jetscope: reliable and interactive analytics at … · jetscope: reliable and interactive analytics...
TRANSCRIPT
JetScope: Reliable and Interactive Analytics at Cloud Scale
Eric Boutin, Paul Brett, Xiaoyu Chen, Jaliya EkanayakeTao Guan, Anna Korsun, Zhicheng Yin, Nan Zhang, Jingren Zhou
Microsoft
ABSTRACTInteractive, reliable, and rich data analytics at cloud scale isa key capability to support low latency data exploration andexperimentation over terabytes of data for a wide range ofbusiness scenarios. Besides the challenges in massive scal-ability and low latency distributed query processing, it isimperative to achieve all these requirements with effectivefault tolerance and efficient recovery, as failures and fluctu-ations are the norm in such a distributed environment.
We present a cloud scale interactive query processing sys-tem, called JetScope, developed at Microsoft. The systemhas a SQL-like declarative scripting language and deliversmassive scalability and high performance through advancedoptimizations. In order to achieve low latency, the systemleverages various access methods, optimizes delivering firstrows, and maximizes network and scheduling efficiency. Thesystem also provides a fine-grained fault tolerance mecha-nism which is able to efficiently detect and mitigate fail-ures without significantly impacting the query latency anduser experience. JetScope has been deployed to hundredsof servers in production at Microsoft, serving a few millionqueries every day.
1. INTRODUCTIONAn increasing number of organizations rely on the results
of massive data analytics for critical business decisions. Asthe data volumes expand dramatically, there is a need toscale out query processing and support efficient big dataanalytics over large clusters of commodity hardware. Onthe other hand, failures and fluctuations are the norm insuch cloud scale clusters. It is critical for the system to beresilient to various system faults and efficiently recover fromthem with minimum performance impact. While the scaleand complexity of data processing continues to grow, there isalso an increasing demand to produce results in a real-timeand interactive manner. Such low latency big data systemswith fault tolerance greatly facilitates data exploration and
This work is licensed under the Creative Commons Attribution-NonCommercial-NoDerivs 3.0 Unported License. To view a copy of this li-cense, visit http://creativecommons.org/licenses/by-nc-nd/3.0/. Obtain per-mission prior to any use beyond those covered by the license. Contactcopyright holder by emailing [email protected]. Articles from this volumewere invited to present their results at the 41st International Conference onVery Large Data Bases, August 31st - September 4th 2015, Kohala Coast,Hawaii.Proceedings of the VLDB Endowment, Vol. 8, No. 12Copyright 2015 VLDB Endowment 2150-8097/15/08.
fast experimentation, and enables a wide range of real-timebusiness scenarios.
Parallel database systems have focused on latency opti-mizations, typically running on expensive high-end servers.However, when the data volumes to be stored and processedreach a point where clusters of hundreds or thousands ofservers are required, parallel database solutions become pro-hibitively expensive. At such scale, many of the underlyingassumptions of parallel database systems (e.g., fault toler-ance) begin to break down, and the classical solutions areno longer viable without substantial extensions.
To address the scalability and reliability challenges, sev-eral batch processing systems were proposed, including Map-Reduce [8], Dryad [12], Hive [19], Scope [21], Pig [15], Strato-sphere [3], Impala [13], etc., some of which offer high levelSQL-like programming languages and conceptual data mod-els. Such systems are designed to achieve great query through-put over both structured and unstructured datasets withscalability and fault tolerance. The queries usually processtens of terabytes of data or more in batch systems and cantake up to hours or days to finish. It is difficult for these sys-tems to achieve interactive query response times for severalarchitectural reasons. For instance, the intermediate resultsare often materialized to disks, in order to provide fault tol-erance and allow subsequent tasks to execute independentlyfor scalability reasons. Such materialization costs are pro-hibitive for low latency queries. In addition, the underlyingtasks are scheduled in phases, or batches. It is typical tohave seconds of delay to start, track, and shut down tasks.These design choices are sufficient for batch workload, butfall short for low latency queries.
In this paper, we describe an interactive low latency queryprocessing system at cloud scale, called JetScope, devel-oped at Microsoft. The system has a SQL-like declarativescripting language with no explicit parallelism, while beingamenable to efficient parallel execution on large clusters.Rich structural properties and access methods allow sophis-ticated query optimization and efficient query processing.An optimizer is responsible for converting scripts into ef-ficient execution plans for the distributed computation en-gine. A physical execution plan consists of a directed acyclicgraph (DAG) of tasks. Execution of the plan is orchestratedby a job manager that schedules tasks on available servers.In order to achieve low latency, the system utilizes a richset of index structures and data structural properties andoptimizes for pipelining results to users, avoiding any block-ing operations. During execution, effective gang schedulingstrategy is exploited to minimize task startup costs and in-
1680
termediate results are streamed between tasks without hit-ting disks to reduce execution latency. The system scaleswell to hundreds of servers and is able to process datasetswith terabytes of data in seconds.
Providing fault tolerance and failure recovery efficientlywhile maintaining low query latency at scale is particularlychallenging. The approach of rerunning the entire query incase of failures is expensive and significantly increases theend-to-end query latency. JetScope implements a novellightweight fault tolerance technique, which greatly mini-mizes wasted work and provides fine-grained failure recov-ery effectively. Specifically, JetScope tracks task executionprogress continuously and is able to recover failed task withminimum recomputation. As a result, the overall impactfrom failure handling is greatly minimized without sacrific-ing query latency.
The JetScope system has been deployed to hundreds ofservers in production at Microsoft. The system serves asthe computation platform for various Microsoft services, tar-geted for large scale interactive data analysis, and executes afew million queries daily with a rapidly growing popularity.Experiments show that JetScope outperforms Impala andHive by a few times on similar hardware. The system im-plements a scalable architecture which efficiently serves hun-dreds of queries with a variety of complexities concurrently.With fine grained fault tolerance mechanisms, JetScope iscapable of recovering from server or rack failures more effi-ciently than other systems. Finally, JetScope evolves fromScope [21, 5], a cloud scale batch production system, whichprovides a natural unification between batch and interac-tive query processing. Albeit with different system tradeoffsand optimization goals, distributed batch and interactivequery processing share lots of commonalities in declarativelanguage, optimization, runtime, and scheduling.
The rest of this paper is structured as follows. In Sec-tion 2 we present the query language and data model inJetScope. We also describe rich access methods that fa-cilitate query optimization and processing. In Section 3we give an overview of the JetScope architecture. Wepresent details of query compilation, optimization, runtime,and scheduling in order to achieve low query latency in thecluster in Section 4. In Section 5, we explain the lightweighttask monitoring mechanism and present an efficient protocolto recover from failures and minimize latency impact. Weshare some interesting production experiences and explainhow to effectively unify both batch and interactive queryprocessing in Section 6. We present experimental resultsto compare JetScope with other systems, demonstrate ef-ficiency of our novel failure handling strategy, and evaluatethe system scalability in Section 7. Finally, we review re-lated work in Section 8 and conclude in Section 9.
2. QUERY LANGUAGE & DATA REPRE-SENTATION
JetScope provides a powerful scripting language basedon SQL. A script consists of a sequence of SQL commands,each of which takes one or more row sets as input, per-forms some operation on the data, and outputs a row set.Like relational databases, every row set has a well-definedschema that all its rows must adhere to. Users can namethe output of a command using assignment and output canbe consumed by subsequent commands simply by referring
to it by name. Named inputs/outputs enable users to writescripts in multiple (small) steps, a style preferred by someprogrammers. Besides SQL queries, JetScope provides aseamless integration with C#, which allows users to call C#
functions where needed.
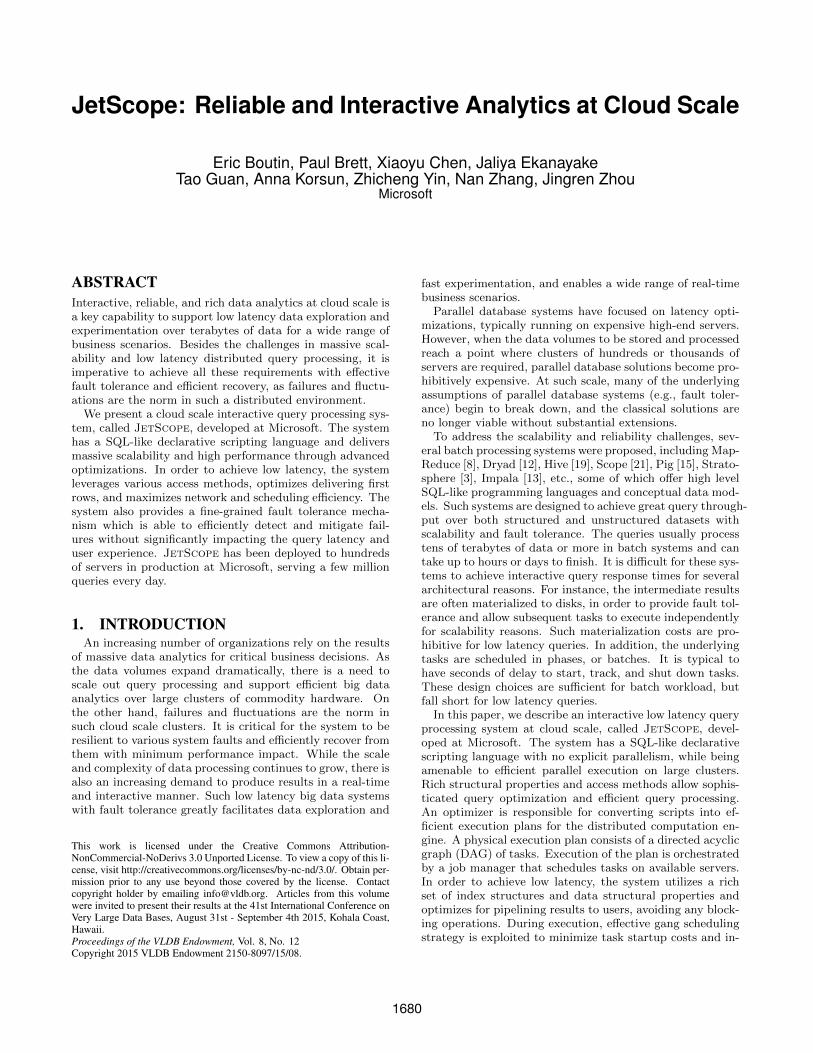
Result =SELECT COUNT(*) AS countFROM store_sales,
household_demographics,time_dim,store
WHERE ss_sold_time_sk == time_dim.t_time_skAND ss_hdemo_sk == household_demographics.hd_demo_skAND ss_store_sk == s_store_skAND time_dim.t_hour == @HourAND time_dim.t_minute >= 30AND household_demographics.hd_dep_count == @DepcntAND store.s_store_name == "ese"
ORDER BY count;
OUTPUT Result TO CONSOLE;
Figure 1: TPC-DS Query 96 in JetScope.
Figure 1 shows TPCDS Query 96 in JetScope to illus-trate an example. The last command requests the resultsto be streamed to the console window. The full descriptionof JetScope programming language is outside the scope ofthis paper.
JetScope also supports a rich set of partitioning schemesand indexing methods, which enable sophisticated query op-timization and facilitate query execution.
Partitioning Schemes. In JetScope, tables can be hor-izontally partitioned into tens of thousands of partitions.JetScope supports a variety of partitioning schemes, in-cluding hash and range partitioning on a single or compos-ite keys. Based on the data volume and distribution, thesystem can choose the optimal number of partitions andtheir boundaries by means of sampling and calculating dis-tributed histograms. Data in a partition is typically pro-cessed together (i.e., a partition represents a computationunit). A partition is comprised of one or several physicalextents, which is the unit of storage in the underlying dis-tributed file system. This approach allows the system toachieve effective replication and fault recovery through ex-tents while providing computation efficiency through parti-tions.
Data Affinity. A partition can be processed efficientlywhen all its extents are stored close to each other. Unliketraditional parallel databases, JetScope does not require allextents of a partition to be stored on a single server whichcould lead to unbalanced storage across servers. Instead, thesystem attempts to store the extents close together by uti-lizing store affinity. Store affinity aims to achieve maximumdata locality without sacrificing uniform data distribution.Every extent has an optional affinity id, and all extents withthe same affinity id belong to an affinity group. The systemtreats store affinity as a placement hint and tries to placeall the extents of an affinity group on the same server un-less the server has already been overloaded. In this case,the extents are placed in the same rack. If the rack is alsooverloaded, the system then tries to place the extents in aclose rack based on the network topology. Each partitionof a table is assigned an affinity id. As extents are created
1681
within the partition, they get assigned the same affinity id,so that they are stored close together.
Table References. The store affinity functionality can alsobe used to associate/affinitize the partitioning of an outputtable with that of a referenced table. This causes the out-put table to mirror the partitioning choices (i.e., partition-ing function and number of partitions) of the referenced ta-ble. Additionally, each partition in the output table uses theaffinity id of the corresponding partition in the referencedtable. Therefore, two tables that are referenced not only arepartitioned in the same way, but partitions are physicallyplaced close to each other in the cluster. This layout signifi-cantly improves parallel join performance, as less data needto be transferred across the network.
Primary and Secondary Indexes. JetScope supportsboth primary and secondary indexes. Within each partition,a primary index is maintained over a single or compositekeys. Optional secondary indexes can be created over a setof columns, potentially using a different partitioning scheme.The optimizer considers all the available indexes to generatethe optimal execution plan.
Column Groups. JetScope supports both row and col-umn store. For the row store, columns in a table are packedin a way that is similar to PAX [2] in an extent to improvecomputation and memory efficiency. To address scenariosthat require processing just a few columns of a wide table,JetScope supports the notion of column groups, which con-tain vertical partitions of tables over user-defined subsets ofcolumns.
3. ARCHITECTURAL OVERVIEWJetScope is a multi-tenant and scalable interactive sys-
tem delivering low latency query execution over tens of ter-abytes of data. It employs a scalable architecture, whichscales up query processing over big data while supportinghundreds of parallel queries with a variety of complexities.In this section, we describe JetScope architecture and howa JetScope query is answered, from submission, compila-tion, optimization to execution and returning the results ina streaming fashion.
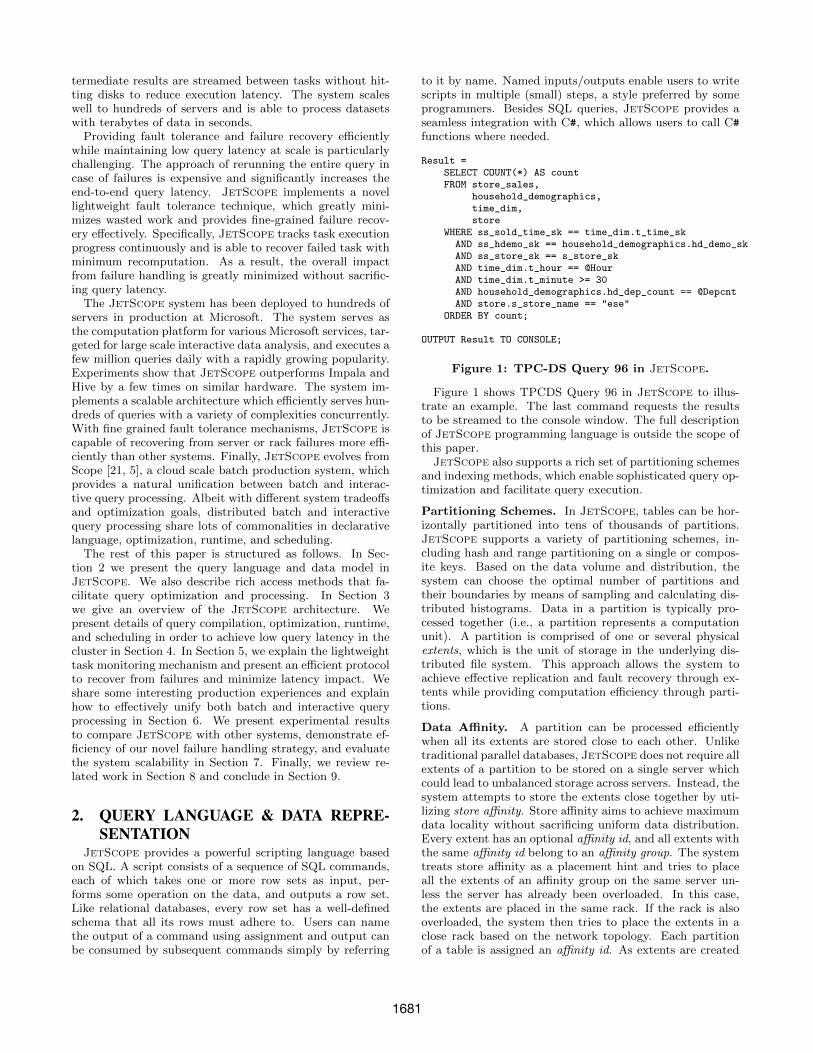
Figure 2 shows an overview of the JetScope system atscale. JetScope queries are submitted to the cluster por-tal either from users’ development environment or variousapplications via ODBC APIs. Inside the computing cluster,JetScope comprises of three major layers: (i) front end,(ii) orchestration, and (iii) back end. The front end layerauthenticates users and compiles the query. It hands thecompiled query to the orchestration layer, which schedulesand dispatches individual tasks to back end servers for ex-ecution. The data is read from a distributed file system,storing data across the cluster. Whenever possible, tasksare dispatched to the servers that are close to the input datain the network topology to take advantage of data locality.Once the query starts execution, the results are streamedback through the front end to the client application as soonas they are available. In order to support a large number ofconcurrent queries, the system automatically shards querycompilation and scheduling among different instances of sys-tem components and provides efficient load balance amongthem. The capacity of the system can be dynamically ad-justed by adding/removing servers in various functions.
3.1 Front EndThe front end layer consists of a group of servers handling
communication between the cluster and the clients. Eachserver runs a front end service, which performs authenti-cation and provides interfaces for both job submission andcluster management, and a compiler service, which carriesout job compilation and optimization.
A JetScope script goes through a series of transforma-tions before it is sent for execution in the back end. Ini-tially, the compiler parses the input script, unfolds viewsand macro directives, performs syntax and type checking,and resolves names. The result of this step is an annotatedabstract syntax tree, which is passed to the query optimizer.
The JetScope optimizer is a cost-based transformationengine that generates efficient execution plans for input trees.It leverages existing work on relational query optimizationand performs rich and non-trivial query rewritings that con-sider the input script in a holistic manner, takes account ofdata structural properties and available indexes, etc.
The compiler then generates code for each operator andcombines a series of operators into an execution unit ortask, which can be scheduled separately and executed bya single server. The system groups distinct types of tasksinto separate stages to simplify job management. All thetasks in a stage perform the same computation, defined inthe query plan, on a different partition of input data. Theoutput of the compilation of a script thus consists of (i) agraph definition file that enumerates all stages and the dataflow relationships among them, and (ii) the assembly itself,which contains the generated code. This package is sentto a job manager service (JMS) for execution. Throughoutthe execution of the query, the front end service serves asthe gateway, which streams the resulting rows to the clientapplication as soon as they become available.
3.2 OrchestrationThe execution of a JetScope script is orchestrated by
a job manager service (JMS), which is responsible for con-structing the task graph using the definition sent by thecompiler and scheduling work across available resources inthe cluster. The JMS maintains the task graph and keepstrack of the state and history of each task. To achieve lowlatency, the JMS uses special scheduling techniques to dis-patch tasks in real-time, which is covered in detail in Sec-tion 4. The JMS also continuously monitors the status foreach task, detects transient failures, and effectively recoversfrom them without rerunning the entire query. We discussthe fault tolerance strategies in Section 5.
To ensure all the servers run normally, a coordinator ser-vice maintains state information for each server and contin-uously tracks their health via a heartbeat mechanism. Incase of server failures, the coordinator notifies every JMSso that no new tasks will be dispatched to the problem-atic servers. The coordinator also dynamically manages re-sources for each JMS. When new resources become available,for instance, new servers are added, each JMS is notified bythe coordinator so that they can utilize their newly allocatedresources for task execution. We discuss resource manage-ment in detail in Section 4.4.
3.3 Back EndThere is a large group of processing servers in the back
end, each of which runs a Process Node service (PN). The
1682
Figure 2: JetScope Architectural Overview.
PN service on each server is a proxy to manage workers thatare ready to execute any assigned task promptly. At run-time, the JMS dispatches a task to a worker for execution.The worker is responsible to set up the required executionenvironment, including executing any required I/Os fromthe underlying distributed file system. Operators within atask are processed in a pipelined fashion, similar to a single-node database engine. As we shall describe in Section 4.2,the results of a task become immediately available for itsconsuming tasks.
4. LOW LATENCY OPTIMIZATIONSA key aspect of an interactive analytic engine is to mini-
mize query latency and deliver results to end users as soon asthey become available. JetScope achieves low latency userexperience by optimizing every component on the criticalpath of the query execution.
First, the compiler service is always ready to accept a newquery and finishes compilation and optimization in a smallfraction of a second. Second, the resulting DAG executionplan is sent to a long running JMS, which starts to constructgraph and schedule tasks to back end servers immediately.Third, the system generates code for each operator and com-piles it into machine code to avoid any interpretation costs atruntime. Finally, the results of a task are immediately avail-able for the next task or routed back to end users withoutany delay. In addition, we describe several key techniquesto avoid latency overhead in a distributed environment.
4.1 Query OptimizationJetScope has a cost-based query optimizer which lever-
ages database optimization techniques [11] and reasons aboutstructural properties such as partitioning, grouping and sort-ing properties; and various access methods holistically. Thedetailed description about the optimizer can be found in [22].Further, to optimize for interactive experience, the query
Hash Join 2ss_hdemo_sk, hd_demo_sk
Hash Join 3ss_store_sk, s_store_sk
Read store_sales
18.3TB
Read time_dim
5MB
Filter 1t_hour, t_minute
Global Aggregator
Output
task2,1
Read household...
211KB
stage2
Filter 2hd_dep_count
stage4
task4,1
task1,1
stage1
task5,1
Hash Join 1ss_sold_time, t_time_sk
stage5 task3,1
Read store
532KB
stage3
Filter 3m_store_name
task6,1
stage6
task4,N
task5,N
Partial AggregatorCOUNT(*)
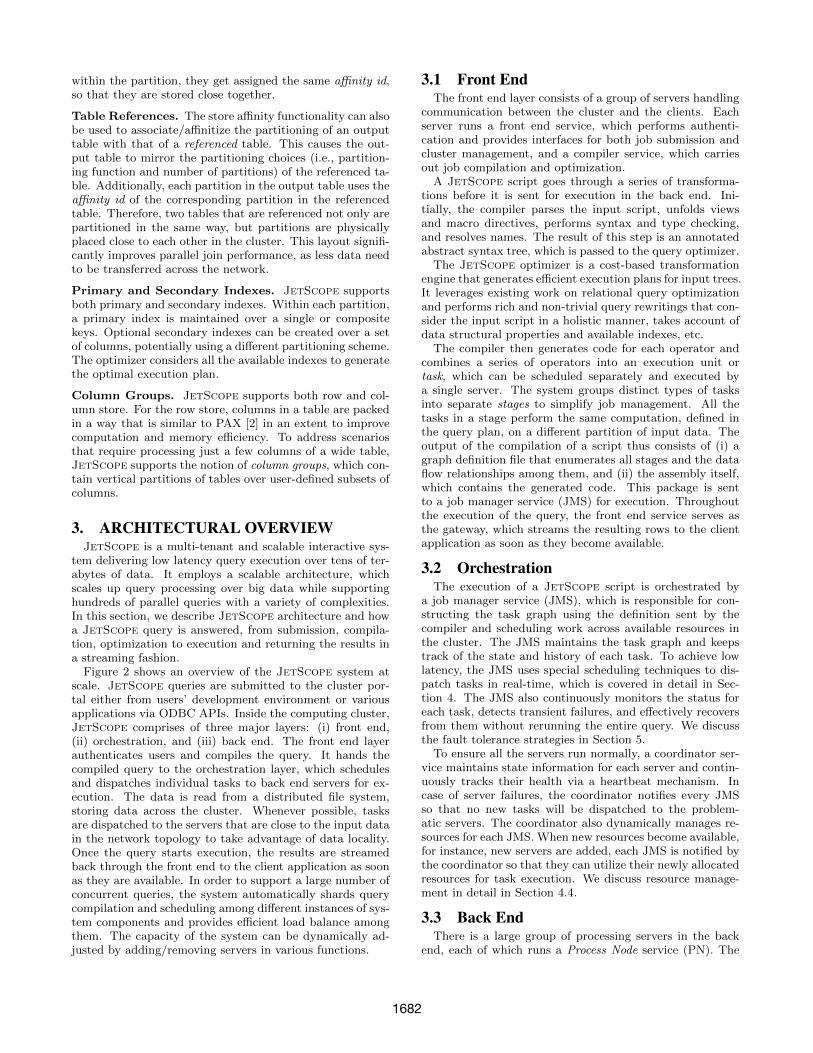
Figure 3: An Execution Plan for TPC-DS Query 96.
optimizer avoids blocking operators, such as sort-based op-erations, to favor hash-based operations so that any partialintermediate results can be pipelined to the next operation,possibly on a different server, without waiting for the com-plete results.
Figure 3 shows the final execution plan for TPC-DS Query96 against a 30TB TPC-DS database by the optimizer inJetScope. There are 6 stages, some of which contain agroup of tasks so that they can perform the same computa-tion on a different partition of the input table in parallel. As
1683
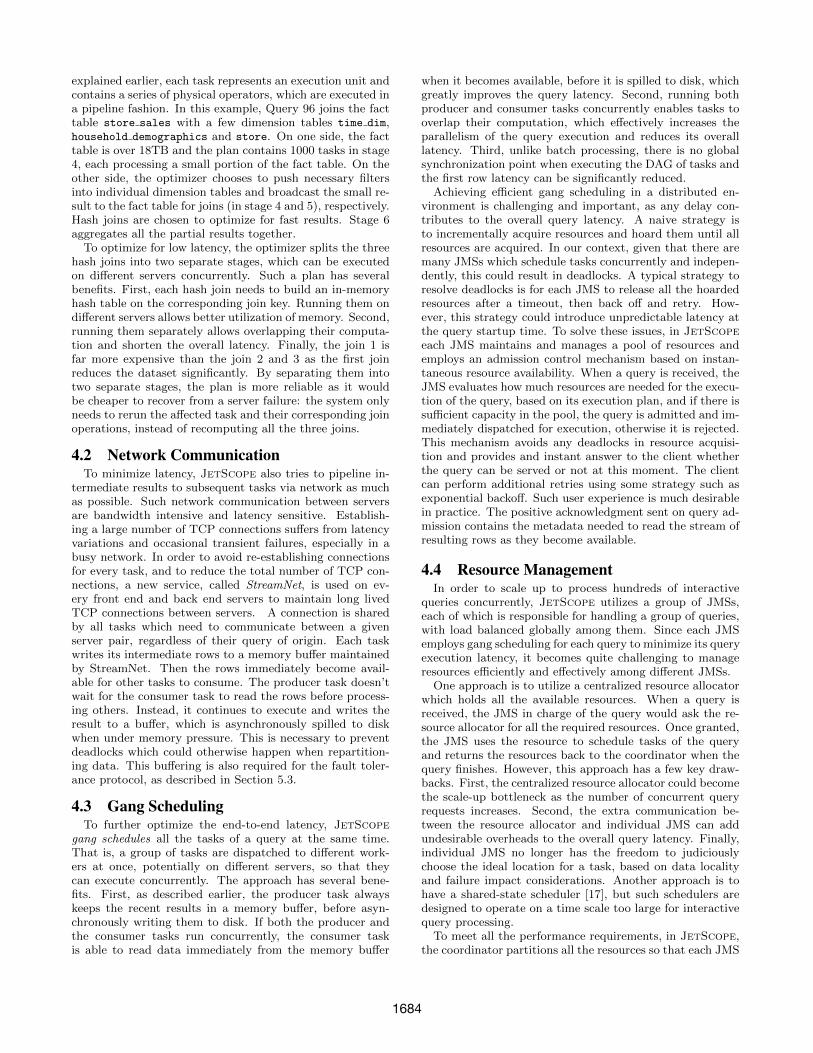
explained earlier, each task represents an execution unit andcontains a series of physical operators, which are executed ina pipeline fashion. In this example, Query 96 joins the facttable store sales with a few dimension tables time dim,household demographics and store. On one side, the facttable is over 18TB and the plan contains 1000 tasks in stage4, each processing a small portion of the fact table. On theother side, the optimizer chooses to push necessary filtersinto individual dimension tables and broadcast the small re-sult to the fact table for joins (in stage 4 and 5), respectively.Hash joins are chosen to optimize for fast results. Stage 6aggregates all the partial results together.
To optimize for low latency, the optimizer splits the threehash joins into two separate stages, which can be executedon different servers concurrently. Such a plan has severalbenefits. First, each hash join needs to build an in-memoryhash table on the corresponding join key. Running them ondifferent servers allows better utilization of memory. Second,running them separately allows overlapping their computa-tion and shorten the overall latency. Finally, the join 1 isfar more expensive than the join 2 and 3 as the first joinreduces the dataset significantly. By separating them intotwo separate stages, the plan is more reliable as it wouldbe cheaper to recover from a server failure: the system onlyneeds to rerun the affected task and their corresponding joinoperations, instead of recomputing all the three joins.
4.2 Network CommunicationTo minimize latency, JetScope also tries to pipeline in-
termediate results to subsequent tasks via network as muchas possible. Such network communication between serversare bandwidth intensive and latency sensitive. Establish-ing a large number of TCP connections suffers from latencyvariations and occasional transient failures, especially in abusy network. In order to avoid re-establishing connectionsfor every task, and to reduce the total number of TCP con-nections, a new service, called StreamNet, is used on ev-ery front end and back end servers to maintain long livedTCP connections between servers. A connection is sharedby all tasks which need to communicate between a givenserver pair, regardless of their query of origin. Each taskwrites its intermediate rows to a memory buffer maintainedby StreamNet. Then the rows immediately become avail-able for other tasks to consume. The producer task doesn’twait for the consumer task to read the rows before process-ing others. Instead, it continues to execute and writes theresult to a buffer, which is asynchronously spilled to diskwhen under memory pressure. This is necessary to preventdeadlocks which could otherwise happen when repartition-ing data. This buffering is also required for the fault toler-ance protocol, as described in Section 5.3.
4.3 Gang SchedulingTo further optimize the end-to-end latency, JetScope
gang schedules all the tasks of a query at the same time.That is, a group of tasks are dispatched to different work-ers at once, potentially on different servers, so that theycan execute concurrently. The approach has several bene-fits. First, as described earlier, the producer task alwayskeeps the recent results in a memory buffer, before asyn-chronously writing them to disk. If both the producer andthe consumer tasks run concurrently, the consumer taskis able to read data immediately from the memory buffer
when it becomes available, before it is spilled to disk, whichgreatly improves the query latency. Second, running bothproducer and consumer tasks concurrently enables tasks tooverlap their computation, which effectively increases theparallelism of the query execution and reduces its overalllatency. Third, unlike batch processing, there is no globalsynchronization point when executing the DAG of tasks andthe first row latency can be significantly reduced.
Achieving efficient gang scheduling in a distributed en-vironment is challenging and important, as any delay con-tributes to the overall query latency. A naive strategy isto incrementally acquire resources and hoard them until allresources are acquired. In our context, given that there aremany JMSs which schedule tasks concurrently and indepen-dently, this could result in deadlocks. A typical strategy toresolve deadlocks is for each JMS to release all the hoardedresources after a timeout, then back off and retry. How-ever, this strategy could introduce unpredictable latency atthe query startup time. To solve these issues, in JetScopeeach JMS maintains and manages a pool of resources andemploys an admission control mechanism based on instan-taneous resource availability. When a query is received, theJMS evaluates how much resources are needed for the execu-tion of the query, based on its execution plan, and if there issufficient capacity in the pool, the query is admitted and im-mediately dispatched for execution, otherwise it is rejected.This mechanism avoids any deadlocks in resource acquisi-tion and provides and instant answer to the client whetherthe query can be served or not at this moment. The clientcan perform additional retries using some strategy such asexponential backoff. Such user experience is much desirablein practice. The positive acknowledgment sent on query ad-mission contains the metadata needed to read the stream ofresulting rows as they become available.
4.4 Resource ManagementIn order to scale up to process hundreds of interactive
queries concurrently, JetScope utilizes a group of JMSs,each of which is responsible for handling a group of queries,with load balanced globally among them. Since each JMSemploys gang scheduling for each query to minimize its queryexecution latency, it becomes quite challenging to manageresources efficiently and effectively among different JMSs.
One approach is to utilize a centralized resource allocatorwhich holds all the available resources. When a query isreceived, the JMS in charge of the query would ask the re-source allocator for all the required resources. Once granted,the JMS uses the resource to schedule tasks of the queryand returns the resources back to the coordinator when thequery finishes. However, this approach has a few key draw-backs. First, the centralized resource allocator could becomethe scale-up bottleneck as the number of concurrent queryrequests increases. Second, the extra communication be-tween the resource allocator and individual JMS can addundesirable overheads to the overall query latency. Finally,individual JMS no longer has the freedom to judiciouslychoose the ideal location for a task, based on data localityand failure impact considerations. Another approach is tohave a shared-state scheduler [17], but such schedulers aredesigned to operate on a time scale too large for interactivequery processing.
To meet all the performance requirements, in JetScope,the coordinator partitions all the resources so that each JMS
1684
manages a disjoint portion. Each JMS admits and schedulesqueries concurrently and independently at a great speed.Each JMS also maintains some spare resources to handleunexpected failures, as described in Section 5. A load bal-ancer monitors the availability of each JMS continuouslyand performs necessary load balancing among them. As de-scribed in Section 3, the coordinator can dynamically adjustresource allocations among different JMSs as needed. Thecoordinator also monitors server health and notifies individ-ual JMS promptly of problematic servers in case of failures.
Server1 Server2 Server1 Server2
Vertical Partitioning Horizontal Partitioning
JMS1 JMS2
JMS1
JMS2
Figure 4: Resource Partitioning.
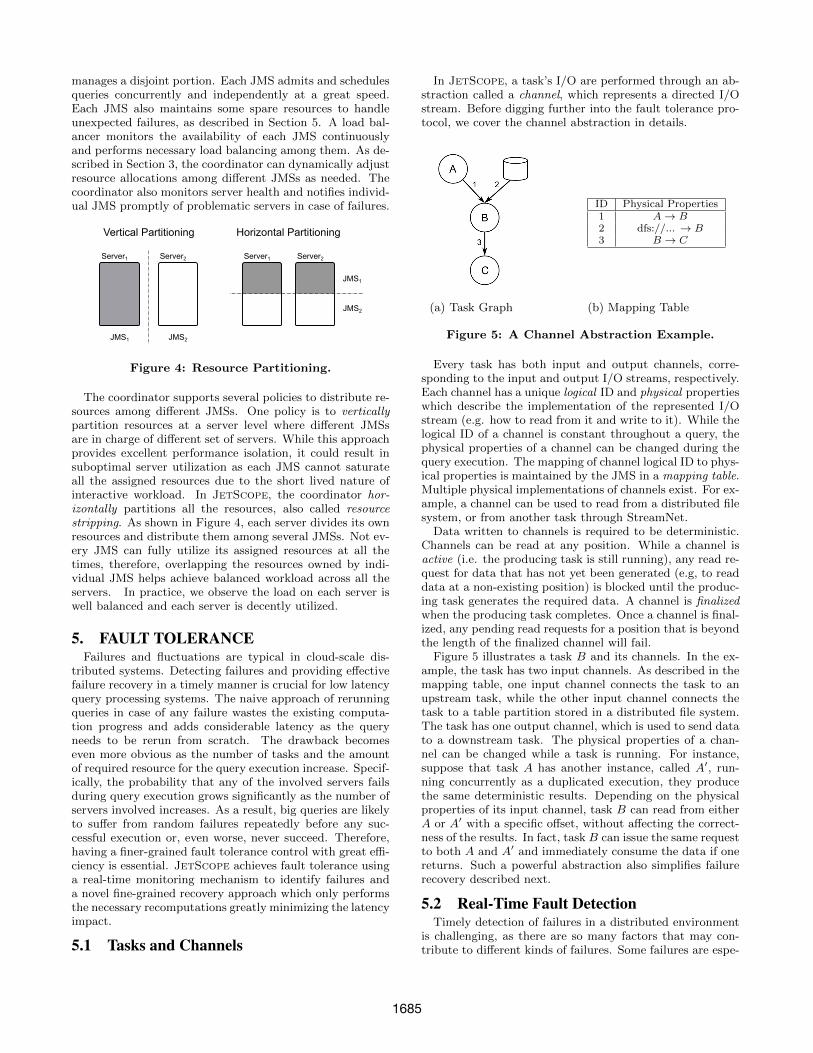
The coordinator supports several policies to distribute re-sources among different JMSs. One policy is to verticallypartition resources at a server level where different JMSsare in charge of different set of servers. While this approachprovides excellent performance isolation, it could result insuboptimal server utilization as each JMS cannot saturateall the assigned resources due to the short lived nature ofinteractive workload. In JetScope, the coordinator hor-izontally partitions all the resources, also called resourcestripping. As shown in Figure 4, each server divides its ownresources and distribute them among several JMSs. Not ev-ery JMS can fully utilize its assigned resources at all thetimes, therefore, overlapping the resources owned by indi-vidual JMS helps achieve balanced workload across all theservers. In practice, we observe the load on each server iswell balanced and each server is decently utilized.
5. FAULT TOLERANCEFailures and fluctuations are typical in cloud-scale dis-
tributed systems. Detecting failures and providing effectivefailure recovery in a timely manner is crucial for low latencyquery processing systems. The naive approach of rerunningqueries in case of any failure wastes the existing computa-tion progress and adds considerable latency as the queryneeds to be rerun from scratch. The drawback becomeseven more obvious as the number of tasks and the amountof required resource for the query execution increase. Specif-ically, the probability that any of the involved servers failsduring query execution grows significantly as the number ofservers involved increases. As a result, big queries are likelyto suffer from random failures repeatedly before any suc-cessful execution or, even worse, never succeed. Therefore,having a finer-grained fault tolerance control with great effi-ciency is essential. JetScope achieves fault tolerance usinga real-time monitoring mechanism to identify failures anda novel fine-grained recovery approach which only performsthe necessary recomputations greatly minimizing the latencyimpact.
5.1 Tasks and Channels
In JetScope, a task’s I/O are performed through an ab-straction called a channel, which represents a directed I/Ostream. Before digging further into the fault tolerance pro-tocol, we cover the channel abstraction in details.
A
B
ID Physical Properties1 A → B2 dfs://... → B3 B → C
(a) Task Graph (b) Mapping Table
Figure 5: A Channel Abstraction Example.
Every task has both input and output channels, corre-sponding to the input and output I/O streams, respectively.Each channel has a unique logical ID and physical propertieswhich describe the implementation of the represented I/Ostream (e.g. how to read from it and write to it). While thelogical ID of a channel is constant throughout a query, thephysical properties of a channel can be changed during thequery execution. The mapping of channel logical ID to phys-ical properties is maintained by the JMS in a mapping table.Multiple physical implementations of channels exist. For ex-ample, a channel can be used to read from a distributed filesystem, or from another task through StreamNet.
Data written to channels is required to be deterministic.Channels can be read at any position. While a channel isactive (i.e. the producing task is still running), any read re-quest for data that has not yet been generated (e.g, to readdata at a non-existing position) is blocked until the produc-ing task generates the required data. A channel is finalizedwhen the producing task completes. Once a channel is final-ized, any pending read requests for a position that is beyondthe length of the finalized channel will fail.
Figure 5 illustrates a task B and its channels. In the ex-ample, the task has two input channels. As described in themapping table, one input channel connects the task to anupstream task, while the other input channel connects thetask to a table partition stored in a distributed file system.The task has one output channel, which is used to send datato a downstream task. The physical properties of a chan-nel can be changed while a task is running. For instance,suppose that task A has another instance, called A′, run-ning concurrently as a duplicated execution, they producethe same deterministic results. Depending on the physicalproperties of its input channel, task B can read from eitherA or A′ with a specific offset, without affecting the correct-ness of the results. In fact, task B can issue the same requestto both A and A′ and immediately consume the data if onereturns. Such a powerful abstraction also simplifies failurerecovery described next.
5.2 Real-Time Fault DetectionTimely detection of failures in a distributed environment
is challenging, as there are so many factors that may con-tribute to different kinds of failures. Some failures are espe-
1685
cially difficult to detect or are only detected after they makenegative latency impact. For instance, network partitionsor power outages, which do not usually result in an immedi-ately observable query level failures. Instead, they typicallyresult in low level system events, such as network timeoutsor TCP connection failures, which are only detected afterthe query latency was impacted.
JetScope employs two lightweight mechanisms to de-tect and identify failures promptly for each task. First,JetScope uses a frequent heartbeat communication betweenthe JMS and each worker running a task. The JMS keepstrack of the last time it received an update from a task.When a task missed enough updates, the JMS considers thetask failed and restarts the task in another server. Thismechanism allows the JMS to quickly detect failures affect-ing running queries and take immediate actions.
Second, the coordinator maintains communication witheach back end server. When the coordinator detects a serverfailure due to lost communication, it notifies every JMS,which then considers all tasks on the server failed and trig-gers recovery. The coordinator then requests a replacementback end server in order to avoid a capacity reduction. Thesecond mechanism notifies each JMS of server failures, evenif some JMS had no task scheduled on the server. It pre-vents future tasks from being dispatched to the problematicservers, which would otherwise results in query processingdelays.
ID Physical Properties1 A → C2 A → D3 B → C4 B → D5 C → E6 D → E
(a) Original Task Graph (b) Original Mapping Table
ID Physical Properties1 A → C2 A → D′
3 B → C4 B → D′
5 C → E6 D′ → E
(c) Task Graph with Failed D (d) Updated Mapping Table
Figure 6: A Failure Recovery Example.
5.3 Fine-Grained Failure RecoveryJetScope streams intermediate results between depen-
dent tasks, allowing downstream tasks to consume rows whenthey are available. Although this helps reduce the querylatency, it introduces challenges when failures occur in themiddle of communications. JetScope employs a fine-grained
fault recovery mechanism, which enables recovery with min-imal latency impact by only recomputing the failed tasks.
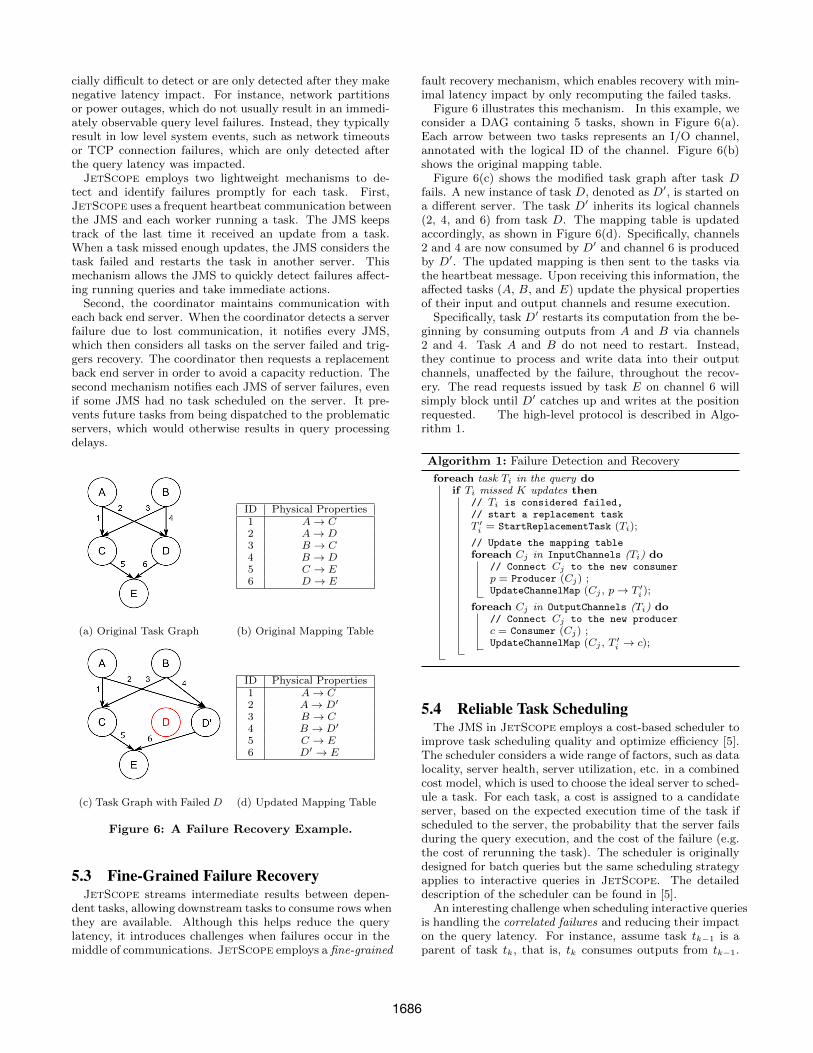
Figure 6 illustrates this mechanism. In this example, weconsider a DAG containing 5 tasks, shown in Figure 6(a).Each arrow between two tasks represents an I/O channel,annotated with the logical ID of the channel. Figure 6(b)shows the original mapping table.
Figure 6(c) shows the modified task graph after task Dfails. A new instance of task D, denoted as D′, is started ona different server. The task D′ inherits its logical channels(2, 4, and 6) from task D. The mapping table is updatedaccordingly, as shown in Figure 6(d). Specifically, channels2 and 4 are now consumed by D′ and channel 6 is producedby D′. The updated mapping is then sent to the tasks viathe heartbeat message. Upon receiving this information, theaffected tasks (A, B, and E) update the physical propertiesof their input and output channels and resume execution.
Specifically, task D′ restarts its computation from the be-ginning by consuming outputs from A and B via channels2 and 4. Task A and B do not need to restart. Instead,they continue to process and write data into their outputchannels, unaffected by the failure, throughout the recov-ery. The read requests issued by task E on channel 6 willsimply block until D′ catches up and writes at the positionrequested. The high-level protocol is described in Algo-rithm 1.
Algorithm 1: Failure Detection and Recovery
foreach task Ti in the query doif Ti missed K updates then
// Ti is considered failed,// start a replacement taskT ′i = StartReplacementTask (Ti);
// Update the mapping tableforeach Cj in InputChannels (Ti) do
// Connect Cj to the new consumerp = Producer (Cj) ;UpdateChannelMap (Cj , p → T ′i );
foreach Cj in OutputChannels (Ti) do// Connect Cj to the new producerc = Consumer (Cj) ;UpdateChannelMap (Cj , T ′i → c);
5.4 Reliable Task SchedulingThe JMS in JetScope employs a cost-based scheduler to
improve task scheduling quality and optimize efficiency [5].The scheduler considers a wide range of factors, such as datalocality, server health, server utilization, etc. in a combinedcost model, which is used to choose the ideal server to sched-ule a task. For each task, a cost is assigned to a candidateserver, based on the expected execution time of the task ifscheduled to the server, the probability that the server failsduring the query execution, and the cost of the failure (e.g.the cost of rerunning the task). The scheduler is originallydesigned for batch queries but the same scheduling strategyapplies to interactive queries in JetScope. The detaileddescription of the scheduler can be found in [5].
An interesting challenge when scheduling interactive queriesis handling the correlated failures and reducing their impacton the query latency. For instance, assume task tk−1 is aparent of task tk, that is, tk consumes outputs from tk−1.
1686
If both tasks are scheduled to the same server or rack, bothtasks would fail if the server or the rack failed. In this case,the recovery of the query is slowed down, because not onlyboth tasks need to rerun but also t′k has to wait for t′k−1
to repopulate the output channel. Such correlated failureare common in practice and could have severe impact onthe system reliability and query latency. JetScope incor-porates such considerations into the cost model. The costof a server failure now needs to consider all the dependenttasks that get scheduled to the same server. As a result, thescheduler judiciously considers scheduling two expensive anddependent tasks in different failure domains to avoid suchcorrelated failures in a cost-based manner.
6. DISCUSSIONJetScope is designed to be an interactive computing ser-
vice, running 24/7 without any down time. It is importantto handle system deployments and maintenance gracefullywithout impacting users. We describe key architectural as-pects of JetScope that allows online system deploymentand maintenance in Section 6.1. JetScope evolves fromScope [21], a distributed batch processing system. We dis-cuss an important unification of batch and interactive queryprocessing in Section 6.2.
6.1 Online Deployment and MaintenanceJetScope is designed to support multiple versions of the
system to serve queries concurrently. The system can rundifferent versions of front end services, JMSs and their work-ers side by side. Upon query submission, the system assignsthe query a version tag, which is used to route the queryto the system of the corresponding version for further pro-cessing. Such capability is crucial for online deployment,production flighting, and verification. During those events,the system temporarily stops routing queries, via load bal-ancers, to a set of system components of a particular version,waits for them to drain current computation, and takes themdown for upgrade or deployment before routing new queriesto them. During the process, another version of the systemcontinues to operate, with minimal impact on users.
Cluster wide maintenance, e.g., to apply OS patches, oc-cur regularly in data clusters. Similarly, JetScope appliesmaintenance progressively to minimize their impact to queryprocessing. Specifically, the coordinator first receives noti-fication that certain servers are scheduled for maintenance,and then notified each JMS to stop sending new tasks tothe affected servers. The system waits for the current tasksto finish before taking them down for maintenance. Finally,the coordinator picks new servers to compensate the lost ca-pacity and notifies JMSs. The rest of the system continueto function during this process.
6.2 Unification of Batch and Interactive Pro-cessing
Batch processing systems typically handle massive datasets,optimize for throughput, and can take hours or days to finishprocessing a query, while interactive processing optimizes forlow latency and process queries in seconds or minutes. Thetwo systems compliment each others and both are valuablein the big data computation eco-system. It is therefore im-portant to unify batch and interactive processing effectivelyand support both in a shared environment. JetScope and
Scope provide a natural unification, as many system com-ponents are shared between batch and interactive processingbut optimize different aspects in execution, scheduling, andfault tolerance. The two systems are deployed to the samecomputing clusters with tens of thousands of servers, eachwith its own allocated resources. The two systems share thesame underlying distributed file system, storing data acrossall the servers in the cluster. Such a design allows users toleverage both systems for different scenarios without copy-ing data from one system to the other. In fact, it is typicalto use the batch processing system to process the raw dataand construct tables, which is time-consuming, and thenleverage the interactive processing system for fast analyticsand exploration. In addition, the unification allows users towrite queries using the same declarative language. Perform-ing automatic selection of the optimal execution strategy,depending on the data volume, required resources, etc. ispart of our future work.
7. EVALUATION AT SCALEWe perform detailed experiments on JetScope to eval-
uate its performance and scalability under various circum-stances. More specifically, we focus on answering the fol-lowing questions: (i) How does JetScope perform in areal production environment? (Section 7.1) (ii) How doesJetScope perform with complex queries? How does it com-pare with the performance of other systems? (Section 7.2)(iii) How do server and rack failures affect the query perfor-mance with JetScope’s fine-grained fault recovery? Howdoes it compare with a coarse-grained fault recovery strat-egy? Does JetScope’s task placement optimization help?(Section 7.3) (iv) How does JetScope scale? (Section 7.4)
7.1 JetScope in Production
0 0.1 0.2 0.3 0.4 0.5 0.6 0.7 0.8 0.9
1
0.1 1 10 100 1000
CD
F
Query Latency (s)
Figure 7: Query Latency on Production Clusters.
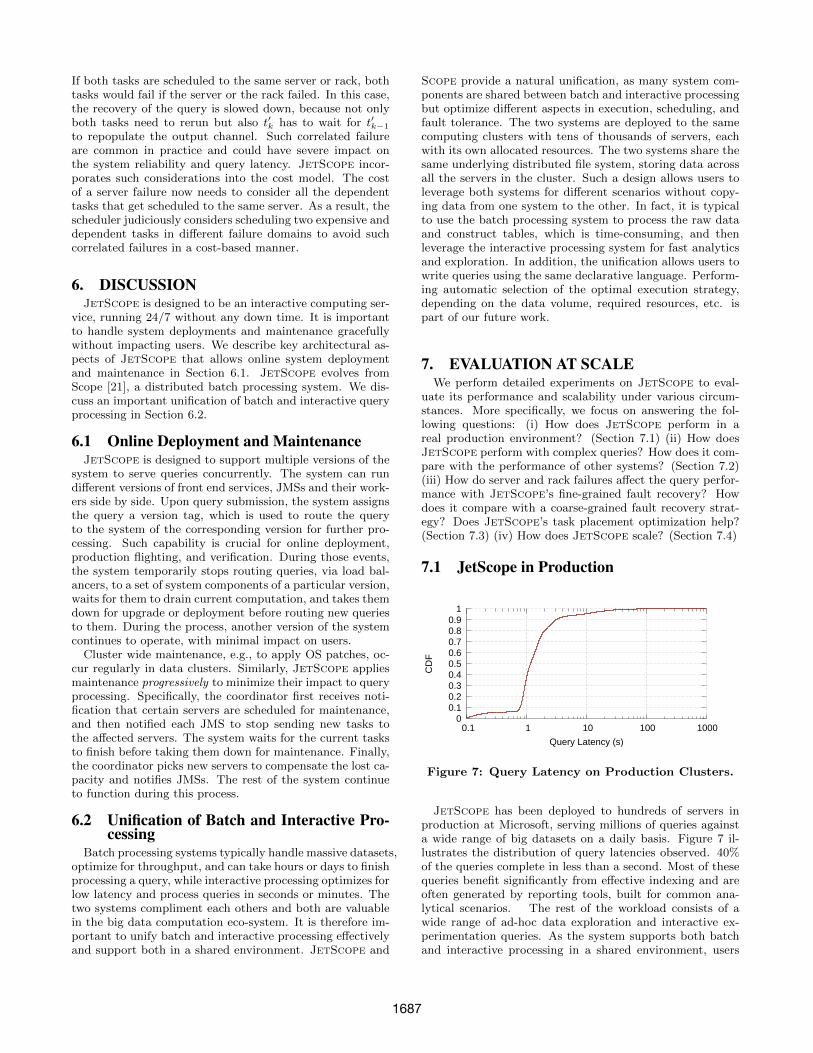
JetScope has been deployed to hundreds of servers inproduction at Microsoft, serving millions of queries againsta wide range of big datasets on a daily basis. Figure 7 il-lustrates the distribution of query latencies observed. 40%of the queries complete in less than a second. Most of thesequeries benefit significantly from effective indexing and areoften generated by reporting tools, built for common ana-lytical scenarios. The rest of the workload consists of awide range of ad-hoc data exploration and interactive ex-perimentation queries. As the system supports both batchand interactive processing in a shared environment, users
1687
run scaled down versions of more complex experiments us-ing JetScope to validate their assumptions before launch-ing full scale experiments that could run for many hours inthe batch system.
7.2 Query PerformanceJetScope is capable of running various complex SQL
queries with excellent performance. However, it is difficultto compare the performance numbers among different dis-tributed computation systems, as the underlying computingclusters might have different hardware configuration, whichhave a profound impact on the system performance. Re-cent work published detailed performance numbers aboutHive and Impala running on a 1TB TPC-H database, aswell as the hardware configuration used [10]. We configurea test cluster with a similar hardware configuration so asto roughly compare JetScope performance numbers withthose for Hive and Impala. In particular, the test clusterhas 21 servers as in the Hive and Impala experiments andeach server has comparable specifications.
Hive &Impala [10]
JetScope
Server Count 21 21Server Configuration
OS Ubuntu 12.04 Windows Server 2012Memory 96GB 128GBNetwork 10 gigabit 10 gigabitCPU Sockets 2 2CPU Cores 12 16
CPU SpecificationBrand Intel Xeon Intel XeonClock 2.2GHz 2.1GHzCores/Socket 6 8
I/O SystemDisk Count 200 180Disk RPM 7k 7k
Table 1: Cluster Configuration.
It is worthwhile pointing out the difference in the clus-ter configuration. For Hive and Impala experiments, eachserver has 10 direct-attached hard drives. In JetScope,each server has 3 direct-attached data drives. To have asimilar configuration, we have data stored in 60 servers with180 disks in total. This is suboptimal for JetScope as thedata is distributed among different servers and the systemno longer benefits from the data locality. On the other side,each server in JetScope clusters has slightly more coresand memory with slightly lower CPU clock speed. Despitethe difference, we believe the cluster configuration is closeenough to provide a rough comparison. To avoid dilutingthe performance numbers by caching data in memory, wedisable file cache for JetScope.
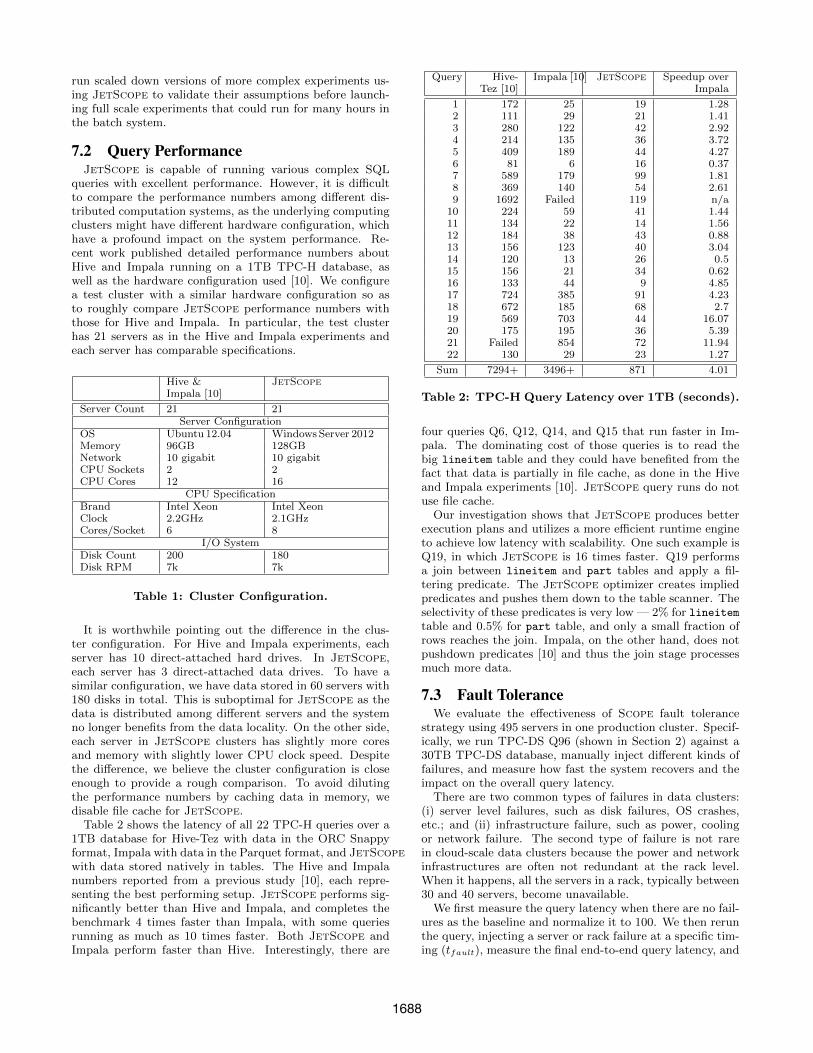
Table 2 shows the latency of all 22 TPC-H queries over a1TB database for Hive-Tez with data in the ORC Snappyformat, Impala with data in the Parquet format, and JetScopewith data stored natively in tables. The Hive and Impalanumbers reported from a previous study [10], each repre-senting the best performing setup. JetScope performs sig-nificantly better than Hive and Impala, and completes thebenchmark 4 times faster than Impala, with some queriesrunning as much as 10 times faster. Both JetScope andImpala perform faster than Hive. Interestingly, there are
Query Hive-Tez [10]
Impala [10] JetScope Speedup overImpala
1 172 25 19 1.282 111 29 21 1.413 280 122 42 2.924 214 135 36 3.725 409 189 44 4.276 81 6 16 0.377 589 179 99 1.818 369 140 54 2.619 1692 Failed 119 n/a
10 224 59 41 1.4411 134 22 14 1.5612 184 38 43 0.8813 156 123 40 3.0414 120 13 26 0.515 156 21 34 0.6216 133 44 9 4.8517 724 385 91 4.2318 672 185 68 2.719 569 703 44 16.0720 175 195 36 5.3921 Failed 854 72 11.9422 130 29 23 1.27
Sum 7294+ 3496+ 871 4.01
Table 2: TPC-H Query Latency over 1TB (seconds).
four queries Q6, Q12, Q14, and Q15 that run faster in Im-pala. The dominating cost of those queries is to read thebig lineitem table and they could have benefited from thefact that data is partially in file cache, as done in the Hiveand Impala experiments [10]. JetScope query runs do notuse file cache.
Our investigation shows that JetScope produces betterexecution plans and utilizes a more efficient runtime engineto achieve low latency with scalability. One such example isQ19, in which JetScope is 16 times faster. Q19 performsa join between lineitem and part tables and apply a fil-tering predicate. The JetScope optimizer creates impliedpredicates and pushes them down to the table scanner. Theselectivity of these predicates is very low — 2% for lineitemtable and 0.5% for part table, and only a small fraction ofrows reaches the join. Impala, on the other hand, does notpushdown predicates [10] and thus the join stage processesmuch more data.
7.3 Fault ToleranceWe evaluate the effectiveness of Scope fault tolerance
strategy using 495 servers in one production cluster. Specif-ically, we run TPC-DS Q96 (shown in Section 2) against a30TB TPC-DS database, manually inject different kinds offailures, and measure how fast the system recovers and theimpact on the overall query latency.
There are two common types of failures in data clusters:(i) server level failures, such as disk failures, OS crashes,etc.; and (ii) infrastructure failure, such as power, coolingor network failure. The second type of failure is not rarein cloud-scale data clusters because the power and networkinfrastructures are often not redundant at the rack level.When it happens, all the servers in a rack, typically between30 and 40 servers, become unavailable.
We first measure the query latency when there are no fail-ures as the baseline and normalize it to 100. We then rerunthe query, injecting a server or rack failure at a specific tim-ing (tfault), measure the final end-to-end query latency, and
1688
0%
20%
40%
60%
80%
100%
0 20 40 60 80 100
Que
ry S
low
dow
n (%
)
Fault Injection Time (tfault)(Normalized by Baseline Latency as 100)
Fine-Grained Recovery After Server FailureFine-Grained Recovery After Rack Failure
Query Restarted After Failure
Figure 8: Impact of Failures on Latency.
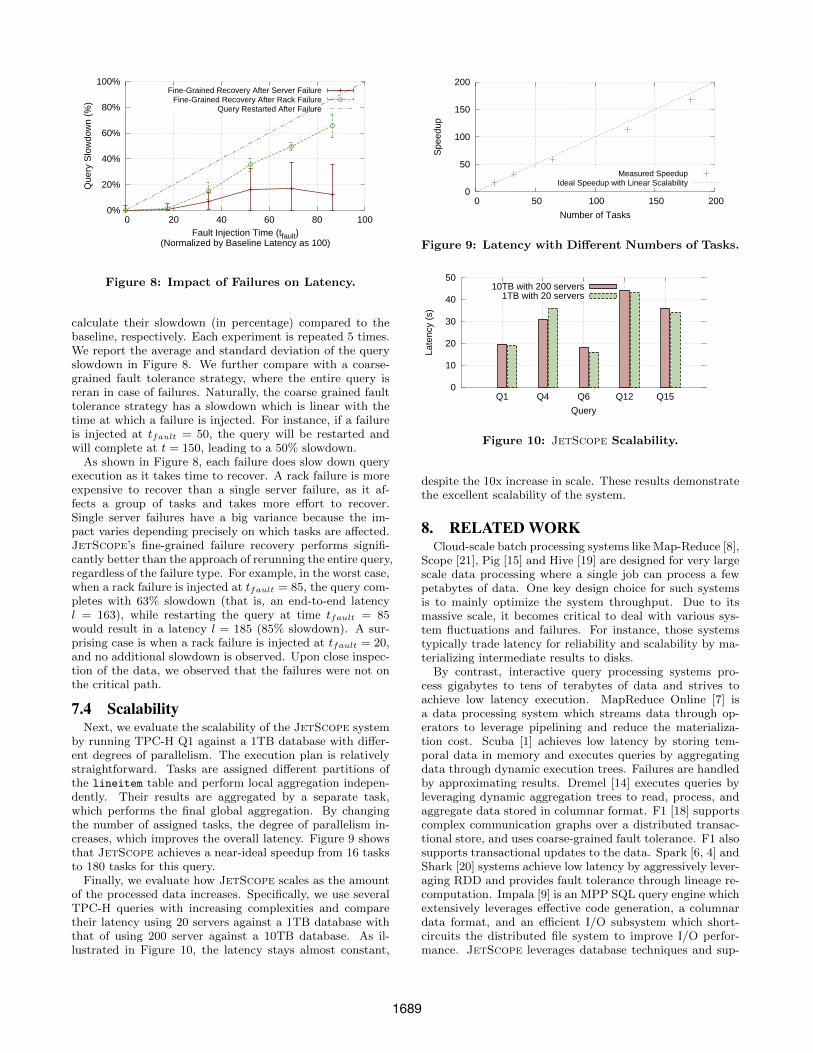
calculate their slowdown (in percentage) compared to thebaseline, respectively. Each experiment is repeated 5 times.We report the average and standard deviation of the queryslowdown in Figure 8. We further compare with a coarse-grained fault tolerance strategy, where the entire query isreran in case of failures. Naturally, the coarse grained faulttolerance strategy has a slowdown which is linear with thetime at which a failure is injected. For instance, if a failureis injected at tfault = 50, the query will be restarted andwill complete at t = 150, leading to a 50% slowdown.
As shown in Figure 8, each failure does slow down queryexecution as it takes time to recover. A rack failure is moreexpensive to recover than a single server failure, as it af-fects a group of tasks and takes more effort to recover.Single server failures have a big variance because the im-pact varies depending precisely on which tasks are affected.JetScope’s fine-grained failure recovery performs signifi-cantly better than the approach of rerunning the entire query,regardless of the failure type. For example, in the worst case,when a rack failure is injected at tfault = 85, the query com-pletes with 63% slowdown (that is, an end-to-end latencyl = 163), while restarting the query at time tfault = 85would result in a latency l = 185 (85% slowdown). A sur-prising case is when a rack failure is injected at tfault = 20,and no additional slowdown is observed. Upon close inspec-tion of the data, we observed that the failures were not onthe critical path.
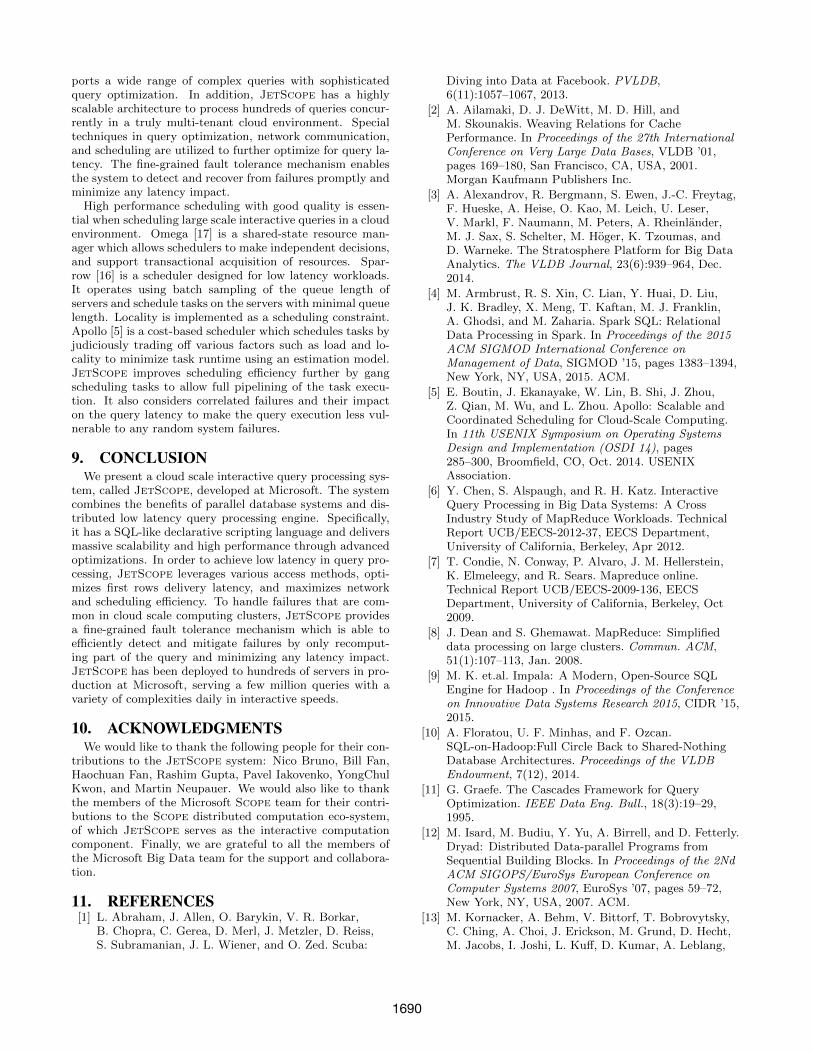
7.4 ScalabilityNext, we evaluate the scalability of the JetScope system
by running TPC-H Q1 against a 1TB database with differ-ent degrees of parallelism. The execution plan is relativelystraightforward. Tasks are assigned different partitions ofthe lineitem table and perform local aggregation indepen-dently. Their results are aggregated by a separate task,which performs the final global aggregation. By changingthe number of assigned tasks, the degree of parallelism in-creases, which improves the overall latency. Figure 9 showsthat JetScope achieves a near-ideal speedup from 16 tasksto 180 tasks for this query.
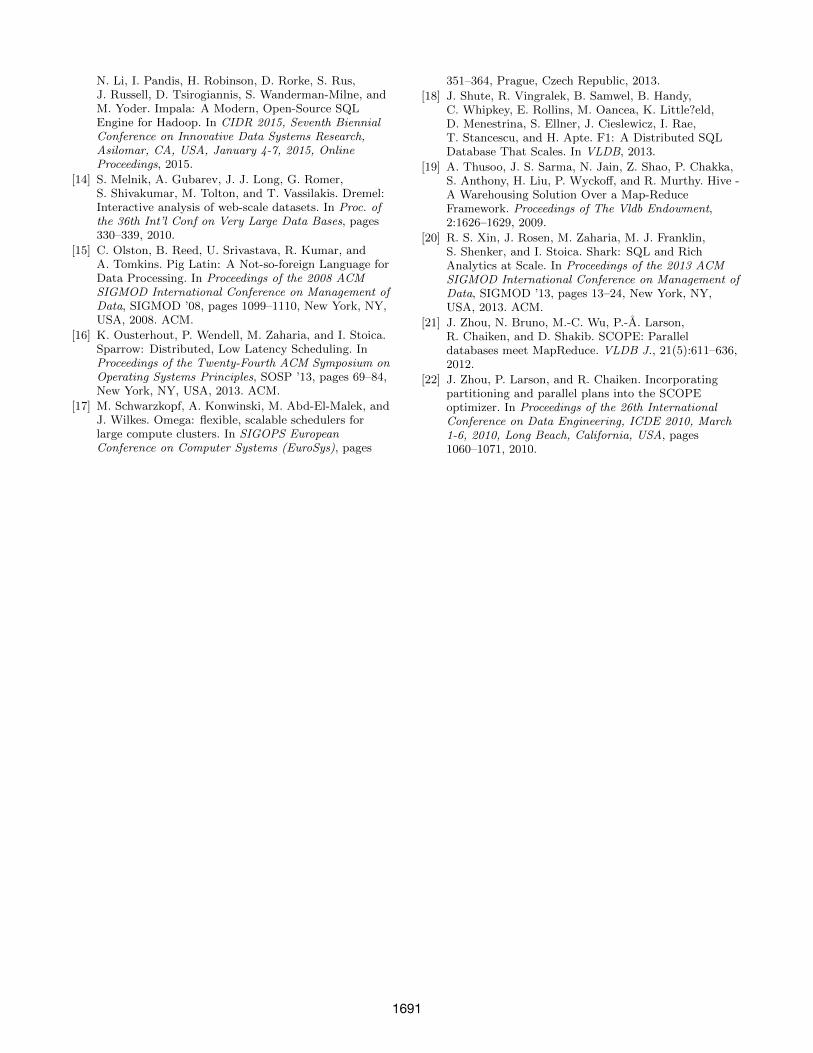
Finally, we evaluate how JetScope scales as the amountof the processed data increases. Specifically, we use severalTPC-H queries with increasing complexities and comparetheir latency using 20 servers against a 1TB database withthat of using 200 server against a 10TB database. As il-lustrated in Figure 10, the latency stays almost constant,
0
50
100
150
200
0 50 100 150 200
Spe
edup
Number of Tasks
Measured SpeedupIdeal Speedup with Linear Scalability
Figure 9: Latency with Different Numbers of Tasks.
0
10
20
30
40
50
Q1 Q4 Q6 Q12 Q15
Late
ncy
(s)
Query
10TB with 200 servers1TB with 20 servers
Figure 10: JetScope Scalability.
despite the 10x increase in scale. These results demonstratethe excellent scalability of the system.
8. RELATED WORKCloud-scale batch processing systems like Map-Reduce [8],
Scope [21], Pig [15] and Hive [19] are designed for very largescale data processing where a single job can process a fewpetabytes of data. One key design choice for such systemsis to mainly optimize the system throughput. Due to itsmassive scale, it becomes critical to deal with various sys-tem fluctuations and failures. For instance, those systemstypically trade latency for reliability and scalability by ma-terializing intermediate results to disks.
By contrast, interactive query processing systems pro-cess gigabytes to tens of terabytes of data and strives toachieve low latency execution. MapReduce Online [7] isa data processing system which streams data through op-erators to leverage pipelining and reduce the materializa-tion cost. Scuba [1] achieves low latency by storing tem-poral data in memory and executes queries by aggregatingdata through dynamic execution trees. Failures are handledby approximating results. Dremel [14] executes queries byleveraging dynamic aggregation trees to read, process, andaggregate data stored in columnar format. F1 [18] supportscomplex communication graphs over a distributed transac-tional store, and uses coarse-grained fault tolerance. F1 alsosupports transactional updates to the data. Spark [6, 4] andShark [20] systems achieve low latency by aggressively lever-aging RDD and provides fault tolerance through lineage re-computation. Impala [9] is an MPP SQL query engine whichextensively leverages effective code generation, a columnardata format, and an efficient I/O subsystem which short-circuits the distributed file system to improve I/O perfor-mance. JetScope leverages database techniques and sup-
1689
ports a wide range of complex queries with sophisticatedquery optimization. In addition, JetScope has a highlyscalable architecture to process hundreds of queries concur-rently in a truly multi-tenant cloud environment. Specialtechniques in query optimization, network communication,and scheduling are utilized to further optimize for query la-tency. The fine-grained fault tolerance mechanism enablesthe system to detect and recover from failures promptly andminimize any latency impact.
High performance scheduling with good quality is essen-tial when scheduling large scale interactive queries in a cloudenvironment. Omega [17] is a shared-state resource man-ager which allows schedulers to make independent decisions,and support transactional acquisition of resources. Spar-row [16] is a scheduler designed for low latency workloads.It operates using batch sampling of the queue length ofservers and schedule tasks on the servers with minimal queuelength. Locality is implemented as a scheduling constraint.Apollo [5] is a cost-based scheduler which schedules tasks byjudiciously trading off various factors such as load and lo-cality to minimize task runtime using an estimation model.JetScope improves scheduling efficiency further by gangscheduling tasks to allow full pipelining of the task execu-tion. It also considers correlated failures and their impacton the query latency to make the query execution less vul-nerable to any random system failures.
9. CONCLUSIONWe present a cloud scale interactive query processing sys-
tem, called JetScope, developed at Microsoft. The systemcombines the benefits of parallel database systems and dis-tributed low latency query processing engine. Specifically,it has a SQL-like declarative scripting language and deliversmassive scalability and high performance through advancedoptimizations. In order to achieve low latency in query pro-cessing, JetScope leverages various access methods, opti-mizes first rows delivery latency, and maximizes networkand scheduling efficiency. To handle failures that are com-mon in cloud scale computing clusters, JetScope providesa fine-grained fault tolerance mechanism which is able toefficiently detect and mitigate failures by only recomput-ing part of the query and minimizing any latency impact.JetScope has been deployed to hundreds of servers in pro-duction at Microsoft, serving a few million queries with avariety of complexities daily in interactive speeds.
10. ACKNOWLEDGMENTSWe would like to thank the following people for their con-
tributions to the JetScope system: Nico Bruno, Bill Fan,Haochuan Fan, Rashim Gupta, Pavel Iakovenko, YongChulKwon, and Martin Neupauer. We would also like to thankthe members of the Microsoft Scope team for their contri-butions to the Scope distributed computation eco-system,of which JetScope serves as the interactive computationcomponent. Finally, we are grateful to all the members ofthe Microsoft Big Data team for the support and collabora-tion.
11. REFERENCES[1] L. Abraham, J. Allen, O. Barykin, V. R. Borkar,
B. Chopra, C. Gerea, D. Merl, J. Metzler, D. Reiss,S. Subramanian, J. L. Wiener, and O. Zed. Scuba:
Diving into Data at Facebook. PVLDB,6(11):1057–1067, 2013.
[2] A. Ailamaki, D. J. DeWitt, M. D. Hill, andM. Skounakis. Weaving Relations for CachePerformance. In Proceedings of the 27th InternationalConference on Very Large Data Bases, VLDB ’01,pages 169–180, San Francisco, CA, USA, 2001.Morgan Kaufmann Publishers Inc.
[3] A. Alexandrov, R. Bergmann, S. Ewen, J.-C. Freytag,F. Hueske, A. Heise, O. Kao, M. Leich, U. Leser,V. Markl, F. Naumann, M. Peters, A. Rheinlander,M. J. Sax, S. Schelter, M. Hoger, K. Tzoumas, andD. Warneke. The Stratosphere Platform for Big DataAnalytics. The VLDB Journal, 23(6):939–964, Dec.2014.
[4] M. Armbrust, R. S. Xin, C. Lian, Y. Huai, D. Liu,J. K. Bradley, X. Meng, T. Kaftan, M. J. Franklin,A. Ghodsi, and M. Zaharia. Spark SQL: RelationalData Processing in Spark. In Proceedings of the 2015ACM SIGMOD International Conference onManagement of Data, SIGMOD ’15, pages 1383–1394,New York, NY, USA, 2015. ACM.
[5] E. Boutin, J. Ekanayake, W. Lin, B. Shi, J. Zhou,Z. Qian, M. Wu, and L. Zhou. Apollo: Scalable andCoordinated Scheduling for Cloud-Scale Computing.In 11th USENIX Symposium on Operating SystemsDesign and Implementation (OSDI 14), pages285–300, Broomfield, CO, Oct. 2014. USENIXAssociation.
[6] Y. Chen, S. Alspaugh, and R. H. Katz. InteractiveQuery Processing in Big Data Systems: A CrossIndustry Study of MapReduce Workloads. TechnicalReport UCB/EECS-2012-37, EECS Department,University of California, Berkeley, Apr 2012.
[7] T. Condie, N. Conway, P. Alvaro, J. M. Hellerstein,K. Elmeleegy, and R. Sears. Mapreduce online.Technical Report UCB/EECS-2009-136, EECSDepartment, University of California, Berkeley, Oct2009.
[8] J. Dean and S. Ghemawat. MapReduce: Simplifieddata processing on large clusters. Commun. ACM,51(1):107–113, Jan. 2008.
[9] M. K. et.al. Impala: A Modern, Open-Source SQLEngine for Hadoop . In Proceedings of the Conferenceon Innovative Data Systems Research 2015, CIDR ’15,2015.
[10] A. Floratou, U. F. Minhas, and F. Ozcan.SQL-on-Hadoop:Full Circle Back to Shared-NothingDatabase Architectures. Proceedings of the VLDBEndowment, 7(12), 2014.
[11] G. Graefe. The Cascades Framework for QueryOptimization. IEEE Data Eng. Bull., 18(3):19–29,1995.
[12] M. Isard, M. Budiu, Y. Yu, A. Birrell, and D. Fetterly.Dryad: Distributed Data-parallel Programs fromSequential Building Blocks. In Proceedings of the 2NdACM SIGOPS/EuroSys European Conference onComputer Systems 2007, EuroSys ’07, pages 59–72,New York, NY, USA, 2007. ACM.
[13] M. Kornacker, A. Behm, V. Bittorf, T. Bobrovytsky,C. Ching, A. Choi, J. Erickson, M. Grund, D. Hecht,M. Jacobs, I. Joshi, L. Kuff, D. Kumar, A. Leblang,
1690
N. Li, I. Pandis, H. Robinson, D. Rorke, S. Rus,J. Russell, D. Tsirogiannis, S. Wanderman-Milne, andM. Yoder. Impala: A Modern, Open-Source SQLEngine for Hadoop. In CIDR 2015, Seventh BiennialConference on Innovative Data Systems Research,Asilomar, CA, USA, January 4-7, 2015, OnlineProceedings, 2015.
[14] S. Melnik, A. Gubarev, J. J. Long, G. Romer,S. Shivakumar, M. Tolton, and T. Vassilakis. Dremel:Interactive analysis of web-scale datasets. In Proc. ofthe 36th Int’l Conf on Very Large Data Bases, pages330–339, 2010.
[15] C. Olston, B. Reed, U. Srivastava, R. Kumar, andA. Tomkins. Pig Latin: A Not-so-foreign Language forData Processing. In Proceedings of the 2008 ACMSIGMOD International Conference on Management ofData, SIGMOD ’08, pages 1099–1110, New York, NY,USA, 2008. ACM.
[16] K. Ousterhout, P. Wendell, M. Zaharia, and I. Stoica.Sparrow: Distributed, Low Latency Scheduling. InProceedings of the Twenty-Fourth ACM Symposium onOperating Systems Principles, SOSP ’13, pages 69–84,New York, NY, USA, 2013. ACM.
[17] M. Schwarzkopf, A. Konwinski, M. Abd-El-Malek, andJ. Wilkes. Omega: flexible, scalable schedulers forlarge compute clusters. In SIGOPS EuropeanConference on Computer Systems (EuroSys), pages
351–364, Prague, Czech Republic, 2013.
[18] J. Shute, R. Vingralek, B. Samwel, B. Handy,C. Whipkey, E. Rollins, M. Oancea, K. Little?eld,D. Menestrina, S. Ellner, J. Cieslewicz, I. Rae,T. Stancescu, and H. Apte. F1: A Distributed SQLDatabase That Scales. In VLDB, 2013.
[19] A. Thusoo, J. S. Sarma, N. Jain, Z. Shao, P. Chakka,S. Anthony, H. Liu, P. Wyckoff, and R. Murthy. Hive -A Warehousing Solution Over a Map-ReduceFramework. Proceedings of The Vldb Endowment,2:1626–1629, 2009.
[20] R. S. Xin, J. Rosen, M. Zaharia, M. J. Franklin,S. Shenker, and I. Stoica. Shark: SQL and RichAnalytics at Scale. In Proceedings of the 2013 ACMSIGMOD International Conference on Management ofData, SIGMOD ’13, pages 13–24, New York, NY,USA, 2013. ACM.
[21] J. Zhou, N. Bruno, M.-C. Wu, P.-A. Larson,R. Chaiken, and D. Shakib. SCOPE: Paralleldatabases meet MapReduce. VLDB J., 21(5):611–636,2012.
[22] J. Zhou, P. Larson, and R. Chaiken. Incorporatingpartitioning and parallel plans into the SCOPEoptimizer. In Proceedings of the 26th InternationalConference on Data Engineering, ICDE 2010, March1-6, 2010, Long Beach, California, USA, pages1060–1071, 2010.
1691