jestec- ukmitc_6_2015_001_012.pdf
TRANSCRIPT
Journal of Engineering Science and Technology Special Issue on 4th International Technical Conference 2014, June (2015) 1 - 12 © School of Engineering, Taylor’s University
1
CONCRETE DELAMINATIONS LOCATION AND ITS SEVERITY DETECTION BY VISUAL INSPECTION AND
GROUND PENETRATING RADAR
A. M. SHAMSUDIN, S. F. SENIN, R. HAMID*, K. YUSUF
Department of Civil and Structural Engineering, Faculty of Engineering and Built
Environment, Universiti Kebangsaan Malaysia, 43600 Bangi, Selangor DE, Malaysia
*Corresponding Author: [email protected]
Abstract
Concrete delamination is a problem commonly found in reinforced concrete
bridge deck and may cause severe damage to the structural component. The need to access the severity of this defect is pertinent as the detachment of
the concrete cover from the rebar is invisible and only showing when
cracks and spalling had reached the top of asphalt layer. Most of the bridge
inspections on concrete delamination rely on human interpretation based on
visual inspection (VI). VI is a very subjective assessment and should be conducted by highly trained bridge inspectors. It is also a time consuming
method. Alternatively, Ground Penetrating Radar (GPR) is a rapid and non-
destructive method to detect rebar delaminations within the bridge deck and
quantify this defect based on the reflection of electromagnetic waves by the
air void within the delamination. Therefore, VI and GPR method were
employed at a case study site to detect the location of the delamination and to estimate the extent of its severity. Based on the VI result, the
delamination was detected in almost of deck area where 8.7 m and 9.5 m
length was observed at area A1 and A8, respectively. Meanwhile, through
GPR, delaminations were measured at 4 different areas (A1, A4, A7 and
A8) with coverage of 8.5 m, 5.2 m, 4.1 m and 6.4 m respectively. GPR had
confirmed the existence of delamination at A1 and A8 and further had detected size of delaminated area at A4 and A7. The differences of
delamination extent detected by both methods are 2.3% at A1 and 32.6% at
A8. GPR has shown better capability in detecting size and location of
hidden delaminated area under asphalt layer of a bridge deck which is very
useful in maintenance decision.
Keywords: GPR, Visual inspection, Bridge inspection, Delamination, Location
and severity.
Concrete Delaminations Location and Its Severity Detection by Visual . . . . 2
Journal of Engineering Science and Technology Special Issue 6/2015
Nomenclatures
A1 Area 1 on bridge deck
A4 Area 4 on bridge deck
A7 Area 7 on bridge deck
A8 Area 8 on bridge deck
c
w
Speed of light in vacuum media, = 0.3 m/ns
Moisture content of concrete (kg/kg)
Greek Symbols
ε Dielectric value of media
Abbreviations
ABIM Annual Bridge Inspection Manual
GPR Ground Penetrating Radar
PWD Public Works Department
VI Visual inspection
1. Introduction
Delamination of concrete structures is a type of defect manifested by the
discontinuity of concrete surface as the result of widening fracture that extends
partly or completely through the member [1]. The growth of such defects on
high-performance structural component such as bridge deck structure is
inevitable as heavy traffic loads and harsh environment, i.e., climate changes
will accelerate the delamination growth [2]. Usually the defects were hidden in
the deck and not manifested on the surface until the significant deck cover
separate from substrate concrete, which impair the appearance and
serviceability problems [3]. Therefore, a precise routine assessment of the
delamination bridge’s condition is very important in order to maintain and
preserve the bridge appearance and structural serviceability.
As mentioned previously, concrete bridge is a high performance structure that
is frequently exposed to moist environment and repeated traffic loading of
vehicles. According to Shah and Chandra [4], the repeated traffic loading will
result in progressive microcracks on concrete surface. With the penetration of
rainwater inside the microcracks, steel bar will start to corrode as the steel surface
is attacked by moisture and oxygen. As rebar corrosion continues, the corrosion
products or rust can occupy several times than the original steel, resulting tensile
forces to develop in the concrete deck. Since concrete is relatively weak in
tension, internal cracks will develop and expose the steel surface to even more
moisture and oxygen. This situation will promote more accelerated corrosion
process surround the steel bar and causing the bond between steel bar and the
surround concrete breaks. Eventually, at the late stage, pieces of concrete break
away, forming large scale spalls in the concrete and huge potholes are easily
visualized and located by the bridge inspector. Therefore, a need on accessing the
delamination problem at an early stage is required before huge potholes started to
formed on the bridge deck surface.
3 A.M. Shamsudin et al.
Journal of Engineering Science and Technology Special Issue 6/2015
Ground Penetrating Radar (GPR) is one example of a method that has
potential to detect delamination in bridge deck structure. Wielen et al. [5], and
Wang et al. [6] have shown the capability of GPR on detecting the location of
embedded cracks inside a bridge deck and its length estimation. On the other
hand, visual inspection method is limited only on concrete surface observation
that is rated based on subjective scale provided by bridge authorities.
In this paper, a comparison study by both method was conducted at an aging
bridge located in Kuala Lipis, Pahang, Malaysia. Inspection works were done in
order to determine the location and the length of delaminations by both methods.
2. Methodology
2.1. Visual inspection (VI)
This study focused on the bridge deck component evaluation that was carried out
by inspecting bridge deck based on the Annually Bridge Inspection manual. The
bridge has been closed for replacement works due to its critical conditions. The
visual inspection method was done according to the Annual Bridge Inspection
Manual (ABIM) [7] by Public Works Department (PWD) Malaysia. The bridge
deck was evaluated by visually inspecting the bridge deck component
delamination defect. The characterisation of severity is given in Table 1 to
categories the delamination severity in this study.
Table 1. Severity of delamination on concrete bridge deck structure [7].
Severity Description
No defect No visible delaminated area
Light Delaminated area measuring < 150mm in any direction
Medium Delaminated area measuring 150mm - 300 mm in any direction
Severe Delaminated area measuring 300mm - 600 mm in any direction
Very severe Delaminated area measuring > 600mm in any direction
2.2. Ground penetrating radar (GPR)
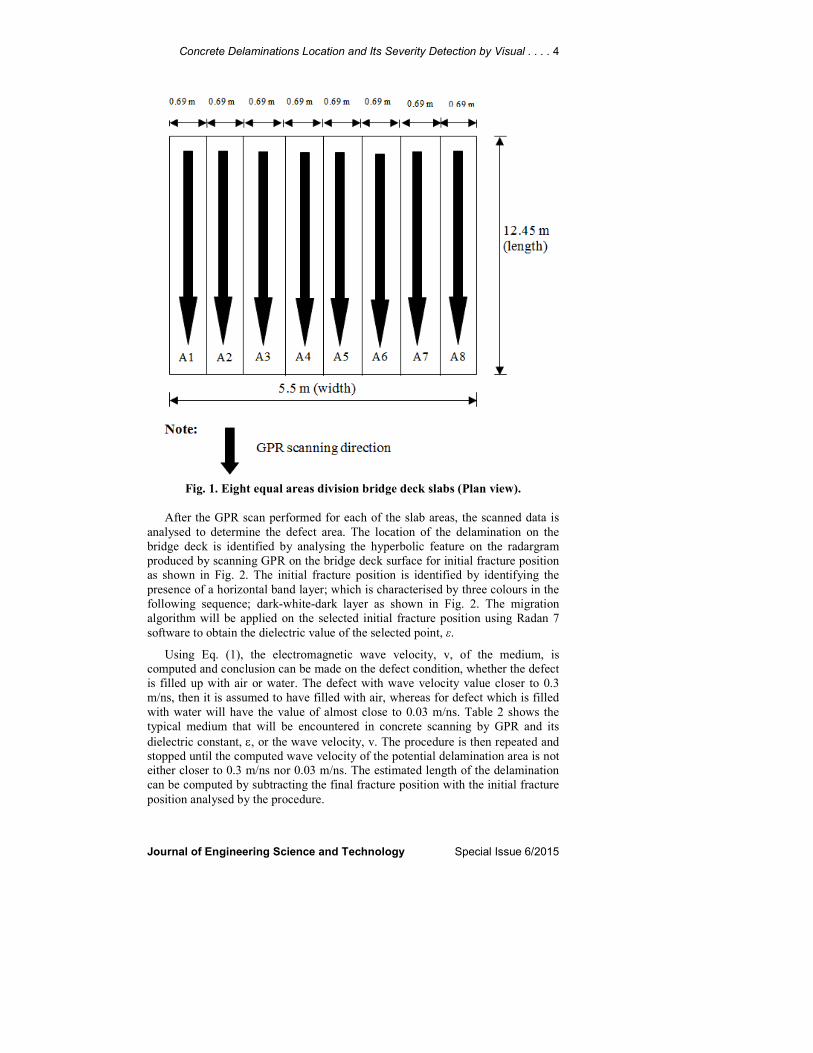
The plan view of the surveyed bridge deck slab in this study is shown in Fig. 1.
Before the GPR data collection is performed on the deck by scanning the antenna,
the deck width is divided into eight equal areas as depicted in Fig. 1. The width of
each slab areas is marked on the deck surface and recorded for the purpose of
GPR analysis. The surface condition of the deck should be free from any water to
ensure no influence of water on the GPR signals.
The GPR system consist of 1.6 GHz antenna, mounted on a lightweight and
highly manoeuvrable wheel cart and a controller unit to record the scanned data.
The data collection is performed for each of the slab areas by pushing the GPR
system in the direction shown in Fig. 1. As the GPR system is pushed along the
bridge deck, electromagnetic wave will be transmitted by the antenna and
propagates inside the bride deck and reflected to the receiver antenna once
encountered layer of different electrical impedance.
Concrete Delaminations Location and Its Severity Detection by Visual . . . . 4
Journal of Engineering Science and Technology Special Issue 6/2015
Fig. 1. Eight equal areas division bridge deck slabs (Plan view).
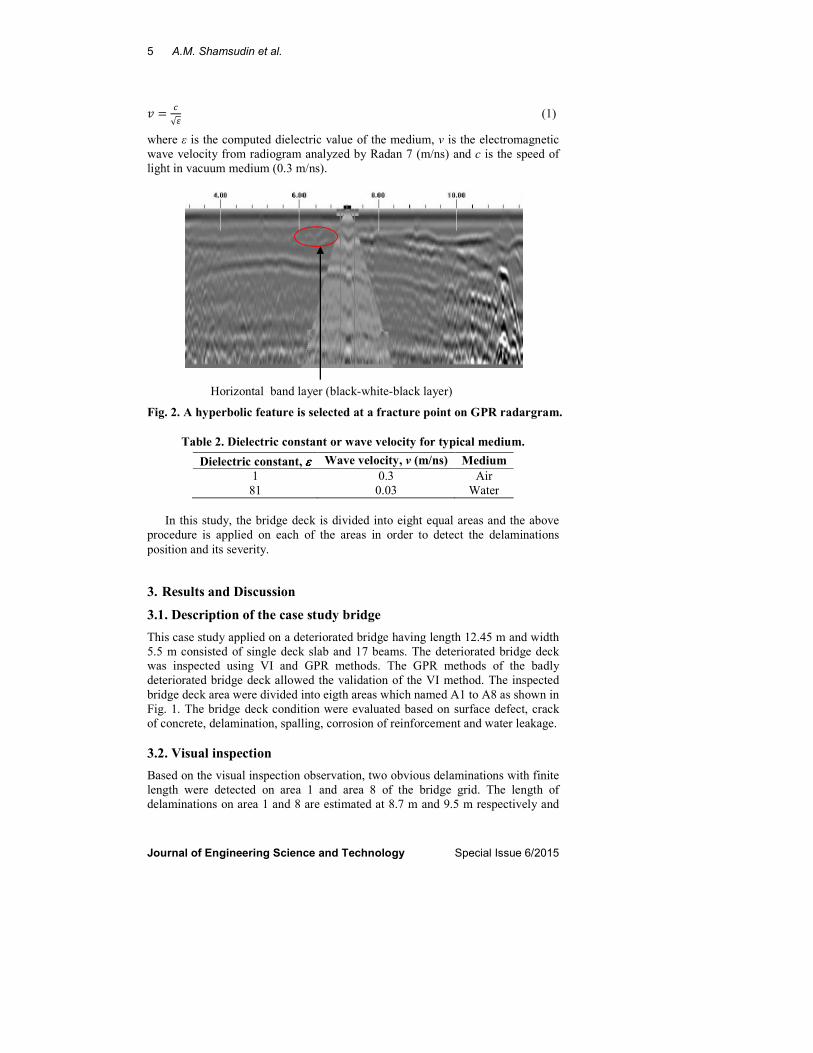
After the GPR scan performed for each of the slab areas, the scanned data is
analysed to determine the defect area. The location of the delamination on the
bridge deck is identified by analysing the hyperbolic feature on the radargram
produced by scanning GPR on the bridge deck surface for initial fracture position
as shown in Fig. 2. The initial fracture position is identified by identifying the
presence of a horizontal band layer; which is characterised by three colours in the
following sequence; dark-white-dark layer as shown in Fig. 2. The migration
algorithm will be applied on the selected initial fracture position using Radan 7
software to obtain the dielectric value of the selected point, ε.
Using Eq. (1), the electromagnetic wave velocity, v, of the medium, is
computed and conclusion can be made on the defect condition, whether the defect
is filled up with air or water. The defect with wave velocity value closer to 0.3
m/ns, then it is assumed to have filled with air, whereas for defect which is filled
with water will have the value of almost close to 0.03 m/ns. Table 2 shows the
typical medium that will be encountered in concrete scanning by GPR and its
dielectric constant, ε, or the wave velocity, v. The procedure is then repeated and
stopped until the computed wave velocity of the potential delamination area is not
either closer to 0.3 m/ns nor 0.03 m/ns. The estimated length of the delamination
can be computed by subtracting the final fracture position with the initial fracture
position analysed by the procedure.
5 A.M. Shamsudin et al.
Journal of Engineering Science and Technology Special Issue 6/2015
� =�
�� (1)
where ε is the computed dielectric value of the medium, v is the electromagnetic
wave velocity from radiogram analyzed by Radan 7 (m/ns) and c is the speed of
light in vacuum medium (0.3 m/ns).
Fig. 2. A hyperbolic feature is selected at a fracture point on GPR radargram.
Table 2. Dielectric constant or wave velocity for typical medium.
Dielectric constant, εεεε Wave velocity, v (m/ns) Medium
1 0.3 Air
81 0.03 Water
In this study, the bridge deck is divided into eight equal areas and the above
procedure is applied on each of the areas in order to detect the delaminations
position and its severity.
3. Results and Discussion
3.1. Description of the case study bridge
This case study applied on a deteriorated bridge having length 12.45 m and width
5.5 m consisted of single deck slab and 17 beams. The deteriorated bridge deck
was inspected using VI and GPR methods. The GPR methods of the badly
deteriorated bridge deck allowed the validation of the VI method. The inspected
bridge deck area were divided into eigth areas which named A1 to A8 as shown in
Fig. 1. The bridge deck condition were evaluated based on surface defect, crack
of concrete, delamination, spalling, corrosion of reinforcement and water leakage.
3.2. Visual inspection
Based on the visual inspection observation, two obvious delaminations with finite
length were detected on area 1 and area 8 of the bridge grid. The length of
delaminations on area 1 and 8 are estimated at 8.7 m and 9.5 m respectively and
Horizontal band layer (black-white-black layer)
Concrete Delaminations Location and Its Severity Detection by Visual . . . . 6
Journal of Engineering Science and Technology Special Issue 6/2015
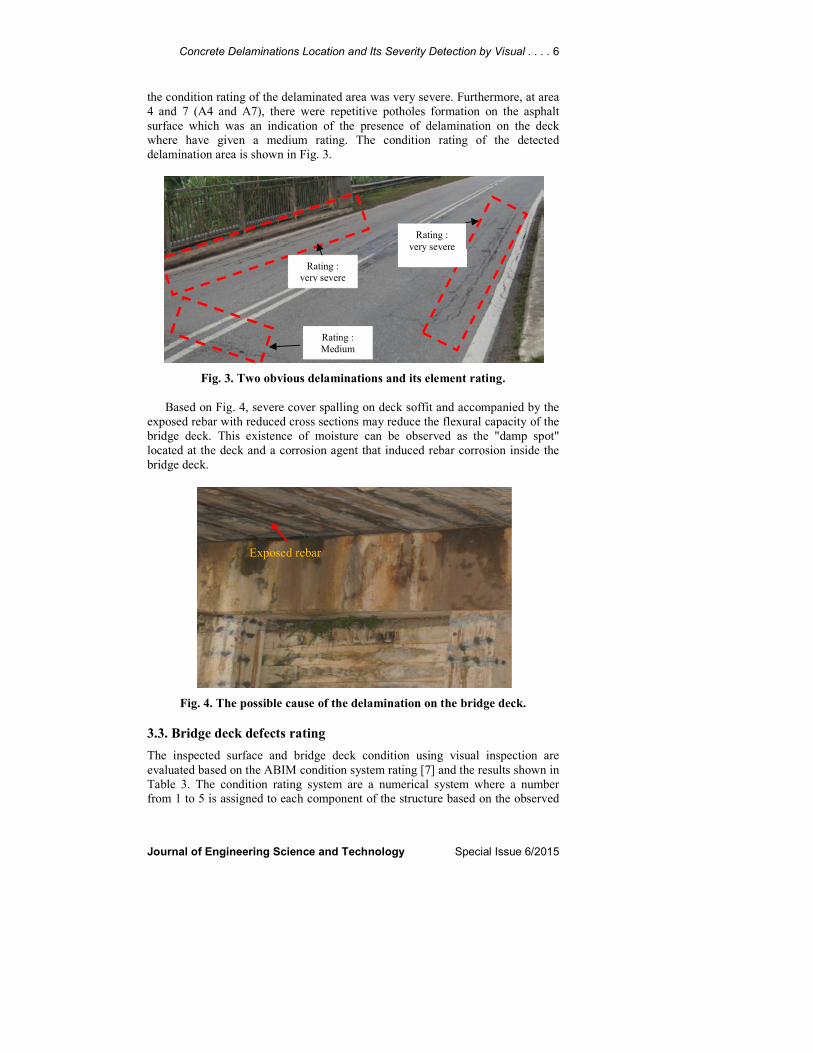
the condition rating of the delaminated area was very severe. Furthermore, at area
4 and 7 (A4 and A7), there were repetitive potholes formation on the asphalt
surface which was an indication of the presence of delamination on the deck
where have given a medium rating. The condition rating of the detected
delamination area is shown in Fig. 3.
Fig. 3. Two obvious delaminations and its element rating.
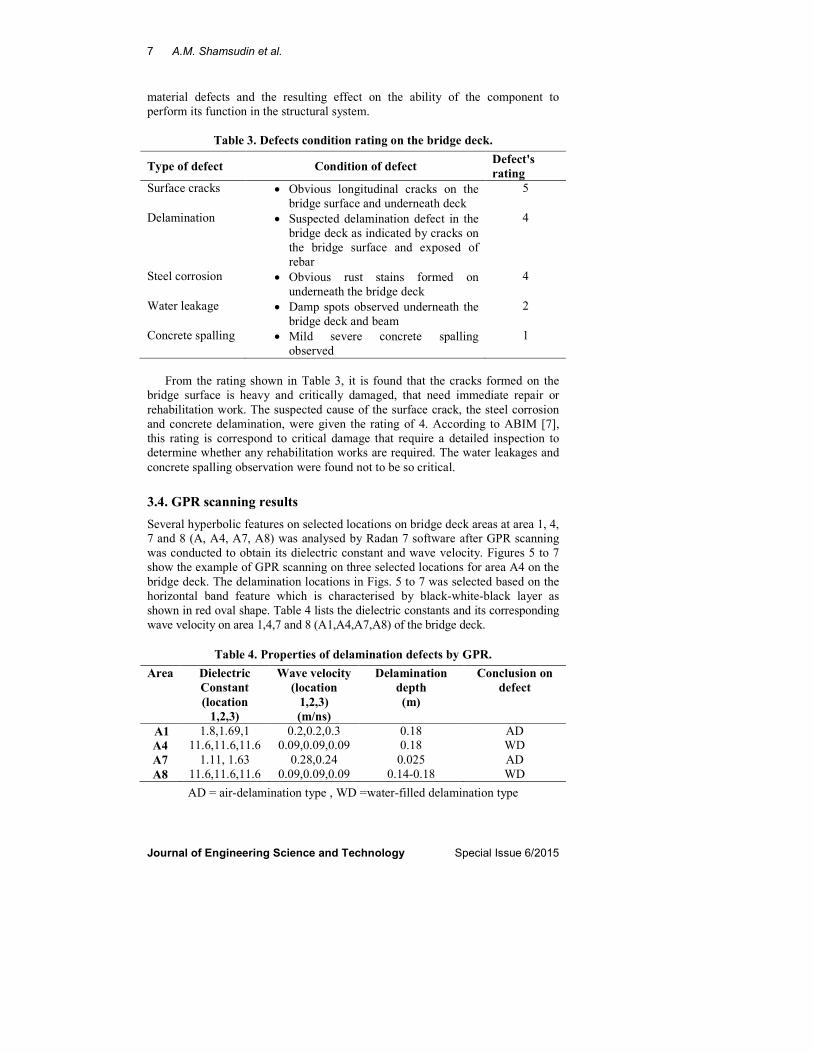
Based on Fig. 4, severe cover spalling on deck soffit and accompanied by the
exposed rebar with reduced cross sections may reduce the flexural capacity of the
bridge deck. This existence of moisture can be observed as the "damp spot"
located at the deck and a corrosion agent that induced rebar corrosion inside the
bridge deck.
Fig. 4. The possible cause of the delamination on the bridge deck.
3.3. Bridge deck defects rating
The inspected surface and bridge deck condition using visual inspection are
evaluated based on the ABIM condition system rating [7] and the results shown in
Table 3. The condition rating system are a numerical system where a number
from 1 to 5 is assigned to each component of the structure based on the observed
Rating :
very severe
Rating :
very severe
Exposed rebar
Rating :
Medium
7 A.M. Shamsudin et al.
Journal of Engineering Science and Technology Special Issue 6/2015
material defects and the resulting effect on the ability of the component to
perform its function in the structural system.
Table 3. Defects condition rating on the bridge deck.
Type of defect Condition of defect Defect's
rating
Surface cracks • Obvious longitudinal cracks on the bridge surface and underneath deck
5
Delamination • Suspected delamination defect in the
bridge deck as indicated by cracks on
the bridge surface and exposed of
rebar
4
Steel corrosion • Obvious rust stains formed on
underneath the bridge deck
4
Water leakage • Damp spots observed underneath the
bridge deck and beam
2
Concrete spalling • Mild severe concrete spalling
observed
1
From the rating shown in Table 3, it is found that the cracks formed on the
bridge surface is heavy and critically damaged, that need immediate repair or
rehabilitation work. The suspected cause of the surface crack, the steel corrosion
and concrete delamination, were given the rating of 4. According to ABIM [7],
this rating is correspond to critical damage that require a detailed inspection to
determine whether any rehabilitation works are required. The water leakages and
concrete spalling observation were found not to be so critical.
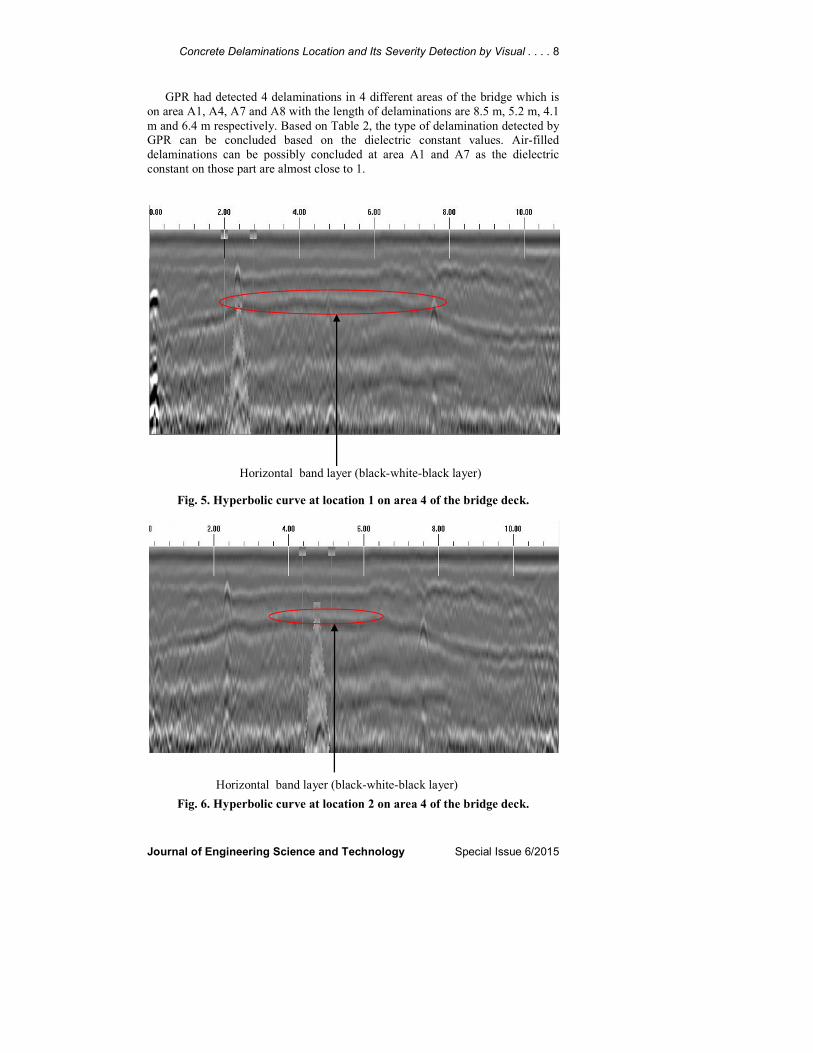
3.4. GPR scanning results
Several hyperbolic features on selected locations on bridge deck areas at area 1, 4,
7 and 8 (A, A4, A7, A8) was analysed by Radan 7 software after GPR scanning
was conducted to obtain its dielectric constant and wave velocity. Figures 5 to 7
show the example of GPR scanning on three selected locations for area A4 on the
bridge deck. The delamination locations in Figs. 5 to 7 was selected based on the
horizontal band feature which is characterised by black-white-black layer as
shown in red oval shape. Table 4 lists the dielectric constants and its corresponding
wave velocity on area 1,4,7 and 8 (A1,A4,A7,A8) of the bridge deck.
Table 4. Properties of delamination defects by GPR.
Area Dielectric
Constant
(location
1,2,3)
Wave velocity
(location
1,2,3)
(m/ns)
Delamination
depth
(m)
Conclusion on
defect
A1 1.8,1.69,1 0.2,0.2,0.3 0.18 AD
A4 11.6,11.6,11.6 0.09,0.09,0.09 0.18 WD
A7 1.11, 1.63 0.28,0.24 0.025 AD
A8 11.6,11.6,11.6 0.09,0.09,0.09 0.14-0.18 WD
AD = air-delamination type , WD =water-filled delamination type
Concrete Delaminations Location and Its Severity Detection by Visual . . . . 8
Journal of Engineering Science and Technology Special Issue 6/2015
GPR had detected 4 delaminations in 4 different areas of the bridge which is
on area A1, A4, A7 and A8 with the length of delaminations are 8.5 m, 5.2 m, 4.1
m and 6.4 m respectively. Based on Table 2, the type of delamination detected by
GPR can be concluded based on the dielectric constant values. Air-filled
delaminations can be possibly concluded at area A1 and A7 as the dielectric
constant on those part are almost close to 1.
Fig. 5. Hyperbolic curve at location 1 on area 4 of the bridge deck.
Fig. 6. Hyperbolic curve at location 2 on area 4 of the bridge deck.
Horizontal band layer (black-white-black layer)
Horizontal band layer (black-white-black layer)
9 A.M. Shamsudin et al.
Journal of Engineering Science and Technology Special Issue 6/2015
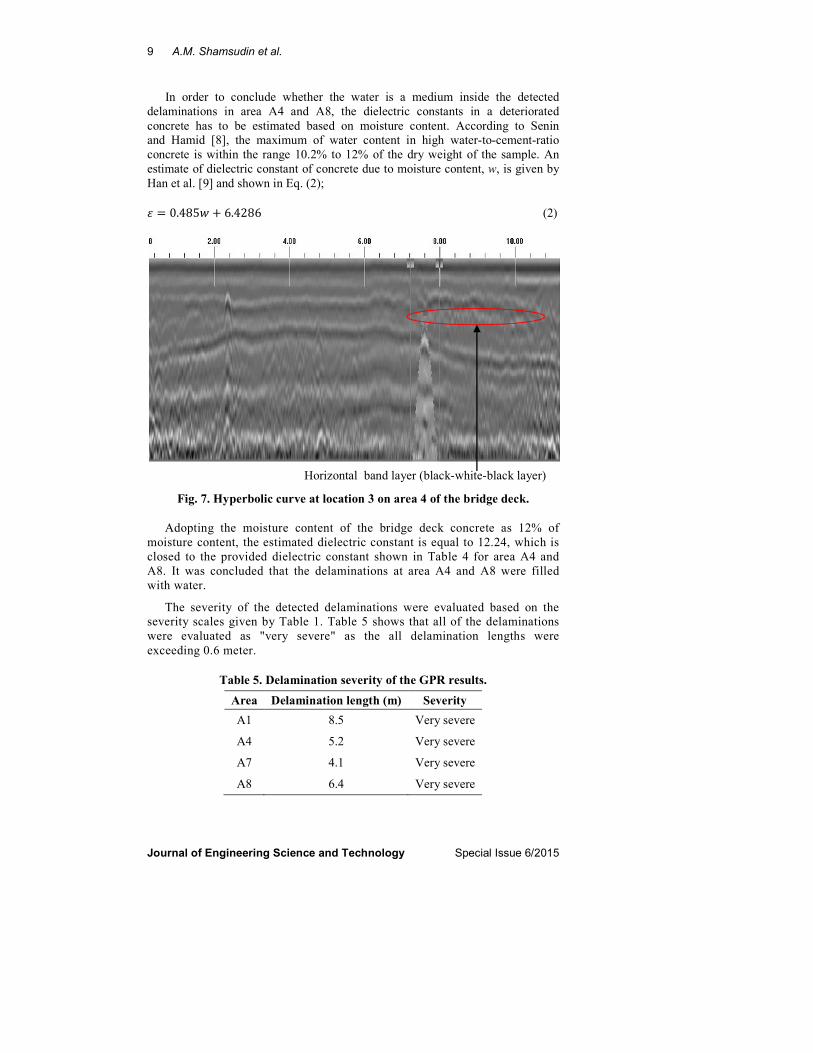
In order to conclude whether the water is a medium inside the detected
delaminations in area A4 and A8, the dielectric constants in a deteriorated
concrete has to be estimated based on moisture content. According to Senin
and Hamid [8], the maximum of water content in high water-to-cement-ratio
concrete is within the range 10.2% to 12% of the dry weight of the sample. An
estimate of dielectric constant of concrete due to moisture content, w, is given by
Han et al. [9] and shown in Eq. (2);
� = ���� ���� (2)
Fig. 7. Hyperbolic curve at location 3 on area 4 of the bridge deck.
Adopting the moisture content of the bridge deck concrete as 12% of
moisture content, the estimated dielectric constant is equal to 12.24, which is
closed to the provided dielectric constant shown in Table 4 for area A4 and
A8. It was concluded that the delaminations at area A4 and A8 were filled
with water.
The severity of the detected delaminations were evaluated based on the
severity scales given by Table 1. Table 5 shows that all of the delaminations
were evaluated as "very severe" as the all delamination lengths were
exceeding 0.6 meter.
Table 5. Delamination severity of the GPR results.
Area Delamination length (m) Severity
A1 8.5 Very severe
A4 5.2 Very severe
A7 4.1 Very severe
A8 6.4 Very severe
Horizontal band layer (black-white-black layer)

Concrete Delaminations Location and Its Severity Detection by Visual . . . . 10
Journal of Engineering Science and Technology Special Issue 6/2015
3.5. Comparison between the visual inspection and ground
penetrating radar
A comparison was made between both methods of accessing the detection
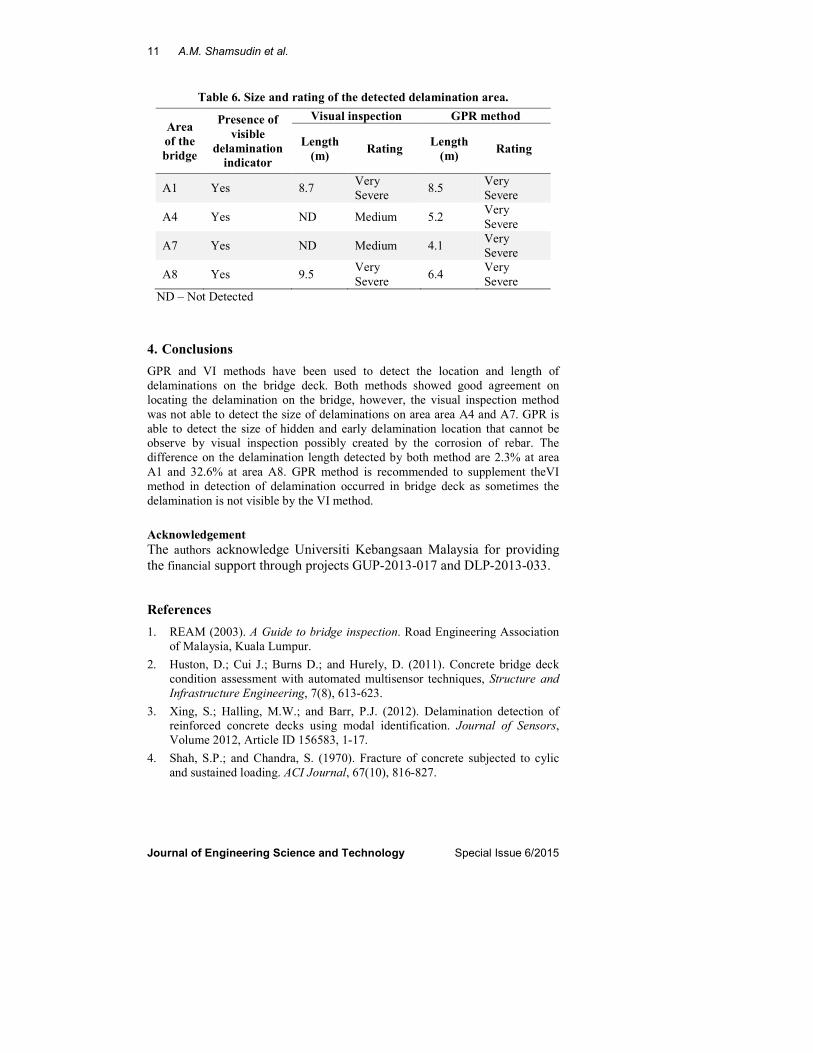
capabilities on each area of the bridge. Based on Table 6 and Fig. 8, it
is suggested that GPR has the ability to detect the location and size of
the delaminated area more accurate, located at area A1, A4, A7 and A8
having length 8.5 m, 5.2 m, 4.1 m and 6.4 m, respectively. Meanwhile, VI
method was only able to detect size of the delaminated area at A1 (8.7 m) and
A8 (9.5 m). The percentage of difference on delaminations extend by both
methods was 2.3 % at location A1 and 32.6 % at location A8. This
observation suggests that GPR showed its superior detection capability over
VI method as its ability to detect another two hidden delamination features on
the bridge deck.
GPR was able to detect more hidden delaminations features than visual
inspection as the method characterising the delamination based on the
electromagnetic wave reflection on air or water that trapped within the
delamination gap.
Fig. 8. Result of the delaminations detected using both methods.
11 A.M. Shamsudin et al.
Journal of Engineering Science and Technology Special Issue 6/2015
Table 6. Size and rating of the detected delamination area.
Area
of the
bridge
Presence of
visible
delamination
indicator
Visual inspection GPR method
Length
(m) Rating
Length
(m) Rating
A1 Yes 8.7 Very
Severe 8.5
Very
Severe
A4 Yes ND Medium 5.2 Very
Severe
A7 Yes ND Medium 4.1 Very
Severe
A8 Yes 9.5 Very
Severe 6.4
Very
Severe
ND – Not Detected
4. Conclusions
GPR and VI methods have been used to detect the location and length of
delaminations on the bridge deck. Both methods showed good agreement on
locating the delamination on the bridge, however, the visual inspection method
was not able to detect the size of delaminations on area area A4 and A7. GPR is
able to detect the size of hidden and early delamination location that cannot be
observe by visual inspection possibly created by the corrosion of rebar. The
difference on the delamination length detected by both method are 2.3% at area
A1 and 32.6% at area A8. GPR method is recommended to supplement theVI
method in detection of delamination occurred in bridge deck as sometimes the
delamination is not visible by the VI method.
Acknowledgement
The authors acknowledge Universiti Kebangsaan Malaysia for providing
the financial support through projects GUP-2013-017 and DLP-2013-033.
References
1. REAM (2003). A Guide to bridge inspection. Road Engineering Association
of Malaysia, Kuala Lumpur.
2. Huston, D.; Cui J.; Burns D.; and Hurely, D. (2011). Concrete bridge deck
condition assessment with automated multisensor techniques, Structure and
Infrastructure Engineering, 7(8), 613-623.
3. Xing, S.; Halling, M.W.; and Barr, P.J. (2012). Delamination detection of
reinforced concrete decks using modal identification. Journal of Sensors,
Volume 2012, Article ID 156583, 1-17.
4. Shah, S.P.; and Chandra, S. (1970). Fracture of concrete subjected to cylic
and sustained loading. ACI Journal, 67(10), 816-827.
Concrete Delaminations Location and Its Severity Detection by Visual . . . . 12
Journal of Engineering Science and Technology Special Issue 6/2015
5. Wielen, A.V.D.; Nguyen, F.; and Courard, L. (2010). Nondestructive
detection of delaminations in concrete bridge decks. 13th International
Conference on GPR, Lecce, 1-5.
6. Wang, Z.W.; Zhou, M.; Slabaugh, G.G.; Zhai, J.; and Fang, T. (2011).
Automatic detection of bridge deck condition from ground penetrating radar
images. IEEE Transactions on Automation Science and Engineering, 8(3),
633- 640.
7. PWD. (2003). Annual bridge inspection manual. Bridge Unit, Roads Branch,
Public Work Departement Malaysia.
8. Senin, S.F.; and Hamid, R. (2014). Effect of moisture and chloride content on
Ground Penetrating Radar normalized amplitude ratio of concrete slab.
International Technical Conference, Seoul, South Korea.
9. Han, J.B.; and Yang, J. (2011). Application of radar technology on concrete
water content testing. Advanced Materials Research, 250-253, 3103-3106.