jardine strategic annual report 2017 · jardine strategic hongkong land is a major listed property...
TRANSCRIPT
Jardine Strategic Annual Report 2017
Jardine StrategicAnnual Report 2017
ContentsHighlights 1Chairman’s Statement 2Group Structure 4Profit and Net Assets Analysis 5Operating Review 6Financial Review 14Directors’ Profiles 19Financial Statements 20Independent Auditors’ Report 109Five Year Summary 115Responsibility Statement 116Corporate Governance 117Principal Risks and Uncertainties 122Shareholder Information 123Group Offices 124
Jardine Strategic is a holding company with its principal interests in Jardine Matheson, Hongkong Land, Dairy Farm, Mandarin Oriental, Jardine Cycle & Carriage and Astra International. These companies are leaders in the fields of engineering and construction, transport services, insurance broking, property investment and development, retailing, restaurants, luxury hotels, motor vehicles and related activities, financial services, heavy equipment, mining and agribusiness.
Jardine Strategic’s policy is to take strategic stakes in multinational businesses, particularly those with an Asian focus, and to support their expansion. It also complements these interests with smaller positions in quality businesses with existing or potential links with the Group.
Jardine Strategic is incorporated in Bermuda and has a standard listing on the London Stock Exchange, with secondary listings in Bermuda and Singapore. Jardine Matheson Limited, which operates from Hong Kong, acts as General Manager to the Company and provides management services to the Group companies. It makes available senior management and provides financial, legal, human resources and treasury support services to the Group’s subsidiaries and associates.
Jardine Strategic Holdings LimitedJardine HouseHamiltonBermuda
Highlights
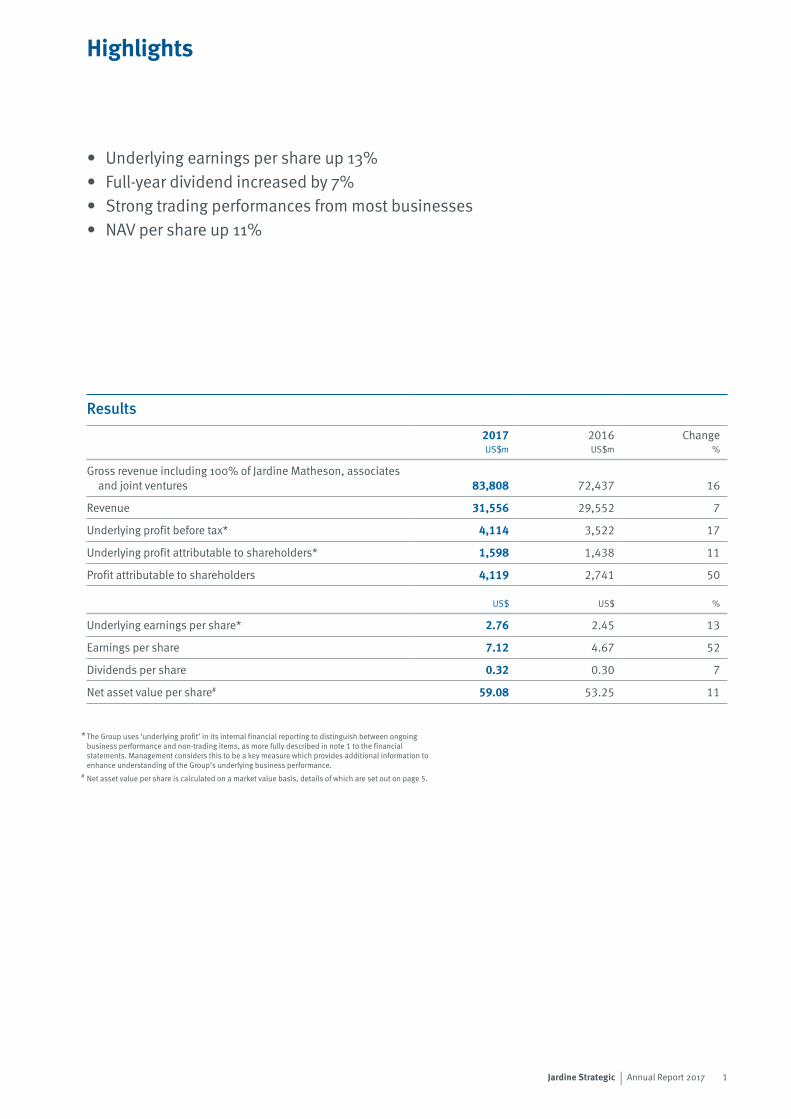
• Underlying earnings per share up 13%• Full-year dividend increased by 7%• Strong trading performances from most businesses• NAV per share up 11%
Results
2017US$m
2016US$m
Change%
Gross revenue including 100% of Jardine Matheson, associates and joint ventures 83,808 72,437 16
Revenue 31,556 29,552 7
Underlying profit before tax* 4,114 3,522 17
Underlying profit attributable to shareholders* 1,598 1,438 11
Profit attributable to shareholders 4,119 2,741 50
US$ US$ %
Underlying earnings per share* 2.76 2.45 13
Earnings per share 7.12 4.67 52
Dividends per share 0.32 0.30 7
Net asset value per share# 59.08 53.25 11
* The Group uses ‘underlying profit’ in its internal financial reporting to distinguish between ongoing business performance and non-trading items, as more fully described in note 1 to the financial statements. Management considers this to be a key measure which provides additional information to enhance understanding of the Group’s underlying business performance.
# Net asset value per share is calculated on a market value basis, details of which are set out on page 5.
1Jardine Strategic | Annual Report 2017
Chairman’s Statement
Sir Henry KeswickChairman
At Hongkong Land, underlying profit grew due to the strength of both its investment and development property activities. Positive performances in most of Dairy Farm’s retail formats and key associates were, however, offset by poor performances in its supermarket and hypermarket businesses in Southeast Asia and it recognized US$64 million of business rationalization costs. Mandarin Oriental saw generally improved performances across its hotel portfolio, notably in Hong Kong, but profitability was again impacted by the renovation of its London hotel. Mandarin Oriental’s adjusted shareholders’ funds at the end of 2017 were US$1.9 billion higher following a significant revaluation of The Excelsior hotel in Hong Kong.
Jardine Cycle & Carriage produced good profit growth as Astra’s results improved, although there was a reduced overall contribution from the group’s Direct Motor Interests and Other Strategic Interests including Thaco and Siam City Cement. Astra’s performance reflected the return to profitability at Permata Bank and enhanced commodity prices benefiting its heavy equipment and mining activities as well as agribusiness. The results from Astra’s automotive activities, however, were lower due to reduced earnings from motor cars in challenging markets.
The Group’s financial position remains strong with shareholders’ funds up 17% at US$30.5 billion at the year end. Robust cash flows have enabled continued high levels of capital expenditure to be combined with low levels of debt. The Group’s capital investment, including expenditure on properties for sale, was US$6.8 billion in 2017, in addition to which capital investment at Jardine Matheson and the Group’s associates and joint ventures exceeded US$4.9 billion. The consolidated net debt excluding financial services companies was US$3.8 billion at 31st December 2017, representing gearing of 6%.
The Board is recommending a final dividend of US¢22.50 per share, which produces a full-year dividend of US¢32.00 per share, up 7% from the prior year.
OverviewThe Group produced a good overall result for the year as most businesses traded well. There were strong performances from Astra, Hongkong Land and Jardine Matheson’s directly held businesses. Reduced contributions were, however, seen from Dairy Farm, Mandarin Oriental and Jardine Cycle & Carriage’s non-Astra businesses.
PerformanceThe Group’s revenue for 2017, including 100% of revenue from Jardine Matheson, associates and joint ventures, was US$83.8 billion, compared with US$72.4 billion in 2016, while the Group’s consolidated revenue for 2017 was US$31.6 billion, an increase of 7%. Jardine Strategic achieved an underlying profit before tax for the year of US$4,114 million, an increase of 17%. The underlying profit attributable to shareholders was up 11% at US$1,598 million, while underlying earnings per share were 13% higher at US$2.76.
The profit attributable to shareholders for the year was US$4,119 million, which included the Group’s US$2,326 million share of increases in property valuations, principally Hongkong Land’s investment properties in Hong Kong, and US$195 million of other net non-trading gains. This compares with US$2,741 million in 2016, which reflected a US$1,260 million increase in property valuations and US$43 million of other net non-trading gains.
Within Jardine Matheson’s businesses, Jardine Pacific achieved good results in 2017 as Gammon’s contribution recovered and Hactl benefited from increased cargo throughput. Jardine Motors’ increased earnings were led by strong results from mainland China. Jardine Lloyd Thompson’s contribution was higher due to a combination of a good trading performance and the absence of the restructuring costs seen in 2016.
2 Jardine Strategic | Annual Report 2017
Strategic DevelopmentsMainland China continued to grow in importance for the Group, with its contribution to profits increasing to 15%. In this market, Hongkong Land’s residential developments achieved an excellent result, while Zung Fu and affiliates Zhongsheng and Yonghui each had a very good year. A 28% shareholding was taken in Greatview, the second-largest supplier of aseptic carton packaging in China.
Hongkong Land secured five further development projects in mainland China during 2017, including in the new markets of Wuhan, Nanjing and Hangzhou. The retail component of its luxury retail and hotel complex in Beijing, WF CENTRAL, was opened in late 2017. In January 2018, Hongkong Land secured a prime commercial site in Nanjing city centre, which has a developable area of 235,000 sq. m.
In Southeast Asia, Jardine Cycle & Carriage continued to build its business interests, acquiring a 10% shareholding in Vinamilk, the leading dairy producer in Vietnam with a market share of some 58%. Hongkong Land secured further development projects in Singapore and Vietnam, together with a joint-venture interest in a prime freehold site in Bangkok. Astra in Indonesia is expanding its operations further with investments in toll roads, energy and property. In February 2018, Astra acquired a minority stake in GO-JEK, Indonesia’s leading multi-platform technology group.
The Group’s new investments in Greatview and Vinamilk are in line with the strategy of taking stakes in leading companies that are benefiting from the opportunities offered by the economic development of the region and the growth of the middle classes. Investments are being made in strong companies with first class management teams that can accelerate the Group’s exposure to fast growing markets.
Weakness in Dairy Farm’s supermarket and hypermarket businesses in Southeast Asia led to a review being undertaken to determine the actions necessary to re-establish the competitive positions of these operations. While Dairy Farm’s other formats and markets are trading well, Dairy Farm recognizes that it must change and adapt in the face of intensifying and evolving competition, both online and offline, as well as greater demands from increasingly well-informed customers.
During the year, Mandarin Oriental explored strategic options for The Excelsior hotel in Hong Kong. While a review of market interest in a potential sale did not give rise to any acceptable offers, all options for the site are still being considered, including the redevelopment of the site as a commercial property.
PeopleJulian Hui and Dr George Koo will step down from the Board at the forthcoming Annual General Meeting and will not seek re-election. We would like to thank them for their contributions to the Company. We are very pleased that Lord Powell of Bayswater has been invited to join the Board with effect from 10th May 2018.
OutlookThe Group’s key markets in Greater China and Southeast Asia look well placed for 2018 as the good levels of economic growth seen in 2017 appear set to continue. This, when coupled with the development initiatives that are being pursued across the Group’s businesses, provides the basis for future profit growth.
3Jardine Strategic | Annual Report 2017
Jardine Strategic
Hongkong Land is a major listed property investment, management and development group that operates under the principles of excellence, integrity and partnership. Its more than 850,000 sq. m. of prime office and retail space in Hong Kong, Singapore and other major Asian cities attracts the world’s foremost companies and luxury brands. The group also has a number of high quality residential and mixed-use projects under development in cities across Greater China and Southeast Asia. (50%)
Jardine Cycle & Carriage is a leading Singapore-listed company. In addition to holding just over 50% in Astra International, it is growing its portfolio of automotive and other strategic interests in Southeast Asia, including in Indonesia, Vietnam, Singapore, Thailand, Malaysia and Myanmar. The businesses include motor dealerships, financial services, dairy, cement, engineering and property. (75%)
Dairy Farm is a leading listed Asian retailer that is active across four divisions, being Food (including supermarkets, hypermarkets and convenience stores), Health and Beauty, Home Furnishings and Restaurants. The group aims to provide quality and value to Asian consumers by offering leading brands, a compelling retail experience and great service, all provided through a strong store network supported by efficient supply chains. (78%)
Mandarin Oriental is an international hotel investment and management group with deluxe and first class hotels, resorts and residences in sought-after destinations. The group operates 31 hotels and eight residences in 21 countries and territories, and has a strong pipeline of properties under development. As an innovative industry leader, the group is committed to exceeding its guests’ expectations through exceptional levels of hospitality. (78%)
Astra is a major listed Indonesian group working through its seven business lines – Automotive; Financial Services; Heavy Equipment, Mining, Construction & Energy; Agribusiness; Infrastructure and Logistics; Information Technology; and Property. Astra’s philosophy is to be an
asset to the nation with an emphasis on sustainable growth, through providing the best services to its customers, a first class working environment and socially responsible outlook. Jardine Cycle & Carriage has a shareholding of just over 50%.
Jardine Matheson
Jardine Pacific’s diverse portfolio comprises industry leaders in the areas of engineering and construction, airport and transport services, restaurants and IT. Its companies seek to deliver excellent performance and best in class service to their customers and to create value for their business partners and shareholders. (100%)
Jardine Matheson is a diversified Asian-based group with unsurpassed experience in the region, having been founded in China in 1832. It comprises a broad portfolio of market-leading businesses, held in part through its 84% stake in Jardine Strategic, which represent a combination of cash generating activities and long-term property assets and are closely aligned to the increasingly prosperous consumers of the region. (58%)
Jardine Motors is engaged in the sales and service of motor vehicles and related activities. It has operations in Hong Kong, Macau and the United Kingdom, and a large and growing presence in Southern China. It combines a customer-oriented approach with first class products and services. (100%)
(Figures in brackets show effective ownership by Jardine Matheson as at 8th March 2018.)
(Figures in brackets show effective ownership by Jardine Strategic as at 8th March 2018.)
Jardine Lloyd Thompson is one of the world’s leading providers of insurance, reinsurance and employee benefits related advice, brokerage and associated services. A UK-listed group, its deep specialist knowledge and entrepreneurial culture give it the insights and creative freedom to go beyond the routine and deliver better results for its clients. (42%)
4 Jardine Strategic | Annual Report 2017
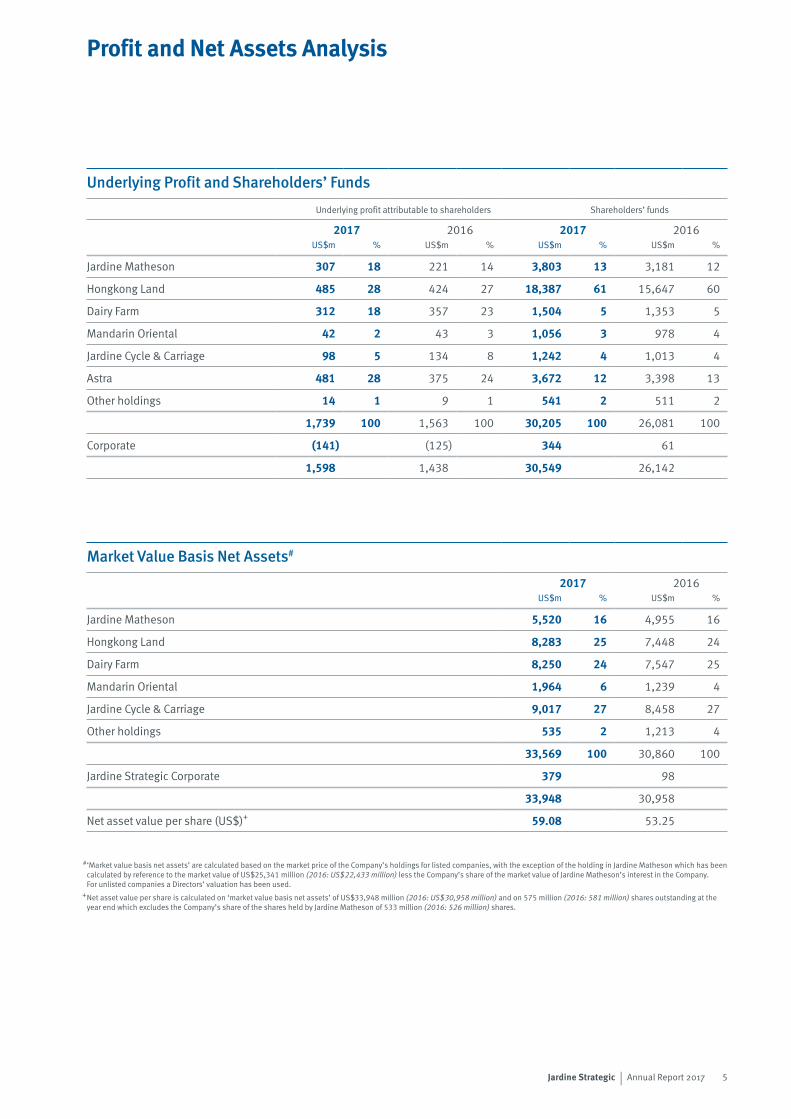
Underlying Profit and Shareholders’ Funds
Underlying profit attributable to shareholders Shareholders’ funds
2017 2016 2017 2016US$m % US$m % US$m % US$m %
Jardine Matheson 307 18 221 14 3,803 13 3,181 12
Hongkong Land 485 28 424 27 18,387 61 15,647 60
Dairy Farm 312 18 357 23 1,504 5 1,353 5
Mandarin Oriental 42 2 43 3 1,056 3 978 4
Jardine Cycle & Carriage 98 5 134 8 1,242 4 1,013 4
Astra 481 28 375 24 3,672 12 3,398 13
Other holdings 14 1 9 1 541 2 511 2
1,739 100 1,563 100 30,205 100 26,081 100
Corporate (141) (125) 344 61
1,598 1,438 30,549 26,142
Market Value Basis Net Assets#
2017 2016US$m % US$m %
Jardine Matheson 5,520 16 4,955 16
Hongkong Land 8,283 25 7,448 24
Dairy Farm 8,250 24 7,547 25
Mandarin Oriental 1,964 6 1,239 4
Jardine Cycle & Carriage 9,017 27 8,458 27
Other holdings 535 2 1,213 4
33,569 100 30,860 100
Jardine Strategic Corporate 379 98
33,948 30,958
Net asset value per share (US$)+ 59.08 53.25
‘Market value basis net assets’ are calculated based on the market price of the Company’s holdings for listed companies, with the exception of the holding in Jardine Matheson which has been calculated by reference to the market value of US$25,341 million (2016: US$22,433 million) less the Company’s share of the market value of Jardine Matheson’s interest in the Company. For unlisted companies a Directors’ valuation has been used.
Net asset value per share is calculated on ‘market value basis net assets’ of US$33,948 million (2016: US$30,958 million) and on 575 million (2016: 581 million) shares outstanding at the year end which excludes the Company’s share of the shares held by Jardine Matheson of 533 million (2016: 526 million) shares.
#
+
Profit and Net Assets Analysis
5Jardine Strategic | Annual Report 2017
• Underlying earnings per share up 12%
• Jardine Pacific’s businesses performed well
• Jardine Motors saw strong results from mainland China
• Further revenue and profit growth in JLT
• Increased contribution from Jardine Strategic
2017 2016 Change (%)
Revenue (US$ billion) 39.5 37.1 6
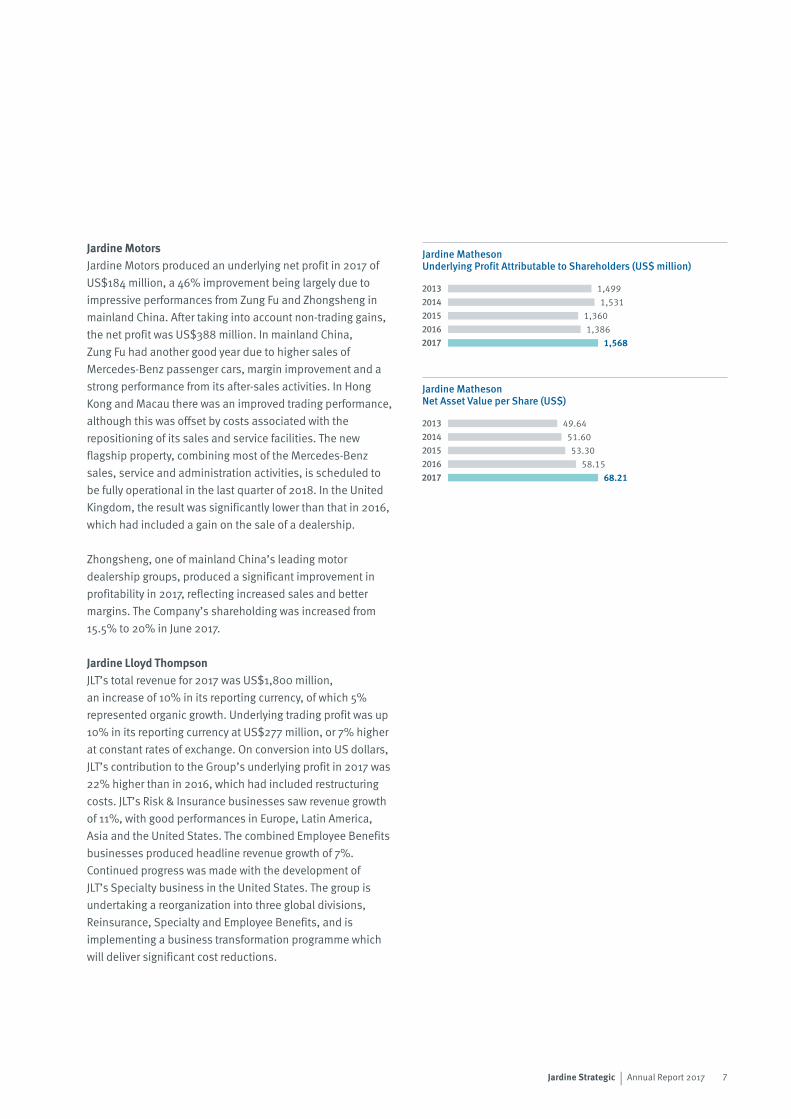
Underlying profit attributable to shareholders (US$ million) 1,568 1,386 13
Underlying earnings per share (US$) 4.17 3.71 12
Net asset value per share (US$) 68.21 58.15 17
Operating Review
Ben KeswickManaging Director
Jardine Matheson achieved an underlying profit before tax for the year of US$4,378 million, an increase of 17%. The underlying profit attributable to shareholders was up 13% at US$1,568 million, while underlying earnings per share were 12% higher at US$4.17. The profit attributable to shareholders for the year was US$3,785 million, benefiting mainly from an increase in the value of Hongkong Land’s investment property portfolio. This compares with US$2,503 million in 2016, which also benefited from increases in property values.
Jardine PacificJardine Pacific produced an underlying net profit of US$164 million, including an initial contribution from the interest in Greatview, compared with US$135 million in 2016, an increase of 21%. The net profit after non-trading gains was US$174 million. Within its engineering and construction activities, Jardine Schindler and JEC again performed well and Gammon’s result recovered in 2017 following a weaker performance in 2016 due to provisions for a specific civils project. Jardine Restaurants produced steady profit growth, but the reported result was lower due to one-off employee benefit costs. The contribution from Transport Services reflected Hactl’s improved performance due to good growth in cargo throughput. JTH delivered reduced earnings as IT markets remained soft.
The Company acquired 28% stake in Hong Kong-listed Greatview in June 2017. Founded in mainland China, Greatview is the second-largest supplier of aseptic carton packaging in China and the third-largest globally. Greatview achieved stable growth during 2017 as the effect of challenging market conditions in China was offset by strong growth momentum in its international business. Its contribution from June onwards reflects the Group’s equity interest. Jardine Pacific will be supporting Greatview’s continued development, particularly in new markets including those in Southeast Asia.
Jardine Matheson
6 Jardine Strategic | Annual Report 2017
Jardine Matheson Underlying Profit Attributable to Shareholders (US$ million)
Jardine Matheson Net Asset Value per Share (US$)
Jardine MotorsJardine Motors produced an underlying net profit in 2017 of US$184 million, a 46% improvement being largely due to impressive performances from Zung Fu and Zhongsheng in mainland China. After taking into account non-trading gains, the net profit was US$388 million. In mainland China, Zung Fu had another good year due to higher sales of Mercedes-Benz passenger cars, margin improvement and a strong performance from its after-sales activities. In Hong Kong and Macau there was an improved trading performance, although this was offset by costs associated with the repositioning of its sales and service facilities. The new flagship property, combining most of the Mercedes-Benz sales, service and administration activities, is scheduled to be fully operational in the last quarter of 2018. In the United Kingdom, the result was significantly lower than that in 2016, which had included a gain on the sale of a dealership.
Zhongsheng, one of mainland China’s leading motor dealership groups, produced a significant improvement in profitability in 2017, reflecting increased sales and better margins. The Company’s shareholding was increased from 15.5% to 20% in June 2017.
Jardine Lloyd ThompsonJLT’s total revenue for 2017 was US$1,800 million, an increase of 10% in its reporting currency, of which 5% represented organic growth. Underlying trading profit was up 10% in its reporting currency at US$277 million, or 7% higher at constant rates of exchange. On conversion into US dollars, JLT’s contribution to the Group’s underlying profit in 2017 was 22% higher than in 2016, which had included restructuring costs. JLT’s Risk & Insurance businesses saw revenue growth of 11%, with good performances in Europe, Latin America, Asia and the United States. The combined Employee Benefits businesses produced headline revenue growth of 7%. Continued progress was made with the development of JLT’s Specialty business in the United States. The group is undertaking a reorganization into three global divisions, Reinsurance, Specialty and Employee Benefits, and is implementing a business transformation programme which will deliver significant cost reductions.
1,4991,531
1,3601,386
1,568
Jardine Matheson Underlying Profit Attributable to Shareholders (US$ million)JS
20132014201520162017
49.6451.6053.30
58.1568.21
Jardine Matheson Net Asset Value per Share (US$)JS
20132014201520162017
7Jardine Strategic | Annual Report 2017
Operating Review (continued)
Hongkong Land’s underlying profit for 2017 rose 14% to US$970 million, with strong performances from both investment properties and development properties. The profit attributable to shareholders of US$5,585 million included net revaluation gains of US$4,615 million recorded on its investment properties, principally in Hong Kong. This compares to US$3,346 million in 2016, which included net revaluation gains of US$2,498 million. The group remains well-financed with net debt of US$2.5 billion at the year end and net gearing of 7%.
In investment properties, limited competitive supply in the Hong Kong office leasing market benefited the group’s Central portfolio where year-end vacancy reduced to 1.4% and rental reversions remained positive. The retail portion of the portfolio was effectively fully occupied, although rental reversions were neutral during the year. The group’s Singapore office portfolio was almost fully let, but the average rents declined marginally.
In mainland China, the retail component of the group’s luxury retail and hotel complex in Beijing opened in late 2017, and the Mandarin Oriental Hotel is due to open in the second half of 2018. Elsewhere, in Jakarta the development of the fifth tower of World Trade Centre was completed, in Phnom Penh a 25,000 sq. m. mixed-use complex was opened, and in Bangkok’s central business district the group acquired a 49%-joint venture interest in a prime freehold site with a developable area of 440,000 sq. m.
Within development properties, the profit contribution from mainland China increased significantly in 2017 due to higher completions of residential units. In Singapore, results were lower with only one project completion during the year. Hongkong Land’s joint venture projects in the rest of Southeast Asia are progressing on schedule.
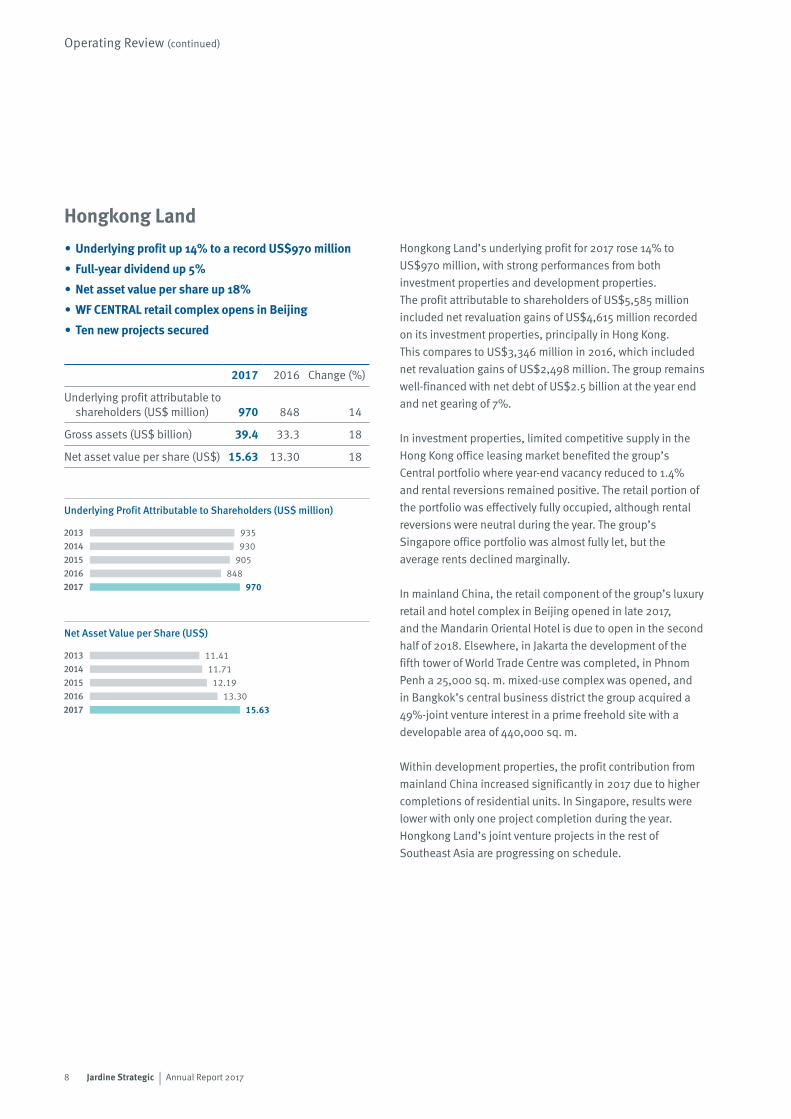
Hongkong Land• Underlying profit up 14% to a record US$970 million
• Full-year dividend up 5%
• Net asset value per share up 18%
• WF CENTRAL retail complex opens in Beijing
• Ten new projects secured
2017 2016 Change (%)
Underlying profit attributable to shareholders (US$ million) 970 848 14
Gross assets (US$ billion) 39.4 33.3 18
Net asset value per share (US$) 15.63 13.30 18
935930
905848
970
Underlying Earnings per Share (US¢)Hongkong Land
20132014201520162017
11.4111.71
12.1913.30
15.63
Net Asset Value per Share (US$)Hongkong Land
20132014201520162017
Underlying Profit Attributable to Shareholders (US$ million)
Net Asset Value per Share (US$)
8 Jardine Strategic | Annual Report 2017
Dairy Farm’s result in 2017 was disappointing as positive performances in most formats and key associates were offset by weakness in its supermarket and hypermarket operations in Southeast Asia. Sales for the year by the group’s subsidiaries were little changed at US$11.3 billion. Total sales, including 100% of associates and joint ventures, were up 7% at US$21.8 billion, reflecting strong growth at both Yonghui and Maxim’s. The underlying profit attributable to shareholders was 13% lower at US$403 million, after deducting rationalization costs of US$64 million principally relating to the closure of underperforming stores and stock clearance in the Food Division.
The Food Division’s poor performances in its supermarket and hypermarket businesses in Malaysia, Singapore and Indonesia led to sales being down and profits significantly lower. A strategic review is underway to determine the actions needed to restore the profitability of these businesses. Sales were more resilient in Hong Kong, although increasing costs led to profits being marginally lower. The group’s convenience stores produced overall sales and profit growth, in part reflecting a consumer shift to more convenient retail formats and enhanced customer offerings.
In the Health and Beauty Division, strong performances in Hong Kong, Macau and Indonesia, together with improvements in mainland China, led to sales and profit growth. IKEA recorded higher sales and trading profit, but overall profit was affected by store pre-opening expenses in Hong Kong. There was encouraging growth in IKEA’s e-commerce channels. Maxim’s, which enjoyed good sales and profit growth during the year, is continuing to expand in the region with the acquisition of the existing businesses and franchises of Genki Sushi in both Singapore and Malaysia, and of Starbucks in Singapore.
The group’s 20%-owned associate in mainland China, Yonghui Superstores, opened a net 292 new stores in 2017, which underpinned its 19% growth in revenue. Supply chain and shrinkage improvements produced margin gains, which together with better capital utilization, led to a 45% growth in profit.
Dairy Farm
Sales (excluding Associates and Joint Ventures) (US$ billion)
Underlying Profit Attributable to Shareholders (US$ million)
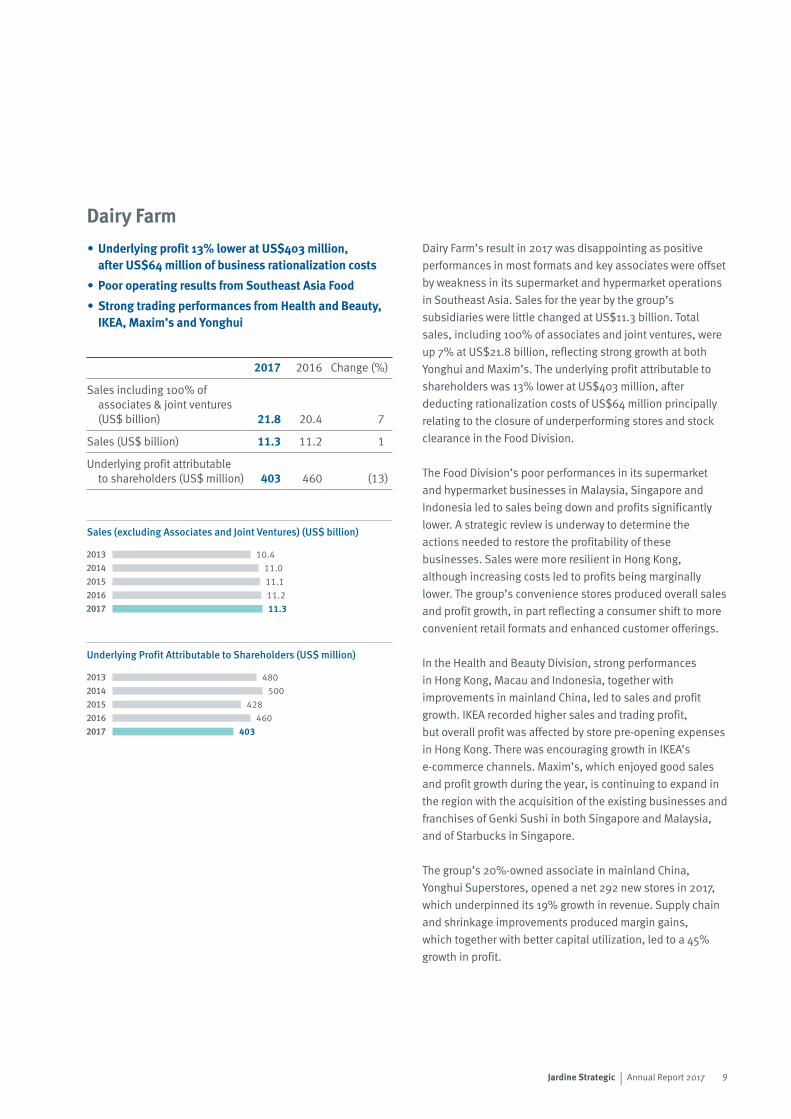
• Underlying profit 13% lower at US$403 million, after US$64 million of business rationalization costs
• Poor operating results from Southeast Asia Food
• Strong trading performances from Health and Beauty, IKEA, Maxim’s and Yonghui
2017 2016 Change (%)
Sales including 100% of associates & joint ventures (US$ billion) 21.8 20.4 7
Sales (US$ billion) 11.3 11.2 1
Underlying profit attributable to shareholders (US$ million) 403 460 (13)
480500
428460
403
Underlying Profit Attributableto Shareholders (US$ million)Dairy Farm
20132014201520162017
10.411.011.111.211.3
SalesJS Dairy Farm
20132014201520162017
9Jardine Strategic | Annual Report 2017
Operating Review (continued)
Mandarin Oriental’s underlying profit was slightly lower primarily due to the impact of the renovation of its London property as the combined results of the group’s other hotels improved in 2017, notably in Hong Kong. The underlying profit was US$55 million, compared with US$57 million in 2016, and with no non-trading items the profit attributable to shareholders was also US$55 million, in line with 2016.
The renovation of Mandarin Oriental Hyde Park, London is on schedule to complete in the second quarter of 2018. The jointly-owned Hotel Ritz, Madrid closed at the end of February 2018 to commence an extensive renovation. In June 2017, the group announced that consideration was being given to its strategic options for The Excelsior, Hong Kong. A subsequent review of market interest in a potential sale did not give rise to any acceptable offers. Mandarin Oriental is still considering all options for the site, including possible redevelopment as a commercial property, although no decision has yet been made.
Mandarin Oriental announced nine new management contracts over the past year. They comprise the management of existing hotels in Santiago, Chile and on Canouan in Saint Vincent and the Grenadines; four hotels with branded residences scheduled to open in Dubai and Honolulu in 2020, in London in 2021 and in Melbourne in 2022; a hotel in Beijing located in a traditional hutong quarter due to open in 2019; branded residences in Barcelona opening in 2020; and a coastal resort in Viña del Mar in Chile opening in 2020. In the next 12 months the group expects to open its first hotels in the Middle East, in Doha and Dubai, as well as Mandarin Oriental Wangfujing in Beijing.
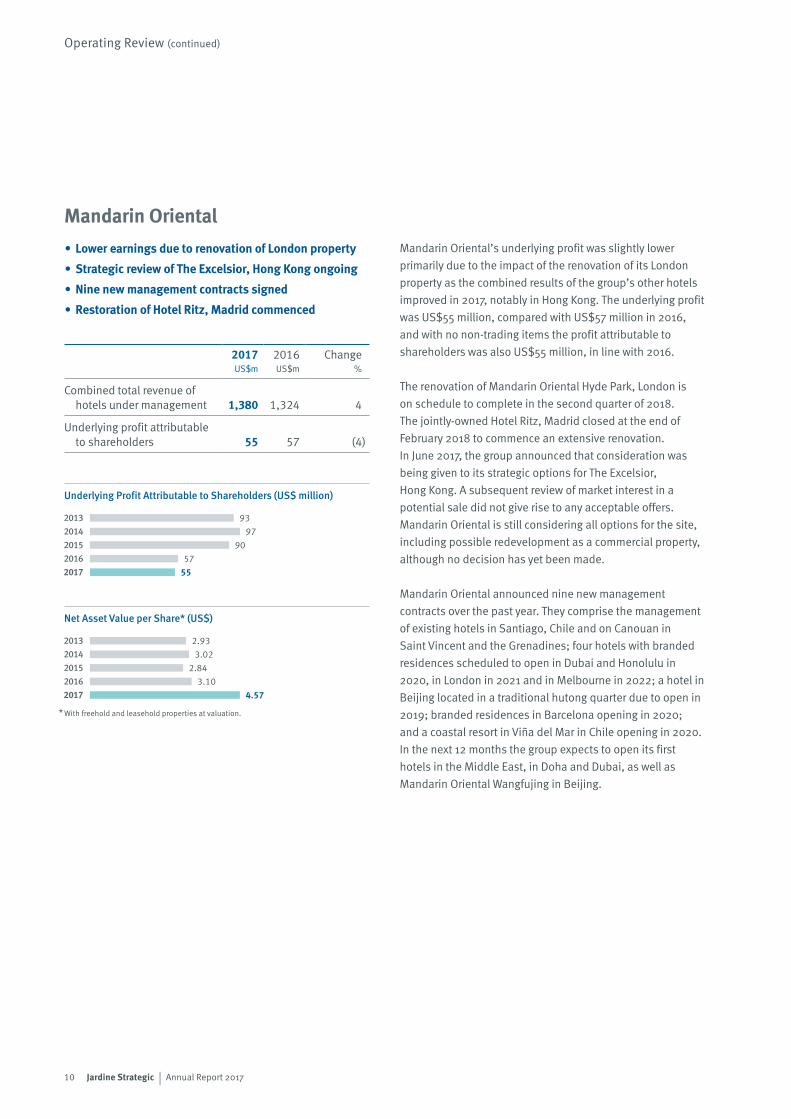
Mandarin Oriental• Lower earnings due to renovation of London property
• Strategic review of The Excelsior, Hong Kong ongoing
• Nine new management contracts signed
• Restoration of Hotel Ritz, Madrid commenced
2017US$m
2016US$m
Change%
Combined total revenue of hotels under management 1,380 1,324 4
Underlying profit attributable to shareholders 55 57 (4)
9397
9057
55
Underlying Profit Attributable to Shareholders (US$ million)MO
20132014201520162017
* With freehold and leasehold properties at valuation.
2.933.02
2.843.10
4.57
Net Asset Value per Share* (US$)MO
20132014201520162017
Underlying Profit Attributable to Shareholders (US$ million)
Net Asset Value per Share* (US$)
10 Jardine Strategic | Annual Report 2017
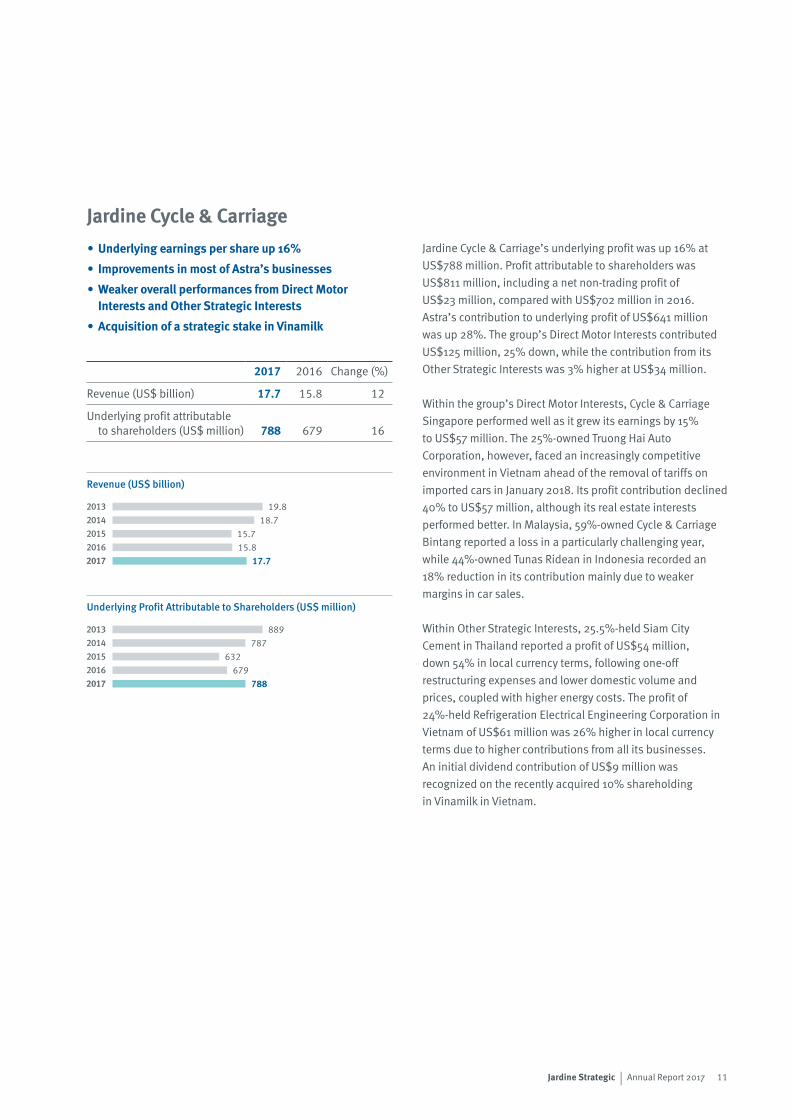
Jardine Cycle & Carriage’s underlying profit was up 16% at US$788 million. Profit attributable to shareholders was US$811 million, including a net non-trading profit of US$23 million, compared with US$702 million in 2016. Astra’s contribution to underlying profit of US$641 million was up 28%. The group’s Direct Motor Interests contributed US$125 million, 25% down, while the contribution from its Other Strategic Interests was 3% higher at US$34 million.
Within the group’s Direct Motor Interests, Cycle & Carriage Singapore performed well as it grew its earnings by 15% to US$57 million. The 25%-owned Truong Hai Auto Corporation, however, faced an increasingly competitive environment in Vietnam ahead of the removal of tariffs on imported cars in January 2018. Its profit contribution declined 40% to US$57 million, although its real estate interests performed better. In Malaysia, 59%-owned Cycle & Carriage Bintang reported a loss in a particularly challenging year, while 44%-owned Tunas Ridean in Indonesia recorded an 18% reduction in its contribution mainly due to weaker margins in car sales.
Within Other Strategic Interests, 25.5%-held Siam City Cement in Thailand reported a profit of US$54 million, down 54% in local currency terms, following one-off restructuring expenses and lower domestic volume and prices, coupled with higher energy costs. The profit of 24%-held Refrigeration Electrical Engineering Corporation in Vietnam of US$61 million was 26% higher in local currency terms due to higher contributions from all its businesses. An initial dividend contribution of US$9 million was recognized on the recently acquired 10% shareholding in Vinamilk in Vietnam.
Jardine Cycle & Carriage• Underlying earnings per share up 16%
• Improvements in most of Astra’s businesses
• Weaker overall performances from Direct Motor Interests and Other Strategic Interests
• Acquisition of a strategic stake in Vinamilk
2017 2016 Change (%)
Revenue (US$ billion) 17.7 15.8 12
Underlying profit attributable to shareholders (US$ million) 788 679 16
19.818.7
15.715.8
17.7
Revenue (US$ billion)Jardine C&C
20132014201520162017
889787
632679
788
Underlying Profit Attributable to Shareholders (US$ million)Jardine C&C
20132014201520162017
Revenue (US$ billion)
Underlying Profit Attributable to Shareholders (US$ million)
11Jardine Strategic | Annual Report 2017
Operating Review (continued)
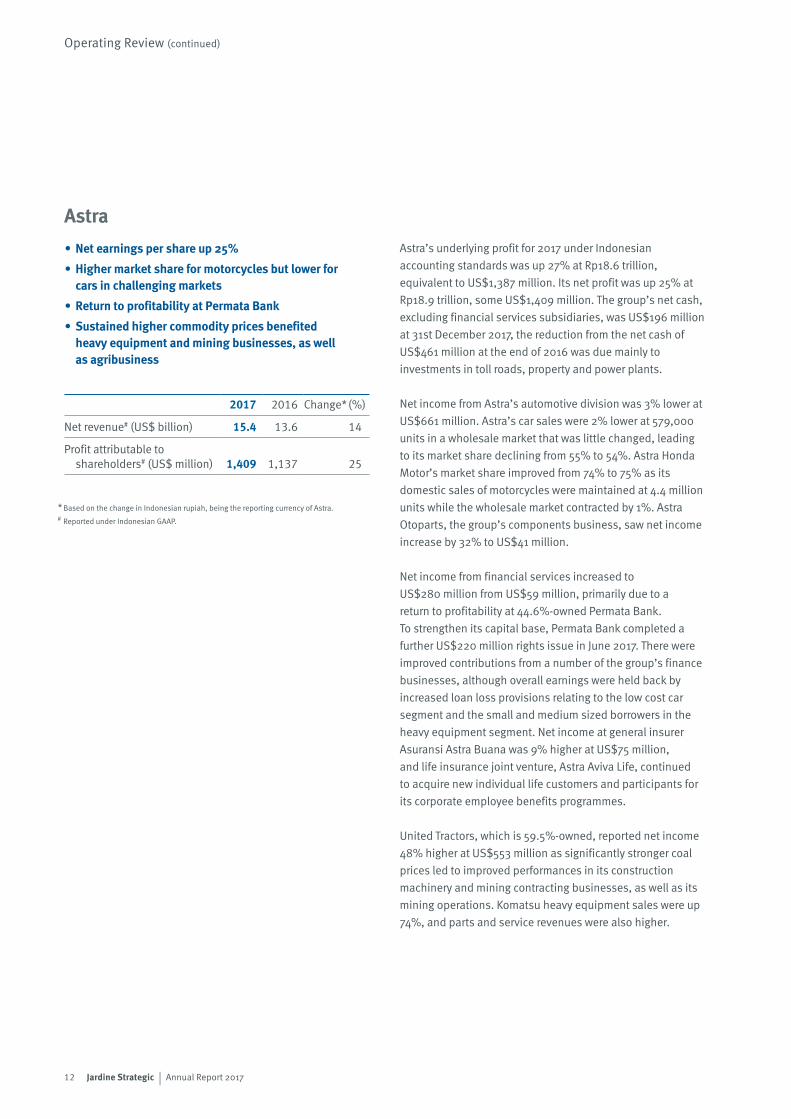
Astra’s underlying profit for 2017 under Indonesian accounting standards was up 27% at Rp18.6 trillion, equivalent to US$1,387 million. Its net profit was up 25% at Rp18.9 trillion, some US$1,409 million. The group’s net cash, excluding financial services subsidiaries, was US$196 million at 31st December 2017, the reduction from the net cash of US$461 million at the end of 2016 was due mainly to investments in toll roads, property and power plants.
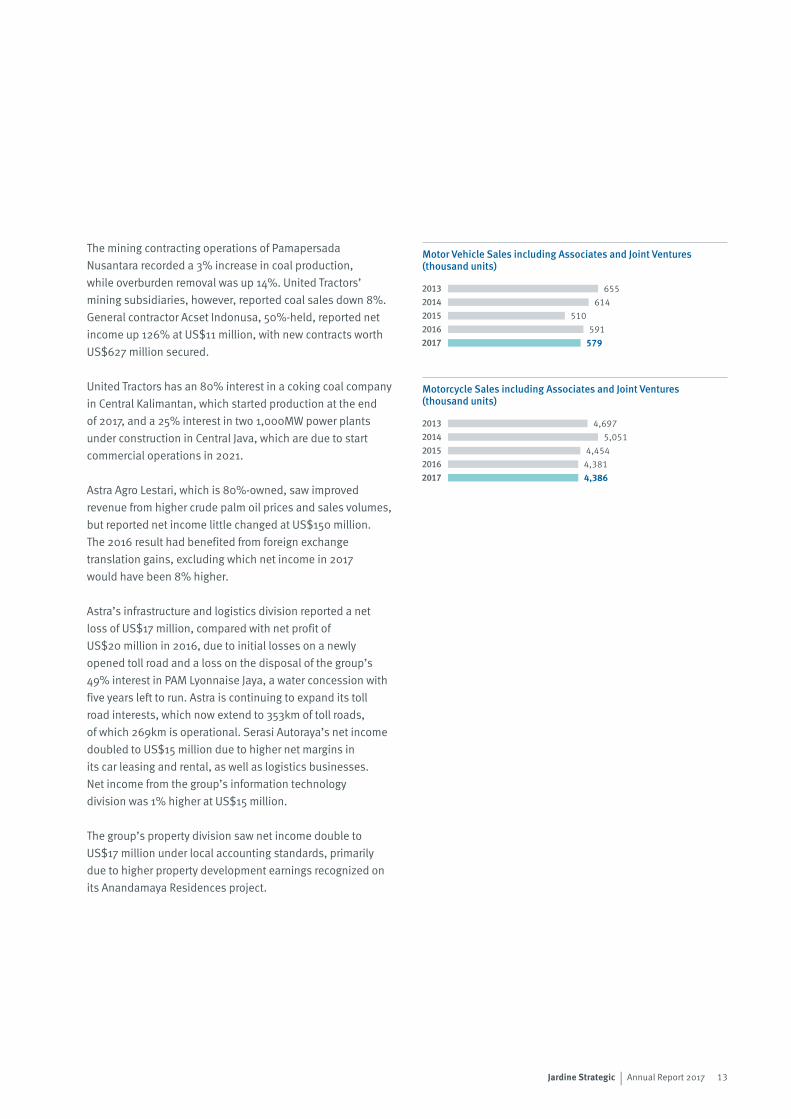
Net income from Astra’s automotive division was 3% lower at US$661 million. Astra’s car sales were 2% lower at 579,000 units in a wholesale market that was little changed, leading to its market share declining from 55% to 54%. Astra Honda Motor’s market share improved from 74% to 75% as its domestic sales of motorcycles were maintained at 4.4 million units while the wholesale market contracted by 1%. Astra Otoparts, the group’s components business, saw net income increase by 32% to US$41 million.
Net income from financial services increased to US$280 million from US$59 million, primarily due to a return to profitability at 44.6%-owned Permata Bank. To strengthen its capital base, Permata Bank completed a further US$220 million rights issue in June 2017. There were improved contributions from a number of the group’s finance businesses, although overall earnings were held back by increased loan loss provisions relating to the low cost car segment and the small and medium sized borrowers in the heavy equipment segment. Net income at general insurer Asuransi Astra Buana was 9% higher at US$75 million, and life insurance joint venture, Astra Aviva Life, continued to acquire new individual life customers and participants for its corporate employee benefits programmes.
United Tractors, which is 59.5%-owned, reported net income 48% higher at US$553 million as significantly stronger coal prices led to improved performances in its construction machinery and mining contracting businesses, as well as its mining operations. Komatsu heavy equipment sales were up 74%, and parts and service revenues were also higher.
Astra• Net earnings per share up 25%
• Higher market share for motorcycles but lower for cars in challenging markets
• Return to profitability at Permata Bank
• Sustained higher commodity prices benefited heavy equipment and mining businesses, as well as agribusiness
2017 2016 Change* (%)
Net revenue# (US$ billion) 15.4 13.6 14
Profit attributable to shareholders# (US$ million) 1,409 1,137 25
* Based on the change in Indonesian rupiah, being the reporting currency of Astra.# Reported under Indonesian GAAP.
12 Jardine Strategic | Annual Report 2017
The mining contracting operations of Pamapersada Nusantara recorded a 3% increase in coal production, while overburden removal was up 14%. United Tractors’ mining subsidiaries, however, reported coal sales down 8%. General contractor Acset Indonusa, 50%-held, reported net income up 126% at US$11 million, with new contracts worth US$627 million secured.
United Tractors has an 80% interest in a coking coal company in Central Kalimantan, which started production at the end of 2017, and a 25% interest in two 1,000MW power plants under construction in Central Java, which are due to start commercial operations in 2021.
Astra Agro Lestari, which is 80%-owned, saw improved revenue from higher crude palm oil prices and sales volumes, but reported net income little changed at US$150 million. The 2016 result had benefited from foreign exchange translation gains, excluding which net income in 2017 would have been 8% higher.
Astra’s infrastructure and logistics division reported a net loss of US$17 million, compared with net profit of US$20 million in 2016, due to initial losses on a newly opened toll road and a loss on the disposal of the group’s 49% interest in PAM Lyonnaise Jaya, a water concession with five years left to run. Astra is continuing to expand its toll road interests, which now extend to 353km of toll roads, of which 269km is operational. Serasi Autoraya’s net income doubled to US$15 million due to higher net margins in its car leasing and rental, as well as logistics businesses. Net income from the group’s information technology division was 1% higher at US$15 million.
The group’s property division saw net income double to US$17 million under local accounting standards, primarily due to higher property development earnings recognized on its Anandamaya Residences project.
655614
510591
579
Motor Vehicle Sales including Associatesand Joint Ventures (thousand unitsAstra
20132014201520162017
4,6975,051
4,4544,3814,386
Motorcycle Sales including Associatesand Joint Ventures (thousand units)Astra
20132014201520162017
Motor Vehicle Sales including Associates and Joint Ventures (thousand units)
Motorcycle Sales including Associates and Joint Ventures (thousand units)
13Jardine Strategic | Annual Report 2017
Financial Review
Accounting PoliciesThe Directors continue to review the appropriateness of the accounting policies adopted by the Group having regard to developments in International Financial Reporting Standards. There have been no changes to the accounting policies in 2017.
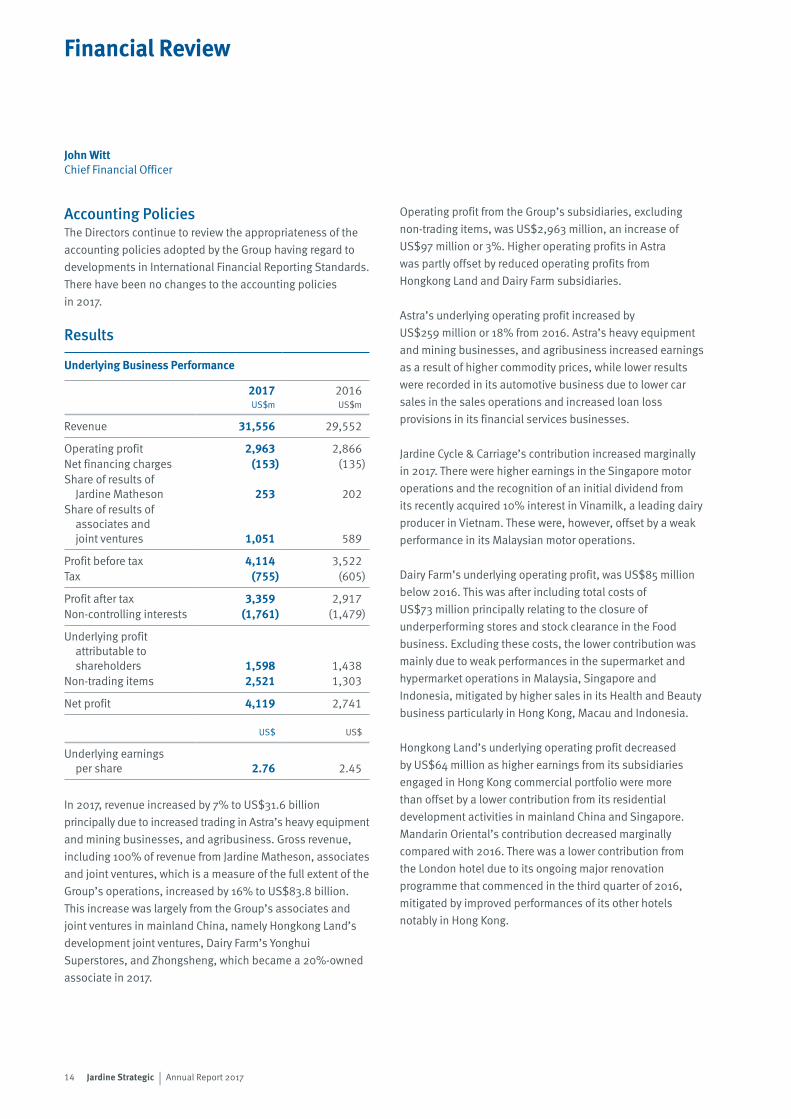
Results
Underlying Business Performance
2017US$m
2016US$m
Revenue 31,556 29,552
Operating profit 2,963 2,866Net financing charges (153) (135)Share of results of
Jardine Matheson 253 202Share of results of
associates and joint ventures 1,051 589
Profit before tax 4,114 3,522Tax (755) (605)
Profit after tax 3,359 2,917Non-controlling interests (1,761) (1,479)
Underlying profit attributable to shareholders 1,598 1,438
Non-trading items 2,521 1,303
Net profit 4,119 2,741
US$ US$
Underlying earnings per share 2.76 2.45
In 2017, revenue increased by 7% to US$31.6 billion principally due to increased trading in Astra’s heavy equipment and mining businesses, and agribusiness. Gross revenue, including 100% of revenue from Jardine Matheson, associates and joint ventures, which is a measure of the full extent of the Group’s operations, increased by 16% to US$83.8 billion. This increase was largely from the Group’s associates and joint ventures in mainland China, namely Hongkong Land’s development joint ventures, Dairy Farm’s Yonghui Superstores, and Zhongsheng, which became a 20%-owned associate in 2017.
Operating profit from the Group’s subsidiaries, excluding non-trading items, was US$2,963 million, an increase of US$97 million or 3%. Higher operating profits in Astra was partly offset by reduced operating profits from Hongkong Land and Dairy Farm subsidiaries.
Astra’s underlying operating profit increased by US$259 million or 18% from 2016. Astra’s heavy equipment and mining businesses, and agribusiness increased earnings as a result of higher commodity prices, while lower results were recorded in its automotive business due to lower car sales in the sales operations and increased loan loss provisions in its financial services businesses.
Jardine Cycle & Carriage’s contribution increased marginally in 2017. There were higher earnings in the Singapore motor operations and the recognition of an initial dividend from its recently acquired 10% interest in Vinamilk, a leading dairy producer in Vietnam. These were, however, offset by a weak performance in its Malaysian motor operations.
Dairy Farm’s underlying operating profit, was US$85 million below 2016. This was after including total costs of US$73 million principally relating to the closure of underperforming stores and stock clearance in the Food business. Excluding these costs, the lower contribution was mainly due to weak performances in the supermarket and hypermarket operations in Malaysia, Singapore and Indonesia, mitigated by higher sales in its Health and Beauty business particularly in Hong Kong, Macau and Indonesia.
Hongkong Land’s underlying operating profit decreased by US$64 million as higher earnings from its subsidiaries engaged in Hong Kong commercial portfolio were more than offset by a lower contribution from its residential development activities in mainland China and Singapore. Mandarin Oriental’s contribution decreased marginally compared with 2016. There was a lower contribution from the London hotel due to its ongoing major renovation programme that commenced in the third quarter of 2016, mitigated by improved performances of its other hotels notably in Hong Kong.
John WittChief Financial Officer
14 Jardine Strategic | Annual Report 2017
Net financing charges increased by US$18 million compared to 2016 primarily due to the higher average levels of net debt in Hongkong Land and Jardine Cycle & Carriage. Interest cover exclusive of financial services companies remained strong at 23 times, calculated as the sum of underlying operating profit and share of results of associates and joint ventures divided by net financing charges.
The underlying profit contribution from Jardine Matheson increased by 25% to US$253 million. This result included an increase of US$21 million in Jardine Motors as Zung Fu in mainland China achieved higher sales at higher margins and benefited from a strong performance in its after-sales operations. This was partly offset by lower earnings in the United Kingdom. In 2016, its contribution also benefited from a gain on the sale of a dealership. The trading performance of Zung Fu in Hong Kong improved in 2017, although this was offset by costs associated with the repositioning of its sales and services facilities. Jardine Pacific’s overall results increased by US$13 million as Gammon’s contribution recovered following a weaker performance in 2016 due to provisions for a major project, and higher contribution from Hactl. Jardine Lloyd Thompson’s contribution was US$7 million higher mainly due to higher revenues and the absence of the 2016 restructuring costs in its Employee Benefits business in the United Kingdom.
The Group’s share of underlying results of associates and joint ventures increased by US$462 million or 78% to US$1,051 million. Contributions from Astra’s associates and joint ventures increased by US$268 million principally due to a return to profitability at Permata Bank following significant loan-loss provisions made in 2016, and a higher contribution from its automotive associates and joint ventures. The contribution from Hongkong Land’s associates and joint ventures increased by US$182 million, primarily from its joint venture development projects in mainland China. In Dairy Farm, the contributions from its associates increased by US$28 million with strong performance in both Yonghui Superstores and Maxim’s. In addition, the Group benefited during 2017 from the initial contributions from its new associates, Greatview and Zhongsheng.
In Jardine Cycle & Carriage, contributions from associates and joint ventures were US$53 million lower, compared with the prior year, mainly due to reduced earnings in the motor vehicle operation of THACO in Vietnam, and lower domestic demand and prices for cement together with one-off restructuring expenses in Siam City Cement in Thailand.
The underlying effective tax rate for the year was 26%, which was broadly in line with that of 2016.
The Group’s underlying profit attributable to shareholders in 2017 was US$1,598 million or US$2.76 on an earnings per share basis, 11% and 13% higher than in the prior year, respectively.
Non-trading ItemsIn 2017, the Group had net non-trading gains of US$2,521 million, which included a net increase of US$2,326 million in the fair value of investment properties primarily in Hongkong Land, gains on property disposals of US$110 million, and gains on disposal of other investments of US$66 million.
In 2016, the Group’s non-trading gains of US$1,303 million included a net increase of US$1,260 million in the fair value of investment properties primarily in Hongkong Land and gains on property disposals of US$97 million, partly offset by impairment charges of US$57 million against goodwill on certain businesses within Jardine Pacific.
DividendsThe Board is recommending a final dividend of US$0.225 per share for 2017, providing a total annual dividend of US$0.32 per share, an increase of 7% over 2016. The final dividend will be payable on 16th May 2018, subject to approval at the Annual General Meeting to be held on 10th May 2018, to those persons registered as shareholders on 23rd March 2018. The dividends are payable in cash with a scrip alternative.
15Jardine Strategic | Annual Report 2017
Financial Review (continued)
Cash Flow
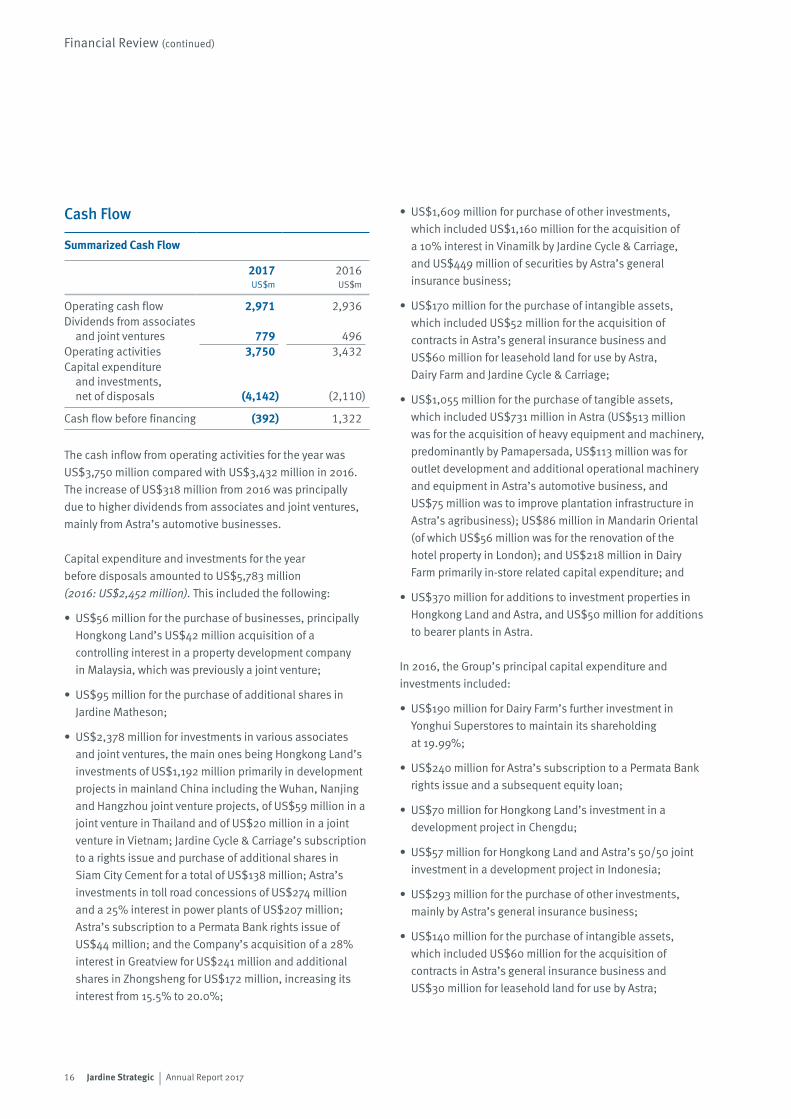
Summarized Cash Flow
2017US$m
2016US$m
Operating cash flow 2,971 2,936Dividends from associates
and joint ventures 779 496Operating activities 3,750 3,432Capital expenditure
and investments, net of disposals (4,142) (2,110)
Cash flow before financing (392) 1,322
The cash inflow from operating activities for the year was US$3,750 million compared with US$3,432 million in 2016. The increase of US$318 million from 2016 was principally due to higher dividends from associates and joint ventures, mainly from Astra’s automotive businesses.
Capital expenditure and investments for the year before disposals amounted to US$5,783 million (2016: US$2,452 million). This included the following:
• US$56 million for the purchase of businesses, principally Hongkong Land’s US$42 million acquisition of a controlling interest in a property development company in Malaysia, which was previously a joint venture;
• US$95 million for the purchase of additional shares in Jardine Matheson;
• US$2,378 million for investments in various associates and joint ventures, the main ones being Hongkong Land’s investments of US$1,192 million primarily in development projects in mainland China including the Wuhan, Nanjing and Hangzhou joint venture projects, of US$59 million in a joint venture in Thailand and of US$20 million in a joint venture in Vietnam; Jardine Cycle & Carriage’s subscription to a rights issue and purchase of additional shares in Siam City Cement for a total of US$138 million; Astra’s investments in toll road concessions of US$274 million and a 25% interest in power plants of US$207 million; Astra’s subscription to a Permata Bank rights issue of US$44 million; and the Company’s acquisition of a 28% interest in Greatview for US$241 million and additional shares in Zhongsheng for US$172 million, increasing its interest from 15.5% to 20.0%;
• US$1,609 million for purchase of other investments, which included US$1,160 million for the acquisition of a 10% interest in Vinamilk by Jardine Cycle & Carriage, and US$449 million of securities by Astra’s general insurance business;
• US$170 million for the purchase of intangible assets, which included US$52 million for the acquisition of contracts in Astra’s general insurance business and US$60 million for leasehold land for use by Astra, Dairy Farm and Jardine Cycle & Carriage;
• US$1,055 million for the purchase of tangible assets, which included US$731 million in Astra (US$513 million was for the acquisition of heavy equipment and machinery, predominantly by Pamapersada, US$113 million was for outlet development and additional operational machinery and equipment in Astra’s automotive business, and US$75 million was to improve plantation infrastructure in Astra’s agribusiness); US$86 million in Mandarin Oriental (of which US$56 million was for the renovation of the hotel property in London); and US$218 million in Dairy Farm primarily in-store related capital expenditure; and
• US$370 million for additions to investment properties in Hongkong Land and Astra, and US$50 million for additions to bearer plants in Astra.
In 2016, the Group’s principal capital expenditure and investments included:
• US$190 million for Dairy Farm’s further investment in Yonghui Superstores to maintain its shareholding at 19.99%;
• US$240 million for Astra’s subscription to a Permata Bank rights issue and a subsequent equity loan;
• US$70 million for Hongkong Land’s investment in a development project in Chengdu;
• US$57 million for Hongkong Land and Astra’s 50/50 joint investment in a development project in Indonesia;
• US$293 million for the purchase of other investments, mainly by Astra’s general insurance business;
• US$140 million for the purchase of intangible assets, which included US$60 million for the acquisition of contracts in Astra’s general insurance business and US$30 million for leasehold land for use by Astra;
16 Jardine Strategic | Annual Report 2017

• US$906 million for the purchase of tangible assets by Group companies; and
• US$312 million for additions to investment properties in Hongkong Land and Astra.
The contribution to the Group’s cash flow from disposals for the year amounted to US$1,641 million (2016: US$342 million), which principally included US$658 million relating to advances and repayments from associates and joint ventures in Hongkong Land, US$398 million from the redemption of convertible bonds by Zhongsheng, US$369 million from the sale of other investments by Astra’s general insurance business and the Company, and US$86 million from the sale of non-core businesses by Astra.
The Group also purchased additional shares in Group companies for a total cost of US$64 million (2016: US$127 million), which, according to accounting standards, is presented under financing activities in the Consolidated Cash Flow Statement.
The Group’s management also looks at total capital investment across the Group. The Group’s capital investment, including expenditure on properties for sale, was US$6.8 billion in 2017 (2016: US$3.2 billion), in addition to which capital investment at Jardine Matheson and the Group’s associates and joint ventures exceeded US$4.9 billion (2016: US$2.5 billion).
Treasury PolicyThe Group manages its exposure to financial risk using a variety of techniques and instruments. The main objectives are to limit foreign exchange and interest rate risks to provide a degree of certainty about costs. The investment of the Group’s cash resources is managed so as to minimize risk while seeking to enhance yield. Appropriate credit guidelines are in place to manage counterparty risk.
When economically sensible to do so, borrowings are taken in local currency to hedge foreign exposures on investments. A portion of borrowings is denominated in fixed rates. Adequate headroom in committed facilities is maintained to facilitate the Group’s capacity to pursue new investment opportunities and to provide some protection against market
uncertainties. Overall, the Group’s funding arrangements are designed to keep an appropriate balance between equity and debt from banks and capital markets, both short and long term in tenor, to give flexibility to develop the business.The Group’s Treasury operations are managed as cost centres and are not permitted to undertake speculative transactions unrelated to underlying financial exposures.
Note 2 of the financial statements summarizes the Group’s financial risk factors.
FundingThe Group is well financed with strong liquidity. Net gearing, excluding net borrowings relating to Astra’s financial services companies, was 6% at 31st December 2017, up from 4% at the end of 2016. Net borrowings, on the same basis, were US$3.8 billion at 31st December 2017 compared with US$2.0 billion at the end of 2016. Astra’s financial services companies had net borrowings of US$3.4 billion at the end of the year compared with US$3.6 billion at the end of 2016.
At the year end, undrawn committed facilities totalled US$6.4 billion. In addition, the Group had available liquid funds of US$5.3 billion. The Group’s total equity increased by US$8.0 billion to US$58.2 billion during the year.
Net Debt* and Total Equity (US$ billion)
2013
2014
2015
2016
2017
Net DebtTotal Equity
* Excluding net debt of Astra’s financial services companies.
42.6
44.7
45.9
50.2
58.2
2.3
2.2
2.4
2.0
3.8
Net Debt* and Total Equity (US$ billion)JS Financial Review
17Jardine Strategic | Annual Report 2017
Financial Review (continued)
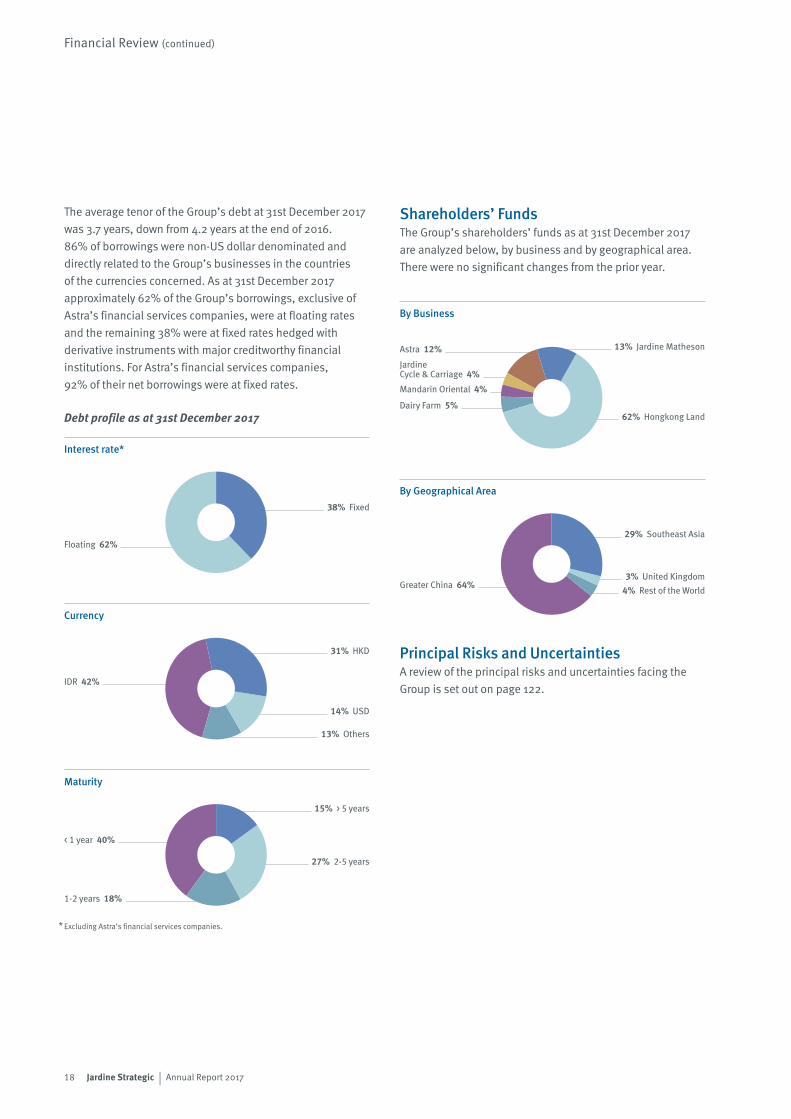
The average tenor of the Group’s debt at 31st December 2017 was 3.7 years, down from 4.2 years at the end of 2016. 86% of borrowings were non-US dollar denominated and directly related to the Group’s businesses in the countries of the currencies concerned. As at 31st December 2017 approximately 62% of the Group’s borrowings, exclusive of Astra’s financial services companies, were at floating rates and the remaining 38% were at fixed rates hedged with derivative instruments with major creditworthy financial institutions. For Astra’s financial services companies, 92% of their net borrowings were at fixed rates.
Debt profile as at 31st December 2017
Shareholders’ FundsThe Group’s shareholders’ funds as at 31st December 2017 are analyzed below, by business and by geographical area. There were no significant changes from the prior year.
Principal Risks and UncertaintiesA review of the principal risks and uncertainties facing the Group is set out on page 122.
Floating 62%
38% Fixed
IDR 42%
13% Others
14% USD
31% HKD
< 1 year 40%
1-2 years 18%
27% 2-5 years
15% > 5 years
Astra 12%
Jardine Cycle & Carriage 4%Mandarin Oriental 4%
Dairy Farm 5%62% Hongkong Land
13% Jardine Matheson
Greater China 64%
29% Southeast Asia
4% Rest of the World3% United Kingdom
Interest rate*
By Geographical Area
By Business
Currency
Maturity
* Excluding Astra’s financial services companies.
18 Jardine Strategic | Annual Report 2017
Directors’ Profiles
Sir Henry Keswick*ChairmanSir Henry joined the Board in 1988 and became Chairman in 1989. He is chairman of Jardine Matheson, having first joined the group in 1961, and is a director of Dairy Farm, Hongkong Land and Mandarin Oriental. He is also vice chairman of the Hong Kong Association.
Ben Keswick*Managing DirectorMr Ben Keswick was appointed as Managing Director in 2012. He has held a number of executive positions since joining the Jardine Matheson group in 1998, including finance director and then chief executive officer of Jardine Pacific between 2003 and 2007 and, thereafter, group managing director of Jardine Cycle & Carriage until 2012. He has an MBA from INSEAD. Mr Keswick is chairman of Jardine Matheson Limited and Jardine Cycle & Carriage and a commissioner of Astra. He is also chairman and managing director of Dairy Farm, Hongkong Land and Mandarin Oriental, managing director of Jardine Matheson and a director of Jardine Pacific and Jardine Motors.
Charles Allen-JonesMr Allen-Jones joined the Board in 2008. He was formerly senior partner of Linklaters, where he had been a partner for 33 years until 2001. Mr Allen-Jones is also a director of Hongkong Land.
David Hsu*Mr Hsu joined the Board in 2014 having first joined the Jardine Matheson group in 2011. He is chairman of Jardine Matheson (China) with responsibility for supporting the group’s business developments in mainland China, Taiwan and Macau. He was previously chief executive of J.P. Morgan Asset Management in the Asia Pacific Region. Mr Hsu is also a director of Jardine Matheson Limited, Jardine Matheson and Greatview.
Julian HuiMr Hui joined the Board in 2015. He is an executive director of Owens Company, and a director of Central Development and Mandarin Oriental.
Adam Keswick* Mr Adam Keswick was appointed a Director in 2012. He first joined the Jardine Matheson group in 2001 and was deputy managing director of Jardine Matheson from 2012 to 2016. Mr Keswick is deputy chairman of Jardine Lloyd Thompson and a director of Dairy Farm, Hongkong Land, Jardine Matheson and Mandarin Oriental. He is also a director of Ferrari, and a supervisory board member of Rothschild & Co.
Simon Keswick*Mr Simon Keswick joined the Board in 1986. He joined the Jardine Matheson group in 1962 and is a director of Dairy Farm, Hongkong Land, Jardine Matheson and Mandarin Oriental.
Dr George C.G. KooDr Koo, a Fellow of the Royal College of Surgeons, joined the Board in 1996. He is also a director of Dairy Farm.
Anthony Nightingale Mr Nightingale was Managing Director of the Company from 2006 to 2012. He held a number of senior positions since first joining the Jardine Matheson group in 1969 until his retirement from executive office in 2012. He is also a director of Dairy Farm, Hongkong Land, Jardine Cycle & Carriage, Jardine Matheson, Mandarin Oriental, Prudential, Schindler, Shui On Land and Vitasoy and a commissioner of Astra. He is chairman of The Sailors Home and Missions to Seamen in Hong Kong.
Y.K. Pang*Mr Pang was appointed a Director in 2016. He is deputy managing director of Jardine Matheson. He has held a number of senior executive positions in the Jardine Matheson group, which he joined in 1984, including chief executive of Hongkong Land between 2007 and 2016. He is chairman of Jardine Pacific and chairman and chief executive of Jardine Motors. Mr Pang is also deputy chairman of Jardine Matheson Limited and a director of Dairy Farm, Hongkong Land, Jardine Matheson (China), Mandarin Oriental, Yonghui Superstores and Zhongsheng. He is chairman of the General Committee of the Employers’ Federation of Hong Kong and a past chairman of the Hong Kong General Chamber of Commerce.
Percy WeatherallMr Weatherall was Managing Director of the Company from 2000 to 2006. He held a number of senior positions since first joining the Jardine Matheson group in 1976 until his retirement from executive office in 2006. He is also a director of Dairy Farm, Hongkong Land, Jardine Matheson and Mandarin Oriental. He is chairman of Corney & Barrow and the Nith District Salmon Fishery Board.
Executive Director
Company Secretary Neil McNamara
Registered OfficeJardine House, 33-35 Reid StreetHamiltonBermuda
19Jardine Strategic | Annual Report 2017
20 Jardine Strategic | Annual Report 2017
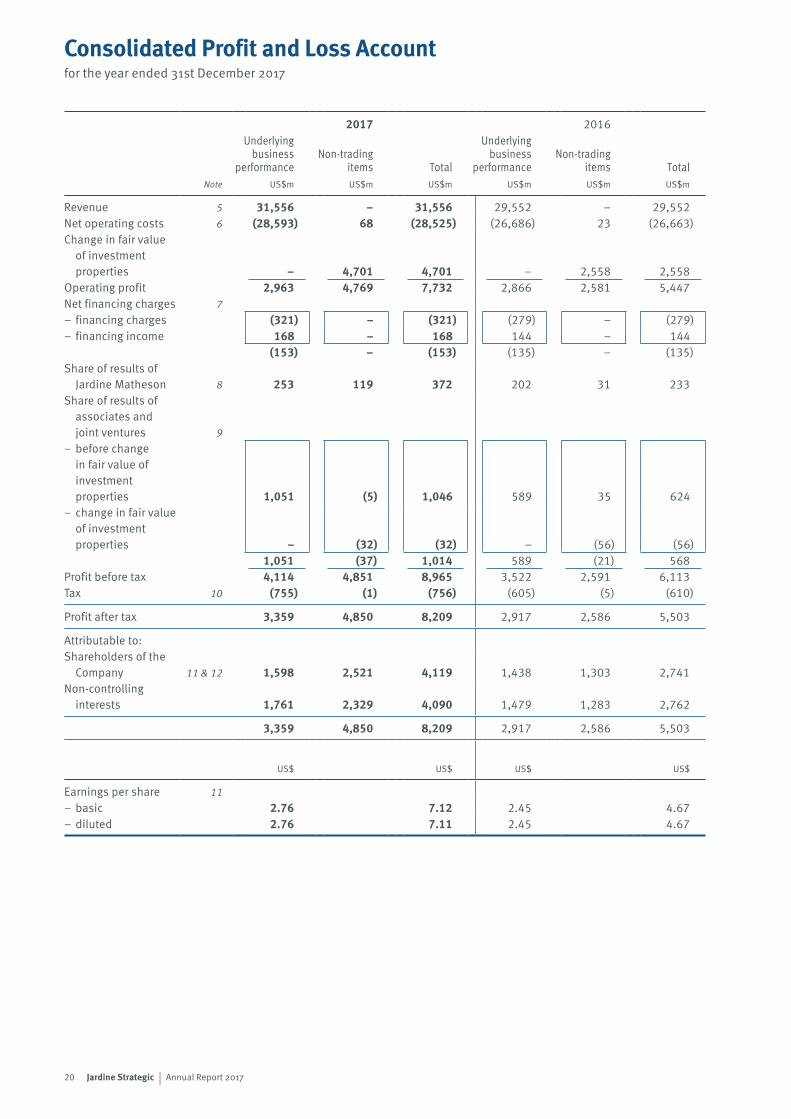
2017 2016Underlying
businessperformance
Non-tradingitems Total
Underlyingbusiness
performanceNon-trading
items Total Note US$m US$m US$m US$m US$m US$m
Revenue 5 31,556 – 31,556 29,552 – 29,552Net operating costs 6 (28,593) 68 (28,525) (26,686) 23 (26,663)Change in fair value
of investment properties – 4,701 4,701 – 2,558 2,558
Operating profit 2,963 4,769 7,732 2,866 2,581 5,447Net financing charges 7– financing charges (321) – (321) (279) – (279)– financing income 168 – 168 144 – 144
(153) – (153) (135) – (135)Share of results of
Jardine Matheson 8 253 119 372 202 31 233Share of results of
associates and joint ventures 9
– before change in fair value of investment properties 1,051 (5) 1,046 589 35 624
– change in fair value of investment properties – (32) (32) – (56) (56)
1,051 (37) 1,014 589 (21) 568Profit before tax 4,114 4,851 8,965 3,522 2,591 6,113Tax 10 (755) (1) (756) (605) (5) (610)
Profit after tax 3,359 4,850 8,209 2,917 2,586 5,503
Attributable to:Shareholders of the
Company 11 & 12 1,598 2,521 4,119 1,438 1,303 2,741Non-controlling
interests 1,761 2,329 4,090 1,479 1,283 2,762
3,359 4,850 8,209 2,917 2,586 5,503
US$ US$ US$ US$
Earnings per share 11– basic 2.76 7.12 2.45 4.67– diluted 2.76 7.11 2.45 4.67
Consolidated Profit and Loss Accountfor the year ended 31st December 2017
21Jardine Strategic | Annual Report 2017
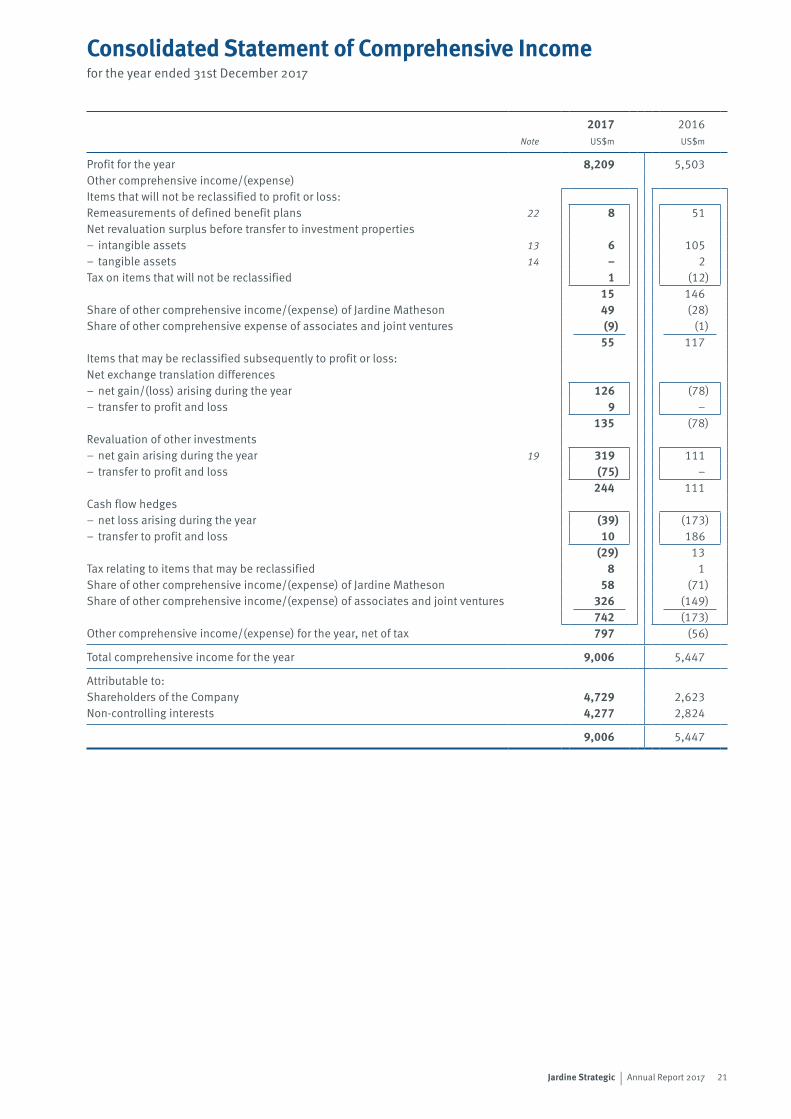
Consolidated Statement of Comprehensive Incomefor the year ended 31st December 2017
2017 2016Note US$m US$m
Profit for the year 8,209 5,503Other comprehensive income/(expense)Items that will not be reclassified to profit or loss:Remeasurements of defined benefit plans 22 8 51Net revaluation surplus before transfer to investment properties– intangible assets 13 6 105– tangible assets 14 – 2Tax on items that will not be reclassified 1 (12)
15 146Share of other comprehensive income/(expense) of Jardine Matheson 49 (28)Share of other comprehensive expense of associates and joint ventures (9) (1)
55 117Items that may be reclassified subsequently to profit or loss:Net exchange translation differences– net gain/(loss) arising during the year 126 (78)– transfer to profit and loss 9 –
135 (78)Revaluation of other investments– net gain arising during the year 19 319 111– transfer to profit and loss (75) –
244 111Cash flow hedges– net loss arising during the year (39) (173)– transfer to profit and loss 10 186
(29) 13Tax relating to items that may be reclassified 8 1Share of other comprehensive income/(expense) of Jardine Matheson 58 (71)Share of other comprehensive income/(expense) of associates and joint ventures 326 (149)
742 (173)Other comprehensive income/(expense) for the year, net of tax 797 (56)
Total comprehensive income for the year 9,006 5,447
Attributable to:Shareholders of the Company 4,729 2,623Non-controlling interests 4,277 2,824
9,006 5,447
22 Jardine Strategic | Annual Report 2017
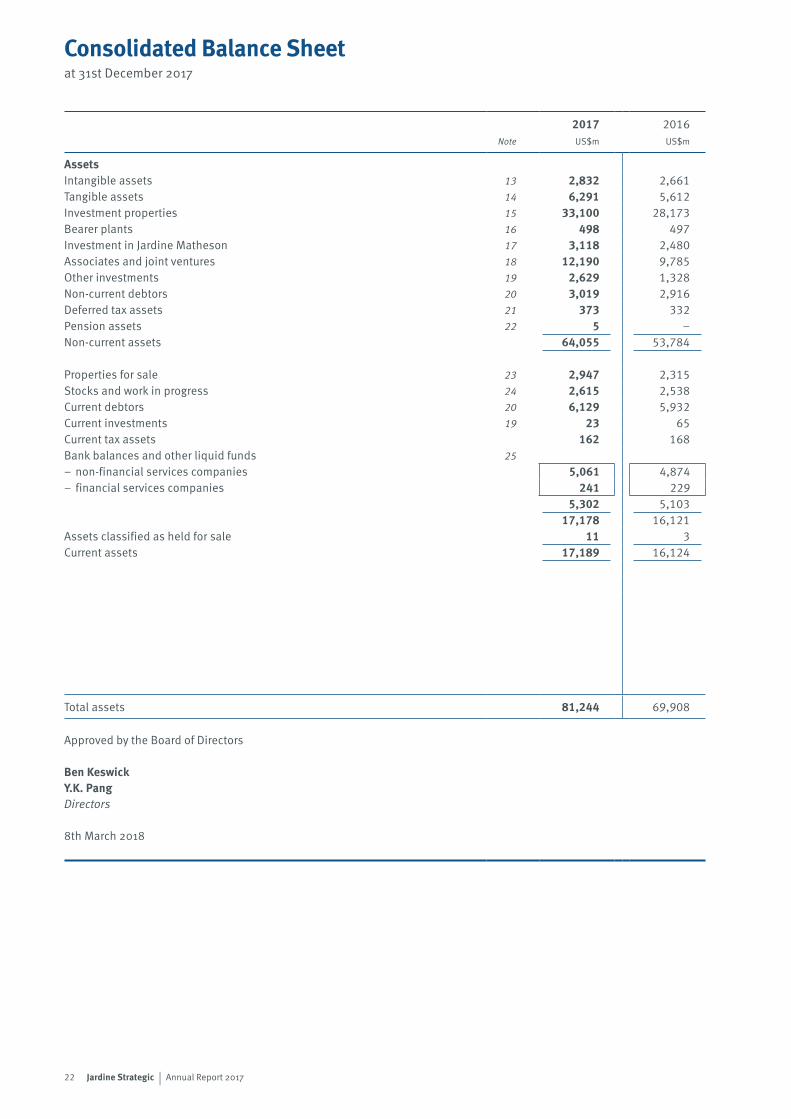
2017 2016Note US$m US$m
AssetsIntangible assets 13 2,832 2,661Tangible assets 14 6,291 5,612Investment properties 15 33,100 28,173Bearer plants 16 498 497Investment in Jardine Matheson 17 3,118 2,480Associates and joint ventures 18 12,190 9,785Other investments 19 2,629 1,328Non-current debtors 20 3,019 2,916Deferred tax assets 21 373 332Pension assets 22 5 –Non-current assets 64,055 53,784
Properties for sale 23 2,947 2,315Stocks and work in progress 24 2,615 2,538Current debtors 20 6,129 5,932Current investments 19 23 65Current tax assets 162 168Bank balances and other liquid funds 25– non-financial services companies 5,061 4,874– financial services companies 241 229
5,302 5,10317,178 16,121
Assets classified as held for sale 11 3Current assets 17,189 16,124
Total assets 81,244 69,908
Approved by the Board of Directors
Ben KeswickY.K. PangDirectors
8th March 2018
Consolidated Balance Sheetat 31st December 2017
23Jardine Strategic | Annual Report 2017
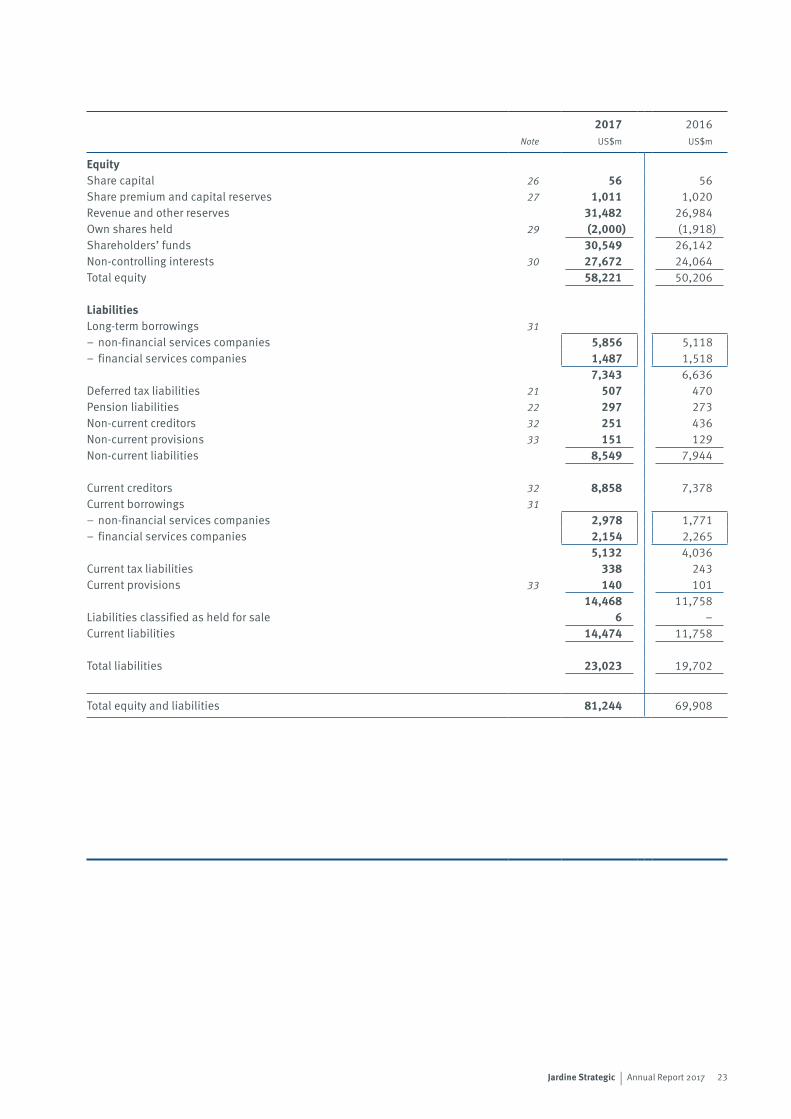
2017 2016Note US$m US$m
EquityShare capital 26 56 56Share premium and capital reserves 27 1,011 1,020Revenue and other reserves 31,482 26,984Own shares held 29 (2,000) (1,918)Shareholders’ funds 30,549 26,142Non-controlling interests 30 27,672 24,064Total equity 58,221 50,206
LiabilitiesLong-term borrowings 31– non-financial services companies 5,856 5,118– financial services companies 1,487 1,518
7,343 6,636Deferred tax liabilities 21 507 470Pension liabilities 22 297 273Non-current creditors 32 251 436Non-current provisions 33 151 129Non-current liabilities 8,549 7,944
Current creditors 32 8,858 7,378Current borrowings 31– non-financial services companies 2,978 1,771– financial services companies 2,154 2,265
5,132 4,036Current tax liabilities 338 243Current provisions 33 140 101
14,468 11,758Liabilities classified as held for sale 6 –Current liabilities 14,474 11,758
Total liabilities 23,023 19,702
Total equity and liabilities 81,244 69,908
24 25Jardine Strategic | Annual Report 2017 Jardine Strategic | Annual Report 2017
Share capital
Share premium
Capital reserves
Revenue reserves
Contributed surplus
Asset revaluation
reservesHedging reserves
Exchange reserves
Own Attributable to Attributable to shares shareholders of non-controlling held the Company interests
Total equity
US$m US$m US$m US$m US$m US$m US$m US$m US$m US$m US$m US$m
2017At 1st January 56 816 204 28,498 304 262 (16) (2,064) (1,918) 26,142 24,064 50,206Total comprehensive income – – – 4,337 – 2 9 381 – 4,729 4,277 9,006Dividends paid by the Company – – – (177) – – – – – (177) – (177)Dividends paid to non-controlling interests – – – – – – – – – – (766) (766)Unclaimed dividends forfeited – – – 1 – – – – – 1 – 1Employee share option schemes – – 12 – – – – – – 12 – 12Scrip issued in lieu of dividends – – – 7 – – – – – 7 – 7Increase in own shares held – – – – – – – – (82) (82) – (82)Subsidiaries acquired – – – – – – – – – – 107 107Subsidiaries disposed of – – – – – – – – – – (1) (1)Capital repayment to non-controlling interests – – – – – – – – – – (3) (3)Change in interests in subsidiaries – – – (48) – – – – – (48) (16) (64)Change in interests in associates and joint ventures – – – (35) – – – – – (35) 10 (25)Transfer – – (21) 21 – – – – – – – –
At 31st December 56 816 195 32,604 304 264 (7) (1,683) (2,000) 30,549 27,672 58,221
2016At 1st January 56 984 194 25,850 304 222 (10) (1,814) (1,867) 23,919 21,943 45,862Total comprehensive income – – – 2,840 – 40 (6) (251) – 2,623 2,824 5,447Dividends paid by the Company – – – (171) – – – – – (171) – (171)Dividends paid to non-controlling interests – – – – – – – – – – (726) (726)Unclaimed dividends forfeited – – – 1 – – – – – 1 – 1Employee share option schemes – – 13 – – – – – – 13 1 14Scrip issued in lieu of dividends – – – 6 – – – – – 6 – 6Repurchase of shares – (168) – – – – – – – (168) – (168)Increase in own shares held – – – – – – – – (51) (51) – (51)Capital contribution from non-controlling interests – – – – – – – – – – 83 83Change in interests in subsidiaries – – – (29) – – – 1 – (28) (61) (89)Change in interests in associates and joint ventures – – – (2) – – – – – (2) – (2)Transfer – – (3) 3 – – – – – – – –
At 31st December 56 816 204 28,498 304 262 (16) (2,064) (1,918) 26,142 24,064 50,206
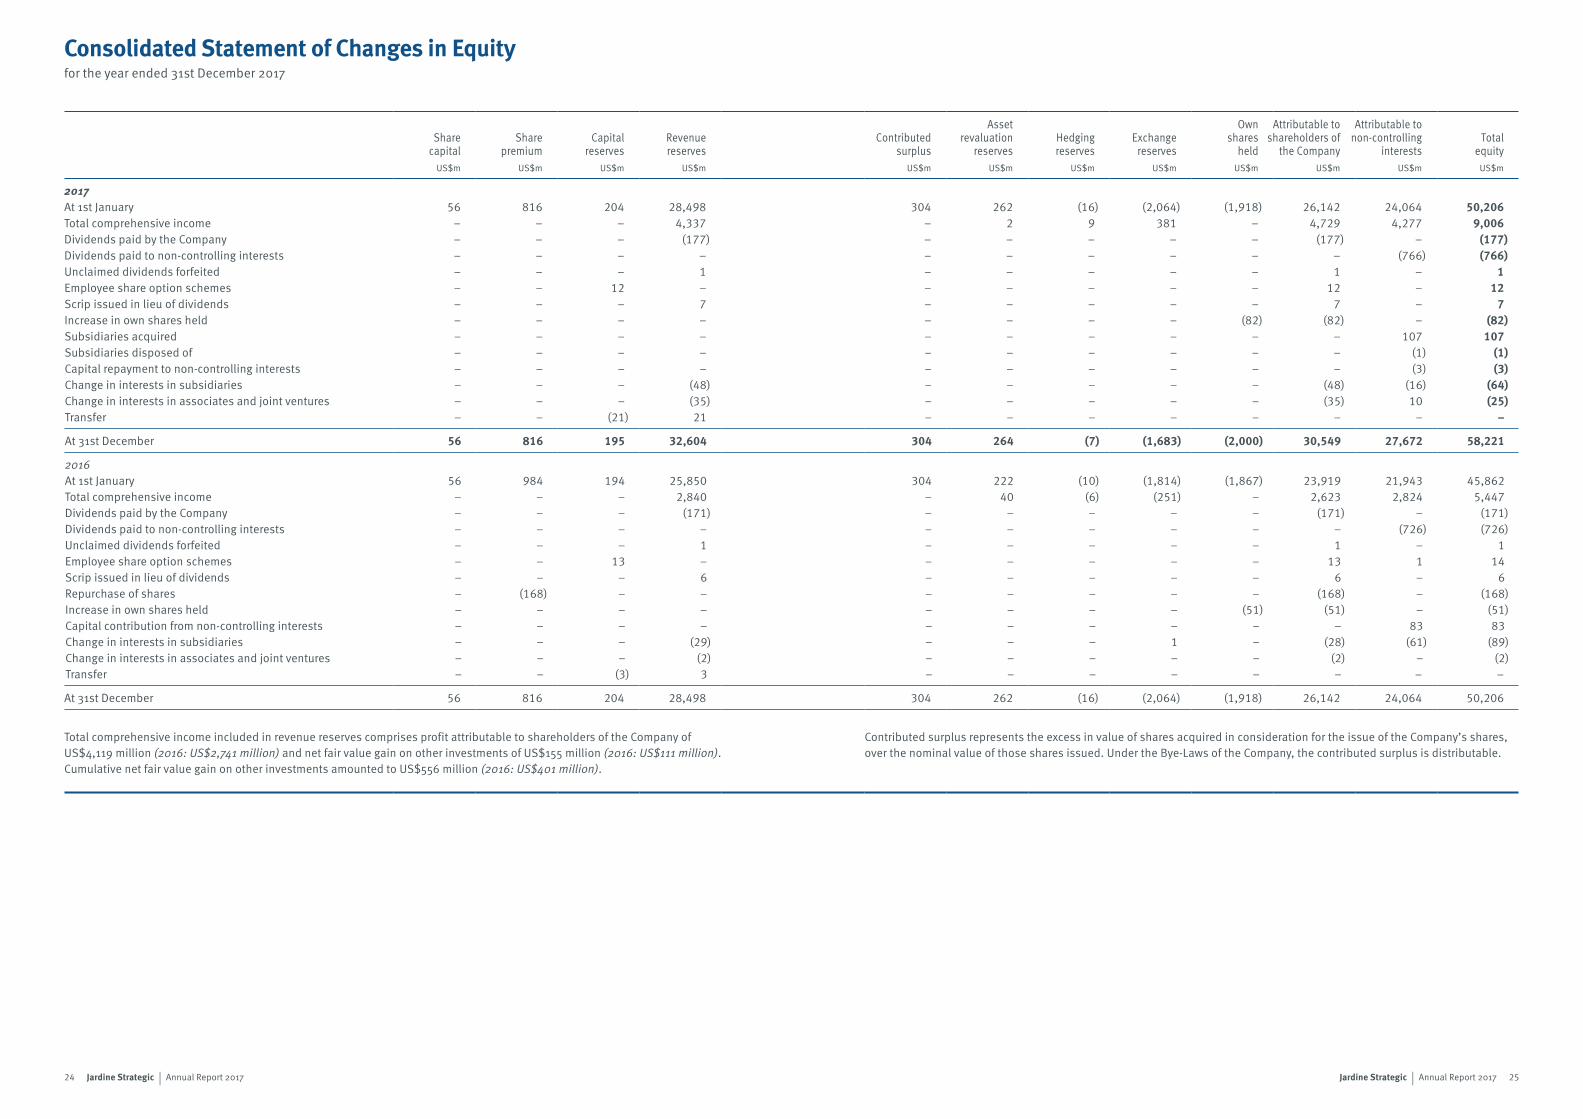
Total comprehensive income included in revenue reserves comprises profit attributable to shareholders of the Company of US$4,119 million (2016: US$2,741 million) and net fair value gain on other investments of US$155 million (2016: US$111 million). Cumulative net fair value gain on other investments amounted to US$556 million (2016: US$401 million).
Contributed surplus represents the excess in value of shares acquired in consideration for the issue of the Company’s shares, over the nominal value of those shares issued. Under the Bye-Laws of the Company, the contributed surplus is distributable.
Consolidated Statement of Changes in Equityfor the year ended 31st December 2017
26 Jardine Strategic | Annual Report 2017
2017 2016Note US$m US$m
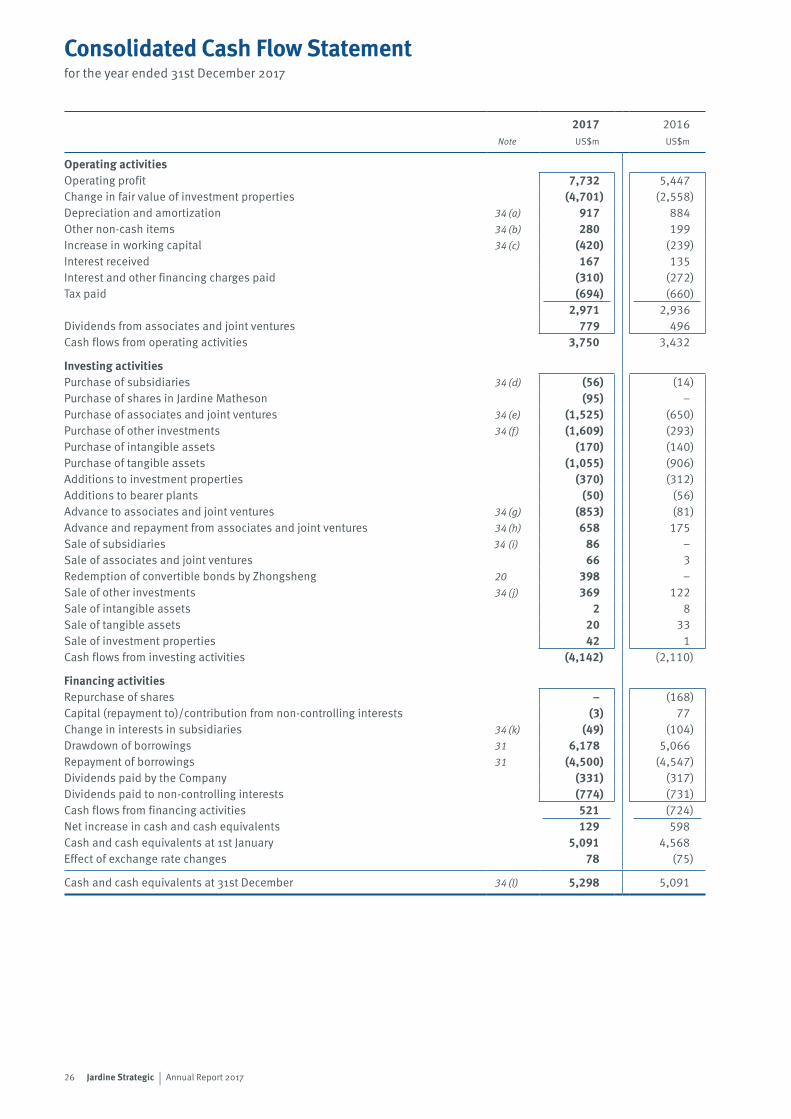
Operating activities Operating profit 7,732 5,447Change in fair value of investment properties (4,701) (2,558)Depreciation and amortization 34 (a) 917 884Other non-cash items 34 (b) 280 199Increase in working capital 34 (c) (420) (239)Interest received 167 135Interest and other financing charges paid (310) (272)Tax paid (694) (660)
2,971 2,936Dividends from associates and joint ventures 779 496Cash flows from operating activities 3,750 3,432
Investing activitiesPurchase of subsidiaries 34 (d) (56) (14)Purchase of shares in Jardine Matheson (95) –Purchase of associates and joint ventures 34 (e) (1,525) (650)Purchase of other investments 34 (f) (1,609) (293)Purchase of intangible assets (170) (140)Purchase of tangible assets (1,055) (906)Additions to investment properties (370) (312)Additions to bearer plants (50) (56)Advance to associates and joint ventures 34 (g) (853) (81)Advance and repayment from associates and joint ventures 34 (h) 658 175Sale of subsidiaries 34 (i) 86 –Sale of associates and joint ventures 66 3Redemption of convertible bonds by Zhongsheng 20 398 –Sale of other investments 34 (j) 369 122Sale of intangible assets 2 8Sale of tangible assets 20 33Sale of investment properties 42 1Cash flows from investing activities (4,142) (2,110)
Financing activitiesRepurchase of shares – (168)Capital (repayment to)/contribution from non-controlling interests (3) 77Change in interests in subsidiaries 34 (k) (49) (104)Drawdown of borrowings 31 6,178 5,066Repayment of borrowings 31 (4,500) (4,547)Dividends paid by the Company (331) (317)Dividends paid to non-controlling interests (774) (731)Cash flows from financing activities 521 (724)Net increase in cash and cash equivalents 129 598Cash and cash equivalents at 1st January 5,091 4,568Effect of exchange rate changes 78 (75)
Cash and cash equivalents at 31st December 34 (l) 5,298 5,091
Consolidated Cash Flow Statementfor the year ended 31st December 2017
27Jardine Strategic | Annual Report 2017
Notes to the Financial Statements
1 Principal Accounting PoliciesBasis of preparationThe financial statements have been prepared in accordance with International Financial Reporting Standards (‘IFRS’), including International Accounting Standards (‘IAS’) and Interpretations adopted by the International Accounting Standards Board (‘IASB’). The financial statements have been prepared on a going concern basis and under the historical cost convention except as disclosed in the accounting policies below.
There are no new standards or amendments, which are effective in 2017 and relevant to the Group’s operations, that have a material impact on the Group’s accounting policies and disclosures.
New standards and amendments effective after 2017 which are relevant to the Group’s operations and yet to be adopted:A number of new standards and amendments, which are effective for accounting periods beginning after 2017, have been published and will be adopted by the Group from their effective dates. The Group’s assessment of the impact of these standards and amendments is set out below.
IFRS 9 Financial Instruments (effective from 1st January 2018)The standard replaces IAS 39 ‘Financial Instruments: Recognition and Measurement’, addresses the classification, measurement and derecognition of financial assets and liabilities, and includes a new expected credit losses model for financial assets that replaces the incurred loss impairment model used today. A substantially-reformed approach to hedging accounting is introduced.
The Group does not expect the new guidance to have a significant impact on the classification and measurement of its financial assets and financial liabilities. At 31st December 2017, the Group had investments in equity securities classified as available-for-sale with a fair value of US$2,649 million. Under IFRS 9, the gains and losses arising from changes in fair value of these investments will be recognized in profit and loss, instead of through other comprehensive income. Such fair value gains or losses on revaluation of these investments will be classified as non-trading items. The above change will not have any impact on the Group’s underlying profit attributable to shareholders and shareholders’ funds. The Group’s profit attributable to shareholders for the year ended 31st December 2017 would increase by US$155 million. The new loan impairment model will mainly affect the loan impairment provisions of the Group’s financial services companies in Indonesia. Based on the assessments undertaken to date, the change is expected to reduce the Group’s underlying profit attributable to shareholders for the year ended 31st December 2017 by less than 1% with insignificant effect on the Group’s shareholders’ funds at 1st January 2018.
The new hedge accounting rules will align the accounting for hedging instruments closely with the Group’s risk management practices. The Group does not expect a significant impact on the accounting for its hedging relationships.
IFRS 15 Revenue from Contracts with Customers (effective from 1st January 2018)The standard establishes a comprehensive framework for the recognition of revenue. It replaces IAS 11 ‘Construction Contracts’ and IAS 18 ‘Revenue’ which covers contracts for goods and services. The core principle in the framework is that revenue is recognized when control of a good or service transfers to a customer. The new standard will change the Group’s revenue recognition on certain property sales, from completion method to percentage of completion method. This will lead to earlier recognition of revenue when compared to the current completion method.
Based on the Group’s assessment, it is estimated that the change in the above property sale recognition method will reduce the Group’s underlying profit attributable to shareholders for the year ended 31st December 2017 by less than 1% with insignificant effect on the Group’s shareholders’ funds at 1st January 2018. The impact of IFRS 15 on the Group’s other businesses is expected to be insignificant.
IFRS 16 Leases (effective from 1st January 2019)The standard replaces IAS 17 ‘Leases’ and related interpretations. It will result in lessees bringing almost all of their leases onto the balance sheet as the distinction between operating leases and finance leases is removed. The model requires a lessee to recognize a right-of-use asset and a lease liability, except for leases with a term of less than 12 months or with low-value. IFRS 16 will affect primarily the accounting for the Group’s operating leases. As at 31st December 2017, the Group had total commitments under operating leases of US$3,078 million (refer note 36). The accounting for lessors will not change significantly.
28 Jardine Strategic | Annual Report 2017
Notes to the Financial Statements (continued)
The Group is currently finalizing the detailed assessment on its lease portfolio and at the date of this report, it is therefore not yet possible to estimate the amount of right-of-use assets and lease liabilities that will have to be recognized on adoption of the new standard and how this may affect the Group’s profit or loss and classification of cash flows going forward.
IFRS 17 Insurance Contracts (effective from 1st January 2021)The standard replaces IAS 4 ‘Insurance Contracts’. It is a comprehensive standard with a fundamental overhaul of insurance accounting, covering recognition and measurement, presentation and disclosure. It requires insurance contract liabilities reported on the balance sheet using current assumptions at each reporting date. It is likely to have a significant impact on profit and shareholders’ funds for insurance companies. There could also be an increase in volatility in reported profit and shareholders’ funds compared to today’s accounting models. The new standard will have an effect on the Group’s insurance companies, which are in the process of assessing the impact on the Group’s financial statements.
Apart from the above, there are no other standards or amendments that are not yet effective and that would be expected to have a material impact to the Group.
The principal operating subsidiaries, associates and joint ventures have different functional currencies in line with the economic environments of the locations in which they operate. The functional currency of the Company is United States dollars. The consolidated financial statements are presented in United States dollars.
The Group’s reportable segments are set out in note 4 and are described on page 4 and pages 6 to 13.
Basis of consolidation(i) The consolidated financial statements include the financial statements of the Company, its subsidiaries, and the Group’s interests in associates and joint ventures and its investment in Jardine Matheson.
(ii) A subsidiary is an entity over which the Group has control. The Group controls an entity when the Group is exposed to, or has rights to, variable returns from its involvement with the entity and has the ability to affect those returns through its power over the entity.
The purchase method of accounting is used to account for the acquisition of subsidiaries by the Group. The cost of an acquisition includes the fair value at the acquisition date of any contingent consideration. The Group recognizes the non-controlling interest’s proportionate share of the recognized identifiable net assets of the acquired subsidiary. In a business combination achieved in stages, the Group remeasures its previously held interest in the acquiree at its acquisition-date fair value and recognizes the resulting gain or loss in profit and loss. Changes in a parent’s ownership interest in a subsidiary that do not result in the loss of control are accounted for as equity transactions. When control over a previous subsidiary is lost, any remaining interest in the entity is remeasured at fair value and the resulting gain or loss is recognized in profit and loss.
All material intercompany transactions, balances and unrealized surpluses and deficits on transactions between Group companies have been eliminated.
(iii) An associate is an entity, not being a subsidiary or joint venture, over which the Group exercises significant influence. A joint venture is a type of joint arrangement whereby the parties that have joint control of the arrangement have rights to the net assets of the joint venture. Joint control is the contractually agreed sharing of control of an arrangement, which exists only when decisions about the relevant activities require unanimous consent of the parties sharing control.
Associates and joint ventures are included on the equity basis of accounting.
Profits and losses resulting from upstream and downstream transactions between the Group and its associates and joint ventures are recognized in the consolidated financial statements only to the extent of unrelated investor’s interests in the associates and joint ventures.
(iv) The Company has a 57% interest in its ultimate holding company, Jardine Matheson Holdings Limited. The results of Jardine Matheson are included on the equity basis of accounting. The cost of and related income arising from shares held in the Company by Jardine Matheson are eliminated from shareholders’ funds and profit, respectively.
29Jardine Strategic | Annual Report 2017
(v) Non-controlling interests represent the proportion of the results and net assets of subsidiaries and their associates and joint ventures not attributable to the Group.
(vi) The results of subsidiaries, associates and joint ventures, and Jardine Matheson are included or excluded from their effective dates of acquisition or disposal, respectively. The results of entities other than subsidiaries, associates and joint ventures, and Jardine Matheson are included to the extent of dividends received when the right to receive such dividend is established.
Foreign currenciesTransactions in foreign currencies are accounted for at the exchange rates ruling at the transaction dates.
Assets and liabilities of subsidiaries, associates and joint ventures, together with all other monetary assets and liabilities expressed in foreign currencies, are translated into United States dollars at the rates of exchange ruling at the year end. Results expressed in foreign currencies are translated into United States dollars at the average rates of exchange ruling during the year, which approximate the exchange rates at the dates of the transactions.
Exchange differences arising from the retranslation of the net investment in foreign subsidiaries, associates and joint ventures, and of financial instruments which are designated as hedges of such investments, are recognized in other comprehensive income and accumulated in equity under exchange reserves. On the disposal of these investments, such exchange differences are recognized in profit and loss. Exchange differences on available-for-sale investments are recognized in other comprehensive income as part of the gains and losses arising from changes in their fair value. Exchange differences relating to changes in the amortized cost of monetary securities classified as available-for-sale and all other exchange differences are recognized in profit and loss.
Goodwill and fair value adjustments arising on acquisition of a foreign entity after 1st January 2003 are treated as assets and liabilities of the foreign entity and translated into United States dollars at the rate of exchange ruling at the year end.
Impairment of non-financial assetsAssets that have indefinite useful lives are not subject to amortization and are tested for impairment annually and whenever there is an indication that the assets may be impaired. Assets that are subject to amortization are reviewed for impairment whenever events or changes in circumstances indicate that the carrying amount may not be recoverable. For the purpose of assessing impairment, assets are grouped at the lowest level for which there is separately identifiable cash flows. Cash-generating units or groups of cash-generating units to which goodwill has been allocated are tested for impairment annually and whenever there is an indication that the units may be impaired. An impairment loss is recognized for the amount by which the carrying amount of the asset exceeds its recoverable amount, which is the higher of an asset’s fair value less costs to sell and value in use. Non-financial assets other than goodwill that suffered an impairment are reviewed for possible reversal of the impairment annually.
Intangible assets(i) Goodwill represents the excess of the sum of the consideration transferred, the amount of any non-controlling interests in the acquiree, and the acquisition-date fair value of any previously held equity interest in the acquiree over the acquisition-date fair value of the Group’s share of the net identifiable assets acquired. Non-controlling interests are measured at their proportionate share of the net identifiable assets at the acquisition date. If the cost of acquisition is less than the fair value of the net assets acquired, the difference is recognized directly in profit and loss. Goodwill on acquisitions of subsidiaries is included in intangible assets. Goodwill on acquisitions of associates and joint ventures is included in investment in associates and joint ventures. Goodwill is allocated to cash-generating units or groups of cash-generating units for the purpose of impairment testing and is carried at cost less accumulated impairment loss.
The profit or loss on disposal of subsidiaries, associates and joint ventures is stated after deducting the carrying amount of goodwill relating to the entity sold.
(ii) Franchise rights, which are rights under franchise agreements, are separately identified intangible assets acquired as part of a business combination. These franchise agreements are deemed to have indefinite lives because either they do not have any term of expiry or their renewal by the Group would be probable and would not involve significant costs, taking into account the history of renewal and the relationships between the franchisee and the contracting parties. The useful lives are reviewed at each balance sheet date. Franchise rights are carried at cost less accumulated impairment loss.
30 Jardine Strategic | Annual Report 2017
Notes to the Financial Statements (continued)
(iii) Leasehold land represents payments to third parties to acquire short-term interests in property. These payments are stated at cost and are amortized over the useful life of the lease which includes the renewal period if the lease can be renewed by the Group without significant cost.
(iv) Concession rights are operating rights for toll roads under service concession arrangements. The cost of the construction services is amortized based on traffic volume projections.
(v) Other intangible assets are stated at cost less accumulated amortization. Amortization is calculated on the straight line basis to allocate the cost of intangible assets over their estimated useful lives.
Tangible fixed assets and depreciationFreehold land and buildings, and the building component of owner-occupied leasehold properties are stated at cost less any accumulated depreciation and impairment. Long-term interests in leasehold land are classified as finance leases and grouped under tangible assets if substantially all risks and rewards relating to the land have been transferred to the Group, and are amortized over the useful life of the lease. Grants related to tangible assets are deducted in arriving at the carrying amount of the assets. Mining properties, which are contractual rights to mine and own coal reserves in specified concession areas, and other tangible fixed assets are stated at cost less amounts provided for depreciation. Cost of mining properties includes expenditure to restore and rehabilitate coal mining areas following the completion of production.
Depreciation of tangible fixed assets other than mining properties is calculated on the straight line basis to allocate the cost or valuation of each asset to its residual value over its estimated useful life. The residual values and useful lives are reviewed at each balance sheet date. The estimated useful lives are as follows:
Buildings 21 – 150 yearsSurface, finishes and services of hotel properties 20 – 30 yearsLeasehold improvements shorter of unexpired lease term or useful lifeLeasehold land period of the leasePlant and machinery 2 – 20 yearsFurniture, equipment and motor vehicles 2 – 25 years
No depreciation is provided on freehold land as it is deemed to have an indefinite life. Mining properties are depreciated using the unit of production method.
Where the carrying amount of a tangible fixed asset is greater than its estimated recoverable amount, it is written down immediately to its recoverable amount.
The profit or loss on disposal of tangible fixed assets is recognized by reference to their carrying amount.
Investment propertiesProperties including those under operating leases which are held for long-term rental yields or capital gains are classified and accounted for as investment properties, but the business model does not necessarily envisage that the properties will be held for their entire useful life. Investment properties are carried at fair value, representing estimated open market value determined annually by independent qualified valuers who have recent experience in the location and category of the investment property being valued. The market value of commercial properties are calculated on the discounted net rental income allowing for reversionary potential. The market value of residential properties are arrived at by reference to market evidence of transaction prices for similar properties. Changes in fair value are recognized in profit and loss.
Bearer plantsBearer plants are stated at cost less any accumulated depreciation and impairment loss. The cost of bearer plants includes costs incurred for field preparation, planting, fertilizing and maintenance, capitalization of borrowing costs incurred on loans used to finance the development of immature bearer plants and an allocation of other indirect costs based on planted hectares. Bearer plants are considered mature three to four years after planting and once they are generating fresh fruit bunches which average four to six tonnes per hectare per year. Depreciation of mature bearer plants commences in the year when the bearer plants are mature using the straight-line method over the estimated useful life of 20 years. Agricultural produce growing on bearer plants comprise oil palm fruits which are measured at fair value. Changes in fair value are recorded in the profit and loss account.
31Jardine Strategic | Annual Report 2017
Investments(i) Investments are classified by management as available for sale or held to maturity on initial recognition. Available-for-sale investments are shown at fair value. Gains and losses arising from changes in fair value are recognized in other comprehensive income and accumulated in equity. On the disposal of an investment or when an investment is determined to be impaired, the cumulative gain or loss previously deferred in equity is recognized in profit and loss. Held-to-maturity investments are shown at amortized cost. Investments are classified under non-current assets unless they are expected to be realized within 12 months after the balance sheet date.
(ii) At each balance sheet date, the Group assesses whether there is objective evidence that an investment is impaired. In the case of equity securities classified as available for sale, a significant or prolonged decline in the fair value of the security below its cost is considered as an indicator that the securities are impaired and are recognized in profit and loss.
(iii) All purchases and sales of investments are recognized on the trade date, which is the date that the Group commits to purchase or sell the investment.
LeasesLeases are classified as finance leases when the terms of the lease transfer substantially all the risks and rewards of ownership to the lessee. All other leases are classified as operating leases.
(i) Amount due from lessees under finance leases are recorded as receivables at the amount of the Group’s net investment in the leases. Finance lease income is allocated to accounting periods so as to reflect a constant periodic rate of return on the Group’s net investment outstanding in respect of the leases.
(ii) Plant and machinery under finance leases are capitalized at the commencement of the lease at the lower of the fair value of the leased asset and the present value of the minimum lease payments. Lease payments are allocated between the liability and finance charges so as to achieve a constant rate on the finance balance outstanding.
(iii) Payments made under operating leases (net of any incentives received from the lessor) are charged to profit and loss on a straight line basis over the period of the lease. When a lease is terminated before the lease period has expired, any payment required to be made to the lessor by way of penalty is recognized as an expense in the year in which termination takes place.
Properties for saleProperties for sale, which comprise land and buildings held for resale, are stated at the lower of cost and net realizable value. The cost of properties for sale comprises land costs, and construction and other development costs.
Stocks and work in progressStocks, which principally comprise goods held for resale, are stated at the lower of cost and net realizable value. Cost is determined by the first-in, first-out method. The cost of finished goods and work in progress comprises raw materials, labour and an appropriate proportion of overheads.
DebtorsConsumer financing debtors and financing lease receivables are measured at amortized cost using the effective interest method. The gross amount due from customers for contract work is stated at cost plus an appropriate proportion of profit, established by reference to the percentage of completion, and after deducting progress payments and provisions for foreseeable losses. Repossessed assets of finance companies are measured at the lower of the carrying amount of the debtors in default and fair value less costs to sell. All other debtors, excluding derivative financial instruments, are measured at amortized cost except where the effect of discounting would be immaterial. Provision for impairment is established when there is objective evidence that the outstanding amounts will not be collected. Significant financial difficulties of the debtor, probability that the debtor will enter bankruptcy or financial reorganization, and default or delinquency in payments are considered indicators that the debtor is impaired. The carrying amount of the asset is reduced through the use of an allowance account and the amount of the loss is recognized in arriving at operating profit. When a debtor is uncollectible, it is written off against the allowance account. Subsequent recoveries of amount previously written off are credited to profit and loss.
Debtors with maturities greater than 12 months after the balance sheet date are classified under non-current assets.

32 Jardine Strategic | Annual Report 2017
Notes to the Financial Statements (continued)
Cash and cash equivalentsFor the purposes of the cash flow statement, cash and cash equivalents comprise deposits with banks and financial institutions, bank and cash balances, and liquid investments, net of bank overdrafts. In the balance sheet, bank overdrafts are included in current borrowings.
Liquid investments, which are readily convertible to known amounts of cash and which are subject to an insignificant risk of change in value, are included in bank balances and other liquid funds and are stated at market value. Increases or decreases in market value are recognized in profit and loss.
ProvisionsProvisions are recognized when the Group has present legal or constructive obligations as a result of past events, it is probable that an outflow of resources embodying economic benefits will be required to settle the obligations, and a reliable estimate of the amount of the obligations can be made.
Borrowings and borrowing costsBorrowings are initially recognized at fair value, net of transaction costs incurred. In subsequent periods, borrowings are stated at amortized cost using the effective interest method.
On the issue of bonds which are convertible into a fixed number of ordinary shares of the issuing entity, the fair value of the liability portion is determined using a market interest rate for an equivalent non-convertible bond; this amount is included in long-term borrowings on the amortized cost basis until extinguished on conversion or maturity of the bond. The remainder of the proceeds is allocated to the conversion option which is recognized and included in shareholders’ funds. On the issue of convertible bonds which are not convertible into the issuing entity’s own shares or which are not convertible into a fixed number of ordinary shares of the issuing entity, the fair value of the conversion option component is determined and included in current liabilities, and the residual amount is allocated to the carrying amount of the bond. Any conversion option component included in current liabilities is shown at fair value with changes in fair value recognized in profit and loss.
Borrowing costs relating to major development projects are capitalized until the asset is substantially completed. Capitalized borrowing costs are included as part of the cost of the asset. All other borrowing costs are expensed as incurred.
Borrowings are classified as current liabilities unless the Group has an unconditional right to defer settlement of the liability for at least 12 months after the balance sheet date.
Current and deferred taxThe tax expense for the year comprises current and deferred tax. Tax is recognized in profit and loss, except to the extent that it relates to items recognized in other comprehensive income or direct in equity. In this case, the tax is also recognized in other comprehensive income or directly in equity, respectively.
The current income tax charge is calculated on the basis of the tax laws enacted or substantively enacted at the balance sheet date in the countries where the Group operates and generates taxable income. Management periodically evaluates positions taken in tax returns with respect to situations in which applicable tax regulation is subject to interpretation. It establishes provisions where appropriate on the basis of amounts expected to be paid to the tax authorities.
Deferred tax is provided, using the liability method, for all temporary differences arising between the tax bases of assets and liabilities and their carrying values. Deferred tax is determined using tax rates and laws that have been enacted or substantially enacted by the balance sheet date and are expected to apply when the related deferred tax asset is realized or the deferred tax liability is settled.
Provision for deferred tax is made on the revaluation of certain non-current assets and, in relation to acquisitions, on the difference between the fair value of the net assets acquired and their tax base. Deferred tax is provided on temporary differences associated with investments in subsidiaries, associates and joint ventures, except where the Group is able to control the reversal of the temporary difference and it is probable that the temporary difference will not reverse in the foreseeable future. Deferred tax assets relating to the carry forward of unused tax losses are recognized to the extent that it is probable that future taxable profit will be available against which the unused tax losses can be utilized.
33Jardine Strategic | Annual Report 2017
Employee benefits(i) Pension obligationsThe Group operates a number of defined benefit and defined contribution plans, the assets of which are held in trustee administered funds.
Pension accounting costs for defined benefit plans are assessed using the projected unit credit method. Under this method, the costs of providing pensions are charged to profit and loss spreading the regular cost over the service lives of employees in accordance with the advice of qualified actuaries, who carry out a full valuation of major plans every year. The pension obligations are measured as the present value of the estimated future cash outflows by reference to market yields on high quality corporate bonds which have terms to maturity approximating the terms of the related liability. Plan assets are measured at fair value.
Actuarial gains and losses arising from experience adjustments and changes in actuarial assumptions are recognized in other comprehensive income in the year in which they occur.
Past service costs are recognized immediately in profit and loss.
The Group’s total contributions relating to the defined contribution plans are charged to profit and loss in the year to which they relate.
(ii) Share-based compensationThe Group operates a number of equity settled employee share option schemes. The fair value of the employee services received in exchange for the grant of the options in respect of options granted after 7th November 2002 is recognized as an expense. The total amount to be expensed over the vesting period is determined by reference to the fair value of the options granted as determined on the grant date. At each balance sheet date, the entity revises its estimates of the number of options that are expected to become exercisable. The impact of the revision of original estimates, if any, is recognized in profit and loss.
Derivative financial instrumentsThe Group only enters into derivative financial instruments in order to hedge underlying exposures. Derivative financial instruments are initially recognized at fair value on the date a derivative contract is entered into and are subsequently remeasured at their fair value. The method of recognizing the resulting gain or loss is dependent on the nature of the item being hedged. The Group designates certain derivatives as a hedge of the fair value of a recognized asset or liability (‘fair value hedge’), or a hedge of a forecasted transaction or of the foreign currency risk on a firm commitment (‘cash flow hedge’), or a hedge of a net investment in a foreign entity.
Changes in the fair value of derivatives that are designated and qualify as fair value hedges and that are highly effective, are recognized in profit and loss, along with any changes in the fair value of the hedged asset or liability that is attributable to the hedged risk. When a hedging instrument expires or is sold, or when a hedge no longer meets the criteria for hedge accounting, the cumulative adjustment to the carrying amount of a hedged item for which the effective interest method is used is amortized to profit and loss over the residual period to maturity.
Changes in the fair value of derivatives that are designated and qualify as cash flow hedges and that are highly effective, are recognized in other comprehensive income and accumulated in equity under hedging reserves. Changes in the fair value relating to the ineffective portion is recognized immediately in profit and loss. Where the forecasted transaction or firm commitment results in the recognition of a non-financial asset or of a non-financial liability, the gains and losses previously deferred in hedging reserves are transferred from hedging reserves and included in the initial measurement of the cost of the asset or liability. Otherwise, amounts deferred in hedging reserves are transferred to profit and loss in the same periods during which the hedged firm commitment or forecasted transaction affects profit and loss. When a hedging instrument expires or is sold, or when a hedge no longer meets the criteria for hedge accounting, any cumulative gain or loss existing in hedging reserves at that time remains in the hedging reserves and is recognized when the committed or forecasted transaction ultimately is recognized in profit and loss. When a committed or forecasted transaction is no longer expected to occur, the cumulative gain or loss that was reported in hedging reserves is immediately transferred to profit and loss.
34 Jardine Strategic | Annual Report 2017
Notes to the Financial Statements (continued)
Certain derivative transactions, while providing effective economic hedges under the Group’s risk management policies, do not qualify for hedge accounting under the specific rules in IAS 39. Changes in the fair value of any derivative instruments that do not qualify for hedge accounting under IAS 39 are recognized immediately in profit and loss.
Hedges of net investments in foreign entities are accounted for on a similar basis to that used for cash flow hedges. Any gain or loss on the hedging instrument relating to the effective portion of the hedge is recognized in other comprehensive income and accumulated in exchange reserves; the gain or loss relating to the ineffective portion is recognized immediately in profit and loss.
The fair value of derivatives which are designated and qualify as effective hedges are classified as non-current assets or liabilities if the remaining maturities of the hedged assets or liabilities are greater than 12 months after the balance sheet date.
Insurance contractsInsurance contracts are those contracts that transfer significant insurance risk.
Premiums on insurance contracts are recognized as revenue proportionately over the period of coverage. The portion of premium received on in-force contracts that relates to unexpired risks at the balance sheet date is reported as the unearned premium liability. Claims and loss adjustment expenses are charged to profit and loss as incurred based on the estimated liabilities for compensation owed to contract holders or third parties damaged by the contract holders. They include direct and indirect claims settlement costs and arise from events that have occurred up to the balance sheet date even if they have not yet been reported to the Group. The Group does not discount its liabilities for unpaid claims. Liabilities for unpaid claims are estimated using the input of assessments for individual cases reported to the Group and statistical analyzes for the claims incurred but not reported.
Financial guarantee contracts under which the Group accepts significant risk from a third party by agreeing to compensate that party on the occurrence of a specified uncertain future event are accounted for in a manner similar to insurance contracts. Provisions are recognized when it is probable that the Group has obligations under such guarantees and an outflow of resources embodying economic benefits will be required to settle the obligations.
Offsetting financial instrumentsFinancial assets and liabilities are offset and the net amount reported in the balance sheet when there is a legally enforceable right to offset the recognized amounts and there is an intention to settle on a net basis or realize the asset and settle the liability simultaneously. The legally enforceable right must not be contingent on future events and must be enforceable in the normal course of business and in the event of default, insolvency or bankruptcy of the company or the counterparty.
Non-trading itemsNon-trading items are separately identified to provide greater understanding of the Group’s underlying business performance. Items classified as non-trading items include fair value gains or losses on revaluation of investment properties; gains and losses arising from the sale of businesses, investments and properties; impairment of non-depreciable intangible assets and other investments; provisions for the closure of businesses; acquisition-related costs in business combinations; and other credits and charges of a non-recurring nature that require inclusion in order to provide additional insight into underlying business performance.
35Jardine Strategic | Annual Report 2017
Earnings per shareBasic earnings per share are calculated on profit attributable to shareholders and on the weighted average number of shares in issue during the year. The weighted average number excludes the Company’s share of the shares held by Jardine Matheson. For the purpose of calculating diluted earnings per share, profit attributable to shareholders is adjusted for the effects of the conversion of dilutive potential ordinary shares of Jardine Matheson, subsidiaries, associates or joint ventures.
DividendsDividends proposed or declared after the balance sheet date are not recognized as a liability at the balance sheet date. The nominal amount of the ordinary shares issued as a result of election for scrip is capitalized out of the share premium account or other reserves, as appropriate.
Revenue recognitionRevenue is measured at the fair value of the consideration received and receivable and represents amounts receivable for goods and services provided in the normal course of business, net of discounts and sales related taxes.
(i) Revenue from the sale of goods, including properties for sale, is recognized on the transfer of significant risks and rewards of ownership, which generally coincides with the time when the goods are delivered to customers.
(ii) Receipts under operating leases are accounted for on an accrual basis over the lease terms.
(iii) Revenue from a contract to provide services is recognized by reference to the stage of completion of the contract.
(iv) Revenue from consumer financing and financing leases is recognized over the term of the respective contracts based on a constant rate of return on the net investment.
(v) Interest income is recognized on a time proportion basis taking into account the principal amounts outstanding and the interest rates applicable.
(vi) Dividend income is recognized when the right to receive payment is established.
Pre-operating costsPre-operating costs are expensed as they are incurred.
36 Jardine Strategic | Annual Report 2017
Notes to the Financial Statements (continued)
2 Financial Risk ManagementFinancial risk factorsThe Group’s activities expose it to a variety of financial risks: market risk (including foreign exchange risk, interest rate risk and price risk), credit risk and liquidity risk.
The Group’s treasury function co-ordinates, under the directions of the board of Jardine Matheson Limited, financial risk management policies and their implementation on a group-wide basis. The Group’s treasury policies are designed to manage the financial impact of fluctuations in interest rates and foreign exchange rates and to minimize the Group’s financial risks. The Group uses derivative financial instruments, principally interest rate swaps, caps and collars, cross-currency swaps, forward foreign exchange contracts and foreign currency options as appropriate for hedging transactions and managing the Group’s assets and liabilities in accordance with the Group’s financial risk management policies. Financial derivative contracts are executed between third party banks and the Group entity that is directly exposed to the risk being hedged. Certain derivative transactions, while providing effective economic hedges under the Group’s risk management policies, do not qualify for hedge accounting under the specific rules in IAS 39. Changes in the fair value of any derivative instruments that do not qualify for hedge accounting under IAS 39 are recognized immediately in the profit and loss account. It is the Group’s policy not to enter into derivative transactions for speculative purposes. The notional amounts and fair values of derivative financial instruments at 31st December 2017 are disclosed in note 35.
(i) Market riskForeign exchange riskEntities within the Group are exposed to foreign exchange risk from future commercial transactions, net investments in foreign operations and net monetary assets and liabilities that are denominated in a currency that is not the entity’s functional currency.
Entities in the Group use cross-currency swaps, forward foreign exchange contracts and foreign currency options in a consistent manner to hedge firm and anticipated foreign exchange commitments and manage their foreign exchange risk arising from future commercial transactions. The Group does not usually hedge its net investments in foreign operations except in circumstances where there is a material exposure arising from a currency that is anticipated to be volatile and the hedging is cost effective. Group entities are required to manage their foreign exchange risk against their functional currency. Foreign currency borrowings are swapped into the entity’s functional currency using cross-currency swaps except where the foreign currency borrowings are repaid with cash flows generated in the same foreign currency. The purpose of these hedges is to mitigate the impact of movements in foreign exchange rates on assets and liabilities and the profit and loss account of the Group.
Currency risks as defined by IFRS 7 arise on account of monetary assets and liabilities being denominated in a currency that is not the functional currency. At 31st December 2017 the Group’s Indonesian rupiah functional entities had United States dollar denominated net monetary assets of US$358 million (2016: US$371 million). At 31st December 2017, if the United States dollar had strengthened/weakened by 10% against the Indonesian rupiah with all other variables unchanged, the Group’s profit after tax would have been US$27 million higher/lower (2016: US$28 million higher/lower), arising from foreign exchange gains/losses taken on translation. The impact on amounts attributable to the shareholders of the Company would be US$7 million higher/lower (2016: US$5 million higher/lower). This sensitivity analysis ignores any offsetting foreign exchange factors and has been determined assuming that the change in foreign exchange rates had occurred at the balance sheet date. The stated change represents management’s assessment of reasonably possible changes in foreign exchange rates over the period until the next annual balance sheet date. There are no other significant monetary balances held by Group companies at 31st December 2017 that are denominated in a non-functional currency. Differences resulting from the translation of financial statements into the Group’s presentation currency are not taken into consideration.
Since the Group manages the interdependencies between foreign exchange risk and interest rate risk of foreign currency borrowings using cross-currency swaps, the sensitivity analysis on financial impacts arising from cross-currency swaps is included in the sensitivity assessment on interest rates under the interest rate risk section.
37Jardine Strategic | Annual Report 2017
Interest rate riskThe Group is exposed to interest rate risk through the impact of rate changes on interest bearing liabilities and assets. These exposures are managed partly by using natural hedges that arise from offsetting interest rate sensitive assets and liabilities, and partly through fixed rate borrowings and the use of derivative financial instruments such as interest rate swaps, caps and collars. The Group monitors interest rate exposure on a monthly basis by currency and business unit, taking into consideration proposed financing and hedging arrangements. The Group’s guideline is to maintain 40% to 60% of its gross borrowings, exclusive of the financial services companies, in fixed rate instruments. At 31st December 2017 the Group’s interest rate hedge exclusive of the financial services companies was 39% (2016: 42%), with an average tenor of six years (2016: seven years). The financial services companies borrow predominately at a fixed rate. The interest rate profile of the Group’s borrowings after taking into account hedging transactions are set out in note 31.
Cash flow interest rate risk is the risk that changes in market interest rates will impact cash flows arising from variable rate financial instruments. Borrowings at floating rates therefore expose the Group to cash flow interest rate risk. The Group manages this risk by using forward rate agreements to a maturity of one year, and by entering into interest rate swaps, caps and collars for a maturity of up to five years. Forward rate agreements and interest rate swaps have the economic effect of converting borrowings from floating rate to fixed rate, caps provide protection against a rise in floating rates above a pre-determined rate, whilst collars combine the purchase of a cap and the sale of a floor to specify a range in which an interest rate will fluctuate.
Fair value interest rate risk is the risk that the value of a financial asset or liability and derivative financial instruments will fluctuate because of changes in market interest rates. The Group manages its fair value interest rate risk by entering into interest rate swaps which have the economic effect of converting borrowings from fixed rate to floating rate, to maintain the Group’s fixed rate instruments within the Group’s guideline.
At 31st December 2017, if interest rates had been 100 basis points higher/lower with all other variables held constant, the Group’s profit after tax would have been US$5 million (2016: US$18 million) higher/lower, and hedging reserves would have been US$93 million (2016: US$82 million) higher/lower as a result of fair value changes to cash flow hedges. The sensitivity analysis has been determined assuming that the change in interest rates had occurred at the balance sheet date and had been applied to the exposure to interest rate risk for both derivative and non-derivative financial instruments in existence at that date. There is no significant sensitivity resulting from interest rate caps and collars. The 100 basis point increase or decrease represents management’s assessment of a reasonably possible change in those interest rates which have the most impact on the Group, specifically the United States, Hong Kong and Indonesian rates, over the period until the next annual balance sheet date. In the case of effective fair value hedges, changes in the fair value of the hedged items caused by interest rate movements balance out in the profit and loss account against changes in the fair value of the hedging instruments. Changes in market interest rates affect the interest income or expense of non-derivative variable-interest financial instruments, the interest payments of which are not designated as hedged items of cash flow hedges against interest rate risks. As a consequence, they are included in the calculation of profit after tax sensitivities. Changes in the market interest rate of financial instruments that were designated as hedging instruments in a cash flow hedge to hedge payment fluctuations resulting from interest rate movements affect the hedging reserves and are therefore taken into consideration in the equity-related sensitivity calculations.
38 Jardine Strategic | Annual Report 2017
Notes to the Financial Statements (continued)
Price riskThe Group is exposed to securities price risk because of listed and unlisted investments which are available for sale and held by the Group at fair value. Gains and losses arising from changes in the fair value of available-for-sale investments are recognized in other comprehensive income. The performance of the Group’s listed and unlisted available-for-sale investments are monitored regularly, together with an assessment of their relevance to the Group’s long-term strategic plans. Details of the Group’s available-for-sale investments are contained in note 19.
Available-for-sale investments are unhedged. At 31st December 2017, if the price of listed and unlisted available-for-sale investments had been 25% higher/lower with all other variables held constant, total equity would have been US$662 million (2016: US$347 million) higher/lower unless impaired. The sensitivity analysis has been determined based on a reasonable expectation of possible valuation volatility over the next 12 months.
The Group is exposed to financial risks arising from changes in commodity prices, primarily coal, steel rebar and copper. The Group considers the outlook for coal, steel rebar and copper prices regularly in considering the need for active financial risk management. The Group’s policy is generally not to hedge commodity price risk, although limited hedging may be undertaken for strategic reasons. In such cases the Group uses forward contracts to hedge the price risk. To mitigate or hedge the price risk, Group entities may enter into a forward contract to buy the commodity at a fixed price at a future date, or a forward contract to sell the commodity at a fixed price at a future date.
(ii) Credit riskThe Group’s credit risk is primarily attributable to deposits with banks, credit exposures to customers and derivative financial instruments with a positive fair value. The Group has credit policies in place and the exposures to these credit risks are monitored on an ongoing basis.
The Group manages its deposits with banks and financial institutions and transactions involving derivative financial instruments by monitoring credit ratings and capital adequacy ratios of counterparties, and limiting the aggregate risk to any individual counterparty. The utilization of credit limits is regularly monitored. Similarly transactions involving derivative financial instruments are with banks with sound credit ratings and capital adequacy ratios. In developing countries it may be necessary to deposit money with banks that have a lower credit rating, however the Group only enters into derivative transactions with counterparties which have credit ratings of at least investment grade. Management does not expect any counterparty to fail to meet its obligations.
In respect of credit exposures to customers, the Group has policies in place to ensure that sales on credit without collateral are made principally to corporate companies with an appropriate credit history and credit insurance is purchased for businesses where it is economically effective. The Group normally obtains collateral over vehicles from consumer financing debtors towards settlement of vehicle receivables. Customers give the right to the Group to sell the repossessed collateral or take any other action to settle the outstanding receivable. Sales to other customers are made in cash or by major credit cards.
The maximum exposure to credit risk is represented by the carrying amount of each financial asset in the balance sheet after deducting any impairment allowance.
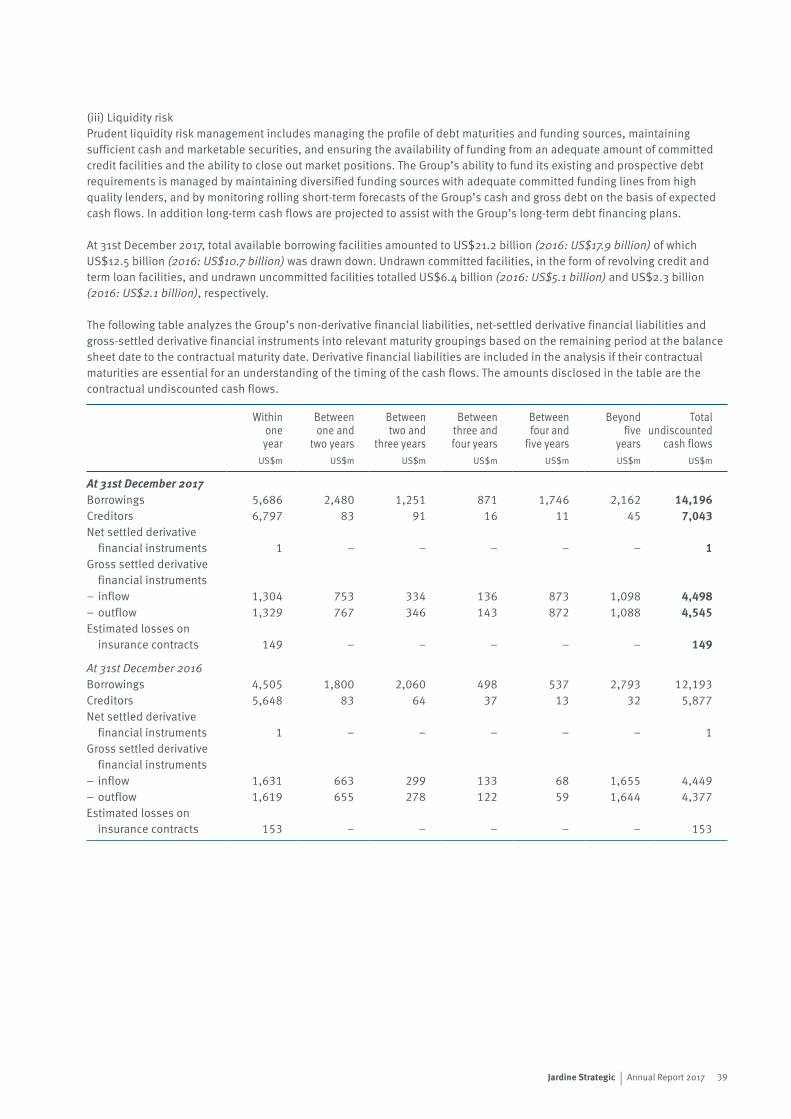
39Jardine Strategic | Annual Report 2017
(iii) Liquidity riskPrudent liquidity risk management includes managing the profile of debt maturities and funding sources, maintaining sufficient cash and marketable securities, and ensuring the availability of funding from an adequate amount of committed credit facilities and the ability to close out market positions. The Group’s ability to fund its existing and prospective debt requirements is managed by maintaining diversified funding sources with adequate committed funding lines from high quality lenders, and by monitoring rolling short-term forecasts of the Group’s cash and gross debt on the basis of expected cash flows. In addition long-term cash flows are projected to assist with the Group’s long-term debt financing plans.
At 31st December 2017, total available borrowing facilities amounted to US$21.2 billion (2016: US$17.9 billion) of which US$12.5 billion (2016: US$10.7 billion) was drawn down. Undrawn committed facilities, in the form of revolving credit and term loan facilities, and undrawn uncommitted facilities totalled US$6.4 billion (2016: US$5.1 billion) and US$2.3 billion (2016: US$2.1 billion), respectively.
The following table analyzes the Group’s non-derivative financial liabilities, net-settled derivative financial liabilities and gross-settled derivative financial instruments into relevant maturity groupings based on the remaining period at the balance sheet date to the contractual maturity date. Derivative financial liabilities are included in the analysis if their contractual maturities are essential for an understanding of the timing of the cash flows. The amounts disclosed in the table are the contractual undiscounted cash flows.
Withinoneyear
Betweenone and
two years
Betweentwo and
three years
Betweenthree andfour years
Betweenfour and
five years
Beyond Total five undiscounted years cash flows
US$m US$m US$m US$m US$m US$m US$m
At 31st December 2017Borrowings 5,686 2,480 1,251 871 1,746 2,162 14,196Creditors 6,797 83 91 16 11 45 7,043Net settled derivative
financial instruments 1 – – – – – 1Gross settled derivative
financial instruments– inflow 1,304 753 334 136 873 1,098 4,498– outflow 1,329 767 346 143 872 1,088 4,545Estimated losses on
insurance contracts 149 – – – – – 149
At 31st December 2016Borrowings 4,505 1,800 2,060 498 537 2,793 12,193Creditors 5,648 83 64 37 13 32 5,877Net settled derivative
financial instruments 1 – – – – – 1Gross settled derivative
financial instruments– inflow 1,631 663 299 133 68 1,655 4,449– outflow 1,619 655 278 122 59 1,644 4,377Estimated losses on
insurance contracts 153 – – – – – 153
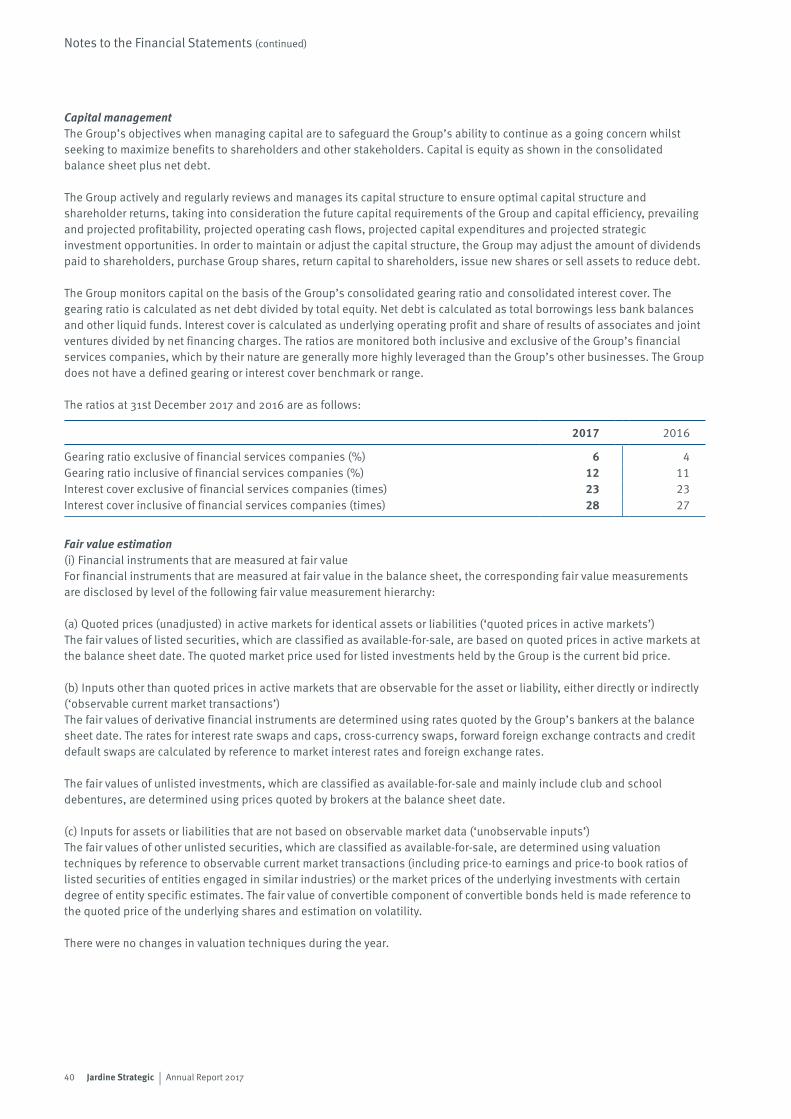
40 Jardine Strategic | Annual Report 2017
Notes to the Financial Statements (continued)
Capital managementThe Group’s objectives when managing capital are to safeguard the Group’s ability to continue as a going concern whilst seeking to maximize benefits to shareholders and other stakeholders. Capital is equity as shown in the consolidated balance sheet plus net debt.
The Group actively and regularly reviews and manages its capital structure to ensure optimal capital structure and shareholder returns, taking into consideration the future capital requirements of the Group and capital efficiency, prevailing and projected profitability, projected operating cash flows, projected capital expenditures and projected strategic investment opportunities. In order to maintain or adjust the capital structure, the Group may adjust the amount of dividends paid to shareholders, purchase Group shares, return capital to shareholders, issue new shares or sell assets to reduce debt.
The Group monitors capital on the basis of the Group’s consolidated gearing ratio and consolidated interest cover. The gearing ratio is calculated as net debt divided by total equity. Net debt is calculated as total borrowings less bank balances and other liquid funds. Interest cover is calculated as underlying operating profit and share of results of associates and joint ventures divided by net financing charges. The ratios are monitored both inclusive and exclusive of the Group’s financial services companies, which by their nature are generally more highly leveraged than the Group’s other businesses. The Group does not have a defined gearing or interest cover benchmark or range.
The ratios at 31st December 2017 and 2016 are as follows:
2017 2016
Gearing ratio exclusive of financial services companies (%) 6 4Gearing ratio inclusive of financial services companies (%) 12 11Interest cover exclusive of financial services companies (times) 23 23Interest cover inclusive of financial services companies (times) 28 27
Fair value estimation(i) Financial instruments that are measured at fair valueFor financial instruments that are measured at fair value in the balance sheet, the corresponding fair value measurements are disclosed by level of the following fair value measurement hierarchy:
(a) Quoted prices (unadjusted) in active markets for identical assets or liabilities (‘quoted prices in active markets’)The fair values of listed securities, which are classified as available-for-sale, are based on quoted prices in active markets at the balance sheet date. The quoted market price used for listed investments held by the Group is the current bid price.
(b) Inputs other than quoted prices in active markets that are observable for the asset or liability, either directly or indirectly (‘observable current market transactions’)The fair values of derivative financial instruments are determined using rates quoted by the Group’s bankers at the balance sheet date. The rates for interest rate swaps and caps, cross-currency swaps, forward foreign exchange contracts and credit default swaps are calculated by reference to market interest rates and foreign exchange rates.
The fair values of unlisted investments, which are classified as available-for-sale and mainly include club and school debentures, are determined using prices quoted by brokers at the balance sheet date.
(c) Inputs for assets or liabilities that are not based on observable market data (‘unobservable inputs’)The fair values of other unlisted securities, which are classified as available-for-sale, are determined using valuation techniques by reference to observable current market transactions (including price-to earnings and price-to book ratios of listed securities of entities engaged in similar industries) or the market prices of the underlying investments with certain degree of entity specific estimates. The fair value of convertible component of convertible bonds held is made reference to the quoted price of the underlying shares and estimation on volatility.
There were no changes in valuation techniques during the year.
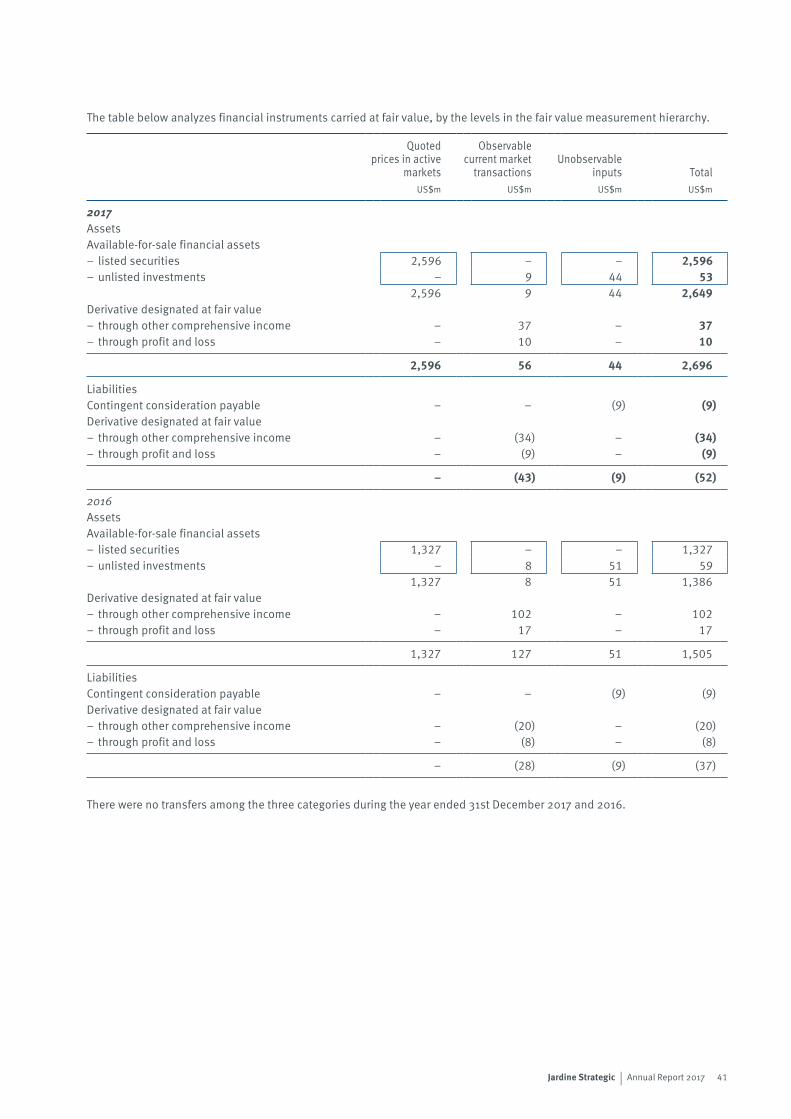
41Jardine Strategic | Annual Report 2017
The table below analyzes financial instruments carried at fair value, by the levels in the fair value measurement hierarchy.
Quotedprices in active
markets
Observable current market
transactionsUnobservable
inputs TotalUS$m US$m US$m US$m
2017AssetsAvailable-for-sale financial assets– listed securities 2,596 – – 2,596– unlisted investments – 9 44 53
2,596 9 44 2,649Derivative designated at fair value– through other comprehensive income – 37 – 37– through profit and loss – 10 – 10
2,596 56 44 2,696
LiabilitiesContingent consideration payable – – (9) (9)Derivative designated at fair value– through other comprehensive income – (34) – (34)– through profit and loss – (9) – (9)
– (43) (9) (52)
2016AssetsAvailable-for-sale financial assets– listed securities 1,327 – – 1,327– unlisted investments – 8 51 59
1,327 8 51 1,386Derivative designated at fair value– through other comprehensive income – 102 – 102– through profit and loss – 17 – 17
1,327 127 51 1,505
LiabilitiesContingent consideration payable – – (9) (9)Derivative designated at fair value– through other comprehensive income – (20) – (20)– through profit and loss – (8) – (8)
– (28) (9) (37)
There were no transfers among the three categories during the year ended 31st December 2017 and 2016.
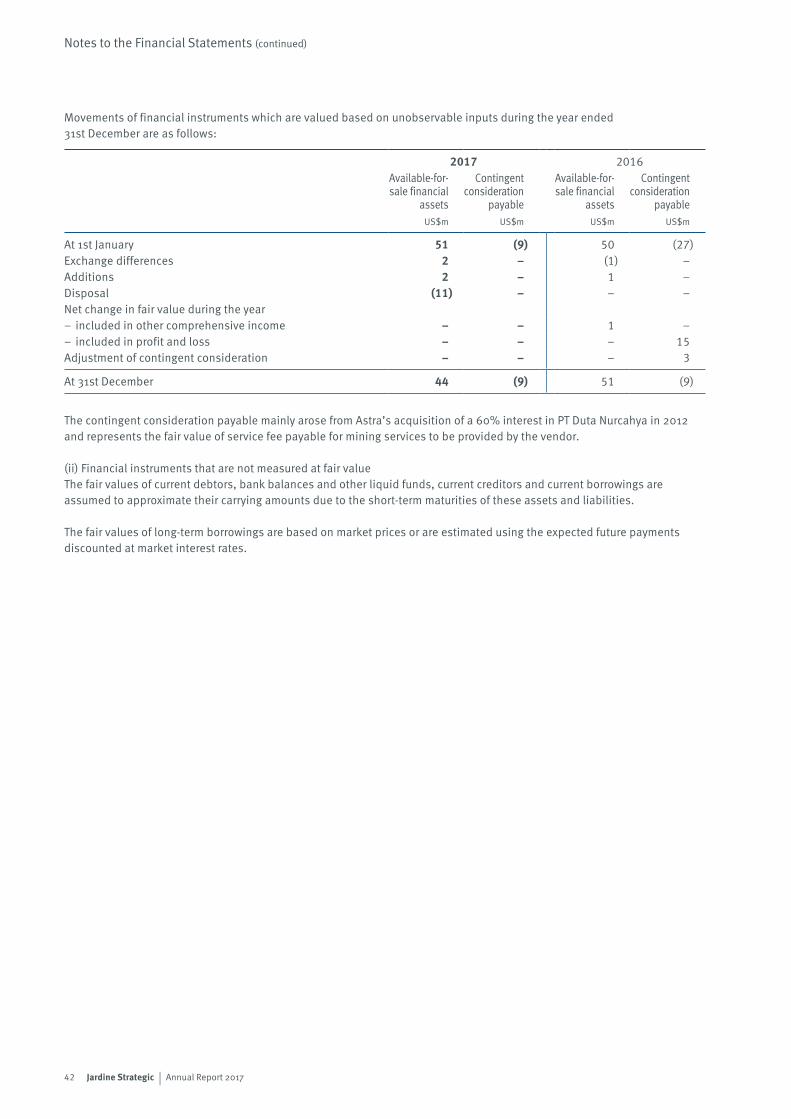
42 Jardine Strategic | Annual Report 2017
Notes to the Financial Statements (continued)
Movements of financial instruments which are valued based on unobservable inputs during the year ended31st December are as follows:
2017 2016Available-for-sale financial
assets
Contingentconsideration
payable
Available-for-sale financial
assets
Contingentconsideration
payableUS$m US$m US$m US$m
At 1st January 51 (9) 50 (27)Exchange differences 2 – (1) –Additions 2 – 1 –Disposal (11) – – –Net change in fair value during the year– included in other comprehensive income – – 1 –– included in profit and loss – – – 15Adjustment of contingent consideration – – – 3
At 31st December 44 (9) 51 (9)
The contingent consideration payable mainly arose from Astra’s acquisition of a 60% interest in PT Duta Nurcahya in 2012 and represents the fair value of service fee payable for mining services to be provided by the vendor.
(ii) Financial instruments that are not measured at fair valueThe fair values of current debtors, bank balances and other liquid funds, current creditors and current borrowings are assumed to approximate their carrying amounts due to the short-term maturities of these assets and liabilities.
The fair values of long-term borrowings are based on market prices or are estimated using the expected future payments discounted at market interest rates.
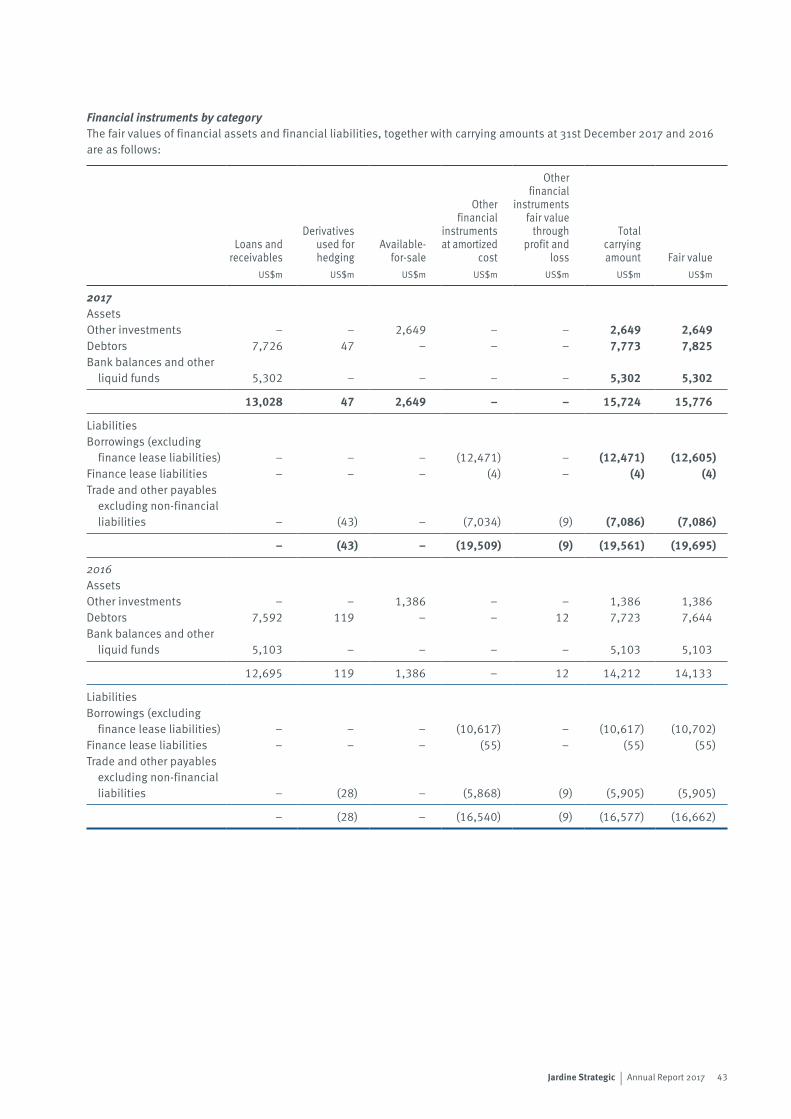
43Jardine Strategic | Annual Report 2017
Financial instruments by categoryThe fair values of financial assets and financial liabilities, together with carrying amounts at 31st December 2017 and 2016 are as follows:
Loans and receivables
Derivatives used for hedging
Available- for-sale
Other financial
instruments at amortized
cost
Other financial
instruments fair value
through profit and
loss
Total carrying amount Fair value
US$m US$m US$m US$m US$m US$m US$m
2017AssetsOther investments – – 2,649 – – 2,649 2,649Debtors 7,726 47 – – – 7,773 7,825Bank balances and other
liquid funds 5,302 – – – – 5,302 5,302
13,028 47 2,649 – – 15,724 15,776
LiabilitiesBorrowings (excluding
finance lease liabilities) – – – (12,471) – (12,471) (12,605)Finance lease liabilities – – – (4) – (4) (4)Trade and other payables
excluding non-financial liabilities – (43) – (7,034) (9) (7,086) (7,086)
– (43) – (19,509) (9) (19,561) (19,695)
2016AssetsOther investments – – 1,386 – – 1,386 1,386Debtors 7,592 119 – – 12 7,723 7,644Bank balances and other
liquid funds 5,103 – – – – 5,103 5,103
12,695 119 1,386 – 12 14,212 14,133
LiabilitiesBorrowings (excluding
finance lease liabilities) – – – (10,617) – (10,617) (10,702)Finance lease liabilities – – – (55) – (55) (55)Trade and other payables
excluding non-financial liabilities – (28) – (5,868) (9) (5,905) (5,905)
– (28) – (16,540) (9) (16,577) (16,662)
44 Jardine Strategic | Annual Report 2017
Notes to the Financial Statements (continued)
3 Critical Accounting Estimates and JudgementsEstimates and judgements used in preparing the financial statements are continually evaluated and are based on historical experience and other factors, including expectations of future events that are believed to be reasonable. The resulting accounting estimates will, by definition, seldom equal the related actual results. The estimates and assumptions that have a significant effect on the carrying amounts of assets and liabilities are discussed below.
Acquisition of subsidiaries, associates and joint venturesThe initial accounting on the acquisition of subsidiaries, associates and joint ventures involves identifying and determining the fair values to be assigned to the identifiable assets, liabilities and contingent liabilities of the acquired entities. The fair values of franchise rights, leasehold land, concession rights, tangible assets, investment properties and plantations are determined by independent valuers by reference to market prices or present value of expected net cash flows from the assets. Any changes in the assumptions used and estimates made in determining the fair values, and management’s ability to measure reliably the contingent liabilities of the acquired entity will impact the carrying amount of these assets and liabilities.
On initial acquisition or acquisition of further interests in an entity, an assessment of the level of control or influence exercised by the Group is required. For entities where the Group has a shareholding of less than 50%, an assessment of the Group’s level of voting rights, board representation and other indicators of influence is performed to consider whether the Group has de facto control, requiring consolidation of that entity, or significant influence, requiring classification as an associate.
Investment propertiesThe fair values of investment properties, which are principally held by Hongkong Land, are determined by independent valuers on an open market for existing-use basis calculated on the discounted net income allowing for reversionary potential. For investment properties in Hong Kong and Singapore, capitalization rates in the range of 2.75% to 3.50% for office (2016: 3.20% to 3.85%) and 3.75% to 5.00% for retail (2016: 4.50% to 5.50%) are used by Hongkong Land in the fair value determination.
Consideration has been given to assumptions that are mainly based on market conditions existing at the balance sheet date and appropriate capitalization rates. These estimates are regularly compared to actual market data and actual transactions entered into by the Group.
Impairment of assetsThe Group tests annually whether goodwill and other assets that have indefinite useful lives suffered any impairment. Other assets are reviewed for impairment whenever events or changes in circumstances indicate that the carrying amount of the asset exceeds its recoverable amount. The recoverable amount of an asset or a cash generating unit is determined based on the higher of its fair value less costs to sell and its value in use, calculated on the basis of management’s assumptions and estimates. Changing the key assumptions, including the amount of estimated coal reserves, the discount rates or the growth rate assumptions in the cash flow projections, could materially affect the value-in-use calculations.
The results of the impairment reviews undertaken at 31st December 2017 on the Group’s indefinite life franchise rights indicated that no impairment charge was necessary. If there is a significant increase in the discount rate and/or a significant adverse change in the projected performance of the business to which these rights attach, it may be necessary to take an impairment charge to profit and loss in the future.
In determining when an available-for-sale equity investment is impaired, significant judgement is required. In making this judgement, the Group evaluates, among other factors, the duration and extent to which the fair value of an investment is less than its cost; and the financial health of and near-term business outlook for the investee, including factors such as industry and sector performance, changes in technology and operational and financing cash flow.
45Jardine Strategic | Annual Report 2017
Income taxesThe Group is subject to income taxes in numerous jurisdictions. Significant judgement is required in determining the worldwide provision for income taxes. There are many transactions and calculations for which the ultimate tax determination is uncertain during the ordinary course of business. Where the final tax outcome of these matters is different from the amounts that were initially recorded, such differences will impact the income tax and deferred tax provisions in the period in which such determination is made.
Provision for deferred tax follows the way management expects to recover or settle the carrying amount of the related assets or liabilities, which the management may expect to recover through use, sale or combination of both. Accordingly, deferred tax will be calculated at income tax rate, capital gains tax rate or combination of both. There is a rebuttable presumption in International Financial Reporting Standards that investment properties measured at fair value are recovered through sale. Thus, deferred tax on revaluation of investment properties held by the Group are calculated at the capital gains tax rate.
Recognition of deferred tax assets, which principally relate to tax losses, depends on the management’s expectation of future taxable profit that will be available against which the tax losses can be utilized. The outcome of their actual utilization may be different.
Pension obligationsThe present value of the pension obligations depends on a number of factors that are determined on an actuarial basis using a number of assumptions. The assumptions used in determining the net cost/income for pensions include the discount rate. Any changes in these assumptions will impact the carrying amount of pension obligations.
The Group determines the appropriate discount rate at the end of each year. This is the interest rate that should be used to determine the present value of estimated future cash outflows expected to be required to settle the pension obligations. In determining the appropriate discount rate, the Group considers the interest rates of high-quality corporate bonds that are denominated in the currency in which the benefits will be paid and that have terms to maturity approximating the terms of the related pension obligation.
Other key assumptions for pension obligations are based in part on current market conditions.
Non-trading itemsThe Group uses underlying business performance in its internal financial reporting to distinguish between the underlying profits and non-trading items. The identification of non-trading items requires judgement by management, but follows the consistent methodology as set out in the Group’s accounting policies.
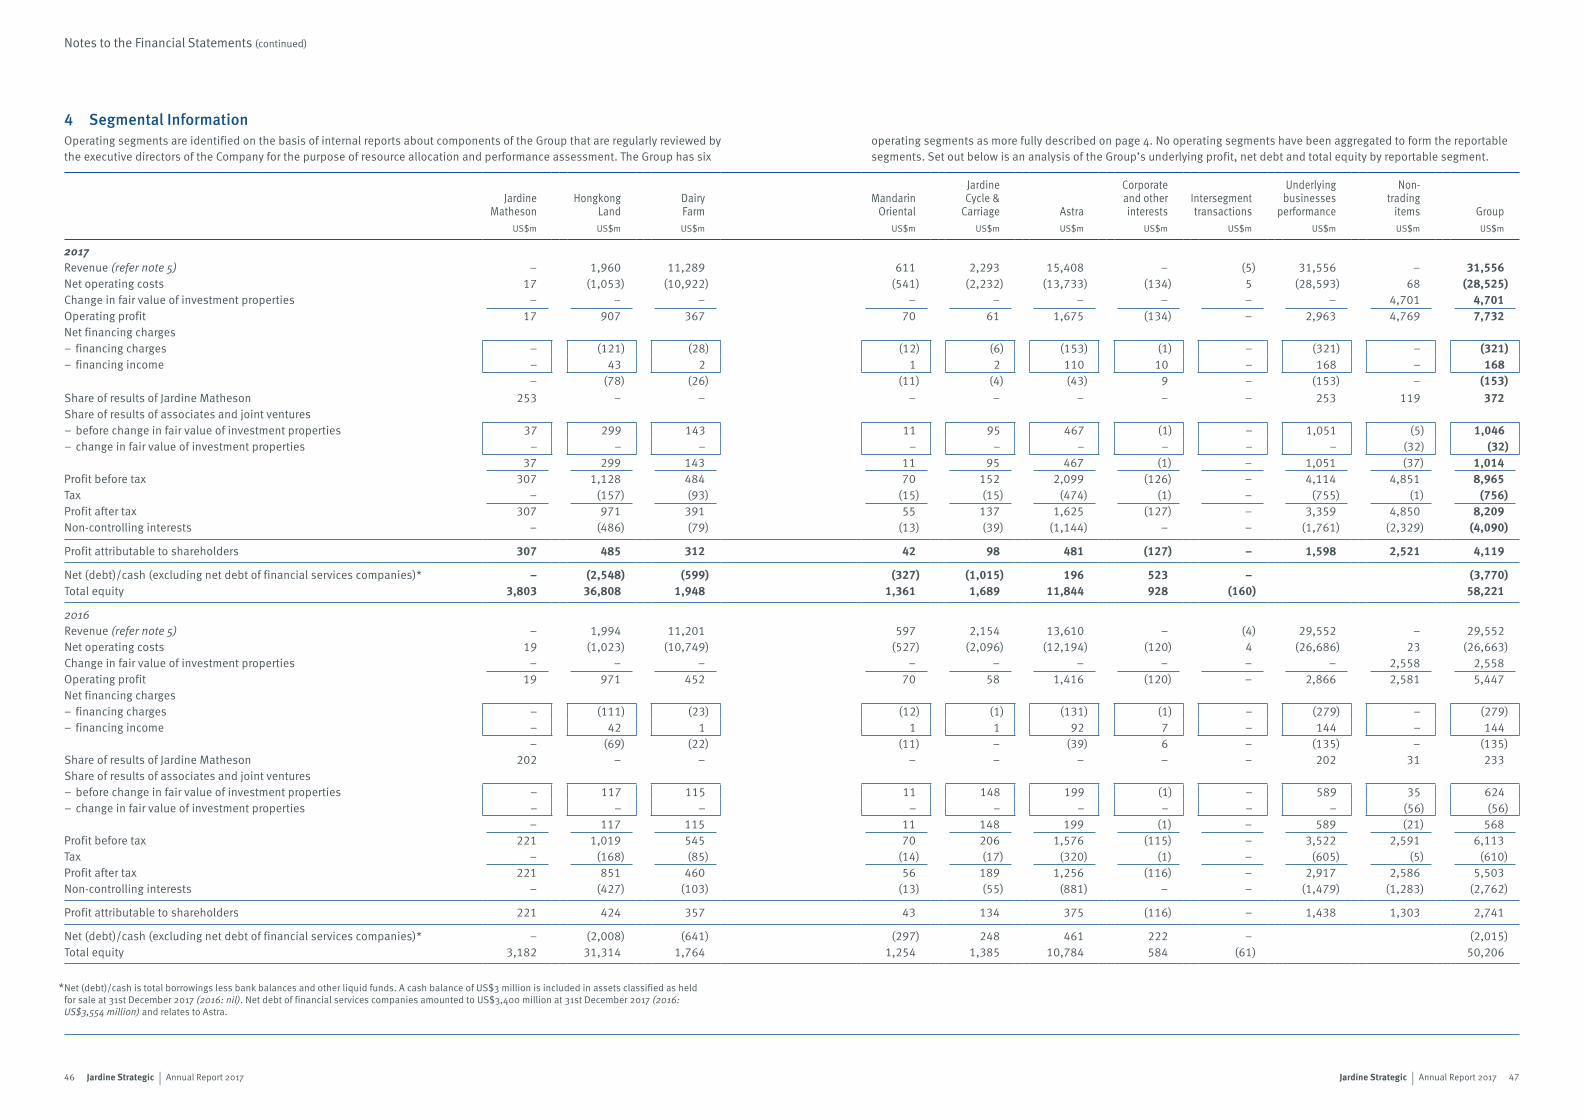
46 47Jardine Strategic | Annual Report 2017 Jardine Strategic | Annual Report 2017
Notes to the Financial Statements (continued)
4 Segmental InformationOperating segments are identified on the basis of internal reports about components of the Group that are regularly reviewed by the executive directors of the Company for the purpose of resource allocation and performance assessment. The Group has six
JardineMatheson
HongkongLand
DairyFarm
MandarinOriental
JardineCycle &
Carriage Astra
Corporate and other interests
Intersegment transactions
Underlying businesses
performance
Non-trading
items GroupUS$m US$m US$m US$m US$m US$m US$m US$m US$m US$m US$m
2017Revenue (refer note 5) – 1,960 11,289 611 2,293 15,408 – (5) 31,556 – 31,556Net operating costs 17 (1,053) (10,922) (541) (2,232) (13,733) (134) 5 (28,593) 68 (28,525)Change in fair value of investment properties – – – – – – – – – 4,701 4,701Operating profit 17 907 367 70 61 1,675 (134) – 2,963 4,769 7,732Net financing charges– financing charges – (121) (28) (12) (6) (153) (1) – (321) – (321)– financing income – 43 2 1 2 110 10 – 168 – 168
– (78) (26) (11) (4) (43) 9 – (153) – (153)Share of results of Jardine Matheson 253 – – – – – – – 253 119 372Share of results of associates and joint ventures– before change in fair value of investment properties 37 299 143 11 95 467 (1) – 1,051 (5) 1,046– change in fair value of investment properties – – – – – – – – – (32) (32)
37 299 143 11 95 467 (1) – 1,051 (37) 1,014Profit before tax 307 1,128 484 70 152 2,099 (126) – 4,114 4,851 8,965Tax – (157) (93) (15) (15) (474) (1) – (755) (1) (756)Profit after tax 307 971 391 55 137 1,625 (127) – 3,359 4,850 8,209Non-controlling interests – (486) (79) (13) (39) (1,144) – – (1,761) (2,329) (4,090)
Profit attributable to shareholders 307 485 312 42 98 481 (127) – 1,598 2,521 4,119
Net (debt)/cash (excluding net debt of financial services companies)* – (2,548) (599) (327) (1,015) 196 523 – (3,770)Total equity 3,803 36,808 1,948 1,361 1,689 11,844 928 (160) 58,221
2016Revenue (refer note 5) – 1,994 11,201 597 2,154 13,610 – (4) 29,552 – 29,552Net operating costs 19 (1,023) (10,749) (527) (2,096) (12,194) (120) 4 (26,686) 23 (26,663)Change in fair value of investment properties – – – – – – – – – 2,558 2,558Operating profit 19 971 452 70 58 1,416 (120) – 2,866 2,581 5,447Net financing charges– financing charges – (111) (23) (12) (1) (131) (1) – (279) – (279)– financing income – 42 1 1 1 92 7 – 144 – 144
– (69) (22) (11) – (39) 6 – (135) – (135)Share of results of Jardine Matheson 202 – – – – – – – 202 31 233Share of results of associates and joint ventures– before change in fair value of investment properties – 117 115 11 148 199 (1) – 589 35 624– change in fair value of investment properties – – – – – – – – – (56) (56)
– 117 115 11 148 199 (1) – 589 (21) 568Profit before tax 221 1,019 545 70 206 1,576 (115) – 3,522 2,591 6,113Tax – (168) (85) (14) (17) (320) (1) – (605) (5) (610)Profit after tax 221 851 460 56 189 1,256 (116) – 2,917 2,586 5,503Non-controlling interests – (427) (103) (13) (55) (881) – – (1,479) (1,283) (2,762)
Profit attributable to shareholders 221 424 357 43 134 375 (116) – 1,438 1,303 2,741
Net (debt)/cash (excluding net debt of financial services companies)* – (2,008) (641) (297) 248 461 222 – (2,015)Total equity 3,182 31,314 1,764 1,254 1,385 10,784 584 (61) 50,206
Net (debt)/cash is total borrowings less bank balances and other liquid funds. A cash balance of US$3 million is included in assets classified as held for sale at 31st December 2017 (2016: nil). Net debt of financial services companies amounted to US$3,400 million at 31st December 2017 (2016: US$3,554 million) and relates to Astra.
*
operating segments as more fully described on page 4. No operating segments have been aggregated to form the reportable segments. Set out below is an analysis of the Group’s underlying profit, net debt and total equity by reportable segment.
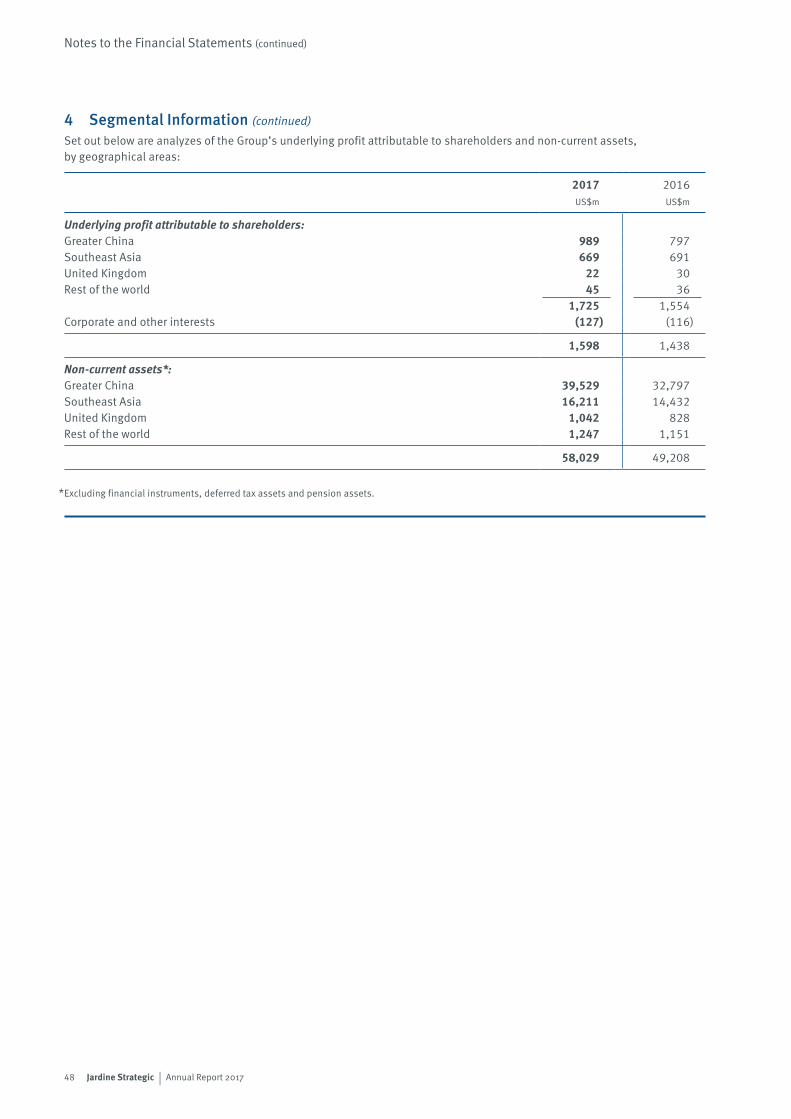
48 Jardine Strategic | Annual Report 2017
Notes to the Financial Statements (continued)
4 Segmental Information (continued)
Set out below are analyzes of the Group’s underlying profit attributable to shareholders and non-current assets, by geographical areas:
2017 2016US$m US$m
Underlying profit attributable to shareholders:Greater China 989 797Southeast Asia 669 691United Kingdom 22 30Rest of the world 45 36
1,725 1,554Corporate and other interests (127) (116)
1,598 1,438
Non-current assets*:Greater China 39,529 32,797Southeast Asia 16,211 14,432United Kingdom 1,042 828Rest of the world 1,247 1,151
58,029 49,208
Excluding financial instruments, deferred tax assets and pension assets.*
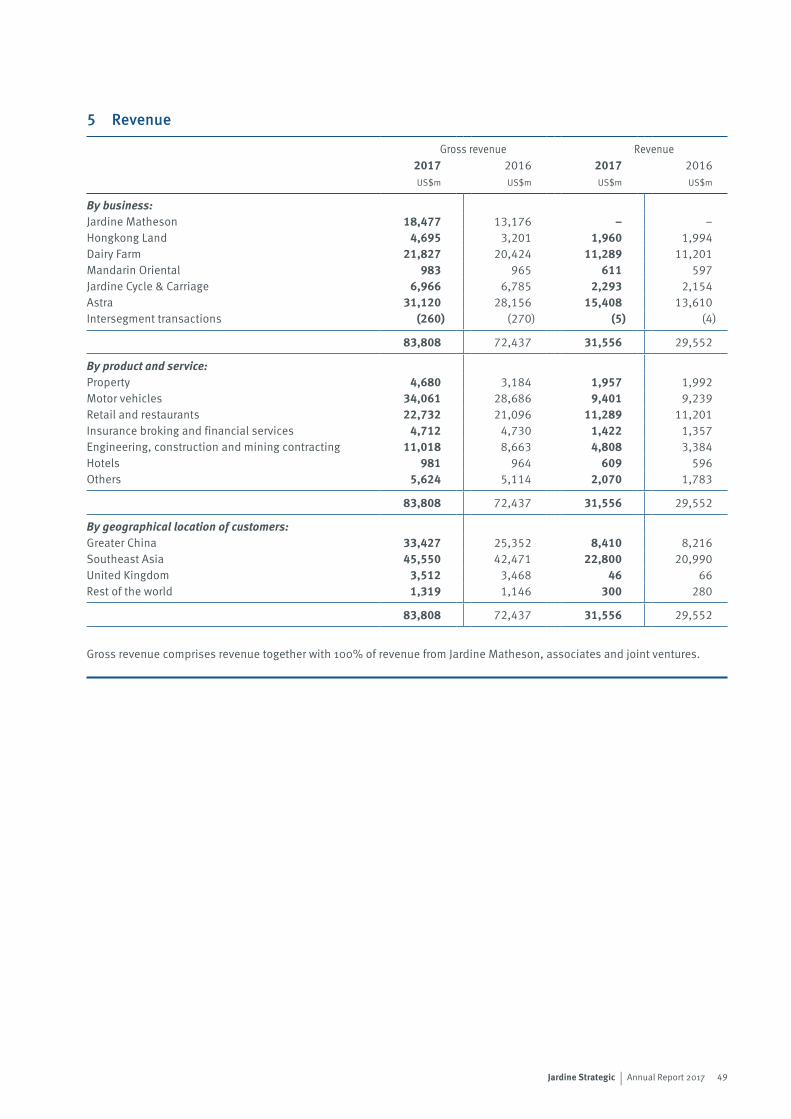
49Jardine Strategic | Annual Report 2017
5 Revenue
Gross revenue Revenue2017 2016 2017 2016US$m US$m US$m US$m
By business:Jardine Matheson 18,477 13,176 – –Hongkong Land 4,695 3,201 1,960 1,994Dairy Farm 21,827 20,424 11,289 11,201Mandarin Oriental 983 965 611 597Jardine Cycle & Carriage 6,966 6,785 2,293 2,154Astra 31,120 28,156 15,408 13,610Intersegment transactions (260) (270) (5) (4)
83,808 72,437 31,556 29,552
By product and service:Property 4,680 3,184 1,957 1,992Motor vehicles 34,061 28,686 9,401 9,239Retail and restaurants 22,732 21,096 11,289 11,201Insurance broking and financial services 4,712 4,730 1,422 1,357Engineering, construction and mining contracting 11,018 8,663 4,808 3,384Hotels 981 964 609 596Others 5,624 5,114 2,070 1,783
83,808 72,437 31,556 29,552
By geographical location of customers:Greater China 33,427 25,352 8,410 8,216Southeast Asia 45,550 42,471 22,800 20,990United Kingdom 3,512 3,468 46 66Rest of the world 1,319 1,146 300 280
83,808 72,437 31,556 29,552
Gross revenue comprises revenue together with 100% of revenue from Jardine Matheson, associates and joint ventures.
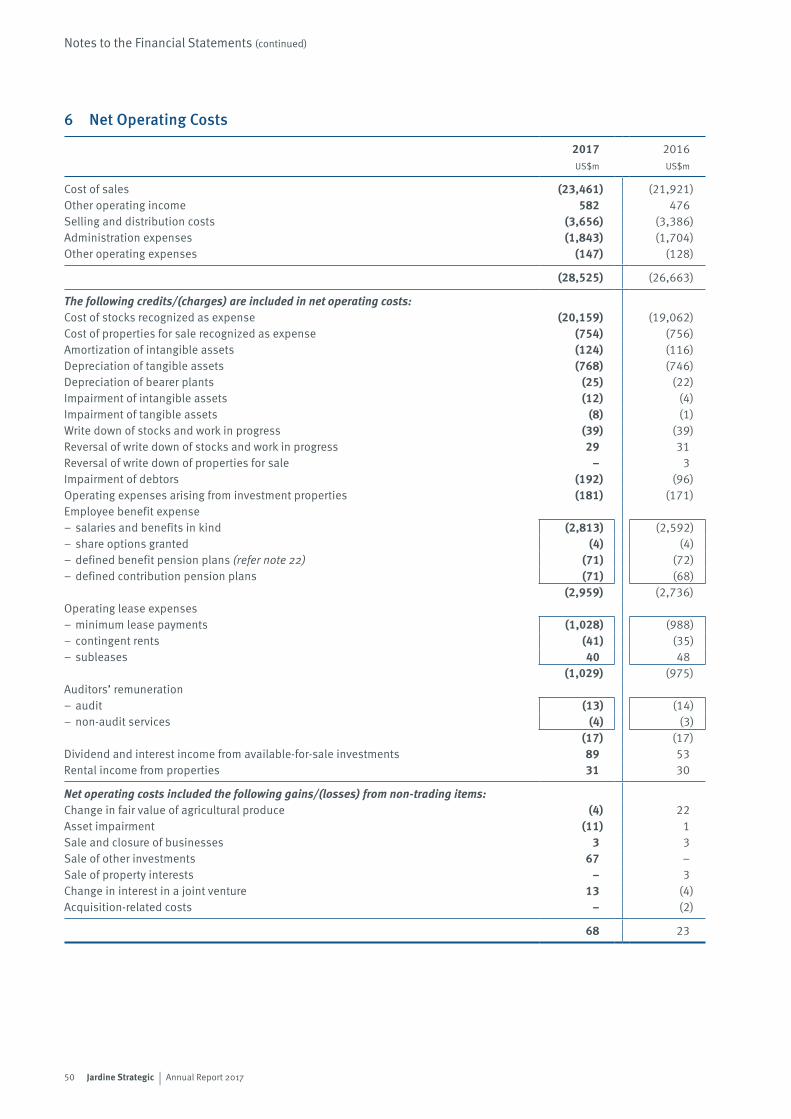
50 Jardine Strategic | Annual Report 2017
Notes to the Financial Statements (continued)
6 Net Operating Costs
2017 2016US$m US$m
Cost of sales (23,461) (21,921)Other operating income 582 476Selling and distribution costs (3,656) (3,386)Administration expenses (1,843) (1,704)Other operating expenses (147) (128)
(28,525) (26,663)
The following credits/(charges) are included in net operating costs:Cost of stocks recognized as expense (20,159) (19,062)Cost of properties for sale recognized as expense (754) (756)Amortization of intangible assets (124) (116)Depreciation of tangible assets (768) (746)Depreciation of bearer plants (25) (22)Impairment of intangible assets (12) (4)Impairment of tangible assets (8) (1)Write down of stocks and work in progress (39) (39)Reversal of write down of stocks and work in progress 29 31Reversal of write down of properties for sale – 3Impairment of debtors (192) (96)Operating expenses arising from investment properties (181) (171)Employee benefit expense– salaries and benefits in kind (2,813) (2,592)– share options granted (4) (4)– defined benefit pension plans (refer note 22) (71) (72)– defined contribution pension plans (71) (68)
(2,959) (2,736)Operating lease expenses– minimum lease payments (1,028) (988)– contingent rents (41) (35)– subleases 40 48
(1,029) (975)Auditors’ remuneration– audit (13) (14)– non-audit services (4) (3)
(17) (17)Dividend and interest income from available-for-sale investments 89 53Rental income from properties 31 30
Net operating costs included the following gains/(losses) from non-trading items:Change in fair value of agricultural produce (4) 22Asset impairment (11) 1Sale and closure of businesses 3 3Sale of other investments 67 –Sale of property interests – 3Change in interest in a joint venture 13 (4)Acquisition-related costs – (2)
68 23
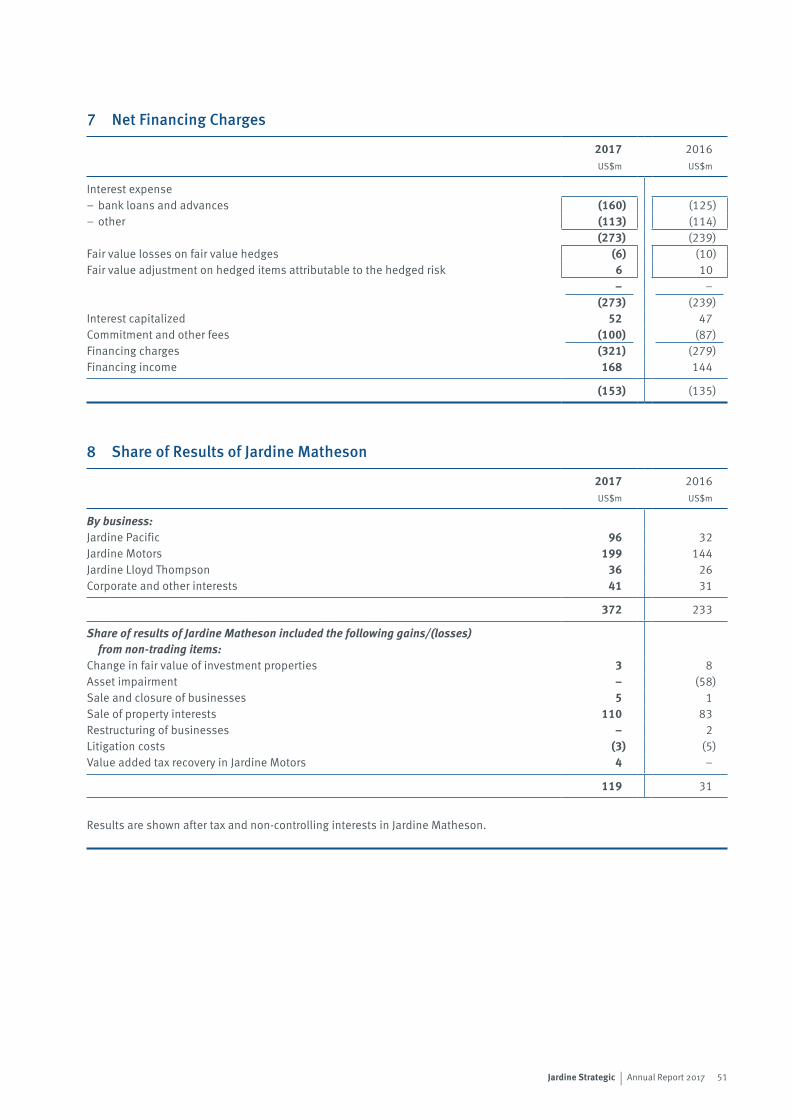
51Jardine Strategic | Annual Report 2017
7 Net Financing Charges
2017 2016US$m US$m
Interest expense– bank loans and advances (160) (125)– other (113) (114)
(273) (239)Fair value losses on fair value hedges (6) (10)Fair value adjustment on hedged items attributable to the hedged risk 6 10
– –(273) (239)
Interest capitalized 52 47Commitment and other fees (100) (87)Financing charges (321) (279)Financing income 168 144
(153) (135)
8 Share of Results of Jardine Matheson
2017 2016US$m US$m
By business:Jardine Pacific 96 32Jardine Motors 199 144Jardine Lloyd Thompson 36 26Corporate and other interests 41 31
372 233
Share of results of Jardine Matheson included the following gains/(losses) from non-trading items:
Change in fair value of investment properties 3 8Asset impairment – (58)Sale and closure of businesses 5 1Sale of property interests 110 83Restructuring of businesses – 2Litigation costs (3) (5)Value added tax recovery in Jardine Motors 4 –
119 31
Results are shown after tax and non-controlling interests in Jardine Matheson.
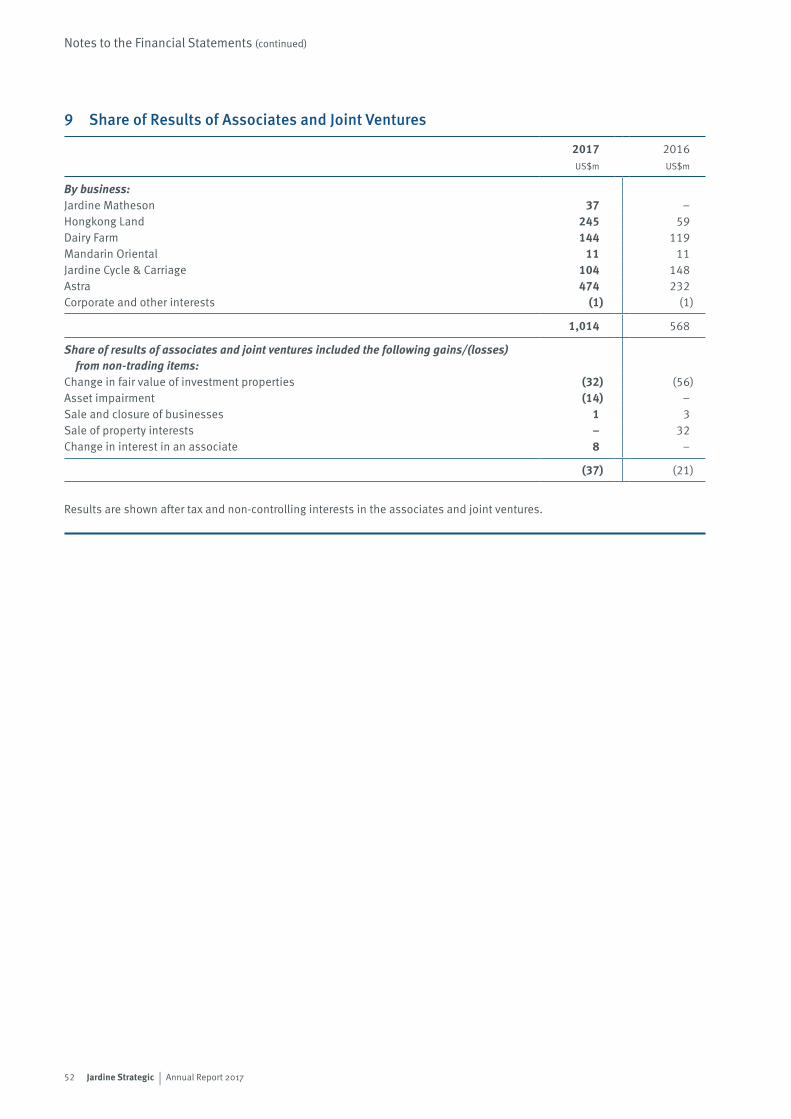
52 Jardine Strategic | Annual Report 2017
Notes to the Financial Statements (continued)
9 Share of Results of Associates and Joint Ventures
2017 2016US$m US$m
By business:Jardine Matheson 37 –Hongkong Land 245 59Dairy Farm 144 119Mandarin Oriental 11 11Jardine Cycle & Carriage 104 148Astra 474 232Corporate and other interests (1) (1)
1,014 568
Share of results of associates and joint ventures included the following gains/(losses) from non-trading items:
Change in fair value of investment properties (32) (56)Asset impairment (14) –Sale and closure of businesses 1 3Sale of property interests – 32Change in interest in an associate 8 –
(37) (21)
Results are shown after tax and non-controlling interests in the associates and joint ventures.
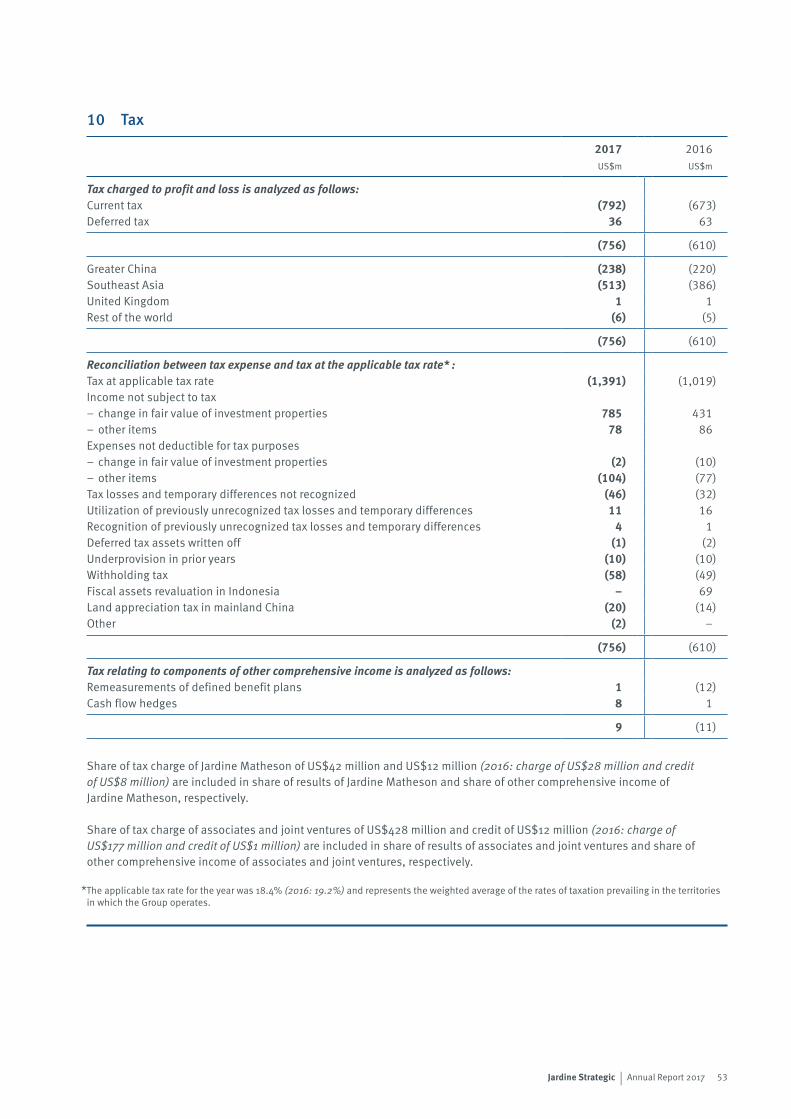
53Jardine Strategic | Annual Report 2017
10 Tax
2017 2016US$m US$m
Tax charged to profit and loss is analyzed as follows:Current tax (792) (673)Deferred tax 36 63
(756) (610)
Greater China (238) (220)Southeast Asia (513) (386)United Kingdom 1 1Rest of the world (6) (5)
(756) (610)
Reconciliation between tax expense and tax at the applicable tax rate* :Tax at applicable tax rate (1,391) (1,019)Income not subject to tax– change in fair value of investment properties 785 431– other items 78 86Expenses not deductible for tax purposes– change in fair value of investment properties (2) (10)– other items (104) (77)Tax losses and temporary differences not recognized (46) (32)Utilization of previously unrecognized tax losses and temporary differences 11 16Recognition of previously unrecognized tax losses and temporary differences 4 1Deferred tax assets written off (1) (2)Underprovision in prior years (10) (10)Withholding tax (58) (49)Fiscal assets revaluation in Indonesia – 69Land appreciation tax in mainland China (20) (14)Other (2) –
(756) (610)
Tax relating to components of other comprehensive income is analyzed as follows:Remeasurements of defined benefit plans 1 (12)Cash flow hedges 8 1
9 (11)
Share of tax charge of Jardine Matheson of US$42 million and US$12 million (2016: charge of US$28 million and credit of US$8 million) are included in share of results of Jardine Matheson and share of other comprehensive income of Jardine Matheson, respectively.
Share of tax charge of associates and joint ventures of US$428 million and credit of US$12 million (2016: charge of US$177 million and credit of US$1 million) are included in share of results of associates and joint ventures and share of other comprehensive income of associates and joint ventures, respectively.
The applicable tax rate for the year was 18.4% (2016: 19.2%) and represents the weighted average of the rates of taxation prevailing in the territories in which the Group operates.
*
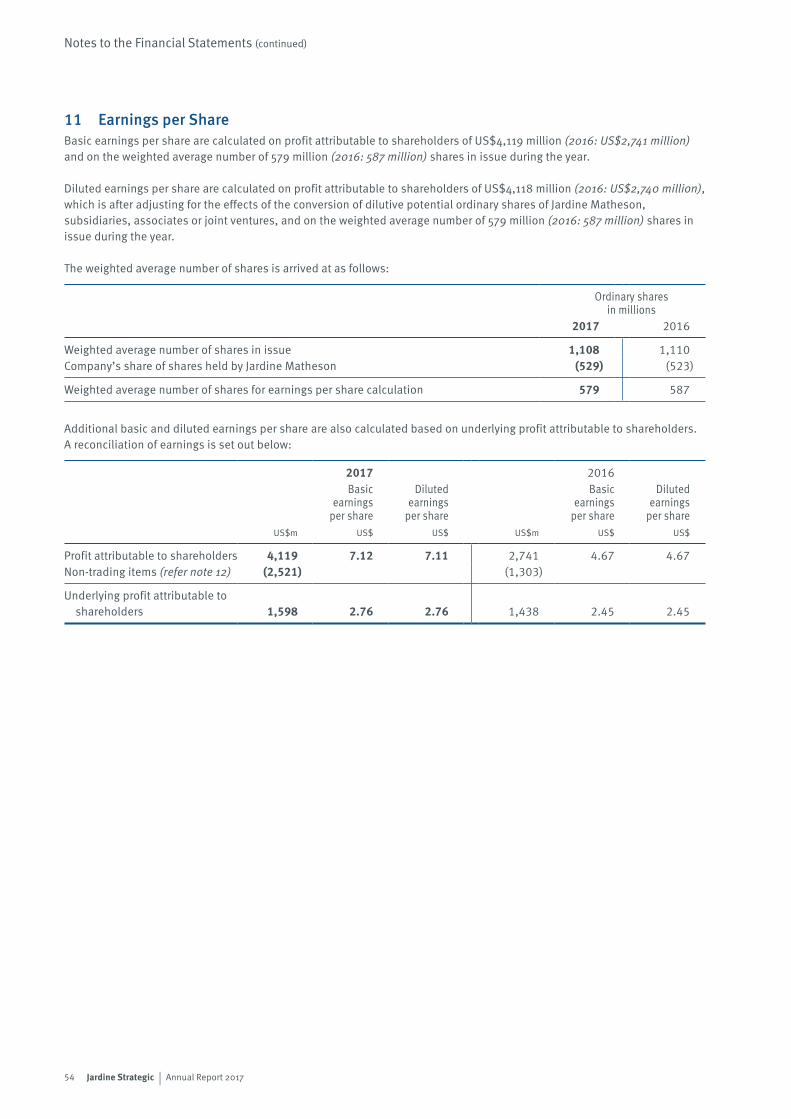
54 Jardine Strategic | Annual Report 2017
Notes to the Financial Statements (continued)
11 Earnings per ShareBasic earnings per share are calculated on profit attributable to shareholders of US$4,119 million (2016: US$2,741 million) and on the weighted average number of 579 million (2016: 587 million) shares in issue during the year.
Diluted earnings per share are calculated on profit attributable to shareholders of US$4,118 million (2016: US$2,740 million), which is after adjusting for the effects of the conversion of dilutive potential ordinary shares of Jardine Matheson, subsidiaries, associates or joint ventures, and on the weighted average number of 579 million (2016: 587 million) shares in issue during the year.
The weighted average number of shares is arrived at as follows:
Ordinary sharesin millions
2017 2016
Weighted average number of shares in issue 1,108 1,110Company’s share of shares held by Jardine Matheson (529) (523)
Weighted average number of shares for earnings per share calculation 579 587
Additional basic and diluted earnings per share are also calculated based on underlying profit attributable to shareholders. A reconciliation of earnings is set out below:
2017 2016Basic
earningsper share
Dilutedearnings
per share
Basicearnings
per share
Dilutedearnings
per shareUS$m US$ US$ US$m US$ US$
Profit attributable to shareholders 4,119 7.12 7.11 2,741 4.67 4.67Non-trading items (refer note 12) (2,521) (1,303)
Underlying profit attributable to shareholders 1,598 2.76 2.76 1,438 2.45 2.45
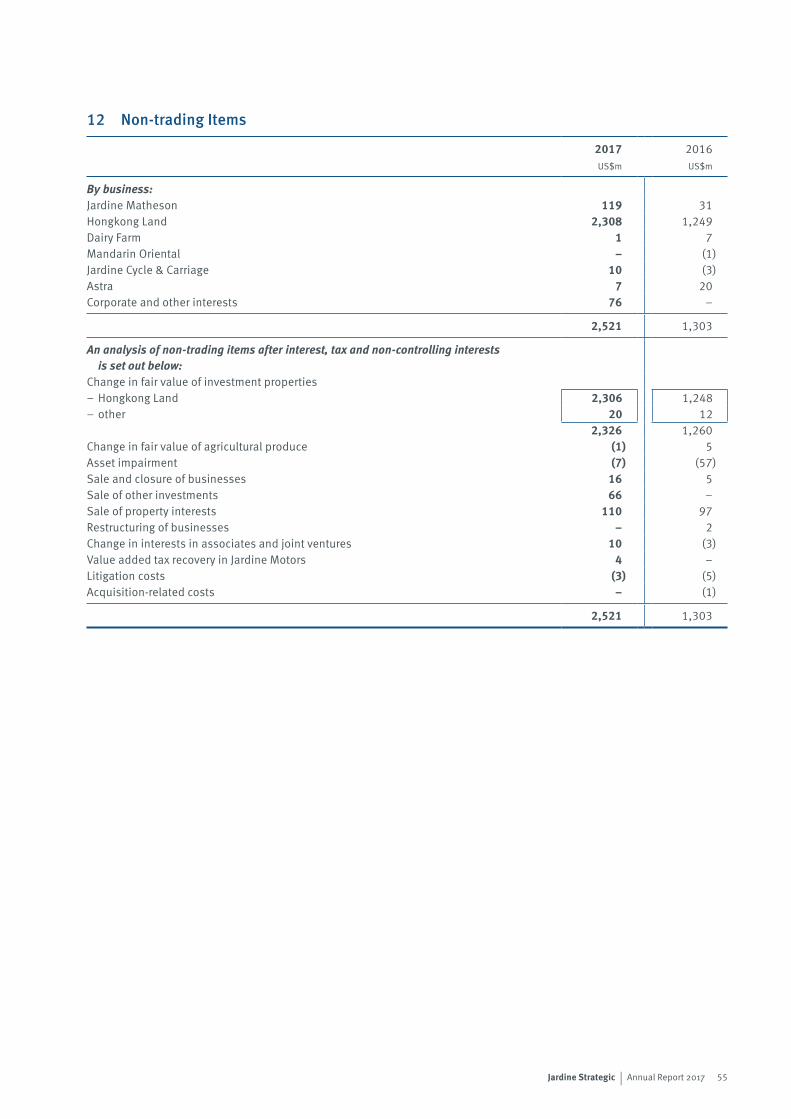
55Jardine Strategic | Annual Report 2017
12 Non-trading Items
2017 2016US$m US$m
By business:Jardine Matheson 119 31Hongkong Land 2,308 1,249Dairy Farm 1 7Mandarin Oriental – (1)Jardine Cycle & Carriage 10 (3)Astra 7 20Corporate and other interests 76 –
2,521 1,303
An analysis of non-trading items after interest, tax and non-controlling interests is set out below:
Change in fair value of investment properties– Hongkong Land 2,306 1,248– other 20 12
2,326 1,260Change in fair value of agricultural produce (1) 5Asset impairment (7) (57)Sale and closure of businesses 16 5Sale of other investments 66 –Sale of property interests 110 97Restructuring of businesses – 2Change in interests in associates and joint ventures 10 (3)Value added tax recovery in Jardine Motors 4 –Litigation costs (3) (5)Acquisition-related costs – (1)
2,521 1,303
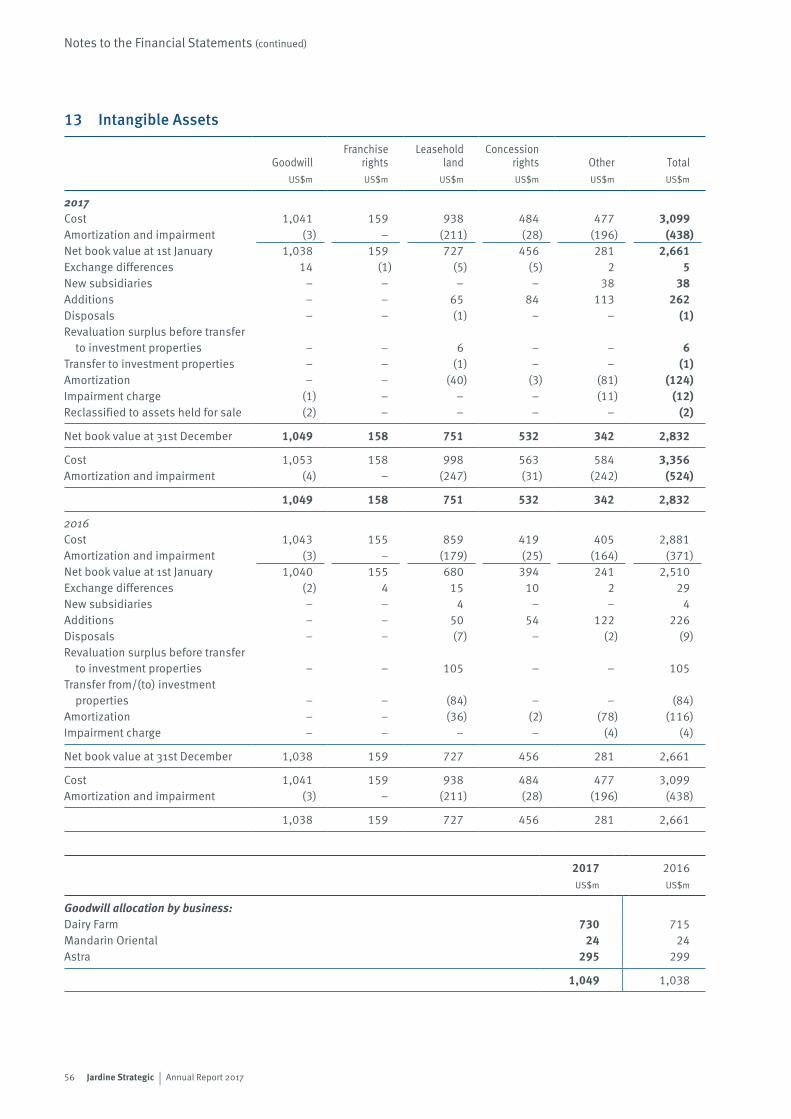
56 Jardine Strategic | Annual Report 2017
Notes to the Financial Statements (continued)
13 Intangible Assets
GoodwillFranchise
rightsLeasehold
landConcession
rights Other TotalUS$m US$m US$m US$m US$m US$m
2017Cost 1,041 159 938 484 477 3,099Amortization and impairment (3) – (211) (28) (196) (438)Net book value at 1st January 1,038 159 727 456 281 2,661Exchange differences 14 (1) (5) (5) 2 5New subsidiaries – – – – 38 38Additions – – 65 84 113 262Disposals – – (1) – – (1)Revaluation surplus before transfer
to investment properties – – 6 – – 6Transfer to investment properties – – (1) – – (1)Amortization – – (40) (3) (81) (124)Impairment charge (1) – – – (11) (12)Reclassified to assets held for sale (2) – – – – (2)
Net book value at 31st December 1,049 158 751 532 342 2,832
Cost 1,053 158 998 563 584 3,356Amortization and impairment (4) – (247) (31) (242) (524)
1,049 158 751 532 342 2,832
2016Cost 1,043 155 859 419 405 2,881Amortization and impairment (3) – (179) (25) (164) (371)Net book value at 1st January 1,040 155 680 394 241 2,510Exchange differences (2) 4 15 10 2 29New subsidiaries – – 4 – – 4Additions – – 50 54 122 226Disposals – – (7) – (2) (9)Revaluation surplus before transfer
to investment properties – – 105 – – 105Transfer from/(to) investment
properties – – (84) – – (84)Amortization – – (36) (2) (78) (116)Impairment charge – – – – (4) (4)
Net book value at 31st December 1,038 159 727 456 281 2,661
Cost 1,041 159 938 484 477 3,099Amortization and impairment (3) – (211) (28) (196) (438)
1,038 159 727 456 281 2,661
2017 2016US$m US$m
Goodwill allocation by business:Dairy Farm 730 715Mandarin Oriental 24 24Astra 295 299
1,049 1,038
57Jardine Strategic | Annual Report 2017
13 Intangible Assets (continued)
Goodwill relating to Dairy Farm is allocated to groups of cash-generating units identified by banners or group of stores acquired in each geographical segment. Cash flow projections for impairment reviews are based on budgets prepared on the basis of assumptions reflective of the prevailing market conditions, and are discounted appropriately. Key assumptions used for value-in-use calculations for significant balances of goodwill include budgeted gross margins between 21% and 30% and average growth rate between 2% to 4% to project cash flows, which vary across the group’s business segments and geographical locations, over a five-year period and thereafter, and are based on management expectations for the market development; and pre-tax discount rates between 5% and 13% applied to the cash flow projections. The discount rates used reflect business specific risks relating to the relevant industry, business life-cycle and geographical location. On the basis of these reviews, management concluded that no impairment exists.
Goodwill relating to Astra represents goodwill arising from acquisition of shares in Astra which is regarded as an operating segment. Accordingly, for the purpose of impairment review, the carrying value of Astra is compared with the recoverable amount measured by reference to the quoted market price of the shares held. On the basis of this review and the continued expected level of profitability, management concluded that no impairment has occurred.
Franchise rights are rights under franchise agreements with automobile and heavy equipment manufacturers. These franchise agreements are deemed to have indefinite lives because either they do not have any term of expiry or their renewal would be probable and would not involve significant costs, taking into account the history of renewal and the relationships between the franchisee and the contracting parties. The carrying amounts of franchise rights, which included automotive of US$56 million and heavy equipment of US$100 million, are not amortized as such rights will contribute cash flows for an indefinite period. Management has performed an impairment review of the carrying amounts of franchise rights at 31st December 2017 and has concluded that no impairment has occurred. The impairment review was made by comparing the carrying amounts of the cash-generating units in which the franchise rights reside with the recoverable amounts of the cash-generating units. The recoverable amounts of the cash-generating units are determined based on value-in-use calculations. These calculations use pre-tax cash flow projections based on budgets covering a three-year period. Cash flows beyond the three-year period are extrapolated using growth rates between 3% and 4%. Pre-tax discount rates between 14% and 16%, reflecting business specific risks, are applied to the cash flow projections.
Other intangible assets comprise trademarks, computer software, hotel development costs, deferred acquisition costs for insurance contracts and customer contracts.
At 31st December 2017, the carrying amount of leasehold land pledged as security for borrowings amounted to US$4 million (2016: US$4 million) (refer note 31).
The amortization charges are all recognized in arriving at operating profit and are included in cost of sales, selling and distribution costs and administration expenses.
The remaining amortization periods for intangible assets are as follows:
Leasehold land up to 83 yearsConcession rights by traffic volume over 38 to 42 yearsComputer software up to 7 yearsOther various
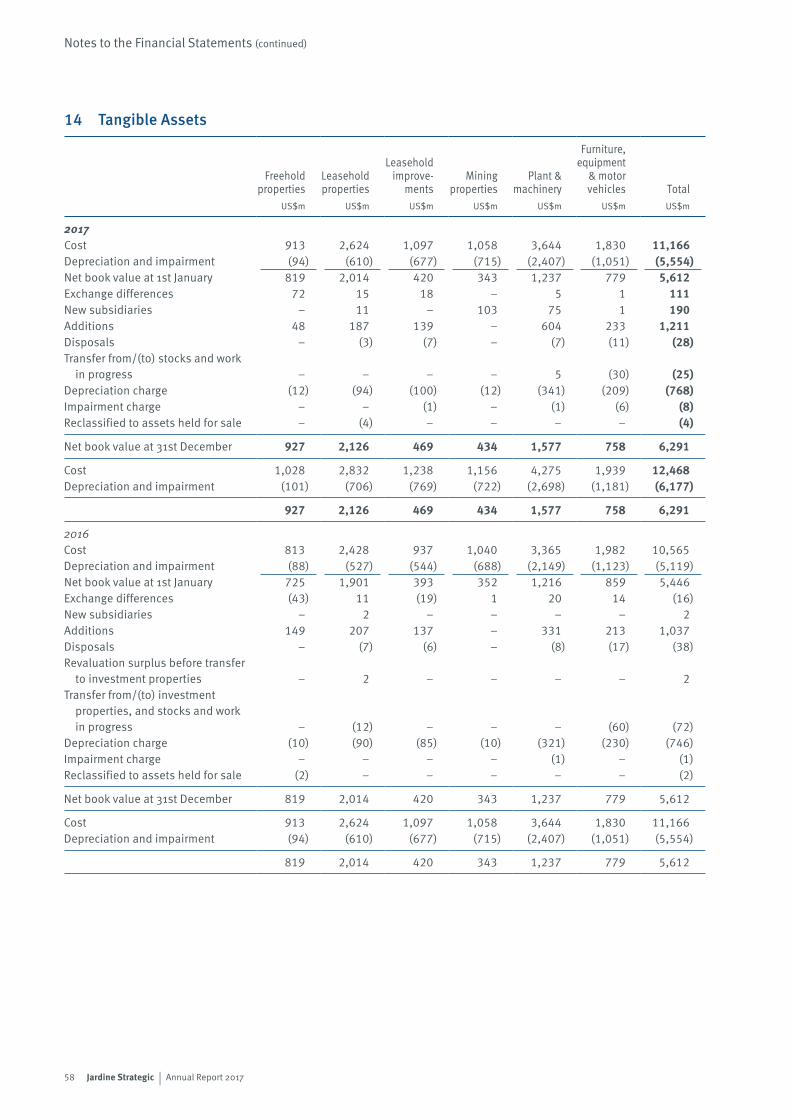
58 Jardine Strategic | Annual Report 2017
Notes to the Financial Statements (continued)
14 Tangible Assets
Freehold properties
Leasehold properties
Leasehold improve-
mentsMining
propertiesPlant &
machinery
Furniture, equipment
& motor vehicles Total
US$m US$m US$m US$m US$m US$m US$m
2017Cost 913 2,624 1,097 1,058 3,644 1,830 11,166Depreciation and impairment (94) (610) (677) (715) (2,407) (1,051) (5,554)Net book value at 1st January 819 2,014 420 343 1,237 779 5,612Exchange differences 72 15 18 – 5 1 111New subsidiaries – 11 – 103 75 1 190Additions 48 187 139 – 604 233 1,211Disposals – (3) (7) – (7) (11) (28)Transfer from/(to) stocks and work
in progress – – – – 5 (30) (25)Depreciation charge (12) (94) (100) (12) (341) (209) (768)Impairment charge – – (1) – (1) (6) (8)Reclassified to assets held for sale – (4) – – – – (4)
Net book value at 31st December 927 2,126 469 434 1,577 758 6,291
Cost 1,028 2,832 1,238 1,156 4,275 1,939 12,468Depreciation and impairment (101) (706) (769) (722) (2,698) (1,181) (6,177)
927 2,126 469 434 1,577 758 6,291
2016Cost 813 2,428 937 1,040 3,365 1,982 10,565Depreciation and impairment (88) (527) (544) (688) (2,149) (1,123) (5,119)Net book value at 1st January 725 1,901 393 352 1,216 859 5,446Exchange differences (43) 11 (19) 1 20 14 (16)New subsidiaries – 2 – – – – 2Additions 149 207 137 – 331 213 1,037Disposals – (7) (6) – (8) (17) (38)Revaluation surplus before transfer
to investment properties – 2 – – – – 2Transfer from/(to) investment
properties, and stocks and work in progress – (12) – – – (60) (72)
Depreciation charge (10) (90) (85) (10) (321) (230) (746)Impairment charge – – – – (1) – (1)Reclassified to assets held for sale (2) – – – – – (2)
Net book value at 31st December 819 2,014 420 343 1,237 779 5,612
Cost 913 2,624 1,097 1,058 3,644 1,830 11,166Depreciation and impairment (94) (610) (677) (715) (2,407) (1,051) (5,554)
819 2,014 420 343 1,237 779 5,612
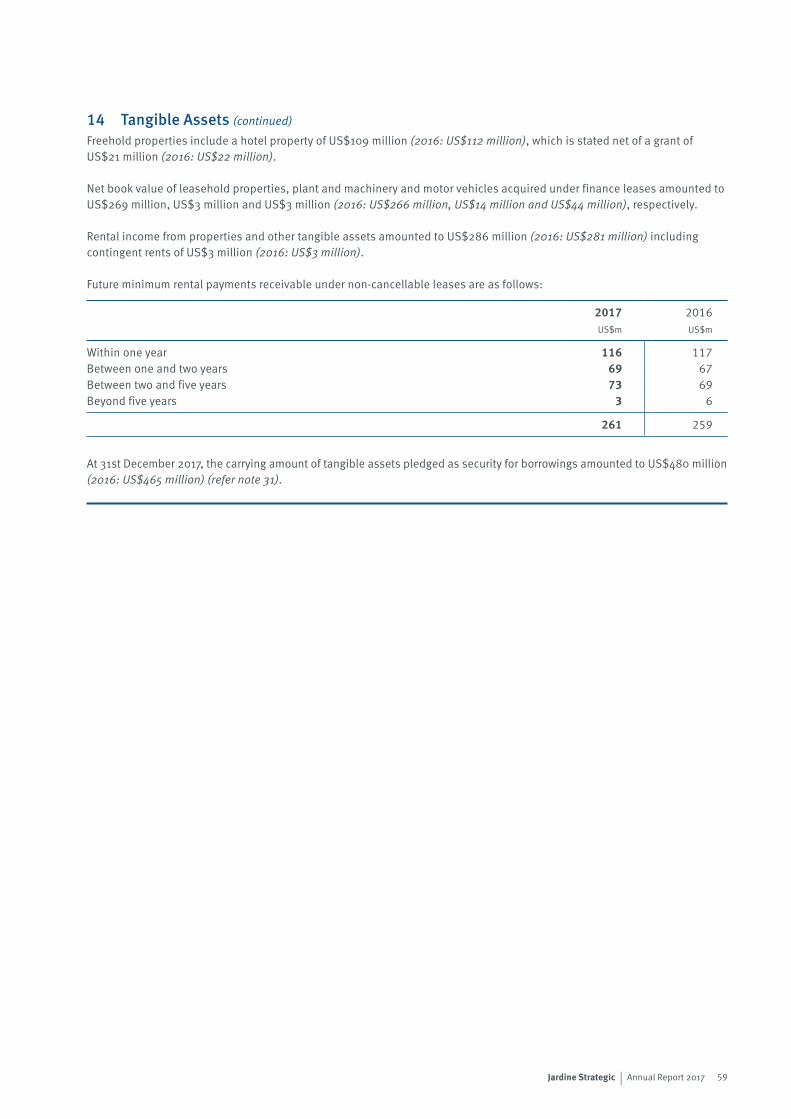
59Jardine Strategic | Annual Report 2017
14 Tangible Assets (continued)
Freehold properties include a hotel property of US$109 million (2016: US$112 million), which is stated net of a grant of US$21 million (2016: US$22 million).
Net book value of leasehold properties, plant and machinery and motor vehicles acquired under finance leases amounted to US$269 million, US$3 million and US$3 million (2016: US$266 million, US$14 million and US$44 million), respectively.
Rental income from properties and other tangible assets amounted to US$286 million (2016: US$281 million) including contingent rents of US$3 million (2016: US$3 million).
Future minimum rental payments receivable under non-cancellable leases are as follows:
2017 2016US$m US$m
Within one year 116 117Between one and two years 69 67Between two and five years 73 69Beyond five years 3 6
261 259
At 31st December 2017, the carrying amount of tangible assets pledged as security for borrowings amounted to US$480 million (2016: US$465 million) (refer note 31).
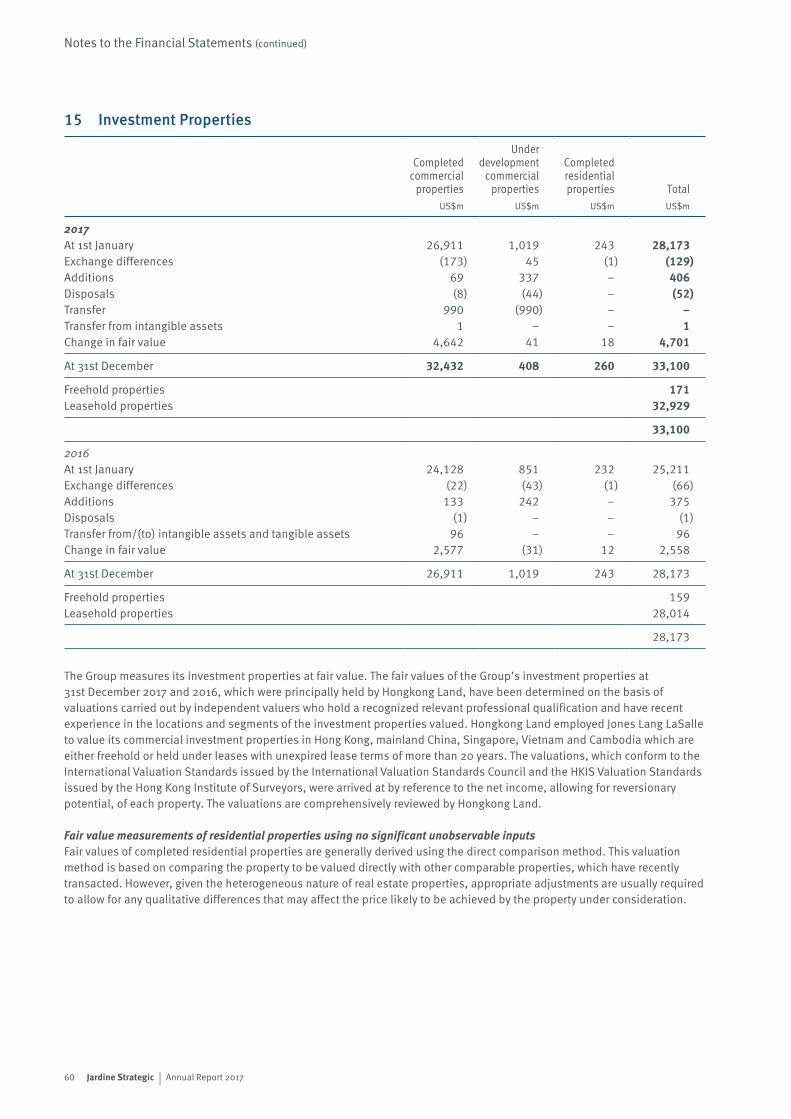
60 Jardine Strategic | Annual Report 2017
Notes to the Financial Statements (continued)
15 Investment Properties
Completed commercial
properties
Under development
commercial properties
Completed residential properties Total
US$m US$m US$m US$m
2017At 1st January 26,911 1,019 243 28,173Exchange differences (173) 45 (1) (129)Additions 69 337 – 406Disposals (8) (44) – (52)Transfer 990 (990) – –Transfer from intangible assets 1 – – 1Change in fair value 4,642 41 18 4,701
At 31st December 32,432 408 260 33,100
Freehold properties 171Leasehold properties 32,929
33,100
2016At 1st January 24,128 851 232 25,211Exchange differences (22) (43) (1) (66)Additions 133 242 – 375Disposals (1) – – (1)Transfer from/(to) intangible assets and tangible assets 96 – – 96Change in fair value 2,577 (31) 12 2,558
At 31st December 26,911 1,019 243 28,173
Freehold properties 159Leasehold properties 28,014
28,173
The Group measures its investment properties at fair value. The fair values of the Group’s investment properties at 31st December 2017 and 2016, which were principally held by Hongkong Land, have been determined on the basis of valuations carried out by independent valuers who hold a recognized relevant professional qualification and have recent experience in the locations and segments of the investment properties valued. Hongkong Land employed Jones Lang LaSalle to value its commercial investment properties in Hong Kong, mainland China, Singapore, Vietnam and Cambodia which are either freehold or held under leases with unexpired lease terms of more than 20 years. The valuations, which conform to the International Valuation Standards issued by the International Valuation Standards Council and the HKIS Valuation Standards issued by the Hong Kong Institute of Surveyors, were arrived at by reference to the net income, allowing for reversionary potential, of each property. The valuations are comprehensively reviewed by Hongkong Land.
Fair value measurements of residential properties using no significant unobservable inputsFair values of completed residential properties are generally derived using the direct comparison method. This valuation method is based on comparing the property to be valued directly with other comparable properties, which have recently transacted. However, given the heterogeneous nature of real estate properties, appropriate adjustments are usually required to allow for any qualitative differences that may affect the price likely to be achieved by the property under consideration.
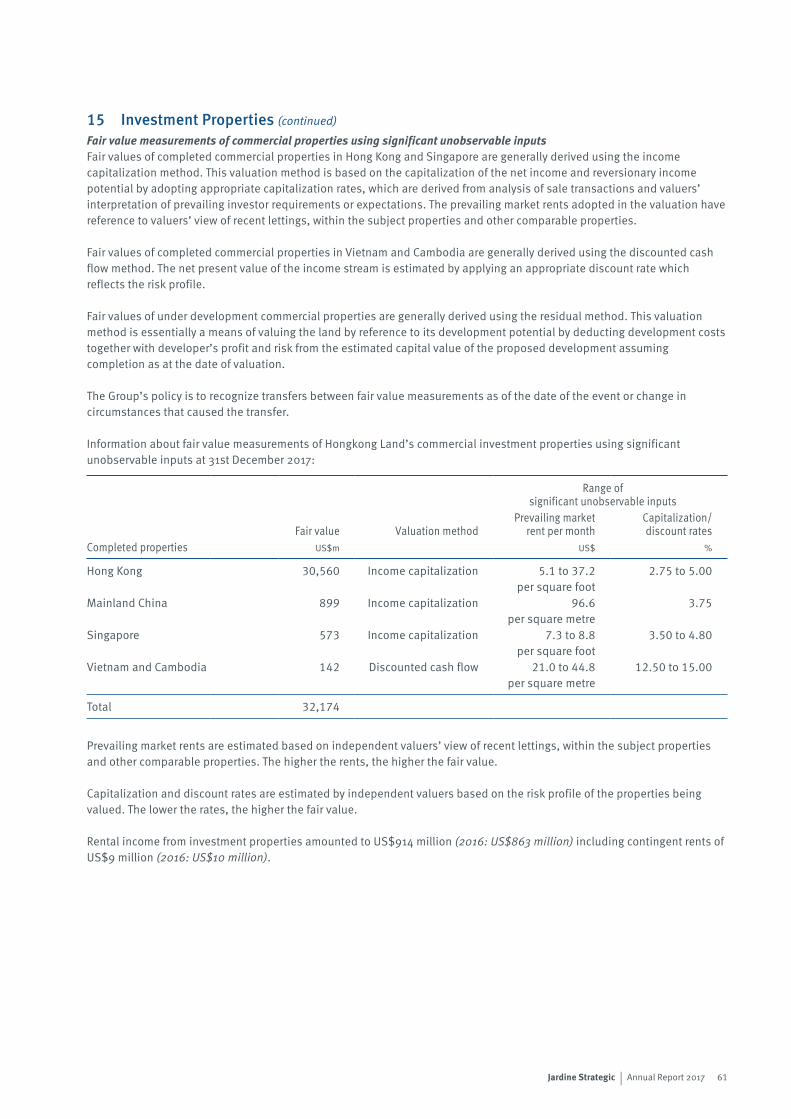
61Jardine Strategic | Annual Report 2017
15 Investment Properties (continued)
Fair value measurements of commercial properties using significant unobservable inputsFair values of completed commercial properties in Hong Kong and Singapore are generally derived using the income capitalization method. This valuation method is based on the capitalization of the net income and reversionary income potential by adopting appropriate capitalization rates, which are derived from analysis of sale transactions and valuers’ interpretation of prevailing investor requirements or expectations. The prevailing market rents adopted in the valuation have reference to valuers’ view of recent lettings, within the subject properties and other comparable properties.
Fair values of completed commercial properties in Vietnam and Cambodia are generally derived using the discounted cash flow method. The net present value of the income stream is estimated by applying an appropriate discount rate which reflects the risk profile.
Fair values of under development commercial properties are generally derived using the residual method. This valuation method is essentially a means of valuing the land by reference to its development potential by deducting development costs together with developer’s profit and risk from the estimated capital value of the proposed development assuming completion as at the date of valuation.
The Group’s policy is to recognize transfers between fair value measurements as of the date of the event or change in circumstances that caused the transfer.
Information about fair value measurements of Hongkong Land’s commercial investment properties using significant unobservable inputs at 31st December 2017:
Range of significant unobservable inputs
Fair value Valuation methodPrevailing market
rent per monthCapitalization/discount rates
Completed properties US$m US$ %
Hong Kong 30,560 Income capitalization 5.1 to 37.2 per square foot
2.75 to 5.00
Mainland China 899 Income capitalization 96.6 per square metre
3.75
Singapore 573 Income capitalization 7.3 to 8.8 per square foot
3.50 to 4.80
Vietnam and Cambodia 142 Discounted cash flow 21.0 to 44.8 per square metre
12.50 to 15.00
Total 32,174
Prevailing market rents are estimated based on independent valuers’ view of recent lettings, within the subject properties and other comparable properties. The higher the rents, the higher the fair value.
Capitalization and discount rates are estimated by independent valuers based on the risk profile of the properties being valued. The lower the rates, the higher the fair value.
Rental income from investment properties amounted to US$914 million (2016: US$863 million) including contingent rents of US$9 million (2016: US$10 million).
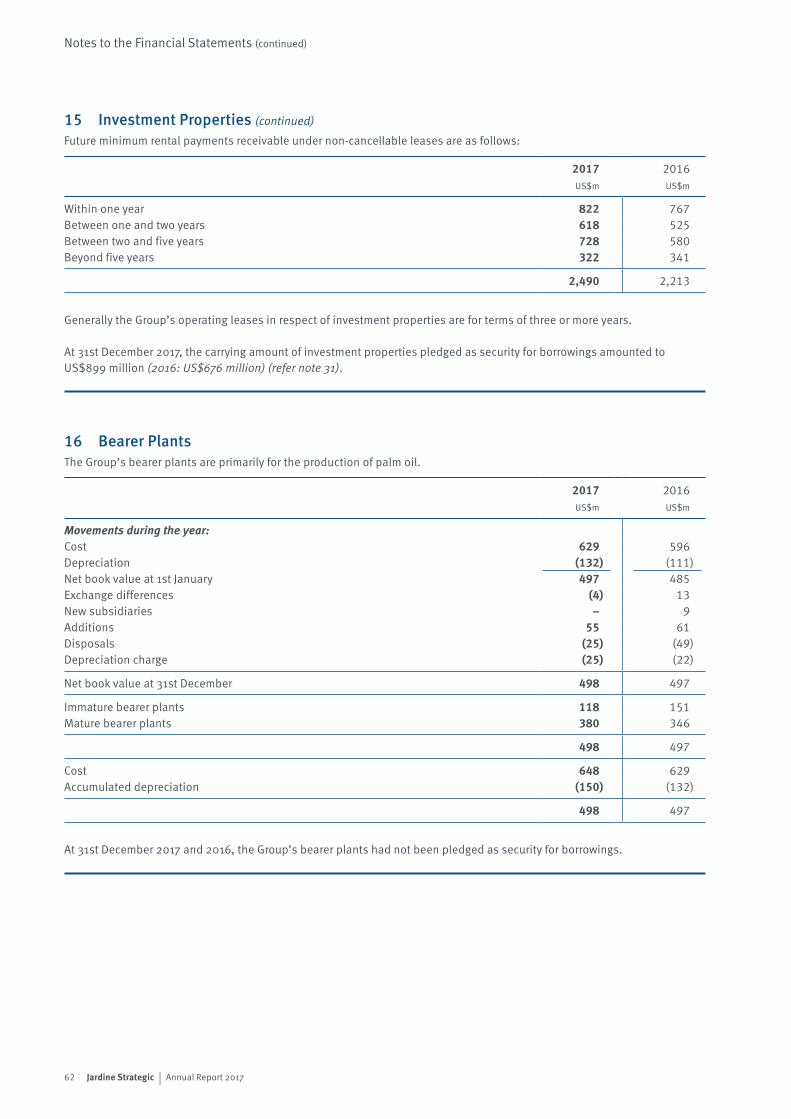
62 Jardine Strategic | Annual Report 2017
Notes to the Financial Statements (continued)
15 Investment Properties (continued)
Future minimum rental payments receivable under non-cancellable leases are as follows:
2017 2016US$m US$m
Within one year 822 767Between one and two years 618 525Between two and five years 728 580Beyond five years 322 341
2,490 2,213
Generally the Group’s operating leases in respect of investment properties are for terms of three or more years.
At 31st December 2017, the carrying amount of investment properties pledged as security for borrowings amounted to US$899 million (2016: US$676 million) (refer note 31).
16 Bearer PlantsThe Group’s bearer plants are primarily for the production of palm oil.
2017 2016US$m US$m
Movements during the year:Cost 629 596Depreciation (132) (111)Net book value at 1st January 497 485Exchange differences (4) 13New subsidiaries – 9Additions 55 61Disposals (25) (49)Depreciation charge (25) (22)
Net book value at 31st December 498 497
Immature bearer plants 118 151Mature bearer plants 380 346
498 497
Cost 648 629Accumulated depreciation (150) (132)
498 497
At 31st December 2017 and 2016, the Group’s bearer plants had not been pledged as security for borrowings.
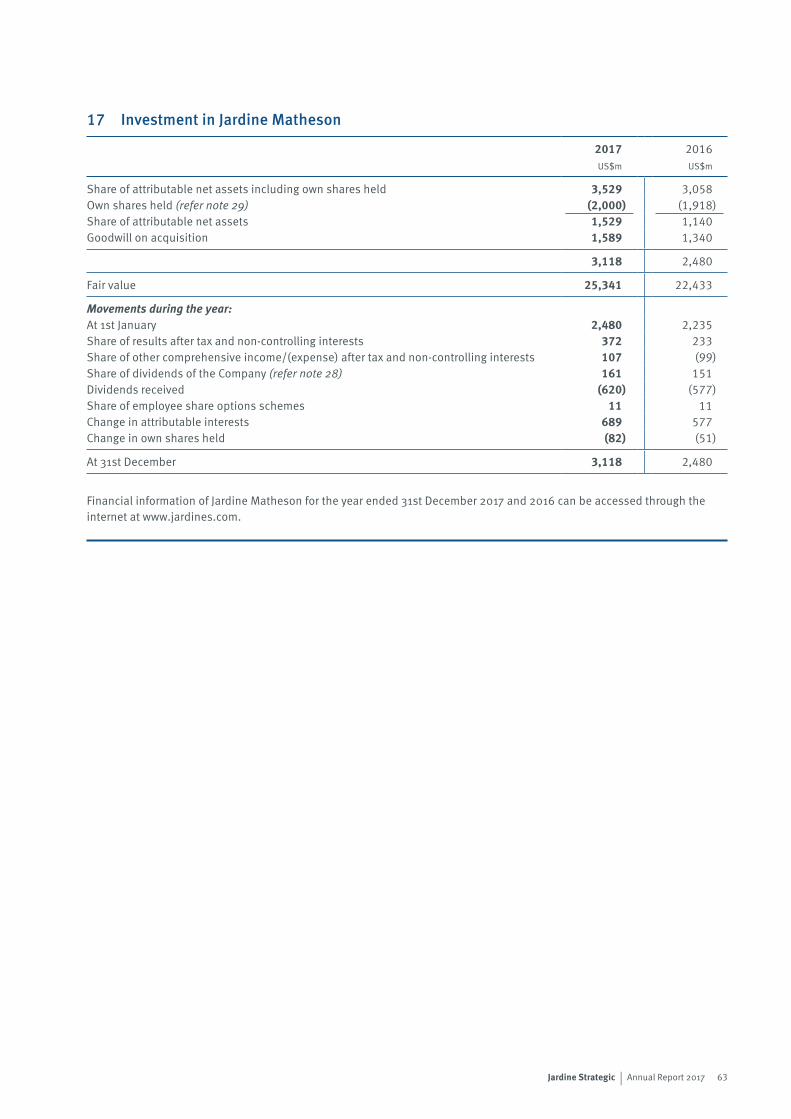
63Jardine Strategic | Annual Report 2017
17 Investment in Jardine Matheson
2017 2016US$m US$m
Share of attributable net assets including own shares held 3,529 3,058Own shares held (refer note 29) (2,000) (1,918)Share of attributable net assets 1,529 1,140Goodwill on acquisition 1,589 1,340
3,118 2,480
Fair value 25,341 22,433
Movements during the year:At 1st January 2,480 2,235Share of results after tax and non-controlling interests 372 233Share of other comprehensive income/(expense) after tax and non-controlling interests 107 (99)Share of dividends of the Company (refer note 28) 161 151Dividends received (620) (577)Share of employee share options schemes 11 11Change in attributable interests 689 577Change in own shares held (82) (51)
At 31st December 3,118 2,480
Financial information of Jardine Matheson for the year ended 31st December 2017 and 2016 can be accessed through the internet at www.jardines.com.
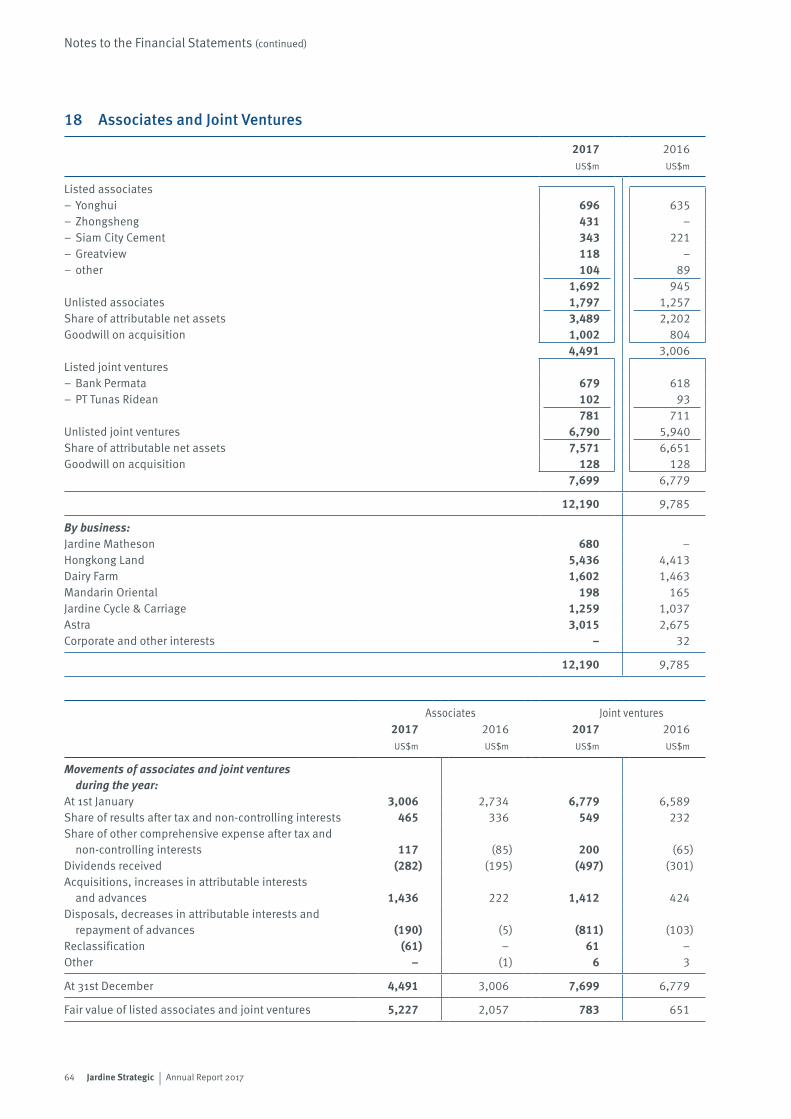
64 Jardine Strategic | Annual Report 2017
Notes to the Financial Statements (continued)
18 Associates and Joint Ventures
2017 2016US$m US$m
Listed associates– Yonghui 696 635– Zhongsheng 431 –– Siam City Cement 343 221– Greatview 118 –– other 104 89
1,692 945Unlisted associates 1,797 1,257Share of attributable net assets 3,489 2,202Goodwill on acquisition 1,002 804
4,491 3,006Listed joint ventures– Bank Permata 679 618– PT Tunas Ridean 102 93
781 711Unlisted joint ventures 6,790 5,940Share of attributable net assets 7,571 6,651Goodwill on acquisition 128 128
7,699 6,779
12,190 9,785
By business:Jardine Matheson 680 –Hongkong Land 5,436 4,413Dairy Farm 1,602 1,463Mandarin Oriental 198 165Jardine Cycle & Carriage 1,259 1,037Astra 3,015 2,675Corporate and other interests – 32
12,190 9,785
Associates Joint ventures2017 2016 2017 2016US$m US$m US$m US$m
Movements of associates and joint ventures during the year:
At 1st January 3,006 2,734 6,779 6,589Share of results after tax and non-controlling interests 465 336 549 232Share of other comprehensive expense after tax and
non-controlling interests 117 (85) 200 (65)Dividends received (282) (195) (497) (301)Acquisitions, increases in attributable interests
and advances 1,436 222 1,412 424Disposals, decreases in attributable interests and
repayment of advances (190) (5) (811) (103)Reclassification (61) – 61 –Other – (1) 6 3
At 31st December 4,491 3,006 7,699 6,779
Fair value of listed associates and joint ventures 5,227 2,057 783 651
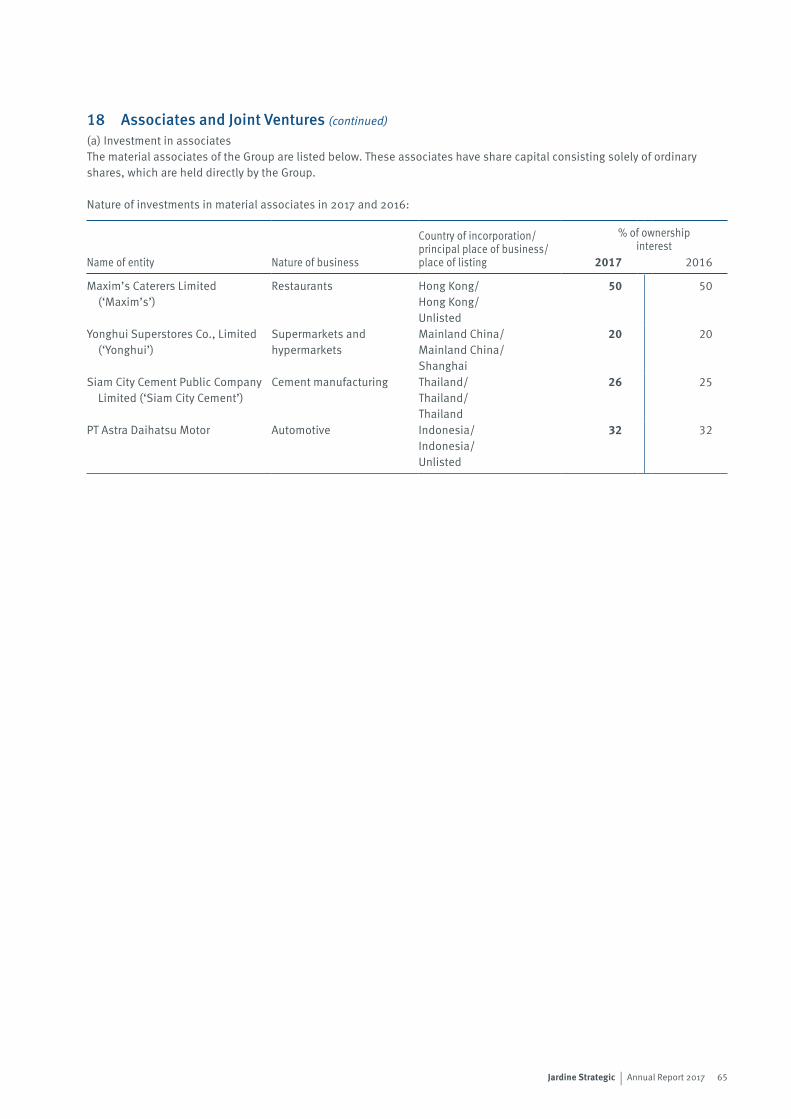
65Jardine Strategic | Annual Report 2017
18 Associates and Joint Ventures (continued)
(a) Investment in associatesThe material associates of the Group are listed below. These associates have share capital consisting solely of ordinary shares, which are held directly by the Group.
Nature of investments in material associates in 2017 and 2016:
Name of entity Nature of business
Country of incorporation/principal place of business/place of listing
% of ownershipinterest
2017 2016
Maxim’s Caterers Limited (‘Maxim’s’)
Restaurants Hong Kong/Hong Kong/Unlisted
50 50
Yonghui Superstores Co., Limited (‘Yonghui’)
Supermarkets and hypermarkets
Mainland China/Mainland China/Shanghai
20 20
Siam City Cement Public Company Limited (‘Siam City Cement’)
Cement manufacturing Thailand/Thailand/Thailand
26 25
PT Astra Daihatsu Motor Automotive Indonesia/Indonesia/Unlisted
32 32
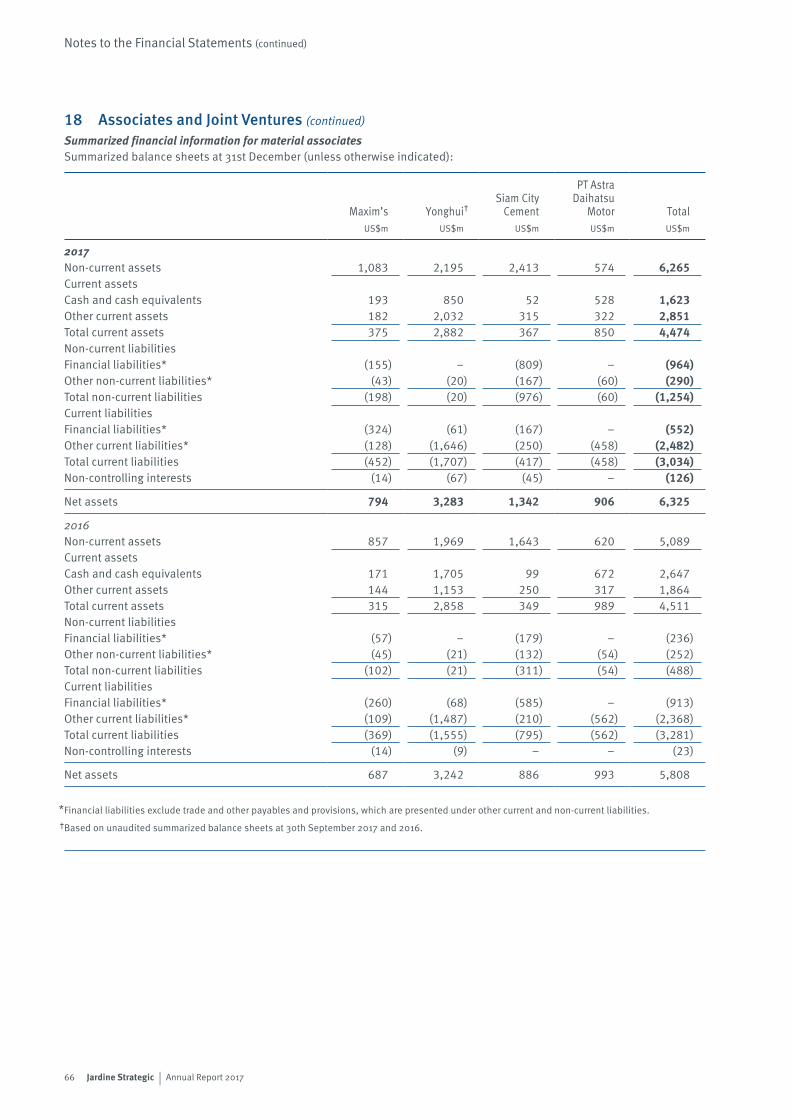
66 Jardine Strategic | Annual Report 2017
Notes to the Financial Statements (continued)
18 Associates and Joint Ventures (continued)
Summarized financial information for material associatesSummarized balance sheets at 31st December (unless otherwise indicated):
Maxim’s Yonghui†Siam City
Cement
PT AstraDaihatsu
Motor TotalUS$m US$m US$m US$m US$m
2017Non-current assets 1,083 2,195 2,413 574 6,265Current assetsCash and cash equivalents 193 850 52 528 1,623Other current assets 182 2,032 315 322 2,851Total current assets 375 2,882 367 850 4,474Non-current liabilitiesFinancial liabilities* (155) – (809) – (964)Other non-current liabilities* (43) (20) (167) (60) (290)Total non-current liabilities (198) (20) (976) (60) (1,254)Current liabilitiesFinancial liabilities* (324) (61) (167) – (552)Other current liabilities* (128) (1,646) (250) (458) (2,482)Total current liabilities (452) (1,707) (417) (458) (3,034)Non-controlling interests (14) (67) (45) – (126)
Net assets 794 3,283 1,342 906 6,325
2016Non-current assets 857 1,969 1,643 620 5,089Current assetsCash and cash equivalents 171 1,705 99 672 2,647Other current assets 144 1,153 250 317 1,864Total current assets 315 2,858 349 989 4,511Non-current liabilitiesFinancial liabilities* (57) – (179) – (236)Other non-current liabilities* (45) (21) (132) (54) (252)Total non-current liabilities (102) (21) (311) (54) (488)Current liabilitiesFinancial liabilities* (260) (68) (585) – (913)Other current liabilities* (109) (1,487) (210) (562) (2,368)Total current liabilities (369) (1,555) (795) (562) (3,281)Non-controlling interests (14) (9) – – (23)
Net assets 687 3,242 886 993 5,808
Financial liabilities exclude trade and other payables and provisions, which are presented under other current and non-current liabilities.
Based on unaudited summarized balance sheets at 30th September 2017 and 2016.
*†
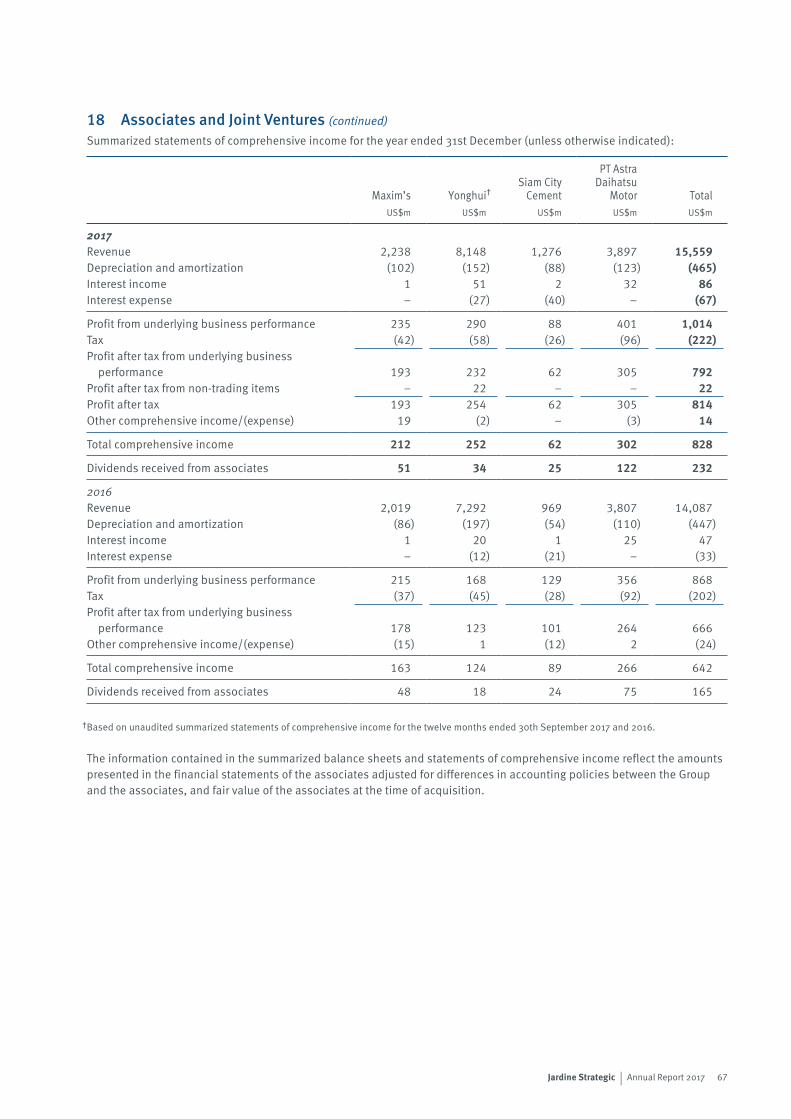
67Jardine Strategic | Annual Report 2017
18 Associates and Joint Ventures (continued)
Summarized statements of comprehensive income for the year ended 31st December (unless otherwise indicated):
Maxim’s Yonghui†Siam City
Cement
PT AstraDaihatsu
Motor TotalUS$m US$m US$m US$m US$m
2017Revenue 2,238 8,148 1,276 3,897 15,559Depreciation and amortization (102) (152) (88) (123) (465)Interest income 1 51 2 32 86Interest expense – (27) (40) – (67)
Profit from underlying business performance 235 290 88 401 1,014Tax (42) (58) (26) (96) (222)Profit after tax from underlying business
performance 193 232 62 305 792Profit after tax from non-trading items – 22 – – 22Profit after tax 193 254 62 305 814Other comprehensive income/(expense) 19 (2) – (3) 14
Total comprehensive income 212 252 62 302 828
Dividends received from associates 51 34 25 122 232
2016Revenue 2,019 7,292 969 3,807 14,087Depreciation and amortization (86) (197) (54) (110) (447)Interest income 1 20 1 25 47Interest expense – (12) (21) – (33)
Profit from underlying business performance 215 168 129 356 868Tax (37) (45) (28) (92) (202)Profit after tax from underlying business
performance 178 123 101 264 666Other comprehensive income/(expense) (15) 1 (12) 2 (24)
Total comprehensive income 163 124 89 266 642
Dividends received from associates 48 18 24 75 165
Based on unaudited summarized statements of comprehensive income for the twelve months ended 30th September 2017 and 2016.
The information contained in the summarized balance sheets and statements of comprehensive income reflect the amounts presented in the financial statements of the associates adjusted for differences in accounting policies between the Group and the associates, and fair value of the associates at the time of acquisition.
†
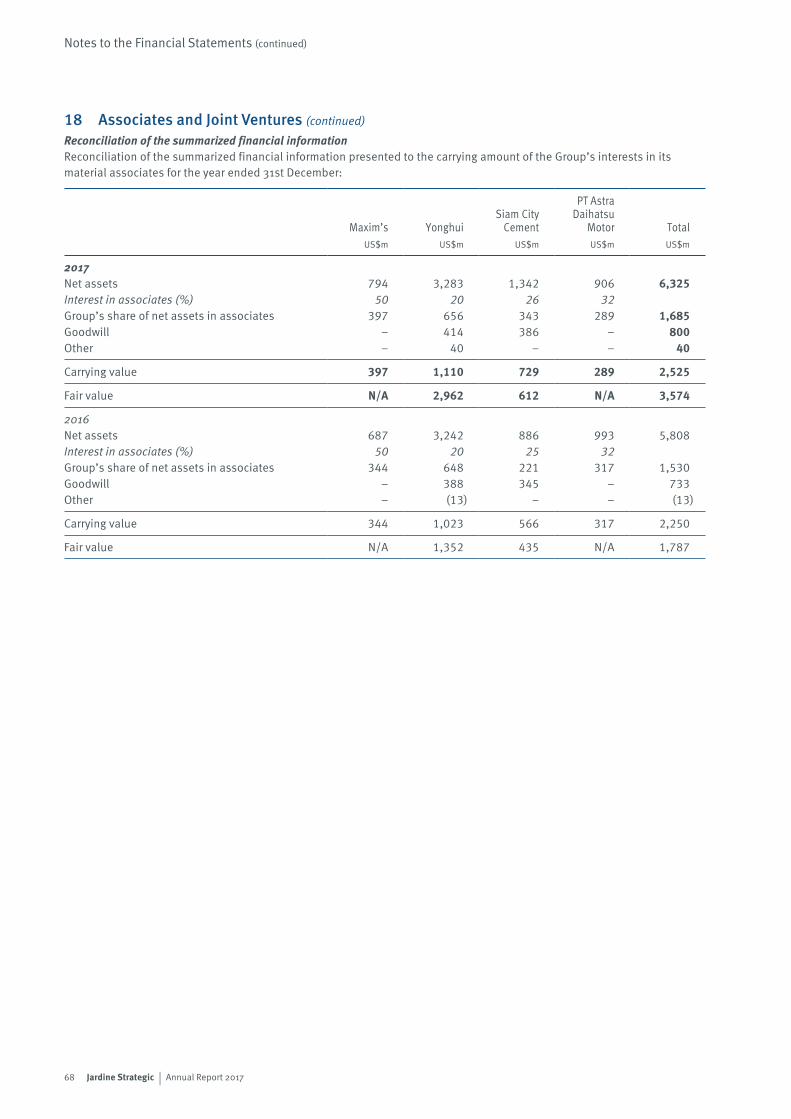
68 Jardine Strategic | Annual Report 2017
Notes to the Financial Statements (continued)
18 Associates and Joint Ventures (continued)
Reconciliation of the summarized financial informationReconciliation of the summarized financial information presented to the carrying amount of the Group’s interests in its material associates for the year ended 31st December:
Maxim’s YonghuiSiam City
Cement
PT AstraDaihatsu
Motor TotalUS$m US$m US$m US$m US$m
2017Net assets 794 3,283 1,342 906 6,325Interest in associates (%) 50 20 26 32Group’s share of net assets in associates 397 656 343 289 1,685Goodwill – 414 386 – 800Other – 40 – – 40
Carrying value 397 1,110 729 289 2,525
Fair value N/A 2,962 612 N/A 3,574
2016Net assets 687 3,242 886 993 5,808Interest in associates (%) 50 20 25 32Group’s share of net assets in associates 344 648 221 317 1,530Goodwill – 388 345 – 733Other – (13) – – (13)
Carrying value 344 1,023 566 317 2,250
Fair value N/A 1,352 435 N/A 1,787
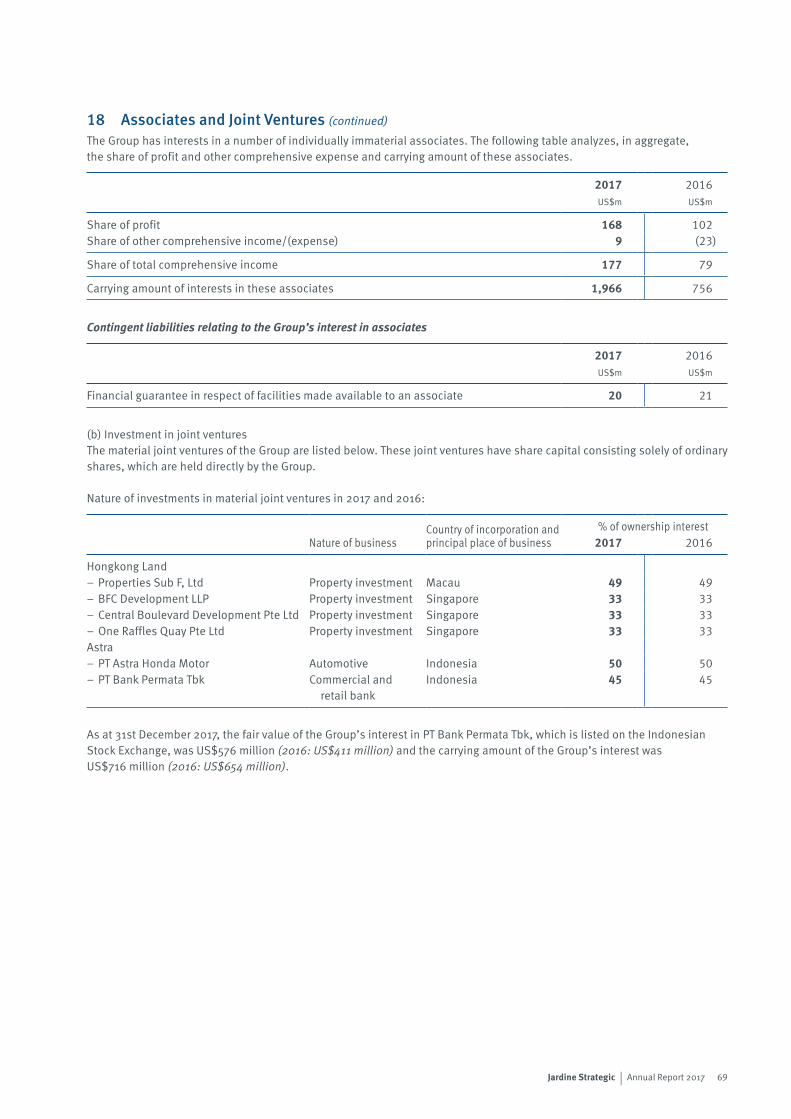
69Jardine Strategic | Annual Report 2017
18 Associates and Joint Ventures (continued)
The Group has interests in a number of individually immaterial associates. The following table analyzes, in aggregate, the share of profit and other comprehensive expense and carrying amount of these associates.
2017 2016US$m US$m
Share of profit 168 102Share of other comprehensive income/(expense) 9 (23)
Share of total comprehensive income 177 79
Carrying amount of interests in these associates 1,966 756
Contingent liabilities relating to the Group’s interest in associates
2017 2016US$m US$m
Financial guarantee in respect of facilities made available to an associate 20 21
(b) Investment in joint venturesThe material joint ventures of the Group are listed below. These joint ventures have share capital consisting solely of ordinary shares, which are held directly by the Group.
Nature of investments in material joint ventures in 2017 and 2016:
Nature of businessCountry of incorporation and principal place of business
% of ownership interest2017 2016
Hongkong Land– Properties Sub F, Ltd Property investment Macau 49 49– BFC Development LLP Property investment Singapore 33 33– Central Boulevard Development Pte Ltd Property investment Singapore 33 33– One Raffles Quay Pte Ltd Property investment Singapore 33 33Astra– PT Astra Honda Motor Automotive Indonesia 50 50– PT Bank Permata Tbk Commercial and
retail bankIndonesia 45 45
As at 31st December 2017, the fair value of the Group’s interest in PT Bank Permata Tbk, which is listed on the Indonesian Stock Exchange, was US$576 million (2016: US$411 million) and the carrying amount of the Group’s interest was US$716 million (2016: US$654 million).
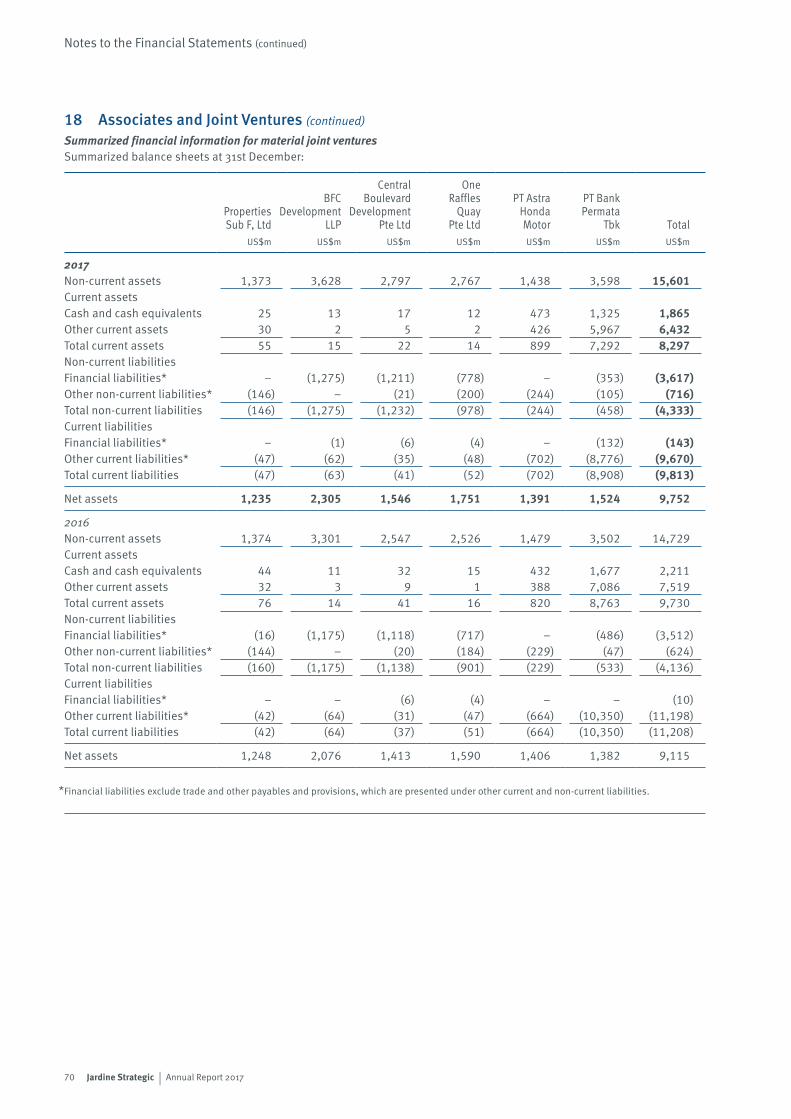
70 Jardine Strategic | Annual Report 2017
Notes to the Financial Statements (continued)
18 Associates and Joint Ventures (continued)
Summarized financial information for material joint venturesSummarized balance sheets at 31st December:
Central BFC Boulevard Properties Development Development Sub F, Ltd LLP Pte Ltd
OneRaffles
QuayPte Ltd
PT AstraHondaMotor
PT BankPermata
Tbk TotalUS$m US$m US$m US$m US$m US$m US$m
2017Non-current assets 1,373 3,628 2,797 2,767 1,438 3,598 15,601Current assetsCash and cash equivalents 25 13 17 12 473 1,325 1,865Other current assets 30 2 5 2 426 5,967 6,432Total current assets 55 15 22 14 899 7,292 8,297Non-current liabilitiesFinancial liabilities* – (1,275) (1,211) (778) – (353) (3,617)Other non-current liabilities* (146) – (21) (200) (244) (105) (716)Total non-current liabilities (146) (1,275) (1,232) (978) (244) (458) (4,333)Current liabilitiesFinancial liabilities* – (1) (6) (4) – (132) (143)Other current liabilities* (47) (62) (35) (48) (702) (8,776) (9,670)Total current liabilities (47) (63) (41) (52) (702) (8,908) (9,813)
Net assets 1,235 2,305 1,546 1,751 1,391 1,524 9,752
2016Non-current assets 1,374 3,301 2,547 2,526 1,479 3,502 14,729Current assetsCash and cash equivalents 44 11 32 15 432 1,677 2,211Other current assets 32 3 9 1 388 7,086 7,519Total current assets 76 14 41 16 820 8,763 9,730Non-current liabilitiesFinancial liabilities* (16) (1,175) (1,118) (717) – (486) (3,512)Other non-current liabilities* (144) – (20) (184) (229) (47) (624)Total non-current liabilities (160) (1,175) (1,138) (901) (229) (533) (4,136)Current liabilitiesFinancial liabilities* – – (6) (4) – – (10)Other current liabilities* (42) (64) (31) (47) (664) (10,350) (11,198)Total current liabilities (42) (64) (37) (51) (664) (10,350) (11,208)
Net assets 1,248 2,076 1,413 1,590 1,406 1,382 9,115
Financial liabilities exclude trade and other payables and provisions, which are presented under other current and non-current liabilities.*
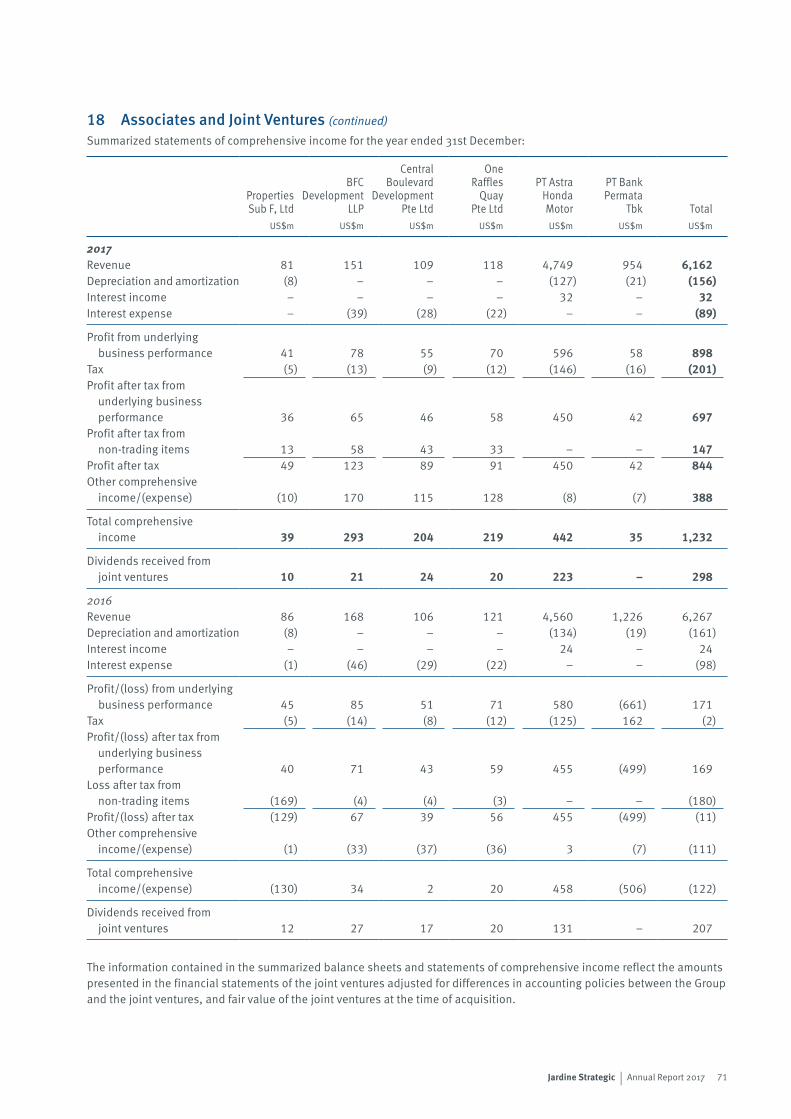
71Jardine Strategic | Annual Report 2017
18 Associates and Joint Ventures (continued)
Summarized statements of comprehensive income for the year ended 31st December:
Central BFC Boulevard Properties Development Development Sub F, Ltd LLP Pte Ltd
OneRaffles
QuayPte Ltd
PT AstraHondaMotor
PT BankPermata
Tbk TotalUS$m US$m US$m US$m US$m US$m US$m
2017Revenue 81 151 109 118 4,749 954 6,162Depreciation and amortization (8) – – – (127) (21) (156)Interest income – – – – 32 – 32Interest expense – (39) (28) (22) – – (89)
Profit from underlying business performance 41 78 55 70 596 58 898
Tax (5) (13) (9) (12) (146) (16) (201)Profit after tax from
underlying business performance 36 65 46 58 450 42 697
Profit after tax from non-trading items 13 58 43 33 – – 147
Profit after tax 49 123 89 91 450 42 844Other comprehensive
income/(expense) (10) 170 115 128 (8) (7) 388
Total comprehensive income 39 293 204 219 442 35 1,232
Dividends received from joint ventures 10 21 24 20 223 – 298
2016Revenue 86 168 106 121 4,560 1,226 6,267Depreciation and amortization (8) – – – (134) (19) (161)Interest income – – – – 24 – 24Interest expense (1) (46) (29) (22) – – (98)
Profit/(loss) from underlying business performance 45 85 51 71 580 (661) 171
Tax (5) (14) (8) (12) (125) 162 (2)Profit/(loss) after tax from
underlying business performance 40 71 43 59 455 (499) 169
Loss after tax from non-trading items (169) (4) (4) (3) – – (180)
Profit/(loss) after tax (129) 67 39 56 455 (499) (11)Other comprehensive
income/(expense) (1) (33) (37) (36) 3 (7) (111)
Total comprehensive income/(expense) (130) 34 2 20 458 (506) (122)
Dividends received from joint ventures 12 27 17 20 131 – 207
The information contained in the summarized balance sheets and statements of comprehensive income reflect the amounts presented in the financial statements of the joint ventures adjusted for differences in accounting policies between the Group and the joint ventures, and fair value of the joint ventures at the time of acquisition.
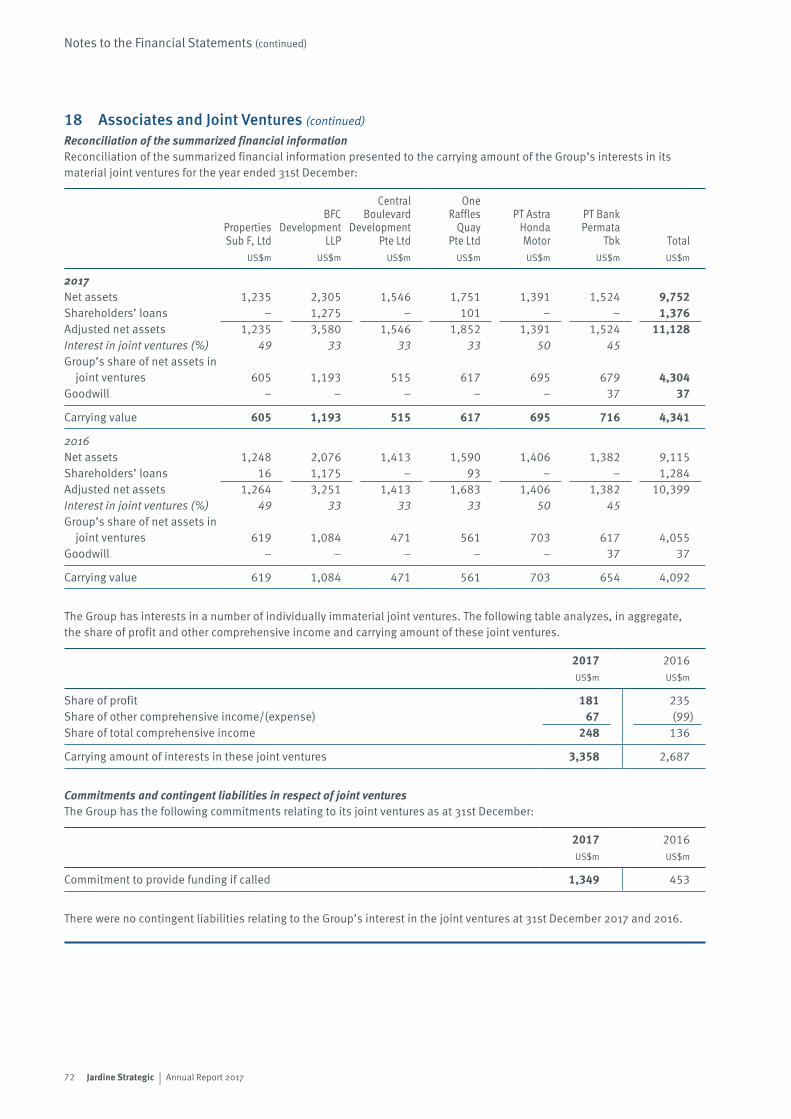
72 Jardine Strategic | Annual Report 2017
Notes to the Financial Statements (continued)
18 Associates and Joint Ventures (continued)
Reconciliation of the summarized financial informationReconciliation of the summarized financial information presented to the carrying amount of the Group’s interests in its material joint ventures for the year ended 31st December:
Central BFC Boulevard Properties Development Development Sub F, Ltd LLP Pte Ltd
OneRaffles
QuayPte Ltd
PT AstraHondaMotor
PT BankPermata
Tbk TotalUS$m US$m US$m US$m US$m US$m US$m
2017Net assets 1,235 2,305 1,546 1,751 1,391 1,524 9,752Shareholders’ loans – 1,275 – 101 – – 1,376Adjusted net assets 1,235 3,580 1,546 1,852 1,391 1,524 11,128Interest in joint ventures (%) 49 33 33 33 50 45Group’s share of net assets in
joint ventures 605 1,193 515 617 695 679 4,304Goodwill – – – – – 37 37
Carrying value 605 1,193 515 617 695 716 4,341
2016Net assets 1,248 2,076 1,413 1,590 1,406 1,382 9,115Shareholders’ loans 16 1,175 – 93 – – 1,284Adjusted net assets 1,264 3,251 1,413 1,683 1,406 1,382 10,399Interest in joint ventures (%) 49 33 33 33 50 45Group’s share of net assets in
joint ventures 619 1,084 471 561 703 617 4,055Goodwill – – – – – 37 37
Carrying value 619 1,084 471 561 703 654 4,092
The Group has interests in a number of individually immaterial joint ventures. The following table analyzes, in aggregate, the share of profit and other comprehensive income and carrying amount of these joint ventures.
2017 2016US$m US$m
Share of profit 181 235Share of other comprehensive income/(expense) 67 (99)Share of total comprehensive income 248 136
Carrying amount of interests in these joint ventures 3,358 2,687
Commitments and contingent liabilities in respect of joint venturesThe Group has the following commitments relating to its joint ventures as at 31st December:
2017 2016US$m US$m
Commitment to provide funding if called 1,349 453
There were no contingent liabilities relating to the Group’s interest in the joint ventures at 31st December 2017 and 2016.
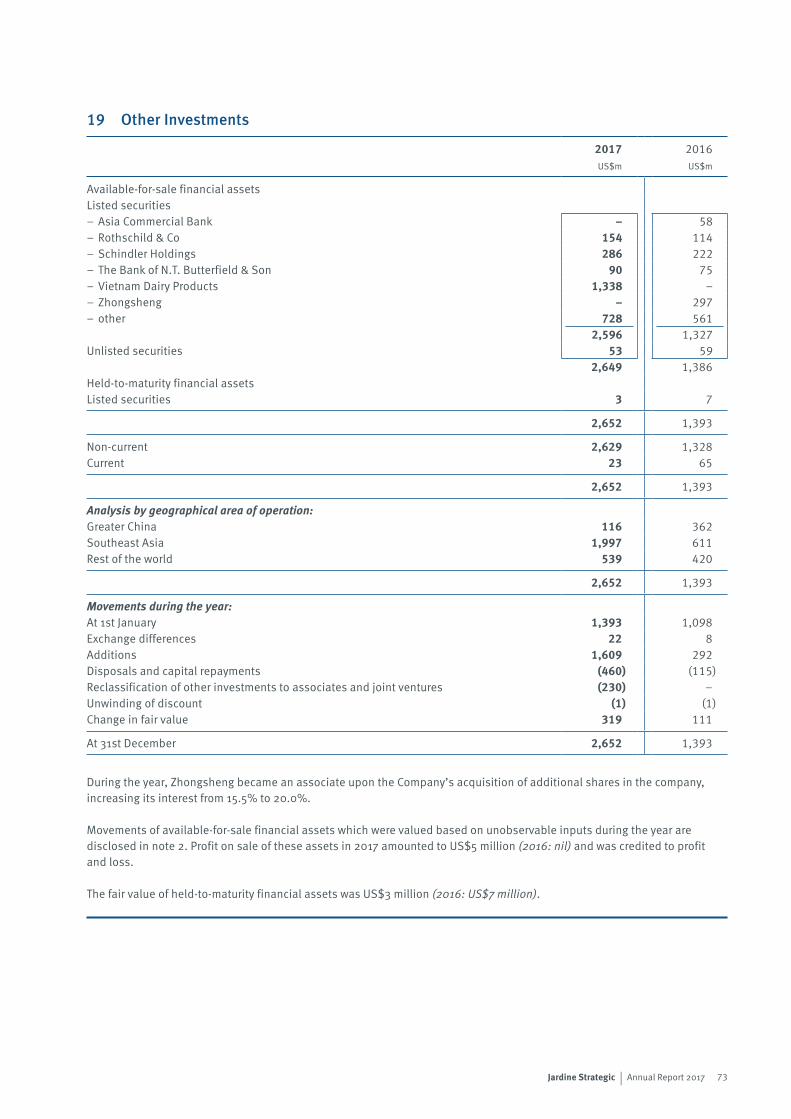
73Jardine Strategic | Annual Report 2017
19 Other Investments
2017 2016US$m US$m
Available-for-sale financial assetsListed securities– Asia Commercial Bank – 58– Rothschild & Co 154 114– Schindler Holdings 286 222– The Bank of N.T. Butterfield & Son 90 75– Vietnam Dairy Products 1,338 –– Zhongsheng – 297– other 728 561
2,596 1,327Unlisted securities 53 59
2,649 1,386Held-to-maturity financial assetsListed securities 3 7
2,652 1,393
Non-current 2,629 1,328Current 23 65
2,652 1,393
Analysis by geographical area of operation:Greater China 116 362Southeast Asia 1,997 611Rest of the world 539 420
2,652 1,393
Movements during the year:At 1st January 1,393 1,098Exchange differences 22 8Additions 1,609 292Disposals and capital repayments (460) (115)Reclassification of other investments to associates and joint ventures (230) –Unwinding of discount (1) (1)Change in fair value 319 111
At 31st December 2,652 1,393
During the year, Zhongsheng became an associate upon the Company’s acquisition of additional shares in the company, increasing its interest from 15.5% to 20.0%.
Movements of available-for-sale financial assets which were valued based on unobservable inputs during the year are disclosed in note 2. Profit on sale of these assets in 2017 amounted to US$5 million (2016: nil) and was credited to profit and loss.
The fair value of held-to-maturity financial assets was US$3 million (2016: US$7 million).
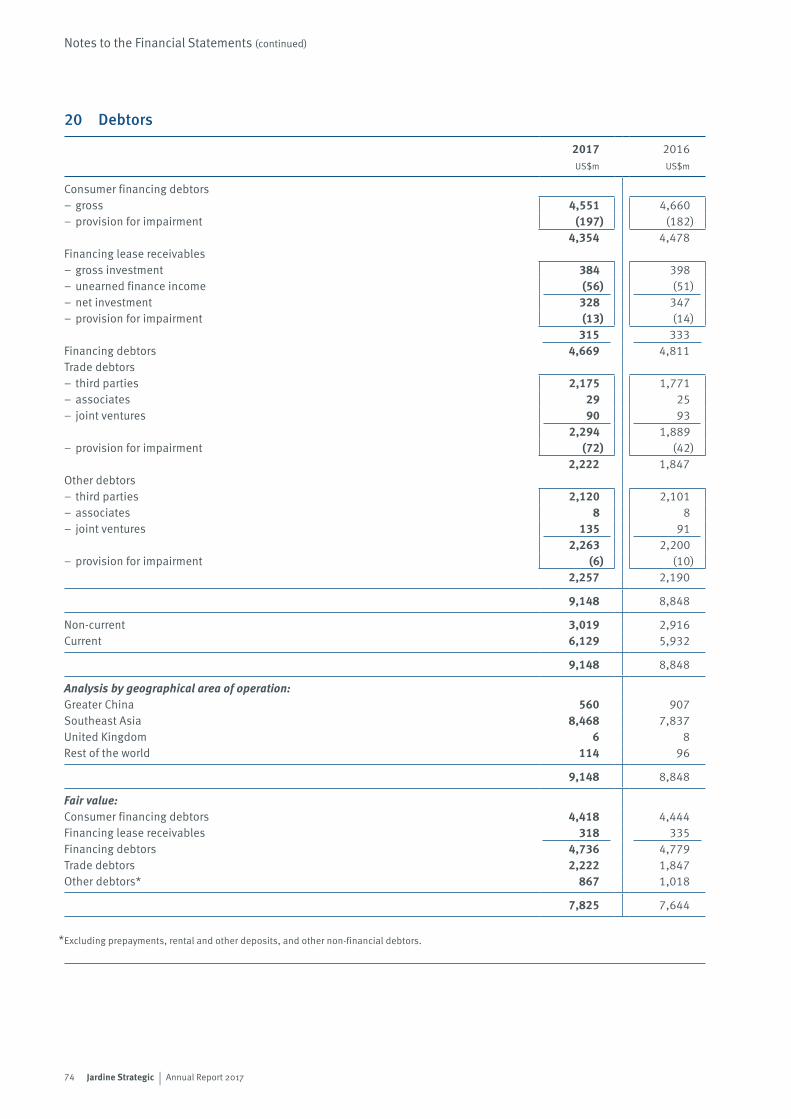
74 Jardine Strategic | Annual Report 2017
Notes to the Financial Statements (continued)
20 Debtors
2017 2016US$m US$m
Consumer financing debtors– gross 4,551 4,660– provision for impairment (197) (182)
4,354 4,478Financing lease receivables– gross investment 384 398– unearned finance income (56) (51)– net investment 328 347– provision for impairment (13) (14)
315 333Financing debtors 4,669 4,811Trade debtors– third parties 2,175 1,771– associates 29 25– joint ventures 90 93
2,294 1,889– provision for impairment (72) (42)
2,222 1,847Other debtors– third parties 2,120 2,101– associates 8 8– joint ventures 135 91
2,263 2,200– provision for impairment (6) (10)
2,257 2,190
9,148 8,848
Non-current 3,019 2,916Current 6,129 5,932
9,148 8,848
Analysis by geographical area of operation:Greater China 560 907Southeast Asia 8,468 7,837United Kingdom 6 8Rest of the world 114 96
9,148 8,848
Fair value:Consumer financing debtors 4,418 4,444Financing lease receivables 318 335Financing debtors 4,736 4,779Trade debtors 2,222 1,847Other debtors* 867 1,018
7,825 7,644
Excluding prepayments, rental and other deposits, and other non-financial debtors.*
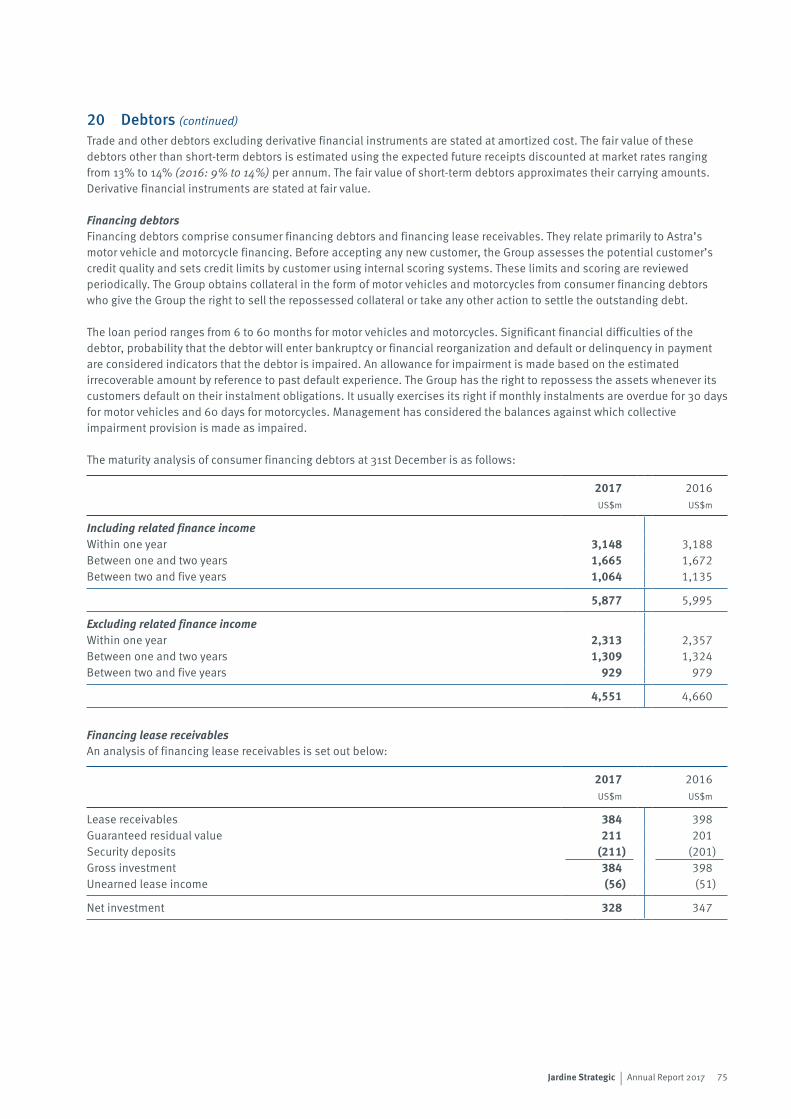
75Jardine Strategic | Annual Report 2017
20 Debtors (continued)
Trade and other debtors excluding derivative financial instruments are stated at amortized cost. The fair value of these debtors other than short-term debtors is estimated using the expected future receipts discounted at market rates ranging from 13% to 14% (2016: 9% to 14%) per annum. The fair value of short-term debtors approximates their carrying amounts. Derivative financial instruments are stated at fair value.
Financing debtorsFinancing debtors comprise consumer financing debtors and financing lease receivables. They relate primarily to Astra’s motor vehicle and motorcycle financing. Before accepting any new customer, the Group assesses the potential customer’s credit quality and sets credit limits by customer using internal scoring systems. These limits and scoring are reviewed periodically. The Group obtains collateral in the form of motor vehicles and motorcycles from consumer financing debtors who give the Group the right to sell the repossessed collateral or take any other action to settle the outstanding debt.
The loan period ranges from 6 to 60 months for motor vehicles and motorcycles. Significant financial difficulties of the debtor, probability that the debtor will enter bankruptcy or financial reorganization and default or delinquency in payment are considered indicators that the debtor is impaired. An allowance for impairment is made based on the estimated irrecoverable amount by reference to past default experience. The Group has the right to repossess the assets whenever its customers default on their instalment obligations. It usually exercises its right if monthly instalments are overdue for 30 days for motor vehicles and 60 days for motorcycles. Management has considered the balances against which collective impairment provision is made as impaired.
The maturity analysis of consumer financing debtors at 31st December is as follows:
2017 2016US$m US$m
Including related finance incomeWithin one year 3,148 3,188Between one and two years 1,665 1,672Between two and five years 1,064 1,135
5,877 5,995
Excluding related finance incomeWithin one year 2,313 2,357Between one and two years 1,309 1,324Between two and five years 929 979
4,551 4,660
Financing lease receivablesAn analysis of financing lease receivables is set out below:
2017 2016US$m US$m
Lease receivables 384 398Guaranteed residual value 211 201Security deposits (211) (201)Gross investment 384 398Unearned lease income (56) (51)
Net investment 328 347
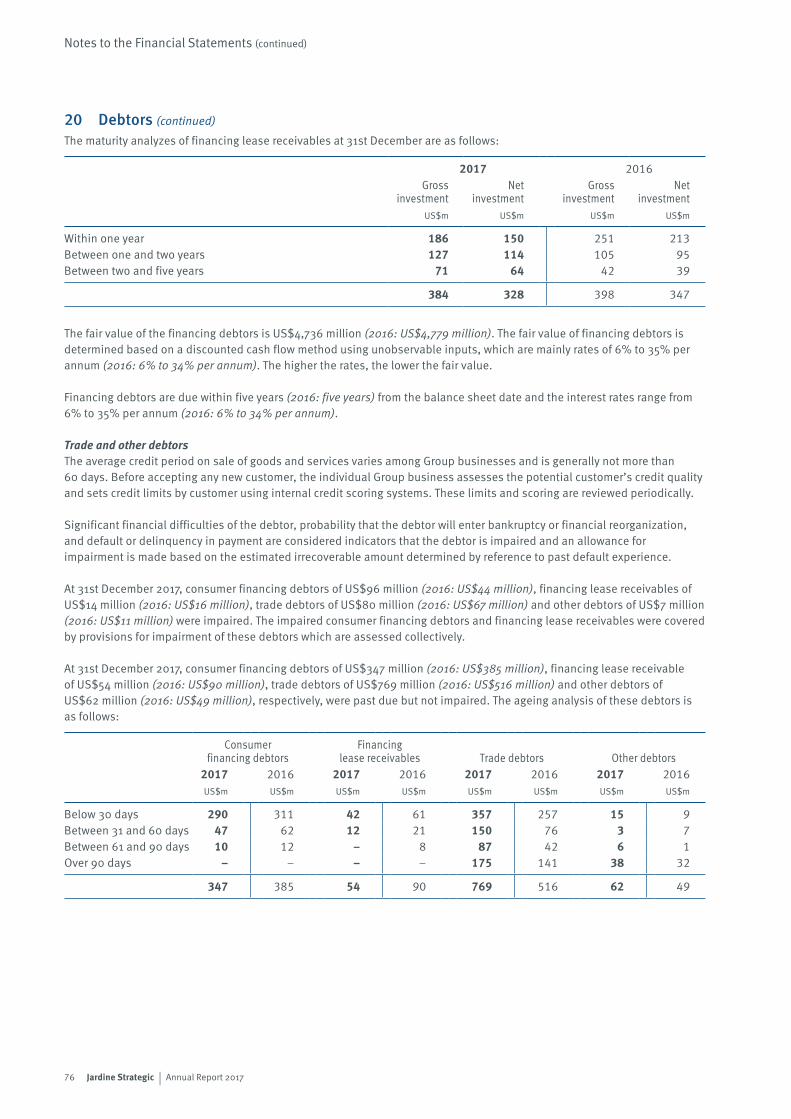
76 Jardine Strategic | Annual Report 2017
Notes to the Financial Statements (continued)
20 Debtors (continued)
The maturity analyzes of financing lease receivables at 31st December are as follows:
2017 2016Gross
investmentNet
investmentGross
investmentNet
investmentUS$m US$m US$m US$m
Within one year 186 150 251 213Between one and two years 127 114 105 95Between two and five years 71 64 42 39
384 328 398 347
The fair value of the financing debtors is US$4,736 million (2016: US$4,779 million). The fair value of financing debtors is determined based on a discounted cash flow method using unobservable inputs, which are mainly rates of 6% to 35% per annum (2016: 6% to 34% per annum). The higher the rates, the lower the fair value.
Financing debtors are due within five years (2016: five years) from the balance sheet date and the interest rates range from 6% to 35% per annum (2016: 6% to 34% per annum).
Trade and other debtorsThe average credit period on sale of goods and services varies among Group businesses and is generally not more than 60 days. Before accepting any new customer, the individual Group business assesses the potential customer’s credit quality and sets credit limits by customer using internal credit scoring systems. These limits and scoring are reviewed periodically.
Significant financial difficulties of the debtor, probability that the debtor will enter bankruptcy or financial reorganization, and default or delinquency in payment are considered indicators that the debtor is impaired and an allowance for impairment is made based on the estimated irrecoverable amount determined by reference to past default experience.
At 31st December 2017, consumer financing debtors of US$96 million (2016: US$44 million), financing lease receivables of US$14 million (2016: US$16 million), trade debtors of US$80 million (2016: US$67 million) and other debtors of US$7 million (2016: US$11 million) were impaired. The impaired consumer financing debtors and financing lease receivables were covered by provisions for impairment of these debtors which are assessed collectively.
At 31st December 2017, consumer financing debtors of US$347 million (2016: US$385 million), financing lease receivable of US$54 million (2016: US$90 million), trade debtors of US$769 million (2016: US$516 million) and other debtors of US$62 million (2016: US$49 million), respectively, were past due but not impaired. The ageing analysis of these debtors is as follows:
Consumer financing debtors
Financing lease receivables Trade debtors Other debtors
2017 2016 2017 2016 2017 2016 2017 2016US$m US$m US$m US$m US$m US$m US$m US$m
Below 30 days 290 311 42 61 357 257 15 9Between 31 and 60 days 47 62 12 21 150 76 3 7Between 61 and 90 days 10 12 – 8 87 42 6 1Over 90 days – – – – 175 141 38 32
347 385 54 90 769 516 62 49
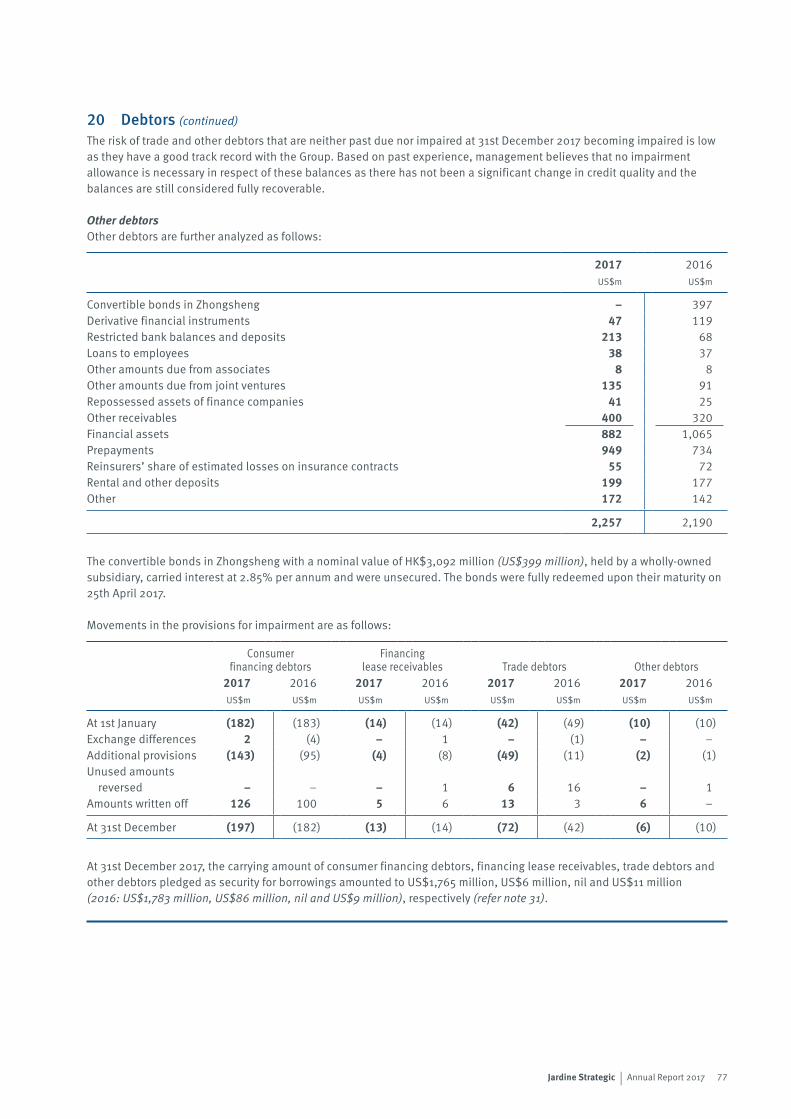
77Jardine Strategic | Annual Report 2017
20 Debtors (continued)
The risk of trade and other debtors that are neither past due nor impaired at 31st December 2017 becoming impaired is low as they have a good track record with the Group. Based on past experience, management believes that no impairment allowance is necessary in respect of these balances as there has not been a significant change in credit quality and the balances are still considered fully recoverable.
Other debtorsOther debtors are further analyzed as follows:
2017 2016US$m US$m
Convertible bonds in Zhongsheng – 397Derivative financial instruments 47 119Restricted bank balances and deposits 213 68Loans to employees 38 37Other amounts due from associates 8 8Other amounts due from joint ventures 135 91Repossessed assets of finance companies 41 25Other receivables 400 320Financial assets 882 1,065Prepayments 949 734Reinsurers’ share of estimated losses on insurance contracts 55 72Rental and other deposits 199 177Other 172 142
2,257 2,190
The convertible bonds in Zhongsheng with a nominal value of HK$3,092 million (US$399 million), held by a wholly-owned subsidiary, carried interest at 2.85% per annum and were unsecured. The bonds were fully redeemed upon their maturity on 25th April 2017.
Movements in the provisions for impairment are as follows:
Consumer financing debtors
Financing lease receivables Trade debtors Other debtors
2017 2016 2017 2016 2017 2016 2017 2016US$m US$m US$m US$m US$m US$m US$m US$m
At 1st January (182) (183) (14) (14) (42) (49) (10) (10)Exchange differences 2 (4) – 1 – (1) – –Additional provisions (143) (95) (4) (8) (49) (11) (2) (1)Unused amounts
reversed – – – 1 6 16 – 1Amounts written off 126 100 5 6 13 3 6 –
At 31st December (197) (182) (13) (14) (72) (42) (6) (10)
At 31st December 2017, the carrying amount of consumer financing debtors, financing lease receivables, trade debtors and other debtors pledged as security for borrowings amounted to US$1,765 million, US$6 million, nil and US$11 million (2016: US$1,783 million, US$86 million, nil and US$9 million), respectively (refer note 31).
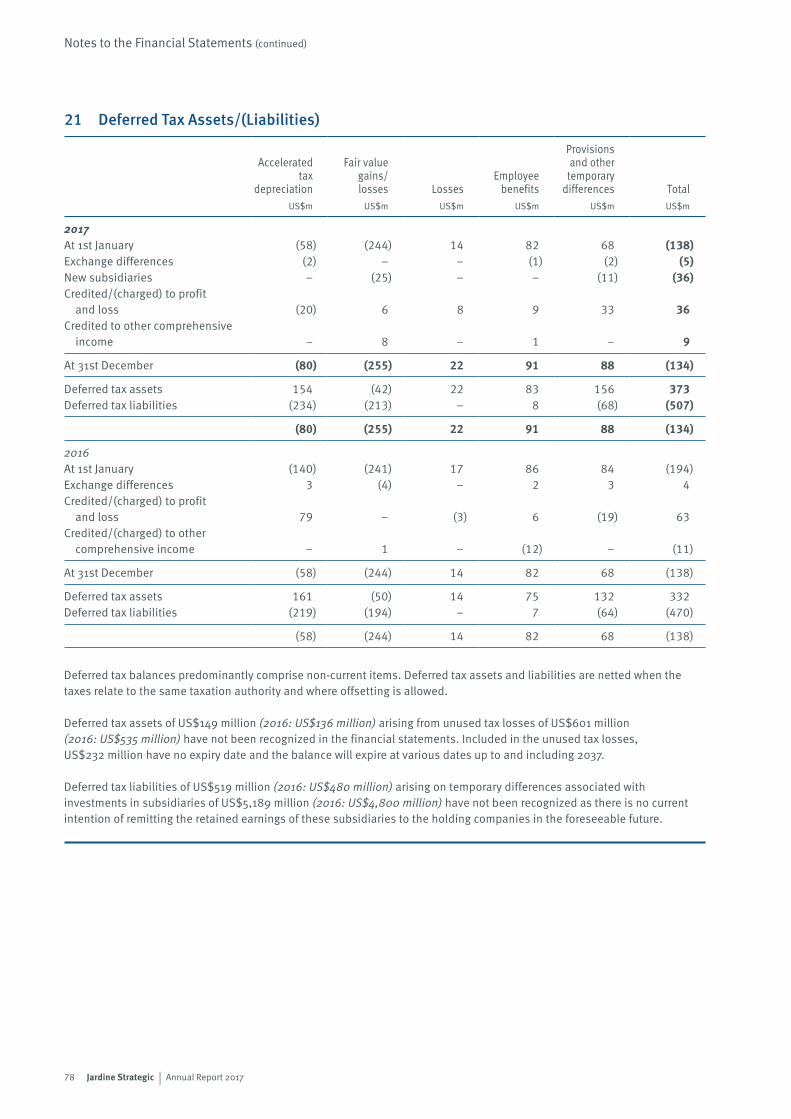
78 Jardine Strategic | Annual Report 2017
Notes to the Financial Statements (continued)
21 Deferred Tax Assets/(Liabilities)
Accelerated tax
depreciation
Fair value gains/ losses Losses
Employee benefits
Provisions and other
temporary differences Total
US$m US$m US$m US$m US$m US$m
2017At 1st January (58) (244) 14 82 68 (138)Exchange differences (2) – – (1) (2) (5)New subsidiaries – (25) – – (11) (36)Credited/(charged) to profit
and loss (20) 6 8 9 33 36Credited to other comprehensive
income – 8 – 1 – 9
At 31st December (80) (255) 22 91 88 (134)
Deferred tax assets 154 (42) 22 83 156 373Deferred tax liabilities (234) (213) – 8 (68) (507)
(80) (255) 22 91 88 (134)
2016At 1st January (140) (241) 17 86 84 (194)Exchange differences 3 (4) – 2 3 4Credited/(charged) to profit
and loss 79 – (3) 6 (19) 63Credited/(charged) to other
comprehensive income – 1 – (12) – (11)
At 31st December (58) (244) 14 82 68 (138)
Deferred tax assets 161 (50) 14 75 132 332Deferred tax liabilities (219) (194) – 7 (64) (470)
(58) (244) 14 82 68 (138)
Deferred tax balances predominantly comprise non-current items. Deferred tax assets and liabilities are netted when the taxes relate to the same taxation authority and where offsetting is allowed.
Deferred tax assets of US$149 million (2016: US$136 million) arising from unused tax losses of US$601 million (2016: US$535 million) have not been recognized in the financial statements. Included in the unused tax losses, US$232 million have no expiry date and the balance will expire at various dates up to and including 2037.
Deferred tax liabilities of US$519 million (2016: US$480 million) arising on temporary differences associated with investments in subsidiaries of US$5,189 million (2016: US$4,800 million) have not been recognized as there is no current intention of remitting the retained earnings of these subsidiaries to the holding companies in the foreseeable future.
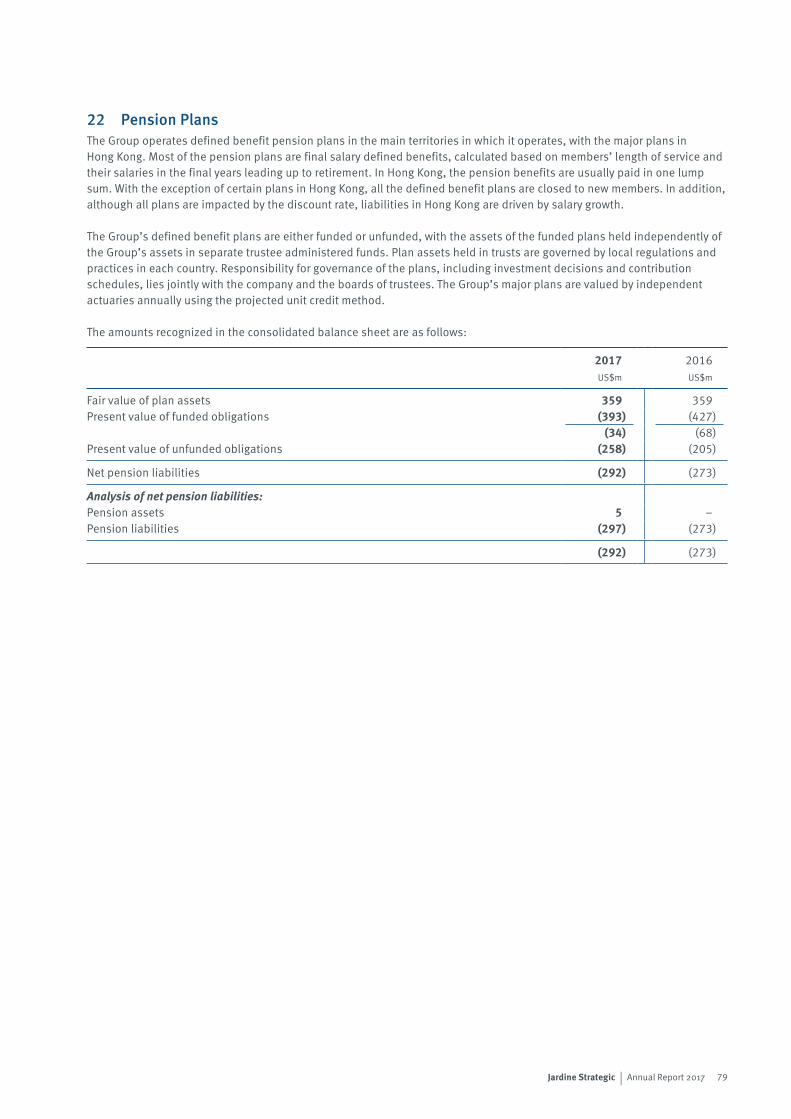
79Jardine Strategic | Annual Report 2017
22 Pension PlansThe Group operates defined benefit pension plans in the main territories in which it operates, with the major plans in Hong Kong. Most of the pension plans are final salary defined benefits, calculated based on members’ length of service and their salaries in the final years leading up to retirement. In Hong Kong, the pension benefits are usually paid in one lump sum. With the exception of certain plans in Hong Kong, all the defined benefit plans are closed to new members. In addition, although all plans are impacted by the discount rate, liabilities in Hong Kong are driven by salary growth.
The Group’s defined benefit plans are either funded or unfunded, with the assets of the funded plans held independently of the Group’s assets in separate trustee administered funds. Plan assets held in trusts are governed by local regulations and practices in each country. Responsibility for governance of the plans, including investment decisions and contribution schedules, lies jointly with the company and the boards of trustees. The Group’s major plans are valued by independent actuaries annually using the projected unit credit method.
The amounts recognized in the consolidated balance sheet are as follows:
2017 2016US$m US$m
Fair value of plan assets 359 359Present value of funded obligations (393) (427)
(34) (68)Present value of unfunded obligations (258) (205)
Net pension liabilities (292) (273)
Analysis of net pension liabilities:Pension assets 5 –Pension liabilities (297) (273)
(292) (273)
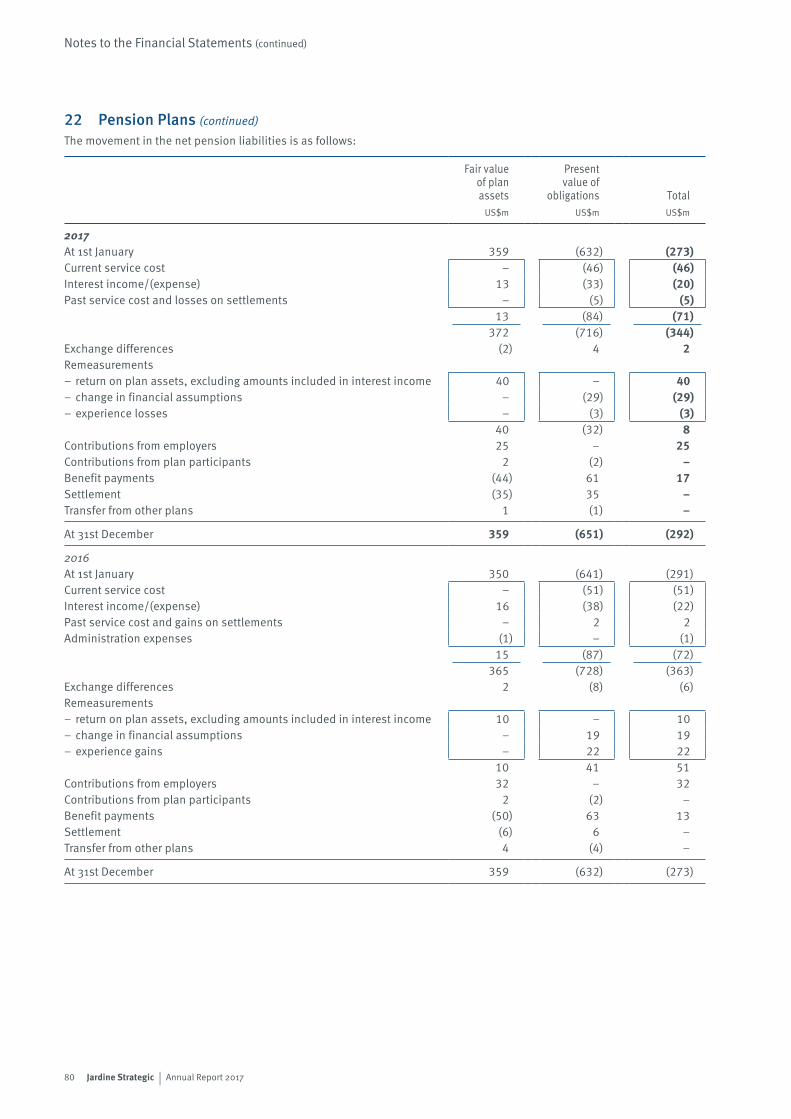
80 Jardine Strategic | Annual Report 2017
Notes to the Financial Statements (continued)
22 Pension Plans (continued)
The movement in the net pension liabilities is as follows:
Fair valueof planassets
Presentvalue of
obligations TotalUS$m US$m US$m
2017At 1st January 359 (632) (273)Current service cost – (46) (46)Interest income/(expense) 13 (33) (20)Past service cost and losses on settlements – (5) (5)
13 (84) (71)372 (716) (344)
Exchange differences (2) 4 2Remeasurements– return on plan assets, excluding amounts included in interest income 40 – 40– change in financial assumptions – (29) (29)– experience losses – (3) (3)
40 (32) 8Contributions from employers 25 – 25Contributions from plan participants 2 (2) –Benefit payments (44) 61 17Settlement (35) 35 –Transfer from other plans 1 (1) –
At 31st December 359 (651) (292)
2016At 1st January 350 (641) (291)Current service cost – (51) (51)Interest income/(expense) 16 (38) (22)Past service cost and gains on settlements – 2 2Administration expenses (1) – (1)
15 (87) (72)365 (728) (363)
Exchange differences 2 (8) (6)Remeasurements– return on plan assets, excluding amounts included in interest income 10 – 10– change in financial assumptions – 19 19– experience gains – 22 22
10 41 51Contributions from employers 32 – 32Contributions from plan participants 2 (2) –Benefit payments (50) 63 13Settlement (6) 6 –Transfer from other plans 4 (4) –
At 31st December 359 (632) (273)
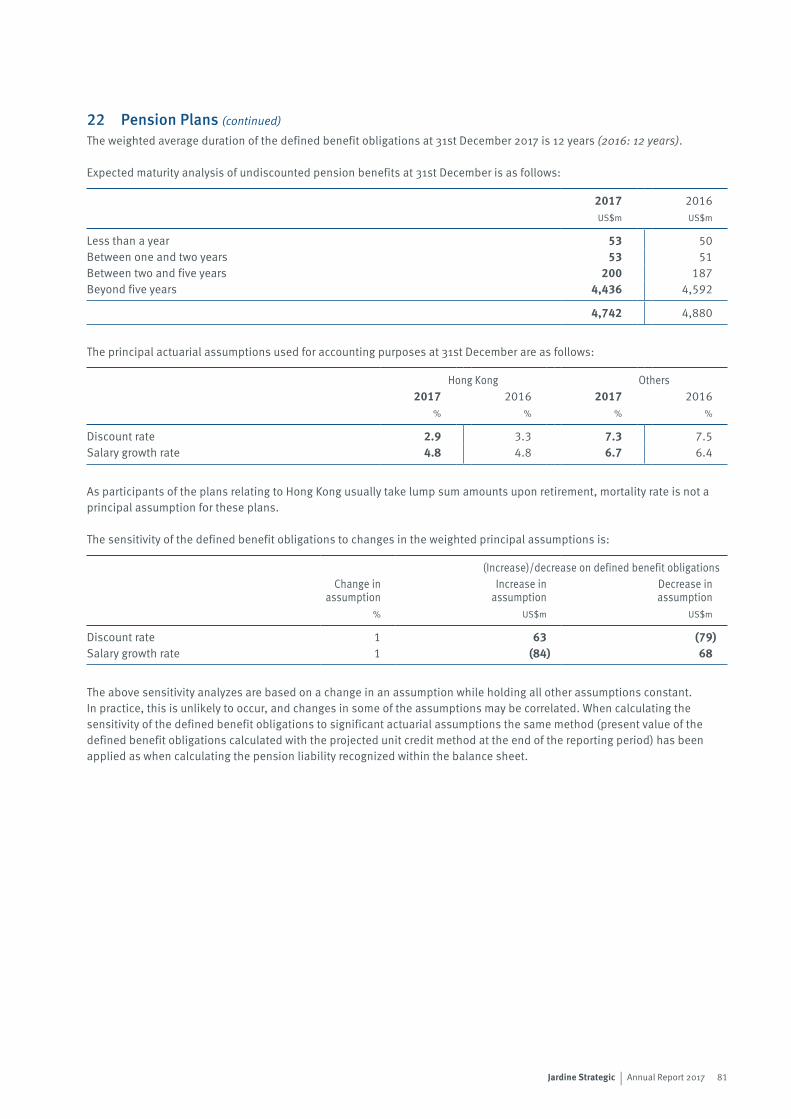
81Jardine Strategic | Annual Report 2017
22 Pension Plans (continued)
The weighted average duration of the defined benefit obligations at 31st December 2017 is 12 years (2016: 12 years).
Expected maturity analysis of undiscounted pension benefits at 31st December is as follows:
2017 2016US$m US$m
Less than a year 53 50Between one and two years 53 51Between two and five years 200 187Beyond five years 4,436 4,592
4,742 4,880
The principal actuarial assumptions used for accounting purposes at 31st December are as follows:
Hong Kong Others2017 2016 2017 2016
% % % %
Discount rate 2.9 3.3 7.3 7.5Salary growth rate 4.8 4.8 6.7 6.4
As participants of the plans relating to Hong Kong usually take lump sum amounts upon retirement, mortality rate is not a principal assumption for these plans.
The sensitivity of the defined benefit obligations to changes in the weighted principal assumptions is:
(Increase)/decrease on defined benefit obligationsChange in
assumptionIncrease in
assumptionDecrease in assumption
% US$m US$m
Discount rate 1 63 (79)Salary growth rate 1 (84) 68
The above sensitivity analyzes are based on a change in an assumption while holding all other assumptions constant. In practice, this is unlikely to occur, and changes in some of the assumptions may be correlated. When calculating the sensitivity of the defined benefit obligations to significant actuarial assumptions the same method (present value of the defined benefit obligations calculated with the projected unit credit method at the end of the reporting period) has been applied as when calculating the pension liability recognized within the balance sheet.

82 Jardine Strategic | Annual Report 2017
Notes to the Financial Statements (continued)
22 Pension Plans (continued)
The analysis of the fair value of plan assets at 31st December is as follows:
AsiaPacific Europe
NorthAmerica Global Total
US$m US$m US$m US$m US$m
2017Quoted investments Equity instruments 49 – – – 49 Debt instruments – government 24 – – – 24 – corporate bonds – investment grade 17 – – – 17
41 – – – 41 Investment funds 56 22 58 32 168
146 22 58 32 258Unquoted investments
Investment funds 4 3 3 76 86Total investments 150 25 61 108 344Cash and cash equivalents 20Benefits payable and other (5)
359
2016Quoted investments Equity instruments 48 – – – 48 Debt instruments – government 45 – – 2 47 – corporate bonds – investment grade 21 1 3 1 26
66 1 3 3 73 Investment funds 33 19 47 23 122
147 20 50 26 243Unquoted investments Investment funds 4 2 1 77 84Total investments 151 22 51 103 327Cash and cash equivalents 34Benefits payable and other (2)
359
83Jardine Strategic | Annual Report 2017
22 Pension Plans (continued)
The defined benefit plans in Hong Kong have two strategic asset allocations for its open and closed plans. The open plans have an equity/debt allocation of 70/30 whilst the closed plans have a 55/45 split.
The strategic asset allocation is derived from the asset-liability modelling (‘ALM’) review, done triennially to ensure the plans can meet future funding and solvency requirements. The last ALM review was completed in 2015, with modified strategic asset allocations adopted in 2015. The next ALM review is scheduled for 2018.
As at 31st December 2017, the Hong Kong plans had assets of US$284 million (2016: US$247 million). These assets were invested 30% in Asia Pacific, 9% in Europe and 22% in North America (2016: 27%, 9% and 21%, respectively). Within Asia Pacific, 36% (2016: 46%) was invested in Hong Kong equities and bonds. 69% (2016: 65%) and 31% (2016: 35%) of the investments were in quoted and unquoted instruments, respectively. The high percentage of quoted instruments provides liquidity to fund drawdowns and benefit payments. Within the quoted equity allocation, the plan is well diversified in terms of sectors, with the top three being financials, technology and consumer goods, with a combined fair value of US$19 million. In 2016, the top three being financials, technology and industrials, with a combined fair value of US$18 million.
Through its defined benefit pension plans, the Group is expected to be exposed to a number of risks such as asset volatility, changes in bond yields, inflation risk and life expectancy, the most significant of which are detailed below:
Asset volatilityThe plan liabilities are calculated using a discount rate set with reference to corporate bond yields; if plan assets underperform this yield, this will create a deficit. The Group’s defined benefit plans hold a percentage of equities, which are expected to outperform corporate bonds in the long-term, whilst generating volatility and risk in the short-term.
In Hong Kong, where the Group has open and closed plans, the assets and liabilities mix are distinct to reduce the level of investment risk to each plan. The composition of the assets are reviewed on a regular basis, with annual rebalancing and de-risking initiatives undertaken to reduce investment volatility of the plan assets while maintaining an appropriate level of target returns. The open plans retained a higher exposure to equities to generate higher returns to meet pension obligations. Management believes that the long-term nature of the plan liabilities and the strength of the Group supports a level of equity investment as part of the Group’s long term strategy to manage the plans efficiently.
Changes in bond yieldsA decrease in corporate bond yields will increase plan liabilities, although this will be partially offset by an increase in the value of the plans’ bond holdings.
Inflation riskThe majority of the Group’s plan assets are unaffected by inflation.
Life expectancyThe Hong Kong plans mainly provide for a lump-sum benefit payment at retirement.
The Group ensures that the investment positions are managed within an ALM framework that is developed to achieve long-term returns that are in line with the obligations under the pension schemes. Within the ALM framework, the Group’s objective is to match assets to the pension obligations by investing in a well-diversified portfolio that generates sufficient risk-adjusted returns that match the benefit payments. The Group also actively monitors the duration and the expected yield of the investments to ensure it matches the expected cash outflows arising from the pension obligations.
Investments across the plans are well diversified, such that the failure of any single investment would not have a material impact on the overall level of assets.
The Group maintains an active and regular contribution schedule across all the plans. The contributions to all its plans in 2017 were US$25 million and the estimated amount of contributions expected to be paid to all its plans in 2018 is US$27 million.
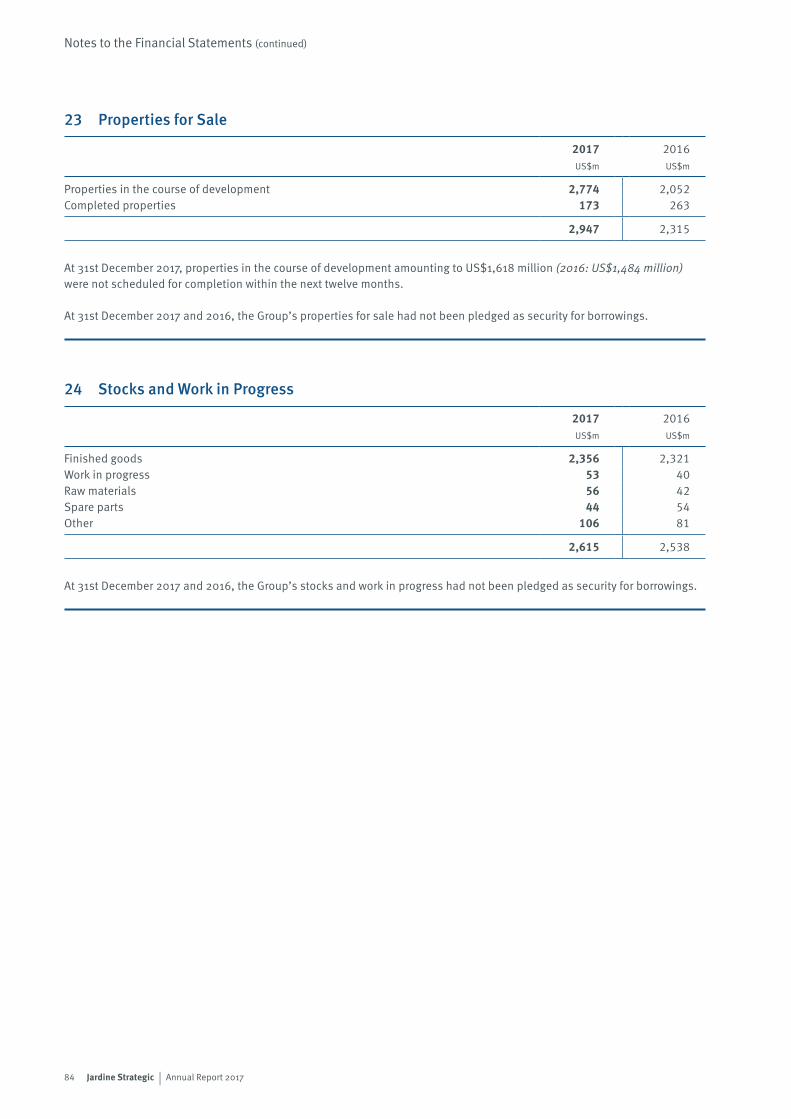
84 Jardine Strategic | Annual Report 2017
Notes to the Financial Statements (continued)
23 Properties for Sale
2017 2016US$m US$m
Properties in the course of development 2,774 2,052Completed properties 173 263
2,947 2,315
At 31st December 2017, properties in the course of development amounting to US$1,618 million (2016: US$1,484 million) were not scheduled for completion within the next twelve months.
At 31st December 2017 and 2016, the Group’s properties for sale had not been pledged as security for borrowings.
24 Stocks and Work in Progress
2017 2016US$m US$m
Finished goods 2,356 2,321Work in progress 53 40Raw materials 56 42Spare parts 44 54Other 106 81
2,615 2,538
At 31st December 2017 and 2016, the Group’s stocks and work in progress had not been pledged as security for borrowings.
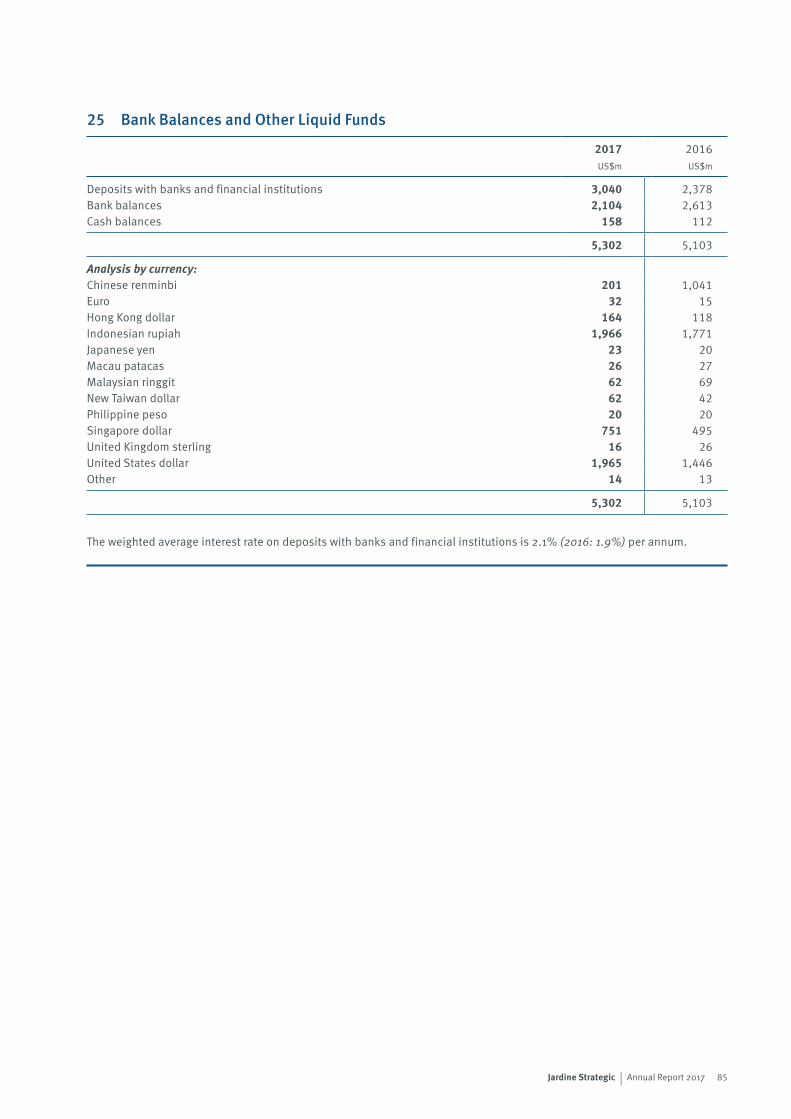
85Jardine Strategic | Annual Report 2017
25 Bank Balances and Other Liquid Funds
2017 2016US$m US$m
Deposits with banks and financial institutions 3,040 2,378Bank balances 2,104 2,613Cash balances 158 112
5,302 5,103
Analysis by currency:Chinese renminbi 201 1,041Euro 32 15Hong Kong dollar 164 118Indonesian rupiah 1,966 1,771Japanese yen 23 20Macau patacas 26 27Malaysian ringgit 62 69New Taiwan dollar 62 42Philippine peso 20 20Singapore dollar 751 495United Kingdom sterling 16 26United States dollar 1,965 1,446Other 14 13
5,302 5,103
The weighted average interest rate on deposits with banks and financial institutions is 2.1% (2016: 1.9%) per annum.
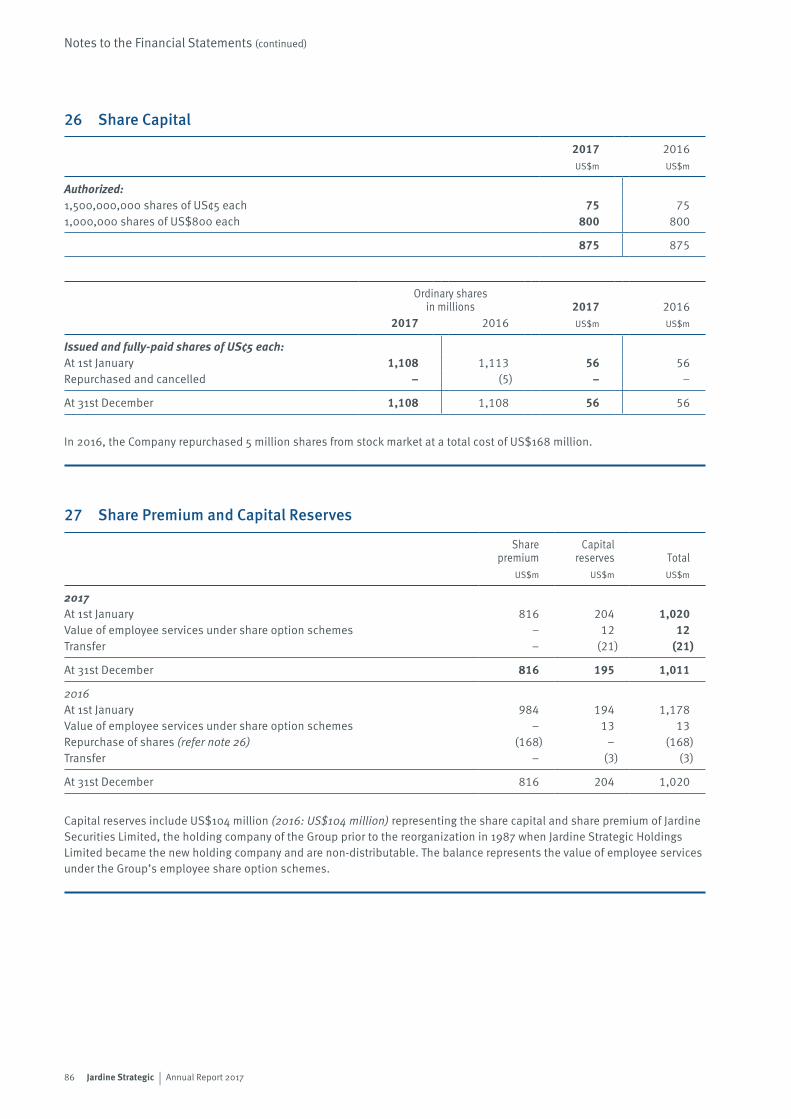
86 Jardine Strategic | Annual Report 2017
Notes to the Financial Statements (continued)
26 Share Capital
2017 2016US$m US$m
Authorized:1,500,000,000 shares of US¢5 each 75 751,000,000 shares of US$800 each 800 800
875 875
Ordinary sharesin millions 2017 2016
2017 2016 US$m US$m
Issued and fully-paid shares of US¢5 each:At 1st January 1,108 1,113 56 56Repurchased and cancelled – (5) – –
At 31st December 1,108 1,108 56 56
In 2016, the Company repurchased 5 million shares from stock market at a total cost of US$168 million.
27 Share Premium and Capital Reserves
Share premium
Capital reserves Total
US$m US$m US$m
2017At 1st January 816 204 1,020Value of employee services under share option schemes – 12 12Transfer – (21) (21)
At 31st December 816 195 1,011
2016At 1st January 984 194 1,178Value of employee services under share option schemes – 13 13Repurchase of shares (refer note 26) (168) – (168)Transfer – (3) (3)
At 31st December 816 204 1,020
Capital reserves include US$104 million (2016: US$104 million) representing the share capital and share premium of Jardine Securities Limited, the holding company of the Group prior to the reorganization in 1987 when Jardine Strategic Holdings Limited became the new holding company and are non-distributable. The balance represents the value of employee services under the Group’s employee share option schemes.
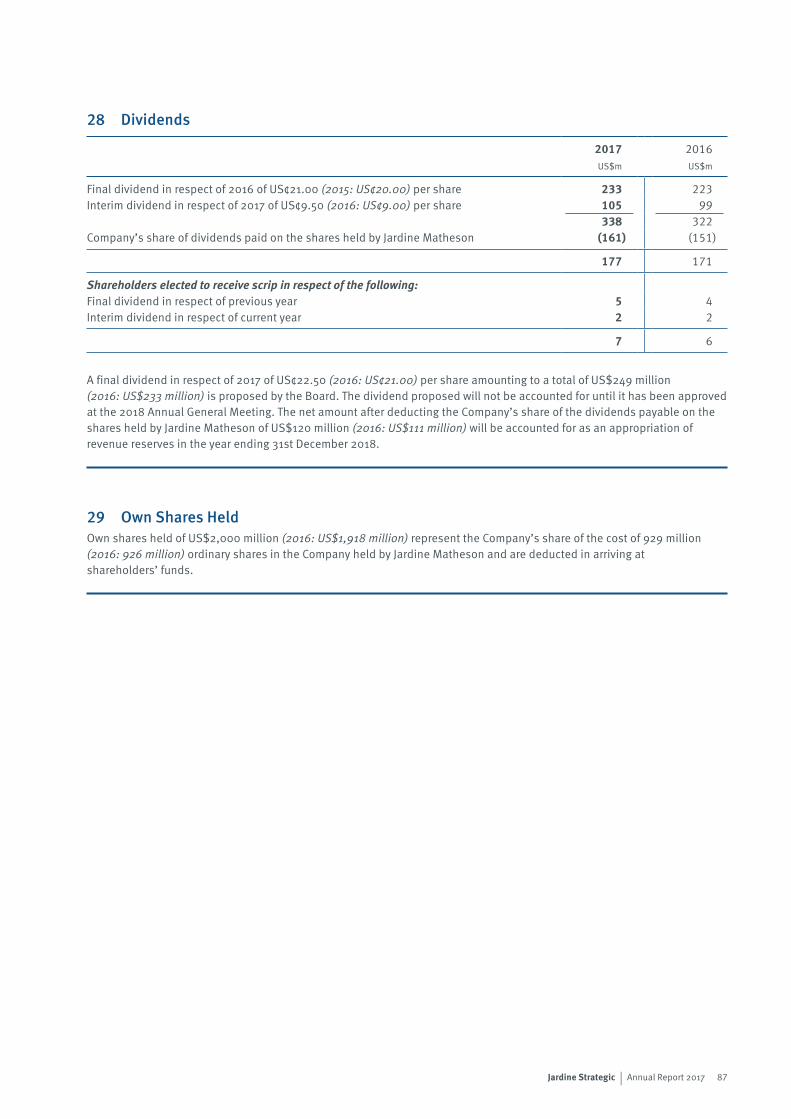
87Jardine Strategic | Annual Report 2017
28 Dividends
2017 2016US$m US$m
Final dividend in respect of 2016 of US¢21.00 (2015: US¢20.00) per share 233 223Interim dividend in respect of 2017 of US¢9.50 (2016: US¢9.00) per share 105 99
338 322Company’s share of dividends paid on the shares held by Jardine Matheson (161) (151)
177 171
Shareholders elected to receive scrip in respect of the following:Final dividend in respect of previous year 5 4Interim dividend in respect of current year 2 2
7 6
A final dividend in respect of 2017 of US¢22.50 (2016: US¢21.00) per share amounting to a total of US$249 million (2016: US$233 million) is proposed by the Board. The dividend proposed will not be accounted for until it has been approved at the 2018 Annual General Meeting. The net amount after deducting the Company’s share of the dividends payable on the shares held by Jardine Matheson of US$120 million (2016: US$111 million) will be accounted for as an appropriation of revenue reserves in the year ending 31st December 2018.
29 Own Shares HeldOwn shares held of US$2,000 million (2016: US$1,918 million) represent the Company’s share of the cost of 929 million (2016: 926 million) ordinary shares in the Company held by Jardine Matheson and are deducted in arriving at shareholders’ funds.
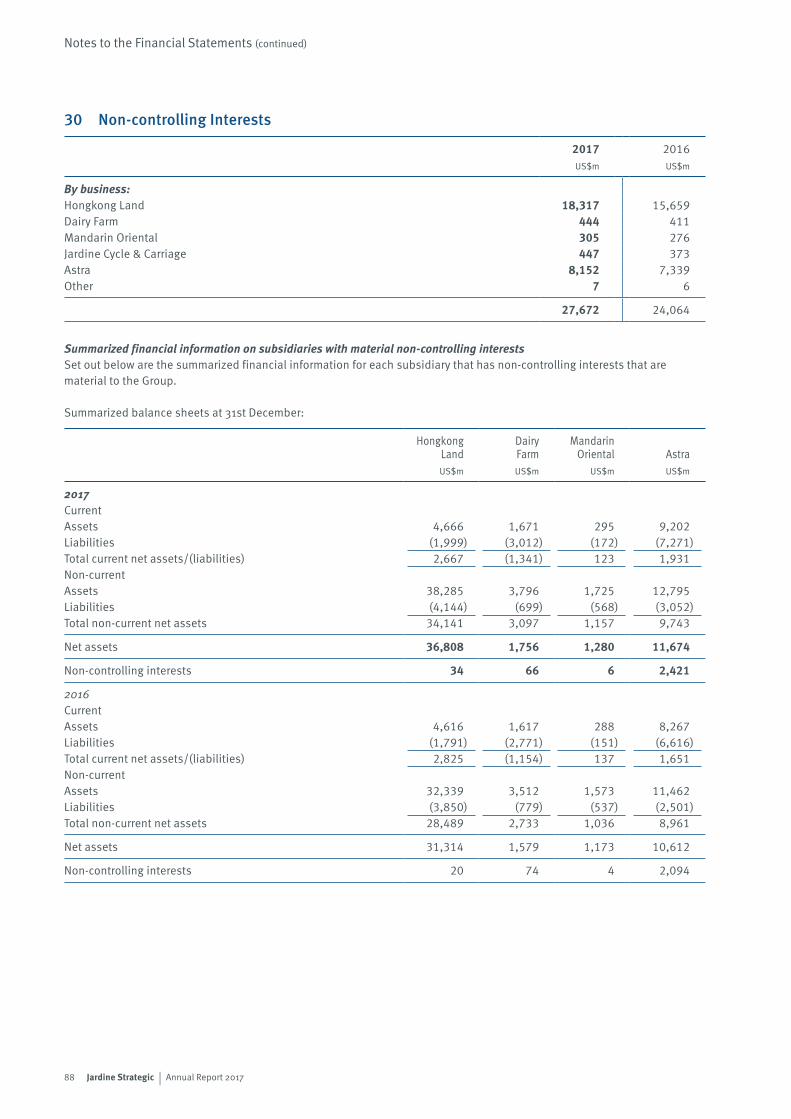
88 Jardine Strategic | Annual Report 2017
Notes to the Financial Statements (continued)
30 Non-controlling Interests
2017 2016US$m US$m
By business:Hongkong Land 18,317 15,659Dairy Farm 444 411Mandarin Oriental 305 276Jardine Cycle & Carriage 447 373Astra 8,152 7,339Other 7 6
27,672 24,064
Summarized financial information on subsidiaries with material non-controlling interestsSet out below are the summarized financial information for each subsidiary that has non-controlling interests that are material to the Group.
Summarized balance sheets at 31st December:
HongkongLand
DairyFarm
MandarinOriental Astra
US$m US$m US$m US$m
2017CurrentAssets 4,666 1,671 295 9,202Liabilities (1,999) (3,012) (172) (7,271)Total current net assets/(liabilities) 2,667 (1,341) 123 1,931Non-currentAssets 38,285 3,796 1,725 12,795Liabilities (4,144) (699) (568) (3,052)Total non-current net assets 34,141 3,097 1,157 9,743
Net assets 36,808 1,756 1,280 11,674
Non-controlling interests 34 66 6 2,421
2016CurrentAssets 4,616 1,617 288 8,267Liabilities (1,791) (2,771) (151) (6,616)Total current net assets/(liabilities) 2,825 (1,154) 137 1,651Non-currentAssets 32,339 3,512 1,573 11,462Liabilities (3,850) (779) (537) (2,501)Total non-current net assets 28,489 2,733 1,036 8,961
Net assets 31,314 1,579 1,173 10,612
Non-controlling interests 20 74 4 2,094
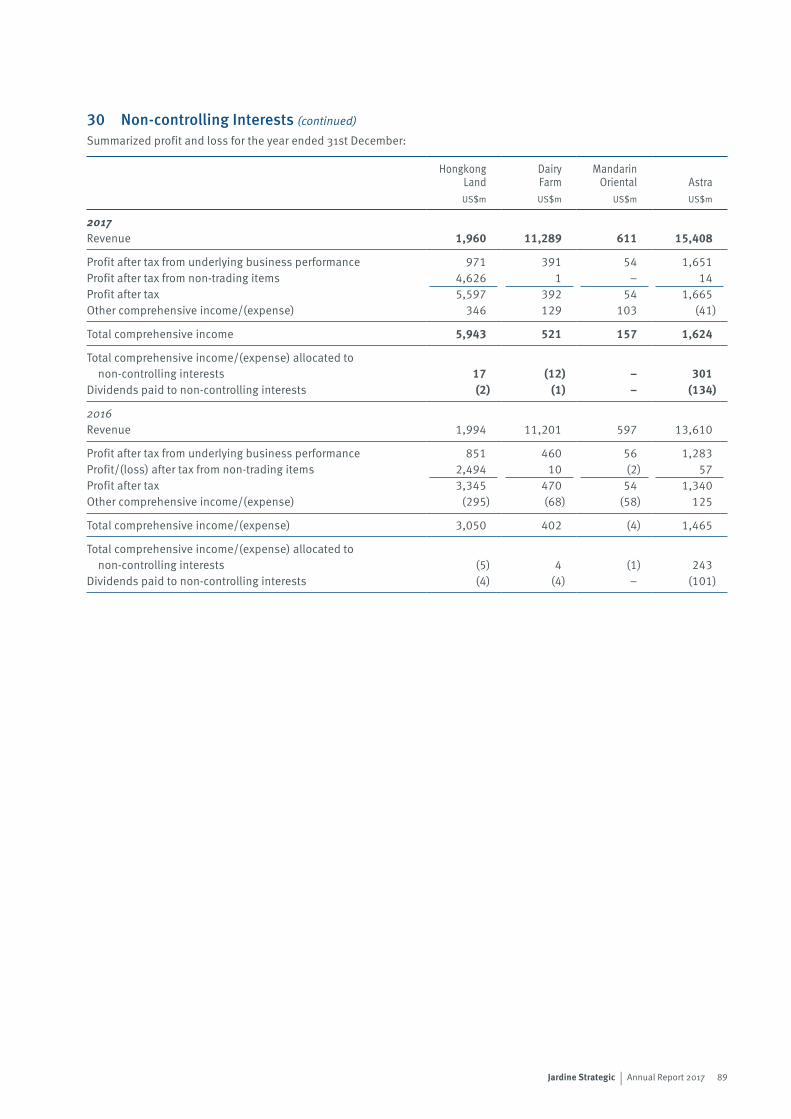
89Jardine Strategic | Annual Report 2017
30 Non-controlling Interests (continued)
Summarized profit and loss for the year ended 31st December:
HongkongLand
DairyFarm
MandarinOriental Astra
US$m US$m US$m US$m
2017Revenue 1,960 11,289 611 15,408
Profit after tax from underlying business performance 971 391 54 1,651Profit after tax from non-trading items 4,626 1 – 14Profit after tax 5,597 392 54 1,665Other comprehensive income/(expense) 346 129 103 (41)
Total comprehensive income 5,943 521 157 1,624
Total comprehensive income/(expense) allocated to non-controlling interests 17 (12) – 301
Dividends paid to non-controlling interests (2) (1) – (134)
2016Revenue 1,994 11,201 597 13,610
Profit after tax from underlying business performance 851 460 56 1,283Profit/(loss) after tax from non-trading items 2,494 10 (2) 57Profit after tax 3,345 470 54 1,340Other comprehensive income/(expense) (295) (68) (58) 125
Total comprehensive income/(expense) 3,050 402 (4) 1,465
Total comprehensive income/(expense) allocated to non-controlling interests (5) 4 (1) 243
Dividends paid to non-controlling interests (4) (4) – (101)
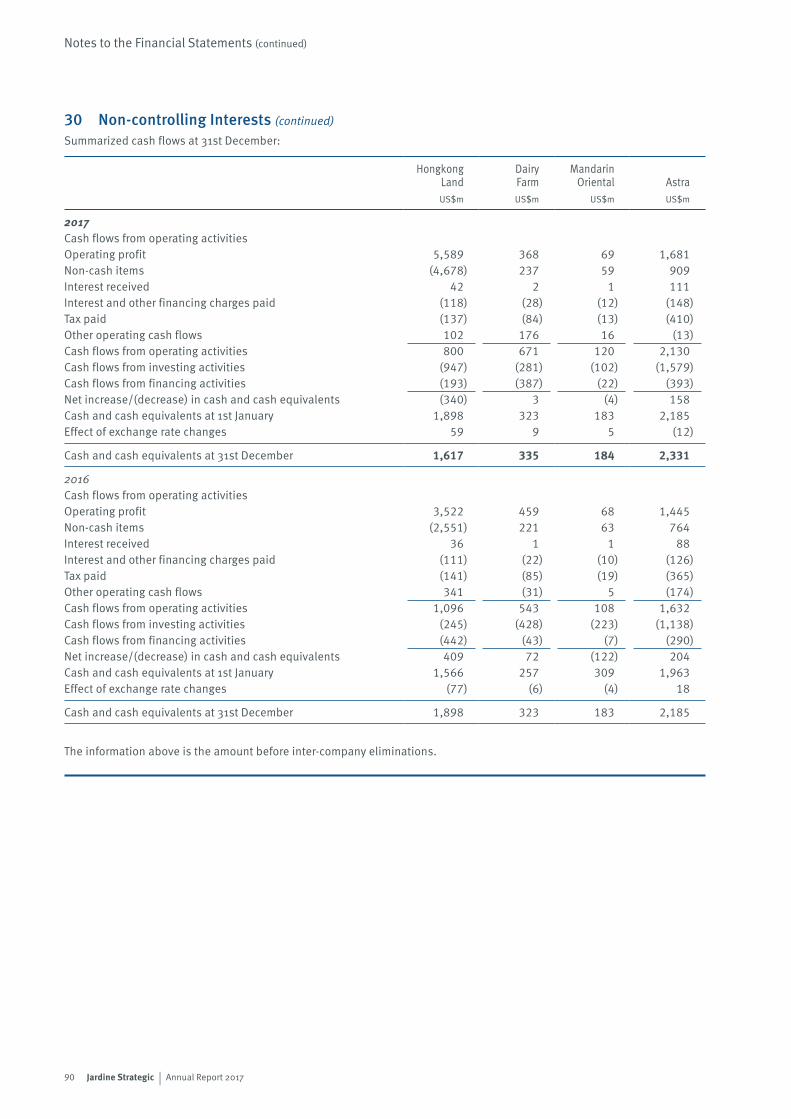
90 Jardine Strategic | Annual Report 2017
Notes to the Financial Statements (continued)
30 Non-controlling Interests (continued)
Summarized cash flows at 31st December:
HongkongLand
DairyFarm
MandarinOriental Astra
US$m US$m US$m US$m
2017Cash flows from operating activitiesOperating profit 5,589 368 69 1,681Non-cash items (4,678) 237 59 909Interest received 42 2 1 111Interest and other financing charges paid (118) (28) (12) (148)Tax paid (137) (84) (13) (410)Other operating cash flows 102 176 16 (13)Cash flows from operating activities 800 671 120 2,130Cash flows from investing activities (947) (281) (102) (1,579)Cash flows from financing activities (193) (387) (22) (393)Net increase/(decrease) in cash and cash equivalents (340) 3 (4) 158Cash and cash equivalents at 1st January 1,898 323 183 2,185Effect of exchange rate changes 59 9 5 (12)
Cash and cash equivalents at 31st December 1,617 335 184 2,331
2016Cash flows from operating activitiesOperating profit 3,522 459 68 1,445Non-cash items (2,551) 221 63 764Interest received 36 1 1 88Interest and other financing charges paid (111) (22) (10) (126)Tax paid (141) (85) (19) (365)Other operating cash flows 341 (31) 5 (174)Cash flows from operating activities 1,096 543 108 1,632Cash flows from investing activities (245) (428) (223) (1,138)Cash flows from financing activities (442) (43) (7) (290)Net increase/(decrease) in cash and cash equivalents 409 72 (122) 204Cash and cash equivalents at 1st January 1,566 257 309 1,963Effect of exchange rate changes (77) (6) (4) 18
Cash and cash equivalents at 31st December 1,898 323 183 2,185
The information above is the amount before inter-company eliminations.
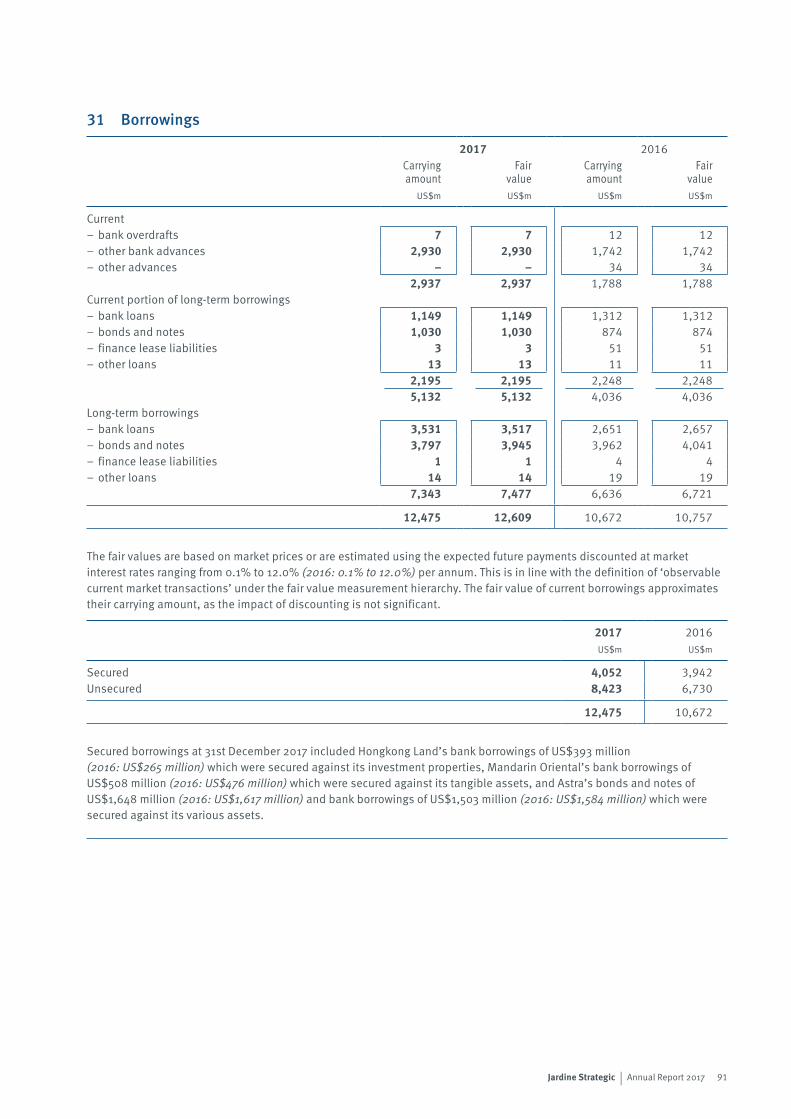
91Jardine Strategic | Annual Report 2017
31 Borrowings
2017 2016Carrying amount
Fair value
Carrying amount
Fair value
US$m US$m US$m US$m
Current– bank overdrafts 7 7 12 12– other bank advances 2,930 2,930 1,742 1,742– other advances – – 34 34
2,937 2,937 1,788 1,788Current portion of long-term borrowings– bank loans 1,149 1,149 1,312 1,312– bonds and notes 1,030 1,030 874 874– finance lease liabilities 3 3 51 51– other loans 13 13 11 11
2,195 2,195 2,248 2,2485,132 5,132 4,036 4,036
Long-term borrowings– bank loans 3,531 3,517 2,651 2,657– bonds and notes 3,797 3,945 3,962 4,041– finance lease liabilities 1 1 4 4– other loans 14 14 19 19
7,343 7,477 6,636 6,721
12,475 12,609 10,672 10,757
The fair values are based on market prices or are estimated using the expected future payments discounted at market interest rates ranging from 0.1% to 12.0% (2016: 0.1% to 12.0%) per annum. This is in line with the definition of ‘observable current market transactions’ under the fair value measurement hierarchy. The fair value of current borrowings approximates their carrying amount, as the impact of discounting is not significant.
2017 2016US$m US$m
Secured 4,052 3,942Unsecured 8,423 6,730
12,475 10,672
Secured borrowings at 31st December 2017 included Hongkong Land’s bank borrowings of US$393 million (2016: US$265 million) which were secured against its investment properties, Mandarin Oriental’s bank borrowings of US$508 million (2016: US$476 million) which were secured against its tangible assets, and Astra’s bonds and notes of US$1,648 million (2016: US$1,617 million) and bank borrowings of US$1,503 million (2016: US$1,584 million) which were secured against its various assets.
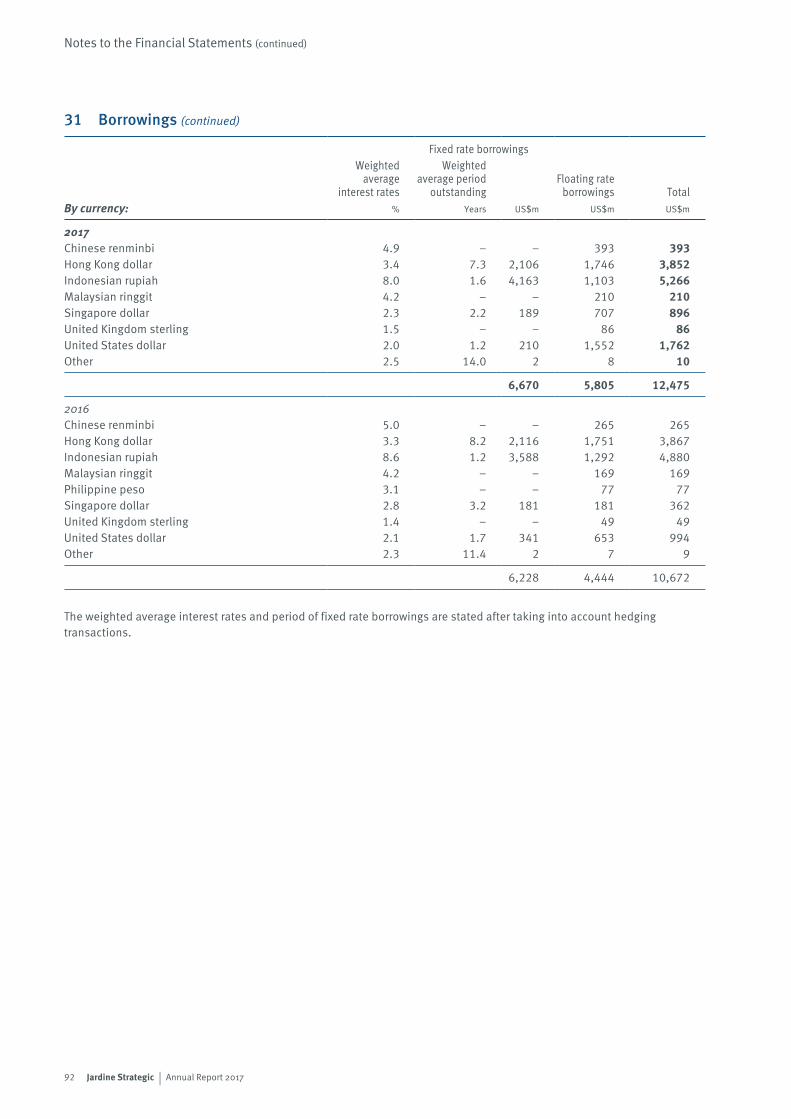
92 Jardine Strategic | Annual Report 2017
Notes to the Financial Statements (continued)
31 Borrowings (continued)
Fixed rate borrowingsWeighted
average interest rates
Weighted average period
outstandingFloating rate
borrowings TotalBy currency: % Years US$m US$m US$m
2017Chinese renminbi 4.9 – – 393 393Hong Kong dollar 3.4 7.3 2,106 1,746 3,852Indonesian rupiah 8.0 1.6 4,163 1,103 5,266Malaysian ringgit 4.2 – – 210 210Singapore dollar 2.3 2.2 189 707 896United Kingdom sterling 1.5 – – 86 86United States dollar 2.0 1.2 210 1,552 1,762Other 2.5 14.0 2 8 10
6,670 5,805 12,475
2016Chinese renminbi 5.0 – – 265 265Hong Kong dollar 3.3 8.2 2,116 1,751 3,867Indonesian rupiah 8.6 1.2 3,588 1,292 4,880Malaysian ringgit 4.2 – – 169 169Philippine peso 3.1 – – 77 77Singapore dollar 2.8 3.2 181 181 362United Kingdom sterling 1.4 – – 49 49United States dollar 2.1 1.7 341 653 994Other 2.3 11.4 2 7 9
6,228 4,444 10,672
The weighted average interest rates and period of fixed rate borrowings are stated after taking into account hedging transactions.
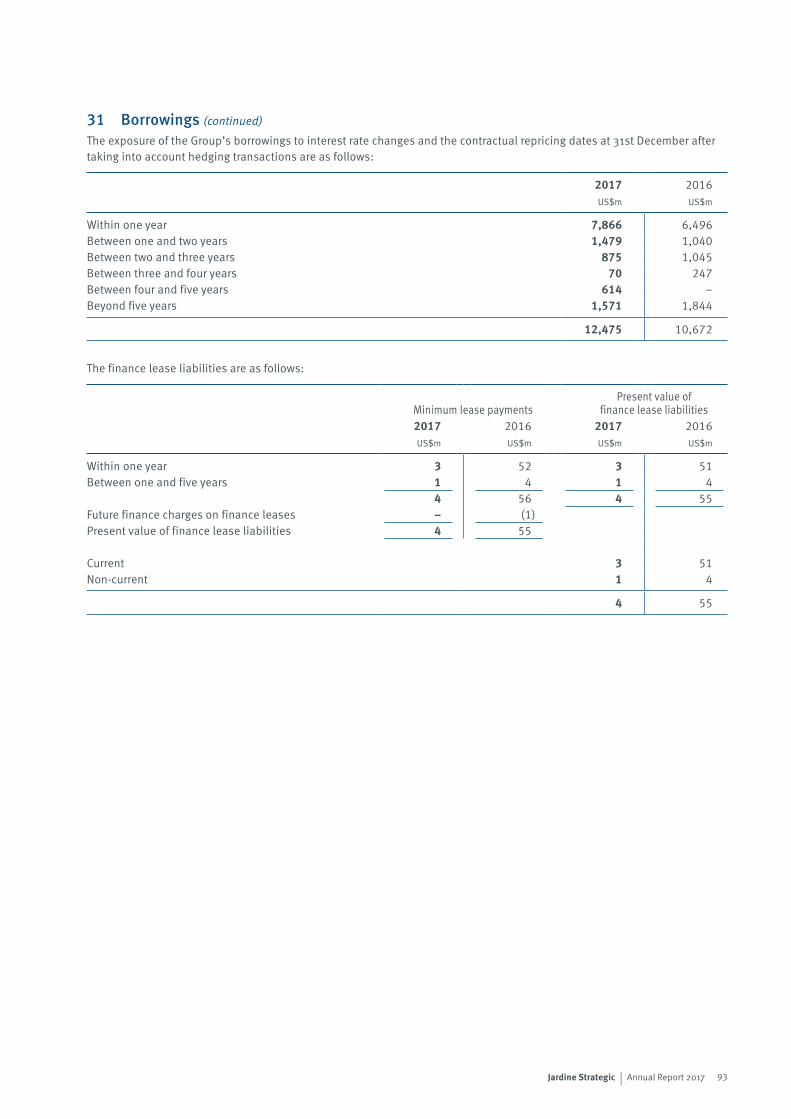
93Jardine Strategic | Annual Report 2017
31 Borrowings (continued)
The exposure of the Group’s borrowings to interest rate changes and the contractual repricing dates at 31st December after taking into account hedging transactions are as follows:
2017 2016US$m US$m
Within one year 7,866 6,496Between one and two years 1,479 1,040Between two and three years 875 1,045Between three and four years 70 247Between four and five years 614 –Beyond five years 1,571 1,844
12,475 10,672
The finance lease liabilities are as follows:
Minimum lease paymentsPresent value of
finance lease liabilities2017 2016 2017 2016US$m US$m US$m US$m
Within one year 3 52 3 51Between one and five years 1 4 1 4
4 56 4 55Future finance charges on finance leases – (1)Present value of finance lease liabilities 4 55
Current 3 51Non-current 1 4
4 55
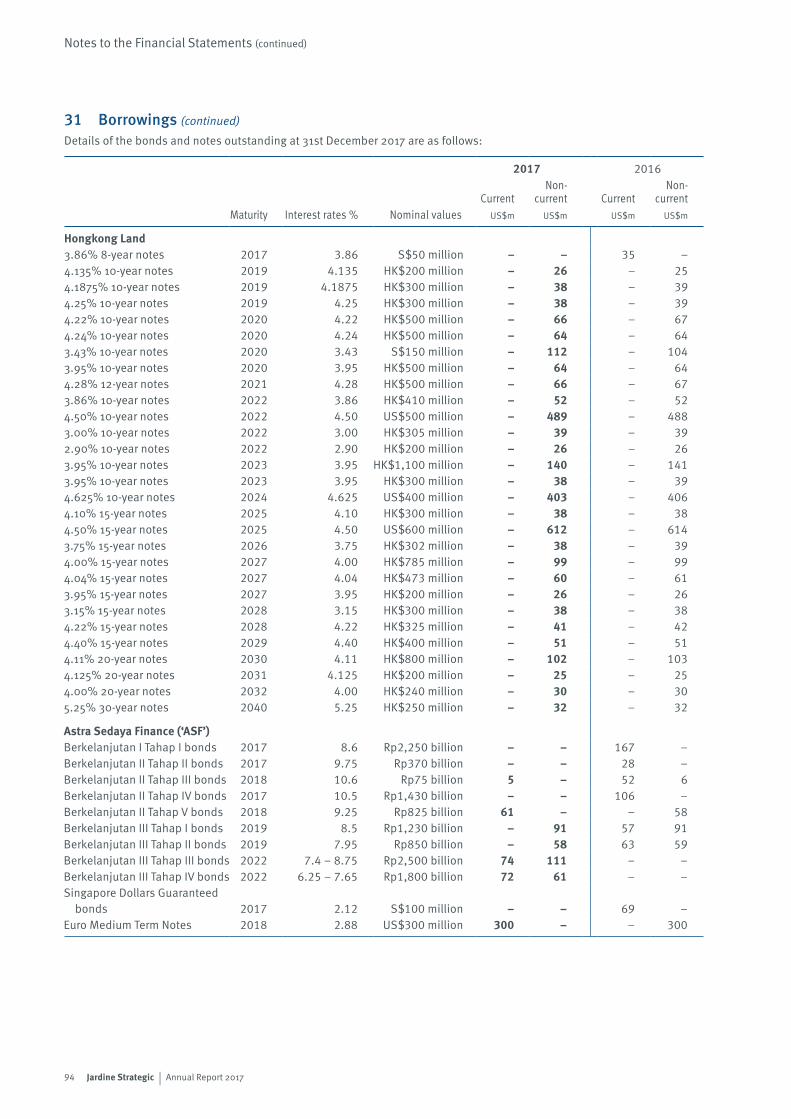
94 Jardine Strategic | Annual Report 2017
Notes to the Financial Statements (continued)
31 Borrowings (continued)
Details of the bonds and notes outstanding at 31st December 2017 are as follows:
2017 2016
CurrentNon-
current CurrentNon-
currentMaturity Interest rates % Nominal values US$m US$m US$m US$m
Hongkong Land3.86% 8-year notes 2017 3.86 S$50 million – – 35 –4.135% 10-year notes 2019 4.135 HK$200 million – 26 – 254.1875% 10-year notes 2019 4.1875 HK$300 million – 38 – 394.25% 10-year notes 2019 4.25 HK$300 million – 38 – 394.22% 10-year notes 2020 4.22 HK$500 million – 66 – 674.24% 10-year notes 2020 4.24 HK$500 million – 64 – 643.43% 10-year notes 2020 3.43 S$150 million – 112 – 1043.95% 10-year notes 2020 3.95 HK$500 million – 64 – 644.28% 12-year notes 2021 4.28 HK$500 million – 66 – 673.86% 10-year notes 2022 3.86 HK$410 million – 52 – 524.50% 10-year notes 2022 4.50 US$500 million – 489 – 4883.00% 10-year notes 2022 3.00 HK$305 million – 39 – 392.90% 10-year notes 2022 2.90 HK$200 million – 26 – 263.95% 10-year notes 2023 3.95 HK$1,100 million – 140 – 1413.95% 10-year notes 2023 3.95 HK$300 million – 38 – 394.625% 10-year notes 2024 4.625 US$400 million – 403 – 4064.10% 15-year notes 2025 4.10 HK$300 million – 38 – 384.50% 15-year notes 2025 4.50 US$600 million – 612 – 6143.75% 15-year notes 2026 3.75 HK$302 million – 38 – 394.00% 15-year notes 2027 4.00 HK$785 million – 99 – 994.04% 15-year notes 2027 4.04 HK$473 million – 60 – 613.95% 15-year notes 2027 3.95 HK$200 million – 26 – 263.15% 15-year notes 2028 3.15 HK$300 million – 38 – 384.22% 15-year notes 2028 4.22 HK$325 million – 41 – 424.40% 15-year notes 2029 4.40 HK$400 million – 51 – 514.11% 20-year notes 2030 4.11 HK$800 million – 102 – 1034.125% 20-year notes 2031 4.125 HK$200 million – 25 – 254.00% 20-year notes 2032 4.00 HK$240 million – 30 – 305.25% 30-year notes 2040 5.25 HK$250 million – 32 – 32
Astra Sedaya Finance (‘ASF’)Berkelanjutan I Tahap I bonds 2017 8.6 Rp2,250 billion – – 167 –Berkelanjutan II Tahap II bonds 2017 9.75 Rp370 billion – – 28 –Berkelanjutan II Tahap III bonds 2018 10.6 Rp75 billion 5 – 52 6Berkelanjutan II Tahap IV bonds 2017 10.5 Rp1,430 billion – – 106 –Berkelanjutan II Tahap V bonds 2018 9.25 Rp825 billion 61 – – 58Berkelanjutan III Tahap I bonds 2019 8.5 Rp1,230 billion – 91 57 91Berkelanjutan III Tahap II bonds 2019 7.95 Rp850 billion – 58 63 59Berkelanjutan III Tahap III bonds 2022 7.4 – 8.75 Rp2,500 billion 74 111 – –Berkelanjutan III Tahap IV bonds 2022 6.25 – 7.65 Rp1,800 billion 72 61 – –Singapore Dollars Guaranteed
bonds 2017 2.12 S$100 million – – 69 –Euro Medium Term Notes 2018 2.88 US$300 million 300 – – 300
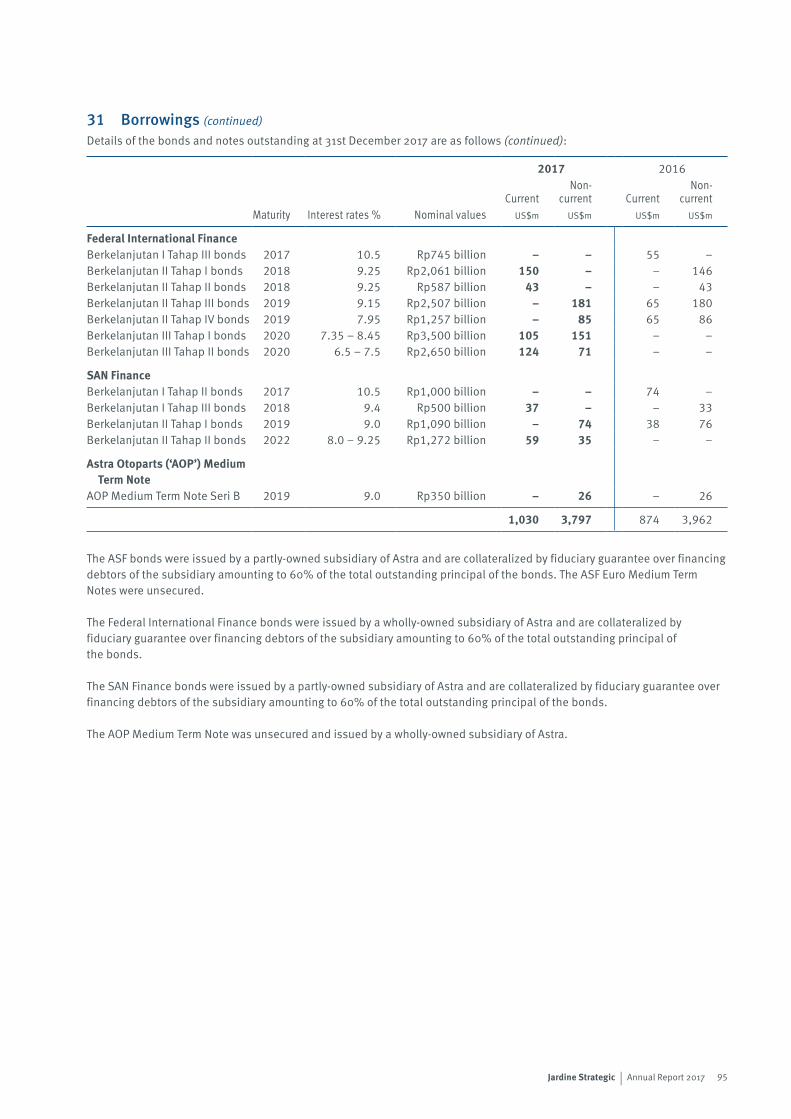
95Jardine Strategic | Annual Report 2017
31 Borrowings (continued)
Details of the bonds and notes outstanding at 31st December 2017 are as follows (continued):
2017 2016
CurrentNon-
current CurrentNon-
currentMaturity Interest rates % Nominal values US$m US$m US$m US$m
Federal International FinanceBerkelanjutan I Tahap III bonds 2017 10.5 Rp745 billion – – 55 –Berkelanjutan II Tahap I bonds 2018 9.25 Rp2,061 billion 150 – – 146Berkelanjutan II Tahap II bonds 2018 9.25 Rp587 billion 43 – – 43Berkelanjutan II Tahap III bonds 2019 9.15 Rp2,507 billion – 181 65 180Berkelanjutan II Tahap IV bonds 2019 7.95 Rp1,257 billion – 85 65 86Berkelanjutan III Tahap I bonds 2020 7.35 – 8.45 Rp3,500 billion 105 151 – –Berkelanjutan III Tahap II bonds 2020 6.5 – 7.5 Rp2,650 billion 124 71 – –
SAN FinanceBerkelanjutan I Tahap II bonds 2017 10.5 Rp1,000 billion – – 74 –Berkelanjutan I Tahap III bonds 2018 9.4 Rp500 billion 37 – – 33Berkelanjutan II Tahap I bonds 2019 9.0 Rp1,090 billion – 74 38 76Berkelanjutan II Tahap II bonds 2022 8.0 – 9.25 Rp1,272 billion 59 35 – –
Astra Otoparts (‘AOP’) Medium Term Note
AOP Medium Term Note Seri B 2019 9.0 Rp350 billion – 26 – 26
1,030 3,797 874 3,962
The ASF bonds were issued by a partly-owned subsidiary of Astra and are collateralized by fiduciary guarantee over financing debtors of the subsidiary amounting to 60% of the total outstanding principal of the bonds. The ASF Euro Medium Term Notes were unsecured.
The Federal International Finance bonds were issued by a wholly-owned subsidiary of Astra and are collateralized by fiduciary guarantee over financing debtors of the subsidiary amounting to 60% of the total outstanding principal of the bonds.
The SAN Finance bonds were issued by a partly-owned subsidiary of Astra and are collateralized by fiduciary guarantee over financing debtors of the subsidiary amounting to 60% of the total outstanding principal of the bonds.
The AOP Medium Term Note was unsecured and issued by a wholly-owned subsidiary of Astra.
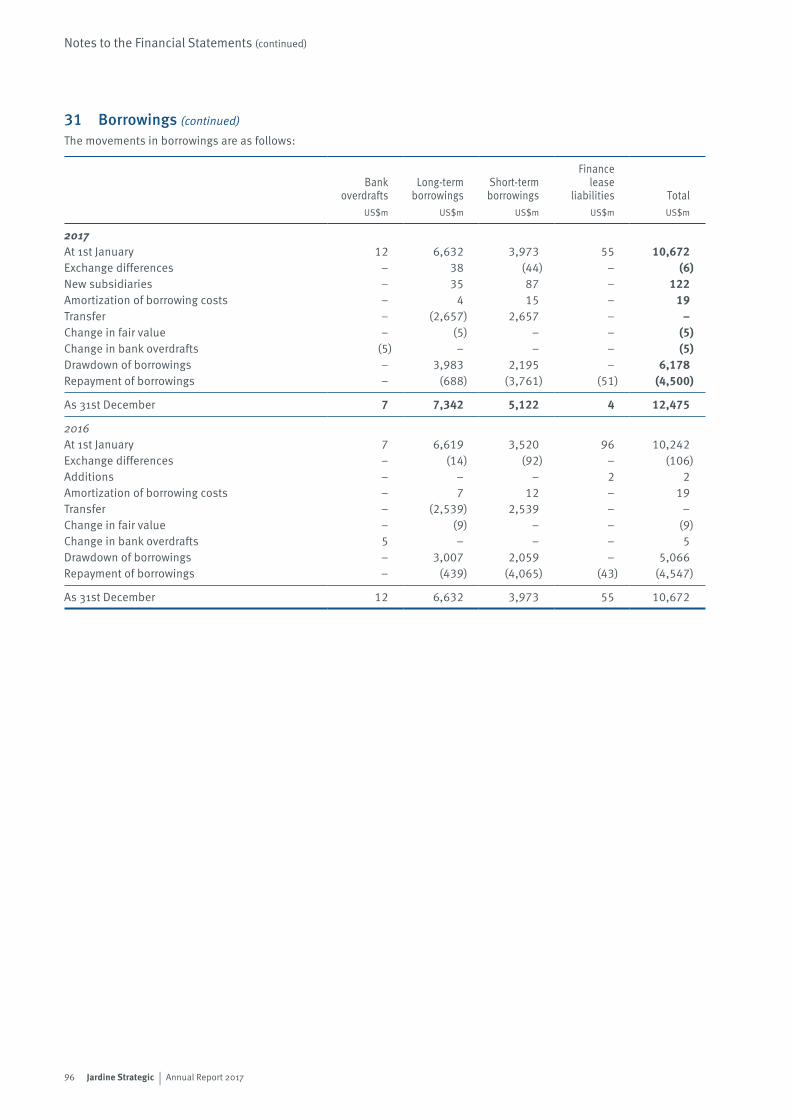
96 Jardine Strategic | Annual Report 2017
Notes to the Financial Statements (continued)
31 Borrowings (continued)
The movements in borrowings are as follows:
Bank overdrafts
Long-term borrowings
Short-term borrowings
Finance lease
liabilities TotalUS$m US$m US$m US$m US$m
2017At 1st January 12 6,632 3,973 55 10,672Exchange differences – 38 (44) – (6)New subsidiaries – 35 87 – 122Amortization of borrowing costs – 4 15 – 19Transfer – (2,657) 2,657 – –Change in fair value – (5) – – (5)Change in bank overdrafts (5) – – – (5)Drawdown of borrowings – 3,983 2,195 – 6,178Repayment of borrowings – (688) (3,761) (51) (4,500)
As 31st December 7 7,342 5,122 4 12,475
2016At 1st January 7 6,619 3,520 96 10,242Exchange differences – (14) (92) – (106)Additions – – – 2 2Amortization of borrowing costs – 7 12 – 19Transfer – (2,539) 2,539 – –Change in fair value – (9) – – (9)Change in bank overdrafts 5 – – – 5Drawdown of borrowings – 3,007 2,059 – 5,066Repayment of borrowings – (439) (4,065) (43) (4,547)
As 31st December 12 6,632 3,973 55 10,672
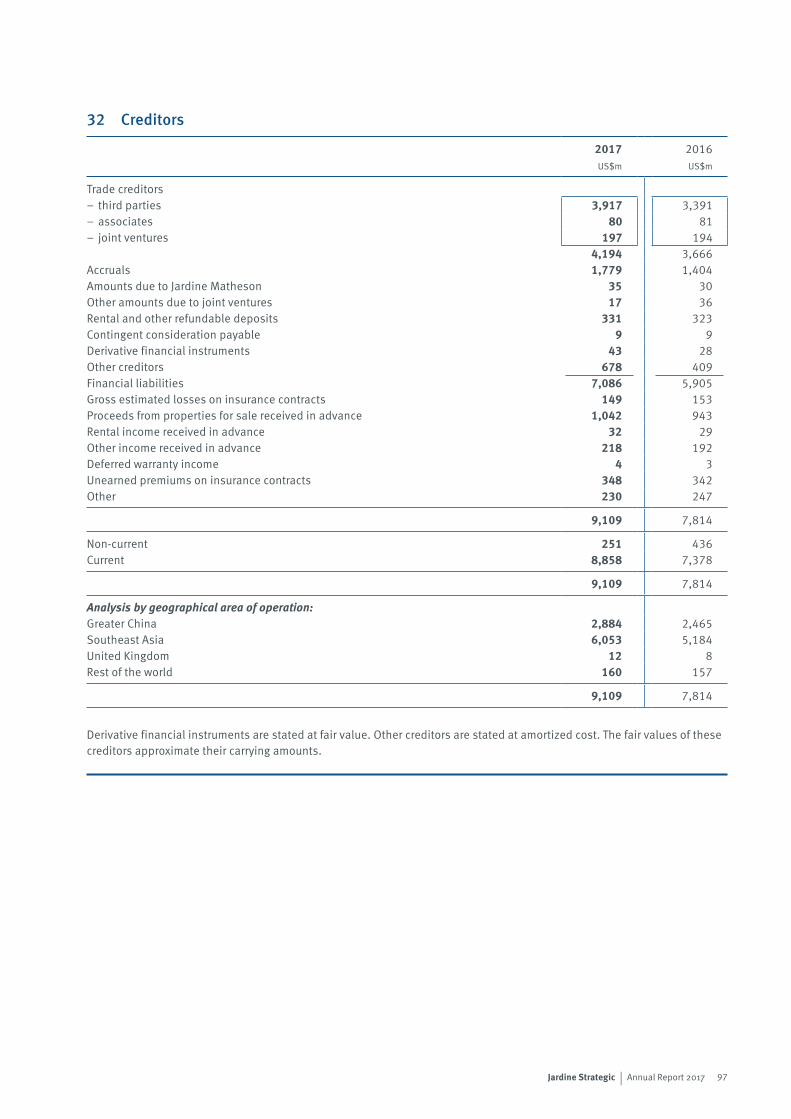
97Jardine Strategic | Annual Report 2017
32 Creditors
2017 2016US$m US$m
Trade creditors– third parties 3,917 3,391– associates 80 81– joint ventures 197 194
4,194 3,666Accruals 1,779 1,404Amounts due to Jardine Matheson 35 30Other amounts due to joint ventures 17 36Rental and other refundable deposits 331 323Contingent consideration payable 9 9Derivative financial instruments 43 28Other creditors 678 409Financial liabilities 7,086 5,905Gross estimated losses on insurance contracts 149 153Proceeds from properties for sale received in advance 1,042 943Rental income received in advance 32 29Other income received in advance 218 192Deferred warranty income 4 3Unearned premiums on insurance contracts 348 342Other 230 247
9,109 7,814
Non-current 251 436Current 8,858 7,378
9,109 7,814
Analysis by geographical area of operation:Greater China 2,884 2,465Southeast Asia 6,053 5,184United Kingdom 12 8Rest of the world 160 157
9,109 7,814
Derivative financial instruments are stated at fair value. Other creditors are stated at amortized cost. The fair values of these creditors approximate their carrying amounts.
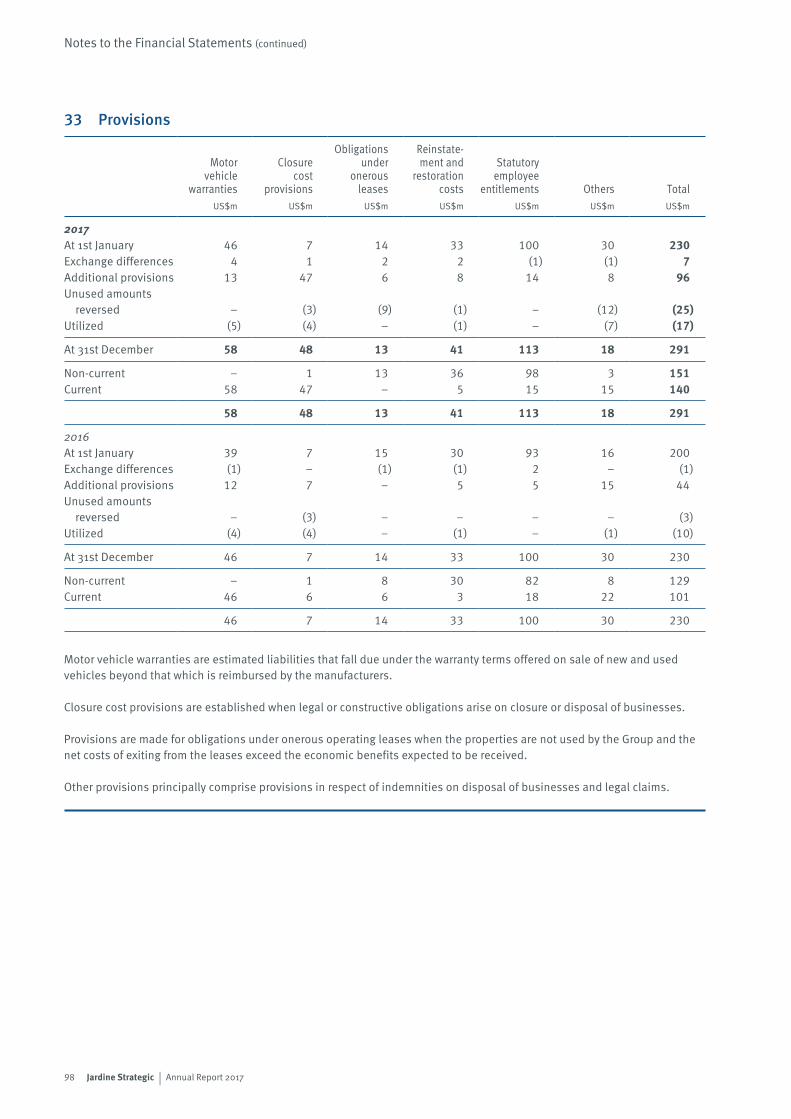
98 Jardine Strategic | Annual Report 2017
Notes to the Financial Statements (continued)
33 Provisions
Motor vehicle
warranties
Closure cost
provisions
Obligations under
onerous leases
Reinstate-ment and
restoration costs
Statutory employee
entitlements Others TotalUS$m US$m US$m US$m US$m US$m US$m
2017At 1st January 46 7 14 33 100 30 230Exchange differences 4 1 2 2 (1) (1) 7Additional provisions 13 47 6 8 14 8 96Unused amounts
reversed – (3) (9) (1) – (12) (25)Utilized (5) (4) – (1) – (7) (17)
At 31st December 58 48 13 41 113 18 291
Non-current – 1 13 36 98 3 151Current 58 47 – 5 15 15 140
58 48 13 41 113 18 291
2016At 1st January 39 7 15 30 93 16 200Exchange differences (1) – (1) (1) 2 – (1)Additional provisions 12 7 – 5 5 15 44Unused amounts
reversed – (3) – – – – (3)Utilized (4) (4) – (1) – (1) (10)
At 31st December 46 7 14 33 100 30 230
Non-current – 1 8 30 82 8 129Current 46 6 6 3 18 22 101
46 7 14 33 100 30 230
Motor vehicle warranties are estimated liabilities that fall due under the warranty terms offered on sale of new and used vehicles beyond that which is reimbursed by the manufacturers.
Closure cost provisions are established when legal or constructive obligations arise on closure or disposal of businesses.
Provisions are made for obligations under onerous operating leases when the properties are not used by the Group and the net costs of exiting from the leases exceed the economic benefits expected to be received.
Other provisions principally comprise provisions in respect of indemnities on disposal of businesses and legal claims.
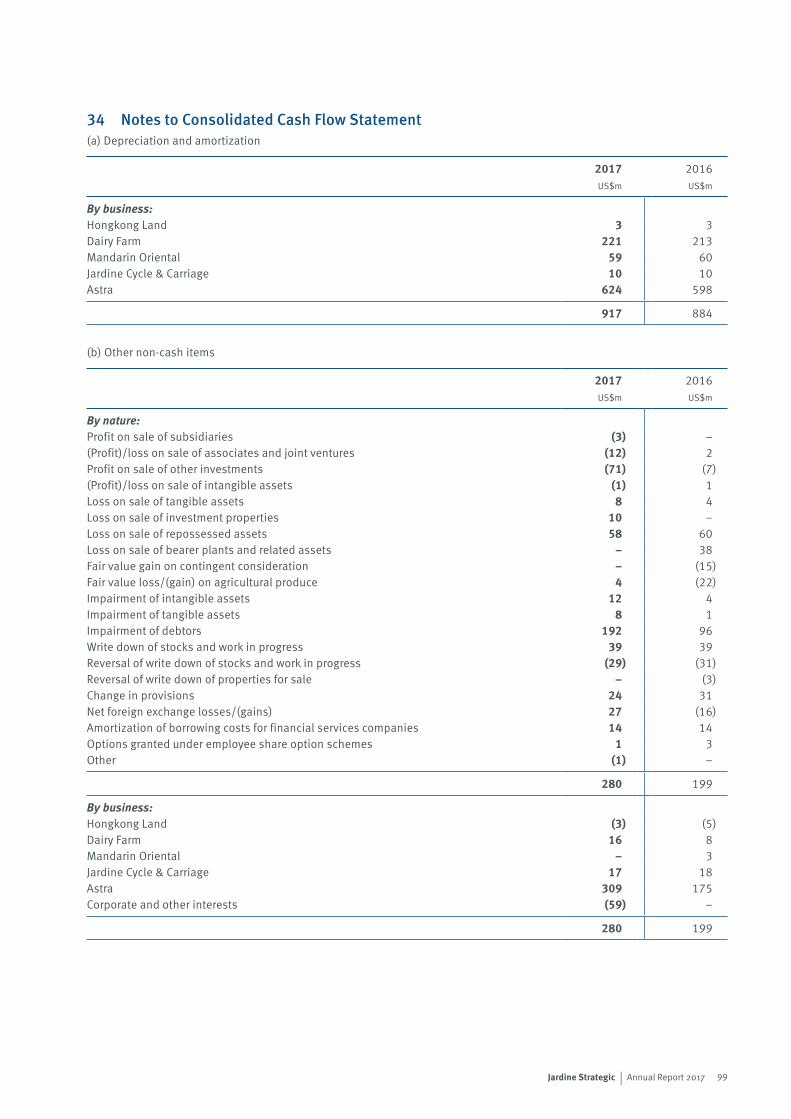
99Jardine Strategic | Annual Report 2017
34 Notes to Consolidated Cash Flow Statement(a) Depreciation and amortization
2017 2016US$m US$m
By business:Hongkong Land 3 3Dairy Farm 221 213Mandarin Oriental 59 60Jardine Cycle & Carriage 10 10Astra 624 598
917 884
(b) Other non-cash items
2017 2016US$m US$m
By nature:Profit on sale of subsidiaries (3) –(Profit)/loss on sale of associates and joint ventures (12) 2Profit on sale of other investments (71) (7)(Profit)/loss on sale of intangible assets (1) 1Loss on sale of tangible assets 8 4Loss on sale of investment properties 10 –Loss on sale of repossessed assets 58 60Loss on sale of bearer plants and related assets – 38Fair value gain on contingent consideration – (15)Fair value loss/(gain) on agricultural produce 4 (22)Impairment of intangible assets 12 4Impairment of tangible assets 8 1Impairment of debtors 192 96Write down of stocks and work in progress 39 39Reversal of write down of stocks and work in progress (29) (31)Reversal of write down of properties for sale – (3)Change in provisions 24 31Net foreign exchange losses/(gains) 27 (16)Amortization of borrowing costs for financial services companies 14 14Options granted under employee share option schemes 1 3Other (1) –
280 199
By business:Hongkong Land (3) (5)Dairy Farm 16 8Mandarin Oriental – 3Jardine Cycle & Carriage 17 18Astra 309 175Corporate and other interests (59) –
280 199
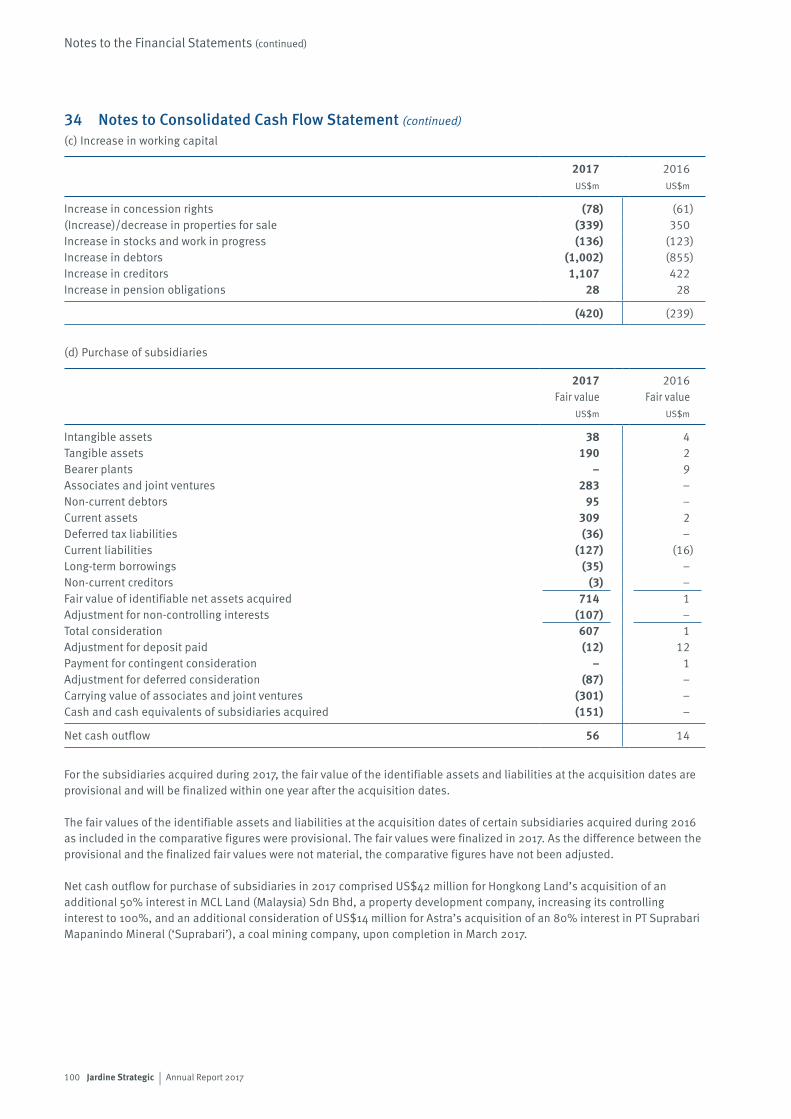
100 Jardine Strategic | Annual Report 2017
Notes to the Financial Statements (continued)
34 Notes to Consolidated Cash Flow Statement (continued)
(c) Increase in working capital
2017 2016US$m US$m
Increase in concession rights (78) (61)(Increase)/decrease in properties for sale (339) 350Increase in stocks and work in progress (136) (123)Increase in debtors (1,002) (855)Increase in creditors 1,107 422Increase in pension obligations 28 28
(420) (239)
(d) Purchase of subsidiaries
2017 2016Fair value Fair value
US$m US$m
Intangible assets 38 4Tangible assets 190 2Bearer plants – 9Associates and joint ventures 283 –Non-current debtors 95 –Current assets 309 2Deferred tax liabilities (36) –Current liabilities (127) (16)Long-term borrowings (35) –Non-current creditors (3) –Fair value of identifiable net assets acquired 714 1Adjustment for non-controlling interests (107) –Total consideration 607 1Adjustment for deposit paid (12) 12Payment for contingent consideration – 1Adjustment for deferred consideration (87) –Carrying value of associates and joint ventures (301) –Cash and cash equivalents of subsidiaries acquired (151) –
Net cash outflow 56 14
For the subsidiaries acquired during 2017, the fair value of the identifiable assets and liabilities at the acquisition dates are provisional and will be finalized within one year after the acquisition dates.
The fair values of the identifiable assets and liabilities at the acquisition dates of certain subsidiaries acquired during 2016 as included in the comparative figures were provisional. The fair values were finalized in 2017. As the difference between the provisional and the finalized fair values were not material, the comparative figures have not been adjusted.
Net cash outflow for purchase of subsidiaries in 2017 comprised US$42 million for Hongkong Land’s acquisition of an additional 50% interest in MCL Land (Malaysia) Sdn Bhd, a property development company, increasing its controlling interest to 100%, and an additional consideration of US$14 million for Astra’s acquisition of an 80% interest in PT Suprabari Mapanindo Mineral (‘Suprabari’), a coal mining company, upon completion in March 2017.
101Jardine Strategic | Annual Report 2017
34 Notes to Consolidated Cash Flow Statement (continued)
(d) Purchase of subsidiaries (continued)Net cash outflow in 2016 included US$12 million deposit paid for Astra’s acquisition of the above-mentioned 80% interest in Suprabari.
None of the goodwill is expected to be deductible for tax purposes.
Revenue and loss after tax since acquisition in respect of subsidiaries acquired during the year amounted to US$22 million and US$19 million, respectively. Had the acquisitions occurred on 1st January 2017, consolidated revenue and profit after tax for the year ended 31st December 2017 would have been US$31,564 million and US$8,213 million, respectively.
(e) Purchase of associates and joint ventures in 2017 included Hongkong Land’s investments in mainland China, Thailand and Vietnam for a total of US$438 million; Jardine Cycle & Carriage’s subscription to rights issue and purchase of additional shares in Siam City Cement Public Company Limited in Thailand of US$138 million, increasing its interest from 24.9% to 25.5%; Astra’s investments in toll road concessions of US$274 million and a 25% interest in power plants of US$207 million in Indonesia, and subscription to PT Bank Permata’s rights issue of US$44 million; and the Company’s acquisition of a 28% interest in Greatview Aseptic Packaging Company Limited, an aseptic carton packaging supplier, of US$241 million and additional investment in Zhongsheng of US$172 million, increasing its interest from 15.5% to 20.0%.
Purchase in 2016 included US$190 million for Dairy Farm’s further investment in Yonghui; US$240 million for Astra’s subscription to rights issue and capital advance to PT Bank Permata; US$70 million for Hongkong Land’s investment in mainland China; US$74 million for Astra’s investment in Indonesia, and US$57 million for Hongkong Land’s and Astra’s 50% joint investment in an Indonesian residential project.
(f ) Purchase of other investments in 2017 comprised US$1,160 million for acquisition of a 10% interest in Vietnam Dairy Products by Jardine Cycle & Carriage and US$449 million for acquisition of securities by Astra.
Purchase in 2016 mainly included US$208 million for Astra’s acquisition of securities and US$84 million for the Company’s acquisition of an additional 4% interest in Zhongsheng.
(g) Advance to associates and joint ventures in 2017 and 2016 mainly included Hongkong Land’s advance to its property joint ventures.
(h) Advance and repayment from associates and joint ventures in 2017 and 2016 mainly included advance and repayment from Hongkong Land’s property joint ventures.
(i) Sale of subsidiaries in 2017 included US$83 million for disposal of a mutual fund company by Astra.
(j) Sale of other investments in 2017 mainly included disposal of securities by Astra and the Company of US$261 million and US$95 million, respectively.
Sale of other investments in 2016 comprised Astra’s sale of securities.
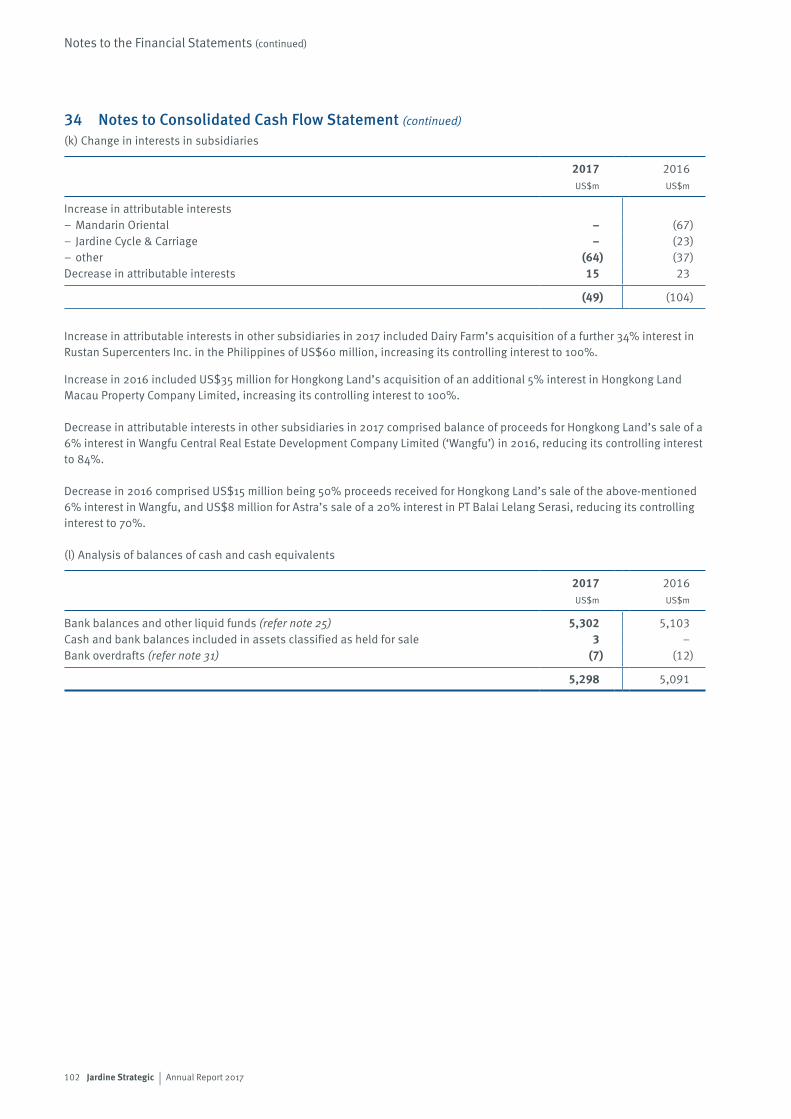
102 Jardine Strategic | Annual Report 2017
Notes to the Financial Statements (continued)
34 Notes to Consolidated Cash Flow Statement (continued)
(k) Change in interests in subsidiaries
2017 2016US$m US$m
Increase in attributable interests– Mandarin Oriental – (67)– Jardine Cycle & Carriage – (23)– other (64) (37)Decrease in attributable interests 15 23
(49) (104)
Increase in attributable interests in other subsidiaries in 2017 included Dairy Farm’s acquisition of a further 34% interest in Rustan Supercenters Inc. in the Philippines of US$60 million, increasing its controlling interest to 100%.
Increase in 2016 included US$35 million for Hongkong Land’s acquisition of an additional 5% interest in Hongkong Land Macau Property Company Limited, increasing its controlling interest to 100%.
Decrease in attributable interests in other subsidiaries in 2017 comprised balance of proceeds for Hongkong Land’s sale of a 6% interest in Wangfu Central Real Estate Development Company Limited (‘Wangfu’) in 2016, reducing its controlling interest to 84%.
Decrease in 2016 comprised US$15 million being 50% proceeds received for Hongkong Land’s sale of the above-mentioned 6% interest in Wangfu, and US$8 million for Astra’s sale of a 20% interest in PT Balai Lelang Serasi, reducing its controlling interest to 70%.
(l) Analysis of balances of cash and cash equivalents
2017 2016US$m US$m
Bank balances and other liquid funds (refer note 25) 5,302 5,103Cash and bank balances included in assets classified as held for sale 3 –Bank overdrafts (refer note 31) (7) (12)
5,298 5,091
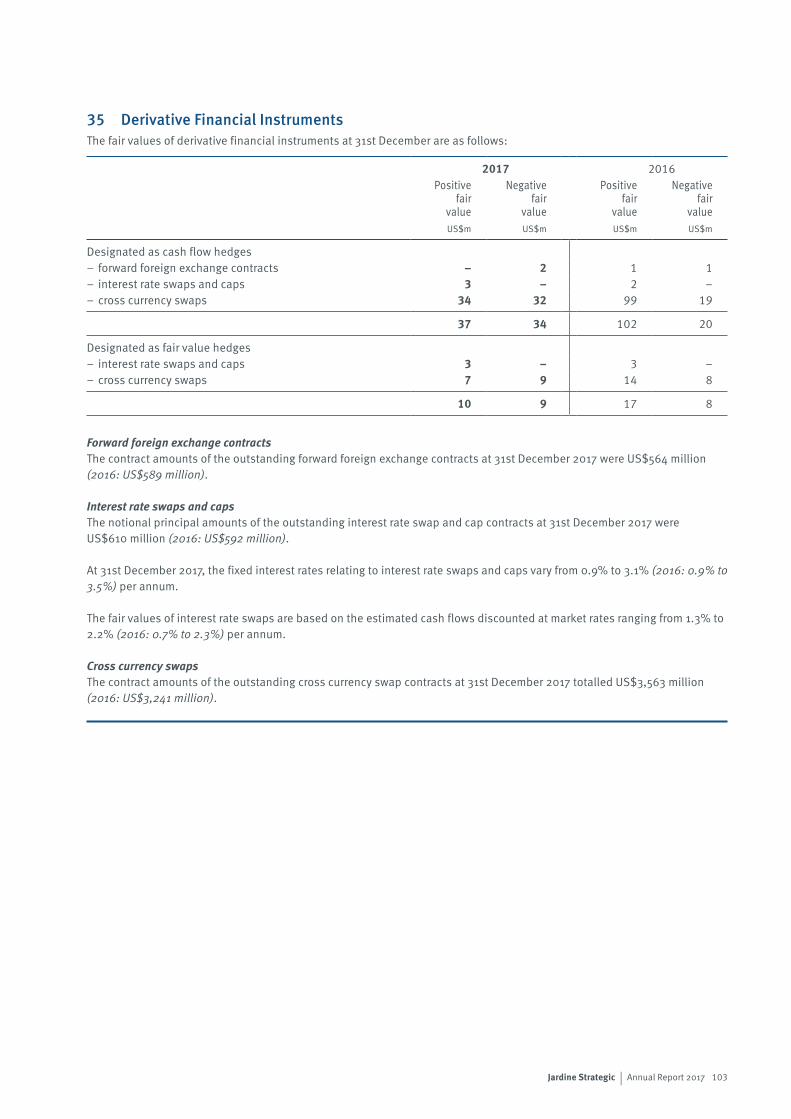
103Jardine Strategic | Annual Report 2017
35 Derivative Financial InstrumentsThe fair values of derivative financial instruments at 31st December are as follows:
2017 2016Positive
fair value
Negative fair
value
Positive fair
value
Negative fair
valueUS$m US$m US$m US$m
Designated as cash flow hedges– forward foreign exchange contracts – 2 1 1– interest rate swaps and caps 3 – 2 –– cross currency swaps 34 32 99 19
37 34 102 20
Designated as fair value hedges– interest rate swaps and caps 3 – 3 –– cross currency swaps 7 9 14 8
10 9 17 8
Forward foreign exchange contractsThe contract amounts of the outstanding forward foreign exchange contracts at 31st December 2017 were US$564 million (2016: US$589 million).
Interest rate swaps and capsThe notional principal amounts of the outstanding interest rate swap and cap contracts at 31st December 2017 were US$610 million (2016: US$592 million).
At 31st December 2017, the fixed interest rates relating to interest rate swaps and caps vary from 0.9% to 3.1% (2016: 0.9% to 3.5%) per annum.
The fair values of interest rate swaps are based on the estimated cash flows discounted at market rates ranging from 1.3% to 2.2% (2016: 0.7% to 2.3%) per annum.
Cross currency swapsThe contract amounts of the outstanding cross currency swap contracts at 31st December 2017 totalled US$3,563 million (2016: US$3,241 million).
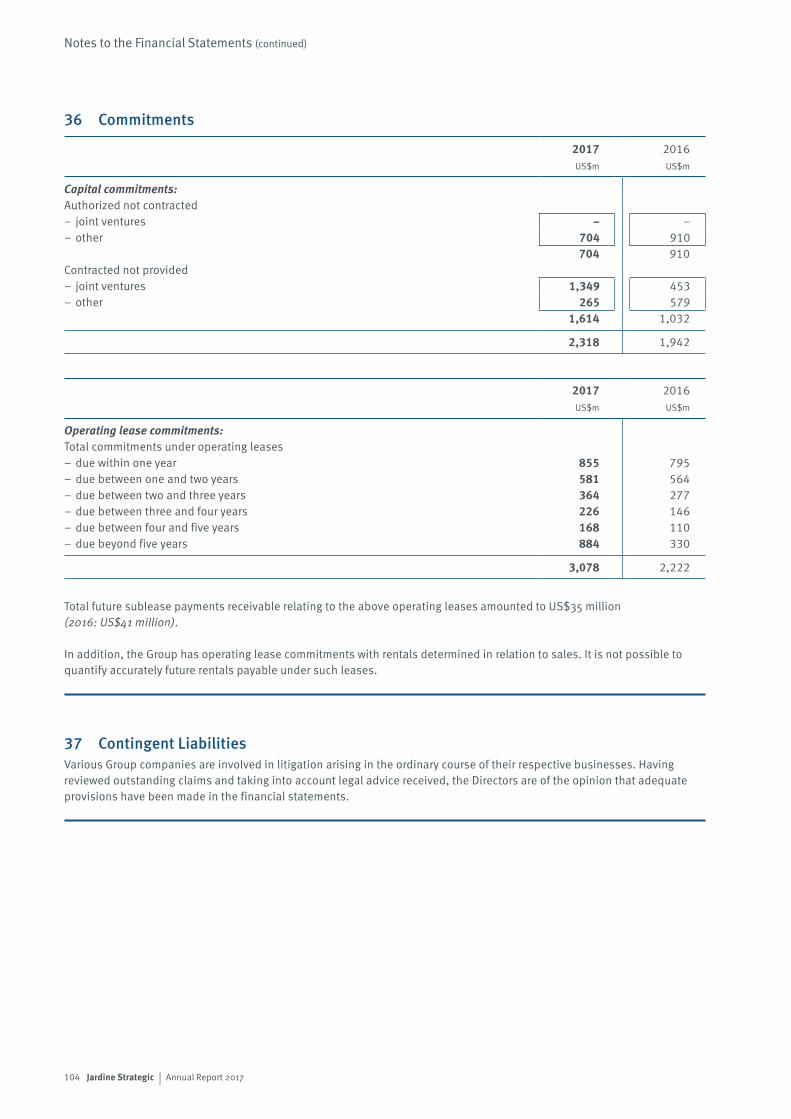
104 Jardine Strategic | Annual Report 2017
Notes to the Financial Statements (continued)
36 Commitments
2017 2016US$m US$m
Capital commitments:Authorized not contracted– joint ventures – –– other 704 910
704 910Contracted not provided– joint ventures 1,349 453– other 265 579
1,614 1,032
2,318 1,942
2017 2016US$m US$m
Operating lease commitments:Total commitments under operating leases– due within one year 855 795– due between one and two years 581 564– due between two and three years 364 277– due between three and four years 226 146– due between four and five years 168 110– due beyond five years 884 330
3,078 2,222
Total future sublease payments receivable relating to the above operating leases amounted to US$35 million (2016: US$41 million).
In addition, the Group has operating lease commitments with rentals determined in relation to sales. It is not possible to quantify accurately future rentals payable under such leases.
37 Contingent LiabilitiesVarious Group companies are involved in litigation arising in the ordinary course of their respective businesses. Having reviewed outstanding claims and taking into account legal advice received, the Directors are of the opinion that adequate provisions have been made in the financial statements.
105Jardine Strategic | Annual Report 2017
38 Related Party TransactionsThe ultimate holding company of the Group is Jardine Matheson Holdings Limited (‘Jardine Matheson’), a company incorporated in Bermuda. As at 31st December 2017, the Company held a 57% (2016: 57%) interest in Jardine Matheson.
In accordance with the Bye-Laws of the Company, Jardine Matheson Limited, a wholly-owned subsidiary of Jardine Matheson, has been appointed General Manager of the Company under a General Manager Agreement. With effect from 1st January 2008, Jardine Matheson Limited has sub-delegated certain of its responsibilities under the agreement to a fellow subsidiary. Total fees payable for services provided to the Company in 2017 amounted to US$141 million (2016: US$123 million).
In the normal course of business the Group undertakes a variety of transactions with Jardine Matheson, and with certain of its associates and joint ventures.
The most significant of such transactions relate to the purchases of motor vehicles and spare parts from its associates and joint ventures in Indonesia including PT Toyota-Astra Motor, PT Astra Honda Motor and PT Astra Daihatsu Motor. Total cost of motor vehicles and spare parts purchased in 2017 amounted to US$5,272 million (2016: US$5,325 million). The Group also sells motor vehicles and spare parts to its associates and joint ventures in Indonesia including PT Astra Honda Motor, PT Astra Daihatsu Motor and PT Tunas Ridean. Total revenue from sale of motor vehicles and spare parts in 2017 amounted to US$599 million (2016: US$601 million).
The Group uses Jardine Lloyd Thompson to place certain of its insurance. Brokerage fees and commissions, net of rebates, paid in 2017 to Jardine Lloyd Thompson were US$6 million (2016: US$5 million).
The Group manages six (2016: six) associate and joint venture hotels . Management fees received by the Group in 2017 from these managed hotels amounted to US$14 million (2016: US$13 million).
PT Bank Permata provides banking services to the Group. The Group’s deposits with PT Bank Permata at 31st December 2017 amounted to US$588 million (2016: US$328 million).
Amounts of outstanding balances with Jardine Matheson, associates and joint ventures are included in debtors and creditors, as appropriate (refer notes 20 and 32). A subsidiary of the Company has also committed to provide loan facilities to a subsidiary of Jardine Matheson. Undrawn facilities at 31st December 2017 amounted to US$400 million (2016: US$400 million).
Details of Directors’ remuneration (being the key management personnel compensation) are shown on page 118 under the heading of Directors’ Appointment, Retirement, Remuneration and Service Contracts.
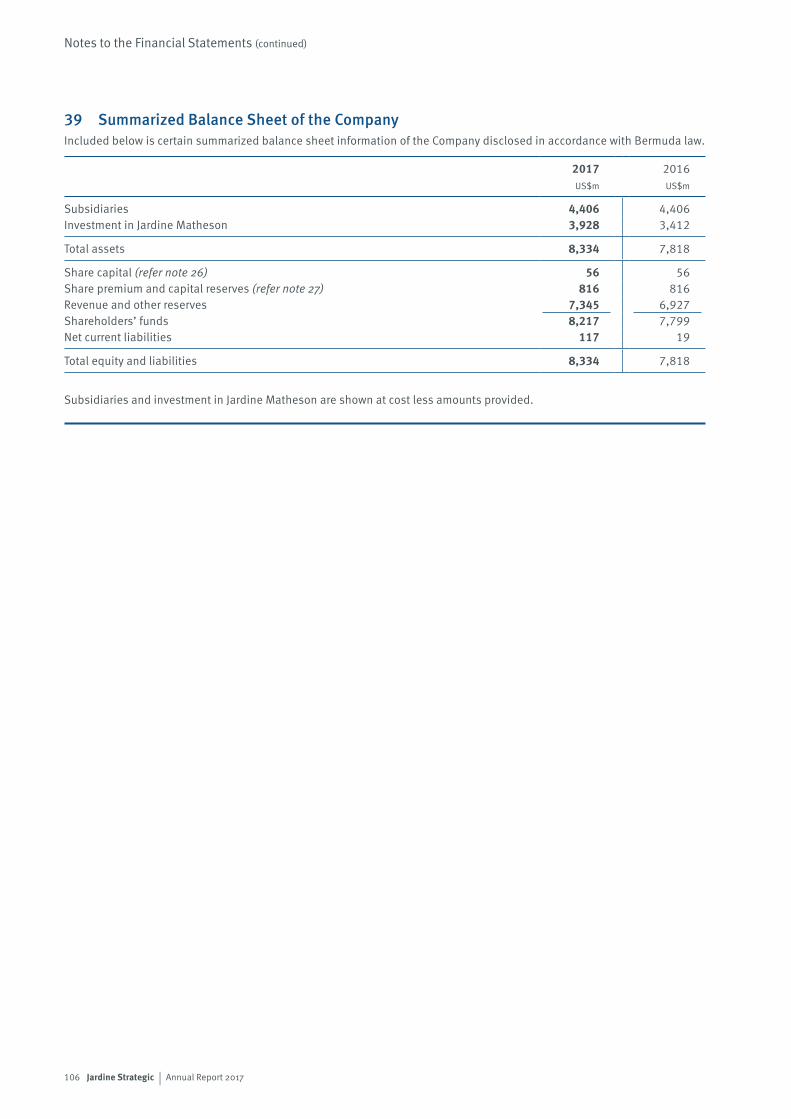
106 Jardine Strategic | Annual Report 2017
Notes to the Financial Statements (continued)
39 Summarized Balance Sheet of the CompanyIncluded below is certain summarized balance sheet information of the Company disclosed in accordance with Bermuda law.
2017 2016US$m US$m
Subsidiaries 4,406 4,406Investment in Jardine Matheson 3,928 3,412
Total assets 8,334 7,818
Share capital (refer note 26) 56 56Share premium and capital reserves (refer note 27) 816 816Revenue and other reserves 7,345 6,927Shareholders’ funds 8,217 7,799Net current liabilities 117 19
Total equity and liabilities 8,334 7,818
Subsidiaries and investment in Jardine Matheson are shown at cost less amounts provided.
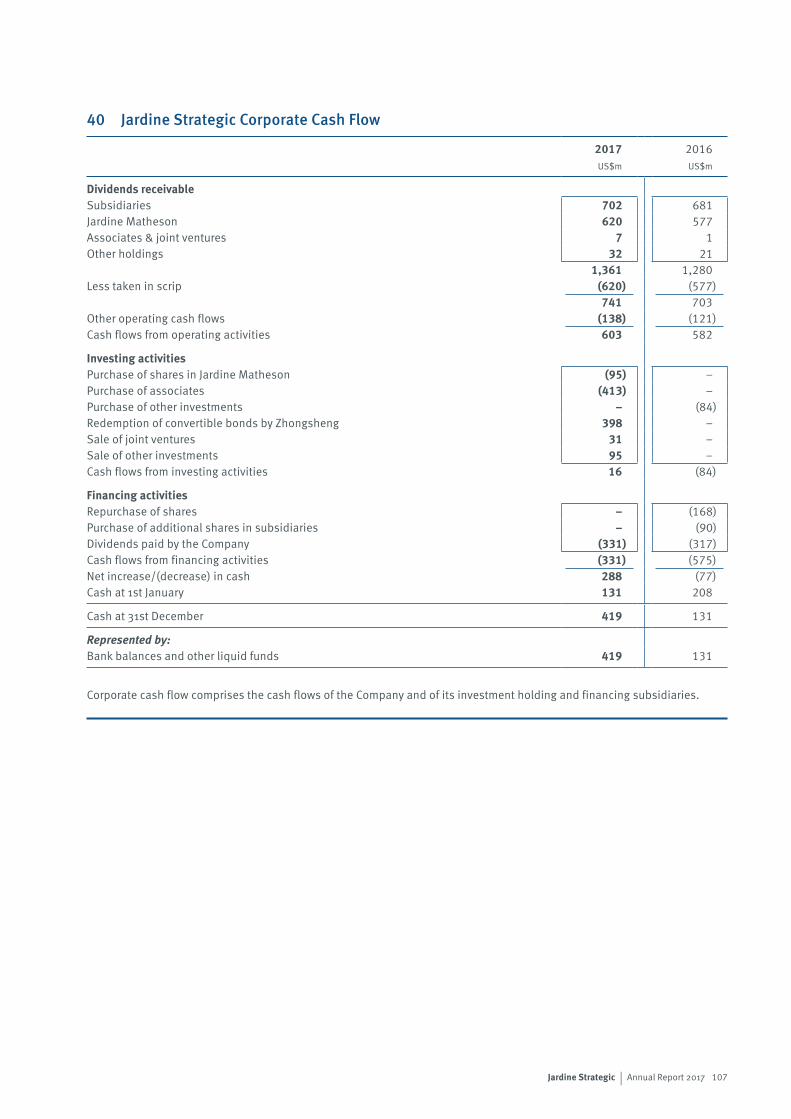
107Jardine Strategic | Annual Report 2017
40 Jardine Strategic Corporate Cash Flow
2017 2016US$m US$m
Dividends receivableSubsidiaries 702 681Jardine Matheson 620 577Associates & joint ventures 7 1Other holdings 32 21
1,361 1,280Less taken in scrip (620) (577)
741 703Other operating cash flows (138) (121)Cash flows from operating activities 603 582
Investing activitiesPurchase of shares in Jardine Matheson (95) –Purchase of associates (413) –Purchase of other investments – (84)Redemption of convertible bonds by Zhongsheng 398 –Sale of joint ventures 31 –Sale of other investments 95 –Cash flows from investing activities 16 (84)
Financing activitiesRepurchase of shares – (168)Purchase of additional shares in subsidiaries – (90)Dividends paid by the Company (331) (317)Cash flows from financing activities (331) (575)Net increase/(decrease) in cash 288 (77)Cash at 1st January 131 208
Cash at 31st December 419 131
Represented by:Bank balances and other liquid funds 419 131
Corporate cash flow comprises the cash flows of the Company and of its investment holding and financing subsidiaries.
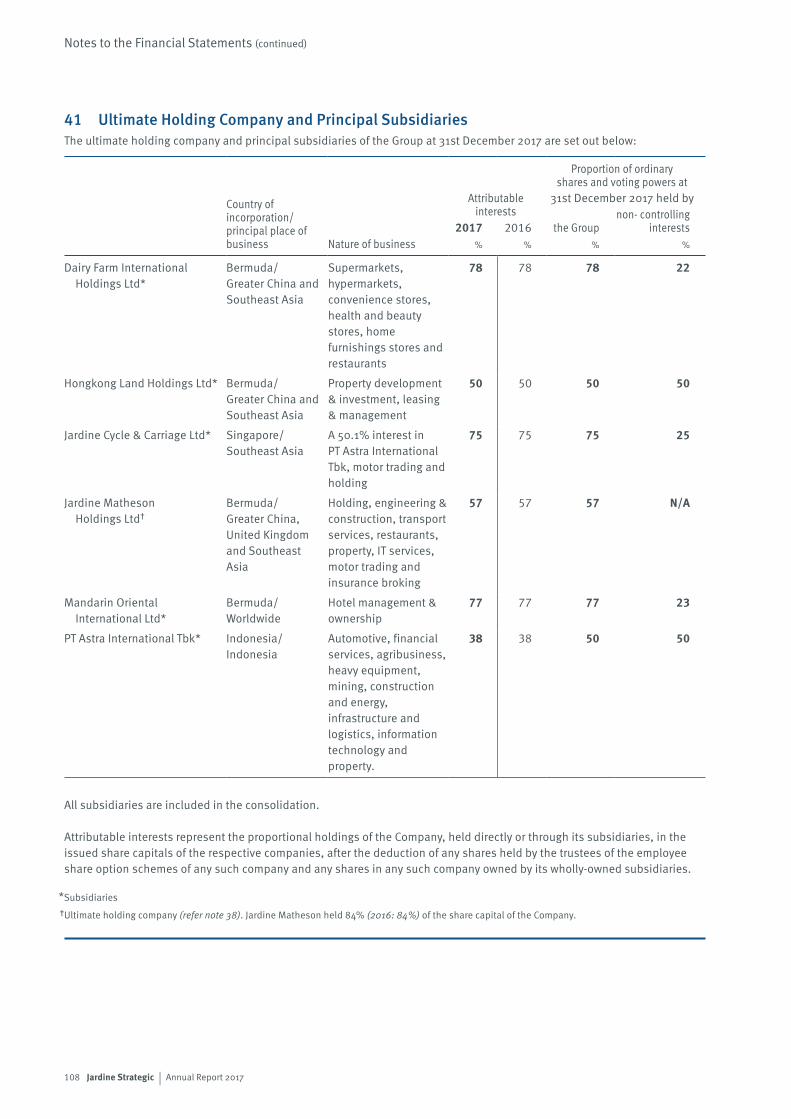
108 Jardine Strategic | Annual Report 2017
Notes to the Financial Statements (continued)
41 Ultimate Holding Company and Principal SubsidiariesThe ultimate holding company and principal subsidiaries of the Group at 31st December 2017 are set out below:
Country of incorporation/principal place of business Nature of business
Attributableinterests
Proportion of ordinary shares and voting powers at
31st December 2017 held by
2017 2016 the Groupnon- controlling
interests% % % %
Dairy Farm International Holdings Ltd*
Bermuda/ Greater China and Southeast Asia
Supermarkets, hypermarkets, convenience stores, health and beauty stores, home furnishings stores and restaurants
78 78 78 22
Hongkong Land Holdings Ltd* Bermuda/ Greater China and Southeast Asia
Property development & investment, leasing & management
50 50 50 50
Jardine Cycle & Carriage Ltd* Singapore/ Southeast Asia
A 50.1% interest in PT Astra International Tbk, motor trading and holding
75 75 75 25
Jardine Matheson Holdings Ltd†
Bermuda/ Greater China, United Kingdom and Southeast Asia
Holding, engineering & construction, transport services, restaurants, property, IT services, motor trading and insurance broking
57 57 57 N/A
Mandarin Oriental International Ltd*
Bermuda/ Worldwide
Hotel management & ownership
77 77 77 23
PT Astra International Tbk* Indonesia/ Indonesia
Automotive, financial services, agribusiness, heavy equipment, mining, construction and energy, infrastructure and logistics, information technology and property.
38 38 50 50
All subsidiaries are included in the consolidation.
Attributable interests represent the proportional holdings of the Company, held directly or through its subsidiaries, in the issued share capitals of the respective companies, after the deduction of any shares held by the trustees of the employee share option schemes of any such company and any shares in any such company owned by its wholly-owned subsidiaries.
Subsidiaries
Ultimate holding company (refer note 38). Jardine Matheson held 84% (2016: 84%) of the share capital of the Company.
*†

109Jardine Strategic | Annual Report 2017
Independent Auditors’ Report
To the members of Jardine Strategic Holdings Limited
Report on the audit of the Financial StatementsOpinionIn our opinion, Jardine Strategic Holdings Limited’s Group financial statements (the ‘financial statements’):
• give a true and fair view of the state of the Group’s affairs as at 31st December 2017 and of its profit and cash flows for the year then ended;
• have been properly prepared in accordance with International Financial Reporting Standards (‘IFRSs’) as issued by the International Accounting Standards Board (IASB); and
• have been prepared in accordance with the requirements of the Companies Act 1981 (Bermuda).
What we have auditedWe have audited the financial statements, included within the Annual Report, which comprise: the Consolidated Balance Sheet as at 31st December 2017; the Consolidated Profit and Loss account, Consolidated Statement of Comprehensive Income, the Consolidated Cash Flow Statement, and the Consolidated Statement of Changes in Equity for the year then ended; and the Notes to the Financial Statements, which include a description of the significant accounting policies.
Certain required disclosures have been presented in the Corporate Governance section on page 118, rather than in the Notes to the Financial Statements. These disclosures are cross-referenced from the financial statements and are identified as audited.
Basis for opinionWe conducted our audit in accordance with International Standards on Auditing (UK) (‘ISAs (UK)’) and applicable law. Our responsibilities under ISAs (UK) are further described in the Auditors’ responsibilities for the audit of the financial statements section of our report. We believe that the audit evidence we have obtained is sufficient and appropriate to provide a basis for our opinion.
IndependenceWe remained independent of the Group in accordance with the ethical requirements that are relevant to our audit of the financial statements in the UK, which includes the Financial Reporting Council’s (‘FRC’s’) Ethical Standard as applicable to listed entities, and we have fulfilled our other ethical responsibilities in accordance with these requirements.
Our audit approachOverview
Materiality• Overall Group materiality: US$448 million, based on 5% of profit before tax. • Specific Group materiality: US$206 million, based on 5% of underlying profit before tax.
Audit scope• A full scope audit was performed on four entities – Jardine Cycle & Carriage Limited (which includes PT Astra
International Tbk), Hongkong Land Holdings Limited, Dairy Farm International Holdings Limited and Mandarin Oriental International Limited. These entities accounted for 99% of the Group’s revenue and 94% of the Group’s profit before tax.
• A full scope audit of one subsidiary and one joint venture of Jardine Matheson Holdings Limited was also performed. These account for 2% of Jardine Strategic Holdings Limited’s profit before tax.
Key audit matters• Valuation of investment properties.• Impairment of goodwill in subsidiaries and investments in associates and joint ventures.• Provisioning for consumer financing debtors.
110 Jardine Strategic | Annual Report 2017
The scope of our auditAs part of designing our audit, we determined materiality and assessed the risks of material misstatement in the financial statements. In particular, we looked at where the directors made subjective judgements, for example in respect of significant accounting estimates that involved making assumptions and considering future events that are inherently uncertain. As in all of our audits we also addressed the risk of management override of internal controls, including evaluating whether there was evidence of bias by the directors that represented a risk of material misstatement due to fraud.
Key audit mattersKey audit matters are those matters that, in the auditors’ professional judgement, were of most significance in the audit of the financial statements of the current period and include the most significant assessed risks of material misstatement (whether or not due to fraud) identified by the auditors, including those which had the greatest effect on: the overall audit strategy; the allocation of resources in the audit; and directing the efforts of the engagement team. These matters, and any comments we make on the results of our procedures thereon, were addressed in the context of our audit of the financial statements as a whole, and in forming our opinion thereon, and we do not provide a separate opinion on these matters. This is not a complete list of all risks identified by our audit.
Key audit matter How our audit addressed the key audit matter
Valuation of investment propertiesRefer to note 3 (Critical Accounting Estimates and Judgements) and note 15 (Investment Properties) to the financial statements.
The fair value of the Group’s investment properties amounted to US$33,100 million at 31st December 2017, with a revaluation gain of US$4,701 million recognized as a non-trading item in the Consolidated Profit and Loss account for the year. The Group’s property portfolio principally consists of commercial properties.
The valuation of the Group’s investment property portfolio is inherently subjective due to, among other factors, the individual nature of each property, its location, prevailing market returns and the expected future rentals for that particular property.
The valuations were carried out by third party valuers (the ‘valuers’). In determining a property’s valuation, the valuers makes assumptions, judgements and estimates in key areas. Valuations are principally derived using the income capitalization method. Judgements are made in respect of capitalization rates and market rents.
We focused on the valuation of investment properties due to the significant judgements and estimates involved in determining the valuations.
We assessed the valuers’ qualifications and their expertise, considering whether there were any matters that might have affected their objectivity or may have imposed scope limitations upon their work. We found no evidence to suggest that the objectivity of the valuers in their performance of the valuations was compromised.
Our work focused on the highest value properties in the portfolio, namely the buildings in the central business district of Hong Kong.
We read the valuation reports for the Hong Kong properties covering the majority of the total investment property portfolio and considered the valuation approach used was appropriate for each property and suitable for use in determining the carrying value. We performed testing, on a sample basis, on the input data used in the valuation process to satisfy ourselves of the accuracy of the property information supplied to the valuers by management, for example agreeing of lease terms to tenancy agreements and other supporting documents.
We understood and assessed the Group’s controls over data used in the valuation of the investment property portfolio and management’s review of the valuations.
The audit team, including our valuation specialists, attended meetings with the valuers at which the valuations and the key assumptions therein were discussed. We compared the capitalization rates used by the valuers with an estimated range of expected yields, determined via reference to published benchmarks and market information. We evaluated year-on-year movements in capital values and rentals with reference to publicly available information and prevailing market rents. We evaluated whether assumptions were appropriate in light of the evidence provided by significant transactions which had taken place in local markets during the year.
We concluded that the assumptions used in the valuations were supportable in light of available evidence.
Independent Auditors’ Report (continued)
111Jardine Strategic | Annual Report 2017
Key audit matter How our audit addressed the key audit matter
Impairment of goodwill in subsidiaries and investments in associates and joint venturesRefer to note 3 (Critical Accounting Estimates and Judgements), note 13 (Intangible Assets) and note 18 (Associates and Joint Ventures) to the financial statements.
As at 31st December 2017, goodwill in subsidiaries totalled US$1,049 million and investments in associates and joint ventures totalled US$12,190 million.
Management undertook impairment assessments, as required by accounting standards, noting certain cash generating units (‘CGUs’) that were underperforming or loss making.
The determination of the recoverable amount of CGUs requires significant judgements by management, particularly management’s view on key internal inputs and external market conditions which impact future cash flows, the discount rates and long term growth rates.
We have reviewed and understood management’s impairment assessment process, including the identification of indicators of impairment and appropriateness of the valuation models used. We assessed management’s determination of CGUs. Where we identified a risk of impairment we performed the following procedures.
With the support of our valuation specialists, we benchmarked and challenged key assumptions in management’s valuation models used to determine recoverable amounts, including assumptions of projected profit of businesses, long term growth rates and discount rates appropriate for the CGUs under review, using our knowledge and experience.
We tested the discounted cash flow models used by management in their assessments, re-performed the calculations to check their accuracy, compared historical budgeted performance to actual results and agreed the figures used to the detailed management approved budgets to assess the reasonableness of the cash flows used in the models.
Our challenge focused particularly on the discount rates and long term growth rates used. We compared the discount rates used to the range of typical discount rates used in similar businesses, considering whether management had incorporated all relevant macro-economic and country-specific factors, as well as those specific to those CGUs, in determining their discount rates.
For growth rates we compared each rate used to the range of growth rates used by similar businesses, considering whether management had considered macro-economic and country-specific factors specific to the relevant businesses. We also tested management’s historical estimation accuracy by comparing previous projected growth rates to the actual growth achieved. Where differences were noted we understood management’s rationale and the evidence, such as actual recent performance, to support management’s estimates.
We evaluated the sensitivity analysis performed by management and performed our independent sensitivity analysis on the key assumptions above and considered a range of alternative outcomes to determine the sensitivity of the valuation models to changes in assumptions.
Based on the work performed, we found that the judgements made by management to determine the discount rates, long term growth rates and valuation models are reasonable.
112 Jardine Strategic | Annual Report 2017
Key audit matter How our audit addressed the key audit matter
Provisioning for consumer financing debtorsRefer to note 1 (Principal Accounting Policies) and note 20 (Debtors) to the financial statements.
As at 31st December 2017, consumer financing debtors of the Group amounted to US$4,354 million, held primarily in PT Astra Sedaya Finance (‘ASF’) and PT Federal International Finance (‘FIF’), subsidiaries of the Group.
Assessing the provision for impairment of consumer financing debtors requires management to make complex and subjective judgements over both the timing of recognition and estimation of any impairment required.
Provisions for impairment are calculated on a collective basis for large homogeneous portfolios using models driven by a number of observable inputs and management assumptions. Assumptions and parameters used in the calculations are based on historical data and current customer credit data and include the delinquency status of the borrowers.
We understood and tested the design and key controls over the credit reviews and approval processes that management has in place on the granting of loans. In addition, over consumer financing debtors’ data and impairment calculations, we:
• understood the identification of impairment events and how management identify all such events;
• assessed the classification of loans that were impaired; and• tested the calculation of the impairment provisions on
identified loans.
We adopted a combination of tests of controls and tests of details for our audit of provisions for impairment of consumer financing debtors of ASF and FIF to obtain sufficient audit evidence.
In addition to tests of controls, we understood management’s basis for determining whether a loan is impaired and assessed the reasonableness of that basis through discussions with management, our understanding of the Group’s lending portfolios and our broader industry knowledge.
We assessed the models used and the assumptions applied by management, such as the basis on which the probability of default is calculated and estimated losses in the event of default, and how these compared with historical data adjusting for current market conditions and trends. We challenged whether historical experience was representative of current circumstances and of recent losses incurred in the portfolios. We re-performed the provision calculation independently and understood any significant differences identified. Based on our procedures, management’s assumptions are supported by historical data and within a reasonable range based on actual loss rate data.
We tested the completeness and accuracy of the consumer financing debtor’s data from underlying systems that are used in the calculations and models to determine the impairment provisions.
In considering the appropriateness of provisions, we assessed whether consumer financing debtors in higher risk segments had been appropriately considered and captured in the impairment provision by challenging management on their key areas of judgement, including the segmentation of the portfolio of consumer financing debtors, the period of historical loss data used and estimated market value for collateral held based on our understanding of the counterparties and current market conditions.
Based on the evidence obtained, we found that the assumptions and the data used in calculating provisions for impairment were supportable based on available evidence.
How we tailored the audit scopeJardine Strategic Holdings Limited is a holding company of a diversified group of businesses, many of which are separately listed.
We tailored the scope of our audit to ensure that we performed sufficient audit work to be able to give an opinion on the financial statements as a whole, taking into account the geographic locations and structure of the Group, the accounting processes and controls in place and the industries in which it operates.
Independent Auditors’ Report (continued)
113Jardine Strategic | Annual Report 2017
The Group’s accounting processes are structured around a finance function in each main business, which are responsible for their own accounting records and controls and which in turn report to a group finance function for that business. Each of the Group’s listed subsidiaries have in addition to their own group finance functions, corporate governance structures and public reporting requirements. These businesses report financial information to the Group’s finance function in Hong Kong to enable them to prepare consolidated financial statements.
In establishing the overall approach to the Group audit, we determined the type of work that needed to be performed by members of the Group engagement team or by component auditors from within the PwC Network operating under our instruction. Where the work was performed by component auditors, we determined the level of involvement we needed to have in the audit work at those components to be able to conclude whether sufficient, appropriate audit evidence had been obtained as a basis for our opinion on the financial statements as a whole. The Group engagement team was involved in the significant reporting entities in scope for Group reporting during the audit cycle through a combination of meetings, visits and conference calls. The lead Group audit partner and other senior team members undertook multiple visits to Hong Kong during the audit and were involved throughout the year in regular conference calls and other forms of communication to direct and oversee the audit throughout the year. The lead Group audit partner and other senior team members also visited a number of countries, including Indonesia, Singapore, Malaysia and Thailand during the audit to review the work of component teams along with regular communication throughout the year.
For four entities – Jardine Cycle & Carriage Limited (which includes PT Astra International Tbk), Hongkong Land Holdings Limited, Dairy Farm International Holdings Limited and Mandarin Oriental International Limited – an audit of the complete financial information was performed. These entities accounted for 99% of the Group’s revenue and 94% of the Group’s profit before tax. An audit of the complete financial information of one subsidiary and one joint venture of Jardine Matheson Holdings Limited was also performed. These accounted for 2% of Jardine Strategic Holdings Limited’s profit before tax. This, together with procedures performed on central functions and at the Group level (on the consolidation and other areas of significant judgement), gave us the evidence we needed for our opinion on the financial statements as a whole.
MaterialityThe scope of our audit was influenced by our application of materiality. We set certain quantitative thresholds for materiality. These, together with qualitative considerations, helped us to determine the scope of our audit and the nature, timing and extent of our audit procedures on the individual financial statement line items and disclosures and in evaluating the effect of misstatements, both individually and in aggregate on the financial statements as a whole.
Based on our professional judgement, we determined materiality for the financial statements as a whole as follows:
Overall Group materiality US$448 million.
How we determined it 5% of profit before tax.
Rationale for benchmark applied Profit is the primary measure used by the shareholders in assessing the performance of the Group.
We set a specific materiality level of US$206 million for those items affecting underlying profit before tax. This equates to 5% of underlying profit before tax. In arriving at this judgement we had regard to the fact that underlying profit is an important financial indicator of the Group.
For each component in the scope of our Group audit, we allocated a materiality that is less than our overall Group materiality. The range of materiality allocated across components was US$3 million to US$383 million. The range of specific materiality allocated across components was US$3 million to US$113 million.
We agreed with the Audit Committee that we would report to them misstatements identified during our audit above US$10 million other than items relating to classifications within the Consolidated Profit and Loss Account or Consolidated Balance Sheet which were only reported above US$115 million. We also reported misstatements below this amount that in our view, warranted reporting for qualitative reasons.
Conclusions relating to going concernIn accordance with ISAs (UK) we are required to report if the directors’ use of the going concern basis of accounting in the preparation of the financial statements is not appropriate; or the directors have not disclosed in the financial statements any identified material uncertainties that may cast significant doubt about the Group’s ability to continue to adopt the going concern basis of accounting for a period of at least twelve months from the date when the financial statements are authorised for issue. We have nothing to report.
However, because not all future events or conditions can be predicted, this statement is not a guarantee as to the Group’s ability to continue as a going concern.
114 Jardine Strategic | Annual Report 2017
Reporting on other informationThe other information comprises all of the information in the Annual Report other than the financial statements and our auditors’ report thereon. The directors are responsible for the other information. Our opinion on the financial statements does not cover the other information and, accordingly, we do not express an audit opinion or, except to the extent otherwise explicitly stated in this report, any form of assurance thereon.
In connection with our audit of the financial statements, our responsibility is to read the other information and, in doing so, consider whether the other information is materially inconsistent with the financial statements or our knowledge obtained in the audit, or otherwise appears to be materially misstated. If we identify an apparent material inconsistency or material misstatement, we are required to perform procedures to conclude whether there is a material misstatement of the financial statements or a material misstatement of the other information. If, based on the work we have performed, we conclude that there is a material misstatement of this other information, we are required to report that fact. We have nothing to report based on these responsibilities.
Responsibilities for the financial statements and the auditResponsibilities of the directors for the financial statementsAs explained more fully in the Responsibility Statement set out on page 116, the directors are responsible for the preparation of the financial statements in accordance with the applicable framework and for being satisfied that they give a true and fair view. The directors are also responsible for such internal control as they determine is necessary to enable the preparation of financial statements that are free from material misstatement, whether due to fraud or error.
In preparing the financial statements, the directors are responsible for assessing the Group’s ability to continue as a going concern, disclosing as applicable, matters related to going concern and using the going concern basis of accounting unless the directors either intend to liquidate the Group or to cease operations, or have no realistic alternative but to do so.
Auditors’ responsibilities for the audit of the financial statementsOur objectives are to obtain reasonable assurance about whether the financial statements as a whole are free from material misstatement, whether due to fraud or error, and to issue an auditors’ report that includes our opinion. Reasonable assurance is a high level of assurance, but is not a guarantee that an audit conducted in accordance with ISAs (UK) will always detect a material misstatement when it exists. Misstatements can arise from fraud or error and are considered material if, individually or in the aggregate, they could reasonably be expected to influence the economic decisions of users taken on the basis of these financial statements.
A further description of our responsibilities for the audit of the financial statements is located on the FRC’s website at: www.frc.org.uk/auditorsresponsibilities. This description forms part of our auditors’ report.
Use of this reportThis report, including the opinions, has been prepared for and only for the Company’s members as a body in accordance with Section 90 of the Companies Act 1981 (Bermuda) and for no other purpose. We do not, in giving these opinions, accept or assume responsibility for any other purpose or to any other person to whom this report is shown or into whose hands it may come save where expressly agreed by our prior consent in writing.
John Bakerfor and on behalf of PricewaterhouseCoopers LLPChartered Accountants London8th March 2018
(a) The maintenance and integrity of the Jardine Strategic Holdings Limited website is the responsibility of the directors; the work carried out by the auditors does not involve consideration of these matters and, accordingly, the auditors accept no responsibility for any changes that may have occurred to the financial statements since they were initially presented on the website.
(b) Legislation in Bermuda governing the preparation and dissemination of financial statements may differ from legislation in other jurisdictions.
Independent Auditors’ Report (continued)
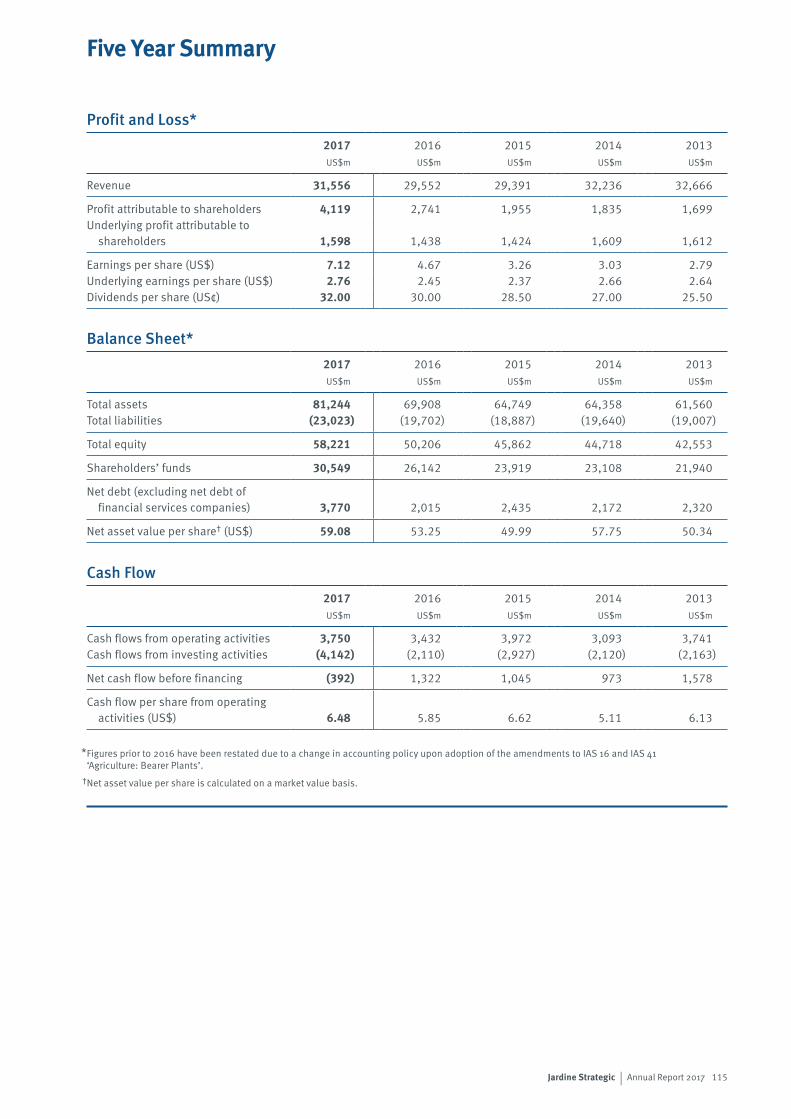
115Jardine Strategic | Annual Report 2017
Five Year Summary
Profit and Loss*2017 2016 2015 2014 2013US$m US$m US$m US$m US$m
Revenue 31,556 29,552 29,391 32,236 32,666
Profit attributable to shareholders 4,119 2,741 1,955 1,835 1,699 Underlying profit attributable to
shareholders 1,598 1,438 1,424 1,609 1,612
Earnings per share (US$) 7.12 4.67 3.26 3.03 2.79 Underlying earnings per share (US$) 2.76 2.45 2.37 2.66 2.64 Dividends per share (US¢) 32.00 30.00 28.50 27.00 25.50
Balance Sheet*2017 2016 2015 2014 2013US$m US$m US$m US$m US$m
Total assets 81,244 69,908 64,749 64,358 61,560 Total liabilities (23,023) (19,702) (18,887) (19,640) (19,007)
Total equity 58,221 50,206 45,862 44,718 42,553
Shareholders’ funds 30,549 26,142 23,919 23,108 21,940
Net debt (excluding net debt of financial services companies) 3,770 2,015 2,435 2,172 2,320
Net asset value per share† (US$) 59.08 53.25 49.99 57.75 50.34
Cash Flow2017 2016 2015 2014 2013US$m US$m US$m US$m US$m
Cash flows from operating activities 3,750 3,432 3,972 3,093 3,741 Cash flows from investing activities (4,142) (2,110) (2,927) (2,120) (2,163)
Net cash flow before financing (392) 1,322 1,045 973 1,578
Cash flow per share from operating activities (US$) 6.48 5.85 6.62 5.11 6.13
Figures prior to 2016 have been restated due to a change in accounting policy upon adoption of the amendments to IAS 16 and IAS 41 ‘Agriculture: Bearer Plants’.
Net asset value per share is calculated on a market value basis.
*
†
116 Jardine Strategic | Annual Report 2017
Responsibility Statement
The Directors of the Company confirm to the best of their knowledge that:
(a) the consolidated financial statements have been prepared in accordance with International Financial Reporting Standards, including International Accounting Standards and Interpretations adopted by the International Accounting Standards Board; and
(b) the sections of this Report, including the Chairman’s Statement, Operating Review and Principal Risks and Uncertainties, which constitute the management report include a fair review of all information required to be disclosed by the Disclosure Guidance and Transparency Rules 4.1.8 to 4.1.11 issued by the Financial Conduct Authority of the United Kingdom.
For and on behalf of the Board
Ben KeswickY.K. PangDirectors
8th March 2018
117Jardine Strategic | Annual Report 2017
Corporate Governance
Jardine Strategic Holdings Limited is incorporated in Bermuda. The Company is a holding company within the Jardine Matheson Group, and the majority of the Group’s business interests are in Greater China and Southeast Asia. The Company’s equity shares have a standard listing on the Main Market of the London Stock Exchange, and secondary listings in Bermuda and Singapore. The Company’s share capital is 84%-owned by Jardine Matheson Holdings Limited (‘Jardine Matheson’), in which the Company itself has a 58% interest. Similar to the Company, Jardine Matheson is Bermuda incorporated and listed in London, Bermuda and Singapore. The Disclosure Guidance and Transparency Rules (the ‘DTRs’) issued by the Financial Conduct Authority of the United Kingdom (the ‘FCA’) require that this Report address all relevant information about the corporate governance practices applied beyond the requirements under Bermuda law.
The Company attaches importance to the corporate stability that is fundamental to the Group’s ability to pursue a long-term strategy in its Asian markets. It is committed to high standards of governance based on its approach developed over many years.
The Management of the GroupAs a holding company within the Jardine Matheson Group, the Company is concerned primarily with the oversight and coordination of its interests in the other listed companies within the wider Group. The Memorandum of Association of the Company provides for the chairman of Jardine Matheson to be, or to appoint, the Managing Director of the Company. In addition, the Bye-laws of the Company provide for Jardine Matheson, or such wholly-owned subsidiary as it shall appoint, to be the General Manager of the Company. Jardine Matheson Limited, a Hong Kong-based management company, has been so appointed. The General Manager provides management services to the Company and other members of the Group. The Company itself has no employees.
The structural relationship between the Group companies is considered to be a key element to the Group’s success. By coordinating objectives, establishing common values and standards and sharing experience, contacts and business relationships, the Group aims to optimize opportunities across the Asian countries in which it operates. The Company’s system of governance is based on a well-tried approach to oversight and management, in which the individual subsidiaries and affiliates benefit from the Group’s strategic guidance and professional expertise, while at the same time the independence of their boards is respected and clear operational accountability rests with their executive management teams.
The Directors of the Company have the full power to manage its business affairs, with the exception of matters reserved to be exercised by the Company in general meeting under Bermuda legislation or the Company’s Bye-laws. Among the matters on which the Board decides are the Company’s investment strategy, its annual budget, dividends and major corporate activities.
Operational management is delegated to the appropriate level, and coordination with the Group’s listed subsidiaries is undertaken by the board of the General Manager. This board, which meets regularly in Hong Kong, is chaired by the Managing Director and has five other members, including Jardine Matheson’s deputy managing director, group finance director, group strategy director and group general counsel.
The BoardThe Company currently has a Board of eleven Directors. Their names and brief biographies appear on page 19 of this Report. The Board composition and operation provide stability, allowing the Company to take a long-term view as it seeks to grow its businesses and pursue investment opportunities.
The Chairman has been appointed in accordance with the provisions of the Bye-laws of the Company, which provide that the chairman of Jardine Matheson, or any Director nominated by him, shall be the Chairman of the Company. The Chairman’s role is to lead the Board as it oversees the Company’s strategic and financial direction. The role of the Managing Director is to implement the strategy set by the Board and to manage the Company’s interests. An important part of this is undertaken in his capacity as chairman of the board of the General Manager to which responsibility for implementing the Company’s strategy within designated financial parameters has been delegated.
118 Jardine Strategic | Annual Report 2017
Corporate Governance (continued)
The Board is scheduled to hold four meetings in 2018 and ad hoc procedures are adopted to deal with urgent matters. In 2017 one meeting was held in Bermuda and three were held in Asia. The Board receives high quality, up to date information for each of its meetings. In addition certain Directors who are not members of the board of the General Manager and who are based outside Asia regularly visit Asia and Bermuda to discuss the Group’s business, as well as to participate in four annual Group strategic reviews that precede the regular Board meetings. These Directors are not directly involved in the operational management of the Group’s business activities, but their knowledge and close oversight of the Group’s affairs reinforces the process by which business is reviewed before consideration at Board meetings.
Directors’ Appointment, Retirement, Remuneration and Service ContractsEach new Director is appointed by the Board, and when appointing non-executive Directors, the Board pays particular attention to the Asian business experience and relationships that they bring.
In accordance with the Company’s Bye-laws, each new Director appointed by the Board is subject to retirement at the first annual general meeting after appointment. Thereafter, Directors are subject to retirement by rotation under the Bye-laws whereby one-third of the Directors retire at the annual general meeting each year. These provisions apply to both executive and non-executive Directors, but the requirement to retire by rotation does not extend to the Chairman or Managing Director.
At this year’s Annual General Meeting to be held on 10th May 2018, Julian Hui and Dr George C.G. Koo are to retire and will not seek re-election. It is proposed that Lord Powell of Bayswater will join the Board following the Annual General Meeting. In accordance with Bye-law 85, Simon Keswick retires by rotation, and being eligible, offers himself for re-election. Simon Keswick has a service contract with a subsidiary of Jardine Matheson that has a notice period of six months.
Directors’ fees are decided upon by shareholders in general meeting as provided for by the Company’s Bye-laws. For the year ended 31st December 2017, Directors’ fees payable by the Company amounted to US$710,000 (2016: US$647,487).
The Company purchases insurance to cover its Directors against their costs in defending themselves in civil proceedings taken against them in that capacity and in respect of damages resulting from the unsuccessful defence of any proceedings. To the extent permitted by law, the Company also indemnifies its Directors. Neither the insurance nor the indemnity provides cover where the Director has acted fraudulently or dishonestly.
Audit CommitteeThe Board has established an Audit Committee, the current members of which are Anthony Nightingale, Adam Keswick and Lord Sassoon; they have extensive knowledge of the Group but are not directly involved in operational management. The Company’s Managing Director, together with representatives of the General Manager and the internal and external auditors, also attend the Audit Committee meetings by invitation. The Audit Committee meets and reports to the Board semi-annually.
Prior to completion and announcement of the half-year and year-end results, a review of the Company’s financial information and any issues raised in connection with the preparation of the results, including the adoption of new accounting policies, is undertaken by the Audit Committee with the Managing Director and representatives of the General Manager and a report is received from the external auditors. The external auditors also have access to the Board, and to the boards of the Group’s operating companies.
The Audit Committee also keeps under review the nature, scope and results of the audits conducted by the internal audit function and the findings of the various Group audit committees. The Audit Committee’s responsibilities extend to reviewing the effectiveness of both the internal and the external audit functions; considering the independence and objectivity of the external auditors; and reviewing and approving the level and nature of non-audit work performed by the external auditors.
The terms of reference of the Audit Committee can be found on the Company’s website at www.jardines.com.
119Jardine Strategic | Annual Report 2017
Risk Management and Internal ControlThe Board has overall responsibility for the Company’s systems of risk management and internal control. The Board has delegated to the Audit Committee responsibility for providing oversight in respect of risk management activities. The Audit Committee considers the Group’s principal risks and uncertainties and potential changes to the risk profile, and reviews the operation and effectiveness of the Company’s systems of internal control and the procedures by which these risks are monitored and mitigated. The Audit Committee considers the systems and procedures on a regular basis, and reports to the Board semi-annually. The systems of internal control are designed to manage, rather than eliminate, business risk; to help safeguard its assets against fraud and other irregularities; and to give reasonable, but not absolute, assurance against material financial misstatement or loss.
The General Manager oversees the implementation of the systems of internal control throughout the Group. The implementation of the systems of internal control within the Group’s operating companies is the responsibility of each company’s board and its executive management. The effectiveness of these systems is monitored by the internal audit function, which is independent of the operating companies, and by a series of audit committees or risk management and compliance committees that operate in each major business unit across the Group. The internal audit function also monitors the approach taken by the business units to risk. The findings of the internal audit function and recommendations for any corrective action required are reported to the relevant audit committee and, if appropriate, to the Audit Committee of the Company.
The Group has in place an organizational structure with defined lines of responsibility and delegation of authority. Across the Group there are established policies and procedures for financial planning and budgeting; for information and reporting systems; for assessment of risk; and for monitoring the Group’s operations and performance. The information systems in place are designed to ensure that the financial information reported is reliable and up to date.
The Group’s policy on commercial conduct underpins the internal control process, particularly in the area of compliance. The policy is set out in the Jardine Matheson Code of Conduct, which is a set of guidelines to which every Group employee must adhere, and is reinforced and monitored by an annual compliance certification process.
The Audit Committee has also been given the responsibility to oversee the effectiveness of the formal procedures for Group employees to raise any matters of serious concern and is required to review any reports made under those procedures that are referred to it by the internal audit function.
The principal risks and uncertainties facing the Company are set out on page 122.
Directors’ Responsibilities in respect of the Financial StatementsThe Directors are required under the Bermuda Companies Act to prepare financial statements for each financial year and to present them annually to the Company’s shareholders at the annual general meeting. The financial statements are required to present fairly in accordance with International Financial Reporting Standards (‘IFRS’) the financial position of the Group at the end of the year and the results of its operations and its cash flows for the year then ended. The Directors consider that applicable accounting policies under IFRS, applied on a consistent basis and supported by prudent and reasonable judgments and estimates, have been followed in preparing the financial statements. The financial statements have been prepared on a going concern basis.
Code of ConductThe Group conducts business in a professional, ethical and even-handed manner. Its ethical standards are clearly set out in the Jardine Matheson Code of Conduct. The code requires that all Group companies comply with all laws of general application, all rules and regulations that are industry specific and proper standards of business conduct. The code prohibits the giving or receiving of illicit payments, and requires that all managers must be fully aware of their obligations under the code and establish procedures to ensure compliance at all levels within their organizations.

120 Jardine Strategic | Annual Report 2017
Corporate Governance (continued)
The code also encourages inclusion and diversity, and requires all employees to be treated fairly, impartially and with dignity and respect. As a multinational Group with a broad range of businesses operating primarily across East Asia and Southeast Asia, although with further interests elsewhere in the world, the Group believes in promoting equal opportunities in recruiting, developing and rewarding its people regardless of race, gender, nationality, religion, sexual orientation, disability, age or background. The scale and breadth of the Group’s businesses necessitate that they seek the best people from the communities in which they operate most suited to their needs.
The Group has in place procedures by which employees can raise, in confidence, matters of serious concern in areas such as financial reporting or compliance.
Directors’ Share InterestsThe Directors of the Company in office on 8th March 2018 had interests (within the meaning of the EU Market Abuse Regulation (‘MAR’), which applies to the Company as it is listed on the London Stock Exchange) as set out below in the ordinary share capital of the Company. These interests included those notified to the Company in respect of the Directors’ closely associated persons (as that term is used under MAR).
Charles Allen-Jones 5,415Julian Hui 4,387Dr George C.G. Koo 147,924Anthony Nightingale 18,507
Substantial ShareholdersAs a non-UK issuer, the Company is subject to the DTRs pursuant to which a person must in certain circumstances notify the Company of the percentage of voting rights attaching to the share capital of the Company that he holds. The obligation to notify arises if that person acquires or disposes of shares in the Company which results in the percentage of voting rights which he holds reaching, exceeding or falling below 5%, 10%, 15%, 20%, 25%, 30%, 50% and 75%.
The Company has been informed that Jardine Matheson is interested indirectly in 929,995,439 ordinary shares carrying 83.96% of the voting rights attaching to the Company’s issued ordinary share capital. Apart from this shareholding, the Company is not aware of any holders of voting rights of 5% or more attaching to the issued ordinary share capital of the Company as at 8th March 2018.
There were no contracts of significance with corporate substantial shareholders during the year under review.
Governance PrinciplesThe Company’s primary listing on the London Stock Exchange is a standard listing on the Main Market. Under a standard listing, the Company is subject to the UK Listing Rules (other than those which apply only to companies with a premium listing), the DTRs, the UK Prospectus Rules and MAR. The Company, therefore, is bound by the rules in relation to continuous disclosure, periodic financial reporting, disclosure of interests in shares and market abuse, including the rules governing insider dealing, market manipulation and the disclosure of inside information. The Company is also subject to regulatory oversight from the FCA, as the Company’s principal securities regulator, and is required to comply with the Admission and Disclosure Standards of the Main Market of the London Stock Exchange.
When shareholders approved the Company’s move to a standard listing from a premium listing in 2014, the Company stated that it intended to maintain certain governance principles on the same basis as was then applicable to the Company’s premium listing, as follows:
1. When assessing a significant transaction, being a larger transaction which would be classified as a class 1 transaction under the provisions of the UK Listing Rules, the Company will engage an independent financial adviser to provide a fairness opinion on the terms of the transaction.
121Jardine Strategic | Annual Report 2017
2. In the event of a related party transaction, being a transaction with a related party which would require a sponsor to provide a fair and reasonable opinion under the provisions of the UK Listing Rules, the Company will engage an independent financial adviser to confirm that the terms of the transaction are fair and reasonable as far as the shareholders of the Company are concerned.
3. Further, as soon as the terms of a significant transaction or a related party transaction are agreed, an announcement will be issued by the Company providing such details of the transaction as are necessary for investors to evaluate the effect of the transaction on the Company.
4. At each annual general meeting, the Company will seek shareholder approval to issue new shares on a non-pre-emptive basis for up to 33% of the Company’s issued share capital, of which up to 5% can be issued for cash consideration.
5. The Company will continue to adhere to its Securities Dealing Rules. These rules, which were based on the UK Model Code, have since been revised to follow the provisions of MAR with respect to market abuse and disclosure of interests in shares.
6. The Company will continue its policies and practices in respect of risk management and internal controls.
Related Party TransactionsDetails of transactions with related parties entered into by the Company during the course of the year are included in note 38 to the financial statements on page 105.
Securities Purchase ArrangementsThe Directors have the power under the Bermuda Companies Act and the Company’s Memorandum of Association to purchase the Company’s shares. Any shares so purchased shall be treated as cancelled and, therefore, reduce the issued share capital of the Company. The Board considers on a regular basis the possibility for share repurchases or the acquisition of further shares in Group companies, including shares in Jardine Matheson. When doing so, it considers the potential for the enhancement of earnings or asset values per share. When purchasing such shares, the Company is subject to the provisions of MAR.
During the year JMH Investments Limited (‘JMHI’), a wholly-owned subsidiary of Jardine Matheson, purchased a total of 2,436,500 ordinary shares of the Company in the market for an aggregate total cost of US$106.9 million. The ordinary shares purchased represented some 0.22% of the Company’s issued ordinary share capital. As the Company’s interest in Jardine Matheson is over 50%, the share purchases by JMHI have been disclosed as if they were share repurchases, although the shares themselves are not required to be cancelled.
Takeover CodeThe Company is subject to a Takeover Code, based on London’s City Code on Takeovers and Mergers. The Takeover Code provides an orderly framework within which takeovers can be conducted and the interests of shareholders protected. The Takeover Code has statutory backing, being established under the Acts of incorporation of the Company in Bermuda.
Annual General MeetingThe 2018 Annual General Meeting will be held on 10th May 2018. The full text of the resolutions and explanatory notes in respect of the meeting are contained in the Notice of Meeting which accompanies this Report. A corporate website is maintained containing a wide range of information of interest to investors at www.jardines.com.
Power to amend Bye-lawsThe Bye-laws of the Company can be amended by the shareholders by way of a special resolution at a general meeting of the Company.
122 Jardine Strategic | Annual Report 2017
Principal Risks and Uncertainties
The Board has overall responsibility for risk management and internal control. The process by which the Group identifies and manages risk is set out in more detail on page 119 of the Corporate Governance section of this Report. The following are the principal risks and uncertainties facing the Company as required to be disclosed pursuant to the Disclosure Guidance and Transparency Rules issued by the Financial Conduct Authority of the United Kingdom and are in addition to the matters referred to in the Chairman’s Statement and Operating Review.
Economic RiskMost of the Group’s businesses are exposed to the risk of negative developments in global and regional economies and financial markets, either directly or through the impact on the Group’s joint venture partners, franchisors, bankers, suppliers or customers. These developments can result in recession, inflation, deflation, currency fluctuations, restrictions in the availability of credit, business failures, or increases in financing costs, oil prices and in the cost of raw materials. Such developments might increase operating costs, reduce revenues, lower asset values or result in the Group’s businesses being unable to meet in full their strategic objectives.
Commercial Risk and Financial RiskRisks are an integral part of normal commercial practices, and where practicable steps are taken to mitigate such risks. These risks are further pronounced when operating in volatile markets.
A number of the Group’s businesses make significant investment decisions in respect of developments or projects that take time to come to fruition and achieve the desired returns and are, therefore, subject to market risks.
The Group’s businesses operate in areas that are highly competitive and evolving rapidly, and failure to compete effectively in terms of price, tender terms, product specification, application of new technologies or levels of service can have an adverse effect on earnings or market share. Significant pressure from such competition may also lead to reduced margins. The quality and safety of the products and services provided by the Group’s businesses are important and there is an associated risk if they are below standard, while any damage to brand equity or reputation might adversely impact the ability to achieve acceptable revenues and profit margins. The potential impact on a number of the Group’s businesses of the disruption to IT systems or infrastructure, whether by cyber-crime or other reasons, may be significant.
The steps taken by the Group to manage its exposure to financial risk are set out in the Financial Review on pages 17 to 18 and note 2 to the financial statements on pages 36 to 43.
Concessions, Franchises and Key ContractsA number of the Group’s businesses and projects are reliant on concessions, franchises, management or other key contracts. Cancellation, expiry or termination, or the renegotiation of any such concession, franchise, management or other key contracts, could have an adverse effect on the financial condition and results of operations of certain subsidiaries, associates and joint ventures of the Group.
Regulatory and Political RiskThe Group’s businesses are subject to a number of regulatory environments in the territories in which they operate. Changes in the regulatory approach to such matters as foreign ownership of assets and businesses, exchange controls, planning controls, emission regulations, tax rules and employment legislation have the potential to impact the operations and profitability of the Group’s businesses. Changes in the political environment in such territories can also affect the Group’s businesses.
Terrorism, Pandemic and Natural DisastersA number of the Group’s operations are vulnerable to the effects of terrorism, either directly through the impact of an act of terrorism or indirectly through the impact of generally reduced economic activity in response to the threat of or an actual act of terrorism.
All Group businesses would be impacted by a global or regional pandemic which could be expected to seriously affect economic activity and the ability of our businesses to operate smoothly. In addition, many of the territories in which the Group operates can experience from time to time natural disasters such as earthquakes and typhoons.
123Jardine Strategic | Annual Report 2017
Shareholder Information
Financial Calendar
2017 full-year results announced 8th March 2018Shares quoted ex-dividend on the Singapore Exchange 21st March 2018Shares quoted ex-dividend on the London Stock Exchange 22nd March 2018Share registers closed 26th to 30th March 20182017 final dividend scrip election period closes 27th April 2018Annual General Meeting to be held 10th May 20182017 final dividend payable 16th May 20182018 half-year results to be announced 27th July 2018*Shares quoted ex-dividend on the Singapore Exchange 15th August 2018*Shares quoted ex-dividend on the London Stock Exchange 16th August 2018*Share registers to be closed 20th to 24th August 2018*2018 interim dividend scrip election period closes 21st September 2018*2018 interim dividend payable 10th October 2018*
Subject to change
DividendsThe dividends will be available in cash with a scrip alternative. Shareholders will receive their cash dividends in United States dollars, unless they are registered on the Jersey branch register where they will have the option to elect for sterling. These shareholders may make new currency elections for the 2017 final dividend by notifying the United Kingdom transfer agent in writing by 27th April 2018. The sterling equivalent of dividends declared in United States dollars will be calculated by reference to a rate prevailing on 2nd May 2018. Shareholders holding their shares through CREST in the United Kingdom will receive their cash dividends in sterling only. Shareholders holding their shares through The Central Depository (Pte) Limited (‘CDP’) in Singapore will receive their cash dividends in United States dollars unless they elect, through CDP, to receive Singapore dollars.
Registrars and Transfer AgentShareholders should address all correspondence with regard to their shareholdings or dividends to the appropriate registrar or transfer agent.
Principal RegistrarJardine Matheson International Services LimitedP.O. Box HM 1068Hamilton HM EXBermuda
Jersey Branch RegistrarLink Market Services (Jersey) Limited 12 Castle StreetSt Helier, Jersey JE2 3RTChannel Islands
United Kingdom Transfer AgentLink Asset ServicesThe Registry34 Beckenham RoadBeckenhamKent BR3 4TU, United Kingdom
Singapore Branch RegistrarM & C Services Private Limited112 Robinson Road #05-01Singapore 068902
Press releases and other financial information can be accessed through the internet at www.jardines.com.
*
124 Jardine Strategic | Annual Report 2017
Group Offices
Jardine Matheson Ltd 48th Floor, Jardine HouseG.P.O. Box 70Hong Kong
TelephoneEmailWebsite
(852) 2843 [email protected] Keswick
Matheson & Co., Ltd 3 Lombard StreetLondon EC3V 9AQUnited Kingdom
TelephoneEmailWebsite
(44 20) 7816 [email protected] Keswick
Jardine Pacific Ltd 48th Floor, Jardine HouseG.P.O. Box 70Hong Kong
TelephoneEmail
(852) 2843 [email protected] Cheung
Jardine Motors Group Ltd 25th Floor, Devon HouseTaikoo Place979 King’s RoadQuarry BayHong Kong
TelephoneEmail
(852) 2579 [email protected]. Pang
Jardine Lloyd Thompson Group plc The St Botolph Building138 HoundsditchLondon EC3A 7AWUnited Kingdom
TelephoneEmailWebsite
(44 20) 7528 [email protected] Burke
Hongkong Land Ltd 8th FloorOne Exchange SquareCentralHong Kong
TelephoneEmailWebsite
(852) 2842 [email protected] Wong
Dairy Farm Management Services Ltd 11th Floor, Devon HouseTaikoo Place979 King’s RoadQuarry BayHong Kong
TelephoneEmailWebsite
(852) 2299 [email protected] McLeod
Mandarin Oriental Hotel Group International Ltd
7th Floor281 Gloucester RoadCauseway BayHong Kong
TelephoneEmailWebsite
(852) 2895 [email protected] Riley
Jardine Cycle & Carriage Ltd 239 Alexandra RoadSingapore 159930
TelephoneEmailWebsite
(65) 6473 [email protected] Newbigging
PT Astra International Tbk Jl. Gaya Motor Raya No. 8Sunter II, Jakarta 14330Indonesia
TelephoneEmailWebsite
(62 21) 652 [email protected] Sugiarto