j p morgan 4q 2008 earnings results
DESCRIPTION
J P morgan 4Q 2008 earnings resultsTRANSCRIPT
J A N U A R Y 1 5 , 2 0 0 9
F I N A N C I A L R E S U L T S
4Q08
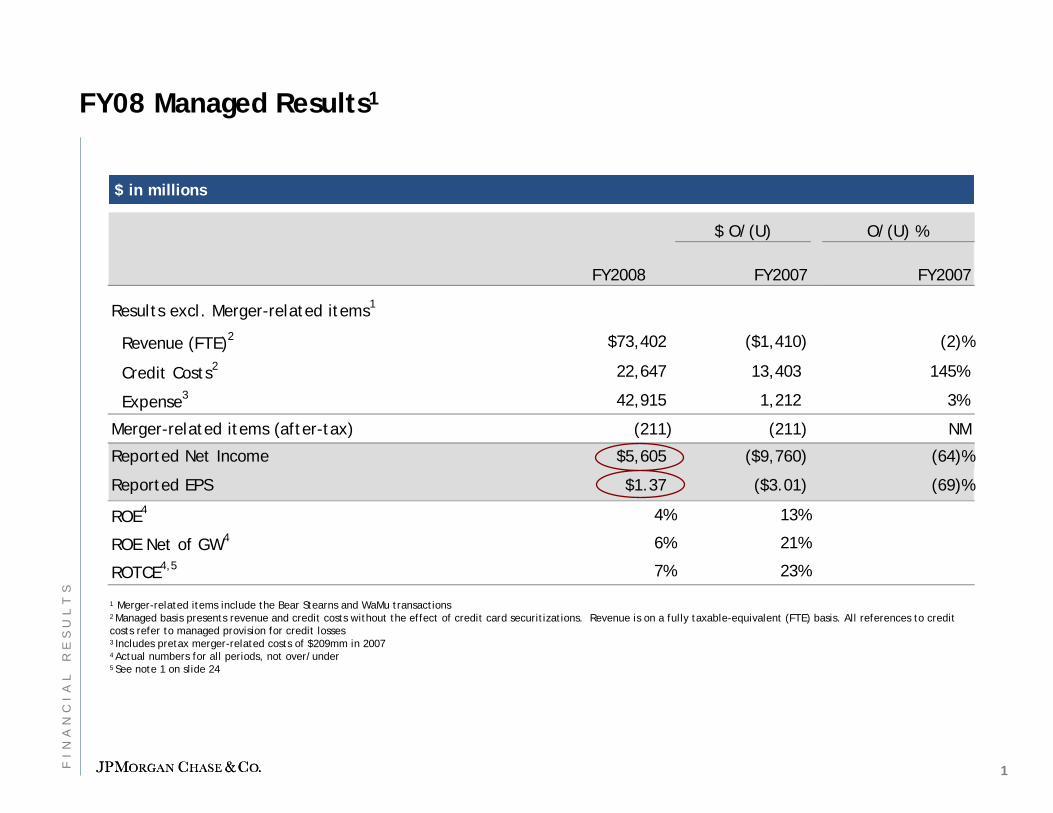
FY08 Managed Results1
$ in millions$ in millions
1 Merger-related items include the Bear Stearns and WaMu transactions2 Managed basis presents revenue and credit costs without the effect of credit card securitizations. Revenue is on a fully taxable-equivalent (FTE) basis. All references to credit costs refer to managed provision for credit losses3 Includes pretax merger-related costs of $209mm in 20074 Actual numbers for all periods, not over/under5 See note 1 on slide 24
$ O/(U) O/(U) %
FY2008 FY2007 FY2007
Results excl. Merger-related items1
Revenue (FTE)2 $73,402 ($1,410) (2)%
Credit Costs2 22,647 13,403 145%
Expense3 42,915 1,212 3%
Merger-related items (after-tax) (211) (211) NM
Reported Net Income $5,605 ($9,760) (64)%
Reported EPS $1.37 ($3.01) (69)%
ROE4 4% 13%
ROE Net of GW4 6% 21%
ROTCE4,5 7% 23%
1FI
NA
NC
IA
LR
ES
UL
TS
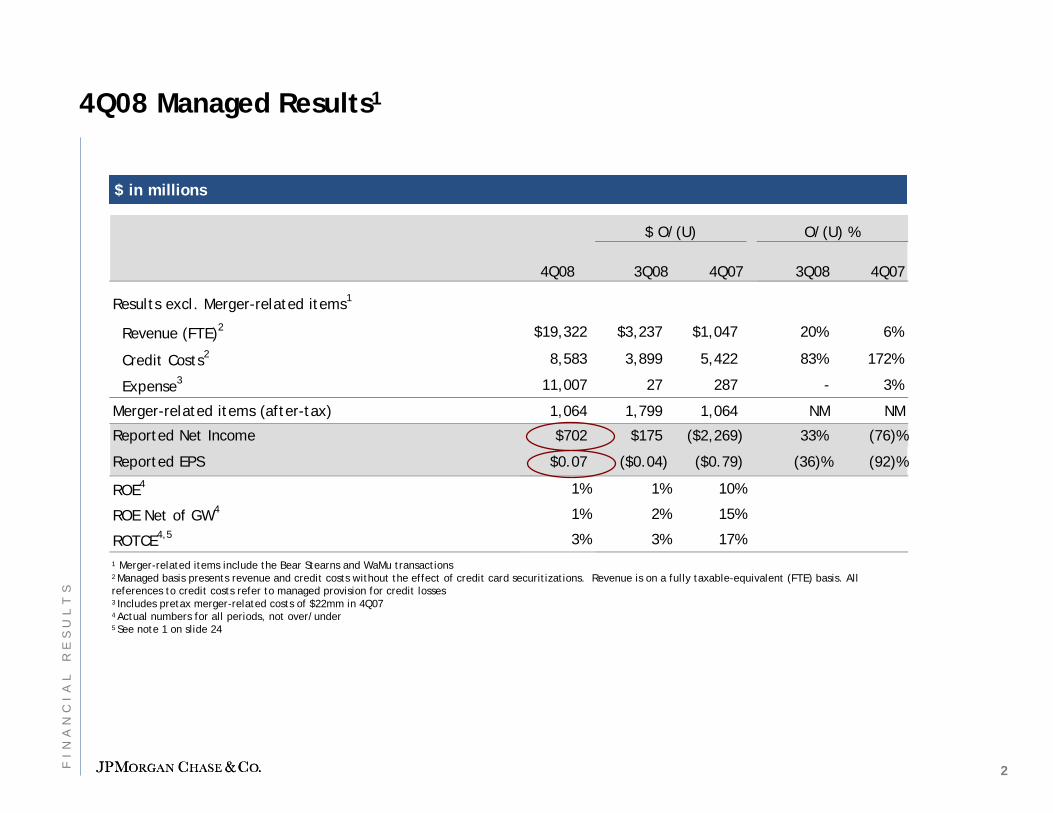
4Q08 Managed Results1
$ in millions$ in millions
1 Merger-related items include the Bear Stearns and WaMu transactions2 Managed basis presents revenue and credit costs without the effect of credit card securitizations. Revenue is on a fully taxable-equivalent (FTE) basis. All references to credit costs refer to managed provision for credit losses3 Includes pretax merger-related costs of $22mm in 4Q074 Actual numbers for all periods, not over/under5 See note 1 on slide 24
4Q08 3Q08 4Q07 3Q08 4Q07
Results excl. Merger-related items1
Revenue (FTE)2 $19,322 $3,237 $1,047 20% 6%
Credit Costs2 8,583 3,899 5,422 83% 172%
Expense3 11,007 27 287 - 3%
Merger-related items (after-tax) 1,064 1,799 1,064 NM NM
Reported Net Income $702 $175 ($2,269) 33% (76)%
Reported EPS $0.07 ($0.04) ($0.79) (36)% (92)%
ROE4 1% 1% 10%
ROE Net of GW4 1% 2% 15%
ROTCE4,5 3% 3% 17%
$ O/(U) O/(U) %
2FI
NA
NC
IA
LR
ES
UL
TS
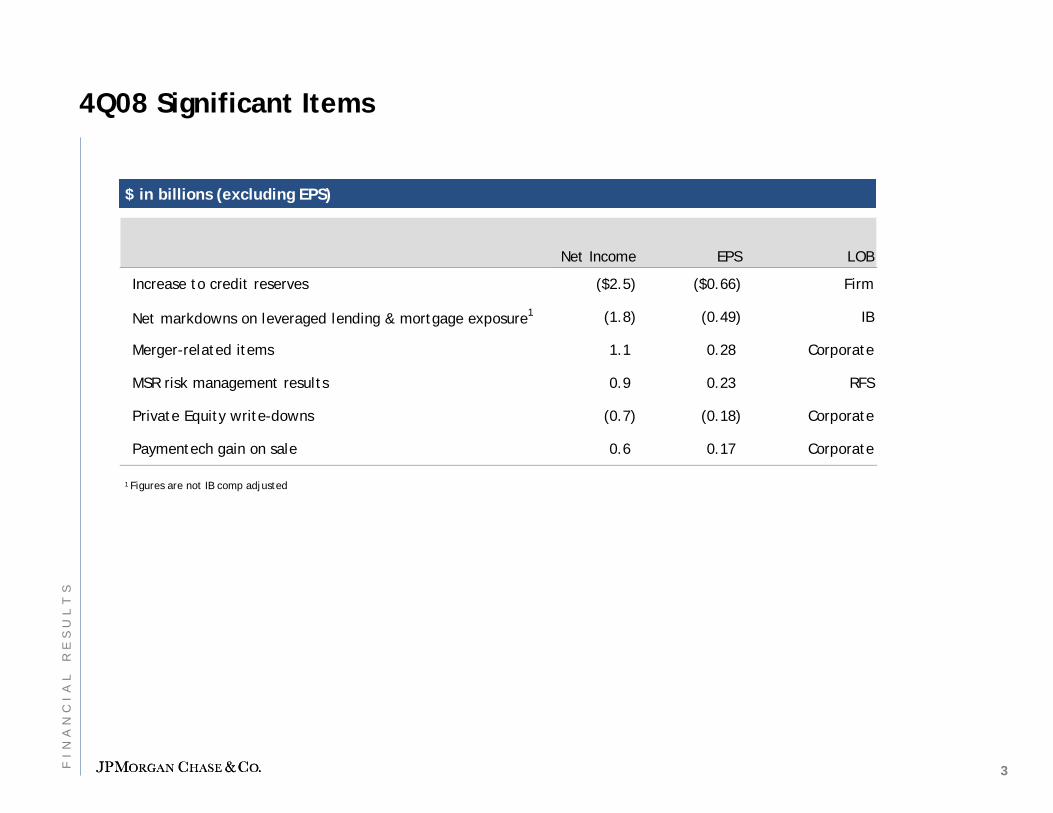
Net Income EPS LOB
Increase to credit reserves ($2.5) ($0.66) Firm
Net markdowns on leveraged lending & mortgage exposure1 (1.8) (0.49) IB
Merger-related items 1.1 0.28 Corporate
MSR risk management results 0.9 0.23 RFS
Private Equity write-downs (0.7) (0.18) Corporate
Paymentech gain on sale 0.6 0.17 Corporate
4Q08 Significant Items
$ in billions (excluding EPS)$ in billions (excluding EPS)
1 Figures are not IB comp adjusted
3FI
NA
NC
IA
LR
ES
UL
TS
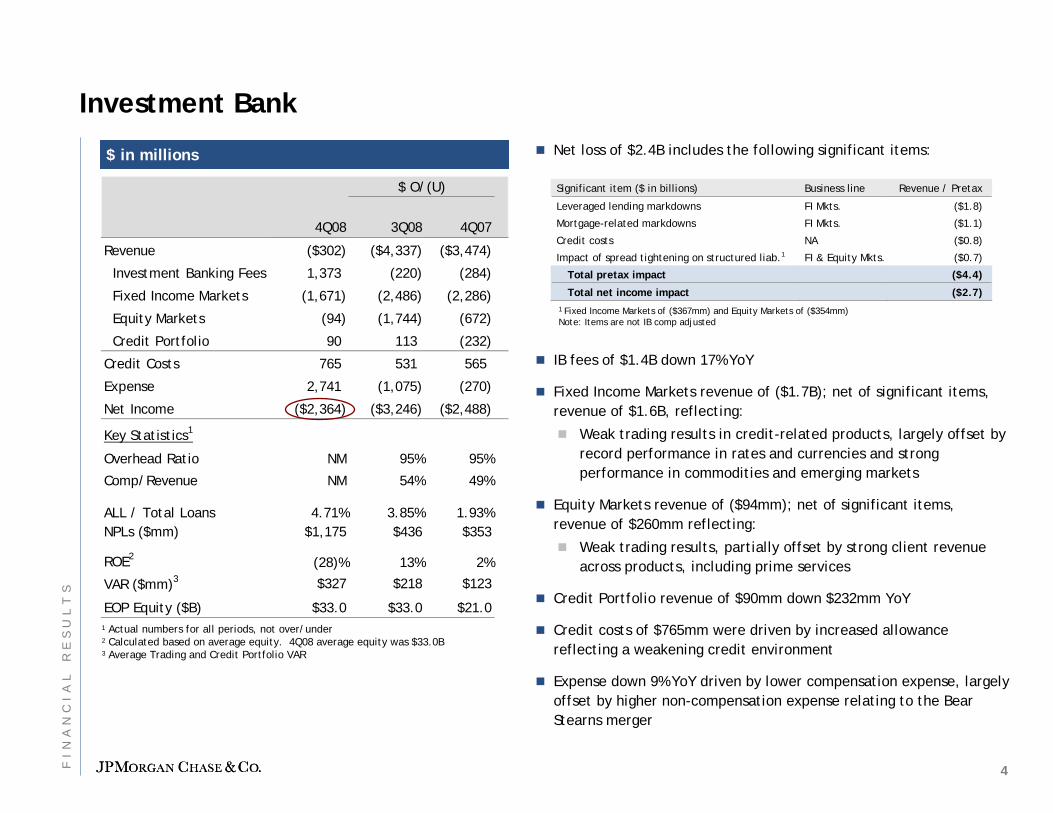
Investment BankNet loss of $2.4B includes the following significant items:
IB fees of $1.4B down 17% YoY
Fixed Income Markets revenue of ($1.7B); net of significant items, revenue of $1.6B, reflecting:
Weak trading results in credit-related products, largely offset by record performance in rates and currencies and strong performance in commodities and emerging markets
Equity Markets revenue of ($94mm); net of significant items, revenue of $260mm reflecting:
Weak trading results, partially offset by strong client revenue across products, including prime services
Credit Portfolio revenue of $90mm down $232mm YoY
Credit costs of $765mm were driven by increased allowance reflecting a weakening credit environment
Expense down 9% YoY driven by lower compensation expense, largely offset by higher non-compensation expense relating to the Bear Stearns merger
1 Actual numbers for all periods, not over/under2 Calculated based on average equity. 4Q08 average equity was $33.0B3 Average Trading and Credit Portfolio VAR
4Q08 3Q08 4Q07
Revenue ($302) ($4,337) ($3,474)
Investment Banking Fees 1,373 (220) (284)
Fixed Income Markets (1,671) (2,486) (2,286)
Equity Markets (94) (1,744) (672)
Credit Portfolio 90 113 (232)
Credit Costs 765 531 565
Expense 2,741 (1,075) (270)
Net Income ($2,364) ($3,246) ($2,488)
Key Statistics1
Overhead Ratio NM 95% 95%
Comp/Revenue NM 54% 49%
ALL / Total Loans 4.71% 3.85% 1.93%NPLs ($mm) $1,175 $436 $353
ROE2 (28)% 13% 2%
VAR ($mm)3 $327 $218 $123
EOP Equity ($B) $33.0 $33.0 $21.0
$ O/(U)
$ in millions$ in millions
Significant item ($ in billions) Business line Revenue / Pretax
Leveraged lending markdowns FI Mkts. ($1.8)
Mortgage-related markdowns FI Mkts. ($1.1)
Credit costs NA ($0.8)
Impact of spread tightening on structured liab.1 FI & Equity Mkts. ($0.7)
Total pretax impact ($4.4)
Total net income impact ($2.7) 1 Fixed Income Markets of ($367mm) and Equity Markets of ($354mm)Note: Items are not IB comp adjusted
4FI
NA
NC
IA
LR
ES
UL
TS
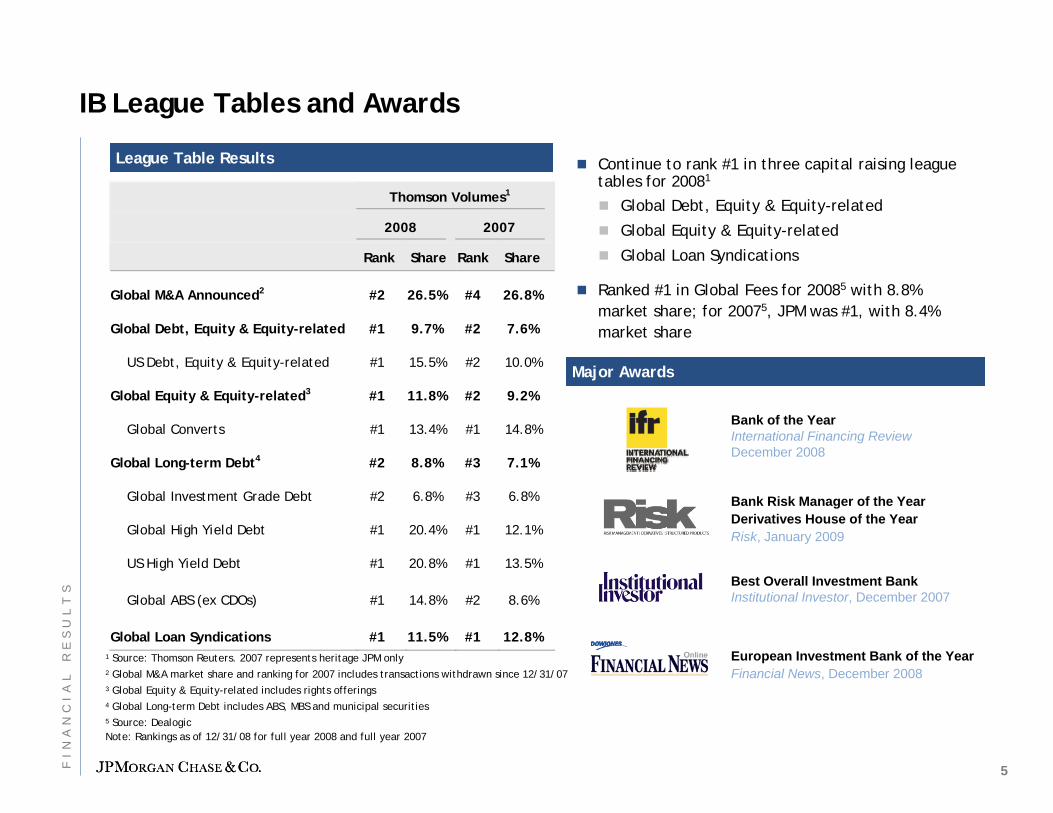
League Table ResultsLeague Table Results
IB League Tables and Awards
Thomson Volumes1
2008 2007
Rank Share Rank Share
Global M&A Announced2 #2 26.5% #4 26.8%
Global Debt, Equity & Equity-related #1 9.7% #2 7.6%
US Debt, Equity & Equity-related #1 15.5% #2 10.0%
Global Equity & Equity-related3 #1 11.8% #2 9.2%
Global Converts #1 13.4% #1 14.8%
Global Long-term Debt4 #2 8.8% #3 7.1%
Global Investment Grade Debt #2 6.8% #3 6.8%
Global High Yield Debt #1 20.4% #1 12.1%
US High Yield Debt #1 20.8% #1 13.5%
Global ABS (ex CDOs) #1 14.8% #2 8.6%
Global Loan Syndications #1 11.5% #1 12.8%
1 Source: Thomson Reuters. 2007 represents heritage JPM only 2 Global M&A market share and ranking for 2007 includes transactions withdrawn since 12/31/073 Global Equity & Equity-related includes rights offerings4 Global Long-term Debt includes ABS, MBS and municipal securities5 Source: DealogicNote: Rankings as of 12/31/08 for full year 2008 and full year 2007
Major AwardsMajor Awards
Best Overall Investment BankInstitutional Investor, December 2007
Bank of the YearInternational Financing ReviewDecember 2008
European Investment Bank of the YearFinancial News, December 2008
Continue to rank #1 in three capital raising league tables for 20081
Global Debt, Equity & Equity-related
Global Equity & Equity-related
Global Loan Syndications
Ranked #1 in Global Fees for 20085 with 8.8% market share; for 20075, JPM was #1, with 8.4% market share
Bank Risk Manager of the YearDerivatives House of the YearRisk, January 2009
5FI
NA
NC
IA
LR
ES
UL
TS
Leveraged Lending
Markdowns of $1.8B, net of hedges, on remaining legacy commitments
$12.6B of legacy commitments with gross markdowns of $5.7B, or 45%; market value at 12/31/08 of $6.9B
$12.9B of legacy commitments at 9/30/08
($0.3B) reduction, or 2% of exposure
$12.6B of legacy commitments at 12/31/08 classified as held-for-sale
Valuations are deal specific and result in a wide range of pricing levels; markdowns represent best indication of prices at 12/31/08
Note: Exposures are stated on a trade date basis. $9.3B total commitments at 12/31/08 classified as held-for-investment
6FI
NA
NC
IA
LR
ES
UL
TS
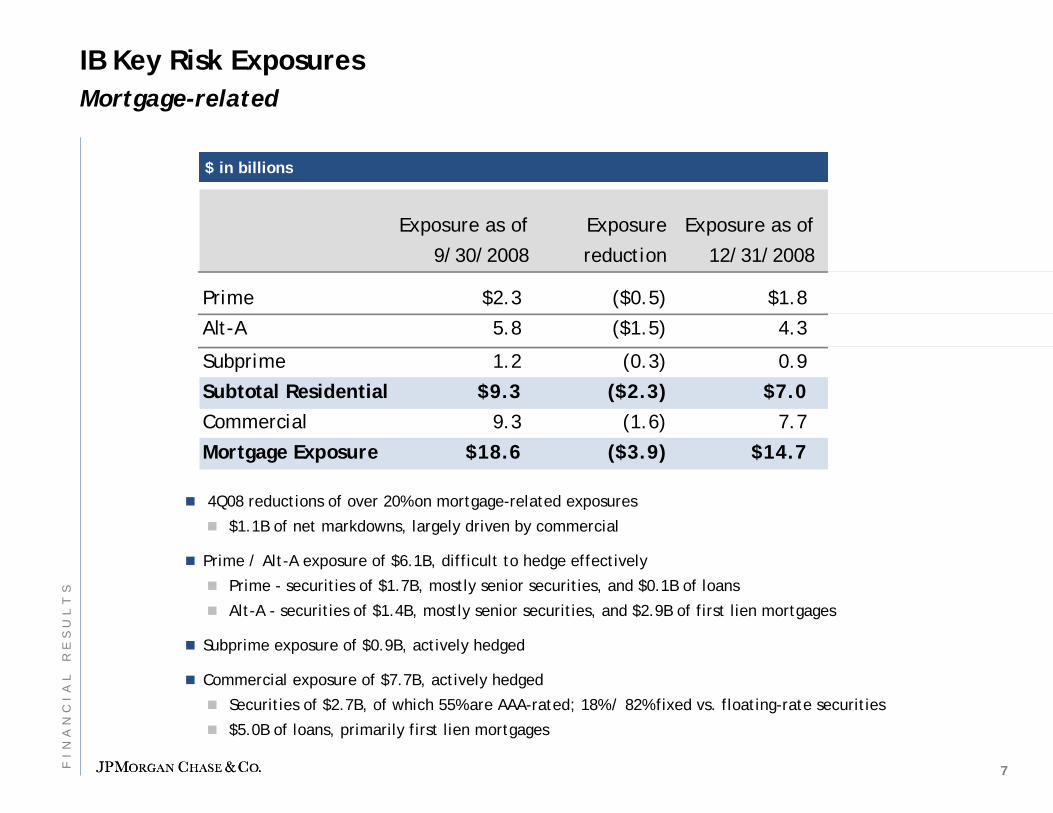
IB Key Risk ExposuresMortgage-related
$ in billions$ in billions
Exposure as of
9/30/2008
Exposure
reduction
Exposure as of
12/31/2008
Prime $2.3 ($0.5) $1.8
Alt-A 5.8 ($1.5) 4.3
Subprime 1.2 (0.3) 0.9
Subtotal Residential $9.3 ($2.3) $7.0Commercial 9.3 (1.6) 7.7
Mortgage Exposure $18.6 ($3.9) $14.7
4Q08 reductions of over 20% on mortgage-related exposures
$1.1B of net markdowns, largely driven by commercial
Prime / Alt-A exposure of $6.1B, difficult to hedge effectively
Prime - securities of $1.7B, mostly senior securities, and $0.1B of loans
Alt-A - securities of $1.4B, mostly senior securities, and $2.9B of first lien mortgages
Subprime exposure of $0.9B, actively hedged
Commercial exposure of $7.7B, actively hedged
Securities of $2.7B, of which 55% are AAA-rated; 18% / 82% fixed vs. floating-rate securities
$5.0B of loans, primarily first lien mortgages
7FI
NA
NC
IA
LR
ES
UL
TS
Retail Banking Consumer Lending
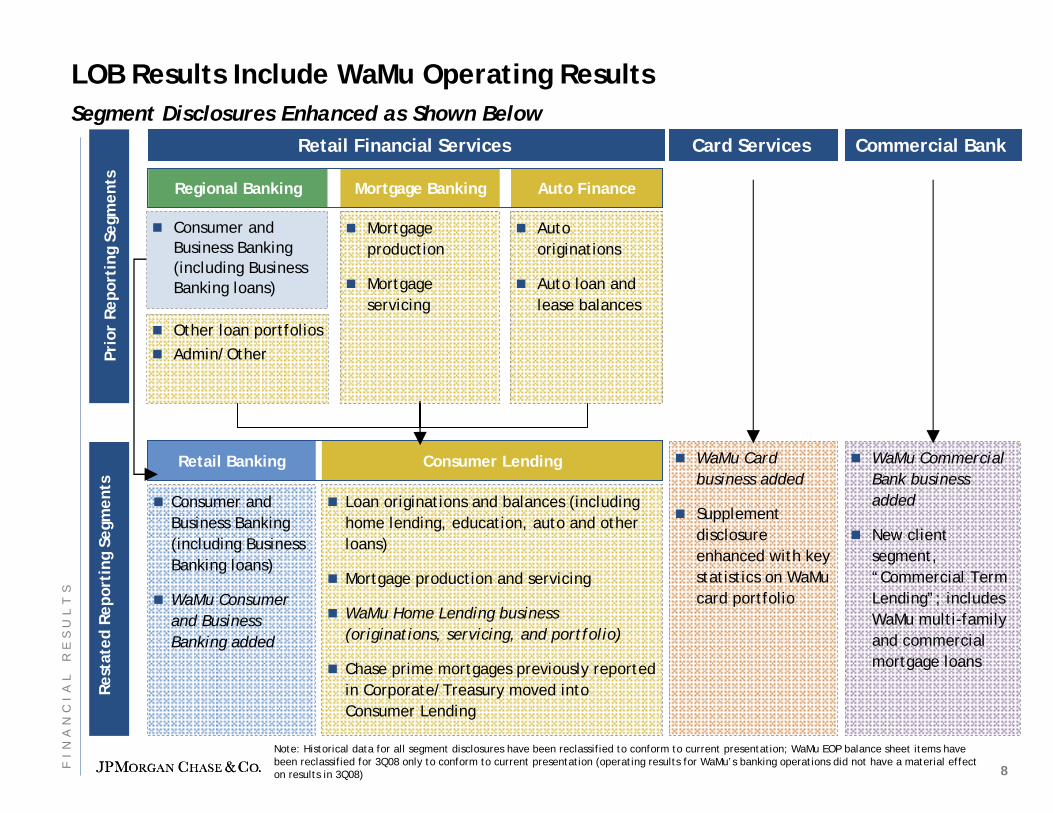
LOB Results Include WaMu Operating ResultsSegment Disclosures Enhanced as Shown Below
Regional Banking Mortgage Banking Auto Finance
Consumer and Business Banking (including Business Banking loans)
WaMu Consumer and Business Banking added
Loan originations and balances (including home lending, education, auto and other loans)
Mortgage production and servicing
WaMu Home Lending business (originations, servicing, and portfolio)
Chase prime mortgages previously reported in Corporate/Treasury moved into Consumer Lending
Rest
ated
Rep
orti
ng S
egm
ents
Prio
r Re
port
ing
Segm
ents
WaMu Card business added
Supplementdisclosure enhanced with key statistics on WaMu card portfolio
WaMu Commercial Bank business added
New client segment, “Commercial Term Lending”; includes WaMu multi-family and commercial mortgage loans
Retail Financial ServicesRetail Financial Services
Other loan portfoliosAdmin/Other
Mortgage production
Mortgage servicing
Auto originations
Auto loan and lease balances
Card ServicesCard Services Commercial BankCommercial Bank
Consumer and Business Banking (including Business Banking loans)
Note: Historical data for all segment disclosures have been reclassified to conform to current presentation; WaMu EOP balance sheet items have been reclassified for 3Q08 only to conform to current presentation (operating results for WaMu’s banking operations did not have a material effect on results in 3Q08) 8F
IN
AN
CI
AL
RE
SU
LT
S
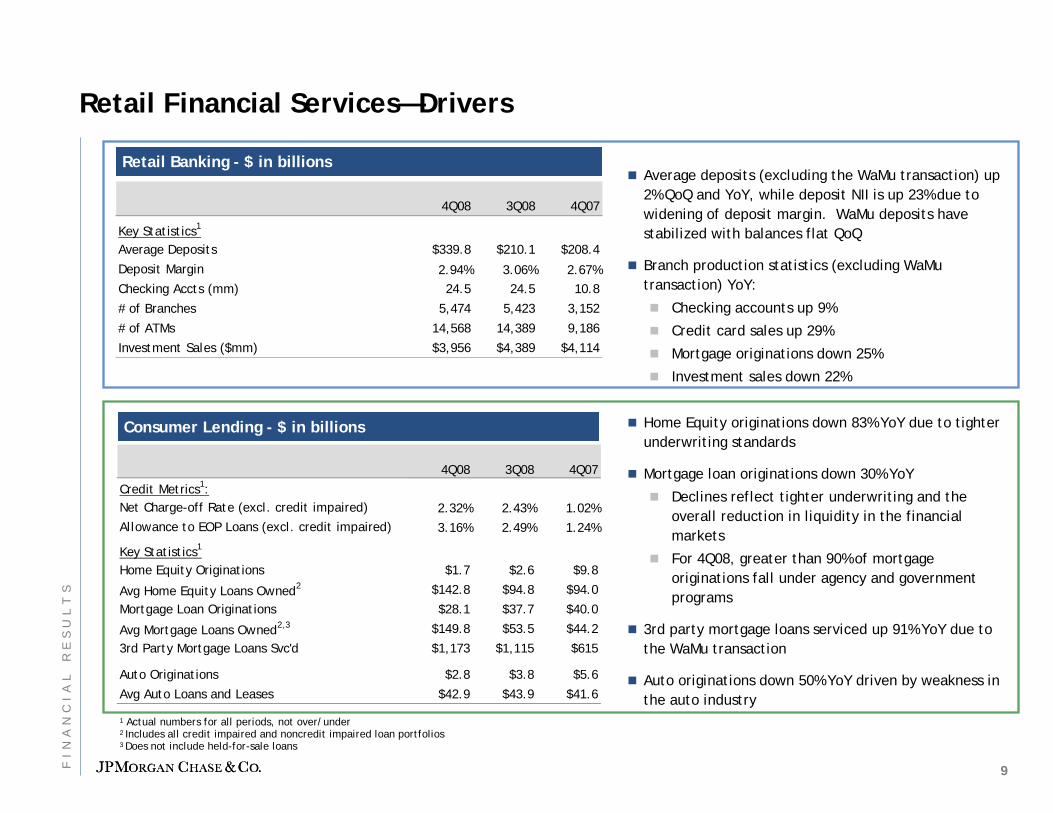
Retail Financial Services—Drivers
1 Actual numbers for all periods, not over/under2 Includes all credit impaired and noncredit impaired loan portfolios3 Does not include held-for-sale loans
Average deposits (excluding the WaMu transaction) up 2% QoQ and YoY, while deposit NII is up 23% due to widening of deposit margin. WaMu deposits have stabilized with balances flat QoQ
Branch production statistics (excluding WaMu transaction) YoY:
Checking accounts up 9%
Credit card sales up 29%
Mortgage originations down 25%
Investment sales down 22%
Home Equity originations down 83% YoY due to tighter underwriting standards
Mortgage loan originations down 30% YoY
Declines reflect tighter underwriting and the overall reduction in liquidity in the financial markets
For 4Q08, greater than 90% of mortgage originations fall under agency and government programs
3rd party mortgage loans serviced up 91% YoY due to the WaMu transaction
Auto originations down 50% YoY driven by weakness in the auto industry
Consumer Lending - $ in billionsConsumer Lending - $ in billions
Retail Banking - $ in billionsRetail Banking - $ in billions
4Q08 3Q08 4Q07
Key Statistics1
Average Deposits $339.8 $210.1 $208.4
Deposit Margin 2.94% 3.06% 2.67%Checking Accts (mm) 24.5 24.5 10.8
# of Branches 5,474 5,423 3,152
# of ATMs 14,568 14,389 9,186
Investment Sales ($mm) $3,956 $4,389 $4,114
4Q08 3Q08 4Q07
Credit Metrics1:Net Charge-off Rate (excl. credit impaired) 2.32% 2.43% 1.02%Allowance to EOP Loans (excl. credit impaired) 3.16% 2.49% 1.24%
Key Statistics1
Home Equity Originations $1.7 $2.6 $9.8
Avg Home Equity Loans Owned2 $142.8 $94.8 $94.0
Mortgage Loan Originations $28.1 $37.7 $40.0
Avg Mortgage Loans Owned2,3 $149.8 $53.5 $44.2
3rd Party Mortgage Loans Svc'd $1,173 $1,115 $615
Auto Originations $2.8 $3.8 $5.6
Avg Auto Loans and Leases $42.9 $43.9 $41.6
9FI
NA
NC
IA
LR
ES
UL
TS
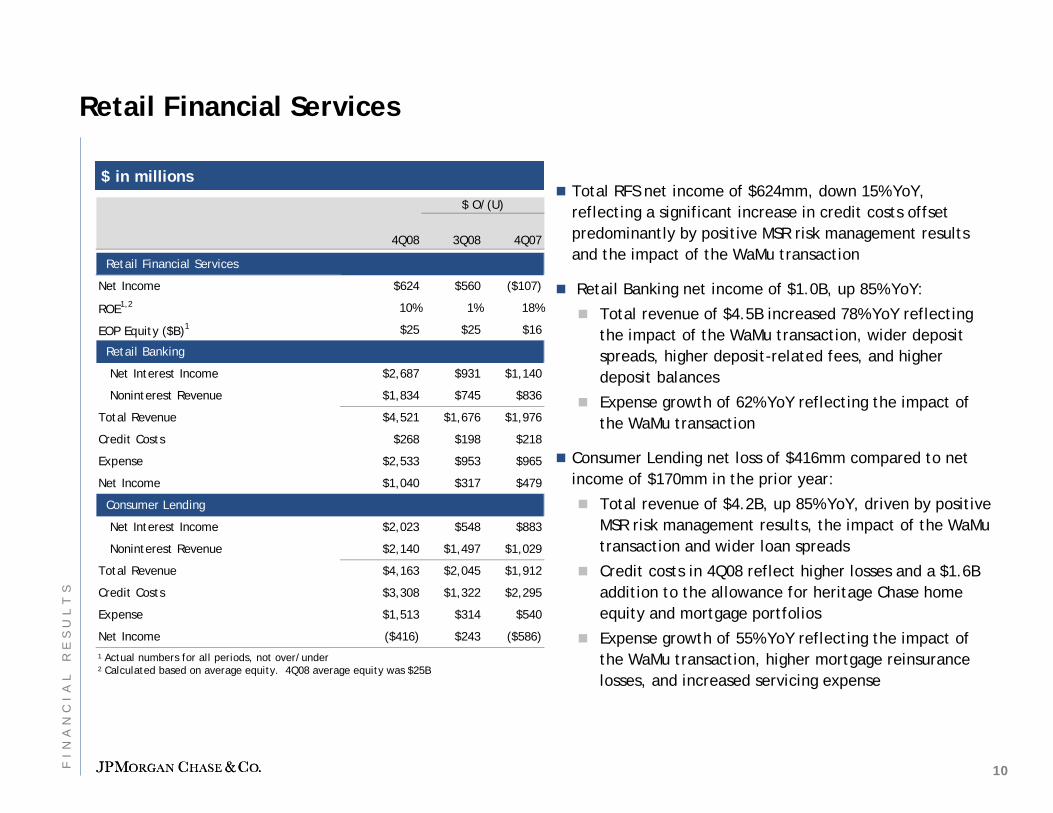
4Q08 3Q08 4Q07
Retail Financial Services
Net Income $624 $560 ($107)
ROE1,2 10% 1% 18%
EOP Equity ($B)1 $25 $25 $16
Retail Banking
Net Interest Income $2,687 $931 $1,140
Noninterest Revenue $1,834 $745 $836
Total Revenue $4,521 $1,676 $1,976
Credit Costs $268 $198 $218
Expense $2,533 $953 $965
Net Income $1,040 $317 $479
Consumer Lending
Net Interest Income $2,023 $548 $883
Noninterest Revenue $2,140 $1,497 $1,029
Total Revenue $4,163 $2,045 $1,912
Credit Costs $3,308 $1,322 $2,295
Expense $1,513 $314 $540
Net Income ($416) $243 ($586)
$ O/(U)Total RFS net income of $624mm, down 15% YoY, reflecting a significant increase in credit costs offset predominantly by positive MSR risk management results and the impact of the WaMu transaction
Retail Banking net income of $1.0B, up 85% YoY:
Total revenue of $4.5B increased 78% YoY reflecting the impact of the WaMu transaction, wider deposit spreads, higher deposit-related fees, and higher deposit balances
Expense growth of 62% YoY reflecting the impact of the WaMu transaction
Consumer Lending net loss of $416mm compared to net income of $170mm in the prior year:
Total revenue of $4.2B, up 85% YoY, driven by positive MSR risk management results, the impact of the WaMu transaction and wider loan spreads
Credit costs in 4Q08 reflect higher losses and a $1.6B addition to the allowance for heritage Chase home equity and mortgage portfolios
Expense growth of 55% YoY reflecting the impact of the WaMu transaction, higher mortgage reinsurance losses, and increased servicing expense
Retail Financial Services
1 Actual numbers for all periods, not over/under2 Calculated based on average equity. 4Q08 average equity was $25B
$ in millions$ in millions
10FI
NA
NC
IA
LR
ES
UL
TS
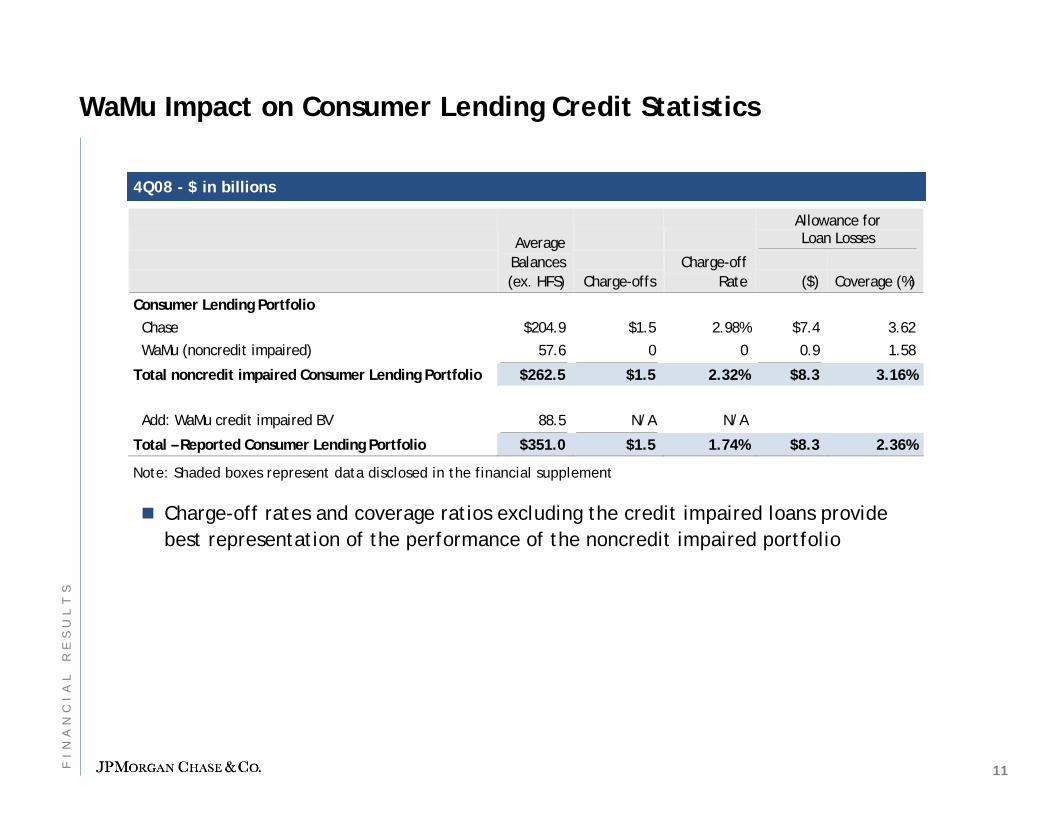
4Q08 - $ in billions4Q08 - $ in billions
WaMu Impact on Consumer Lending Credit Statistics
Allowance for Loan Losses
Average Balances
(ex. HFS) Charge-offs Charge-off
Rate ($) Coverage (%)
Consumer Lending Portfolio Chase $204.9 $1.5 2.98% $7.4 3.62 WaMu (noncredit impaired) 57.6 0 0 0.9 1.58
Total noncredit impaired Consumer Lending Portfolio $262.5 $1.5 2.32% $8.3 3.16% Add: WaMu credit impaired BV 88.5 N/A N/A
Total – Reported Consumer Lending Portfolio $351.0 $1.5 1.74% $8.3 2.36% Note: Shaded boxes represent data disclosed in the financial supplement
Charge-off rates and coverage ratios excluding the credit impaired loans provide best representation of the performance of the noncredit impaired portfolio
11FI
NA
NC
IA
LR
ES
UL
TS
Comments on Home Equity PortfolioComments on Home Equity Portfolio
1.25%
1.50%
1.75%
2.00%
2.25%
2.50%
2.75%
3.00%
3.25%
Sep-07 Dec-07 Mar-08 Jun-08 Sep-08 Dec-08
Heritage JPM Combined noncredit impaired
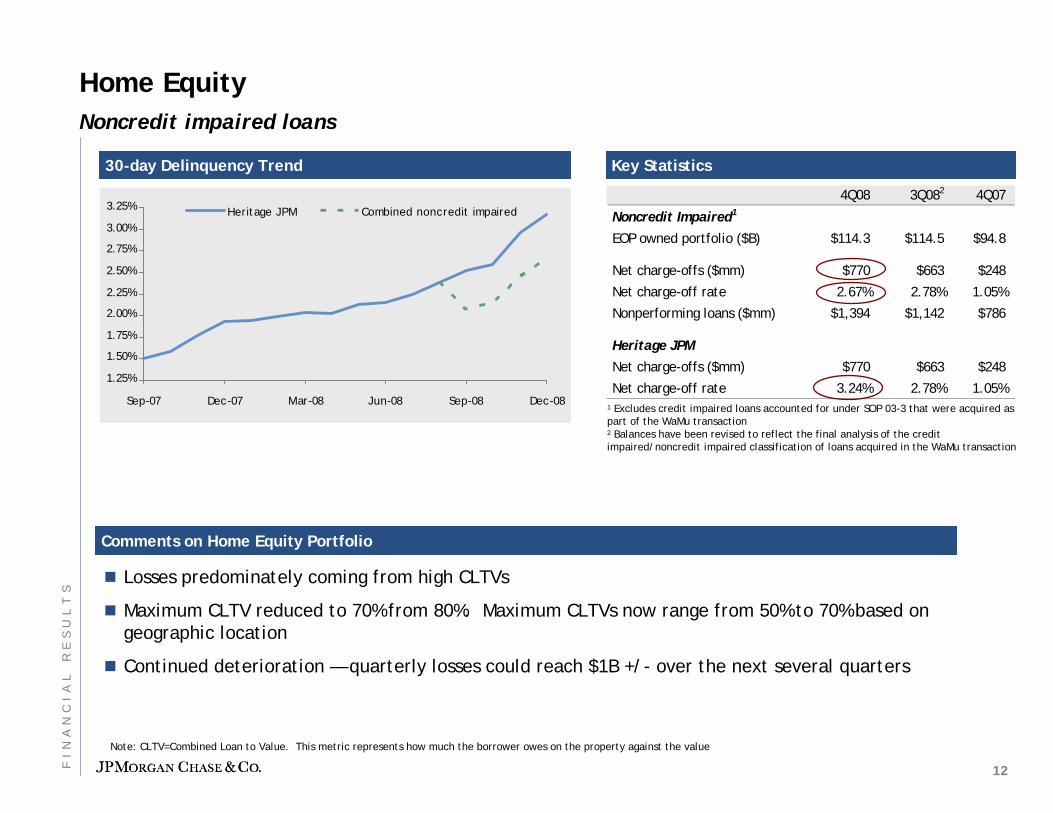
Note: CLTV=Combined Loan to Value. This metric represents how much the borrower owes on the property against the value
1 Excludes credit impaired loans accounted for under SOP 03-3 that were acquired as part of the WaMu transaction2 Balances have been revised to reflect the final analysis of the credit impaired/noncredit impaired classification of loans acquired in the WaMu transaction
Home Equity Noncredit impaired loans
4Q08 3Q082 4Q07
Noncredit Impaired1
EOP owned portfolio ($B) $114.3 $114.5 $94.8
Net charge-offs ($mm) $770 $663 $248
Net charge-off rate 2.67% 2.78% 1.05%
Nonperforming loans ($mm) $1,394 $1,142 $786
Heritage JPM
Net charge-offs ($mm) $770 $663 $248
Net charge-off rate 3.24% 2.78% 1.05%
Key StatisticsKey Statistics30-day Delinquency Trend30-day Delinquency Trend
Losses predominately coming from high CLTVs
Maximum CLTV reduced to 70% from 80%. Maximum CLTVs now range from 50% to 70% based on geographic location
Continued deterioration — quarterly losses could reach $1B +/- over the next several quarters
12FI
NA
NC
IA
LR
ES
UL
TS
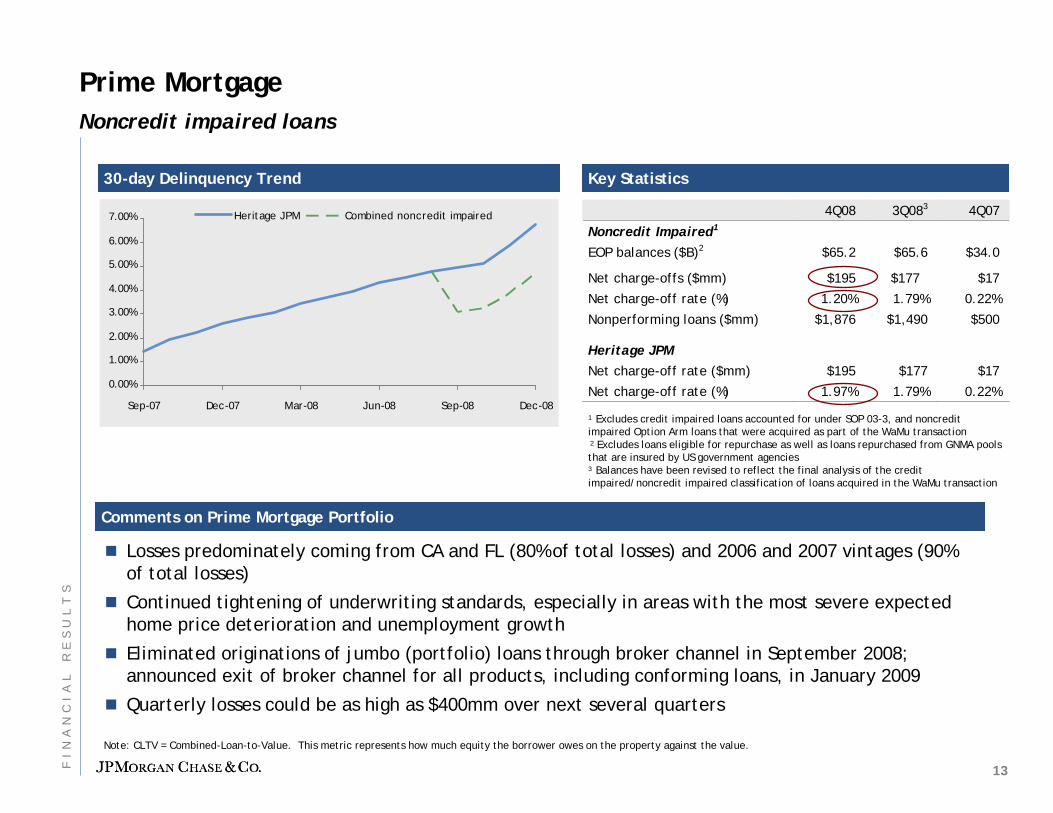
Prime MortgageNoncredit impaired loans
0.00%
1.00%
2.00%
3.00%
4.00%
5.00%
6.00%
7.00%
Sep-07 Dec-07 Mar-08 Jun-08 Sep-08 Dec-08
Heritage JPM Combined noncredit impaired
Comments on Prime Mortgage PortfolioComments on Prime Mortgage Portfolio
1 Excludes credit impaired loans accounted for under SOP 03-3, and noncredit impaired Option Arm loans that were acquired as part of the WaMu transaction2 Excludes loans eligible for repurchase as well as loans repurchased from GNMA pools that are insured by US government agencies3 Balances have been revised to reflect the final analysis of the credit impaired/noncredit impaired classification of loans acquired in the WaMu transaction
4Q08 3Q083 4Q07
Noncredit Impaired1
EOP balances ($B)2 $65.2 $65.6 $34.0
Net charge-offs ($mm) $195 $177 $17
Net charge-off rate (%) 1.20% 1.79% 0.22%
Nonperforming loans ($mm) $1,876 $1,490 $500
Heritage JPM
Net charge-off rate ($mm) $195 $177 $17
Net charge-off rate (%) 1.97% 1.79% 0.22%
Key StatisticsKey Statistics30-day Delinquency Trend30-day Delinquency Trend
Losses predominately coming from CA and FL (80% of total losses) and 2006 and 2007 vintages (90% of total losses)
Continued tightening of underwriting standards, especially in areas with the most severe expected home price deterioration and unemployment growth
Eliminated originations of jumbo (portfolio) loans through broker channel in September 2008; announced exit of broker channel for all products, including conforming loans, in January 2009
Quarterly losses could be as high as $400mm over next several quarters
Note: CLTV = Combined-Loan-to-Value. This metric represents how much equity the borrower owes on the property against the value.
13FI
NA
NC
IA
LR
ES
UL
TS
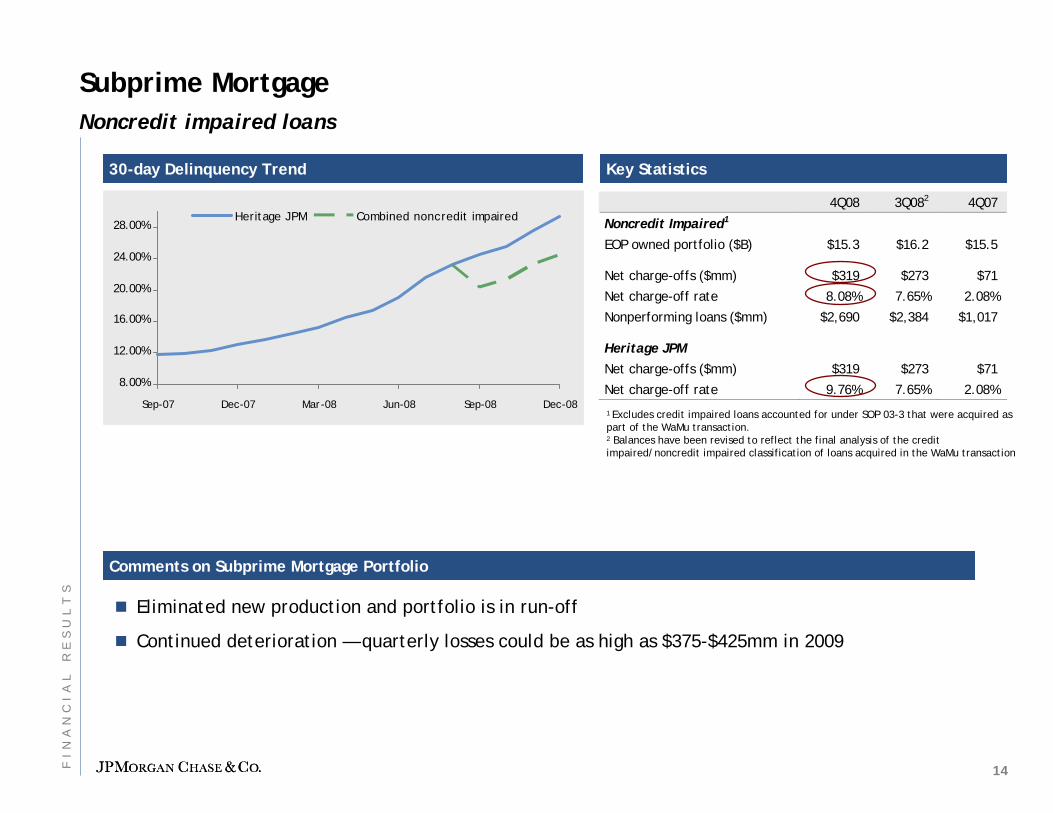
Subprime Mortgage Noncredit impaired loans
Comments on Subprime Mortgage PortfolioComments on Subprime Mortgage Portfolio
1 Excludes credit impaired loans accounted for under SOP 03-3 that were acquired as part of the WaMu transaction.2 Balances have been revised to reflect the final analysis of the credit impaired/noncredit impaired classification of loans acquired in the WaMu transaction
4Q08 3Q082 4Q07
Noncredit Impaired1
EOP owned portfolio ($B) $15.3 $16.2 $15.5
Net charge-offs ($mm) $319 $273 $71
Net charge-off rate 8.08% 7.65% 2.08%
Nonperforming loans ($mm) $2,690 $2,384 $1,017
Heritage JPM
Net charge-offs ($mm) $319 $273 $71
Net charge-off rate 9.76% 7.65% 2.08%
Key StatisticsKey Statistics30-day Delinquency Trend30-day Delinquency Trend
Eliminated new production and portfolio is in run-off
Continued deterioration — quarterly losses could be as high as $375-$425mm in 2009
8.00%
12.00%
16.00%
20.00%
24.00%
28.00%
Sep-07 Dec-07 Mar-08 Jun-08 Sep-08 Dec-08
Heritage JPM Combined noncredit impaired
14FI
NA
NC
IA
LR
ES
UL
TS
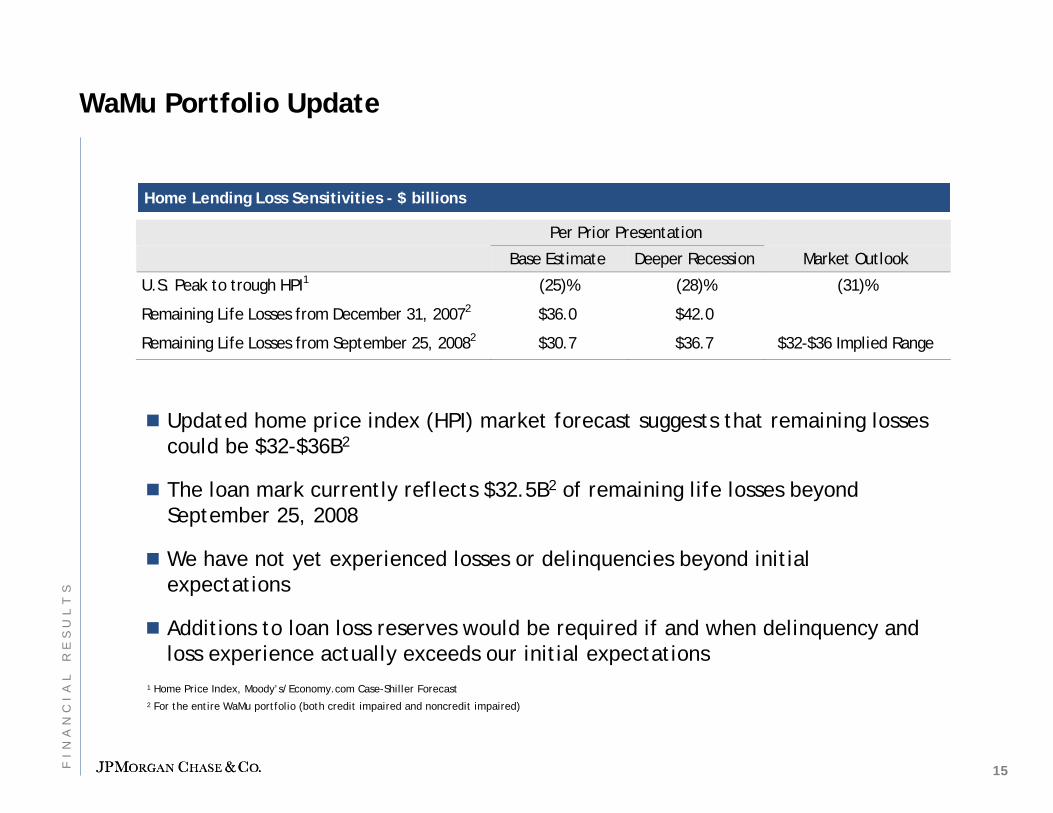
WaMu Portfolio Update
Per Prior Presentation
Base Estimate Deeper Recession Market Outlook
U.S. Peak to trough HPI1 (25)% (28)% (31)%
Remaining Life Losses from December 31, 20072 $36.0 $42.0
Remaining Life Losses from September 25, 20082 $30.7 $36.7 $32-$36 Implied Range
Home Lending Loss Sensitivities - $ billionsHome Lending Loss Sensitivities - $ billions
Updated home price index (HPI) market forecast suggests that remaining losses could be $32-$36B2
The loan mark currently reflects $32.5B2 of remaining life losses beyond September 25, 2008
We have not yet experienced losses or delinquencies beyond initial expectations
Additions to loan loss reserves would be required if and when delinquency and loss experience actually exceeds our initial expectations
1 Home Price Index, Moody’s/Economy.com Case-Shiller Forecast2 For the entire WaMu portfolio (both credit impaired and noncredit impaired)
15FI
NA
NC
IA
LR
ES
UL
TS
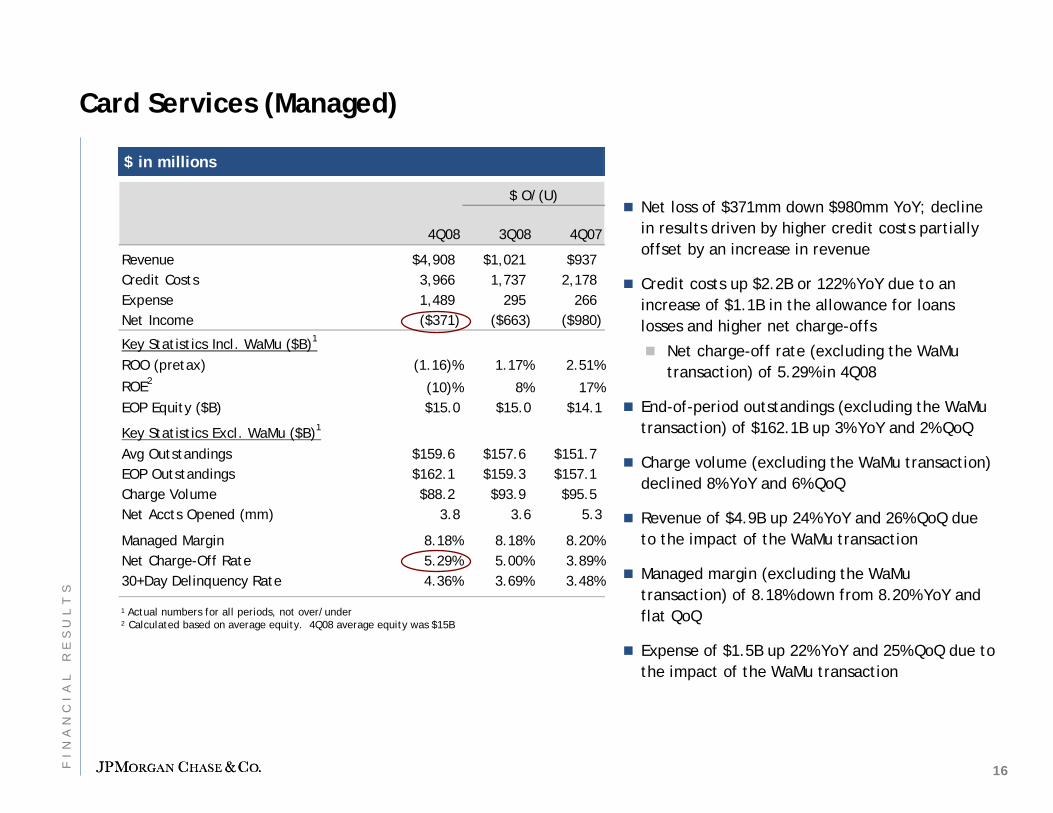
4Q08 3Q08 4Q07
Revenue $4,908 $1,021 $937Credit Costs 3,966 1,737 2,178 Expense 1,489 295 266 Net Income ($371) ($663) ($980)
Key Statistics Incl. WaMu ($B)1
ROO (pretax) (1.16)% 1.17% 2.51%
ROE2 (10)% 8% 17%EOP Equity ($B) $15.0 $15.0 $14.1
Key Statistics Excl. WaMu ($B)1
Avg Outstandings $159.6 $157.6 $151.7EOP Outstandings $162.1 $159.3 $157.1Charge Volume $88.2 $93.9 $95.5Net Accts Opened (mm) 3.8 3.6 5.3
Managed Margin 8.18% 8.18% 8.20%Net Charge-Off Rate 5.29% 5.00% 3.89%30+Day Delinquency Rate 4.36% 3.69% 3.48%
$ O/(U)Net loss of $371mm down $980mm YoY; decline in results driven by higher credit costs partially offset by an increase in revenue
Credit costs up $2.2B or 122% YoY due to an increase of $1.1B in the allowance for loans losses and higher net charge-offs
Net charge-off rate (excluding the WaMu transaction) of 5.29% in 4Q08
End-of-period outstandings (excluding the WaMu transaction) of $162.1B up 3% YoY and 2% QoQ
Charge volume (excluding the WaMu transaction) declined 8% YoY and 6% QoQ
Revenue of $4.9B up 24% YoY and 26% QoQ due to the impact of the WaMu transaction
Managed margin (excluding the WaMu transaction) of 8.18% down from 8.20% YoY and flat QoQ
Expense of $1.5B up 22% YoY and 25% QoQ due to the impact of the WaMu transaction
Card Services (Managed)
1 Actual numbers for all periods, not over/under2 Calculated based on average equity. 4Q08 average equity was $15B
$ in millions$ in millions
16FI
NA
NC
IA
LR
ES
UL
TS
Commercial Banking
¹ Actual numbers for all periods, not over/under2 Includes deposits and deposits swept to on-balance sheet liabilities3 Calculated based on average equity. 4Q08 average equity was $8B
$ in millions$ in millions
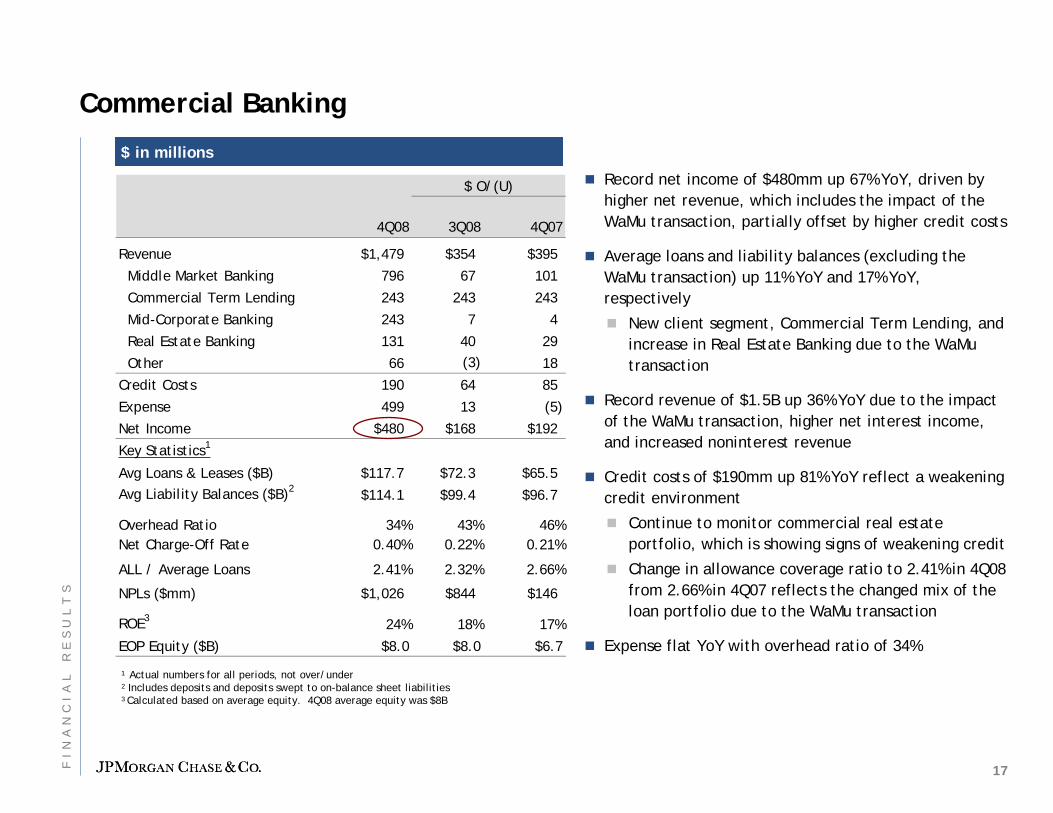
Record net income of $480mm up 67% YoY, driven by higher net revenue, which includes the impact of the WaMu transaction, partially offset by higher credit costs
Average loans and liability balances (excluding the WaMu transaction) up 11% YoY and 17% YoY, respectively
New client segment, Commercial Term Lending, and increase in Real Estate Banking due to the WaMu transaction
Record revenue of $1.5B up 36% YoY due to the impact of the WaMu transaction, higher net interest income, and increased noninterest revenue
Credit costs of $190mm up 81% YoY reflect a weakening credit environment
Continue to monitor commercial real estate portfolio, which is showing signs of weakening credit
Change in allowance coverage ratio to 2.41% in 4Q08 from 2.66% in 4Q07 reflects the changed mix of the loan portfolio due to the WaMu transaction
Expense flat YoY with overhead ratio of 34%
4Q08 3Q08 4Q07
Revenue $1,479 $354 $395
Middle Market Banking 796 67 101
Commercial Term Lending 243 243 243
Mid-Corporate Banking 243 7 4
Real Estate Banking 131 40 29
Other 66 (3) 18
Credit Costs 190 64 85
Expense 499 13 (5)
Net Income $480 $168 $192
Key Statistics1
Avg Loans & Leases ($B) $117.7 $72.3 $65.5Avg Liability Balances ($B)2 $114.1 $99.4 $96.7
Overhead Ratio 34% 43% 46%Net Charge-Off Rate 0.40% 0.22% 0.21%
ALL / Average Loans 2.41% 2.32% 2.66%
NPLs ($mm) $1,026 $844 $146
ROE3 24% 18% 17%
EOP Equity ($B) $8.0 $8.0 $6.7
$ O/(U)
17FI
NA
NC
IA
LR
ES
UL
TS
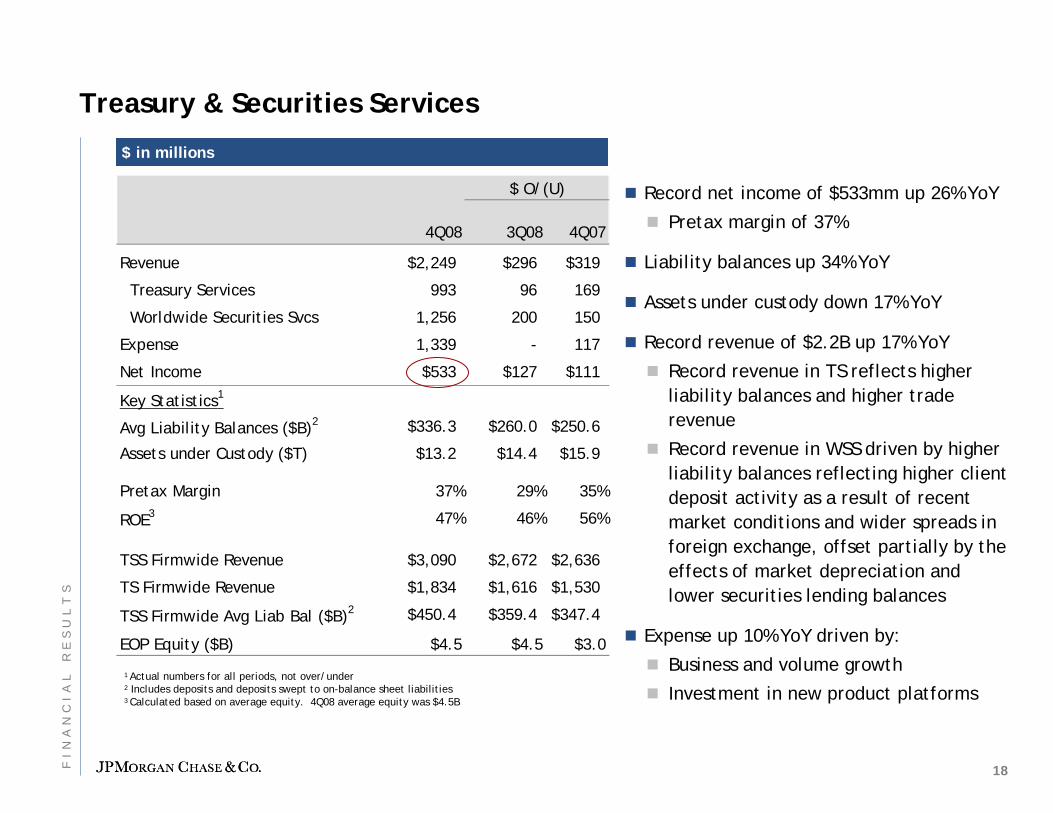
4Q08 3Q08 4Q07
Revenue $2,249 $296 $319
Treasury Services 993 96 169
Worldwide Securities Svcs 1,256 200 150
Expense 1,339 - 117
Net Income $533 $127 $111
Key Statistics1
Avg Liability Balances ($B)2 $336.3 $260.0 $250.6
Assets under Custody ($T) $13.2 $14.4 $15.9
Pretax Margin 37% 29% 35%
ROE3 47% 46% 56%
TSS Firmwide Revenue $3,090 $2,672 $2,636
TS Firmwide Revenue $1,834 $1,616 $1,530
TSS Firmwide Avg Liab Bal ($B)2 $450.4 $359.4 $347.4
EOP Equity ($B) $4.5 $4.5 $3.0
$ O/(U)
Treasury & Securities Services
1 Actual numbers for all periods, not over/under2 Includes deposits and deposits swept to on-balance sheet liabilities3 Calculated based on average equity. 4Q08 average equity was $4.5B
$ in millions$ in millions
Record net income of $533mm up 26% YoY
Pretax margin of 37%
Liability balances up 34% YoY
Assets under custody down 17% YoY
Record revenue of $2.2B up 17% YoY
Record revenue in TS reflects higher liability balances and higher trade revenue
Record revenue in WSS driven by higher liability balances reflecting higher client deposit activity as a result of recent market conditions and wider spreads in foreign exchange, offset partially by the effects of market depreciation and lower securities lending balances
Expense up 10% YoY driven by:
Business and volume growth
Investment in new product platforms
18FI
NA
NC
IA
LR
ES
UL
TS
Asset Management
$ in millions$ in millions
1 Actual numbers for all periods, not over/under2 Reflects $15B for assets under management and $68B for assets under supervision from the Bear Stearns merger on May 30, 20083 Reflects the transfer commencing in 1Q07 of held-for-investment prime mortgage loans from AM to Corporate within the Corporate/Private Equity segment4 Calculated based on average equity. 4Q08 average equity was $7B
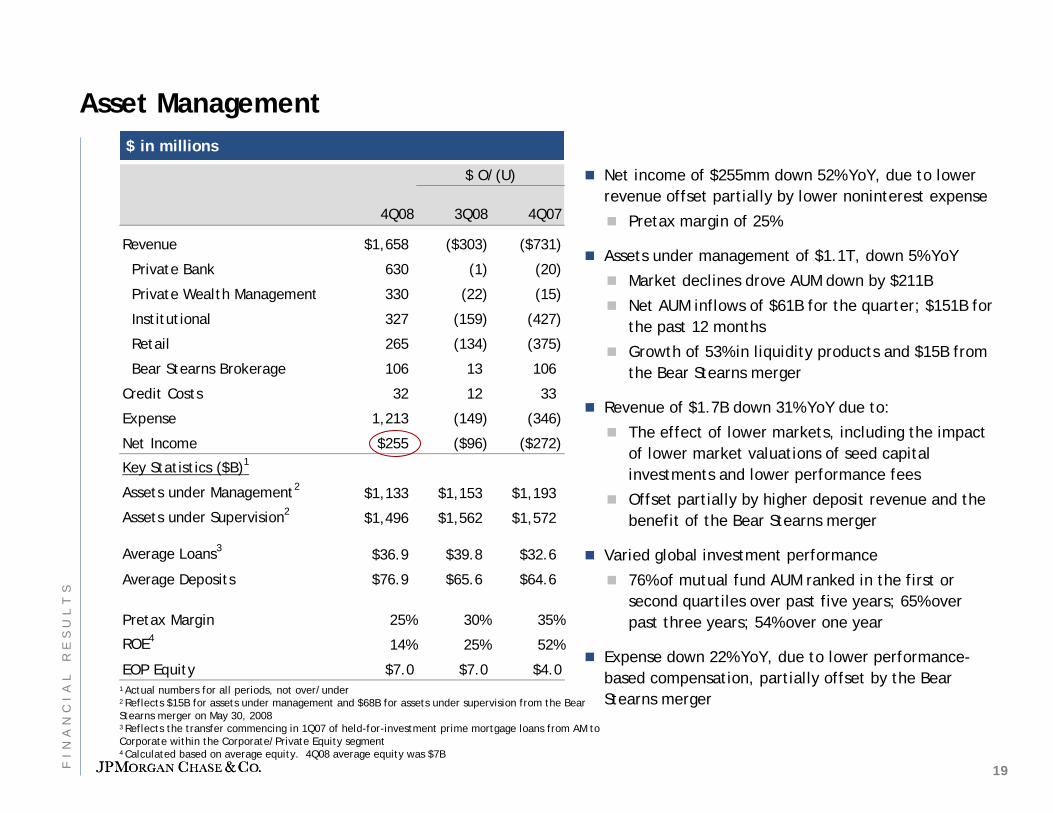
Net income of $255mm down 52% YoY, due to lower revenue offset partially by lower noninterest expense
Pretax margin of 25%
Assets under management of $1.1T, down 5% YoY
Market declines drove AUM down by $211B
Net AUM inflows of $61B for the quarter; $151B for the past 12 months
Growth of 53% in liquidity products and $15B from the Bear Stearns merger
Revenue of $1.7B down 31% YoY due to:
The effect of lower markets, including the impact of lower market valuations of seed capital investments and lower performance fees
Offset partially by higher deposit revenue and the benefit of the Bear Stearns merger
Varied global investment performance
76% of mutual fund AUM ranked in the first or second quartiles over past five years; 65% over past three years; 54% over one year
Expense down 22% YoY, due to lower performance-based compensation, partially offset by the Bear Stearns merger
4Q08 3Q08 4Q07
Revenue $1,658 ($303) ($731)
Private Bank 630 (1) (20)
Private Wealth Management 330 (22) (15)
Institutional 327 (159) (427)
Retail 265 (134) (375)
Bear Stearns Brokerage 106 13 106
Credit Costs 32 12 33
Expense 1,213 (149) (346)
Net Income $255 ($96) ($272)
Key Statistics ($B)1
Assets under Management2 $1,133 $1,153 $1,193
Assets under Supervision2 $1,496 $1,562 $1,572
Average Loans3 $36.9 $39.8 $32.6
Average Deposits $76.9 $65.6 $64.6
Pretax Margin 25% 30% 35%
ROE4 14% 25% 52%
EOP Equity $7.0 $7.0 $4.0
$ O/(U)
19FI
NA
NC
IA
LR
ES
UL
TS
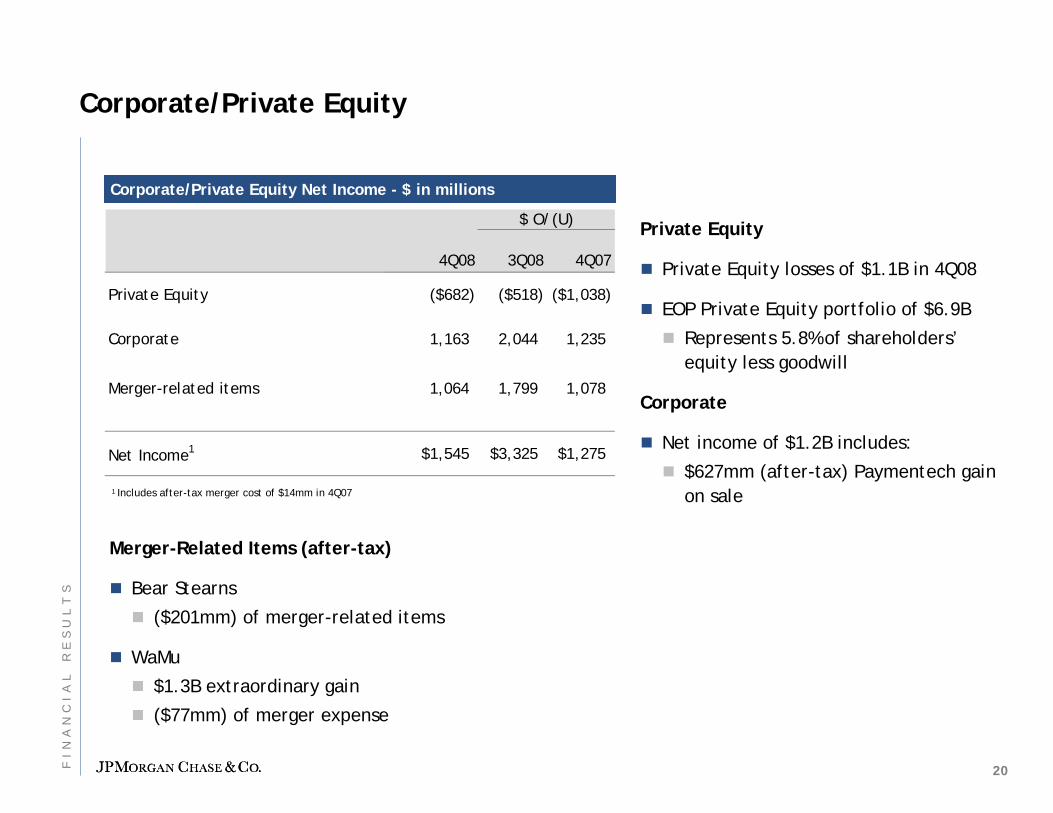
4Q08 3Q08 4Q07
Private Equity ($682) ($518) ($1,038)
Corporate 1,163 2,044 1,235
Merger-related items 1,064 1,799 1,078
Net Income1 $1,545 $3,325 $1,275
$ O/(U)
Corporate/Private Equity
Corporate/Private Equity Net Income - $ in millionsCorporate/Private Equity Net Income - $ in millions
Private Equity
Private Equity losses of $1.1B in 4Q08
EOP Private Equity portfolio of $6.9B
Represents 5.8% of shareholders’equity less goodwill
Corporate
Net income of $1.2B includes:
$627mm (after-tax) Paymentech gain on sale
Merger-Related Items (after-tax)
Bear Stearns
($201mm) of merger-related items
WaMu
$1.3B extraordinary gain
($77mm) of merger expense
1 Includes after-tax merger cost of $14mm in 4Q07
20FI
NA
NC
IA
LR
ES
UL
TS
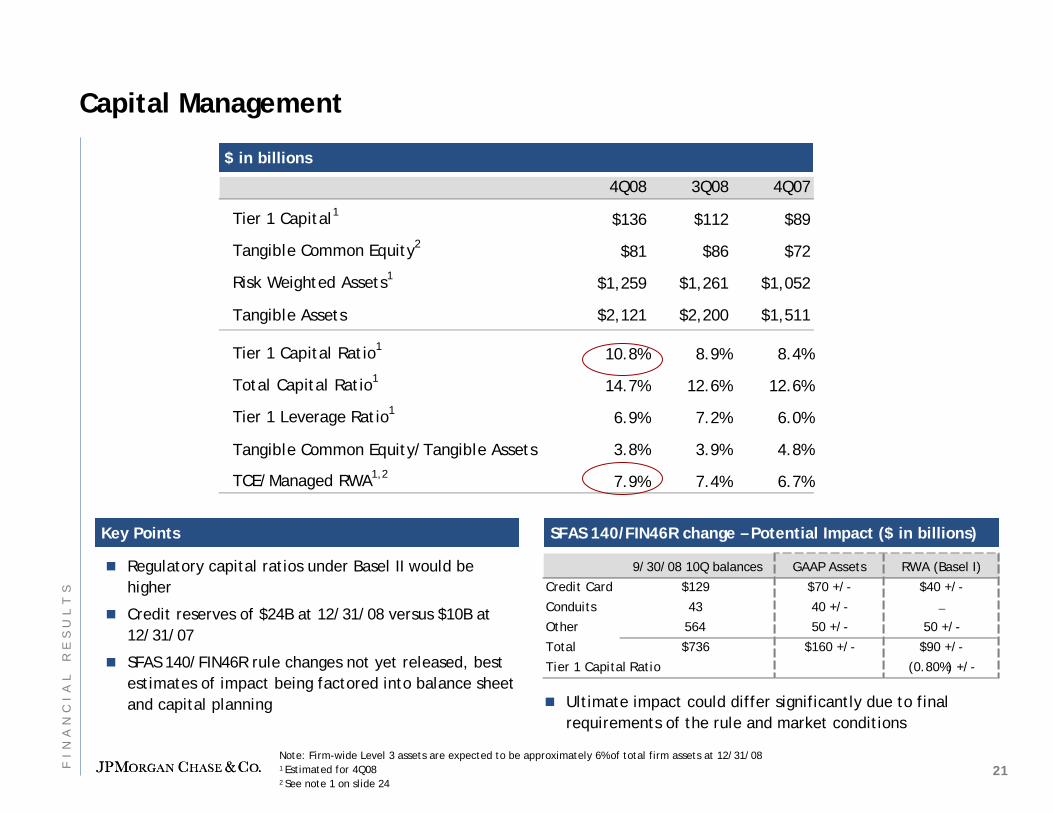
Capital Management
$ in billions$ in billions
Note: Firm-wide Level 3 assets are expected to be approximately 6% of total firm assets at 12/31/081 Estimated for 4Q08 2 See note 1 on slide 24
Regulatory capital ratios under Basel II would be higher
Credit reserves of $24B at 12/31/08 versus $10B at 12/31/07
SFAS 140/FIN46R rule changes not yet released, best estimates of impact being factored into balance sheet and capital planning
SFAS 140/FIN46R change – Potential Impact ($ in billions)SFAS 140/FIN46R change – Potential Impact ($ in billions)
Ultimate impact could differ significantly due to final requirements of the rule and market conditions
Key PointsKey Points
9/30/08 10Q balances GAAP Assets RWA (Basel I)
Credit Card $129 $70 +/- $40 +/-
Conduits 43 40 +/- −Other 564 50 +/- 50 +/-
Total $736 $160 +/- $90 +/-
Tier 1 Capital Ratio (0.80%) +/-
4Q08 3Q08 4Q07
Tier 1 Capital1 $136 $112 $89
Tangible Common Equity2 $81 $86 $72
Risk Weighted Assets1 $1,259 $1,261 $1,052
Tangible Assets $2,121 $2,200 $1,511
Tier 1 Capital Ratio1 10.8% 8.9% 8.4%
Total Capital Ratio1 14.7% 12.6% 12.6%
Tier 1 Leverage Ratio1 6.9% 7.2% 6.0%
Tangible Common Equity/Tangible Assets 3.8% 3.9% 4.8%
TCE/Managed RWA1,2 7.9% 7.4% 6.7%
21FI
NA
NC
IA
LR
ES
UL
TS
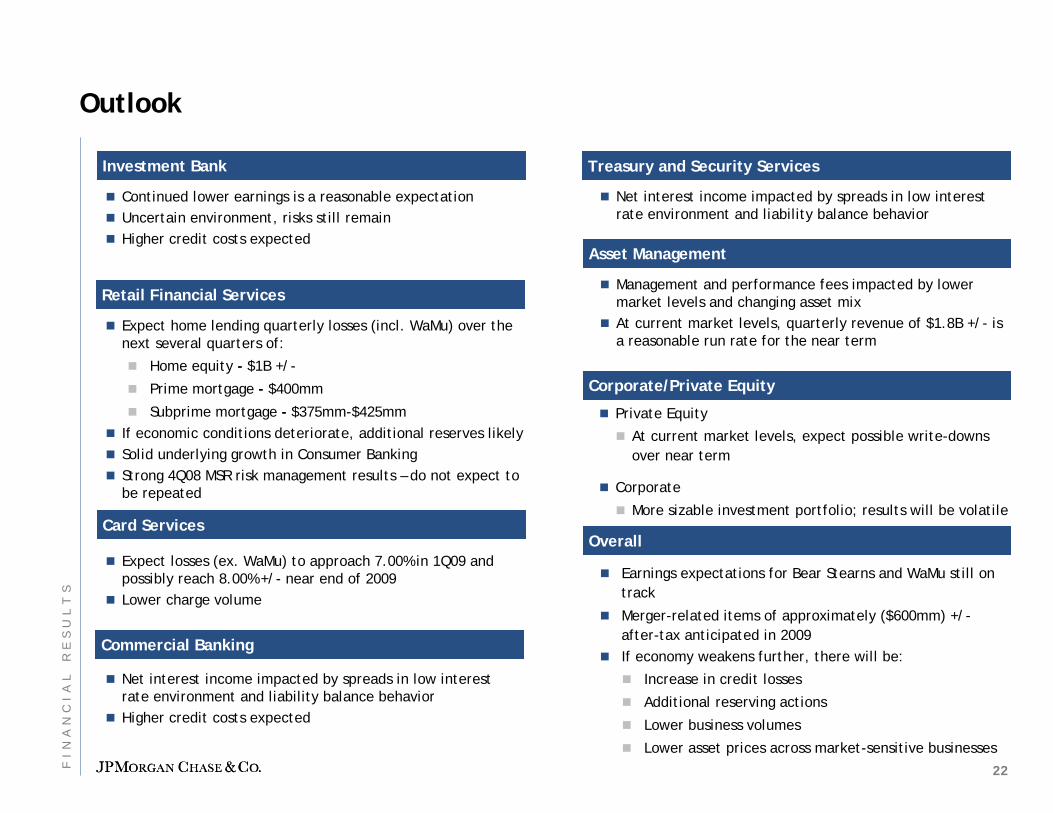
Outlook
Investment BankInvestment Bank
Retail Financial ServicesRetail Financial Services
Card ServicesCard Services
Treasury and Security ServicesTreasury and Security Services
Corporate/Private EquityCorporate/Private Equity
Asset ManagementAsset Management
Commercial BankingCommercial Banking
OverallOverall
Private Equity
At current market levels, expect possible write-downs over near term
Corporate
More sizable investment portfolio; results will be volatile
Management and performance fees impacted by lower market levels and changing asset mixAt current market levels, quarterly revenue of $1.8B +/- is a reasonable run rate for the near term
Earnings expectations for Bear Stearns and WaMu still on track
Merger-related items of approximately ($600mm) +/-after-tax anticipated in 2009If economy weakens further, there will be:
Increase in credit losses
Additional reserving actions
Lower business volumes
Lower asset prices across market-sensitive businesses
Continued lower earnings is a reasonable expectationUncertain environment, risks still remainHigher credit costs expected
Expect losses (ex. WaMu) to approach 7.00% in 1Q09 and possibly reach 8.00% +/- near end of 2009Lower charge volume
Net interest income impacted by spreads in low interest rate environment and liability balance behavior Higher credit costs expected
Net interest income impacted by spreads in low interest rate environment and liability balance behavior
Expect home lending quarterly losses (incl. WaMu) over the next several quarters of:
Home equity - $1B +/-
Prime mortgage - $400mm
Subprime mortgage - $375mm-$425mmIf economic conditions deteriorate, additional reserves likelySolid underlying growth in Consumer BankingStrong 4Q08 MSR risk management results – do not expect to be repeated
22FI
NA
NC
IA
LR
ES
UL
TS

Key Investor Topics
WaMu Integration Update
Bear Stearns Integration Update
Recent Lending Activity
The Way Forward
Credit card practices
23FI
NA
NC
IA
LR
ES
UL
TS
This presentation includes non-GAAP financial measures.
1. TCE as shown on slides 1 and 2, which is used for purposes of calculating return on tangible common equity and presented as Tangible Common Equity on slide 21 (line 2), is defined as common stockholders' equity less identifiable intangible assets (other than MSRs) and goodwill. TCE as shown in slide 21 (line 9) in the TCE/Managed RWA ratio, which is used for purposes of a capital strength calculation, is defined as common stockholders' equity plus a portion of preferred stock and junior subordinated notes (which have certain equity-like characteristics due to their subordinated and long-term nature) less identifiable intangible assets (other than MSRs) and goodwill. For 4Q08, the identifiable intanagible assets and goodwill are deducted net of deferred tax liabilities related to identifiable intangibles created in non-taxable transactions and deferred tax liabilities related to tax deductible goodwill. This latter definition of TCE is used by the firm and certain credit rating agencies when analyzing the firm's capital strength. The TCE measures used in this presentation are not necessarily comparable to similarly titled measures provided by other firms due to differences in calculation methodologies.
2. Financial results are presented on a managed basis, as such basis is described in the firm’s Quarterly Report on Form 10-Q for the quarter ended September 30, 2008 and in the Annual Report on Form 10-K for the year ended December 31, 2007.
3. All non-GAAP financial measures included in this presentation are provided to assist readers in understanding certain trend information. Additional information concerning such non-GAAP financial measures can be found in the above-referenced filings, to which reference is hereby made.
Notes on non-GAAP financial measures and forward-looking statements
Forward looking statementsThis presentation contains forward-looking statements within the meaning of the Private Securities Litigation Reform Act of 1995. Such statements are based upon the current beliefs and expectations of JPMorgan Chase’s management and are subject to significant risks and uncertainties. Actual results may differ from those set forth in the forward-looking statements. Factors that could cause JPMorgan Chase’s actual results to differ materially from those described in the forward-looking statements can be found in JPMorgan Chase’s Quarterly Reports on Form 10-Q for the quarters ended September 30, 2008, June 30, 2008, and March 31, 2008 and its Annual Report on Form 10-K for the year ended December 31, 2007, each of which has been filed with the Securities and Exchange Commission and available on JPMorgan Chase’s website (www.jpmorganchase.com) and on the Securities and Exchange Commission’s website (www.sec.gov). JPMorgan Chase does not undertake to update the forward-looking statements to reflect the impact of circumstances or events that may arise after the date of the forward-looking statements.
24FI
NA
NC
IA
LR
ES
UL
TS
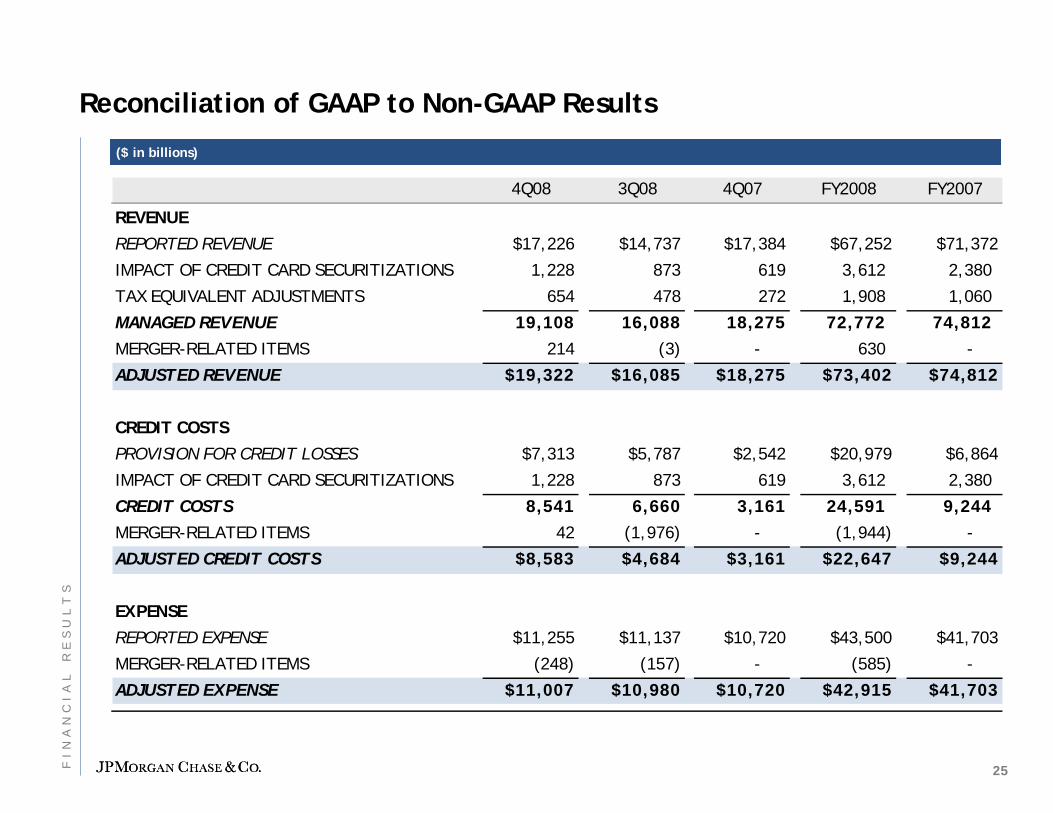
Reconciliation of GAAP to Non-GAAP Results
4Q08 3Q08 4Q07 FY2008 FY2007
REVENUEREPORTED REVENUE $17,226 $14,737 $17,384 $67,252 $71,372
IMPACT OF CREDIT CARD SECURITIZATIONS 1,228 873 619 3,612 2,380
TAX EQUIVALENT ADJUSTMENTS 654 478 272 1,908 1,060
MANAGED REVENUE 19,108 16,088 18,275 72,772 74,812 MERGER-RELATED ITEMS 214 (3) - 630 -
ADJUSTED REVENUE $19,322 $16,085 $18,275 $73,402 $74,812
CREDIT COSTSPROVISION FOR CREDIT LOSSES $7,313 $5,787 $2,542 $20,979 $6,864
IMPACT OF CREDIT CARD SECURITIZATIONS 1,228 873 619 3,612 2,380
CREDIT COSTS 8,541 6,660 3,161 24,591 9,244 MERGER-RELATED ITEMS 42 (1,976) - (1,944) -
ADJUSTED CREDIT COSTS $8,583 $4,684 $3,161 $22,647 $9,244
EXPENSEREPORTED EXPENSE $11,255 $11,137 $10,720 $43,500 $41,703
MERGER-RELATED ITEMS (248) (157) - (585) -
ADJUSTED EXPENSE $11,007 $10,980 $10,720 $42,915 $41,703
($ in billions)($ in billions)
25FI
NA
NC
IA
LR
ES
UL
TS