it just got easier to monitor energy consumption in hvac! · it just got easier to monitor energy...
TRANSCRIPT
Energy cannot be created or destroyed, but it can be wasted.
It Just Got Easier to Monitor Energy Consumption in HVAC!
The Belimo Energy Valve™
Knowledge is Power.
Agenda
Advantages of PI Valves
Changes in Coil Performance
Continuous Commissioning
The Belimo Energy Valve
Agenda
Advantages of PI Valves
Changes in Coil Performance
Continuous Commissioning
The Belimo Energy Valve
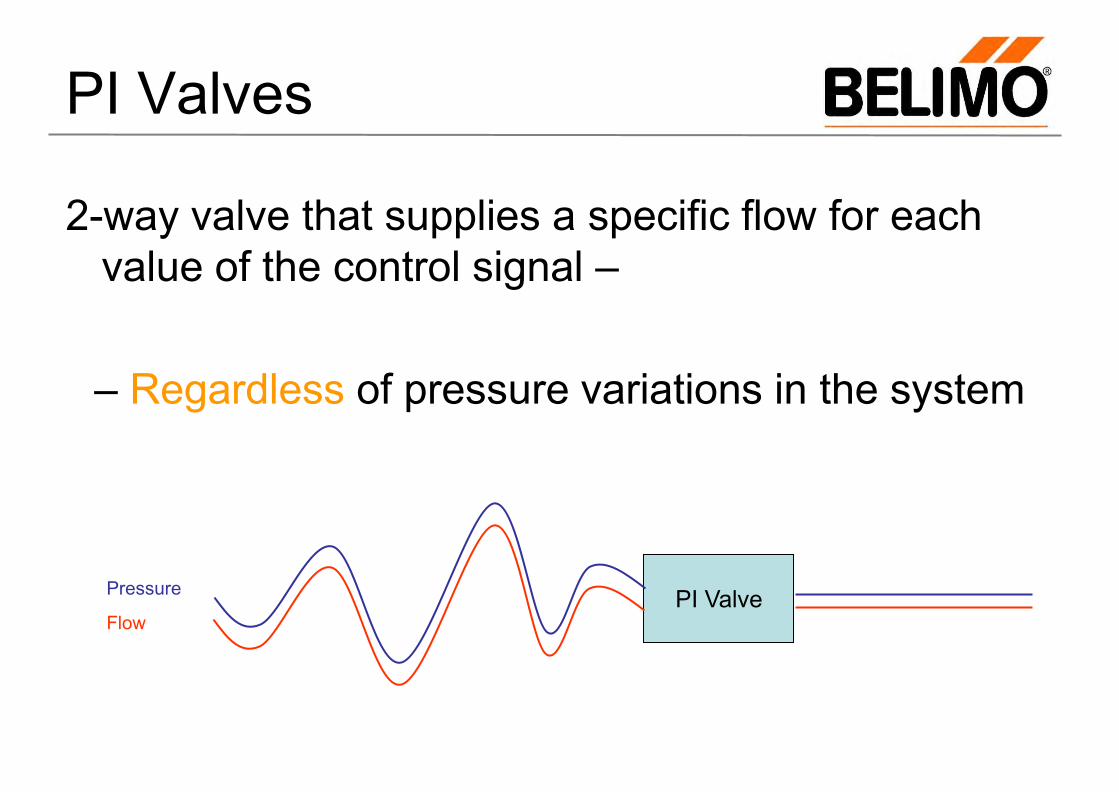
PI Valves
2-way valve that supplies a specific flow for each value of the control signal – – Regardless of pressure variations in the system
PI Valve Pressure
Flow
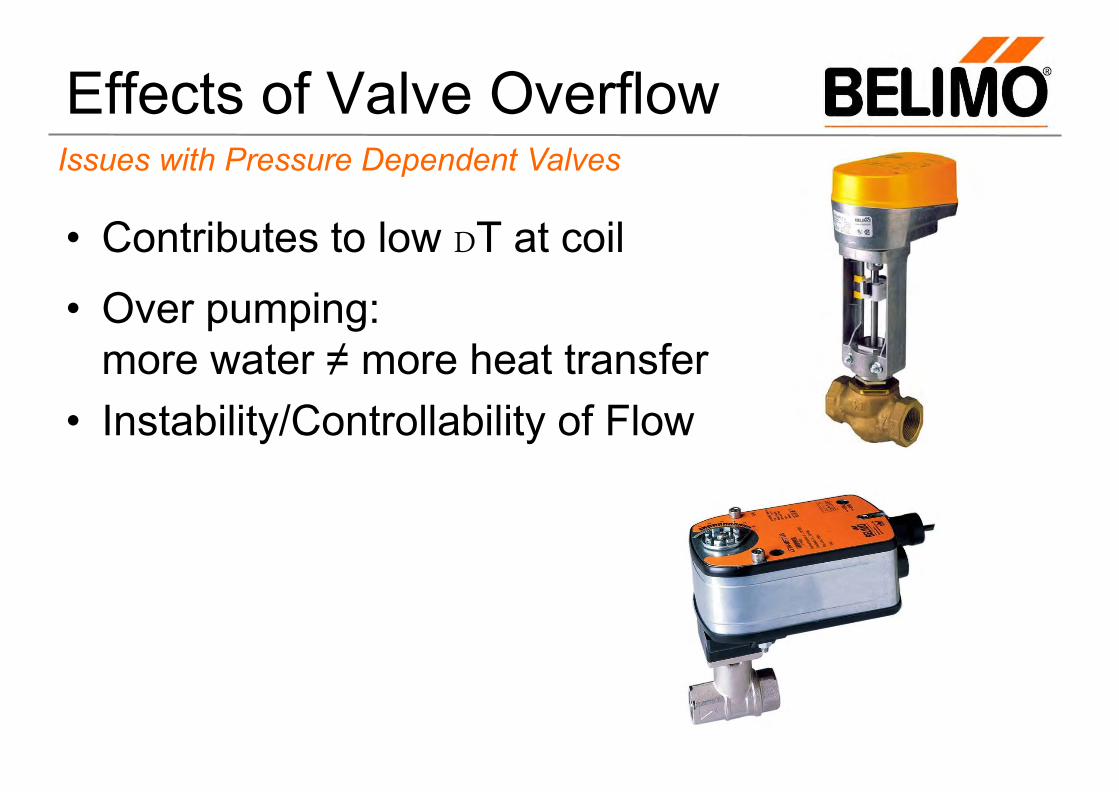
Effects of Valve Overflow
• Contributes to low DT at coil • Over pumping:
more water ≠ more heat transfer • Instability/Controllability of Flow
Issues with Pressure Dependent Valves
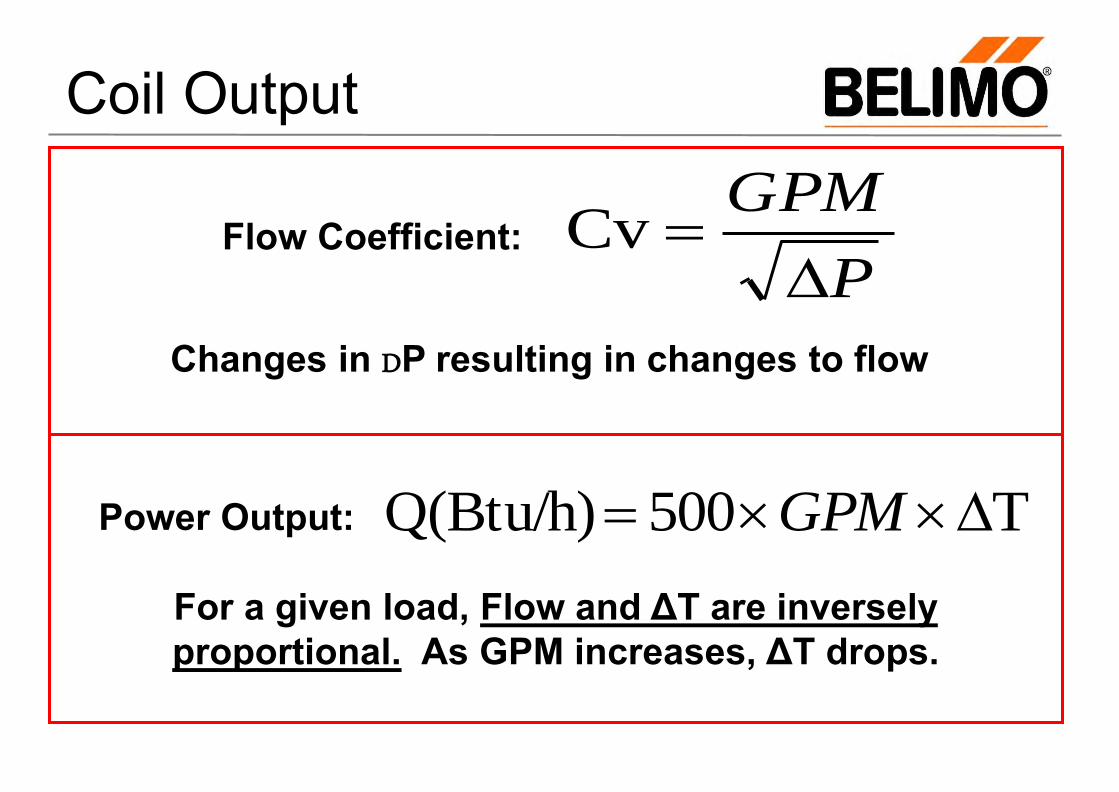
Coil Output
For a given load, Flow and ΔT are inversely proportional. As GPM increases, ΔT drops.
P
GPM
CvFlow Coefficient:
T500Q(Btu/h) GPMPower Output:
Changes in DP resulting in changes to flow
100
90
20
40
60
80
10
30
50
70
Coo
ling
Out
put (
%)
0 40 60 80 100 10 20 30 50 70 90
Water Flow (%) 110 120 130 140 150
Flow
Cooling Output %
Water DT
Wat
er D
T
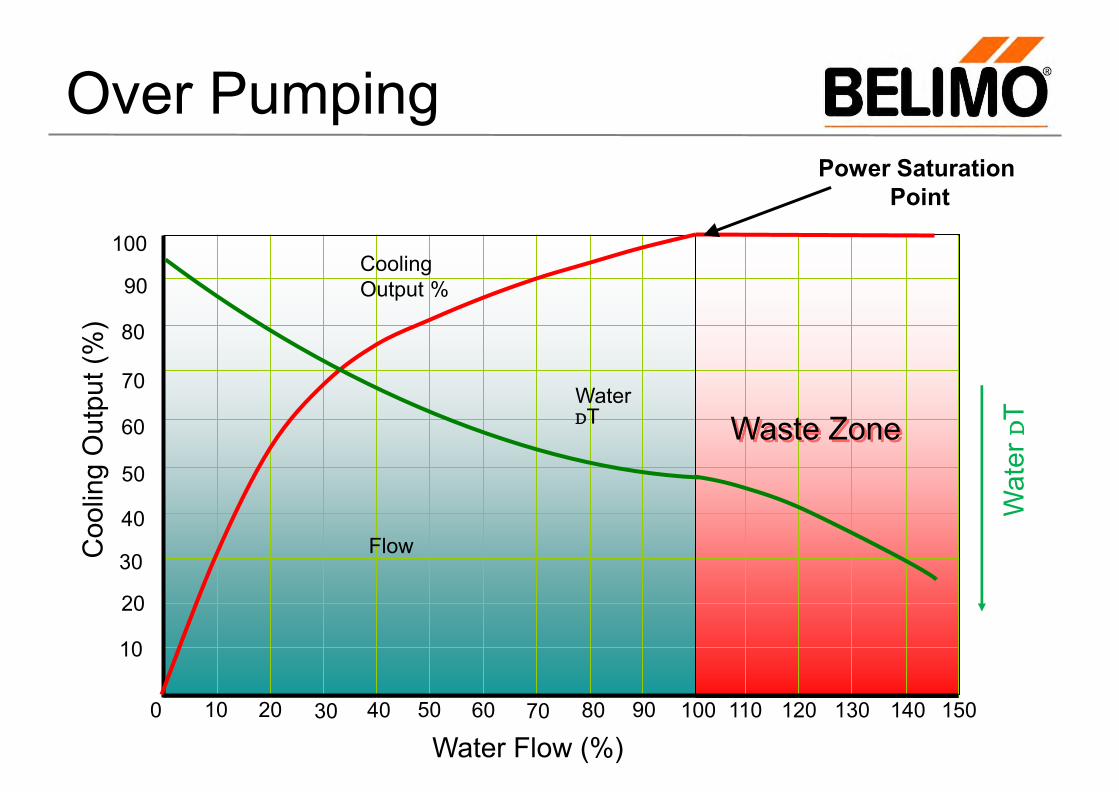
Power Saturation Point
Waste Zone
Over Pumping
Power Saturation Point
Point beyond which coil cannot yield additional heat transfer regardless of increased flow.
Waste Zone Range beyond the “Power Saturation Point”.
Power Saturation
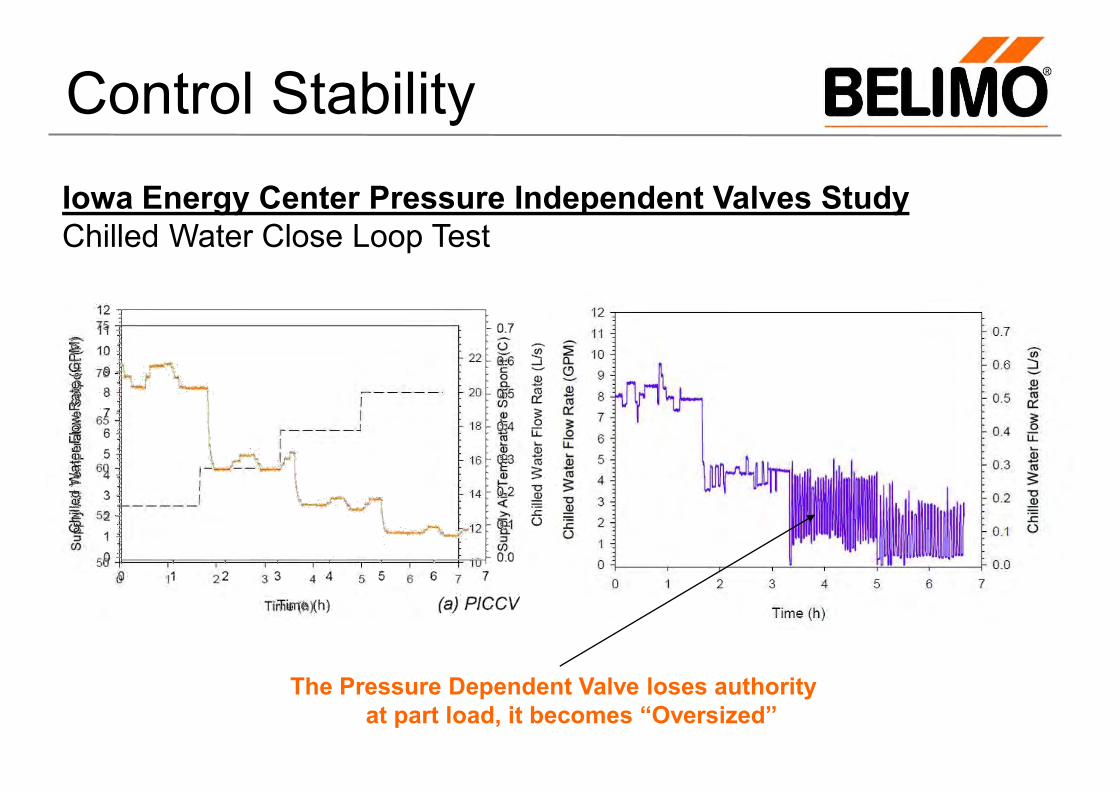
Control Stability
The Pressure Dependent Valve loses authority at part load, it becomes “Oversized”
Iowa Energy Center Pressure Independent Valves Study Chilled Water Close Loop Test
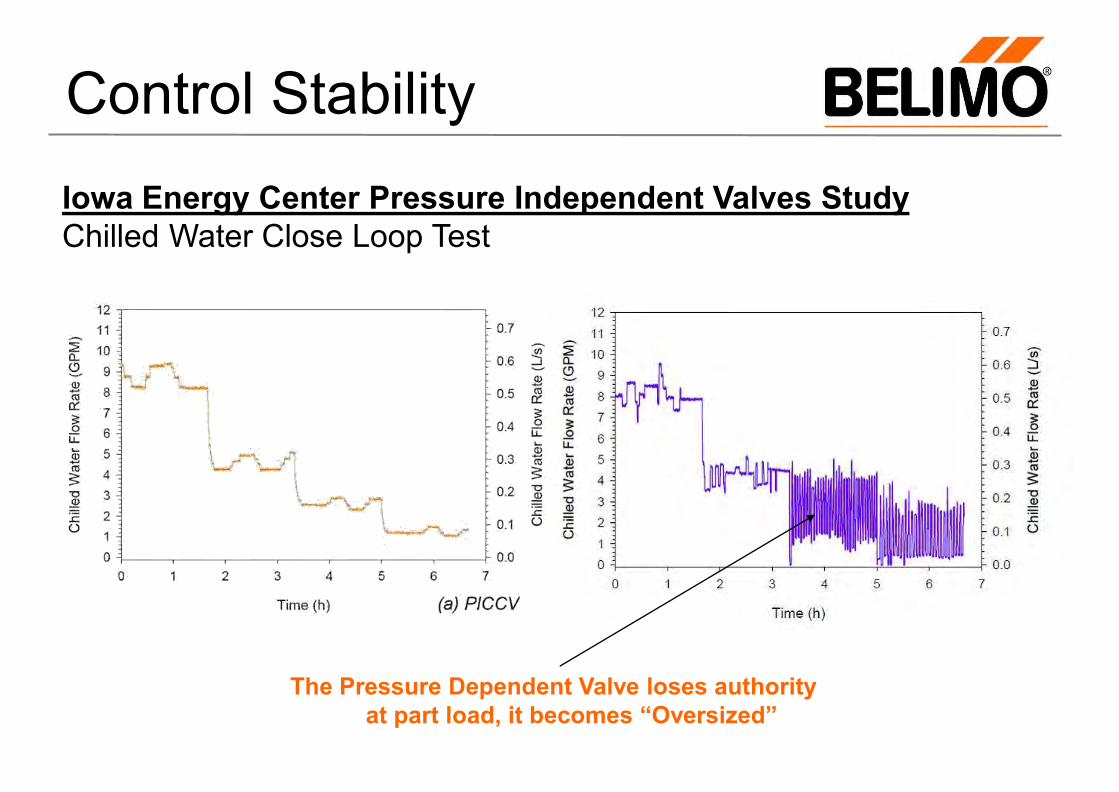
Control Stability
The Pressure Dependent Valve loses authority at part load, it becomes “Oversized”
Iowa Energy Center Pressure Independent Valves Study Chilled Water Close Loop Test
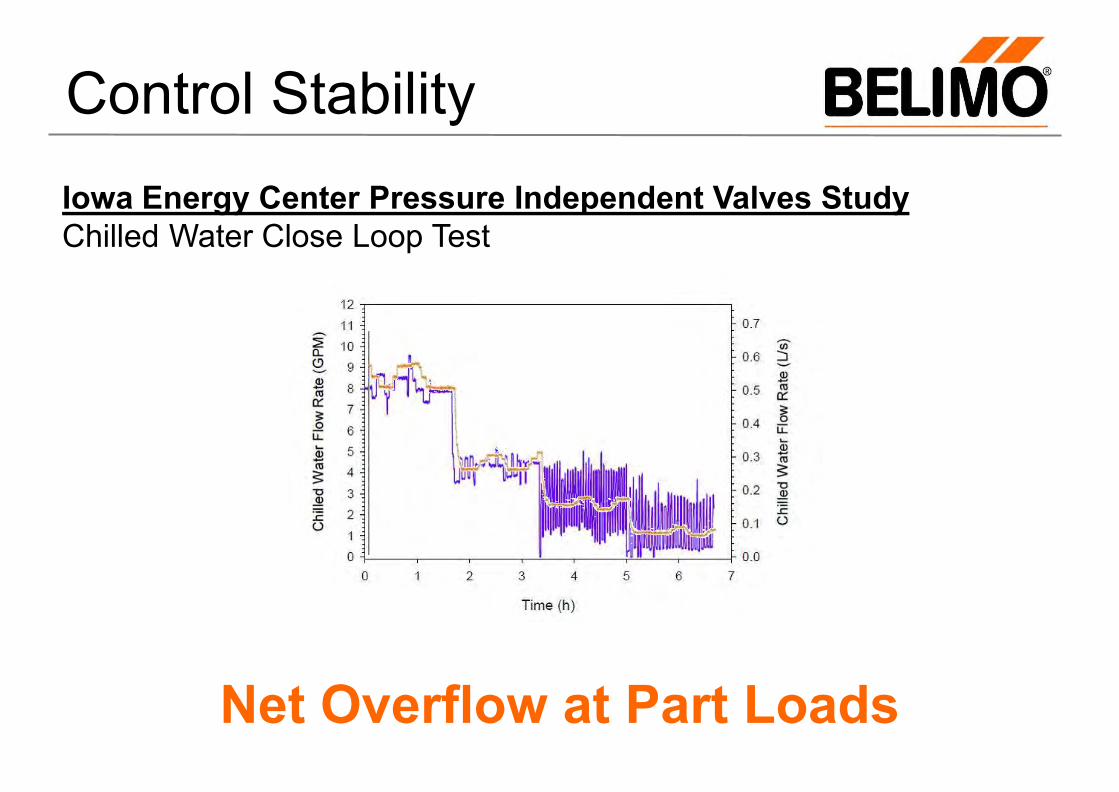
Control Stability
Net Overflow at Part Loads
Iowa Energy Center Pressure Independent Valves Study Chilled Water Close Loop Test
Agenda
Advantages of PI Valves
Changes in Coil Performance
Continuous Commissioning
The Belimo Energy Valve
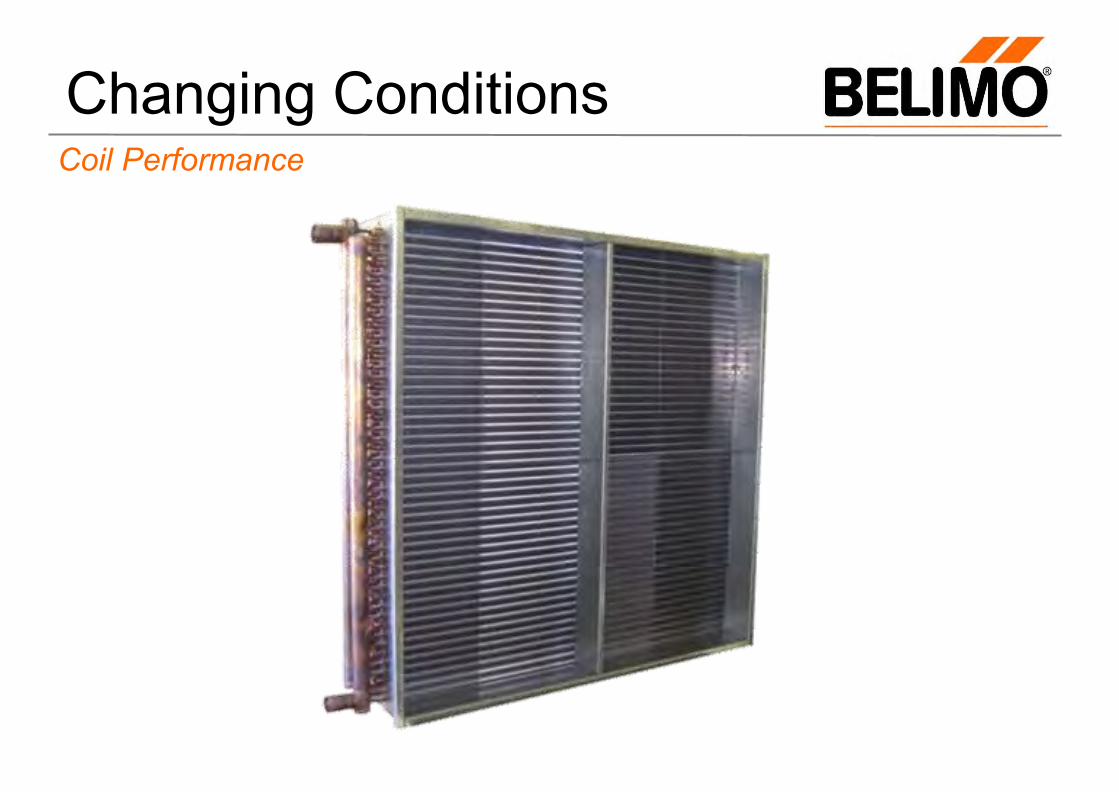
Changing Conditions Coil Performance
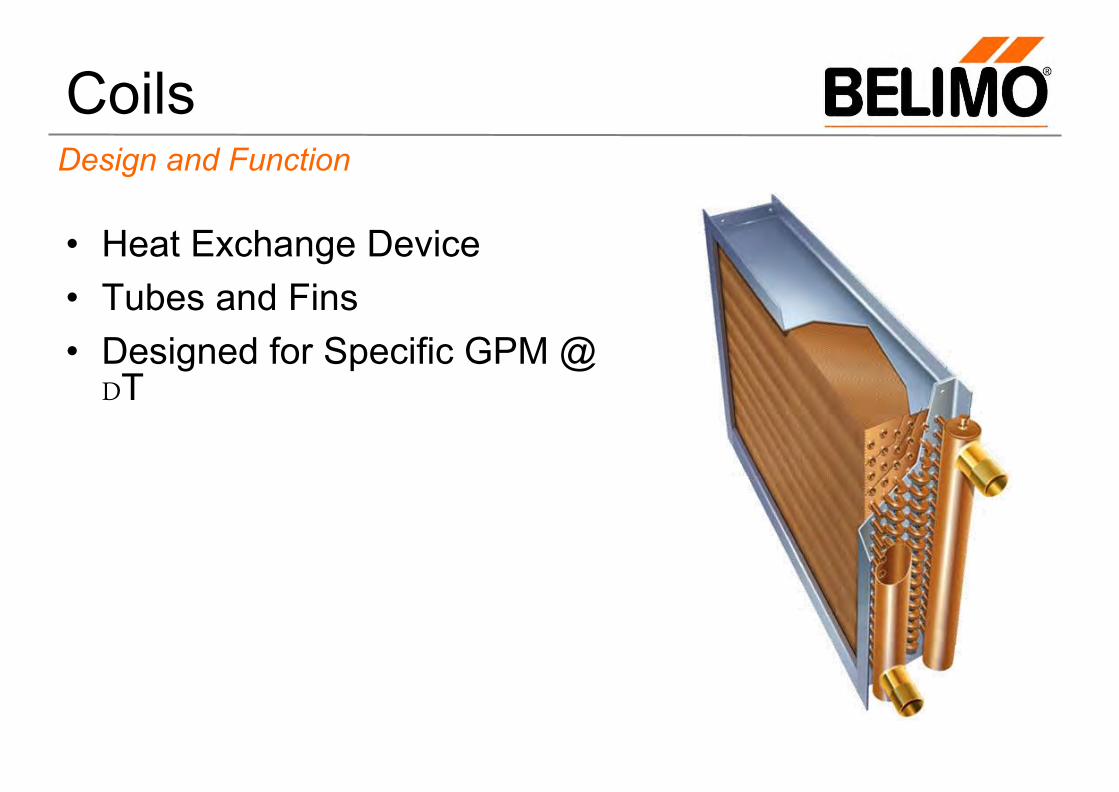
Coils Design and Function
• Heat Exchange Device • Tubes and Fins • Designed for Specific GPM @
DT
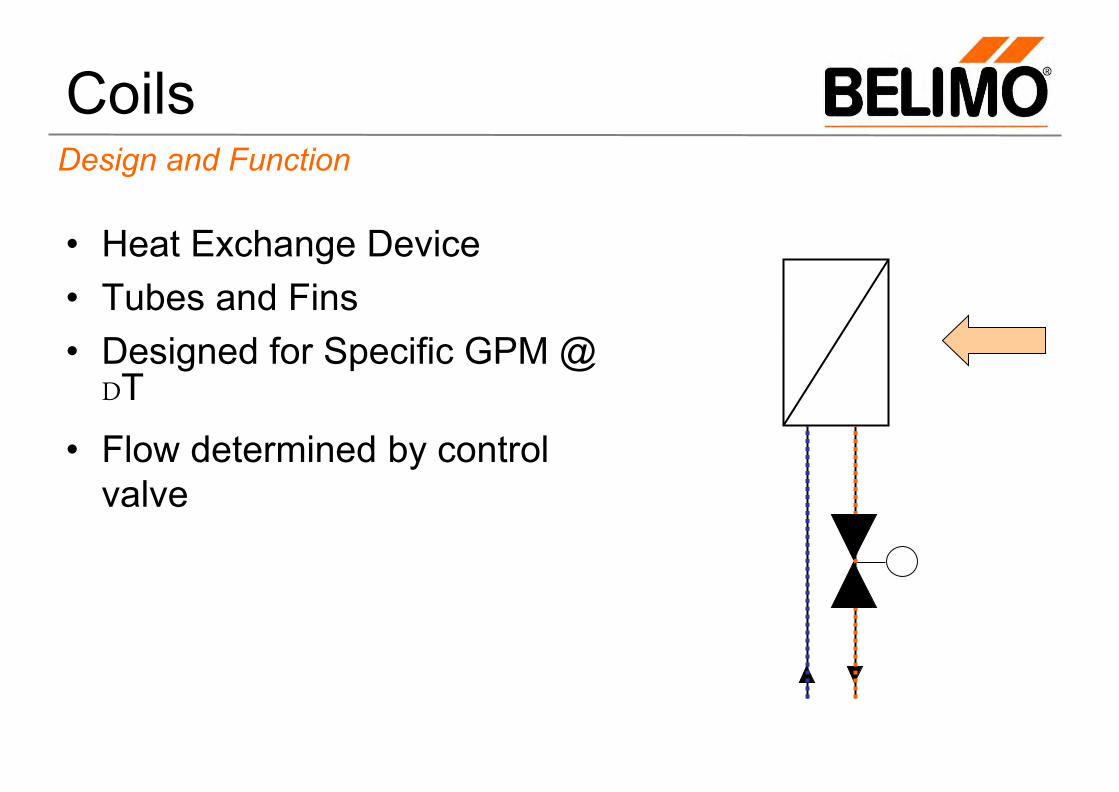
Coils
• Heat Exchange Device • Tubes and Fins • Designed for Specific GPM @
DT
• Flow determined by control valve
Design and Function
Coils
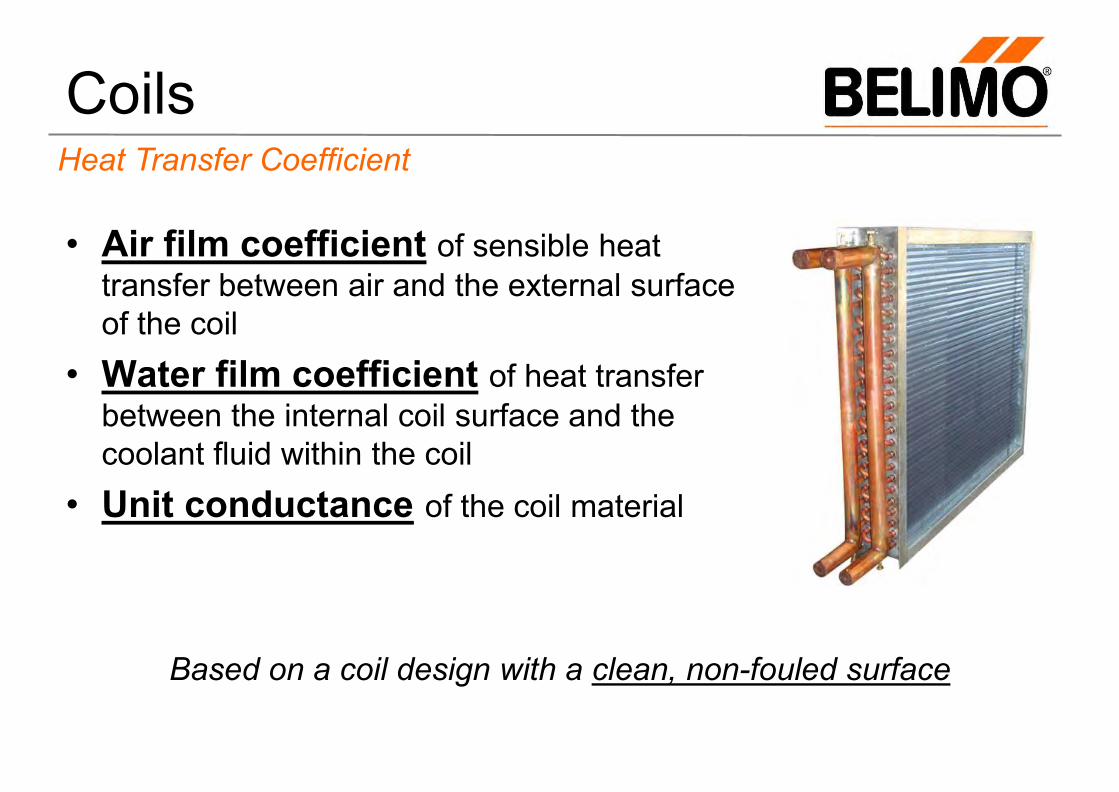
• Air film coefficient of sensible heat transfer between air and the external surface of the coil
• Water film coefficient of heat transfer between the internal coil surface and the coolant fluid within the coil
• Unit conductance of the coil material
Based on a coil design with a clean, non-fouled surface
Heat Transfer Coefficient
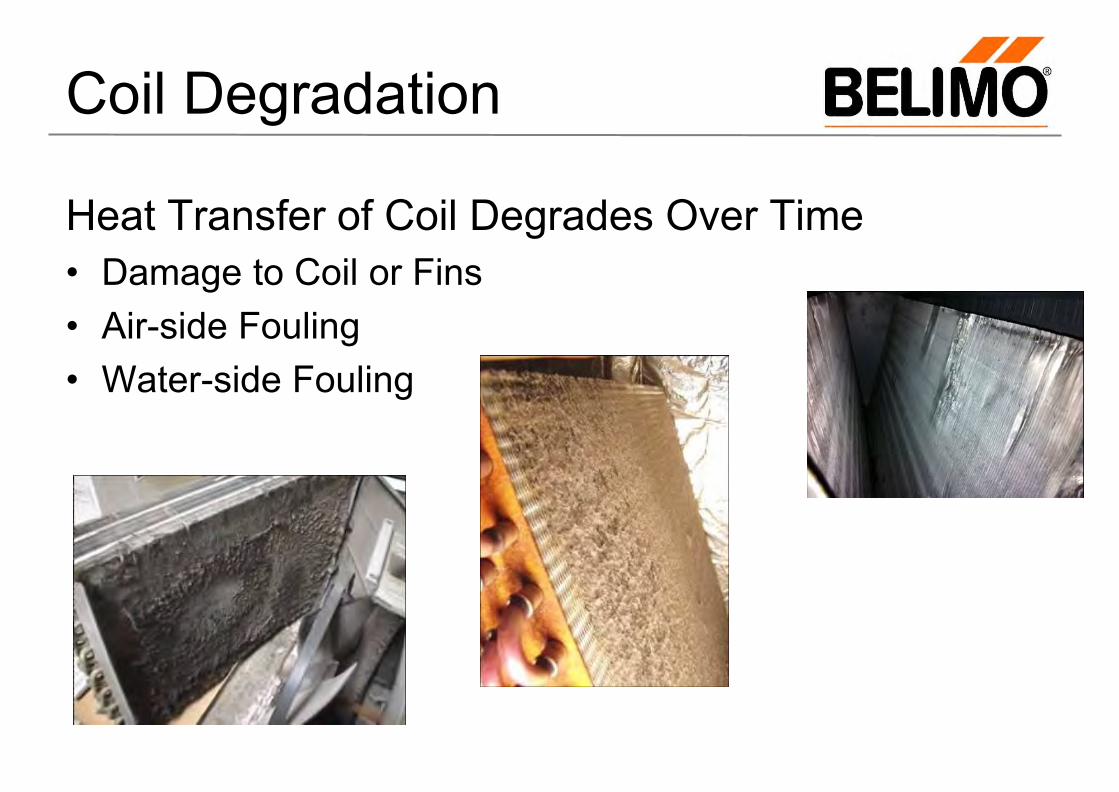
Coil Degradation
Heat Transfer of Coil Degrades Over Time • Damage to Coil or Fins • Air-side Fouling • Water-side Fouling
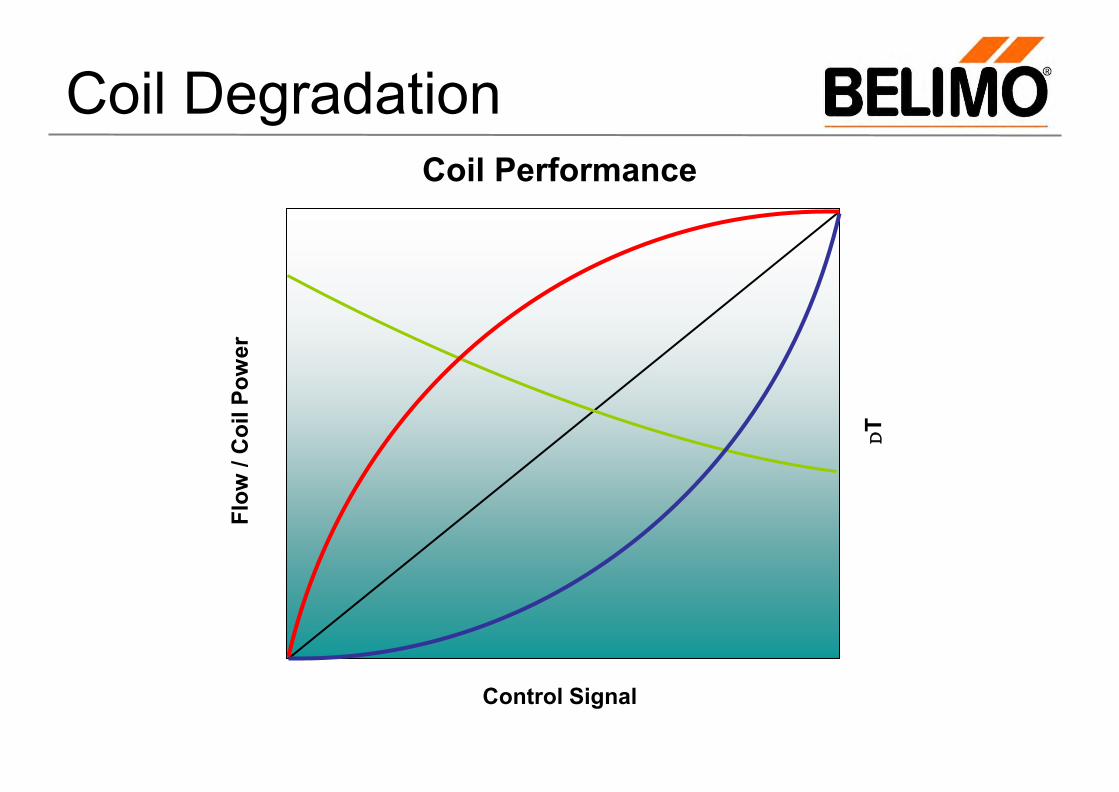
Coil Degradation
Control Signal
DT
Coil Performance
Flow
/ C
oil P
ower
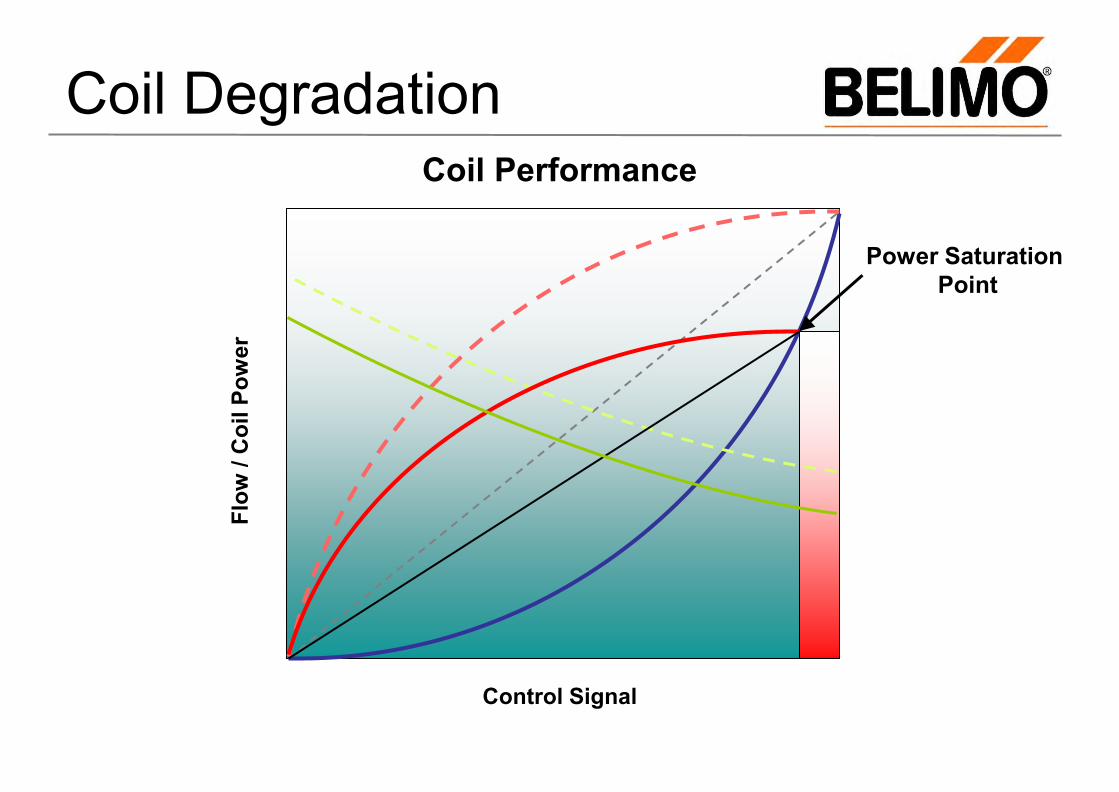
Coil Degradation
Control Signal
Flow
/ C
oil P
ower
Coil Performance
Power Saturation Point
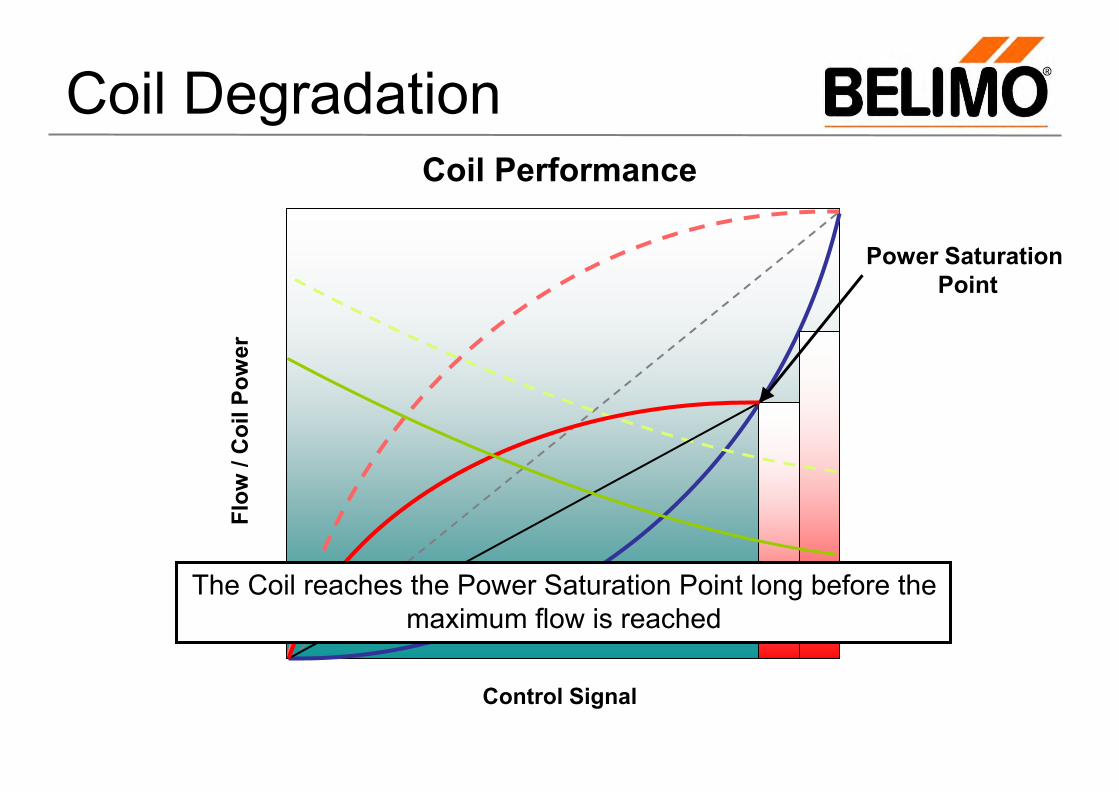
Coil Degradation
Control Signal
Flow
/ C
oil P
ower
Coil Performance
Power Saturation Point
The Coil reaches the Power Saturation Point long before the maximum flow is reached
Agenda
Advantages of PI Valves
Changes in Coil Performance
Continuous Commissioning
The Belimo Energy Valve
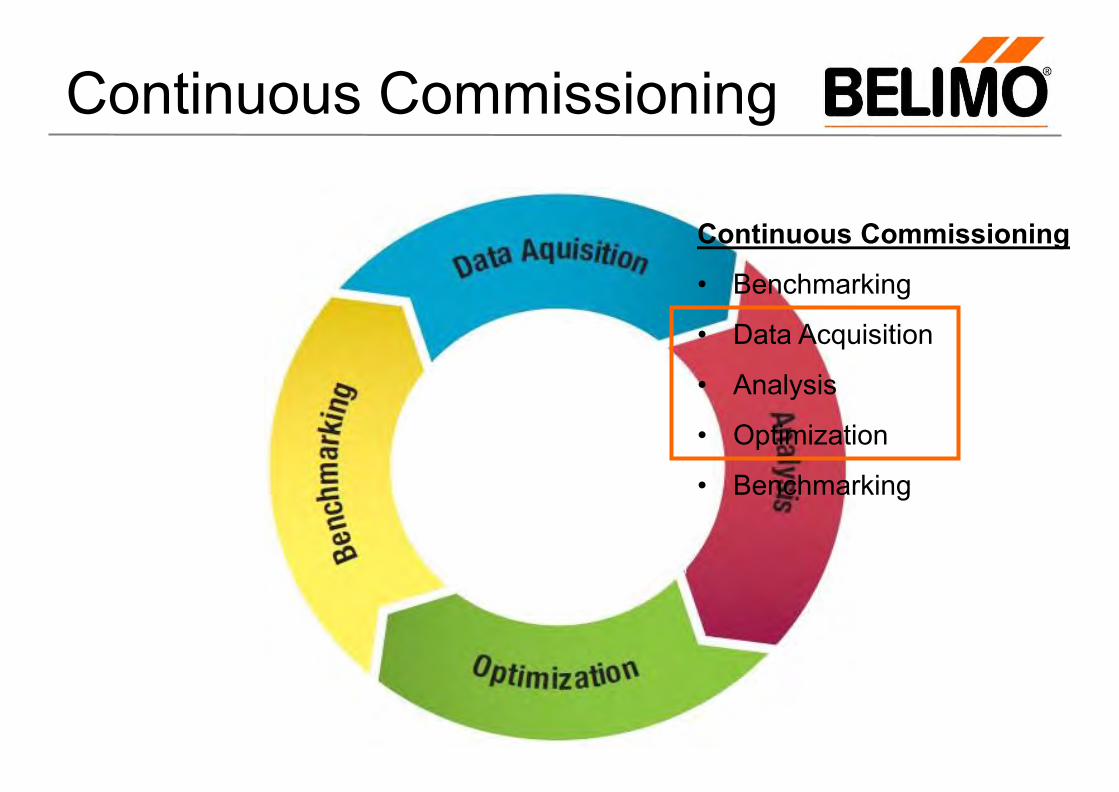
Continuous Commissioning
Continuous Commissioning
• Benchmarking
• Data Acquisition
• Analysis
• Optimization
• Benchmarking
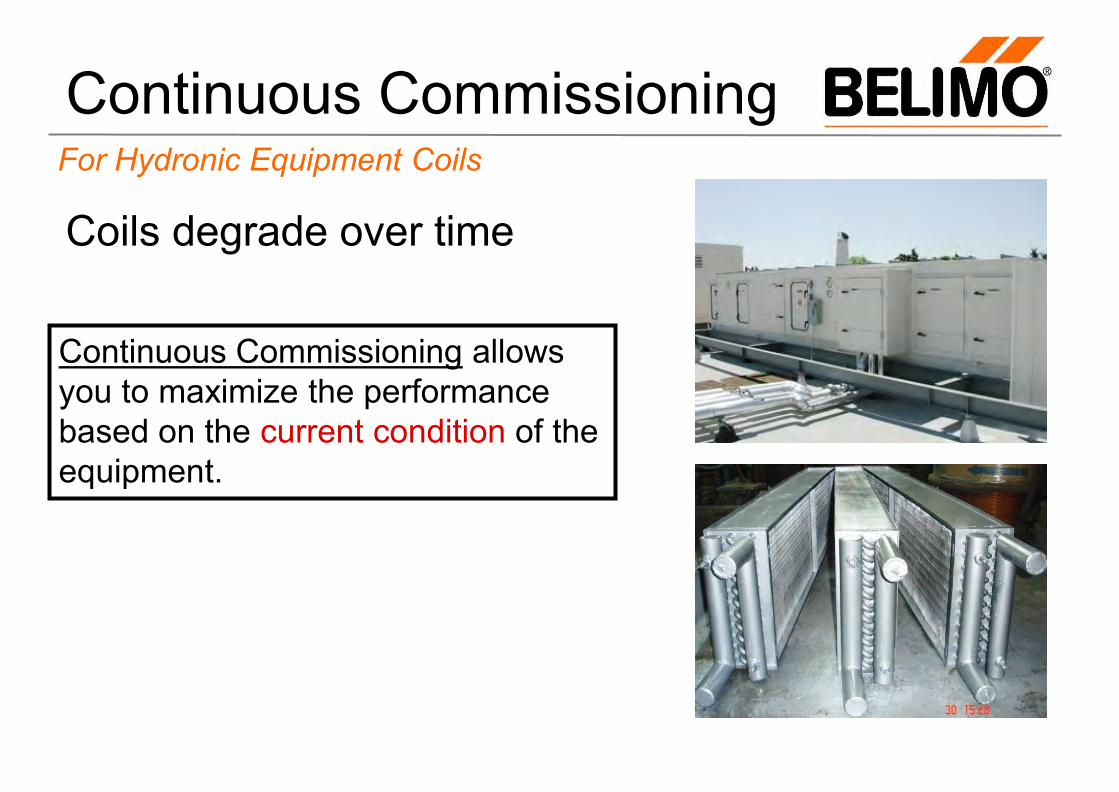
Continuous Commissioning
Coils degrade over time
For Hydronic Equipment Coils
Continuous Commissioning allows you to maximize the performance based on the current condition of the equipment.
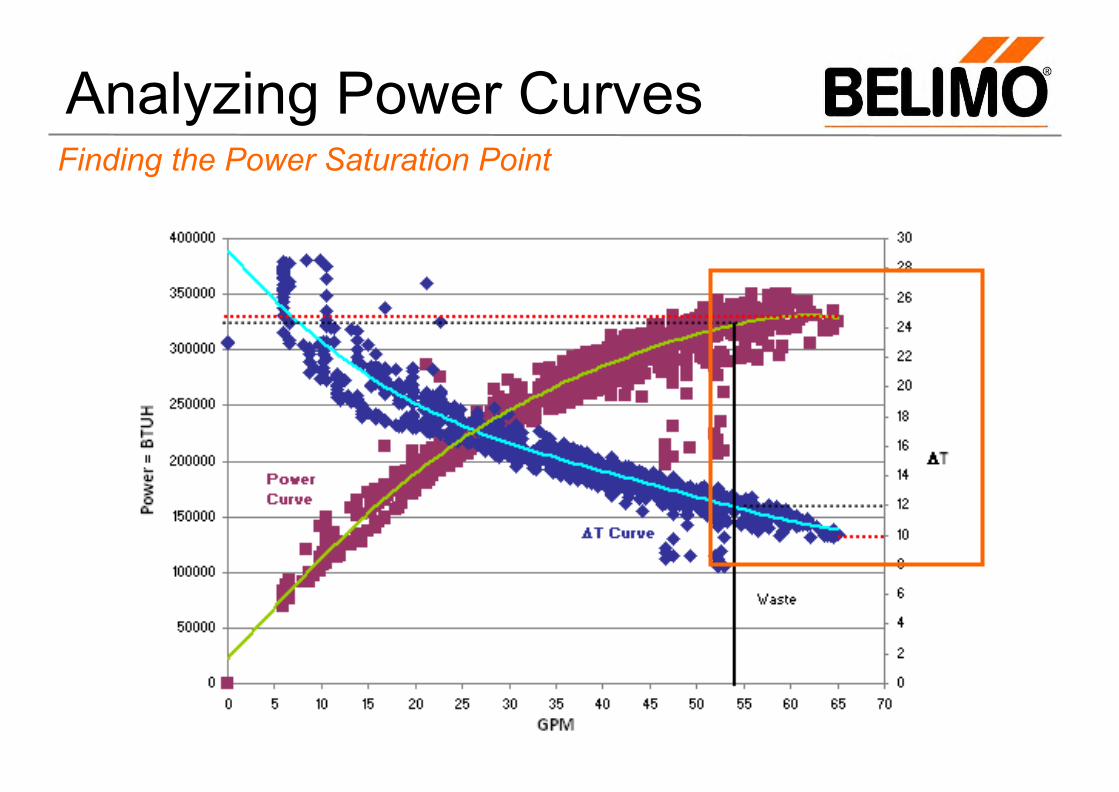
Analyzing Power Curves Finding the Power Saturation Point
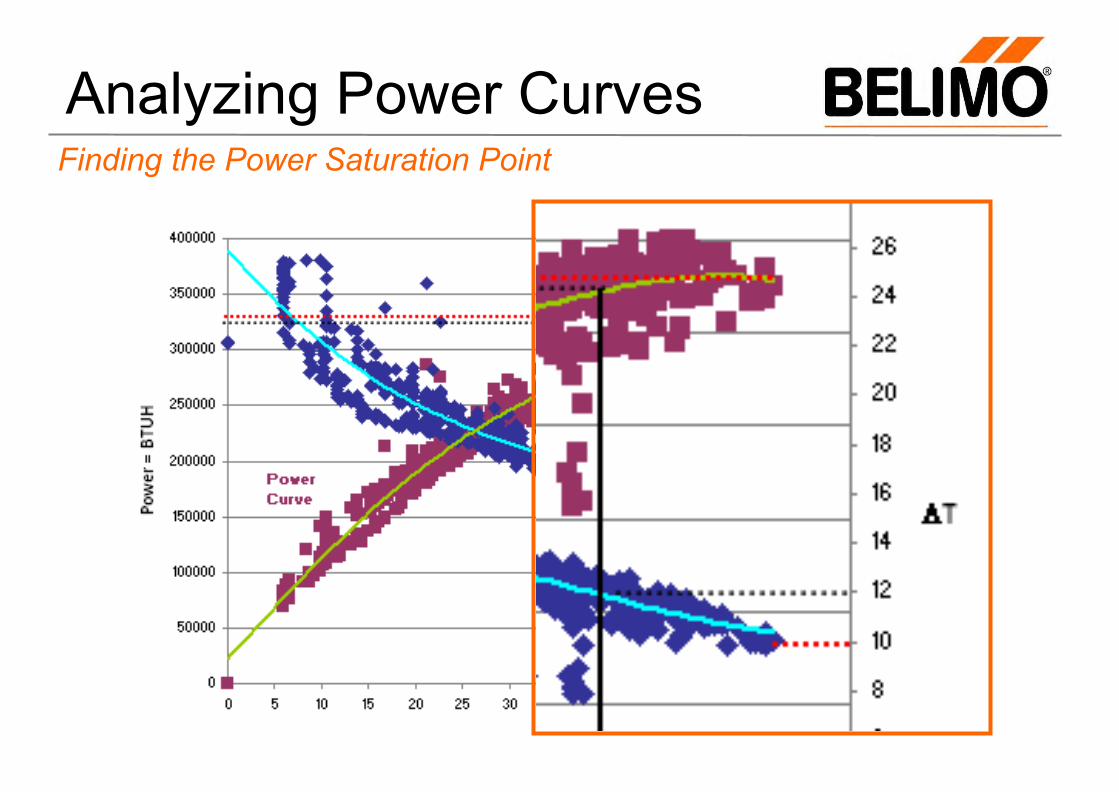
Analyzing Power Curves Finding the Power Saturation Point
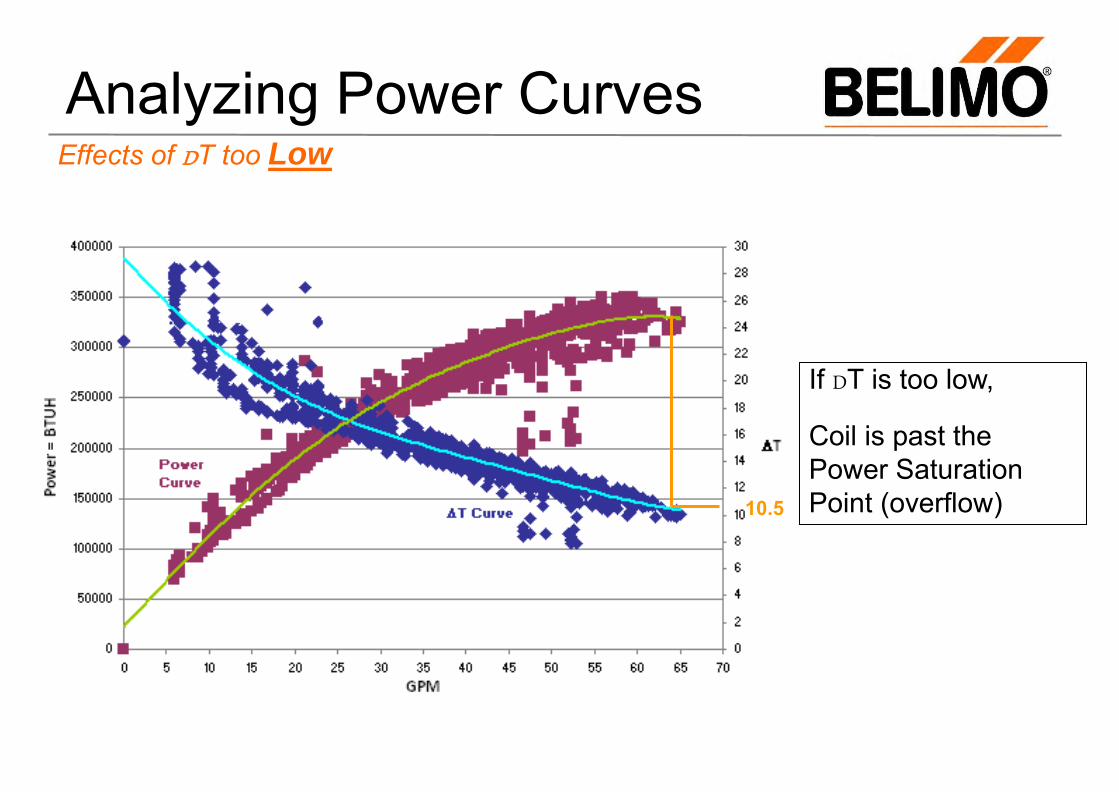
Analyzing Power Curves Effects of DT too Low
If DT is too low,
Coil is past the Power Saturation Point (overflow) 10.5
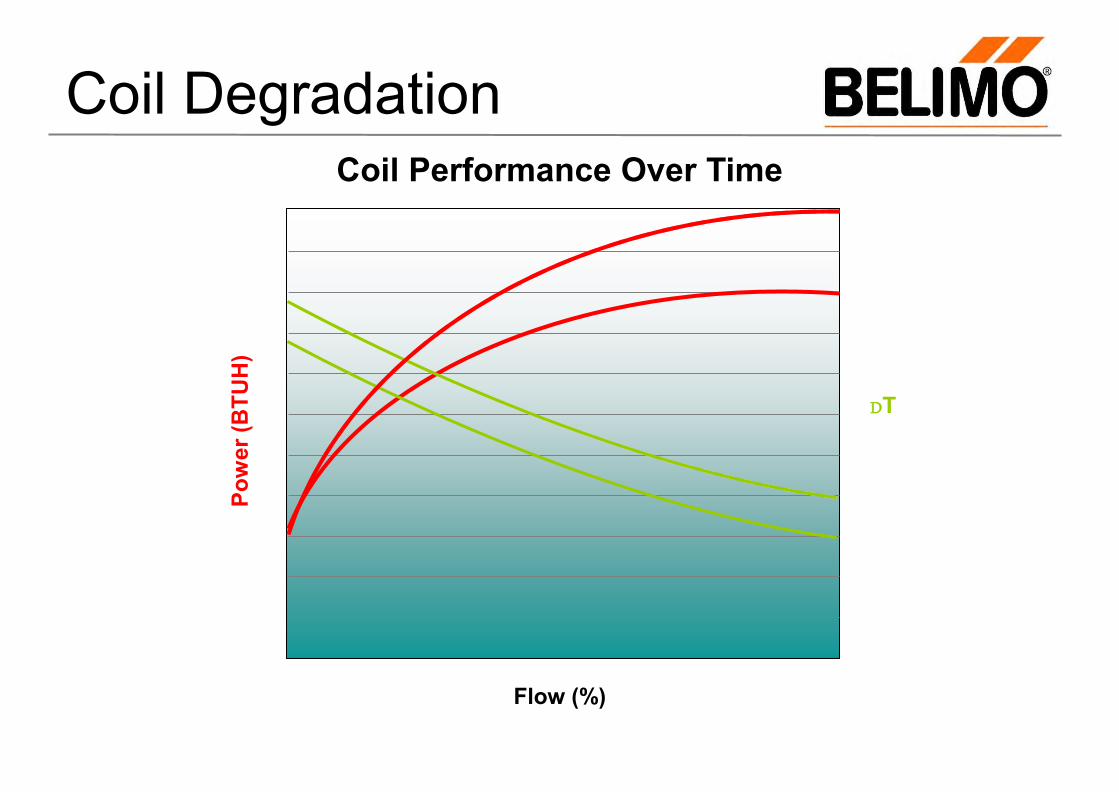
Coil Degradation
Flow (%)
Pow
er (B
TUH
)
Coil Performance Over Time
DT
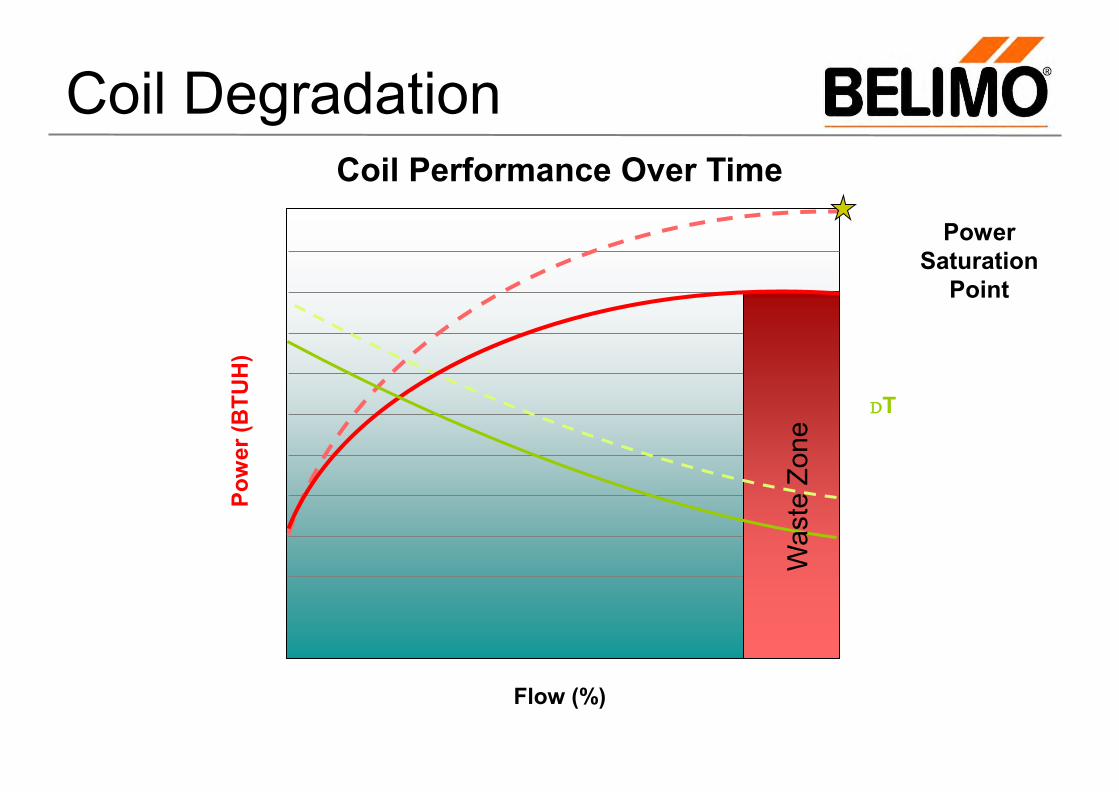
Coil Degradation
Flow (%)
Pow
er (B
TUH
)
Coil Performance Over Time
DT
Was
te Z
one
Power Saturation
Point
Agenda
Advantages of PI Valves
Changes in Coil Performance
Continuous Commissioning
The Belimo Energy Valve
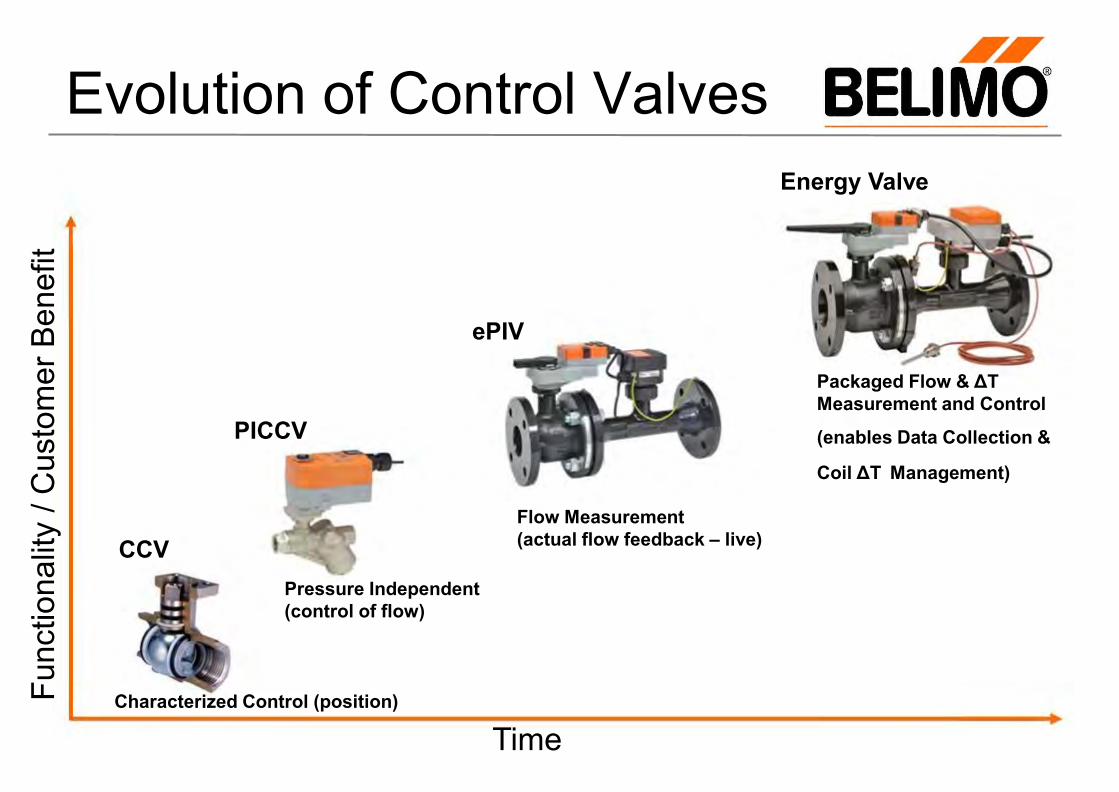
Evolution of Control Valves
Characterized Control (position)
Pressure Independent (control of flow)
Flow Measurement (actual flow feedback – live)
Packaged Flow & ΔT Measurement and Control
(enables Data Collection &
Coil ΔT Management)
Time
Func
tiona
lity
/ Cus
tom
er B
enef
it
CCV
PICCV
ePIV
Energy Valve
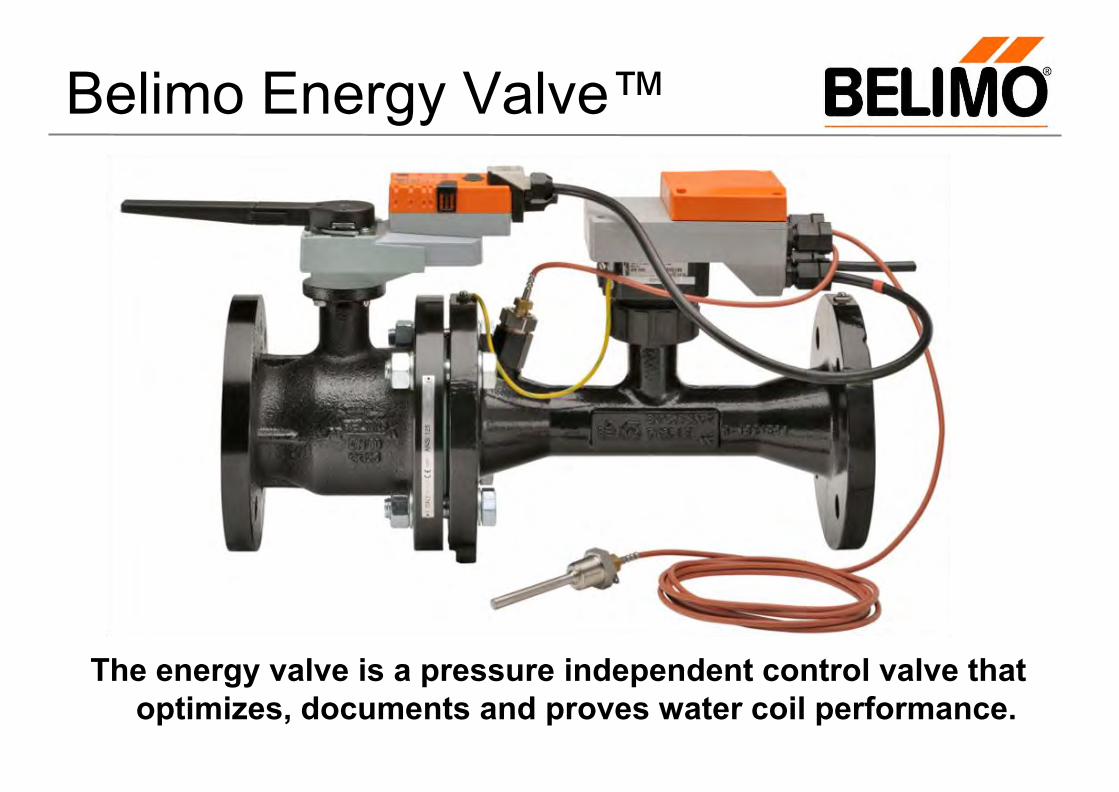
Belimo Energy Valve™
The energy valve is a pressure independent control valve that optimizes, documents and proves water coil performance.
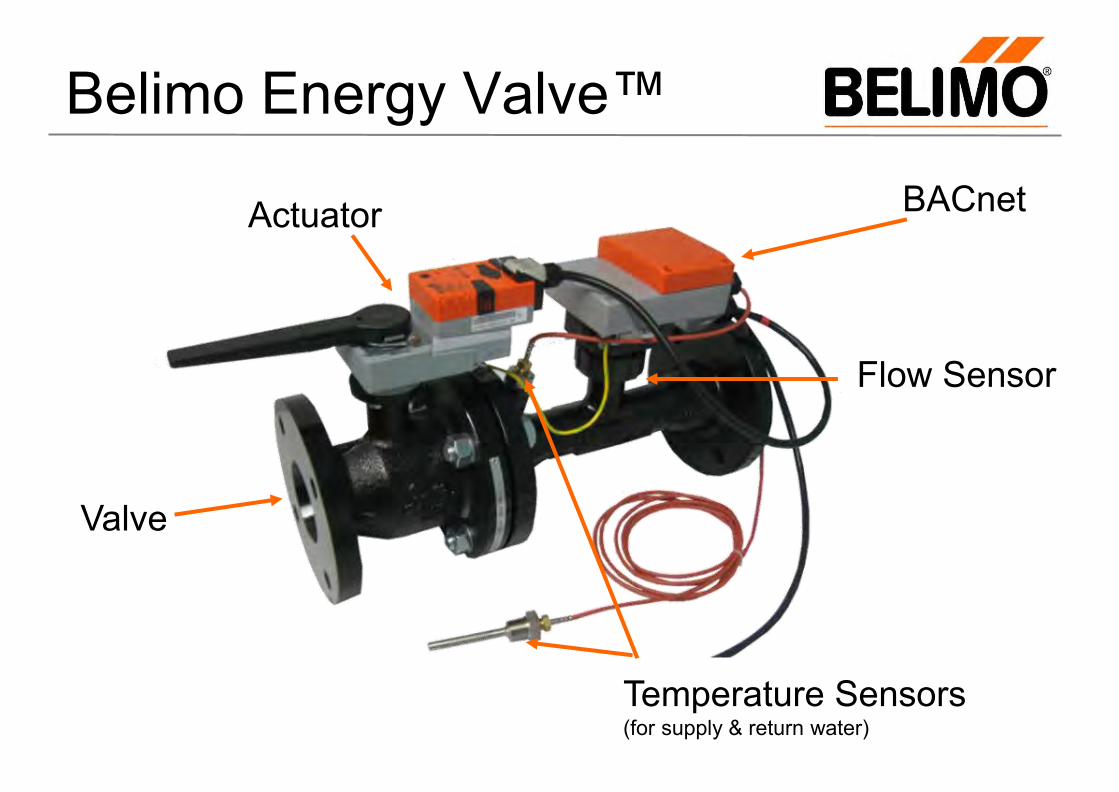
Belimo Energy Valve™
Actuator
Valve
BACnet
Temperature Sensors (for supply & return water)
Flow Sensor
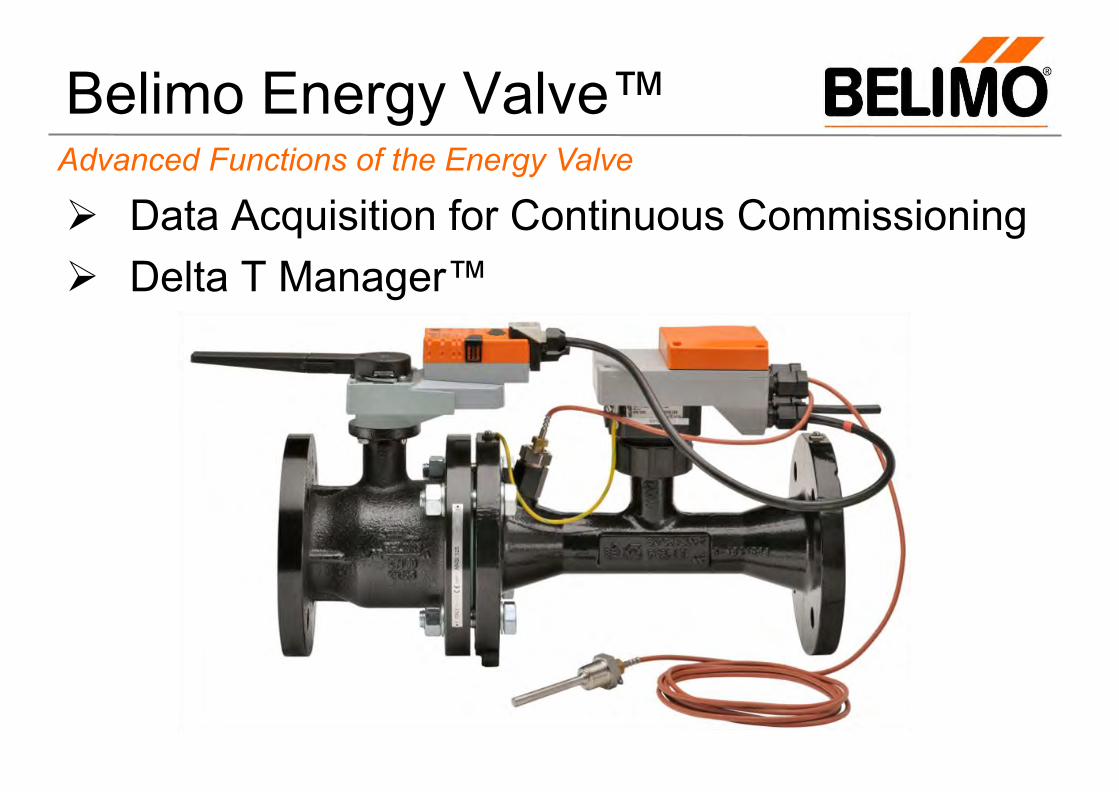
Belimo Energy Valve™
Data Acquisition for Continuous Commissioning Delta T Manager™
Advanced Functions of the Energy Valve
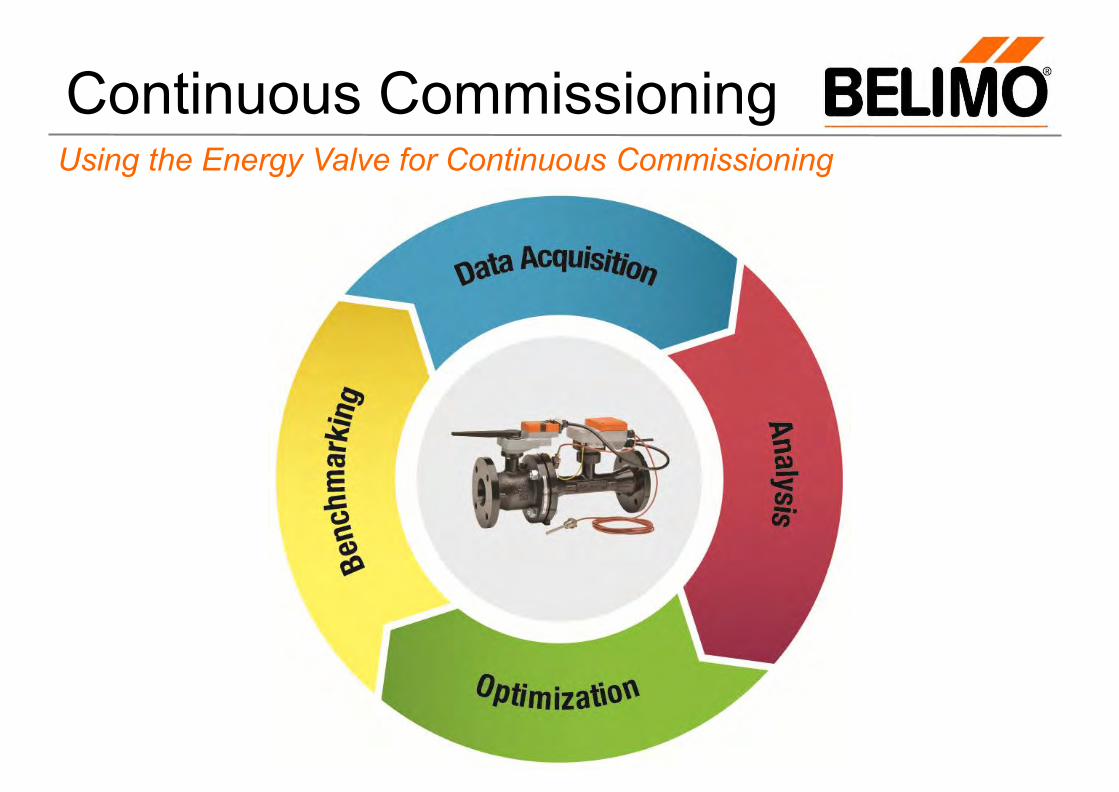
Continuous Commissioning Using the Energy Valve for Continuous Commissioning

1. Benchmarking Building Design
The first iteration of Benchmarking is the Engineer’s design
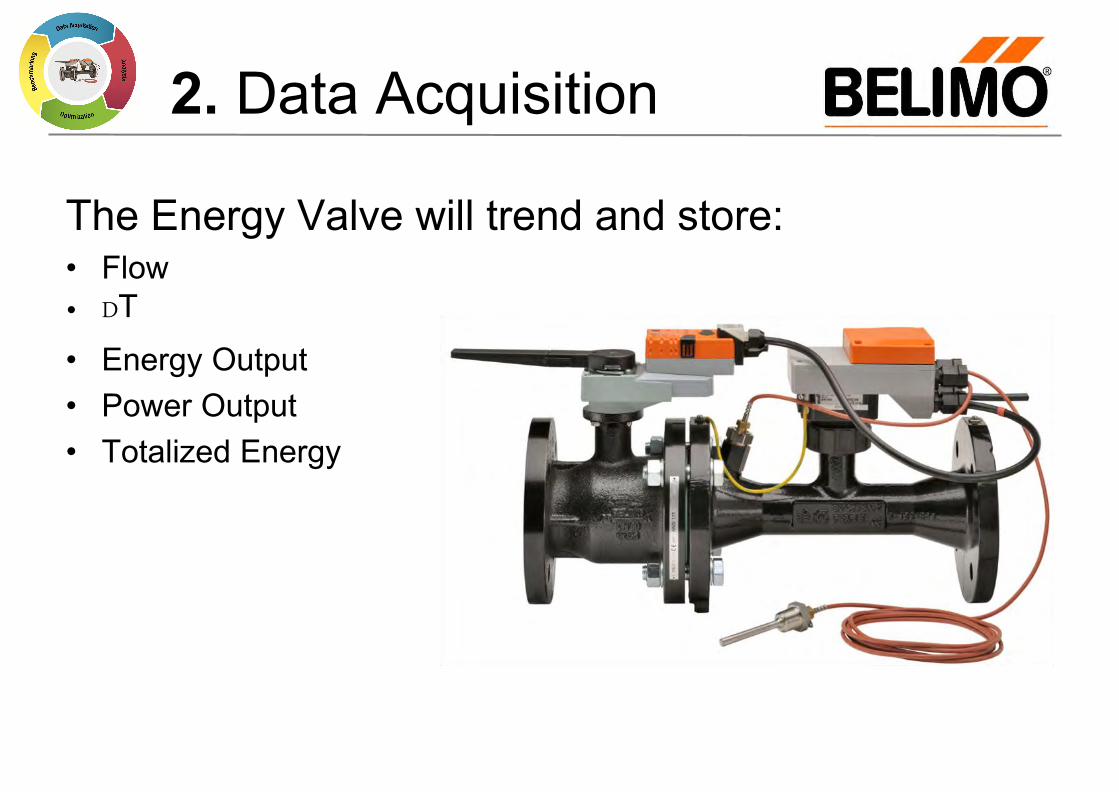
2. Data Acquisition
The Energy Valve will trend and store: • Flow • DT
• Energy Output • Power Output • Totalized Energy
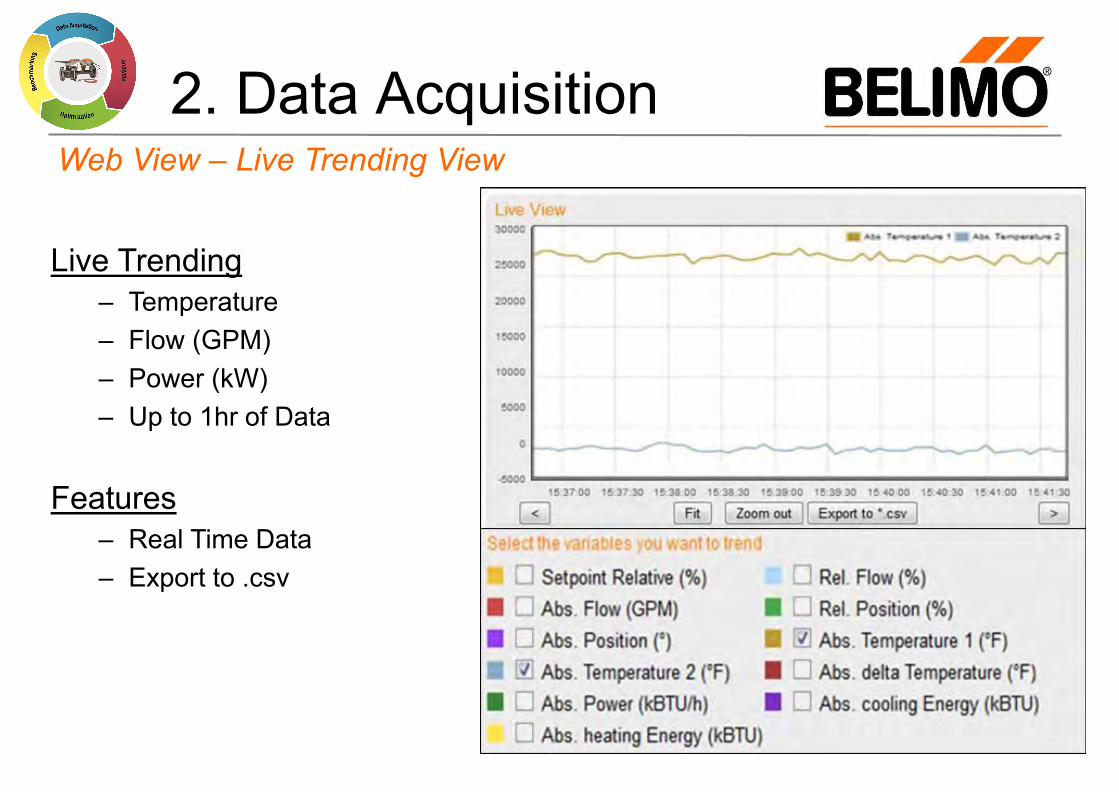
2. Data Acquisition Web View – Live Trending View
Live Trending – Temperature – Flow (GPM) – Power (kW) – Up to 1hr of Data
Features – Real Time Data – Export to .csv
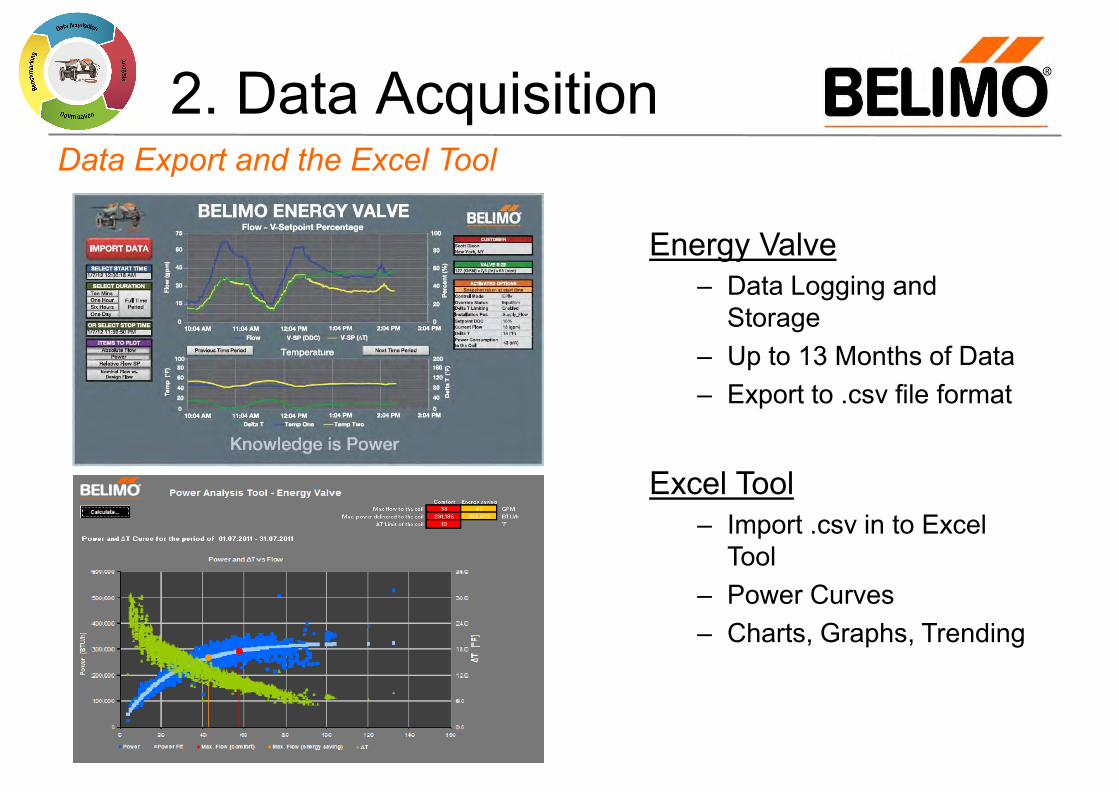
2. Data Acquisition Data Export and the Excel Tool
Energy Valve – Data Logging and
Storage – Up to 13 Months of Data – Export to .csv file format
Excel Tool
– Import .csv in to Excel Tool
– Power Curves – Charts, Graphs, Trending

2. Data Acquisition
• BACnet MS/TP • BACnet IP • TCP/IP • MP-bus
Network Communications
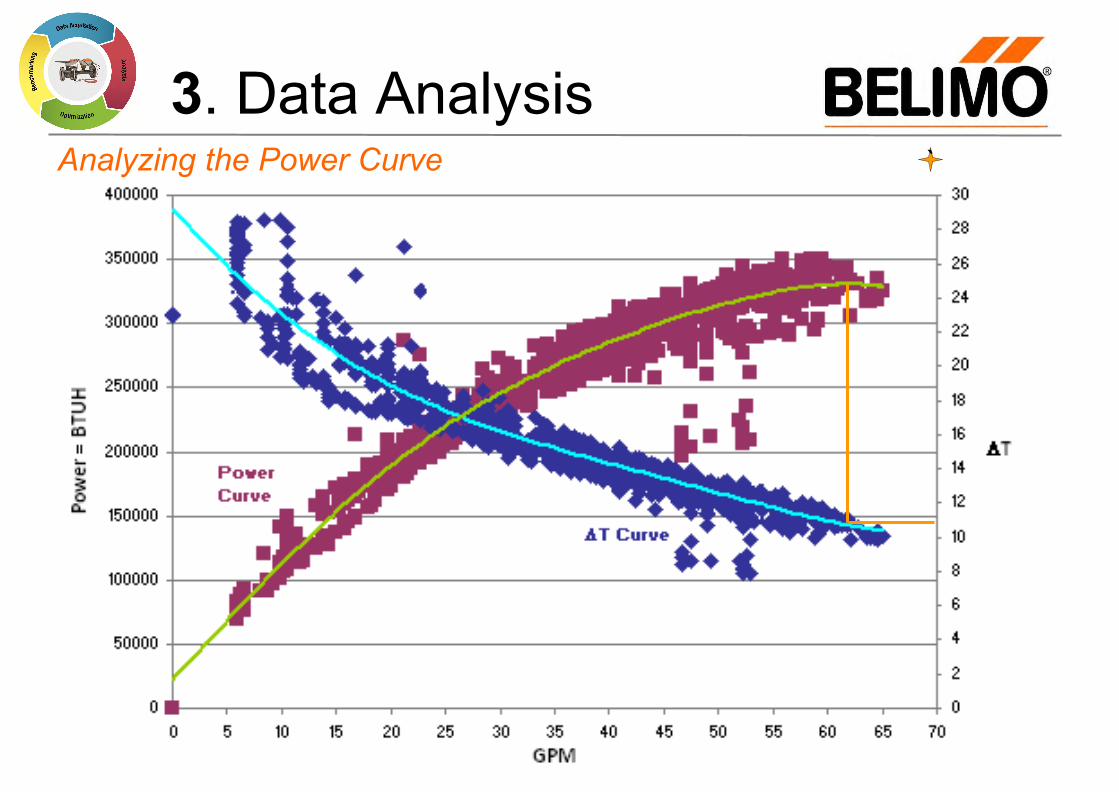
3. Data Analysis Analyzing the Power Curve `
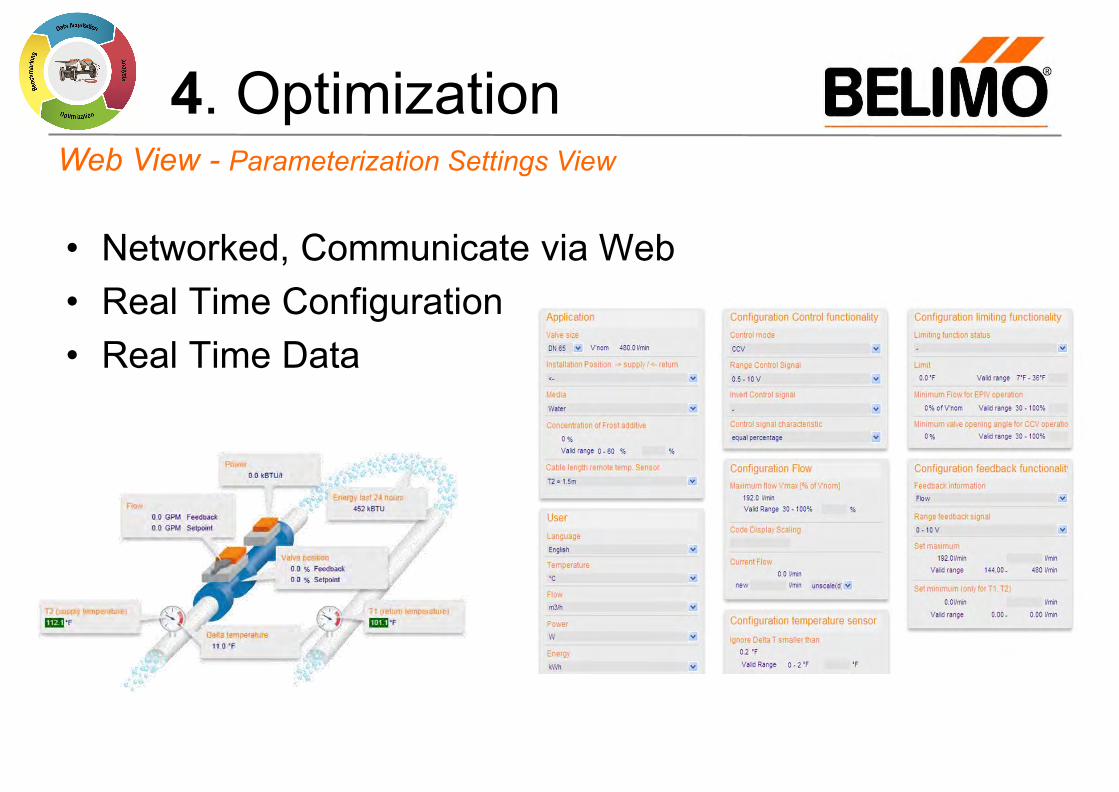
4. Optimization Web View - Parameterization Settings View
• Networked, Communicate via Web • Real Time Configuration • Real Time Data
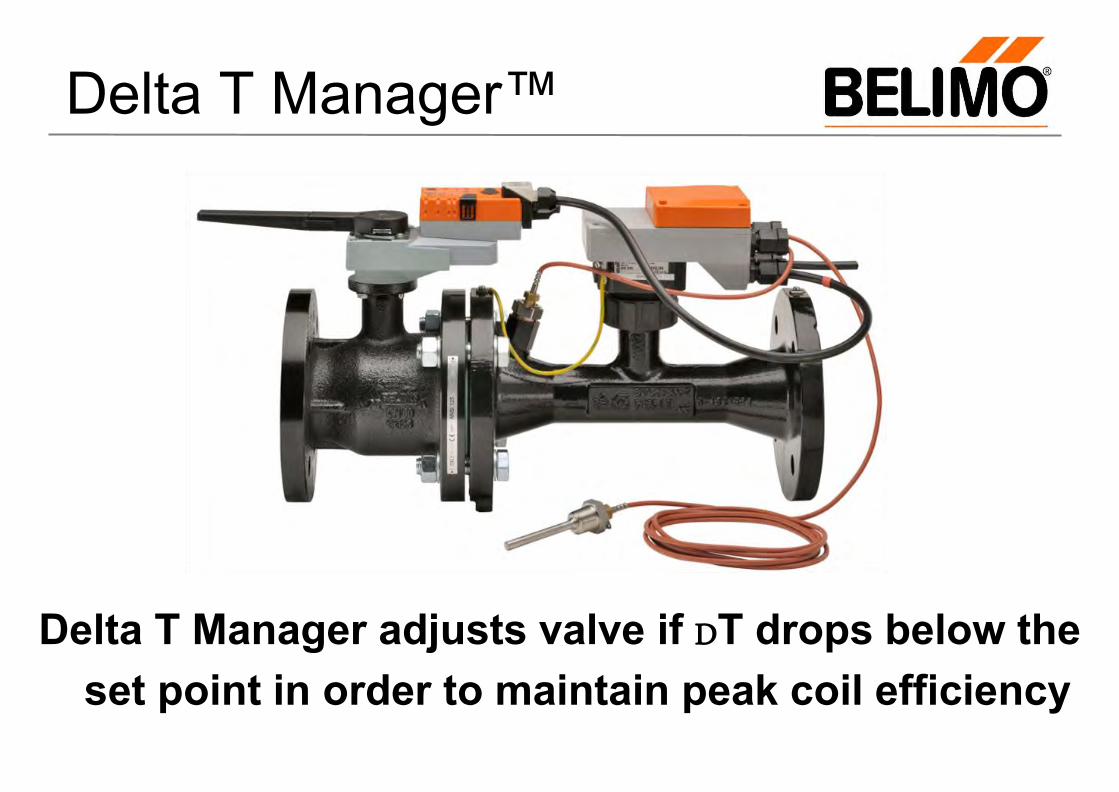
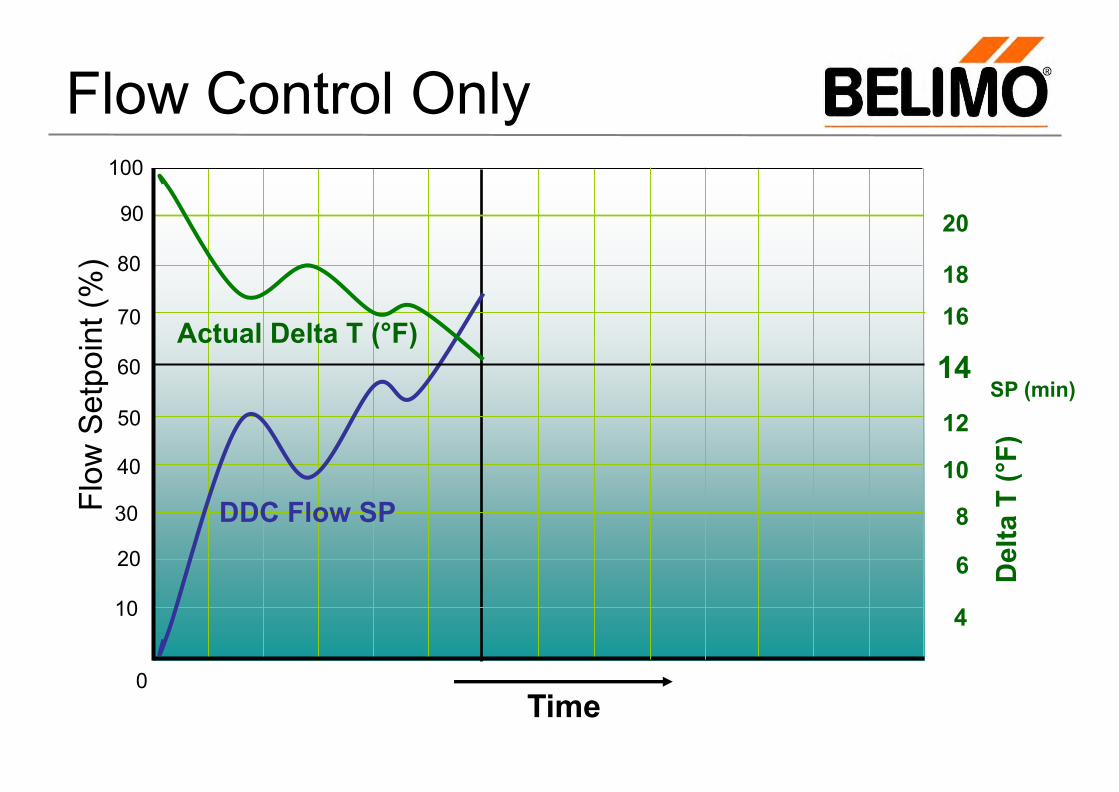
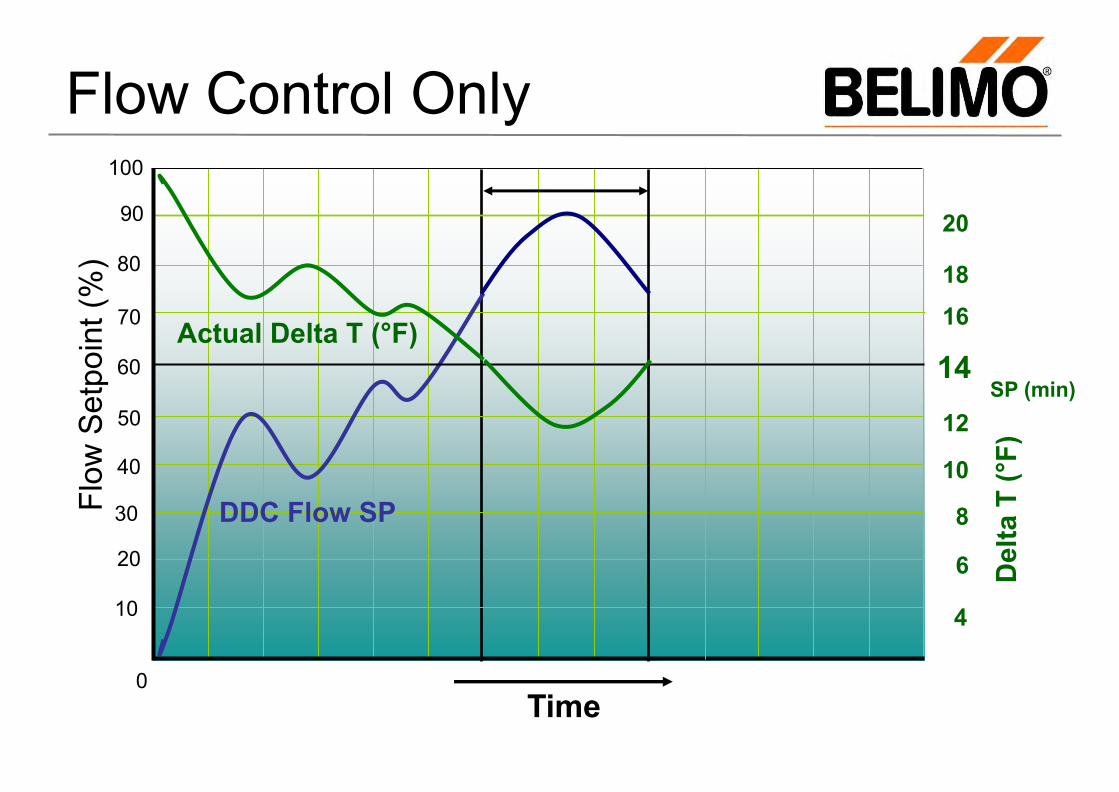
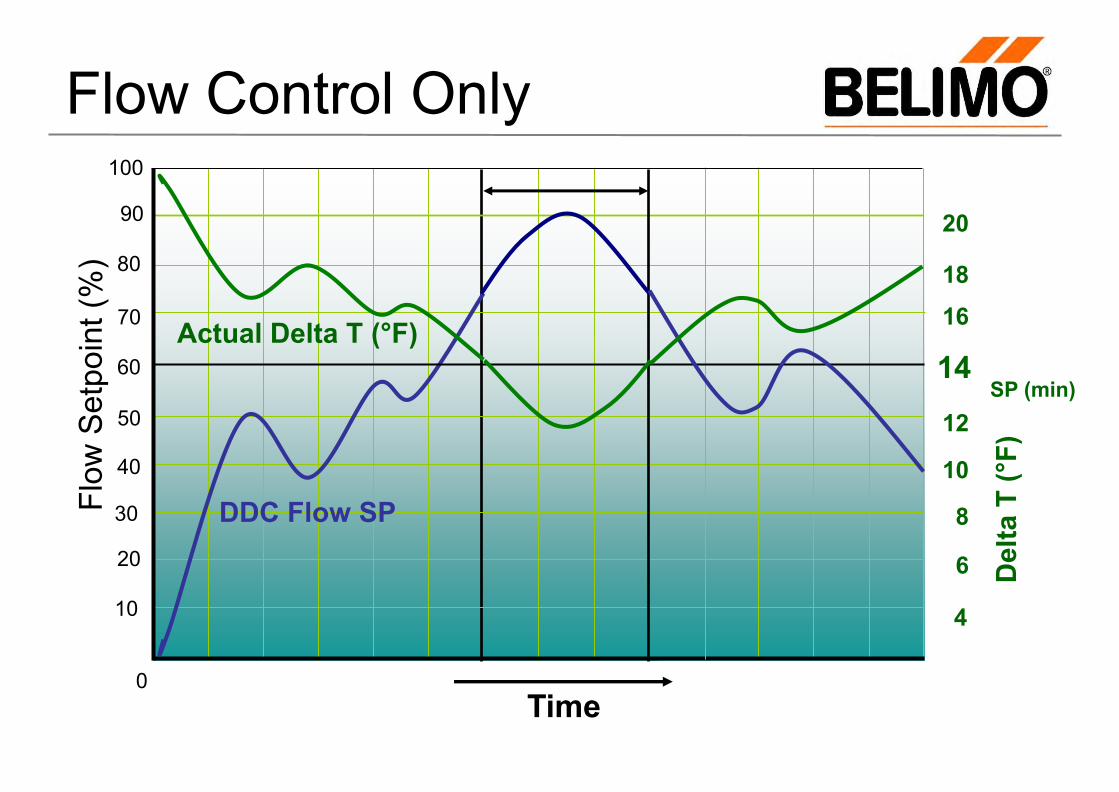
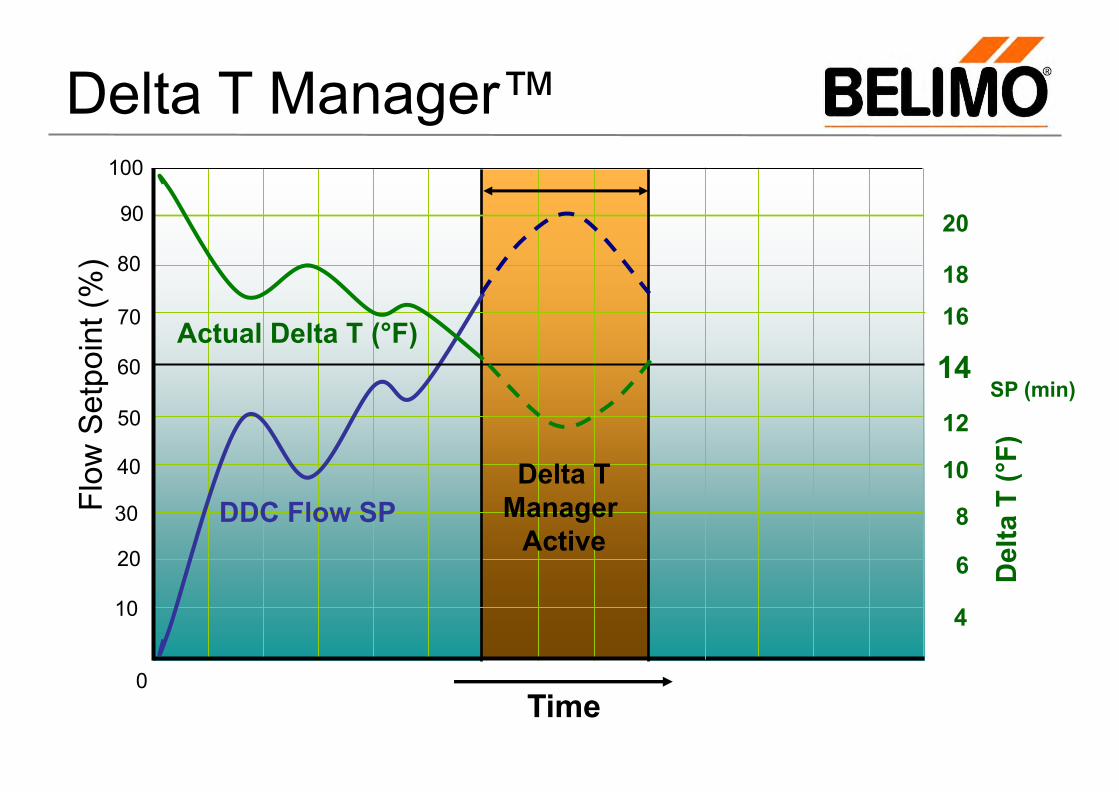
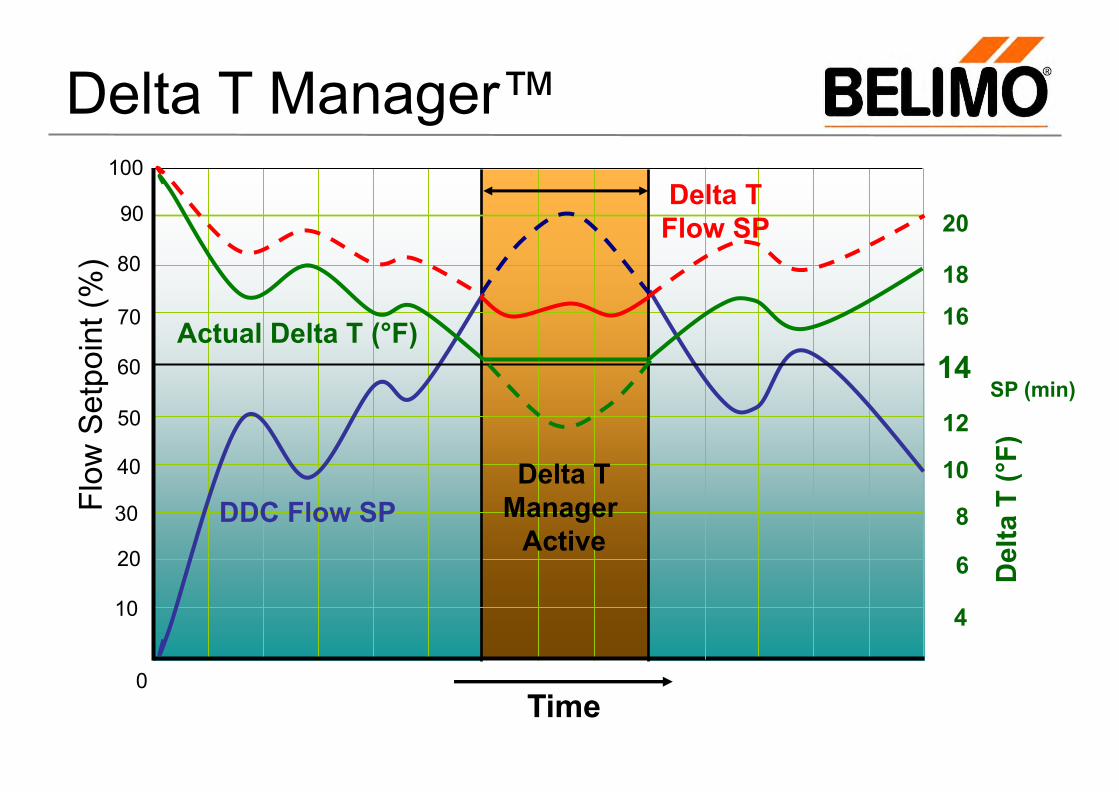
Delta T Manager™
Delta T Manager adjusts valve if DT drops below the set point in order to maintain peak coil efficiency
0
20
40
60
80
100
10
30
50
70
90
Time
Flow
Set
poin
t (%
)
DDC Flow SP
Del
ta T
(°F)
14
18
12
16
20
10
8
6
4
Actual Delta T (°F)
SP (min)
Flow Control Only
0
20
40
60
80
100
10
30
50
70
90
Time
Flow
Set
poin
t (%
)
DDC Flow SP
Del
ta T
(°F)
14
18
12
16
20
10
8
6
4
Actual Delta T (°F)
SP (min)
Flow Control Only
0
20
40
60
80
100
10
30
50
70
90
Time
Flow
Set
poin
t (%
)
DDC Flow SP
Del
ta T
(°F)
14
18
12
16
20
10
8
6
4
Actual Delta T (°F)
SP (min)
Flow Control Only
0
20
40
60
80
100
10
30
50
70
90
Time
Flow
Set
poin
t (%
)
DDC Flow SP
Del
ta T
(°F)
14
18
12
16
20
10
8
6
4
Actual Delta T (°F)
SP (min)
Delta T Manager
Active
Delta T Manager™
0
20
40
60
80
100
10
30
50
70
90
Time
Flow
Set
poin
t (%
)
DDC Flow SP
Del
ta T
(°F)
14
18
12
16
20
10
8
6
4
Actual Delta T (°F)
SP (min)
Delta T Manager™
Delta T Manager
Active
Delta T Flow SP
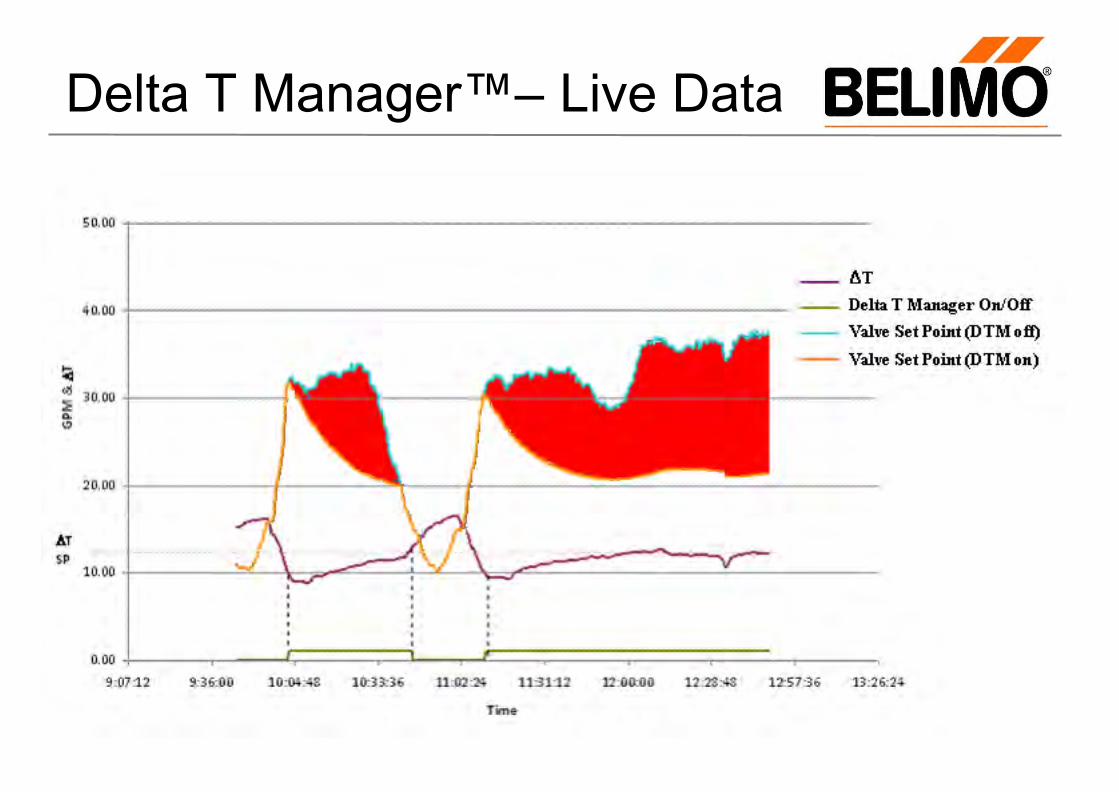
Delta T Manager™– Live Data
WASTE ZONE
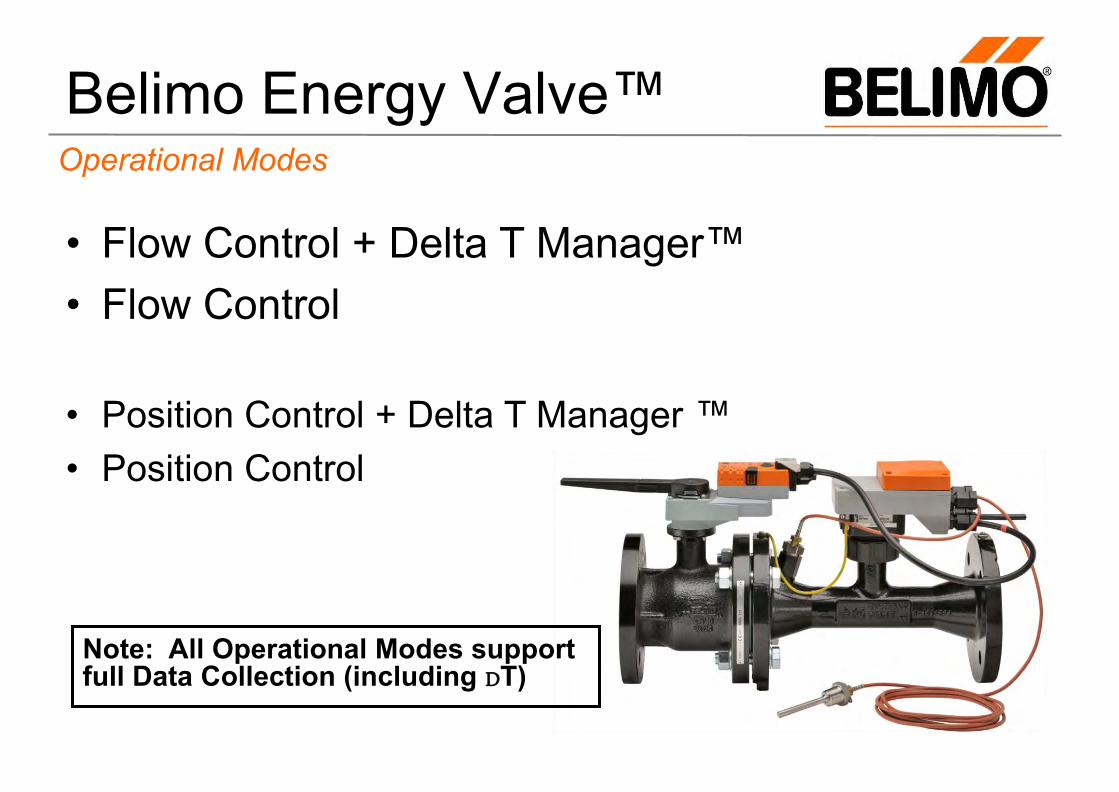
Belimo Energy Valve™
• Flow Control + Delta T Manager™ • Flow Control
• Position Control + Delta T Manager ™ • Position Control
Operational Modes
Note: All Operational Modes support full Data Collection (including DT)
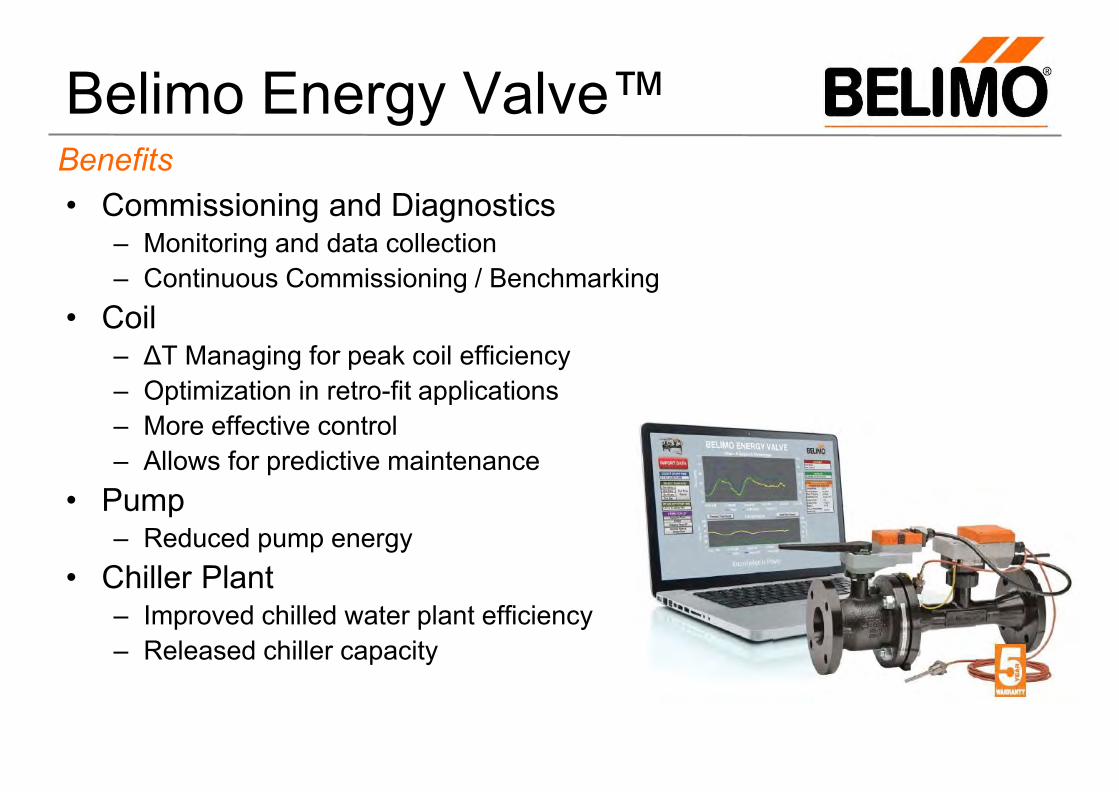
Belimo Energy Valve™
• Commissioning and Diagnostics – Monitoring and data collection – Continuous Commissioning / Benchmarking
• Coil – ΔT Managing for peak coil efficiency – Optimization in retro-fit applications – More effective control – Allows for predictive maintenance
• Pump – Reduced pump energy
• Chiller Plant – Improved chilled water plant efficiency – Released chiller capacity
Benefits

Questions?
The Belimo Energy Valve™