issuer operating performance and ipo price … series... · issuer operating performance and ipo...
TRANSCRIPT
ISSUER OPERATING PERFORMANCE AND IPO PRICE FORMATION
Michael Willenborg
University of Connecticut [email protected]
Biyu Wu University of Connecticut
March 14, 2014
ISSUER OPERATING PERFORMANCE AND IPO PRICE FORMATION
ABSTRACT
We extend the study of the association between public information and IPO price formation by examining Brau and Fawcett’s (2006) chief financial officer survey response that having strong historical earnings is the most important signal of quality an IPO issuer can convey to investors. For a sample of 2001–2012 IPOs, we find measures of pre-IPO operating performance explain a substantial portion of the variation in the revision from the mid-point of the initial price range to the IPO offer price. Moreover, for these recent IPOs, the partial adjustment phenomenon concentrates among issues with strong performance; whereas for those with weak performance, the downward price adjustment is nearly full. As for why issuers with strong performance seem to acquiesce to a partial increase in offer price, these IPOs have the largest wealth gains from shares sold / retained upon going public. Overall, our results are consistent with Loughran and Ritter’s (2002) agency / prospect theory explanation for IPO partial adjustment and suggest an important role for historical accounting information in the pricing of book-built IPOs.
Keywords: Operating performance, initial public offerings, partial adjustment, underpricing
Data Availability: Public sources

I. INTRODUCTION
When a company files to go public in a firm commitment initial public offering (IPO), in
either its initial registration statement or a subsequent amendment, it must provide an initial price
range within which it expects to sell its shares. Following this disclosure, representatives of the
company and its lead underwriters meet with select investors to obtain feedback and indications
of interest to price and pre-sell the offering. Subsequent to this road-show period, the offer price
decision is made the day before the shares begin to trade. Then, as is well known, on average,
the offer price is lower than the first-day closing price. This price formation of IPOs, from initial
price range to offer price to closing price on the first trading day, is a topic of longstanding
interest. While the latter return (underpricing) garners the majority of attention, understanding
the former (price revision) is arguably the key. For example, Ritter and Welch (2002, p. 1803)
conclude “the solution to the underpricing puzzle has to lie in focusing on the setting of the offer
price, where the normal interplay of supply and demand is suppressed by the underwriter.”
In an influential paper that links setting the offer price with underpricing, Benveniste and
Spindt (1989) propose a book-building theory of IPO pricing and allocation by underwriters. In
their model, to induce ‘regular’ (e.g., road-show) investors to divulge indications of strong
demand, underwriters only partially revise the range upward to arrive at the offer price. As a
result, underpricing of IPO shares, along with discretionary allocation of them, compensates
investors for truthful revelation of favorable private information. Consistent with this, Hanley
(1993) was the first to document the strong, positive association between the price revision and
first-day underpricing (i.e., the partial-adjustment phenomenon).
More recently, Loughran and Ritter (2002) posit an agency / prospect theory explanation
for the partial adjustment phenomenon. They argue that if issuers anchor on the midpoint of
filing range and offset the loss of company proceeds from underpricing on primary shares with
their wealth revaluation on retained / secondary shares, they will acquiesce to under-adjustment
of the offer price in response to strong demand. Given this emphasis on the covariance between
money left on the table and unexpected wealth changes, Loughran and Ritter (2002, p. 438)
2
assert “issuers bargain hard over the offer price in a bad state of the world, whereas they are
pushovers in bargaining over the offer price in a good state of the world.” Importantly, their
explanation makes no distinction between private and public information. In support of this,
they show that market returns during the 15 days pre-IPO are positively associated with both the
price revision and initial returns and that this association is considerably stronger when returns
are negative (i.e., they document partial (nearly full) adjustment to favorable (unfavorable)
public information). In his discussion of Loughran and Ritter (2002), Daniel (2002, p. 453)
poses “[s]ome questions that merit further investigation include … [t]o what extent are revisions
predictable using information available as of the preliminary prospectus date?”
From an empirical standpoint, one way to address Daniel’s (2002) question, and further
our understanding of IPO price formation, is to focus on the price revision and advance proxies
that plausibly surrogate for favorable or unfavorable public information. In Brau and Fawcett’s
(2006) survey of chief financial officers (CFOs), all categories of respondents chose “having
strong historical earnings” as the most important positive signal issuers convey to investors
regarding the value of a firm going public. In this paper, we study the relation between pre-IPO
operating performance and IPO price formation, with a focus on the revision from the mid-point
of the initial price range to the offer price. We report evidence of a strong, positive association
between pre-IPO operating performance and the price revision; a relation apparent in descriptive
statistics, robust to multiple regression and consistent with an identification strategy wherein we
substitute stale versions of our performance measures. Overall, these findings are supportive of
an important pricing role for the historical accounting information in the IPO prospectus.
We study firm commitment, share IPOs by domestic companies from January 2001 to
December 2012. At average underpricing of 13.2%, these IPOs sustain a comparable fraction of
‘money left on the table’ as the pre-bubble samples of Loughran and Ritter (2002) and Lowry
and Schwert (2004). Using the most-recent financial statements in the final prospectus, we
compute three measures of pre-IPO operating performance: operating income to average assets;
net income to average assets; and operating cash flow to average assets. Descriptively each of
3
these measures is strongly positively associated with both the price revision and underpricing,
particularly in the tails of the distribution (e.g., whereas IPOs in the lowest decile of operating
income, net income or operating cash flow have mean (median) price revisions of –22% (–21%)
and mean (median) underpricing of 5% (1%); those in the highest decile have mean (median)
price revisions of +5% (+8%) and mean (median) underpricing of +22% (+19%)). This suggests
an asymmetric association between operating performance and IPO offer price formation, in that
downward (upward) price adjustments for IPOs with weak (strong) operating performance are
almost full (partial). Within Loughran and Ritter’s (2002) framework, this is consistent with the
view that weak (strong) pre-IPO operating performance represents unfavorable (favorable)
public information that engenders weak (strong) demand and motivates issuers to bargain
aggressively (passively) with the underwriter over the IPO offer price at the pricing meeting.
The positive association between pre-IPO operating performance and offer price revision
is robust to controlling for other determinants (e.g., book-building market returns, ownership
retention, selling shareholders and whether the issuer is in a high technology industry).
Moreover, specification of each of our operating performance variable of interest substantially
increases the explained variation in price revision over-and-above that of a baseline estimation.
We also adopt an identification strategy to assess whether our results weaken upon
substituting older versions of our variables of interest. To do this, we restrict the sample for our
offer price revision regressions to those IPOs with both year-end and interim financial statements
in their final prospectus. These are issuers for which the year-end statements have ‘gone stale’.
This occurs, per Securities and Exchange Commission (SEC) rules, when the time between the
date of the year-end financial statements and the effective date of the registration statement
exceeds 134 days (e.g., for a December 31 year-end issuer, this occurs at the close of business on
May 14th). The coefficients on our operating performance variables of interest are smaller and
the regression explanatory power is lower when we use older, year-end financial statements in
place of more-recent, interim financial statements to calculate our variables of interest.

4
To refine our test of Brau and Fawcett’s (2006) CFO survey response, which specifically
references “strong” historical earnings as a signal of quality, we also parse our continuous pre-
IPO operating performance variables into a series of indicator variables based on decile ranking.
Upon regressing price revision on these indicators, we find a near-monotonic increase in the
coefficients on these indicator variables of interest as they ascend decile ranks.
The association between pre-IPO operating performance and initial returns, while also
positive and significant, is much weaker than with the price revision. For example, when we
supplement a benchmark underpricing regression, which controls for the price revision, with
operating income to assets the adjusted R-squared increases from 39.2% to 40.0%. We conclude
that to the extent pre-IPO operating performance influences IPO price formation, it is primarily
with respect to the revision from mid-point of initial price range to offer price.
To examine why issuers with strong performance seem to acquiesce to a partial upward
adjustment of offer price, we follow Loughran and Ritter (2002) and compute the change in pre-
IPO shareholder wealth. Two components comprise this revaluation: the change from mid-point
of the initial price range to offer price for the shares insiders sell at the IPO; and the change from
mid-point of the initial price range to closing price on the first trading day for the shares that
shareholders retain. For issuers in the highest decile of pre-IPO performance, the revaluation in
pre-IPO shareholders’ wealth exceeds money left on the table by several orders of magnitude.
Therefore, one explanation for why issuers with strong performance agree to a partial adjustment
of the initial price range in response to strong demand is they anchor on the mid-point of the
price range and offset the company’s loss of proceeds with their gain in wealth from revaluation.
Combining with Brau and Fawcett’s (2006) CFO survey with Loughran and Ritter’s
(2002) agency / prospect theory of partial adjustment, our findings are consistent with strong
(weak) pre-IPO operating performance signaling favorable (unfavorable) public information
regarding firm value. In the favorable scenario, underwriters, who prefer to market underpriced
shares (Baron 1982; Loughran and Ritter 2002), exploit issuers’ satisfaction with their positive
wealth revaluation by partially adjusting the IPO offer price. Issuers, happy with the increase
5
vis-à-vis the mid-point of the initial range, acquiesce to this partial adjustment at the pricing
meeting. In contrast to this, the unfavorable scenario, issuers bargain aggressively at the pricing
meeting and, as such, little money is left on the table.
Overall, our paper contributes by providing evidence suggestive of an important role for
historical accounting information in the price formation of book-built IPOs. Previous papers
focus on the valuation of IPOs, oftentimes by studying subsets of the population, and generally
find historical accounting information to be of relatively little importance (e.g., Kim and Ritter
1999; Bartov, Mohanram and Seethamraju 2002; Berger 2002). We extend the study of the
importance of accounting information in the context of IPOs by focusing on the price formation,
from mid-point of the initial range to offer price to first closing price.
II. BACKGROUND AND MOTIVATION
In this section, we discuss the literature on partial price adjustment and underpricing of
book-built IPOs. Two primary streams comprise this literature: one emphasizes informational
issues and book building and another emphasizes agency issues and bargaining incentives. We
then discuss the role of accounting information in the valuation and price formation of IPOs.
Investors, underwriters and private information
One stream focuses on investors and underwriters and concludes that book building can
improve pricing accuracy by facilitating the revelation or acquisition of private information.
Benveniste and Spindt (1989) model the pre-market interaction between underwriters and
“regular” (e.g., road show) investors as a single-price auction wherein investors bid by indicating
non-binding interest at different prices which underwriters use to construct a demand curve to set
the price. In contrast to indications of weak demand, which should require little inducement,
underwriters keep prices intentionally low to reward investors for truthful revelation of strong
demand. Following this, partial offer price adjustment to favorable demand, in concert with
preferential allocation of shares, compensates investors for providing private information that
6
allows the underwriter to more-accurately price the issue. Underpricing therefore results from
the partial offer price adjustment necessary to ensure the revelation of strong demand from
regular investors is incentive compatible. Among Benveniste and Spindt’s (1989, p. 353)
implications is that “[u]nderpricing is directly related to the level of interest in the premarket.”1
Several empirical papers provide results consistent with this dynamic, information-based
view of IPO pricing. Hanley (1993) reports a strong, positive relation between the IPO price
revision (from mid-point of the initial price range to offer price) and first-day returns. Based on
a small, yet detailed sample of international equity issues, Cornelli and Goldreich (2001) find
that investors providing bids with both share and price information receive favorable allocations
from underwriters. Ljungqvist and Wilhelm (2002) study a large, worldwide sample for which
they have share allocation data and conclude the data more strongly support the view that
allocations promote price discovery, as opposed to representing discriminatory practices.
Issuers, underwriters and public information
A second stream focuses on agency issues between issuers and underwriters, such as the
former’s bargaining incentives or non-price aspects of their objective function.
Loughran and Ritter (2002) apply a prospect theory framework (Kahneman and Tversky
1979) and argue that if issuers anchor on the filing range and offset the loss of company proceeds
from underpricing primary shares with the positive wealth revaluation on retained or secondary
shares, they will acquiesce at the pricing meeting to partial adjustment of the offer price in
response to strong demand. Following this focus on the covariance between money left on the
table and unexpected wealth changes, if bookbuilding demand is favorable (unfavorable), due to
either private or public information, issuers acquiesce (negotiate) at the pricing meeting. In
support of this, they show that public information in the form of market returns during the 15
1 In contrast to the revelation of private information Chemmanur (1993) models the issuer’s decision to underprice the IPO in order to compensate investors for information production and several papers (Benveniste and Wilhelm (1990); Sherman (2000); Sherman and Titman (2002) model book-building / underpricing as way to incentivize investors to incur the costs of becoming informed (see also Yung 2005).
7
days pre-IPO are positively associated with both the price revision and initial returns and that
this association is stronger when market returns are negative.2 Loughran and Ritter (2002)
interpret the asymmetric association between book-building market returns and price revision as
consistent with a theory of bargaining, as they assert that issuers will aggressively (passively)
bargain over the offer price when roadshow demand is unfavorable (favorable).
Habib and Ljungqvist (2001) and Ljungqvist and Wilhelm (2003) posit that underpricing
is partly a function of the extent to which owners “care” about it. These papers focus on the
relation between proxies for issuer incentives to bargain for a higher offer price and IPO pricing.
For example, Ljungqvist and Wilhelm (2003) examine a sample of domestic IPOs from 1996 to
2001 and conclude that decreases in CEO ownership and insider selling along with an increase in
directed-share programs (i.e., allocation of shares to ‘friends and family’) explain a large portion
of the variation in underpricing during the internet bubble.
For a sample of domestic IPOs from 1980-2003, Loughran and Ritter (2004) test three
non-mutually exclusive explanations for the time-series variation in underpricing: 1) a change in
issuer risk composition (Ritter 1984); 2) realignment of issuer bargaining incentives (Ljungqvist
and Wilhelm 2003); and 3) a change in issuer objective function away from maximizing IPO
proceeds. They conclude the latter, specifically issuer desire to garner coverage from top stock
analysts (‘analyst lust’) and underwriter allocations of hot IPOs to executives of yet-to-go-public
companies (‘spinning’), best explains the underpricing during 1999-2000. Of note, subsequent
legal and regulatory intervention limits both of these drivers of bubble-period underpricing.
Lowry and Schwert (2004) conclude that neither the mid-point of the initial price range
nor the IPO price fully reflect public information, which they suggest may stem from an implicit
contract between underwriter and issuer to limit revisions. Consistent with prior literature, they
document an asymmetric association between book-building market returns and price revision;
as the downward price revision to negative returns is almost one-for-one, but the upward price
2 Bradley and Jordan (2002) also show that initial returns are associated with the initial returns of previous IPOs.
8
revision to positive returns is much less than this. They also question the significance of publicly
available variables prior to disclosure of the initial price range to explain the price revision and
conclude the IPO market is “almost efficient” with respect to public information.
Because IPO failure is costly, Edelen and Kadlec (2005) conclude partial adjustment to
public information, and its asymmetric response to good and bad news, is partly an artifact of the
selection bias inherent in using samples of successful IPOs. They argue that firms proceed with
IPOs when positive market responses occur but, to ensure a successful offering and the issuer
surplus it entails, only partially adjust price upward; in contrast, when negative market responses
occur, because of the costs of withdrawal, firms more-fully adjust price downward.
Accounting information and the pricing of IPOs
Several papers examine the relation between accounting information in the prospectus
and the pricing or valuation of IPOs. In general, this literature documents little role for historical
accounting measures of operating performance.
Klein (1996) studies the valuation usefulness of prospectus financial statement variables
for a sample of 193 IPOs from 1980 to 1991 with positive pre-IPO income. She documents a
positive association between the offer price and the market price one week after the offering and
both pre-IPO earnings per share and book value per share. Kim and Ritter (1999) study the
association between issuer and industry multiples (e.g., price-earnings ratios) for a sample of 190
IPOs from 1992-1993 with positive pre-IPO income. They report positive, albeit statistically
weak, associations between issuer and industry multiples (e.g., upon regressing issuer P/E on
industry-median P/E, the adjusted-R2 is just 5.0%). Kim and Ritter (1999, page 424) conclude
historical accounting numbers are of limited value for understanding IPO valuation and that “…
the performance of the comparable firms approach is surprisingly weak.”
Bartov, Mohanram and Seethamrau (2002) study of the association between IPO prices
and earnings, operating cash flows and sales for samples of 98 Internet IPOs and 98 matched
non-Internet IPOs during 1996-1999. Their specification partitions earnings and operating cash
9
flows by whether they are positive or negative. For Internet IPOs, their findings provide no
support for an association between earnings and IPO prices but rather strong evidence that
negative operating cash flows are associated with higher offer prices. For non-Internet IPOs,
they find offer prices are positively related to earnings and cash flows, but only for issuers for
which these variables are non-negative. Akin to Kim and Ritter’s (1999) conclusion, Berger
(2002, page 348) summarizes Bartov et al.’s (2002) findings as “[t]he results point to a very
limited pricing role for the financial statement data contained in the IPO prospectus.”
A recent paper by Brau and Fawcett (2006) motivates re-visiting the relation between
accounting measures of operating performance and IPO pricing. They survey three categories of
chief financial officers, those with companies: that went public; that began to go public but
withdrew; large enough to go public but have not done so. Among their questions is “[w]hat
type of signal do the following actions convey to investors regarding the value of a firm going
public?” (italics in original) All groups of respondents chose “having strong historical earnings”
as the most important positive signal issuers convey to investors regarding the value of a firm
going public. We extend the study of the association between public information and IPO price
formation, as Loughran and Ritter (2002) theorize, by examining this CFO survey response.
III. SAMPLE, VARIABLE SPECIFICATION AND DESCRIPTIVE STATISTICS
Sample
Panel A of Table 1 presents our sample. Using Thompson Financial’s SDC database, we
begin by identifying 1,826 firm-commitment IPOs by stand-alone (non-carve out) US companies
from January 1, 2001 through December 31, 2012. This period covers a dozen, post-IPO bubble
years and, for the most part, begins where those of Loughran and Ritter (2002), Ljungqvist and
Wilhelm (2003) and Lowry and Schwert (2004) end.3 We focus on share IPOs by non-financial
companies by eliminating 790 IPOs by financial companies (i.e., SDC SIC 6xxx; most of which 3 Loughran and Ritter’s (2002) sample is 1990–1998; Ljungqvist and Wilhelm’s (2003) sample is 1996–2001; and Lowry and Schwert’s (2004) primary sample is 1985–1997 though, for certain analyses, it extends through 1999. As such, our 2001–2012 sample is least comparable to Ljungqvist and Wilhelm’s (2003) IPO bubble period sample.
10
are unit investment trusts), and 113 unit IPOs, because they are mostly small offerings by small
companies. We eliminate 71 IPOs without necessary financial statement information in their
registration statement, most of which are issuers that do not provide two balance sheets to
calculate average assets for the year before going public. Since our interest is price formation of
book-built IPOs, we eliminate 15 IPOs sold via auction (Degeorge, Derrien and Womack 2010).4
We also eliminate 7 IPOs for which the time between the date of the registration statement with
the initial price range and the IPO date exceeds one year (Edelen and Kadlec 2005) and 6 IPOs
with a mid-point of their initial price range of $5 or less. Our final sample consists of 824 IPOs.
Variable specification and descriptive statistics
Panel B of Table 1 presents descriptive statistics and Table 2 presents correlations for all
dependent and independent variables. Mean (median) PriceRevision (change from the midpoint
of the initial price range to the IPO offer price), in percentage terms, is –5.2% (0.0%). This
average is more negative than the –1.4% Lowry and Schwert’s (2004) report for their pre-bubble
period sample, and much less than the +5.8% Ljungqvist and Wilhelm (2003) report for their
bubble period sample.5 Mean (median) InitialReturn (change from the IPO offer price to the
closing price on the first trading day), in percentage terms, is 13.2% (8.3%). This average is
similar to Loughran and Ritter’s (2002) 14.1% and Lowry and Schwert’s (2004) 12.3% but, not
surprisingly, far below Ljungqvist and Wilhelm’s (2003) average underpricing of 35.7%.
Our three operating performance variables are: OI/Assets (annualized operating income,
per the most-recent pre-IPO income statement, divided by average assets), NI/Assets (annualized
net income, per the most-recent pre-IPO income statement, divided by average assets) and
OCF/Assets (annualized operating cash flow, per the most-recent pre-IPO statement of cash
flows, divided by average assets). All of these variables have negative means and positive
medians. As might be expected, because of the effects of special items, interest expense and 4 See W.R. Hambrecht’s website at http://www.wrhambrecht.com/ind/auctions/index.html. 5 Loughran and Ritter (2002) do not report descriptive statistics for price revision. However, per their Table 2, because the fraction of their sample with offer prices below the minimum of the initial range exceeds that above the maximum (27.3% and 24.3%, respectively), the average price revision for their sample seems likely negative.

11
income taxes, average (median) OI/Assets is less negative (more positive) than average (median)
NI/Assets. Of note, all three of these measures have a considerable amount of dispersion; for
example, NI/Assets has a standard deviation of 0.998 around a mean of –0.241. Not surprisingly,
this dispersion is particularly evident at the negative tail of each variable’s distribution.6
In terms of covariates, we specify two ‘spillover’ variables for public information during
book building (Ljungqvist and Wilhelm 2003). The first is MktReturn, the equally-weighted
return on all companies in CRSP residing in the issuer’s Fama and French (1997) industry from
the date of the registration statement with the initial price range to IPO date. When specifying
our regressions, we allow for the likelihood that positive secondary market returns affect the
price revision differently than negative market returns (Loughran and Ritter 2002; Lowry and
Schwert 2004; Edelen and Kadlec 2005). The second is IPOReturn, the average initial return for
all IPOs during the period from the date of the first registration statement to IPO date.7
We also control for ownership retention and insider selling. The average (median) issuer
retains 71.0% (73.5%) ownership (i.e., Retain%, one minus the number of shares sold in the IPO
divided by the number of post-IPO shares outstanding). While the majority of our IPOs do not
have secondary shares, the average SellingShr% (number of selling shareholder shares divided
by number of total shares in the IPO) is 16.7%. Leland and Pyle (1977) theorize that higher
values of Retain% and SellingShr% are positive and negative signals, respectively, of firm value
to potential investors. In addition, these two variables also proxy for IPO issuer incentives to
bargain at the IPO pricing meeting (Loughran and Ritter 2002; Ljungqvist and Wilhelm 2003).
Following this, a positive (negative) association between Retain% and PriceRevision is
consistent with a signaling (agency) story and a negative (positive) association between
SellingShr% and PriceRevision is consistent with a signaling (agency) story.
6 For example, for Ventrus Biosciences Inc. (a company that went public on December 16, 2010), OI/Assets, NI/Assets and OCF/Assets are –5.802, –21.204 and –14.303, respectively. 7 In specifying IPOReturn, to retain observations, we compile initial returns starting with the date of an issuer’s first prospectus. If we were to start from the date of an issuer’s prospectus that discloses the initial price range, we would lose observations because, in numerous instances, no companies went public during this shorter time frame.
12
The motivation for our other covariates (e.g., UW, VC, Proceeds, Age, HighTech, Assets)
is extant IPO papers on price revision and initial returns, notably Ljungqvist and Wilhelm (2003)
and Lowry and Schwert (2004). Following Lowry and Schwert (2004), we adjust Proceeds and
Assets for inflation, converting them to 1983 dollars with the Consumer Price Index.
Table 2 shows correlations, Pearson (Spearman) below (above) the diagonal. Each
operating performance measure is positively correlated with PriceRevision and InitialReturn.
The measure with the highest Pearson (Spearman) correlation with PriceRevision is OI/Assets
(OCF/Assets). Of note, consistent with the dispersion in these measures, Spearman correlations
between dependent variables (PriceRevision or InitialReturn) and independent variables of
interest (OI/Assets, NI/Assets, OCF/Assets) are more positive than their Pearson counterparts
(e.g., the Pearson (Spearman) correlation between PriceRevision and NI/Assets is 0.175 (0.309)).
Because of extreme values, particularly in the left tail of the distribution, we winsorize OI/Assets,
NI/Assets and OCF/Assets at + / – 1% for our regression estimations.
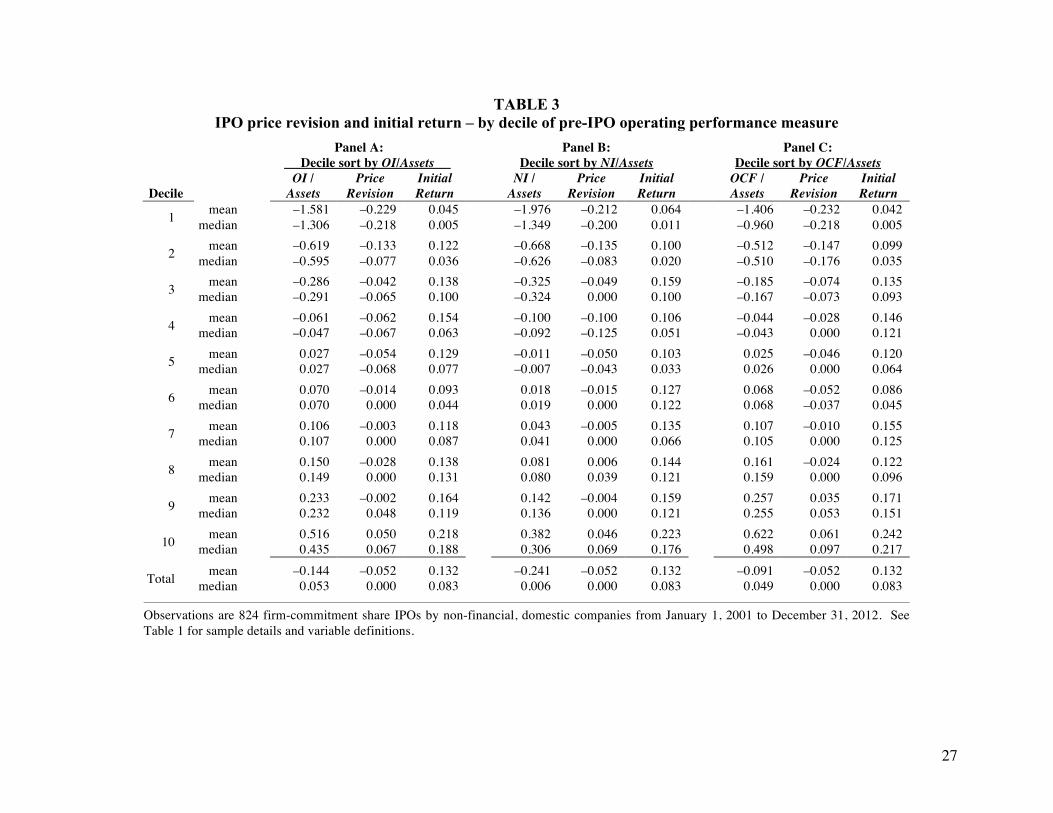
Table 3 provides descriptive sorts of our sample by: OI/Assets (panel A), NI/Assets (panel
B) and OCF/Assets (panel C). For each panel, we sort the variable of interest by decile and show
mean and median values of PriceRevision and InitialReturn. It is interesting to compare the
extremes of these sorts. For issuers in Decile 1, IPOs with very negative operating income, net
income or operating cash flow, mean (median) PriceRevision ranges from –23.2% to –21.2%
(–21.8% to –20.0%) and mean (median) InitialReturn ranges from +4.2% to +6.4% (+0.5% to
+1.1%). In contrast, for issuers in Decile 10, IPOs with very positive operating income, net
income or operating cash flows (i.e., per Brau and Fawcett’s survey, with “strong historical
earnings), mean (median) PriceRevision ranges from +4.6% to +6.1% (+6.7% to +9.7%) and
mean (median) InitialReturn ranges from +21.8% to +24.2% (+17.6% to +21.7%). Within the
context of Loughran and Ritter (2002), these findings are consistent with the view that weak
(strong) pre-IPO operating performance represents unfavorable (favorable) public information
that engenders weak (strong) roadshow demand and motivates issuers to bargain aggressively
(passively) with the underwriter at the pricing meeting.
13
Taken together, these findings suggest the association between pre-IPO operating
performance and IPO price formation is asymmetric. That is, for those issuers with very weak
(very strong) performance that go public, the downward (upward) price adjustment is almost full
(partial). This asymmetry is akin to that between book-building market returns and the price
revision (Loughran and Ritter 2002; Lowry and Schwert 2004; Edelen and Kadlec 2005) in that
‘bad’ (‘good’) news is nearly fully (partially) associated with downward (upward) price revision.
IV. EMPIRICAL ANALYSIS
Issuer operating performance and price revision
We begin by regressing each measure of pre-IPO operating performance on the IPO price
revision.8 These estimations supplement the Table 2 correlations by clustering standard errors by
IPO year.9 Given the presence of extreme values among these measures, we impart a winsor of
+1% and –1%. Because successful IPOs comprise our sample, the coefficients we report are
contingent upon the offering being completed (Loughran and Ritter 2002; Ljungqvist and
Wilhelm 2003; and Lowry and Schwert 2004)
PriceRevision = β0 + β1OI/Assets + ε (1a)
PriceRevision = β0 + β1NI/Assets + ε (1b)
PriceRevision = β0 + β1OCF/Assets + ε (1c)
Where: PriceRevision = (IPO price – mid-point of initial filing range) ÷ mid-point of initial filing range OIAssets = Annualized operating income per most-recent pre-IPO financial statements ÷ Average assets NI/Assets = Annualized net income per most-recent pre-IPO financial statements ÷ Average assets OCF/Assets = Annualized operating cash flow per most-recent pre-IPO financial statements ÷ Average assets
8 If we take a step back from studying the PriceRevision, and regress the mid-point of the initial price range on our measures of pre-IPO operating performance, we find the coefficient on each of them is strongly positive. When we then split these measures into separate variables depending on whether they are positive or negative, we find that the positive association stems from IPOs with negative OI/Assets, NI/Assets or OCF/Assets (i.e., issuers with poor pre-IPO operating performance have lower mid-points of their initial price range). Following Brau and Fawcett’s (2006) survey response, our analysis focuses on investor reaction to pre-IPO operating performance as opposed to examining the determinants of the initial price range. 9 We do not assume companies that go public during a given time period have pricing residuals that are independent in cross-section. Because of this, for all regression estimations, we cluster standard errors by IPO year.

14
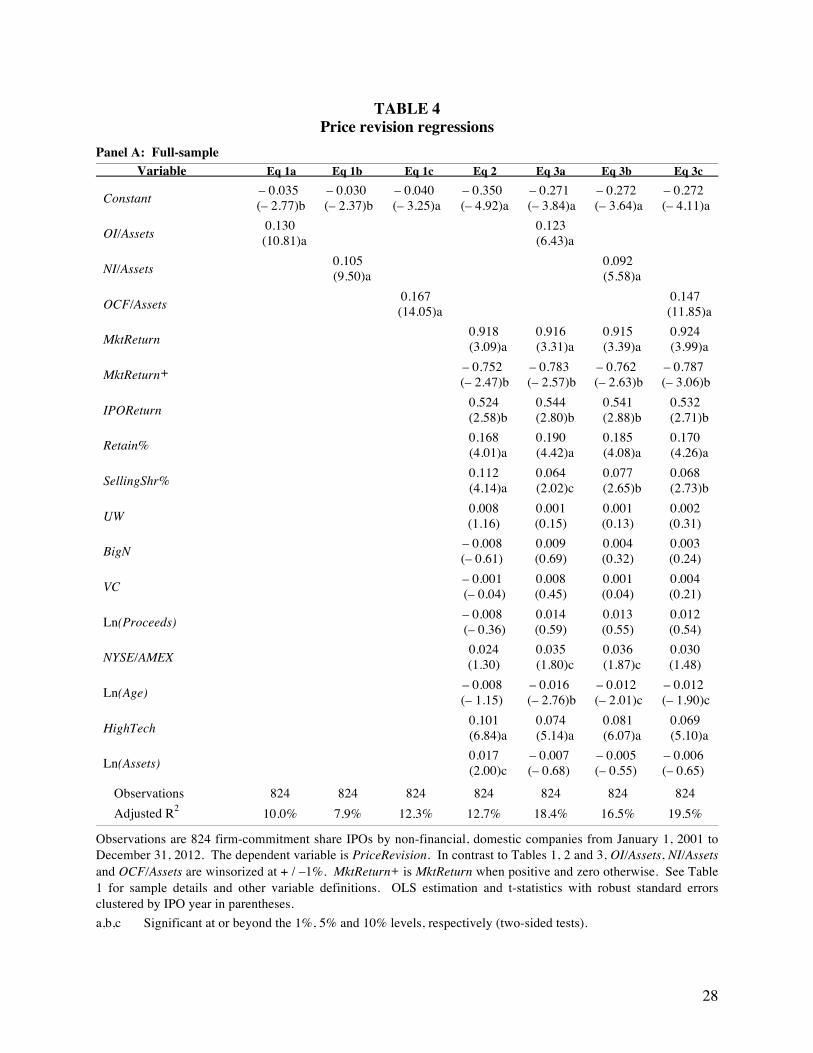
Columns 1 – 3 of Table 4 panel A report the results of estimating equations (1a), (1b) and
(1c). The coefficient for each operating performance measure is positive and highly significant
and their specification explains a substantial portion of the variation in PriceRevision.
To specify a benchmark to assess the effect of issuer operating performance, we estimate
equation (2) by regressing the PriceRevision on determinants from the literature. To control for
public information that arises during book building, we follow Ljungqvist and Wilhelm (2003)
and Edelin and Kadlec (2005) and specify MktReturn and IPOReturn as spillover, from
secondary and primary markets, respectively. With regard to the former, because Loughran and
Ritter (2002) and others document an asymmetric revision to positive versus negative market
returns, we also specify MktReturn+, which equals MktReturn when it is positive, and zero
otherwise. To control for the positive signal issuers convey by ownership retention (Leland and
Pyle 1977; Brau and Fawcett 2006) or, alternatively, for lower issuer incentives to bargain for a
higher IPO price (Loughran and Ritter 2002), we specify Retain%. To control for the negative
signal issuers convey by selling secondary shares or, alternatively, for higher issuer incentives to
bargain to increase the offer price, we specify SellingShr% (Ljungqvist and Wilhelm 2003).
Following Lowry and Schwert (2004), we specify Ln(Proceeds) and NYSEAMEX as transaction
characteristics. To control for effects associated with professional advisors / intermediaries, we
specify UW, BigN and VC (Ljungqvist and Wilhelm 2003; Lowry and Schwert 2004; Edelin and
Kadlec 2005; and Brau and Fawcett 2006). Lastly, we also specify Ln(Age), HighTech and
Ln(Assets) as issuer characteristics (Lowry and Schwert 2004; Ljungqvist and Wilhelm 2003).
Overall, equation (2) provides a stringent benchmark against which to compare the inclusion of
our operating performance variables of interest in equations (3a), (3b) and (3c).
PriceRevision = β0 + β1MktReturn + β2MktReturn+ + β3IPOReturn + β4Retain% + β5SellingShr% + β6UW + β7BigN + β8VC + β9Ln(Proceeds) + β10NYSE/AMEX + β11Ln(Age) + β12HighTech + β13Ln(Assets) + εi,t (2)
Where: PriceRevision = (IPO price – mid-point of initial filing range) ÷ mid-point of initial filing range
15
MktReturn = Average return on all companies in CRSP in issuer’s Fama-French (1997) industry for the period from the date of issuer’s prospectus with the initial price range to IPO date
MktReturn+ = MktReturn when it is positive, and zero otherwise IPOReturn = Average initial return of IPOs from the date of issuer’s first prospectus to IPO date Retain% = One less (number of shares sold in IPO ÷ number of post-IPO shares outstanding) SellingShr% = Number of shares sold by selling shareholders ÷ number of shares sold in IPO UW = Underwriter rank (Carter, et al., 1998; and Loughran and Ritter 2004) BigN = One if IPO issuer has a BigN audit firm, and zero otherwise VC = One if IPO issuer has venture capital backing, and zero otherwise Ln(Proceeds) = Natural logarithm of IPO proceeds (inflation adjusted to 1983 dollard) per issuer’s prospectus
with the initial price range (i.e., midpoint of initial price range times number of shares filed) NYSE/AMEX = One if IPO is listed on the NYSE or AMEX, and zero otherwise Ln(Age) = Natural logarithm of one plus the number of years from year of company founding or
incorporation, if founding date is unavailable, to IPO year HighTech = One if IPO issuer is a high technology company per SDC, and zero otherwise Ln(Assets) = Natural logarithm of issuer’s pre-IPO total assets, in millions (inflation adjusted)
Column 4 of Table 4 panel A reports the results of estimating equation (2). The
explanatory power, an adjusted R2 of 12.7%, is between the 11% for Lowry and Schwert’s
(2004) 1985-1997 sample and the 22% for Ljungqvist and Wilhelm’s (2003) 1996-2000 sample.
As for covariates, consistent with the extant literature, the price revision to book-building market
returns is more complete when they are negative. MktReturn’s coefficient of 0.918 implies that a
market return during bookbuilding of –10% corresponds to a price revision of –9.18%. In
contrast, the coefficient on MktReturn+ of –0.752 suggests a book-building market return of
+10% corresponds to a price revision of +1.66% (0.918 – 0.752).10 Consistent with Habib and
Ljungqvist (2001) and Ljungqvist and Wilhelm (2003), the price revision to public information
from the primary market and for issuer incentives to bargain for a higher IPO price (IPOReturn
and SellingSh%, respectively), are both positive and significant. The coefficient on Retain% is
positive and significant, consistent with the view that the equity that entrepreneurs retain signals
their private information regarding firm value (Leland and Pyle 1977). As with Ljungqvist and
Wilhelm (2003) and Lowry and Schwert (2004), the coefficient on HighTech is positive and
significant. Lastly, consistent with its Table 2 correlation, the coefficient on Ln(Assets) is
positive and significant, though this association is not robust to specifying our operating
performance variables of interest in equations (3a), (3b) and (3c).
10 Edelen and Kadlec (2005) argue that this asymmetry, particularly the strength of the relation between negative market returns and price revision, is largely due to selection bias pertaining to an issuer’s option to withdraw.

16
We then augment equation (2) by specifying our three pre-IPO operating performance
variables in equations (3a), (3b) and (3c).
PriceRevision = β0 + β1OI/Assets + β2MktReturn + β3MktReturn+ + β4IPOReturn + β5Retain% + β6SellingShr% + β7UW + β8BigN + β9VC + β10Ln(Proceeds) + β11NYSE/AMEX + β12Ln(Age) + β13HighTech + β14Ln(Assets) + εi,t (3a)
PriceRevision = β0 + β1NI/Assets + β2MktReturn + β3MktReturn+ + β4IPOReturn + β5Retain% + β6SellingShr% + β7UW + β8BigN + β9VC + β10Ln(Proceeds) + β11NYSE/AMEX + β12Ln(Age) + β13HighTech + β14Ln(Assets) + εi,t (3b)
PriceRevision = β0 + β1OCF/Assets + β2MktReturn + β3MktReturn+ + β4IPOReturn + β5Retain% + β6SellingShr% + β7UW + β8BigN + β9VC + β10Ln(Proceeds) + β11NYSE/AMEX + β12Ln(Age) + β13HighTech + β14Ln(Assets) + εi,t (3c)
Columns 5 – 7 of Table 4 panel A present the results of estimating equations (3a), (3b)
and (3c). In each case, the coefficient on the pre-IPO operating performance variable remains
positive and significant and their specification substantially increases the explanatory power
above that of equation (2) (e.g., specifying OCF/Assets in equation (3c) increases the adjusted R2
from 12.7% for equation (2) to 19.5%).11. As with the univariate regressions, the coefficient on
OCF/Assets is the largest and most significant; and, at 0.147, implies a one standard deviation
change in OCF/Assets is associated with a 6.8% increase in PriceRevision (0.147 * 0.46012).13
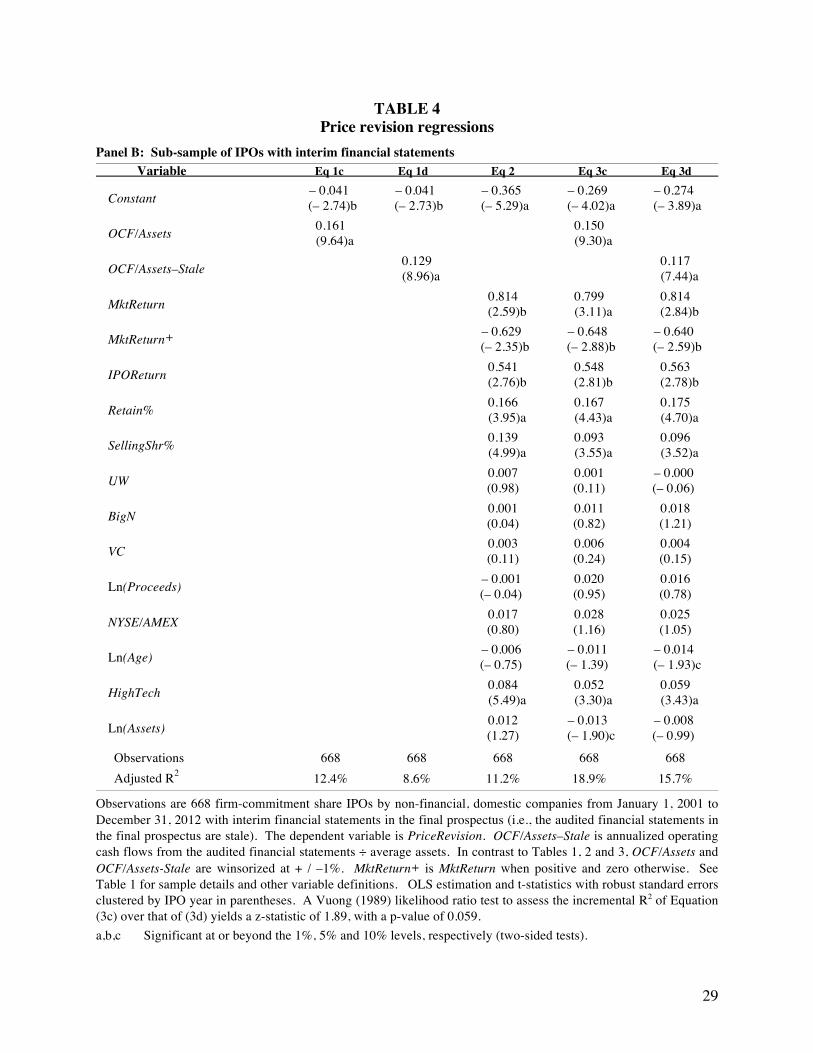
We also adopt an identification strategy to assess whether our results weaken upon
substituting older versions of our variables of interest. To do this, we restrict the sample for our
price revision regressions to the majority (668 of 824, 81%) of IPOs with both year-end and
interim financial statements in their final prospectus. These are issuers with year-end financial
statements that have gone ‘stale’, meaning the time period between the effective date of the
registration statement and financial statements exceeds 134 days (e.g., for a registrant with a 11 We also estimate equations (1a), (1b), (1c), (2), (3a), (3b) and (3c) via ordered probit using, in place of the continuous variable PriceRevision, the five categories of price revision we show in Table 7. The results of these estimations are very similar to those we provide in Table 4. 12 In contrast to the 0.757 in Table 1 panel B, the standard deviation for winsorized OCF/Assets is 0.460. 13 The findings in Table 3 and the positive coefficients on our pre-IPO operating performance variables contrasts with Roosenboom (2007), which finds French IPOs with higher ratios of forecasted earnings before interest and taxes to sales are associated with lower initial IPO price discounts.
17
December 31 year-end, this occurs at the close of business on May 14th). Given the strength of
OCF/Assets in Table 4, we table the results of estimating equations (1c), (3c) and (1d), (3d); the
latter two specify OCF/Assets–Stale, which we compute using the older, year-end statements.
PriceRevision = β0 + β1OCF/Assets–Stale + ε (1d)
PriceRevision = β0 + β1OCF/Assets–Stale + β2MktReturn + β3MktReturn+ + β4IPOReturn + β5Retain% + β6SellingShr% + β7UW + β8BigN + β9VC + β10Ln(Proceeds) + β11NYSE/AMEX + β12Ln(Age) + β13HighTech + β14Ln(Assets) + εi,t (3d)
Table 4 panel B reports the results. For both univariate and multivariate estimations, the
coefficient on OCF/Assets–Stale is smaller than that on OCF/Assets. For the multivariate
regressions, the coefficient on OCF/Assets is 0.150 (column four) whereas on OCF/Assets–Stale
it is 0.117 (column five); a decrease of 22%. In addition, the regression’s R2 decreases from
18.9% to 15.7% upon substituting OCF/Assets–Stale in place of OCF/Assets; a decrease of 16%.
A Vuong (1989) likelihood ratio test to assess the incremental R2 of Equation (3c) over that of
(3d) yields a z-statistic of 1.89, with a p-value of 0.059. These weaker results from specifying a
‘stale’ version of pre-IPO operating performance in place of the most-recent version provide
additional assurance of the positive association between operating performance and the revision
from mid-point of the initial price range to IPO offer price.
An alternative test of the association between pre-IPO operating performance and price
revision is to specify a series of indicator variables using the Table 2 (OI/Assets, NI/Assets and
OCF/Assets) decile in which a given IPO resides. In equations (4a), (4b) and (4c), we substitute
each variable of interest with a series of nine indicators (the intercept captures Decile 1). This
approach combines the descriptive statistics in Table 2 with the regressions in Table 4.
PriceRevision = β0 + β1OI/Assets–Decile2 + β2OI/Assets–Decile3 + β3OI/Assets–Decile4 + β4OI/Assets–Decile5 + β5OI/Assets–Decile6 + β6OI/Assets–Decile7 + β7OI/Assets–Decile8 + β8OI/Assets–Decile9 + β9OI/Assets–Decile10 + β10MktReturn + β11MktReturn+ + β12IPOReturn + β13Retain% + β14SellingShr% + β15UW + β16BigN + β17VC + β18Ln(Proceeds) + β19NYSE/AMEX + β20Ln(Age) + β21HighTech + β22Ln(Assets) + εi,t (4a)

18
PriceRevision = β0 + β1NI/Assets–Decile2 + β2NI/Assets–Decile3 + β3NI/Assets–Decile4 + β4NI/Assets–Decile5 + β5NI/Assets–Decile6 + β6NI/Assets–Decile7 + β7NI/Assets–Decile8 + β8NI/Assets–Decile9 + β9NI/Assets–Decile10 + β10MktReturn + β11MktReturn+ + β12IPOReturn + β13Retain% + β14SellingShr% + β15UW + β16BigN + β17VC + β18Ln(Proceeds) + β19NYSE/AMEX + β20Ln(Age) + β21HighTech + β22Ln(Assets) + εi,t (4b)
PriceRevision = β0 + β1OCF/Assets–Decile2 + β2OCF/Assets–Decile3 + β3OCF/Assets–Decile4 + β4OCF/Assets–Decile5 + β5OCF/Assets–Decile6 + β6OCF/Assets–Decile7 + β7OCFI/Assets–Decile8 + β8OCF/Assets–Decile9 + β9OCF/Assets–Decile10 + β10MktReturn + β11MktReturn+ + β12IPOReturn + β13Retain% + β14SellingShr% + β15UW + β16BigN + β17VC + β18Ln(Proceeds) + β19NYSE/AMEX + β20Ln(Age) + β21HighTech + β22Ln(Assets) + εi,t (4c)
Table 5 reports the results of estimating equation (4a) in panel A, equation (4b) in panel
B and equation (4c) in panel C. For presentation purposes, we show the results of the Table 4
panel A regression with the continuous version of each variable of interest (i.e., equations 3a, 3b
and 3c). We suppress the control variables results, though they are consistent with Table 4. In
general, across all three panels, the coefficients on the operating performance indicator variables
increase with decile rank. In addition, consistent with Brau and Fawcett’s (2006) CFO survey
response that “strong” historical earnings is the most important signal of quality an IPO issuer
can convey, for all estimations the coefficient on OCF/Assets–Decile10 is the most positive.
Overall, the results in Table 5 reinforce those in Tables 2, 3 and 4, and provide insight regarding
the linearity of the relation between pre-IPO operating performance and the IPO price revision.
Issuer operating performance and initial returns
In this section, we examine the relation between issuer pre-IPO operating performance
and initial returns (i.e., underpricing). As with the price revision regressions, we begin by
regressing winsorized versions of each pre-IPO operating performance measure on initial returns.
InitialReturn = β0 + β1OI/Assets + ε (5a)
InitialReturn = β0 + β1NI/Assets + ε (5b)
InitalReturn = β0 + β1OCF/Assets + ε (5c)
19
Where: InitialReturn = (Closing price on the first day of trading – IPO price) ÷ IPO price
Columns 1 – 3 of Table 6 reports the results of estimating equations (5a), (5b) and (5c).
As with the PriceRevision regressions in Table 4 Panel A, he coefficient for each measure of
issuer pre-IPO operating performance is positive and significant. However, in contrast to the
price revision estimations, the explanatory power of these underpricing regressions is
considerably lower. For example, whereas the adjusted R-squared from regressing OCF/Assets
on PriceRevision is 12.3%, it is just 4.3% upon regressing OCF/Assets on InitialReturn.
To specify a benchmark to assess the effect of issuer pre-IPO operating performance, we
estimate equation (6) by regressing the InitialReturn on the covariates in equation (2) plus the
price revision. As with regard to the relation between secondary market returns during book
building and the price revision, following Ljungqvist and Wilhelm (2003), we allow for an
asymmetric relation between the IPO price revision and initial returns.
InitialReturn = β0 + β1MktReturn + β2MktReturn+ + β3IPOReturn + β4Retain% + β5SellingShr% + β6UW + β7BigN + β8VC + β9Ln(Proceeds) + β10NYSE/AMEX + β11Ln(Age) + β12HighTech + β13Ln(Assets) + β14PriceRevision + β15PriceRevision+ + εi,t (6)
Where: PriceUpdate = (IPO price – mid-point of initial filing range) ÷ mid-point of initial filing range PriceUpdate+ = PriceUpdate when it is positive, and zero otherwise
Column 4 of Table 6 reports the results of estimating equation (6). The explanatory
power, an adjusted R2 of 39.3%, is consistent with literature that finds IPO underpricing is
predictable (e.g., Bradley and Jordan 2002). The positive coefficient on Retain% is consistent
with Leland and Pyle’s (1977) signaling story and Loughran and Ritter’s (2002) prediction that
IPOs that sell a smaller percentage ownership should be more underpriced.14 The positive
coefficients on PriceRevision and PriceRevision+, and that the latter is larger than the former, is
consistent with Ljungqvist and Wilhelm (2003). Whereas PriceRevision’s coefficient of 0.154
implies an IPO price adjustment of –10% corresponds to underpricing of –1.54%; the coefficient 14 The results in Table 6 are quantitatively very similar if we substitute a measure of ‘overhang’ (i.e., the ratio of shares retained to shares offered) in place of %Retain (see Bradley and Jordan, 2002).
20
on PriceRevision+ of 0.768 implies an IPO price adjustment of +10% corresponds to
underpricing of +9.22% (0.154 + 0.768).
We then augment equation (6) by specifying our three pre-IPO operating performance
variables of interest in equations (7a), (7b) and (7c).
InitialReturn = β0 + β1OI/Assets + β2MktReturn + β3MktReturn+ + β4IPOReturn + β5Retain% + β6SellingShr% + β7UW + β8BigN + β9VC + β10Ln(Proceeds) + β11NYSE/AMEX + β12Ln(Age) + β13HighTech + β14Ln(Assets) + β15PriceRevision + β16PriceRevision+ + εi,t (7a)
InitialReturn = β0 + β1NI/Assets + β2MktReturn + β3MktReturn+ + β4IPOReturn + β5Retain% + β6SellingShr% + β7UW + β8BigN + β9VC + β10Ln(Proceeds) + β11NYSE/AMEX + β12Ln(Age) + β13HighTech + β14Ln(Assets) + β15PriceRevision + β16PriceRevision+ + εi,t (7b)
InitialReturn = β0 + β1OCF/Assets + β2MktReturn + β3MktReturn+ + β4IPOReturn + β5Retain% + β6SellingShr% + β7UW + β8BigN + β9VC + β10Ln(Proceeds) + β11NYSE/AMEX + β12Ln(Age) + β13HighTech + β14Ln(Assets) + β15PriceRevision + β16PriceRevision+ + εi,t (7c)
Columns 5 – 7 of Table 6 present the results of estimating equations (7a), (7b) and (7c).
While the coefficients on OI/Assets, NI/Assets and OCF/Assets remain positive and significant,
specifying these variables results in small increases in explanatory power versus the equation (2)
benchmark (e.g., specifying OI/Assets in equation (7a) increases the adjusted R-squared from
39.3% for equation (6) to 40.0%). We conclude that to the extent pre-IPO performance
influences IPO price formation, it is primarily with respect to the change from the mid-point of
the initial price range to IPO offer price and not from IPO offer price to the first closing price.
Why might issuers with strong operating performance go along with a partial adjustment?
While our findings are consistent with Brau and Fawcett’s (2006) CFO survey response
that “having strong historical earnings” is an important signal of IPO quality to investors, they
beg the question of why such issuers seem to acquiesce to a partial upward adjustment of offer
price. To examine this, we follow Loughran and Ritter (2002) and compare the amount of
money left-on-the-table with the change in wealth for pre-IPO shareholders. Two components
21
comprise this wealth revaluation: the change from mid-point of the initial price range to offer
price for secondary shares that shareholders sell at the IPO; plus the change from mid-point of
the initial price range to closing price on the first trading day for shares that shareholders retain.
Table 7 sorts our sample by decile of pre-IPO operating cash flow to average assets
(OCF/Assets).15 In addition to mean and median PriceRevision and InitialReturn (which we
repeat from Table 3 panel C), Table 7 shows underwriter rank (UW) and the fraction of IPOs in
each decile with an IPO offer price: below the minimum of the initial price range (Below Min);
between the minimum and mid-point of the initial price range (Min to Mid); at the mid-point of
the initial price range (At Mid); between midpoint and maximum of the initial price range (Mid
to Max); and above the maximum of the initial price range (Above Max). Overall, 36.4% and
24.2% of our 2001–2012 IPOs have offer prices below the minimum and above the maximum of
the initial price range, respectively; versus 27.3% and 24.3%, respectively, for Loughran and
Ritter’s (2002) 1990–1998 IPOs. Lastly, Table 7 also shows the final IPO proceeds (this differs
from our Proceeds variable, which is inflation-adjusted proceeds per the initial prospectus), as
well as the amount of money left-on-the-table and pre-issue shareholder wealth revaluation.
The majority (57.3%) of IPOs in Decile 1 (i.e., lowest pre-IPO operating cash flow to
assets) have offer prices below the minimum of the initial price range. On average (median),
these IPOs raise $59.3 ($49.1) million, leave just $3.2 ($0.2) million on the table and have
revaluations of –$28.6 (–$29.4) million. In the framework of Loughran and Ritter (2002), this is
consistent with issuers aggressively bargaining at the pricing meeting because the wealth losses
they suffer leave them unwilling to acquiesce to underpricing.
In contrast, the offer price formation is much different for IPOs in Decile 10 (i.e., highest
pre-IPO operating cash flow to assets). The majority (56.1%) of these IPOs have offer prices
above the maximum of the initial price range. On average (median), these IPOs raise $155.9
($93.4) million, leave $42.7 ($21.9) million on the table and have revaluations of $222.7 ($94.1)
15 Sorting by OI/Assets and NI/Assets produces results similar to those we provide in Table 7.

22
million (i.e., the revaluation in pre-issue shareholders’ wealth exceeds the money left on the table
by four-to-five orders of magnitude). In the context of Loughran and Ritter (2002), this is
consistent with issuers agreeing to a partial price adjustment because the wealth gains they enjoy
leave them willing to acquiesce to underpricing. As such, one explanation for why issuers go
along with a partial adjustment in response to strong demand is they anchor on the mid-point of
the initial price range and offset the company’s loss of proceeds with their psychic wealth gain.16
V. SUMMARY
In this paper, we extend the study of the association between public information and IPO
price formation by examining Brau and Fawcett’s (2006) CFO survey response that “having
strong historical earnings” is the most important signal of quality an issuer can convey. For a
sample of 2001–2012 IPOs, we find measures of pre-IPO operating performance explain a
substantial portion of the variation in the revision from the mid-point of the initial price range to
the offer price. That is, post-bubble, the partial adjustment phenomenon concentrates among
issuers with pre-IPO strong performance; whereas for issuers with weak performance, the
downward price adjustment is nearly full. As for why issuers with strong performance seem to
acquiesce to a partial increase in offer price, these IPOs have the largest wealth gains from shares
sold / retained upon going public. Our findings are consistent with Loughran and Ritter’s (2002)
prediction of partial (almost full) adjustment to favorable (unfavorable) public information and
suggest an important role for historical accounting information in the pricing of book-built IPOs.
16 “The IPOs leaving a lot of money on the table are those where the offer price is revised upward from what had been anticipated at the time of distributing the preliminary prospectus. The offer price is increased in response to indications of strong demand, but it could have been increased even further. Thus at the same time that underpricing is diluting the preissue shareholders of these firms, these shareholders are receiving the good news that their wealth is much higher than they had anticipated … We are arguing that when unexpectedly strong demand becomes apparent during the preselling period, issuing firms acquiesce in leaving more money on the table. When demand is unexpectedly weak, issuing firms negotiate more aggressively, leaving little money on the table.” (Loughran and Ritter 2002, p. 414, 416)

23
REFERENCES
Baron, D. 1982. A model of the demand for investment banking advising and distribution services for new issues. The Journal of Finance 37, 955-976.
Bartov, E., Mohanram, P. and C. Seethamraju. 2002. Valuation of Internet stocks–An IPO perspective. Journal of Accounting Research 40, 321-346.
Benveniste, L. M. and P. A. Spindt. 1989. How investment bankers determine the offer price and allocation of new issues. Journal of Financial Economics 24, 213-232.
Benveniste, L. M. and W. J. Wilhelm. 1990. A comparative analysis of IPO proceeds under alternative regulatory environments. Journal of Financial Economics 28, 173-207.
Berger, P. G. 2002. Discussion of Valuation of Internet stocks–An IPO perspective. Journal of Accounting Research 40, 321-346.
Bradley, D. and B. Jordan. 2002. Partial adjustment to public information and IPO underpricing. Journal of Financial and Quantitative Analysis 37, 595-616.
Brau, J. C. and S. Fawcett. 2006. Initial public offerings: An analysis of theory and practice. The Journal of Finance 61, 399-436.
Chemanmanur, T. J. 1993. The pricing of initial public offerings: A dynamic model with information production. The Journal of Finance 48, 285-304.
Cornelli, F. and D. Goldreich. 2001. Bookbuilding and strategic allocation. The Journal of Finance 56, 2337-2369.
Daniel, K. 2002. Discussion of “Why don’t issuers get upset about leaving money on the table in IPOs?” Review of Financial Studies 15, 445-454.
Degeorge, F., Derrien, F. and K. L. Womack 2010. Auctioned IPOs: The US evidence. Journal of Financial Economics 98, 177-194.
Edelen, R. M. and G. B. Kadlec. 2005. Issuer surplus and the partial adjustment of IPO prices to public information. Journal of Financial Economics 77, 347-373.
Fama, E. F. and K. R. French. 2007. Industry costs of equity. Journal of Financial Economics 43, 153-194.
Habib, M. A. and A. P. Ljungqvist. 2001. Underpricing and entrepreneurial wealth losses in IPOs: Theory and Evidence. The Review of Financial Studies 14, 433-458.
Hanley, K. W. 1993. The underpricing of initial public offerings and the partial adjustment phenomenon. Journal of Financial Economics 34, 231-250.
24
Kahneman, D. and A. Tversky. 1979. Prospect theory: An analysis of decision under risk. Econometrica 47, 263-291.
Kim, M. and J. R. Ritter. 1999. Valuing IPOs. Journal of Financial Economics 53, 409-437.
Klein, A. 1996. Can investors use the prospectus to price initial public offerings? The Journal of Financial Statement Analysis 2, 23-39.
Leland, H. and D. Pyle. 1977. Informational asymmetries, financial structure and financial intermediation. The Journal of Finance 32, 371-387.
Loughran, T. and J. R. Ritter. 2002. Why don’t issuers get upset about leaving money on the table in IPOs? Review of Financial Studies 15, 413-443.
Loughran, T. and J. R. Ritter. 2004. Why has IPO underpricing changed over time? Financial Management 33, 5-37.
Lowry, M. and W. Schwert. 2004. Is the IPO pricing process efficient? Journal of Financial Economics 71, 3-26.
Ljungqvist, A. P. and W. J. Wilhelm, Jr. 2002. IPO allocations: Discriminatory or discretionary? Journal of Financial Economics 65, 167-201.
Ljungqvist, A. P. and W. J. Wilhelm, Jr. 2003. IPO pricing in the Dot-com bubble. The Journal of Finance 58, 723-752.
Ritter, J. R. 1984. The ‘hot issue’ market of 1980. Journal of Business 57, 215-240.
Ritter, J. R. and I. Welch. 2002. A review of IPO activity, pricing, and allocations. The Journal of Finance 57, 1795-1828.
Roosenboom, P. 2007. How do underwriters value initial public offerings? An empirical analysis of the French IPO market. Contemporary Accounting Research 24, 1217-1243.
Sherman, A. 2000. IPOs and long-term relationships: An advantage of book building. Review of Financial Studies 13, 697-714.
Sherman, A. 2005. Global trends in IPO methods: Book building versus auctions with endogenous entry. Journal of Financial Economics 78, 615-649.
Sherman, A. and S. Titman. 2002. Building the IPO order book: Underpricing and participation limits with costly information. Journal of Financial Economics 65, 3-29.
Vuong, Q. 1989. Likelihood ratio tests for model selection and non-nested hypotheses. Econometrica 57, 307-333.
Yung, C. 2005. IPOs with buy- and sell-side information production: The dark side of open sales. Review of Financial Studies 18, 327-347.
25
TABLE 1 Sample and descriptive statistics
Panel A: Sample Firm commitment IPOs by stand-alone domestic companies: January 2001 – December 2012 1,826 Less: Financial registrants (SIC 6xxx) 790 Unit IPOs 113 Necessary financial statement information not available 71 IPOs issued via auction mechanism 15 IPOs with # days from initial filing range date to IPO date exceeds 365 7 IPOs with initial filing range mid-point ≤ $5.00 6 Sample 824 Panel B: Descriptive Statistics (n = 824)
Variable Mean Median MidQRange Standard Deviation PriceRevision –0.052 0.000 –0.056 0.219 InitialReturn 0.132 0.083 0.113 0.193 OI/Assets –0.144 0.053 –0.071 0.655 NI/Assets –0.241 0.006 –0.122 0.998 OCF/Assets –0.091 0.049 –0.004 0.757 MktReturn 0.017 0.012 0.012 0.079 IPOReturn 0.116 0.111 0.114 0.047 Retain% 0.710 0.735 0.725 0.139 SellingShr% 0.167 0.000 0.141 0.253 UW 8.220 9.000 8.500 1.485 BigN 0.859 1.000 1.000 0.348 VC 0.527 1.000 0.500 0.500 Proceeds 82.175 44.285 58.798 182.945 NYSE/AMEX 0.296 0.000 0.500 0.457 Age 18.740 10.000 12.750 23.539 HighTech 0.278 0.000 0.500 0.448 Assets 234.082 45.413 92.313 694.186
Variables are as follows: PriceUpdate = (IPO price – mid-point of initial filing range) ÷ mid-point of initial filing range InitialReturn = (Closing price on first day of trading – IPO price) ÷ IPO price OIAssets = Annualized operating income per most-recent pre-IPO financial statements ÷ Average assets NI/Assets = Annualized net income per most-recent pre-IPO financial statements ÷ Average assets OCF/Assets = Annualized operating cash flow per most-recent pre-IPO financial statements ÷ Average assets MktReturn = Average return on all companies in CRSP in issuer’s Fama-French (1997) industry for the
period from the date of issuer’s prospectus with the initial price range to IPO date IPOReturn = Average initial return of IPOs between date of issuer’s first prospectus and IPO date Retain% = One – (number of shares sold in IPO ÷ number of post-IPO shares outstanding) SellingShr% = Number of shares sold by selling shareholders ÷ number of shares sold in IPO UW = Underwriter rank (Carter, et al., 1998; and Loughran and Ritter 2004) BigN = One if IPO issuer has a Big5 or Big4 audit firm, and zero otherwise VC = One if IPO issuer has venture capital backing, and zero otherwise Proceeds = IPO proceeds per issuer’s initial prospectus, in millions (inflation adjusted to 1983 dollars),
excluding the exercise of overallotment options NYSE/AMEX = One if IPO is listed on the NYSE or AMEX, and zero otherwise Age = Years from founding or incorporation, if founding date is unavailable, to IPO year HighTech = One if IPO issuer is a high technology company per SDC, and zero otherwise Assets = Issuer’s pre-IPO total assets, in millions (inflation adjusted to 1983 dollars)
26
TABLE 2 Correlations
Price Revision
Initial Return
OI/ Assets
NI/ Assets
OCF/ Assets
Mkt Return
IPO Return
Retain%
Selling Shr%
UW Rank
BigN
VC
Ln Proceeds
NYSE/ AMEX
Ln Age
High Tech
Ln Assets
PriceRevision 0.557 0.291 0.309 0.323 0.153 0.105 0.142 0.232 0.187 0.057 0.005 0.133 0.102 0.010 0.212 0.130 InitialReturn 0.529 0.203 0.211 0.221 0.122 0.079 0.195 0.137 0.126 0.056 0.124 -0.000 -0.013 -0.045 0.171 -0.002 OI/Assets 0.275 0.165 0.930 0.690 0.057 -0.052 -0.105 0.437 0.111 0.005 -0.369 0.313 0.229 0.388 0.058 0.393 NI/Assets 0.175 0.120 0.835 0.682 0.067 -0.076 -0.045 0.438 0.113 0.013 -0.316 0.270 0.216 0.340 0.094 0.363 OCF/Assets 0.238 0.140 0.808 0.904 0.037 -0.025 0.016 0.369 0.173 0.060 -0.213 0.255 0.193 0.227 0.175 0.329 MktReturn 0.113 0.081 -0.008 -0.028 -0.028 0.015 -0.103 -0.026 -0.087 -0.029 -0.095 -0.034 0.042 -0.025 -0.039 -0.013 IPOReturn 0.121 0.094 -0.039 -0.014 -0.007 0.083 0.085 -0.092 0.027 0.004 0.110 0.001 -0.041 -0.042 0.039 -0.004 Retain% 0.113 0.221 -0.056 -0.008 0.020 -0.114 0.092 -0.128 0.204 0.066 0.269 -0.044 -0.011 -0.188 0.207 -0.002 SellingShr% 0.158 0.048 0.293 0.201 0.196 -0.037 -0.091 -0.170 0.179 0.033 -0.189 0.314 0.193 0.246 0.126 0.271 UWRank 0.137 0.142 0.284 0.312 0.258 -0.115 -0.013 0.089 0.187 0.371 0.066 0.539 0.282 0.065 0.081 0.449 BigN 0.047 0.043 0.054 0.116 0.094 -0.019 -0.011 0.026 0.057 0.473 0.175 0.214 -0.005 0.022 0.064 0.163 VC -0.016 0.158 -0.229 -0.102 -0.103 -0.089 0.112 0.275 -0.246 0.125 0.175 -0.362 -0.349 -0.430 0.176 -0.453 LnProceeds 0.117 -0.023 0.326 0.277 0.238 -0.039 -0.024 -0.148 0.335 0.572 0.274 -0.293 0.476 0.301 -0.144 0.811 NYSE/AMEX 0.114 -0.024 0.188 0.120 0.136 0.024 -0.024 -0.063 0.245 0.154 -0.005 -0.349 0.438 0.269 -0.100 0.514 LnAge 0.018 -0.096 0.296 0.202 0.168 -0.029 -0.073 -0.170 0.240 0.114 0.040 -0.443 0.317 0.289 -0.080 0.397 HighTech 0.212 0.185 0.101 0.077 0.110 -0.070 0.068 0.183 0.046 0.073 0.064 0.176 -0.116 -0.100 -0.120 -0.142 LnAssets 0.144 -0.035 0.478 0.403 0.356 -0.010 -0.033 -0.095 0.104 0.491 0.208 -0.400 0.827 0.512 0.440 -0.132 Observations are 824 firm-commitment share IPOs by non-financial, domestic companies from January 1, 2001 to December 31, 2012. See Table 1 for sample details and variable definitions. Pearson (Spearman) correlations are below (above) the diagonal. To accord with our regression specifications, we show correlations for the natural log of Proceeds, Age and Assets. However, in contrast to our regression specifications (for which we winsorize, at +0.5% and –0.5%, our operating performance variables of interest), we show correlations for un-winsorized versions OI/Assets, NI/Assets and OCF/Assets.
27
TABLE 3 IPO price revision and initial return – by decile of pre-IPO operating performance measure
Panel A: Panel B: Panel C: Decile sort by OI/Assets Decile sort by NI/Assets Decile sort by OCF/Assets
Decile
OI / Assets
Price Revision
Initial Return
NI / Assets
Price Revision
Initial Return
OCF / Assets
Price Revision
Initial Return
1 mean median
–1.581 –1.306
–0.229 –0.218
0.045 0.005 –1.976
–1.349 –0.212 –0.200
0.064 0.011 –1.406
–0.960 –0.232 –0.218
0.042 0.005
2 mean median
–0.619 –0.595
–0.133 –0.077
0.122 0.036 –0.668
–0.626 –0.135 –0.083
0.100 0.020 –0.512
–0.510 –0.147 –0.176
0.099 0.035
3 mean median
–0.286 –0.291
–0.042 –0.065
0.138 0.100 –0.325
–0.324 –0.049
0.000 0.159 0.100 –0.185
–0.167 –0.074 –0.073
0.135 0.093
4 mean median
–0.061 –0.047
–0.062 –0.067
0.154 0.063 –0.100
–0.092 –0.100 –0.125
0.106 0.051 –0.044
–0.043 –0.028
0.000 0.146 0.121
5 mean median
0.027 0.027
–0.054 –0.068
0.129 0.077 –0.011
–0.007 –0.050 –0.043
0.103 0.033 0.025
0.026 –0.046
0.000 0.120 0.064
6 mean median
0.070 0.070
–0.014 0.000
0.093 0.044 0.018
0.019 –0.015
0.000 0.127 0.122 0.068
0.068 –0.052 –0.037
0.086 0.045
7 mean median
0.106 0.107
–0.003 0.000
0.118 0.087 0.043
0.041 –0.005
0.000 0.135 0.066 0.107
0.105 –0.010
0.000 0.155 0.125
8 mean median
0.150 0.149
–0.028 0.000
0.138 0.131 0.081
0.080 0.006 0.039
0.144 0.121 0.161
0.159 –0.024
0.000 0.122 0.096
9 mean median
0.233 0.232
–0.002 0.048
0.164 0.119 0.142
0.136 –0.004
0.000 0.159 0.121 0.257
0.255 0.035 0.053
0.171 0.151
10 mean median
0.516 0.435
0.050 0.067
0.218 0.188 0.382
0.306 0.046 0.069
0.223 0.176 0.622
0.498 0.061 0.097
0.242 0.217
Total mean median
–0.144 0.053
–0.052 0.000
0.132 0.083
–0.241 0.006
–0.052 0.000
0.132 0.083
–0.091 0.049
–0.052 0.000
0.132 0.083
Observations are 824 firm-commitment share IPOs by non-financial, domestic companies from January 1, 2001 to December 31, 2012. See Table 1 for sample details and variable definitions.
28
TABLE 4 Price revision regressions
Panel A: Full-sample
Variable Eq 1a Eq 1b Eq 1c Eq 2 Eq 3a Eq 3b Eq 3c
Constant – 0.035 (– 2.77)b
– 0.030 (– 2.37)b
– 0.040 (– 3.25)a
– 0.350 (– 4.92)a
– 0.271 (– 3.84)a
– 0.272 (– 3.64)a
– 0.272 (– 4.11)a
OI/Assets 0.130 (10.81)a
0.123 (6.43)a
NI/Assets 0.105 (9.50)a
0.092 (5.58)a
OCF/Assets 0.167 (14.05)a
0.147 (11.85)a
MktReturn 0.918 (3.09)a
0.916 (3.31)a
0.915 (3.39)a
0.924 (3.99)a
MktReturn+ – 0.752 (– 2.47)b
– 0.783 (– 2.57)b
– 0.762 (– 2.63)b
– 0.787 (– 3.06)b
IPOReturn 0.524 (2.58)b
0.544 (2.80)b
0.541 (2.88)b
0.532 (2.71)b
Retain% 0.168 (4.01)a
0.190 (4.42)a
0.185 (4.08)a
0.170 (4.26)a
SellingShr% 0.112 (4.14)a
0.064 (2.02)c
0.077 (2.65)b
0.068 (2.73)b
UW 0.008 (1.16)
0.001 (0.15)
0.001 (0.13)
0.002 (0.31)
BigN – 0.008 (– 0.61)
0.009 (0.69)
0.004 (0.32)
0.003 (0.24)
VC – 0.001 (– 0.04)
0.008 (0.45)
0.001 (0.04)
0.004 (0.21)
Ln(Proceeds) – 0.008 (– 0.36)
0.014 (0.59)
0.013 (0.55)
0.012 (0.54)
NYSE/AMEX 0.024 (1.30)
0.035 (1.80)c
0.036 (1.87)c
0.030 (1.48)
Ln(Age) – 0.008 (– 1.15)
– 0.016 (– 2.76)b
– 0.012 (– 2.01)c
– 0.012 (– 1.90)c
HighTech 0.101 (6.84)a
0.074 (5.14)a
0.081 (6.07)a
0.069 (5.10)a
Ln(Assets) 0.017 (2.00)c
– 0.007 (– 0.68)
– 0.005 (– 0.55)
– 0.006 (– 0.65)
Observations 824 824 824 824 824 824 824 Adjusted R2 10.0% 7.9% 12.3% 12.7% 18.4% 16.5% 19.5%
Observations are 824 firm-commitment share IPOs by non-financial, domestic companies from January 1, 2001 to December 31, 2012. The dependent variable is PriceRevision. In contrast to Tables 1, 2 and 3, OI/Assets, NI/Assets and OCF/Assets are winsorized at + / –1%. MktReturn+ is MktReturn when positive and zero otherwise. See Table 1 for sample details and other variable definitions. OLS estimation and t-statistics with robust standard errors clustered by IPO year in parentheses. a,b,c Significant at or beyond the 1%, 5% and 10% levels, respectively (two-sided tests).
29
TABLE 4 Price revision regressions
Panel B: Sub-sample of IPOs with interim financial statements
Variable Eq 1c Eq 1d Eq 2 Eq 3c Eq 3d
Constant – 0.041 (– 2.74)b
– 0.041 (– 2.73)b
– 0.365 (– 5.29)a
– 0.269 (– 4.02)a
– 0.274 (– 3.89)a
OCF/Assets 0.161 (9.64)a
0.150 (9.30)a
OCF/Assets–Stale 0.129 (8.96)a
0.117 (7.44)a
MktReturn 0.814 (2.59)b
0.799 (3.11)a
0.814 (2.84)b
MktReturn+ – 0.629 (– 2.35)b
– 0.648 (– 2.88)b
– 0.640 (– 2.59)b
IPOReturn 0.541 (2.76)b
0.548 (2.81)b
0.563 (2.78)b
Retain% 0.166 (3.95)a
0.167 (4.43)a
0.175 (4.70)a
SellingShr% 0.139 (4.99)a
0.093 (3.55)a
0.096 (3.52)a
UW 0.007 (0.98)
0.001 (0.11)
– 0.000 (– 0.06)
BigN 0.001 (0.04)
0.011 (0.82)
0.018 (1.21)
VC 0.003 (0.11)
0.006 (0.24)
0.004 (0.15)
Ln(Proceeds) – 0.001 (– 0.04)
0.020 (0.95)
0.016 (0.78)
NYSE/AMEX 0.017 (0.80)
0.028 (1.16)
0.025 (1.05)
Ln(Age) – 0.006 (– 0.75)
– 0.011 (– 1.39)
– 0.014 (– 1.93)c
HighTech 0.084 (5.49)a
0.052 (3.30)a
0.059 (3.43)a
Ln(Assets) 0.012 (1.27)
– 0.013 (– 1.90)c
– 0.008 (– 0.99)
Observations 668 668 668 668 668 Adjusted R2 12.4% 8.6% 11.2% 18.9% 15.7%
Observations are 668 firm-commitment share IPOs by non-financial, domestic companies from January 1, 2001 to December 31, 2012 with interim financial statements in the final prospectus (i.e., the audited financial statements in the final prospectus are stale). The dependent variable is PriceRevision. OCF/Assets–Stale is annualized operating cash flows from the audited financial statements ÷ average assets. In contrast to Tables 1, 2 and 3, OCF/Assets and OCF/Assets-Stale are winsorized at + / –1%. MktReturn+ is MktReturn when positive and zero otherwise. See Table 1 for sample details and other variable definitions. OLS estimation and t-statistics with robust standard errors clustered by IPO year in parentheses. A Vuong (1989) likelihood ratio test to assess the incremental R2 of Equation (3c) over that of (3d) yields a z-statistic of 1.89, with a p-value of 0.059. a,b,c Significant at or beyond the 1%, 5% and 10% levels, respectively (two-sided tests).
30
TABLE 5 Price revision regressions – pre-IPO operating performance measure by decile ranking
Panel A: OI/Assets Panel B: NI/Assets Panel C: OCF/Assets
Variable Eq 3a Eq 4a Eq 3b Eq 4b Eq 3c Eq 4c
Constant – 0.271 (– 3.84)a
– 0.457 (– 6.85)a Constant – 0.272
(– 3.64)a – 0.453 (– 6.71)a Constant – 0.272
(– 4.11)a – 0.453 (– 6.51)a
OI/Assets 0.123 (6.43)a
NI/Assets 0.092 (5.58)a
OCF/Assets 0.147 (11.85)a
OI/Assets–Decile2 0.088 (2.25)b NI/Assets–Decile2 0.064
(1.64) OCF/Assets–Decile2 0.082 (2.47)b
OI/Assets–Decile3 0.160 (5.06)a NI/Assets–Decile3 0.135
(4.84)a OCF/Assets–Decile3 0.136 (4.68)a
OI/Assets–Decile4 0.135 (3.25)a NI/Assets–Decile4 0.087
(2.21)b OCF/Assets–Decile4 0.192 (5.23)a
OI/Assets–Decile5 0.168 (6.16)a NI/Assets–Decile5 0.149
(6.29)a OCF/Assets–Decile5 0.167 (5.16)a
OI/Assets–Decile6 0.209 (6.24)a NI/Assets–Decile6 0.186
(7.05)a OCF/Assets–Decile6 0.167 (4.54)a
OI/Assets–Decile7 0.230 (8.10)a NI/Assets–Decile7 0.191
(6.08)a OCF/Assets–Decile7 0.204 (5.03)a
OI/Assets–Decile8 0.214 (6.81)a NI/Assets–Decile8 0.223
(7.41)a OCF/Assets–Decile8 0.181 (5.99)a
OI/Assets–Decile9 0.208 (6.15)a NI/Assets–Decile9 0.179
(5.69)a OCF/Assets–Decile9 0.237 (8.00)a
OI/Assets–Decile10 0.265 (6.22)a NI/Assets–Decile10 0.226
(4.68)a OCF/Assets–Decile10 0.250 (9.30)a
Control variables Yes Yes Control variables Yes Yes Control variables Yes Yes Observations 824 824 Observations 824 824 Observations 824 824 Adjusted R2 18.4% 19.2% Adjusted R2 16.5% 18.8% Adjusted R2 19.5% 19.6%
Observations are 824 firm-commitment share IPOs by non-financial, domestic companies from January 1, 2001 to December 31, 2012. The dependent variable is PriceRevision. In contrast to Tables 1, 2 and 3, OI/Assets, NI/Assets and OCF/Assets are winsorized at + / –1%. For each operating performance variable (OI/Assets, NI/Assets and OCF/Assets), we specify indicator variables for whether the IPO sorts into a given decile in Table 3 (e.g., OI/Assets-Decile2 equals one if an IPO is in the second decile of OI/Assets in Table 3). Control variables are as in Table 4. See Table 1 for sample details and other variable definitions. OLS estimation and t-statistics with robust standard errors clustered by IPO year in parentheses. a,b,c Significant at or beyond the 1%, 5% and 10% levels, respectively (two-sided tests).

31
TABLE 6 Initial returns regressions
Variable Eq 5a Eq 5b Eq 5c Eq 6 Eq 7a Eq 7b Eq 7c
Constant 0.140 (15.52)a
0.144 (16.40)a
0.138 (15.23)a
– 0.048 (– 0.76)
– 0.029 (– 0.44)
– 0.024 (– 0.36)
– 0.035 (– 0.51)
OI/Assets 0.064 (9.96)a
0.041 (2.80)b
NI/Assets 0.056 (10.45)a
0.035 (2.90)b
OCF/Assets 0.088 (8.70)a
0.038 (2.08)c
MktReturn 0.182 (1.05)
0.202 (1.14)
0.197 (1.14)
0.203 (1.21)
MktReturn+ – 0.077 (– 0.42)
– 0.104 (– 0.53)
– 0.094 (– 0.50)
– 0.102 (– 0.56)
IPOReturn 0.069 (0.62)
0.087 (0.83)
0.084 (0.78)
0.082 (0.75)
Retain% 0.128 (3.78)a
0.139 (4.14)a
0.138 (4.08)a
0.133 (3.95)a
SellingShr% 0.031 (1.30)
0.017 (0.65)
0.019 (0.77)
0.021 (0.84)
UW 0.015 (2.10)c
0.013 (1.77)
0.012 (1.72)
0.014 (1.85)c
BigN – 0.029 (– 1.59)
– 0.024 (– 1.31)
– 0.025 (– 1.39)
– 0.027 (– 1.48)
VC 0.018 (1.20)
0.021 (1.37)
0.019 (1.24)
0.020 (1.29)
Ln(Proceeds) – 0.015 (– 1.34)
– 0.008 (– 0.68)
– 0.007 (– 0.60)
– 0.010 (– 0.86)
NYSE/AMEX – 0.006 (– 0.32)
– 0.002 (– 0.11)
– 0.001 (– 0.05)
– 0.004 (– 0.21)
Ln(Age) 0.000 (0.04)
– 0.003 (– 0.51)
– 0.002 (– 0.31)
– 0.001 (– 0.18)
HighTech 0.008 (0.48)
0.001 (0.05)
0.002 (0.11)
0.001 (0.08)
Ln(Assets) – 0.003 (– 0.32)
– 0.010 (– 1.10)
– 0.011 (– 1.15)
– 0.008 (– 0.88)
PriceRevision 0.154 (3.54)a
0.131 (3.16)a
0.138 (3.32)a
0.134 (3.38)a
PriceRevision+ 0.768 (4.84)a
0.769 (5.00)a
0.765 (4.98)a
0.766 (4.92)a
Observations 824 824 824 824 824 824 824 Adjusted R2 3.0% 2.9% 4.3% 39.3% 40.0% 39.9% 39.8%
Observations are 824 firm-commitment share IPOs by non-financial, domestic companies from January 1, 2001 to December 31, 2012. The dependent variable is InitialReturn. In contrast to Tables 1, 2 and 3, OI/Assets, NI/Assets and OCF/Assets are winsorized at + / –1%. MktReturn+ is MktReturn when positive and zero otherwise. PriceRevision+ is PriceRevision when positive and zero otherwise. See Table 1 for sample details and other variable definitions. OLS estimation and t-statistics with robust standard errors clustered by IPO year in parentheses. a,b,c Significant at or beyond the 1%, 5% and 10% levels, respectively (two-sided tests).
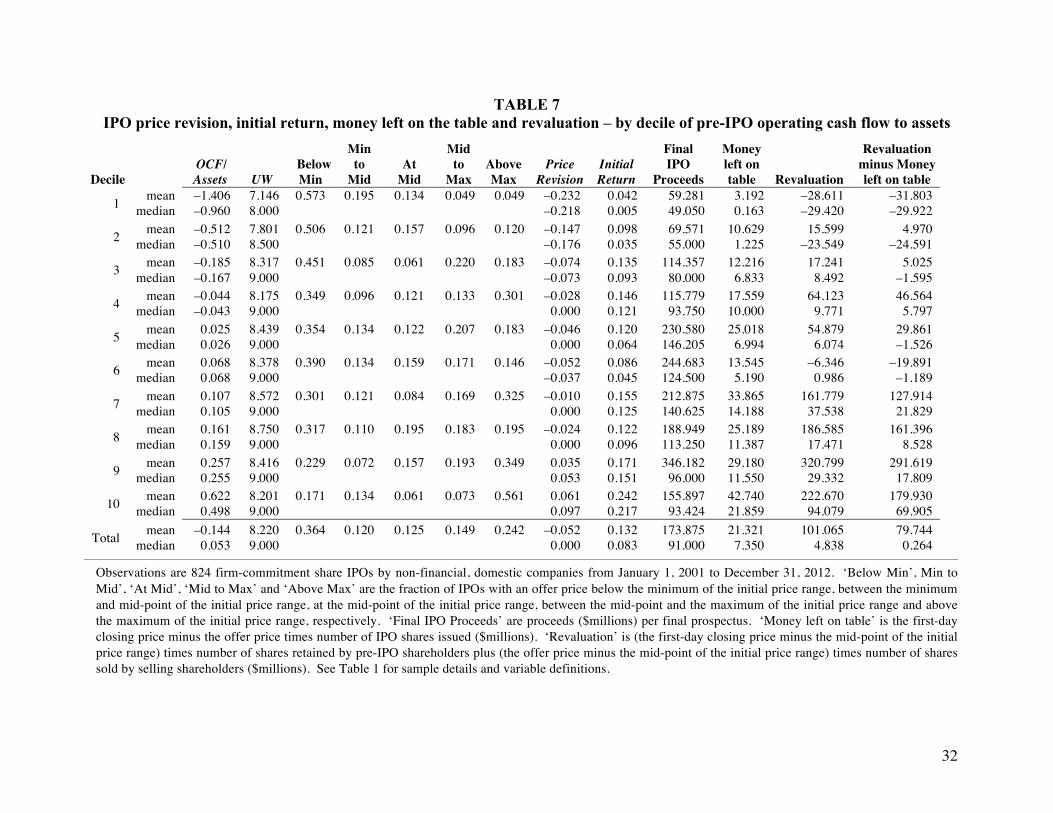
32
TABLE 7 IPO price revision, initial return, money left on the table and revaluation – by decile of pre-IPO operating cash flow to assets
Decile
OCF/ Assets
UW
Below Min
Min to
Mid
At
Mid
Mid to
Max
Above Max
Price
Revision
Initial Return
Final IPO
Proceeds
Money left on table
Revaluation
Revaluation minus Money left on table
1 mean median
–1.406 –0.960
7.146 8.000
0.573 0.195 0.134 0.049 0.049 –0.232 –0.218
0.042 0.005
59.281 49.050
3.192 0.163
–28.611 –29.420
–31.803 –29.922
2 mean median
–0.512 –0.510
7.801 8.500
0.506 0.121 0.157 0.096 0.120 –0.147 –0.176
0.098 0.035
69.571 55.000
10.629 1.225
15.599 –23.549
4.970 –24.591
3 mean median
–0.185 –0.167
8.317 9.000
0.451 0.085 0.061 0.220 0.183
–0.074 –0.073
0.135 0.093
114.357 80.000
12.216 6.833
17.241 8.492
5.025 –1.595
4 mean median
–0.044 –0.043
8.175 9.000
0.349 0.096 0.121 0.133 0.301 –0.028 0.000
0.146 0.121
115.779 93.750
17.559 10.000
64.123 9.771
46.564 5.797
5 mean median
0.025 0.026
8.439 9.000
0.354 0.134 0.122 0.207 0.183 –0.046 0.000
0.120 0.064
230.580 146.205
25.018 6.994
54.879 6.074
29.861 –1.526
6 mean median
0.068 0.068
8.378 9.000
0.390 0.134 0.159 0.171 0.146 –0.052 –0.037
0.086 0.045
244.683 124.500
13.545 5.190
–6.346 0.986
–19.891 –1.189
7 mean median
0.107 0.105
8.572 9.000
0.301 0.121 0.084 0.169 0.325 –0.010 0.000
0.155 0.125
212.875 140.625
33.865 14.188
161.779 37.538
127.914 21.829
8 mean median
0.161 0.159
8.750 9.000
0.317 0.110 0.195 0.183 0.195 –0.024 0.000
0.122 0.096
188.949 113.250
25.189 11.387
186.585 17.471
161.396 8.528
9 mean median
0.257 0.255
8.416 9.000
0.229 0.072 0.157 0.193 0.349 0.035 0.053
0.171 0.151
346.182 96.000
29.180 11.550
320.799 29.332
291.619 17.809
10 mean median
0.622 0.498
8.201 9.000
0.171 0.134 0.061 0.073 0.561 0.061 0.097
0.242 0.217
155.897 93.424
42.740 21.859
222.670 94.079
179.930 69.905
Total mean median
–0.144 0.053
8.220 9.000
0.364 0.120 0.125 0.149 0.242 –0.052 0.000
0.132 0.083
173.875 91.000
21.321 7.350
101.065 4.838
79.744 0.264
Observations are 824 firm-commitment share IPOs by non-financial, domestic companies from January 1, 2001 to December 31, 2012. ‘Below Min’, Min to Mid’, ‘At Mid’, ‘Mid to Max’ and ‘Above Max’ are the fraction of IPOs with an offer price below the minimum of the initial price range, between the minimum and mid-point of the initial price range, at the mid-point of the initial price range, between the mid-point and the maximum of the initial price range and above the maximum of the initial price range, respectively. ‘Final IPO Proceeds’ are proceeds ($millions) per final prospectus. ‘Money left on table’ is the first-day closing price minus the offer price times number of IPO shares issued ($millions). ‘Revaluation’ is (the first-day closing price minus the mid-point of the initial price range) times number of shares retained by pre-IPO shareholders plus (the offer price minus the mid-point of the initial price range) times number of shares sold by selling shareholders ($millions). See Table 1 for sample details and variable definitions.