isolation and identification of inulooligosaccharides ... and... · isolation and identification...
TRANSCRIPT
Ir
SCa
b
c
a
A
R
A
P
K
I
H
G
E
P
E
1
Ipmcdgga
B
0d
a n a l y t i c a c h i m i c a a c t a 6 0 4 ( 2 0 0 7 ) 81–87
avai lab le at www.sc iencedi rec t .com
journa l homepage: www.e lsev ier .com/ locate /aca
solation and identification of inulooligosaccharidesesulting from inulin hydrolysis
ebastien N. Ronkarta,b,∗, Christophe S. Bleckera, Helene Fourmanoira,b,hristian Fougniesc, Claude Deroannea, Jean-Claude Van Herckc, Michel Paquotb
Department of Food Technology, Gembloux Agricultural University, Passage des Deportes 2, B-5030 Gembloux, BelgiumDepartment of Industrial Biological Chemistry, Gembloux Agricultural University, Passage des Deportes 2, B-5030 Gembloux, BelgiumCosucra Groupe Warcoing S.A., Rue de la Sucrerie 1, B-7740 Warcoing, Belgium
r t i c l e i n f o
rticle history:
eceived 25 June 2007
ccepted 31 July 2007
ublished on line 6 August 2007
eywords:
nulin
ydrolysis
lobe artichoke
ndo-inulinase
urification
a b s t r a c t
In this study, inulooligosaccharides (Fn-type inulin) resulting from the endo-inulinase
hydrolysis of globe artichoke inulin were purified and characterized. The aim was to produce
Fn oligomer standards with the intention of identifying them in the complex inulin chro-
matogram. Inulin was extracted from globe artichoke and presented a high average degree
of polymerization (DP) of about 80 as determined by high-performance anion exchange
chromatography coupled with pulsed amperometric detection (HPAEC-PAD). This inulin
was hydrolyzed by a commercial endo-inulinase yielding a product with a very high Fn/GFn
molecule ratio, thus limiting the interference of GFn during the purification process. High-
performance size exclusion chromatography was used to individually isolate and collect
each retention peak corresponding to a specific oligomer. The purity of these fractions
was checked by HPAEC-PAD and showed that relatively pure molecules were produced.
lution profile Electrospray ionization mass spectrometry allowed the molecular weight determination of
these purified oligomers and ascertained their DP as F2, F3 and F4. These F2–4 standards
were used with glucose, fructose, sucrose and GF2–4 (commercially available) to spike com-
mercial oligofructose products in order to determine the elution profile in the HPAEC-PAD
chromatogram.
Composition depends on the plant source, harvesting date
. Introduction
nulin is a natural storage carbohydrate mainly found inlants from the Asteraceae family. It is not a simpleolecule, but a mixture of oligo- and/or polysaccharides
omposed of fructose unit chains (linked by �-(2 → 1)--fructosyl-fructose bonds) of various length, terminated
enerally by a single glucose unit (linked by an �-d-lucopyranosoyl bond). Inulins with a terminal glucose unitre called as �-d-glucopyranosyl-[�-d-fructofuranosyl]n−1-∗ Corresponding author at: Department of Industrial Biological Chem-5030 Gembloux, Belgium. Tel.: +32 81 622232; fax: +32 81 622231.
E-mail address: [email protected] (S.N. Ronkart).003-2670/$ – see front matter © 2007 Elsevier B.V. All rights reserved.oi:10.1016/j.aca.2007.07.073
© 2007 Elsevier B.V. All rights reserved.
d-fructofuranoside (or fructooligosaccharide), while thoseonly constituted by fructose are �-d-fructopyranosyl-[�-d-fructofuranosyl]n−1-d-fructofuranoside (or inulooligosaccha-ride) [1]. So, the general formula may be depicted as GFn orFn, with G as glucose and F as fructose, and n characterizingthe total number of units (Fig. 1).
istry, Gembloux Agricultural University, Passage des Deportes 2,
but also on extraction and post-extraction processes [2,3]. Asthe use of inulin and derivatives is in constant increase inthe food industry, essentially as a nutritional food ingredient,
82 a n a l y t i c a c h i m i c a a c t
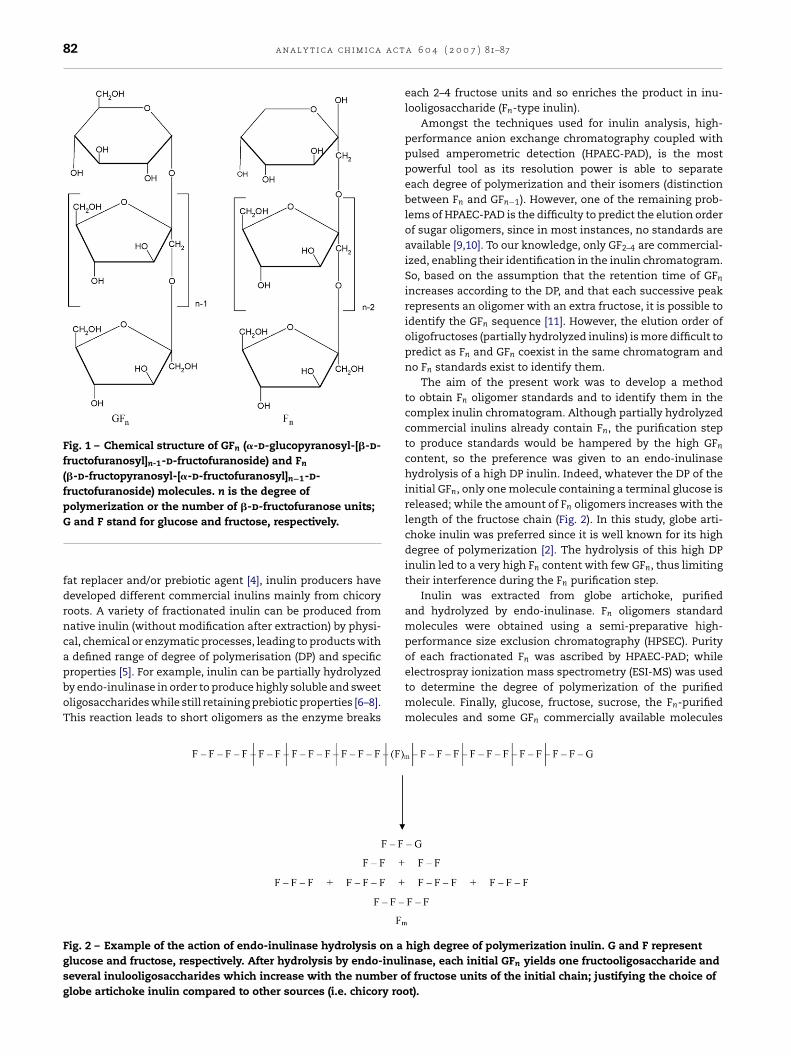
Fig. 1 – Chemical structure of GFn (�-d-glucopyranosyl-[�-d-fructofuranosyl]n-1-d-fructofuranoside) and Fn
(�-d-fructopyranosyl-[�-d-fructofuranosyl]n−1-d-fructofuranoside) molecules. n is the degree ofpolymerization or the number of �-d-fructofuranose units;
n
electrospray ionization mass spectrometry (ESI-MS) was used
G and F stand for glucose and fructose, respectively.
fat replacer and/or prebiotic agent [4], inulin producers havedeveloped different commercial inulins mainly from chicoryroots. A variety of fractionated inulin can be produced fromnative inulin (without modification after extraction) by physi-cal, chemical or enzymatic processes, leading to products witha defined range of degree of polymerisation (DP) and specificproperties [5]. For example, inulin can be partially hydrolyzed
by endo-inulinase in order to produce highly soluble and sweetoligosaccharides while still retaining prebiotic properties [6–8].This reaction leads to short oligomers as the enzyme breaksFig. 2 – Example of the action of endo-inulinase hydrolysis on aglucose and fructose, respectively. After hydrolysis by endo-inuliseveral inulooligosaccharides which increase with the number oglobe artichoke inulin compared to other sources (i.e. chicory roo
a 6 0 4 ( 2 0 0 7 ) 81–87
each 2–4 fructose units and so enriches the product in inu-looligosaccharide (Fn-type inulin).
Amongst the techniques used for inulin analysis, high-performance anion exchange chromatography coupled withpulsed amperometric detection (HPAEC-PAD), is the mostpowerful tool as its resolution power is able to separateeach degree of polymerization and their isomers (distinctionbetween Fn and GFn−1). However, one of the remaining prob-lems of HPAEC-PAD is the difficulty to predict the elution orderof sugar oligomers, since in most instances, no standards areavailable [9,10]. To our knowledge, only GF2–4 are commercial-ized, enabling their identification in the inulin chromatogram.So, based on the assumption that the retention time of GFn
increases according to the DP, and that each successive peakrepresents an oligomer with an extra fructose, it is possible toidentify the GFn sequence [11]. However, the elution order ofoligofructoses (partially hydrolyzed inulins) is more difficult topredict as Fn and GFn coexist in the same chromatogram andno Fn standards exist to identify them.
The aim of the present work was to develop a methodto obtain Fn oligomer standards and to identify them in thecomplex inulin chromatogram. Although partially hydrolyzedcommercial inulins already contain Fn, the purification stepto produce standards would be hampered by the high GFn
content, so the preference was given to an endo-inulinasehydrolysis of a high DP inulin. Indeed, whatever the DP of theinitial GFn, only one molecule containing a terminal glucose isreleased; while the amount of Fn oligomers increases with thelength of the fructose chain (Fig. 2). In this study, globe arti-choke inulin was preferred since it is well known for its highdegree of polymerization [2]. The hydrolysis of this high DPinulin led to a very high Fn content with few GFn, thus limitingtheir interference during the Fn purification step.
Inulin was extracted from globe artichoke, purifiedand hydrolyzed by endo-inulinase. Fn oligomers standardmolecules were obtained using a semi-preparative high-performance size exclusion chromatography (HPSEC). Purityof each fractionated F was ascribed by HPAEC-PAD; while
to determine the degree of polymerization of the purifiedmolecule. Finally, glucose, fructose, sucrose, the Fn-purifiedmolecules and some GFn commercially available molecules
high degree of polymerization inulin. G and F representnase, each initial GFn yields one fructooligosaccharide andf fructose units of the initial chain; justifying the choice oft).
c t a
wpp
2
2
Ti(lwwy5apacu
Fe
a n a l y t i c a c h i m i c a a
ere used to determine the order of elution in com-lex HPAEC-PAD chromatograms of oligofructose commercialroducts.
. Materials and methods
.1. Extraction of globe artichoke inulin
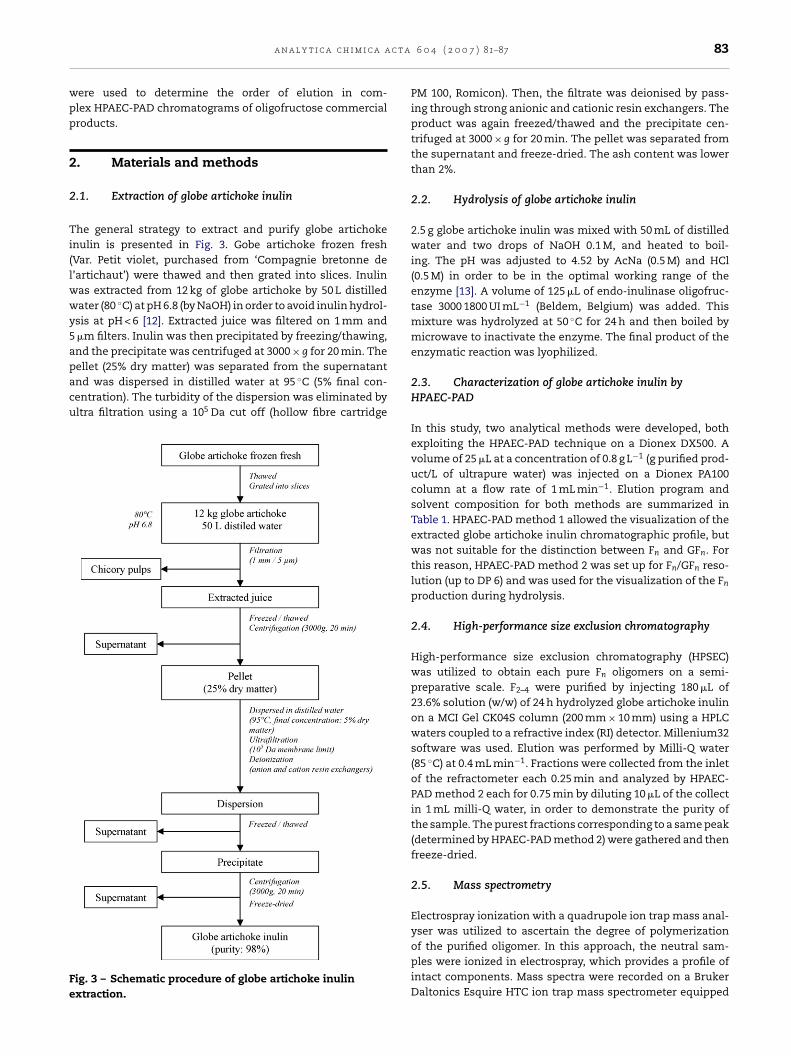
he general strategy to extract and purify globe artichokenulin is presented in Fig. 3. Gobe artichoke frozen freshVar. Petit violet, purchased from ‘Compagnie bretonne de’artichaut’) were thawed and then grated into slices. Inulinas extracted from 12 kg of globe artichoke by 50 L distilledater (80 ◦C) at pH 6.8 (by NaOH) in order to avoid inulin hydrol-
sis at pH < 6 [12]. Extracted juice was filtered on 1 mm and�m filters. Inulin was then precipitated by freezing/thawing,nd the precipitate was centrifuged at 3000 × g for 20 min. The
ellet (25% dry matter) was separated from the supernatantnd was dispersed in distilled water at 95 ◦C (5% final con-entration). The turbidity of the dispersion was eliminated byltra filtration using a 105 Da cut off (hollow fibre cartridgeig. 3 – Schematic procedure of globe artichoke inulinxtraction.
6 0 4 ( 2 0 0 7 ) 81–87 83
PM 100, Romicon). Then, the filtrate was deionised by pass-ing through strong anionic and cationic resin exchangers. Theproduct was again freezed/thawed and the precipitate cen-trifuged at 3000 × g for 20 min. The pellet was separated fromthe supernatant and freeze-dried. The ash content was lowerthan 2%.
2.2. Hydrolysis of globe artichoke inulin
2.5 g globe artichoke inulin was mixed with 50 mL of distilledwater and two drops of NaOH 0.1 M, and heated to boil-ing. The pH was adjusted to 4.52 by AcNa (0.5 M) and HCl(0.5 M) in order to be in the optimal working range of theenzyme [13]. A volume of 125 �L of endo-inulinase oligofruc-tase 3000 1800 UI mL−1 (Beldem, Belgium) was added. Thismixture was hydrolyzed at 50 ◦C for 24 h and then boiled bymicrowave to inactivate the enzyme. The final product of theenzymatic reaction was lyophilized.
2.3. Characterization of globe artichoke inulin byHPAEC-PAD
In this study, two analytical methods were developed, bothexploiting the HPAEC-PAD technique on a Dionex DX500. Avolume of 25 �L at a concentration of 0.8 g L−1 (g purified prod-uct/L of ultrapure water) was injected on a Dionex PA100column at a flow rate of 1 mL min−1. Elution program andsolvent composition for both methods are summarized inTable 1. HPAEC-PAD method 1 allowed the visualization of theextracted globe artichoke inulin chromatographic profile, butwas not suitable for the distinction between Fn and GFn. Forthis reason, HPAEC-PAD method 2 was set up for Fn/GFn reso-lution (up to DP 6) and was used for the visualization of the Fn
production during hydrolysis.
2.4. High-performance size exclusion chromatography
High-performance size exclusion chromatography (HPSEC)was utilized to obtain each pure Fn oligomers on a semi-preparative scale. F2–4 were purified by injecting 180 �L of23.6% solution (w/w) of 24 h hydrolyzed globe artichoke inulinon a MCI Gel CK04S column (200 mm × 10 mm) using a HPLCwaters coupled to a refractive index (RI) detector. Millenium32software was used. Elution was performed by Milli-Q water(85 ◦C) at 0.4 mL min−1. Fractions were collected from the inletof the refractometer each 0.25 min and analyzed by HPAEC-PAD method 2 each for 0.75 min by diluting 10 �L of the collectin 1 mL milli-Q water, in order to demonstrate the purity ofthe sample. The purest fractions corresponding to a same peak(determined by HPAEC-PAD method 2) were gathered and thenfreeze-dried.
2.5. Mass spectrometry
Electrospray ionization with a quadrupole ion trap mass anal-yser was utilized to ascertain the degree of polymerization
of the purified oligomer. In this approach, the neutral sam-ples were ionized in electrospray, which provides a profile ofintact components. Mass spectra were recorded on a BrukerDaltonics Esquire HTC ion trap mass spectrometer equipped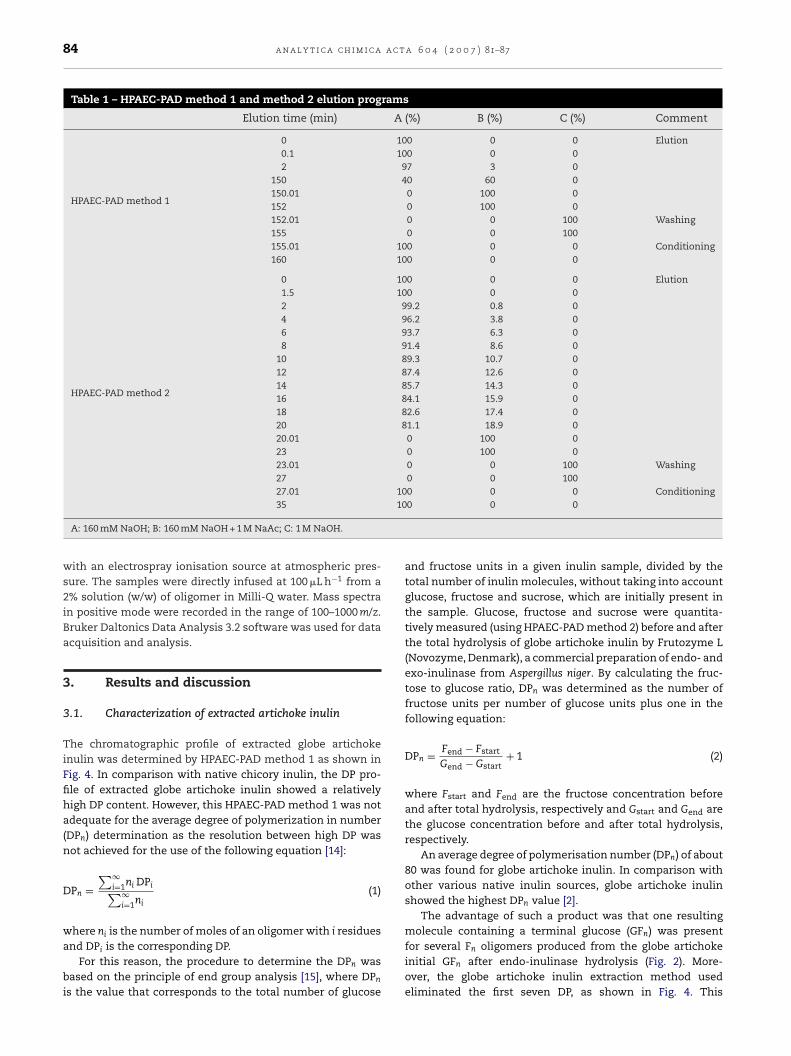
84 a n a l y t i c a c h i m i c a a c t a 6 0 4 ( 2 0 0 7 ) 81–87
Table 1 – HPAEC-PAD method 1 and method 2 elution programs
Elution time (min) A (%) B (%) C (%) Comment
HPAEC-PAD method 1
0 100 0 0 Elution0.1 100 0 02 97 3 0
150 40 60 0150.01 0 100 0152 0 100 0152.01 0 0 100 Washing155 0 0 100155.01 100 0 0 Conditioning160 100 0 0
HPAEC-PAD method 2
0 100 0 0 Elution1.5 100 0 02 99.2 0.8 04 96.2 3.8 06 93.7 6.3 08 91.4 8.6 0
10 89.3 10.7 012 87.4 12.6 014 85.7 14.3 016 84.1 15.9 018 82.6 17.4 020 81.1 18.9 020.01 0 100 023 0 100 023.01 0 0 100 Washing27 0 0 10027.01 100 0 0 Conditioning
10
35A: 160 mM NaOH; B: 160 mM NaOH + 1 M NaAc; C: 1 M NaOH.
with an electrospray ionisation source at atmospheric pres-sure. The samples were directly infused at 100 �L h−1 from a2% solution (w/w) of oligomer in Milli-Q water. Mass spectrain positive mode were recorded in the range of 100–1000 m/z.Bruker Daltonics Data Analysis 3.2 software was used for dataacquisition and analysis.
3. Results and discussion
3.1. Characterization of extracted artichoke inulin
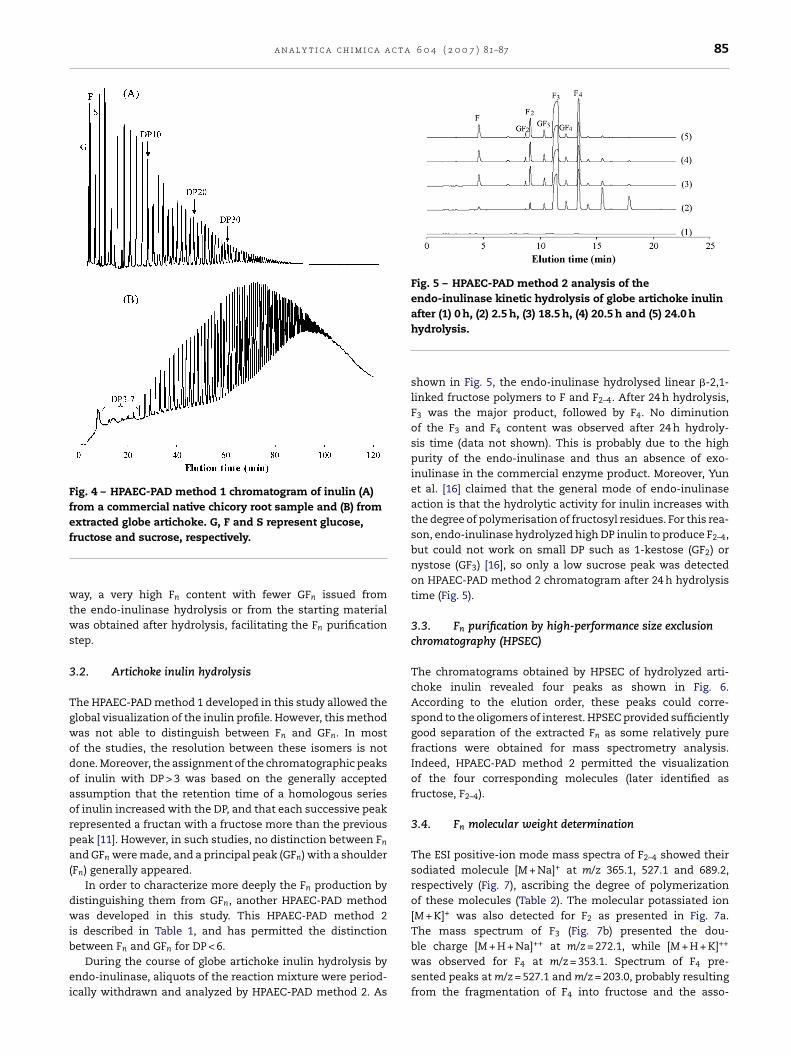
The chromatographic profile of extracted globe artichokeinulin was determined by HPAEC-PAD method 1 as shown inFig. 4. In comparison with native chicory inulin, the DP pro-file of extracted globe artichoke inulin showed a relativelyhigh DP content. However, this HPAEC-PAD method 1 was notadequate for the average degree of polymerization in number(DPn) determination as the resolution between high DP wasnot achieved for the use of the following equation [14]:
DPn =∑∞
i=1ni DPi∑∞i=1ni
(1)
where n is the number of moles of an oligomer with i residues
iand DPi is the corresponding DP.For this reason, the procedure to determine the DPn was
based on the principle of end group analysis [15], where DPn
is the value that corresponds to the total number of glucose
0 0 0
and fructose units in a given inulin sample, divided by thetotal number of inulin molecules, without taking into accountglucose, fructose and sucrose, which are initially present inthe sample. Glucose, fructose and sucrose were quantita-tively measured (using HPAEC-PAD method 2) before and afterthe total hydrolysis of globe artichoke inulin by Frutozyme L(Novozyme, Denmark), a commercial preparation of endo- andexo-inulinase from Aspergillus niger. By calculating the fruc-tose to glucose ratio, DPn was determined as the number offructose units per number of glucose units plus one in thefollowing equation:
DPn = Fend − Fstart
Gend − Gstart+ 1 (2)
where Fstart and Fend are the fructose concentration beforeand after total hydrolysis, respectively and Gstart and Gend arethe glucose concentration before and after total hydrolysis,respectively.
An average degree of polymerisation number (DPn) of about80 was found for globe artichoke inulin. In comparison withother various native inulin sources, globe artichoke inulinshowed the highest DPn value [2].
The advantage of such a product was that one resultingmolecule containing a terminal glucose (GF ) was present
nfor several Fn oligomers produced from the globe artichokeinitial GFn after endo-inulinase hydrolysis (Fig. 2). More-over, the globe artichoke inulin extraction method usedeliminated the first seven DP, as shown in Fig. 4. This
a n a l y t i c a c h i m i c a a c t a 6 0 4 ( 2 0 0 7 ) 81–87 85
Fig. 4 – HPAEC-PAD method 1 chromatogram of inulin (A)from a commercial native chicory root sample and (B) fromextracted globe artichoke. G, F and S represent glucose,f
wtws
3
Tgwodoaorpa(
dwib
ei
Fig. 5 – HPAEC-PAD method 2 analysis of theendo-inulinase kinetic hydrolysis of globe artichoke inulinafter (1) 0 h, (2) 2.5 h, (3) 18.5 h, (4) 20.5 h and (5) 24.0 h
ructose and sucrose, respectively.
ay, a very high Fn content with fewer GFn issued fromhe endo-inulinase hydrolysis or from the starting materialas obtained after hydrolysis, facilitating the Fn purification
tep.
.2. Artichoke inulin hydrolysis
he HPAEC-PAD method 1 developed in this study allowed thelobal visualization of the inulin profile. However, this methodas not able to distinguish between Fn and GFn. In mostf the studies, the resolution between these isomers is notone. Moreover, the assignment of the chromatographic peaksf inulin with DP > 3 was based on the generally acceptedssumption that the retention time of a homologous seriesf inulin increased with the DP, and that each successive peakepresented a fructan with a fructose more than the previouseak [11]. However, in such studies, no distinction between Fn
nd GFn were made, and a principal peak (GFn) with a shoulderFn) generally appeared.
In order to characterize more deeply the Fn production byistinguishing them from GFn, another HPAEC-PAD methodas developed in this study. This HPAEC-PAD method 2
s described in Table 1, and has permitted the distinction
etween Fn and GFn for DP < 6.During the course of globe artichoke inulin hydrolysis byndo-inulinase, aliquots of the reaction mixture were period-cally withdrawn and analyzed by HPAEC-PAD method 2. As
hydrolysis.
shown in Fig. 5, the endo-inulinase hydrolysed linear �-2,1-linked fructose polymers to F and F2–4. After 24 h hydrolysis,F3 was the major product, followed by F4. No diminutionof the F3 and F4 content was observed after 24 h hydroly-sis time (data not shown). This is probably due to the highpurity of the endo-inulinase and thus an absence of exo-inulinase in the commercial enzyme product. Moreover, Yunet al. [16] claimed that the general mode of endo-inulinaseaction is that the hydrolytic activity for inulin increases withthe degree of polymerisation of fructosyl residues. For this rea-son, endo-inulinase hydrolyzed high DP inulin to produce F2–4,but could not work on small DP such as 1-kestose (GF2) ornystose (GF3) [16], so only a low sucrose peak was detectedon HPAEC-PAD method 2 chromatogram after 24 h hydrolysistime (Fig. 5).
3.3. Fn purification by high-performance size exclusionchromatography (HPSEC)
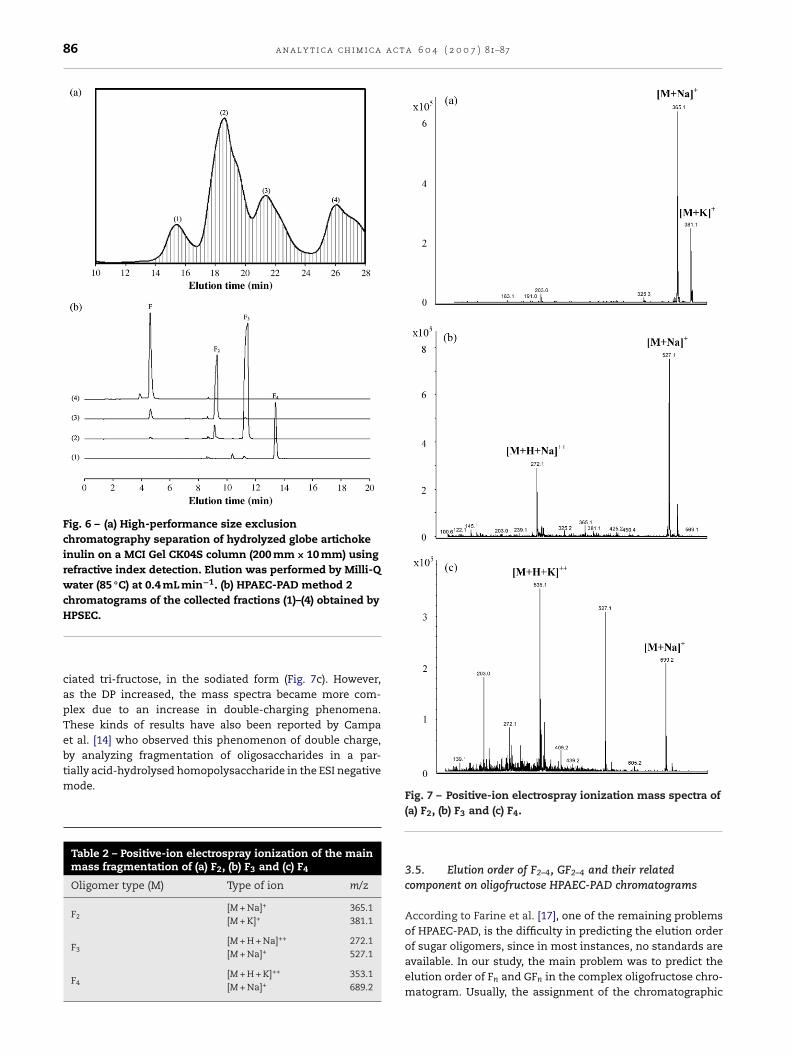
The chromatograms obtained by HPSEC of hydrolyzed arti-choke inulin revealed four peaks as shown in Fig. 6.According to the elution order, these peaks could corre-spond to the oligomers of interest. HPSEC provided sufficientlygood separation of the extracted Fn as some relatively purefractions were obtained for mass spectrometry analysis.Indeed, HPAEC-PAD method 2 permitted the visualizationof the four corresponding molecules (later identified asfructose, F2–4).
3.4. Fn molecular weight determination
The ESI positive-ion mode mass spectra of F2–4 showed theirsodiated molecule [M + Na]+ at m/z 365.1, 527.1 and 689.2,respectively (Fig. 7), ascribing the degree of polymerizationof these molecules (Table 2). The molecular potassiated ion[M + K]+ was also detected for F2 as presented in Fig. 7a.The mass spectrum of F3 (Fig. 7b) presented the dou-
ble charge [M + H + Na]++ at m/z = 272.1, while [M + H + K]++was observed for F4 at m/z = 353.1. Spectrum of F4 pre-sented peaks at m/z = 527.1 and m/z = 203.0, probably resultingfrom the fragmentation of F4 into fructose and the asso-
86 a n a l y t i c a c h i m i c a a c t a 6 0 4 ( 2 0 0 7 ) 81–87
Fig. 6 – (a) High-performance size exclusionchromatography separation of hydrolyzed globe artichokeinulin on a MCI Gel CK04S column (200 mm × 10 mm) usingrefractive index detection. Elution was performed by Milli-Qwater (85 ◦C) at 0.4 mL min−1. (b) HPAEC-PAD method 2chromatograms of the collected fractions (1)–(4) obtained by
HPSEC.ciated tri-fructose, in the sodiated form (Fig. 7c). However,as the DP increased, the mass spectra became more com-plex due to an increase in double-charging phenomena.These kinds of results have also been reported by Campaet al. [14] who observed this phenomenon of double charge,by analyzing fragmentation of oligosaccharides in a par-
tially acid-hydrolysed homopolysaccharide in the ESI negativemode.Table 2 – Positive-ion electrospray ionization of the mainmass fragmentation of (a) F2, (b) F3 and (c) F4
Oligomer type (M) Type of ion m/z
F2[M + Na]+ 365.1[M + K]+ 381.1
F3[M + H + Na]++ 272.1[M + Na]+ 527.1
F4[M + H + K]++ 353.1[M + Na]+ 689.2
Fig. 7 – Positive-ion electrospray ionization mass spectra of
(a) F2, (b) F3 and (c) F4.3.5. Elution order of F2–4, GF2–4 and their relatedcomponent on oligofructose HPAEC-PAD chromatograms
According to Farine et al. [17], one of the remaining problemsof HPAEC-PAD, is the difficulty in predicting the elution order
of sugar oligomers, since in most instances, no standards areavailable. In our study, the main problem was to predict theelution order of Fn and GFn in the complex oligofructose chro-matogram. Usually, the assignment of the chromatographic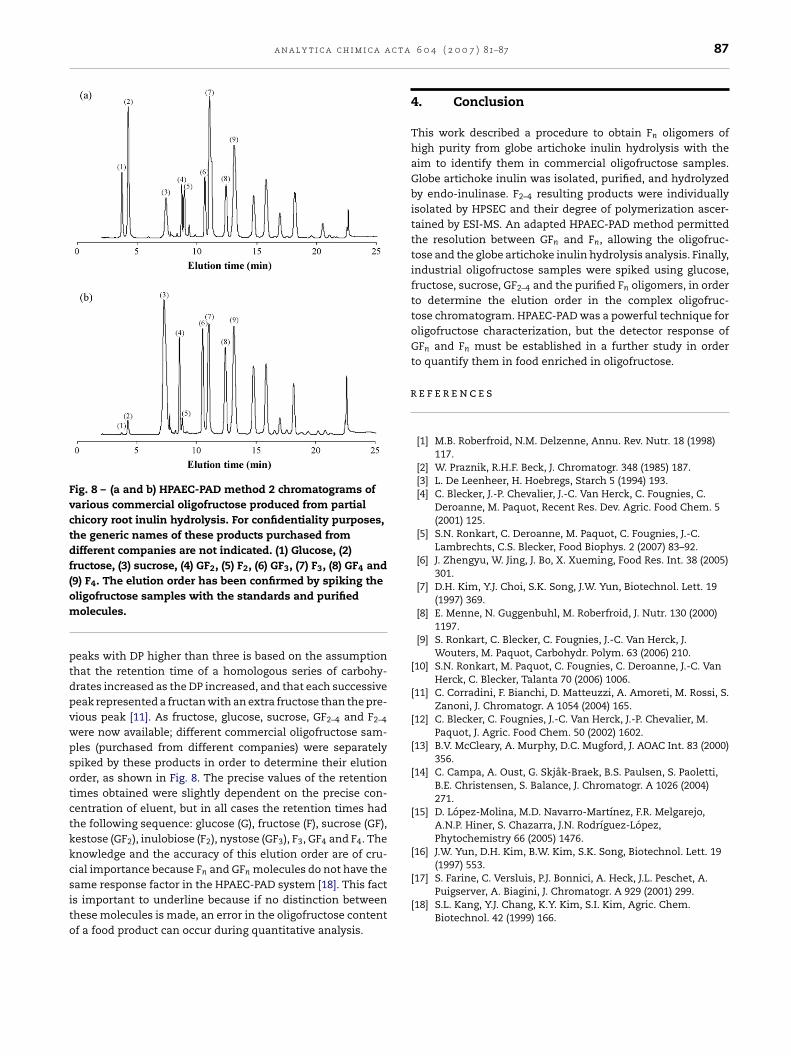
a n a l y t i c a c h i m i c a a c t a
Fig. 8 – (a and b) HPAEC-PAD method 2 chromatograms ofvarious commercial oligofructose produced from partialchicory root inulin hydrolysis. For confidentiality purposes,the generic names of these products purchased fromdifferent companies are not indicated. (1) Glucose, (2)fructose, (3) sucrose, (4) GF2, (5) F2, (6) GF3, (7) F3, (8) GF4 and(9) F4. The elution order has been confirmed by spiking theom
ptdpvwpsotctkkcsito
r
(1997) 553.
ligofructose samples with the standards and purifiedolecules.
eaks with DP higher than three is based on the assumptionhat the retention time of a homologous series of carbohy-rates increased as the DP increased, and that each successiveeak represented a fructan with an extra fructose than the pre-ious peak [11]. As fructose, glucose, sucrose, GF2–4 and F2–4
ere now available; different commercial oligofructose sam-les (purchased from different companies) were separatelypiked by these products in order to determine their elutionrder, as shown in Fig. 8. The precise values of the retentionimes obtained were slightly dependent on the precise con-entration of eluent, but in all cases the retention times hadhe following sequence: glucose (G), fructose (F), sucrose (GF),estose (GF2), inulobiose (F2), nystose (GF3), F3, GF4 and F4. Thenowledge and the accuracy of this elution order are of cru-ial importance because Fn and GFn molecules do not have the
ame response factor in the HPAEC-PAD system [18]. This facts important to underline because if no distinction betweenhese molecules is made, an error in the oligofructose contentf a food product can occur during quantitative analysis.6 0 4 ( 2 0 0 7 ) 81–87 87
4. Conclusion
This work described a procedure to obtain Fn oligomers ofhigh purity from globe artichoke inulin hydrolysis with theaim to identify them in commercial oligofructose samples.Globe artichoke inulin was isolated, purified, and hydrolyzedby endo-inulinase. F2–4 resulting products were individuallyisolated by HPSEC and their degree of polymerization ascer-tained by ESI-MS. An adapted HPAEC-PAD method permittedthe resolution between GFn and Fn, allowing the oligofruc-tose and the globe artichoke inulin hydrolysis analysis. Finally,industrial oligofructose samples were spiked using glucose,fructose, sucrose, GF2–4 and the purified Fn oligomers, in orderto determine the elution order in the complex oligofruc-tose chromatogram. HPAEC-PAD was a powerful technique foroligofructose characterization, but the detector response ofGFn and Fn must be established in a further study in orderto quantify them in food enriched in oligofructose.
e f e r e n c e s
[1] M.B. Roberfroid, N.M. Delzenne, Annu. Rev. Nutr. 18 (1998)117.
[2] W. Praznik, R.H.F. Beck, J. Chromatogr. 348 (1985) 187.[3] L. De Leenheer, H. Hoebregs, Starch 5 (1994) 193.[4] C. Blecker, J.-P. Chevalier, J.-C. Van Herck, C. Fougnies, C.
Deroanne, M. Paquot, Recent Res. Dev. Agric. Food Chem. 5(2001) 125.
[5] S.N. Ronkart, C. Deroanne, M. Paquot, C. Fougnies, J.-C.Lambrechts, C.S. Blecker, Food Biophys. 2 (2007) 83–92.
[6] J. Zhengyu, W. Jing, J. Bo, X. Xueming, Food Res. Int. 38 (2005)301.
[7] D.H. Kim, Y.J. Choi, S.K. Song, J.W. Yun, Biotechnol. Lett. 19(1997) 369.
[8] E. Menne, N. Guggenbuhl, M. Roberfroid, J. Nutr. 130 (2000)1197.
[9] S. Ronkart, C. Blecker, C. Fougnies, J.-C. Van Herck, J.Wouters, M. Paquot, Carbohydr. Polym. 63 (2006) 210.
[10] S.N. Ronkart, M. Paquot, C. Fougnies, C. Deroanne, J.-C. VanHerck, C. Blecker, Talanta 70 (2006) 1006.
[11] C. Corradini, F. Bianchi, D. Matteuzzi, A. Amoreti, M. Rossi, S.Zanoni, J. Chromatogr. A 1054 (2004) 165.
[12] C. Blecker, C. Fougnies, J.-C. Van Herck, J.-P. Chevalier, M.Paquot, J. Agric. Food Chem. 50 (2002) 1602.
[13] B.V. McCleary, A. Murphy, D.C. Mugford, J. AOAC Int. 83 (2000)356.
[14] C. Campa, A. Oust, G. Skjak-Braek, B.S. Paulsen, S. Paoletti,B.E. Christensen, S. Balance, J. Chromatogr. A 1026 (2004)271.
[15] D. Lopez-Molina, M.D. Navarro-Martınez, F.R. Melgarejo,A.N.P. Hiner, S. Chazarra, J.N. Rodrıguez-Lopez,Phytochemistry 66 (2005) 1476.
[16] J.W. Yun, D.H. Kim, B.W. Kim, S.K. Song, Biotechnol. Lett. 19
[17] S. Farine, C. Versluis, P.J. Bonnici, A. Heck, J.L. Peschet, A.Puigserver, A. Biagini, J. Chromatogr. A 929 (2001) 299.
[18] S.L. Kang, Y.J. Chang, K.Y. Kim, S.I. Kim, Agric. Chem.Biotechnol. 42 (1999) 166.