is school funding fair? a national report card - … school funding fair 7th... · danielle farrie,...
TRANSCRIPT

Is School Funding Fair?
A National Report Card SEVENTH EDITION: FEBRUARY 2018
Bruce D. Baker, Rutgers University
Danielle Farrie, Education Law Center
David Sciarra, Education Law Center

www.schoolfundingfairness.org
About the Authors
Bruce D. Baker is a professor in the Department of Educational Theory, Policy and Administration in
the Graduate School of Education at Rutgers University. He is co-author of Financing Education Systems
with Preston Green and Craig Richards, author of numerous peer-reviewed articles on education
finance, and sits on the editorial boards of the Journal of Education Finance and Education Finance and
Policy. He also serves as a research fellow for the National Education Policy Center.
David G. Sciarra is Executive Director of the Education Law Center (ELC) in Newark, New Jersey. A
practicing civil rights lawyer since 1978, he has litigated a wide range of cases involving socioeconomic
rights, including affordable housing, shelter for the homeless, and welfare rights. Since 1996, he has
litigated to enforce access for low-income and minority children to an equal and adequate education
under state and federal law, and served as counsel to the plaintiff students in New Jersey’s landmark
Abbott v. Burke case. He also does research, writing, and lecturing on education law and policy in such
areas as school finance, early education, and school reform.
Danielle Farrie is Research Director at the Education Law Center (ELC). She conducts analysis to
support litigation and public policy for ELC and partner organizations. Before joining ELC, she conducted
research in the field of urban education on such topics as school choice, racial segregation, and school
segregation. She has also co-authored peer-reviewed articles on how race affects perceptions of school
quality and on parental involvement among low-income families. She holds a Ph.D. in sociology from
Temple University.
Please visit www.schoolfundingfairness.org to download the report, explore findings with interactive
graphics and download complete datasets for further analysis.
Copyright © 2018 Education Law Center, Newark, N.J.

www.schoolfundingfairness.org ii | P a g e
Table of Contents Executive Summary ......................................................................................................................................................... iii
Introduction ......................................................................................................................................................................... 1
Analyzing School Funding Fairness ...................................................................................................................... 2
The Fairness Principles ......................................................................................................................................... 2
Why Measure Fairness?......................................................................................................................................... 4
Existing Measures of State School Finance ........................................................................................................ 4
Research Method ............................................................................................................................................................... 5
The Fairness Measures ............................................................................................................................................... 6
Resource Allocation Indicators ............................................................................................................................... 7
Evaluating the States ........................................................................................................................................................ 8
Fairness Measure #1: Funding Level ................................................................................................................... 9
Fairness Measure #2: Funding Distribution ..................................................................................................... 9
State Fairness Profiles .............................................................................................................................................. 12
Fairness Measure #3: Fiscal Effort ...................................................................................................................... 15
Fairness Measure #4: Coverage ........................................................................................................................... 18
The Four Fairness Measures .................................................................................................................................. 20
Fair School Funding and Resource Allocation .................................................................................................... 23
Early Childhood Education ..................................................................................................................................... 23
Wage Competitiveness ............................................................................................................................................. 23
Teacher-to-Student Ratios ...................................................................................................................................... 24
How Much is Enough?.................................................................................................................................................... 28
Appendix A: Data and Methodology ........................................................................................................................ 29
Appendix B: Fairness Measures…………..……………………………………………………………………………… 32
Appendix C: Resource Allocation Measures………………………………………………………………………… 37
Appendix D: Student Poverty Measures……………………………………………………………………………….40

www.schoolfundingfairness.org iii | P a g e
Executive Summary “Is School Funding Fair? A National Report Card” analyzes the condition of state school finance
systems with a focus on the fair distribution of resources to the neediest students. The Report
Card makes a number of assumptions about how school funding systems should be designed:
A fair funding system should provide levels of funding based on student need.
Student poverty is the most critical variable affecting funding levels and can serve as a
proxy for other measures of disadvantage, such as racial segregation, limited English
proficiency, and student mobility.
Fair funding systems are designed “progressively” so that funding increases relative to
student poverty.
A sufficient overall level of funding is a crucial starting point for any funding formula to
be successful.
The Seventh Edition of the Report Card examines the fiscal condition of the nation’s schools
using data from 2015.
The Fairness Measures The report evaluates states on the basis of four separate, but interrelated, fairness measures.
These measures are designed to provide meaningful comparisons among states by taking into
account factors that influence education costs, such as geography, regional labor markets, and
population density, where appropriate. The measures are:
Funding Level: Using figures adjusted to account for a variety of interstate differences,
this measure allows for a comparison of the average state and local revenue per pupil
across states. States are ranked from highest to lowest in per pupil funding.
Funding Distribution: This measure shows whether a state provides more or less
funding to schools based on their poverty concentration. States are evaluated as
"regressive", "progressive", or "flat" and are given letter grades that correspond to their
relative position compared to other states.
Effort: This measures differences in state spending relative to a state’s fiscal capacity.
States are ranked according to the ratio of state spending on education to gross state
product (GSP) and personal income.
Coverage: This measures the proportion of school-aged children attending the state’s
public schools and also addresses the income disparity between families using public
and nonpublic schools. States are ranked according to both the proportion of children in
public schools and the income ratio of public and nonpublic school families.
Summary of Findings
The report’s core findings include:
Funding levels continue to be characterized by wide disparities among states, with
gaps between the highest and lowest funded states actually growing. The funding

www.schoolfundingfairness.org iv | P a g e
differential between the highest (New York) and lowest (Idaho) funded states is over
$12,400.
The majority of states have unfair funding systems with “flat” or “regressive” funding
distribution patterns that ignore the need for additional funding in high-poverty
districts. In 2015, only eleven states had progressive funding systems, down from a high
of twenty-two in 2008.
Whether measured in relation to a state’s economic productivity or personal income,
the fiscal effort that states exert varies widely. States with the lowest effort spend on
schools about $25 of every $1,000 in economic productivity, while the highest effort
states spend $50. Similarly, in relation to personal income, the lowest effort states
allocate $29 for every $1,000 in aggregate income compared to $64 in the highest effort
state.
Coverage is a relatively stable indicator, but it demonstrates the degree to which
wealthier families in some states opt out of the public education system, potentially
affecting the public and political will necessary to improve school funding. The
percentage of school-aged children enrolled in public schools ranges from 78% in
Hawaii, to a high of 93% in Utah.
Only two states, New Jersey and Wyoming, are positioned relatively well on all four
indicators.
California, Florida, Louisiana and Tennessee are poorly positioned on all four fairness
measures. All three states receive a ”C” in Funding Distribution (no additional funding
for poor districts). They rank in the lower half of states on Funding Level, and have
below average Effort levels and poor Coverage.
Resource Allocation Indicators Fair school funding delivers adequate resources where they are needed most to support
students’ academic progress. The report explores the consequences of funding fairness, or lack
thereof, for schools and students through the following three resource allocation indicators:
Early Childhood Education: Enrollment of low-income students in early childhood
education lags behind that of their wealthier peers in nearly all states. The states with
the greatest disparities in preschool enrollment are more likely to have regressively
distributed funding.
Wage Competitiveness: A fair school funding system should provide districts with the
opportunity to attract and retain high quality teachers. Competitive salaries are one
way to attain that goal, but average teacher salaries in most states are below those of
their non-teacher counterparts. States with higher funding levels are able to offer more
competitive salaries, while in the lowest funded states teacher salaries are the least
competitive with other professions.
Pupil-to-Teacher Ratios: An equitable distribution of school staff in districts and
states is one of the most meaningful outcomes of fair school funding. Twenty-nine states
had a flat or regressive distribution, meaning that higher poverty districts had the same

www.schoolfundingfairness.org v | P a g e
number or more pupils per teacher. Unsurprisingly, the states with the fairest
distribution of staff were also more likely to have a fair distribution of funding.
This edition of the National Report Card, like its precursors, demonstrates that school funding
remains stubbornly unfair in most states. As a result, states have failed to create finance
systems that support improved student outcomes, especially among the nation’s low-income
students.
www.schoolfundingfairness.org 1 | P a g e
Introduction The National Report Card was first published in 2010. Since then, a growing body of research
has convincingly demonstrated that money does, in fact, make a difference in improving
educational opportunities for the nation’s schoolchildren. In just the last few years, a body of
rigorous empirical studies has shown that:
Increased funding leads to greater and more fairly distributed education resources.
When states make a greater fiscal effort to fund their schools, school spending goes up,
and that translates into higher staffing levels, smaller class sizes and more competitive
wages for teachers.1
States that invest in the resources that matter – low pupil-to-teacher ratios, especially
for high poverty districts, and competitive wages – tend to have higher academic
outcomes among children from low-income families and smaller income-based
achievement gaps.2
Adequacy-oriented school funding reforms between 1990 and 2011 achieved their
goals of improving educational opportunity by raising achievement among students in
low-income districts. In fact, states with reform saw decreasing achievement gaps over
the period studied, while states without school finance reform saw their achievement
gaps increase.3
School funding reform also leads to improvements far beyond test scores. A study of
school finance reforms of the 1970s and 80s finds that increased spending led to higher
high school graduation rates, greater educational attainment, higher earnings and lower
rates of poverty in adulthood.4
Money matters because the availability and level of resources in schools matter.5 Fair and
equitable state finance systems must be at the center of efforts to improve educational
outcomes and reduce stubborn achievement gaps among students. Yet in the face of compelling
evidence, most states still have not enacted school funding reforms to meet the needs of all
students, especially those who are most vulnerable because of poverty, disability, or lack of
English fluency.
1 Bruce D. Baker, Danielle Farrie, David Sciarra. 2016. “The Changing Distribution of Educational Opportunities: 1993-2002.” In The Dynamics of Opportunity in America: Evidence and Perspectives, eds. Irwin Kirsch and Henry Braun. Educational Testing Service. 2 Baker, Bruce D., Danielle Farrie, David Sciarra. 2016. Mind the Gap: 20 Years of Progress and Retrenchment in School Funding and Achievement Gaps. Educational Testing Service, Research Report No. RR-16-15. 3 Julien Lafortune, Jesse Rothstein, Diane Whitmore. 2016. Can school finance reforms improve student achievement? Washington Center for Equitable Growth. 4 C. Kirabo Jackson, Rucker Johnson, Claudia Persico. 2014. How Money Makes a Difference: The Effects of School Finance Reforms on Outcomes for Low Income Students. Stanford Center for Opportunity Policy in Education. 5 For a review, see Bruce D. Baker. 2017. How Money Matters for Schools. Learning Policy Institute.

www.schoolfundingfairness.org 2 | P a g e
The National Report Card evaluates and compares the extent to which state school funding
systems ensure equality of educational opportunity for all children. The goal is to provide data
and information for a better understanding of the fairness, or lack thereof, of existing public
education finance systems. Our hope is that, armed with this information, lawmakers,
educators, advocates and citizens can improve resources and outcomes for school children in
their states.
Analyzing School Funding Fairness To effectively analyze how well states fund public education, one critical question must be
answered: What is fair school funding? In this report, “fair” school funding is defined as a
state finance system that ensures equal educational opportunity by providing a sufficient
level of funding that is distributed to districts within the state to account for additional
needs generated by student poverty.
The National Report Card measures the fairness of the school finance systems in all 50 states
and the District of Columbia according to the definition above. The central purpose of the
Report Card is to evaluate the extent to which state systems ensure equality of educational
opportunity for all children, regardless of background, family income, where they live, or where
they attend school. Equal educational opportunity means that all children and all schools have
access to the teachers, support staff and other essential resources needed to provide them with
the “opportunity to learn.”
Fair School Funding is a State Responsibility
In the United States the responsibility for funding K-12 education falls to each individual state. As a
result, the 50 states and the District of Columbia each have their own unique system for funding
their schools. In total, revenues for public elementary and secondary schools are 9% federal, 46%
state and 45% local. While the majority of funding is split between state and local revenue sources,
the decision about how those revenues are allocated is wholly determined by state policy. Some
state finance systems, such as those in Illinois and New Hampshire, provide the majority of revenues
through local sources, while others, such as those in Vermont, New Mexico and Minnesota, are
heavily reliant on state revenues.
One of the most important features of a fair school finance system is its effectiveness in accounting
for the ability of local districts to generate revenue. A greater reliance on state funding does not
necessarily lead to a fairer system. The central question is: Are state revenues targeted to districts
that have weak fiscal capacity, or is state funding blind to local ability to raise funds, exacerbating
inequities? It is critical for states to design systems in which the interaction of local and state
revenues results in an adequate level and equitable distribution of funds. If this is not the case, it is
the responsibility of state elected officials to enact reforms .to ensure fairness in the system.

www.schoolfundingfairness.org 3 | P a g e
The Fairness Principles
The National Report Card is built on the following core principles:
Varying levels of funding are required to provide equal educational opportunities to
children with different needs.
The costs of education vary based on geographic location, regional differences in
teacher salaries, school district size, population density, and various student
characteristics. It is critical to account for as many of these variables as possible, given
the availability of reliable data.
The level of funding should increase relative to the level of concentrated student
poverty — that is, state finance systems should provide more funding to districts
serving larger shares of students in poverty. Economists often evaluate systems as
“progressive” or “regressive.” As used in this report, a “progressive” finance system
allocates more funding to districts with high levels of student poverty; a “regressive”
system allocates less to those districts; and a “flat” system allocates roughly the same
amount of funding across districts with varying needs.
Student poverty — especially concentrated student poverty — is the most critical
variable affecting funding levels. Student and school poverty correlates with, and is a
proxy for, a multitude of factors that increase the costs of providing equal educational
opportunity — most notably, gaps in educational achievement, school district racial
composition, English-language proficiency, homelessness, and student mobility. State
finance systems should deliver greater levels of funding to higher-poverty settings,
while controlling for differences in other cost factors.6
While the distribution of funding to account for student need is crucial, the overall
funding level in states is also a significant element in fair school funding. Without
sufficient base or foundational funding, even a progressively funded system will be
unable to provide equitable educational opportunities.
The sufficiency of the overall level of funding in any state can be assessed based on
comparisons to other states with similar conditions and similar characteristics. Using
available national data, average differences in state and local revenues between states,
as well as within states, can be projected and indexed to compare expected state and
local revenues per pupil under a given set of conditions. These expected values are
derived from a statistical model that predicts funding levels while controlling for
various school district characteristics. These predicted funding levels allow for more
direct comparison of districts having similar characteristics across states.
6 Current data do not permit inclusion of measures for additional student characteristics, e.g., disability or limited English proficiency, without compromising the relationship between school funding and poverty, the main focus of this analysis. For more information, see the technical appendix.
www.schoolfundingfairness.org 4 | P a g e
Why Measure Fairness?
Based on these core principles, the data and measures presented in the National Report Card
focus on the central question of state school finance systems: Do they support equal
educational opportunity for all students and, in particular, for low-income students in school
districts with concentrated poverty? Put simply, does a particular state fairly fund its public
schools?
Without a state-by-state commitment to enact progressive finance systems that address
existing funding inequities, education policies and initiatives to improve overall achievement,
while also reducing gaps between the lowest and highest performing students, will continue to
falter. Only with strong systems of public education built on sufficient funding, distributed
progressively, will states be able to implement and sustain the initiatives necessary to boost
student achievement. Policymakers, educators, business leaders, parents — and the public at
large — urgently need better and more reliable information to understand the fairness of
existing finance systems, identify problems with those systems, and devise and implement
policy solutions to advance school funding fairness.
Existing Measures of State School Finance
While several reports analyze state school funding systems, they fail to adequately or
accurately capture the differences in spending levels among states and the distribution of funds
within states.
The National Center for Education Statistics (NCES) publishes the most commonly used metric
for state school funding: state and local revenue per pupil. This is a fairly straightforward
measure, but one that ignores the complexity of comparing funding levels among states.
Without any adjustments for the characteristics of the students served or for differences in
regional purchasing power, this measure is unsatisfactory for making state comparisons.
In their annual Quality Counts report, Education Week publishes state school finance data using
four indicators measuring “Equity” and four indicators measuring “Spending.” Education Week
does make adjustments for student characteristics by “weighting” student enrollments to
account for student poverty, while adjusting for regional cost differences.7 However, the
poverty weight is hypothetical, not based on research on the additional costs of serving poor
students in each state. In addition, the equity measures do not distinguish whether disparities
are the result of progressive or regressive school funding, ignoring a basic tenet of funding
fairness.
Education Trust, a Washington D.C.-based advocacy group, has published multiple reports
addressing funding gaps between high and low poverty districts and high and low minority
districts. The most recent analysis adjusts for regional cost differences and student poverty,
7 A “weighting” is an adjustment to per-pupil revenue or expenditure data designed to address differences in needs and costs.

www.schoolfundingfairness.org 5 | P a g e
using a “conservative” poverty weight of 1.4, likely underestimating the additional costs
required to serve these students.8 In addition, focusing only on funding gaps at the extremes of
poverty and minority concentration ignores whether these gaps are representative of funding
patterns for the state as a whole.
The U.S. Education Department (ED) publishes a measure of funding equity in the “Education
Dashboard.” Similar to Education Trust, the ED measure shows the difference in per-pupil
spending in the highest and lowest quartile districts by poverty. Users can select a “preferred”
weighted adjustment for student poverty in 10% increments from 0-100%. However, the most
recent data posted are from 2007-08.
More recently, the Urban Institute and EdBuild have adopted a regressive/progressive
framework in reports on school funding. The Urban Institute measures progressiveness as the
relative spending levels between poor and nonpoor students. This is accomplished by
calculating per pupil spending averages weighted, respectively, by the number of poor and
nonpoor children in each district.9 This methodology adjusts for wage differences, but does not
include other district characteristics that can influence costs.
EdBuild also categorizes states as progressive or regressive using cost-adjusted funding gaps
between the highest and lowest poverty quartiles. They adjust enrollments by various poverty
weights ranging from 1.0 to 1.6 to demonstrate how few states meet an equity target by
providing additional funding for students in poverty.10 Again, the poverty weights are
hypothetical and do not reflect the true costs of educating poor students in each state.
Research Method The National Report Card addresses the shortcomings in these reports by:
Using actual state and local revenues at the district level to characterize the overall
pattern of each state’s funding relative to student poverty, not limited to funding at the
extremes of poverty concentration;
Adjusting revenues for numerous external cost factors allowing legitimate comparisons
among states;
Including additional indicators to evaluate the economic and political context for
establishing fair school funding; and
Including resource allocation measures that demonstrate how funding fairness
influences the distribution of actual resources for students and teachers.
8 Ed Trust bases this weight on the federal Title I formula and concedes that it is likely an underestimate. 9 Chingos, Matthew M. & Kristen Blagg. 2017. Do Poor Kids Get Their Fair Share of School Funding? Urban Institute. 10 EdBuild. 2014. Resource Inequality: Shortchanging Students.
www.schoolfundingfairness.org 6 | P a g e
Some of the indicators are quite straightforward, using publicly available data reported at the
state level to compose indices that can be easily ranked. Others require more advanced
statistical methods in order to control for extraneous factors that influence funding and
resource allocation.
The four fairness measures and three resource allocation indicators are described briefly
below. For more information on data sources and the details of the construction of these
indicators see Appendix A. A more detailed technical report on the data and methodology is
available at www.schoolfundingfairness.org. Limited longitudinal data is presented in
Appendix B and C, and the full range of data is available online.11
The Fairness Measures The National Report Card consists of four separate but interrelated fairness measures. The four
measures are:
Funding Level – This measures the overall level of state and local revenue provided to
school districts and compares each state’s average per-pupil revenue with that of other
states. To recognize the variety of interstate differences, each state’s revenue level is
adjusted to reflect differences in regional wages, poverty, economies of scale, and
population density.
Funding Distribution – This measures the distribution of funding across local districts
within a state, relative to student poverty. The measure shows whether a state provides
more or less funding to schools based on their poverty concentration, using simulations
ranging from 0% to 30% child poverty.12,13
Fiscal Effort – This measures differences in state spending for education relative to state
fiscal capacity. The report includes two measures of “Fiscal Effort:”1) the ratio of state
spending to gross state product (GSP), and 2) the ratio of state spending to aggregate
personal income.
Coverage – This measures the proportion of school-aged children attending the state’s
public schools. The share of a state’s students in public schools, and the median
household income of those students, is an important indicator of the distribution of
funding relative to student poverty (especially where more affluent households opt out
11 Year-to-year comparisons rely on updated models, and therefore may not align exactly with previously published results. 12 Poverty is measured using the Census definition of poverty, rather than free or reduced lunch (FRL) eligibility, which is more commonly used in education. The Census poverty threshold in 2015 was approximately $24,000 for a family of four. FRL eligibility is set at 185% of the Census poverty threshold, approximately $44,400. See Appendix D to compare measures. 13 Hawaii and the District of Columbia are excluded from this analysis because they are single-district systems. Alaska is also excluded because the state’s unique geography and sparse population, so highly correlated with poverty, result in inconsistent estimates of within-state resource distribution.

www.schoolfundingfairness.org 7 | P a g e
of public schooling, choosing parochial or private schools or home schooling) and the
overall effort to provide fair school funding.
States are evaluated by two methods – a grading curve and rank. Funding Distribution and
Fiscal Effort, the two measures over which states have direct control, are given letter grades
that are based on the typical grading “curve” and range from “A” to “F.”14 Funding Level and
Coverage are ranked because these measures are influenced not only by state policy, but also
by other historical and contextual factors.
The four fairness measures are comparative in nature, determining how an individual state
compares to other states in the nation or region. States are not evaluated using specific
thresholds of education costs and school funding that might be “adequate” or “equitable” if
applied nationally or regionally. This type of evaluation would require positing hard definitions
of education costs and student need based on the complex conditions in each state, including
the state’s unique content and performance standards. Such an exercise is beyond the scope of
this report.
Resource Allocation Indicators Fair school funding delivers adequate resources where they are needed most. The effective use
of education funding can lead to adequate staffing of schools; a full, rich curriculum; and
effective class sizes, all of which can improve student outcomes.
The following three indicators of how states allocate resources are included in the report:
Early Childhood Education – This measures enrollment rates in early childhood
education programs by income level. Access to early learning opportunities, especially
for low-income students, is a key indicator of a state’s commitment to providing equal
educational opportunities and reducing achievement gaps.
Wage Competitiveness – This indicator uses wage data to compare compensation
between teachers and non-teachers who have similar education levels, experience, and
hours worked. The index is expressed as the ratio between teacher wages and non-
teacher wages to evaluate whether the teaching profession is economically competitive
in each state.
14 To calculate grades, a standardized score (z-score) is calculated as the state’s difference from the mean, expressed in standard deviations. Grades are as follows: A = 2/3 standard deviation above the mean (z > 0.67); B = between 1/3 and 2/3 standard deviations above the mean (.33 < z <.67); C = between 1/3 standard deviation below and 1/3 standard deviation above the mean (-.33 < z < .33); D = between 1/3 and 2/3 standard deviations below the mean (-.33 > z > -.67); F = 2/3 standard deviation below the mean (z < -.67). In some cases, the tables show states that have the same numerical score but different letter grades because their unrounded scores place them on opposite sides of the grading cutoffs.

www.schoolfundingfairness.org 8 | P a g e
Teacher-to-Student Ratios – This measures district staffing patterns, comparing teacher-
to-student ratios in high poverty and low poverty districts. A fair distribution of staffing
resources would result in higher teacher-to-student ratios in high poverty districts. An
unfair distribution would result in comparable teacher-to-student ratios in schools,
regardless of student poverty, or fewer teachers in high poverty districts.
A Note on Interpretation
The goal of the National Report Card is to use available data to
encourage a more sophisticated and nuanced discussion of fair
school funding. When examining the state-by-state evaluations
in the next sections, it is important to consider a few points.
First, because the evaluations are comparative and not
benchmarked to a defined outcome, high grades or rankings do
not indicate that states have met a fair school funding
threshold. Instead, they demonstrate that some states are doing
better than others, even if improvement is still needed.
Second, the fairness measures are interrelated and complex.
Each of the indicators is important in its own right, but it is also
important to consider the interplay between measures. For
example, a state that ranks well in distribution, but very low in
overall funding levels, is unlikely to meaningfully address the
needs of students.
Third, each state’s finance system is embedded in a complicated
historical, political and economic landscape. This report does
not address these complex factors or their influence. The
findings, however, can be useful in new or ongoing efforts to
reform the finance systems to recognize the demographic and
resource needs of all students.
www.schoolfundingfairness.org 9 | P a g e
Evaluating the States
Fairness Measure #1: Funding Level School funding analyses that rely on raw per pupil funding calculations to compare spending by
state do not account for the complex differences among states and school districts that affect
education costs. To put states on a more equal footing, we have constructed a model of school
funding that predicts average funding levels while controlling for the following: student
poverty, regional wage variation, and school district size and density. The funding levels
presented here are predicted by the model at a 20% poverty rate, close to the national poverty
rate (19%).
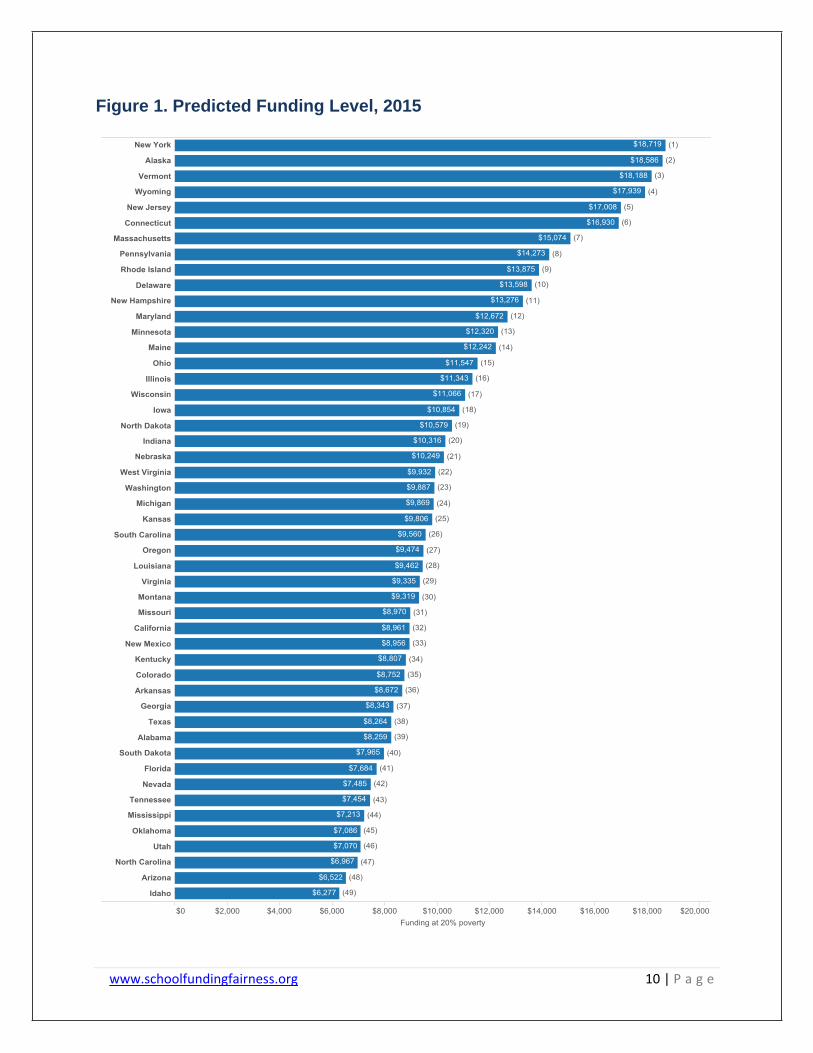
There continue to be wide disparities in funding among states. In 2015, funding levels ranged
from a high of $18,719 in New York, to a low of $6,277 in Idaho. This means the average
student in Idaho has access to only one-third of the funding available to a similar student in
New York. These vast disparities suggest wide variations in the educational opportunities
provided to students by each state.
Relative funding rankings remain consistent over time, with a few notable exceptions. Since
2007, Illinois’s rank improved from 28th to 16th, and North Dakota improved from 40th to 19th.
Florida declined from 24th to 41st, and Georgia dropped from 22nd to 37th. (See Figure 1)
Fairness Measure #2: Funding Distribution The funding distribution measure addresses the key question of whether a state’s funding
system recognizes the need for additional resources for students in settings of concentrated
student poverty. States are classified as progressive if high poverty (30%) districts receive at
least 5% additional funds over low poverty (0%) districts; regressive if high poverty districts
receive 5% less funding than low poverty districts; and flat if they fall in between.
In 2015, eleven states had progressive funding distributions, down from a high of twenty-two
in 2008. Twenty states were flat, meaning they had no substantial variation in funding between
high poverty and low poverty districts. Seventeen states had regressive funding patterns (see
Figure 2).
Utah, Delaware and Minnesota are the most progressive states and provide their highest
poverty districts with, on average, over 30% more funding per student than their lowest
poverty districts. In the most regressive states – Nevada, Illinois and North Dakota – students
in high poverty districts get less than 75 cents for every dollar received by their low poverty
counterparts. (See Figure 2)
www.schoolfundingfairness.org 10 | P a g e
Figure 1. Predicted Funding Level, 2015

www.schoolfundingfairness.org 11 | P a g e
Figure 2. State Funding Distribution, 2015
www.schoolfundingfairness.org 12 | P a g e
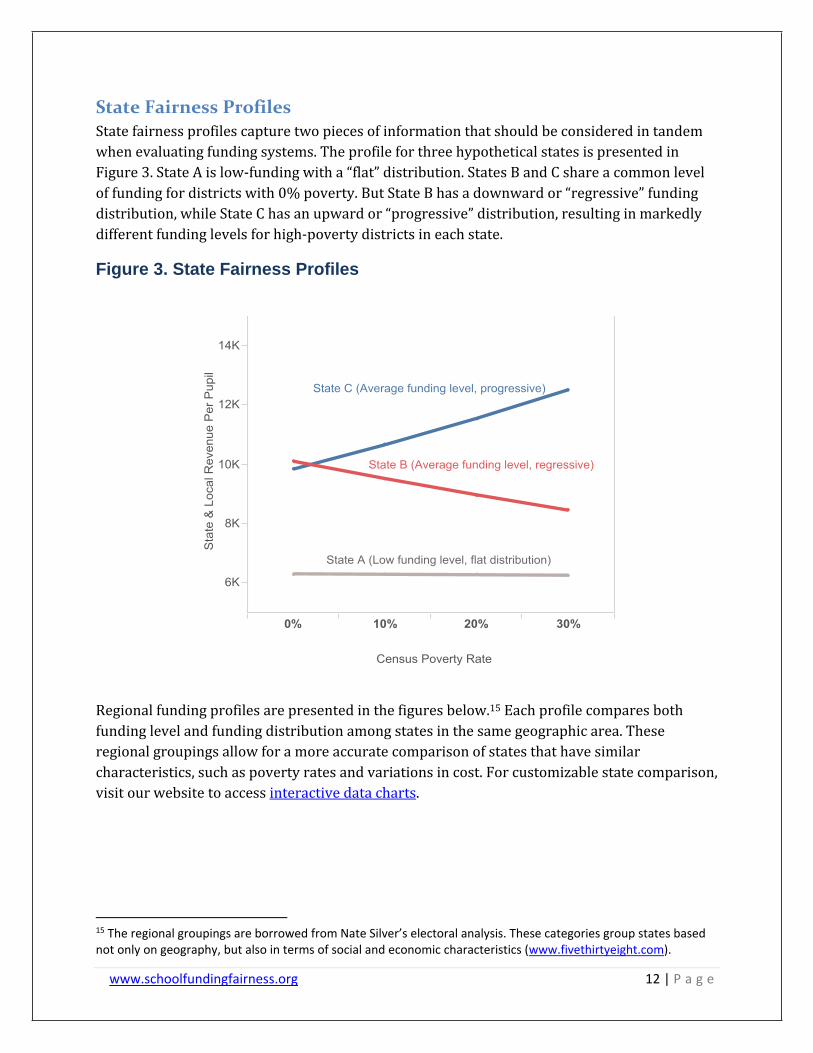
State Fairness Profiles State fairness profiles capture two pieces of information that should be considered in tandem
when evaluating funding systems. The profile for three hypothetical states is presented in
Figure 3. State A is low-funding with a “flat” distribution. States B and C share a common level
of funding for districts with 0% poverty. But State B has a downward or “regressive” funding
distribution, while State C has an upward or “progressive” distribution, resulting in markedly
different funding levels for high-poverty districts in each state.
Figure 3. State Fairness Profiles
Regional funding profiles are presented in the figures below.15 Each profile compares both
funding level and funding distribution among states in the same geographic area. These
regional groupings allow for a more accurate comparison of states that have similar
characteristics, such as poverty rates and variations in cost. For customizable state comparison,
visit our website to access interactive data charts.
15 The regional groupings are borrowed from Nate Silver’s electoral analysis. These categories group states based not only on geography, but also in terms of social and economic characteristics (www.fivethirtyeight.com).

www.schoolfundingfairness.org 13 | P a g e
Figure 4. State Fairness Profiles


www.schoolfundingfairness.org 15 | P a g e
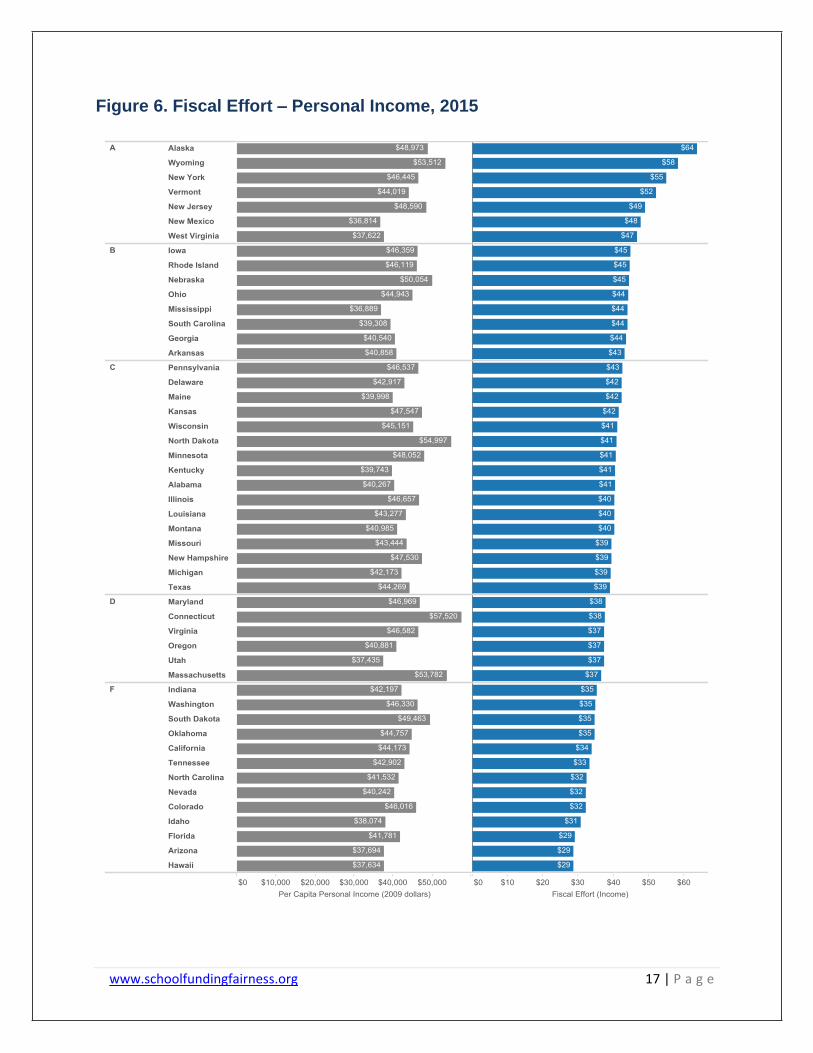
Fairness Measure #3: Fiscal Effort The Fiscal Effort index measures local and state spending on education in relation to a state’s
ability to generate revenue. Two measures of fiscal effort are taken into account: one based on
a state’s economic productivity, or gross state product (GSP), and the second based on
aggregate personal income. Fiscal effort based on gross state product represents a state’s
ability to generate revenue from economic productivity, for example, corporate income and
proceeds from natural resources. Fiscal effort based on personal income represents residents’
income capacity to pay taxes to support public services. The measures are expressed as the
dollars spent on education for every $1,000 generated in economic productivity or personal
income.
It is important to consider how states’ relative wealth and fiscal effort interact. Wealthy states
can exert relatively low effort and still generate comparatively high funding levels. Conversely,
a state with low economic output could make relatively high effort and still have poorly funded
schools.
In general, states rank similarly whether measuring effort through gross state product or
personal income. States such as Alaska, New Jersey, New York, Vermont, and Wyoming all have
relatively high fiscal effort, whether measuring spending against GSP or personal income. On
the other hand, states such as Arizona, California, Colorado, Hawaii, North Carolina, and Nevada
exert low fiscal effort on both measures. One exception is Delaware, a state with high corporate
revenues from the financial industry, but lower than average personal incomes. As a result, its
fiscal effort is low in relation to GSP, but higher than average relative to income.

www.schoolfundingfairness.org 16 | P a g e
Figure 5. Fiscal Effort – Gross State Product, 2015
www.schoolfundingfairness.org 17 | P a g e
Figure 6. Fiscal Effort – Personal Income, 2015

www.schoolfundingfairness.org 18 | P a g e
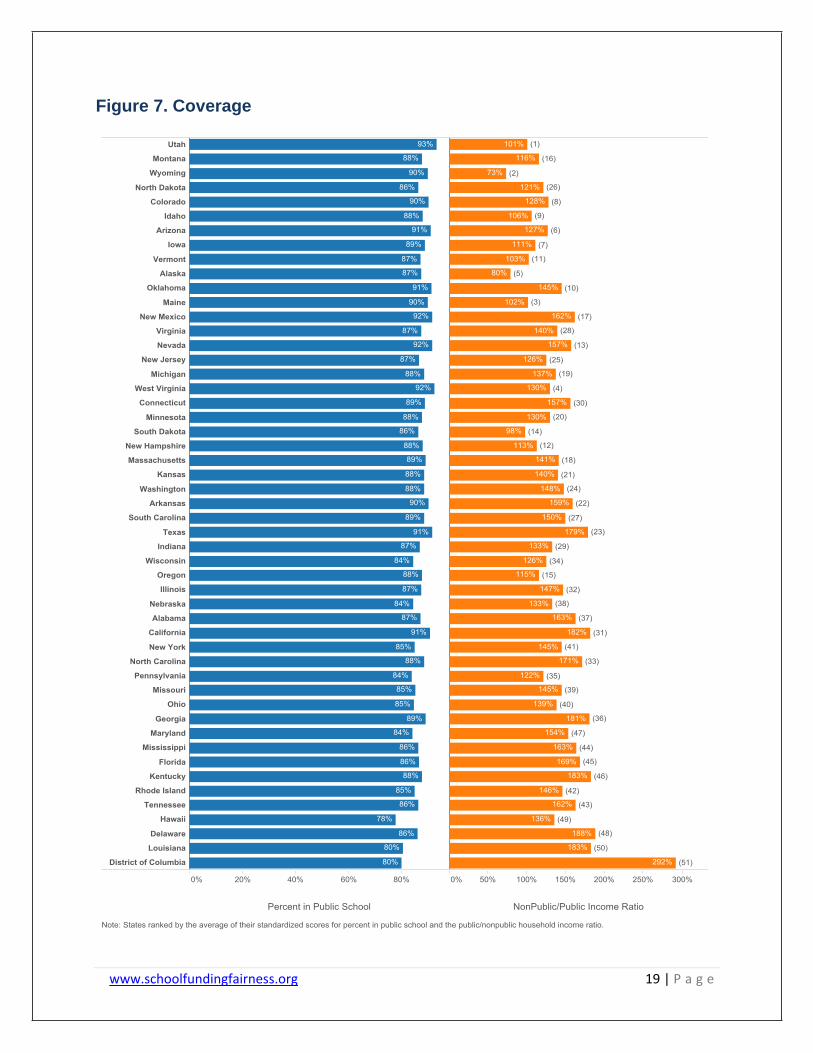
Fairness Measure #4: Coverage The coverage indicator measures the share of school-aged children enrolled in public schools
and the degree of economic disparity between households in the public and nonpublic
education systems. The coverage indicator is a gauge of several important issues. The
proportion of students enrolled in public schools affects the level of financial support necessary
for public education. There are also two important consequences when wealthier households
opt out of public education: a further concentration of poverty in the public schools and an
increase in the need for resources in those schools. Finally, when wealthier families no longer
use the public education system, it affects the public and political will necessary to generate
sufficient revenues for a fair school funding system.
The percentage of school-aged children enrolled in public school ranges from 78% in Hawaii to
a high of 93% in Utah. In several states, there are wide disparities in the incomes of families
with children in public and nonpublic schools. States such as Utah, Wyoming and Maine have
comparatively few students who opt out of public schools, and those who do are not very
economically different from their public school peers. On the other hand, the District of
Columbia, Louisiana and Hawaii have a large percentage of students, whose families are
significantly wealthier, who do not attend public schools.

www.schoolfundingfairness.org 20 | P a g e
The Four Fairness Measures Table 1 presents each state’s scores on the four fairness indicators. The table provides a
scorecard on the strengths and weaknesses of a particular state’s finance systems and how a
state’s performance compares to other states in the region and across the country.
A few major findings stand out:
New Jersey and Wyoming are the only states positioned relatively well on all four
fairness indicators.
South Carolina, Vermont, and West Virginia score well on Funding Level, Fiscal Effort
and Coverage, but score poorly on the important Funding Distribution measure. This
means that even though these states are funded relatively well, with above average
funding levels and fiscal effort, the distribution of those funds disadvantages high
poverty districts.
Arizona, Nevada, South Dakota, and Texas score poorly on all measures except
Coverage.
Colorado, North Carolina, and Utah have somewhat progressive funding systems, but
low funding levels. Without a sufficient base level of funding, even a progressive system
cannot be fair. These states also score poorly on Fiscal Effort, indicating that they have
the capacity to increase the base funding level.
California, Florida, Louisiana, and Tennessee score poorly on all measures with low
funding levels, low fiscal effort, and flat or regressive distribution of funds.

www.schoolfundingfairness.org 21 | P a g e
Table 1. National Report Card, 2015
Funding Funding Coverage
Distribution GSP Income Level
Alabama F B C 39 37
Alaska A A 2 5
Arizona F F F 48 6
Arkansas B A B 36 22
California C F F 32 31
Colorado B F F 35 8
Connecticut C C D 6 30
Delaware A F A 10 48
District of Columbia 51
Florida C F F 41 45
Georgia B C B 37 36
Hawaii F F 49
Idaho C F F 49 9
Illinois F C C 16 32
Indiana C F F 20 29
Iowa D C B 18 7
Kansas C C C 25 21
Kentucky C C C 34 46
Louisiana C D C 28 50
Maine F A C 14 3
Maryland D C C 12 47
Massachusetts A D D 7 18
Michigan C C C 24 19
Minnesota A C C 13 20
Mississippi C A B 44 44
Missouri F C C 31 39
Montana D B C 30 16
Nebraska C C B 21 38
Nevada F F F 42 13
Fiscal Effort

www.schoolfundingfairness.org 22 | P a g e
Table 1. The National Report Card (cont.)
Funding Funding Coverage
Distribution GSP Income Level
New Hampshire D B C 11 12
New Jersey A A A 5 25
New Mexico D C A 33 17
New York C A A 1 41
North Carolina B F F 47 33
North Dakota F F F 19 26
Ohio A C B 15 40
Oklahoma C F F 45 10
Oregon C F D 27 15
Pennsylvania C B C 8 35
Rhode Island D A A 9 42
South Carolina C A A 26 27
South Dakota F F F 40 14
Tennessee C F F 43 43
Texas D F D 38 23
Utah A F C 46 1
Vermont C A A 3 11
Virginia F C C 29 28
Washington C F F 23 24
West Virginia C A A 22 4
Wisconsin B C C 17 34
Wyoming A A A 4 2
Fiscal Effort
Note: Funding Level and Coverage rankings are colored by quartiles: Q1, Q2, Q3, Q4.

www.schoolfundingfairness.org 23 | P a g e
Fair School Funding and Resource Allocation This section explores the impact of funding fairness, or lack thereof, on schools and students
through three resource allocation indicators. These indicators are examples of how a state’s
funding priorities affect the quality and breadth of educational opportunities available for
students. Information on methodology and data sources can be found in Appendix A. Detailed,
longitudinal data tables for these indicators can be found in Appendix C.
Early Childhood Education Access to early childhood education is a critical component of a fair and equitable education
system. Research shows that low-income children often come to school lagging behind their
peers academically. High quality preschool programs can help reduce those gaps.16 States vary
in the degree to which early education programs are available to young children across the
socioeconomic spectrum. States that recognize the need for early interventions in children’s
educational careers can promote and support early education programs that focus on
providing opportunities for low-income families.
Not surprisingly, there is great variation in the extent to which young children are enrolled in
early childhood programs in the states. Total enrollment of 3- and 4-year-olds ranges from a
high of 77% in the District of Columbia to a low of 27% in Idaho. Enrollment of low-income
children ranges from 72% in the District of Columbia to only 22% in North Dakota.
Though the importance of early childhood education for low-income children is well
documented, in most states these children are still less likely to be enrolled than their peers.
Only a handful of states enroll proportionally more low-income students in early childhood
programs. In South Dakota, Wyoming, Vermont, and Montana, low-income children are more
likely than their peers to be enrolled in early education, as depicted by the enrollment ratio. In
the vast majority of states, low-income children are considerably less likely to be enrolled than
their peers. In states such as West Virginia, North Dakota, Alaska, and Maine, enrollment rates
in general are very low, with about a third of children enrolled in early education. But
participation is much lower among low-income students, with only about one in five enrolled in
a program.
Wage Competitiveness A state’s ability to attract and retain high quality teachers is a fundamental component of a
strong and equitable school system. Because teachers’ salaries and benefits make up the bulk of
school budgets, a fair school funding system is required to maintain an equitable distribution of
high quality teachers in all districts. One of the most important ways that states can ensure that
teaching jobs remain desirable in the job market is to provide competitive wages.
16 For a review, see W.S. Barnett. 2011. “Effectiveness of early educational intervention.” Science, 333, 975-978.

www.schoolfundingfairness.org 24 | P a g e
We have constructed a measure of wage competiveness that compares teachers’ salaries to the
salaries of other professionals in the same labor market and of similar age, degree level and
hours worked. Results are reported for 25-year-olds.
Most states’ average teachers’ salaries are far below the salaries of their non-teacher
counterparts. On average, teachers beginning their careers at age 25 earn about 82% of what
non-teachers earn. Only three states have average teacher wages that are comparable to
similar workers: Wyoming, Alaska, and Iowa. Wages are least competitive in Colorado, New
Hampshire, Virginia, Utah, and Washington, where teachers earn about 30% less than their
counterparts.
Teacher-to-Student Ratios The fundamental premise of fair school funding is that additional resources are required to
address the needs of students in poverty. High poverty schools require more staff to address
the challenges of serving low-income students, since these students benefit from smaller class
sizes, literacy and math specialists, instructional coaches, and social services such as counselors
and nurses. Our measure of staffing fairness compares the number of teachers per 100
students in high and low poverty districts.
The staffing fairness measure ranges from a progressive 154% in North Dakota to a regressive
75% in Florida. In other words, high poverty districts in North Dakota have, on average, 40%
more teachers per 100 students than low poverty districts, potentially resulting in smaller class
sizes, while in Florida, the poorest districts have about 25% fewer teachers per 100 students
than low poverty districts. Predicted staff to student ratios, at 20% poverty, range from a high
of 9.2 teachers per 100 students in North Dakota to a low of 4.4 in California.
Nineteen states have a progressive distribution of teachers, i.e., at least 5% more teachers per
student in high poverty districts. Ten states are regressive and have fewer teachers per student
in high poverty districts. The remaining nineteen states have essentially no difference in
staffing ratios between low and high poverty districts. This means the majority of states are
failing to systematically provide an equitable distribution of teachers so that high poverty
schools have smaller teacher-to-student ratios than low poverty schools.

www.schoolfundingfairness.org 25 | P a g e
Figure 8. Early Childhood Education

www.schoolfundingfairness.org 26 | P a g e
Figure 9. Wage Competitiveness

www.schoolfundingfairness.org 27 | P a g e
Figure 10. Teacher to Student Fairness Ratio

www.schoolfundingfairness.org 28 | P a g e
How Much is Enough? The National Report Card shows wide disparities in education funding among states, with the
lowest funded states providing less than a third of what the highest funded states provide their
schools. Most states’ finance systems also fail to increase funding to address higher levels of
student poverty in districts.
For policymakers, the key question is: how much should a state spend to meet the goal of
student academic proficiency as measured by state standards? To date, this analysis has not
been possible at the national level. Because each state sets its own academic standards and
faces unique economic conditions, no national study has been able to identify each state’s
ability to achieve common academic outcomes nor assess the cost of reaching that goal.
The National Education Cost Model (NECM) fills this gap in existing research. The model uses
newly available, district-level estimates of school expenditures, student population
characteristics, economic conditions, and assessments of reading and math that are
comparable across states to determine how much each district and state must spend to achieve
national average outcomes.
The report, The Real Shame of the Nation: The Causes and Consequences of Interstate Inequity in
Public School Investments, provides a deeper and sobering analysis of the condition of the 50
state finance systems.17 The report shows egregiously uneven investment in public schooling
across states and equally egregious differences in the ability of state public education systems
to achieve even modest student outcomes. In fact, most states do not provide enough funding
for their highest poverty children to achieve average outcomes. In some states, the funding
disparity for the most vulnerable students exceeds $10,000 per pupil. The handful of states that
are successfully targeting resources to higher poverty districts have student outcomes to
match.
The NECM and the Shame of the Nation report have important policy implications: school
finance reform and increased investment is essential to improve student outcomes in those
states and districts that are presently most deprived of resources. Further, to reduce
achievement gaps both within and among states, an effective federal policy is needed to boost
investments in states to reduce interstate inequality while encouraging states with unrealized
capacity to do more to address their own shortfalls.
The National Report Card, the NECM, and the Shame of the Nation report offer irrefutable
evidence of the failure of finance systems in most states to provide all children with the
opportunity for educational success. Together these reports are a resounding and urgent call to
action for state school finance reform.
17 Report is authored by Bruce D. Baker, Mark Weber, Ajay Srikanth, Robert Kim and Michael Atzbi.

www.schoolfundingfairness.org 29 | P a g e
Appendix A: Data and Methodology
Fairness Measures Funding Level: A regression model predicts an average per-pupil funding level for each state,
while holding other factors constant. This eliminates the variation in funding associated with
characteristics that vary between districts and across states, and determines average funding
at the state level under a hypothetical, yet meaningful, set of conditions. State and local funding
levels are predicted with the following variables: student poverty, regional wage variation,
economies of scale, population density, and the interaction between economies of scale and
density. Reported funding levels are predicted using national averages for all independent
variables and a poverty rate of 20%.
The regression equation includes a panel of 25 years of data and presents estimates for the
most recent five years. Models used in previous editions only included 3-year panels, with
estimates reported for the most recent year. Due to this change in modeling, there will be slight
differences between the results of this edition and previously published editions.
Funding Distribution: Using the above regression model, the relationship between student
poverty and school funding is estimated for each state. Funding levels are predicted for poverty
levels at 10% intervals from 0% to 30% under the average conditions within each state. The
fairness ratio is calculated by dividing state and local funding at 30% poverty by funding at 0%
poverty. A higher ratio indicates greater fairness.
Fiscal Effort: The two Fiscal Effort indices are calculated by dividing the total direct expense for
elementary and secondary education by: 1) state gross domestic product, and 2) aggregate
personal income. The indices are expressed as education spending per $1,000 of GSP or
personal income.
Coverage: The Coverage indicator includes two measures. First is the proportion of school-aged
children attending the state’s public schools, as opposed to private schools, homeschooling, or
not attending school at all. The second is the ratio of median household income of students who
are enrolled in public schools to those who are not. The Coverage rankings are computed by
calculating a standardized score (z-score) for each measure and then taking the average.

www.schoolfundingfairness.org 30 | P a g e
Table A-1. Data Sources
Indicator Data Element Data Source Funding Level & Funding Distribution
Local and state revenues per pupil
U.S. Census F-33 Public Elementary-Secondary Education Finance Survey
http://www.census.gov/govs/school/
Student poverty rates
U.S. Census Small Area Income and Poverty Estimates
http://www.census.gov/did/www/saipe/data/index.html
Regional wage variation
Taylor’s Extended NCES Comparable Wage Index
http://bush.tamu.edu/research/faculty/Taylor_CWI
Economies of Scale/District Size
NCES Common Core of Data – Local Education Agency Universe Survey
http://nces.ed.gov/ccd/
Population Density U.S. Census Population Estimates
https://www.census.gov/popest/index.html
Effort Gross State Product Bureau of Economic Analysis
http://bea.gov/itable/
Personal Income Bureau of Economic Analysis
http://bea.gov/itable/
Total direct expense for elementary and secondary education
The Urban Institute-Brookings Institution Tax Policy Center Data Query System (SLF-DQS)
http://slfdqs.taxpolicycenter.org
Coverage % 6-16 year olds enrolled in school
U.S. Census American Community Survey
Integrated Public Use Micro Data System www.ipums.org (3-Year Sample)
Median household income by school enrollment
U.S. Census American Community Survey
Integrated Public Use Micro Data System www.ipums.org (3-Year Sample)
Early Childhood Education
School enrollment of 3- and 4-year-olds by household income
U.S. Census American Community Survey
Integrated Public Use Micro Data System www.ipums.org (3-Year Sample)
Teacher-to-Student Fairness
District teachers per 100 students
NCES Common Core of Data – Local Education Agency Universe Survey
http://nces.ed.gov/ccd/
Wage Competitiveness
Teacher and non-teacher wages
U.S. Census American Community Survey
Integrated Public Use Micro Data System www.ipums.org (3-Year Sample)

www.schoolfundingfairness.org 31 | P a g e
Resource Allocation Indicators Early Childhood: The early childhood indicator compares school enrollment rates for 3- and 4-
year-olds by income level. Low-income is defined as family income below 185% of the federal
poverty level. This is the threshold at which students qualify for free or reduced price lunch.
School enrollment is not limited to public school, and there are no restrictions on the number
of days per week or hours per day the student attends. The ratio is calculated as the percentage
of enrolled low-income students over the percentage of enrolled not low-income students.
States are ranked on this ratio.
Wage Competitiveness: This indicator uses a regression model predicting average wages for
teachers and non-teachers while controlling for age, education, and hours/weeks worked. The
ratio of wages between teachers and non-teachers is computed at age 25 and indicates whether
teachers, on average, are paid more or less than non-teachers.
Teacher-to-Student Ratios: The teacher-to-student ratio fairness measure is calculated by
generating a regression model to establish the relationship between district teacher-to-student
ratios (teachers per 100 students) and student poverty. Similar to the funding fairness analysis,
the model controls for size, sparsity, and poverty and then estimates teacher-to-student ratios
at various poverty levels for each state. The fairness ratio is calculated by dividing the
predicted teacher-to-student ratio at 30% poverty by the predicted ratio at 0% poverty.

Appendix B: Fairness MeasuresTable B‐1. Funding Level
Funding Level
Rank Funding Level RankFunding
LevelRank
Funding Level
RankFunding
LevelRank
Alabama $7,830 37 $7,882 37 $7,870 37 $8,155 37 $8,259 39
Alaska $14,527 3 $15,326 3 $17,719 1 $16,770 3 $18,586 2
Arizona $6,618 46 $6,370 47 $6,499 47 $6,778 47 $6,522 48
Arkansas $8,245 30 $8,536 31 $8,418 32 $8,711 32 $8,672 36
California $7,730 38 $7,612 39 $7,734 38 $8,363 36 $8,961 32
Colorado $8,024 35 $7,978 36 $8,226 35 $8,453 35 $8,752 35
Connecticut $13,984 5 $15,237 4 $15,802 4 $16,549 4 $16,930 6
Delaware $11,444 12 $12,462 10 $13,563 8 $13,608 10 $13,598 10
Florida $7,396 41 $7,051 42 $7,196 42 $7,618 41 $7,684 41
Georgia $8,208 31 $8,144 35 $7,990 36 $8,112 38 $8,343 37
Idaho $6,145 48 $5,764 49 $5,831 49 $5,872 49 $6,277 49
Illinois $10,389 16 $10,651 16 $10,788 15 $11,192 15 $11,343 16
Indiana $9,860 19 $10,165 20 $10,192 19 $10,376 20 $10,316 20
Iowa $9,942 18 $10,244 19 $10,312 18 $10,582 18 $10,854 18
Kansas $9,148 22 $9,546 22 $9,559 22 $9,780 23 $9,806 25
Kentucky $8,110 34 $8,310 32 $8,449 31 $8,521 34 $8,807 34
Louisiana $8,616 26 $9,017 25 $8,995 28 $9,177 28 $9,462 28
Maine $11,234 13 $10,876 15 $11,532 13 $12,191 13 $12,242 14
Maryland $11,879 10 $12,315 11 $12,391 12 $12,706 12 $12,672 12
Massachusetts $13,349 6 $13,847 6 $14,277 6 $14,988 5 $15,074 7
Michigan $9,121 23 $9,205 24 $9,403 23 $9,640 25 $9,869 24
Minnesota $11,215 14 $11,190 14 $11,409 14 $11,734 14 $12,320 13
Mississippi $6,633 45 $6,827 44 $6,924 44 $7,071 45 $7,213 44
Missouri $8,202 32 $8,698 29 $8,779 30 $8,900 31 $8,970 31
Montana $8,358 29 $8,582 30 $8,800 29 $9,007 30 $9,319 30
Nebraska $9,502 20 $9,610 21 $9,919 21 $10,284 22 $10,249 21
Nevada $7,329 43 $7,399 41 $7,345 41 $7,436 42 $7,485 42
New Hampshire $11,561 11 $12,150 12 $12,614 11 $13,100 11 $13,276 11
New Jersey $14,270 4 $16,397 2 $16,516 3 $17,046 2 $17,008 5
New Mexico $8,121 33 $8,204 33 $8,252 34 $8,611 33 $8,956 33
New York $16,190 1 $17,019 1 $17,508 2 $18,190 1 $18,719 1
North Carolina $7,646 40 $6,617 46 $6,697 46 $7,383 44 $6,967 47
North Dakota $9,026 24 $9,309 23 $9,369 24 $10,550 19 $10,579 19
Ohio $10,301 17 $10,285 18 $10,421 17 $10,988 16 $11,547 15
Oklahoma $6,596 47 $6,747 45 $6,807 45 $7,059 46 $7,086 45
Oregon $7,868 36 $8,191 34 $8,273 33 $9,021 29 $9,474 27
Pennsylvania $11,985 9 $12,498 9 $13,047 10 $13,813 8 $14,273 8
Rhode Island $12,414 8 $12,643 8 $13,241 9 $13,674 9 $13,875 9
South Carolina $8,609 27 $8,785 27 $9,312 25 $9,431 26 $9,560 26
South Dakota $7,366 42 $7,543 40 $7,685 39 $7,872 40 $7,965 40
Tennessee $6,694 44 $6,880 43 $6,950 43 $7,393 43 $7,454 43
Texas $7,706 39 $7,666 38 $7,627 40 $8,018 39 $8,264 38
Utah $6,040 49 $6,182 48 $6,310 48 $6,551 48 $7,070 46
Vermont $12,919 7 $13,363 7 $13,780 7 $14,734 6 $18,188 3
Virginia $8,633 25 $8,747 28 $9,104 26 $9,231 27 $9,335 29
Washington $8,544 28 $8,813 26 $9,039 27 $9,694 24 $9,887 23
West Virginia $9,348 21 $11,434 13 $10,006 20 $10,296 21 $9,932 22
Wisconsin $11,005 15 $10,515 17 $10,569 16 $10,807 17 $11,066 17
Wyoming $14,646 2 $14,237 5 $14,614 5 $14,587 7 $17,939 4
20152011 2012 2013 2014
www.schoolfundingfairness.org
____________________________________________________________________________________________
_
32 | Page

Appendix D: Student Poverty Measures
State Census SAIPEPoverty
Free/ReducedLunch Eligible
(NCES)
Alabama
Alaska
Arizona
Arkansas
California
Colorado
Connecticut
Delaware
District ofColumbia
Florida
Georgia
Hawaii
Idaho
Illinois
Indiana
Iowa
Kansas
Kentucky
Louisiana
Maine
Maryland
Massachusetts
Michigan
Minnesota
Mississippi
Missouri 51%
74%
38%
47%
40%
45%
47%
64%
57%
50%
41%
49%
54%
49%
50%
62%
58%
92%
37%
38%
42%
59%
62%
43%
52%
18%
30%
12%
20%
14%
13%
15%
26%
23%
15%
13%
18%
18%
15%
13%
23%
22%
29%
18%
13%
13%
20%
24%
23%
13%
25%
State Census SAIPEPoverty
Free/ReducedLunch Eligible
(NCES)
Montana
Nebraska
Nevada
New Hampshire
New Jersey
New Mexico
New York
North Carolina
North Dakota
Ohio
Oklahoma
Oregon
Pennsylvania
Rhode Island
South Carolina
South Dakota
Tennessee
Texas
Utah
Vermont
Virginia
Washington
West Virginia
Wisconsin
Wyoming 38%
41%
46%
46%
40%
39%
37%
59%
56%
40%
56%
47%
46%
51%
60%
45%
30%
57%
51%
63%
37%
29%
52%
44%
44%
11%
15%
22%
14%
14%
12%
11%
22%
22%
15%
23%
19%
17%
18%
20%
19%
10%
22%
21%
25%
14%
10%
20%
14%
16%
Note: Census student poverty is the number of children age 5-17 below the poverty threshold. FRL is the number of public school students eligible for free orreduced-price lunch (below 185% of the poverty threshold). Arizona's FRL data did not meet NCES data quality standards.
Source: U.S. Census, Small Area Income Population Estimates, School District Estimates; National Center for Education Statistics, Elementary - Secondary InformationSystem._____________________________________________________________________________________________________________________
www.schoolfundingfairness.org 40 | Page