irrigation and autocracy - web.econ.ku.dkweb.econ.ku.dk/bentzen/irrigation_and_autocracy.pdf ·...
TRANSCRIPT
Irrigation and Autocracy
Jeanet Sinding Bentzen Nicolai Kaarsen Asger Moll Wingender∗
June 11, 2015
Abstract
Irrigated agriculture makes societies more likely to be ruled by an authoritarian elite.
This effect has been hypothesized by many European intellectuals over the centuries. We
use statistical methods to demonstrate that the effect exists across countries, within coun-
tries, and across premodern societies surveyed by ethnographers. To avoid endogeneity,
we use geographical and climatic variation to identify irrigation dependent societies. We
find that countries whose agriculture entirely depends on irrigation are about six points
less democratic on the 21-point polity2-scale than countries where agriculture is rainfed.
Our results reflect that irrigation allows landed elites in arid areas to monopolize water
and consequently arable land. That makes elites more powerful, and better able to oppose
democratization than their peers in rainfed societies. Consistent with this conjecture, we
show empirically that historical land inequality is an important mediator for the effect
of irrigation dependence on present institutions.
KEYWORDS: Democracy, resource curse, institutions, irrigation.
∗All authors are affi liated with the Department of Economics, University of Copenhagen, Øster Farimags-gade 5, building 26, DK-1353 Copenhagen K, Denmark. Additional contact information: Bentzen:[email protected], Kaarsen: [email protected], Wingender: [email protected]. We thankDaron Acemoglu, Oana Borcan, Antonio Ciccone, Carl-Johan Dalgaard, Jacob Gerner Hariri, James Robin-son, Hans-Joachim Voth, David Weil, seminar participants at Brown University, ISET, Pompeu Fabra, andUniversity of Copenhagen; participants at the Growth and Development Conference at ISI, New Delhi; theNordic Conference in Development Economics, and the Congress of the European Economic Association; andfour anonymous referees for useful comments. We gratefully acknowledge financial support from the CarlsbergFoundation and the Danish Council for Independent Research.
1

1 Introduction
We show empirically that societies whose agriculture has been based on irrigation are more
unequal economically and politically than societies with rainfed agriculture. Irrigation allowed
landed elites to monopolize water in areas with little rain, and they could consequently extract
monopoly rents from peasants working their land. Irrigation-based societies thereby became
more unequal than rainfed societies, and the high inequality made democracy less likely to
take root.
The idea that irrigation leads to oppressive institutions is not new. It is part of Karl
Marx’s theory of the Asiatic Mode of Production, but the idea is most forcefully articulated
by Karl August Wittfogel in his book Oriental Despotism.1 Marx and Wittfogel analyze a
few historical case studies of centralized and despotic states underpinned by irrigation, such
as ancient Egypt, Mesopotamia, India, China, the Chagga (Tanzania), and the pre-columbian
Andean and Mexican civilizations. We are the first to go beyond the historical case studies
and use statistical methods to test the link between irrigation and present-day institutions.
We need to distinguish between societies based on irrigation and societies based on rainfed
agriculture in our empirical analysis. The extent of irrigation is likely to be endogenous,
however, as authoritarian leaders may be more willing and capable of undertaking large scale
irrigation works. To rule out reverse causality, we use a measure of irrigation potential based on
exogenous geographical and climatic variables to identify societies that were based on irrigation
historically.
In the first part of our empirical analysis, we show that countries with a high irrigation
potential are more likely to be autocratic today as measured by the polity2 index from the
Marshall et al. (2010) Polity IV database. Our estimates imply that on the 21 point polity2-
scale of democracy, a country with only rainfed agriculture is about six points more democratic
than a country with only irrigated agriculture. The results are robust to a wide range of
control variables capturing variation in geography, climate, resource endowments, development,
religion, and colonial history. Colonization dilutes the effect of irrigation somewhat, consistent
1Marx (1853) and Wittfogel (1957). Marx and Wittfogel were inspired by earlier writings on irrigation byprominent intellectuals ranging from Aristotle and Herodotus, to Montesqieu, Hegel, Adams Smith, and JohnStewart Mill. See O’Leary (1989) for an account of the history of thought on the Asiatic Mode of Production.
2

with a lasting impact of European presence on institutions.2
To check the robustness of our results to possible unobserved confounders at the country-
level, we move to subnational evidence in the second part of our analysis. We demonstrate
that respondents in the World Values Survey are less likely to view democracy as the best form
of government if they live in districts with high irrigation potential.
We argue that our results are caused by the fundamental differences between irrigated and
rainfed agriculture: Irrigated agriculture depends on dams, canals, and other costly infrastruc-
ture. In premodern societies, without well-functioning capital markets, only a monarch or
members of local feudal elites could command the necessary resources to invest in large scale
irrigation. By owning the irrigation infrastructure, the elites gained a natural monopoly over
water in areas with little rain. This monopoly caused a concentration of land ownership. Not
just because the elites were more likely to build irrigation systems in hitherto barren areas if
they themselves owned the land. But also because absentee landlordism became more attrac-
tive by irrigation. Tenants, who could not afford to construct irrigation systems themselves,
had few outside options in areas where irrigation was a necessity. This increased the bargain-
ing power of land owners, and consequently the potential for rent-seeking. The potential for
rent-seeking by land owners was amplified by the spatial concentration and predictable yields
of irrigated agriculture which reduced the costs of monitoring tenants.3
To support our argument we proceed to demonstrate that a concentration of land ownership
did exist historically in areas with irrigation. In a sample of premodern societies surveyed by
ethnographers, we find that societies whose agriculture was based on irrigation were about 30
percentage points more likely to be ruled by an elite. We find the same pattern in country-
level data from the middle of the 20th century: land inequality was significantly higher in
countries with a high irrigation potential. Consistent with the transmission mechanism we
propose, we demonstrate a link from historical land inequality to present autocracy. We do
so by using irrigation potential as one of two instrumental variables for land inequality. The
other instrument is the suitability for cereals relative to plantation crops, a group of crops
2E.g., Acemoglu et al. (2001), Feyrer & Sacerdote (2009), Olsson (2009), Dell (2010) and Hariri (2012).3Mayshar et al. (2012).
3
which are known from prior studies to increase land inequality.4 Instrumented historical land
inequality exerts a large and statistically significant effect on the polity2−index of democracy.Moreover, the use of two instruments allows us to test the exclusion restrictions by a Hansen
overidentification test. The test rejects the null that irrigation potential has an effect on the
polity2−index of democracy beyond its effect on land inequality. The overidentification test haslow power, but the result is consistent with our hypothesis that irrigation concentrated wealth
and land in the hands of a landed elite opposed to democracy. The elite set up oppressive
institutions to protect their natural monopolies of water and land. They were particularly
opposed to democracy out of fear that enfranchised peasants would vote for land reform.
Large land owners were, for instance, among the main supporters of the authoritarian regimes
in North African countries prior to the Arab spring.5 In Pakistan, much of the political elite
derives from the class of big landholders in the heavily irrigated Indus basin, and they have
successfully thwarted many attempts at land reforms.6
Our paper is related to studies by Engerman & Sokoloff (1997, 2000, 2002, 2005) of how
agriculture put temperate America and tropical America on different development trajecto-
ries.7 Tropical crops such as sugar, bananas, and coffee could profitably be grown on large
scale plantations using slave labor. By contrast, plantations and slavery were not viable in
the temperate parts of the Americas where cereals were the main crops. As irrigation, the
plantation system created a powerful landed elite who successfully prevented the emergence of
democratic institutions akin to the ones that took hold in the United States and Canada.
Our paper is also related to studies by Haber (2012) and Welzel (2014), who both demon-
strate a link between rainfall and democracy.8 Democracies are, according to Haber (2012),
found in areas with moderate rainfall. Moderate rainfall is conducive to cereal production
characterized by small minimum effi cient scales, low barriers to entry, storability, and high
local variation in output. The first two characteristics provide opportunities for small in-
dependent farmers, and the other two opportunities for accumulation and trade. This gave
4See, e.g., Easterly (2007) and the discussion below.5King (2007).6Malik (2010).7See also Lagerloef (2004), Easterly (2007), Soares et al. (2012), and Ager (2013).8Haber (2012) is a revised version of an earlier paper by Haber & Menaldo (2010).
4

rise to relatively egalitarian societies who would favor property rights and constraints on the
executive.
Irrigation systems are usually large in scale, and the high fixed costs are a barrier to entry.
So the hypothesis we test in this paper is embedded in the multifaceted theory of Haber
(2012). We run a horse race regression between the impact of irrigation potential and that of a
nonlinear effect of rainfall use to test his theory Haber. Both effects have a significant impact
on the polity2-index when included separately in regressions, but rainfall becomes insignificant
when they are included together.
Welzel (2013, 2014) shows that temperate societies with plenty of rainfall tend to be more
democratic, have stronger preferences for freedom, and develop faster economically. The first
part of the explanation is, according to Welzel, water autonomy: rain made fresh water avail-
able to everyone, which, among other things, prevented the centralization of irrigated societies.
The second part of the explanation is that cool weather curbed the spread of diseases. In this
paper, we confirm the first conjecture by testing the irrigation hypothesis directly.
The link between irrigation and autocracy is an example of the resource curse, i.e., the
empirical finding that natural resource abundance curses societies with poor institutions. Oil
is the classic example, cf. Ross (2001, 2012), but hardly the only one. Numerous scholars,
including Auty (2001), Isham et al. (2005), Bulte et al. (2005), Boschini et al. (2007),
and Williams (2011), have shown that broad measures of oil, mineral, and plantation crops
wealth are associated with poor institutions in developing countries. What oil, minerals, and
plantations crops have in common with water for irrigation is that they are "point-source"
resources, i.e., resources that are easy to monopolize. Cereals and other crops grown in irrigated
areas may be less valuable than oil or gold, but food production has been the main economic
activity for most of human history. So it is, perhaps, not surprising that we find that irrigation
has at least as large effect on institutions as the other point source resources studied in the
literature.
5
2 Irrigation: a mixed blessing
Before we begin a detailed discussion of irrigation and institutions, a small note on terminology
is warranted: We use the term "irrigation" as shorthand for traditional irrigation methods
based on surface water and gravity. The advent of diesel and electric motors in the 20th century
gave farmers access to a new source of power, and hence a new source of water: ground water
pumped from aquifers. This permitted a different sort of irrigation based on wells drilled by
individual farmers which did not have the same impact on institutions as traditional irrigation
methods. Economic development and other 20th century technologies also made irrigation
viable in many areas with no history of irrigation. We discuss modern irrigation techniques in
Section 3, where we introduce our measure of irrigation potential.
2.1 A natural monopoly
Irrigation can turn barren land into fertile fields. In warmer climates, irrigation may allow for
multiple harvests every year in areas where the local rainfall permits only one or none at all.
But irrigation has drawbacks, too. Irrigation infrastructure can profitably be monopolized by
a rent-seeking elite, just as oil-drilling and mining in developing countries tend to be. One
reason is that irrigation systems require large fixed costs to construct, and the gains are often
spread across many farmers and over many years. Absent well-functioning capital markets,
local land lords or centralized governments are in a better position to finance the construction
of irrigation systems than individual farmers, and consequently to claim ownership. The
geographer Commodore B. Fisher observed this firsthand in early 20th century Persia:
"Because of the expense and the diffi culty of cooperative effort on the part of
small landowners, these irrigation systems are privately owned and tend to perpet-
uate the feudal system which is well organized in Persia today. A wealthy family
can purchase an extensive tract of desert land, make a large investment in a water
system, and attract hundreds of tenants who are eager to make their homes around
the water supply. Under the need of water and the diffi culty of securing it, these
6

tenants are easily reduced to virtual slavery."9
Because peasants were unable to construct their own irrigation system, they had no other
choice than to rely on the ones owned by the landed elite. The elite therefore gained a local
natural monopoly over water. As described in the quote by Commodore B. Fisher, the local
monopoly of water essentially amounted to a monopoly of fertile lands. Absent any modern
regulation of natural monopolies, the owners of irrigation systems were free to extract monopoly
rents from the peasants. And rent-seeking led to a more unequal distribution of wealth.
The scope for rent-seeking is amplified by other characteristics of irrigated agriculture:
Predictable high yields, and production in confined geographical areas. Yields are predictable
since the amount of water allocated to each plot is observed and deliberate.10 In medieval
Egypt, for example, accurate estimates of yields were calculated in advance by observing the
height reached by the annual floods, and taxes were set accordingly.11 Predictable yields and
the spatial concentration of irrigation reduce the costs of monitoring agricultural production,
and absentee landlordism based on sharecropping or serfdom thereby become attractive. Land
owners do not need to monitor effort directly. Shirking can be prevented by promising severe
punishment if the sharecropper or serf fails to produce the amount of crops predicted by
the water allocated to his plot. Large landholdings are therefore more attractive in irrigated
societies than in rainfed areas and, as a consequence, a centralization of land ownership is more
likely to occur.
Mayshar et al. (2012) formalize this mechanism in a principal-agent model, and apply it to
a case study of ancient Mesopotamia.12 Agriculture in Lower Mesopotamia (Babylonia) was fed
by water from Tigris and Euphrates, and land ownership was concentrated within a small, but
powerful elite. By contrast, agriculture in Upper Mesopotamia was rainfed, and independent
owner-occupied farms were prevalent. Braudel (1972) similarly describes how a traveller in
16th century Spain "passing from the secanos to the regadios - the dry to the irrigated zones -9Fisher (1928).10Mayshar et al. (2012).11Cooper (1976).12The case study builds on Renger (1995).The model also predicts under which conditions an irrigation-based
society becomes centralized, as with the Pharaos in Egypt, or decentralized, as in Mesopotamia where the locallanded elites had more power relative to the center. This part of their analysis concerns the distribution ofrents amongst the elite. We are interested in how large rents the elite is able to extract from the pesants.
7
left behind a relatively free peasant to find a peasant slave."13 The same pattern is found in a
quantitative study of early 20th century Punjab by Islam (1997). He shows that the correlation
between the share of land with canal irrigation and the share of land tilled by tenants rather
than independent farmers is 0.58 across districts. Serfdom and sharecropping also appear to
have been the norm in the ancient societies as discussed by Wittfogel (1957).
Archaeologists and anthropologists give numerous examples of societies where an elite based
their power on irrigation.14 Hayashida (2006) describes a society existing from around 900-
1532 AD in the Pampa de Chaparrí on the North coast of Peru. The society was governed by
a hierarchical system of lords who distributed water to the local farmers in return for corvée
labor. Another example is the princely state of Hunza in Pakistan, established by Mir Silim
Khan in 1790.15 When Silim Khan came to power, he ordered the construction of massive
irrigation systems. The allocation of water to each Hunza village was overseen by a hierarchy
of offi cials, who also directed when villagers should plant, harvest, and do maintenance work
on the irrigation infrastructure. The irrigation system generated large amounts of revenue for
the Mir and his offi cials. In that respect, the Hunza state resembles modern Uzbekistan. A
major source of revenue for the Uzbek government derives from its control of the country’s
irrigated cotton fields.
Both the Hunza state and modern Uzbekistan are examples of centralized despotic states
of the kind envisioned by Marx and Wittfogel. Yet, irrigation needs not lead to centralization
at the national level. Irrigation systems have to be managed locally, and, as we have argued
above, this management was often firmly in the hands of a local landed elite. The degree of
centralization depends on the circumstances. For instance, whether the elites find centralization
to be desirable, or how well a central government can monitor and tax the landed elite.16
Centralization or not, irrigation concentrated land ownership in the hands of an elite with no
interest in democracy.
13Braudel (1972), page 75.14See Mitchell (1973) and Hunt & Hunt (1976) for an overview of the literature, including some counter-
examples.15See Sidky (1997).16See Mayshar et al. (2012) for a discussion of the latter.
8
2.2 Impact on national institutions
An elite in control of land or other natural resources risks expropriation, either violently
through rebellion, or peacefully at the ballot box. To protect their privileges, they opt for
an oppressive regime and fend off calls for democracy. Moreover, the resource rents can substi-
tute for taxation, and thereby make the ruling elite less likely to offer representation in return
for tax payments.17 This is the essence of the institutional resource curse.
Resource abundance may, however, be compatible with good institutions if the resource-
owning elite faces opposition from other special interest groups. That is one reason why
the resource curse is mostly observed in developing countries with little economic activity
outside their primary sectors. Another reason why resources rarely are a curse in developed
countries is that many subsoil resources have been discovered within the past century, when
many developed countries already had developed institutional constraints on the elite.18 For
instance, oil discoveries in the North Sea have not turned Norway into an authoritarian country,
just as oil discoveries in Texas and the Mexican gulf have had little impact on institutions in
the United States. Norway and the United States both had solid democratic institutions when
oil was discovered, and they both had diversified economies where other special interest groups
provided opposition to the oil magnates.
Things were different when oil was discovered in Africa and the Middle East.19 Democratic
institutions were fragile or non-existent, and the ruling elites were in a good position to turn
the oil bonanzas into personal cash cows. Some of the resulting financial gain was used to set
up institutions that protected their oil wealth, and to entrench their power further.
In contrast to oil extraction, irrigation is an old technology mastered in ancient Mesopotamia.
So few nations, if any, had institutions that provided checks and balances on the ruling elite
when irrigation was first introduced. Moreover, all societies that adopted irrigation were
agrarian, so the irrigation rents represented a significant share of total income. And with a
negligible nonagricultural sector, the irrigation owning elite faced little opposition from other
17Bates & Lien (1985).18See, e.g., Boschini et al. (2007) and Mehlum et al. (2006). The same argument can be made about modern
irrigation techniques. See Section 3.19See Ross (2001), Ross (2012).
9
special interest groups. All requirements for a resource curse were in place.
2.3 Institutional persistence
Agriculture accounts for an ever declining share of world output, and so too do irrigation
rents. But the uneven distribution of power and wealth in irrigation-based societies may
nevertheless persist after the societies develop and industrialize. The elite can, for example,
use their fortunes and political power to get a grip on emerging sectors such as manufacturing,
utilities, and banking. They have the financial muscle to do so directly through investment or
acquisition. But intermarriage with the emerging urban elite also appears to be a conscious
strategy for big land owners, at least in the case of Pakistan described by Malik (2010).
A similar strategy may have been employed in Algeria, Egypt, Syria, and Tunisia, where the
regimes prior to the Arab spring were controlled by coalitions of landed elites and urban elites.20
These elites were more concerned with rent-seeking than democracy, and collaborated to roll
back land reforms and nationalizations undertaken by earlier populist socialist movements.
The same pattern was found in Chile where the Pinochet regime was supported by both urban
elites and irrigation owners expropriated by the previous communist regime led by Salvador
Allende.21
The landed elite in irrigation based societies were also able to exert substantial influence on
the bureaucracy. The unequal distribution of wealth in irrigation based societies meant that
it was mainly the large land owners who were able to provide their sons and daughters with
the education necessary to reach the higher ranks of the bureaucracy.22 The bureaucracies
therefore became dominated by members of the landed elite, who viewed the landed interests
favorably during the process of industrialization.23 In Pakistan, the landed elite were even able
to gain control of elected bodies. 105 out of 138 elected members of parliament were in 1970
large land owners, and the landed elite managed to block successive subsequent attempts at
20King (2007).21Bellisario (2007).22Inequality of land ownership is known to cause such inequality in educational attainment as well. See Galor
et al. (2009).23See Alam (1974), King (1998) and Jeffrey (2000) for case studies of Pakistan, Tunisia, and India.
10
land reform.24
Through coalitions with urban elites, and through their influence on government and bu-
reaucracy, the irrigation elites have the means to fend off calls for democracy even after agri-
culture loses its relative economic importance. The task is made easier since irrigation also
bars entry of independent farmers, the natural middle class in an agrarian society, and prime
supporters of democracy.25 The opposition to elite rule is therefore weaker than in rainfed
societies with large middle classes.
The institutional persistence in irrigation based societies resembles that of the slave-propelled
plantation system in the Americas. Engerman & Sokoloff (2000) argue that even when slav-
ery was abolished, plantation owners kept their land and much of their political power.26
Democracy would undermine their political influence and open up the possibility of land re-
distribution. The plantation owners consequently supported autocratic regimes. Even in the
United States did slavery have a lasting legacy on institutions. Lagerloef (2004), Soares et al.
(2012), and Ager (2013) show that present-day variation in institutional quality and income
inequality within the United States can be traced to antebellum slavery.
Inspired by the insights of Sokoloff and Engerman, Easterly (2007) use suitability for wheat
cane relative to sugar as an instrument for present-day inequality. Instrumented inequality
predicts poor institutional outcomes and economic underdevelopment. It also predicts less
schooling, consistent with the model and the results reported by Galor et al. (2009).
There are numerous other examples of institutional persistence. Following Acemoglu et al.
(2001), many studies use the transplantation of institutions during the colonial era as random
experiments to identify the effect on present-day outcomes. Dell (2010) shows that the mining
mita in Peru, a system of coerced labor abolished in 1812, still exerts a negative effect on
land tenure and public goods provision in the affected areas. Iyer & Banerjee (2005) and Iyer
(2010) find that the institutions set up by the British in India to collect land revenue have left
24See Alam (1974) and Malik (2010).25See, e.g., Easterly (2001). The lack of an agrarian middle class is likely to have impeded the rise of an
industrial middle class, which in the model of the Industrial Revolution by Doepke & Zilibotti (2008) replacesthe landed aristocracy as the dominant class during the process of industrialization.26The ideas of Sokoloff and Engerman were anticipated by Baldwin (1956) and Earle (1978). See also Isham
et al. (2005) for a discussion.
11
their mark on today’s institutions. Olsson (2009) and Hariri (2012), among others, provide
cross-country evidence for the persistence of colonial institutions.
Colonizers exported both good and bad institutions to their colonies. As argued by Ace-
moglu et al. (2001), democracy, rule of law, and free trade, are parts of the colonial legacy in
the colonies where Europeans settled. But in resource abundant regions where European set-
tlers found the climate and the disease environment unbearable, they set up colonies with the
purpose of extracting resource rents. When the Europeans left, local elites took control of the
extractive institutions imposed by their former colonizers. That led to an uneven distribution
of power and wealth similar to in the irrigation-based societies we study in this paper.
3 Measuring irrigation dependence
To test whether societies with a history of irrigation are more autocratic today, we estimate
regressions of the form:
institutionsi = α0 + α1irrigationi +X ′iβ + ui , (1)
where i indexes the unit of observation, institutions is a measure of democracy or land owner-
ship, irrigation is a measure of irrigation dependence, X is a vector of control variables, and
u is an error term.
The main empirical challenge is to find a measure of historic irrigation dependence. We want
to identify societies where traditional irrigation methods at some point in time contributed to a
substantial fraction of aggregate income. Consistent country-level data on historical irrigation
use do not exist, and the recent emergence of new irrigation technologies have made modern
irrigation data a poor proxy. Moreover, even if historical irrigation data existed, the extent of
irrigation would be endogenous. Autocratic leaders may, for instance, be inclined to undertake
large irrigation works, as they can pocket much of the revenue themselves. They may also be
better able to command and coordinate the necessary labor. An estimate of α1 in Equation
(1) could reflect these possibilities, rather than the resource curse mechanism we are testing.27
27This has often been used to criticize Wittfogel (1957), see, e.g., Fukuyama (2011).
12
To avoid endogeneity bias, and as an alternative to lacking historical data, we compute an
exogenous measure of irrigation potential to identify societies that depended on irrigation in
the past. Variation in our measure of irrigation potential is caused by variation in geography
and climate, and not by institutions or other acts of man.28
3.1 Irrigation potential
Our irrigation potential variable is based on data from the Food and Agriculture Organization
(FAO)’s global Agro-Ecological Zones (GAEZ) 2002 database. FAO divides the globe into
0.083x0.083o (latitude-by-longitude) grid cells, corresponding to 9x9 km at the equator. For
each grid cell, FAO calculates the crop, or combination of crops, that maximizes yields in
terms of nutritional value.29 The calculations are based on a long list of variables, including
temperature and precipitation profiles over the year, cloud cover, altitude, crop-specific evapo-
transpiration, soil texture, and the slope of the terrain. Crucially, FAO estimates the maximum
attainable agricultural yields both under the assumption that rain is the only source of water,
and under the assumption that an unlimited supply of water from irrigation is available. The
ratio of the maximum attainable yield under irrigation to the maximum attainable yield under
rainfed conditions is defined by FAO as the irrigation impact:
irrigation impact =max. attainable yields from irrigated agriculture
max. attainable yields from rainfed agriculture
Irrigation impact consequently measures the hypothetical increase in yields if irrigation is
introduced in an area where agriculture was previously rainfed. The hypothetical increase is
independent of the actual technology in use and the actual variety of crops grown.
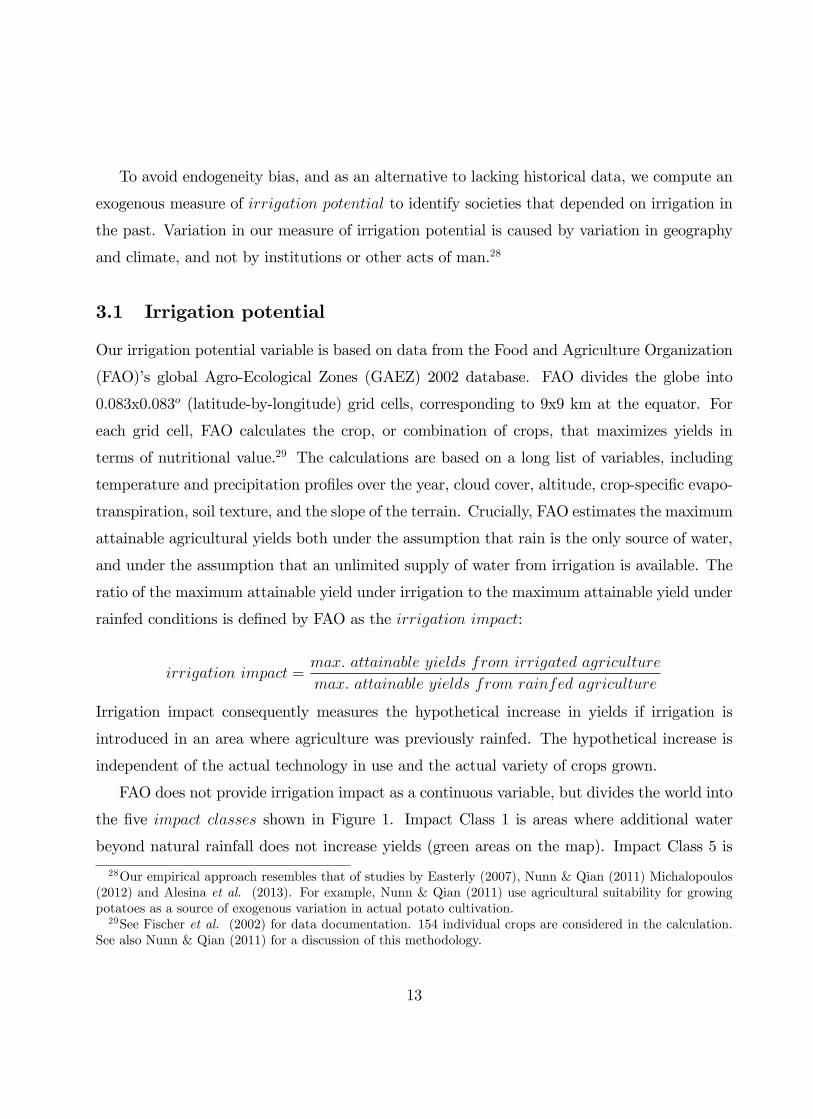
FAO does not provide irrigation impact as a continuous variable, but divides the world into
the five impact classes shown in Figure 1. Impact Class 1 is areas where additional water
beyond natural rainfall does not increase yields (green areas on the map). Impact Class 5 is
28Our empirical approach resembles that of studies by Easterly (2007), Nunn & Qian (2011) Michalopoulos(2012) and Alesina et al. (2013). For example, Nunn & Qian (2011) use agricultural suitability for growingpotatoes as a source of exogenous variation in actual potato cultivation.29See Fischer et al. (2002) for data documentation. 154 individual crops are considered in the calculation.
See also Nunn & Qian (2011) for a discussion of this methodology.
13

Figure 1: Irrigation impact classes.Sources: The FAO Global Agro-Ecological Zones (GAEZ) 2002 database.
areas where irrigation can more than double yields (red areas on the map), and impact classes
2-4 are intermediate steps between these two extremes. Areas too cold, too mountainous, too
sandy or with no nearby water source are classified as unsuitable to agriculture (grey areas on
the map).
Our aim is to identify societies where a landed elite can monopolize water, and thus agri-
culture, by controlling irrigation systems. Such societies are most likely to be located where no
agriculture is possible without irrigation, i.e., in Impact Class 5. We therefore focus on Impact
Class 5 in our empirical analysis. Peasants in Impact Class 5 had historically few options but
to work on the irrigated land owned by the elite. That made them relatively easy targets for
rent-seeking and oppression, and we should therefore expect irrigation to have a greater impact
on institutions in societies located in Impact Class 5. In the lower impact classes, agriculture
is possible without irrigation, and peasants would not have had to rely on irrigation systems
owned by the elite.
A second reason for focusing on Impact Class 5 is that we can be confident that agrarian
societies located in Impact Class 5 areas in fact had irrigation historically, since this was the
only possible type of agriculture. The same is not true for the lower impact classes, where
rainfed agriculture is possible. Moreover, the rapid technological progress of the past century
has dramatically reduced the relative cost of constructing irrigation infrastructure and made
it profitable to adopt irrigation in many areas with low impact classes. We return to this issue
14

below, and in the appendix where we show that our empirical results are robust to including
Impact Class 4 in our measure of irrigation (Table B1).
For the purpose of our analysis, we need to convert the pixel-level irrigation impact data to
a meaningful measure of irrigation dependence measured across larger geographical areas (i.e.,
countries, regions, and ethnographic societies). To this end, we define the irrigation potential
of an area as land in irrigation Impact Class 5 as the fraction of land suitable for agriculture:
irrigation potential =area in impact class 5
land suitable for agriculture. (2)
Land suitable for agriculture is land in either of the impact classes 1-5 on the map in Fig-
ure 1, and irrigation potential consequently ranges from 0 to 1. Countries with irrigation
potential = 1 include Egypt, Turkmenistan, and Qatar; countries with irrigation potential = 0
include United Kingdom, Denmark, and Macedonia; and countries with intermediate levels of
irrigation potential include Argentina (0.42), Jordan (0.54), and Namibia (0.56).
We put land suitable for agriculture in the denominator of Equation (2) since we are in-
terested in the effect of irrigated agriculture relative to rainfed agriculture on institutions.
Moreover, the institutions of a society are likely to have evolved in areas with the greatest
number of people. Malthusian constraints kept population densities low in most areas unsuit-
able for agriculture. By leaving such areas out of the analysis, we get a clearer picture of
the geographical circumstances that shaped institutions in a given society. Dividing by total
land instead of land suitable for agriculture in Equation (2) would introduce a measurement
error. The vast deserts of Egypt would, for example, make the country seem less dependent
on irrigation than it actually is.
Our measure of irrigation potential is based on soil data from around 1990, and climatic
averages for the period 1961-1990, but it is nevertheless a good proxy for historical irrigation
potential. Climate is highly persistent over time and climate change is exogenous to human
activity at the local level. Human activity can, however, deplete the soil. But soil depletion
affects the estimated yields of rainfed agriculture and irrigated agriculture proportionally, and
the denominator in our measure of irrigation potential is consequently unchanged. The only
exception is when soil depletion renders some previously irrigated areas completely unsuitable
15
for agriculture. This would lower the area in impact class 5 relative to its historical level, and
our measure of irrigation potential would then underestimate the extent of historical irrigation.
We address this issue in the empirical analyses by controlling for soil constraints and salination.
FAO calculates the attainable crop yields underlying our measure of irrigation potential
based on an assumption that an intermediate input level is used. The intermediate input
level roughly corresponds to the methods of agricultural production in use prior to the Green
Revolution. So our measure captures the potential for irrigation when access to improved
crop varieties, fertilizer, and mechanization is limited. Irrigation potential is consequently less
affected by recent technological progress than actual modern irrigation.30
3.2 Irrigation potential and irrigation in premodern societies
Are societies with a high irrigation potential more likely to actually have had irrigation? To
find out, we compare our irrigation potential data to data on historical irrigation use from the
Ethnographic Atlas compiled by Murdock (1967). The Ethnographic Atlas is a data collection
based on ethnographic observations from 1267 traditional societies scattered around the globe.
The data is coded such that quantitative comparisons of societies can be made. All societies
outside Europe are measured before any significant European influence, most in the 19th and
early 20th century.
The Atlas contains information on whether a society had agriculture at the time of ob-
servation, and whether they used irrigation. In Table 1, we split the agrarian societies into
societies with and without irrigation, and show how the two groups were distributed across
the irrigation impact classes.
We use the coordinates provided by the Atlas to locate each society. The coordinates are
not exact. Rounding errors may cause societies to lie up to 50 km from the given coordinates,
and measurement errors may add further uncertainty about the location. Furthermore, a
society would typically occupy an area larger than one cell. We therefore follow Alesina et al.
30The irrigation impact in a region may be affected by older developments, such as the Columbian Exchange,or the introduction of the steel-tipped plow. Whether such progress increases or decreases irrigation potentialis uncertain. The steel-tipped plow, for instance, made agriculture possible in areas with heavy soil. How theplow affected the irrigation potential of a country depends on how the heavy soils were distributed betweenrainfed and arid areas in the country. We treat such historical developments as measurement errors.
16
(2013) and compute all geographical variables as averages of cells within 200 km radius of the
coordinates reported in the Ethnographic Atlas.
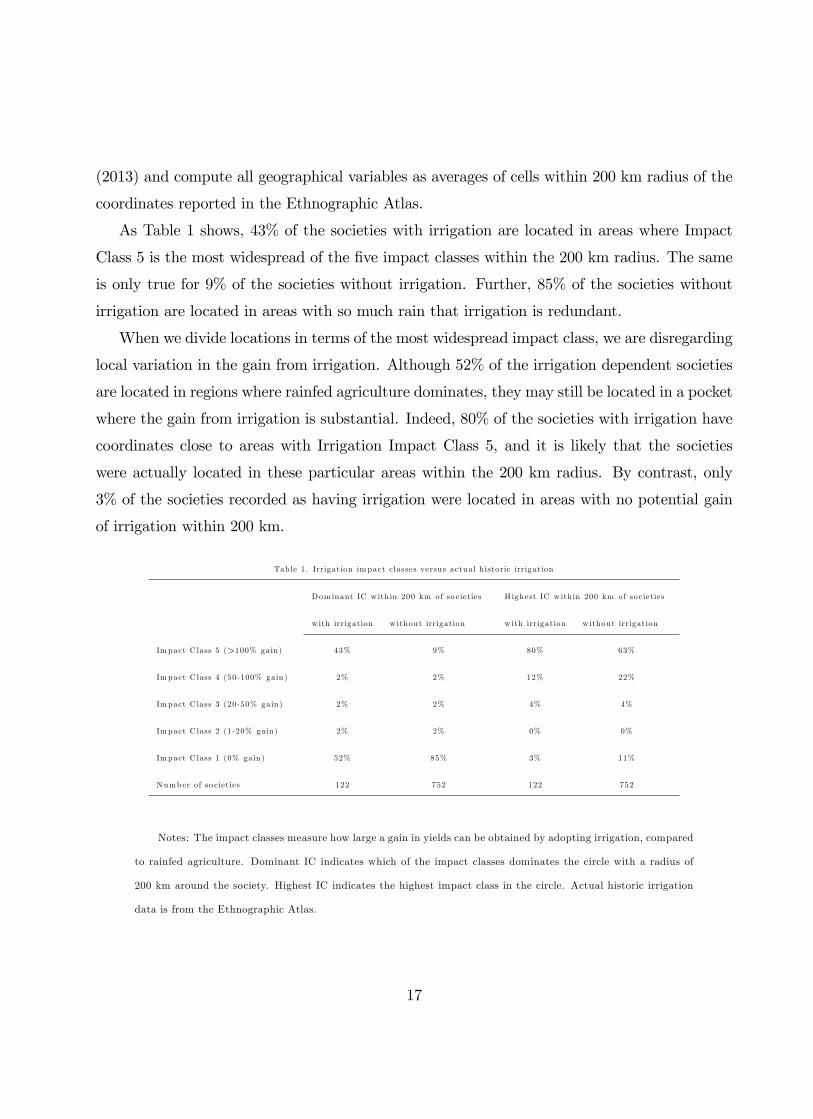
As Table 1 shows, 43% of the societies with irrigation are located in areas where Impact
Class 5 is the most widespread of the five impact classes within the 200 km radius. The same
is only true for 9% of the societies without irrigation. Further, 85% of the societies without
irrigation are located in areas with so much rain that irrigation is redundant.
When we divide locations in terms of the most widespread impact class, we are disregarding
local variation in the gain from irrigation. Although 52% of the irrigation dependent societies
are located in regions where rainfed agriculture dominates, they may still be located in a pocket
where the gain from irrigation is substantial. Indeed, 80% of the societies with irrigation have
coordinates close to areas with Irrigation Impact Class 5, and it is likely that the societies
were actually located in these particular areas within the 200 km radius. By contrast, only
3% of the societies recorded as having irrigation were located in areas with no potential gain
of irrigation within 200 km.
Table 1. Irrigation impact classes versus actual h istoric irrigation
Dom inant IC w ith in 200 km of so cieties H ighest IC w ith in 200 km of so cieties
w ith irrigation w ithout irrigation w ith irrigation w ithout irrigation
Impact C lass 5 (>100% gain) 43% 9% 80% 63%
Impact C lass 4 (50-100% gain) 2% 2% 12% 22%
Impact C lass 3 (20-50% gain) 2% 2% 4% 4%
Impact C lass 2 (1-20% gain) 2% 2% 0% 0%
Impact C lass 1 (0% gain) 52% 85% 3% 11%
Number of so cieties 122 752 122 752
Notes: The impact classes measure how large a gain in yields can be obtained by adopting irrigation, compared
to rainfed agriculture. Dominant IC indicates which of the impact classes dominates the circle with a radius of
200 km around the society. Highest IC indicates the highest impact class in the circle. Actual historic irrigation
data is from the Ethnographic Atlas.
17
3.3 Irrigation potential and modern irrigation
The evidence from premodern societies supports our conjecture that societies with a history of
irrigation are mainly found in Irrigation Impact Class 5. We cannot conduct a similar test at the
country level, since no consistent data on historical irrigation use exists.31 Instead, we compare
our measure of irrigation potential to modern data on actual irrigation from AQUASTAT, a
database maintained by FAO.
For each country, we compute the share of cultivated land that is irrigated, and regress
the resulting variable on our measure of irrigation potential based on Impact Class 5. The
coeffi cient on irrigation potential and the R2 of the regression are reported in the top row of
Table 2. Without any control variables, the coeffi cient is 0.3 and significant, implying that
countries with irrigation potential = 1 on average have 30 percentage points more of their
cultivated land under irrigation than countries with irrigation potential = 0. The correlation
does not appear to be driven by one or more of the geographical and climatic factors underlying
our measure of irrigation potential. On the contrary, the estimated coeffi cient on irrigation
potential increases when we add control variables for absolute latitude, soil quality, average
temperature, and average precipitation. The rise in the estimated coeffi cient reflects that
the control variables explain some of the variation in irrigation outside Impact Class 5. For
instance, latitude is known to be correlated with income, and richer countries are more likely
to invest in irrigation systems in low impact areas.
We add the lower impact classes to our baseline measure of irrigation potential in the rows
below. Consistent with the results from the Ethnographic Atlas, the estimated coeffi cient
and the explanatory power drop successively, the broader measure we use. The probability of
having irrigation, it seems, increases with the return to irrigation.
31The estimates for 1900 in Freydank & Siebert (2008) are a possible exception. See Appendix C.
18
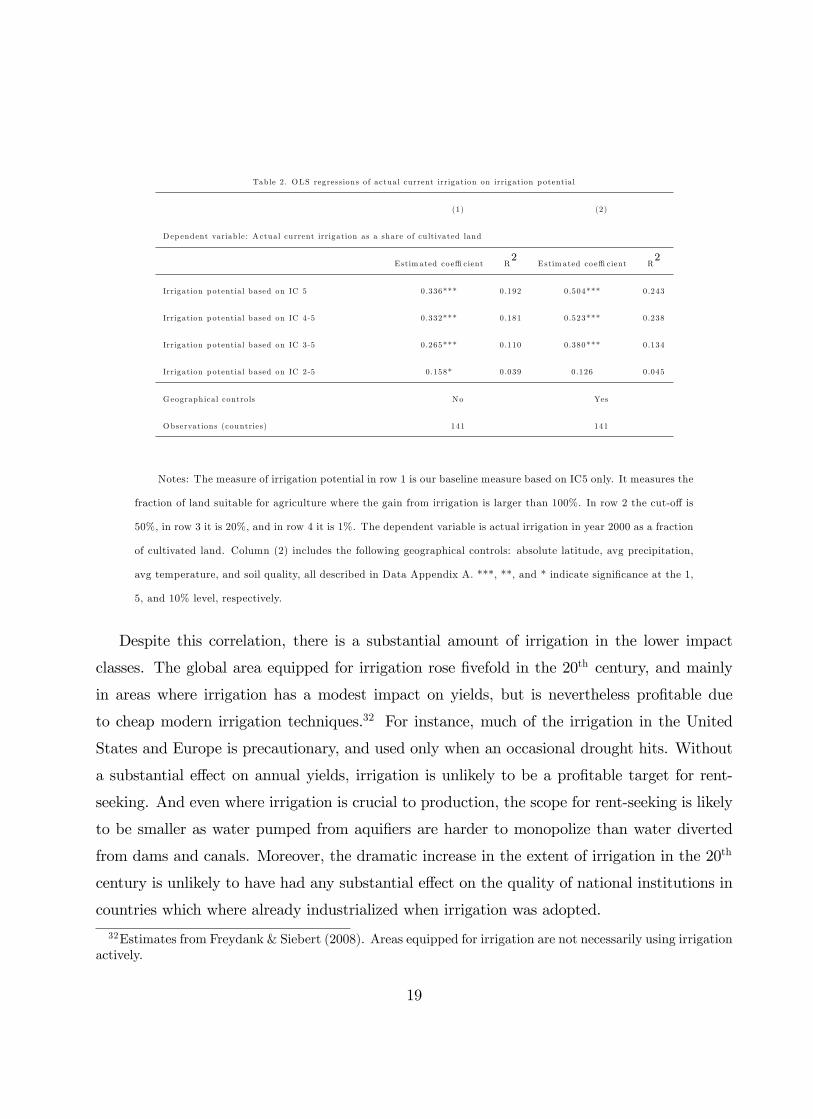
Table 2. OLS regressions of actual current irrigation on irrigation potentia l
(1) (2)
Dep endent variab le: Actual current irrigation as a share of cu ltivated land
Estim ated co effi cient R2
Estim ated co effi cient R2
Irrigation potentia l based on IC 5 0.336*** 0.192 0.504*** 0.243
Irrigation potentia l based on IC 4-5 0.332*** 0.181 0.523*** 0.238
Irrigation potentia l based on IC 3-5 0.265*** 0.110 0.380*** 0.134
Irrigation potentia l based on IC 2-5 0.158* 0.039 0.126 0.045
Geographical contro ls No Yes
Observations (countries) 141 141
Notes: The measure of irrigation potential in row 1 is our baseline measure based on IC5 only. It measures the
fraction of land suitable for agriculture where the gain from irrigation is larger than 100%. In row 2 the cut-off is
50%, in row 3 it is 20%, and in row 4 it is 1%. The dependent variable is actual irrigation in year 2000 as a fraction
of cultivated land. Column (2) includes the following geographical controls: absolute latitude, avg precipitation,
avg temperature, and soil quality, all described in Data Appendix A. ***, **, and * indicate significance at the 1,
5, and 10% level, respectively.
Despite this correlation, there is a substantial amount of irrigation in the lower impact
classes. The global area equipped for irrigation rose fivefold in the 20th century, and mainly
in areas where irrigation has a modest impact on yields, but is nevertheless profitable due
to cheap modern irrigation techniques.32 For instance, much of the irrigation in the United
States and Europe is precautionary, and used only when an occasional drought hits. Without
a substantial effect on annual yields, irrigation is unlikely to be a profitable target for rent-
seeking. And even where irrigation is crucial to production, the scope for rent-seeking is likely
to be smaller as water pumped from aquifiers are harder to monopolize than water diverted
from dams and canals. Moreover, the dramatic increase in the extent of irrigation in the 20th
century is unlikely to have had any substantial effect on the quality of national institutions in
countries which where already industrialized when irrigation was adopted.
32Estimates from Freydank & Siebert (2008). Areas equipped for irrigation are not necessarily using irrigationactively.
19

So the modern irrigation data are a sum of historical irrigation systems, which we expect
to influence institutions, and the increase in irrigation of the modern sort, which is unlikely
to have a similar effect. An OLS regression of institutions on modern irrigation data will by
implication be a downward biased estimate of the effect of historical dependence on irrigation,
and the bias is likely to be sizeable given the fivefold increase of irrigation in the 20th century.
The problem cannot be solved by using irrigation potential as an instrument for actual modern
irrigation. The increase in modern irrigation is inversely related to our measure of irrigation
potential exactly because most modern irrigation systems were constructed in areas where they
were not profitable without 20th century technology. This inverse relationship implies that
irrigation potential is an invalid instrument for actual modern irrigation, and the instrumental
variable (IV) estimates are consequently biased.33
The reduced form estimates of institutions on irrigation potential do not suffer from the
same bias, and we therefore use irrigation potential directly as explanatory variable in our main
regressions.34 We do, however, report IV estimates as robustness checks in Appendix C. We
find a significant relationship between irrigation and institutions when we use IV estimation.
4 Empirical results: democracy
We use the polity2 index from the Marshall et al. (2010) Polity IV database as our main
measure of democracy at the country level.35 The polity2 index is widely used in quantitative
studies of democracy. It ranges from -10 (hereditary monarchy) to 10 (consolidated democ-
racy). Examples of countries with a score of 10 in the polity2 index are the United States,
United Kingdom, and Sweden. The only countries to score a -10 are Saudi Arabia and Oman,
but Swaziland, North Korea, and Uzbekistan come close with a polity2 score of -9.
Column (1) in Table 3 shows the relation between irrigation potential and the polity2 index
33See Appendix C for a formal statement of this bias.34Even without the mentioned bias, there would not be much additional information in the IV estimates.
In the exactly identified setting, the IV estimates simply amount to a rescaling of the reduced form estimates.The sign on the coeffi cient for instrumented irrigation is the same as the sign of the coeffi cient on irrigationpotential in the reduced form regression. And since the magnitudes of coeffi cients in both cases do not have anatural interpretation independent of the scaling of the variables, the rescaling is superfluous.35The data is available online from www.systemicpeace.org/polity/polity4.htm.
20
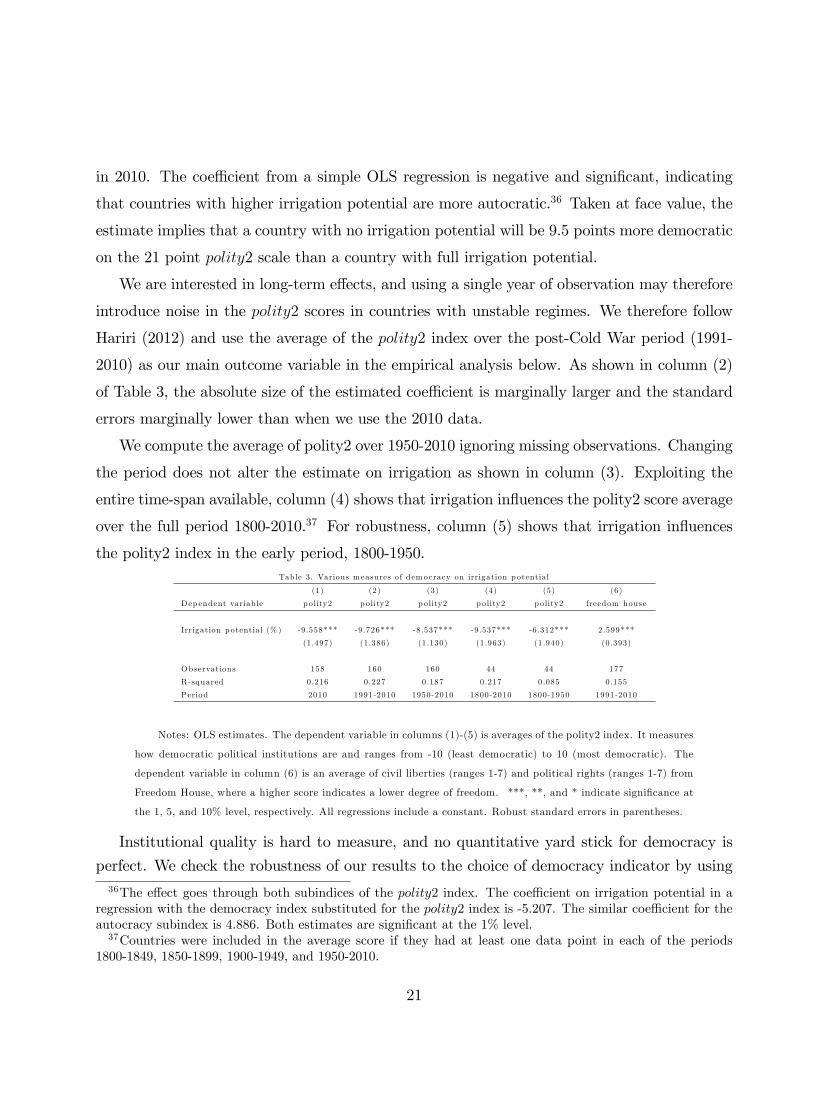
in 2010. The coeffi cient from a simple OLS regression is negative and significant, indicating
that countries with higher irrigation potential are more autocratic.36 Taken at face value, the
estimate implies that a country with no irrigation potential will be 9.5 points more democratic
on the 21 point polity2 scale than a country with full irrigation potential.
We are interested in long-term effects, and using a single year of observation may therefore
introduce noise in the polity2 scores in countries with unstable regimes. We therefore follow
Hariri (2012) and use the average of the polity2 index over the post-Cold War period (1991-
2010) as our main outcome variable in the empirical analysis below. As shown in column (2)
of Table 3, the absolute size of the estimated coeffi cient is marginally larger and the standard
errors marginally lower than when we use the 2010 data.
We compute the average of polity2 over 1950-2010 ignoring missing observations. Changing
the period does not alter the estimate on irrigation as shown in column (3). Exploiting the
entire time-span available, column (4) shows that irrigation influences the polity2 score average
over the full period 1800-2010.37 For robustness, column (5) shows that irrigation influences
the polity2 index in the early period, 1800-1950.Table 3. Various m easures of democracy on irrigation potentia l
(1) (2) (3) (4) (5) (6)
Dep endent variab le p olity2 p olity2 polity2 p olity2 p olity2 freedom house
Irrigation potentia l (% ) -9 .558*** -9 .726*** -8 .537*** -9 .537*** -6 .312*** 2.599***
(1.497) (1 .386) (1 .130) (1 .963) (1 .940) (0 .393)
Observations 158 160 160 44 44 177
R -squared 0.216 0.227 0.187 0.217 0.085 0.155
Period 2010 1991-2010 1950-2010 1800-2010 1800-1950 1991-2010
Notes: OLS estimates. The dependent variable in columns (1)-(5) is averages of the polity2 index. It measures
how democratic political institutions are and ranges from -10 (least democratic) to 10 (most democratic). The
dependent variable in column (6) is an average of civil liberties (ranges 1-7) and political rights (ranges 1-7) from
Freedom House, where a higher score indicates a lower degree of freedom. ***, **, and * indicate significance at
the 1, 5, and 10% level, respectively. All regressions include a constant. Robust standard errors in parentheses.
Institutional quality is hard to measure, and no quantitative yard stick for democracy is
perfect. We check the robustness of our results to the choice of democracy indicator by using36The effect goes through both subindices of the polity2 index. The coeffi cient on irrigation potential in a
regression with the democracy index substituted for the polity2 index is -5.207. The similar coeffi cient for theautocracy subindex is 4.886. Both estimates are significant at the 1% level.37Countries were included in the average score if they had at least one data point in each of the periods
1800-1849, 1850-1899, 1900-1949, and 1950-2010.
21

an alternative measure of democracy: The average of the Civil Liberties and Political Rights
ratings by Freedom House. Countries are categorized on a scale from 1 to 7 according to the
amount of political rights and civil liberties they offer their citizens. A rating of 1 indicates the
highest degree of freedom and 7 indicates the lowest. As expected, citizens living in areas with
higher irrigation potential are less likely to enjoy civil liberties and political rights (Column 6
of Table 3). In the remainder of this paper, we use the polity2 index as explanatory variable,
but we obtain similar results using the Freedom House measure.
4.1 Baseline geographical control variables
Table 4, column (1) shows the relationship between the polity2 index averaged over the period
1991-2010 and irrigation potential when continent dummies are included in the regression.
Compared to column (2) of Table 3, the coeffi cient on irrigation potential decreases since
Africa and Asia both have higher irrigation potential and are more autocratic than the average
continent.
To check whether the link between democracy and irrigation potential is driven by spatial
autocorrelation, we provide Conley (1999) standard errors in squared brackets. The Conley
(1999) standard errors are similar to the ordinary robust standard errors, indicating that spatial
autocorrelation is not a worry.
Following Hall & Jones (1999), the distance from the equator is widely used as a proxy for
development or institutional quality in empirical studies. As shown in column (2), countries
located further away from the equator are indeed more democratic, but the coeffi cient on
irrigation potential is unchanged and remains highly significant.
22

Table 4. D emocracy on irrigation potentia l contro lling for geography
(1) (2) (3) (4) (5) (6) (7) (8)
Polity2 index 1991-2010
Irrigation potentia l (% ) -6 .369*** -5 .898** -7 .123** -5 .037*** -6 .454*** -4 .723* -6 .854***
(1.534) (2 .534) (2 .857) (1 .632) (1 .535) (2 .553) (2 .438)
[1 .574] [2 .903] [2 .915] [1 .629] [1 .570] [2 .534]
Absolute latitude 0.115* 0.121* 0.149*
(0.066) (0 .065) (0 .082)
Precip itation 1.382 6.737*** -0 .733 1.471 1.856
(1.140) (2 .301) (3 .549) (1 .114) (1 .358)
Temperature 0.012 0.043 0.032
(0.125) (0 .123) (0 .121)
Soil constra ints (% ) -5 .474 -4 .977 -2 .551
(4.730) (4 .811) (5 .793)
Squared precip itation -2 .131** 0.111
(0.914) (1 .212)
O il (1000 barrels/day/cap) -5 .703*** -5 .230*** -2 .867
(1.833) (1 .590) (2 .814)
Land w ith in 100 km of navigab le rivers % -2.843 -3 .424 0.443
(1 .988) (2 .106) (2 .768)
Observations 156 156 156 156 156 156 156 156
R -squared 0.486 0.512 0.454 0.487 0.507 0.491 0.535
Estim ation OLS OLS OLS OLS OLS OLS OLS Median
Continent dumm ies Yes Yes Yes Yes Yes Yes Yes Yes
A ltonji test 12.5 -9 .4 3.8 -75.8 2.9 -14.1
Notes: OLS estimates in columns (1)-(7), Median regression estimates in column (8). The dependent variable
is the polity2 index averaged 1991-2010. The remaining variables are described in Data Appendix A. The Altonji
test statistic takes column (1) as the restricted model. All regressions include a constant. ***, **, and * indicate
significance at the 1, 5, and 10% level, respectively, based on the robust standard errors reported in parentheses.
Conley (1999) standard errors in brackets (cut-off = 500 km).
Irrigation potential is based on numerous geographical and climatic variables. To check
whether it is one of the components of the irrigation potential variable, and not the variable
itself, that is correlated with the polity2 index, we include the most important components in
our regression. These are average annual temperature, average annual precipitation and soil
quality. We control for these variables column (2). None of them are significant, and their
inclusion has negligible impact on the irrigation potential coeffi cient.38
The relationship between irrigation potential and polity2 estimated in column (2) is de-
picted in the AV-plot in Figure 2. There is a visible negative relationship, but a number of
outliers are also visible. The unique histories of Israel and Cuba have, for instance, provided
them with institutions that deviates from the norms in their regions. Mongolia is likewise a
visible outlier. It has a high irrigation potential, but Mongolia’s agriculture relies on nomadic
animal husbandry rather than irrigation. Such outliers are, however, not what drives our re-
sults. On the contrary, when we estimate the regression in column (3) by median regression
38Including the variables one by one produces similar results. Additional controls related to the calculationof irrigation potential are added in Appendix B.
23

robust to outliers, we get a coeffi cient on irrigation potential of -10.118 compared to -5.898 in
the OLS case. The same is true for all the other empirical results we provide in this paper:
outliers reduce the coeffi cient on irrigation potential in absolute size, and the OLS estimates
are in this regard conservative.
CYP ISR
TUR
TCD
SEN
LBN
GMB
THA
SWZ
IND
BFA
NER
MEX
ARM
ZAF
GEO
BEN
IRN
SDNERITJK
LKA
URYKHM
CUB
HTI
LAOVNM
BOL
KOR
CHN
NZL
TGO
ETH
ZMB
AGO
ZWE
MLI
DOMHUN
GHATTO
KGZ
NGA
CIVMDA
MWIMOZ
JOR
LSO
TZA
BGRSLV
PHL
GRC
RUS
UKR
DNKCAF
PER
POLNPL
JPN
MKDNLD
IRQ
UGA
CZEBRA
FJI
GNB
VEN
PRT
BDI
BLR
AUS
PRYFRA
USALTU
LVAEST
PAKMDG
DEUBEL
RWA
MAR
FIN
GIN
ROU
SYR
JAM
BTN
SWECODSVK
ALB
HND
SGP
CMR
COM
COG
CAN
ITAKEN
ARG
BIH
HRV
IRLECU
GAB
ESP
BGD
AZE
SLBIDN
UZB
SVN
GUY
GBRAUTCHL
NIC
PNG
MYS
NOR
GNQ
TWN
MRTCOL
TUN
NAM
PAN
QAT
AFGBHRAREGTMCHELBR
SAU
OMNKWTSLE
CRI
DZA
YEM SOM
BWA
TKMLBY
KAZ
DJI
EGY
MNG
10
50
510
(Pol
ity2
1991
201
0 | X
)
.4 .2 0 .2 .4 .6(Irrigation potential | X)
coef = 5.8976557, (robust) se = 2.534455, t = 2.33
Figure 2. AV plot of the polity2 index on irrigation potential (Table 4, column 2)
4.2 Additional geographical control variables
Cereals are usually associated with good institutional outcomes and plantation crops with
poor. As discussed in the introduction, Haber (2012) shows that modern democracies are
clustered in areas with moderate rainfall, which he argues proxy for the climatic suitability for
growing rainfed cereals. Areas with more rain are suitable for plantation crops, and areas with
less rain for irrigated agriculture. In our regressions, we capture the nonlinear relationship
between rainfall and democracy by adding precipitation and precipitation squared as control
variables in Table 4. Column (3) shows that the nonlinear relationship exists when irrigation
potential is excluded from the regression. But when we include irrigation potential in Column
(4), both rainfall terms become insignificant, individually and jointly.39 The results of Haber
(2012) thus appear to be driven by the correlation with irrigation.40
39Confirmed by an F-test with a p-value of 0.897.40Easterly (2007) provides an empirical study of the plantation crops vs. cereals theory of institutions. He
uses the agro-climatic suitability of wheat relative to sugar as a proxy of dependence on cereals rather thanplantation crops. We include this measure as a control variable in Appendix B, as well as a more generalmeasure of dependence on cereals relative to plantation crops. The estimated effect of irrigation is robust tothese variables.
24
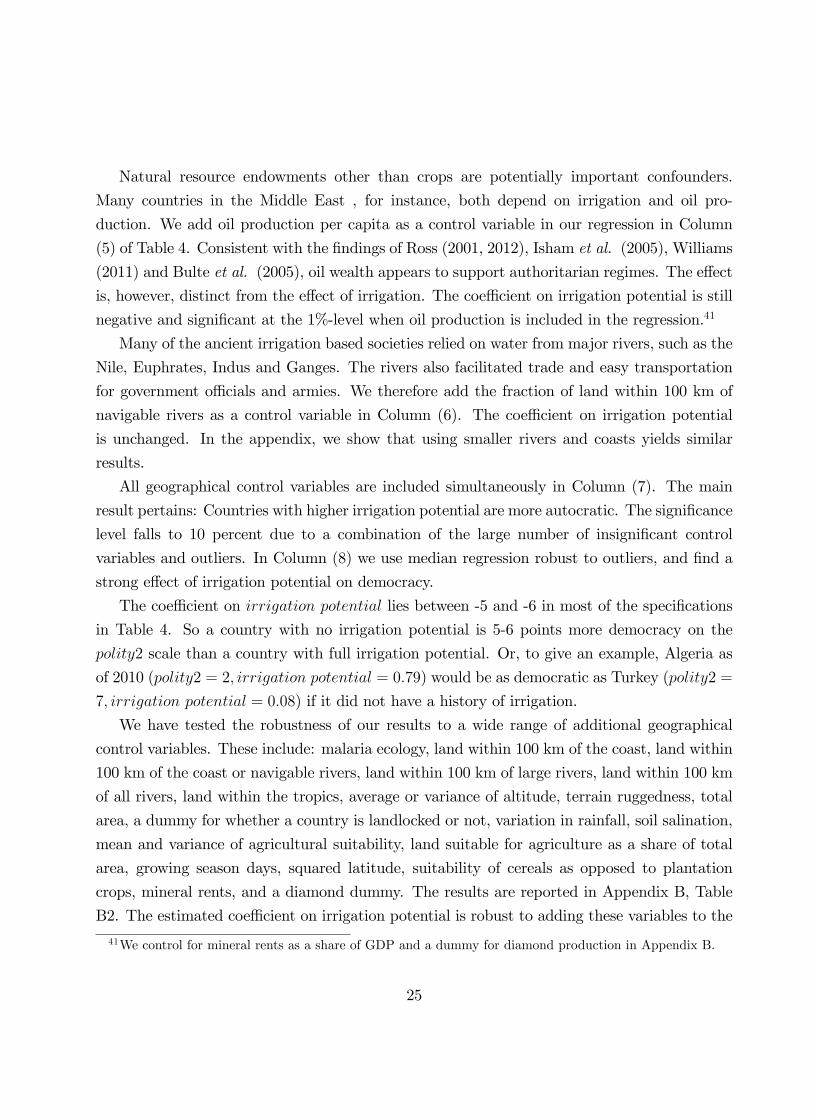
Natural resource endowments other than crops are potentially important confounders.
Many countries in the Middle East , for instance, both depend on irrigation and oil pro-
duction. We add oil production per capita as a control variable in our regression in Column
(5) of Table 4. Consistent with the findings of Ross (2001, 2012), Isham et al. (2005), Williams
(2011) and Bulte et al. (2005), oil wealth appears to support authoritarian regimes. The effect
is, however, distinct from the effect of irrigation. The coeffi cient on irrigation potential is still
negative and significant at the 1%-level when oil production is included in the regression.41
Many of the ancient irrigation based societies relied on water from major rivers, such as the
Nile, Euphrates, Indus and Ganges. The rivers also facilitated trade and easy transportation
for government offi cials and armies. We therefore add the fraction of land within 100 km of
navigable rivers as a control variable in Column (6). The coeffi cient on irrigation potential
is unchanged. In the appendix, we show that using smaller rivers and coasts yields similar
results.
All geographical control variables are included simultaneously in Column (7). The main
result pertains: Countries with higher irrigation potential are more autocratic. The significance
level falls to 10 percent due to a combination of the large number of insignificant control
variables and outliers. In Column (8) we use median regression robust to outliers, and find a
strong effect of irrigation potential on democracy.
The coeffi cient on irrigation potential lies between -5 and -6 in most of the specifications
in Table 4. So a country with no irrigation potential is 5-6 points more democracy on the
polity2 scale than a country with full irrigation potential. Or, to give an example, Algeria as
of 2010 (polity2 = 2, irrigation potential = 0.79) would be as democratic as Turkey (polity2 =
7, irrigation potential = 0.08) if it did not have a history of irrigation.
We have tested the robustness of our results to a wide range of additional geographical
control variables. These include: malaria ecology, land within 100 km of the coast, land within
100 km of the coast or navigable rivers, land within 100 km of large rivers, land within 100 km
of all rivers, land within the tropics, average or variance of altitude, terrain ruggedness, total
area, a dummy for whether a country is landlocked or not, variation in rainfall, soil salination,
mean and variance of agricultural suitability, land suitable for agriculture as a share of total
area, growing season days, squared latitude, suitability of cereals as opposed to plantation
crops, mineral rents, and a diamond dummy. The results are reported in Appendix B, Table
B2. The estimated coeffi cient on irrigation potential is robust to adding these variables to the
41We control for mineral rents as a share of GDP and a dummy for diamond production in Appendix B.
25

regression.
While we have controlled for a large number of observable geographical characteristics,
there may still be omitted confounders. We report the Altonji et al. (2005) statistic for the
importance of selection on unobservables relative to observables at the bottom of Table 4.42
A test statistic greater than one implies that to reduce the estimated coeffi cient on irrigation
potential to zero, unobservables should explain more of the covariance between irrigation po-
tential and the polity2-index than the included control variables (continents excluded). Given
that the Altonji et al. (2005) statistic is larger than 2 in all specifications, we are relatively
confident that our results are not driven by unobserved geographical variation.
4.3 Development and colonization
In Table 5, we check the robustness of our results to possible confounders related to historical
and present development. We have fewer observations than in Table 4 as the control variables
we include here are not available for as many countries as the geographical variables.
Lipset (1959) famously hypothesized that democracy is a consequence of economic modern-
ization. If the theory is correct and if irrigation is correlated with economic development, the
observed effect of irrigation on institutional quality could work through modernization. For
instance, a high irrigation potential could slow democratization if irrigated societies specialized
in agricultural production and failed to develop modern industries.43
As a first step to check whether that is the case, Column (2) of Table 5 includes the
logarithm of real GDP per capita in year 2000 from Penn World Tables. As expected, richer
countries are more democratic.44 But the effect does not seem to work through irrigation,
since the estimated coeffi cient on irrigation potential is unchanged. In Column (3), we include
the number of years since each country passed through the Neolithic transition, i.e., when the
population started farming rather than hunting. In Column (4) we include the State Antiquity
Index, which captures the cumulated number of years a state has been present within modern-
day country borders.45 Both variables have been shown to be correlated with contemporary
42We use the specific version of the test suggested by Nunn & Wantchekon (2011).43Matsuyama (1992), Galor & Mountford (2006, 2008), and Williamson (2011), among others, argue that
such specialization in agricultural production might explain the unequal global distribution of income today.44Note, however, that this result is potentially biased as GDP is likely to be endogenous.45Years since the Neolithic Transitions is from Putterman & Trainor (2006), and the State Antiquity Index
is from Bocksette & Putterman (2007). The results are similar when we use the Putterman (2008) migration-adjusted years since the Neolithic Revolution.
26
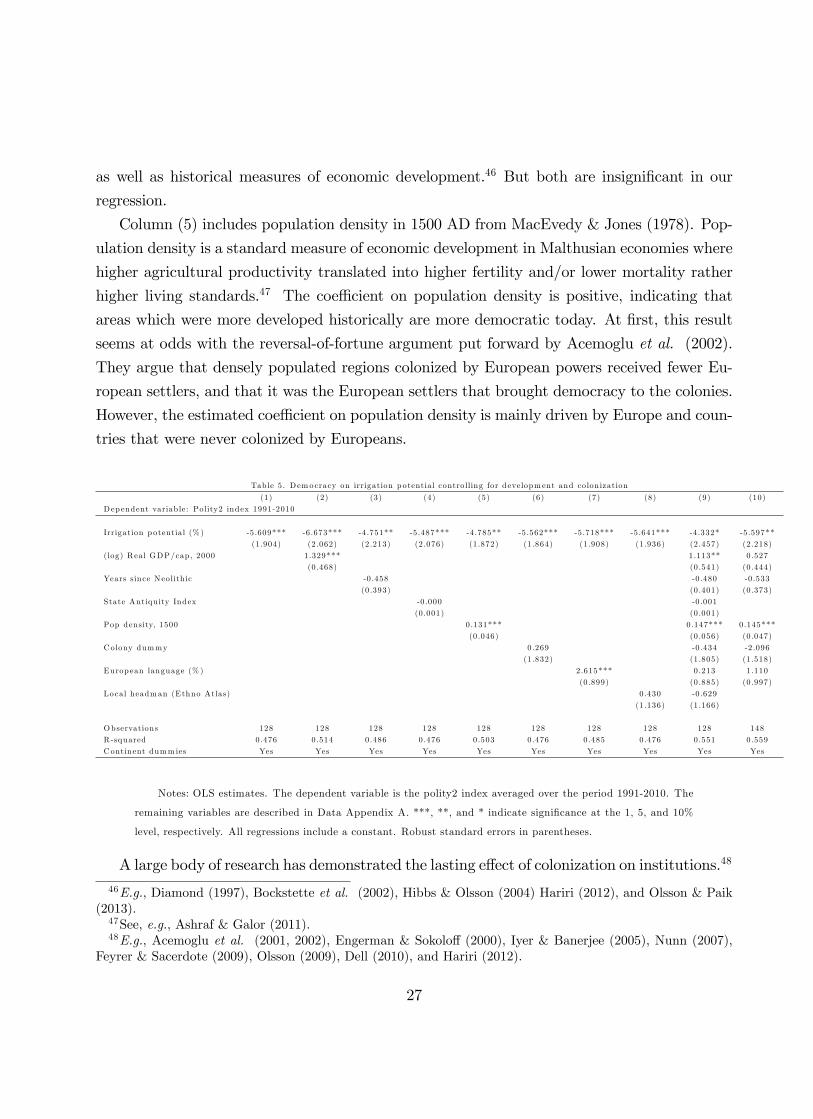
as well as historical measures of economic development.46 But both are insignificant in our
regression.
Column (5) includes population density in 1500 AD from MacEvedy & Jones (1978). Pop-
ulation density is a standard measure of economic development in Malthusian economies where
higher agricultural productivity translated into higher fertility and/or lower mortality rather
higher living standards.47 The coeffi cient on population density is positive, indicating that
areas which were more developed historically are more democratic today. At first, this result
seems at odds with the reversal-of-fortune argument put forward by Acemoglu et al. (2002).
They argue that densely populated regions colonized by European powers received fewer Eu-
ropean settlers, and that it was the European settlers that brought democracy to the colonies.
However, the estimated coeffi cient on population density is mainly driven by Europe and coun-
tries that were never colonized by Europeans.
Table 5. D emocracy on irrigation potentia l contro lling for developm ent and colon ization
(1) (2) (3) (4) (5) (6) (7) (8) (9) (10)
Dep endent variab le: Polity2 index 1991-2010
Irrigation potentia l (% ) -5 .609*** -6 .673*** -4 .751** -5 .487*** -4 .785** -5 .562*** -5 .718*** -5 .641*** -4 .332* -5 .597**
(1.904) (2 .062) (2 .213) (2 .076) (1 .872) (1 .864) (1 .908) (1 .936) (2 .457) (2 .218)
(log) Real GDP/cap, 2000 1.329*** 1.113** 0.527
(0.468) (0 .541) (0 .444)
Years since Neolith ic -0 .458 -0 .480 -0 .533
(0.393) (0 .401) (0 .373)
State Antiqu ity Index -0 .000 -0 .001
(0.001) (0 .001)
Pop density, 1500 0.131*** 0.147*** 0.145***
(0.046) (0 .056) (0 .047)
Colony dummy 0.269 -0 .434 -2 .096
(1.832) (1 .805) (1 .518)
Europ ean language (% ) 2.615*** 0.213 1.110
(0 .899) (0 .885) (0 .997)
Local headman (Ethno Atlas) 0 .430 -0 .629
(1.136) (1 .166)
Observations 128 128 128 128 128 128 128 128 128 148
R -squared 0.476 0.514 0.486 0.476 0.503 0.476 0.485 0.476 0.551 0.559
Continent dumm ies Yes Yes Yes Yes Yes Yes Yes Yes Yes Yes
Notes: OLS estimates. The dependent variable is the polity2 index averaged over the period 1991-2010. The
remaining variables are described in Data Appendix A. ***, **, and * indicate significance at the 1, 5, and 10%
level, respectively. All regressions include a constant. Robust standard errors in parentheses.
A large body of research has demonstrated the lasting effect of colonization on institutions.48
46E.g., Diamond (1997), Bockstette et al. (2002), Hibbs & Olsson (2004) Hariri (2012), and Olsson & Paik(2013).47See, e.g., Ashraf & Galor (2011).48E.g., Acemoglu et al. (2001, 2002), Engerman & Sokoloff (2000), Iyer & Banerjee (2005), Nunn (2007),
Feyrer & Sacerdote (2009), Olsson (2009), Dell (2010), and Hariri (2012).
27
We address this potential confounder in two ways. In Table 5, by adding control variables for
colonization, and in Table 6 below by splitting the sample. In Column (6) of Table 5 we include
a dummy which equals one if the country was ever colonized. Colonization does by itself not
explain variation in present-day democracy in addition to the variation explained by irrigation
potential. But, as Column (7) shows, the number of European settlers, as proxied by the
fraction of the population that speaks a European language, does. The impact of irrigation
potential on democracy is, however, not affected by adding this control variable.49
Lastly, we add a control variable for pre-colonial institutions in column (8) proposed by
Giuliano & Nunn (2013). The variable is based on observations from the Ethnographic Atlas,
and it measures whether local village headmen in a country were chosen by election and/or
informal consensus rather than by less democratic succession rules. The variable is insignificant,
and does not have any impact on the coeffi cient of irrigation potential.50
All variables are included simultaneously in Column (9). The coeffi cient on irrigation
potential is reduced somewhat compared to Column (1), but not significantly so. The State
Antiquity Index and historic democracy have fewer observations than the other variables. And
since they are both insignificant, we exclude them in Column (10) to increase the number of
observations. As a result, both the size and the significance level of the irrigation potential
coeffi cient increases.51
We now return to a more thorough investigation of colonization. In Table 6, we split the
sample into a sub-sample of the 64 countries that were never a colony (columns 1-3) and
a sub-sample of the 96 countries that were colonized at some point in time (columns 4-6).
The coeffi cient on irrigation potential retains its sign and significance in both subsamples.
However, the impact and explanatory power of irrigation is stronger in the sample of countries
that were never colonized. Our interpretation of this result is that European colonialism dilutes
the effect of irrigation by creating additional variance in institutions unrelated to irrigation.
This interpretation is consistent with the institutional legacy of colonization demonstrated
empirically by the studies cited in Section 2.3.
Acemoglu et al. (2001, 2002) argue that the disease environment was crucial for the types
of institutions set up by Europeans. Humid areas are more dangerous in this respect, and
49Using instead a measure of fraction of the population of European descent produces similar results. InAppendix B, we also add control variables for countries legal systems. Legal systems were often part of thepackage of institutions implemented by colonizers in their colonies.50Continent dummies and not irrigation potential turns the coeffi cient on this variable insignificant. This
point is also made by Bentzen et al. (2015).51The coeffi cient on irrigation potential increases in all columns when the sample is increased to 148 countries.
28
the disease environment is therefore inversely correlated with irrigation potential. To test this
possible confounder in the colony sub-sample, we include malaria ecology in the last column
of Table 6.52 When irrigation is accounted for, we do not find support for the hypothesis that
the disease environment has an impact on current institutions in former colonies.Table 6. D emocracy on irrigation potentia l in non-co lon ies vs colon ies
(1) (2) (3) (4) (5) (6)
Sample Never colon ized Form er colon ies
A ll A ll Non-Europ e A ll A ll A ll
D ep endent variab le: Polity2 index 1991-2010
Irrigation potentia l (% ) -15.436*** -11.364*** -11.684*** -6 .051*** -3 .441** -3 .352*
(2.859) (3 .549) (3 .698) (1 .576) (1 .508) (1 .716)
Malaria ecology index 0.012
(0.080)
Observations 64 64 29 96 96 96
R -squared 0.485 0.560 0.356 0.109 0.423 0.423
Continent dumm ies No Yes Yes No Yes Yes
Notes: OLS estimates. The dependent variable is the polity2 index averaged over the period 1991-2010. The
remaining variables are described in Data Appendix A. ***, **, and * indicate significance at the 1, 5, and 10%
level, respectively. All regressions include a constant. Robust standard errors in parentheses.
4.4 Religion
People with the same religious beliefs often share cultural values, and these values may affect
political institutions and development. Weber (1930) famously linked the rise of capitalism to
Protestantism. More recently, Bruce (2004) describes how Protestant culture can be conducive
to democracy. Most of the contemporary debate about religion and democracy is, however,
centered on Islam.53 Muslim countries are, on average, less democratic than other countries,
and some observers argue that the tenets of Islam are inherently incompatible with democracy.
We include the population share of adherents to each of the major world religions in Table 7.
When included individually, the correlations between each of these measures and institutions
are as suggested by the literature: Muslim countries are less democratic than the average coun-
try, and Protestant countries more democratic. The coeffi cients on Catholics and Buddhists
are insignificant. The coeffi cient on irrigation potential drops somewhat when the fraction of
Muslims are included, and the significance level decreases to 10 percent.54
52Acemoglu et al. (2001, 2002) use settler mortality and not malaria ecology as a measure of the diseaseenvironment. Data on settler mortality is, however, only available for a small sample of colonies. Moreover,the coeffi cient on settler mortality is insignificant in our regressions.53See e.g., Bellin (2004), Huntington (1993), Kedourie (1992), and Hariri (2015).54Again, the coeffi cient on irrigation potential remains large and significant at the 5 percent level when we
use median regression robust to outliers.
29
These results may, however, be biased since the spread of religion, especially Islam, could
be endogenous to irrigation potential. Michalopoulos et al. (2012) demonstrate that Islam
spread from the Arab Peninsula along major trade routes. Most of the trade routes ran along
an East-West axis, thus spreading the religion into regions with a similar climate. Furthermore,
Michalopoulos et al. (2012) show that Islam was more likely to take hold in areas with large
variation in soil fertility. They explain the latter by noting that variation in soil quality was
a source of income inequalities, and that Islam’s redistributive aims had more appeal in areas
with large inequality. Variation in soil quality is extreme in areas where desert intersects with
irrigated fields, and, as we show later in this paper, land ownership is more unequal in irrigated
areas. So an alternative interpretation of the results of Michalopoulos et al. (2012) is that
Islam spread to societies with agriculture based on irrigation, because these societies were more
unequal than elsewhere.
In a related paper, Chaney (2012) uses desert ecology as an instrumental variable for Arab
conquest. Arab armies depended on camels, and their ability to protect power was therefore
larger close to desert terrain. Irrigation is often found close to such terrain, and Arab conquest
and the spread of Islam could consequently be determined by geographical factors related to
irrigation potential for military reasons.
The dynamics of the spread of Islam means that irrigation potential and the share of
Muslims in the population are highly correlated at the country level (ρ = 0.65). Moreover,
much of the variation in irrigation potential in our data is within the group of countries which
at the present have Muslim majorities. This makes it hard to disentangle the effect of Islam
from the effect of irrigation potential in the regressions reported in Table 7. We therefore turn
to subnational evidence in the next subsection. To preview the results, we demonstrate that
individuals living in areas with high irrigation potential have less favorable views on democracy
even when country fixed-effects and the religion of the respondent are taken into account. In
fact, Muslims appear to have more favorable views on democracy than followers of other
religions. So the negative relationship between Islam and the polity2-index in Table 7 does
not appear to be explained by Muslims being culturally opposed to democratic institutions.
This is consistent with the fact that relatively few of the Muslim countries in our sample
are theocracies. Rather, Islamic outfits such as the Muslim Brotherhood have often acted as
the main opposition to secular oppressive regimes, such as the Ba’athists in Iraq and Syria,
and the military dictatorship in Egypt. Likewise, we demonstrate in Section 5 that societies
with a high irrigation potential are more unequal in terms of land ownership no matter their
30
religious adherence. Our interpretation of the results in Table 7 is therefore that Islam is more
widespread in regions where high irrigation potential supports oppressive regimes.
Table 7. D emocracy on irrigation potentia l contro lling for cu ltural values
(1) (2) (3) (4) (5) (6)
Dep endent variab le: Polity2 index 1991-2010
Irrigation potentia l (% ) -5 .785*** -3 .406* -5 .505*** -5 .719*** -6 .020*** -3 .648*
(1.543) (2 .057) (1 .574) (1 .563) (1 .668) (2 .107)
Muslim s 2000 (% ) -3 .704* -4 .009*
(1.996) (2 .414)
Protestants 2000 (% ) 3.750** 1.899
(1.749) (2 .345)
Catholics 2000 (% ) 0.565 -0 .321
(1.318) (1 .854)
Buddhists 2000 (% ) -1 .497 -3 .458
(3.911) (4 .192)
Observations 158 158 158 158 158 158
R -squared 0.475 0.496 0.482 0.475 0.476 0.503
Continent dumm ies Yes Yes Yes Yes Yes Yes
Notes: OLS estimates. The dependent variable is the polity2 index averaged over the period 1991-2010. The
remaining variables are described in Data Appendix A. ***, **, and * indicate significance at the 1, 5, and 10%
level, respectively. All regressions include a constant. Robust standard errors in parentheses.
4.5 Subnational evidence: attitudes towards democracy
While we have controlled for a wide range of possible confounders, we cannot rule out that
one or more unobserved variables correlate with both irrigation potential and democracy.
Many possible unobservables are likely to correlate at the national level, so we now turn to
sub-national data which allow us to include country fixed-effects in our empirical analysis.
Comprehensive sub-national data on actual institutions do, unfortunately, not exist. Instead,
we use survey data on individuals’views on democracy taken from The World Values Survey
and the European Values Study.
Survey participants are asked two questions about democracy. The first is whether they
feel a democratic political system is very good, fairly good, fairly bad or very bad.55 From the
answers we create and index where the value 4 indicates that the response is "very good", 3
if the response is "fairly good", and so on. The second question is whether respondents agree
with the following statement: “Democracy may have problems but it is better than any other
form of government”. Respondents can strongly disagree (index value 1), disagree (2), agree
(3), and strongly agree (4).56 We label the resulting variables demo_good and demo_better.
55Question e117 in the pooled WVS / EVS.56Question e123 in the pooled WVS / EVS. We have transformed the original variable such that higher
values indicate a more favorable view on democracy.
31
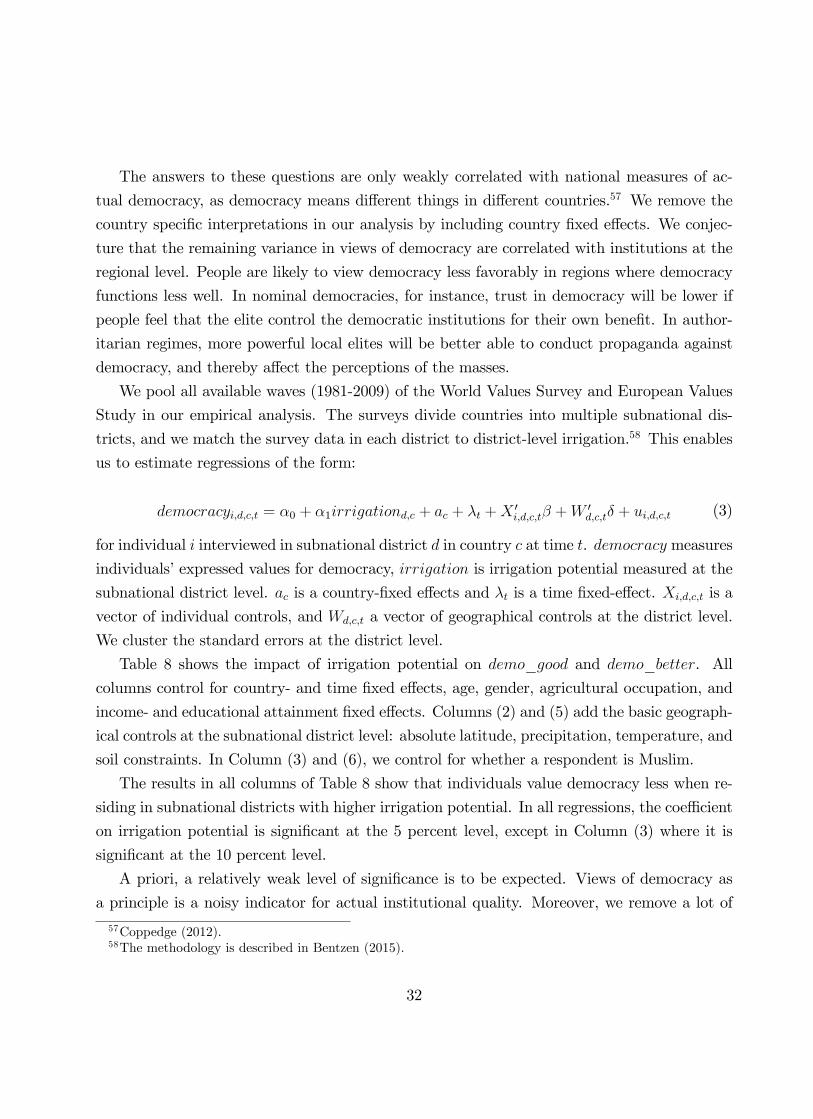
The answers to these questions are only weakly correlated with national measures of ac-
tual democracy, as democracy means different things in different countries.57 We remove the
country specific interpretations in our analysis by including country fixed effects. We conjec-
ture that the remaining variance in views of democracy are correlated with institutions at the
regional level. People are likely to view democracy less favorably in regions where democracy
functions less well. In nominal democracies, for instance, trust in democracy will be lower if
people feel that the elite control the democratic institutions for their own benefit. In author-
itarian regimes, more powerful local elites will be better able to conduct propaganda against
democracy, and thereby affect the perceptions of the masses.
We pool all available waves (1981-2009) of the World Values Survey and European Values
Study in our empirical analysis. The surveys divide countries into multiple subnational dis-
tricts, and we match the survey data in each district to district-level irrigation.58 This enables
us to estimate regressions of the form:
democracyi,d,c,t = α0 + α1irrigationd,c + ac + λt +X ′i,d,c,tβ +W ′
d,c,tδ + ui,d,c,t (3)
for individual i interviewed in subnational district d in country c at time t. democracy measures
individuals’expressed values for democracy, irrigation is irrigation potential measured at the
subnational district level. ac is a country-fixed effects and λt is a time fixed-effect. Xi,d,c,t is a
vector of individual controls, and Wd,c,t a vector of geographical controls at the district level.
We cluster the standard errors at the district level.
Table 8 shows the impact of irrigation potential on demo_good and demo_better. All
columns control for country- and time fixed effects, age, gender, agricultural occupation, and
income- and educational attainment fixed effects. Columns (2) and (5) add the basic geograph-
ical controls at the subnational district level: absolute latitude, precipitation, temperature, and
soil constraints. In Column (3) and (6), we control for whether a respondent is Muslim.
The results in all columns of Table 8 show that individuals value democracy less when re-
siding in subnational districts with higher irrigation potential. In all regressions, the coeffi cient
on irrigation potential is significant at the 5 percent level, except in Column (3) where it is
significant at the 10 percent level.
A priori, a relatively weak level of significance is to be expected. Views of democracy as
a principle is a noisy indicator for actual institutional quality. Moreover, we remove a lot of
57Coppedge (2012).58The methodology is described in Bentzen (2015).
32
variation in institutions by including country fixed effects. In this light, it is striking that the
relationship between irrigation and institutions persists at the sub-national level.
The coeffi cient on the dummy indicating whether a respondent is Muslim is positive, and,
in Column (3), significant. Surprisingly, Islam is associated with more favorable views on
democracy for a given level of national democracy. The point estimate on irrigation potential
is statistically unchanged when the Muslim dummy is included. If anything, it increases in
numerical value.
Table 8. OLS regressions of attitudes towards democracy on irrigation potentia l
(1) (2) (3) (4) (5) (6)
Dep endent variab le demo_good demo_better
Irrigation potentia l (% ) -0 .059** -0 .059** -0 .057* -0 .074** -0 .086** -0 .099**
(0.028) (0 .030) (0 .033) (0 .032) (0 .036) (0 .039)
Muslim 0.046*** 0.020
(0.017) (0 .048)
Observations 96,315 95,444 74,854 62,342 61,675 47,927
R -squared 0.104 0.105 0.104 0.121 0.122 0.129
Country FE Y Y Y Y Y Y
Indiv idual contro ls Y Y Y Y Y Y
Geo controls N Y Y N Y Y
Number countries 70 70 69 52 52 51
Number regions 749 743 725 485 481 454
Notes. OLS estimates. The unit of analysis is individuals. demo_good is the answer to whether the respondent
thinks that a democratic system is very bad (scores 1), fairly bad (2), fairly good (3), or very good (4). demo_better
is the answer to whether the respondent disagrees strongly (scores 1), disagrees (2), agrees (3), or strongly agrees
(4) with the claim that democracy may have problems, but is the best political system. The individual controls
are year fixed effects, age, gender, a dummy for agricultural worker, and 10 income and 8 education fixed effects.
Geo controls refer to district level controls for absolute latitude, precipitation, temperature, and soil constraints.
Standard errors, clustered at the district level, are reported in parentheses. ***, **, and * indicate significance at
the 1, 5, and 10% level.
5 Land inequality
Our results so far confirm that irrigation based societies are more likely to be autocracies today.
In Section 2, we argued that this link arose from irrigation granting landed elites a monopoly
over water in arid areas, and that this monopoly fostered a concentration of land ownership in
the hands of the elite. In this section we provide empirical evidence for this mechanism.
33

5.1 Evidence from The Ethnographic Atlas
Our first piece of evidence comes from The Ethnographic Atlas.59 We use the Atlas to construct
a dummy variable, elite, which equals 1 for societies "...in which an elite class derives its
superior status from, and perpetuates it through, control over scarce resources, particularly
land, and is thereby differentiated from a propertyless proletariat or serf class." We remove
societies of hunters and gatherers from the sample, as irrigation is only relevant for societies
whose livelihood depends on agriculture. That leaves us with a sample of 770 societies, of
which 45 societies are coded as elite = 1.60 None of the non-agricultural societies are elite
societies.
To check whether the historical inequality captured by the elite variable has a bearing on
contemporary institutions, we average the variable across ethnographic societies within the
borders of modern countries and compare the results to the polity2 index. The correlation,
shown in Table 9, is -0.23 and significant, so areas which historically had strong elites are more
likely to be autocratic today.
The elite dummy variable is derived from the Atlas’categorization of social stratification.
Elite stratification is one of five possibilities: Complex stratification, hereditary aristocracy,
elite stratification, wealth distinctions, and absence among free men. The five forms of so-
cial stratification are not mutually exclusive. A society with hereditary aristocracy can, for
example, also have elite stratification.
Table 9 also shows the correlation between the polity2-index and the four other forms of
social stratification. Elite stratification a numerically higher correlation with the polity2 index
than the other four forms of stratification, and is the best predictor of autocracy today. The
only other significant coeffi cient is the one for complex stratification. But complex stratification
is vaguely defined, and no clear conclusions can be drawn from this correlation.
Table 9. S imple correlations b etween polity2 and stratification
polity2
Stratification based on:
- Absence among free m en 0.08
- Wealth d istinctions -0 .13
- E lite contro l o f resources -0 .23**
- Hered itary aristo cracy -0 .11
- Complex (so cia l c lasses) 0 .19**
Observations (countries) 115
59Murdock (1967). See also Section 3.2.60There are 826 countries in our sample with agriculture, but some of them are located on small islands for
which we do not have data on irrigation potential. These are excluded from the sample. None of the excludedsocieties have elite stratification.
34

Notes: Simple correlations between the polity2 index and the five stratification groups across 115 countries.
The stratification measures are dummies averaged within present-day borders. ***, **, and * indicate significance
at the 1%, 5%, and 10% level, respectively.
For each society in the sample, we calculate irrigation potential and all the geographical
control variables as averages within a 200 km radius of the society centre. We then regress our
elite dummy on the irrigation potential of a society. The results are reported in Table 10.
In all specifications, we control for the century in which a society is observed, and for
language group fixed effects. A shared language is an indicator of common cultural, religious,
and historical background, and we thereby remove variation in elite stratification caused by
such possible confounders. Without any other control variables, the estimated coeffi cient on
irrigation potential is 0.362 and significant at the 1%-level. The regression is a linear probability
model, and the result implies that the probability of being ruled by an elite is 36 percent higher
for societies with irrigation compared to societies with rainfed agriculture. We get similar
results when we include our baseline geographical controls from Section 4, shown in column
(2).
A potential omitted variable is development: elite stratification may simply be absent in
primitive societies. We add three control variables from the Ethnographic Atlas one-by-one in
columns (3)-(5) to control for this possibility: the density of the settlement, the intensity of
agriculture, and a dummy for whether a society was a part of a state.61 None of the variables
are significant, and our main result does not appear to be driven by variation in development.
In Column (6), we control for whether the local headman (if any) was appointed by election
or informal consensus rather than less democratic procedures. While earlier studies have shown
that this variable is correlated with democracy today, it is uncorrelated with historical land
inequality as measured by our elite dummy.62 Historical land inequality and proto-democratic
institutions appear to be to distinct determinants of present day democracy.
In Column (7), we include all four control variables simultaneously. There are fewer ob-
servations of elected headmen in the Ethnographic Atlas than of the other control variables,
and the sample size therefore drops. In Column (8), we include all control variables but the
appointment of the local headman (which is insignificant) to increase the sample size. The
coeffi cient on irrigation potential is unchanged in both cases, indicating that there is a robust
relationship between irrigation and land inequality across premodern societies.
61The dummy for part of a state corresponds to the centralization variable in Gennaioli & Rainer (2007).62See Giuliano & Nunn (2013).
35
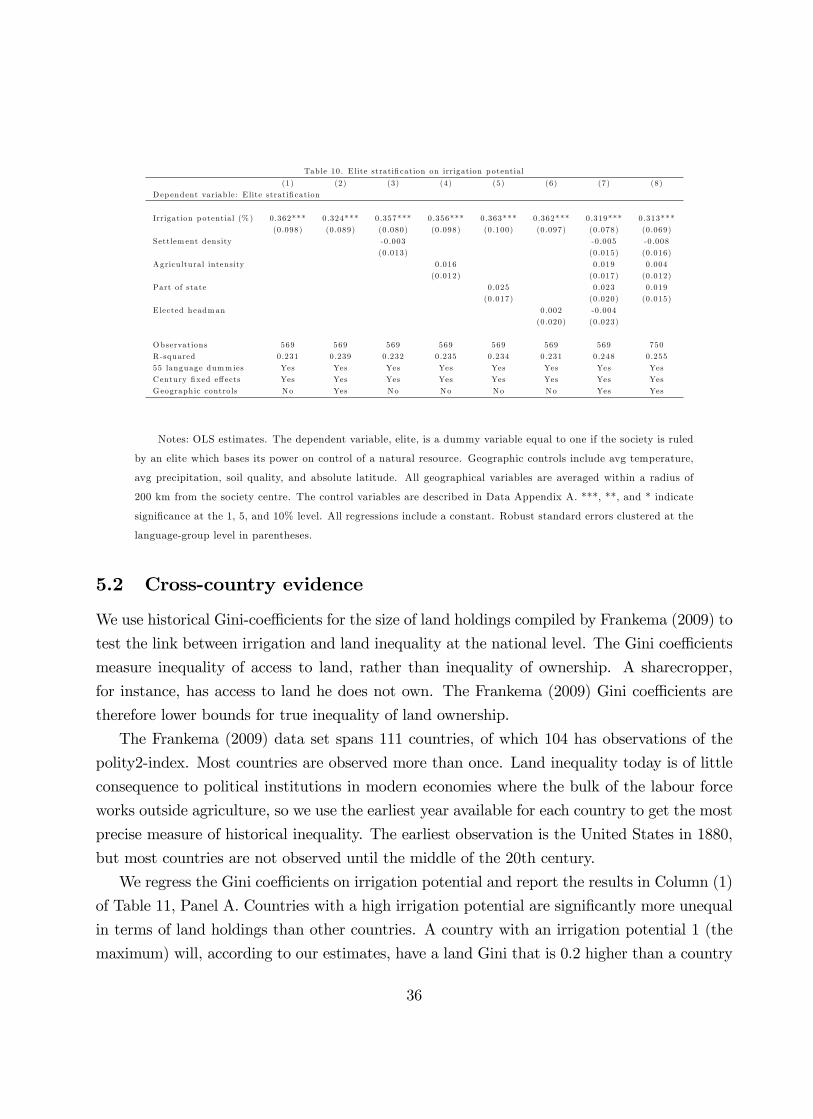
Table 10. E lite stratification on irrigation potentia l
(1) (2) (3) (4) (5) (6) (7) (8)
Dep endent variab le: E lite stratification
Irrigation potentia l (% ) 0.362*** 0.324*** 0.357*** 0.356*** 0.363*** 0.362*** 0.319*** 0.313***
(0.098) (0 .089) (0 .080) (0 .098) (0 .100) (0 .097) (0 .078) (0 .069)
Settlem ent density -0 .003 -0 .005 -0 .008
(0.013) (0 .015) (0 .016)
Agricu ltural intensity 0.016 0.019 0.004
(0.012) (0 .017) (0 .012)
Part of state 0.025 0.023 0.019
(0.017) (0 .020) (0 .015)
E lected headman 0.002 -0 .004
(0.020) (0 .023)
Observations 569 569 569 569 569 569 569 750
R -squared 0.231 0.239 0.232 0.235 0.234 0.231 0.248 0.255
55 language dumm ies Yes Yes Yes Yes Yes Yes Yes Yes
Century fixed effects Yes Yes Yes Yes Yes Yes Yes Yes
Geographic contro ls No Yes No No No No Yes Yes
Notes: OLS estimates. The dependent variable, elite, is a dummy variable equal to one if the society is ruled
by an elite which bases its power on control of a natural resource. Geographic controls include avg temperature,
avg precipitation, soil quality, and absolute latitude. All geographical variables are averaged within a radius of
200 km from the society centre. The control variables are described in Data Appendix A. ***, **, and * indicate
significance at the 1, 5, and 10% level. All regressions include a constant. Robust standard errors clustered at the
language-group level in parentheses.
5.2 Cross-country evidence
We use historical Gini-coeffi cients for the size of land holdings compiled by Frankema (2009) to
test the link between irrigation and land inequality at the national level. The Gini coeffi cients
measure inequality of access to land, rather than inequality of ownership. A sharecropper,
for instance, has access to land he does not own. The Frankema (2009) Gini coeffi cients are
therefore lower bounds for true inequality of land ownership.
The Frankema (2009) data set spans 111 countries, of which 104 has observations of the
polity2-index. Most countries are observed more than once. Land inequality today is of little
consequence to political institutions in modern economies where the bulk of the labour force
works outside agriculture, so we use the earliest year available for each country to get the most
precise measure of historical inequality. The earliest observation is the United States in 1880,
but most countries are not observed until the middle of the 20th century.
We regress the Gini coeffi cients on irrigation potential and report the results in Column (1)
of Table 11, Panel A. Countries with a high irrigation potential are significantly more unequal
in terms of land holdings than other countries. A country with an irrigation potential 1 (the
maximum) will, according to our estimates, have a land Gini that is 0.2 higher than a country
36
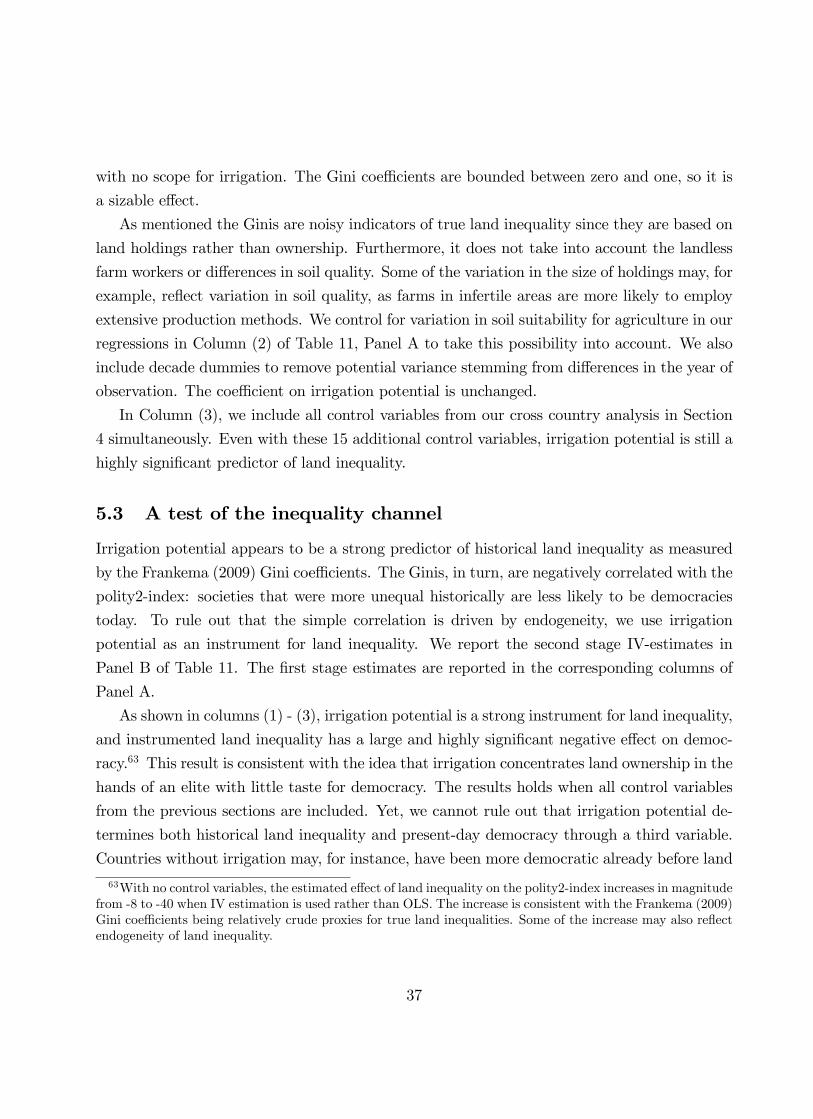
with no scope for irrigation. The Gini coeffi cients are bounded between zero and one, so it is
a sizable effect.
As mentioned the Ginis are noisy indicators of true land inequality since they are based on
land holdings rather than ownership. Furthermore, it does not take into account the landless
farm workers or differences in soil quality. Some of the variation in the size of holdings may, for
example, reflect variation in soil quality, as farms in infertile areas are more likely to employ
extensive production methods. We control for variation in soil suitability for agriculture in our
regressions in Column (2) of Table 11, Panel A to take this possibility into account. We also
include decade dummies to remove potential variance stemming from differences in the year of
observation. The coeffi cient on irrigation potential is unchanged.
In Column (3), we include all control variables from our cross country analysis in Section
4 simultaneously. Even with these 15 additional control variables, irrigation potential is still a
highly significant predictor of land inequality.
5.3 A test of the inequality channel
Irrigation potential appears to be a strong predictor of historical land inequality as measured
by the Frankema (2009) Gini coeffi cients. The Ginis, in turn, are negatively correlated with the
polity2-index: societies that were more unequal historically are less likely to be democracies
today. To rule out that the simple correlation is driven by endogeneity, we use irrigation
potential as an instrument for land inequality. We report the second stage IV-estimates in
Panel B of Table 11. The first stage estimates are reported in the corresponding columns of
Panel A.
As shown in columns (1) - (3), irrigation potential is a strong instrument for land inequality,
and instrumented land inequality has a large and highly significant negative effect on democ-
racy.63 This result is consistent with the idea that irrigation concentrates land ownership in the
hands of an elite with little taste for democracy. The results holds when all control variables
from the previous sections are included. Yet, we cannot rule out that irrigation potential de-
termines both historical land inequality and present-day democracy through a third variable.
Countries without irrigation may, for instance, have been more democratic already before land
63With no control variables, the estimated effect of land inequality on the polity2-index increases in magnitudefrom -8 to -40 when IV estimation is used rather than OLS. The increase is consistent with the Frankema (2009)Gini coeffi cients being relatively crude proxies for true land inequalities. Some of the increase may also reflectendogeneity of land inequality.
37

inequality was first measured. The correlation we observe between land inequality and present
democracy would then reflect that democracy is persistent, and that democratic countries are
more likely to undertake land reform.
The fact that we generally observe land inequality before the big waves of land reforms in
the 1960s and 1970s makes that possibility seem less likely, but we need to test it formally. To
this end, we use an additional instrument for land inequality: the suitability of cereals relative
to the suitability of plantation crops.64 By having two instruments, we are able to test the
exclusion restrictions of our instruments by a Hansen overidentification test. The Hansen test
has low power, however, especially since the cereal-plantation crops suitability ratio turns out
to be a relatively weak instrument for land inequality. Rather comforting, when the suitability
ratio is used as the sole instrument, an Anderson-Rubin p-value of 0.047 confirms that an
increased land Gini is detrimental to democracy (not shown).
We report the IV estimates with two instruments and the results of the Hansen overiden-
tification test in columns (4) - (6) of Table 11. The null of the overidentification test is that
the exclusion restrictions are not violated, i.e., that the instruments do not affect democracy
through other channels than land inequality. The test accepts the null with a p-value of 0.463
in column (4), where no control variables are included. The p-value increases to 0.667 when we
control for variance in agricultural suitability and decade fixed effects. The endogenous con-
trol variables, such as GDP per capita and population in 1500 CE, reduce the p-value of the
overidentification test to 0.199 when the full set of control variables is added to the regression
in column (6). The p-value is 0.657 when only the exogenous baseline geographical control
variables are included (not shown in the table).
Taken at face value, these test results indicate that irrigation potential only influences
democracy through land inequality. The low power of the test makes this conclusion too
strong. But the results are consistent with our hypothesis that elite rule, proxied by land
inequality, is an important channel through which irrigation has an impact on present day
institutions.65
64The instrument is the log of 1+land suitable for cereals / land suitable for agriculture1+land suitable for plantation crops / land suitable for agriculture . Cereals are buck-
wheat, maize, millet, oat, rhye, sorghum, and wheat. Plantation crops are banana, cocoa, coffee, sugar, andtea. This variable is a generalization of the Easterly (2007) measure of the wheat-sugar suitability ratio, whichhe uses as an instrument for inequality. Sugar is mostly relevant in the Americas, and the Easterly measure istherefore a weaker instrument than the generalization we use here.65We reach the same conclusion if we use the alternative test of the exclusion restriction on irrigation
potential proposed by Acemoglu et al. (2002). In this test, the cereal-plantation crop suitability ratio is theonly excluded instrument in the regression, and irrigation potential is included as a control. The coeffi cienton irrigation potential is in that case insignificant and slightly positive in the second stage, indicating that
38

Table 11. IV regression of democracy on land inequality
(1) (2) (3) (4) (5) (6)
Panel A : F irst stage
Dep endent variab le: Land G in i
Irrigation potentia l (% ) 0.193*** 0.187*** 0.278*** 0.206*** 0.202*** 0.234**
(0.040) (0 .047) (0 .087) (0 .039) (0 .049) (0 .095)
(log) Area w ith cereal / p lantation crops -0 .062 -0 .076 -0 .053
(0.048) (0 .058) (0 .079)
R -squared 0.398 0.505 0.618 0.409 0.517 0.616
Panel B : Second stage
Dep endent variab le: Polity2 index 1991-2010
Land G in i -41 .914*** -48.347*** -29.967*** -46.595*** -51.284*** -42.639***
(9.792) (10.948) (11.519) (9 .170) (11.594) (15.794)
K leib ergen Paap F 23.05 16.14 10.17 14.26 8.514 4.390
Anderson-Rubin p 0.000 0.000 0.001 0.000 0.000 0.000
Hansen J p-value 0.463 0.667 0.199
Observations 102 102 102 102 102 102
Continents Yes Yes Yes Yes Yes Yes
Variance agr su itab ility No Yes Yes No Yes Yes
Decade fixed effects No Yes Yes No Yes Yes
Full set of contro ls No No Yes No No Yes
Notes: IV estimates of democracy on land inequality, where land inequality is instrumented with irrigation
potential in columns (1) - (3) and with irrigation potential and the ratio between the suitability for cereal versus
plantation crops in columns (4) - (6). Panel A shows the first stage results and panel B the second stage results.
The full set of controls is average precipitation, average temperature, soil quality, absolute latitude, land within 100
km of navigable rivers, oil share, real GDP per capita, years since Neolithic Revolution, population density year
1500, colony dummy, European language share, Muslim share, Protestants share, Catholics share, and Buddhists
share. See Data Appendix A for a description of these variables.
6 Conclusion
We have tested the theory that societies with a history of irrigated agriculture have developed
more autocratic institutions than societies with a history of rainfed agriculture. Such a link has
been hypothesized by many prominent scholars throughout history, including Marx (1853) and
Wittfogel (1957), but it can best be understood through the lens of more recent resource curse
theories. Irrigation can provide high crop yields, but it also allows local elites to effectively
monopolize arable land in arid areas through their ownership of irrigation infrastructure. Much
of the gain from irrigated agriculture therefore ends up in the hands of the elite. In that sense,
irrigation potential has little effect on the polity2-index beyond its effect on instrumented land inequality. Aswith the Hansen overidentification test, however, this test has relatively low power since the cereal-plantationsuitability is a relatively weak instrument.
39

water for irrigation resembles a point-source resource, a class of natural resources shown to
inhibit democratization when found in abundance.
Since adoption of irrigation may be influenced by existing institutions and the degree of
economic development, we use an exogenous measure of irrigation potential to estimate a
causal effect of historical irrigation on autocracy. We find that countries in areas with a high
potential for irrigation are more autocratic today as measured by the polity2 index from the
Polity IV database. Our results are robust to a wide range of geographical, climatic, cultural,
and historical control variables. According to our estimates, the difference between a country
with no irrigation potential and a country with full irrigation potential is about six points on
the 21 point polity2 scale. By implication, the difference in irrigation potential can account for
the gap in institutional quality between Turkey and Algeria. At a more disaggregated level,
we document that individuals in regions with a high irrigation potential have less favorable
views on democracy.
As the example with Turkey and Algeria shows, the magnitudes involved are quite large.
Contemporary effects of irrigation on institutions are unlikely to generate such differences,
and they should be seen as the outcome of a long historical process. Irrigation fostered a
concentration of power and wealth in the hands of a small elite. The elite entrenched itself
through non-democratic institutions, and both the elite and the institutions were able to survive
even when the economic importance of agriculture declined.
We demonstrate this mechanism in two steps. First we show that irrigation historically
was associated with a concentration of land ownership. Premodern societies were more likely
to be ruled by a natural resource-controlling elite if their agriculture was based on irrigation.
And countries with high irrigation potential had higher Gini-coeffi cients for land holdings in
the middle of the 20th century. Second, we show that irrigation potential has little effect on
present day democracy once historical land inequality is accounted for.
Our results contribute to the literature on the origins of institutions. Much attention has
been paid to economic development and to historical contingencies related to, for example,
colonization. However important these determinants might be, a significant fraction of global
variation in institutional quality can still be traced to deeply rooted geographical factors. The
supply of water is one, as we show in this paper.
40

A Data AppendixVariable Description Source
Absolute latitude Distance in decimal degrees to the Equator from cen-
troid of the country.
Thematic Mapping,
www.thematicmapping.org.
Agricultural intensity Index ranging from 1 to 4. 1 is casual agriculture and
4 is intensive agriculture.
Ethnographic Atlas, V28.
Murdock (1967).
Agriculture suitability, mean Average suitability for agriculture. We use the Ra-
mankutty et al. (2002) 0.5x0.5 degree grid cell shape-
file of agriculture suitability, which is constructed by
(i) empirically fitting the relationship between existing
croplands and both climate and soil characteristics and
then (ii) combining the derived relationship with the
available regional climatic and soil characteristics.
Center for Sustainability
and the Global Environ-
ment (SAGE), University of
Wisconsin-Maddison.
Agriculture suitability, variance Spatial variance of the above agricultural suitability Center for Sustainability
and the Global Environ-
ment (SAGE), University of
Wisconsin-Maddison.
Arable land % Share of total area suitable for agriculture, where suit-
able for agriculture is defined as belonging to impact
classes 1-5, shown in Figure 1.
Plate 47 of FAO
GAEZ 2002 database.
www.iiasa.ac.at/Research/LUC/
SAEZ/.
Area in the tropics Share of total area located in the tropics Nunn & Qian (2011).
Buddhists Buddhists as a percentage of total population in year
2000
The Quality of Governance In-
stitute, University of Gothen-
burg.
Catholics Catholics as a percentage of total population in year
2000
The Quality of Governance In-
stitute, University of Gothen-
burg.
Cereal / plantation Log of 1+cerealshare1+plantationshare
, where cerealshare =land suitable for cereals
land suitable for agricultureand plantationshare =
land suitable for plantation cropsland suitable for agriculture
. Plantation crops
are banana, cocoa, coffee, sugar and tea. Cereals
are buckwheat, maize, millet, oat, rhye, sorghum and
wheat. We define suitable as land classified as at least
medium suitable by FAO.
FAO GAEZ 3.0 database.
Colony dummy Dummy equal to 1 if the country was colonized by
Europeans
Olsson (2009).
Continent dummies Dummies for Europe, Asia, North America, South
America, Africa, and Oceania.
Demo_better Index 1-4 measuring whether the respondent dis-
agrees strongly (scores 1), disagrees (2), agrees (3),
or strongly agrees (4) with the claim that democracy
may have problems, but is the best political system.
We have transformed the original variable such that
higher values indicate a more favorable view on democ-
racy.
Question e123 in the pooled
World Values Survey / Euro-
pean Values Study.
Demo_good Index 1-4 measuring whether the respondent thinks
that a democratic system is very bad (scores 1), fairly
bad (2), fairly good (3), or very good (4).
Question e117 in the pooled
World Values Survey / Euro-
pean Values Study.
Diamond dummy A dummy equal to one if there are diamonds in the
underground.
Gilmore et al. (2005)
41
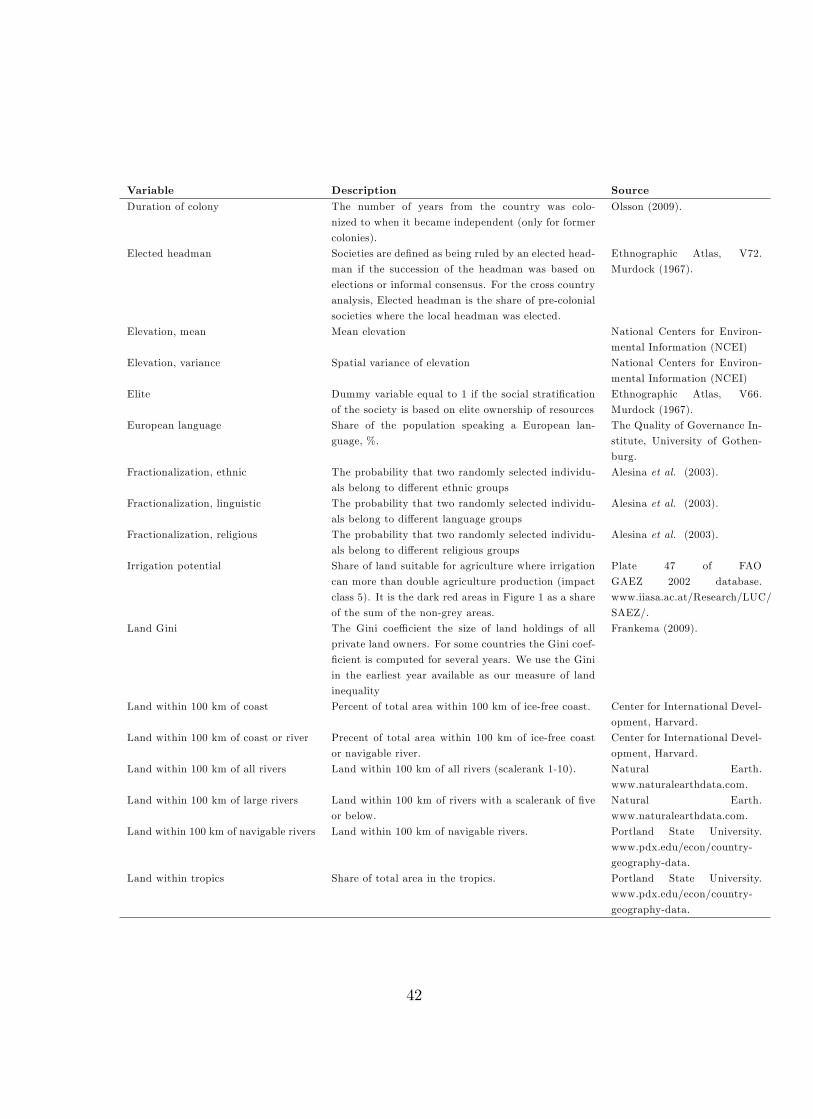
Variable Description Source
Duration of colony The number of years from the country was colo-
nized to when it became independent (only for former
colonies).
Olsson (2009).
Elected headman Societies are defined as being ruled by an elected head-
man if the succession of the headman was based on
elections or informal consensus. For the cross country
analysis, Elected headman is the share of pre-colonial
societies where the local headman was elected.
Ethnographic Atlas, V72.
Murdock (1967).
Elevation, mean Mean elevation National Centers for Environ-
mental Information (NCEI)
Elevation, variance Spatial variance of elevation National Centers for Environ-
mental Information (NCEI)
Elite Dummy variable equal to 1 if the social stratification
of the society is based on elite ownership of resources
Ethnographic Atlas, V66.
Murdock (1967).
European language Share of the population speaking a European lan-
guage, %.
The Quality of Governance In-
stitute, University of Gothen-
burg.
Fractionalization, ethnic The probability that two randomly selected individu-
als belong to different ethnic groups
Alesina et al. (2003).
Fractionalization, linguistic The probability that two randomly selected individu-
als belong to different language groups
Alesina et al. (2003).
Fractionalization, religious The probability that two randomly selected individu-
als belong to different religious groups
Alesina et al. (2003).
Irrigation potential Share of land suitable for agriculture where irrigation
can more than double agriculture production (impact
class 5). It is the dark red areas in Figure 1 as a share
of the sum of the non-grey areas.
Plate 47 of FAO
GAEZ 2002 database.
www.iiasa.ac.at/Research/LUC/
SAEZ/.
Land Gini The Gini coeffi cient the size of land holdings of all
private land owners. For some countries the Gini coef-
ficient is computed for several years. We use the Gini
in the earliest year available as our measure of land
inequality
Frankema (2009).
Land within 100 km of coast Percent of total area within 100 km of ice-free coast. Center for International Devel-
opment, Harvard.
Land within 100 km of coast or river Precent of total area within 100 km of ice-free coast
or navigable river.
Center for International Devel-
opment, Harvard.
Land within 100 km of all rivers Land within 100 km of all rivers (scalerank 1-10). Natural Earth.
www.naturalearthdata.com.
Land within 100 km of large rivers Land within 100 km of rivers with a scalerank of five
or below.
Natural Earth.
www.naturalearthdata.com.
Land within 100 km of navigable rivers Land within 100 km of navigable rivers. Portland State University.
www.pdx.edu/econ/country-
geography-data.
Land within tropics Share of total area in the tropics. Portland State University.
www.pdx.edu/econ/country-
geography-data.
42
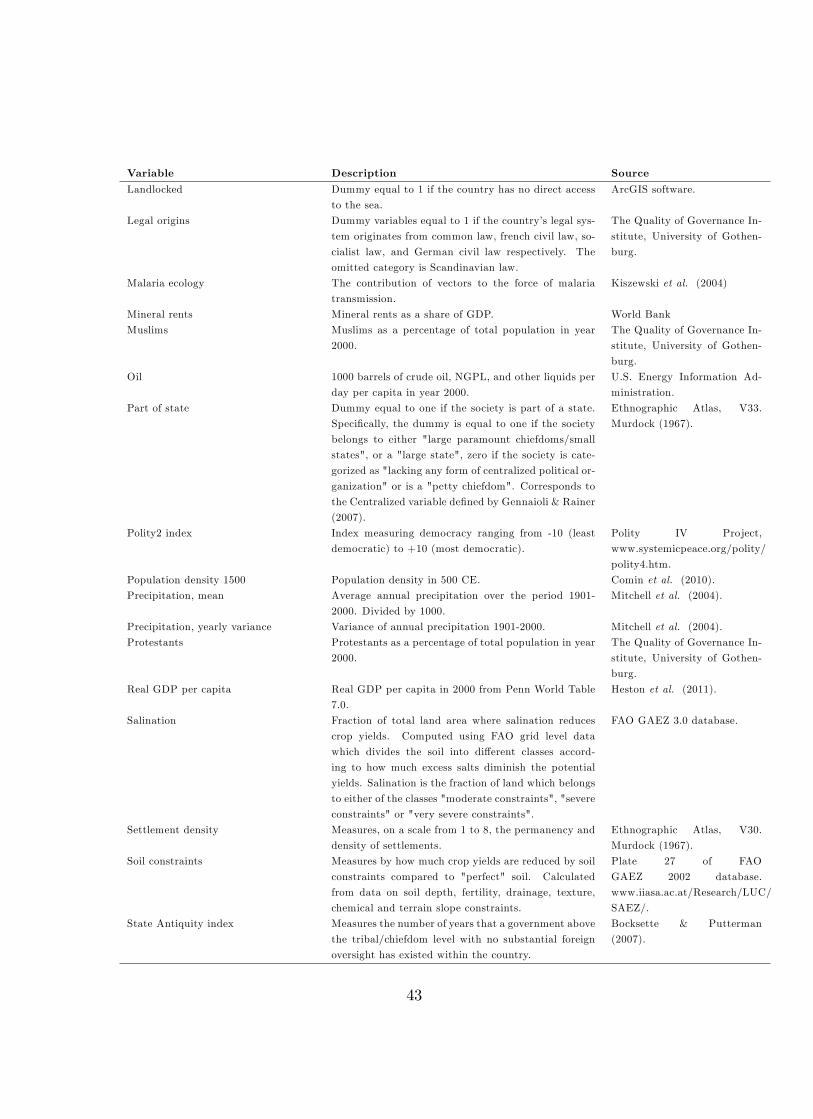
Variable Description Source
Landlocked Dummy equal to 1 if the country has no direct access
to the sea.
ArcGIS software.
Legal origins Dummy variables equal to 1 if the country’s legal sys-
tem originates from common law, french civil law, so-
cialist law, and German civil law respectively. The
omitted category is Scandinavian law.
The Quality of Governance In-
stitute, University of Gothen-
burg.
Malaria ecology The contribution of vectors to the force of malaria
transmission.
Kiszewski et al. (2004)
Mineral rents Mineral rents as a share of GDP. World Bank
Muslims Muslims as a percentage of total population in year
2000.
The Quality of Governance In-
stitute, University of Gothen-
burg.
Oil 1000 barrels of crude oil, NGPL, and other liquids per
day per capita in year 2000.
U.S. Energy Information Ad-
ministration.
Part of state Dummy equal to one if the society is part of a state.
Specifically, the dummy is equal to one if the society
belongs to either "large paramount chiefdoms/small
states", or a "large state", zero if the society is cate-
gorized as "lacking any form of centralized political or-
ganization" or is a "petty chiefdom". Corresponds to
the Centralized variable defined by Gennaioli & Rainer
(2007).
Ethnographic Atlas, V33.
Murdock (1967).
Polity2 index Index measuring democracy ranging from -10 (least
democratic) to +10 (most democratic).
Polity IV Project,
www.systemicpeace.org/polity/
polity4.htm.
Population density 1500 Population density in 500 CE. Comin et al. (2010).
Precipitation, mean Average annual precipitation over the period 1901-
2000. Divided by 1000.
Mitchell et al. (2004).
Precipitation, yearly variance Variance of annual precipitation 1901-2000. Mitchell et al. (2004).
Protestants Protestants as a percentage of total population in year
2000.
The Quality of Governance In-
stitute, University of Gothen-
burg.
Real GDP per capita Real GDP per capita in 2000 from Penn World Table
7.0.
Heston et al. (2011).
Salination Fraction of total land area where salination reduces
crop yields. Computed using FAO grid level data
which divides the soil into different classes accord-
ing to how much excess salts diminish the potential
yields. Salination is the fraction of land which belongs
to either of the classes "moderate constraints", "severe
constraints" or "very severe constraints".
FAO GAEZ 3.0 database.
Settlement density Measures, on a scale from 1 to 8, the permanency and
density of settlements.
Ethnographic Atlas, V30.
Murdock (1967).
Soil constraints Measures by how much crop yields are reduced by soil
constraints compared to "perfect" soil. Calculated
from data on soil depth, fertility, drainage, texture,
chemical and terrain slope constraints.
Plate 27 of FAO
GAEZ 2002 database.
www.iiasa.ac.at/Research/LUC/
SAEZ/.
State Antiquity index Measures the number of years that a government above
the tribal/chiefdom level with no substantial foreign
oversight has existed within the country.
Bocksette & Putterman
(2007).
43
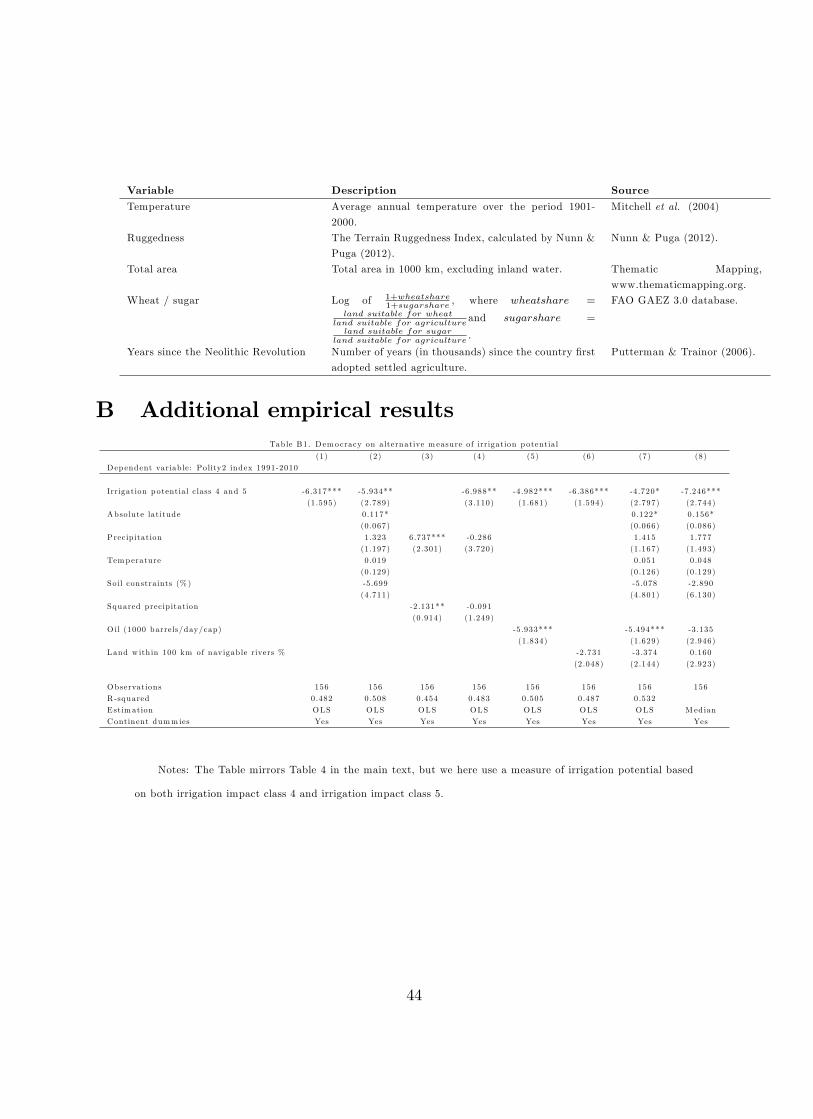
Variable Description Source
Temperature Average annual temperature over the period 1901-
2000.
Mitchell et al. (2004)
Ruggedness The Terrain Ruggedness Index, calculated by Nunn &
Puga (2012).
Nunn & Puga (2012).
Total area Total area in 1000 km, excluding inland water. Thematic Mapping,
www.thematicmapping.org.
Wheat / sugar Log of 1+wheatshare1+sugarshare
, where wheatshare =land suitable for wheat
land suitable for agricultureand sugarshare =
land suitable for sugarland suitable for agriculture
.
FAO GAEZ 3.0 database.
Years since the Neolithic Revolution Number of years (in thousands) since the country first
adopted settled agriculture.
Putterman & Trainor (2006).
B Additional empirical resultsTable B1. Democracy on alternative m easure of irrigation potentia l
(1) (2) (3) (4) (5) (6) (7) (8)
Dep endent variab le: Polity2 index 1991-2010
Irrigation potentia l c lass 4 and 5 -6.317*** -5 .934** -6 .988** -4 .982*** -6 .386*** -4 .720* -7 .246***
(1.595) (2 .789) (3 .110) (1 .681) (1 .594) (2 .797) (2 .744)
Absolute latitude 0.117* 0.122* 0.156*
(0.067) (0 .066) (0 .086)
Precip itation 1.323 6.737*** -0 .286 1.415 1.777
(1.197) (2 .301) (3 .720) (1 .167) (1 .493)
Temperature 0.019 0.051 0.048
(0.129) (0 .126) (0 .129)
Soil constra ints (% ) -5 .699 -5 .078 -2 .890
(4.711) (4 .801) (6 .130)
Squared precip itation -2 .131** -0 .091
(0.914) (1 .249)
O il (1000 barrels/day/cap) -5 .933*** -5 .494*** -3 .135
(1.834) (1 .629) (2 .946)
Land w ith in 100 km of navigab le rivers % -2.731 -3 .374 0.160
(2 .048) (2 .144) (2 .923)
Observations 156 156 156 156 156 156 156 156
R -squared 0.482 0.508 0.454 0.483 0.505 0.487 0.532
Estim ation OLS OLS OLS OLS OLS OLS OLS Median
Continent dumm ies Yes Yes Yes Yes Yes Yes Yes Yes
Notes: The Table mirrors Table 4 in the main text, but we here use a measure of irrigation potential based
on both irrigation impact class 4 and irrigation impact class 5.
44
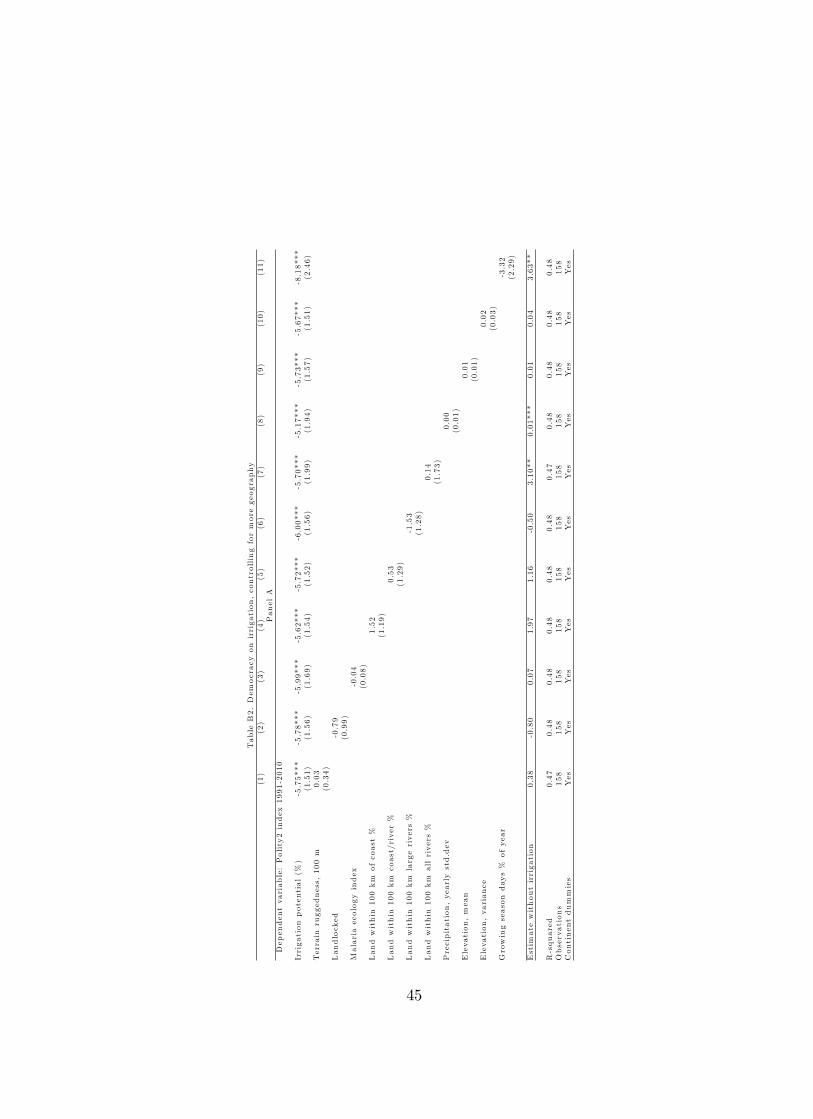
TableB2.Dem
ocracy
onirrigation,controllingformoregeography
(1)
(2)
(3)
(4)
(5)
(6)
(7)
(8)
(9)
(10)
(11)
PanelA
Dependentvariable:Polity2index
1991-2010
Irrigationpotential(%)
-5.75***
-5.78***
-5.99***
-5.62***
-5.72***
-6.00***
-5.70***
-5.17***
-5.73***
-5.67***
-8.18***
(1.51)
(1.56)
(1.69)
(1.54)
(1.52)
(1.56)
(1.99)
(1.94)
(1.57)
(1.51)
(2.46)
Terrainruggedness,100m
0.03
(0.34)
Landlocked
-0.79
(0.99)
Malariaecologyindex
-0.04
(0.08)
Landwithin100kmofcoast%
1.52
(1.19)
Landwithin100kmcoast/river%
0.53
(1.29)
Landwithin100kmlargerivers%
-1.53
(1.28)
Landwithin100kmallrivers%
0.14
(1.73)
Precipitation,yearlystd.dev
0.00
(0.01)
Elevation,mean
0.01
(0.01)
Elevation,variance
0.02
(0.03)
Growingseasondays%ofyear
-3.32
(2.29)
Estimatewithoutirrigation
0.38
-0.80
0.07
1.97
1.16
-0.50
3.10**
0.01***
0.01
0.04
3.63**
R-squared
0.47
0.48
0.48
0.48
0.48
0.48
0.47
0.48
0.48
0.48
0.48
Observations
158
158
158
158
158
158
158
158
158
158
158
Continentdummies
Yes
Yes
Yes
Yes
Yes
Yes
Yes
Yes
Yes
Yes
Yes
45

TableB2cont.Dem
ocracy
onirrigation,controllingformoregeography
(1)
(2)
(3)
(4)
(5)
(6)
(7)
(8)
(9)
(10)
(11)
(12)
PanelB
Dependentvariable:Polity2index
1991-2010
Irrigationpotential(%)
-6.55***
-5.41***
-5.58***
-8.16***
-5.90***
-7.38***
-5.95***
-6.44***
-6.51***
-5.53***
-5.53**
-7.79***
(1.72)
(1.66)
(1.56)
(1.92)
(1.53)
(1.96)
(1.56)
(1.45)
(1.53)
(1.54)
(2.15)
(2.11)
Absolutelatitude
0.07
(0.09)
AbsolutelatitudeXabsolutelatitude
0.00
(0.00)
Meanagriculturalsuitability
0.78
(1.65)
Variance
ofagriculturalsuitability
3.29
(3.70)
Arableland(%)
-3.20**
-1.93
(1.45)
(1.72)
Totalarea
0.00*
0.00
(0.00)
(0.00)
Landwithintropics(%)
-0.02*
-0.00
(0.01)
(0.02)
(log)Wheat/sugarcrops
2.59
(2.27)
(log)Cereal/Plantationcrops
2.95**
2.17
(1.35)
(1.67)
Mineralrents,%ofGDP
0.07
(0.13)
Diamonddummy
1.22
(1.42)
Salination%
-0.61
(2.91)
Estimatewithoutirrigation
4.28**
6.09
1.04
0.00*
0.01
1.358
1.79
0.00
1.41
-6.49***
Observations
158
158
158
158
158
158
158
158
152
157
158
158
R-squared
0.49
0.48
0.48
0.49
0.48
0.49
0.48
0.50
0.49
0.48
0.47
0.50
Continentdummies
Yes
Yes
Yes
Yes
Yes
Yes
Yes
Yes
Yes
Yes
Yes
Yes
46
Notes: OLS estimates. The dependent variable is the polity2 index. "Estimate of geo without irrigation"
is the parameter estimate of the particular geographical variable in the same regression when irrigation potential
is omitted. Column (12) of panel B includes all significant variables simultaneously. All variables are described
in Data Appendix A. ***, **, and * indicate significance at the 1, 5, and 10% level. All regressions include a
constant. Robust standard errors in parentheses.
Table B3. Democracy on irrigation w ith additional contro ls
(1) (2) (3) (4) (5)
Dep endent variab le: Polity2 index 1991-2010
Irrigation potentia l (% ) -5 .39*** -4 .66** -5 .01*** -9 .02*** -6 .69**
(1.70) (1 .99) (1 .81) (2 .48) (2 .78)
Ethnic fractionalization -4 .58 -7 .19**
(3.57) (3 .36)
Relig ious fractionalization 0.34 -0 .92
(2.12) (3 .63)
L ingu istic fractionalization 2.81 5.66
(3.39) (3 .46)
Legal orig in : Common law 1.02 3.47*
(1 .23) (1 .78)
Legal orig in : French civ il law -0.75 -0 .07
(0 .97) (1 .17)
Legal orig in : So cia list law -2.99*** -0 .99
(0 .86) (1 .37)
Legal orig in : G erman civ il law 2.81* 4.24
(1 .63) (2 .73)
Years since industria lization 0.02* 0.01
(0.01) (0 .01)
Observations 122 122 122 71 71
R -squared 0.47 0.48 0.53 0.55 0.63
Continents Yes Yes Yes Yes Yes
Notes: OLS estimates. The dependent variable is the polity2 index. All variables are described in Data
Appendix A. ***, **, and * indicate, respectively, significance at the 1, 5, and 10% level. All regressions include
a constant. Robust standard errors in parentheses.
C Instrumental variable estimations
This section provides the IV counterparts of the key reduced form regressions reported in the
main text. The reduced form estimates are our preferred estimates for two reasons. First, in
the exactly identified setting of our analysis, the IV estimates are a rescaling of the reduced
form estimates, and they do not as such provide any additional information. Second, the IV
estimates are likely to be biased when we use irrigation potential as instrument for the extent
of actual irrigation today.
To illustrate the bias, let x denote irrigation. Actual irrigation measured today can be
written as a sum of historical irrigation using traditional methods and recently irrigated areas
where irrigation is based on cheap modern technologies:
47

xtoday = xtraditional + xmodern.
We observe xtoday, but not its parts. Assume that only traditional irrigation affects democracy
today and that it does so through a linear relationship:
democracyi = β0 + β1xtraditional,i + εi.
The equation above can be rewritten in terms of the observed xtoday:
democracyi = β0 + β1xtoday + ηi ,
where ηi = −β1xmodern+ εi. OLS estimates of β1 based on the equation above are biased sincecov (xtoday, ηi) 6= 0. Suppose now that we try to solve this problem by using irrigation potentialas an instrument for irrigation today. We would then estimate the following first and second
stage regressions:
xtoday = α0 + α1xpotential + ui ;
democracyi = βIV0 + βIV1 xtoday + vi ,
where xtoday is the predicted xtoday from the first stage. The IV estimates are unbiased estimates
of β1 if xmodern and xpotential are uncorrelated. As discussed in the main text, however, this
exogeneity condition is likely to be violated since modern technologies have increased the scope
for irrigation outside areas with high irrigation potential. We should consequently expect λ1to be negative in the following regression:
xmodern,i = λ0 + λ1xpotential,i + υi.
The estimated βIV1 is consequently biased. Asymptotically, the bias takes the form:
βIV1 = β1 +−β1λ1α1
.
We estimate α1 > 0 below, and our reduced form regressions in the main text suggest that
β1 < 0. We consequently have that βIV1 < β1, and the IV results will consequently overstate
the true negative effect of irrigation on democracy. We do not face the same problem when
48
we estimate the reduced form regression of democracy on irrigation potential. If λ1 6= 0, wesimply have a measurement error problem, and our estimates are consequently biased toward
zero as in the OLS case (presumably less so because λ1 is likely to be less than one). Our
reduced form estimates therefore tend to underestimate the effect of irrigation, whereas the IV
estimates overstate the effect of irrigation.
C.1 IV results for polity2
Columns (1)-(3) of Table C1 report the IV counterparts of the reduced form regressions in
Table 4. We use data on actual irrigation from FAO. As expected, the estimated coeffi cients
on irrigation have the same sign as the reduced form estimates. The corresponding OLS
estimates are also significant (not shown), albeit numerically smaller than the IV estimates,
some of which is presumably due to the bias discussed above.
We face a weak instrument problem when we include the additional geographical control
variables in column (3). We are not worried by this, as part of the weakness is the consequence
of adding insignificant control variables to the regression, another part is the rise in modern
irrigation outside areas in Impact Class 5. The AV plot of the first stage in column (3) is
shown in Figure C1.
As a robustness check, we use two additional data sets on irrigation dependence: The
Freydank & Siebert (2008) estimates of land equipped for irrigation in year 1900, and data
derived from the Ethnographic Atlas. In the latter case, we measure the irrigation dependence
of a country as the share of societies within that country’s current borders that used irrigation.
The results are in both cases similar to when we use the FAO irrigation data, but the estimates
are less precise due to measurement errors.
In the case of the Freydank & Siebert (2008) data, less than 15 percent of the observations
in 1900 are based on actual data. The rest are estimated by extrapolating modern data back-
wards, by comparisons with other countries, or based on qualitative information. Moreover,
the Freydank & Siebert (2008) data measures area equipped for irrigation, and provides no
information on how intensively the irrigation infrastructure was used, if at all, and how high
the returns were. All these shortcomings add measurement errors to the data set.
49

Table C1. IV estim ates of democracy on irrigation
(1) (2) (3) (4) (5) (6) (7) (8) (9)
Irrigation m easure actual2000 actual2000 actual2000 est1900 est1900 est1900 EthnoAtlas EthnoAtlas EthnoAtlas
Panel A . F irst stage
Dep endent variab le: Irrigation
Irrigation potentia l (% ) 0.345*** 0.244*** 0.218* 0.090** 0.073* 0.076 0.253*** 0.188** 0.193*
(0.085) (0 .086) (0 .127) (0 .035) (0 .041) (0 .058) (0 .073) (0 .076) (0 .111)
Absolute latitude -0 .003 -0 .000 -0 .001
(0.003) (0 .001) (0 .002)
Precip itation -0 .044 -0 .000 -0 .006
(0.053) (0 .019) (0 .052)
Temperature -0 .001 -0 .002 -0 .004
(0.005) (0 .002) (0 .004)
Soil constra ints (% ) 0.094 -0 .002 -0 .008
(0.177) (0 .066) (0 .120)
R -squared 0.215 0.537 0.542 0.145 0.190 0.207 0.153 0.311 0.323
Panel B . Second stage
Dep endent variab le: Polity2 index 1991-2010
Irrigation -32.672*** -28.357*** -26.761* -107.933** -79.487* -70.420 -38.508*** -30.846** -27.589
(7.194) (10.222) (15.527) (43.853) (47.208) (55.649) (11.921) (14.458) (18.461)
R -squared -0 .568 0.178 0.232 -1 .017 -0 .200 -0 .004 -0 .994 -0 .177 -0 .004
K leib ergen Paap F 16.64 7.994 2.953 6.404 3.224 1.697 11.95 6.114 3.003
A Rubin p-value 0 3.06e-05 0.0270 0 0.000126 0.0329 0 0.000126 0.0309
Observations 132 132 132 159 159 159 160 160 160
Continent dumm ies No Yes Yes No Yes Yes No Yes Yes
Baseline geography No No Yes No No Yes No No Yes
Notes: IV estimates, first stage in panel A, second stage in panel B. Irrigation is instrumented with irrigation
potential in a regression on the polity2 index, averaged over the period 1991-2010. The irrigation measure is actual
irrigation as a share of cultivated land in year 2000 in columns (1)-(3), land equipped for irrigation in year 1900 as
a share of arable land in columns (4)-(6), and the share of ethnographic societies within the borders of the country
that relied on irrigation in columns (7)-(9). Geographical baseline controls are absolute latitude, temperature,
precipitation, and soil quality. These are included in columns (3), (6), and (9), but only shown in the first stage
estimation to show that it is their insignificance that renders the instrument weaker. ***, **, and * indicate
significance at the 1, 5, and 10% level, respectively. All regressions include a constant. Robust standard errors in
parentheses.
50
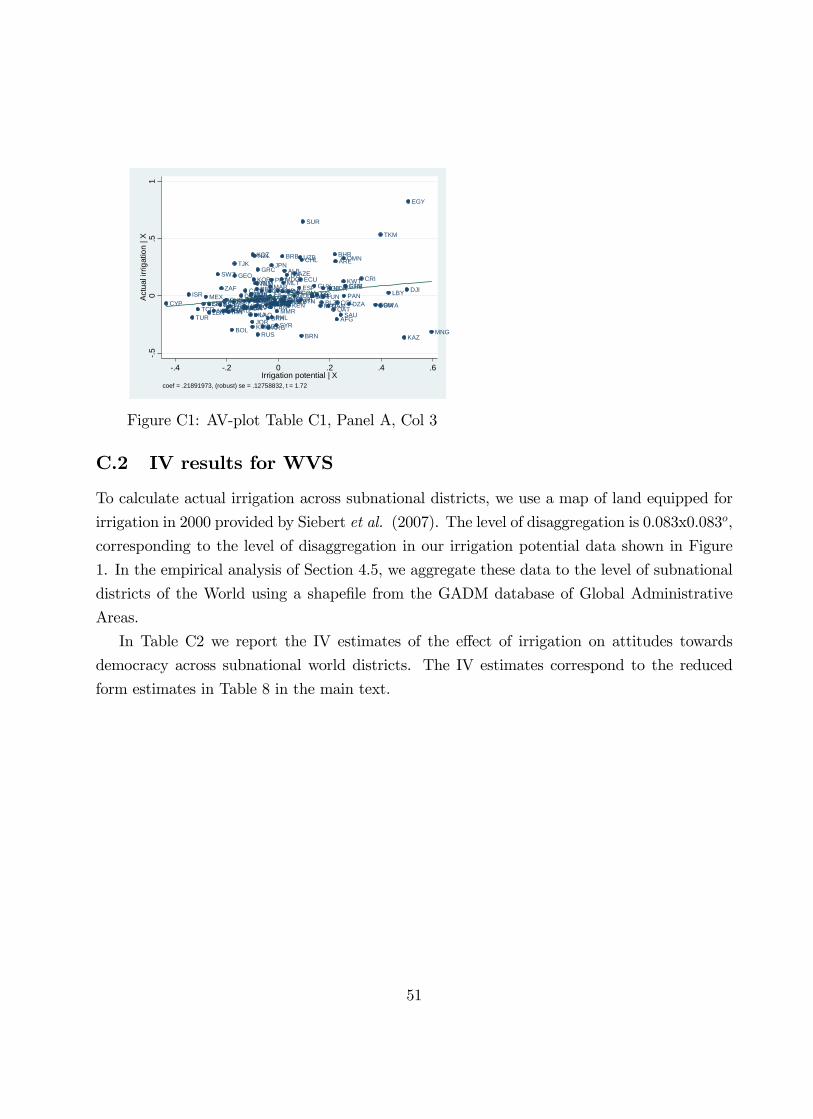
CYPISR
TURTCD
SENMEXGMBLBNNER
SWZ
BFA
ZAF
URYINDARMTHA
CUBHTIIRNERI
BOL
GRDBEN
TJK
GEO
DOM
MLIHUNTTOMDA
CHN
UKRZWETGO
LKA
ZMBDNK
SLVAGO
JORKHM
KGZ
KOR
USA
NZL
BGR
VNM
GHALSO
LAO
PERNLD
POLNGA
RUS
GRC
MOZMWICIVIRQ
PRY
CZE
BRA
CAF
ARG
VENFRABLR
MAR
CAN
JPN
PRT
PHL
ESTLTULVADEUSRBFINUGABEL
SYR
MMRPRI
GNBSWE
MDG
BRB
JAMMLT
SVKHNDRWA
ALBITA
GIN
KENLUXCOD
AZE
COMESP
BTN
UZB
ECU
IRL
BRN
CHL
SUR
GBRATGAUT
GUYNIC
MRTBLZTUNBGD
NAM
NOR
QAT
BHRARE
AFG
COL
SAU
OMN
KWT
PANGTMCHE
DZA
CRI
SOMBWA
TKM
LBY
KAZ
DJI
EGY
MNG
.50
.51
Act
ual i
rriga
tion
| X
.4 .2 0 .2 .4 .6Irrigation potential | X
coef = .21891973, (robust) se = .12758832, t = 1.72
Figure C1: AV-plot Table C1, Panel A, Col 3
C.2 IV results for WVS
To calculate actual irrigation across subnational districts, we use a map of land equipped for
irrigation in 2000 provided by Siebert et al. (2007). The level of disaggregation is 0.083x0.083o,
corresponding to the level of disaggregation in our irrigation potential data shown in Figure
1. In the empirical analysis of Section 4.5, we aggregate these data to the level of subnational
districts of the World using a shapefile from the GADM database of Global Administrative
Areas.
In Table C2 we report the IV estimates of the effect of irrigation on attitudes towards
democracy across subnational world districts. The IV estimates correspond to the reduced
form estimates in Table 8 in the main text.
51
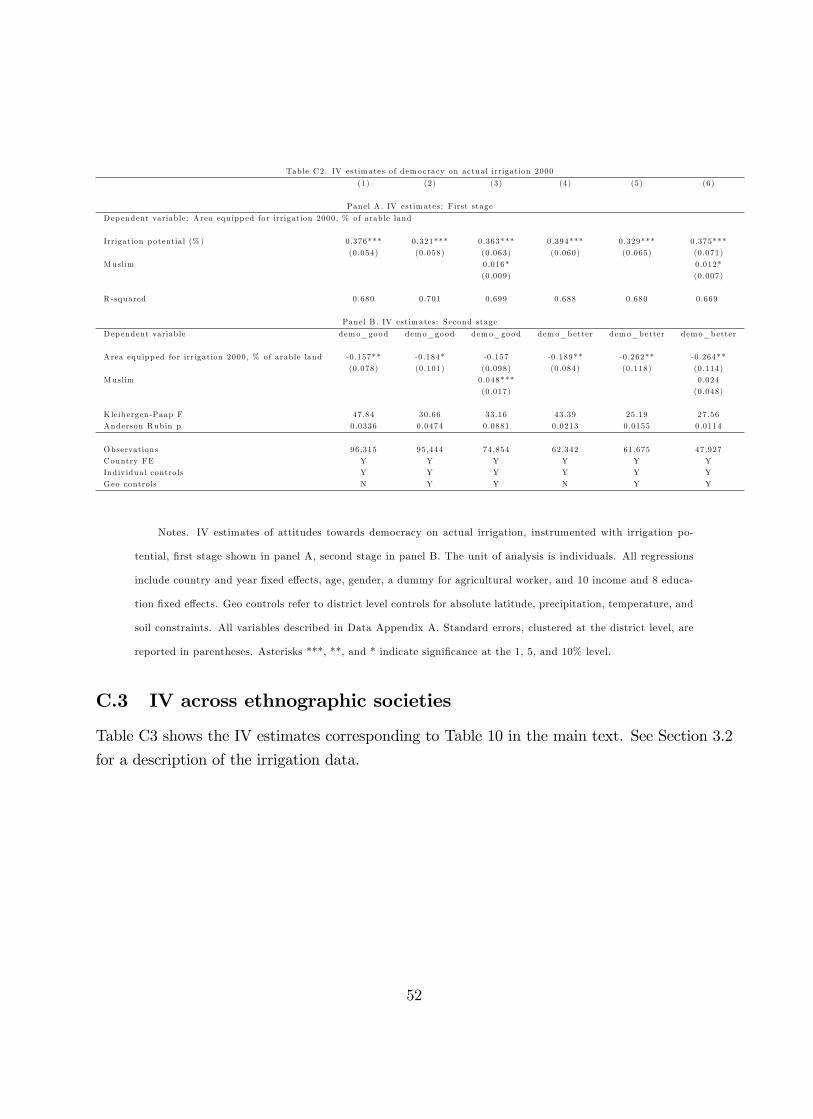
Table C2. IV estim ates of democracy on actual irrigation 2000
(1) (2) (3) (4) (5) (6)
Panel A . IV estim ates: F irst stage
Dep endent variab le: A rea equ ipp ed for irrigation 2000, % of arab le land
Irrigation potentia l (% ) 0.376*** 0.321*** 0.363*** 0.394*** 0.329*** 0.375***
(0.054) (0 .058) (0 .063) (0 .060) (0 .065) (0 .071)
Muslim 0.016* 0.012*
(0.009) (0 .007)
R -squared 0.680 0.701 0.699 0.688 0.680 0.669
Panel B . IV estim ates: Second stage
Dep endent variab le demo_good demo_good demo_good demo_better demo_better demo_better
A rea equipp ed for irrigation 2000, % of arab le land -0.157** -0 .184* -0 .157 -0 .189** -0 .262** -0 .264**
(0.078) (0 .101) (0 .098) (0 .084) (0 .118) (0 .114)
Muslim 0.048*** 0.024
(0.017) (0 .048)
K leib ergen-Paap F 47.84 30.66 33.16 43.39 25.19 27.56
Anderson Rubin p 0.0336 0.0474 0.0881 0.0213 0.0155 0.0114
Observations 96,315 95,444 74,854 62,342 61,675 47,927
Country FE Y Y Y Y Y Y
Indiv idual contro ls Y Y Y Y Y Y
Geo controls N Y Y N Y Y
Notes. IV estimates of attitudes towards democracy on actual irrigation, instrumented with irrigation po-
tential, first stage shown in panel A, second stage in panel B. The unit of analysis is individuals. All regressions
include country and year fixed effects, age, gender, a dummy for agricultural worker, and 10 income and 8 educa-
tion fixed effects. Geo controls refer to district level controls for absolute latitude, precipitation, temperature, and
soil constraints. All variables described in Data Appendix A. Standard errors, clustered at the district level, are
reported in parentheses. Asterisks ***, **, and * indicate significance at the 1, 5, and 10% level.
C.3 IV across ethnographic societies
Table C3 shows the IV estimates corresponding to Table 10 in the main text. See Section 3.2
for a description of the irrigation data.
52
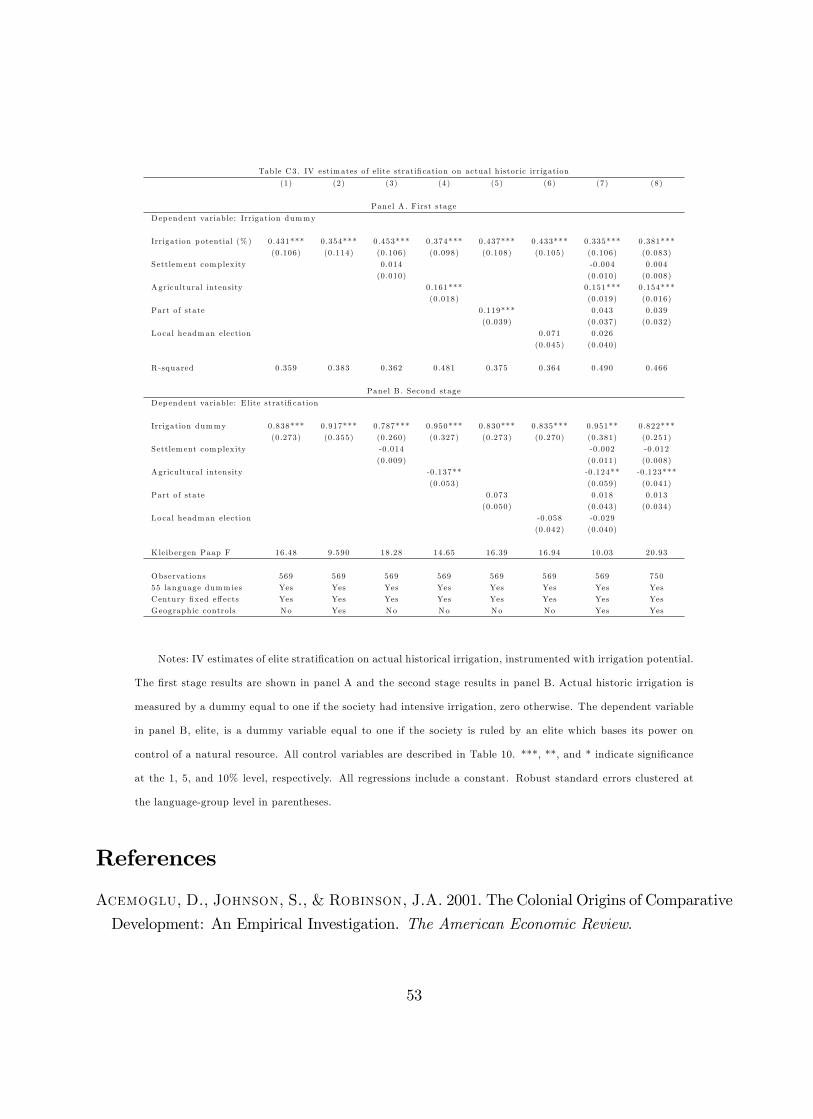
Table C3. IV estim ates of elite stratification on actual h istoric irrigation
(1) (2) (3) (4) (5) (6) (7) (8)
Panel A . F irst stage
Dep endent variab le: Irrigation dummy
Irrigation potentia l (% ) 0.431*** 0.354*** 0.453*** 0.374*** 0.437*** 0.433*** 0.335*** 0.381***
(0.106) (0 .114) (0 .106) (0 .098) (0 .108) (0 .105) (0 .106) (0 .083)
Settlem ent complex ity 0.014 -0 .004 0.004
(0.010) (0 .010) (0 .008)
Agricu ltural intensity 0.161*** 0.151*** 0.154***
(0.018) (0 .019) (0 .016)
Part of state 0.119*** 0.043 0.039
(0.039) (0 .037) (0 .032)
Local headman election 0.071 0.026
(0.045) (0 .040)
R -squared 0.359 0.383 0.362 0.481 0.375 0.364 0.490 0.466
Panel B . Second stage
Dep endent variab le: E lite stratification
Irrigation dummy 0.838*** 0.917*** 0.787*** 0.950*** 0.830*** 0.835*** 0.951** 0.822***
(0.273) (0 .355) (0 .260) (0 .327) (0 .273) (0 .270) (0 .381) (0 .251)
Settlem ent complex ity -0 .014 -0 .002 -0 .012
(0.009) (0 .011) (0 .008)
Agricu ltural intensity -0 .137** -0 .124** -0 .123***
(0.053) (0 .059) (0 .041)
Part of state 0.073 0.018 0.013
(0.050) (0 .043) (0 .034)
Local headman election -0 .058 -0 .029
(0.042) (0 .040)
K leib ergen Paap F 16.48 9.590 18.28 14.65 16.39 16.94 10.03 20.93
Observations 569 569 569 569 569 569 569 750
55 language dumm ies Yes Yes Yes Yes Yes Yes Yes Yes
Century fixed effects Yes Yes Yes Yes Yes Yes Yes Yes
Geographic contro ls No Yes No No No No Yes Yes
Notes: IV estimates of elite stratification on actual historical irrigation, instrumented with irrigation potential.
The first stage results are shown in panel A and the second stage results in panel B. Actual historic irrigation is
measured by a dummy equal to one if the society had intensive irrigation, zero otherwise. The dependent variable
in panel B, elite, is a dummy variable equal to one if the society is ruled by an elite which bases its power on
control of a natural resource. All control variables are described in Table 10. ***, **, and * indicate significance
at the 1, 5, and 10% level, respectively. All regressions include a constant. Robust standard errors clustered at
the language-group level in parentheses.
References
Acemoglu, D., Johnson, S., & Robinson, J.A. 2001. The Colonial Origins of Comparative
Development: An Empirical Investigation. The American Economic Review.
53
Acemoglu, D., Johnson, S., & Robinson, J.A. 2002. Reversal of Fortune: Geography
and Institutions in the Making of the Modern World Income Distribution. Quarterly Journal
of Economics, 117(4), 1231—1294.
Ager, Philipp. 2013. The Persistence of de Facto Power: Elites and Economic Development
in the US South, 1840-1960. European Historical Economics Society (EHES) Working Papers
in Economic History No. 38.
Alam, M Shahid. 1974. Economics of the landed interests: a case study of Pakistan. Pakistan
Economic and Social Review, 12—26.
Alesina, A., Devleeschauwer, A., Easterly, W., Kurlat, S., &Wacziarg, R. 2003.
Fractionalization. Journal of Economic growth, 8(2), 155—194.
Alesina, A., Giuliano, P., & Nunn, N. 2013. On the origins of gender roles: Women and
the plough. The Quarterly Journal of Economics, 128(2), 469—530.
Altonji, Joseph G, Elder, Todd E, & Taber, Christopher R. 2005. Selection on
Observed and Unobserved Variables: Assessing the Effectiveness of Catholic Schools. Journal
of Political Economy, 113(1), 151.
Ashraf, Q., & Galor, O. 2011. Dynamics and Stagnation in the Malthusian Epoch. The
American Economic Review, 101(5), 2003—2041.
Auty, R. M. 2001. The political economy of resource-driven growth. European Economic
Review, 45(4), 839—846.
Baldwin, R. E. 1956. Patterns of development in newly settled regions. The Manchester
School, 24(2), 161—179.
Bates, R. H., & Lien, D. H. D. 1985. A Note on Taxation, Development, and Representative
Government. Politics & Society, 14(1), 53—70.
Bellin, E. 2004. The robustness of authoritarianism in the Middle East: Exceptionalism in
comparative perspective. Comparative politics, 139—157.
Bellisario, Antonio. 2007. The Chilean Agrarian Transformation: Agrarian Reform and
Capitalist Partial Counter-Agrarian Reform, 1964—1980. Journal of Agrarian Change, 7(1),1—34.
54

Bentzen, J. S. 2015. Acts of God? Religiosity and Natural Disasters Across Subnational
World Districts. Tech. rept.
Bentzen, J. S., Hariri, J., & Robinson, J. 2015. The Indigenous Roots of Representative
Democracy. NBER Working Paper No. 21193.
Bocksette, V., & Putterman, L. 2007. State Antiquity Index. Computer file.
Bockstette, V., Chanda, A., & Putterman, L. 2002. States and markets: The advan-
tage of an early start. Journal of Economic Growth, 7(4), 347—369.
Boschini, A. D., Pettersson, J., & Roine, J. 2007. Resource Curse or Not: A Question
of Appropriability*. The Scandinavian Journal of Economics, 109(3), 593—617.
Braudel, Fernand. 1972. The Mediterranean and the Mediterranean world in the age of
Philip II. Vol. 1. Harper and Row, Publishers. New York, Evanston, San Francisco, London.
Bruce, S. 2004. Did Protestantism create democracy? Democratization, 11(4), 3—20.
Bulte, E. H., Damania, R., & Deacon, R. T. 2005. Resource intensity, institutions, and
development. World Development, 33(7), 1029—1044.
Chaney, Eric. 2012. Democratic Change in the Arab World, Past and Present [with Com-
ments and Discussion]. Brookings Papers on Economic Activity, 363—414.
Comin, D., Easterly, W., & Gong, E. 2010. Was the Wealth of Nations Determined in
1000 BC? American Economic Journal. Macroeconomics, 2(3), 65—97.
Conley, Timothy G. 1999. GMM estimation with cross sectional dependence. Journal of
econometrics, 92(1), 1—45.
Cooper, R. S. 1976. The Assessment and Collection of Kharaj Tax in Medieval Egypt.
Journal of the American Oriental Society, 365—382.
Coppedge, Michael. 2012. Democratization and research methods. Cambridge University
Press.
Dell, M. 2010. The persistent effects of Peru’s mining Mita. Econometrica, 78(6), 1863—1903.
Diamond, J. 1997. Guns, Germs and Steel. Norton.
55
Doepke, Matthias, & Zilibotti, Fabrizzio. 2008. Occupational choice and the spirit of
capitalism. The Quarterly Journal of Economics, 747.
Earle, C. V. 1978. A staple interpretation of slavery and free labor. Geographical Review,
51—65.
Easterly, W. 2007. Inequality does cause underdevelopment: Insights from a new instru-
ment. Journal of Development Economics, 84(2), 755—776.
Easterly, William. 2001. The middle class consensus and economic development. Journal
of Economic Growth, 6(4), 317—335.
Engerman, S., & Sokoloff, K. 1997. Factor Endowments, Institutions, and Differential
Paths of Growth among New World Economies. vol. 89. Stanford University Press.
Engerman, S. L., & Sokoloff, K. L. 2000. History lessons: Institutions, factors endow-
ments, and paths of development in the new world. The Journal of Economic Perspectives,
14(3), 217—232.
Engerman, S. L., & Sokoloff, K. L. 2002. Factor endowments, inequality, and paths of
development among new world economics. NBER Working Paper No. 9259.
Engerman, S. L., & Sokoloff, K. L. 2005. The evolution of suffrage institutions in the
new world. Journal of Economic History, 65(4), 891.
Feyrer, J., & Sacerdote, B. 2009. Colonialism and modern income: islands as natural
experiments. The Review of Economics and Statistics, 91(2), 245—262.
Fischer, Günther, Shah, Mahendra, van Velthuizen, Harrij, & Nachtergaele,
Freddy O. 2002. Global Agro-ecological Assessment for Agriculture in the 21st Century:
Methodology and Results. IIASA Research Report RR-02-002.
Frankema, Ewout. 2009. Has Latin America always been unequal?: a comparative study of
asset and income inequality in the long twentieth century. Brill.
Freydank, K., & Siebert, S. 2008. Towards mapping the extent of irrigation in the last
century: time series of irrigated area per country. Frankfurt Hydrology Paper (8).
56
Fukuyama, F. 2011. The Origins of Political Order: From Prehuman Times to the French
Revolution. Profile Books.
Galor, O., & Mountford, A. 2006. Trade and the great divergence: the family connection.
The American Economic Review, 96(2), 299—303.
Galor, O., & Mountford, A. 2008. Trading population for productivity: theory and
evidence. Review of Economic Studies, 75(4), 1143—1179.
Galor, O., Moav, O., & Vollrath, D. 2009. Inequality in Landownership, the Emergence
of Human-Capital Promoting Institutions, and the Great Divergence. Review of Economic
Studies, 76(1), 143—179.
Gennaioli, Nicola, & Rainer, Ilia. 2007. The modern impact of precolonial centralization
in Africa. Journal of Economic Growth, 12(3), 185—234.
Gilmore, Elisabeth, Gleditsch, Nils Petter, Lujala, Päivi, & Rød, Jan Ketil.
2005. Conflict diamonds: A new dataset. Conflict Management and Peace Science, 22(3),257—272.
Giuliano, Paola, & Nunn, Nathan. 2013. The transmission of democracy: from the
village to the nation-state. NBER Working Paper 18722.
Haber, S., & Menaldo, V. 2010. Rainfall and democracy. Social Science Research Network
Working Paper Series.
Haber, Stephen. 2012. Climate, Technology, and the Evolution of Economic and Political
Institutions. PERC Research Paper 12/2.
Hall, R. E., & Jones, C. I. 1999. Why do some countries produce so much more output
per worker than others? The Quarterly Journal of Economics, 114(1), 83—116.
Hariri, J. G. 2012. The Autocratic Legacy of Early Statehood. American Political Science
Review, 106(3), 471—494.
Hariri, J. G. 2015. A Contribution to the Understanding of Middle Eastern and Muslim
Exceptionalism. Journal of Politics.
57
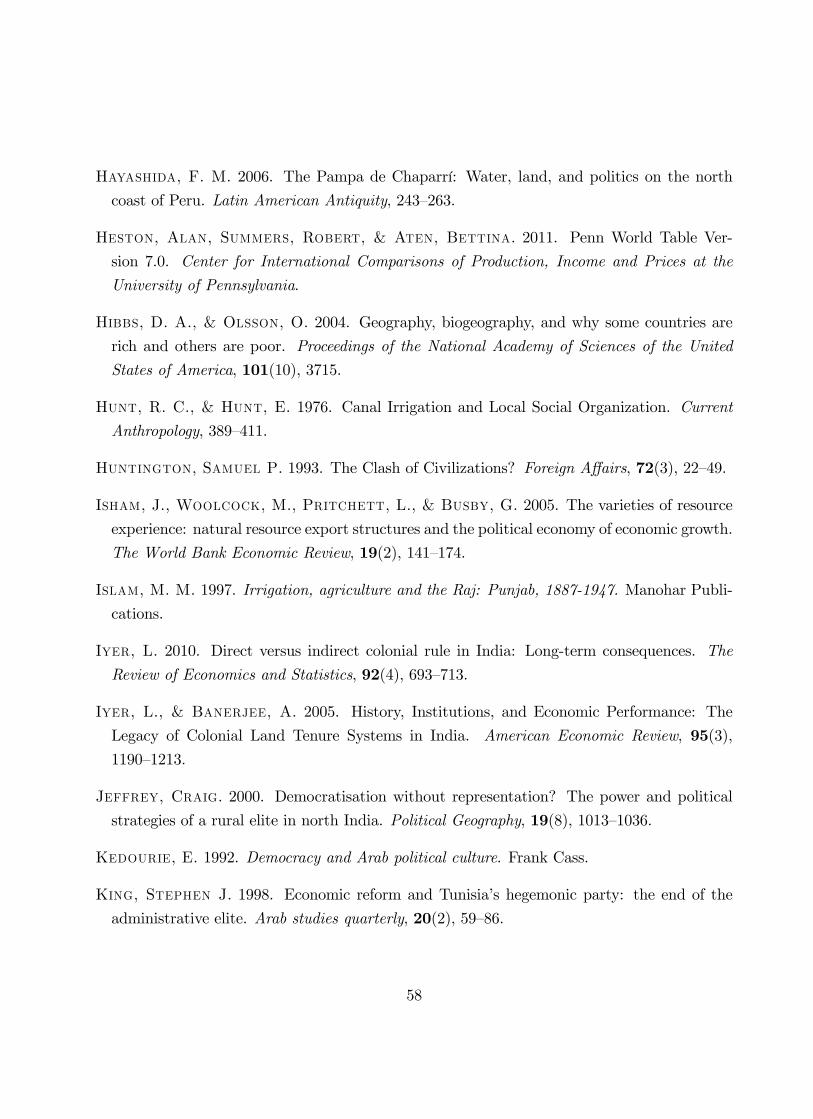
Hayashida, F. M. 2006. The Pampa de Chaparrí: Water, land, and politics on the north
coast of Peru. Latin American Antiquity, 243—263.
Heston, Alan, Summers, Robert, & Aten, Bettina. 2011. Penn World Table Ver-
sion 7.0. Center for International Comparisons of Production, Income and Prices at the
University of Pennsylvania.
Hibbs, D. A., & Olsson, O. 2004. Geography, biogeography, and why some countries are
rich and others are poor. Proceedings of the National Academy of Sciences of the United
States of America, 101(10), 3715.
Hunt, R. C., & Hunt, E. 1976. Canal Irrigation and Local Social Organization. Current
Anthropology, 389—411.
Huntington, Samuel P. 1993. The Clash of Civilizations? Foreign Affairs, 72(3), 22—49.
Isham, J., Woolcock, M., Pritchett, L., & Busby, G. 2005. The varieties of resource
experience: natural resource export structures and the political economy of economic growth.
The World Bank Economic Review, 19(2), 141—174.
Islam, M. M. 1997. Irrigation, agriculture and the Raj: Punjab, 1887-1947. Manohar Publi-
cations.
Iyer, L. 2010. Direct versus indirect colonial rule in India: Long-term consequences. The
Review of Economics and Statistics, 92(4), 693—713.
Iyer, L., & Banerjee, A. 2005. History, Institutions, and Economic Performance: The
Legacy of Colonial Land Tenure Systems in India. American Economic Review, 95(3),1190—1213.
Jeffrey, Craig. 2000. Democratisation without representation? The power and political
strategies of a rural elite in north India. Political Geography, 19(8), 1013—1036.
Kedourie, E. 1992. Democracy and Arab political culture. Frank Cass.
King, Stephen J. 1998. Economic reform and Tunisia’s hegemonic party: the end of the
administrative elite. Arab studies quarterly, 20(2), 59—86.
58

King, Stephen J. 2007. Sustaining Authoritarianism in the Middle East and North Africa.
political science quarterly, 122(3), 433—459.
Kiszewski, A., Mellinger, A., Spielman, A., Malaney, P., Sachs, S. E., & Sachs,
J. 2004. A global index representing the stability of malaria transmission. The American
journal of tropical medicine and hygiene, 70(5), 486—498.
Lagerloef, Nils-Petter. 2004. Regional income gaps in the USA today—what can geogra-
phy and slavery explain? In: 2004 Meeting Papers. Society for Economic Dynamics.
Lipset, S. M. 1959. Some social requisites of democracy: Economic development and political
legitimacy. The American Political Science Review, 53(1), 69—105.
MacEvedy, C., & Jones, R. 1978. Atlas of world population history.
Malik, Anas. 2010. Political Survival in Pakistan: Beyond Ideology. Routledge.
Marshall, M. G., Jaggers, K., & Gurr, T. R. 2010. Polity IV project. Center for
International Development and Conflict Management at the University of Maryland College
Park.
Marx, K. 1853. The British Rule in India. New York Daily Tribune, 8(8), 1853.
Matsuyama, K. 1992. Agricultural productivity, comparative advantage, and economic
growth. Journal of Economic Theory, 58(2), 317—334.
Mayshar, J., Moav, O., & Neeman, Z. 2012. Transparency, Appropriability and the Early
State. Unpublished manuscript.
Mehlum, H., Moene, K., & Torvik, R. 2006. Institutions and the Resource Curse. The
Economic Journal, 116(508), 1—20.
Michalopoulos, Stelios. 2012. The Origins of Ethnolinguistic Diversity. American Eco-
nomic Review, 102(4), 1508—39.
Michalopoulos, Stelios, Naghavi, Alireza, & Prarolo, Giovanni. 2012. Trade and
Geography in the Origins and Spread of Islam. NBER Working Paper No. 18438.
59

Mitchell, Timothy D, Carter, Timothy R, Jones, Philip D, Hulme, Mike, New,
Mark, et al. . 2004. A comprehensive set of high-resolution grids of monthly climate
for Europe and the globe: the observed record (1901—2000) and 16 scenarios (2001—2100).
Tyndall Centre for Climate Change Research Working Paper, 55.
Mitchell, W. P. 1973. The hydraulic hypothesis: a reappraisal. Current Anthropology,
14(5), 532—534.
Murdock, G. P. 1967. Ethnographic atlas. University of Pittsburgh Press (Pittsburgh).
Nunn, N. 2007. Historical legacies: A model linking Africa’s past to its current underdevel-
opment. Journal of Development Economics, 83(1), 157—175.
Nunn, N., & Puga, D. 2012. Ruggedness: The Blessing of Bad Geography in Africa. The
Review of Economics and Statistics.
Nunn, N., & Qian, N. 2011. The Potato’s Contribution to Population and Urbanization:
Evidence From A Historical Experiment. The Quarterly Journal of Economics, 126(2),593—650.
Nunn, Nathan, & Wantchekon, Leonard. 2011. The Slave Trade and the Origins of
Mistrust in Africa. The American Economic Review, 101(7), 3221—3252.
O’Leary, B. 1989. The Asiatic mode of production: Oriental despotism, historical materialism
and Indian history. Blackwell.
Olsson, O. 2009. On the democratic legacy of colonialism. Journal of Comparative Economics,
37(4), 534—551.
Olsson, O., & Paik, C. 2013. A Western Reversal since the Neolithic? The long-run impact
of early agriculture. ESRN Workingpaper.
Putterman, L. 2008. Agriculture, diffusion and development: ripple effects of the Neolithic
Revolution. Economica, 75(300), 729—748.
Putterman, L., & Trainor, C. A. 2006. Agricultural Transition Year Country Data Set.
Computer file available from Louis Puttermans website.
60

Ramankutty, Navin, Foley, Jonathan A, Norman, John, & McSweeney, Kevin.
2002. The global distribution of cultivable lands: current patterns and sensitivity to possible
climate change. Global Ecology and Biogeography, 11(5), 377—392.
Renger, Johannes M. 1995. Institutional, communal, and individual ownership or posses-
sion of arable land in ancient Mesopotamia from the end of the fourth to the end of the first
millennium BC. Chi.-Kent L. Rev., 71, 269.
Ross, M. L. 2001. Does oil hinder democracy? World Politics, 53(03), 325—361.
Ross, M. L. 2012. The oil curse: how petroleum wealth shapes the development of nations.
Princeton University Press.
Sidky, H. 1997. Irrigation and the Rise of the State in Hunza: A Case for the Hydraulic
Hypothesis. Modern Asian Studies, 31(4), 995—1017.
Siebert, S., Döll, P., Feick, S., Hoogeveen, J., & Frenken, K. 2007. Global map
of irrigation areas version 4.0. 1. Johann Wolfgang Goethe University, Frankfurt am Main,
Germany/Food and Agriculture Organization of the United Nations, Rome, Italy.
Soares, R. R., Assunção, J. J., & Goulart, T. F. 2012. A note on slavery and the roots
of inequality. Journal of Comparative Economics, 40(4), 565—580.
Weber, M. 1930. The Protestant Ethic and the Spirit of Capitalism. Routledge.
Welzel, Christian. 2013. Freedom rising. Cambridge University Press.
Welzel, Christian. 2014. Evolution, Empowerment, and Emancipation: How Societies
Climb the Freedom Ladder. World Development, 64, 33—51.
Williams, A. 2011. Shining a light on the resource curse: An empirical analysis of the relation-
ship between natural resources, transparency, and economic growth. World Development,
39(4), 490—505.
Williamson, J. G. 2011. Trade and Poverty: When the Third World Fell Behind. The MIT
Press.
Wittfogel, K. A. 1957. Oriental despotism: a comparative study of total power. Yale
University Press.
61