iron exafs of azotobacter vinelandii nitrogenase mo-fe...
TRANSCRIPT

J. Am. Chem. SOC. 1993,115, 5509-5515 5509
Iron EXAFS of Azotobacter vinelandii Nitrogenase Mo-Fe and V-Fe Proteins J. Chen,t J. Christiansen,* R. C. Tittsworth,s B. J. Hales,! S . J. George,* D. Coucouvanis,II and S. P. Cramer*Jy*
Contribution from the Energy and Environment Division, Lawrence Berkeley Laboratory, Berkeley, California 94720, Department of Chemistry, Louisiana State University, Baton Rouge, Louisiana 70803, Department of Applied Science, University of California, Davis, California 9561 6, and Department of Chemistry, University of Michigan, Ann Arbor, Michigan 481 09
Received July 22, 1992
Abstract: The structure of the iron sites of nitrogenase in dithionite-reduced and thionine-oxidized forms of the Mo-Fe and V-Fe proteins has been investigated using Fe K-edge X-ray absorption spectroscopy. For the dithionite-reduced Azotobacter uinelandii Mo-Fe protein, the dominant EXAFS Fourier transform peaks are assigned to F e 4 and Fe-Fe interactions at -2.32 and 2.64 A, as expected for F e S clusters. An additional Fe-Mo component at 2.73 A is required to completely fit the EXAFS in the 1-3-A region. In the 3-5-A region, a 3.8-A Fe-Fe component is identified, with an amplitude corresponding to almost one long Fe-Fe interaction, averaged over all of the iron in the sample. Features that can be explained as F e S and Fe-Fe interactions at 4.3 and 4.7 8, are also observed. A similar pattern of Fe interactions is observed for the reduced A. uinelandii V-Fe protein, except that the short Fe-Mo interaction is no longer required. In both Mo-Fe and V-Fe proteins, the first coordination sphere Fe-S distances contract slightly upon thionineoxidation. The long-range Fe-S and F e F e interactions arevery close (within 0.1 A) to corresponding distances in Fe&6 prismane clusters. If the amplitudes are adjusted by assuming that only 14 of 30 nitrogenase irons participate in the M center, then they are consistent with recently proposed crystallographic models.
Introduction Biological reduction of dinitrogen to ammonia is catalyzed by
the enzyme system nitrogenase, in parallel with hydrogen evolution and ATP hydrolysis:'
N, + 8H' + 8e- + nMgATP - 2NH, + H, + nMgADP + nPi
The nitrogenase system contains two proteins, a large (>200 000 Da) protein referred to as component 1, dinitrogenase, or Mo- Fe protein2 and a smaller -55 000-Da protein known as component 2, dinitrogenase reductase, or simply the Fe protein. The component 1 protein from Azotobacter vinelandii (Avl) contains 30 Fe atoms and 2 Mo atoms per a282 dimer.' Eight metal ions are grouped in an extractable iron-molybdenum cofactor or FeMo-co, also called the M-center,3 which is thought to contain the active site and for which elemental analysis indicates an Fe:Mo:S ratio of -7:1:(9 f l).4 The alternate component 1 from A. uinelandii (Avl')5,6 possesses a similar cofactor (FeV- co), but with vanadium in place of molybdenum. Reported metal analyses find -23 Fe and 2 V atoms per a&y2 unit.7 Bishop and co-workers have purified a third type of component l8 from
Nzasc
t Lawrence Berkeley Laboratory. t University of California at Davis. 1 Louisiana State University. I University of Michigan. (1) (a) Orme-Johnson, W. H. Annu. Rev. Biophys. Biophys. Chem. 1985,
14, 419-459. (b) Eady, R. R. Ado. Inorg. Chem. 1991, 36, 77-102. (2) Hageman, R. V.; Burris, R. H. Proc. Narf. Acad. Sci. U.S.A. 1978,75,
2699-2702. Thorneley and co-workers have objected to this nomenclature, since they consider N2 reductiona property of the complex between components 1 and 2.
(3) Burgess, B. K. Chem. Rev. 1990,90, 1377-1406. (4) (a) McLean, P. A.; Wink, D. A.; Chapman, S. K.; Hickman, A. B.;
McKillop, D. M.; Orme-Johnson, W. H. Biochemistry 1989,28,9402-9406. (b) Frank,P.;Gheller,S. F.;Newton, W.E.;Hodgson,K.O.Biochem. Biophys. Res. Commun. 1989, 163, 746-754.
(5) Hales, B. J.; Case, E. E.; Morningstar, J. E.; Dzeda, M. F.; Mauterer, L. A. Biochemistry 1986, 25, 7251-7255.
(6) Robson,R. L.;Eady,R. R.;Richardson,T. H.; Miller,R. W.;Hawkins, M.; Postgate, J. R. Nature 1986, 322, 388-396.
A. vinelandii which lacks Mo and V, presumably containing an all-iron cofactor. In all of these proteins, the remaining irons that are not part of the FeMo-co are grouped in so-called P-clusters, originally thought to be 4Fe-4S centers. Crystal structures for both the Clostridium pasteurianum9 and A. vinelandii1° Mo-Fe proteins are progressing rapidly, and structural models for the nitrogenase FeMo-co and P-cluster have been proposedon the basis of 2.7-Aresolution X-ray diffraction data."
Many details about the F e M o or F e V cofactors in nitrogenase have already been derived from EXAFS spectroscopy. 12 The Mo EXAFS of both Mo-Fe protein solutions and FeMo-co solutions and crystals of Mo-Fe protein found average Mo-(O,N), Mo-S, and Mo-Fe distances of -2.1, -2.4, and 2.7 A, respectively.13-15 The V EXAFS of Azotobacter chroococcum Acl* l6 and A. vinelandiiAv1' l7 proteins shows similar structure,
(7) Eady,R. R.;Robson,R. L.;Richardson,T. H.; Miller,R. W.;Hawkins,
(8) Chisnell, J. R.; Premakumar, R.; Bishop, P. E. J. Bacterial. 1988,170,
(9) (a) Bolin, J. T.; Ronco, A. E.; Mortenson, L. E.; Morgan, T. V.; Williamson, M.; Xuong, N.-H. In Nitrogen Fixation: Achievements and Objectives; Gresshoff, P. M., Roth, L. E., Stacey, G., Newton, W. E., Eds.; Chapman and Hall: New York, 1990; pp 117-124. (b) Bolin, J. T.; Ronco, A. E.; Morgan, T. V.; Mortenson, L. E.; Xuong, N.-H. Proc. Natl. Acad. Sci.
(10) Kim, J.; Rees, D. C. Nature 1992, 360, 553-560. (1 1) (a) Kim, J.; Rees, D. C. Science 1992, 257, 1677-1682. (b) The
histogram for the Kim-Rees model in Figure 2 used distances fromcoordinates at 2.7-A resolution, supplied to us by Prof. Rees and also available from the Brookhaven Protein Data Bank.
(12) Cramer, S. P. Biochemical Applications of X-ray Absorption Spec- troscopy. In Extended X-ray Absorption Fine Structure; Konigsberger, D., Prins, R., Eds.; Plenum: New York, 1988; pp 257-320.
(13) (a) Cramer, S. P.; Hodgson, K. 0.; Gillum, W. 0.; Mortenson, L. E. J . Am. Chem. SOC. 1978,100,3398-3407. (b) Cramer, S. P.; Gillum, W. 0.; Hodgson, K. 0.; Mortenson, L. E.; Stiefel, E. I.; Chisnell, J. R.; Brill, W. J.; Shah, V. K. J . Am. Chem. SOC. 1978, 100, 3814.
(14) Conradson, S. D.; Burgess, B. K.; Newton, W. E.; Mortenson, L. E.; Hodgson, K. 0. J . Am. Chem. SOC. 1987, 109, 7507.
(15) Flank, A. M.; Weininger, M.; Mortenson, L. E.; Cramer, S. P. J. Am. Chem. SOC. 1986, 108, 1049-1055.
(16) Arber, J . M.; Dobson, B. R.; Eady, R. R.; Hasnain, S. S.; Garner, C. D.; Matsushita, T.; Nomura, M.; Smith, B. E. Biochem. J . 1989, 258,733- 737.
M. Biochem. J. 1987, 244, 197-207.
27-33.
U.S.A. 1993, 90, 1078-1082.
0 1993 American Chemical Society
5510 J. Am. Chem. SOC., Vol. 115, No. 13. 1993 Chen et al.
Experimental Section
Sample Preparation. The nitrogenase component 1 proteins were extracted from appropriate strains of A . vinelundii at Louisiana State University by methods previously described.28 Specific activities were 1800 nmol of C2H2 reduced min-l (mg of protein)-' and 270 nmol of C2H2 reduced min-I (mg of protein)-' for the molybdenum-containing (Avl) and vanadium-containing proteins (Avl'), respectively. For EXAFS measurements, the samples (in 0.025 M Tris-HC1 (pH 7.4), 0.2 M NaCI, and 2 mM Na2S204) were concentrated to -200 mg/mL, with 40% glycerol added to prevent ice crystal formation. Thionine-oxidized samples were prepared by titration of the protein sample with a saturated solution of thionine in 0.025 M Tris-HC1 (pH 7.4) and 0.2 M NaCl until the end point or by brief stirring over a few grains of solid thionine followed by membrane filtration to remove any excess thionine. EPR measurements confirmed that during these brief exposures to thionine the M center EPR disappeared and the P-clusters were oxidized to the S = integer state, rather than to t h e S = 7/2 state. Specific activities of the prepared oxidized samples were 1800 and 260 nmol of C2H2 reduced min-1 (mg of protein)-' for Avl and Avl', respectively. The prismane compounds ( E ~ ~ N ) ~ ( F ~ ~ S ~ C ~ ~ ) C H S C N and (Et4N)s[(FesSs(OCsH4-p.Me)6)) were synthesized in the Coucouvanis laboratory by methods previously d e s ~ r i b e d , ~ ~ ~ ~ ~ while Fe2(02CH)4(BIPhMe)z was provided by Prof. Stephen Lippard of the Massachusetts Institute of T e c h n o l ~ g y . ~ ~
Enzyme EXAFS samples were injected into 2 cm long by 3 mm high lucite sample cells with 1 mm path lengths and polypropylene windows. All sample preparation wascarried out in a Vacuum Atmospheres glovebox in an Ar atmosphere, with [Oz] 5 1 ppm. Upon removal from theglovebox, enzyme samples were maintained in liquid nitrogen until data collection. Assays on representative samples found no significant activity loss after 20 h of beam exposure at 4 K.
Data Collection. The X-ray absorption spectra were recorded at 4-10 K with an Oxford Instruments CF1208 liquid helium flow cryostat using a Si( l l1) double-crystal monochromator at beam line X-19A of the National Synchrotron Light Source. The second crystal was detuned to 50% of maximum intensity to reduce the transmission of higher order X-rays. The beam line was run unfocused, with slits typically 2 X 20 mm. Model compounds were run in transmission mode, using finely powdered samples which were diluted with sucrose (1:4 w/w). The incident and transmitted beam intensities were monitored by nitrogen- filled ion chambers.
All protein sample data were measured in the fluorescence excitation mode.31 The fluorescence signal was monitored by a Canberra Industries 13-element Ge solid-state array detector,g2 with single channel analyzer windows set on the Fe K a signal. During the measurement, total count rates on each detector were maintained at less than 35 kHz, and an amplifier shaping time of 0.5 ps was used in most cases. The X-ray absorption spectra were recorded in the form F/ lo us energy. Each scan contains 511 points, spanning about 100 eV below to at least 800 eV above the edge, and taking about 40 min. The spectra were calibrated by reference to an Fe foil, using the first inflection point as 71 11.2 eV.
Long distance interactions are important for cluster characterization and normally produce very weak modulations of the X-ray absorption. To check the reproducibility of spectral features, each reported spectrum was measured on at least two separate occasions with different samples. The reduced Mo-Fe protein spectrum reported represents the average of 50 scans. A total of 40,38, and 18 scans were averaged for the oxidized Avl, reduced Avl', and oxidized Avl' samples, respectively.
Analysis Procedures. The EXAFS was extracted from the fluorescence excitation (for protein samples) and transmission (for model compounds) spectra by routine methods33 An initial EO of 71 30eV was used to define themagnitudeofthe photoelectron wavevector k = [ ( ~ ~ I / ~ ~ ) ( E - E O ) ] ~ / ~ . The EXAFS spectra were Fourier transformed from k-space to R-space, and different regions of the transform were then back-transformed to
(4)
(7) (8)
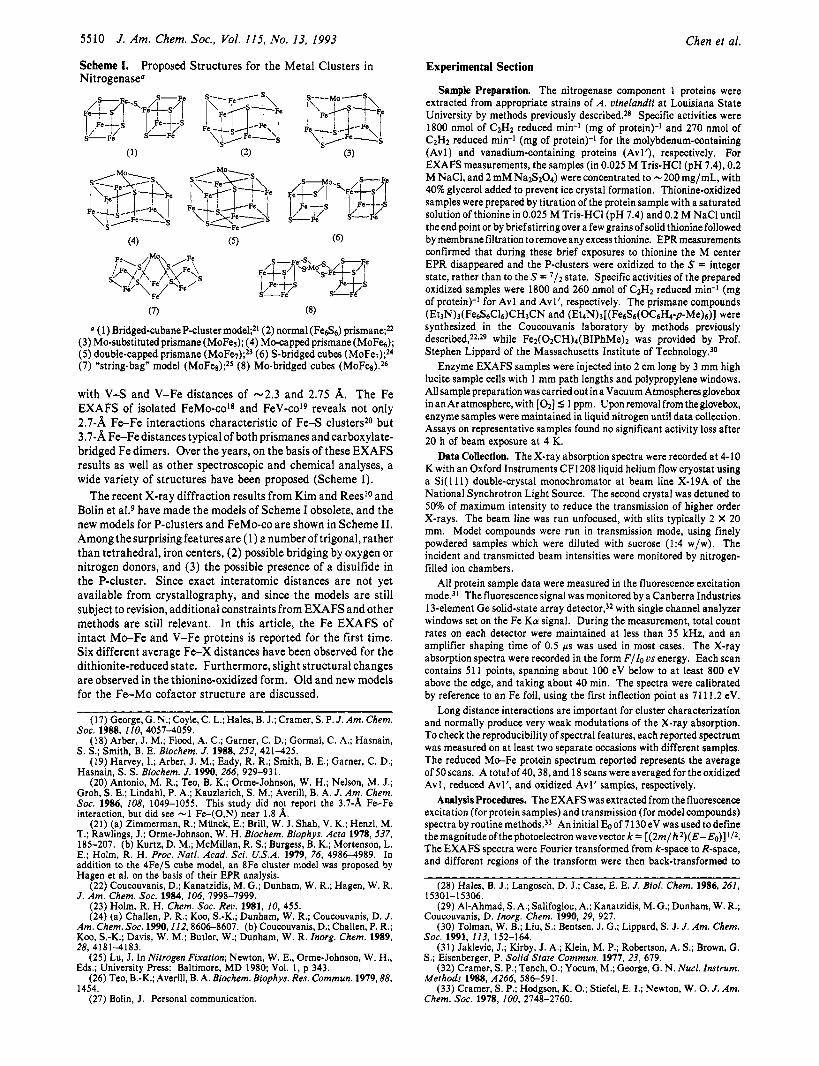
(1) Bridged-cubane P-cluster model;21 (2) normal (Fe&j6) prismane;22 (3) Mo-substituted prismane (MoFes); (4) Mecapped prismane (MOFQ); (5) double-capped prismane ( M o F ~ ~ ) ; ~ ~ (6) S-bridged cubes ( M o F ~ ~ ) ; ~ ~ (7) "string-bag" model ( M O F ~ ~ ) ; ~ ~ (8) Mo-bridged cubes (MoFe8).26
with V S and V-Fe distances of -2.3 and 2.15 A. The Fe EXAFS of isolated FeMo-co18 and FeV-co19 reveals not only 2.7-A Fe-Fe interactions characteristic of F e S clustersZo but 3.7-A Fe-Fe distances typical of both prismanes and carboxylate- bridged Fe dimers. Over the years, on the basis of these EXAFS results as well as other spectroscopic and chemical analyses, a wide variety of structures have been proposed (Scheme I).
The recent X-ray diffraction results from Kim and Rees'o and Bolin et al.9 have made the models of Scheme I obsolete, and the new models for P-clusters and FeMo-co are shown in Scheme 11. Among the surprising features are (1) a number of trigonal, rather than tetrahedral, iron centers, (2) possible bridging by oxygen or nitrogen donors, and (3) the possible presence of a disulfide in the P-cluster. Since exact interatomic distances are not yet available from crystallography, and since the models are still subject to revision, additional constraints from EXAFS and other methods are still relevant. In this article, the Fe EXAFS of intact Mo-Fe and V-Fe proteins is reported for the first time. Six different average Fe-X distances have been observed for the dithionite-reduced state. Furthermore, slight structural changes are observed in the thionine-oxidized form. Old and new models for the Fe-Mo cofactor structure are discussed.
(17) George, G. N.; Coyle, C. L.; Hales, B. J.; Cramer, S. P. J. Am. Chem. Soc. 1988, 110, 40574059.
(18) Arber, J. M.; Flood, A. C.; Garner, C. D.; Gormal, C. A.; Hasnain, S. S.; Smith, B. E. Eiochem. J. 1988, 252,421425.
(19) Harvey, 1.; Arber, J. M.; Eady, R. R.; Smith, B. E.; Garner, C. D.; Hasnain, S. S. Eiochem. J . 1990, 266, 929-931.
(20) Antonio, M. R.; Teo, B. K.; Orme-Johnson, W. H.; Nelson, M. J.; Groh, S. E.; Lindahl, P. A,; Kauzlarich, S. M.; Averill, B. A. J. Am. Chem. Soc. 1986, 108, 1049-1055. This study did not report the 3.7-A Fe-Fe interaction, but did see -1 Fe-(0,N) near 1.8 A.
(21) (a) Zimmerman, R.; Miinck, E.; Brill, W. J. Shah, V. K.; Henzl, M. T.; Rawlings, J.; Orme-Johnson, W. H. Eiochem. Eiophys. Acra 1978, 537, 185-207. (b) Kurtz, D. M.; McMillan, R. S.; Burgess, B. K.; Mortenson, L. E.; Holm, R. H. Proc. Nari. Acad. Sci. U.S.A. 1979, 76, 4986-4989. In addition to the 4Fe/S cube model, an 8Fe cluster model was proposed by Hagen et al. on the basis of their EPR analysis.
(22) Coucouvanis, D.; Kanatzidis, M. G.; Dunham, W. R.; Hagen, W. R. J . Am. Chem. SOC. 1984, 106, 7998-7999.
(23) Holm, R. H. Chem. SOC. Reu. 1981, 10, 455. (24) (a) Challen, P. R.; Koo, S.-K.; Dunham, W. R.; Coucouvanis, D. J.
Am. Chem. SOC. 1990,112,8606-8607. (b) Coucouvanis, D.; Challen, P. R.; Koo, S.-K.; Davis, W. M.; Butler, W.; Dunham, W. R. Inorg. Chem. 1989, 28, 4181-4183.
(25) Lu, J. In Nitrogen Fixation; Newton, W . E., Orme-Johnson, W. H., Eds.; University Press: Baltimore, MD 1980; Vol. 1, p 343.
(26) Teo, B.-K.; Averill, B. A. Eiochem. Eiophys. Res. Commun. 1979,88, 1454.
(27) Bolin, J. Personal communication.
(28) Hales, B. J.; Langosch, D. J.; Case, E. E. J. Bioi. Chem. 1986, 261, 15301-15306.
(29) AI-Ahmad, S. A,; Salifoglou, A,; Kanatzidis, M. G.; Dunham, W. R.;
(30) Tolman, W. B.; Liu, S.; Bentsen, J. G.; Lippard, S. J. J. Am. Chem.
(31) Jaklevic, J.; Kirby, J. A,; Klein, M. P.; Robertson, A. S.; Brown, G.
(32) Cramer, S. P.; Tench, 0.; Yocum, M.; George, G. N. Nucl. Instrum.
(33) Cramer, S . P.; Hodgson, K. 0.; Stiefel, E. I.; Newton, W. 0. J. Am.
Coucouvanis, D. Inorg. Chem. 1990, 29, 927.
SOC. 1991, 113, 152-164.
S.; Eisenberger, P. Solid Stare Commun. 1977, 23, 679.
Merhods 1988, A266, 586-591.
Chem. SOC. 1978, 100, 2748-2760.

Iron EXAFS of Azotobacter uinelandii Nitrogenase
Scheme II. Proposed Core Structures from Crystallography@
J , Am. Chem. SOC., Vol. 115, No. 13, 1993 5511
R R
I R II
R III
@ M center I and P-cluster I1 are from Kim and Rees.” and P-cluster IIl is from Bolin2’ as well as from Kim and R e a l o
yield Fourier-filtered spectra. The simulated EXAFS was calculated by using the standard curved-wave functional form for single-scattering EXAFS:)‘
where Ak,R,) is the curved-wave back-scattering amplitude, &(k,Rj) represents the distance-dependent total phase shift, uj is the root-mean square fluctuation in the distance Rj, yi is a scaling factor that accounts for the effect of intrinsic processes, and the sum is over all neighbors about the central X-ray absorber.” A nonlinear least-squares routine was used to minimize the difference between calculated and observed EXAFS.
Phase-corrected Fourier transforms, using the theoretical Fe-Fe phase shift over k = 1-14 A-I, were computed for all of the presented radial distributions. All curve fitting was based on k3-weighted data over the 3-14-A-I range, and the scale factor y was held fixed at 0.9. For Fe-S, Fe-Fe, and Fe-0 interactions, the threshold energy shifts, AEo, were optimized for the model compounds and held fied at the same values for the protein fits. For the Fe-Mo interaction, AEo was held fixed at the value obtained from the reduced protein fit.
Results
Model Compounds. EXAFS analysis of long-distance metal- metal interactions may involve complications from multiple scattering and mean free path effects.35 To calibrate and check the curve-fitting analysis procedures, we recorded the spectra of several iron complexes with long Fe-Fe distances, including two sulfido-bridged Fe& prismane clusters and a formate-bridged dinuclear Fe complex, F ~ Z ( O Z C H ) ~ ( B I P ~ M ~ ) ~ . ~ ~ The Fourier transforms of these data are illustrated in Figure 1 . To simulate the EXAFS, the 1-3- and 3-5-A regions were first separately back-transformed (Figure 1). Optimization proceeded by starting with fixed coordination numbers and varying the distances Ri, the threshold energy shifts A E o , and the mean-square deviations u2 for each component. This procedure, totally within the single scattering formalism, gave distances within 0.02 and 0.06 A of the crystallographic values for the 1-3- and 3-5-A regions, respectively, as shown in Tables I and 11.
The high symmetry of the [Fe6S6C1613- prismane complex core (Scheme I, cluster 2) allows easy observation and interpretation of EXAFS interactions out to 4.7 A. The strongest peak at -2.3 A corresponds to overlapping first-shell Fe-S and Fe-Cl inter- actions. The Fe-Cl component at 2.22 A adds constructively to the 2.28-A F e S component. By reference to the radial distri- bution function in Figure 2, the peaks at 2.76 and 3.8 A can be assigned, respectively, to a pair of short di-p-sulfido bridged iron- iron interactions and to three long Fe-Fe interactions with single sulfur bridges. A shoulder at 4.7 A, although totally noncon- vincing in magnitude, can be adequately simulated as a single cross-prismane Fe-Fe interaction. The peak at 4.4 A arises from three cross-cluster F e S interactions.
(34) McKale, A. G.; Knapp, G. S.; Chan, S.-K. Phys. Rev. B 1986, 33,
(35) X-Ray Absorption: Principles, Applications, Techniques of EXAFS, SEXAFS, and XANES; Prins, R., Khnigsberger, D., Eds.; Wiley: New York, 1988.
841-846.
0
- 1 x3
2 4 6 6 1 0 1 2 1 4
Distance (A) k (k’) Figure 1. EXAFS Fourier transforms for Fe compounds with long Fe- Fe distances. (a , Left) Fourier transform data for [(Fe&- (OC&-p-Me)s]* prismane (- - -), [Fe&cb]* prismane (-), and Fe2(02CH)4(BIPhMe)z (..e). Features beyond 3 A have been multiplied by 3 in the inset to enhance visibility. (b, Right) Filtered data (-) and thefits(- - -)in the3-5-Aregionfor [(FesSs(OCsH4-pMC)s)]”prismane (top), [Fe&Cl#- prismane (middle), and Fe2(02CH)4(BIPhMe)2 (bottom).
The Fourier transform for the [ (Fe6Ss(OC6H4-p-Me)6)]3- prismane requires additional interpretation, because of the phenolate ligand contribution to the EXAFS. In the first coordination sphere region, replacement of chlorine by oxygen results in a smaller 2.3-A peak and a new feature at - 1.9 A, the Fe-0 component. The average Fe-0-C bond angle is 1 3 3 O , and the direct Fe-C distance is 2.95 A. This component may interfere with the 2.8-A Fe-Fe component. Multiple scattering along the FeO-C path may contribute to the transform peak at -3.3 A, which is merely a side-lobe artifact in the [Fe6S.&ls]3- data. The next shells of carbons occur at 3.5 and 4.2 A, and these direct interactions, along with multiple scattering paths, presumably interfere with the longer distance Fe-Fe and Fe-S components at 3.9 and 4.4 A. Thanks to these interferences, the discrepancies between the crystallographic and EXAFS results are consistently larger for this compound.
Interference between Fe outer-shell light atoms and long Fe- Fe components is even more pronounced in the Fe2(02CH)d- (BIPhMe)2 spectrum. The crystallographic Fe-Fe distance is 3.57 A,between thefirstshellofimidazolecarbonsat 3.13 h a n d the second C,O shell at an average distance of 3.70 A.30 The Fe4-Fe angle is 11 3 O , which is small enough that multiple scattering should not be significant. Still, the Fe-Fe distance obtained by curve-fitting is 3.52 A; the discrepancy of 0.05 A is one of the largest errors observed for such a metal-metal distance estimation. Bearing in mind the dangers of fitting long Fe-Fe interactions in the presence of other outer-shell components, we now present and interpret the nitrogenase Fe EXAFS data.
Nitrogenase and Model Comparisons. The Fe EXAFS Fourier transforms for resting Avl and Avl’ are compared with the [Fe6S6C16]3- prismane model in Figure 3a, while transforms for the oxidized vs reduced protein samples are compared in Figure 3b. The features for distances less than 3 A are much stronger than the longer distance interactions. Since some of the transform

5512 J. Am. Chem. SOC., Vol. 115, No. 13, 1993 Chen et al.
Table I. Nitrogenase and Model Compound 1-3-A Curve-Fitting
Fe-S(CI) A E o = -3 eV Fe-Fe A E o = -8 eV Fe-Mo A E o = -6 eV Fe-O(N,C) AEo = -12 eV
sample No R,bA lOSa2, A 2 c No R,bA 105~2, A 2 C No ( N ’ 3 R,bA lOSa2. A 2 c No R.6A 105~2. A 2 C R,‘
(F%S6C16)3- 4.0 (F%S6C16)”’ 4 ( FC%jS6C16)2-f 4
Fe2 [ (02CH )4(B IPhMe)21 Fe2[ (02CH)4( BIPhMe)2]* dithionite-reduced Aul 3.5 FeMo-cd 3 thionine-oxidized Aul 3.5 dithionite-reduced Aul’ 3.5 FeV-cd 3 thionine-oxidized Aul‘ 3.5
( F&(oc6H4-pMe)6)> 3.0 (Fe&6(oc6H4-pMe),j)s g 3.0
2.277 2.276 2.259 2.298 2.295
2.3 17 2.20 2.29 1 2.322 2.24 2.289
304 2.0 2.757 2 2.765 2 2.757
568 2.0 2.798 2.0 2.781
576 2.0 2.641
513 2.0 2.657 608 2.3 2.674
542 2.3 2.690
2.2 2.64
2 2.65
355 30
568 1 1.890 303 54 1.0 1.870 5.5 2.136 609 19 5.5 2.120
535 0.3 (0.6) 2.732 179 0.5 1.842 7797 22
465 0.3 (0.6) 2.696 34 0.5 1.833 7797 20 773 0.5 1.864 7041 42
0.8 2.70
688 0.5 1.869 7041 20
0 Coordination number; held fixed during refinement. * Interatomic distance; systematic errors were ca. 0.02 A for the 1-3-A region and ca. 0.06 A for the 3-5-A region. Mean-square deviation of R; negative values arise if the postulated N is low or if the amplitude function is inaccurate.
Multiplied by 15/7 for comparison with cofactor data. Fit residual; defined as - &c)2k6)/N, where k is the photoelectron wave number, xexp is the observed EXAFS, x d is the calculated EXAFS, k is the photoelectron wave number (in A-l), and Nis the number of data points. 1 Reference 19. 8 Reference 25. Reference 26. Reference 16. j Reference 17.
Table 11. Nitrogenase and Model Compound 3-5-A Curve-Fitting
Fe-Fe’ A E O = - 10 eV Fe-X AEo = -10 eV FeS’(C) A E o = -1 6 eV Fe-Fe” A E o = -1 3 eV
sample No ( ” 9 R,bA 105~2, A 2 c NO R , ~ A 1 0 5 ~ 2 , A 2 c NO R , ~ A 1 0 5 ~ 2 , A 2 c NO R , ~ A 105~2, A 2 c R,C (F%S6cI6)> 2.0 (F%S6C16)>’ 2 (Fd6c16)2-’ 2 (F&6(oc6H4-pMe)6)> 2.0 (F&6(oc6H4-pMe)6)> ’ 2 Fe2[ (02CH)4(BIPhMe)2] 1 .O Fe2[(02CH)4(BIPhMe)2]* 1 dithionite-reduced Aul *1.4 (3.0) FeMo-cd 1.3 thionine-oxidized Aul *1.4 (3.0) dithionite-reduced Aul’ *1.0 (2.1) FeV-cd 1 thionine-oxidized Aul’ *0.8 (1.7)
3.82 3.790 3.791 3.90 3.836 3.519 3.574 3.78 3.68 3.74 3.76 3.69 3.76
613 3 .O 3 3
1051 3.0 3
428 4.5 4.5
613 *1.6 4.00 487 *2.2
613 *0.7 3.99 487 1 613 *0.8 3.99 487 *0.8
613 *OS 4.02 487 *OS
4.41 4.440 4.4 4.42 4.455 4.13k 4.263 4.28
4.30
4.38
386 1.0 4.68 487 0.3 1 4.70 1 4.7
1 4.732 1756 1.0 4.69 725 2.2
339
386 *0.4 4.68 487 0.3
1 386 1
1.2 0.5
386 1 0.4
0 Coordination number; values with * were found by optimization. Others were held fixed during refinement. bJ See footnotes to Table I. The large error (0.13 A) for the Fe-C distance is due to the complex structure of this compound. The average 4.26-A distance is the mean value of nine different 0, C, and N shells between 4.170 and 4.3 13 A. I Because of limited statistics, only 34 .54% region was fit.
c -4
L -I
1.5 2.5 3.5 4.5 5.5 Distance (A)
Figure 2. Structure and radial distributions around iron for different structures. Top to bottom, in order: singly bridged double cube, “string- bag”, capped prismane, Kim and Rees model,*l and M-Fe protein (EXAFS results). For the ordinate, the number of atoms (N) is multiplied by the atomic number (2). Hatching patterns for all F e X pairs are indicated in the bottom panel.
peaks might be affected by the statistics of the EXAFS experiment, the noise level was assessed by finding the root-mean-square deviation between three EXAFS data sets (Figure 4a). The deviations from the mean for these three independent data sets were Fourier transformed separately, and the average magnitude of this error transform is compared with the final data transform in Figure 4b. The transform truncation ripple level was assessed
0 1 2 3 4 5 6 0 1 2 3 4 5 6
Dlstance (A) Dlatsnce (A)
Figure 3. Fe EXAFS Fourier transforms for nitrogenase. (a, Left) Comparison of Fourier transforms for [Fe&6c16]s prismane (- - -), reducedAv1 protein (-),and reducedAvl’(-). (b, Right) (top) reduced (-) vs oxidized (- - -) Avl; (bottom) reduced (-) vs oxidized (- - -) Avl’. Features beyond 3 A have been multiplied by 5 in the insets to enhance visibility.
by Fourier filtering and back-transforming the 1-3-A features and then retransforming the data from 0 to 6 A. Although the long-distance features are small, they are still above the noise and the Fourier transform ripple level (Figure 4b).
To reduce the number of adjustable parameters and to allow the long-distance interactions to be modeled with sufficient sensitivity, the region between 3 and 5 A was back-transformed separately from the 1-3-A data. The raw and filtered data from this process are compared with simulations in Figure 4.

Iron EXAFS of Azotobacter vinelandii Nitrogenase
I I
Figure 4. Fourier transform filtering of nitrogenase Fe EXAFS. (a, Left) (top) Raw data and error bars; (middle) filtered data (-) and fit (- - -) for the 1-3-A region; (bottom) filtered data (-) and fit (- - -) for the 3-5-A region. (b, Right) Fe-Fe phase-corrected Fourier transforms for data sets shown in a. (Top) Reduced Mo-Fe protein vs estimated noise level and Fourier transform ripple. Features in the 3-5-A region have been multiplied by 6 in the inset. (Middle) Data (-) and fit (- - -) for the 1-3-A region. (Bottom) 3-5-A region data (-) vs best fit with (- - -) and without (-) the -4-A Fe-X component.
Resting (Dithionite-Reduced) Mo-Fe Protein (1-3-dj Region). The two distinct transform peaks in the 1-3-A region are modeled as Fe-S and Fe-Fe interactions a t -2.32 and -2.64 A, respectively. If u2 for Fe-S and Fe-Fe is fixed at values found in the prismane model, then coordination numbers of 2.3 and 1.9 are found for these components. However, a better fit can be gained by fixing these coordination numbers at 3.5 and 2 while optimizing u2 (Table I). The correlation between N and u2 is well-known in EXAFS and limits the precision with which these numbers can be defined.33
Two other components can be added to further improve the simulation quality, as illustrated by search profiles36 for Fe-0 and Fe-Mo interactions (Figure 5b). After Fe-S and Fe-Fe components have been included, addition of Fe-Mo at 2.73 A reduces the fit residual 82 by 32% There is a sharp minimum in this search profile which is absent for the model without Fe- Mo interactions. The 2.73-A distance is close to the previously reported 2.68-2.72-A Mo-Fe distance for the protein and the 2.70-A Fe-Mo distance found in the isolated cofactor.13J8
Subsequent inclusion of Fe-0 at 1.84 A produces a further 31% impr0vement.3~ However, the search profile for this Fe-0 component in the Mo-Fe protein data does not yield the same degree of improvement as in the search profile for [(Fe&- (OC6H4-p-Me)6)13-. As seen in Figure Sa, almost as good a fit can also be obtained by adding an F e O interaction a t 2.1 A. Furthermore, even a structure without oxygen ligands shows a slight improvement in fit when a small oxygen component is added, perhaps due to small systematic errors in the theoretical fitting functions. Although some Fe-(0,N) ligands may be distributed among the 15 different irons in the Mo-Fe protein, they cannot be well discerned in the EXAFS.
Resting (Dithionite-Reduced) Mo-Fe Protein (3-5-dj Region). The dominant feature in this region is well-modeled as an Fe-Fe interaction at 3.78 A. The Fourier transform magnitude is similar to the [Fe6S6C16]3-prismane spectrum, as shown in Figure 3. The Fourier transform peak is weaker in the Avl' data. Additional transform features at 4.3 and 4.7 A are evident, and on the basis of analogy with the prismane radial distribution, they were tentatively identified as Fe-S and F e F e distances, respectively.
In the long-distance fits, summarized in Table 11, the uzvalues for Fe-Fe and long Fe-S were fixed at model compound values,
(36) Cramer, S. P.; Hille, R. J . Am. Chem. SOC. 1985, 107, 8164-8169. (37) During the fit, the total coordination number N for directly bonded
Fe-X is fixed at 4, and u is allowed to float. The best fit was obtained with 3.5 F e S bond and 0.5 Fe-O bond. The coordination number of the Fe-Mo interaction was fixed at 0.3.
J. Am. Chem. SOC., Vol. 115, No. 13, 1993 5513
1 " ' ' , ~ , ' ' , , , , I ' " '""7 2 , . , , , . , 1 . , , , . , , . h i
0.5 t
i J I,, , , , , ,,lit', , , , , , , , , , , , j
"2.5 2.6 2.7 2.8 2.9 3 Distance (A)
Figure 5. EXAFS search profiles. (a, Left) Search for Fe-0 interaction in [(Fe&(OC6H,-p-Me)6)]j prismane (e-), [Fe&Cb]3- prismane (- - -), and the reduced Avl protein (-). (b, Right) Search for Fe-Mo interaction in [Fe6Sa(OC6H4-p-Me)6)]jprismane (- - -) and the reduced Avl protein (-). Note that the zero level corresponds to no improvement in the quality of fit. The search profiles were drawn for adding 1 F A (left) or 0.3 F e M o (right) interactions.
, , -2 I , , . , I , I . . . .
3.9 4 3 4 5 Distance (A)
Figure6. EXAFS search profiles. Search for F A and F e S interactions in (top) Fez[(O&H)4(BIPhMe)z], (middle) [Fe&,(Cl)#- prismane, and (bottom) the reduced Avl protein. The solid curve corresponds to adding 3 Fe-S interactions at the given distance; the dashed curve is for the addition of 4.5 Fe-C interactions.
and coordination numbers were allowed to vary. To confirm the Fe-S assignment for the 4.3-A feature, search profiles for Fe-S and Fe-C interactions have been checked for nitrogenase and the previously described model compounds, and the results are plotted in Figure 6. Since Fe-S and F e C phase shifts are approximately T out of phase throughout the simulation range, a minimum in the Fe-S search profile will yield a maximum in the F e C search. The absolute minima for the model compound search profiles are found with the correct ligand type. The nitrogenase search profile clearly favors an Fe-S assignment for the 4.28-A feature.
Although not evident as a separate peak in the Fourier transforms, an additional component near 4 A improves the fit to the data in this region. After Fe-Fe (3.8 A), Fe-S (4.3 A), and Fe-Fe (4.7 A) features have been included, the fit residual Z2 is reduced from 7 to 0.3 by adding an Fe-Fe component at 4.0 A. An almost equally good fit can be achieved by adding an Fe-S component at 3.9 A, if we allow h E 0 and u2 to float. Although it is not clear whether this feature is due to Fe-Fe, Fe-S, or a mix of them, both of these interactions are chemically expected. Infact,cross-cube Fe-Sdistancesin therangeof 3.849- 3.912 A were reported for synthetic Fe-S cubanes,38 and an average 3.9-A Fe-S distance was found in a 4Fe-4S protein.39
(38) Christou, G.; Mascharak, P. K.; Armstrong, W. H.; Papaefthymiou, G. C.; Frankel, R. B.;Holm, R. H. J . Am. Chem.Soc. 1982,104,2820-2831.
(39) Adman, E. T.; Sieker, L. C.; Jensen, L. H. J . Biol. Chem. 1973, 218,
(40) Eldredge, P. A.; Bose, K. S.; Barber, D. E.; Bryan, R. F.; Sinn, E.; 3981-3996.
Rheingold, A. A.; Averill, B. A. Inorg. Chem. 1991, 30, 2365-2375.

5514 J . Am. Chem. SOC., Vol. 115, No. 13, 1993 Chen et al.
0 ,J,k i O * ' U , U 0 . 0
0 1 2 3 4 2 3 4 5 6 Dlttance (A) Distance (A)
Figure 7. EXAFS data transforms (-) and fit transforms (- - -) for other nitrogenaseformsin the 1-3-A (a, left) and 3-5-A (b, right) regions. (Top) Oxidized Avl protein. (Middle) Reduced Avl' protein. (Bottom) Oxidized Avl' protein.
Thionine-Oxidized Mo-Fe Protein. Although all of the features present in the 1-3-1( region of the reduced Avl Fe EXAFS are also observed in the oxidized spectrum, thionine oxidation of Mo- Fe or V-Fe proteins produces reproducible changes in the intensities of Fourier transform features. The observed Fe-S and Fe-Mo distances derived from curve-fitting contract from 2.32and 2.73 A to2.29 and2.70A,respectively, while theobserved Fe-Fe distance expands slightly, from 2.64 to 2.66 A, in the oxidized sample. Although the appearance of the Fourier transform changes, this may be due to a change in interference between overlapping components. If the coordination numbers are held fixed, the optimized values for the mean-square deviation of R ( 0 2 ) are very similar for both the oxidized and reduced samples. Conversely, if dvalues are fixed, the optimized numbers of F A and Fe-Fe interactions change from 3.5 and 2.0 in the reduced sample to 3.7 and 1.7 in the oxidized sample. For the 1-3-A region, the changes in the appearance of the EXAFS Fourier transform are therefore ascribed to slightly different interferences between overlapping shells, rather than to dramatic changes in coordination number.
Similar to the reduced sample data, the oxidized spectrum in the 3-5-A region is dominated by a long Fe-Fe component now a t 3.74A, which isslightly shorter than the 3.78-Areduced protein value. However, the distances depend on the strength given the tentative F e S component, and thechange is within our estimated error of 0.06 A for these long interactions. The amplitude of this feature is almost unchanged. A -4.0-1( F e S interaction is still required to fit the region, and the amplitude of this feature is only slightly smaller than that of the reduced sample (Table 11). The longer Fe-S and Fe-Fe features at 4.3 and 4.7 8, are much less pronounced, and the simulations do not adequately model this region. In Figure 7b, we only show the data and the fit for the 3-4.5-A region. Fewer oxidized spectra were recorded, and although we cannot exclude some changes in the longer range structure, we defer further speculation until better data can be obtained.
V-Fe Protein. Most of the features observed in the Mo-Fe protein Fe EXAFS are also observed in the spectra of the V-Fe protein. The first F e S and the second Fe-Fe distances both agree within 0.01 A. Although an F e M o near 2.7 A is no longer needed, a distinct Fe-V interaction cannot be identified. Since the electron backscattering phase shifts and amplitudes for vanadium and iron are quite similar, discrimination between F e V and Fe-Fe interactions is not expected. Presumably, the Fe-V distances at -2.7 A are included in the weighted average of Fe-Fe distances. In fact, the calculated first Fe-Fe distances in both the oxidized and reduced forms increase from 2.66 and 2.64 A in the Mo-Fe protein to 2.69 and 2.61 A in the V-Fe protein.
In the 3-5 A range, the major component is a 3.74-%r F e F e interaction. The amplitude of this feature is almost unchanged from the reduced Mo-Fe protein. There is also a clear F e S
Scheme 111. Structural Fragments Inferred from EXAFS Distances"
I I11
IV V VI Fragments N and V use insights from the diffraction models.
component at 4.35 A. Again, a 4.0-A Fe-S interaction is needed to complete the fit; the amplitude of this Fe-S interaction is slightly smaller than that in the Mo-Fe sample. Upon oxidation of the V-Fe protein, there are small changes
in both the F e S and Fe-Fe distances. Just as with the Mo-Fe protein, the average Fe-S distance contracts from 2.32 A in the reduced sample to 2.29 A in the oxidized case. The average short F e F e distance expands from 2.67 A in the reduced protein to 2.69 A in the oxidized protein. The long Fe-Fe interaction changes from 3.78 A in the reduced form to 3.74 A in the oxidized sample. Features consistent with a longer F e S interaction near 4.4 A are evident in the transforms, but further analysis awaits higher quality data. The fits and transforms are summarized in Figure 7.
Discussion
Given the presence of 30 Fe per a& protein molecule,1 there are, in principle, 15 distinct types of iron in the Mo-Fe protein a@ half-molecule. Since solution EXAFS only provides distances and approximate coordination numbers, other data and consid- erable inference are required to draw structural conclusions from the current results. Some of the assumptions we have made are the following: (1) the P-clusters consist of two merged Fe4S4 clusters that primarily contribute short F e S and Fe-Fe inter- actions to the EXAFS; (2) the M center contains seven Fe atoms, bridged by sulfides and/or thiolates, and a single Moor V atom; (3) multiple scattering effects are not significant; and (4) contributions from ligand outer-shell C,N,O atoms (for example, in homocitrate, cysteine, and histidine ligands) are small compared to intracluster Fe-Fe, F e M o , and F e S EXAFS. Although these assumptions were made before the publication of recent X-ray diffraction results,11 they are consistent with the Kim and Rees models. With these assumptions, and independent of the crystallography, the interatomic distances observed in the EXAFS can be used to infer the presence of numerous structural fragments, as illustrated in Scheme 111.
The Fe-S-Fe and Fe-S-Mo angles in fragments I-III are deduced, assuming all Fe-S distances are the same (2.3 A), using the 2.4-A Mo-S distance observed in the Mo EXAFSlS, and using a 2.7-A Fe-Mo distance. This is the first time distances from the iron standpoint have been reported for the intact protein, but similar distances have been reported for the isolated Fe-Mo or Fe-V cofactors.l*J9 Note that a 3.8-A F e F e distance could be either sulfur-bridged as in III or simply the result of arranging two perpendicular 2.64-A Fe-Fe interactions as in IV. Addition of sulfurs to IV leads to fragment V, which after duplication and merging leads to the core of the Kim and Rees model.
The F e S distance at -4.3 A is a new interaction, which has not been previously observed in nitrogenase or FeMo-co EXAFS. In the Fe& prismane models?2 F e S shells occur a t -4.4 A, and these distances are accurately derived from the EXAFS. In the M center, the Fe and its distant sulfur neighbor could be held together by two acute FeS-Fe angles, in FeS-Fe-S chains that
Iron EXAFS of Azotobacter vinelandii Nitrogenase
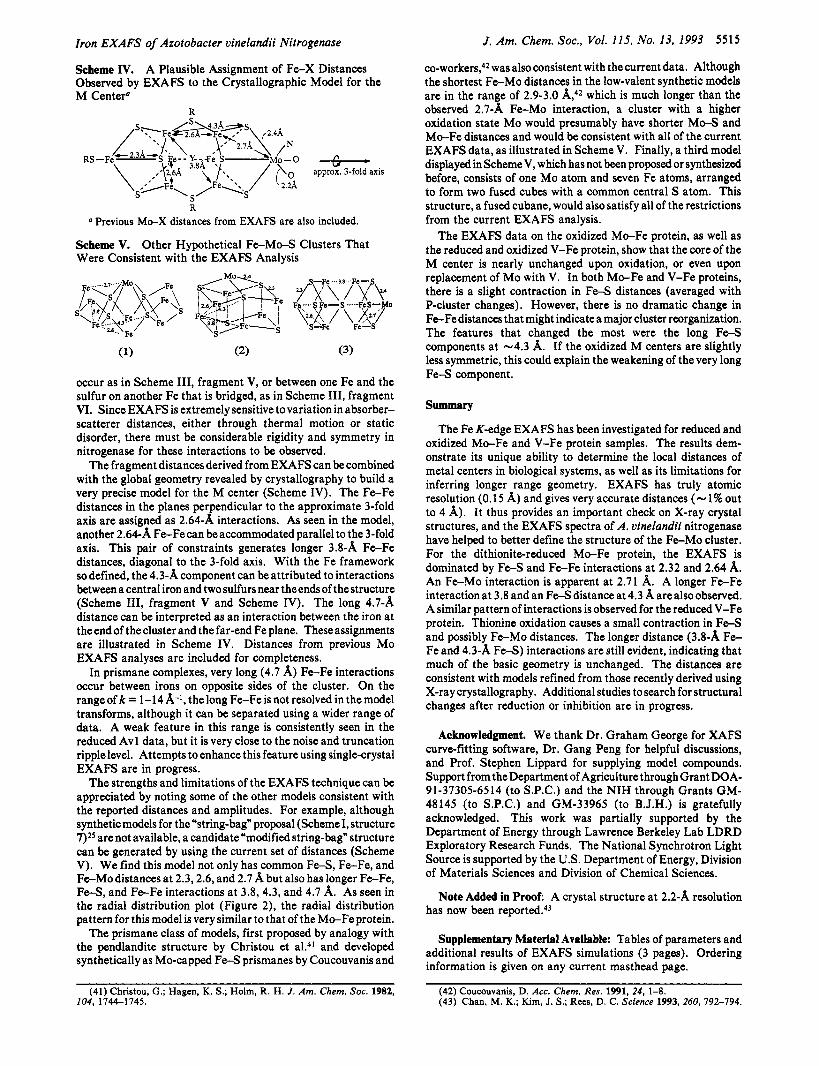
Scheme IV. A Plausible Assignment of F e X Distances Observed by EXAFS to the Crystallographic Model for the M Center“
R
a Previous Mo-X distances from EXAFS are also included.
Scheme V. Other Hypothetical F e - M A Clusters That Were Consistent with the EXAFS Analysis
occur as in Scheme 111, fragment V, or between one Fe and the sulfur on another Fe that is bridged, as in Scheme 111, fragment VI. Since EXAFS is extremely sensitive to variation in absorber- scatterer distances, either through thermal motion or static disorder, there must be considerable rigidity and symmetry in nitrogenase for these interactions to be observed.
The fragment distances derived from EXAFS can be combined with the global geometry revealed by crystallography to build a very precise model for the M center (Scheme IV). The F e F e distances in the planes perpendicular to the approximate 3-fold axis are assigned as 2.64-A interactions. As seen in the model, another 2.64-A FeFecan beaccommodatedparallel to the 3-fold axis. This pair of constraints generates longer 3.8-A F e F e distances, diagonal to the 3-fold axis. With the Fe framework so defined, the 4.3-A component can be attributed to interactions between a central iron and two sulfurs near the ends of the structure (Scheme 111, fragment V and Scheme IV). The long 4.7-A distance can be interpreted as an interaction between the iron at theendof thecluster and the far-end Fe plane. These assignments are illustrated in Scheme IV. Distances from previous Mo EXAFS analyses are included for completeness.
In prismane complexes, very long (4.7 A) Fe-Fe interactions occur between irons on opposite sides of the cluster. On the rangeofk = 1-14A-l, thelong Fe-Feisnot resolvedinthemodel transforms, although it can be separated using a wider range of data. A weak feature in this range is consistently seen in the reduced Avl data, but it is very close to the noise and truncation ripple level. Attempts to enhance this feature using single-crystal EXAFS are in progress.
The strengths and limitations of the EXAFS technique can be appreciated by noting some of the other models consistent with the reported distances and amplitudes. For example, although synthetic models for the ‘string-bag” proposal (Scheme I, structure 7)z5 arenot available, a candidate “modified string-bag” structure can be generated by using the current set of distances (Scheme V). We find this model not only has common F e S , Fe-Fe, and Fe-Modistances at 2.3,2.6, and 2.7 A but also has longer Fe-Fe, Fe-S, and Fe-Fe interactions at 3.8, 4.3, and 4.7 A. As seen in the radial distribution plot (Figure 2), the radial distribution pattern for this model is very similar to that of the Mo-Feprotein.
The prismane class of models, first proposed by analogy with the pendlandite structure by Christou et al.41 and developed synthetically as Mo-capped Fe-S prismanes by Coucouvanis and
(41) Christou, G.; Hagen, K. S.; Holm, R. H. J . Am. Chem. SOC. 1982, 104, 1144-1745.
J. Am, Chem. Sot. , Vol. 115, No. 13, 1993 5515
co-workers,42 was alsoconsistent with the current data. Although the shortest Fe-Mo distances in the low-valent synthetic models are in the range of 2.9-3.0 which is much longer than the observed 2.7-A Fe-Mo interaction, a cluster with a higher oxidation state Mo would presumably have shorter M o S and Mo-Fe distances and would be consistent with all of the current EXAFS data, as illustrated in Scheme V. Finally, a third model displayedin Scheme V, which has not been proposed or synthesized before, consists of one Mo atom and seven Fe atoms, arranged to form two fused cubes with a common central S atom. This structure, a fused cubane, would also satisfy all of therestrictions from the current EXAFS analysis.
The EXAFS data on the oxidized Mo-Fe protein, as well as the reduced and oxidized V-Fe protein, show that the core of the M center is nearly unchanged upon oxidation, or even upon replacement of Mo with V. In both Mo-Fe and V-Fe proteins, there is a slight contraction in Fe-S distances (averaged with P-cluster changes). However, there is no dramatic change in Fe-Fe distances that might indicate a major cluster reorganization. The features that changed the most were the long Fe-S components at -4.3 A. If the oxidized M centers are slightly less symmetric, this could explain the weakening of the very long F e S component.
Summary
The Fe K-edge EXAFS has been investigated for reduced and oxidized Mo-Fe and V-Fe protein samples. The results dem- onstrate its unique ability to determine the local distances of metal centers in biological systems, as well as its limitations for inferring longer range geometry. EXAFS has truly atomic resolution (0.15 A) and gives very accurate distances (- 1% out to 4 A). It thus provides an important check on X-ray crystal structures, and the EXAFS spectra of A . vinelandii nitrogenase have helped to better define the structure of the F e M o cluster. For the dithionite-reduced Mo-Fe protein, the EXAFS is dominated by F A and Fe-Fe interactions at 2.32 and 2.64 A. An F e M o interaction is apparent at 2.71 A. A longer Fe-Fe interaction at 3.8 and an F e S distance at 4.3 A are alsoobserved. A similar pattern of interactions is observed for the reduced V-Fe protein. Thionine oxidation causes a small contraction in Fe-S and possibly Fe-Mo distances. The longer distance (3.8-A Fe- Fe and 4.3-A Fe-S) interactions are still evident, indicating that much of the basic geometry is unchanged. The distances are consistent with models refined from those recently derived using X-ray crystallography. Additional studies to search for structural changes after reduction or inhibition are in progress.
Acknowledgment. We thank Dr. Graham George for XAFS curve-fitting software, Dr. Gang Peng for helpful discussions, and Prof. Stephen Lippard for supplying model compounds. Support from the Department of Agriculture through Grant DOA- 91-37305-6514 (to S.P.C.) and the NIH through Grants GM- 48145 (to S.P.C.) and GM-33965 (to B.J.H.) is gratefully acknowledged. This work was partially supported by the Department of Energy through Lawrence Berkeley Lab LDRD Exploratory Research Funds. The National Synchrotron Light Source is supported by the US. Department of Energy, Division of Materials Sciences and Division of Chemical Sciences.
Note Added in hoof A crystal structure at 2.2-A resolution has now been reported.43
Supplementary Material Available: Tables of parameters and additional results of EXAFS simulations (3 pages). Ordering information is given on any current masthead page.
~~~~~~~
(42) Coucouvanis, D. Acc. Chem. Res. 1991, 24, 1-8. (43) Chan, M. K.; Kim, J. S. ; Rees, D. C. Science 1993, 260, 792-794.