irina bouzina dennis figueras joey yuen - ucf … bouzina dennis figueras joey yuen ii table of...
TRANSCRIPT

Water quality Autonomous Robot
Senior Design II
Group #24
Spring 2014
Irina Bouzina
Dennis Figueras
Joey Yuen

ii
Table of Contents
1.0 Executive Summary…………………………………………………………………………...1
2.0 Project Description…………………………………………………………………………… 2
2.1 General Description…………………………………………………………………....2
2.2 Project Motivation and Goals……………………………………………………….…2
2.2.1 Future Goals…………………………………………………………………3
2.3 Specifications and Requirements (SRS)………………………………………………3
2.3.1 List of Requirements………………………………………………………...3
2.3.2 Physical Description………………………………………………………...5
2.3.3 Electrical Hardware.………………………………………………………....6
2.3.4 Internal Software…………………………………………………………….6
2.3.5 External Software……………………………………………………………7
2.3.6 Mechanical Hardware………………………………………………………..7
2.4 Group Dynamics…………………………………………………………………….…7
2.4.1 Division of Labor……………………………………………………………7
2.4.2 Project Schedule……………………………………………………………..8
2.4.3 Initial Project Budget………………………………………………………...9
3.0 Research……………………………………………………………………………………...11
3.1 Existing Projects and Products……………………………………………………….11
3.1.1 Commercial Designs……………………………………………………….11
3.1.2 Other Designs………………………………………………………………11
3.2 Relevant Technology………………………………………………………………....11
3.2.1 Temperature Sensor………………………………………………………...11
3.2.2 Conductivity Sensor………………………………………………………..12
3.2.3 pH Sensor…………………………………………………………………..12
3.2.4 Dissolved Oxygen Sensor………………………………………………….13
3.2.5 Oxidation Reduction Potential (ORP) Sensor……………………………...14
3.2.6 GPS Module………………………………………………………………..14
3.2.7 Wireless Data Transmission Module……………………………………….16
3.2.8 Photovoltaic (PV) Cells………………………………………………….…17
3.2.9 Rechargeable Battery..……………………………………………………..18
3.2.10 Maximum Power Point Tracking…………………………………………20
3.2.11 Microcontrollers…………………………………………………………..21
3.2.12 Autonomous Motor Control………………………………………………23
3.2.13 Robot Platform……………………………………………………………25
3.2.14 74HCT4051 Serial Mux/Demux…………….….………………………...26
3.2.15 Power Supply……………………………………………………………..27
3.2.16 Charge Controller………………………………………………………....28
3.2.17 Capacitors………………………………………………………………....31
3.2.19 Compass…………………………………………………………………..32
3.2.20 Electronic Speed Control…………………………………………………32
3.2.21 Power System Research SD I……………………………………………..33
3.3 Methods and Architecture……………………………………………………………37
3.3.1 Software……………………………………………………………………37
3.3.2 Hardware…………………………………………………………………...38

iii
3.3.3 Sensor Calibration and Connections………………………………………..40
3.3.4 GPS/Motor Integration……………………………………………………..40
3.3.5 Protection against Electrostatic Discharge………………………………....41
3.4 Final Design Comparison………………………………………………………………….…43
3.4.1 Final Choice for Battery……………………………………………………43
3.4.2 Final Choice for Microcontroller…………………………………………...43
3.4.3 Final Choice on Wireless Technology……………………………………...43
3.4.4 Final Choice for Water Quality Sensors……………………………………44
3.4.5 Final Choice for Water Quality Circuits…………………………………....44
3.4.6 Final Choice for PV Cells…………………………………………………..44
3.4.7 Final Choice for Platform……...…………………………………………...44
3.4.8 Final Choice for DC to DC Step Down Converter………..……………..…45
3.4.9 Final Choice for GPS module…………………..………………………..…46
3.4.10 Final Choice for Charge Controller…………..……………………………46
3.4.11 Final Choice for Motor…………………………………………………....47
3.4.12 Final Choice for Compass………………………………………………....48
4.0 Project Hardware, Software, and Mechanical Design Details.…………………………….…49
4.1 Overall Design………………………………………………………………………..49
4.1.1 PCB………………………………………………………………………...49
4.2 Hardware……………………………………………………………………………..51
4.2.1 Microcontrollers……………………………………………………………51
4.2.2 XBee Pro Module…………………………………………………………..51
4.2.3 Sensors/Circuits…………………………………………………………….52
4.2.4 HCT4051 8-Channel Serial Analog Mux/Demux………………………….54
4.2.5 GPS Module………………………………………………………………..55
4.2.6 PV Cells…………………………………………………………………….58
4.2.7 DC to DC Power Converter………………………………………………...59
4.2.8 Lithium Ion Battery………………………………………………………...60
4.2.9 Charge Controller…………………………………………………………..61
4.3 Software……………………………………………………………………………...63
4.3.1 Microcontrollers……………………………………………………………63
4.3.2 XBee Pro…………………………………………………………………...64
4.3.3 Desktop Application………………………………………………………..65
4.3.4 Navigation Software………………………………………………………..65
4.4 Mechanical…………………………………………………………………………...68
4.4.1 Platform……………………………………………………….……………68
5.0 Design Summary of Hardware, Software, Mechanical……………………………………....70
5.1 Hardware……………………………………………………….…………………….70
5.1.1 Overall Specifications………………………………….…………………..70
5.1.2 Microcontroller……………………………………….……………………71
5.1.3 XBee Pro……………………………………….……………….………….72
5.1.4 Water Quality Circuits……………………………………………………..72
5.1.5 Solar Panels………………………………………………………………...73
5.1.6 Power supply……………………………………………………………….73
5.1.7 GPS………………………………………………………………………...75
5.1.8 Motor……………………………………………………………………….76

iv
5.1.9 GPS Compass………….…………………………………………...……....78
5.2 Software……………………………………………………………………………...79
5.3 Mechanical…………………………………………………………………………...79
6.0 Project Prototype Construction and Coding……………………………………………….…80
6.1 Robot Frame Platform…………………………………….………………………….80
6.2 Water Quality Circuit/Sensor Prototype………………..…………………………….80
6.3 XBee Pro and Microcontroller Prototype………………………………………….…80
6.4 USB Programming…………………………………………………………………...81
6.5 Multiplexer Prototype………………………………………………………………...81
6.6 GPS Prototype………………………………………………………………………..81
7.0 Project Prototype Testing…………………………………………………………………….82
7.1 Hardware Electrical Components/Configurations…………………………………....82
7.2 External Frame/Robot Platform……………………………………………………....84
7.3 XBee Pro Communication Test……………………………………………………....84
7.4 XBee Pro Testing……………………………………………………………………..85
7.5 Autonomous Motion……………………………………………………………….…85
7.6 GPS Function Test…………………………………………………………………....85
7.7 Water Quality Circuit/Sensors Calibration…………………………………………...86
7.7 Waterproofing………………………………………………………………………..86
7.8 Demo Testing………………………………………………………………………...87
8.0 Administrative Content………………………………………………………………………88
8.1 Milestone Discussion………………………………………………………………...88
8.2 Finances and Budget…………………………………………………………………88
8.2.1 Sponsorship………………………………………………………………...90
Appendices
A: Works Cited
B: Letters of Copyright Use

1
1.0 Executive Summary
After going through many ideas during the first two weeks of the fall semester the group decided
to create a project that would sample water quality data in bodies of water. The primary motivation
came from group member, Irina Bouzina, when she told us about the recent problems that some
children and teenagers ran into when swimming in warm bodies of water. According the article
she read, a brain-eating amoeba could be present in bodies of water without anybody knowing
until it had entered a victim. While cases of these amoebae infections were relatively rare, the
mortality rate was disturbingly high. With this motivation we decided to create a project that will
sample water quality in large bodies of water. Though there isn’t a specific sensor that can tell us
if the brain-eating amoeba is present in the water, we believe that with the different measurements
taken of the water it can give the user a general idea if the water is safe to enter. This data can be
used by many people varying from outdoor enthusiasts to scientists researching aquatic life.
The general functionality of this project is a small aquatic vehicle that can autonomously move to
a specified GPS coordinate and take various water quality measurements. The boat can take five
different water quality measurements. These are temperature, pH, Oxidation Reduction Potential
(ORP), Dissolved Oxygen (D.O.) and conductivity. Once the boat arrives to the GPS coordinates
it samples the water and transmits the water quality data wirelessly back to a laptop onshore. To
accomplish autonomous motion, the boat is equipped with a GPS module. The GPS module
obtains the current coordinates of the boat and transmits them to the navigation microcontroller.
The microcontroller then compares the obtained coordinates with the user inputted coordinates. If
the two coordinates differ, the microcontroller will turn on the motor and move the rudder via a
servo to the correct angle so that the boat will travel to its waypoint. The chosen GPS module can
provide a reliable heading as long as the boat is moving. Thus a GPS compass is not needed. The
entire project is powered using solar power. The boat is equipped with batteries that can be
recharged from PV cells that are mounted to the top of the boats hull to gather sunlight. Using PV
cells is a great opportunity to make the project self-sustaining and environmentally friendly.
To finance this project we were sponsored by Duke Energy. From previous years Duke Energy
has sponsored groups from $1500-$4000. With this financial backing we were able to purchase
high quality sensors that can measure water quality accurately. Even with this sponsorship we still
plan to make this as budget friendly as possible. If we are able to make this project low cost, we
hope that other hobbyist will be able to follow these steps and build similar projects that are on a
budget.

2
2.0 Project Description
2.1 General Description
Water quality Autonomous Robot (W.A.R.) is an autonomous, solar-powered, robotic boat that
takes various measurements of water quality and transmits them back to an on shore receiver. A
user is able to input a GPS coordinates and the boat will autonomously move to that location,
measure water quality and transmit data before returning back to saved start point. This is
accomplished by using the on board servo rudder, motor, and propeller. The boat contains three
lithium ion batteries that are recharged by the solar panel mounted on the bow of the boat. The
batteries are used to power all the components of the robot. The robot is waterproof and is mounted
on pre-made RC boat hull.
To determine the water quality, W.A.R. is equipped with five scientific grade sensors and
corresponding circuits. These sensors and circuits calculate temperature in degrees Celsius, pH
levels on a 0 -14 s
cale, water conductivity, dissolved oxygen, and oxidation reduction potential (ORP). These five
sensors and circuits give a good overall picture of the water quality in the body of freshwater. The
microcontroller on the robot receives input data from the sensors and circuits and transmits this
data wirelessly to an on-shore device.
2.2 Project Motivation and Goals
The state of Florida is not only surrounded by water on three sides, but also contains more than
30,000 lakes that cover a little more than 3 million acres of land. Water is an essential requirement
of life for many different species. Unlike other species, humans also use water for recreational and
leisurely activities. There are many water sports, competitive races and other activities that exist
in today’s society. Of course, humans do not have complete control over the water and they must
share with the other natural inhabitants. Most of these other inhabitants can be relatively harmless
but some can be very dangerous to the human body. Perhaps the most frightening of all is the
brain-eating amoeba, called Naegleria Fowleri. While not a widespread epidemic, this particular
amoeba has a very high mortality rate and is especially dangerous to younger children.
On August 3rd, 2013 a little 12 year old boy contracted Naegleria Fowleri, by swimming in a
closed freshwater body of water. This amoeba thrives in warm waters and hot springs, often
leaving people weary and discouraged about swimming in freshwater lakes and fully enjoying
their warm weather summer. However, by precisely measuring the water temperature we are able
to take the proper preventative measures in tracking this amoeba. When the temperature reaches
near 25 °C/77F the amoeba becomes active and begins to reproduce.
The goal of this senior design project is to make it easier for any outdoor enthusiast to test the
water for safe and comfortable conditions. We will achieve this by measuring the water
temperature, as well as pH levels, conductivity, dissolved oxygen and the oxygen reduction
potential of the water. The user of the W.A.R. will be able to stay safely on shore while inputting
a series of GPS coordinates to maneuver the W.A.R. to take samples in different areas of the fresh
water body. The W.A.R. will then wirelessly transmit the gathered data to a portable display the

3
user has on shore. Creating this system will help scientists and outdoor enthusiasts gather precise
data on anybody of freshwater. Instead of having people go in the water and find out that it is
unsafe or uncomfortable for use when it is too late.
2.2.1 Future Goals
A great thing about our project is that we can continuously add more and more features to it in the
future. A feature that the team discussed if we had enough time to implement was integration with
Android devices and Google Maps. Currently we plan on having the user enter GPS coordinates
to a microcontroller from a PC using a USB to FTDI cable. In the future we could implement a
way for the user to take out their Android device, open Google Maps and select where W.A.R.
would need to go. The Android device would communicate with the microcontroller using
Bluetooth and the integration of Google Maps would be achieved by using the open Google Maps
API.
Another feature that we would like to add in the future would be a live video stream from W.A.R.
to the onshore PC. Having a live video stream would be beneficial to the user if the water quality
testing was happening outside the line of sight. With the live stream the user can see where W.A.R.
is and how the surrounding environment could be changing the water quality. To implement a live
video stream we would need to upgrade our wireless connection to something with a higher data
right. Wi-Fi would be ideal here since it has high data rate and can support long distances.
A last feature that would prove useful to our project could be data transmission to a server.
Currently we only plan on transmitting water quality data to an onshore PC. If we could upload
the water quality data in real time to a server then other people who are interesting the water quality
can see the data without being next to the onshore computer. Also having a direct upload to the
server can be useful because we can create a large database of water quality data.
2.3 Specifications and Requirements
2.3.1 List of Requirements
Based off of our team meetings below are the minimum system requirements for W.A.R. These
requirements are a general outline for completion of the design. During testing we confirm that
each of these minimum requirements are working and part of the design. Below in Table 2.3.1.A
is a list of general requirements for our project.

4
Req. ID Requirement Text
W-001 W.A.R. shall be able to transmit data within 50-100 meters of the main receiver
tower.
W-002 W.A.R. subsystems shall operate off lithium ion batteries which are connected
to solar panels.
W-003 W.A.R. sensors shall operate off their connection to the PCB through BNC
connectors.
W-004 W.A.R. navigation system shall operate off lithium ion batteries which are
connected to solar panels.
W-005 W.A.R. shall weigh no more than 5 pounds.
W-006 W.A.R. shall run for at least one hour before needing recharge.
W-007 W.A.R. shall average 4.5W of power from the solar panel.
W-008 W.A.R. shall recalculate the GPS coordinates every 0.25 seconds.
W-009 W.A.R. shall complete all sensor data within 5 minutes.
W-010 The dimension of the BB shall be at most 3x1x1 ft.
W-011 The sensors W.A.R. shall be connected to one microcontroller.
W-012 W.A.R. shall have GPS accuracy within 15 meters.
W-013 W.A.R. shall have one main microcontroller to for navigation and movement.
W-014 W.A.R. shall have GPS lock in approximately 60 seconds.
W-015 W.A.R. shall have an average speed of 5 mph.
Table 2.3.1.A Requirements Table

5
2.3.2 Physical Description
Figure 2.3.2.A Rough Design Drawing of a Side View of W.A.R.
For the robot to move through the water, we are using a pre-made RC boat platform. The boats’
length is no longer than three ft. and its width no wider than one ft. It has the form of a deep vee
so it can traverse through the water easily. The body of the boat, the electronics, sensors, motors,
and servos do not exceed 10 pounds. All the electronic components on the boat are water resistant
and do not fail due to small amounts of water. All electronics are housed inside the boat hull and
have outside access to these electronics with a hatch on top of the boat. The storage of the
electronics is shown in Figure 2.3.2.A.
On top of the RC boat platform is a solar panel, as shown by our rough draft drawing in Figure
2.3.2.B. We ensure that the solar panels are protected from the water when the boat is moving.
Any wiring coming from the solar panels is shielded and has no open ends to ensure no electronics
are damaged.
Figure 2.3.2.B Top View of the Boat Platform

6
The rear of the RC boat holds the motor and servo to control the rudder. Figure 2.3.2.C shows a
design drawing while planning this project.
Figure 2.3.2.C Rear View of the Boat Platform
2.3.3 Electrical Hardware
The entire boat is powered by solar energy. The PV cells are horizontally mounted on top of the
boat and connected in a parallel and series composition. In order to prevent any sort of discharge
or backflow of current, which would cause the battery to discharge when the solar panel is not
providing energy, a diode configuration or some other discharge prevention mechanism is set on
the wire(s) leading to the battery pack. A charge controller is connected between the solar panels
and the battery to prevent any sort of battery overcharge damage.
The set of rechargeable batteries, or battery pack, is able to charge and supply 5V to the first system
and 3.3V to the second system. The first system contains: the sensors, motors, and microcontroller.
The second system contains the communication system. The solar panel continually charges the
battery pack, as the boat is running off the same rechargeable battery pack.
The battery supply connections are all made on a custom made PCB. The power requirements for
each of the two systems is different, therefore each is has different DC to DC converters and/or
circuit configurations.
2.3.4 Internal Software
The software on the navigation microcontroller takes a series of GPS coordinates from the user
and determines the location that the boat will navigates to. The input from user is a UART standard
with possibly 8 bits of data. With this data the software on the navigation microcontroller calculates
the offset, position the rudder and powers the motor. This configuration for movement has a
response time under three seconds.

7
The software on the sensor microcontroller receives UART communication from the sensors one
at a time by using a multiplexer. Each sensor has a response time of less than 3 seconds so the total
time to calculate the water quality is no more than 15 seconds. The sensor microcontroller polls
each water quality circuit for a set amount of time. Once that time expires a multiplexer selects the
next water quality data the microcontroller sends to our wireless transmitter.
2.3.5 External Software
The software on the receiving device is able to receive data in UART standard up to 8 bits and
convert it into readable data for the user. The external software used opens source terminal
software that can read the serial data. The open source terminal software allows the user to create
logs of the water quality so we can make an archive of data.
The user is able to send simple commands to the boat from the on shore display as well. These
commands are no longer than eight bits and include, travel to the inputted GPS coordinates,
measure water quality, transmit data, and return to shore. “Shore” is a static GPS coordinate that
the microcontroller stores upon initial launch.
2.3.6 Mechanical Hardware
The mechanical hardware on the boat robot consists of the motor, the rudder and servos. The boat
robot utilizes a pre-made RC motor and rudder. These are connected to the navigation
microcontroller and along with the internal software steers the boat to the intended destination. All
the mechanical hardware is powered by our own hand crafted power supply. The power supply
uses photovoltaic cells to charge lithium ion batteries which in turn ensure that the boat is able to
stay on the water for extended periods of time.
2.4 Group Dynamics
2.4.1 Division of Labor
There are three members in Group 24 of the fall 2013 Senior Design for Computer and Electrical
Engineers class. These people are Irina Bouzina, EE, Dennis Figueras, CpE and Joey Yuen, CpE.
Irina is responsible for the boat’s power supply subsystem, using PV cells to power the various
components of the boat. The PV cells are used to charge a rechargeable battery that will then power
the PCBs on the boat. Dennis is responsible for the boat’s autonomous movement using GPS
coordinates. The GPS sends the coordinates to the microcontroller and calculates the distance and
direction the boat needs to travel. Joey is responsible for the boat’s water quality sensors and
wireless data transmission. The water quality data is sent to a microcontroller and then transmitted
wirelessly to an onshore PC. All three members work together on microcontroller programming,
subsystem integration, and PCB design. Table 2.4.1.A specifically breaks down, what each
engineer is responsible for.

8
Table 2.4.1.A Each Engineers Responsibility of the W.A.R. Project
Figure 2.4.1.1 is a block diagram that demonstrates the amount of work each engineer is doing
with respect to the entire project.
Solar Cells Charge
Controller
MCU
Programming
Wireless/
Sensors
Motor/Robot
Platform
Navigation
Irina X X X
Dennis X X X
Joey X X X X
Table 2.4.1.B Table with each Engineers Responsibility
2.4.2 Project Schedule
A project schedule is assigned to help the group realize the amount of design work that needs to
be accomplished during the first semester of Senior Design and the amount of work that is needed
to actually implement the design itself during the second semester of Senior Design. Each engineer
is tentatively responsible for their own section of the project (the work distribution is shown in the
block diagram in Figure 2.2 in the next section) and to follow the project schedule start and finish
dates. The two semester long Senior Design schedule for the W.A.R. project, is displayed in the
Figure 1.4.1 below. Though the dates below are well defined the group, they do not necessarily
have to follow it to the exact day. We expect there will be holdups and complications throughout
this project due to the fact we are all entry level engineers designing our first full project.

9
Figure 1.4.1 W.A.R. Project Schedule
2.4.3 Initial Project Budget
The estimated project budget is generated after the general design of the W.A.R. project is
conducted. Each part, its quantity, and cost, is demonstrated in the Table 2.4.3.A. The total cost of
the project sums up to be approximately $1148.00.
Part Cost Per Unit Quantity Total Cost
Scientific Grade pH Sensor -------------------------------- pH Circuit
$60 ------------------------ $28
1 $88
Field Ready Temperature Sensor $18 1 $18
Dissolved Oxygen Sensor ----------------- D.O Circuit
$160 ------------------------ $33.00
1 $193
Oxidation Reduction Potential Sensor -------------------------------- ORP Circuit
$90.00 ------------------------- $28.00
1 $118.00
Conductivity Sensor -------------------------------- Conductivity Circuit
$105.00 -------------------------$43
1 $148.00
Microcontroller (specific model TBD)
$15.00 2 $30.00
Microcontroller Development Board
$50.00 1 $50.00

10
GPS unit $20.00 1 $20.00
1-to-8 MUX - 74HCT4051 $1.00 5 $5.00
Diode Free* 4 $0.00
PV Cells $146.00 + $40(Shipping)
1 $186
Lithium-Ion Battery $45.00 1 $45
MPPT $12.00 1 $12.00
AC to DC Power Converter $40.00 1 $40.00
Breadboard $10.00 1 $10.00
Wiring $10.00 1 $10.00
PCB Manufacturing $50.00 1 $50.00
Rudder $10.00 1 $10.00
Rudder Servo $20.00 1 $20.00
Propeller $5.00 1 $5.00
Motor $10.00 1 $10.00
Robot Frame/Platform $80.00 1 $80.00
Total Cost of Buoy Bot $1148.00
Table 2.4.3.A - Initial Projected Costs Table

11
3.0 Research
3.1 Existing Projects and Products
3.1.1 Commercial Designs
No existing commercial products have been found for this project. There have been a few
noncommercial ones but none available to be purchased by the general populace. The
noncommercial projects are generally from other universities or hobby groups. There are however
many companies that create water quality measurement devices that are handheld. These handheld
devices can measure many different measurements like W.A.R. does.
3.1.2 Other Designs
In April of 2010, a group from the University of Oulu made a water quality measuring robot boat.
Similarly to our design they used a pre made RC boat platform, with a GPS receiver. However
their boat could only measure and transmit the water temperature. This project will be very similar
but will expand on their boats capabilities by adding more water quality measuring functionality
such as conductivity, dissolved oxygen, oxidation reduction potential and pH levels. The W.A.R.
will be able to take in a series of GPS coordinates and save them in the microcontroller for future
use. The robot can be programed to follow the saved path on a daily basis so that the user does not
have to manually enter the coordinates every day.
3.2 Relevant Technology
3.2.1 Temperature Sensor
To accurately measure the water temperature it’s important to consider the proper temperature
calibration of the sensor itself. It’s vital to make sure that the chosen temperature sensor covers
the following range of temperatures: 60 to 90 degrees Fahrenheit (1). The data for average for
water temperature is displayed in Figure 3.2.1.A below.
Figure 3.2.1.A: Average Water Temperature (F) in FL Graph

12
Also, the total power that is derived from the solar cells is distributed to all of the components, so
it’s important to conserve the power and pick the components that require the least amount of
energy. Proper measures are taken to prevent any leaking current draw in between the times that
the sensor is not testing any water. That is usually achieved with some diode configuration that
prevents any excess power withdraw.
3.2.2 Conductivity Sensor
The conductivity is an important measurement because it indirectly measures the Total Dissolved
Solids (TDS) in the water. A normal body of water has a constant range of conductivity under
regular conditions. Therefore a significant change in the conductivity lets the user of the W.A.R.
know that there may be pollutants in the water.
The sensor is able to send data to our microcontroller in a unit called Siemen. To send the data the
sensor is connected from a BNC connector to our conductivity circuit. From there the circuit
deciphers the data and then sends it to our microcontroller. The data is transmitted through RS-
232 format. The sensor uses the RX so it knows when to take the conductivity of water and the TX
line to transmit the data to the conductivity sensor.
There are many factors in choosing the conductivity sensor. The one we choose to be on our boat
will have to be designed for freshwater use, be accurate enough up to micro Siemens and be light
weight so it will not weigh down our boat.
3.2.3 pH Sensor
The pH is another measurement that is important in determining water quality. We want a
measurement of pH because it is one of the most common measurements that can determine if the
water is acidic. Due to acid rain and other pollutants a natural body of water that can sustain life
at 6.5-8 pH can drop to 5 or lower. At levels 5 or below organisms such as fish and aquatic plants
cannot survive. Figure 3.2.3.A shows what pH level acid rain and other acids that pollute bodies
of water. It also shows at what pH level aquatic life is affected.
Figure 3.2.3.A pH Table

13
Our sensor for pH is similar to our conductivity sensor. It connects to a pH circuit through a BNC
connector. From there the pH is determined from the circuit and sent to our main microcontroller.
The data is transmitted through RS-232 format exactly the same as the conductivity sensor.
3.2.4 Dissolved Oxygen Sensor
Another measurement that W.A.R. is taking is dissolved oxygen. Dissolved oxygen measures the
amount of gaseous oxygen in a solution. The oxygen enters the water from the air, aeration of the
water (movement in the water) and waste from aquatic plants through photosynthesis. A very
important factor that determines the dissolved oxygen levels is the temperature of the water. As
the temperature of the water increases the oxygen level continues to decrease and vice versa as
shown in Figure 3.2.4.A.
Figure 3.2.4.A Oxygen Concentration in Water vs. Temperature
It is an important factor in water quality because oxygen is important for all life forms to live. If a
body of water has a low concentration of dissolved oxygen then organisms begin to die off which
could lead to bacteria and other toxins entering the water.
Like the other sensors the dissolved oxygen sensor is connected to a dissolved oxygen circuit
through a BNC connector. The circuit calculates the dissolved oxygen in the water and then
transmits the data to the microcontroller. The data is transmitted through a RS-232 line on the
microcontroller.

14
3.2.5 Oxidation-Reduction Potential (ORP) Sensor
Oxidation-reduction potential measures the ability for a body of water to break down waste, such
as dead animals and plants. ORP is an important measurement in water quality because determines
how well bacteria are decomposing the dead tissue in the water. ORP is related to dissolved oxygen
in the fact that both measurements tell the scientists if there are pollutants in the water. The sensor
for our design should be similar to the other sensors using a BNC connector to the ORP sensor and
transmits data through a RS-232 line with the microcontroller.
3.2.6 GPS Module
For this project, a GPS receiver is needed for the boat robot. The receiver is able to report the
current longitude and latitude of the boat with an error no greater than three meters. The GPS
module is connected to the navigation microcontroller which then compares the boat’s current
location to the user inputted GPS coordinates. If the two locations do not match, the
microcontroller turns on the boat’s motor and steer towards the intended location. The navigation
microcontroller is able to receiver user inputted coordinates from up to 1000 meters away.
GPS receivers communicate with microcontrollers in various ways but the most common is via
serial port, using the NMEA protocol for transmitting. The NMEA protocol is based on strings.
Figure 3.2.6.A shows an example of NMEA transmitting protocol that is commonly used to
connect a GPS receiver to a microcontroller.
Figure 3.2.6.A NMEA Example
To connect the GPS to the microcontroller it is necessary to provide two lines, RX and TX. The
RX line is used for sending data from a GPS receiver to the microcontroller, while the TX line is
used for sending commands from the microcontroller to the GPS receiver. Most GPS receivers
require a power supply of around 3V, since other parts on the boat require more voltage, it is
necessary to use a voltage level translator.
The GPS signal contains three different bits of information. These are as follows: a pseudo random
code, almanac data and ephemeris data. The pseudo random code is an I. D. code that identifies

15
which satellite is transmitting the information. Almanac data is data that describes the orbital
courses of the satellites. Every satellite broadcasts almanac data for every other satellite. The GPS
receiver uses this data to determine which satellites are the closest. It can then determine which
satellites it should track. With Almanac data the receiver can concentrate on the satellites it can
see and ignore the ones that are too far or out of line of sight. Ephemeris data is data that tells the
GPS receiver where each GPS satellite should be at any time throughout the day. Each satellite
broadcasts its own ephemeris data showing the orbital information for that satellite only. Because
ephemeris data is very precise, orbital and clock correction data are necessary for precise
positioning its validity is much shorter. It is broadcast in three six second blocks repeated every
30 seconds. The data is considered valid for up to 4 hours but different manufacturers consider it
valid for different periods with some treating it as stale after only 2 hours.
There are many factors that need to be taken into account before selecting a GPS receiver. These
factors are size, update rate, power requirements, number of channels, and accuracy. Most GPS
receivers are very small, so size should not be a problem. The boat has plenty of space but the
smaller the better. The standard update rate is 1Hz (once per second) which is more than enough
for this project. Depending on the microcontroller that is picked, the update rate might have to be
staggered so that the microcontroller is not overwhelmed with NMEA sentences. GPS receiver
uses around 30mA at 3.3V, this needs to be taken into account during the power supply
construction. Number of channels affects the time it takes the GPS receiver to first find which
satellites to connect to, 12 or 14 channels should work just fine for tracking. Most GPS have an
accuracy of about +/- 10 meters. This is not be ideal, as a gap of 10 meters could cause the W.A.R.
to crash onto shore. Some GPS have an accuracy of +/- 3 meters and are relatively inexpensive.
These would work for the W.A.R. however there exists another method to raise the GPs accuracy
even further.
This method is called differential GPS (DGPS) and is used to obtain a much higher accuracy than
just using a regular GPS by itself. Essentially, DGPS requires an additional receiver to be fixed at
a known location nearby. Coordinates obtained by the fixed stationary receiver are used to correct
the coordinates recorded by the moving unit. Under the ideal conditions and best implementation,
an accuracy of 10 centimeters can be achieved using DGPS. An example picture of DGPS is shown
in figure 3.2.6.B below.

16
Figure 3.2.6.B Differential GPS Example
3.2.7 Wireless Data Transmission Module
To transmit the water quality data, we researched Bluetooth, WLAN, and ZigBee options. With a
Bluetooth module we use a transmit data with extremely low power usage. The new Bluetooth 4.0
standard (Bluetooth LE) can transmit data up to 50 meters and using up to 20 mA. Compared to a
Classic Bluetooth which can transmit data up to 100 meters and using up to 30 mA. Due to the
different classes of Bluetooth we can have low power transmission that won’t drain out batteries.
Some downsides of using Bluetooth are the range we can transmit data. Using Bluetooth LE, the
module can only transmit data 50 meters (160 feet) away. Classic Bluetooth doubles the
transmission range to 100 meters (330 feet). Another downside of Bluetooth is the bandwidth
channel that Bluetooth uses. Currently Bluetooth has a bit rate of ~2.1 Mbps.
For the WLAN (Wi-Fi) option, we can increase the transmission range. With the IEEE 802.11n
protocol we can transmit data outdoors with a max range of 250 meters (820 feet). This allows us
to sample water quality on large bodies of water without worrying about losing connection and
data corruption. Another upside to Wi-Fi is the transfer rate. Depending on which 802.11 protocol
is used the bandwidth can vary from 11 Mbps (802.11b) to 600Mbps (802.11n). A downside of
using WLAN though is that it has fairly high power consumption. As you increase the distance
the data must travel the power consumption will also increase to get the data to the receiver.
Depending on the distance and obstacles in the area the power to transmit data can vary.
The last option we research is the ZigBee standard based off the IEEE 802.15.4 standard. ZigBee
is a great option for us because it is fairly easy to use and can create small personal area networks
(PANs) using very little power. A typical ZigBee standard module has a max range of 100 meters
which is not sufficient for our design. But an adoption of the ZigBee standard is XBee modules

17
which are the most popular form of point-to-point data transmission. These XBee modules keep
the same standard as ZigBee but improve on many factors like range and power consumption. The
XBee modules can transmit data from 100 meters to 4000 meters which is great for our design.
The XBee modules are also easy to setup for communication as the transmitter and receivers only
need to know the other modules serial number and PAN ID to transmit/receive data. A downside
the XBee modules though is the bandwidth and power consumption. The highest bandwidth it can
support is 250Kbps considerably lower compared to Bluetooth and Wi-Fi. For the power
consumption it can vary depending on which module we purchase but for our design we plan on
using a module that can transmit at least 1500 meters which requires about 215mA at 3.3V. Table
3.2.7.A shows all three wireless options and their technologies.
Properties Bluetooth WLAN (Wi-Fi) ZigBee (XBee)
Range(max) 100 meters 820 meters 1500 meters
Network Topology Ad-hoc, small
networks
Point to hub Ad-hoc, peer to peer,
or mesh
Power Consumption Low High Low
Frequency 2.4 GHz 2.4 / 5 GHz 2.4 GHz
Bandwidth Low (~2.1 Mbps) High (~11 Mbps;
dependent on which
802.11x protocol)
Low (250 Kbps)
Cost Cheap Expensive Expensive
Table 3.2.7.A Wireless Technology Comparison
3.2.8 Photovoltaic (PV) cells
Monocrystalline - Typically, the top layer of the cell has a slight negative charge and the rest of
the monocrystalline cell has a positive electrical charge. The cell is usually connected to a base
called the backplane, which is typically made of metal and is useful when physically reinforcing
the cell and providing electrical contact at the bottom. The cells are cut from a single silicon crystal
ingot. To make the ingot, silicon is purified, melted and crystallized. The ingot is then sliced into
thin wafers that are then cut to make individual cells. The cells are very fragile and must be
mounted in a rigid secure frame to protect them and prevent them from breaking. They are the
most efficient but the most expensive out of all different photovoltaic cells. Monocrystalline cells
have one solid color throughout the cell, usually black or blue. It’s important to note that
temperature does affect the voltage of each individual cell.
Polycrystalline - The cells are cut from a block of silicon that, unlike monocrystalline cells, have
a large number of crystals in the silicon block. Similar to the monocrystalline cells they are fragile
and need to be mounted to a rigid protective frame. Polycrystalline cells have a random pattern of
crystal borders instead of a solid color, like the monocrystalline cells.

18
Ribbon - The cells are manufactured by growing a ribbon from molten silicon instead of an ingot.
The ribbon silicon cells possess an anti-reflective coating that gives them a prismatic rainbow
appearance. All three types of referenced cells: monocrystalline, polycrystalline, and ribbon
possess a distinct crystal structure.
Amorphous - The cell is produced by placing several very thin layers of vaporized non-crystalline
silicon are placed on a wide surface. The surface that the silicon is deposited on is usually glass,
plastic, or metal. The thin layer of silicon is flexible, therefore if placed on a flexible surface such
as plastic it has the potential to be a flexible solar cell. Amorphous cells are the least expensive
and least efficient. The amorphous cells are considered least efficient because they possess less
than half efficiency of the amorphous, ribbon, and polycrystalline cells. One important thing to
note is that their power output decreases dramatically, about 15%, over the first few months of
initial exposure; however, after that period the power output stabilizes to a particular value. Most
specifications sheets indicate a power output that is achieved after the stabilization period. The
cells are typically made up in long rectangular sizes called strip cells. The strip cells connected in
series make up modules.
Connection of Cells - Most cells produce a voltage of about half a volt, independent of the size of
the surface area of the cell. However, the current does depend on the surface area of the cell: the
larger the cell the more current it will produce. The cells and their electrical components are sealed
between a top layer of glass or clear plastic and the lower level of plastic or/and metal. A set of
these laid out cells is usually attached by an outer frame that increases mechanical stability. Each
of these sealed cells is called a module. To provide adequate output voltage or current, the cells on
a panel are connected in different ways called an array. To increase the output voltage the cells are
connected in series and to increase the output current the cells are connected in parallel.
Reflectors and Concentrators - To increase the amount of solar energy that is hitting the solar
panel reflectors and/or concentrators are often used as an aid in addition to photovoltaic cells to
focus the sunlight to a specific area. Reflectors are a good way to save money because they are
much less expensive than photovoltaic cells. An important aspect to take into consideration when
using reflectors is that they can often block direct sunlight if not properly positioned. In addition
to that, reflectors work best when direct sunlight is being focused to the reflector, therefore cloudy
weather is a problem while using them. The physical dynamics of the reflectors themselves cause
a wind loading resistance that becomes problematic in a portable design. Concentrators contain
lenses or parabolic reflectors that focus light from a larger area, sunlight from the sun, to a smaller
area, the photovoltaic cell. Unlike reflectors, concentrators have are relatively expensive cost with
respect to the photovoltaic cells, and also increase the temperature of the modules which unless
cooled properly, delivers lower output voltage.
3.2.9 Rechargeable Battery
A battery is composed of many individual cells. A cell is considered the smallest unit in a battery
that is capable of generating voltage. The cells are composed of plates and insulators. The plates
have two opposite polarities, and are composed of the conductive grid and active material. A pair
of positive and negative polarity plates are held together, covering a separator, a type of insulator.
The electrolyte is a source of free electrons, which are waiting to be liberated by a chemical

19
reaction. A conductive charge escape path is created using grids and electrodes, which are part of
each other due to the conductive welding process.
Lead Acid Battery- In a lead acid battery the electrodes and grids are made from lead. A chemical
additive, usually calcium, is added to the battery to give it mechanical strength. The active material
is a special formulation that varies with every battery manufacturer, of lead oxides. The electrolyte
in a lead acid battery is sulfuric acid. The advantages of a lead acid battery include: chemistry has
been proven to work for over 140 years, they come in various sizes, available in sealed
maintenance free form, and are mass produced. In addition to that, they provide the best value of
power per kilowatt-hour, have the longest life cycle, and are the leading recycled battery. Low
maintenance, there is no memory and no electrolyte fill. A strong disadvantage of a lead acid
battery is that it is one of the heaviest of batteries. The battery accepts a very heavy initial charge
quickly, however once the battery hits about 70-80% charging capacity, the electricity being forced
in will eventually begin to decompose the battery. This process is called gassing and it can
permanently damage the cells. Also, it allows a limited a limited number of full discharge cycles.
Best suited for standby applications that require only occasional deep discharges.
Aluminum Air Fuel Cell - The fuel cell consists of an aluminum alloy anode which is placed in a
saline or alkaline electrolyte that then reacts with oxygen. The chemical reaction that produces
energy comes from the aluminum oxidizing, hence the name “Aluminum Air”. A standard
aluminum air battery cell consists of aluminum alloy plates and a cathode which is coupled by an
electrolyte. The oxygen is sparingly served to the cathode as it is required. When the aluminum
alloy is consumed during the electrochemical reaction, a new plate is then inserted and the
chemical reaction resumes. Aluminum Air fuel cell is considered to be 75 times more energy dense
than lithium ion cells, which makes it less heavy and more portable. Disadvantage: difficult to find
one for purchase online and the ones available are significantly more expensive.
Lithium Ion - A low maintenance battery that has no memory and no scheduled cycling is required
to prolong the battery’s life. This battery contains high energy density. The self-discharge is less
than half when compared to the nickel-cadmium. A disadvantage of the lithium ion battery is that
it is fragile and would require a protection circuit that would limit the voltage and current to
maintain safe operation. The maximum charge and discharge current is limited on most packs to
1C and 2C. It is more expensive than most rechargeable batteries. Also, there is no official
established recycling system for lithium ion batteries.
Nickel Cadmium - Uses nickel oxide and metallic cadmium as electrodes. Has been in commercial
use since the 1950’s. Nickel Cadmium battery is a low maintenance sealed battery that does not
expel any gasses and achieves full charge quickly. In addition to that it has a long lasting storage
life and is able to last over 500 charge/discharge cycles. It is able to operate for a large temperature
spectrum, -40 to 60 degrees Celsius, and maintains good performance after a long storage period.
Usually encased in a metal casing, which ensures ruggedness. It is about five times more expensive
than lead acid batteries. The nickel cadmium battery material is very toxic and the recycling system
for this battery is very limited. Also, if left inactive for some time it might be necessary to recharge
it before use because it is prone to self-discharge.
Nickel Metal Hydride - Higher energy density than the Nickel Cadmium, however its life cycle is
dramatically reduced. Heavy load and high temperature degrades the batteries life cycle. During

20
charge, Nickel Metal Hydride generates a significant amount of heat and requires longer charge
time than the Nickel Cadmium. Strong disadvantage: this battery requires full discharge to prevent
crystalline formation. Environmental benefit: contains no toxic materials. Often found in mobile
phones and laptops.
Lithium Polymer - Have three things that make them perfect for RC vehicles. They are lightweight
and can be made into almost any shape and size. They have a large capacity meaning that they
hold a lot of power in little packages and they have a very high discharge rate to power even the
most demanding motor. However, they are more expensive than other rechargeable batteries; they
don't last as long and can burst or catch fire if mistreated. Over the years, safety has been improved
for these batteries and they’ve become more resistant to overcharge and embody smaller
probability of electrolyte leakage.
Nickel Zinc - Similar to the Nickel Cadmium battery because both use an alkaline electrolyte and
a nickel electrode, however they differ in voltage. Some of the Nickel Zinc cells are available in
AA cells. Low cost with respect to other batteries. Provides higher output and a practical, -20 to
50 degrees Celsius, temperature range. Nickel Zinc battery does not contain any toxic materials
and has various recycling programs.
Sodium Sulfur - Contains a sodium anode and sulfur cathode. The sodium and sulfur must both
be a liquid and the electrolyte must be at a temperature (very hot between 400-700 degrees Celsius)
at which it can work as an ionic conductor. A common structure for the Sodium Sulfur cell is two
concentric tubes. The inner tube contains one electrode and the outer tube contains aluminum
which has the other electrode. It’s important to note that the cells are completely enclosed and do
not emit any gases. The cells must be at their operating temperatures otherwise the startup time of
the battery is severely extended. Sodium Sulfur battery has a limited shelf life that ranges from 2-
5 years. A common failure of this battery is due to electrical shorts which are caused by the
corrosion of the insulators. Once the insulators begin to corrode, the battery begins to self -
discharge.
3.2.10 Maximum Powerpoint Tracking
A photovoltaic cell produces maximum current when (ideally) there is no resistance in the circuit.
Therefore the maximum current is when its passing through a short circuit, and containing zero
voltage: this point is demonstrated in Figure 3.1 below. Maximum voltage, also called the open
circuit voltage, occurs when there is a break in the circuit. The open circuit is essentially infinitely
resistant and not allowing any current to pass through. The power output relationship is directly
dependent on the voltage and current, confirmed by equation P=IV. Hence, the maximum power
point is where the maximum current and maximum voltage point intersect. This point is called
Maximum Power Point on the graph in Figure 3.2.10.A below.

21
Figure 3.2.10.A How the MPPT finds the Maximum Power Point
3.2.11 Microcontrollers
The brains of W.A.R. are from the microcontrollers. Two microcontrollers are used, one of which
is responsible for the navigation/movement of W.A.R. and the other will receive/transmit the water
quality data. The criterion used in selecting the correct microcontroller was: low power
consumption, architecture, development, and ease of compatibility with the water sensors. The two
microcontrollers that are researched are shown below in Table 3.2.11.A with a general description
of each microcontroller.
Microcontroller MSP430G2553 ATmega328P
Speed 16 MHz 16 MHz
Data Bus 16-bit RISC 8-bit RISC
RAM 512B 2KB
Storage 16KB 32KB
Digital I/O Channels 8 14
Analog I/O Channels 8 6
Table 3.2.11.A MSP430 vs. ATmega328P
22
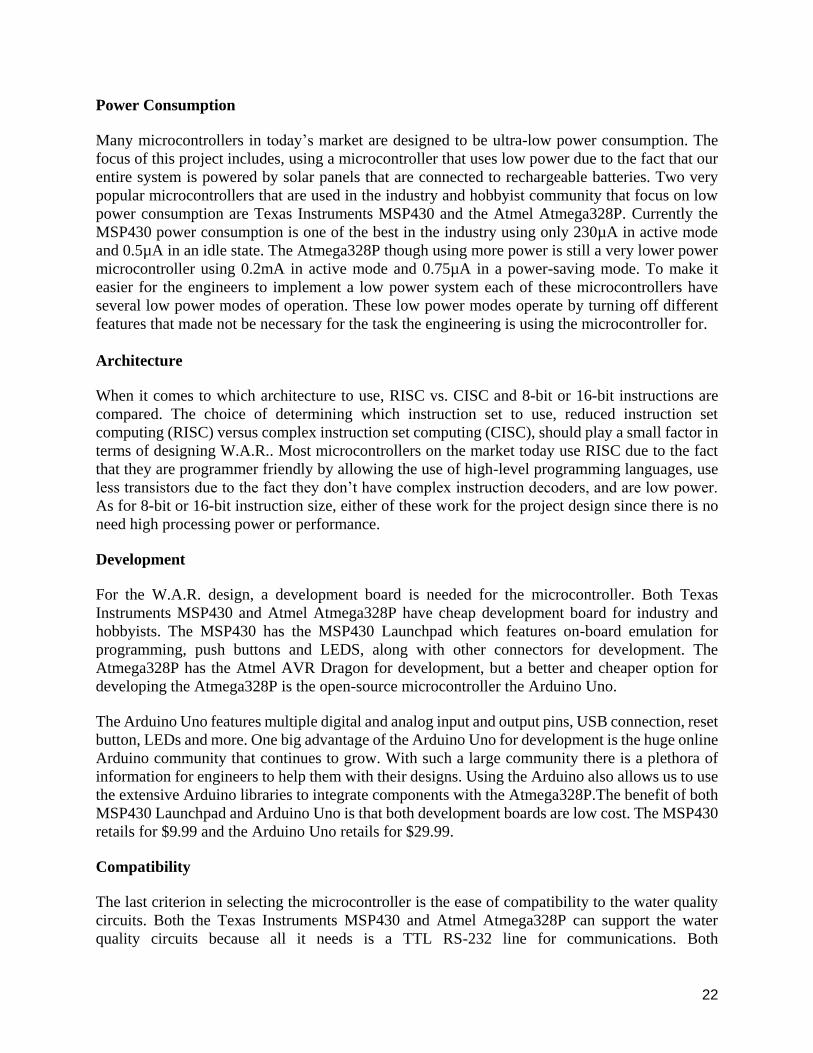
Power Consumption
Many microcontrollers in today’s market are designed to be ultra-low power consumption. The
focus of this project includes, using a microcontroller that uses low power due to the fact that our
entire system is powered by solar panels that are connected to rechargeable batteries. Two very
popular microcontrollers that are used in the industry and hobbyist community that focus on low
power consumption are Texas Instruments MSP430 and the Atmel Atmega328P. Currently the
MSP430 power consumption is one of the best in the industry using only 230µA in active mode
and 0.5µA in an idle state. The Atmega328P though using more power is still a very lower power
microcontroller using 0.2mA in active mode and 0.75µA in a power-saving mode. To make it
easier for the engineers to implement a low power system each of these microcontrollers have
several low power modes of operation. These low power modes operate by turning off different
features that made not be necessary for the task the engineering is using the microcontroller for.
Architecture
When it comes to which architecture to use, RISC vs. CISC and 8-bit or 16-bit instructions are
compared. The choice of determining which instruction set to use, reduced instruction set
computing (RISC) versus complex instruction set computing (CISC), should play a small factor in
terms of designing W.A.R.. Most microcontrollers on the market today use RISC due to the fact
that they are programmer friendly by allowing the use of high-level programming languages, use
less transistors due to the fact they don’t have complex instruction decoders, and are low power.
As for 8-bit or 16-bit instruction size, either of these work for the project design since there is no
need high processing power or performance.
Development
For the W.A.R. design, a development board is needed for the microcontroller. Both Texas
Instruments MSP430 and Atmel Atmega328P have cheap development board for industry and
hobbyists. The MSP430 has the MSP430 Launchpad which features on-board emulation for
programming, push buttons and LEDS, along with other connectors for development. The
Atmega328P has the Atmel AVR Dragon for development, but a better and cheaper option for
developing the Atmega328P is the open-source microcontroller the Arduino Uno.
The Arduino Uno features multiple digital and analog input and output pins, USB connection, reset
button, LEDs and more. One big advantage of the Arduino Uno for development is the huge online
Arduino community that continues to grow. With such a large community there is a plethora of
information for engineers to help them with their designs. Using the Arduino also allows us to use
the extensive Arduino libraries to integrate components with the Atmega328P.The benefit of both
MSP430 Launchpad and Arduino Uno is that both development boards are low cost. The MSP430
retails for $9.99 and the Arduino Uno retails for $29.99.
Compatibility
The last criterion in selecting the microcontroller is the ease of compatibility to the water quality
circuits. Both the Texas Instruments MSP430 and Atmel Atmega328P can support the water
quality circuits because all it needs is a TTL RS-232 line for communications. Both

23
microcontrollers have one UART line which is sufficient for our design as we will be using a
multiplexer to connect each water quality circuit. An advantage with the Atmega328P though is
that it is used on the Arduino Uno which has direct support from the manufacturer of the water
quality sensor circuits due to the large hobbyist community supporting the Arduino.
3.2.12 Autonomous Motor Control
The W.A.R. moves autonomously after the user has inputted a GPS coordinate or series of GPS
coordinates for the robot to follow. These coordinates are transmitted wirelessly via a method to
be further discussed. The navigation microcontroller then turns on the motor and turns the rudder
to the appropriate position. The navigation microcontroller also regularly receives the GPS latitude
and longitude coordinates from the GPS receiver that is on the boat. It then compares the two
coordinates and continues to move the boat until the two coordinates match.
In order to make the W.A.R. move an RC servo is implemented into the design. An RC servo is
used to convert an electrical signal into polar or linear movement. The vast majority of RC servos
are composed with the same blocks. The controller circuit: This is the "brain" of the Servo. This
circuit is responsible to read the user's input signal and translate it into a motor revolution in such
a way, that the drive shaft is rotated to the desired position. The feedback potentiometer: the shaft
of the potentiometer is attached to the drive shaft off the servo. When the drive shaft rotates, so
does the potentiometer. In that way, each and every rotation angle of the drive shaft, corresponds
to a different resistance of the potentiometer. By reading the potentiometers' resistance, the
controller is able to know the exact angle of the drive shaft of the servo. The motor: this is usually
a small high speed DC motor controlled by a H-bridge circuit attached to the servos' controller.
The gearbox: the gearbox will drive the motor's revolution to the drive shaft. Also, the rpm will
be significantly reduced and the torque will be increased. Torque is one of the main characteristics
of RC servos. The drive shaft: when all of the above operate in perfect harmony, the drive shaft is
rotated with accuracy to the user's requested angle. Below is a block diagram of a standard RC
servo.
Figure 3.2.12.A - Block Diagram of RC Servo
However, some modifications that have to be made in order for the servo to work with the
microcontroller and not a remote. All servos come with three wires: A ground which is usually
brown or black, red which is for power and is typically between 4.8V and 6V, and an
orange/white/yellow which is the signal wire and typically between 3V to 5V. While the red and
black wires provide power for the servo, the signal wire is used to command the servo. The idea
is send an ordinary logic square wave at a specific wavelength and the servo gets a particular angle.
To replicate what the RC receiver does, the microcontroller brings high a digital port, wait between

24
1 to 2 milliseconds then brings low the same digital port. This cycle should happen about every 20
milliseconds.
The W.A.R. is not required to move very fast as it is weighed down by the PV cells, batteries and
other electronics that will be placed on it. However, it still has to be able to move and not be pushed
aside by any disruptions in the water. There are many RC motors that satisfy this need.
However, before the motor can be selected, there are some terms that need to be defined,
particularly the different types of motors, and the relevant units:
540 motors - are the most common motor size for 1/12 and 1/10- scale electric vehicles.
550 motors - are a slightly longer version of the 540 motor which is capable of delivering
more torque and power without suffering from power loss.
Brushed motors - utilize brushes rubbing against a commutator to transfer electrical
current to create rotation
Brushless motors - utilize a permanent magnet on the rotor and a series of coils to generate
rotation. Brushless motor are more efficient than brushed motors and have no components
can be worn down.
Closed end bell motors - are brushed motors that are not designed to be readily serviced.
They tend to have shorter life spans compared to open end bell motors due to the fact that
they commutator and brushes cannot be easily cleaned or replaced.
Hand wound modified motors - feature an armature that has the windings wound around
the stack by hand. This provides a much tighter, more consistent and more efficient
armature than machine wining and provides better overall performance.
To select the motor best suited for a hull it is important to know the hull size and amount of cells
planned to be used. Size of hull determines the size of motor needed to push the weight. Cell count
determines the wind (Kv) of motor needed. Hulls from 20”/55cm – 34”/86cm typically will use a
540 size motor 36mm Diameter by 50-75mm length Hulls from 34”/86cm – 40”/102cm + typically
use a motor with a diameter around or over 42mm and a length of over 65mm. To determine the
best suited Kv for a motor, the cell count planned to be used is needed. Following this chart
provides a wide-ranging base for proper Kv selection. Kv is the rating of performance for brushless
motors. The higher the Kv rating of a motor the faster it is. Kv refers to the number of RPM a
motor produces for each volt of power input to it. For example, a 1000 Kv motor produces roughly
6500 rpm at 6.5 volts.

25
LiPo Cell Kv Range
2 cell LiPo 3000-5500Kv
3 cell LiPo 2000-3500kv
4 cell LiPo 1350-2700Kv
6 cell LiPo 900-1800Kv
8 cell LiPo 675-1350Kv
10 cell LiPo 550-1100Kv
12 cell LiPo 450-900Kv
Table 3.2.12.A - Shows Optimal LiPo Cells for a Specific Kv Rating
3.2.13 Robot Platform
For this project, a platform is needed to house all the components of the robot. The platform must
have room for all components while still being able to float. The platform shall be waterproof or
made waterproof through outside means. This biggest difficulty in choosing a robot platform will
be ensuring that platform will be able to stay afloat when all the components are integrated such
as the power supply, PV cells and microcontrollers. Due to time and other constraints, it was
decided that a pre-built platform would be used for this project. There are plenty of hobby
stores/RC boat enthusiasts who would be able to provide an adequate platform can be obtained.
A three foot long RC boat frame is perfect for this project. RC boats of this length are generally
around $50 to $80 dollar depending on if they are used or not and if a motor/rudder is included.
Ideally the boat frame that is ultimately chosen is waterproof or easily made waterproof. While the
sensors and circuitry should not fail when near water or exposed to small amount of water, the less
water in the boat the better. Also, ideally the boat frame requires as few modifications as possible
for this project. In other words, the design of the frame is as simple and efficient as possible.
The below boat hull is the chosen platform for this project. This hull is the Delta Force 29
Fiberglass hull. It is made of high quality fiberglass, measures 29.5in by 9.5in and has plenty of
space inside for all of the electric components and a flat top for placement of the solar panel. It
was purchased from Offshore Electric for $120 including shipping.

26
Figure 3.2.13.A Shows the Boat Platform that was chosen for this project
3.2.15 74HCT4051 Serial Mux/Demux
Two 74HCT4051 multiplexer are used to connect the water quality sensors and XBee Pro to the
microcontroller. One HCT4051 is used to connect all the RX pins to the microcontroller and the
other HCT4051 is used to connect the TX pins. This configuration allows the microcontroller to
communicate in both directions to all the water quality circuits and the XBee Pro. A more detailed
schematic of this connection is covered in the Project Hardware and Software Design details
portion of the report. Below in Figure 3.2.15.A shows the pin layout of the HCT4051 and how the
connection is made.
Figure 3.2.15.A HCT4051 Pin Layout and Logic Symbol

27
3.2.16 Power Supply
AC-DC Power Converter
Most power supplies are designed to convert from high AC voltages to low DC voltages, which
are generally suitable for electronic devices to use. To build an AC to DC converter, its process is
broken down into four different parts, as shown in Figure 3.2.16.A below.
Figure 3.2.16.A Power supply that converts AC to DC
The first block labeled “Transformer” is responsible for either taking the high solar generated
voltage and stepping it down to a lower AC voltage, or taking a low solar generated voltage and
stepping it up to a higher AC voltage, both with very little power loss.
The second block labeled “Rectifier” is responsible for converting the AC to DC. There are several
ways to construct a rectifier. First way involves building a bridge rectifier. The second way
involves only two diodes (as opposed to four in the previous configuration). However, this
configuration requires a center tap transformer which reduces power efficiency. Since diodes are
relatively cheap, it’s more practical and power efficient to use the bridge rectifier configuration.
The following block is called “Smoothing” which acts like a reservoir that is accessed when the
supplied DC voltage from the rectifier is falling. The smoothing effect is achieved by connecting
an electrolytic capacitor to the output of the rectifier. The last block is called the “Regulator” which
represents the voltage regulator. The voltage regulator is responsible for maintaining a constant
voltage level. An adjustable voltage regulator typically ranges from 1.2 to 37 DC volts. An
important aspect to consider with the voltage regulator is whether or not to use the heat sink. If
there is load to the regulators, then it draws a load current that flows through the regulator therefore
heating it up. The extent to which the load current heats up the voltage regulator determines
whether or not the heat sink option on the regulator is used.
DC-DC converter
A DC to DC power converter regulates the voltage prior to charging the battery, and it is also
capable of being a step up or step down converter. A step up converter increases the input voltage
and generates a higher output, whereas the step down converter has the input voltage decreased
therefore generating a lower output, relative to the input. The W.A.R. design contains one DC to
DC step down voltage regulator. The buck converter converts the voltage provided by the two
batteries connected in series, of 7.4, down to 5 volts which is necessary to power the components
on the main PCB.

28
The considered DC to DC converters for the first system are compared in the Table 3.2.16.A below.
Part Model LF50CV L4909-ND
Manufacturer STMicroelectronics STMicroelectronics
Input Up to 16V Up to 40V
Output Voltage 5V 5-12V
Output Current 500mA 1.2A
Dropout Voltage 0.4 – 0.6V N/A
Regulator Topology Fixed Adjustable
Operating
Temperature
-40°C ~ 125°C 0°C ~ 70°C
Number of Pins 3 pin 15 pins
Table 3.2.16.A DC-DC Buck Converter Comparison
Both of the compared step down voltage regulators satisfy the output voltage requirement of 5
volts. However there are several comparisons that have to be taken into account for the specific
application of this project. First, the output current that the microcontrollers on the PCB need to
operate is approximately 0.2A therefore anything exceeding that excessively will potentially burn
the microcontrollers. Both of the regulators are able to accept the input of 7.4 volts. As for the
output, the two different regulators have unique topologies. The LF50CV has a fixed regulator
topology, which means that it will output a specific value of 5 volts, and no other value. The L4909
regulator has a fixed topology that could potentially provide an output voltage of between 5-12
volts, depending on the specific circuit configuration of that chip. The operating temperature for
each regulator varies as well. The LF50CV offers a wide range of temperatures, up to 125 °C. The
L4909, however, has a limited temperature going up to 70°C. The limited temperature in the
second regulator could potentially be a factor in choosing this part since temperature is a factor
that has to be paid extra attention to, since the project will be in outside, hot environment.
3.2.17 Charge Controller
A charge controller is essential especially if the battery is charged with solar energy. If the battery
continues to charge after it is already full, it can potentially become damaged harming it’s
performance. A charge controller prevents the battery from being overcharged, as well as not
allowing any current to drain out of the battery while it’s not being charged. It’s important to make
sure that the input current to the charge controller does not exceed what the controller can handle.
A charge controller can either be built from scratch or bought ready to use. To build a charge
controller from scratch a printed circuit board would need to be built or ordered through a
manufacturer.

29
The charging voltage of a battery is temperature dependent. Hence, the colder the temperature the
higher the charging voltage needs to be. If the charge controller was built from scratch a
temperature sensor would need to install or the user could manually adjust the controllers
activation point. If the battery is mostly warm and well sheltered, small temperature changes won’t
affect the charging voltage.
Already manufactured lithium ion battery charge controllers are compared in Table 3.2.17.A
below.
Part Model MCP73871 MCP73833
Manufacturer Microchip Microchip
Input Voltage 4.5 - 6V 3.75 – 6V
Maximum Input Current 1.8A 1.0A
Output Current Programmable: 50mA -1A Programmable: <1.2A
Operating Temperature .-65°C to +150°C -65°C to +150°C
Battery Drain Current 0.1μA 5μA
Package 20 Lead QFN DFN-10
MSOP-10
Table 3.2.17.A Compares the MCP73871 and MCP73833 Charge Controllers
In addition to having a separate charge controller chip like the ones mentioned previously,
MCP73871 and MCP73833, another option is to purchase a battery with the charge controller
already installed. The Tenergy Lithium Ion battery has a PCB charge controller that monitors the
batteries’ charge and prevents it from being overcharged. The attached to battery charge controller
is not dependable enough to be used alone (without a general charge controller), however it is still
necessary in order to keep all of the electronics safe and make sure that the lithium ion battery is
not disrupted by any minor electrical mishaps.
If the lithium ion battery is connected to directly to the solar panel and the electronics, that can be
a potential hazard. The solar panel output is not always constant, it varies with the weather
conditions, and therefore only relying on a small capacity battery protection is not a good option.
The fragile chemistry of the lithium ion battery is extremely sensitive and should monitored with
extreme caution to prevent any electrical and fire hazards. The battery and the integrated PCB
design of the Tenergy battery is displayed in the Figure 3.2.17.A below.

30
Figure 3.2.17.A Tenergy 30006 Lithium Ion Battery with a Charge Controller
The Tenergy battery is not designed to be in an enclosed battery pack. However, they are able to
be connected in series or parallel with an external battery pack. The battery specifications are
displayed in the Table 3.2.17.B below.
Parameter Value
Capacity Nominal: 2600mAh
Minimum 2450mAh
Dimensions Diameter 18+/-0.2mm
Height 67+/- 0.2mm
Weight 46g
Internal Impedance 180mΩ
Cycle Life More than 500 cycles
Charge Characteristics Current = 0.5C
Voltage = 4.2V
End Current = 0.01mA
Discharge Characteristics Current = 0.5C
End Voltage = 3.0V
Table 3.2.17.B Tenergy Lithium Ion Battery Specifications

31
If the Tenergy 30006 3.7V Lithium Ion battery is to be chosen for the W.A.R. design it would be
able to power the XBee Pro communication system. Also, another Tenergy battery would be able
power the motors, sensors, and the microcontroller on the second platform for at least 5 hours. The
power estimations are calculated using all ideal conditions, when the design is tested in the actual
operating conditions, slightly different results are expected. The battery is exposed to high
temperatures; therefore some loss in battery efficiency is expected.
The internal PCB protection protects the battery for under voltage at 2.5V and over voltage at
4.25V, more specifications about the PCB are displayed in the Table 3.2.17.3 below.
Parameter Minimum Typical Maximum Unit
Operation
Voltage
1.5 N/A 10 V
Excess Charge Detection
Voltage
4.2 4.25 4.3 V
Excess Charge Delay Time 61 77 93 mS
Excess Discharge Detection
Voltage
2.437 2.5 2.563 V
Excess Discharge Delay Time 7 10 13 mS
Consuming Current N/A 3 6 μA
Standby Current N/A 0.3 0.6 μA
Table 3.2.17.C The Internal Charge Controller PCB Specifications
3.2.18 Capacitors
Tantalum Capacitors - Composed of a tantalum center section which is covered by tantalum
peroxide. Comparing to other capacitors, these are the smallest, lightest, and the most stable. They
have a relatively high volumetric efficiency, that is (capacitance*maximum_voltage)/volume.
Tantalum capacitors have incredible frequency characteristics, for example they have ten times
better equivalent series resistance than an aluminum electrolytic capacitor. They possess very low
electrical leakage. In addition to that, these capacitors are very reliable while being used for long
periods of time and do not lose their performance efficiency over time. Lastly, tantalum capacitors
have a very vast operating temperature range which is between -55 to 125 degrees Centigrade.
Ceramic Capacitors - Ceramic capacitors contain no polarity, therefore minimizing circuit design
errors. They also work well in areas where very low, less than 1 microfarad capacitance is needed,
however when the capacitance above that is needed tantalum capacitors work best. Ceramic

32
capacitors are able to pick up mechanical vibrations, therefore interfering with the signal and
sometimes even producing a voltage. They are not constructed as a coil therefore they contain a
low inductance and perform well in high frequency applications.
Aluminum Capacitors – The capacitor is composed of two aluminum foil strips, with a piece of
paper that is soaked in electrolyte solution between them. They are one of the largest capacitors
on the market, in terms of storage. Aluminum capacitors are able to work in voltage ranges from
10V to 100V. These capacitors have relatively high leakage rates which makes them undesirable
for high frequency AC coupling applications. In addition to that, aluminum capacitors have a high
tolerance range +/- 20% which makes them unreliable in applications that require precise accuracy.
3.2.19 Compass
After the GPS module gets a lock on the vehicle’s coordinates, the vehicle needs to know which
way it is facing so when the needed heading is calculated the vehicle can easily turn to face the
waypoint and steer relatively straight there. While the GPS module does give a heading value, this
only occurs when the vehicle is moving forward and it isn’t very accurate when the vehicle is
turning, as it is not moving forward very much at all. If a good heading is not obtained, the vehicle
does not know how much to turn.
The compass can be used to obtain a heading from 0-360 degrees. From this heading, the needed
heading between the vehicle’s location and the next waypoint can be calculated. Since the vehicle
that is being used is a boat, a compass with tilt compensation is needed to account for wind or
small waves. A compass without tilt compensation gives incorrect readings. The compass needs
to be mounted away from the other electronics so that neither will interfere with the other’s
operations. A compass module comes with a ground pin, a VCC pin, a SCL pin, and a SDA pin.
These are the pins that are used for the I2C communications in the code.
3.2.20 Electronic Speed Control
An electronic speed control (ESC) is a circuit with the purpose to vary an electric motor’s speed
and its direction. It can also act as a dynamic brake. ESC systems for brushed motors are very
different from brushless ESC systems and therefore are not compatible. This must be taken into
considerations when purchasing the motor and the ESC. ESC is normally rated according to
maximum current, for example 25 Amperes.
Higher ratings usually imply a larger and heavier ESC which is a factor when calculating the mass
of our boat. ESC’s support nickel metal hydride, lithium ion polymer and lithium iron phosphate
batteries. ESCs designed for boats are waterproof. This means the motor and ESC must be cooled
effectively to prevent burn outs in a matter of minutes. This can be achieved by circulating water
run by the motor by negative propeller vacuum near the drive shaft input. Like cars, boat ESCs
can be used to brake and go in reverse.

33
3.2.21 Power System Research SD I
The following Power System Research SD I section is created to help students in the future who
are conducting research on power system management and provide them with extra tools and
information about our conducted power system research.
DC-DC converter
A DC to DC power converter regulates the voltage prior to charging the battery, and it is also
capable of being a step up or step down converter. A step up converter increases the input voltage
and generates a higher output, whereas the step down converter has the input voltage decreased
therefore generating a lower output, relative to the input.
During the initial research of the project two DC to DC converters were researched in depth. They
are compared in the Table 3.2.21.A below.
Part Model LM4510 LTC3525
Manufacturer Texas Instruments Linear Technology
Input 2.7V to 5.5V
● 18V@80mA from 3.2V
● 5V@280mA from 3.2V
-0.3V to 6V
● 3V@65mA from 1V
● 3.3V@60mA from 1V
● 3.3V@140mA from 1.8V
● 5V@175mA from 3V
Output 5V and 18V Fixed Voltages: 3V, 3.3V, or 5V
Shutdown Current 0.002μA Less than 1μA
Peak Efficiency 85% 95%
Layout 10-Pin 3mm 6-Pin 1mm
Table 3.2.21.A DC-DC Power Converter Comparison
The two DC to DC step up converters that best suit the initial W.A.R. project design are the
LM4510 and LTC3525 parts, which are compared in the Table 3.2.21.A above. Both of the step
up converters convert the desired voltage input to 5 volts, which is the exact amount needed to
power the two PCBs. The LTC3525, however, has a couple of additional input ranges which makes
the solar panel design (which generates the DC power) more flexible. LM4510 has one of the
lowest shut down currents among many step up converters, including the LTC3525, which is not
essential but overall beneficial for the W.A.R. design.
The high peak efficiency percentage and smaller dimension of the Linear Technology LTC3525
step up converter makes it more favorable than the Texas Instrument LM4510 step up converter.
However, overall circuit protection is extremely important and the LM4510 offers a true shutdown
function that ensures input and output isolation and a thermal shutdown protection which would
shut down the device if it exceeded 302 degrees Fahrenheit.

34
The DC to DC step up converters are now considered for the second system, which power the
XBee Pro Communication System. The selected by TI WEBENCH software step up voltage
regulators are plotted on the Efficiency vs. Size plot in Figure 3.2.21.A below.
Figure 3.2.21.A WEBENCH Plot Demonstrating the Applicable Step Up Converters
Each of the step up converters are compared in the Table 3.2.21.B below.
Part Model LM3478 LM25118
Manufacturer Texas Instruments Texas Instruments
Efficiency 75% 88%
BOM Cost $2.36 $3.12
BOM Size for
Application
354mm^2 366mm^2
I-out Max 20A 20A
Table 3.2.21.B DC-DC Power Converter Further Comparison
The LM3478 chip connections are displayed in Figure 3.2.21.B below. While conducting testing
the Vout and Iout connections are analyzed.

35
Figure 3.2.21.B LM3478 Step Up Voltage Regulator Schematic
The efficiency chart for the LM3478 is displayed in Figure 3.2.21.C below. For powering the XBee
Pro, the needed voltage is 3.3 volts at 0.215A. Looking at the chart it’s clear that as the current
approaches the desired amount the efficiency percentage drops. The condition for premium
efficiency percentage of roughly 78% and for the input voltage of 3.0, or 3.3V in our case, circuit
configuration is to have a current close to 0.1A. However, as the current approaches 0.2A the
efficiency is still a desirable amount of 75%.
Figure 3.2.21.C LM3478 Efficiency Plot
Both of the components have available WEBENCH tools such as: Circuit Calculator, Electrical
Simulation, and Schematic Export, which is useful while implementing the testing protocol and
troubleshooting. When comparing the LM3478 component with the LM25118, it is apparent that

36
the higher the desired efficiency percentage the higher the cost of the component, hence the $0.76
difference for 13% efficiency. However, after reviewing the specification sheets for both of them
its apparent that the LM25118 component is much more complex in design therefore the size for
all of the additional materials needed to create a step up voltage regulator is slightly larger (in
area). To be more specific, the difference in BOM size for the step up voltage regulator application
is 12mm2.
Charge Controller
A charge controller is essential especially if the battery is charged with solar energy. If the battery
continues to charge after it is already full, it can potentially become damaged harming it’s
performance. A charge controller prevents the battery from being overcharged, as well as not
allowing any current to drain out of the battery while it’s not being charged. It’s important to make
sure that the input current to the charge controller does not exceed what the controller can handle.
A charge controller can either be built from scratch or bought ready to use. To build a charge
controller from scratch a printed circuit board would need to be built or ordered through a
manufacturer.
The charging voltage of a battery is temperature dependent. Hence, the colder the temperature the
higher the charging voltage needs to be. If the charge controller was built from scratch a
temperature sensor would need to install or the user could manually adjust the controllers
activation point. If the battery is mostly warm and well sheltered, small temperature changes won’t
affect the charging voltage. The overall potential cost to build a charge controller from scratch is
“less than $20.”
Already manufactured lithium ion battery charge controllers are compared in Table 3.2.21.C
below.
Part Model LM3420 LTC4050
Manufacturer Texas Instruments Linear Technology
Input 4.2V 4.5V - 10V
Current Detection Output N/A C/10
Operating Temperature -40 to 257 degrees Fahrenheit -40 to 185 degrees Fahrenheit
Battery Drain Current 0.1μA 5μA
Layout 5-Pin
3.2 x 3.2mm
10-Pin
3.0 x 3.0mm
Table 3.2.21.C Compares the LM3420 and LTC4040 Charge Controllers
The Texas Instruments LM3420 lithium ion battery charge controller comes in three different fixed
voltage charging options: 4.2, 8.2, 12.6, 16.8V. The absolute maximum input voltage the TI charge
controller is able to accept is 20V, and the maximum output current it is able to generate is 20mA.

37
Its operating temperature ranges from -40 to 257 degrees Fahrenheit, which certainly can handle
some of the hotter outdoor temperatures that W.A.R. would be placed in. However, when all of
the electronics would be placed in a small tight space, heat could potentially become an issue,
therefore testing and measuring the maximum internal temperature of all of the electronics turned
on is essential. The charge controller needs to be a very compact size since all of the electronics
will be stored inside the boat structure; the LM3420 is 3.2mm x 3.2mm which is certainly compact
enough to fit inside the structure.
The Linear Technology LTC4050 lithium ion battery charge controller is able to power a 4.1V and
4.2V battery. The charge controller voltage input is between 4.5 and 10V, the absolute maximum
the controller can handle is a 12V input supply voltage. If the supply voltage is removed the charge
controller automatically enters a low quiescent current sleep mode, which drops the battery drain
current to 5μA. It has an internal comparator that detects the near-end-charge condition, which is
C/10, while a programmable timer sets the total charge time. Once the battery is discharged, or a
discharged battery is connected, the charge controller begins a new charge cycle. Also, if the
battery cell voltage drops below 3.88 volts, a new charge cycle begins. The operating temperature
for this charge controller varies from -40 to 185 degrees Fahrenheit. The dimensions for the
controller are 3.0mm x 3.0mm. It contains a ten pin connection.
3.3 Methods and Architecture
This section describes a high level design of the method and architecture of our system. It shows
how important parts of each subsystem are connected and help us determine final choices of each
subsystem.
3.3.1 Software
Microcontroller Programming
The main method of programming on Texas Instruments MSP430 is Code Composer Studio (CCS)
integrated development environment (IDE). It is based off of the open source software framework
Eclipse. The IDE includes a set of tools used to develop and debug embedded applications. CCS
includes compilers for all TI processors, debuggers, simulators, and many more.
For the Atmel Atmega328P we have two options for programming the microcontroller. We can
use the Arduino IDE or Atmel Studios. Both environments have built-in support for all Atmel
microcontrollers and allow the user to program in ANSI-C code.
The Arduino IDE is a very simple interface which holds the text editor, text console, message area,
and menu bar. It is an extremely easy to use IDE since the Arduino platform is geared towards
beginner hobbyist with no technical background. To code in the Arduino IDE, the programmer
creates “sketches” in the text editor. The Arduino programs are written in C or C++ and the IDE
comes with a software library called “Wiring” which is an open source prototyping programming
language.

38
An alternative IDE used to program the Atmega328P is Atmel Studios. Atmel Studios is free of
charge from Atmel and used to program all their Atmel ARM Cortex M chips and Atmel AVR
microcontrollers. Atmel Studios has many built in open source libraries and with over 1600
examples projects to help the engineer. Atmel Studios is based off of Microsoft Visual Studios so
the interface is similar for anyone who has used the software before.
Simulation Software
To properly test and predict the electronic components that are used for the W.A.R. design a couple
of different simulation software are used. MultiSim is used to simulate the circuit configuration.
If any Linear Technology electronic components are used in the design, then LTSpice software is
used to simulate the components’ behavior and output characteristics. If a component from Texas
Instruments is used, then the software WEBENCH is used to use to simulate its behavior as well
as several additional components and how their values would affect the overall circuit
configuration. While looking for and selecting the various electronic power design components
for the project, the WEBENCH software is able to provide a several parameter comparison to
accurately select the component.
3.3.2 Hardware
Solar Panel Connections
A typical solar panel has several modules enclosed in it, each module powers one battery. In the
W.A.R. design, there are three modules each of which powers one battery. Each module has 10
solar cells that are connected in series, which produce an output voltage of 5V. The solar cells are
rated to produce 0.3A in ideal conditions. However, when they are connected in series that current
is reduced due to the increased impedance. If more current needs to be generated, the cells or the
power array can be connected in parallel. Each cell provides roughly about 0.5 volt in direct
sunlight. A standard battery that is often used is a 3.7 volt battery, which usually needs about 4
volts to charge. However, due to the fluctuating weather conditions and inefficiencies in the typical
charge cycle it’s always best to generate a higher voltage so that the input going into the battery is
always enough.
To make sure that the battery is still safe and operating with a solar input of 5 volts, it’s vital to
connect it to a charge controller that will monitor the input voltage and current and make sure that
it’s not exceeding the advised conditions. Assuming ideal conditions for the solar panel, the total
power being generated from the sun can be calculated the following way: 1 module power =
(0.3A)*(0.5V*10 cells) = 1.5watts, total power = 3*module = 4.5 watts. Therefore the entire solar
panel, with three separate modules, outputs the power of 4.5watts.
Most of the solar cells are extremely fragile and some of them are paper thin. A protective frame
is essential in preserving the solar cells. The frame needs to have a rigid bottom, to make sure that
the connected solar cells do not move out of place and do not crack. Also, a glass or plastic top
layer is placed, protecting the solar panel surface against debris. A group of PV cells connected in
parallel or series is referred to as a module.

39
A potential challenge can arise while trying to enclose the properly connected PV cells. Since the
solar cells are extremely fragile, and would be extremely sensitive to water damage, extra time and
emphasis is devoted to making the module properly sealed.
Lithium Ion Battery
Temperature is a vital factor to take into account when charging a lithium ion battery. Table 3.3.2.A
shows the detrimental effects of having the battery be in high temperatures. A battery located in
an environment above 86 degrees Fahrenheit, is considered to be at an elevated temperature.
According to Battery University, keeping a battery at full charge in high heat is more stressful than
cycling.
Table 3.3.2.A Shows How Temperature Affect the Charging Capacity of a Li-ion Battery
To accurately predict the power lifetime the battery can last and needs to charge, to the desired
level, its charge and discharge current need to be calculated precisely. In addition to that, the
capacity of the battery must be known. The current, charge or discharge, is defined by the
following equation:
I = M*Cn
Where “I” is the charge or discharge current, “M” is the multiple of “C”, “C” is the value of rated
capacity, and “n” is the time in hours at which “C” is declared. It’s important to note that all of the
values in this equation are the ideal values, which are rarely achieved due to the inefficiencies in
the discharge cycles.
To properly charge a lithium ion battery, the user must take into account the four different types
of charge stages: trickle and constant current charge, constant voltage, and charge termination.
Charging above 1C does not increase the overall charge time for the batter, and should be avoided
because it can permanently damage the battery. The different stages of recommended charging for
a lithium ion battery are displayed in the Table 3.3.2.B
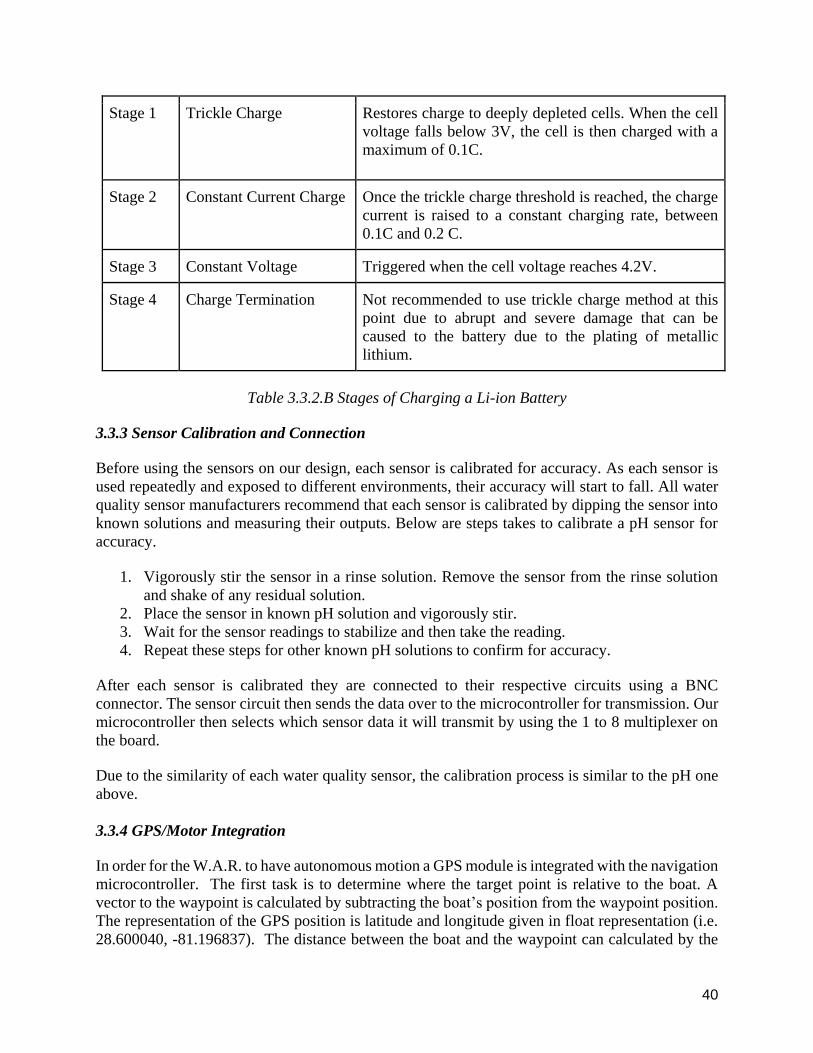
40
Stage 1 Trickle Charge Restores charge to deeply depleted cells. When the cell
voltage falls below 3V, the cell is then charged with a
maximum of 0.1C.
Stage 2 Constant Current Charge Once the trickle charge threshold is reached, the charge
current is raised to a constant charging rate, between
0.1C and 0.2 C.
Stage 3 Constant Voltage Triggered when the cell voltage reaches 4.2V.
Stage 4 Charge Termination Not recommended to use trickle charge method at this
point due to abrupt and severe damage that can be
caused to the battery due to the plating of metallic
lithium.
Table 3.3.2.B Stages of Charging a Li-ion Battery
3.3.3 Sensor Calibration and Connection
Before using the sensors on our design, each sensor is calibrated for accuracy. As each sensor is
used repeatedly and exposed to different environments, their accuracy will start to fall. All water
quality sensor manufacturers recommend that each sensor is calibrated by dipping the sensor into
known solutions and measuring their outputs. Below are steps takes to calibrate a pH sensor for
accuracy.
1. Vigorously stir the sensor in a rinse solution. Remove the sensor from the rinse solution
and shake of any residual solution.
2. Place the sensor in known pH solution and vigorously stir.
3. Wait for the sensor readings to stabilize and then take the reading.
4. Repeat these steps for other known pH solutions to confirm for accuracy.
After each sensor is calibrated they are connected to their respective circuits using a BNC
connector. The sensor circuit then sends the data over to the microcontroller for transmission. Our
microcontroller then selects which sensor data it will transmit by using the 1 to 8 multiplexer on
the board.
Due to the similarity of each water quality sensor, the calibration process is similar to the pH one
above.
3.3.4 GPS/Motor Integration
In order for the W.A.R. to have autonomous motion a GPS module is integrated with the navigation
microcontroller. The first task is to determine where the target point is relative to the boat. A
vector to the waypoint is calculated by subtracting the boat’s position from the waypoint position.
The representation of the GPS position is latitude and longitude given in float representation (i.e.
28.600040, -81.196837). The distance between the boat and the waypoint can calculated by the

41
Haversine Formula, which gives the shortest distance between two points on a sphere. If the
distance is not very large the distance formula can be used instead. However, for expandability
purposes, the Haversine Formula was used in this project.
The needed bearing the boat needs to travel from its current position to reach the waypoint can be
found using the atan2 function. The atan2 function uses two inputs and returns the calculated angle
as well as the correct quadrant. The needed bearing can then be compared to the current course
that is obtained from either a GPS or compass. Finally, the rudder can be moved to change the
course of the boat.
The GPS module has several pins that must be connected to the navigation microcontroller. A
description of the pins and their locations are shown below in Figure 3.3.4.A.
Figure 3.3.4.A - Pin Assignment for EM-406A
Pin Description:
VIN (DC power input) - This is the main Dc supply which should be about 4.5V to 6.5V DC
input power.
TX - This is the main transmitting channel for outputting navigation and measurement of data to
the user written software.
RX - This is the main receiving channel for receiving software commands to the engine board
from the user written software.
GND - This provides the ground for the engine board.
IPPS - This pin provides one pulse per second output from the engine board that is synchronized
to GPS time.
3.3.5 Protection against Electrostatic Discharge
Making sure to follow proper procedures while handling sensitive power modules and integrated
circuits is essential. Electrostatic discharge can cause temporary damage by reducing its

42
performance or even permanent failure in a power module or integrated circuit. Permanent damage
can be done by ESD destroying a semiconductor junction or a connected metallization. Temporary
or slight damage might not be visible at first, however the sensitivity of the circuit could be
drastically affected which could cause eventual failure. Especially since electronic components are
progressively decreasing in size, the ESD damage is more frequent than ever. ESD is the transfer
of static energy between two objects at different potentials. MOSFET and IGBT power modules
are among the components that are sensitive to ESD because the thickness of the gate isolation
only amounts to ten nanometers.
The extent of how sensitive a component is depends on the input capacitance value. Therefore, the
lower the capacitance is the higher the ESD risk. Also, humidity has an effect on ESD transfer:
with higher humidity the component becomes less susceptible to ESD damage.
ESD most often occurs when any conductor, such as a human body, discharges to an ESD sensitive
device. To prevent ESD damage, by grounding all bodies within one meter of the ESD sensitive
component so that the electrostatic charge is able to escape. Another option for preventing ESD is
to work on a conductive package, in which often the electronic components are already shipped
in. The conductive sheet absorbs any ESD, preventing it to getting in the ESD sensitive component.
The second method of working on the conductive sheet, is most likely what we will be using while
assembling electronic components. Also, to prevent ESD damage an electrostatic field meter can
be used to detect the static charges in the area.
Table 3.3.5.A shows the different ESD classifications, for different models, and their voltage
ranges. This table is vital in providing the necessary emphasis on how important it is to take all
necessary ESD precautions to prevent damage to the electronic components.
Table 3.3.5.A: Shows ESD Classifications and Voltage Range for Each ESD Model

43
3.4 Final Design Choices
3.4.1 Final choice for battery
The battery that is chosen for the W.A.R. design is three 3.7 volt lithium ion batteries. The lithium
ion battery has several benefits to it, which are crucial in making W.A.R. successful. The battery
is lightweight and is sold in various compact sizes especially when compared to the nickel
cadmium battery. Because W.A.R. is afloat on a lake, the amount of weight that the boat can
support needs to be extremely conservative, hence, lithium ion battery alone on that fact is ideal
for this design. Also, it has a minimal amount of self-discharge and the rest of the self-discharge
is taken care of by the charge controller. The lithium ion battery has no charge memory effect,
which would typically cause a battery to hold less charge. One drawback of using this battery is
the cost. It is one of the most expensive rechargeable battery choices, however when it is compared
with all of the other benefits this battery holds it is clear that this is the battery for W.A.R.
3.4.2 Final choice for microcontroller
For the W.A.R. design, the Atmel Atmega328P is chosen. The decision to use the Atmel
Atmega328P as the selected microcontroller is because of three reasons:
1. First, the group decided to learn a new microcontroller and its architecture. In the groups
classes they were mainly taught how program Texas Instruments MSP430. They all wanted
to learn something new so we can be versatile in the industry.
2. Secondly the group wanted to use the Arduino IDE/software libraries and take advantage
of the huge Arduino community that could help along the way with our design.
3. The last reason the Atmega328P is chosen, is because the water sensors that are chosen
have direct support with the Arduino which is a distinct advantage when it comes to
designing our project.
3.4.3 Final Choice on Wireless Technology
From research the group believes that ZigBee (XBee) is the best fit for the design, specifically
the XBee Pro Series 1. The XBee modules are chosen for its long range and ease of use. If the
project is put into a scenario where its range from the laptop can span over a huge lake then it is
important to make sure that it can still transmit the water quality data. Also, it is very convenient
how easy it was to set up the communication between W.A.R. and the PC. All that is needed is
the configuration of each XBee module with the others, serial number, same channel, and PAN
ID. Below are specifications of the XBee Pro module we chose:
XBee Pro U.FL Series 1
Outdoor RF line-of-sight Range: 1 Mile
Power Consumption: 215mA @ 3.3V
Frequency: 2.4 GHz
Transmission Power: 60 mW
Antenna: External/U.FL

44
Since the XBee Pro does not come with a built in antenna but comes with a U.FL connector, an
external antenna is purchased. The group believes that the XBee Pro with an external antenna
gives the best connection to the onshore PC. The U.FL to SMA cable is purchased and is
connected to a 2.4 GHz RP-SMA antenna. This allows the user to get the best range compared to
having a built in antenna that may have interference, since it is placed inside the RC boat.
3.4.4 Final Choice of Water Quality Sensors
For the sensors section the group decided to go with sensors from Atlas-Scientific. These are
chosen from Atlas-Scientific because their sensors and embedded circuits have direct support with
the Atmega328P. From the research, other water quality sensors made by other companies do not
have hobbyist support and may not be able to connect to the water quality circuits. These water
quality sensors are more geared towards scientists who have lab equipment to work from.
3.4.5 Final Choice of Water Quality Circuits
Due to the fact there are no other manufacturers of water quality circuits that are available to
purchase and integrate into our design; the group is purchasing these embedded circuits from
Atlas-Scientific. These embedded circuits are simple to use, low powered, and calculate the sensor
data. The water quality circuits that the group is purchasing are:
● pH
● Oxidation Reduction Potential (ORP)
● Dissolved Oxygen (D.O.)
● Conductivity
3.4.6 Final choice for PV cells
The solar cells chosen for the W.A.R. design are the polycrystalline silicon cells. They are among
the least expensive, by far and easily obtainable photovoltaic cells on the market. The ribbon
photovoltaic cells are difficult to obtain individually (not in a module), which is important for our
design since our PV cell layout will have to vary with the shape of the boat. Although the
polycrystalline cells are extremely fragile, extra emphasis is made to enclose them properly and to
purchase a few extra ones (just in case some of the cells break). Also, no reflectors or concentrators
are installed in the solar panel design because the efficiency of the solar module is not increased
significantly as much as it impacts the weight of the W.A.R. design. The solar cells are attached
to a firm, yet light material on the bottom and a clear plastic protection layer on top which prevents
debris damage.
3.4.7 Final for platform
Most RC boat hulls meet the criterion that is needed for this project. However, we chose the Delta
Force 29 Fiberglass hull. We chose this hull because it is made of high quality fiberglass instead
of cheap plastic. This allowed us to make many modifications to the hull without having to worry
about it cracking or breaking. This boat hull is also relatively large measuring at 29.5in by 9.5 in.

45
It is also designed as a Deep Vee, which gives it plenty of empty space inside. We used this space
to place all of our electronic components such as the PCB, the sensors, the GPS and wireless
communication system. The Delta Force 29 also has a flat top which allowed us to place a custom
made solar panel without much trouble. It was also relatively inexpensive for all the features it
included. One downside this hull is that it had to be purchased as an empty hull. We had to purchase
manually install the motor and the rudder.
3.4.8 Final choice for DC to DC Step Down Converter
The DC to DC step down converter chosen for the W.A.R. design is the LF50CV voltage regulator.
This voltage regulator is responsible for taking an input voltage of up to 16 volts and stepping it
down to 5 volts. This specific buck converter is ideal for the project application because it offers
an input voltage range that is not too vast, but still fits the requirement in an efficient way. The
L4901-ND, however, offers an input voltage range of up to 40 volts which is necessary and
excessive for the particular project application. The output voltage for both of the regulators is the
same, the second regulator offers a range of output voltages. The output voltages for the L4909-
ND range from 5-12 volts. The output voltage for that regulator is adjustable by using a list of
specific circuit topologies.
The second voltage regulator has a much greater pin size of 15pins, which makes the part itself
bigger and more complicated to connect, than the first voltage regulator which has only 3 pins.
The pin connections for LF50CV and L4909-ND are shown in Figure 3.4.8.A, respectively.
The L4909-ND is a quality product that offers many features, however if used for this application,
most of its features would be unused. Also, the temperature range for the second regulator, L4909-
ND, only ranges between 0°C ~ 70°C which could be an issue since the part will get very hot being
in very high temperature conditions and in direct sunlight. The temperature range for the first
voltage regulator, the LF50CV, is much greater than that ranging between -40°C - 125°C. It also
is equipped with a heat sink option which could extend that temperature range, and/or make sure
that the temperature tolerance is a more stable value. One of the most important reasons why the
L4909-ND part was not chosen is because of its high current output of 1.2 amperes. Having the
voltage regulator output a current of such a high value will damage some of the parts on the printed
circuit board.
Figure 3.4.8.A The L4909-ND (left) and the LF50CV (right) pin layouts.

46
Therefore, for the W.A.R. design, the LF50CV voltage regulator was chosen. It fits all of the
requirements for the project such as: output voltage of 5 volts, output current of 500mA, relatively
high operating temperature range, and a basic pin connection.
3.4.9 Final Choice for GPS module
20 Channel EM-406A SiRF III
Receiver with Antenna
66 Channel LS20031 GPS 5Hz
Receiver
Number of Channels 20(all-in-view tracking) 66 (22 Tracking, 66 acquisition)
Frequency L1, 1575.42MHz L1, 1575.42MHz
Sensitivity 159dBm 159dBm
Update Rate 1Hz 1Hz default, up to 10Hz
Hot Start 1s <2s
Cold Start 42s 35s
Max Altitude <18,000m <18,000m
Max Velocity <515m/s <515m/s
Power Consumption 44mA 29mA
Power Input 4.5V - 6.5V 3V - 4.3V
Price $39.95 $59.95
Table 3.4.9.A Comparison the Two Considered GPS Units
The group decided to go with the 20 Channel EM-406A SiRF III Receiver with Antenna over the
66 Channel LS20031 GPS 5Hz Receiver mainly because it is cheaper. The two modules are almost
identical in every aspect the only difference beside the price is the power input. Currently there is
already a voltage step down circuit for the 5V microcontroller so if the GPS also uses 5V the design
does need another step down voltage regulator. The SiRF III also interfaces well with the ATmega
microcontrollers that are selected for this project.
3.4.10 Final Choice for Charge Controller
The charge controller chosen for the W.A.R. design is the first charge controller chip, the
MCP73871. The MCP73871 is chosen because it fits the best for W.A.R. project. Both of the
compared charge controller chips fit the input voltage requirement of 5 volts generated by the solar
panel. Both of the charge controller chips offer the same operating temperature range.. Also, both
have a programmable output current. The programmable output current for the first chip ranges
between 50mA to 1A the second one reaches up to 1.2A. For the purpose of the W.A.R. project

47
application the high current output is unnecessary because its important to preserve the lithium ion
battery and keep it operating for as long as possible. Research shows that charging the battery at a
smaller current will help preserve the battery, although it will take a longer amount of time to fully
charge it, it is more important to keep it running through as many charge/discharge cycles as
possible.
The battery drain current for the MCP73871 chip is significantly lower than the MCP73833, which
is an important aspect to consider especially since we are very concerned with conserving the life
of the battery. Also, the maximum input current is higher on the first chip by almost double the
amount. Lastly, the two charge controller chips come in different packaging options. The first
charge controller chip only comes in the 20-lead QFN package which would require a professional
soldering specialist to help the group with assembling it onto the printed circuit board. The second
chip would not require such attention because it is a larger size and offers less pin connections.
The main important reason for choosing the MCP73871 chip over the MCP73833 is efficiency.
Since we are using the solar panel as the input power source, the input voltage and current will be
fluctuating with the different weather conditions. The MCP73871 chip uses Voltage Proportional
Charge Control to ensure low cost while still maintaining efficiency and stability of the managed
power. Working with varying voltages due to the solar panel fluctuating light exposure, it is
necessary to employ VPCC to produce a steady output voltage. The steady voltage output in VPCC
is obtained by limiting the current, therefore increasing the voltage once the output voltage drops
below a pre-set voltage value. The MCP73871 chip only operates at specific input voltage
conditions, which mean that when the solar panels generating a voltage that is lower or higher that
that value it will be operating at extremely low efficiency. Therefore by picking the MCP73871
chip, the W.A.R. boat power system design runs at peak efficiency.
3.4.11 Final Choice for Motor
For the motor we decided to use a standard DC brushed motor bought from a local hobby store.
This motor is rated 3-24V. After testing the motor in the senior design lab, it was found that 3V
and unloaded the motor drew 200 mA. After loading it with the propeller shaft and testing with
3.7V, the voltage of the lithium ion batteries, it was found the motor drew 450 mA. Even though
a brushless motor is much faster, has higher torque and a longer live span that brushed motors, a
brushed motor was ultimately chosen since it was much cheaper and did not require a speed
controller in order to run.
Originally it was planned to use a brushless motor, specifically the HobbyWing 2040 SL 4800kv
Brushless Inrunner. This motor is priced $34.99 and has many desirable features. These include: a
high Kv rating of 4800, max current of 20A, a no load current at 7.4V of 1.7A, a low internal
resistance of 0.0399 ohms. . Figure 3.4.10.1 shown below is the schematic of the motor. Even with
all these features, the DC brushed motor cost four dollars, which means it can be replaced nine
times before costing more than the brushless motor.

48
Figure 3.4.10.1 - Schematic of Brushless Inrunner Motor
3.4.12 Final Choice for Compass
The compass’s main purpose is providing a better heading that what the GPS module already
provides. While not absolutely necessary for our project it would be ideal to include one. Since it
is not absolutely required but would be nice to include we have decided to go for a breakout board.
This would make integration very easy while still providing the needed simple functionality. For
the compass we decided to go with the LSM303DLMTR Breakout Board with tilt compensation.
The board is a triple axis accelerometer combined with a triple axis magnetic sensor which gives
all the data the microcontroller needs. The microcontroller must still calculate the tilt-compensated
output. Figure 3.4.12.1 shows a schematic of the board.
Originally, it was planned to use a compass if the GPS device could not provide an accurate enough
current course of travel for our boat. After testing the GPS, it was found the module provided a
very accurate heading as long as the boat was moving faster than walking speed. After these tests
is was decided that a compass would not be needed for the W.A.R project.
Figure 3.4.12.A Shows the schematic of the LSM303DLMTR

49
4.0 Project Hardware and Software Design Details
4.1 Overall Design
4.1.1 Printed Circuit Boards
In our final design there are four custom printed circuit boards (PCB). The first PCB will be our
main PCB that houses all components that navigation and water quality readings. Some main
components are the two microcontrollers, four water quality circuits, GPS modules, and the
voltage regulator. The other three PCBs are charge controllers which charge the three lithium ion
batteries. These three charge controllers will be identical using the MCP73871 as the main IC to
deliver power to the batteries. To create these PCBs CadSoft Eagle PCB Design Software was
used. After designing the PCBs the group decided to get these manufactured at OSHPARK.com.
OSHPARK was chosen because they supply three copies of each board which was needed for
the charge controllers.
The first PCB will hold all components that are relevant to gathering water quality data and
navigation. This includes two ATmega328 microcontrollers, an XBee module, four different
water quality circuits, four BNC connectors to connect the water quality sensors, two HCT4051
8-channel analog multiplexer/demultiplexer, a voltage regulator, GPS module, relay to turn on
and off the motor, and servo connections to move the rudder. There may be more components on
the PCB but the ones listed above are the main components on the PCB. Figure 4.1.1.A shows
the schematic for the main PCB.

50
Figure 4.1.1.A Main PCB schematic for navigation and water quality system
The other PCBs hold all components that are relevant to charging the lithium ion batteries from
the solar panel. The main IC on the charge controller PCB will be the Microchip MCP73871
which regulates the input voltage of the solar panel to 4.1V for the lithium ion battery. Along
with this chip there will be status LEDs and a standard DC power jack for a secure connection to
the solar panel. Figure 4.1.1.B shows the schematic for the charge controller.
Figure 4.1.1.B Schematic of Charge Controller

51
4.2 Hardware
4.2.1 Microcontrollers
For the W.A.R. design there are two Atmel ATmega328P microcontrollers. One is used to gather
water quality data and then transmit this data wirelessly to a computer through a XBee wireless
module. The second microcontroller is used for navigation and movement. It will take in GPS
coordinates from the user and then navigate the boat to the correct position.
An Atmel ATmega328P is a low powered 8-bit microcontroller. It has 32 kilobytes of flash, 1
kilobyte of Electrically Erasable Programmable Read Only Memory (EEPROM), 1 Universal
Asynchronous Receiver/Transmitter (UART). A great benefit of this microcontroller is its use in
the Arduino community and low cost.
4.2.2 XBee Pro Module
The module and microcontroller are integrated following the selection of the XBee module. The
minimum connections in order to have the XBee module communicating are: VCC, GND, UART-
TX (DOUT), and UART-RX (DIN). VCC requires a voltage of 3.3V and a current of 215mA for
transmission, the max power usage during transmission will be 60mW. The UART-TX is
connected to RX pin on the microcontroller and the UART-RX is connected to the TX pin. This
connection allows the XBee Pro module and the microcontroller to send data serially to each other.
Figure 4.2.2.A details how the XBee Pro and our microcontroller are connected.
Figure 4.2.2.A XBee Pro and Atmega328P Connection

52
For the XBee Pro to transmit data wirelessly there needs to be a second XBee Pro module that
connects to the PC through a serial USB connection. This allows the PC to receive and transmit
serial data from other XBee modules.
Before the two XBee Pro can communicate with each other, they need to be configured in a
coordinator and end device format with the end device configured to communicate with the
coordinator using it serial number. This is discussed further in our Software Design section.
4.2.3 Sensors/Circuits
When W.A.R. boat arrives to the location specified by the user, it will allow the user to choose
which sensor to read from. From this choice the water quality sensor will poll for data for
approximately 5-7 seconds. After the polling of data is done, the user will be allowed to poll for
data again. Each sensor is connected to the circuits through a female BNC connector.
pH Sensor/Circuit
The pH sensor and circuit are purchased from Atlas-Scientific. The sensor is laboratory grade and
has an accuracy of 95% within 1 second of testing. The pH circuit connects with the sensor
allowing the user to decode the sensor data into serial data. The circuit is able to operate on 2.5-
5.5V consuming anywhere from 1.89mA to 14mA depending on the activity of the circuit. Below
in Table 4.2.3.A and Table 4.2.3.B, is a detailed table of these specifications.
Parameter Min Typical Max
Storage
Temp(Circuit)
-40° C 125° C
Storage
Temp(Sensor)
1° C 25° C 35° C
VCC 2.5V 3.3V 5.5V
Table 4.2.3.A Absolute Maximum Ratings
Parameter 5V 3.3V
LED on (Active) 14 mA 4 mA
LED off (Active) 2.3 mA 2 mA
LED on (Quiescent) 7.6 mA 3.6 mA
LED off (Quiescent) 2 mA 1.89 mA
Table 4.2.3.B Power consumption

53
Once the circuit is powered ON the user needs to send commands to the circuit, so that it knows
what action to take. These commands are sent serially using any Terminal software through the
circuits TX and RX pins. Below, in Table 4.2.3.C, are some commands that are available:
Command Function
L1 Enable LEDs
L0 Disable LEDs
R Take one pH reading
C Take continuous pH readings every 378 milliseconds
X Reset circuit to default state
Z0 Change baud rate
Table 4.2.3.C Circuit Commands
ORP Sensor/Circuit
The ORP circuit has the exact same max voltages and power consumptions as the pH sensor. Some
differences between the circuits are the commands. Due to the nature of measuring ORP the circuit
has a few different commands. Below, in Table 4.2.3.D are some various commands of the ORP
circuit.
Command Function
L1 Enable LEDs
L0 Disable LEDs
R Take one pH reading
C Take continuous pH readings every 320
milliseconds
+ Calibration: Increase ORP
- Calibration: Decrease ORP
X Reset circuit to default state
Z0 Change baud rate
Table 4.2.3.D – ORP Circuit Commands

54
Other sensors/circuits
The rest of the sensors/circuits all have the same max voltages and power consumption. Instead of
listing more redundant data, the datasheets for each circuit and sensor can be found on the
manufacturer’s website.
4.2.4 HCT4051 8-channel Serial Analog Mux/Demux
The group is integrating two HCT4051 8-channel multiplexers to connect the water quality circuits
and XBee Pro to the Atmega328Ps UART. Each TX pin on the water quality circuits and XBee
Pro will connect to an HCT4051. This will be our transmit mux that will determine which transmit
signal will be received by the microcontroller. Another HCT4051 will connect the RX pins of the
water quality circuit and XBee Pro. The microcontroller will select which circuit it will want to
send data to through this method. The detailed schematic of this implementation, 4.2.4.A is shown
below:
Figure 4.2.4.A Schematic of Communication between Microcontroller and the Circuits/XBee Pro

55
With this implementation we allow the microcontroller to be able communicate in both directions
will all components in this subsystem. We will be able to send commands to the water quality
circuits and receive the water quality data. With the data from the water quality circuits the
microcontroller can transmit the data to the XBee Pro which then passes it on to our PC.
4.2.5 GPS Module
For this project we are using the 20 Channel EM-406A SiRF III Receiver with Antenna (EM-
406A). This GPS module features the SiRF star III high performance GPS chip set with very high
sensitivity (tracking: -159 dBm). It has an extremely fast TTFF (Time to First Fix) at a low signal
level. It supports NMEA 0183 data protocol and has a built in patch antenna. For its main power
input it requires from 4.5V to 6.5V and 44 mA of power consumption. The input for the module
is done in the NMEA protocol standard. The output of the module can be controlled and can be in
the form of GGA, GLL, GSA, GSV, RMC, and VTG. GGA gives time, position and fix type data..
GLL gives latitude/longitude, UTC time of position fix and status. GSA gives the GPS receiver
operating mode, satellites used in the position solution and DOP values. GSV gives the number of
GPS satellites in view, satellite ID numbers, elevation, azimuth, and signal noise ratio values. RMC
gives the recommended minimum data for GPS which is time, date, position, course and speed
data. VTG gives course and speed information relative to the ground.
A list of all commands can be found on the GPS datasheet. However, the following four are the
most notable and useful to our project: These commands are as follow:
1) Set Serial Port - This command is used to set the protocol for the GPS module. The different
protocol options are as follows (SiRF Binary, NMEA, or USER1). This command is also used to
set the communication parameters. These can be in baud, data bits, stop bits and parity. This
command can be used to switch the module back to SiRF Binary protocol mode since this mode
contains a more extensive command message set. This mode is very useful in changing the
navigation parameters. When the module receives a valid message, the parameter is stored in the
battery backed SRAM and then is received, after which it restarts using the new parameters.
The format of the Set Serial Port command is:
$PSRF100, <protocol>,<baud>,<DataBits>,<StopBits>,<Parity>*CKSUM<CR><LF>
<protocol> 0 = SiRF Binary, 1 = NMEA, 4 = USER1
<baud> 1200, 2400, 4800, 9600, 19200, 38400
<DataBits> 8,7. SiRF protocol is only valid f8 Data bits
<StopBits> 0,1
<Parity> 0 = None, 1 = Odd, 2 = Even
Example: Switch to SiRF Binary protocol at 9600, 8, N, 1.
$PSRF100,0,9600,8,1,0*0C<CR><LF>
The CheckSum Field is the absolute value calculated by the exclusive-OR of the 8 data bits of
each character in the sentence between but excluding the “$” and the “*” characters. The

56
hexadecimal value of the most significant and least significant 4 bits of the results are converted
to two ASCII characters (0-9, A-F) for transmission. The most significant character is transmitted
first.
2) Navigation Initialization - This command is used to initialize the module for a warm start by
providing the current position in (X,Y,Z coordinates). The clock offset and the time must also be
provided in this command. The receiver then searches for the correct satellite signals at the correct
signal parameters. The more accurate the initialization parameters are the more quickly the
receiver is able to acquire a signal and thus produce a faster navigational solution. When a valid
Navigation Initialization command is received, the receiver restarts using the input parameters as
a basis for satellite selection and acquisition.
The format of the Navigation Initialization command is as follows:
$PSRF101,<X>,<Y>,<Z>,<ClkOffset>,<TimeOfWeek>,<WeekNo>,<chnlCount>,<ResetCfg
>
<X> X coordinate position (32 bit Integer)
<Y> Y coordinate position (32 bit Integer)
<Z> Z coordinates position (32 bit Integer)
<ClkOffset> received in Hz, use 0 for last saved value, default 75000(INT 32)
<TimeOfWeek> GPS time of week (Unsigned 32 bit Integer)
<WeekNo> Week number (calculated from UTC time)
<chnlCount> Number of channels to use 1-12. (Unsigned Byte)
<ResetCfg> bit mask 0x01=hot start, 0x02, warm start, 0x04=cold start(Ubyte)
Example: Start using known position and time.
$PSRF101,-2686700,-4304200,3851624,96000,497260,921,12,3*7F
3) Query/Rate Control - This command is used to control the output of the standard NMEA
message. This command is used to control the output of the standard NMEA message. This
command message is also used to set up a standard NMEA message to poll once or for periodic
output. Checksums may also be enabled or disabled depending on the needs of the receiving
program. NMEA message settings are saved in the battery backed memory or each entry when the
message is accepted.
The format of the Query/Rate Control message is:
$PSRF103,<msg>,<mode>,<rate>,<cksumEnable>*CKSUM<CR><LF>
<msg> 0=GGA,1=GLL,2=GSA, 3=GSV,4=RMC,5=VTG
<mode> 0=SetRate,1=Query
<rate> Output <rate> seconds, off=0, max=255
<cksumEnable> 0=disable Checksum, 1=Enable checksum
Example 1:Query the GGA message with checksum enabled
$PSRF103,00,01,00,01*25

57
Example 2: Enable VTG message for a 1Hz constant output with checksum enabled
$PSRF103,05,00,01,01*20
4) LLA Navigation Initialization - This command is very similar to the Navigation Initialization
command in format and operation. The only difference is that the coordinates provided are in
latitude, longitude and altitude. This command also requires the clock offset and time and just like
command 2 it enables the receiver to search for the correct satellite signals.
The format of a LLA Navigation Initialization is as follows:
$PSRF104,<Lat>,<Lon>,<Alt>,<ClkOffset>,<TimeOfWeek>,<WeekNo>, <ChannelCount>,
<ResetCfg>*CKSUM<CR><LF>
<Lat> Latitude position, positive is north of the equator and negative is south.
Given as signed float.
<Lon> Longitude position, positive is east of Greenwich and negative is
west of Greenwich. Given as a signed float.
<Alt> Altitude position. Given as signed float.
The remaining parameters are exactly the same as the corresponding parameters discussed in
command 2.
Example: Start using known position and time.
$PSRF104,37.3875111,-121.97232,0,96000,237759,922,12,3*37
The remaining commands for the 20 Channel EM-406A SiRF III Receiver with Antenna can be
found in the module’s data sheet.
Figure 4.2.5.A shows how the 20 Channel EM-406A SiRF III Receiver with Antenna (the EM-
406A) is connected to the ATMEGA328P microcontroller. The ATMEGA328P needs to transmit
the correct commands to the EM-406A. This is achieved by connecting the microcontroller’s TX
pin to the GPS module’s RX pin. The GPS module needs to transmit the current coordinates to the
microcontroller so that the microcontroller can carry out the corresponding calculations to find out
where it need travel by moving/starting the servo/motor to the correct positions.

58
Figure 4.2.5.A The EM-406A Connections to the ATMEGA328P
4.2.6 PV Cells
Each monocrystalline solar cell generates 0.5 volt. Therefore, to power a 3.7 volt battery with a
charging voltage of 3.6 volt between 7 and 8 monocrystalline solar cells would be needed. The
decision to choose 8 solar cells (more than is technically needed) is made for the following reasons:
the solar cells will not be operating at ultimate efficiency the entire time the battery will be
charging, the perfect angle to receive sunlight at which the solar cell will generate its maximum
amount of energy will not be achieved by all, if any, cells.
The solar cells will be laid out on the boat platform with 8 solar cells on each side of the boat, with
a custom made protection encasing. The cells in each module will connected in series, therefore
generating the needed voltage with a relatively low current. The low current will provide a longer
charge time; however the risk of overheating the components, which will already be hot from the
sun, will be ultimately low. Each module will consist of 10 solar cells, and there will be three
separate modules that power each 3.7 volt battery.
The individual solar cell connections that will be implemented in the design are displayed in Figure
4.2.6.A below. It’s important to note that only two out of the three modules are displayed in the
Figure 4.2.6.A below, for the actual design there will be three uniform modules connected to each
battery.

59
Figure 4.2.6.A Solar Cell Connections for the Two Out of Three Modules
4.2.7 DC to DC Power Converter
The W.A.R. design contains the LF50CV step down voltage regulator which takes an input voltage
of up to 16 volts and steps it down to 5 volts. This voltage regulator takes the input from the two
lithium ion batteries connected in series, which produce an output voltage of 7.4 volts, and steps
down that voltage to 5 volts. The circuit configuration for the LF50CV chip is displayed in Figure
4.2.7.A below.
Figure 4.2.7.A LF50CV test circuit

60
The two different capacitor values connected to the input and output of the chip make sure that the
input and the output of the circuit are stable. The low drop voltage of the regulator is 0.45 volts,
and low quiescent current of 500uA make is ideal for low noise and relatively low power
application such as the W.A.R. project. The electrical characteristics for the LF50CV voltage
regulator are displayed in the table below, Figure 4.2.7.B assuming that the input capacitor value
is 0.1uF and output capacitor value is 2.2nF.
Figure 4.2.7.B: LM3478 Electrical Characteristics
4.2.8 Lithium Ion Battery
The W.A.R. design consists of three 3.7 volt lithium ion batteries that each are connected to a
charge controller that monitors the battery and makes sure that it does not over charge. One of the
batteries is then connected to the motor. Next, two 3.7 volt lithium ion batteries and the charge
controllers are connected in series, which ideally generates 7.4 volts. That system is connected to
the PCB which holds the communication system, sensors, and microcontrollers. Because the
lithium ion battery is so sensitive to high temperatures, the battery is stored in an insulated structure
to help prevent lack of efficiency due to the heat caused by the sun. Styrofoam is used as the
insulator from heat, because of its lightweight and easy installation. The Styrofoam is stacked on
top and bottom of the battery to make sure that the least amount of heat impacts the battery. The

61
connection cables are guided out of the Styrofoam insulation and sealant will be applied where the
cables exit the Styrofoam insulation to prevent heat intake.
To calculate a rough estimate of how long the W.A.R. boat will be able to be powered ON without
having to recharge we used the formula displayed below:
However, due to charge/discharge charge cycle inefficiencies, the practical number of charge time
is predicted to be less than 5.78 hours. It is suggested to not charge the lithium ion battery to full
capacity, but instead to somewhere between 40-80%. When the battery is left idle, overnight, the
battery will be left charged about 40%. The battery’s charge cycle will begin once the charge
controller senses a specific voltage drop, once again replenishing the battery. All of the
components will continually be running off the solar modules and the lithium ion battery will
supplement the current if needed. This way the battery is only used when needed, and when no
power is drawn and the solar modules have an adequate amount of sun exposure, the batteries are
charged from the solar energy.
4.2.9 Charge Controller
There are three charge controllers that each input the output from the solar cells, after which the
output of each charge controller is connected to a 3.7 volt lithium ion battery. The charge controller
chip used to manage the voltage and current transitioning to the battery is the MCP73871 Stand
Alone System Load Sharing and Li-Ion/Li-Polymer Battery Charge Management Controller. The
chip employs a constant current, constant voltage algorithm with thermal regulation. The circuit
configuration for the MCP73871 chip is shown in Figure 4.2.9.A below.
Figure 4.2.9.A MCP73871 Circuit Configuration

62
Maximum current of 1.8 amperes of total input current control. The Microchip chip is used with
the intention to make the charging system efficient, while still maintaining low cost and time
effectiveness. The efficiency of the charging is ensured by employing Voltage Proportional Charge
Control (VPCC), which reduces the charging current as it increases the voltage as soon as the input
voltage (output solar panel voltage) drops below the pre-set battery charge voltage.
The VPCC feature is activated on the chip once the voltage reaches above 1.23 volts and is disabled
if it is connected to the pin IN. The pre-set battery charge voltage is referenced in the voltage
divider resistor value design. By selecting certain resistor values the system has a specific charging
voltage. The voltage divider equation is displayed below, in the box labeled Figure 4.2.9.B.
Figure 4.2.9.B External Top View of LM3420
The charge controller contains three two-pin headers and one DC barrel power jack. The first
female header takes the solar cell module output as its input. It also shares the same connection
with the barrel power jack. The two different connection types are there for functionality purposes,
because the female headers contain an easy connect/disconnect for the wires. The barrel power
jack connection provides a secure connection and is used in the final production of the project.
The charge controller contains three different status LEDs that notify the user of the charge status
of the lithium ion battery. The first LED is labeled “PWR” and indicates if the charge controller
has a good power connection. If the LED is not turned ON then something is wrong with the solar
cell power supply.
The second LED is labeled “CHRG” and it indicated the current charging status of the battery. If
the LED is lit then the battery not yet full and is still consuming charge. Another option indication
for this LED is if the voltage of this battery is low, below 3.1 volts. Therefore if the voltage of the
lithium ion battery drops below 3.1 volts this LED turns ON. The third LED labeled “DONE”
indicates that the battery has reached full charge of 3.7 volts. The charge controller allows
simultaneous use and charging of the battery called load sharing. Therefore the charge controller
parts and battery itself aren’t strained due to constant charge and discharge as the system is being
charged and consuming power.
On the charge controller there are two separate output connections labeled “BATT” and “LOAD”,
one of which is connected to the lithium ion battery and the other is connected to a component
receiving the controlled power, respectively. To enable load sharing included in the charge
controller chip design is a pass transistor that is connected to the output load from the input voltage.
When the charge controller is connected to the solar panel, the lithium ion battery, and a load, the

63
load current is being drawn directly from the solar panel connection. If the load current is lower
than the required current, the battery will supplement the additional needed current by up to 1.8
amperes.
The charge controller provides a charge current of up to 500mA to the lithium ion battery which
is an acceptable value and is lower than the standard charging current for the TENERGY 18650
lithium ion battery.
4.3 Software
4.3.1 Microcontrollers
This project is using two Atmel Atmega328P microcontrollers. The task of the first microcontroller
is to receive the water quality data from the circuits/sensors and take this data and transmit to an
onshore PC. The microcontroller is able to transmit this data to the onshore PC using an XBee Pro
wireless module. In short, the first microcontroller is responsible for choosing which water quality
data to receive in it RX pin by using a mux, from here the data will be send to the connected XBee
Pro from the microcontrollers TX pin. Figure 4.3.1.A. demonstrates the communication between
the PC and W.A.R. on a lake.
Figure 4.3.1.A Diagram of PC Communication to W.A.R. on a Lake.

64
The task of the second microcontroller is to receive GPS coordinates from the user, calculate the
path to those GPS coordinates, and then power/steer the boat to the correct location. The
microcontroller receives the GPS coordinates from the user using open source terminal software
on the PC. The XBee will then take these GPS coordinates and send them to the sensor
microcontroller. From the sensor microcontroller, it will then send the coordinates to the
navigation microcontroller using the I2C protocol. With the coordinates saved in memory, the
microcontroller will calculate the distance and direction to travel. Table 4.3.1.A below describes
the functions that the first microcontroller is using to gather water quality data. Some of these
functions are sensor specific so the user can calibrate the sensor if needed offshore.
Function Name Description
latitude() Request that the user enter a latitude coordinate.
checkLatitude() Takes the entered latitude coordinate and determines if it is a valid
number. If not then the latitude() function is called again.
longitude() Request that the user enter a longitude coordinate.
checkLongitude() Takes the entered longitude coordinate and determines if it is a valid
number. If not then the longitude() function is called again.
printMenu() Prints a menu with possible commands to send to W.A.R boat.
readsomething() Reads the data from the water quality circuit and then sends to XBee
readTemp() Reads the temperature probe and converts AC signal to DC
readSensor() Configures multiplexers for readings and commands circuits to poll for
water quality data.
computerSend() Determines which water quality sensor is selected by the user and calls
readSensor().
Table 4.3.1.A Sensor Function Calls
4.3.2 XBee Pro
The software to configure the XBee Pro is X-CTU. This software is free to download by Digi
International, the manufacturer all XBee modules. X-CTU will allow us to connect to both our
XBee Pro modules and configure them so they have a point-to-point communication and update
their firmware from Digi if needed.
The steps needed to configure the XBee Pro are listed below.

65
1. Connect a XBee Pro to the PC with X-CTU using a XBee USB Dongle.
2. Launch the X-CTU configuration tool and select the XBee module from the COM Port
list.
3. Click the “Test/Query” button to test the X-CTU can connect/communicate to the XBee
Pro.
4. Navigate to the “Modem Configuration” tab in X-CTU.
5. Hit the “Read” button to get the Modem and Function set of the XBee Pro.
6. Look at the PAN ID and check if it is the correct ID for the network. The default PAN ID
will be 3332. This PAN ID must be the same for both XBee Pro modules.
7. Configure the baud rate to desired rate.
8. Take the S/N of the coordinator XBee and put that in the destination S/N for the receiver
XBee
9. Hit the “Write” and the configuration above will be set onto the XBee Pro. A reset of the
device may be required to finish the configuration.
10. Repeat these steps again for the second XBee Pro.
Once these steps are done, both XBee Pro modules should be able to communicate with each
other.
4.3.3 Desktop Application
To record the water quality data that is being sent to the PC the group uses open source terminal
software like PuTTY or Tera Term. The terminal software displays the serial data that is being
sent to the XBee Pro that is connected to the PC. The group configures the terminal software to
log the data so we can keep archives of water quality.
The terminal software also allows us to transmit data to W.A.R. Since both XBee Pros are
configured to receive and transmit data, the user is able to determine the actions of the
microcontroller/water quality circuits using the functions listed above in Table 4.3.1.1. Also, the
terminal software is being used to send the second microcontroller GPS coordinates. These GPS
coordinates tell the second microcontroller the distance and direction needed for travel.
4.3.4 Navigation Software
The navigation subsystem of this project is in charge of the motion of the W.A.R boat. This
subsystem consists of an Atmel ATmega328P microcontroller, an EM-406A GPS device, a DC
motor that spins the propeller, and a servo which turn the rudder. The navigation microcontroller
performs all the distance and heading calculations needed to steer the boat. These calculations use
data from the GPS device and are recalculated every quarter to ensure the boat is moving the right
direction. The navigation microcontroller waits to receive a valid waypoint coordinate from the
sensor microcontroller and for the GPS to have a lock before turning on the DC motor. The servo
angle is set based on the heading calculation, the possible choices are: left, right or straight.
Once W.A.R boat reaches the waypoint, the motor will turn off and the user is able to utilize the
various on board sensors to measure water quality at that specific location. Once the user it done
with the sensors, the user can order W.A.R to return to its starting position. If wireless

66
communications is lost with W.A.R or after enough time has passed, W.A.R will automatically
return home.
To achieve autonomous navigation, the W.A.R boat is outfitted with several components. These
are a brushed DC motor which is connected to the propeller via a brass shaft, a standard size servo,
which moves the rudder and a GPS device, specifically the EM-406A. The DC motor is rated at
3-24V with a current draw of 0.5A when loaded with the propeller. The servo provides 45 oz.-in
of torque at a speed of 60 degrees per 0.17 seconds. A thin eight inch long brass wire connects the
control arm of the servo to the control arm of the rudder. The GPS has a twenty two channel
receiver and is accurate within 10 meters. A summary flow chart of the software procedures can
be seen below in Figure 4.3.4.A below.
Figure 4.3.4.A Summary of the navigation software procedure
As shown in the above flowchart, there are two requirements must be met before the boat is able
to move. The first requirement is that the GPS must have valid data and save its current location
as the return home location. From a cold start this will normally take less than one minute,
depending on weather or outside interference. From a hot start, this will take less than a few
seconds. The second requirement is that the user has sent the boat a valid waypoint to travel to.
The user is able to input a GPS coordinate in the form of two floats into the serial terminal (i.e.

67
28.600402, -81.169385). These two values are wirelessly transmitted to the sensor microcontroller
via an XBee receiver and transmitter, and then transmit latitude/longitude data to the navigation
microcontroller via I2C communications.
There are also two values that must be calculated in order to achieve autonomous motion. These
are distance and bearing between the start and end points. The data from the GPS can be used to
calculate both of these values. The distance can be calculated using the Haversine Formula shown
below in the navigation equations section of this paper. The Haversine Formula is a great circle
formula that calculates the shortest distance between two points on a sphere. It can be split into
three separate parts. Shown in figure 4.3.4.B (1), latitude (𝜑) and longitude (𝜆) coordinates are
converted to radians and used to calculate the value a. The atan2 function shown in figure 4.3.4.B
(2) uses two arguments instead of one in order to gather information on the signs of input and
return the appropriate quadrant of the computed angle. The final value shown in figure 4.3.4.B (3)
is calculated by multiplying by the radius of the Earth (R = 6,371 km) with the value c found in
figure 4.3.4.B (2). The bearing between two points can be calculated using figure 4.3.4.B (4). This equation returns
a value between -180 and 180 degrees. If the returned value is negative, it must be made positive
by adding 360 degrees. As long as the boat is moving, the current direction of travel can be
obtained from the GPS device. Once both the needed heading and the current heading (from GPS
device) are known, then they can be compared by simple subtraction. Depending on the result of
the subtraction, the direction that the rudder must be turned can be found. The GPS is polled for
new data every quarter second which trigger the start of new distance and bearing calculations.
Figure 4.3.4.B Haversine Formula and bearing formula needed for navigation
Shown in table 4.3.4.A is list of the function called used in the navigation code as well as a short
description of each one does.

68
Function Name Description
setup() Runs on startup, configures all needed components.
firstTime(TinyGPS) Save current location of boat as the return home point.
receiveEventt(int) Receives waypoint from sensor microcontroller.
requestEvent() Acknowledges data was received correctly
FeedGPS () Check for valid GPS data and process it.
gpsDump(TinyGPS) Get latitude, longitude and course from GPS. Call Distance function.
distance(float, float,float) Calculate distance from waypoint, adjust servo based on course. The
three float are latitude, longitude and course.
moveServo(int) Move servo to calculated angle.
Table 4.3.4.A Navigation Function Calls
4.4 Mechanical
4.4.1 Platform
All electronics are mounted on a Delta Force 29 Fiberglass Hull. The dimension of this hull is 29
inches long by 10 inches wide. This hull is both lightweight and built for speed. It is designed as
a deep Vee with a small rear pad for handling. Deep Vee also known as mono hulls are the easiest
hull types to set up as opposed to the catamaran, F1 tunnel hulls, sports hydro hulls or outrigger
hulls. All fast electric hulls have a hatch to access the inside. This is where the majority of the
electronics will go. To properly keep water out of the hull, the hatch is taped shut and checked for
leaks in a controlled environment. Hockey tape is used to tape the hatch shut.
On a mono hull there are several components that need to be properly placed and secured. These
are the stinger or strut outdrive, the rudder with water pickup, trim tabs and turn fins. These
components are described below:
The stinger houses the flex shaft and supports the prop shaft. The placement of the propeller is set
away from hull is around 5-7% of the hull’s length. A hole is cut for the flex shaft to exit the hull.
The hole is as far down in the bottom of the Vee as possible. The drive angle is adjusted so that it
runs parallel with the bottom of the hull as a starting point.
A rudder is necessary for steering any RC boat. The length of rudder is around 15% of the hull’s
length. The rudder must also feature a water pickup system that is used to water cool the motor.
The rudder is attached to a servo that receives input from the navigation microcontroller.
Turn fins allow the hull to take sharp turns much more effectively as they provide a pivot point
during corners. The turn fins are placed at the highest point of the bottom surface as shown in the

69
following figure. The fin is perpendicular to the bottom surface. The accurate mounting diagram
is displayed in Figure 4.4.3.A below.
Figure 4.4.3.A - Proper Mounting of Hardware on the Boat’s Hull

70
5.0 Design Summary of Hardware, Software, and
Mechanical
5.1 Hardware
5.1.1 Overall Specifications
The list and Figure 5.1.1.A are the overall specification for W.A.R.
● W.A.R. dimension should be within 3x1x1 ft.
● It should be light enough so it can float on the surface of water.
● W.A.R. should be able to move through the water at a reasonable rate.
● W.A.R. should be easy to transport in the case testing needs to be done at other bodies of
water.
● W.A.R should be powered by lithium ion batteries. These batteries will be recharged using
solar panels that are on top of W.A.R.
Figure 5.1.1.A Overall block diagram

71
Table 5.1.1.A, displayed below, shows the group work distribution of the W.A.R. project. Irina is
responsible for the solar cells, and charge controller. Joey is responsible for the solar cells, charge
controller, MCU programming, and the wireless sensors. Dennis is responsible for the GPS
Navigation, the MCU Programming, and assembling the robot platform.
Solar Cells Charge
Controller
MCU
Programming
Wireless/
Sensors
Motor/Robot
Platform
Navigation
Irina X X X
Dennis X X X
Joey X X X X
Table 5.1.1.A Overall group work distribution
5.1.2 Microcontroller
Below is a list of specification of the microcontroller chosen to design W.A.R. Currently, use two
of these microcontrollers in the design. One is tasked with collecting the water quality data and
transmitting it. The second microcontroller is tasked with movement and navigation of W.A.R.
using GPS. Table 5.1.2.A displayed below shows the Atmel Atmega 328P specifications.
Parameter Value
Flash memory 32 KB
EEPROM 1 KB
CPU Frequency 16 MHz
I/O UART - 1
SPI - 2
I2C - 1
Operating Voltage 1.8-5.5V
Active Mode Current 0.2mA
Maximum Operating Voltage 6.0V
Maximum Current Per Pin 40.0mA

72
Power Supply Current 0.15 - 9.0mA
Power Save Mode 0.75μA
Power Down Mode 0.1μA
Pin count 32 (23 I/O)
Price $3.20
Table 5.1.2.A Atmel ATmega 328P Specs
5.1.3 XBee Pro
The two XBee Pros that allow for W.A.R. to communicate to our onshore PC is shown below.
Each XBee Pro is configured before attaching them to the design. Upon powering up the two
XBees, each should be able to transmit and receive data. Table 5.1.3.A shows the Digi XBee Pro
series specifications.
Parameter Value
Max data rate 250 kbps
Operating Voltage 3.3 @ 215mA
Transmit power 60mW (+18dBm)
Frequency 2.4 GHz
Max transmission range 1 Mile(1500 ft)
I/O 8 digital I/O pins
Table 5.1.3.A Digi XBee Pro Series 1 Specs
5.1.4 Water Quality Circuits
There are four water quality circuits connected to our PCB. There is no temperature circuit due to
the fact that the temperature sensor is connected directly to the analog pins of the microcontroller.
The microcontroller communicates to each water quality circuit through an HCT4051 8-channel
multiplexer. Each water quality circuit RX pin is connected to a select line on the multiplexer and
from there the microcontroller chooses which water quality circuit to read from.

73
5.1.5 Solar Cells
There are three modules; each supply energy to a 3.7 volt lithium ion battery. Each module will
consist of ten photovoltaic cells that will be connected together in series. The solar cells that will
be used for the W.A.R. design are the polycrystalline silicon cells. The cells’ specifications
characteristics are displayed in the Table 5.1.5.A below. It’s important to note that in the
specifications sheet it emphasizes that cold temperatures do not affect the silicon cell, however
when the temperature is above 100 degrees Fahrenheit the temperature will begin to cause a
voltage drop. Also, once the solar cells are connected in series that increases the impedance which
results in a smaller value current output. The solar cells are attached with glue to a firm, flat,
lightweight-wood surface. The top of the solar panels has a plastic panel over them, shielding them
from debris and harsh weather conditions. Each of the modules is sealed and the wires leaving the
module will be sealed with sealant to prevent water escaping into the connections and will keep
the wires in place preventing them from damaging the connected solar cells.
Parameter Value
Dimensions 52 x 38mm
Current 0.275 - 0.300A
Average Power 0.150 Watts
Voltage 0.50V
Voltage at Load 0.48V
Table 5.1.5.A: Specifications for a Polycrystalline Silicon Cell
5.1.6 Power Supply
The power system for W.A.R. consists of three solar cell modules that generate solar energy to
power three 3.7 volt lithium ion batteries. The block diagram describing the general system design
is displayed in Figure 5.6.1.A below; the power system is selected with a red border. Each of the
lithium ion charge controllers are connected to a solar cell module input. Each charge controller is
connected to a lithium ion battery. Two out of the three charge controllers’ load pins are then
connected in series and that is connected to the main PCB which has the sensors, microcontrollers,
GPS, and communication system. To be more specific, the input connection on the PCB is the
same connection as the LF50CV step down voltage regulator. Therefore the input voltage of 7.4
volts is converted to 5 volts.

74
Figure 5.1.6.A Block Diagram of the W.A.R. Power System (Highlighted in Red)
The last charge controller is also connected to a lithium ion battery. The load connection from that
charge controller powers the DC motor. From the previously mentioned calculations, the battery
ideally should be able to power the DC motor for approximately 5.7 hours. However, that amount
of time is an ideal number, and due to inefficiencies in the charge/discharge cycle in practice the
actual run time is expected to be less than that.
The charge controller used for the W.A.R. design is the Microchip MCP73871. The specifications
for the charge controller are displayed in Table 5.1.6.A. below.
Parameter Value
Maximum Voltage 6V
Regulated Charge Voltage 4.08 – 4.12V
Maximum Output Current 500mA
Output Leakage Current 0.01μA
Low Output Voltage 0.4 – 1V
Low Battery Detection Hysteresis 150mW
Operating Temperature -40°C to +85°C
Charge Impedance Range 1 – 20 Ω
Table 5.1.6.A: Lithium Ion Battery Charge Controller MCP73871 Specifications

75
The schematic image for the MCP7381 lithium ion charge controller chip is displayed in Figure
5.1.6.A below:
Figure 5.1.6.A Schematic of MCP7381 Connections
The segment on the left of the schematic represents the power input connections. It displays the
barrel jack connection along with the female type header, both of which share the same node. The
female header is mainly used during testing purposes so that it is easier to connect and disconnect
different power sources. For the final design, only the barrel jack connection is used, which
provides a secure connection. That segment also includes two capacitors each for stability at the
input connection.
Next, the MCP7381 chip is displayed in the middle. The two resistors which are modified for the
VPCC are connected at the VPCC pin, and use the voltage divider equation previously mentioned
to program the desired VPCC voltage value. To the left of the chip are the three status LED’s. The
first indicated if a good power source is connected; the second indicates if the battery is charging,
the third indicates when the battery is fully charged.
Lastly, on the right top side there is the female header that leads to the output load. And on the
bottom right side is the female header that leads to the input of where the lithium ion battery is
connected.
5.1.7 GPS
The GPS module that is chosen is the 20 Channel EM-406A SiRF III Receiver with Antenna
(EM-406A). The specifications for this module are shown in Table 5.1.7.A.

76
Parameter Value
Number of Channels 20(all-in-view tracking)
Frequency L1, 1575.42MHz
Sensitivity 159dBm
Update Rate 1Hz
Hot Start 1s
Cold Start 42s
Max Altitude <18,000m
Max Velocity <515m/s
Power Consumption 44mA
Power Input 4.5V - 6.5V
Price $39.95
Table 5.1.7.A EM-406A Specifications
Figure 5.1.7.A shows how the EM-406A is connected to the ATmega328P microcontroller.
Figure 5.1.7.A Pin Connections between EM-406A and ATMega328P
5.1.8 Motor
For the motor we decided to use a standard DC brushed motor bought from a local hobby store.
This motor is rated 3-24V. After testing the motor in the senior design lab, it was found that 3V

77
and unloaded the motor drew 200 mA. After loading it with the propeller shaft and testing with
3.7V, the voltage of the lithium ion batteries, it was found the motor drew 450 mA. Even though
a brushless motor is much faster, has higher torque and a longer live span that brushed motors, a
brushed motor was ultimately chosen since it was much cheaper and did not require a speed
controller in order to run.
Parameter Value
Max Current 20A
No-load Current 200 mA
Resistance 0.0399 ohms
Diameter * length 20mm * 40mm
Shaft Diameter 2.3mm
Shaft Length 10mm
Weight 60g
Price $4.99
Table 5.1.8.A Specifications for brushed DC motor that was used in this project
Figure 5.1.8.A shows the brushed DC motor and its mount inside the boat.
Figure 5.1.8.A shows the brushed DC motor that was chosen for his project.

78
5.1.9 GPS Compass
For the GPS compass, the group decided to use the Honeywell HMC6352 which is a fully
integrated compass module that combines 2-axis magneto-resistive sensors with the required
analog and digital supports circuits as well as the algorithms needed for heading computation. The
specifications of this module are detailed below in table 5.2.9.A. Originally we planned to use a
compass if the GPS module could not provide a reliable course reading but we didn’t not run into
that problem.
Characteristics Conditions Min Typical Max
Supply Voltage Vsupply to GND 2.7V 3.0V 5.2V
Supply Current Vsupply to GND
Sleep Mode (Vsupply = 3.0V)
Steady State (Vsupply = 3.0V)
Steady State (Vsupply = 5.0V)
Dynamic Peaks
1µA
1mA
2mA
10mA
Field Range Total applied field 0.10G 0.75G
Heading Accuracy HMC6352 2.5degRMS
Heading Resolution 0.5deg
Operating
Temperature
Ambient -20°C 70°C
Storage Temperature Ambient -55°C 125°C
Moisture Sensitivity MAx 240°C MSL3
Output Heading, Mag X, Mag Y
Size 6.5 x 6.5 x 1.5 mm
Weight 0.14g
Table 5.1.9.A HMC6352 Specifications

79
5.2 Software
Microcontroller Programming: Each microcontroller is programmed using the Arduino IDE.
Before each Atmega328P can be used with the Arduino IDE the user must burn the Arduino
bootloader onto the chip. By using the Arduino bootloader the user can use the large number of
libraries that Arduino has to offer.
Microcontroller Configuration: Both microcontrollers are programmed differently as both
have different tasks. The first microcontroller gathers water quality data from the circuits. Each
microcontroller is programmed to poll each water quality circuit for a set amount of time. The
microcontroller switches to each water quality circuit using the multiplexer once the set amount
of time has expired. Once the microcontroller receives data from the circuit it saves the byte of
data and send it off to the XBee Pro which in turn transmits this data to the onshore PC.
The second microcontroller is responsible for navigation. Once the user enters the desired
coordinates for W.A.R. to travel, the microcontroller will calculate the distance and direction it
must travel to. It then powers the motor and control the servo for the rudder and start the
movement.
XBee Pro Configuration: The XBee Pros does not require any programming on the chip. The
only software used on the XBee Pro is the X-CTU. X-CTU which is used to configure each
XBee Pro so that they know to communicate to each other. Each XBee Pro is considered
configured when their PAN ID matches the other so they are on the same network.
Desktop Application: For the water quality data to appear on the PC, the group is using any
open source terminal software. Since the XBee Pro connected to the PC sends the serial data
through a COM port this is the easiest way. The terminal software is configured so it keeps logs
of data so the user can create a water quality archive. The desktop terminal software is used to
send GPS coordinates to the boat and to display the water quality readings.
5.3 Mechanical
W.A.R includes a brushed DC motor that is connected to the navigation microcontroller
(ATmega328P). A lithium ion battery powers the motor with approximately 3.7V and 450 mA of
current draw which causes the boat to move forward. For steering, the design uses a servo that is
also powered and connected to the ATmega328P. On the microcontroller’s command the servo
moves the rudder to the appropriate angle so that the boat can travel to the waypoint that was
inputted. The RC boat hull needs some modifications in order to sail properly. The modifications
are the following: the shaft hole has to be drilled, the exit hole for the servo wire, exit hole for the
antenna, exit holes for the sensors, and mounting the solar panel on top of the boat.

80
6.0 Project Prototype and Coding
6.1 Robot Platform
To prototype the robot platform the empty frame is placed in a body of water and test how much
weight the boat hull can handle. Testing of how much weight the boat can handle will begin by
gradually adding weight inside the hull. Half a pound is added to the boat each iteration until the
boat begins to take on water. When the boat starts taking in water we record the max weight it may
handle and design how much weight we can put on the boat.
6.2 Water Quality Circuit/Sensor Prototype
To prototype the water quality circuit and sensors a small prototype is built, that will output the
water quality data to a PC using serial communication. This prototype is built on a breadboard
using our Arduino Uno, the water quality circuit, and the sensor. The circuit reads the data from
the sensor and sends the water quality to the microcontroller, which then transmits the output to
the PC. This simple configuration is also be used for calibrating the sensors due to the easy setup.
The connections are used for the prototype are very simple since all data will be passed using TX
and RX pins. First, the water quality circuits RX and TX pins are connected into the Arduino Uno
digital I/O pins. The pins are used in the code and create a software serial port from these pins.
This frees up the hardware serial pins on the Arduino that connect to the PC. Therefore, allowing
full communication between the water quality circuit and the PC.
The purpose of this prototype is to proof the design of this project. This allows the group to work
with the code necessary to start connecting multiple water quality circuits/sensors. Once the
prototype working the group begins the final design of the water quality PCB.
6.3 XBee Pro and Microcontroller Prototype
One of the more important features of our project is the wireless communication between the PC
and the Atmega328P. The prototype for this communication is implemented by sending simple
character from the PC and having the Atmega328P echo the character back to the PC wirelessly.
All of the communication is sent through the two XBee Pros connected to our microcontroller and
PC.
To build this prototype, the microcontroller RX and TX pins are connected to the XBee Pro DIN
and DOUT pins. This allows for serial data to be sent between the two devices. To prepare the PC
all that is needed is a USB to XBee explorer to connect the devices. Once everything is setup the
group tests the prototype by opening our open source terminal software and sending a character to
our microcontroller. To acknowledge that the microcontroller has received the data it echoes back
the same character.
This prototype is very beneficial to the final integration because it gives the group a general idea
of the base code and on sending serial data back and forth from the microcontroller to the PC. It’s
important to keep in mind that on the final design the PC and microcontroller will are sending back
just a simple character but instead strings of data from the water quality sensors.

81
6.4 USB Programming
To program the microcontroller, a Arduino Uno development board is used. The development
board has a USB interface which allows the group to program each microcontroller from the
computer. After programming the microcontroller, it will be removed from the Arduino Uno and
placed onto the main PCB.
6.5 Multiplexer Prototype
To ensure that the communication between all the water quality circuits and the PC works the
group build a simple prototype using the microcontroller and multiplexer. To accomplish this
multiplexer the two PCs are connected to the multiplexer on different select lines and have the
microcontroller choose which PC to communicate with.
With a PC selected a character is sent through an open source terminal software and have the
microcontroller echo the same character back. The microcontroller then selects the second PC and
tries to communicate with it.
6.6 GPS Prototype
Before integrating the GPS module into the final design of the project the group build a simple
breadboard prototype. This prototype familiarizes us with the GPS and how it works when it comes
to our final design. To prototype the GPS module the group connected the microcontroller to the
GPS and has the microcontroller send the current GPS coordinates to our PC. The GPS
communicates with the RX and TX pins on the microcontroller and the PC displays the coordinates
using software serial connection from the USB to our Arduino Uno development board.

82
7.0 Project Prototype Testing
7.1 Hardware Electrical Components/Configurations
For all of the electrical components testing of the resistors, capacitors, inductor values, and power
source outputs will be measured and recorded to try to eliminate as much error as possible.
Solar Cells
Before permanently connecting all of the solar cells together to as a module, each solar cell needs
to be tested separately. The testing will be done to make sure that the solar cell works, and to verify
its outputs in the different weather conditions and time of day. The goal of this testing is to make
sure that on average there is enough sunlight to provide to the solar cells to fully charge the lithium
ion battery. Each of the solar cells will be taken outside in the morning around 9am, at noon, and
around 3pm to monitor its current and voltage characteristics. By looking at the minimum and
maximum current and voltage output of each solar cell of all weather conditions, we will estimate
approximately how much time it’s going to take to fully charge the battery.
Next, the cells will be connected to form modules and a clear plastic will be used to cover the cells
for protection against severe weather and debris. To view how impedance affects when all of the
cells are connected together, its output voltage and current will once again be measured outside.
To see how the module efficiency differs from each of the solar cells being connected, the output
characteristics will be measure at the same times of the day: 9am, 12pm, and 3pm.
After the testing of the solar cells is complete, the output characteristics of the module will be used
to estimate the amount of time it will take to charge the battery to a desired level.
DC to DC Step Down Converter
To test the DC to DC step down converter and to make sure it accurately converts a high input
voltage to a low output voltage several testing procedures are conducted. The input pin VIN,is
connected to a DC power source. The input voltage is then varied and measured for the range of
5.5 - 16V, that is done in order to make sure that the varying input range does not affect the output
voltage. The output pin,VOUT, of LF50CV, shown below in Figure 7.1.A, is hooked up to a voltage
meter and the output voltage is measured for the varying input voltages.
Figure 7.1.A LF50CV Circuit Configuration

83
Charge Controller
Testing the charge controller is an extremely important part of the prototype testing. Throughout
the testing of the lithium ion battery charge controller MCP73871, it’s important to take all
precautions not to short or overcharge the lithium ion battery. Since the charge controller chip is
a QFN package it is extremely difficult to test without it actually already being assembled and
soldered on the PCB. Therefore the testing for the actual lithium ion charge controller is conducted
once all of the components are soldered on the charge controller PCB. The actual assembled charge
controller is shown in Figure 7.1.D below.
Figure 7.1.D Assembled Li-Ion Charge Controller
Once all of components are connected on the charge controller PCB, the input is connected to a
DC power supply, which will mimic the solar cell module. The input voltage is fluctuated between
4.0 – 6 volts to mimic the varying weather conditions. Meanwhile, connected to the battery output
is a multimeter which reads what voltage the battery is receiving. If the voltage value is a predicted
value of around 4.2V then it is safe to connect a lithium ion battery and make a break in the
connection and measure the input current. The same testing procedure is directed at the load output
node. If any sort of inaccurate readings occur, an oscilloscope is probed at each pin connection of
the MCP73871 chip and further debugging analyses is conducted.
Its important to make sure that the VPCC is working accurately and the output voltage stays the
same despite the varying input voltage. To make sure that the VPCC is working accurately, the
output voltage should be 4.2 volts and the current should be lower if the voltage at the input (the
simulated solar cell module) is a lower value.

84
Lithium Ion Battery
Due to the fragile chemistry of the lithium ion batteries a built in printed circuit board controller
is included with each battery to prevent explosive and harmful accidents. The included PCB cuts
off the current going into the battery if the battery reaches a voltage above 4.3 volts or will not
charge it if the battery connected is 2.5 volts, at which point it renders it unchangeable. Also, the
PCB protective circuit stops any input current if the battery exceeds a temperature of 90°C/ 194°F.
However, this controller is not reliable enough and is unable to handle varying voltages with
efficiency; therefore it’s not enough to substitute the solar panel/lithium ion battery charge
controller.
In order to get a general idea for how long the lithium ion battery is able to operate for, general
time estimation is done. The battery is delivered along with its specification information. The
“amp-hour” of the battery is able to indicate its duration. The calculation is performed using one
of the two following equations:
OR
The hours’ time that is given by the equation is approximately how long it will take to recharge
the battery after it has been fully discharged. The number of hours given by this equation gives the
time it would take to charge the battery to about 80%. The rest of the 20%, calculation is not as
predictable and can take just as much time or more to charge only that small 20%. Fortunately, it
is not recommended to charge a lithium ion battery to full capacity, because that would damage
the battery itself.
7.2 External Frame/Robot Platform
It is very important that the hull is waterproof and so that the inside electronics do not ever get
wet. To test for this, the boat is placed in a tub of water and completely submerges the hull,
ensuring the insides are dry. As the group purchased a quality made waterproof hull this should
not be a problem. The only problem that might arise is with any modifications that the group will
decide to do to the hull. After all the electronics are placed inside the hull, the boat must still be
able to float. The motor must still be able to propel the boat forward despite the additional weight,
as must he servo be able to turn the rudder in and outside of water. The boat must also be able to
take sharp turns without capsizing. The speed of the boat is regulated to avoid capsizing or losing
contact with the surface of the water as the sensors must be in the water to work properly.
7.3 XBee Pro Communication Test
Below are the steps we will take test that both XBee Pro are able to communicate with each other.
1. Upon boot up both XBee Pros check its own PAN ID and find other modules with the same
ID that it can communicate with.
2. Once the XBee Pros are connected the user tests the communication by sending it a
character and wait for the character to be sent back.

85
3. If the character is sent back correctly and in a reasonable time then we can confirm that the
XBee Pros are correctly communicated so the user can start taking water quality
measurements.
4. If the connection is never made then each XBee Pro module must be reconfigured using
the X-CTU software and checking to make sure that the PAN ID and baud rate settings are
set correctly.
7.4 XBee Pro Range Testing
In order to ensure that the group is able to transmit data from W.A.R. to our onshore PC the
group tests the range of the XBee Pro. The maximum line of sight distance of our XBee Pro is
1500 meters. Our assumption is that the XBee Pro is outside and has possible interference in the
area so the 1500 meters may decrease. To test the devices the group acquires a USB to XBee
explorer for the onshore PC and connects the second XBee Pro to our Atmega328P. Once the
two XBee Pros is configured the group tests the connection range by continuously sending data
back and forth. As data is being sent back and forth as the distance is increased.
At any point if the data becomes corrupted or connection is terminated where no data is returned
then that determines the connection range for the XBee Pros. Due to the fact that there are many
factors when transmitting data long distance the group is conservative on the distance that W.A.R.
and the onshore PC can communicate.
7.5 Autonomous Motion
The testing for the W.A.R is done in a large body of water that is particularly close to our current
location, this body of water is called Lake Claire. The group plans to input a GPS coordinates and
then ensure that the boat travels to the waypoint with some leeway for GPS error. Testing is done
on a clear day in spring so that the water is smooth and not rough. Commands are sent to the
navigation microcontroller which in this case is an ATmega328P through a terminal that is
positioned on the lake’s shore. This terminal is a laptop. For testing purposes, the group has the
boat send back what it thinks its current coordinates are. That way the group can calibrate where
the desired location while still taking into account any GPS error in coordinates.
The goals of the testing are as follow: the boat should be able to travel successfully to a user
selected waypoint; the boat should stop at the waypoint and take water quality measurements,
transmit water information to terminal and return when the user chooses or after a predetermined
amount of time has elapsed. The boat should be able to take sharp turns, the boat should not capsize
under any conditions, the servo should turn the rudder to the appropriate angle and the motor
should spin with enough speed and torque to move the boat but leave the surface of the water.
7.6 GPS Function Test
To test the EM-406A GPS module the SiRFdemo software is used provide by Falcom. The
SiRFdemo can be used to access the advanced settings of the GPS receiver, check factory setting
and modify them. It can also be used to restore factory defaults and verify the revision of the
firmware loaded on the receiver.

86
To use the SiRFdemo the receiver is connected to the PC via a USB/D89 adapter. Once the
software has been run there are various navigation parameters that can be viewed in the response
view window. They can be made to appear by doing a \Poll\Navigation Parameters command. The
various navigation parameters are follows:
Operating Mode: defines the operating mode when optimal reception ($+ satellites) is no longer
available.
Track Smoothing: will smooth the track to remove the jumps resulting from the natural
inaccuracy of the GPS system, this is disabled by default.
Static Navigation: will freeze the position at very low speeds to cancel out the drifting resulting
from the natural inaccuracy of the GPS.
DOP: filtering based on quality of the reception.
Power: to configure power saving trickle modes.
Most settings will remain untouched except for the static navigation; the group plans to test both
options in order to see which one is better for the boat. In order to disable static navigation, a
\Navigation\Static Navigation\command must be used, follow by clicking on “Disable” and then
send. By calling the navigation parameters again, the group can verify that the change has been
recorded by the GPS.
As NMEA is the universal GPS language, after testing has been completed, the user returns to that
mode. To keep the modified settings, the user can do a \Action\Switch to NMEA Protocol\
command then select 4800 for the baud rate then send. To set the GPS back to its factory settings,
the user implements a \Action\Initialize Data Source\Factory Reset then send.
7.7 Water Quality Circuits/Sensors Calibration
To calibrate and make sure the sensors and the embedded circuits are working correctly the group
assembles each water quality circuit with its respective sensor on a breadboard. The output from
each water quality circuit is the output to terminal software on a PC. With each circuit and sensor
connected correctly the user follows these steps to ensure correct functionality:
1. Dip the sensor into a known solution. For example, using the pH circuit/sensor, the user
dips the sensor into a 7.0 pH solution.
2. Stir the sensor around the solution and wait for the measurements to appear on screen.
3. If the measurement is accurate to the solution the sensor was dipped into then the user
knows it is calibrated correctly.
4. If the measurement is not accurate then try another calibration solution and see if the
measurement is off.
5. If accuracy continues to be a problem then the sensor may need to be cleaned due to
residual solutions.
7.8 Waterproofing
To ensure that the electronics in the hull of W.A.R. are not damaged the group makes sure no water
enters W.A.R. is idle or moving. The waterproofing process begins by placing the empty hull in
water and seeing if any water enters the hull. If there is a breach in the hull we plan to fill the
problem area with a marine epoxy. Next W.A.R. is moved around to see if water will enter during

87
movement. Again if water enters the hull the group determines where the problem areas are and
see if we can solve the problem with the marine epoxy.
Since the solar panels need to be outside the hull to get sunlight we need to make sure the solar
panels and its wiring do not get wet. To waterproof the solar panels, a custom solar panel was
made out of plywood and fiberglass. The clear fiberglass still allows sunlight through, so the
batteries can still charge. The cells lie out a piece of cardboard that is on top of a piece of plywood.
A spacer is placed on each corner and a piece of fiberglass is placed on top of the PV cells. The
open space is then sealed with waterproof sealant.
7.9 Demo Testing
Once all subsystems are integrated together the final demo testing on W.A.R. is conducted. In this
testing W.A.R. is treated as if we were end users using our product. In this test the group begins
by entering GPS coordinates into our navigation microcontroller. Once the distance and directions
are calculated W.A.R. begins moving.
During the travel to the GPS coordinates the sensors do not take any measurements unless it
receives commands from the onshore PC. Upon arrival to the GPS coordinates the group tests the
water quality commands by sending all possible commands to the water quality microcontroller.
With each command entered the user ls all outputs and make sure the data is consistent. Once the
user is done collecting the water quality data, W.A.R. returns home, the shore. To test the solar
panels and the power supply for W.A.R. the group continuously runs the demo tests multiple times
until there is no more charge in our batteries. Once the batteries are depleted the group waits to see
if the solar panels are charging the batteries.

88
8.0 Administrative Content
8.1 Milestone Discussion
After finishing this Senior Design II the group was on schedule with what was originally planned
in the milestone chart. With almost daily meetings between engineers, the team was able to keep
on track with only minor complications that were easily resolved within a few days. Some
complications included programming issues, malfunctioning parts, general testing which revealed
design flaws. Below in Figure 8.1.A is the milestone chart for this project.
Figure 8.1.A Milestone Chart
With the completed project, all documentation and resources will be published to the UCF EECS
Senior Design Website. The group plans to design their own website with biographies of each
team member and information on the project.
8.2 Finances and Budget
This project was sponsored by Duke Energy. Despite being sponsored by Duke Energy careful
consideration was placed on costs of parts. After the initial documentation and research this project
will cost around $1150. Unfortunately due to the price of water quality sensors the price of this

89
project was higher than expected. Below is a more finalized budget table compared to our initial
budget table earlier in our paper.
Part Cost Per Unit Quantity Total Cost
Scientific Grade pH Sensor -------------------------------- pH Circuit
$60 ------------------------ $28
1 $88
Field Ready Temperature Sensor $18 1 $18
Dissolved Oxygen Sensor ----------------- D.O Circuit
$160 ------------------------ $33.00
1 $193
Oxidation Reduction Potential Sensor -------------------------------- ORP Circuit
$90.00 ------------------------- $28.00
1 $118.00
Conductivity Sensor -------------------------------- Conductivity Circuit
$105.00 -------------------------$43
1 $148.00
Microcontroller (specific model TBD)
$15.00 2 $30.00
Microcontroller Development Board
$50.00 1 $50.00
GPS unit $20.00 1 $20.00
1-to-8 MUX - 74HCT4051 $1.00 5 $5.00
Diode Free* 4 $0.00
PV Cells $146.00 + $40(Shipping)
1 $186
Lithium-Ion Battery $45.00 1 $45
MPPT $12.00 1 $12.00
AC to DC Power Converter $40.00 1 $40.00
Breadboard $10.00 1 $10.00
Wiring $10.00 1 $10.00
PCB Manufacturing $50.00 1 $50.00
Rudder $10.00 1 $10.00
Rudder Servo $20.00 1 $20.00
Propeller $5.00 1 $5.00
Motor $10.00 1 $10.00

90
Robot Frame/Platform $80.00 1 $80.00
Total Cost of Buoy Bot $1148.00
Table 8.1.A – Updated Projected Costs
8.2.1 Sponsorship
The W.A.R Boat Senior Design Project is entirely funded by Duke Energy. Having the project be
entirely funded by Duke Energy made it easier for group to focus more on the technical aspect of
the project, and worry less on the having to provide the funds themselves. In addition to that,
because the project was sponsored by Duke Energy the engineers were able to select precise
equipment, such as the sensors, to make sure that their data was extremely accurate. The engineers
are incredibly thankful for Duke Energy providing them sponsorship on their Senior Design
Project.

91
Appendix A: Works Cited
APHA. 1992. Standard methods for the examination of water and wastewater. 18th ed. American Public Health Association, Washington, DC. River Watch Network. 1992. Total alkalinity and pH field and laboratory procedures (based on University of Massachusetts Acid Rain Monitoring Project). July 1.
APHA. 1992. Standard methods for the examination of water and wastewater. 18th ed. American
Public Health Association, Washington, DC.
Hach Company. 1992. Hach water analysis handbook. 2nd ed. Loveland, CO.
Mississippi Headwaters River Watch. 1991. Water quality procedures. Mississippi Headwaters
Board. March.
Donovan, John. "Bluetooth Goes Ultra-Low-Power - Wireless Solutions | DigiKey Technology
Zones." Bluetooth Goes Ultra-Low-Power - Wireless Solutions | DigiKey Technology Zones. N.p.,
n.d. Web. 15 Sept. 2013.
<http://www.digikey.com/us/en/techzone/wireless/resources/articles/bluetooth-goes-ultra-low-
power.html>.
"Different Types of Photovoltaic Systems." Different Types of Photovoltaic Systems. N.p., n.d.
Web. 10 Sept. 2013. <http://www.polarpowerinc.com/info/operation20/operation23.htm>.
"Is Lithium-ion the Ideal Battery?" Advantages & Limitations of the Lithium-ion Battery. N.p.,
n.d. Web. 10 Oct. 2013.
<http://batteryuniversity.com/learn/article/is_lithium_ion_the_ideal_battery>.
"Lead Acid Batteries - Battery Council International." Lead Acid Batteries - Battery Council International. N.p., n.d. Web. 10 Oct. 2013. <http://batterycouncil.org/?page=Lead_Acid_Batteries>. Ness, Tomek. "Arduino Playground - 4051." Arduino Playground - 4051. N.p., n.d. Web. 17 Sept. 2013. <http://playground.arduino.cc/learning/4051>. "MSP430G2553(ACTIVE)MSP430G2x53, MSP430G2x13 Mixed Signal Microcontroller." MSP430 Ultra-Low Power 16-bit MCUs. N.p., n.d. Web. 18 Sept. 2013. <http://www.ti.com/product/msp430g2553>. "ATmega328P." ATmega328P. N.p., n.d. Web. 18 Sept. 2013. <http://www.atmel.com/devices/atmega328p.aspx>. Hewes, John. "Power Supplies." Power Supplies. N.p., n.d. Web. 24 Sept. 2013. <http://electronicsclub.info/powersupplies.htm>. Byers, TJ. "Build a Solar Battery Charge Controller." Mother Earth News. N.p., n.d. Web. 24 Sept. 2013. <http://www.motherearthnews.com/diy/solar-battery-charge-controller.aspx>.

92
"How to Prolong Lithium-based Batteries." - Battery University. N.p., n.d. Web. 20 Oct. 2013. <http://batteryuniversity.com/learn/article/how_to_prolong_lithium_based_batteries>.
"MikroElektronika." MikroElektronika - Development Tools, Compilers, Books. N.p., 2009. Web.
15 Oct. 2013. <http://www.mikroe.com/downloads/get/640/en_article_c_avr_04_09.pdf>. "GPS Tracking Comparisons." SparkFun Electronics. N.p., n.d. Web. 15 Oct. 2013.
<https://www.sparkfun.com/tutorials/169>. McCabe, Patrick. "Fundamentals of a GPS guided Vehicle" Let's Make Robots! | Let's Make
Robots! N.p., May 2010. Web. 17 Oct. 2013. <http://letsmakerobots.com/node/19554>. Von Eppinghoven, Ralph. "How to Install a Steering Servo." Offshore Electrics. N.p., n.d. Web.
23 Nov. 2013. <http://www.offshoreelectrics.com/info-pages/install-sterring-servo.php>. Elia. "ATmega Servo Tutorial." Elias Electronics Blog. N.p., 04 Nov. 2011. Web. 26 Nov. 2013.
<http://eliaselectronics.com/atmega-servo-tutorial/>. "Three Phase Permanent Magnet Motor." Atmel Corporation - Microcontrollers, 32-bit, and
Touch Solutions. Atmel Corporation, n.d. Web. 13 Nov. 2013.
<http://www.atmel.com/Images/doc8010.pdf>. Gironi, David. "Controlling DC Motor Speed and Direction with AVR Atmega." Davide Gironi:
Controlling DC Motor Speed and Direction with AVR Atmega. N.p., 06 Mar. 2013. Web. 01 Dec.
2013. <http://davidegironi.blogspot.com/2013/03/controlling-dc-motor-speed-and_6.html>. "Propeller." Radio Control Info. N.p., n.d. Web. 24 Sept. 2013.
<http://www.radiocontrolinfo.com/ElectricBoat/propeller.php>. "Motor." Brushless Motor Electric Boat Selection, How to Choose / Pick a Suitable Brushless
Motor. N.p., n.d. Web. 22 Sept. 2013.
<http://www.radiocontrolinfo.com/ElectricBoat/motor.php>. "Hull." RC Electric Boat Hulls, Catamaran, Tunnel, Hydro, Outrigger, Mono, Hatch, Hatch Tape.
N.p., n.d. Web. 24 Sept. 2013. <http://www.radiocontrolinfo.com/ElectricBoat/hull.php>. "Boat Guided by GPS Example." Acroname Robotics. N.p., n.d. Web. 07 Oct. 2013.
<http://www.acroname.com/examples/10071/10071.html>. Drain, John. "RC Servos and What They Do." PT Boat Servo's. N.p., 2006. Web. 08 Nov. 2013.
<http://www.pt-boat.com/electric/Servo.html>. Molle, Harald. "Ardupilot Goes into the Water." DIY Drones. N.p., 30 Mar. 2010. Web. 17 Nov.
2013. <http://diydrones.ning.com/profiles/blogs/ardupilot-goes-into-the-water>

93
Appendix B: Letters of Copyright Use
All copyright permissions for figures used are listed in order in which they
are used in this document.
Figure 3.2.3.A http://www.epa.gov/acidrain/education/site_students/phscale.html
http://www.epa.gov/students/faq.html
Figure 3.2.4.A http://www.engineeringtoolbox.com/oxygen-solubility-water-d_841.html
Permission from engineeringtoolbox.

94
Figure 3.2.6.A Permission Pending
http://www.mikroe.com/downloads/get/640/en_article_c_avr_04_09.pdf
Figure 3.2.10.A http://bama.ua.edu/~bwbuckley/projects/mppt.html

95
Figure 3.2.15.A http://playground.arduino.cc/learning/4051
Figure 3.2.16.A Reprint with Permission from electronicsclub.info

96
Figure 3.2.17.A Permission Pending
Figure 3.4.10.A
Figure 3.4.12.A
Figure 4.2.7.A
Figure 4.2.9.A
Figure 4.2.9.B
Figure 4.2.9.C
Figure 7.1.A
Figure 7.1.C

97
Figure 7.1.D