ir presentation - may 2014 final
TRANSCRIPT
8/12/2019 IR Presentation - May 2014 FINAL
http://slidepdf.com/reader/full/ir-presentation-may-2014-final 1/48
Energy Corporation
Resolute Energy is aregionally diversified growth
oriented E&P companyfocused on long-lived
domestic oil producing assets
Investor presentation
May 2014
(NYSE: REN)
8/12/2019 IR Presentation - May 2014 FINAL
http://slidepdf.com/reader/full/ir-presentation-may-2014-final 2/48
Cautionary statements
2
This presentation includes “forward-looking statements” within the meaning of the safe harbor provisions of the United States Private Securities Litigation Reform Act of 1995. Words such as“expect,” “estimate,” “project,” “budget,” “forecast,” “anticipate,” “intend,” “plan,” “may,” “will,” “could,” “should,” “poised,” “believes,” “predicts,” “potential,” “continue,” and similar expressions
are intended to identify such forward-looking statements. Such forward looking statements include statements regarding future financial and operating results; statements regarding ourproduction and cost guidance for 2014; liquidity and availability of capital including projections of free cash flow; future production and reserve growth; estimates of original oil in place,resource potential, decline rates and ultimate recoveries of oil and gas (EUR); anticipated capital expenditures in 2014 and the sources of such funding; our intent to pursue financingtransactions to monetize a portion of our interest in Greater Aneth Field and our plans to increase our activity in the Permian and Powder River Basins; our expectations regarding ouroperating, drilling, development and exploration plans and anticipated costs thereof; our anticipated revenues, lease operating expenses, general and administrative rates, tax rates andDD&A rates; anticipated CO2 injection rates and response; our plans and expectations regarding our development activities including drilling, deepening, recompleting, fracing and refracingwells, the number of such potential projects, drilling locations, and productive intervals, the anticipated timing, cost and rate of return of such activities, and the EURs and resource potential ofsuch projects; and the testing and prospectivity of our properties and acreage. Forward-looking statements in this presentation include matters that involve known and unknown risks,uncertainties and other factors that may cause actual results, levels of activity, performance or achievements to differ materially from results expressed or implied by this presentation. Suchrisk factors include, among others: the volatility of oil and gas prices including the price realized by Resolute for the oil and gas it sells; inaccuracy in reserve estimates and expectedproduction rates; discovery, estimation, development and replacement of oil and gas reserves and the risks associated with the potential writedown of reserves; the future cash flow, liquidityand financial position of Resolute; the success of the business and financial strategy, hedging strategies and plans of Resolute; the amount, nature and timing of capital expenditures ofResolute, including future development costs; availability and terms of capital; the effectiveness of Resolute’s CO2 flood program; the potential for downspacing or infill drilling in the Permian
Basin of Texas or obstacles thereto; uncertainty surrounding timing of identifying drilling locations and necessary capital to drill such locations; the timing of issuance of permits and rights ofway; the timing and amount of future production of oil and gas; availability of drilling, completion and production personnel, supplies and equipment; the completion and success ofexploratory drilling on our properties; potential delays in the completion, commissioning and optimization schedule of Resolu te’s facilities construction projects; operating costs and otherexpenses of Resolute; the success of prospect development and property acquisition of Resolute; the success of Resolute in marketing oil and gas; competition in the oil and gas industry;the impact of weather and the occurrence of disasters, such as fires, floods and other events and natural disasters; environmental liabilities; anticipated supply of CO 2, which is currentlysourced exclusively under a contract with Kinder Morgan CO2 Company, L.P.; potential delays in the upgrade of third-party electrical infrastructure serving Aneth Field and potential powersupply limitations; operational problems or uninsured or underinsured losses affecting Resolute’s operations or financial results; government regulation and taxation of the oil and gasindustry, including the potential for increased regulation of underground injection and fracing operations; risks and uncertainties associated with horizontal drilling and completion techniques;the availability of water and our ability to adequately treat and dispose of water after drilling and completing wells; changes in derivatives regulation; developments in oil-producing and gas-producing countries; Resolute’s relationship with the Navajo Nation and the local Navajo community in the area in which Resolute operates; the success of strategic plans, expectations andobjectives for future operations of Resolute; and Resolute’s level of indebtedness including our ability to fulfill our obligations under the senior notes and our credit facility. Actual results maydiffer materially from those contained in the forward-looking statements in this presentation. Resolute undertakes no obligation and does not intend to update these forward-lookingstatements to reflect events or circumstances occurring after the date of this presentation. You are cautioned not to place undue reliance on these forward-looking statements, which speakonly as of the date of this presentation. This presentation may include estimates of quantities of oil and gas using certain terms, such as “resource,” “resource potential,” “EUR,” “oil in place,”
or other descriptions of volumes of reserves, which terms include quantities of oil and gas that may not meet the SEC definition of proved, probable and possible reserves. These estimatesare by their nature more speculative than estimates of proved reserves and accordingly are subject to substantially greater risk of being recovered by Resolute. We believe our resourceestimates are reasonable, but such estimates have not been reviewed by independent engineers. Furthermore, estimates of resources may change significantly as development providesadditional data, and actual quantities that are ultimately recovered may differ substantially from prior estimates. Finally, 24 hour peak IP rates and 30 day peak IP rates for both our wells andfor those wells that are located near to our properties are limited data points in each well’s productive history and not necessarily indicative or predictive of future production rates, EUR oreconomic rates of return from such wells and should not be relied upon for such purpose. You are encouraged to review “Cautionary Note Regarding Forward Looking Statements” and Item1A. - Risk Factors and all other disclosures appearing in the Company’s Form 10-K for the year ended December 31, 2013, and subsequent filings with the Securities and ExchangeCommission for further information on risks and uncertainties that could affect the Company’s businesses, financial condition and results of operations. All forward-looking statements arequalified in their entirety by this cautionary statement.
Non-GAAP financial measures: This presentation includes certain non-GAAP financial measures. A reconciliation of these measures to the most directly comparable GAAP measure ispresented in the Appendix.
8/12/2019 IR Presentation - May 2014 FINAL
http://slidepdf.com/reader/full/ir-presentation-may-2014-final 3/48
Resolute overview
3
Company history
2 0 0 4
Resoluteformed
Aneth Field: Assetsacquired fromChevron Texaco
Aneth Field: Assets acquiredfrom ExxonMobil
Powder RiverBasin assets
acquired
IPO
EnteredBakken trend
– joint venturewith
GeoResources
ExpandedBakkentrend – farmout fromMarathon
DelawareBasin:
EnteredWolfbone
play
Reinforced PermianBasin presence –
Acquisitions in MidlandBasin, Delaware Basinand Northwest Shelf
MidlandBasin:
Acquiredproducingproperties
2 0 0 5
2 0 0 6
2009 2010 2011 2012 2013
Drilled firsthorizontal wells inMidland, Delawareand Powder RiverBasins
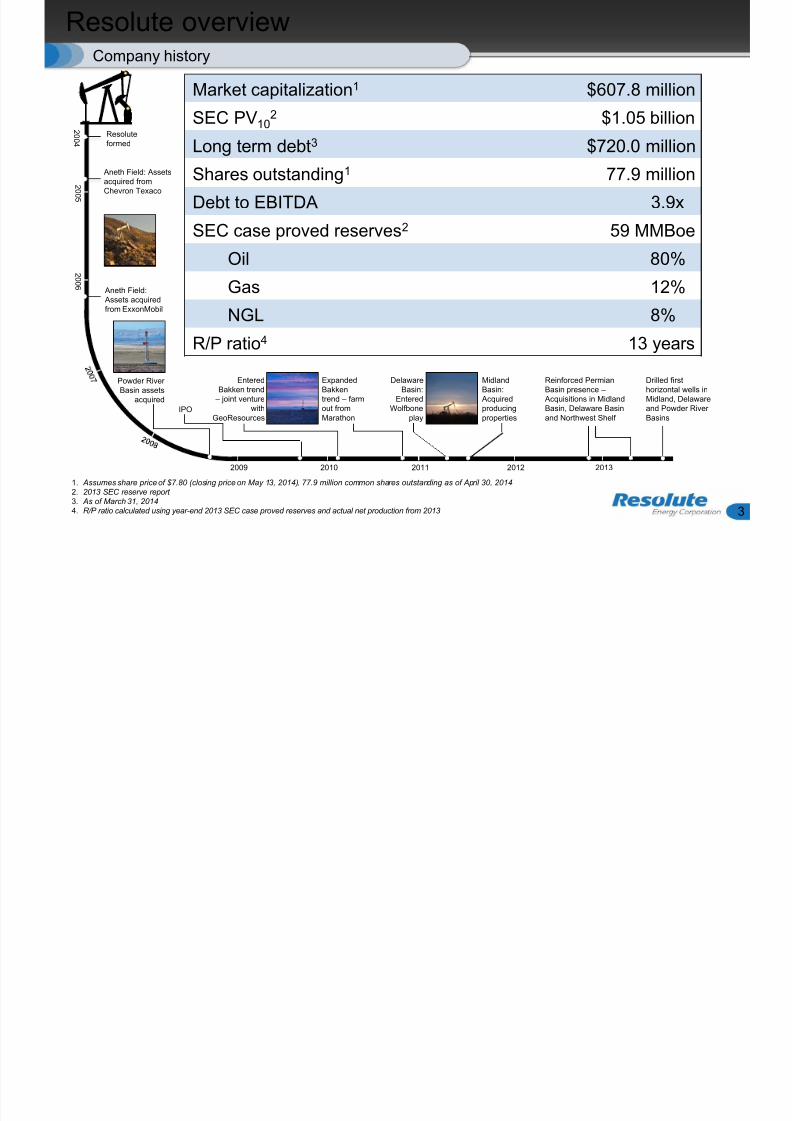
Market capitalization1 $607.8 million
SEC PV102
$1.05 billionLong term debt3 $720.0 million
Shares outstanding1 77.9 million
Debt to EBITDA 3.9x
SEC case proved reserves2 59 MMBoe
Oil 80%
Gas 12%
NGL 8%
R/P ratio4 13 years
1. Assumes share price of $7.80 (closing price on May 13, 2014), 77.9 million common shares outstanding as of April 30, 2014
2. 2013 SEC reserve report3. As of March 31, 20144. R/P ratio calculated using year-end 2013 SEC case proved reserves and actual net production from 2013
8/12/2019 IR Presentation - May 2014 FINAL
http://slidepdf.com/reader/full/ir-presentation-may-2014-final 4/48
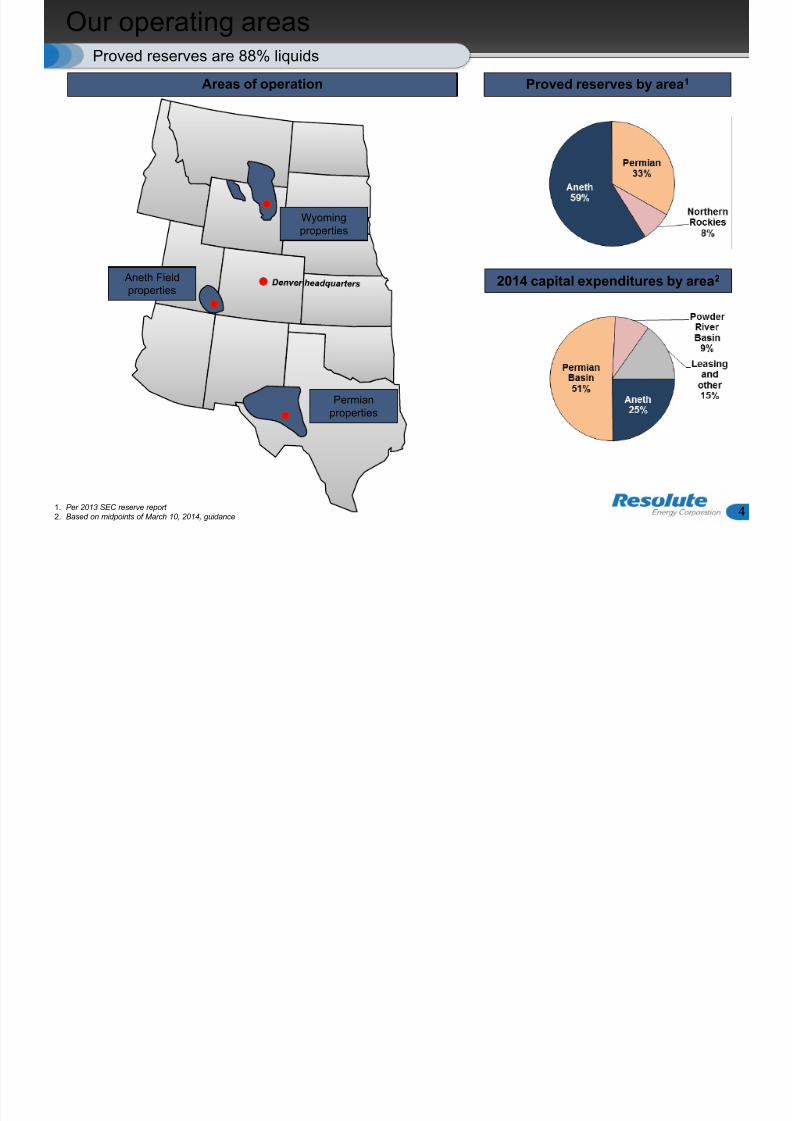
Our operating areas
4
Proved reserves are 88% liquids
Areas of operation Proved reserves by area1
2014 capital expenditures by area2
1. Per 2013 SEC reserve report2. Based on midpoints of March 10, 2014, guidance
Aneth Fieldproperties
Wyomingproperties
Permianproperties
8/12/2019 IR Presentation - May 2014 FINAL
http://slidepdf.com/reader/full/ir-presentation-may-2014-final 5/48
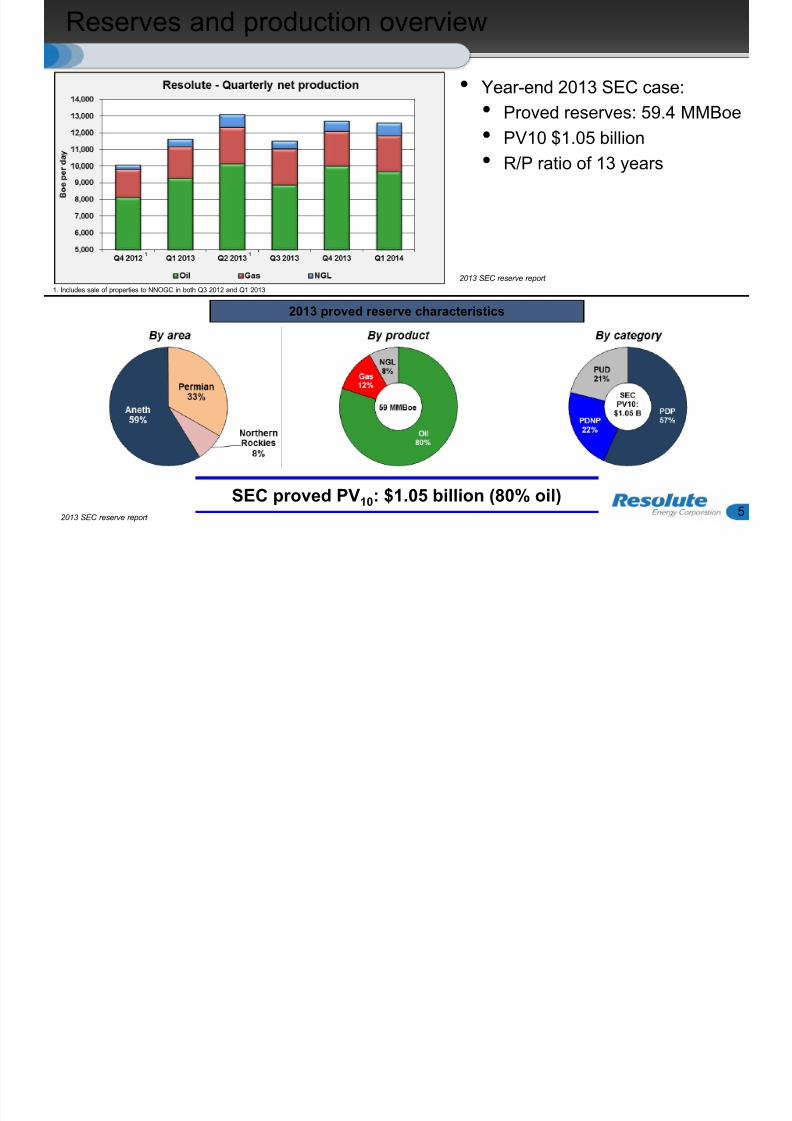
Reserves and production overview
5
2013 proved reserve characteristics
• Year-end 2013 SEC case:
•Proved reserves: 59.4 MMBoe
• PV10 $1.05 billion
• R/P ratio of 13 years
SEC proved PV10: $1.05 billion (80% oil)
2013 SEC reserve report
2013 SEC reserve report
1. Includes sale of properties to NNOGC in both Q3 2012 and Q1 2013
1 1
8/12/2019 IR Presentation - May 2014 FINAL
http://slidepdf.com/reader/full/ir-presentation-may-2014-final 6/48
Company overview
6
• In the Permian Basin Resolute completed meaningful acquisitions at year-
end 2012 and in March 2013
• We assumed operating responsibilities on most of the acquired properties in
the second quarter of 2013, began drilling in first quarter
• Our first three horizontal wells in the Midland Basin are producing
• Our first horizontal well in the Delaware Basin is producing, the second and
third have reached TD and the fourth is drilling
• In the Powder River Basin, Resolute is targeting the Turner
• Our first Turner horizontal well is producing above type curve
• Our second Turner horizontal well is drilling
• In Aneth Field, Resolute continues to increase production by expanding andoptimizing water and CO2 floods
8/12/2019 IR Presentation - May 2014 FINAL
http://slidepdf.com/reader/full/ir-presentation-may-2014-final 7/48
Financial transaction potential
7
• Evaluating a wide range of financing alternatives which would enable
Resolute to:
• Reduce outstanding debt
• Gain access to the capital required to allow the Company to
meaningfully accelerate its horizontal drilling activities in the Permian
and Powder River basins
• Our portfolio of assets provides significant flexibility in addressing these
opportunities
• Board of Directors has approved pursuing a financing transaction that would
• Monetize approximately half of our economic interest in Greater Aneth
Field in a yield-oriented tax-advantaged vehicle
• Continue our operating control over the field
• Retain access to a significant portion of the cash flow generated by this
asset and a meaningful stake in the reserves and production upside
embedded in the field
As discussed in earnings call on May 13, 2014
8/12/2019 IR Presentation - May 2014 FINAL
http://slidepdf.com/reader/full/ir-presentation-may-2014-final 8/48
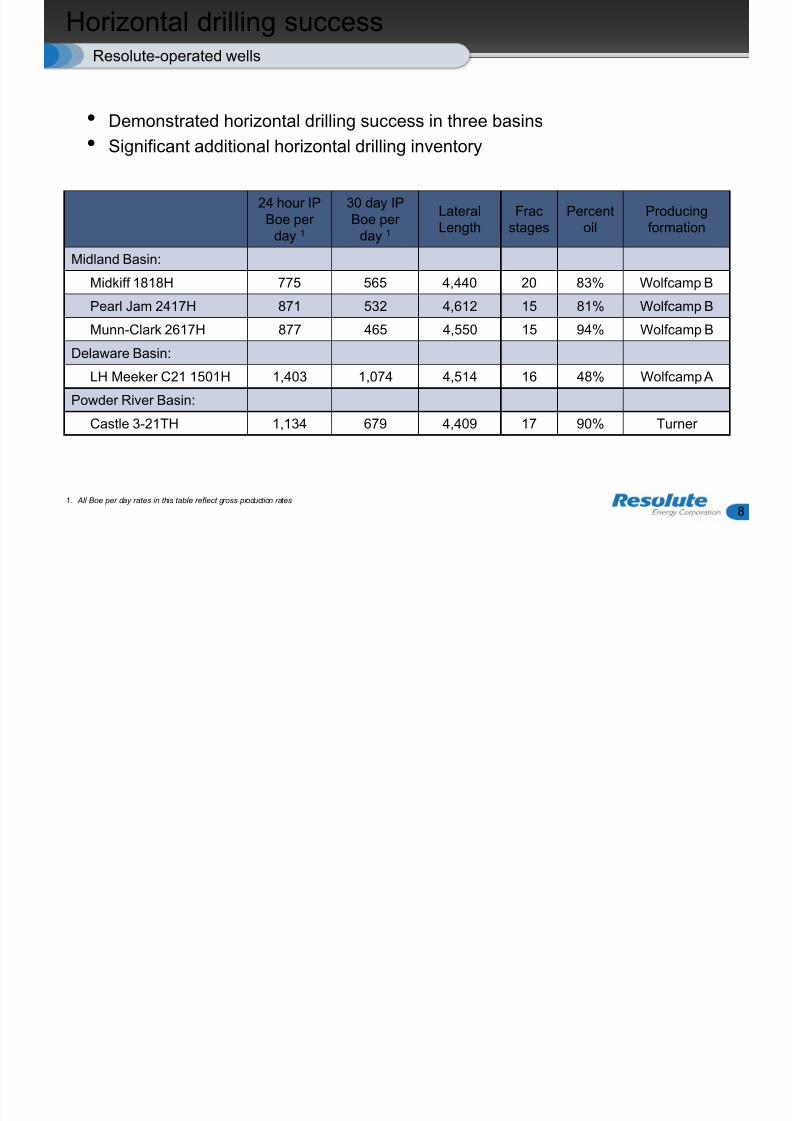
Horizontal drilling success
8
Resolute-operated wells
24 hour IPBoe per
day 1
30 day IPBoe per
day 1
LateralLength
Fracstages
Percentoil
Producingformation
Midland Basin:
Midkiff 1818H 775 565 4,440 20 83% Wolfcamp B
Pearl Jam 2417H 871 532 4,612 15 81% Wolfcamp B
Munn-Clark 2617H 877 465 4,550 15 94% Wolfcamp B
Delaware Basin:
LH Meeker C21 1501H 1,403 1,074 4,514 16 48% Wolfcamp A
Powder River Basin:
Castle 3-21TH 1,134 679 4,409 17 90% Turner
1. All Boe per day rates in this table reflect gross production rates
• Demonstrated horizontal drilling success in three basins• Significant additional horizontal drilling inventory
8/12/2019 IR Presentation - May 2014 FINAL
http://slidepdf.com/reader/full/ir-presentation-may-2014-final 9/48
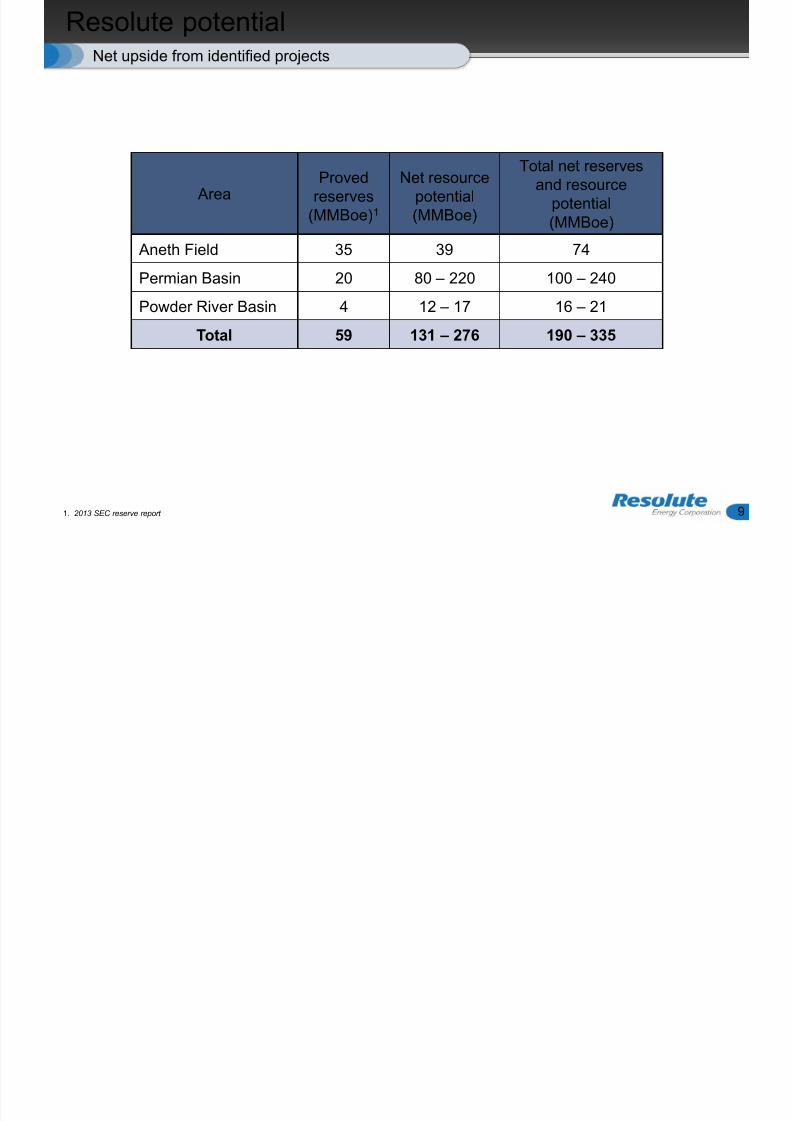
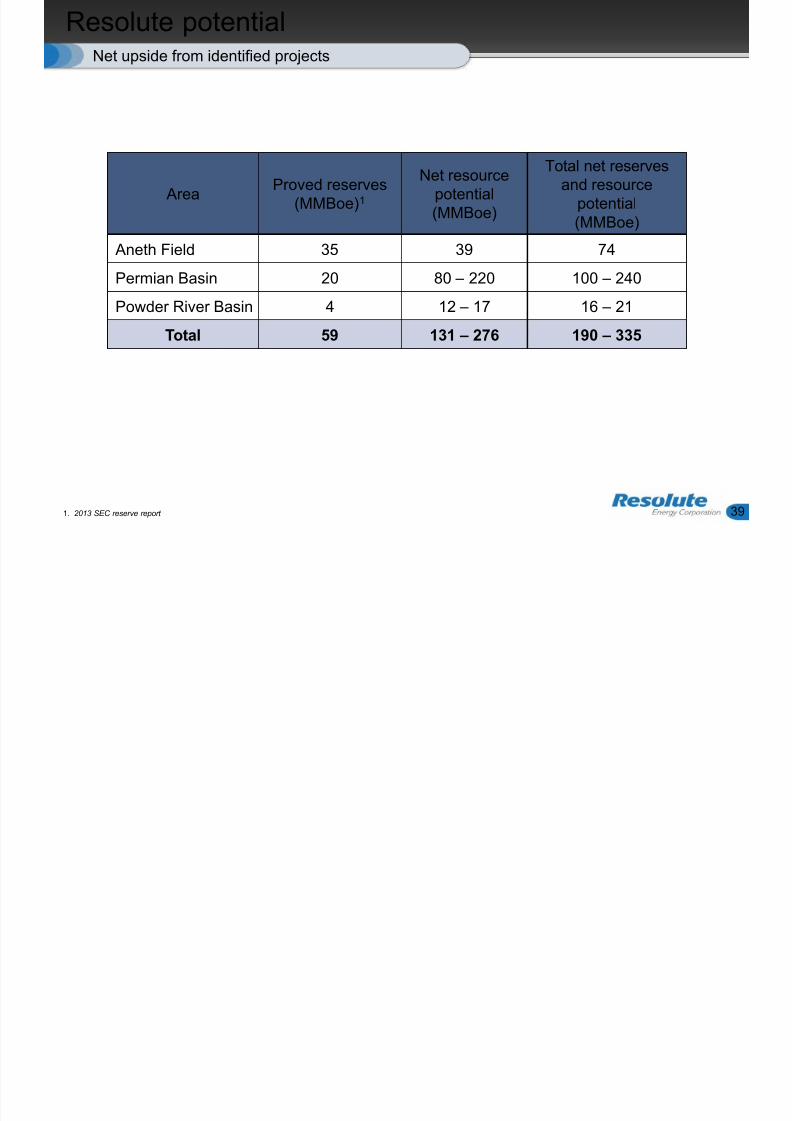
Resolute potential
9
Net upside from identified projects
1. 2013 SEC reserve report
AreaProved
reserves(MMBoe)1
Net resourcepotential(MMBoe)
Total net reservesand resource
potential(MMBoe)
Aneth Field 35 39 74
Permian Basin 20 80 – 220 100 – 240
Powder River Basin 4 12 – 17 16 – 21
Total 59 131 – 276 190 – 335
8/12/2019 IR Presentation - May 2014 FINAL
http://slidepdf.com/reader/full/ir-presentation-may-2014-final 10/48Permian Basin

8/12/2019 IR Presentation - May 2014 FINAL
http://slidepdf.com/reader/full/ir-presentation-may-2014-final 11/48
Permian Basin introduction
11
• In Q2 2011 Resolute acquired acreage and began drilling in Reeves County
in the Delaware Basin (“Reeves County”) • Resolute subsequently acquired a small producing asset in the Midland
Basin (“OTB”)
• Resolute started hiring core Permian Basin staff in November 2011 andopened a Midland office in June 2012. Current Midland-based staff is 46
employees covering key technical and managerial skills.• In December 2012 Resolute acquired:
• Producing properties and undeveloped acreage in the Midland Basin(“Big Spring”)
• Producing properties and undeveloped acreage in the Northwest Shelfarea of the Delaware Basin (“Denton”)
• Approximately 32% of certain producing properties and undevelopedacreage in the Midland Basin (“Gardendale”)
• In March 2013 Resolute acquired the remaining 68% of Gardendale
8/12/2019 IR Presentation - May 2014 FINAL
http://slidepdf.com/reader/full/ir-presentation-may-2014-final 12/48
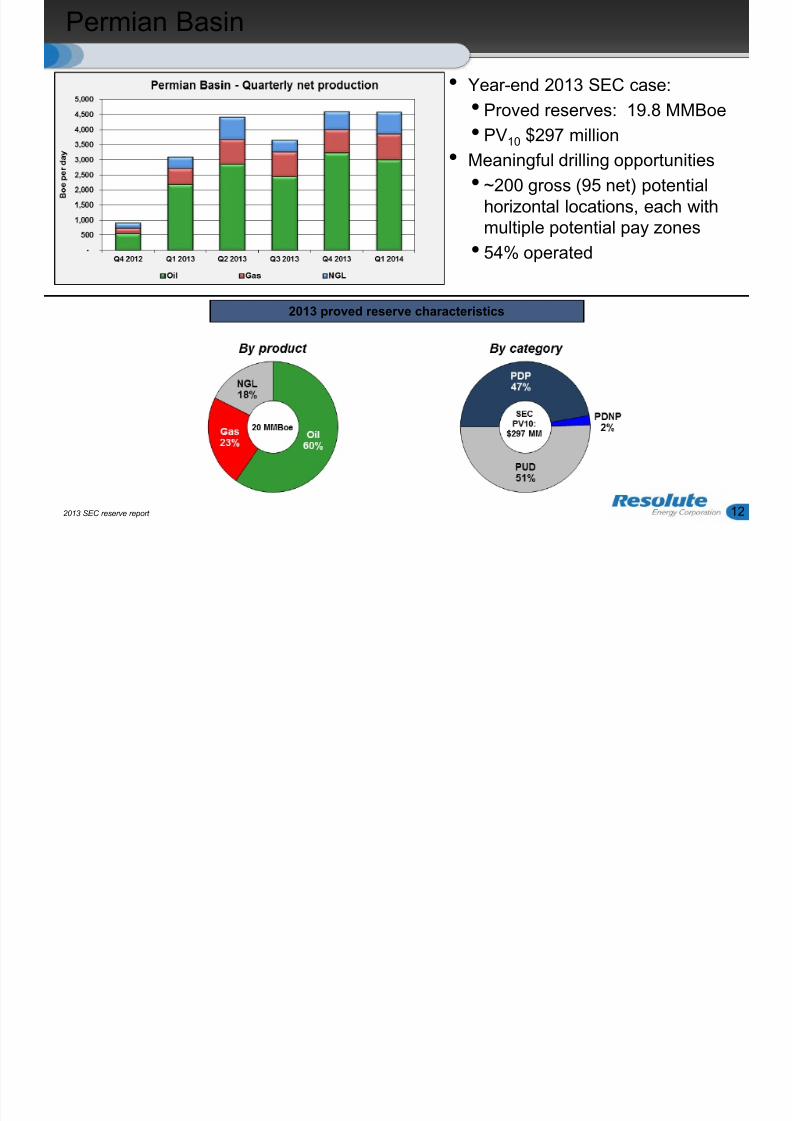
Permian Basin
2013 proved reserve characteristics
• Year-end 2013 SEC case:
• Proved reserves: 19.8 MMBoe
• PV10 $297 million
• Meaningful drilling opportunities
• ~200 gross (95 net) potentialhorizontal locations, each withmultiple potential pay zones
• 54% operated
2013 SEC reserve report 12
8/12/2019 IR Presentation - May 2014 FINAL
http://slidepdf.com/reader/full/ir-presentation-may-2014-final 13/48
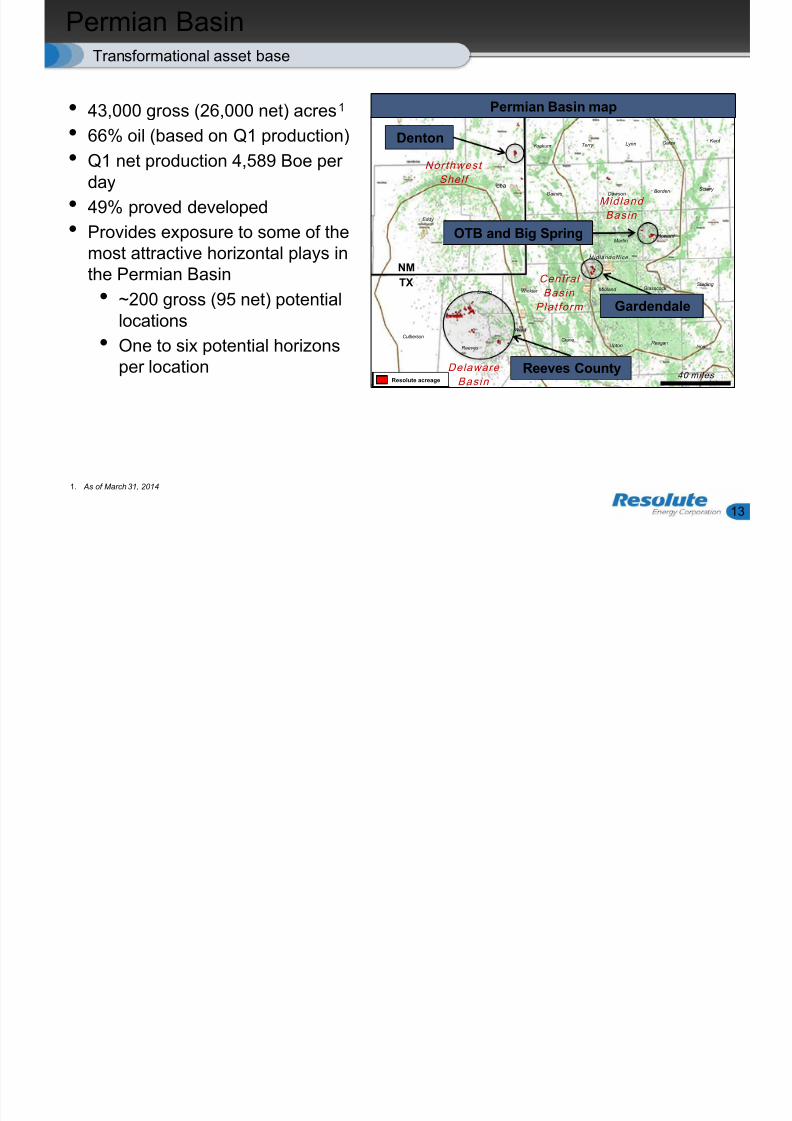
Permian Basin
13
Transformational asset base
• 43,000 gross (26,000 net) acres1
• 66% oil (based on Q1 production)
• Q1 net production 4,589 Boe perday
• 49% proved developed
• Provides exposure to some of the
most attractive horizontal plays inthe Permian Basin
• ~200 gross (95 net) potentiallocations
• One to six potential horizons
per location
1. As of March 31, 2014
Mitchell
Northwest
Shelf
Delaware
Basin
Central
Basin
Plat form
Mid land
Basin
NM
40 miles
Denton
Mid land o f f i ce
TX
Reeves County
OTB and Big Spring
Midland Glasscock
CraneUpton
Reagan
Eddy
Lea
Gaines Dawson
Howard
ScurryBorden
Martin
Yoakum Terry Lynn Garza Kent
Sterling
Reeves
Culberson
Loving Winkler
Irion
Gardendale
Ward
Resolute acreage
Permian Basin map
8/12/2019 IR Presentation - May 2014 FINAL
http://slidepdf.com/reader/full/ir-presentation-may-2014-final 14/48
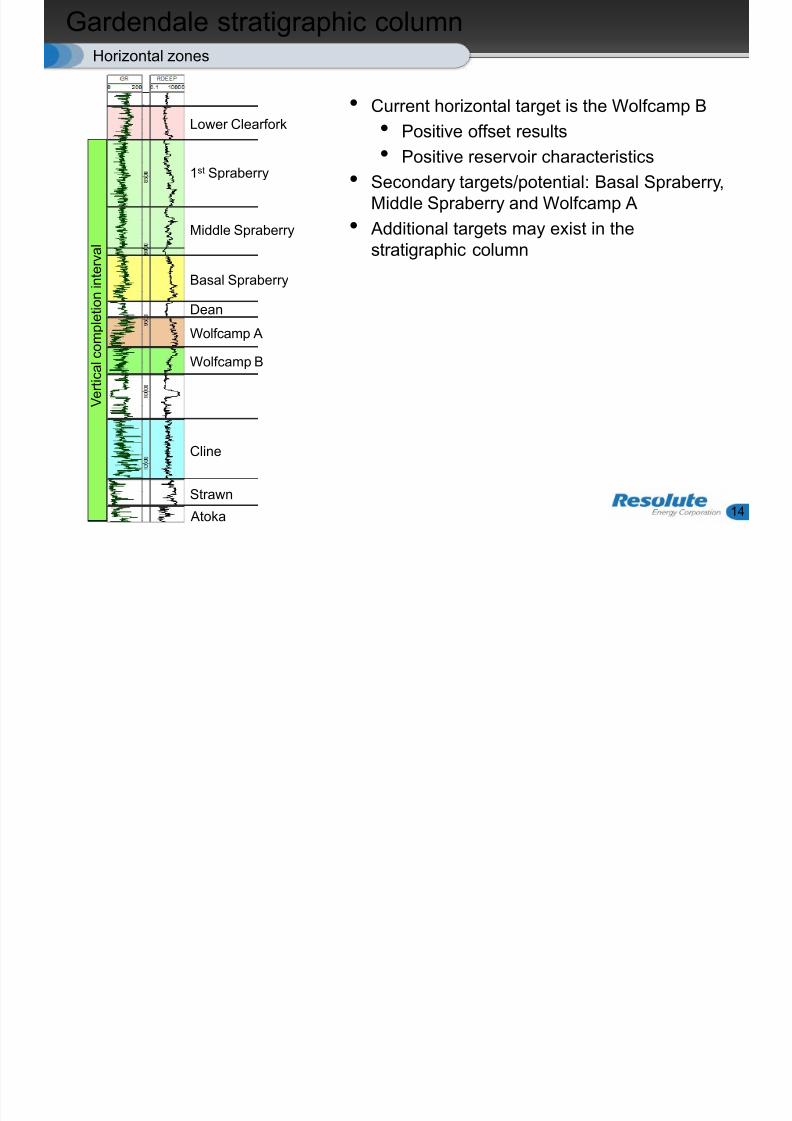
Gardendale stratigraphic column
14
• Current horizontal target is the Wolfcamp B
• Positive offset results
• Positive reservoir characteristics
• Secondary targets/potential: Basal Spraberry,Middle Spraberry and Wolfcamp A
• Additional targets may exist in the
stratigraphic column
Horizontal zones
Lower Clearfork
1st Spraberry
Middle Spraberry
Basal Spraberry
Dean
Wolfcamp A
Wolfcamp B
Cline
Strawn Atoka
V e r t i c a l c o m p l e t i o n i n t e r v a l
8/12/2019 IR Presentation - May 2014 FINAL
http://slidepdf.com/reader/full/ir-presentation-may-2014-final 15/48
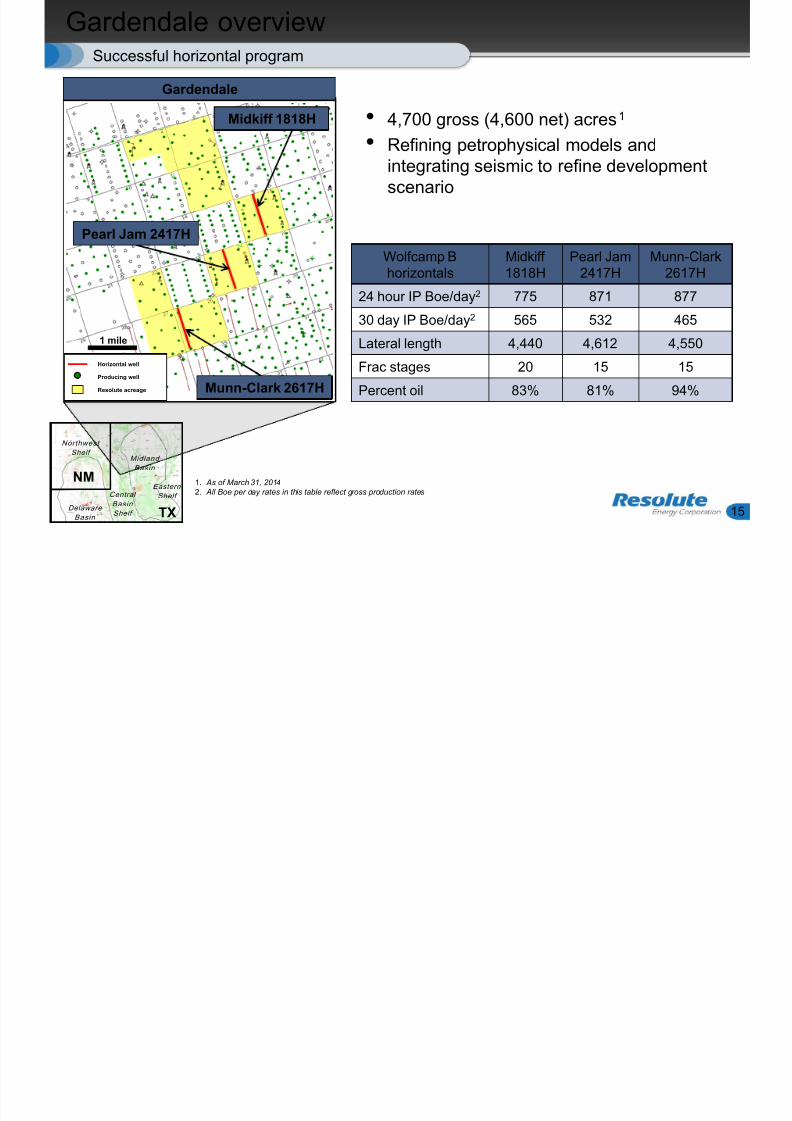
Gardendale overview
15
Successful horizontal program
• 4,700 gross (4,600 net) acres1
• Refining petrophysical models andintegrating seismic to refine developmentscenario
Wolfcamp Bhorizontals
Midkiff1818H
Pearl Jam2417H
Munn-Clark2617H
24 hour IP Boe/day2 775 871 877
30 day IP Boe/day2 565 532 465
Lateral length 4,440 4,612 4,550
Frac stages 20 15 15Percent oil 83% 81% 94%
Northwest
Shelf
Delaware
Basin
CentralBasin
Shelf
Midland
Basin
Eastern
Shelf
NM
TX
1. As of March 31, 20142. All Boe per day rates in this table reflect gross production rates
1 mile
Midland
Ector
Pearl Jam 2417H
Midkiff 1818H
Munn-Clark 2617H
Horizontal well
Producing well
Resolute acreage
Gardendale
8/12/2019 IR Presentation - May 2014 FINAL
http://slidepdf.com/reader/full/ir-presentation-may-2014-final 16/48
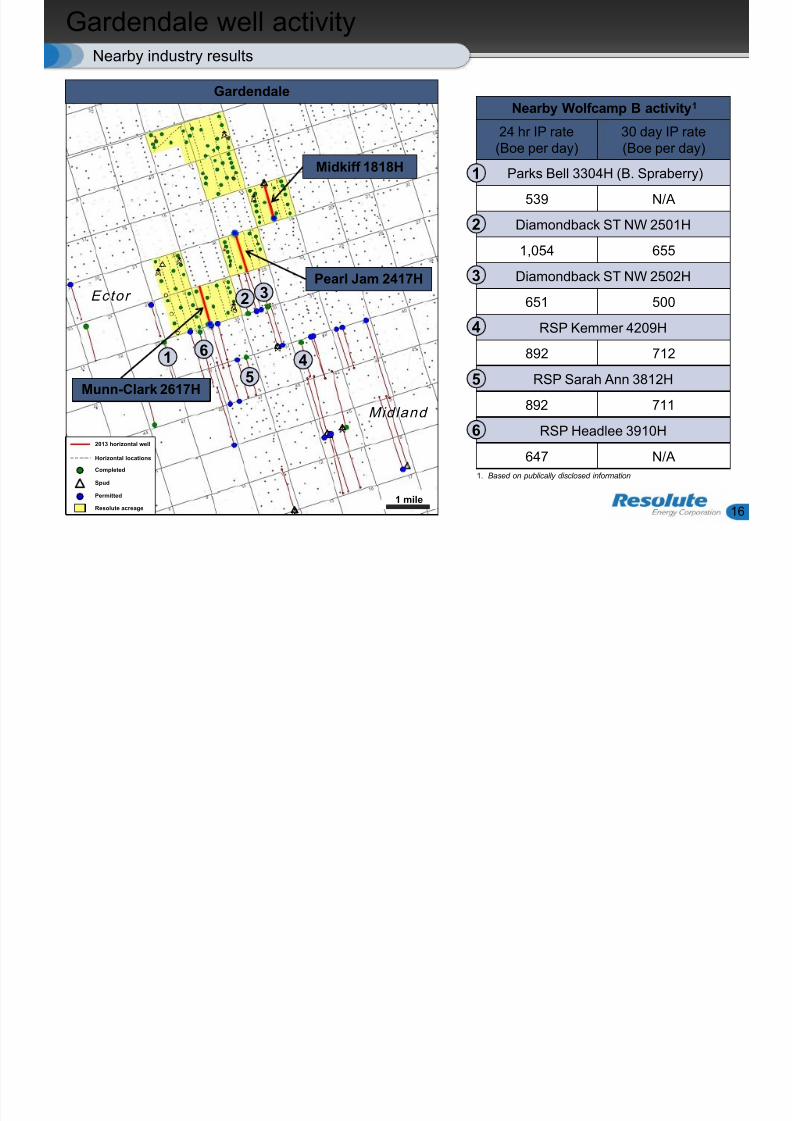
Gardendale well activity
16
Nearby industry results
1. Based on publically disclosed information
Nearby Wolfcamp B activity1
24 hr IP rate(Boe per day)
30 day IP rate(Boe per day)
Parks Bell 3304H (B. Spraberry)
539 N/A
Diamondback ST NW 2501H
1,054 655
Diamondback ST NW 2502H
651 500
RSP Kemmer 4209H
892 712
RSP Sarah Ann 3812H
892 711
RSP Headlee 3910H
647 N/A
3
4
2
1
5
62013 horizontal well
Horizontal locations
Completed
Spud
Permitted
Resolute acreage
2
1 mile
3
5
4
Midland
Ector
6
Pearl Jam 2417H
Midkiff 1818H
Munn-Clark 2617H
Gardendale
1
8/12/2019 IR Presentation - May 2014 FINAL
http://slidepdf.com/reader/full/ir-presentation-may-2014-final 17/48
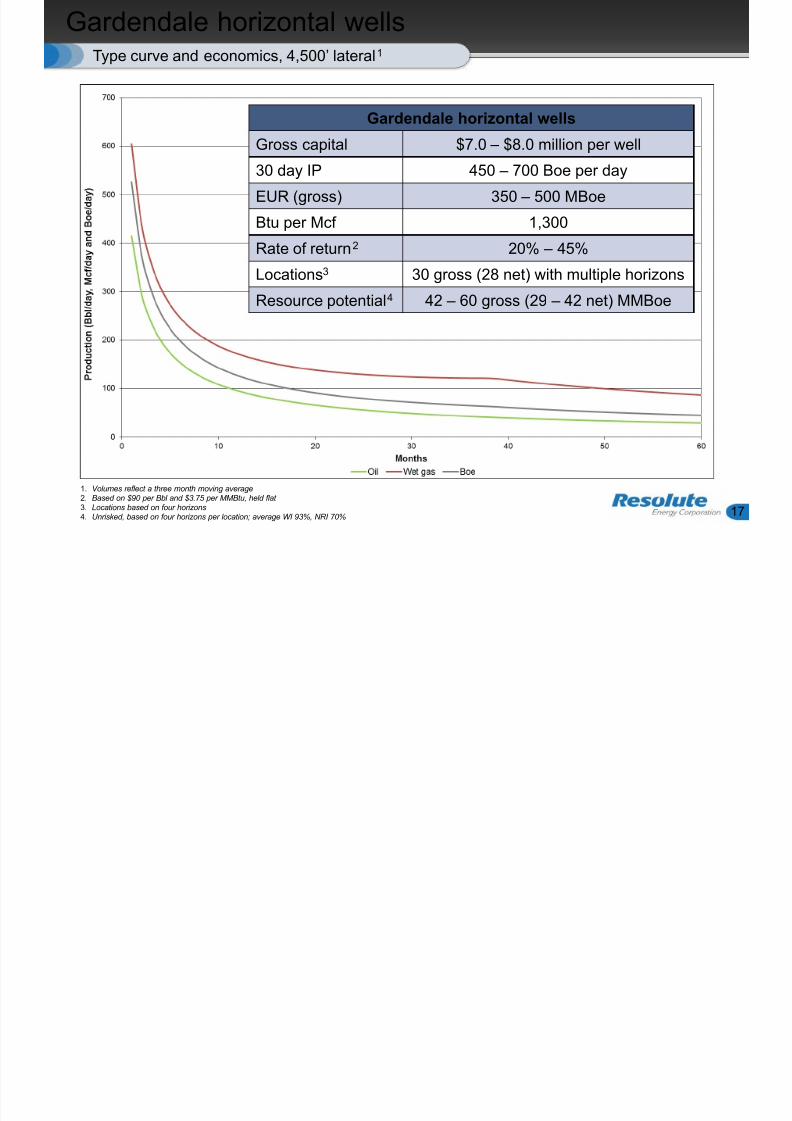
Gardendale horizontal wells
17
Type curve and economics, 4,500’ lateral1
Gardendale horizontal wellsGross capital $7.0 – $8.0 million per well
30 day IP 450 – 700 Boe per day
EUR (gross) 350 – 500 MBoe
Btu per Mcf 1,300
Rate of return2 20% – 45%Locations3 30 gross (28 net) with multiple horizons
Resource potential4 42 – 60 gross (29 – 42 net) MMBoe
1. Volumes reflect a three month moving average
2. Based on $90 per Bbl and $3.75 per MMBtu, held flat3. Locations based on four horizons4. Unrisked, based on four horizons per location; average WI 93%, NRI 70%
8/12/2019 IR Presentation - May 2014 FINAL
http://slidepdf.com/reader/full/ir-presentation-may-2014-final 18/48
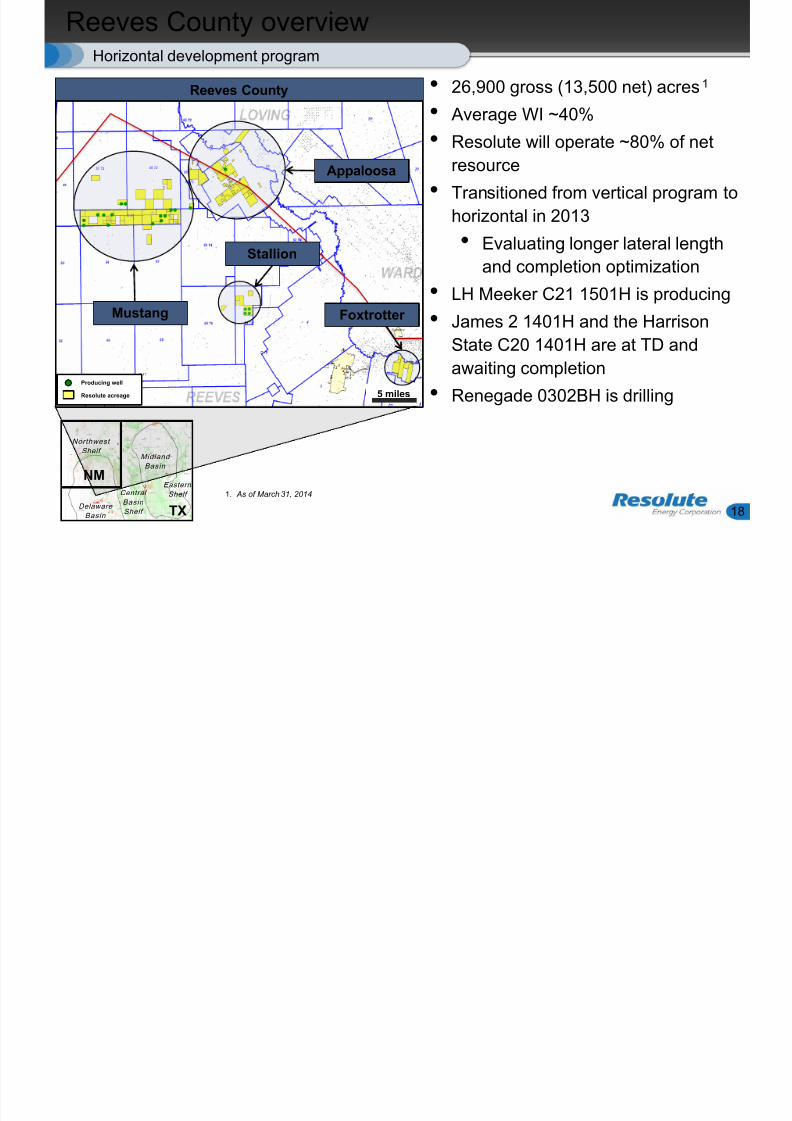
Reeves County overview
18
Horizontal development program
Mustang
Appaloosa
Reeves County
1. As of March 31, 2014
5 miles
Northwest
Shelf
Delaware
Basin
Central
Basin
Shelf
Midland
Basin
Eastern
Shelf
NM
TX
• 26,900 gross (13,500 net) acres1
• Average WI ~40%
• Resolute will operate ~80% of net
resource
• Transitioned from vertical program to
horizontal in 2013
• Evaluating longer lateral lengthand completion optimization
• LH Meeker C21 1501H is producing
• James 2 1401H and the Harrison
State C20 1401H are at TD and
awaiting completion• Renegade 0302BH is drilling
Producing well
Resolute acreage
Foxtrotter
Stallion
8/12/2019 IR Presentation - May 2014 FINAL
http://slidepdf.com/reader/full/ir-presentation-may-2014-final 19/48
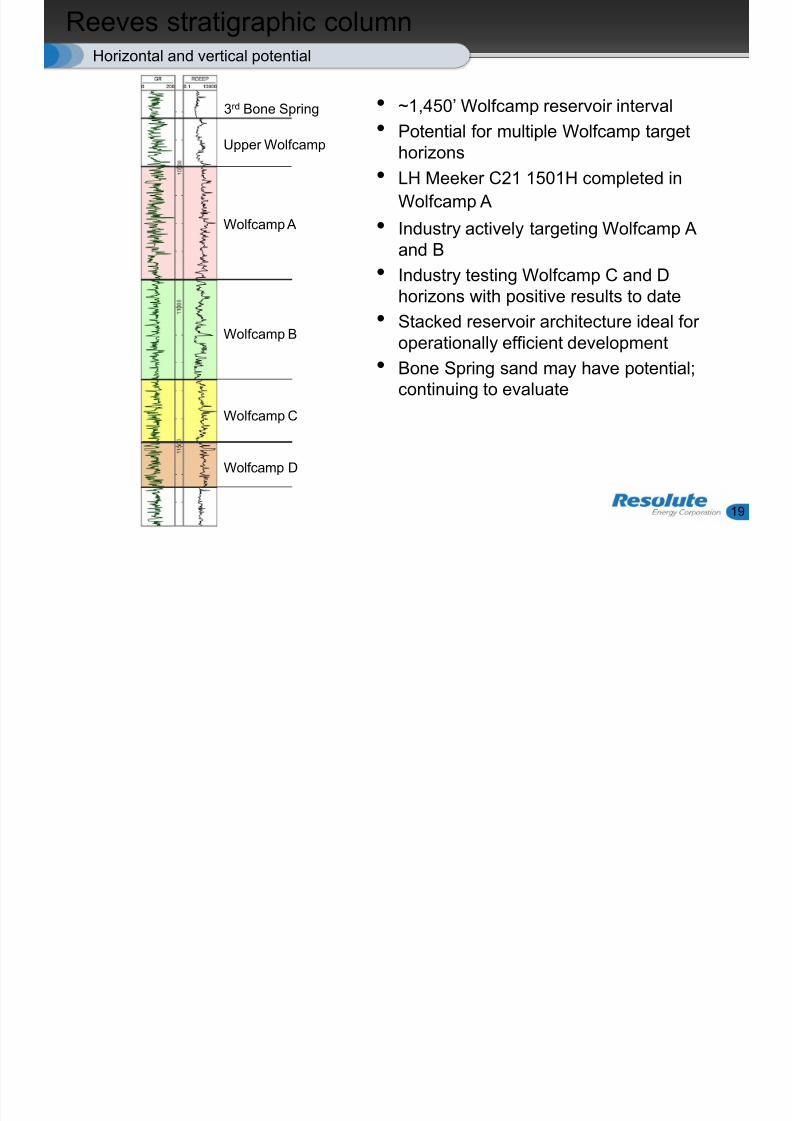
Reeves stratigraphic column
19
Horizontal and vertical potential
Upper Wolfcamp
Wolfcamp A
Wolfcamp B
Wolfcamp C
Wolfcamp D
3rd Bone Spring • ~1,450’ Wolfcamp reservoir interval
• Potential for multiple Wolfcamp targethorizons
• LH Meeker C21 1501H completed in
Wolfcamp A
• Industry actively targeting Wolfcamp A
and B• Industry testing Wolfcamp C and D
horizons with positive results to date
• Stacked reservoir architecture ideal foroperationally efficient development
• Bone Spring sand may have potential;continuing to evaluate
C
8/12/2019 IR Presentation - May 2014 FINAL
http://slidepdf.com/reader/full/ir-presentation-may-2014-final 20/48
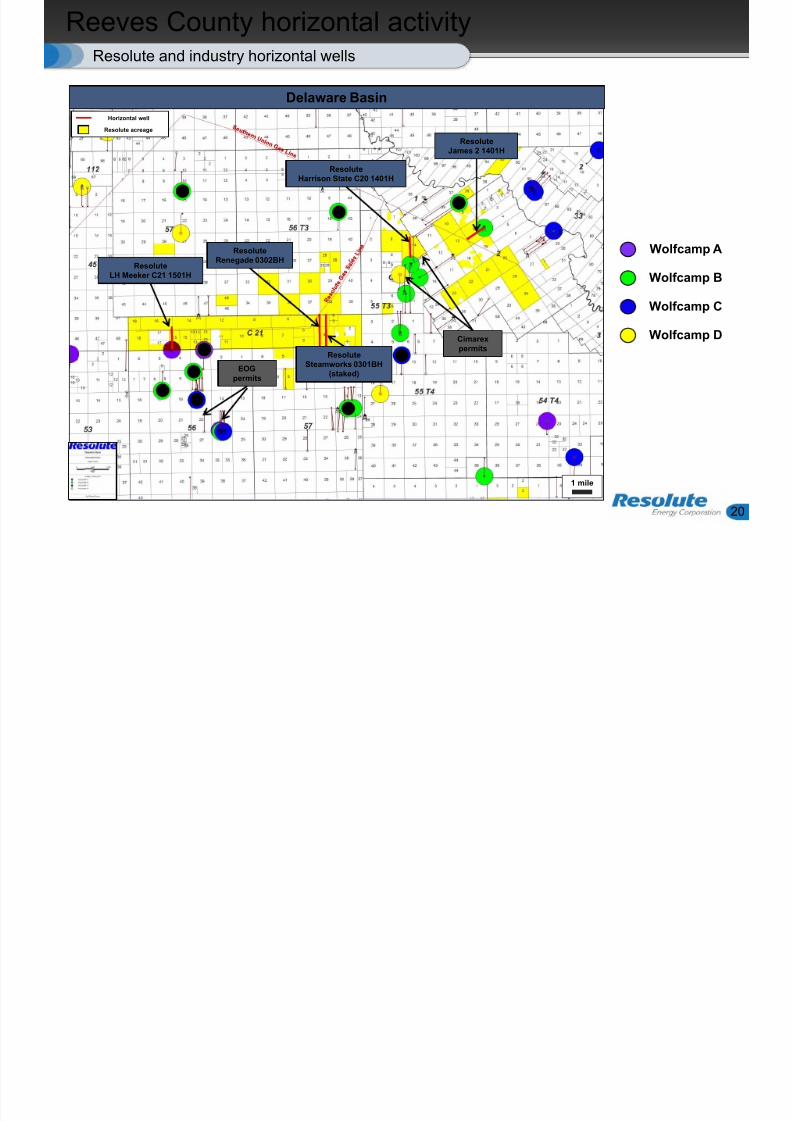
Reeves County horizontal activity
20
Resolute and industry horizontal wells
Delaware Basin
Wolfcamp A
Wolfcamp B
Wolfcamp C
Wolfcamp D
1 mile
1
8
2
ResoluteJames 2 1401H
ResoluteHarrison State C20 1401H
ResoluteLH Meeker C21 1501H
Horizontal well
Resolute acreage
Cimarexpermits
EOGpermits3
4
5
6
9ResoluteSteamworks 0301BH
(staked)
ResoluteRenegade 0302BH
7
N b h i l i i
8/12/2019 IR Presentation - May 2014 FINAL
http://slidepdf.com/reader/full/ir-presentation-may-2014-final 21/48
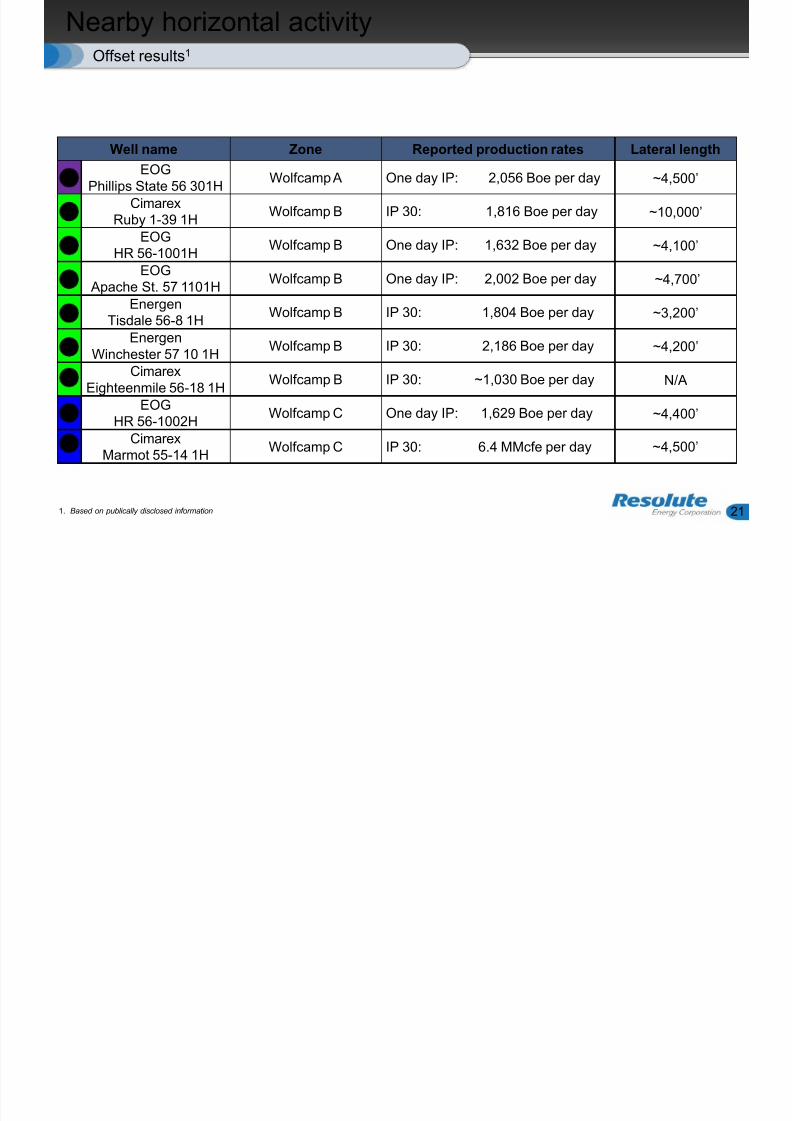
Well name Zone Reported production rates Lateral length
EOGPhillips State 56 301H
Wolfcamp A One day IP: 2,056 Boe per day ~4,500’
CimarexRuby 1-39 1H
Wolfcamp B IP 30: 1,816 Boe per day ~10,000’
EOG
HR 56-1001H Wolfcamp B One day IP: 1,632 Boe per day ~4,100’ EOG
Apache St. 57 1101HWolfcamp B One day IP: 2,002 Boe per day ~4,700’
EnergenTisdale 56-8 1H
Wolfcamp B IP 30: 1,804 Boe per day ~3,200’
EnergenWinchester 57 10 1H
Wolfcamp B IP 30: 2,186 Boe per day ~4,200’
CimarexEighteenmile 56-18 1H
Wolfcamp B IP 30: ~1,030 Boe per day N/A
EOGHR 56-1002H
Wolfcamp C One day IP: 1,629 Boe per day ~4,400’
CimarexMarmot 55-14 1H
Wolfcamp C IP 30: 6.4 MMcfe per day ~4,500’
7
Nearby horizontal activity
21
Offset results1
1. Based on publically disclosed information
1
2
4
5
6
9
3
8
D l B i h i t l ll
8/12/2019 IR Presentation - May 2014 FINAL
http://slidepdf.com/reader/full/ir-presentation-may-2014-final 22/48
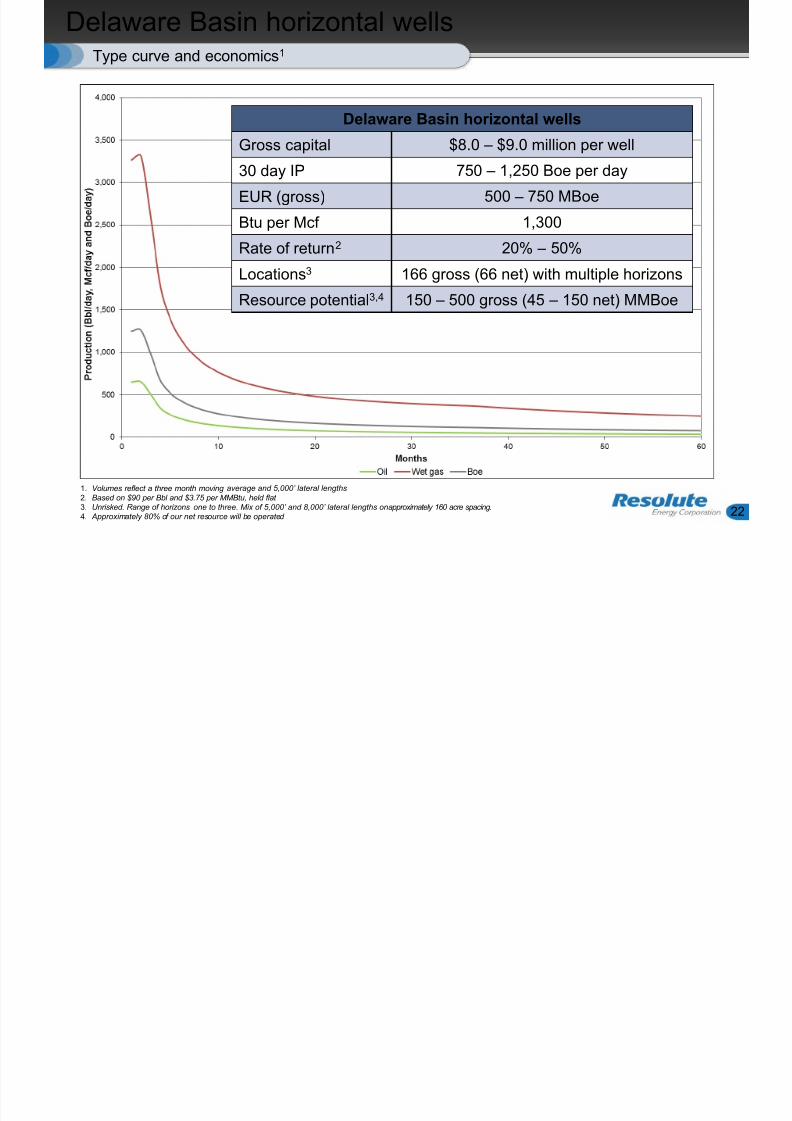
Delaware Basin horizontal wells
22
Type curve and economics1
Delaware Basin horizontal wellsGross capital $8.0 – $9.0 million per well
30 day IP 750 – 1,250 Boe per day
EUR (gross) 500 – 750 MBoe
Btu per Mcf 1,300
Rate of return 2 20% – 50%Locations3 166 gross (66 net) with multiple horizons
Resource potential3,4 150 – 500 gross (45 – 150 net) MMBoe
1. Volumes reflect a three month moving average and 5,000’ lateral lengths
2. Based on $90 per Bbl and $3.75 per MMBtu, held flat3. Unrisked. Range of horizons one to three. Mix of 5,000’ and 8,000’ lateral lengths on approximately 160 acre spacing.4. Approximately 80% of our net resource will be operated
OTB d Bi S i
8/12/2019 IR Presentation - May 2014 FINAL
http://slidepdf.com/reader/full/ir-presentation-may-2014-final 23/48
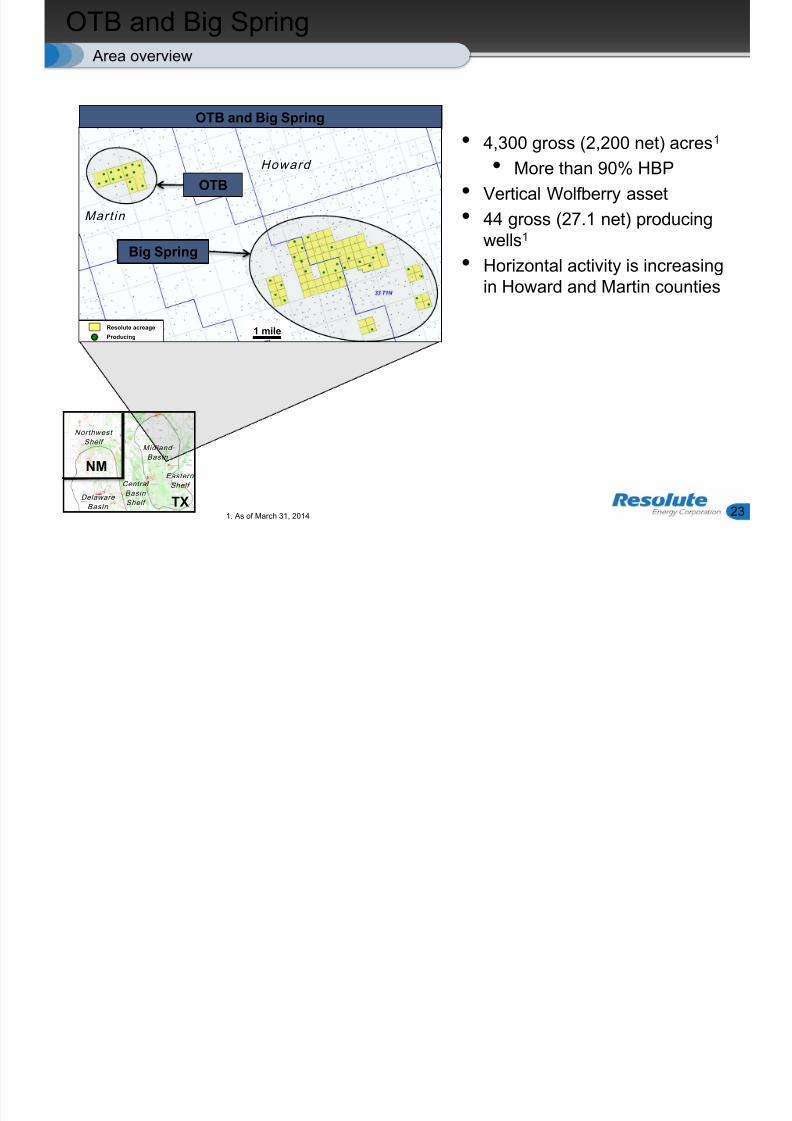
OTB and Big Spring
23
• 4,300 gross (2,200 net) acres1
• More than 90% HBP
• Vertical Wolfberry asset
• 44 gross (27.1 net) producingwells1
• Horizontal activity is increasingin Howard and Martin counties
Area overview
OTB and Big Spring
1 mile
Howard
Martin
Resolute leasehold
OTB
Big Spring
1. As of March 31, 2014
Northwest
Shelf
DelawareBasin
Central
Basin
Shelf
Midland
Basin
Eastern
Shelf
NM
TX
OTB
Howard
Martin
Big Spring
Resolute acreage
Producing1 mile
OTB d Bi S i ti l W lfb
8/12/2019 IR Presentation - May 2014 FINAL
http://slidepdf.com/reader/full/ir-presentation-may-2014-final 24/48
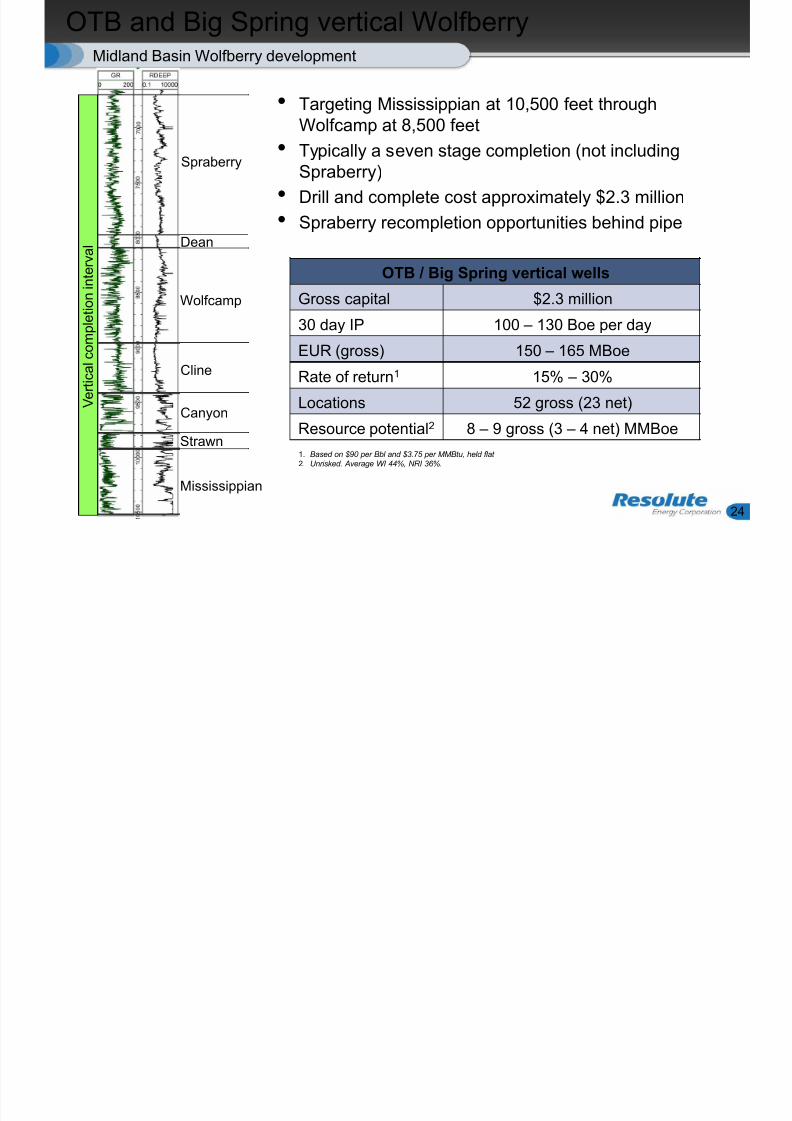
OTB and Big Spring vertical Wolfberry
24
Midland Basin Wolfberry development
Spraberry
Wolfcamp
Dean
Cline
Canyon
Mississippian
Strawn
V e r t i c a l c o m p l e t i o n i n t e r v a l
• Targeting Mississippian at 10,500 feet through
Wolfcamp at 8,500 feet• Typically a seven stage completion (not including
Spraberry)
• Drill and complete cost approximately $2.3 million
• Spraberry recompletion opportunities behind pipe
OTB / Big Spring vertical wells
Gross capital $2.3 million
30 day IP 100 – 130 Boe per day
EUR (gross) 150 – 165 MBoe
Rate of return1 15% – 30%
Locations 52 gross (23 net)
Resource potential2 8 – 9 gross (3 – 4 net) MMBoe
1. Based on $90 per Bbl and $3.75 per MMBtu, held flat2. Unrisked. Average WI 44%, NRI 36%.
D t Fi ld i
8/12/2019 IR Presentation - May 2014 FINAL
http://slidepdf.com/reader/full/ir-presentation-may-2014-final 25/48
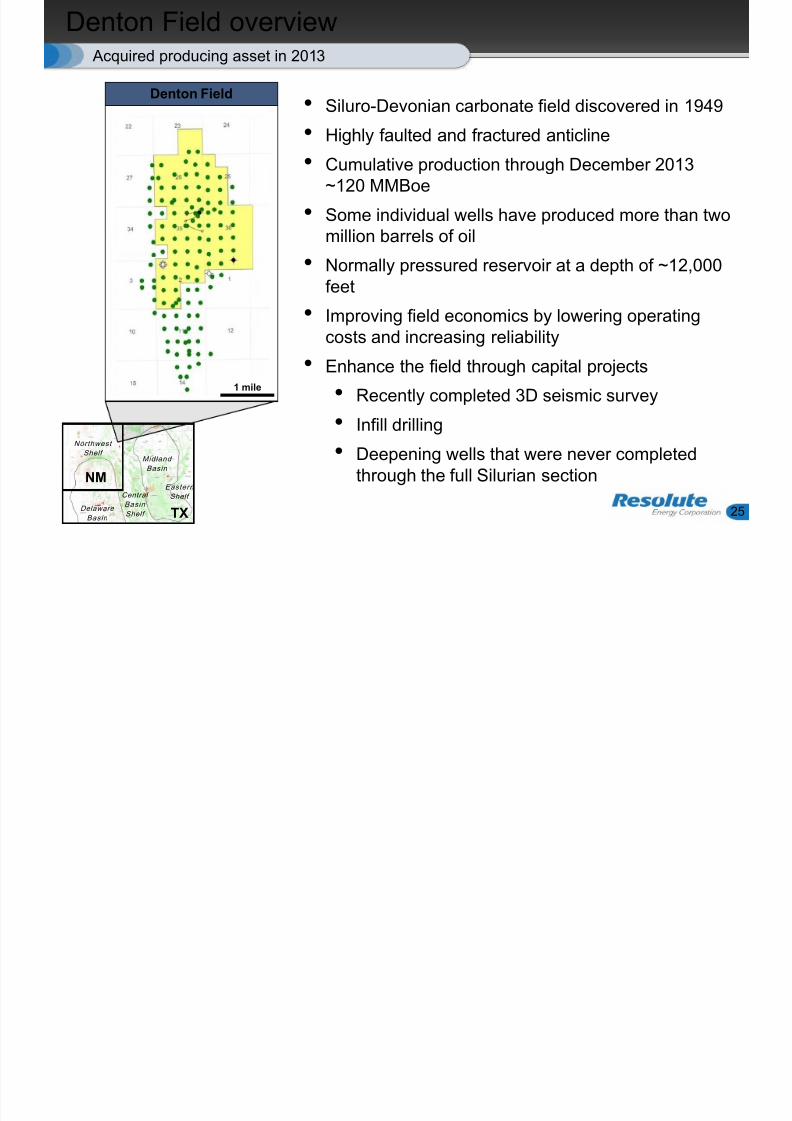
Denton Field overview
25
• Siluro-Devonian carbonate field discovered in 1949
• Highly faulted and fractured anticline
• Cumulative production through December 2013~120 MMBoe
• Some individual wells have produced more than twomillion barrels of oil
• Normally pressured reservoir at a depth of ~12,000feet
• Improving field economics by lowering operatingcosts and increasing reliability
• Enhance the field through capital projects• Recently completed 3D seismic survey
• Infill drilling
• Deepening wells that were never completedthrough the full Silurian section
Acquired producing asset in 2013
1 mile
Northwest
Shelf
Delaware
Basin
Central
Basin
Shelf
Midland
Basin
Eastern
Shelf
NM
TX
Denton Field
P i B i t ti l
8/12/2019 IR Presentation - May 2014 FINAL
http://slidepdf.com/reader/full/ir-presentation-may-2014-final 26/48
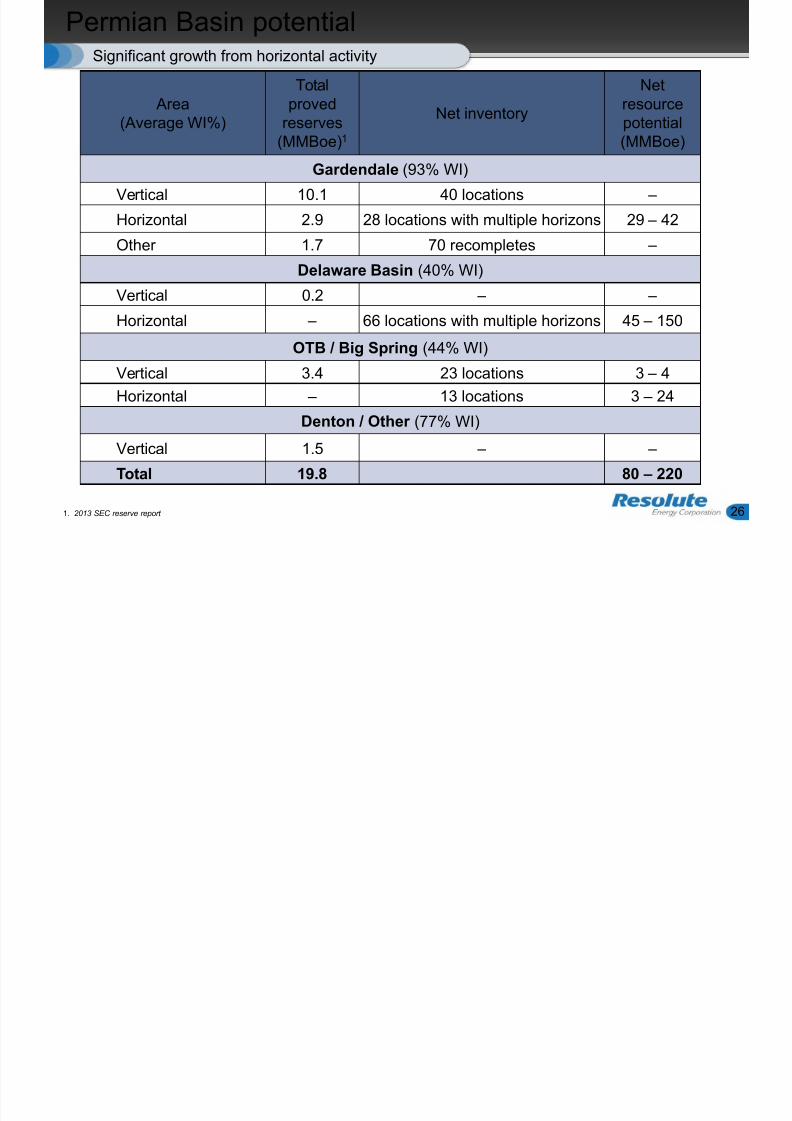
Area
(Average WI%)
Totalproved
reserves(MMBoe)1
Net inventory
Netresource
potential(MMBoe)
Gardendale (93% WI)
Vertical 10.1 40 locations –
Horizontal 2.9 28 locations with multiple horizons 29 – 42
Other 1.7 70 recompletes – Delaware Basin (40% WI)
Vertical 0.2 – –
Horizontal – 66 locations with multiple horizons 45 – 150
OTB / Big Spring (44% WI)
Vertical 3.4 23 locations 3 – 4Horizontal – 13 locations 3 – 24
Denton / Other (77% WI)
Vertical 1.5 – –
Total 19.8 80 – 220
Permian Basin potential
26
Significant growth from horizontal activity
1. 2013 SEC reserve report
8/12/2019 IR Presentation - May 2014 FINAL
http://slidepdf.com/reader/full/ir-presentation-may-2014-final 27/48Wyoming
Po der Ri er Basin
8/12/2019 IR Presentation - May 2014 FINAL
http://slidepdf.com/reader/full/ir-presentation-may-2014-final 28/48
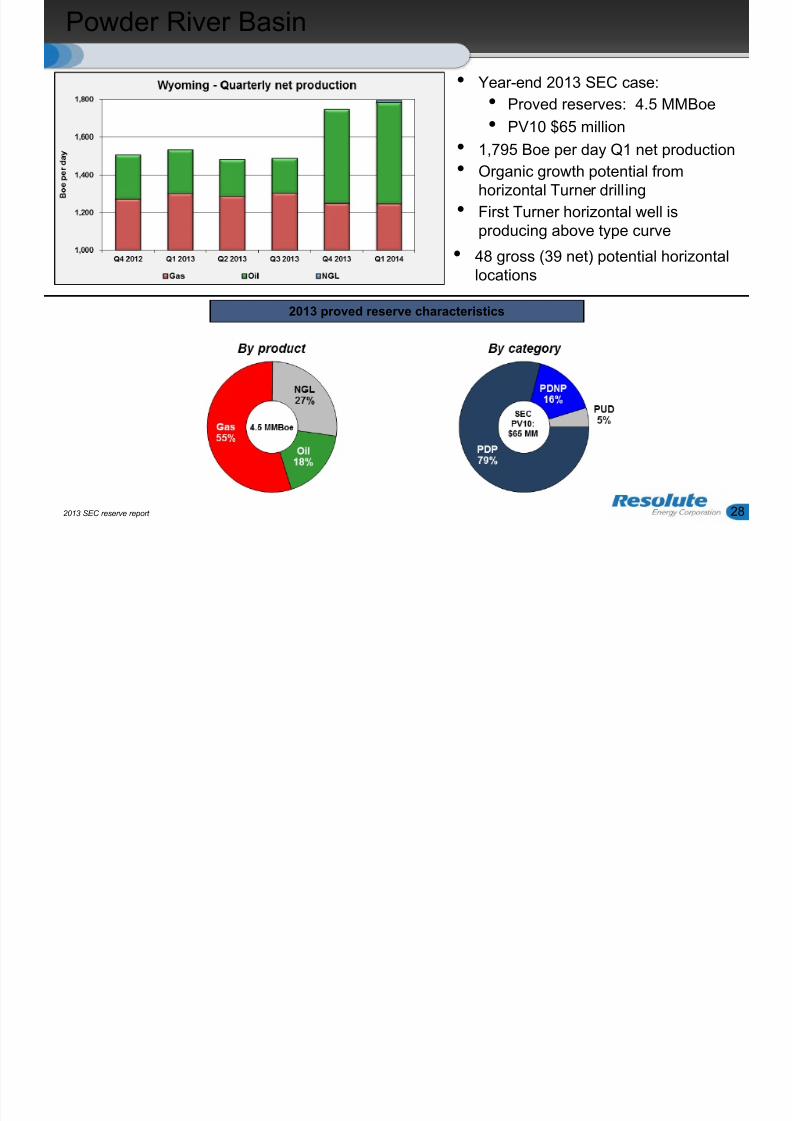
Powder River Basin
28
2013 proved reserve characteristics
• Year-end 2013 SEC case:
• Proved reserves: 4.5 MMBoe
• PV10 $65 million• 1,795 Boe per day Q1 net production
• Organic growth potential fromhorizontal Turner drilling
• First Turner horizontal well isproducing above type curve
• 48 gross (39 net) potential horizontallocations
2013 SEC reserve report
Hilight Field
8/12/2019 IR Presentation - May 2014 FINAL
http://slidepdf.com/reader/full/ir-presentation-may-2014-final 29/48
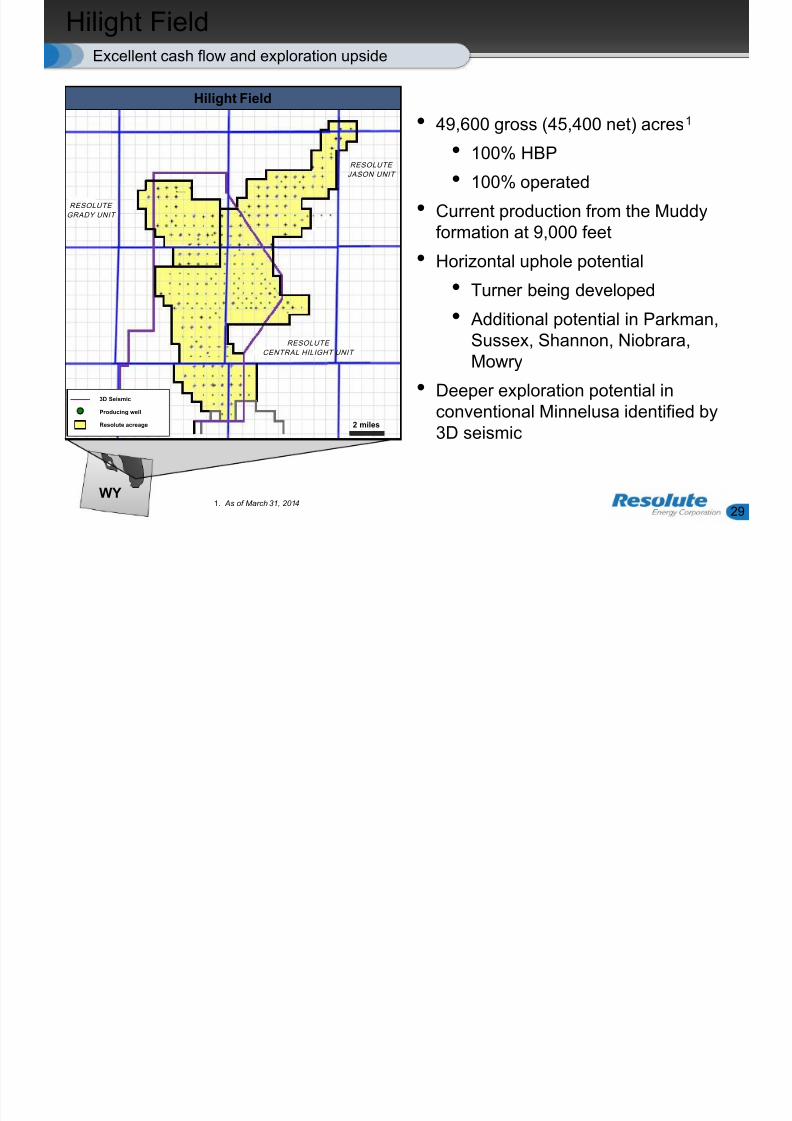
WY
Hilight Field
29
Excellent cash flow and exploration upside
• 49,600 gross (45,400 net) acres1
• 100% HBP
• 100% operated
• Current production from the Muddyformation at 9,000 feet
• Horizontal uphole potential
• Turner being developed
• Additional potential in Parkman,Sussex, Shannon, Niobrara,Mowry
• Deeper exploration potential inconventional Minnelusa identified by3D seismic
Hilight Field
1. As of March 31, 2014
2 miles
RESOLUTE
GRADY UNIT
RESOLUTE
JASON UNIT
RESOLUTE
CENTRAL HILIGHT UNIT
3D Seismic
Producing well
Resolute acreage
Nearby Turner well activity
8/12/2019 IR Presentation - May 2014 FINAL
http://slidepdf.com/reader/full/ir-presentation-may-2014-final 30/48
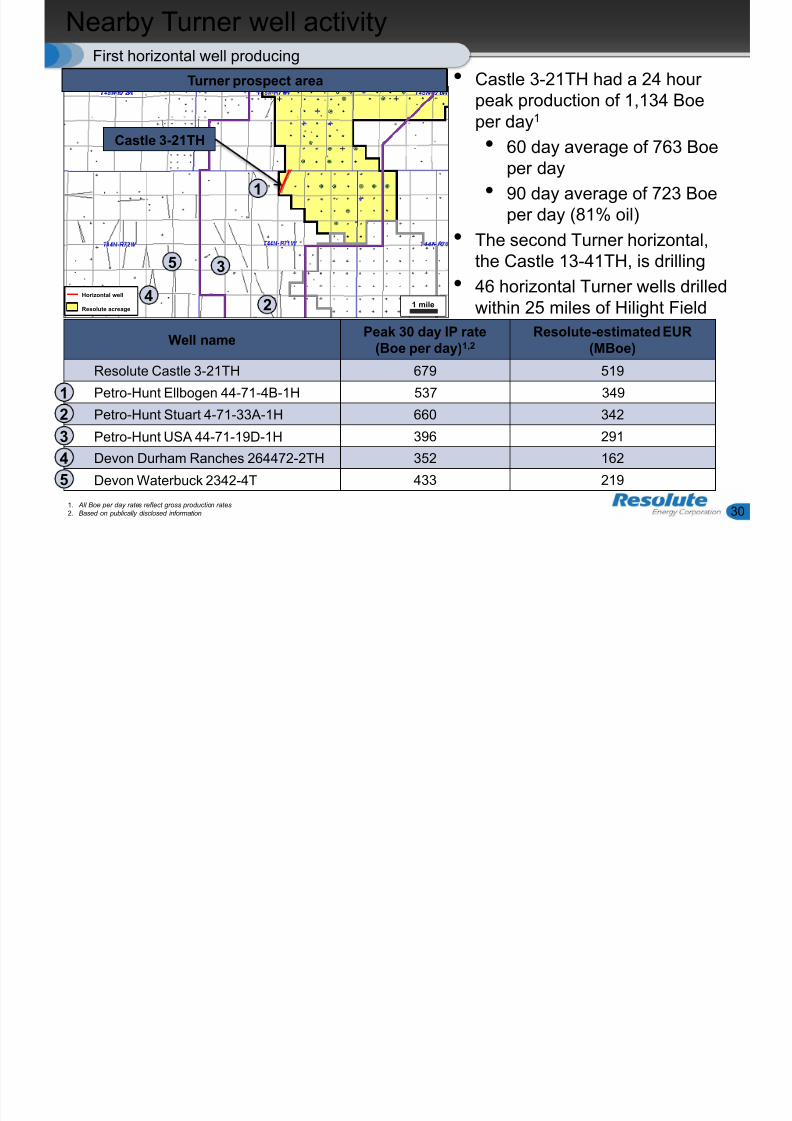
Nearby Turner well activity
30
First horizontal well producing
• Castle 3-21TH had a 24 hourpeak production of 1,134 Boe
per day1
• 60 day average of 763 Boeper day
• 90 day average of 723 Boeper day (81% oil)
• The second Turner horizontal,the Castle 13-41TH, is drilling
• 46 horizontal Turner wells drilledwithin 25 miles of Hilight Field
Well namePeak 30 day IP rate
(Boe per day)1,2
Resolute-estimated EUR(MBoe)
Resolute Castle 3-21TH
679 519Petro-Hunt Ellbogen 44-71-4B-1H 537 349
Petro-Hunt Stuart 4-71-33A-1H 660 342
Petro-Hunt USA 44-71-19D-1H 396 291
Devon Durham Ranches 264472-2TH 352 162
Devon Waterbuck 2342-4T 433 219
1
2
3
4
5
3
1
2
5
41 mile
Castle 3-21TH
Horizontal well
Resolute acreage
1. All Boe per day rates reflect gross production rates2. Based on publically disclosed information
Turner prospect area
Turner horizontal
8/12/2019 IR Presentation - May 2014 FINAL
http://slidepdf.com/reader/full/ir-presentation-may-2014-final 31/48
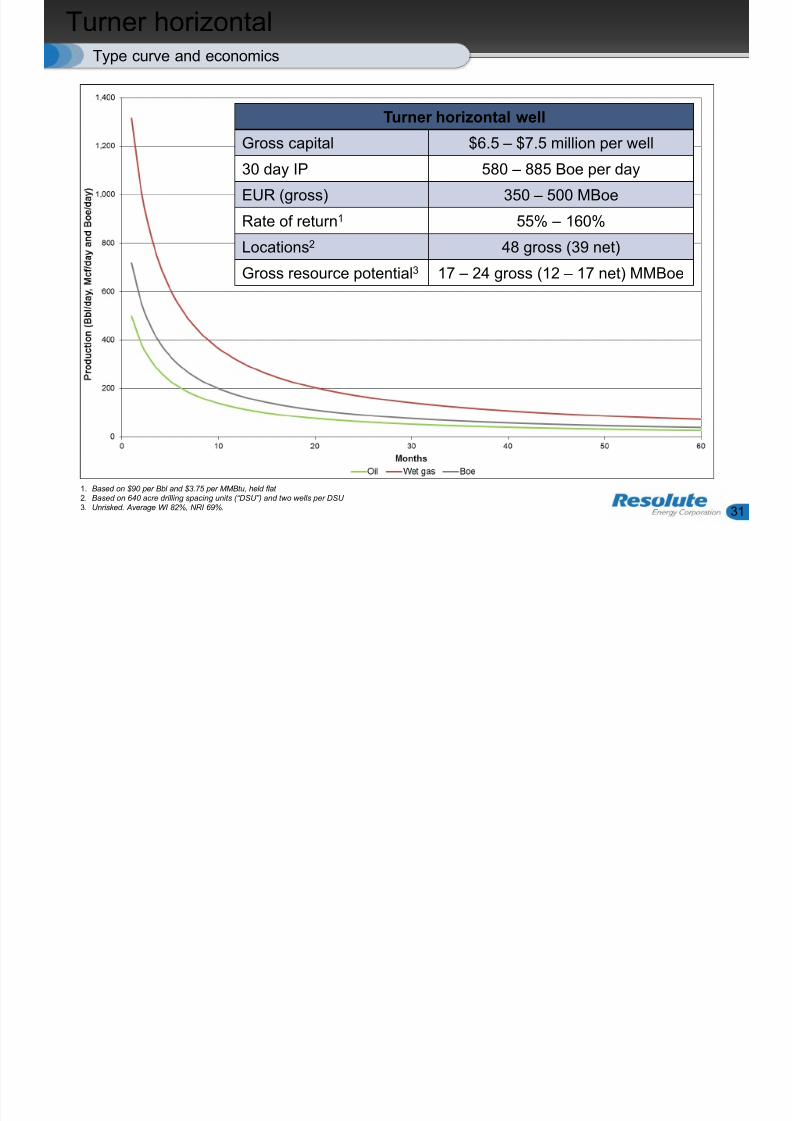
Turner horizontal
31
Type curve and economics
Turner horizontal well
Gross capital $6.5 – $7.5 million per well
30 day IP 580 – 885 Boe per day
EUR (gross) 350 – 500 MBoe
Rate of return1 55% – 160%
Locations2
48 gross (39 net)Gross resource potential3 17 – 24 gross (12 – 17 net) MMBoe
1. Based on $90 per Bbl and $3.75 per MMBtu, held flat
2. Based on 640 acre drilling spacing units (“DSU”) and two wells per DSU 3. Unrisked. Average WI 82%, NRI 69%.
8/12/2019 IR Presentation - May 2014 FINAL
http://slidepdf.com/reader/full/ir-presentation-may-2014-final 32/48Aneth Field
Aneth Field introduction
8/12/2019 IR Presentation - May 2014 FINAL
http://slidepdf.com/reader/full/ir-presentation-may-2014-final 33/48
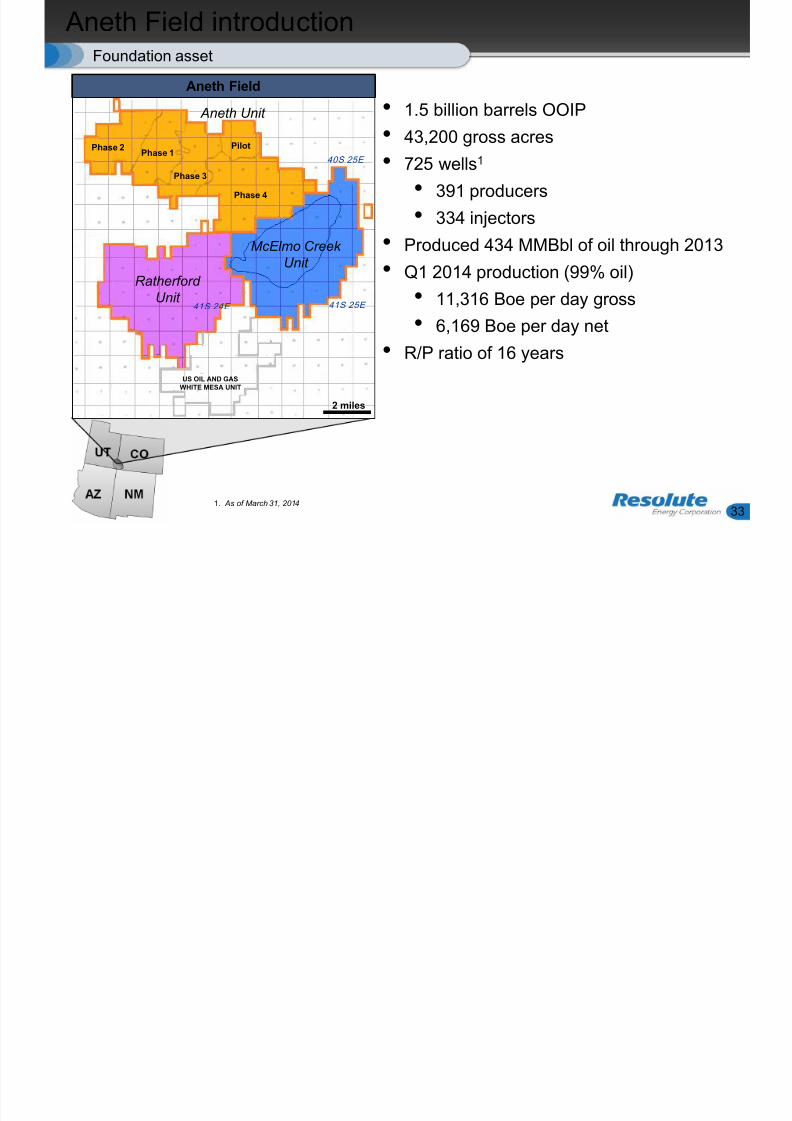
Aneth Field introduction
33
Foundation asset
• 1.5 billion barrels OOIP
• 43,200 gross acres
• 725 wells1
• 391 producers
• 334 injectors
• Produced 434 MMBbl of oil through 2013• Q1 2014 production (99% oil)
• 11,316 Boe per day gross
• 6,169 Boe per day net
• R/P ratio of 16 years
Aneth Field
1. As of March 31, 2014
US OIL AND GASWHITE MESA UNIT
RatherfordUnit
McElmo CreekUnit
Aneth Unit
41S 24E
Phase 2Phase 1
Phase 3
Phase 4
Pilot
40S 25E
41S 25E
2 miles
Aneth Field overview
8/12/2019 IR Presentation - May 2014 FINAL
http://slidepdf.com/reader/full/ir-presentation-may-2014-final 34/48
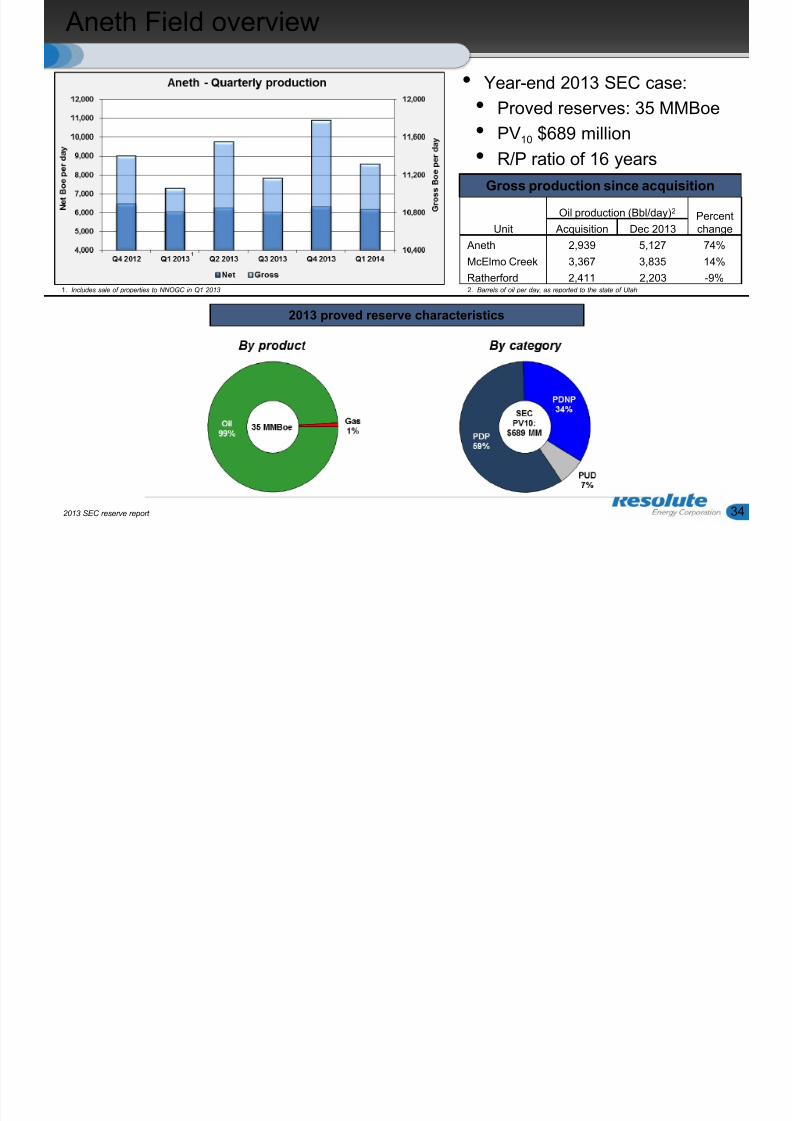
Aneth Field overview
34
• Year-end 2013 SEC case:
• Proved reserves: 35 MMBoe
• PV10 $689 million
• R/P ratio of 16 years
2013 proved reserve characteristics
2. Barrels of oil per day, as reported to the state of Utah
1
1. Includes sale of properties to NNOGC in Q1 2013
Unit
Oil production (Bbl/day)2 Percentchange Acquisition Dec 2013
Aneth 2,939 5,127 74%
McElmo Creek 3,367 3,835 14%
Ratherford 2,411 2,203 -9%
Gross production since acquisition
2013 SEC reserve report
Aneth Field cash flow
8/12/2019 IR Presentation - May 2014 FINAL
http://slidepdf.com/reader/full/ir-presentation-may-2014-final 35/48
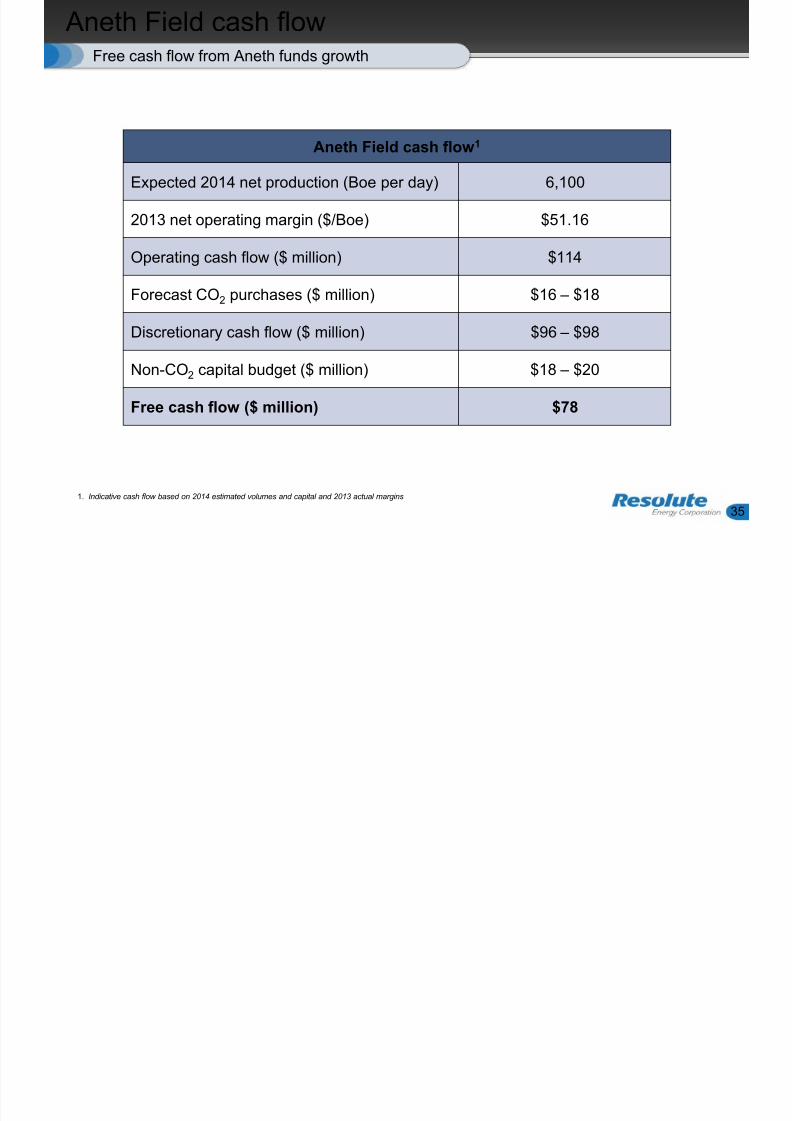
Aneth Field cash flow
35
Free cash flow from Aneth funds growth
Aneth Field cash flow1
Expected 2014 net production (Boe per day) 6,100
2013 net operating margin ($/Boe) $51.16
Operating cash flow ($ million) $114
Forecast CO2 purchases ($ million) $16 – $18
Discretionary cash flow ($ million) $96 – $98
Non-CO2 capital budget ($ million) $18 – $20
Free cash flow ($ million) $78
1. Indicative cash flow based on 2014 estimated volumes and capital and 2013 actual margins
Aneth Field potential
8/12/2019 IR Presentation - May 2014 FINAL
http://slidepdf.com/reader/full/ir-presentation-may-2014-final 36/48
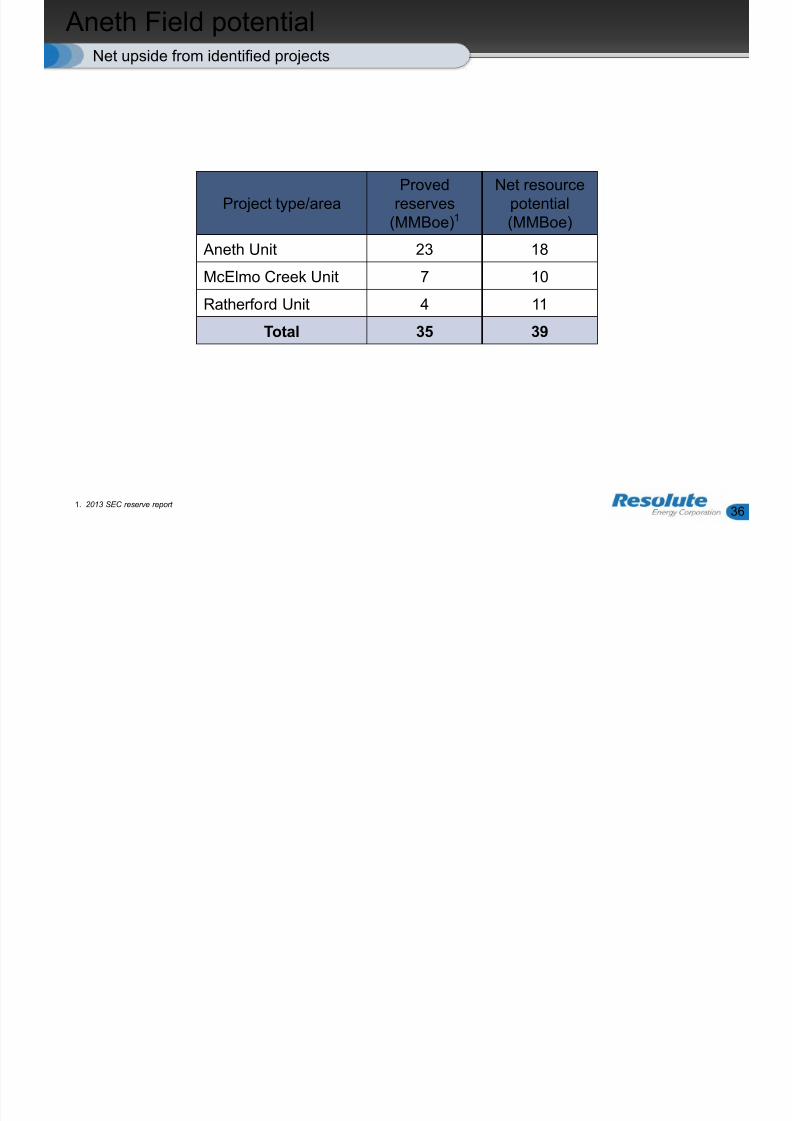
Aneth Field potential
36
Net upside from identified projects
1. 2013 SEC reserve report
Project type/areaProved
reserves(MMBoe)1
Net resourcepotential(MMBoe)
Aneth Unit 23 18McElmo Creek Unit 7 10
Ratherford Unit 4 11
Total 35 39

8/12/2019 IR Presentation - May 2014 FINAL
http://slidepdf.com/reader/full/ir-presentation-may-2014-final 37/48
Financial overview
Financial data
8/12/2019 IR Presentation - May 2014 FINAL
http://slidepdf.com/reader/full/ir-presentation-may-2014-final 38/48
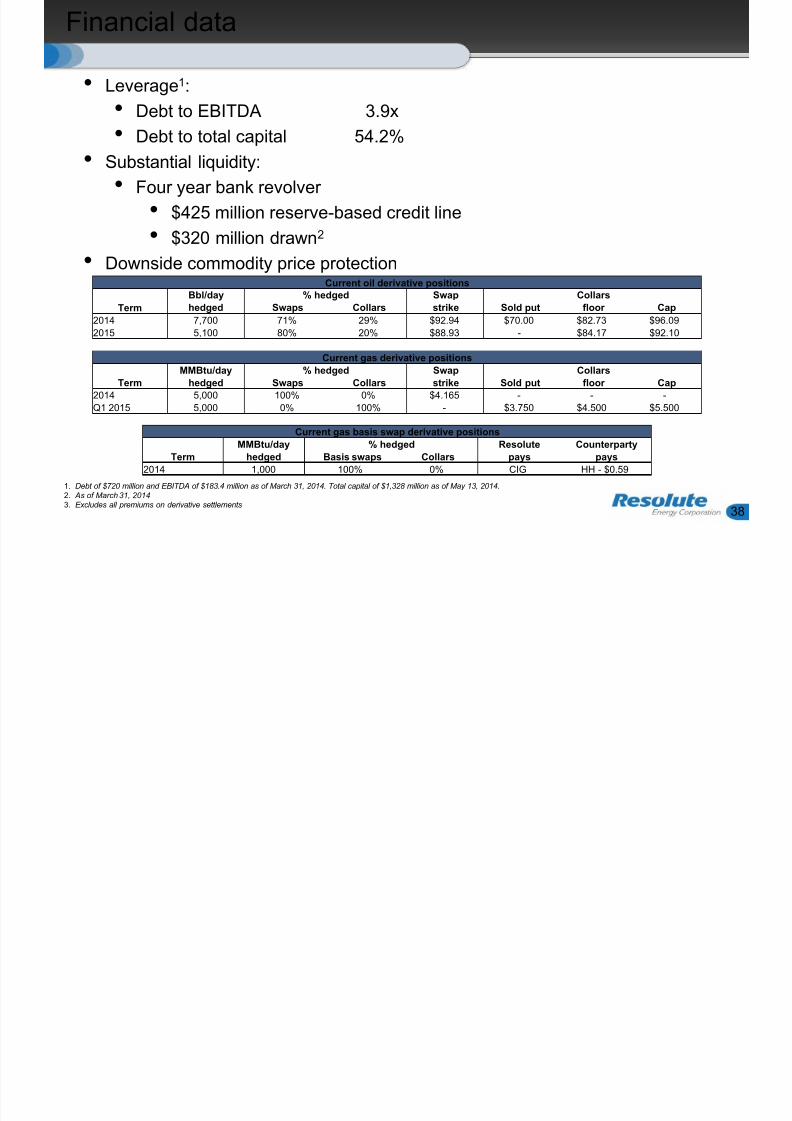
Financial data
38
• Leverage1:
• Debt to EBITDA 3.9x
• Debt to total capital 54.2%
• Substantial liquidity:
• Four year bank revolver
• $425 million reserve-based credit line
• $320 million drawn2
• Downside commodity price protection
1. Debt of $720 million and EBITDA of $183.4 million as of March 31, 2014. Total capital of $1,328 million as of May 13, 2014.2. As of March 31, 20143. Excludes all premiums on derivative settlements
Current oil derivative positionsBbl/day % hedged Swap Collars
Term hedged Swaps Collars strike Sold put floor Cap
2014 7,700 71% 29% $92.94 $70.00 $82.73 $96.09
2015 5,100 80% 20% $88.93 - $84.17 $92.10
Current gas derivative positions
MMBtu/day % hedged Swap Collars
Term hedged Swaps Collars strike Sold put floor Cap
2014 5,000 100% 0% $4.165 - - -
Q1 2015 5,000 0% 100% - $3.750 $4.500 $5.500
Current gas basis swap derivative positions
MMBtu/day % hedged Resolute Counterparty
Term hedged Basis swaps Collars pays pays
2014 1,000 100% 0% CIG HH - $0.59
Resolute potential
8/12/2019 IR Presentation - May 2014 FINAL
http://slidepdf.com/reader/full/ir-presentation-may-2014-final 39/48
Resolute potential
39
Net upside from identified projects
1. 2013 SEC reserve report
AreaProved reserves
(MMBoe)1
Net resourcepotential(MMBoe)
Total net reservesand resource
potential(MMBoe)
Aneth Field 35 39 74Permian Basin 20 80 – 220 100 – 240
Powder River Basin 4 12 – 17 16 – 21
Total 59 131 – 276 190 – 335
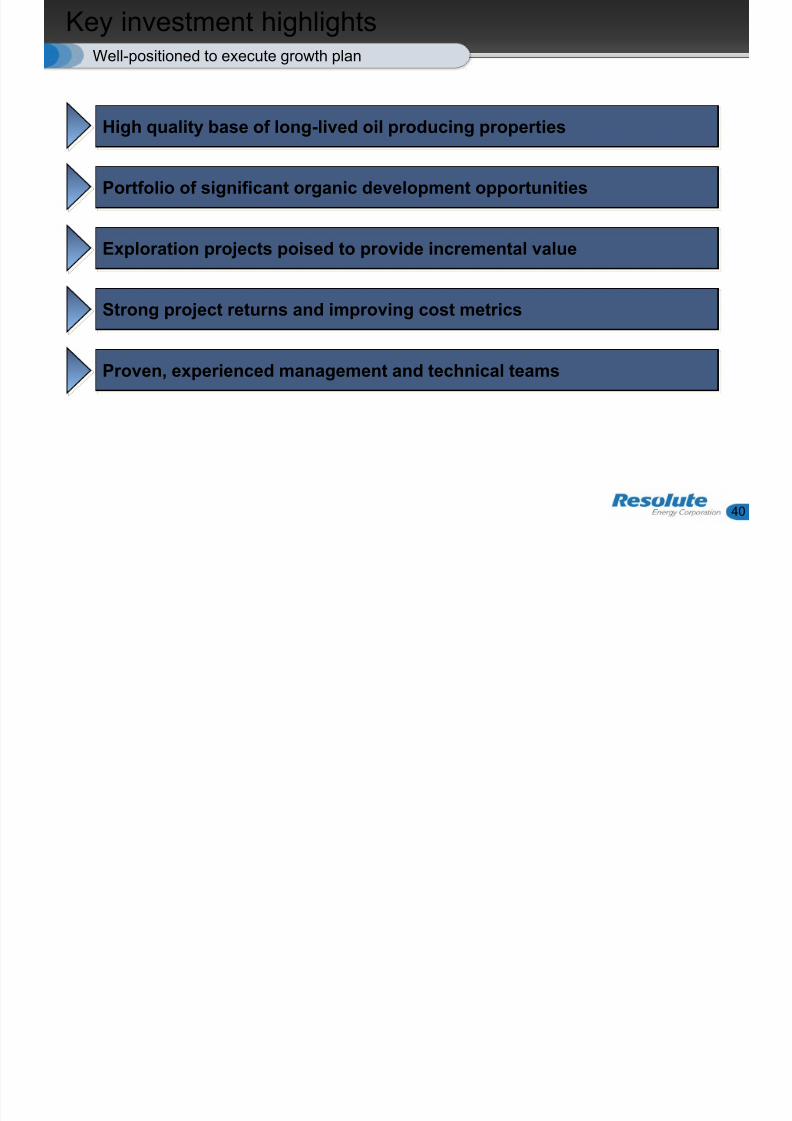
Key investment highlights
8/12/2019 IR Presentation - May 2014 FINAL
http://slidepdf.com/reader/full/ir-presentation-may-2014-final 40/48
Portfolio of significant organic development opportunities
Key investment highlights
40
Well-positioned to execute growth plan
High quality base of long-lived oil producing properties
Exploration projects poised to provide incremental value
Strong project returns and improving cost metrics
Proven, experienced management and technical teams
8/12/2019 IR Presentation - May 2014 FINAL
http://slidepdf.com/reader/full/ir-presentation-may-2014-final 41/48
Resolute investor contacts
Resolute investor contacts
8/12/2019 IR Presentation - May 2014 FINAL
http://slidepdf.com/reader/full/ir-presentation-may-2014-final 42/48
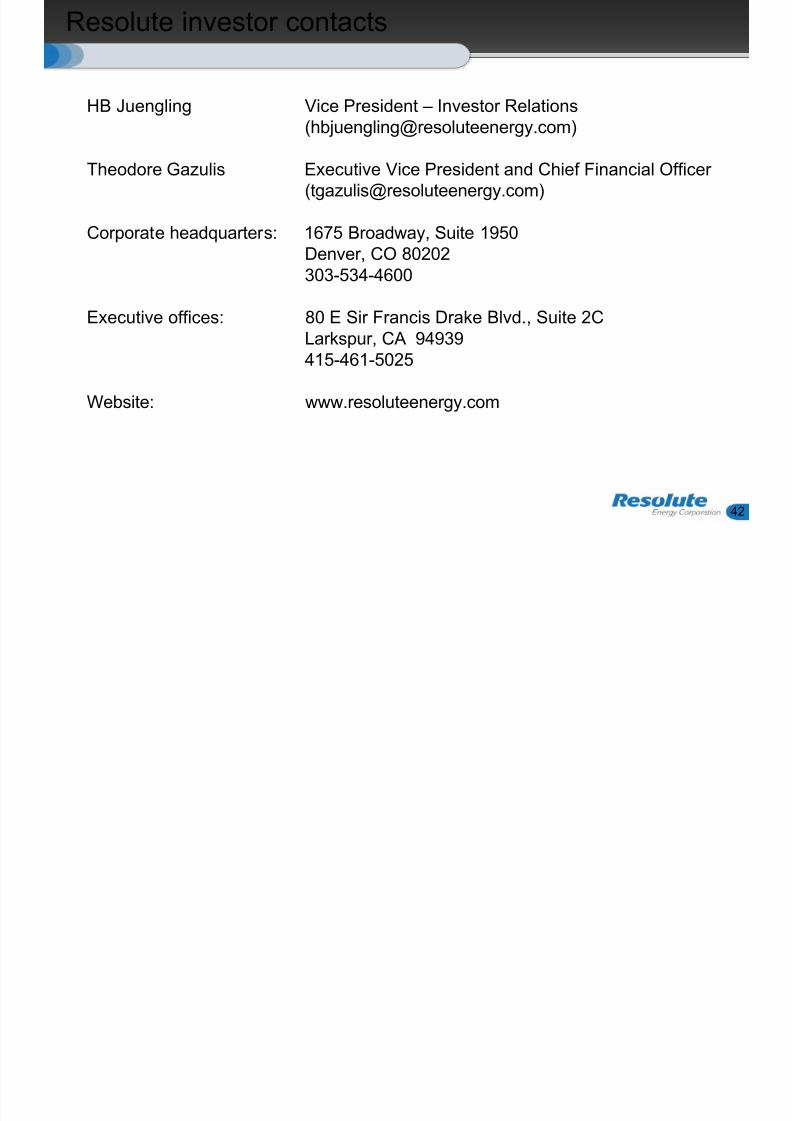
Resolute investor contacts
42
HB Juengling Vice President – Investor Relations
Theodore Gazulis Executive Vice President and Chief Financial Officer([email protected])
Corporate headquarters: 1675 Broadway, Suite 1950
Denver, CO 80202303-534-4600
Executive offices: 80 E Sir Francis Drake Blvd., Suite 2CLarkspur, CA 94939415-461-5025
Website: www.resoluteenergy.com
8/12/2019 IR Presentation - May 2014 FINAL
http://slidepdf.com/reader/full/ir-presentation-may-2014-final 43/48
Appendix
2014 production and cost guidance
8/12/2019 IR Presentation - May 2014 FINAL
http://slidepdf.com/reader/full/ir-presentation-may-2014-final 44/48
2014 production and cost guidance
44
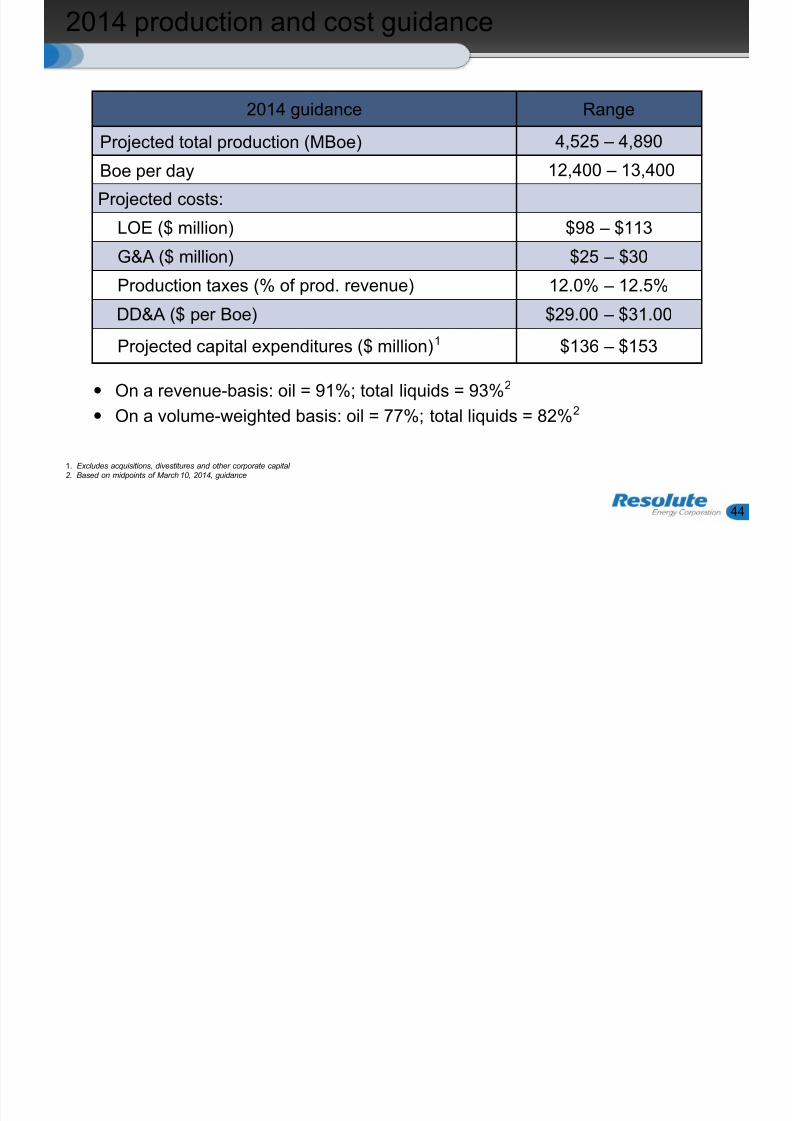
2014 guidance Range
Projected total production (MBoe) 4,525 – 4,890
Boe per day 12,400 – 13,400
Projected costs:
LOE ($ million) $98 – $113
G&A ($ million) $25 – $30
Production taxes (% of prod. revenue) 12.0% – 12.5%
DD&A ($ per Boe) $29.00 – $31.00
Projected capital expenditures ($ million)1 $136 – $153
1. Excludes acquisitions, divestitures and other corporate capital2. Based on midpoints of March 10, 2014, guidance
• On a revenue-basis: oil = 91%; total liquids = 93%2
• On a volume-weighted basis: oil = 77%; total liquids = 82%2
Margins/cost structure
8/12/2019 IR Presentation - May 2014 FINAL
http://slidepdf.com/reader/full/ir-presentation-may-2014-final 45/48
Margins/cost structure
45
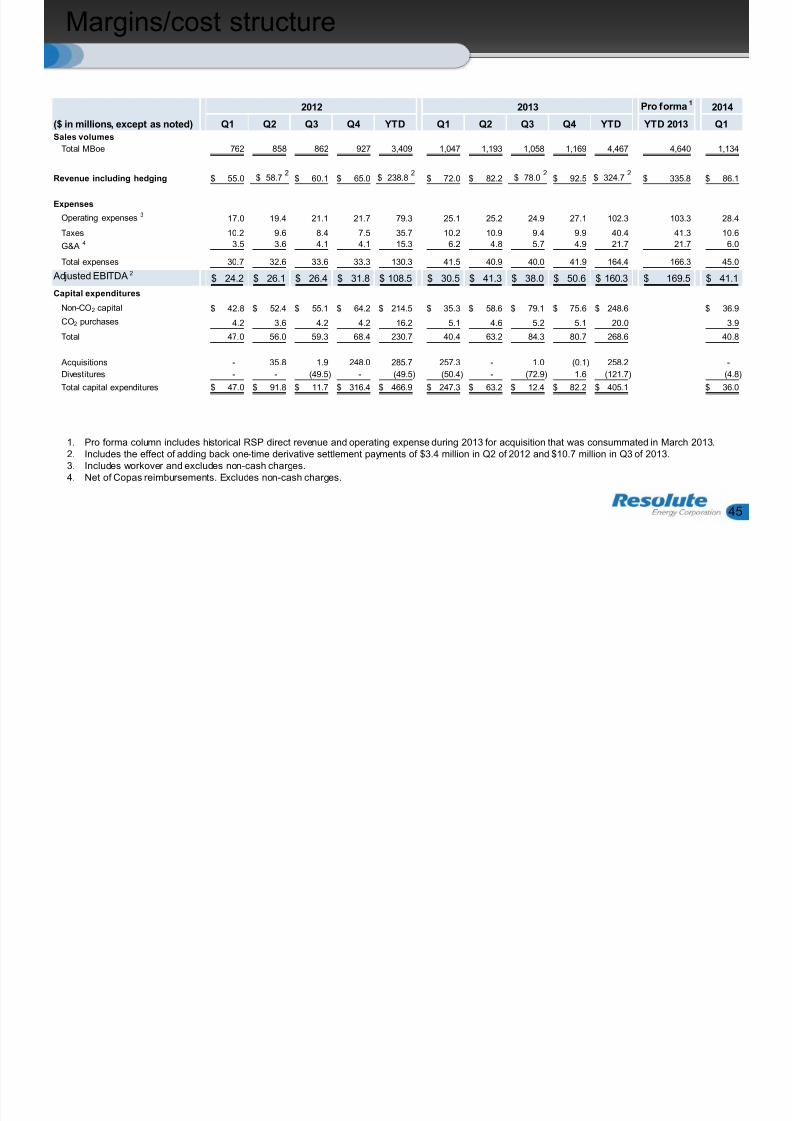
1. Pro forma column includes historical RSP direct revenue and operating expense during 2013 for acquisition that was consummated in March 2013.2. Includes the effect of adding back one-time derivative settlement payments of $3.4 million in Q2 of 2012 and $10.7 million in Q3 of 2013.3. Includes workover and excludes non-cash charges.4. Net of Copas reimbursements. Excludes non-cash charges.
Pro forma 12014
Q1 Q2 Q3 Q4 YTD Q1 Q2 Q3 Q4 YTD YTD 2013 Q1
Sales volumes
Total MBoe 762 858 862 927 3,409 1,047 1,193 1,058 1,169 4,467 4,640 1,134
Revenue including hedging 55.0$ $ 58.72
60.1$ 65.0$ $ 238.82
72.0$ 82.2$ $ 78.02
92.5$ $ 324.72
335.8$ 86.1$
Expenses
Operating expenses 317.0 19.4 21.1 21.7 79.3 25.1 25.2 24.9 27.1 102.3 103.3 28.4
Taxes 10.2 9.6 8.4 7.5 35.7 10.2 10.9 9.4 9.9 40.4 41.3 10.6
G&A 4 3.5 3.6 4.1 4.1 15.3 6.2 4.8 5.7 4.9 21.7 21.7 6.0
Total expenses 30.7 32.6 33.6 33.3 130.3 41.5 40.9 40.0 41.9 164.4 166.3 45.0
Adjusted EBITDA 224.2$ 26.1$ 26.4$ 31.8$ 108.5$ 30.5$ 41.3$ 38.0$ 50.6$ 160.3$ 169.5$ 41.1$
Capital expenditures
Non-CO2 capital 42.8$ 52.4$ 55.1$ 64.2$ 214.5$ 35.3$ 58.6$ 79.1$ 75.6$ 248.6$ 36.9$
CO2 purchases 4.2 3.6 4.2 4.2 16.2 5.1 4.6 5.2 5.1 20.0 3.9
Total 47.0 56.0 59.3 68.4 230.7 40.4 63.2 84.3 80.7 268.6 40.8
Acquisitions - 35.8 1.9 248.0 285.7 257.3 - 1.0 (0.1) 258.2 -
Divestitures - - (49.5) - (49.5) (50.4) - (72.9) 1.6 (121.7) (4.8) Total capital expenditures 47.0$ 91.8$ 11.7$ 316.4$ 466.9$ 247.3$ 63.2$ 12.4$ 82.2$ 405.1$ 36.0$
2013
($ in millions, except as noted)
2012
Margins/cost structure per Boe
8/12/2019 IR Presentation - May 2014 FINAL
http://slidepdf.com/reader/full/ir-presentation-may-2014-final 46/48
Margins/cost structure per Boe
46
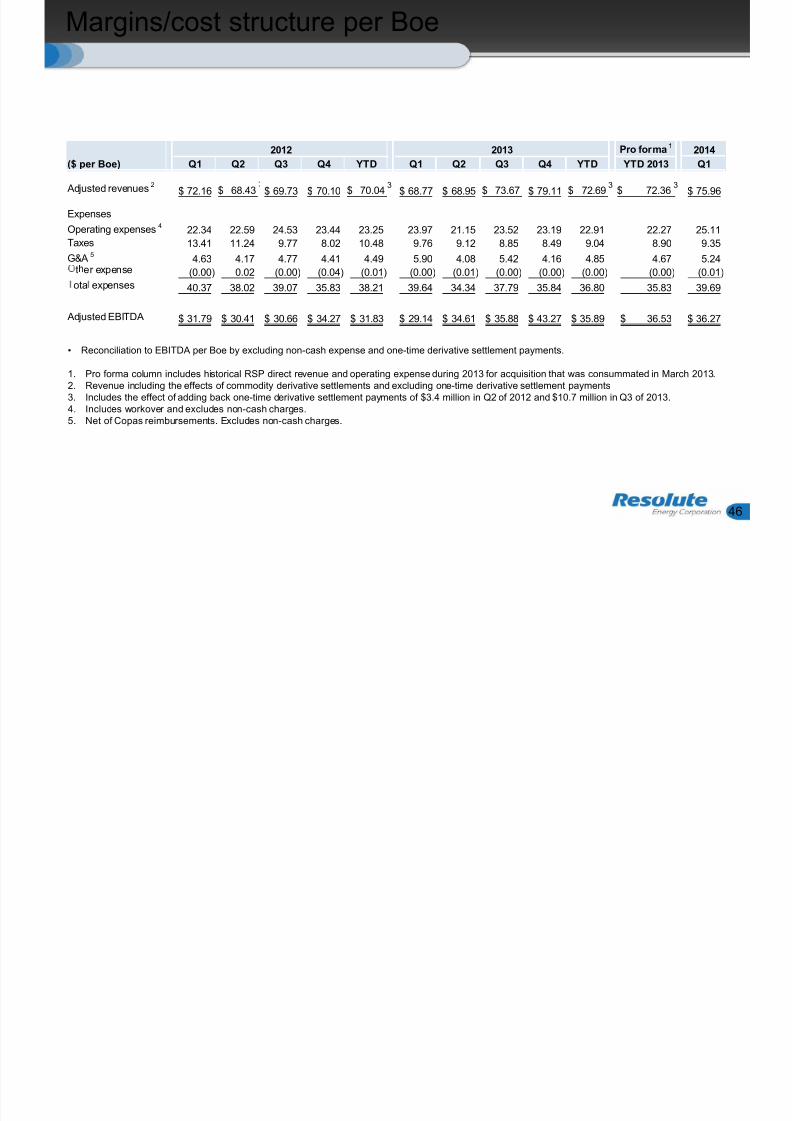
• Reconciliation to EBITDA per Boe by excluding non-cash expense and one-time derivative settlement payments.
1. Pro forma column includes historical RSP direct revenue and operating expense during 2013 for acquisition that was consummated in March 2013.2. Revenue including the effects of commodity derivative settlements and excluding one-time derivative settlement payments3. Includes the effect of adding back one-time derivative settlement payments of $3.4 million in Q2 of 2012 and $10.7 million in Q3 of 2013.4. Includes workover and excludes non-cash charges.5. Net of Copas reimbursements. Excludes non-cash charges.
Pro forma 12014
Q1 Q2 Q3 Q4 YTD Q1 Q2 Q3 Q4 YTD YTD 2013 Q1
Adjusted revenues 272.16$ $ 68.43 69.73$ 70.10$ $ 70.04
368.77$ 68.95$ $ 73.67 79.11$ $ 72.69
3$ 72.36
375.96$
Expenses
Operating expenses 422.34 22.59 24.53 23.44 23.25 23.97 21.15 23.52 23.19 22.91 22.27 25.11
Taxes 13.41 11.24 9.77 8.02 10.48 9.76 9.12 8.85 8.49 9.04 8.90 9.35
G&A 5 4.63 4.17 4.77 4.41 4.49 5.90 4.08 5.42 4.16 4.85 4.67 5.24 t er expense (0.00) 0.02 (0.00) (0.04) (0.01) (0.00) (0.01) (0.00) (0.00) (0.00) (0.00) (0.01)
ota expenses 40.37 38.02 39.07 35.83 38.21 39.64 34.34 37.79 35.84 36.80 35.83 39.69
Adjusted EBITDA 31.79$ 30.41$ 30.66$ 34.27$ 31.83$ 29.14$ 34.61$ 35.88$ 43.27$ 35.89$ 36.53$ 36.27$
2013
($ per Boe)
2012
EBITDA
8/12/2019 IR Presentation - May 2014 FINAL
http://slidepdf.com/reader/full/ir-presentation-may-2014-final 47/48
EBITDA
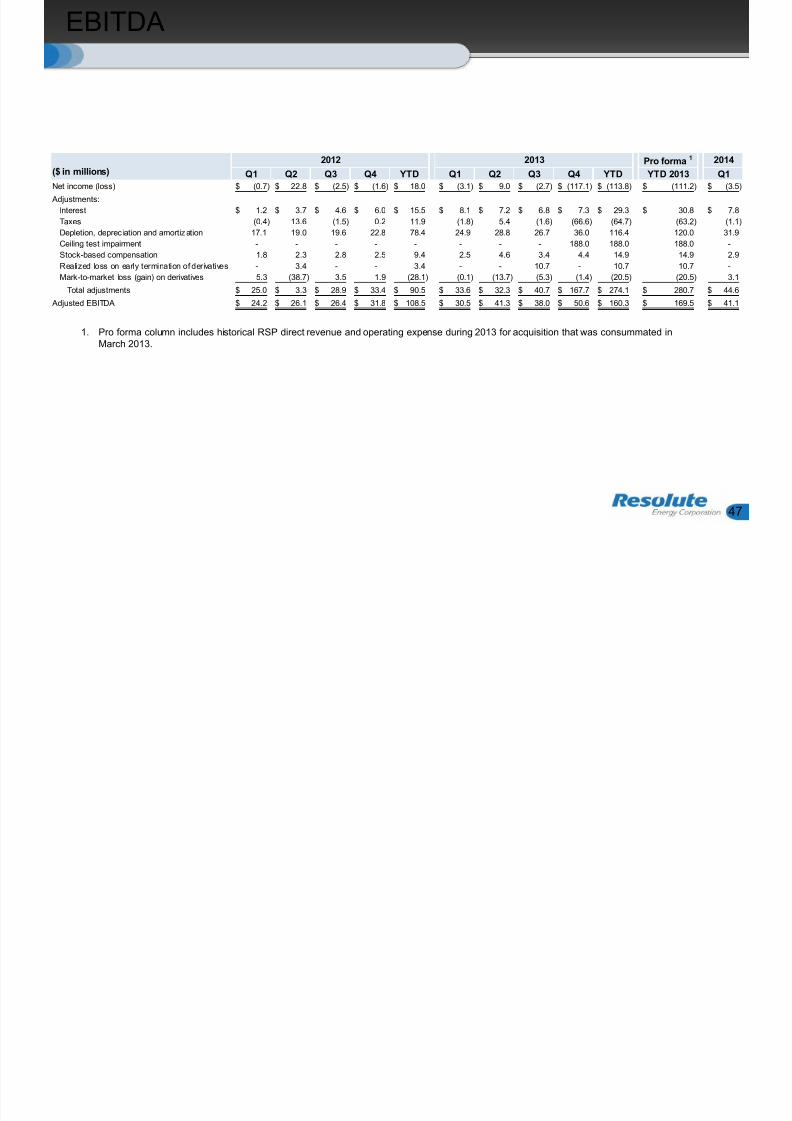
47
1. Pro forma column includes historical RSP direct revenue and operating expense during 2013 for acquisition that was consummated inMarch 2013.
Pro forma 1 2014
Q1 Q2 Q3 Q4 YTD Q1 Q2 Q3 Q4 YTD YTD 2013 Q1
Net income (loss) (0.7)$ 22.8$ (2.5)$ (1.6)$ 18.0$ (3.1)$ 9.0$ (2.7)$ (117.1)$ (113.8)$ (111.2)$ (3.5)$
Adjustments:
Interest 1.2$ 3.7$ 4.6$ 6.0$ 15.5$ 8.1$ 7.2$ 6.8$ 7.3$ 29.3$ 30.8$ 7.8$
Taxes (0.4) 13.6 (1.5) 0.2 11.9 (1.8) 5.4 (1.6) (66.6) (64.7) (63.2) (1.1)
Depletion, deprec iation and amortization 17.1 19.0 19.6 22.8 78.4 24.9 28.8 26.7 36.0 116.4 120.0 31.9
Ceiling test impairment - - - - - - - - 188.0 188.0 188.0 -
Stock-based compensation 1.8 2.3 2.8 2.5 9.4 2.5 4.6 3.4 4.4 14.9 14.9 2.9 Realized loss on early termination of derivatives - 3.4 - - 3.4 - - 10.7 - 10.7 10.7 -
Mark-to-market loss (gain) on derivatives 5.3 (38.7) 3.5 1.9 (28.1) (0.1) (13.7) (5.3) (1.4) (20.5) (20.5) 3.1
Total adjustments 25.0$ 3.3$ 28.9$ 33.4$ 90.5$ 33.6$ 32.3$ 40.7$ 167.7$ 274.1$ 280.7$ 44.6$
Adjusted EBITDA 24.2$ 26.1$ 26.4$ 31.8$ 108.5$ 30.5$ 41.3$ 38.0$ 50.6$ 160.3$ 169.5$ 41.1$
20132012
($ in millions)
Quarterly prices and volumes
8/12/2019 IR Presentation - May 2014 FINAL
http://slidepdf.com/reader/full/ir-presentation-may-2014-final 48/48
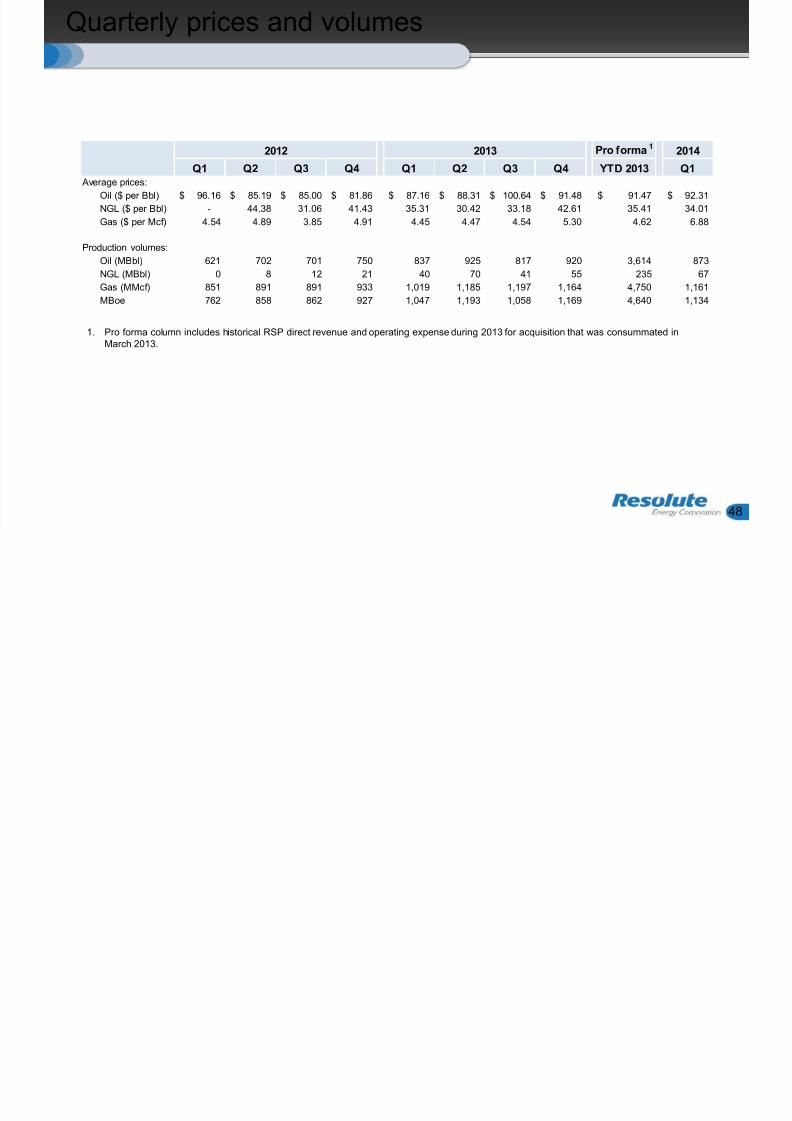
Quarterly prices and volumes
1. Pro forma column includes historical RSP direct revenue and operating expense during 2013 for acquisition that was consummated inMarch 2013.
Pro forma 12014
Q1 Q2 Q3 Q4 Q1 Q2 Q3 Q4 YTD 2013 Q1 Average prices:
Oil ($ per Bbl) 96.16$ 85.19$ 85.00$ 81.86$ 87.16$ 88.31$ 100.64$ 91.48$ 91.47$ 92.31$
NGL ($ per Bbl) - 44.38 31.06 41.43 35.31 30.42 33.18 42.61 35.41 34.01
Gas ($ per Mcf) 4.54 4.89 3.85 4.91 4.45 4.47 4.54 5.30 4.62 6.88
Production volumes:
Oil (MBbl) 621 702 701 750 837 925 817 920 3,614 873
NGL (MBbl) 0 8 12 21 40 70 41 55 235 67
Gas (MMcf) 851 891 891 933 1,019 1,185 1,197 1,164 4,750 1,161
MBoe 762 858 862 927 1,047 1,193 1,058 1,169 4,640 1,134
20132012