investor presentation first quarter of 2016 - novo … presentation first quarter of 2016 ......
TRANSCRIPT

Slide 1
5,05
4,10
3,50
4,72
11,82 11,82
Investor presentation
First quarter of 2016
Shanghai – part of Cities Changing Diabetes
Slide 2
5,05
4,10
3,50
4,72
11,82 11,82
Agenda
Investor presentation First quarter of 2016
Highlights and key events
R&D update
Financials and outlook
Sales update
Slide 3
5,05
4,10
3,50
4,72
11,82 11,82
Forward-looking statements
Novo Nordisk’s reports filed with or furnished to the US Securities and Exchange Commission (SEC), including the company’s Annual Report 2015 and Form 20-F, which are both filed with the SEC in February 2016 in continuation of the publication of the Annual Report 2015, and presentations made, written information released, or oral statements made, to the public in the future by or on behalf of Novo Nordisk, may contain forward-looking statements. Words such as ‘believe’, ‘expect’, ‘may’, ‘will’, ‘plan’, ‘strategy’, ‘prospect’, ‘foresee’, ‘estimate’, ‘project’, ‘anticipate’, ‘can’, ‘intend’, ‘target’ and other words and terms of similar meaning in connection with any discussion of future operating or financial performance identify forward-looking statements. Examples of such forward-looking statements include, but are not limited to:
• Statements of targets, plans, objectives or goals for future operations, including those related to Novo Nordisk’s products, product research, product development, product introductions and product approvals as well as cooperation in relation thereto
• Statements containing projections of or targets for revenues, costs, income (or loss), earnings per share, capital expenditures, dividends, capital structure, net financials and other financial measures
• Statements regarding future economic performance, future actions and outcome of contingencies such as legal proceedings, and
• Statements regarding the assumptions underlying or relating to such statements.
These statements are based on current plans, estimates and projections. By their very nature, forward-looking statements involve inherent risks and uncertainties, both general and specific. Novo Nordisk cautions that a number of important factors, including those described in this presentation, could cause actual results to differ materially from those contemplated in any forward-looking statements.
Factors that may affect future results include, but are not limited to, global as well as local political and economic conditions, including interest rate and currency exchange rate fluctuations, delay or failure of projects related to research and/or development, unplanned loss of patents, interruptions of supplies and production, product recall, unexpected contract breaches or terminations, government-mandated or market-driven price decreases for Novo Nordisk’s products, introduction of competing products, reliance on information technology, Novo Nordisk’s ability to successfully market current and new products, exposure to product liability and legal proceedings and investigations, changes in governmental laws and related interpretation thereof, including on reimbursement, intellectual property protection and regulatory controls on testing, approval, manufacturing and marketing, perceived or actual failure to adhere to ethical marketing practices, investments in and divestitures of domestic and foreign companies, unexpected growth in costs and expenses, failure to recruit and retain the right employees, and failure to maintain a culture of compliance.
Please also refer to the overview of risk factors in ‘Managing risks’ on p 42-43 of the Annual Report 2015.
Unless required by law, Novo Nordisk is under no duty and undertakes no obligation to update or revise any forward-looking statement after the distribution of this presentation, whether as a result of new information, future events or otherwise.
Important drug information
• Victoza® (liraglutide 1.2 mg & 1.8 mg) is approved for the management of type 2 diabetes only
• Saxenda® (liraglutide 3 mg) is approved in the US and EU for the treatment of obesity only
Investor presentation First quarter of 2016
Slide 4
5,05
4,10
3,50
4,72
11,82 11,82
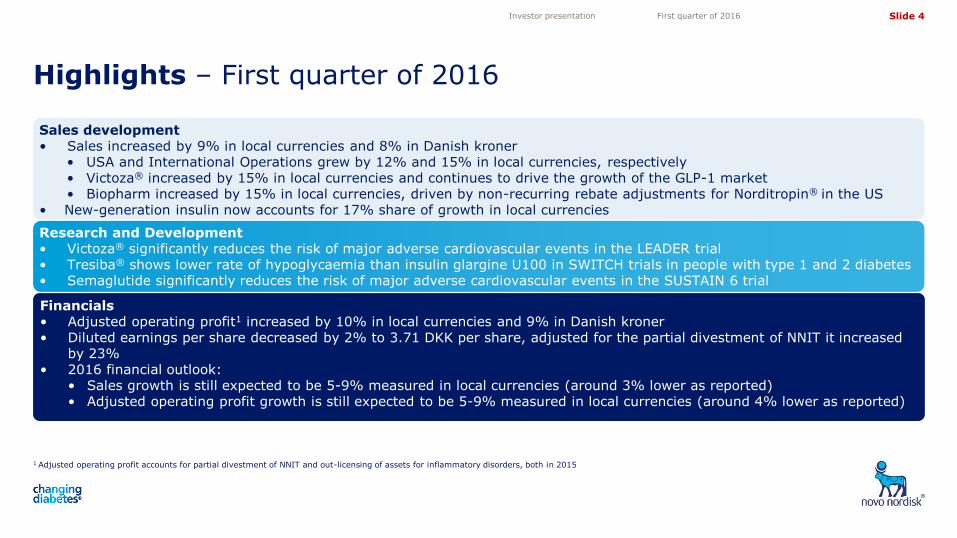
Highlights – First quarter of 2016
1 Adjusted operating profit accounts for partial divestment of NNIT and out-licensing of assets for inflammatory disorders, both in 2015
Investor presentation First quarter of 2016
Research and Development • Victoza® significantly reduces the risk of major adverse cardiovascular events in the LEADER trial • Tresiba® shows lower rate of hypoglycaemia than insulin glargine U100 in SWITCH trials in people with type 1 and 2 diabetes • Semaglutide significantly reduces the risk of major adverse cardiovascular events in the SUSTAIN 6 trial
Sales development • Sales increased by 9% in local currencies and 8% in Danish kroner
• USA and International Operations grew by 12% and 15% in local currencies, respectively • Victoza® increased by 15% in local currencies and continues to drive the growth of the GLP-1 market • Biopharm increased by 15% in local currencies, driven by non-recurring rebate adjustments for Norditropin® in the US
• New-generation insulin now accounts for 17% share of growth in local currencies
Financials • Adjusted operating profit1 increased by 10% in local currencies and 9% in Danish kroner • Diluted earnings per share decreased by 2% to 3.71 DKK per share, adjusted for the partial divestment of NNIT it increased
by 23% • 2016 financial outlook:
• Sales growth is still expected to be 5-9% measured in local currencies (around 3% lower as reported) • Adjusted operating profit growth is still expected to be 5-9% measured in local currencies (around 4% lower as reported)
Slide 5
5,05
4,10
3,50
4,72
11,82 11,82
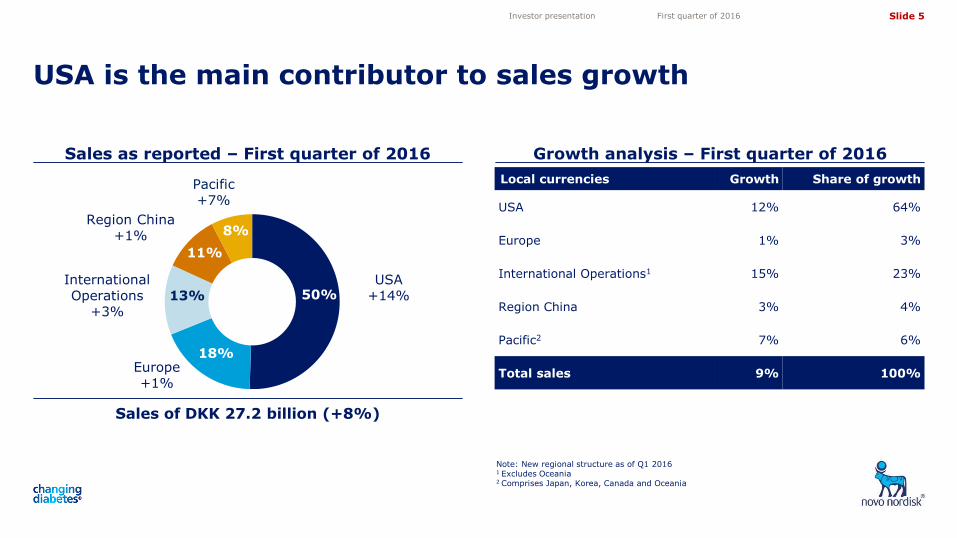
Growth analysis – First quarter of 2016
USA is the main contributor to sales growth
Investor presentation First quarter of 2016
Sales as reported – First quarter of 2016
Sales of DKK 27.2 billion (+8%)
Local currencies Growth Share of growth
USA 12% 64%
Europe 1% 3%
International Operations1 15% 23%
Region China 3% 4%
Pacific2 7% 6%
Total sales 9% 100%
International Operations
+3%
Region China +1%
Pacific +7%
USA +14%
Europe +1%
50%
18%
13%
11%
8%
Note: New regional structure as of Q1 2016 1 Excludes Oceania 2 Comprises Japan, Korea, Canada and Oceania
Slide 6
5,05
4,10
3,50
4,72
11,82 11,82
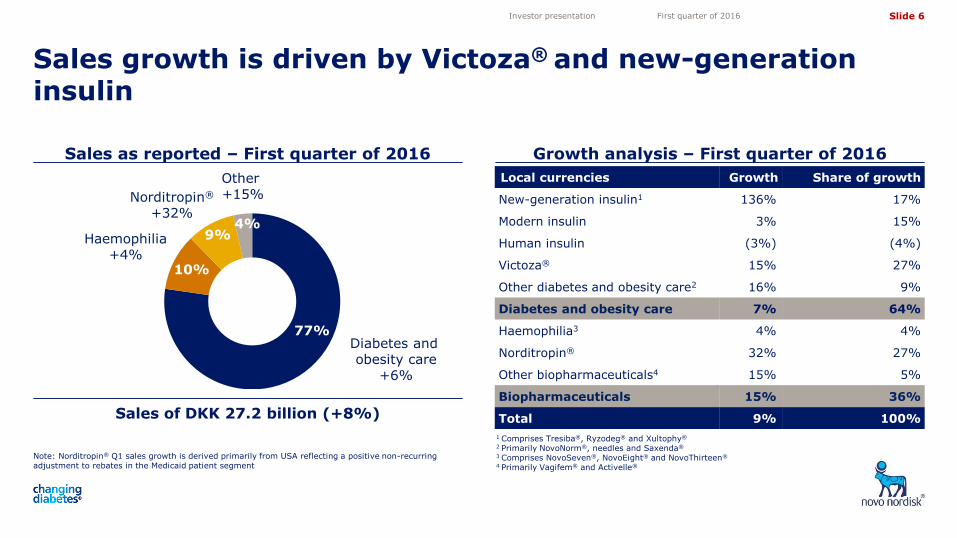
Local currencies Growth Share of growth
New-generation insulin1 136% 17%
Modern insulin 3% 15%
Human insulin (3%) (4%)
Victoza® 15% 27%
Other diabetes and obesity care2 16% 9%
Diabetes and obesity care 7% 64%
Haemophilia3 4% 4%
Norditropin® 32% 27%
Other biopharmaceuticals4 15% 5%
Biopharmaceuticals 15% 36%
Total 9% 100%
Sales growth is driven by Victoza® and new-generation insulin
Investor presentation First quarter of 2016
Sales as reported – First quarter of 2016
Sales of DKK 27.2 billion (+8%)
Growth analysis – First quarter of 2016
1 Comprises Tresiba®, Ryzodeg® and Xultophy®
2 Primarily NovoNorm®, needles and Saxenda®
3 Comprises NovoSeven®, NovoEight® and NovoThirteen®
4 Primarily Vagifem® and Activelle®
Other +15%
7% Haemophilia +4%
11%
Diabetes and obesity care
+6%
79%
3%
77%
10%
9% 4%
Norditropin®
+32%
Note: Norditropin® Q1 sales growth is derived primarily from USA reflecting a positive non-recurring adjustment to rebates in the Medicaid patient segment
Slide 7
5,05
4,10
3,50
4,72
11,82 11,82
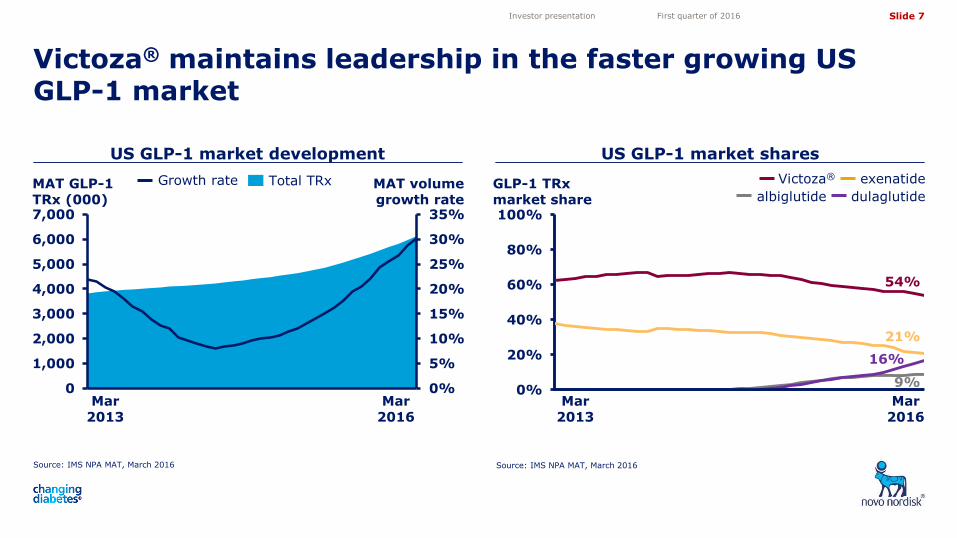
Source: IMS NPA MAT, March 2016
US GLP-1 market development
Source: IMS NPA MAT, March 2016
Investor presentation First quarter of 2016
Total TRx Growth rate
US GLP-1 market shares
exenatide Victoza®
albiglutide dulaglutide MAT GLP-1 TRx (000)
GLP-1 TRx market share
MAT volume growth rate
Victoza® maintains leadership in the faster growing US GLP-1 market
Mar 2016
Mar 2013
54%
9%
16%
21%
0%
20%
40%
60%
80%
100%
0%
5%
10%
15%
20%
25%
30%
35%
0
1,000
2,000
3,000
4,000
5,000
6,000
7,000
Thousands
Mar 2013
Mar 2016
Slide 8
5,05
4,10
3,50
4,72
11,82 11,82
34%
7%
13%
8% 6%
4%
13%
16% 15%
28%
3%
0%
5%
10%
15%
20%
25%
30%
35%
0 4 8 12 16 20 24 28 32 36
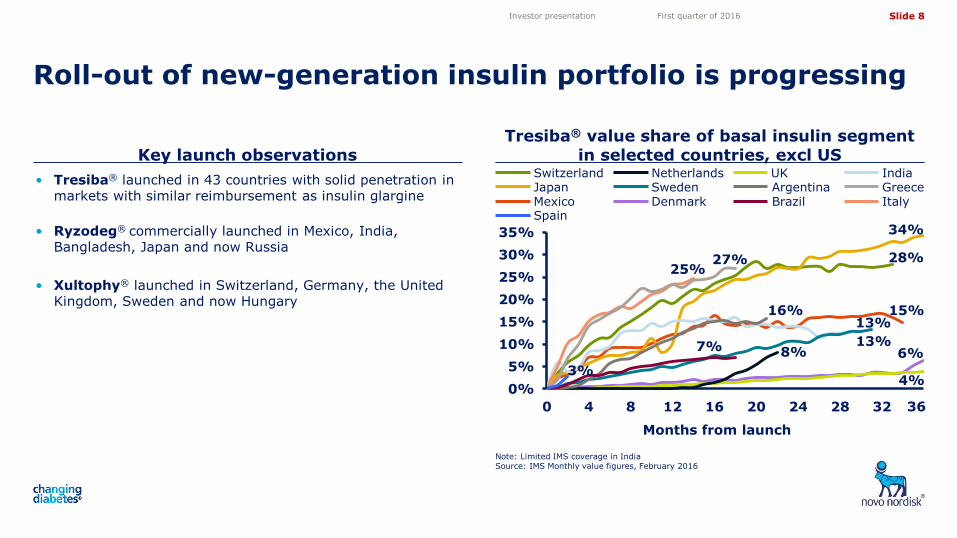
• Tresiba® launched in 43 countries with solid penetration in markets with similar reimbursement as insulin glargine
• Ryzodeg® commercially launched in Mexico, India,
Bangladesh, Japan and now Russia
• Xultophy® launched in Switzerland, Germany, the United Kingdom, Sweden and now Hungary
Key launch observations Tresiba® value share of basal insulin segment
in selected countries, excl US
Roll-out of new-generation insulin portfolio is progressing
Note: Limited IMS coverage in India Source: IMS Monthly value figures, February 2016
Investor presentation First quarter of 2016
Months from launch
Mexico
Switzerland Japan Sweden
Denmark
Netherlands Argentina Brazil
UK India Greece Italy
27% 25%
Spain
36
Slide 9
5,05
4,10
3,50
4,72
11,82 11,82
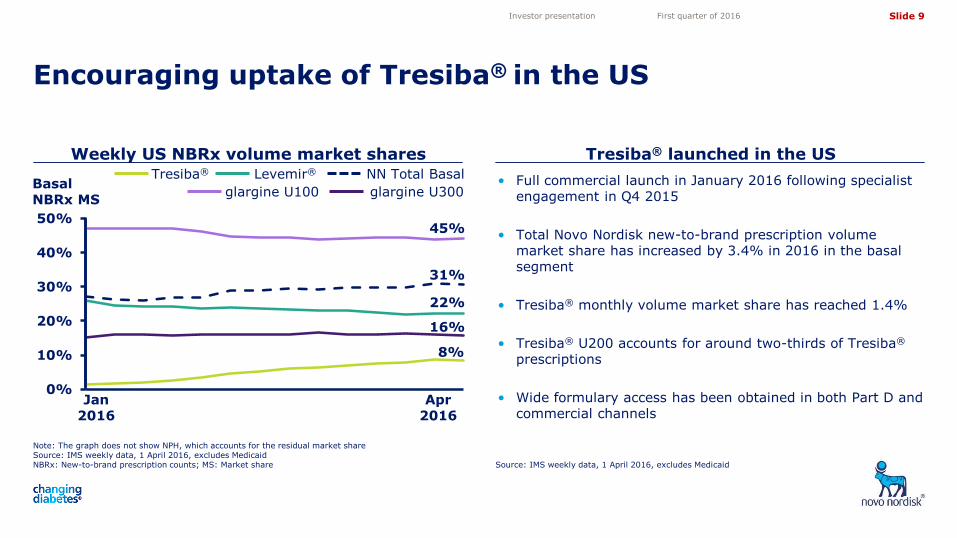
Weekly US NBRx volume market shares
Encouraging uptake of Tresiba® in the US
Source: IMS weekly data, 1 April 2016, excludes Medicaid
Investor presentation First quarter of 2016
Tresiba® launched in the US
• Full commercial launch in January 2016 following specialist engagement in Q4 2015
• Total Novo Nordisk new-to-brand prescription volume market share has increased by 3.4% in 2016 in the basal segment
• Tresiba® monthly volume market share has reached 1.4%
• Tresiba® U200 accounts for around two-thirds of Tresiba® prescriptions
• Wide formulary access has been obtained in both Part D and commercial channels
0%
10%
20%
30%
40%
50%
01-01-2016
Levemir® NN Total Basal Tresiba®
glargine U100 glargine U300
Jan 2016
Apr 2016
45%
31%
22%
16%
8%
Note: The graph does not show NPH, which accounts for the residual market share Source: IMS weekly data, 1 April 2016, excludes Medicaid NBRx: New-to-brand prescription counts; MS: Market share
Basal NBRx MS
Slide 10
5,05
4,10
3,50
4,72
11,82 11,82
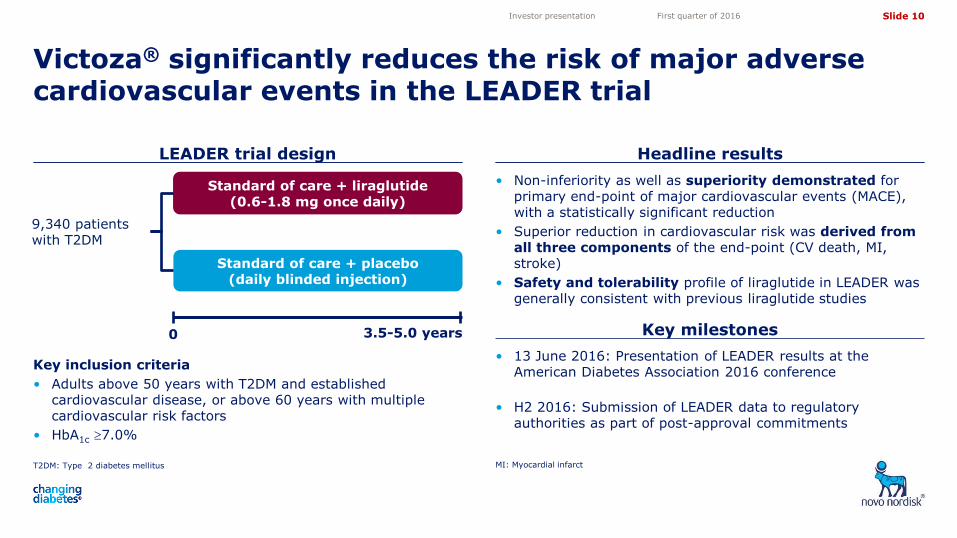
LEADER trial design Headline results
Victoza® significantly reduces the risk of major adverse cardiovascular events in the LEADER trial
T2DM: Type 2 diabetes mellitus
Investor presentation First quarter of 2016
Standard of care + placebo (daily blinded injection)
Standard of care + liraglutide (0.6-1.8 mg once daily)
0 3.5-5.0 years
9,340 patients with T2DM
Key inclusion criteria
• Adults above 50 years with T2DM and established cardiovascular disease, or above 60 years with multiple cardiovascular risk factors
• HbA1c 7.0%
• Non-inferiority as well as superiority demonstrated for primary end-point of major cardiovascular events (MACE), with a statistically significant reduction
• Superior reduction in cardiovascular risk was derived from all three components of the end-point (CV death, MI, stroke)
• Safety and tolerability profile of liraglutide in LEADER was generally consistent with previous liraglutide studies
• 13 June 2016: Presentation of LEADER results at the American Diabetes Association 2016 conference
• H2 2016: Submission of LEADER data to regulatory authorities as part of post-approval commitments
Key milestones
MI: Myocardial infarct
Slide 11
5,05
4,10
3,50
4,72
11,82 11,82
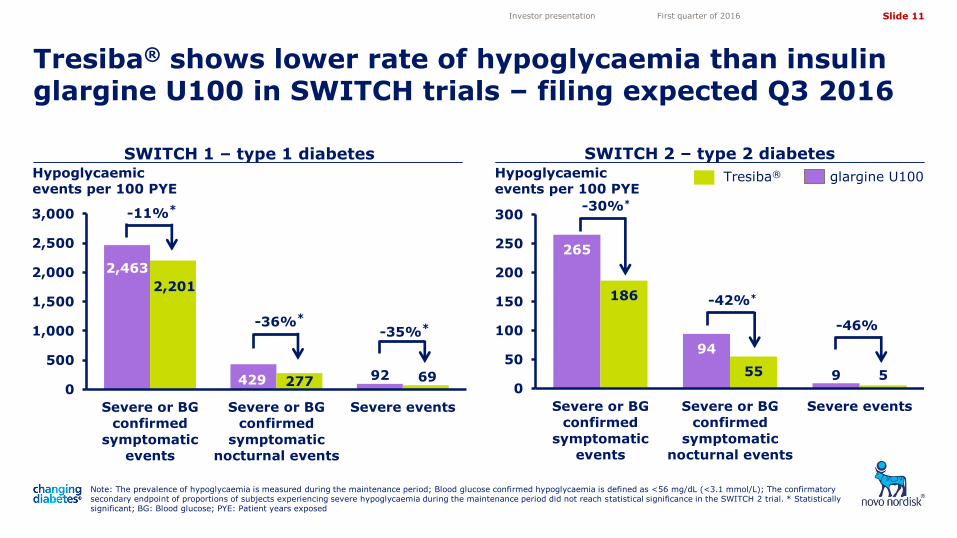
Tresiba® shows lower rate of hypoglycaemia than insulin glargine U100 in SWITCH trials – filing expected Q3 2016
Investor presentation First quarter of 2016
2,463
429 92
2,201
277 69 0
500
1,000
1,500
2,000
2,500
3,000
Severe or BG
confirmed
symptomatic
events
Severe or BG
confirmed
symptomatic
nocturnal events
Severe events
SWITCH 1 – type 1 diabetes SWITCH 2 – type 2 diabetes
Note: The prevalence of hypoglycaemia is measured during the maintenance period; Blood glucose confirmed hypoglycaemia is defined as <56 mg/dL (<3.1 mmol/L); The confirmatory secondary endpoint of proportions of subjects experiencing severe hypoglycaemia during the maintenance period did not reach statistical significance in the SWITCH 2 trial. * Statistically significant; BG: Blood glucose; PYE: Patient years exposed
265
94
9
186
55 5 0
50
100
150
200
250
300
Severe or BG
confirmed
symptomatic
events
Severe or BG
confirmed
symptomatic
nocturnal events
Severe events
-11%*
-36%*
-35%*
-30%*
-42%*
-46%
Tresiba® glargine U100 Hypoglycaemic events per 100 PYE
Hypoglycaemic events per 100 PYE
Slide 12
5,05
4,10
3,50
4,72
11,82 11,82
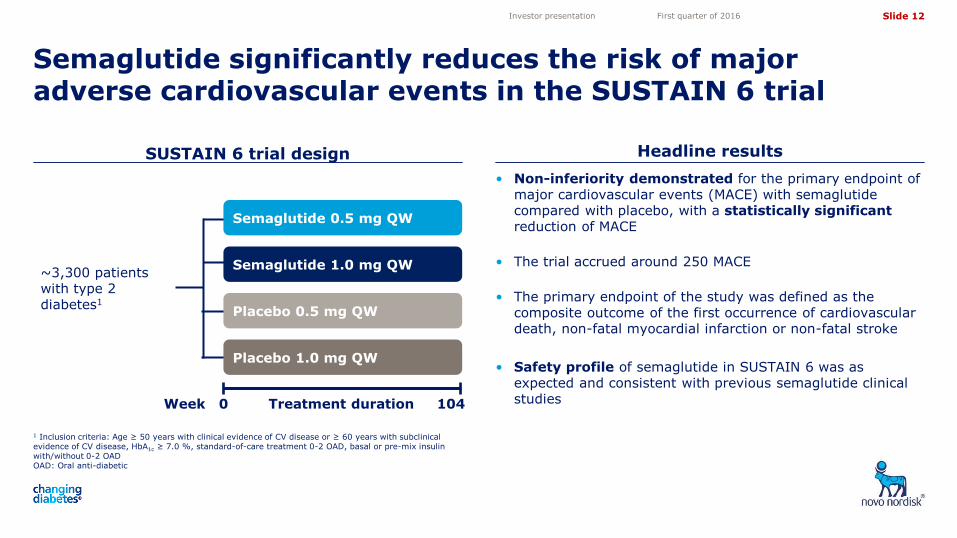
• Non-inferiority demonstrated for the primary endpoint of major cardiovascular events (MACE) with semaglutide compared with placebo, with a statistically significant reduction of MACE
• The trial accrued around 250 MACE
• The primary endpoint of the study was defined as the composite outcome of the first occurrence of cardiovascular death, non-fatal myocardial infarction or non-fatal stroke
• Safety profile of semaglutide in SUSTAIN 6 was as expected and consistent with previous semaglutide clinical studies
1 Inclusion criteria: Age ≥ 50 years with clinical evidence of CV disease or ≥ 60 years with subclinical evidence of CV disease, HbA1c ≥ 7.0 %, standard-of-care treatment 0-2 OAD, basal or pre-mix insulin with/without 0-2 OAD OAD: Oral anti-diabetic
SUSTAIN 6 trial design
Semaglutide significantly reduces the risk of major adverse cardiovascular events in the SUSTAIN 6 trial
Investor presentation First quarter of 2016
Headline results
~3,300 patients with type 2 diabetes1
Week 0 Treatment duration 104
Semaglutide 0.5 mg QW
Semaglutide 1.0 mg QW
Placebo 0.5 mg QW
Placebo 1.0 mg QW
Slide 13
5,05
4,10
3,50
4,72
11,82 11,82
Key development milestones
Investor presentation First quarter of 2016
SUSTAIN 5 comparing semaglutide with insulin glargine U100 successfully completed
Phase 3a trial, PIONEER 3, initiated comparing oral semaglutide (NN9924) with sitagliptin
Advisory Committee meeting scheduled on 24 May 2016 with the FDA to discuss IDegLira (NN9068)
Positive results from phase 3a trial with long-acting growth hormone, somapacitan (NN8640), for treatment of Adult Growth Hormone Deficiency (AGHD)
Slide 14
5,05
4,10
3,50
4,72
11,82 11,82
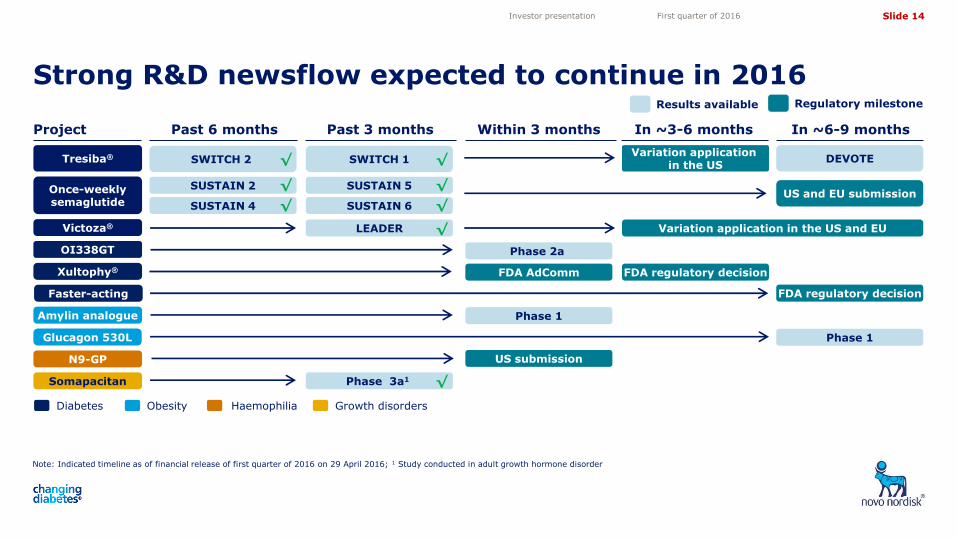
Strong R&D newsflow expected to continue in 2016
Investor presentation First quarter of 2016
Project Past 6 months Past 3 months Within 3 months In ~3-6 months
Tresiba® SWITCH 2
Victoza®
Amylin analogue
Results available
In ~6-9 months
Xultophy®
SUSTAIN 6
LEADER
Phase 1
FDA regulatory decision
Phase 1
Once-weekly semaglutide
SWITCH 1 DEVOTE √
Glucagon 530L
SUSTAIN 2 √
SUSTAIN 4 √
Note: Indicated timeline as of financial release of first quarter of 2016 on 29 April 2016; 1 Study conducted in adult growth hormone disorder
SUSTAIN 5
OI338GT Phase 2a
N9-GP US submission
Diabetes Obesity Haemophilia
Somapacitan Phase 3a1
Growth disorders
√
√
√
√
√
Variation application in the US
Regulatory milestone
Variation application in the US and EU
Faster-acting FDA regulatory decision
FDA AdComm
US and EU submission
Slide 15
5,05
4,10
3,50
4,72
11,82 11,82
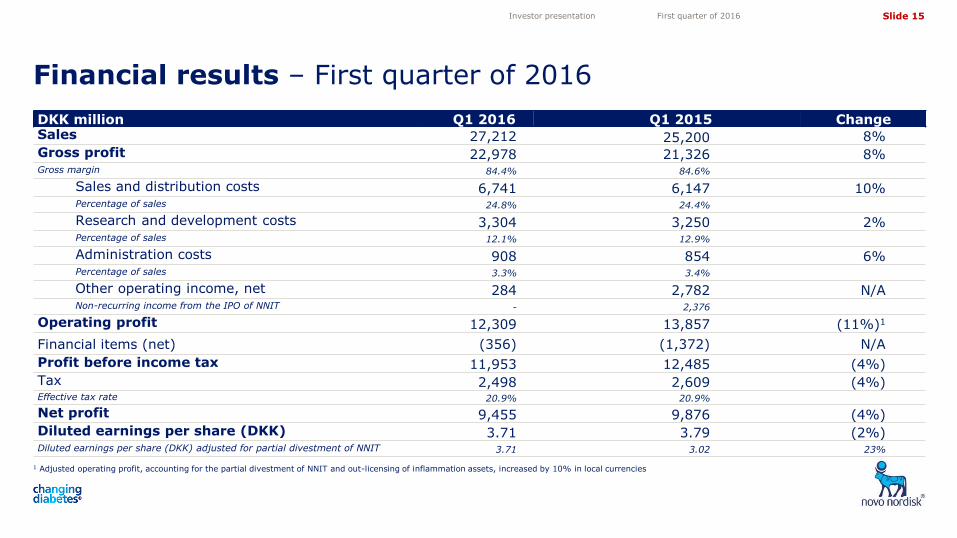
DKK million Q1 2016 Q1 2015 Change Sales 27,212 25,200 8% Gross profit 22,978 21,326 8% Gross margin 84.4% 84.6%
Sales and distribution costs 6,741 6,147 10% Percentage of sales 24.8% 24.4%
Research and development costs 3,304 3,250 2% Percentage of sales 12.1% 12.9%
Administration costs 908 854 6% Percentage of sales 3.3% 3.4%
Other operating income, net 284 2,782 N/A Non-recurring income from the IPO of NNIT - 2,376
Operating profit 12,309 13,857 (11%)1
Financial items (net) (356) (1,372) N/A
Profit before income tax 11,953 12,485 (4%) Tax 2,498 2,609 (4%) Effective tax rate 20.9% 20.9%
Net profit 9,455 9,876 (4%) Diluted earnings per share (DKK) 3.71 3.79 (2%) Diluted earnings per share (DKK) adjusted for partial divestment of NNIT 3.71 3.02 23%
Financial results – First quarter of 2016
1 Adjusted operating profit, accounting for the partial divestment of NNIT and out-licensing of inflammation assets, increased by 10% in local currencies
Investor presentation First quarter of 2016
Slide 16
5,05
4,10
3,50
4,72
11,82 11,82
40
60
80
100
120
140
80
85
90
95
100
105
110
115
120
125
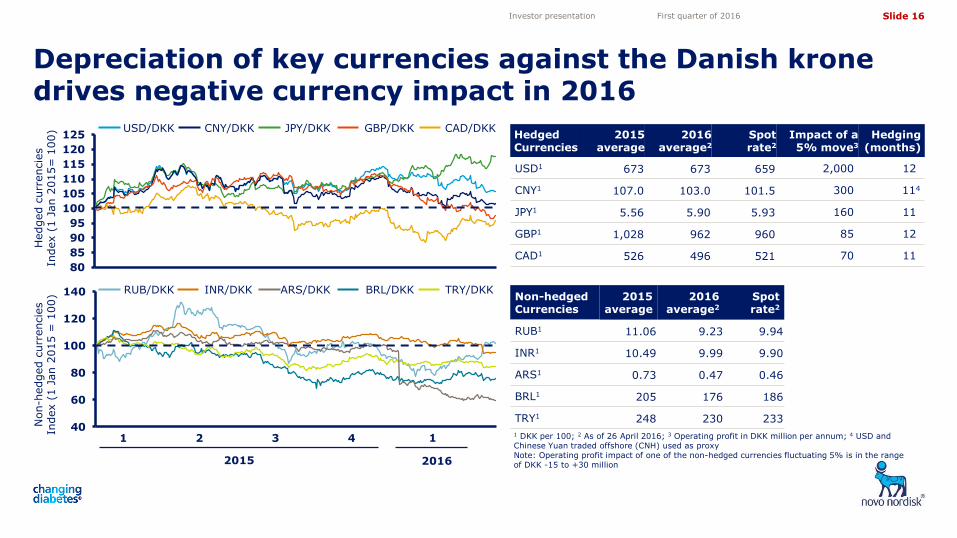
Depreciation of key currencies against the Danish krone drives negative currency impact in 2016
Investor presentation First quarter of 2016
Hedged c
urr
encie
s
Index (
1 J
an 2
015=
100)
CNY/DKK JPY/DKK USD/DKK
Non-h
edged c
urr
encie
s
Index (
1 J
an 2
015 =
100)
CAD/DKK GBP/DKK
1 DKK per 100; 2 As of 26 April 2016; 3 Operating profit in DKK million per annum; 4 USD and Chinese Yuan traded offshore (CNH) used as proxy
Note: Operating profit impact of one of the non-hedged currencies fluctuating 5% is in the range of DKK -15 to +30 million
Hedged Currencies
2015 average
2016 average2
Spot rate2
Impact of a 5% move3
Hedging (months)
USD1 673 673 659 2,000 12
CNY1 107.0 103.0 101.5 300 114
JPY1 5.56 5.90 5.93 160 11
GBP1 1,028 962 960 85 12
CAD1 526 496 521 70 11
Non-hedged Currencies
2015 average
2016 average2
Spot rate2
RUB1 11.06 9.23 9.94
INR1 10.49 9.99 9.90
ARS1 0.73 0.47 0.46
BRL1 205 176 186
TRY1 248 230 233
INR/DKK ARS/DKK RUB/DKK TRY/DKK BRL/DKK
2015
3 1 2 4 1
2016
Slide 17
5,05
4,10
3,50
4,72
11,82 11,82
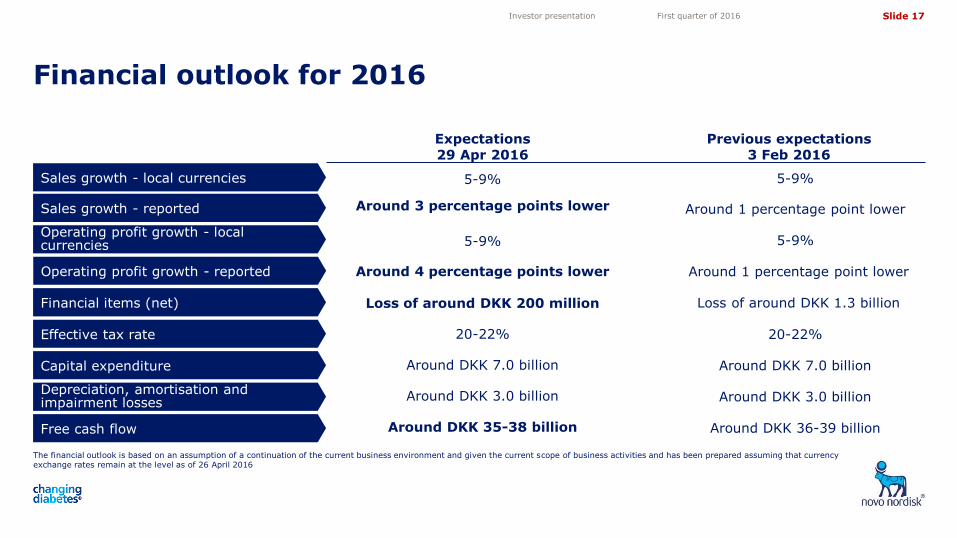
Financial outlook for 2016
The financial outlook is based on an assumption of a continuation of the current business environment and given the current scope of business activities and has been prepared assuming that currency exchange rates remain at the level as of 26 April 2016
Investor presentation First quarter of 2016
Sales growth - local currencies
Sales growth - reported
Operating profit growth - local currencies
Operating profit growth - reported
Financial items (net)
Effective tax rate
Capital expenditure
Free cash flow
Depreciation, amortisation and impairment losses
Expectations 29 Apr 2016
5-9%
Around 3 percentage points lower
5-9%
Loss of around DKK 200 million
20-22%
Around DKK 7.0 billion
Around DKK 3.0 billion
Around DKK 35-38 billion
Previous expectations 3 Feb 2016
5-9%
Around 1 percentage point lower
5-9%
Around 1 percentage point lower
Loss of around DKK 1.3 billion
20-22%
Around DKK 7.0 billion
Around DKK 3.0 billion
Around DKK 36-39 billion
Around 4 percentage points lower
Slide 18
5,05
4,10
3,50
4,72
11,82 11,82
Source: IMS MAT February 2016 volume and value (DKK) figures
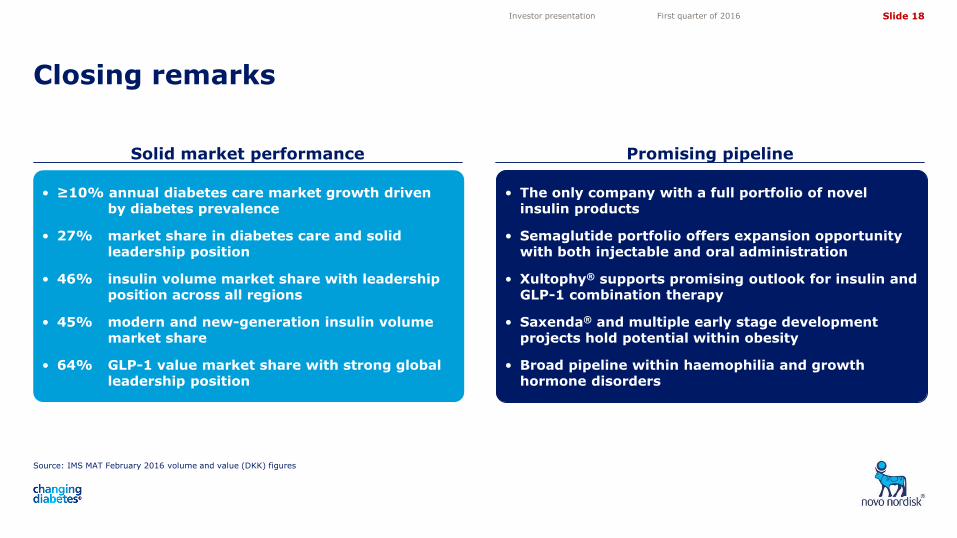
Solid market performance Promising pipeline
Closing remarks
Investor presentation First quarter of 2016
> > • The only company with a full portfolio of novel insulin products
• Semaglutide portfolio offers expansion opportunity with both injectable and oral administration
• Xultophy® supports promising outlook for insulin and GLP-1 combination therapy
• Saxenda® and multiple early stage development projects hold potential within obesity
• Broad pipeline within haemophilia and growth hormone disorders
• ≥10% annual diabetes care market growth driven by diabetes prevalence
• 27% market share in diabetes care and solid leadership position
• 46% insulin volume market share with leadership position across all regions
• 45% modern and new-generation insulin volume market share
• 64% GLP-1 value market share with strong global leadership position
Slide 19
5,05
4,10
3,50
4,72
11,82 11,82
Share information Investor Relations contacts
Investor contact information
Investor presentation First quarter of 2016
Novo Nordisk’s B shares are listed on the stock exchange in Copenhagen under the symbol ‘NOVO B’. Its ADRs are listed on the New York Stock Exchange under the symbol ‘NVO’. For further company information, visit Novo Nordisk on the internet at: novonordisk.com
Peter Hugreffe Ankersen +45 3075 9085 [email protected]
Daniel Bohsen +45 3079 6376 [email protected]
Melanie Raouzeos +45 3075 3479 [email protected]
In North America:
Kasper Veje +1 609 235 8567 [email protected]
Novo Nordisk A/S Investor Relations Novo Allé, DK-2880 Bagsværd
Upcoming events
18 May 2016 Thematic call on Sustainability
13 Jun 2016 Investor and analyst event in connection with ADA
05 Aug 2016 Financial statement for the first six months of 2016
28 Oct 2016 Financial statement for the first nine months of 2016
02 Feb 2017 Financial statement for 2016
Slide 20
5,05
4,10
3,50
4,72
11,82 11,82
Appendix
Investor presentation First quarter of 2016
1. Novo Nordisk at a glance
3. Biopharmaceuticals
4. Financials
2. Diabetes
5. Sustainability
Slide 21
5,05
4,10
3,50
4,72
11,82 11,82
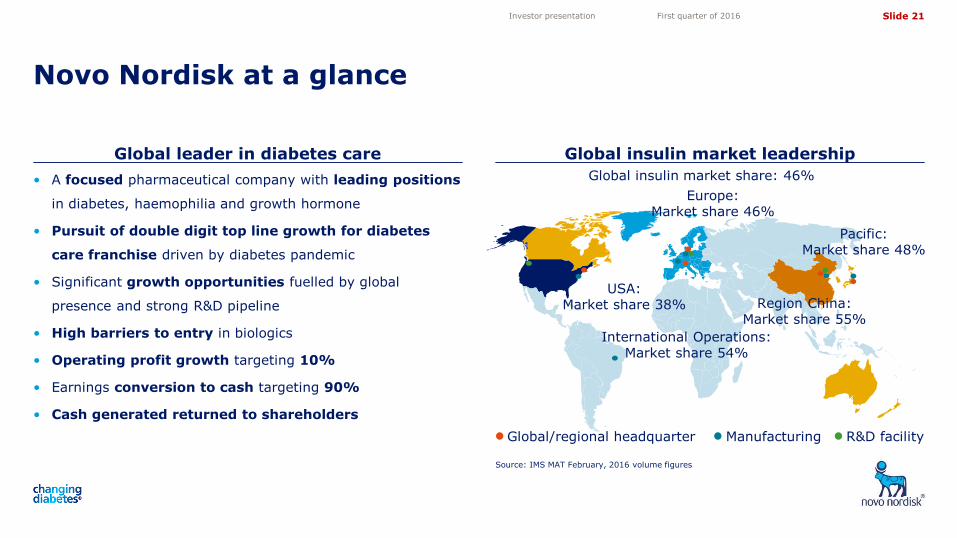
Global leader in diabetes care Global insulin market leadership
Novo Nordisk at a glance
Source: IMS MAT February, 2016 volume figures
Investor presentation First quarter of 2016
R&D facility Manufacturing Global/regional headquarter
USA: Market share 38%
International Operations: Market share 54%
Pacific: Market share 48%
Europe: Market share 46%
Region China: Market share 55%
Global insulin market share: 46% • A focused pharmaceutical company with leading positions
in diabetes, haemophilia and growth hormone
• Pursuit of double digit top line growth for diabetes
care franchise driven by diabetes pandemic
• Significant growth opportunities fuelled by global
presence and strong R&D pipeline
• High barriers to entry in biologics
• Operating profit growth targeting 10%
• Earnings conversion to cash targeting 90%
• Cash generated returned to shareholders
Slide 22
5,05
4,10
3,50
4,72
11,82 11,82
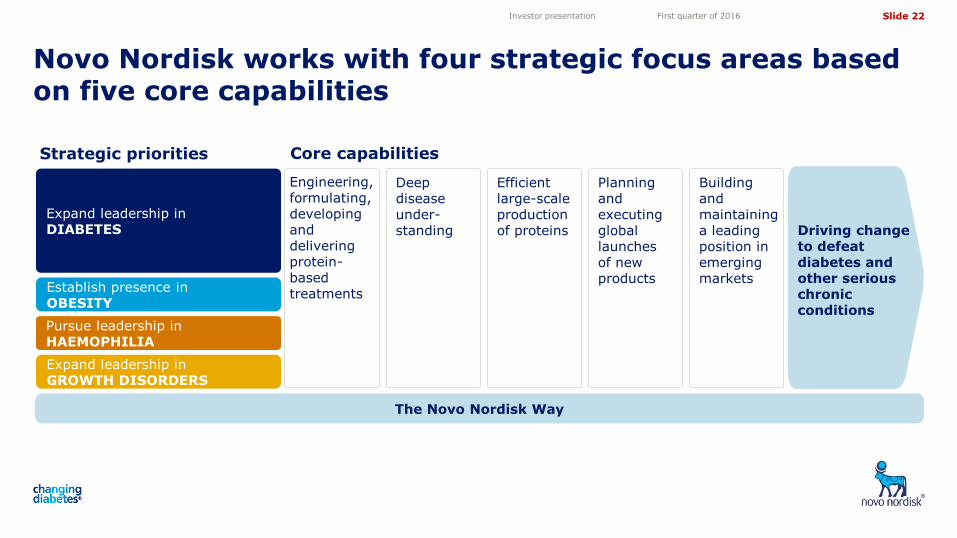
Novo Nordisk works with four strategic focus areas based on five core capabilities
Investor presentation First quarter of 2016
Core capabilities
Expand leadership in DIABETES
Pursue leadership in HAEMOPHILIA
Establish presence in OBESITY
Expand leadership in GROWTH DISORDERS
Strategic priorities
The Novo Nordisk Way
Engineering, formulating, developing and delivering protein-based treatments
Deep disease under- standing
Efficient large-scale production of proteins
Building and maintaining a leading position in emerging markets
Planning and executing global launches of new products
Driving change to defeat diabetes and other serious chronic conditions
Slide 23
5,05
4,10
3,50
4,72
11,82 11,82
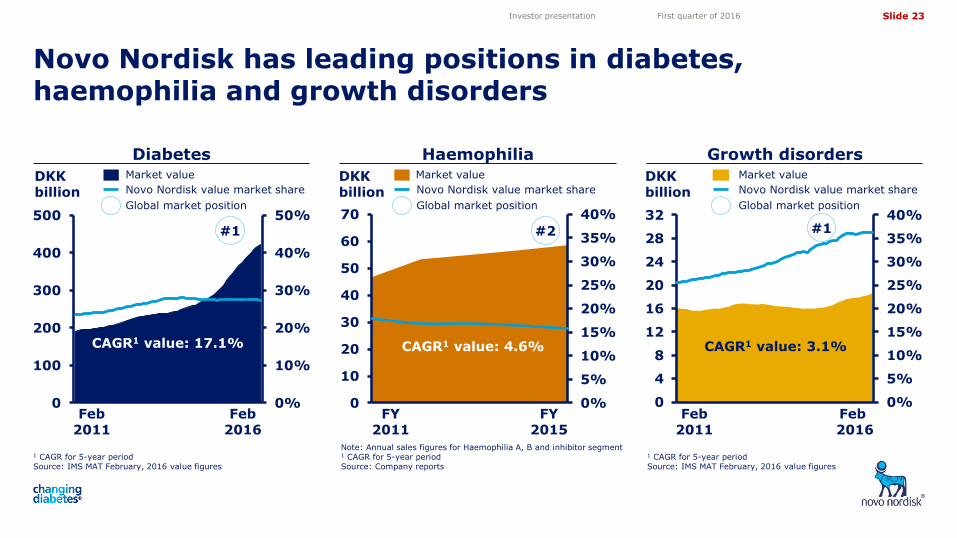
Novo Nordisk has leading positions in diabetes, haemophilia and growth disorders
Investor presentation First quarter of 2016
DKK billion
1 CAGR for 5-year period Source: IMS MAT February, 2016 value figures
Growth disorders Diabetes
DKK billion Novo Nordisk value market share
Global market position
Market value
1 CAGR for 5-year period Source: IMS MAT February, 2016 value figures
0%
10%
20%
30%
40%
50%
0
100
200
300
400
500#1
0%
5%
10%
15%
20%
25%
30%
35%
40%
0
4
8
12
16
20
24
28
32#1
CAGR1 value: 17.1% CAGR1 value: 3.1%
Feb 2011
Feb 2016
Feb 2011
Feb 2016
Market value
0%
5%
10%
15%
20%
25%
30%
35%
40%
0
10
20
30
40
50
60
70
DKK billion
Haemophilia Market value
Note: Annual sales figures for Haemophilia A, B and inhibitor segment 1 CAGR for 5-year period Source: Company reports
#2
CAGR1 value: 4.6%
FY 2011
FY 2015
Novo Nordisk value market share
Global market position
Novo Nordisk value market share
Global market position
Slide 24
5,05
4,10
3,50
4,72
11,82 11,82
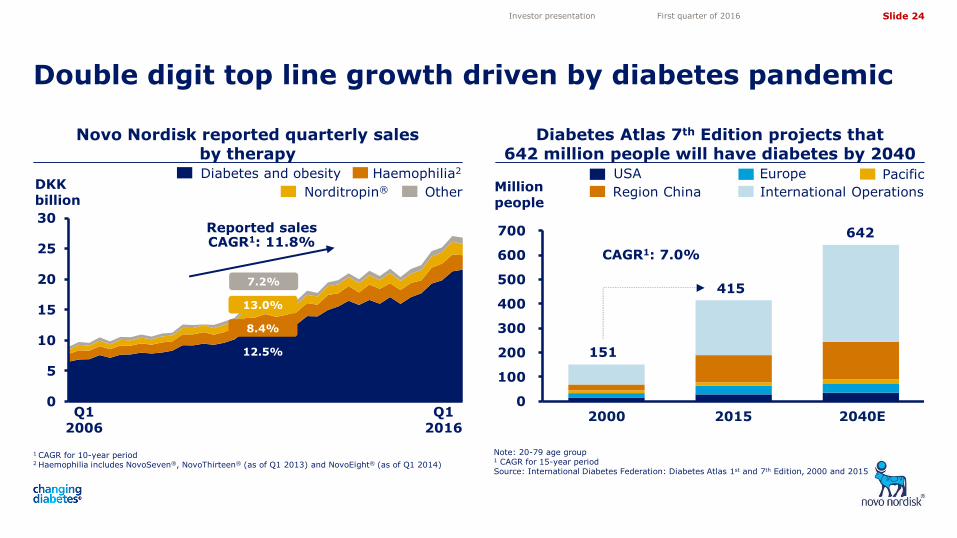
Diabetes Atlas 7th Edition projects that 642 million people will have diabetes by 2040
0
5
10
15
20
25
30
Novo Nordisk reported quarterly sales by therapy
Note: 20-79 age group 1 CAGR for 15-year period Source: International Diabetes Federation: Diabetes Atlas 1st and 7th Edition, 2000 and 2015
Double digit top line growth driven by diabetes pandemic
1 CAGR for 10-year period 2 Haemophilia includes NovoSeven®, NovoThirteen® (as of Q1 2013) and NovoEight® (as of Q1 2014)
Investor presentation First quarter of 2016
DKK billion
Diabetes and obesity Haemophilia2
Norditropin® Other
Reported sales CAGR1: 11.8%
13.0%
8.4%
12.5%
7.2%
Q1 2006
Q1 2016
Million people
2000 2015 2040E
151
415
CAGR1: 7.0%
642
Europe USA Pacific
International Operations Region China
0
100
200
300
400
500
600
700
Slide 25
5,05
4,10
3,50
4,72
11,82 11,82
0
50
100
150
200
250
300
350
400
0%
10%
20%
30%
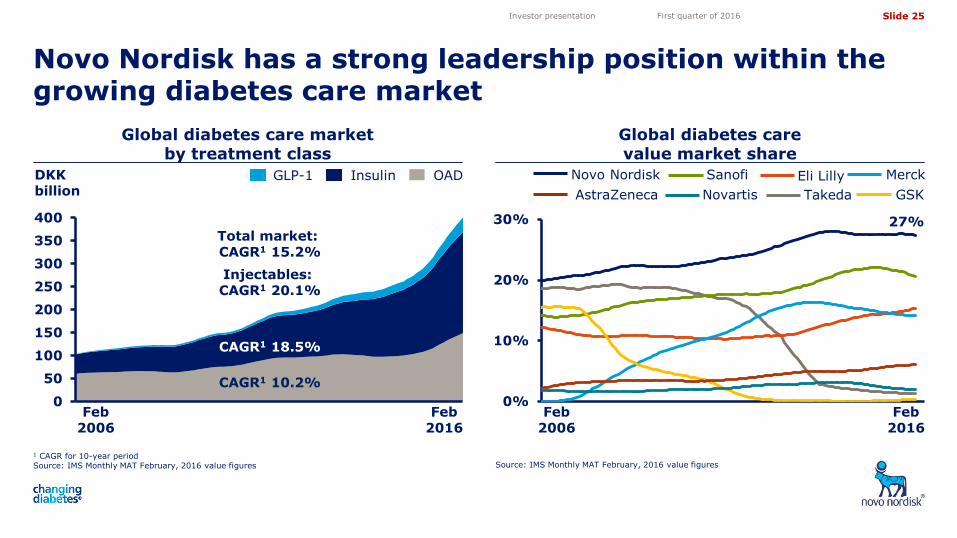
1 CAGR for 10-year period Source: IMS Monthly MAT February, 2016 value figures
Global diabetes care market by treatment class
Global diabetes care value market share
Novo Nordisk has a strong leadership position within the growing diabetes care market
Source: IMS Monthly MAT February, 2016 value figures
Investor presentation First quarter of 2016
Feb 2006
Feb 2016
27%
GSK
Merck Eli Lilly Sanofi
Takeda
Novo Nordisk
AstraZeneca Novartis
DKK billion
OAD Insulin GLP-1
Total market: CAGR1 15.2%
CAGR1 18.5%
Injectables: CAGR1 20.1%
CAGR1 10.2%
Feb 2006
Feb 2016
Slide 26
5,05
4,10
3,50
4,72
11,82 11,82
NovoEight®
NovoSeven®
NovoThirteen®
Norditropin®
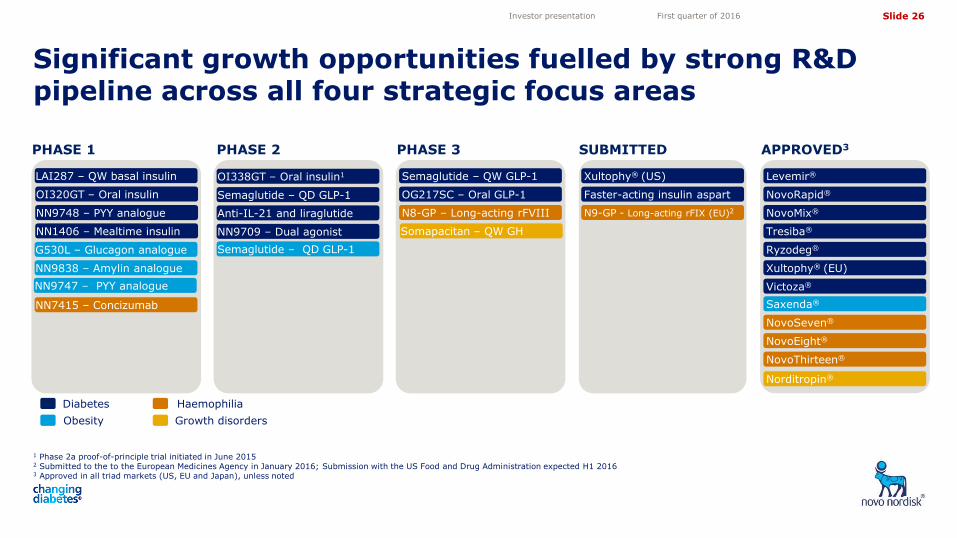
Significant growth opportunities fuelled by strong R&D pipeline across all four strategic focus areas
1 Phase 2a proof-of-principle trial initiated in June 2015 2 Submitted to the to the European Medicines Agency in January 2016; Submission with the US Food and Drug Administration expected H1 2016
3 Approved in all triad markets (US, EU and Japan), unless noted
Investor presentation First quarter of 2016
Saxenda®
Semaglutide – QW GLP-1
Faster-acting insulin aspart
OI338GT – Oral insulin1
OG217SC – Oral GLP-1
LAI287 – QW basal insulin
PHASE 1 PHASE 2 PHASE 3 APPROVED3
NovoRapid®
NovoMix®
Victoza®
Levemir®
Somapacitan – QW GH
NN7415 – Concizumab
N8-GP – Long-acting rFVIII N9-GP - Long-acting rFIX (EU)2
Tresiba®
Ryzodeg®
Diabetes
Obesity
Haemophilia
Growth disorders
Xultophy® (EU)
G530L – Glucagon analogue
NN9838 – Amylin analogue
OI320GT – Oral insulin
SUBMITTED
Semaglutide – QD GLP-1
Semaglutide – QD GLP-1
NN9747 – PYY analogue
Xultophy® (US)
Anti-IL-21 and liraglutide
NN9709 – Dual agonist
NN9748 – PYY analogue
NN1406 – Mealtime insulin
Slide 27
5,05
4,10
3,50
4,72
11,82 11,82
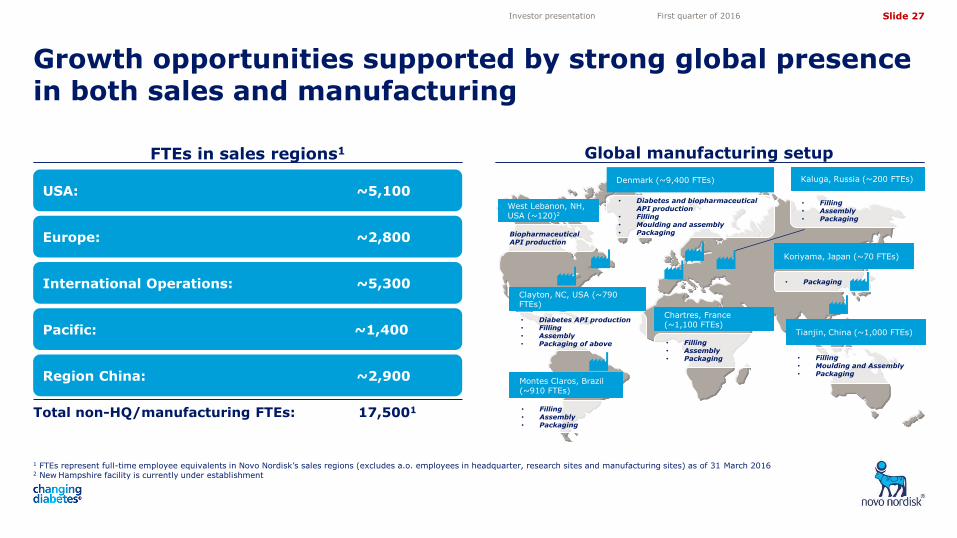
FTEs in sales regions1
Growth opportunities supported by strong global presence in both sales and manufacturing
1 FTEs represent full-time employee equivalents in Novo Nordisk’s sales regions (excludes a.o. employees in headquarter, research sites and manufacturing sites) as of 31 March 2016 2 New Hampshire facility is currently under establishment
Investor presentation First quarter of 2016
Region China: ~2,900
Pacific: ~1,400
International Operations: ~5,300
USA: ~5,100
Europe: ~2,800
Total non-HQ/manufacturing FTEs: 17,5001
West Lebanon, NH, USA (~120)2
Biopharmaceutical API production
• Diabetes API production • Filling • Assembly • Packaging of above
Clayton, NC, USA (~790 FTEs)
Montes Claros, Brazil (~910 FTEs)
• Filling • Assembly • Packaging
Denmark (~9,400 FTEs)
• Filling • Assembly • Packaging
Chartres, France (~1,100 FTEs)
• Filling • Assembly • Packaging
Kaluga, Russia (~200 FTEs)
• Packaging
• Filling • Moulding and Assembly • Packaging
Tianjin, China (~1,000 FTEs)
Koriyama, Japan (~70 FTEs)
• Diabetes and biopharmaceutical API production
• Filling • Moulding and assembly • Packaging
Global manufacturing setup
Slide 28
5,05
4,10
3,50
4,72
11,82 11,82
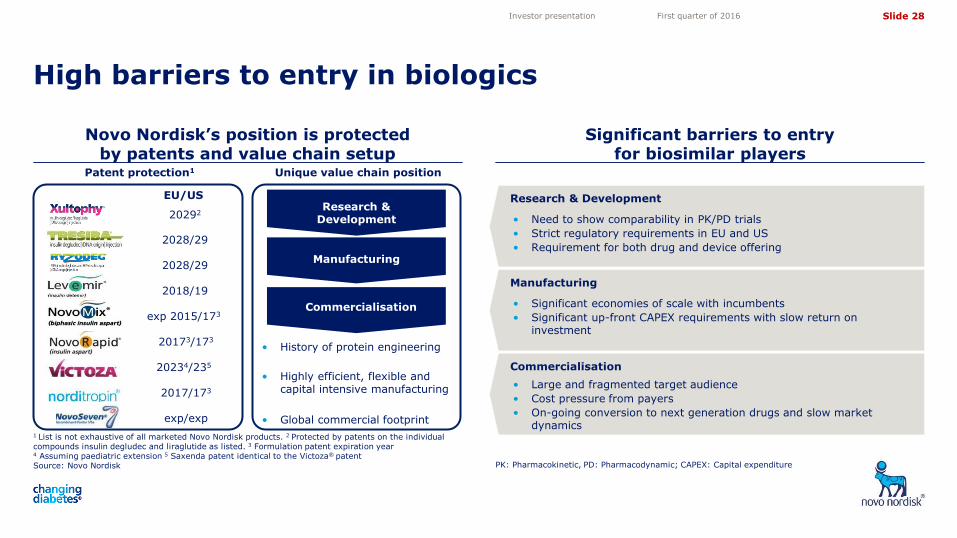
Novo Nordisk’s position is protected by patents and value chain setup
Significant barriers to entry for biosimilar players
High barriers to entry in biologics
1 List is not exhaustive of all marketed Novo Nordisk products. 2 Protected by patents on the individual compounds insulin degludec and liraglutide as listed. 3 Formulation patent expiration year 4 Assuming paediatric extension 5 Saxenda patent identical to the Victoza® patent Source: Novo Nordisk PK: Pharmacokinetic, PD: Pharmacodynamic; CAPEX: Capital expenditure
Investor presentation First quarter of 2016
Research & Development
Manufacturing
Commercialisation
Unique value chain position Patent protection1
2018/192
exp 2015/1732
20173/173
20234/2352
2017/173
exp/exp
EU/US0
• History of protein engineering
• Highly efficient, flexible and capital intensive manufacturing
• Global commercial footprint
• Need to show comparability in PK/PD trials
• Strict regulatory requirements in EU and US
• Requirement for both drug and device offering
Research & Development
• Significant economies of scale with incumbents
• Significant up-front CAPEX requirements with slow return on investment
Manufacturing
Commercialisation
• Large and fragmented target audience
• Cost pressure from payers
• On-going conversion to next generation drugs and slow market dynamics
2028/292
2028/292
202922
Slide 29
5,05
4,10
3,50
4,72
11,82 11,82
Diabetes and obesity
Investor presentation First quarter of 2016
Slide 30
5,05
4,10
3,50
4,72
11,82 11,82
Facts about diabetes Insulin secretion profile
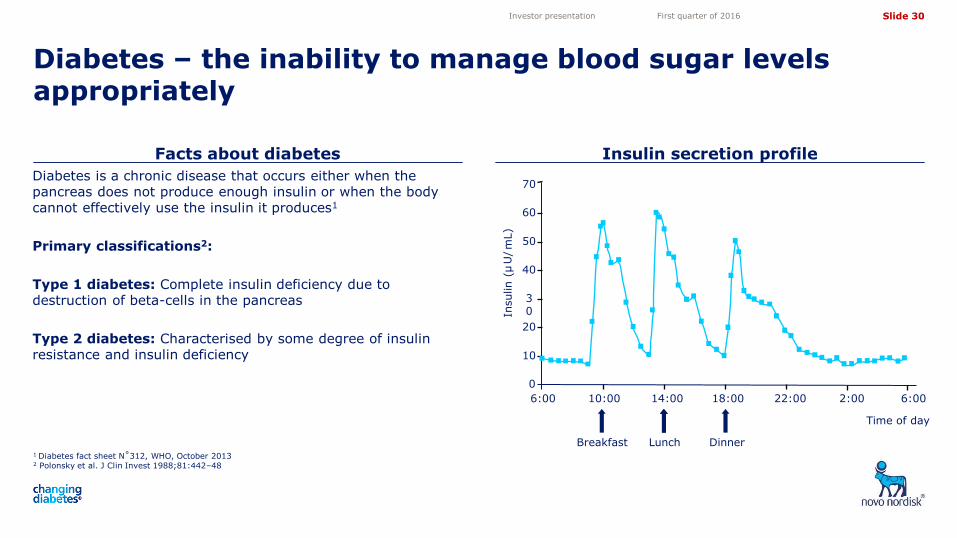
Diabetes – the inability to manage blood sugar levels appropriately
1 Diabetes fact sheet N˚312, WHO, October 2013 2 Polonsky et al. J Clin Invest 1988;81:442–48
Investor presentation First quarter of 2016
Diabetes is a chronic disease that occurs either when the pancreas does not produce enough insulin or when the body cannot effectively use the insulin it produces1
Primary classifications2:
Type 1 diabetes: Complete insulin deficiency due to destruction of beta-cells in the pancreas
Type 2 diabetes: Characterised by some degree of insulin resistance and insulin deficiency
6:00
0
10
20
30
40
50
60
70
10:00 14:00 18:00
Insulin (
µ U
/ m
L )
22:00 2:00 6:00
Time of day
Breakfast Lunch Dinner
Slide 31
5,05
4,10
3,50
4,72
11,82 11,82
Insulin enables glucose to become energy The aim of insulin therapy is to recreate normal
blood insulin profile
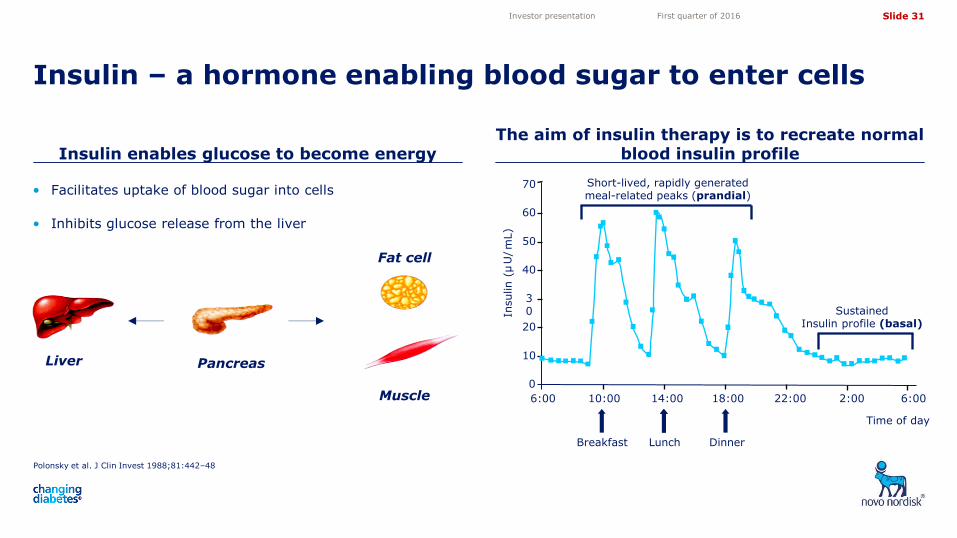
Insulin – a hormone enabling blood sugar to enter cells
Polonsky et al. J Clin Invest 1988;81:442–48
Investor presentation First quarter of 2016
Liver Pancreas
Muscle
Fat cell
• Facilitates uptake of blood sugar into cells
• Inhibits glucose release from the liver
6:00
0
10
20
30
40
50
60
70
10:00 14:00 18:00
Insulin (
µ U
/ m
L )
22:00 2:00 6:00
Short-lived, rapidly generated meal-related peaks (prandial)
Sustained Insulin profile (basal)
Time of day
Breakfast Lunch Dinner
Slide 32
5,05
4,10
3,50
4,72
11,82 11,82
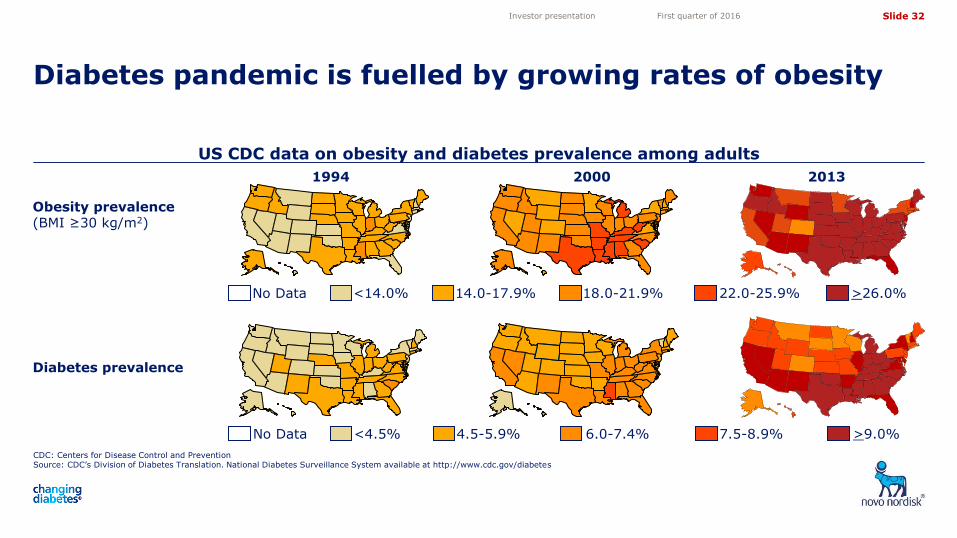
US CDC data on obesity and diabetes prevalence among adults
CDC: Centers for Disease Control and Prevention Source: CDC’s Division of Diabetes Translation. National Diabetes Surveillance System available at http://www.cdc.gov/diabetes
Diabetes pandemic is fuelled by growing rates of obesity
Investor presentation First quarter of 2016
Obesity prevalence (BMI ≥30 kg/m2)
Diabetes prevalence
No Data <14.0% 14.0-17.9% 18.0-21.9% 22.0-25.9% >26.0%
No Data <4.5% 4.5-5.9% 6.0-7.4% 7.5-8.9% >9.0%
1994 2000 2013
Slide 33
5,05
4,10
3,50
4,72
11,82 11,82
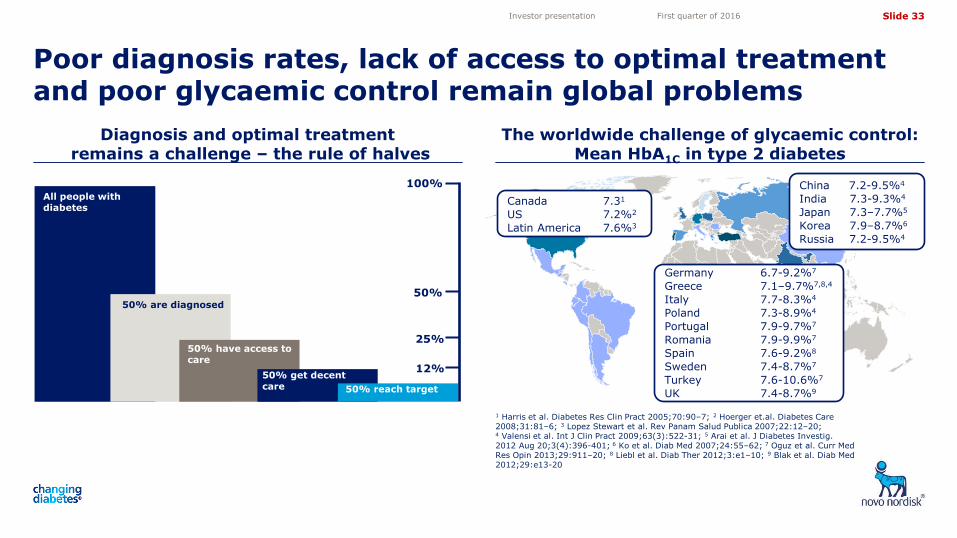
Diagnosis and optimal treatment remains a challenge – the rule of halves
The worldwide challenge of glycaemic control: Mean HbA1C in type 2 diabetes
Poor diagnosis rates, lack of access to optimal treatment and poor glycaemic control remain global problems
1 Harris et al. Diabetes Res Clin Pract 2005;70:90–7; 2 Hoerger et.al. Diabetes Care 2008;31:81–6; 3 Lopez Stewart et al. Rev Panam Salud Publica 2007;22:12–20; 4 Valensi et al. Int J Clin Pract 2009;63(3):522-31; 5 Arai et al. J Diabetes Investig. 2012 Aug 20;3(4):396-401; 6 Ko et al. Diab Med 2007;24:55–62; 7 Oguz et al. Curr Med Res Opin 2013;29:911–20; 8 Liebl et al. Diab Ther 2012;3:e1–10; 9 Blak et al. Diab Med 2012;29:e13-20
Investor presentation First quarter of 2016
50% reach target 50% reach target
All people with diabetes
50% are diagnosed
50% have access to care
50% get decent care
100%
50%
25%
12%
Canada 7.31
US 7.2%2
Latin America 7.6%3
China 7.2-9.5%4
India 7.3-9.3%4
Japan 7.3–7.7%5
Korea 7.9–8.7%6
Russia 7.2-9.5%4
Germany 6.7-9.2%7
Greece 7.1–9.7%7,8,4
Italy 7.7-8.3%4
Poland 7.3-8.9%4
Portugal 7.9-9.7%7
Romania 7.9-9.9%7
Spain 7.6-9.2%8
Sweden 7.4-8.7%7
Turkey 7.6-10.6%7
UK 7.4-8.7%9
Slide 34
5,05
4,10
3,50
4,72
11,82 11,82
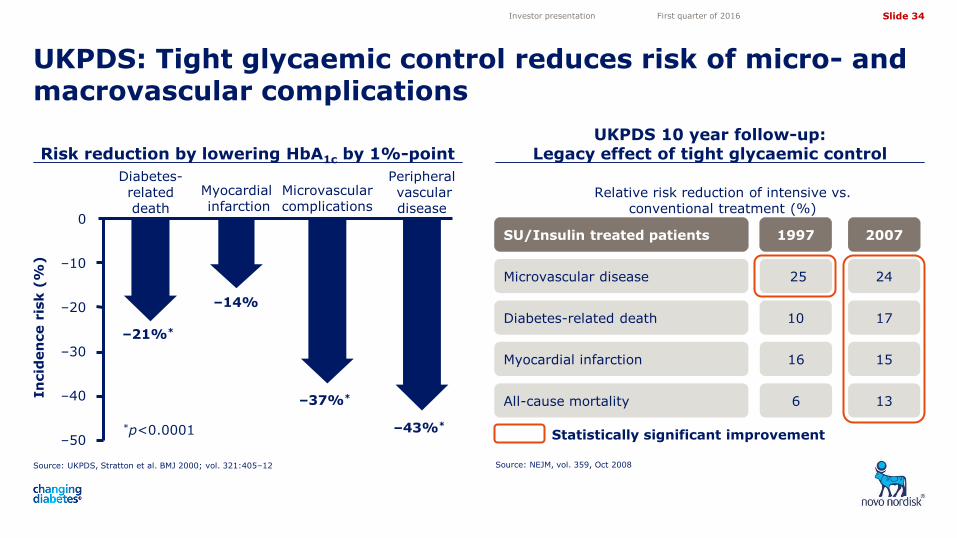
Risk reduction by lowering HbA1c by 1%-point UKPDS 10 year follow-up:
Legacy effect of tight glycaemic control
UKPDS: Tight glycaemic control reduces risk of micro- and macrovascular complications
Source: UKPDS, Stratton et al. BMJ 2000; vol. 321:405–12 Source: NEJM, vol. 359, Oct 2008
Investor presentation First quarter of 2016
In
cid
en
ce r
isk (
%)
–21%*
–14%
–37%*
–43%* *p<0.0001 –50
–40
–30
–20
–10
0
Diabetes-related death
Myocardial infarction
Microvascular complications
Peripheral vascular disease
Relative risk reduction of intensive vs. conventional treatment (%)
25 24 Microvascular disease
16 15 Myocardial infarction
6 13 All-cause mortality
SU/Insulin 1997 2007
10 17 Diabetes-related death
SU/Insulin treated patients
Statistically significant improvement
Slide 35
5,05
4,10
3,50
4,72
11,82 11,82
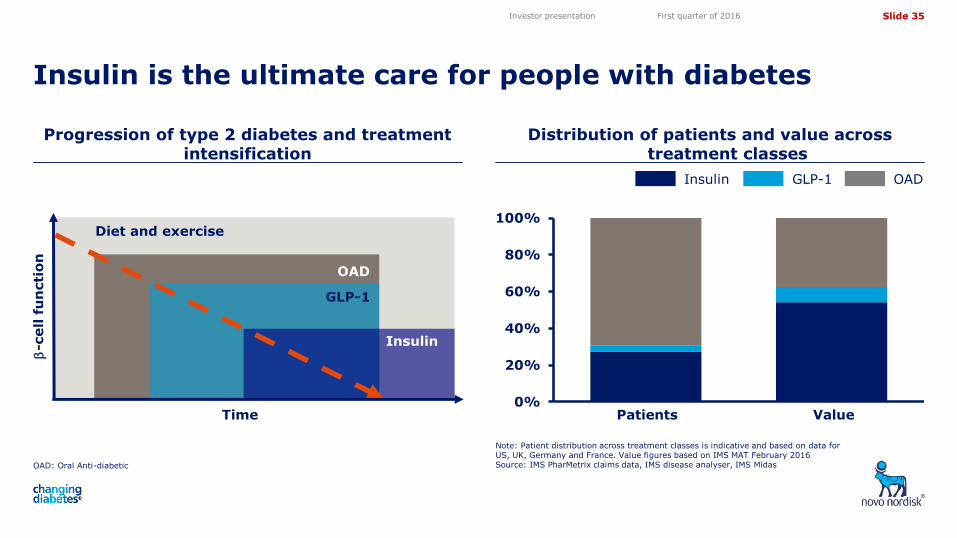
Progression of type 2 diabetes and treatment intensification
Distribution of patients and value across treatment classes
Insulin is the ultimate care for people with diabetes
OAD: Oral Anti-diabetic
Note: Patient distribution across treatment classes is indicative and based on data for US, UK, Germany and France. Value figures based on IMS MAT February 2016 Source: IMS PharMetrix claims data, IMS disease analyser, IMS Midas
Investor presentation First quarter of 2016
-c
ell f
un
cti
on
Time
Diet and exercise
OAD
GLP-1
Insulin
OAD GLP-1 Insulin
Patients Value 0%
20%
40%
60%
80%
100%
Slide 36
5,05
4,10
3,50
4,72
11,82 11,82
0
50
100
150
200
250
300
350
400
450
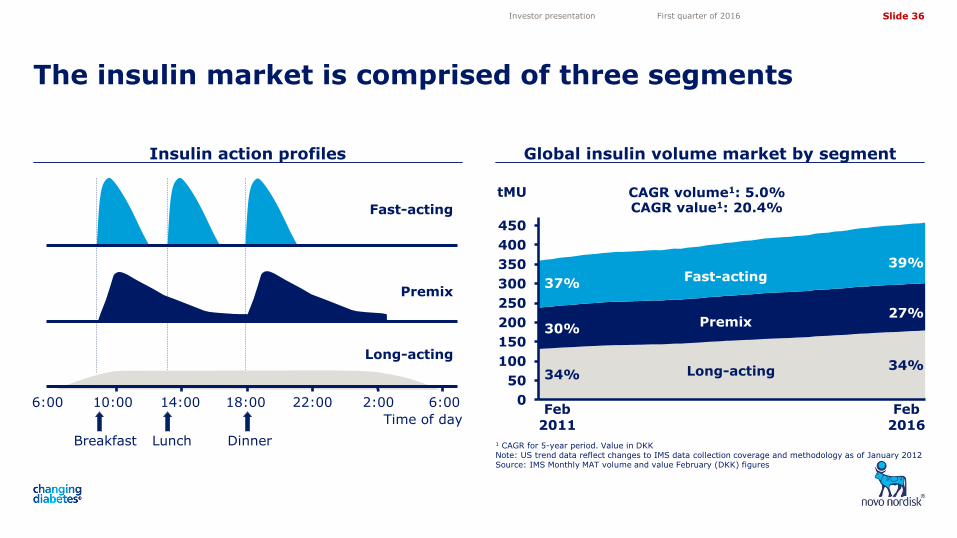
Insulin action profiles Global insulin volume market by segment
The insulin market is comprised of three segments
1 CAGR for 5-year period. Value in DKK Note: US trend data reflect changes to IMS data collection coverage and methodology as of January 2012 Source: IMS Monthly MAT volume and value February (DKK) figures
Investor presentation First quarter of 2016
Time of day
6:00 10:00 14:00 18:00 22:00 2:00 6:00
Breakfast Lunch Dinner
Long-acting
Premix
Fast-acting
CAGR volume1: 5.0% CAGR value1: 20.4%
34%
30%
37%
39%
27%
34%
Feb 2011
Fast-acting
Premix
Long-acting
tMU
Feb 2016
Slide 37
5,05
4,10
3,50
4,72
11,82 11,82
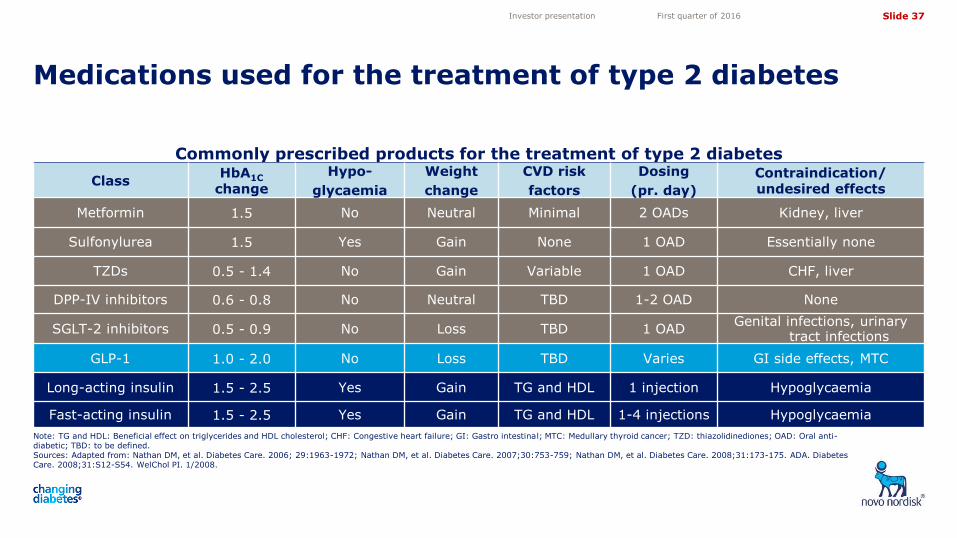
Commonly prescribed products for the treatment of type 2 diabetes
Class HbA1C
change
Hypo-
glycaemia
Weight
change
CVD risk
factors
Dosing
(pr. day)
Contraindication/ undesired effects
Metformin 1.5 No Neutral Minimal 2 OADs Kidney, liver
Sulfonylurea 1.5 Yes Gain None 1 OAD Essentially none
TZDs 0.5 - 1.4 No Gain Variable 1 OAD CHF, liver
DPP-IV inhibitors 0.6 - 0.8 No Neutral TBD 1-2 OAD None
SGLT-2 inhibitors 0.5 - 0.9 No Loss TBD 1 OAD Genital infections, urinary
tract infections
GLP-1 1.0 - 2.0 No Loss TBD Varies GI side effects, MTC
Long-acting insulin 1.5 - 2.5 Yes Gain TG and HDL 1 injection Hypoglycaemia
Fast-acting insulin 1.5 - 2.5 Yes Gain TG and HDL 1-4 injections Hypoglycaemia
Note: TG and HDL: Beneficial effect on triglycerides and HDL cholesterol; CHF: Congestive heart failure; GI: Gastro intestinal; MTC: Medullary thyroid cancer; TZD: thiazolidinediones; OAD: Oral anti-diabetic; TBD: to be defined. Sources: Adapted from: Nathan DM, et al. Diabetes Care. 2006; 29:1963-1972; Nathan DM, et al. Diabetes Care. 2007;30:753-759; Nathan DM, et al. Diabetes Care. 2008;31:173-175. ADA. Diabetes Care. 2008;31:S12-S54. WelChol PI. 1/2008.
Medications used for the treatment of type 2 diabetes
Investor presentation First quarter of 2016
Slide 38
5,05
4,10
3,50
4,72
11,82 11,82
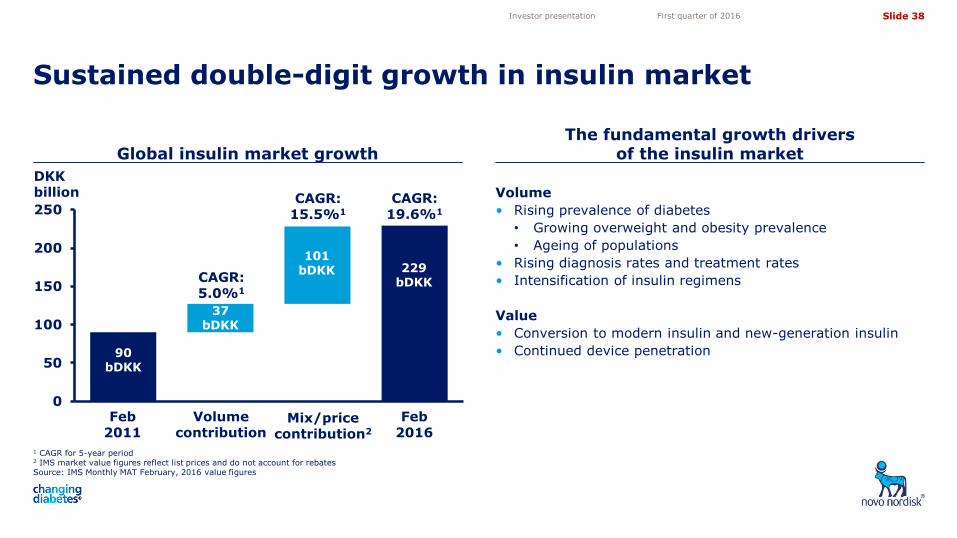
1 CAGR for 5-year period 2 IMS market value figures reflect list prices and do not account for rebates Source: IMS Monthly MAT February, 2016 value figures
Global insulin market growth The fundamental growth drivers
of the insulin market
Sustained double-digit growth in insulin market
Investor presentation First quarter of 2016
Volume
• Rising prevalence of diabetes
• Growing overweight and obesity prevalence
• Ageing of populations
• Rising diagnosis rates and treatment rates
• Intensification of insulin regimens
Value
• Conversion to modern insulin and new-generation insulin
• Continued device penetration
DKK billion
0
50
100
150
200
250
90 bDKK
229 bDKK
37 bDKK
101 bDKK
Feb 2011
Feb 2016
Volume contribution
Mix/price contribution2
CAGR: 5.0%1
CAGR: 15.5%1
CAGR: 19.6%1
Slide 39
5,05
4,10
3,50
4,72
11,82 11,82
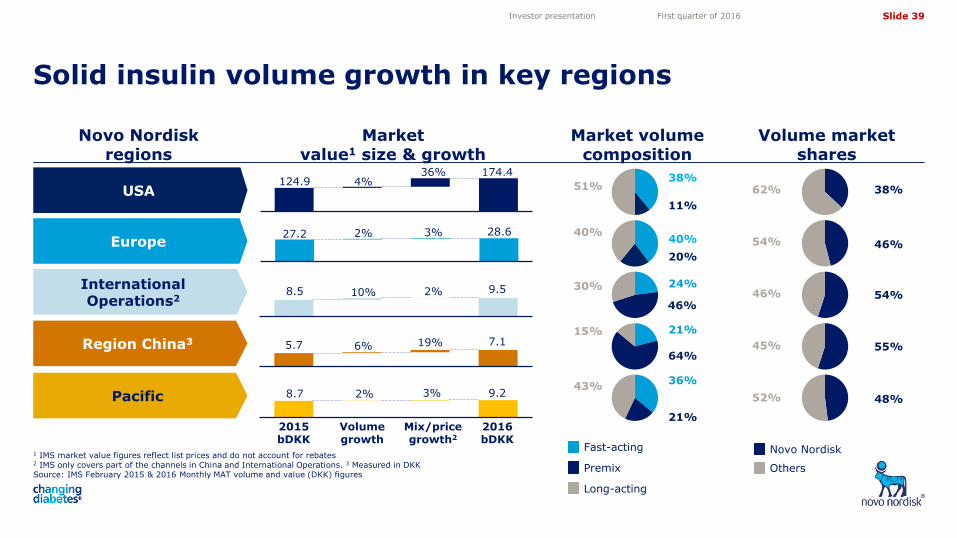
1 IMS market value figures reflect list prices and do not account for rebates 2 IMS only covers part of the channels in China and International Operations. 3 Measured in DKK Source: IMS February 2015 & 2016 Monthly MAT volume and value (DKK) figures
Solid insulin volume growth in key regions
Investor presentation First quarter of 2016
Novo Nordisk regions
Market value1 size & growth
Market volume composition
Volume market shares
USA
Europe
International Operations2
Region China3
Pacific
2015 bDKK
Volume growth
Mix/price growth2
2016 bDKK
124.9 4% 36% 174.4
27.2 2% 3% 28.6
8.5 10% 2% 9.5
8.7 2% 3% 9.2
5.7 6% 19% 7.1
Novo Nordisk
Others Premix
Fast-acting
Long-acting
45% 55%
52% 48%
46% 54%
54% 46%
62% 38%
64%
15% 21%
43%
21%
36%
30%
46%
24%
40%
20%
40%
51%
11%
38%
Slide 40
5,05
4,10
3,50
4,72
11,82 11,82
0%
5%
10%
15%
20%
25%
30%
Regional insulin volume growth
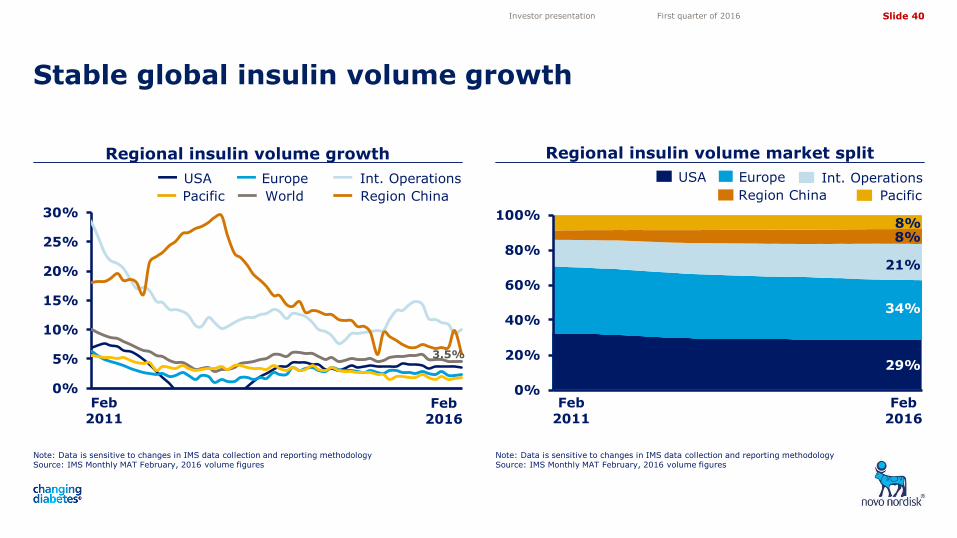
Note: Data is sensitive to changes in IMS data collection and reporting methodology Source: IMS Monthly MAT February, 2016 volume figures
Stable global insulin volume growth
Investor presentation First quarter of 2016
0%
20%
40%
60%
80%
100%
World
Feb 2011
Feb 2016
Feb 2011
Feb 2016
8% 8%
21%
34%
29%
USA Int. Operations
Region China Pacific
Europe USA Int. Operations
Region China Pacific
Europe
Note: Data is sensitive to changes in IMS data collection and reporting methodology Source: IMS Monthly MAT February, 2016 volume figures
Regional insulin volume market split
3.5%
Slide 41
5,05
4,10
3,50
4,72
11,82 11,82
0%
20%
40%
60%
80%
100%
0
100
200
300
400
500
Th
ou
san
ds
0%
20%
40%
60%
80%
100%
0
100
200
300
400
500
Thousands
0%
20%
40%
60%
80%
100%
0
100
200
300
400
500
Thousands
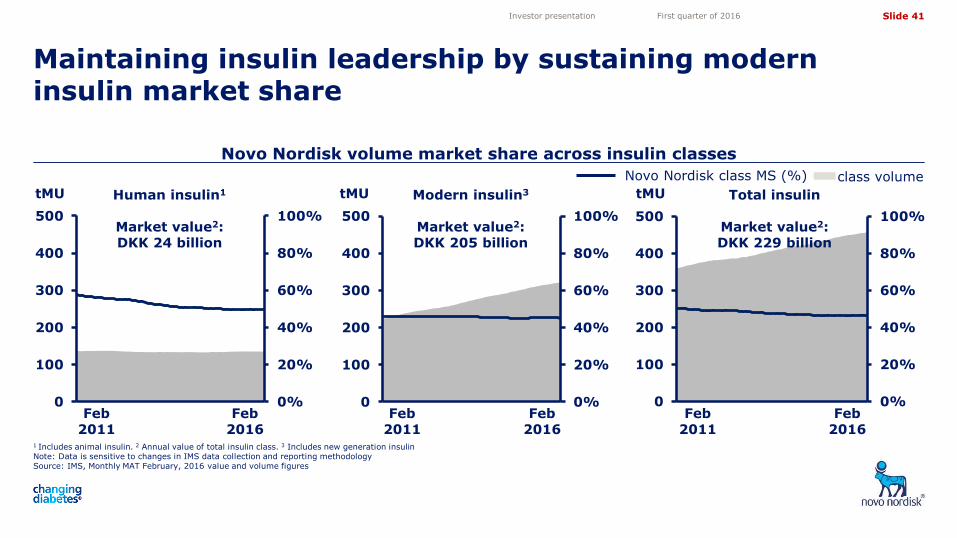
Novo Nordisk volume market share across insulin classes
1 Includes animal insulin. 2 Annual value of total insulin class. 3 Includes new generation insulin Note: Data is sensitive to changes in IMS data collection and reporting methodology Source: IMS, Monthly MAT February, 2016 value and volume figures
Maintaining insulin leadership by sustaining modern insulin market share
Investor presentation First quarter of 2016
Feb 2011
Feb 2016
Feb 2011
Feb 2016
Feb 2011
Feb 2016
Novo Nordisk class MS (%) class volume
Human insulin1
Market value2: DKK 24 billion
Modern insulin3
Market value2: DKK 205 billion
Total insulin
Market value2: DKK 229 billion
tMU tMU tMU
Slide 42
5,05
4,10
3,50
4,72
11,82 11,82
0%
10%
20%
30%
40%
50%
60%
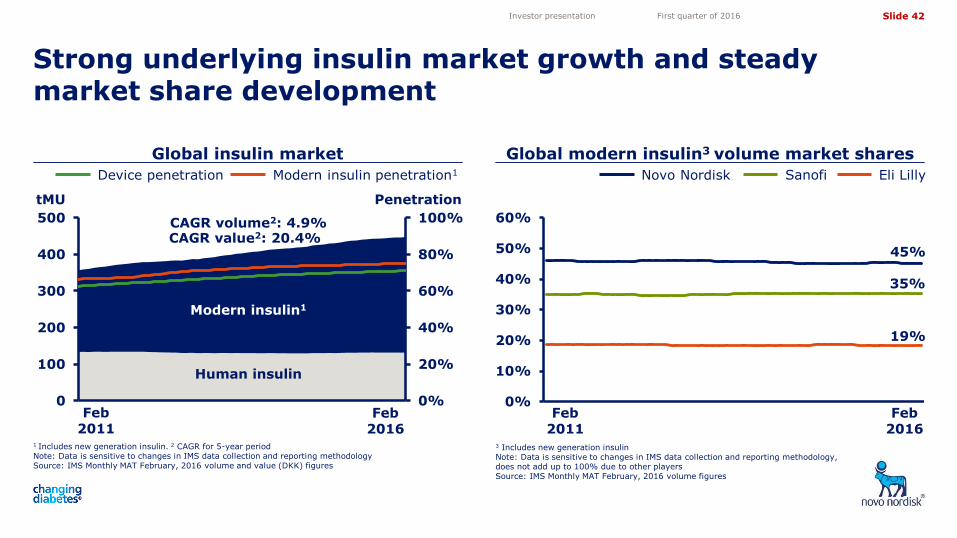
Global insulin market Global modern insulin3 volume market shares
Strong underlying insulin market growth and steady market share development
1 Includes new generation insulin. 2 CAGR for 5-year period Note: Data is sensitive to changes in IMS data collection and reporting methodology Source: IMS Monthly MAT February, 2016 volume and value (DKK) figures
3 Includes new generation insulin Note: Data is sensitive to changes in IMS data collection and reporting methodology, does not add up to 100% due to other players Source: IMS Monthly MAT February, 2016 volume figures
Investor presentation First quarter of 2016
Feb 2016
Feb 2011
Feb 2016
Eli Lilly Novo Nordisk Sanofi
0%
20%
40%
60%
80%
100%
0
100
200
300
400
500
Modern insulin1
Human insulin
tMU Penetration
Device penetration Modern insulin penetration1
CAGR volume2: 4.9% CAGR value2: 20.4%
45%
35%
19%
Feb 2011
Slide 43
5,05
4,10
3,50
4,72
11,82 11,82
0%
20%
40%
60%
80%
100%
0
40
80
120
160
200
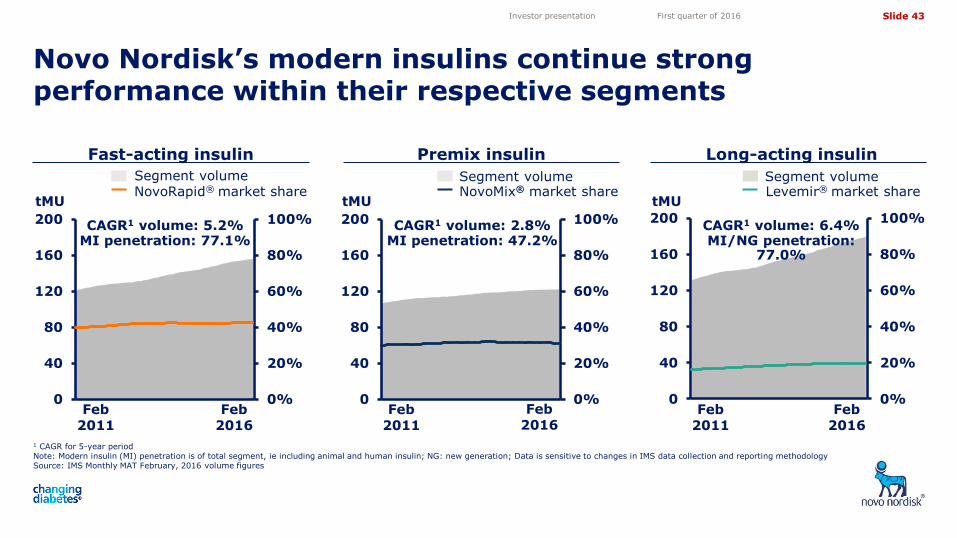
Novo Nordisk’s modern insulins continue strong performance within their respective segments
1 CAGR for 5-year period Note: Modern insulin (MI) penetration is of total segment, ie including animal and human insulin; NG: new generation; Data is sensitive to changes in IMS data collection and reporting methodology Source: IMS Monthly MAT February, 2016 volume figures
Investor presentation First quarter of 2016
Fast-acting insulin Long-acting insulin
tMU Levemir® market share Segment volume
NovoRapid® market share Segment volume
NovoMix® market share Segment volume
tMU tMU
0%
20%
40%
60%
80%
100%
0
40
80
120
160
200
0%
20%
40%
60%
80%
100%
0
40
80
120
160
200
Feb 2011
Feb 2016
Feb 2011
Feb 2016
Feb 2011
Feb 2016
Premix insulin
CAGR1 volume: 6.4% MI/NG penetration:
77.0%
CAGR1 volume: 5.2% MI penetration: 77.1%
CAGR1 volume: 2.8% MI penetration: 47.2%
Slide 44
5,05
4,10
3,50
4,72
11,82 11,82
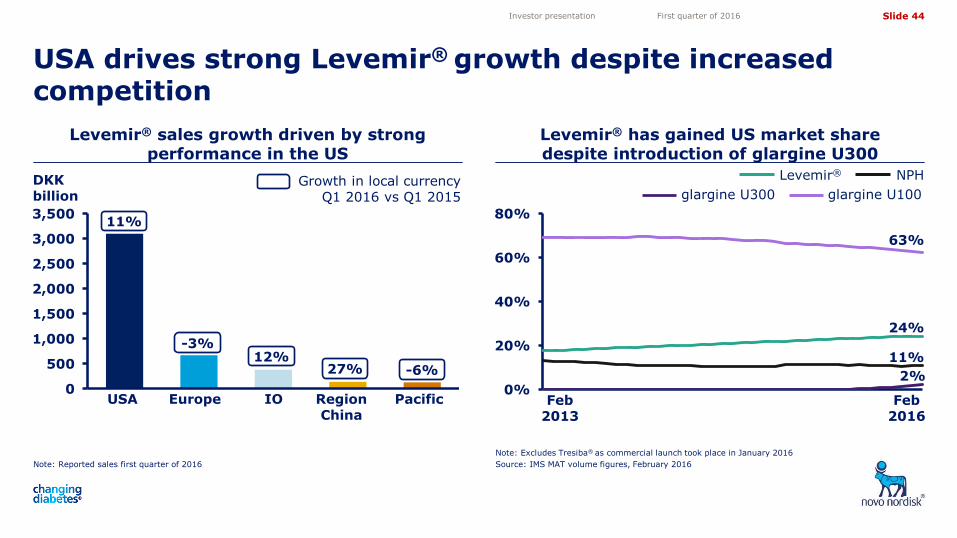
Levemir® has gained US market share despite introduction of glargine U300
Note: Reported sales first quarter of 2016
Levemir® sales growth driven by strong performance in the US
Note: Excludes Tresiba® as commercial launch took place in January 2016
Source: IMS MAT volume figures, February 2016
USA drives strong Levemir® growth despite increased competition
Investor presentation First quarter of 2016
68%
USA Europe IO Region China
Pacific
DKK billion
11%
Growth in local currency Q1 2016 vs Q1 2015
-3% 12%
27% -6%
0%
20%
40%
60%
80%
glargine U100
Levemir® NPH
Feb 2013
Feb 2016
glargine U300
63%
0
500
1,000
1,500
2,000
2,500
3,000
3,500
24%
11%
2%
Slide 45
5,05
4,10
3,50
4,72
11,82 11,82
0%
20%
40%
60%
80%
100%
0
20
40
60
80
100
120
140
0%
10%
20%
30%
40%
50%
60%
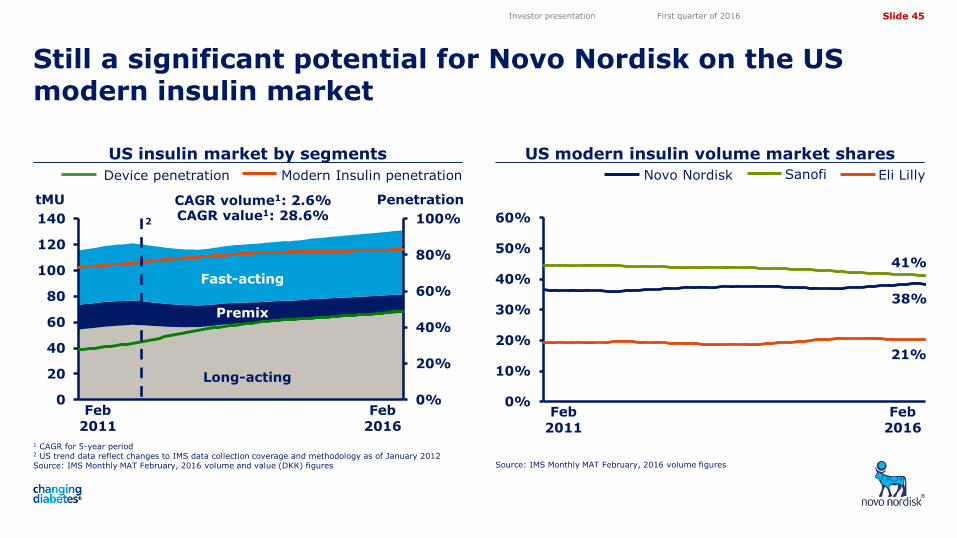
US insulin market by segments US modern insulin volume market shares
Still a significant potential for Novo Nordisk on the US modern insulin market
1 CAGR for 5-year period 2 US trend data reflect changes to IMS data collection coverage and methodology as of January 2012 Source: IMS Monthly MAT February, 2016 volume and value (DKK) figures Source: IMS Monthly MAT February, 2016 volume figures
Investor presentation First quarter of 2016
Modern Insulin penetration Device penetration
Feb 2011
Feb 2016
Feb 2011
Feb 2016
Eli Lilly Novo Nordisk Sanofi
tMU Penetration CAGR volume1: 2.6% CAGR value1: 28.6%
38%
41%
21%
2
Fast-acting
Long-acting
Premix
Slide 46
5,05
4,10
3,50
4,72
11,82 11,82
0%
20%
40%
60%
80%
100%
0
10
20
30
40
50
60
70
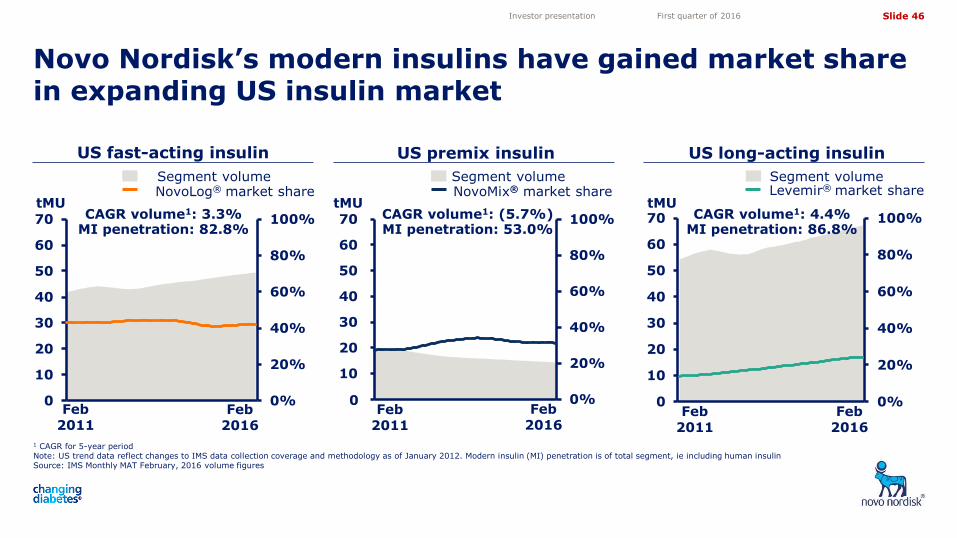
Novo Nordisk’s modern insulins have gained market share in expanding US insulin market
1 CAGR for 5-year period Note: US trend data reflect changes to IMS data collection coverage and methodology as of January 2012. Modern insulin (MI) penetration is of total segment, ie including human insulin Source: IMS Monthly MAT February, 2016 volume figures
Investor presentation First quarter of 2016
US long-acting insulin
tMU Levemir® market share Segment volume
0%
20%
40%
60%
80%
100%
0
10
20
30
40
50
60
70 CAGR volume1: 4.4% MI penetration: 86.8%
Feb 2011
Feb 2016
0%
20%
40%
60%
80%
100%
-
10
20
30
40
50
60
70
0
US fast-acting insulin
NovoLog® market share Segment volume
NovoMix® market share Segment volume
tMU tMU
US premix insulin
CAGR volume1: 3.3% MI penetration: 82.8%
CAGR volume1: (5.7%) MI penetration: 53.0%
Feb 2011
Feb 2016
Feb 2016
Feb 2011
Slide 47
5,05
4,10
3,50
4,72
11,82 11,82
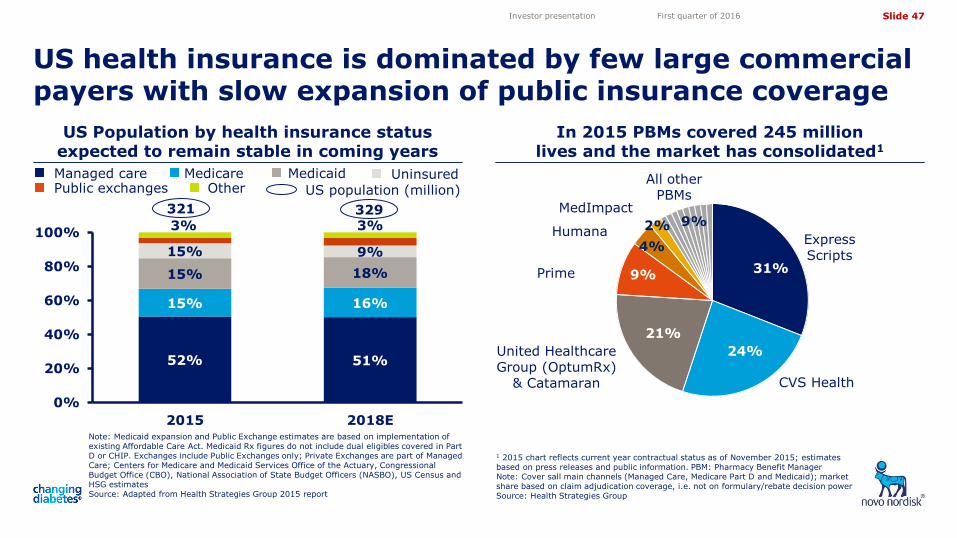
52% 51%
15% 16%
15% 18%
15% 9%
3% 3%
0%
20%
40%
60%
80%
100%
2015 2018E
US Population by health insurance status expected to remain stable in coming years
In 2015 PBMs covered 245 million lives and the market has consolidated1
US health insurance is dominated by few large commercial payers with slow expansion of public insurance coverage
Note: Medicaid expansion and Public Exchange estimates are based on implementation of existing Affordable Care Act. Medicaid Rx figures do not include dual eligibles covered in Part D or CHIP. Exchanges include Public Exchanges only; Private Exchanges are part of Managed Care; Centers for Medicare and Medicaid Services Office of the Actuary, Congressional Budget Office (CBO), National Association of State Budget Officers (NASBO), US Census and HSG estimates Source: Adapted from Health Strategies Group 2015 report
Investor presentation First quarter of 2016
1 2015 chart reflects current year contractual status as of November 2015; estimates based on press releases and public information. PBM: Pharmacy Benefit Manager Note: Cover sall main channels (Managed Care, Medicare Part D and Medicaid); market share based on claim adjudication coverage, i.e. not on formulary/rebate decision power Source: Health Strategies Group
31%
24%
9%
4%
9% 2%
21%
Express Scripts
CVS Health
United Healthcare Group (OptumRx)
& Catamaran
Prime
Humana
MedImpact
All other PBMs
321 329
US population (million)
Managed care Medicare Medicaid Uninsured Public exchanges Other
Slide 48
5,05
4,10
3,50
4,72
11,82 11,82
0%
10%
20%
30%
40%
50%
60%
0%
20%
40%
60%
80%
100%
0
20
40
60
80
100
120
140
160
180
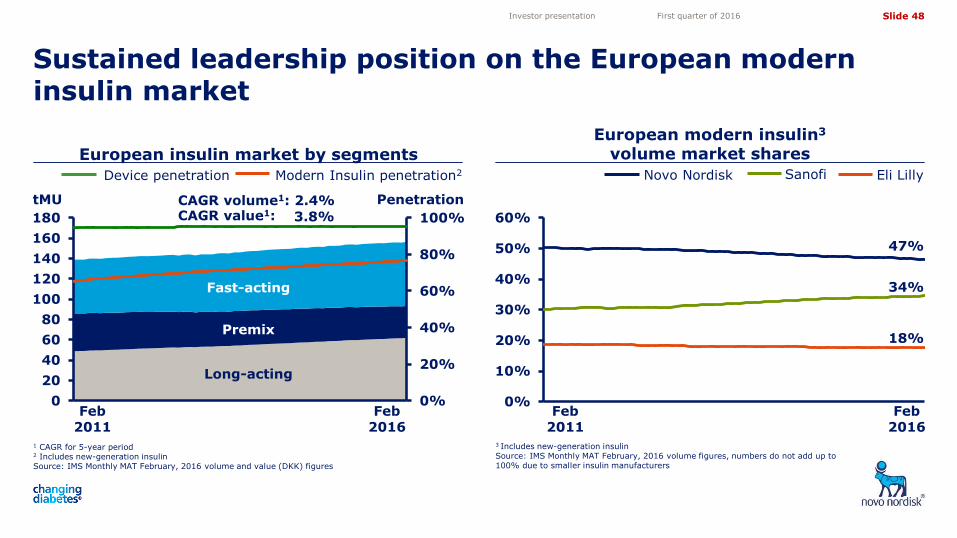
European modern insulin3 volume market shares
Sustained leadership position on the European modern insulin market
Investor presentation First quarter of 2016
1 CAGR for 5-year period 2 Includes new-generation insulin Source: IMS Monthly MAT February, 2016 volume and value (DKK) figures
Modern Insulin penetration2 Device penetration
Feb 2011
Feb 2016
Eli Lilly Novo Nordisk Sanofi
Fast-acting
Long-acting
tMU Penetration
Premix
47%
34%
18%
3 Includes new-generation insulin Source: IMS Monthly MAT February, 2016 volume figures, numbers do not add up to 100% due to smaller insulin manufacturers
CAGR volume1: 2.4% CAGR value1: 3.8%
Feb 2016
Feb 2011
European insulin market by segments
Slide 49
5,05
4,10
3,50
4,72
11,82 11,82
0%
10%
20%
30%
40%
50%
60%
70%
0%
20%
40%
60%
80%
100%
0
20
40
60
80
100
120
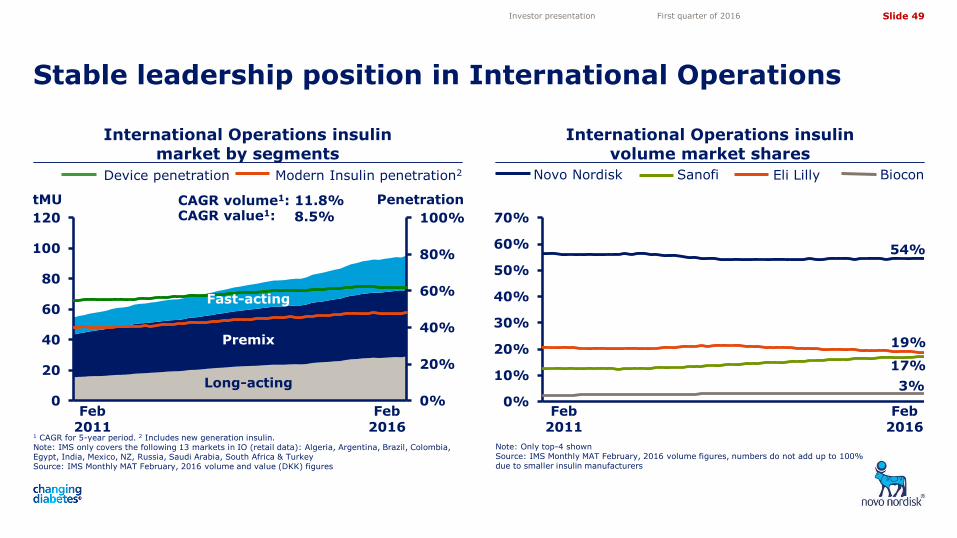
International Operations insulin market by segments
International Operations insulin volume market shares
Stable leadership position in International Operations
1 CAGR for 5-year period. 2 Includes new generation insulin. Note: IMS only covers the following 13 markets in IO (retail data): Algeria, Argentina, Brazil, Colombia, Egypt, India, Mexico, NZ, Russia, Saudi Arabia, South Africa & Turkey Source: IMS Monthly MAT February, 2016 volume and value (DKK) figures
Note: Only top-4 shown Source: IMS Monthly MAT February, 2016 volume figures, numbers do not add up to 100% due to smaller insulin manufacturers
Investor presentation First quarter of 2016
Device penetration
tMU Penetration CAGR volume1: 11.8% CAGR value1: 8.5%
Biocon
54%
17%
19%
Feb 2011
3%
Sanofi Novo Nordisk
Fast-acting
Long-acting
Premix
Feb 2016
Eli Lilly Modern Insulin penetration2
Feb 2016
Feb 2011
Slide 50
5,05
4,10
3,50
4,72
11,82 11,82
0%
10%
20%
30%
40%
50%
60%
70%
0%
20%
40%
60%
80%
100%
0
5
10
15
20
25
30
35
40
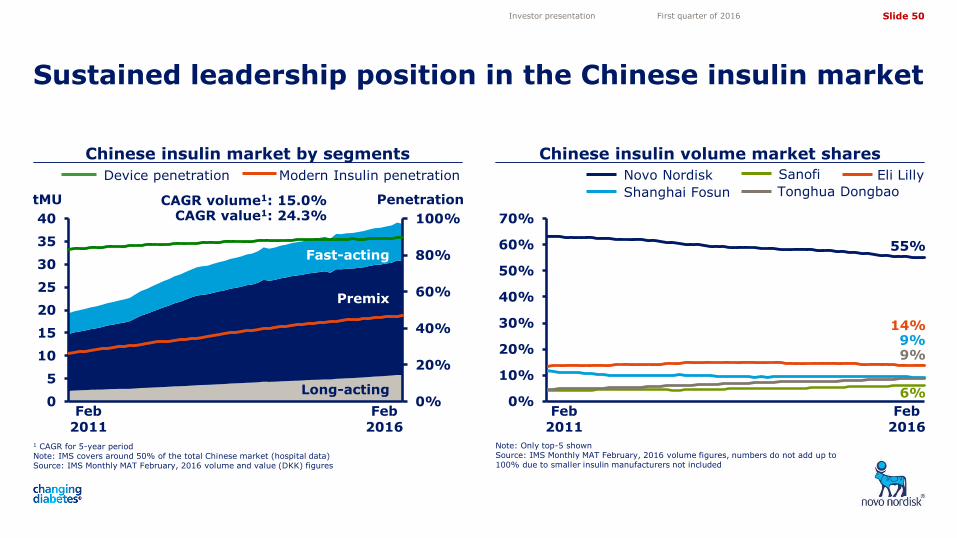
Chinese insulin market by segments Chinese insulin volume market shares
Sustained leadership position in the Chinese insulin market
1 CAGR for 5-year period Note: IMS covers around 50% of the total Chinese market (hospital data) Source: IMS Monthly MAT February, 2016 volume and value (DKK) figures
Note: Only top-5 shown Source: IMS Monthly MAT February, 2016 volume figures, numbers do not add up to 100% due to smaller insulin manufacturers not included
Investor presentation First quarter of 2016
Modern Insulin penetration Device penetration
tMU Penetration CAGR volume1: 15.0% CAGR value1: 24.3%
Fast-acting
Long-acting
Premix
Eli Lilly Novo Nordisk Sanofi
Shanghai Fosun Tonghua Dongbao
55%
6%
14% 9% 9%
Feb 2011
Feb 2016
Feb 2016
Feb 2011
Slide 51
5,05
4,10
3,50
4,72
11,82 11,82
0%
10%
20%
30%
40%
50%
60%
70%
0%
20%
40%
60%
80%
100%
0
2
4
6
8
10
12
14
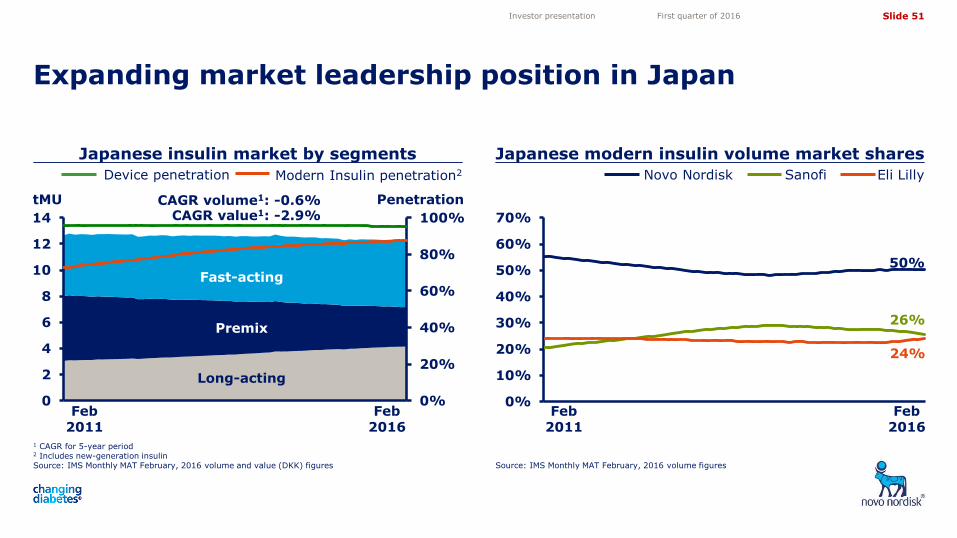
Japanese insulin market by segments Japanese modern insulin volume market shares
Expanding market leadership position in Japan
1 CAGR for 5-year period 2 Includes new-generation insulin Source: IMS Monthly MAT February, 2016 volume and value (DKK) figures Source: IMS Monthly MAT February, 2016 volume figures
Investor presentation First quarter of 2016
Device penetration Eli Lilly Novo Nordisk Sanofi
tMU Penetration CAGR volume1: -0.6% CAGR value1: -2.9%
Fast-acting
Long-acting
Premix
50%
26%
24%
Feb 2011
Feb 2016
Modern Insulin penetration2
Feb 2016
Feb 2011
Slide 52
5,05
4,10
3,50
4,72
11,82 11,82
0%
20%
40%
60%
80%
8%
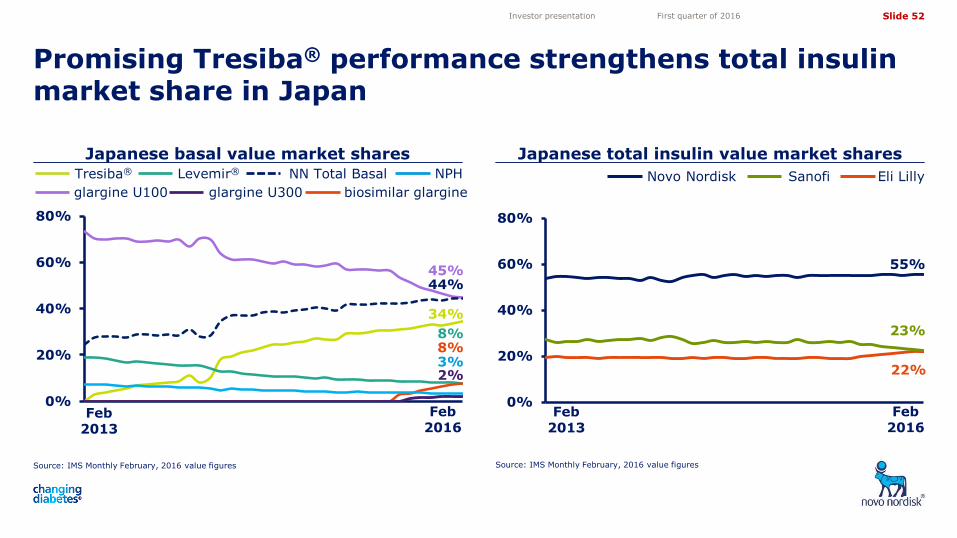
Japanese basal value market shares Japanese total insulin value market shares
Promising Tresiba® performance strengthens total insulin market share in Japan
Source: IMS Monthly February, 2016 value figures Source: IMS Monthly February, 2016 value figures
Investor presentation First quarter of 2016
0%
20%
40%
60%
80%
Eli Lilly Novo Nordisk Sanofi
Feb 2013
Feb 2016
55%
22%
23%
Feb 2013
Feb 2016
glargine U100
NN Total Basal Tresiba® Levemir® NPH
biosimilar glargine
44% 45%
34%
8%
3%
glargine U300
2%
Slide 53
5,05
4,10
3,50
4,72
11,82 11,82
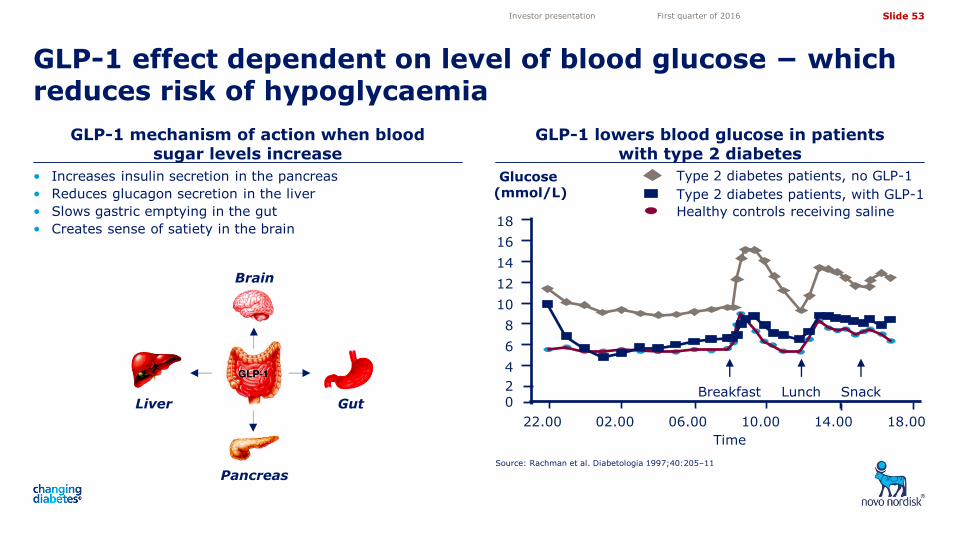
GLP-1 mechanism of action when blood sugar levels increase
GLP-1 lowers blood glucose in patients with type 2 diabetes
GLP-1 effect dependent on level of blood glucose − which reduces risk of hypoglycaemia
Source: Rachman et al. Diabetologia 1997;40:205–11
Investor presentation First quarter of 2016
• Increases insulin secretion in the pancreas
• Reduces glucagon secretion in the liver
• Slows gastric emptying in the gut
• Creates sense of satiety in the brain
Pancreas
Liver
Brain
Gut
Glucose (mmol/L)
12
8
6
0
22.00 02.00 06.00 10.00 14.00
10
4
14
16
Time
2 Breakfast Lunch Snack
18.00
18
Type 2 diabetes patients, no GLP-1
Healthy controls receiving saline
Type 2 diabetes patients, with GLP-1
Slide 54
5,05
4,10
3,50
4,72
11,82 11,82
0
2
4
6
8
10
12
14
0%
2%
4%
6%
8%
10%
0
5
10
15
20
25
30
35
40
Victoza® sales and GLP-1 value market share of total diabetes care market
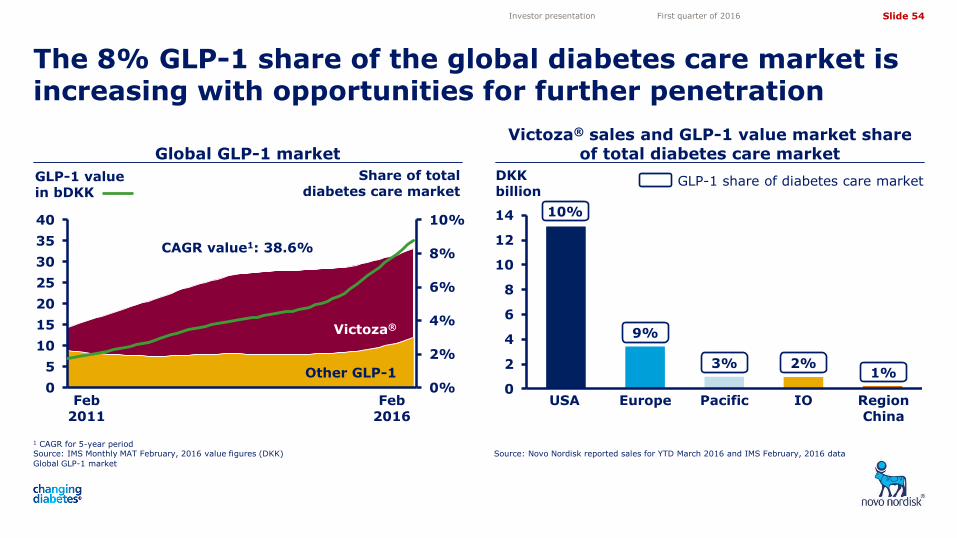
The 8% GLP-1 share of the global diabetes care market is increasing with opportunities for further penetration
Global GLP-1 market
Investor presentation First quarter of 2016
1 CAGR for 5-year period Source: IMS Monthly MAT February, 2016 value figures (DKK)
DKK billion
GLP-1 share of diabetes care market
10%
9%
3% 2% 1%
USA Europe Pacific IO Region China
GLP-1 value in bDKK
Victoza®
CAGR value1: 38.6%
Share of total diabetes care market
Other GLP-1
Feb 2011
Feb 2016
Source: Novo Nordisk reported sales for YTD March 2016 and IMS February, 2016 data
Global GLP-1 market
Slide 55
5,05
4,10
3,50
4,72
11,82 11,82
0%
20%
40%
60%
80%
100%14% 13%
0%
20%
40%
60%
80%
100%
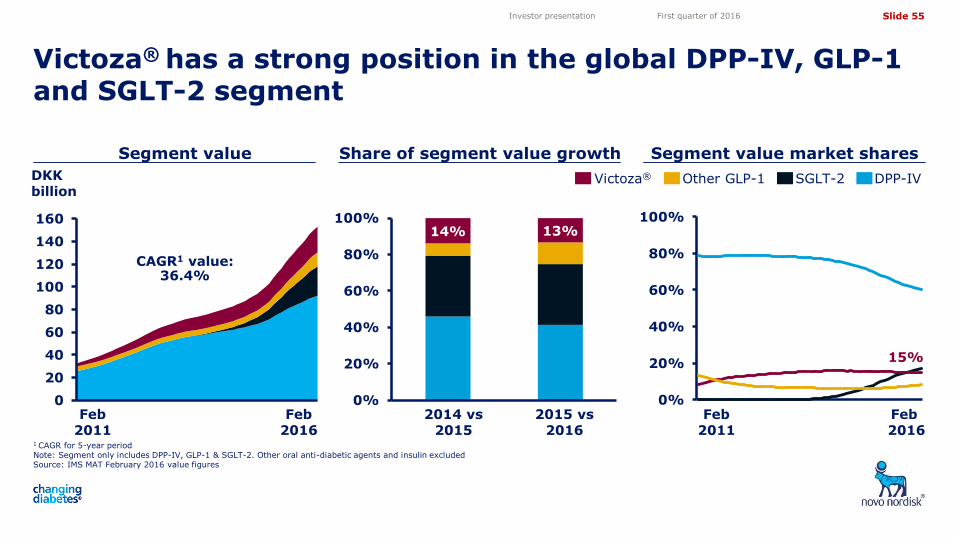
DPP-IV SGLT-2 Victoza® Other GLP-1
Share of segment value growth Segment value market shares
0
20
40
60
80
100
120
140
160
1 CAGR for 5-year period Note: Segment only includes DPP-IV, GLP-1 & SGLT-2. Other oral anti-diabetic agents and insulin excluded Source: IMS MAT February 2016 value figures
Victoza® has a strong position in the global DPP-IV, GLP-1 and SGLT-2 segment
Investor presentation First quarter of 2016
DKK billion
Feb 2011
Feb 2016
Feb 2011
Feb 2016
CAGR1 value: 36.4%
15%
2015 vs 2016
2014 vs 2015
Segment value
Slide 56
5,05
4,10
3,50
4,72
11,82 11,82
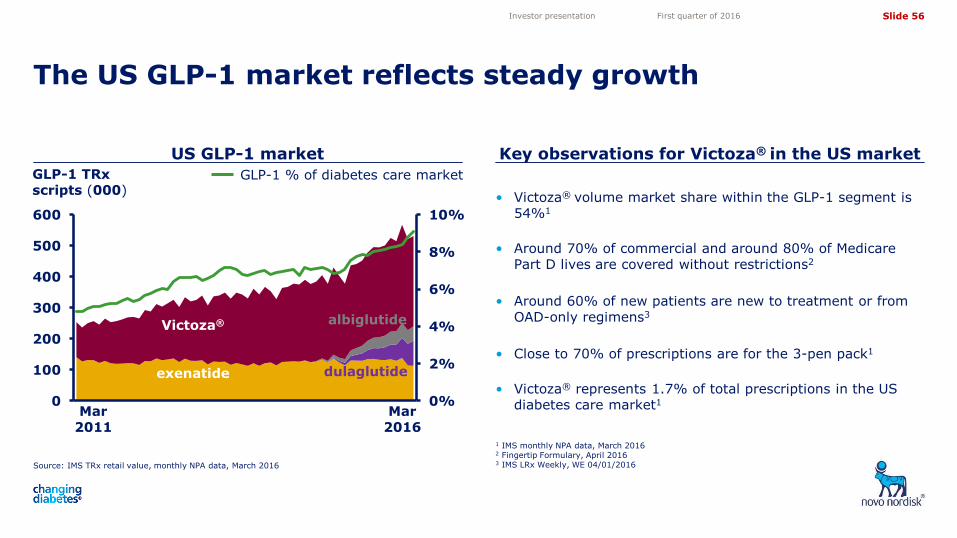
• Victoza® volume market share within the GLP-1 segment is 54%1
• Around 70% of commercial and around 80% of Medicare Part D lives are covered without restrictions2
• Around 60% of new patients are new to treatment or from OAD-only regimens3
• Close to 70% of prescriptions are for the 3-pen pack1
• Victoza® represents 1.7% of total prescriptions in the US diabetes care market1
Source: IMS TRx retail value, monthly NPA data, March 2016
US GLP-1 market Key observations for Victoza® in the US market
The US GLP-1 market reflects steady growth
1 IMS monthly NPA data, March 2016 2 Fingertip Formulary, April 2016 3 IMS LRx Weekly, WE 04/01/2016
0%
2%
4%
6%
8%
10%
0
100
200
300
400
500
600
Investor presentation First quarter of 2016
GLP-1 % of diabetes care market GLP-1 TRx scripts (000)
Victoza®
exenatide
albiglutide
dulaglutide
Mar 2016
Mar 2011
Slide 57
5,05
4,10
3,50
4,72
11,82 11,82
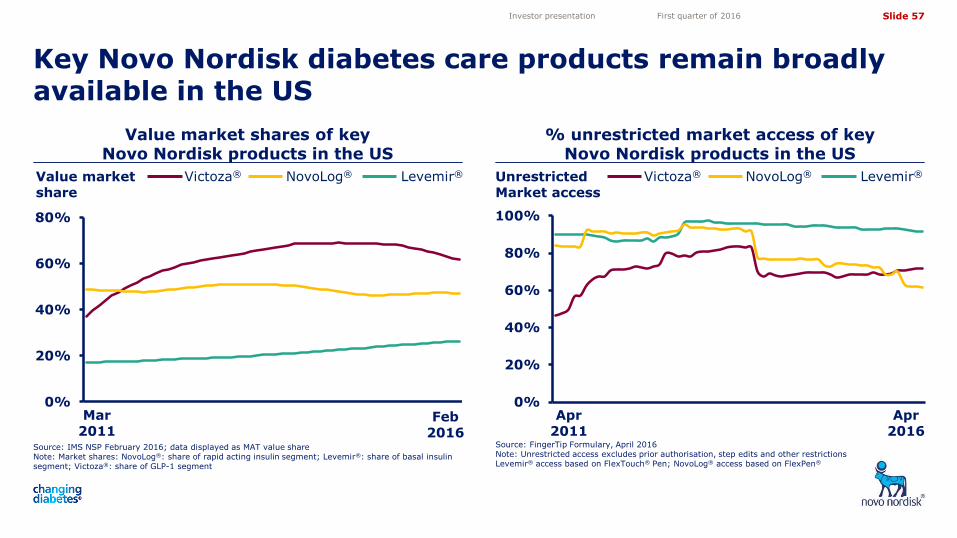
Value market shares of key Novo Nordisk products in the US
% unrestricted market access of key Novo Nordisk products in the US
Investor presentation First quarter of 2016
Value market share
Victoza® NovoLog® Levemir® Unrestricted Market access
Victoza® NovoLog® Levemir®
Key Novo Nordisk diabetes care products remain broadly available in the US
0%
20%
40%
60%
80%
Source: IMS NSP February 2016; data displayed as MAT value share Note: Market shares: NovoLog®: share of rapid acting insulin segment; Levemir®: share of basal insulin segment; Victoza®: share of GLP-1 segment
Mar 2011
Feb 2016
0%
20%
40%
60%
80%
100%
Source: FingerTip Formulary, April 2016 Note: Unrestricted access excludes prior authorisation, step edits and other restrictions Levemir® access based on FlexTouch® Pen; NovoLog® access based on FlexPen®
Apr 2011
Apr 2016
Slide 58
5,05
4,10
3,50
4,72
11,82 11,82
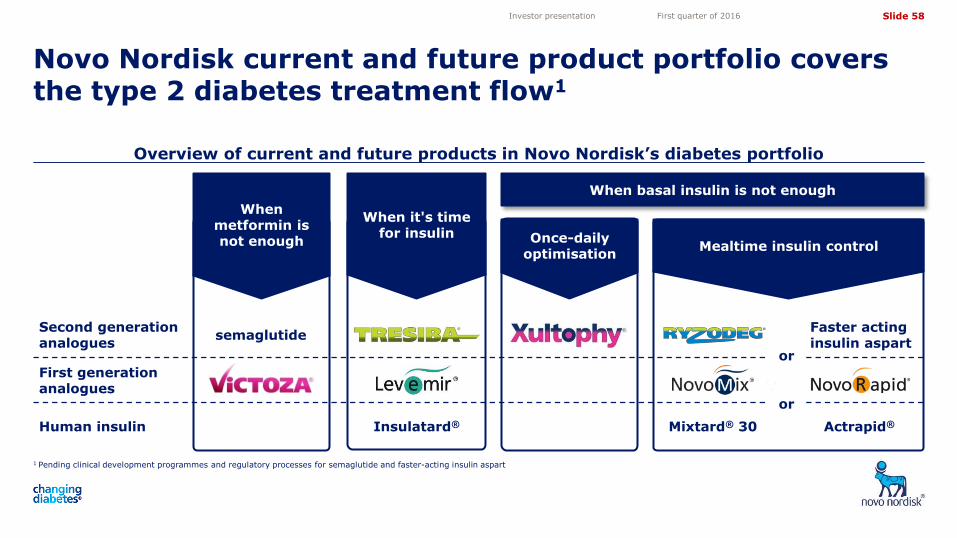
Overview of current and future products in Novo Nordisk’s diabetes portfolio
1 Pending clinical development programmes and regulatory processes for semaglutide and faster-acting insulin aspart
Novo Nordisk current and future product portfolio covers the type 2 diabetes treatment flow1
Investor presentation First quarter of 2016
When basal insulin is not enough
Once-daily optimisation
When metformin is not enough
When it's time for insulin
Mealtime insulin control
semaglutide
Actrapid® Mixtard® 30 Insulatard®
or
Faster acting insulin aspart
First generation analogues
Second generation analogues
Human insulin
or
Slide 59
5,05
4,10
3,50
4,72
11,82 11,82
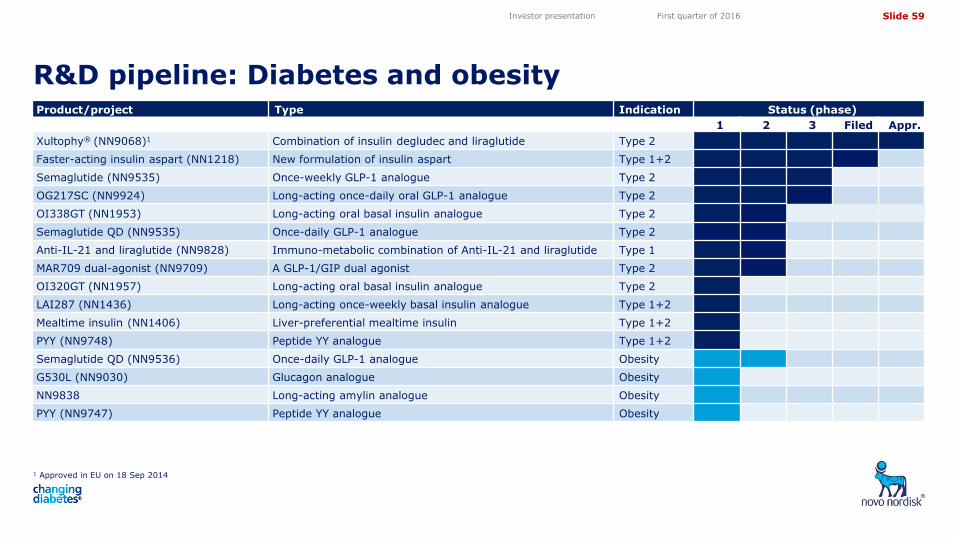
R&D pipeline: Diabetes and obesity
1 Approved in EU on 18 Sep 2014
Investor presentation First quarter of 2016
Product/project Type Indication Status (phase)
1 2 3 Filed Appr.
Xultophy® (NN9068)1 Combination of insulin degludec and liraglutide Type 2
Faster-acting insulin aspart (NN1218) New formulation of insulin aspart Type 1+2
Semaglutide (NN9535) Once-weekly GLP-1 analogue Type 2
OG217SC (NN9924) Long-acting once-daily oral GLP-1 analogue Type 2
OI338GT (NN1953) Long-acting oral basal insulin analogue Type 2
Semaglutide QD (NN9535) Once-daily GLP-1 analogue Type 2
Anti-IL-21 and liraglutide (NN9828) Immuno-metabolic combination of Anti-IL-21 and liraglutide Type 1
MAR709 dual-agonist (NN9709) A GLP-1/GIP dual agonist Type 2
OI320GT (NN1957) Long-acting oral basal insulin analogue Type 2
LAI287 (NN1436) Long-acting once-weekly basal insulin analogue Type 1+2
Mealtime insulin (NN1406) Liver-preferential mealtime insulin Type 1+2
PYY (NN9748) Peptide YY analogue Type 1+2
Semaglutide QD (NN9536) Once-daily GLP-1 analogue Obesity
G530L (NN9030) Glucagon analogue Obesity
NN9838 Long-acting amylin analogue Obesity
PYY (NN9747) Peptide YY analogue Obesity

Slide 60
5,05
4,10
3,50
4,72
11,82 11,82
In phase 3a trials semaglutide shows best in-class potential on HbA1c reduction across treatment cascade
Comparison of HbA1c lowering effect in SUSTAIN 1, 2, 3, 4 and 5 trials
* p < 0.001; QD: once daily; QW: once weekly; sema: semaglutide Source: Novo Nordisk on file (NN9535-3623, NN9535-3624, NN9535-3625, NN9535-3626, NN9535-3627)
Sema 1 mg Sema 0.5 mg
-1.6 -1.6 -1.5
-1.6
-1.8
-1.5
-1.3
-0.9
-1.2
-1.4
-0.5
-0.8
-0.1
-2.0
-1.6
-1.2
-0.8
-0.4
0.00.0
SUSTAIN 1 SUSTAIN 3 SUSTAIN 4 Baseline 8.1% 8.4% 8.2%
72% 74% 25% 67% 40% 73% 58%
% patients HbA1c ≤7%
38%
*
*
*
SUSTAIN 2
8.1%
* *
*
Sitagliptin 100 mg
78% 69% 36%
Ch
an
ge i
n H
bA
1c (
%)
*
Placebo Exenatide QW Insulin glargine QD
SUSTAIN 5 8.4%
79% 61% 11%
*
*
Investor presentation First quarter of 2016
Slide 61
5,05
4,10
3,50
4,72
11,82 11,82
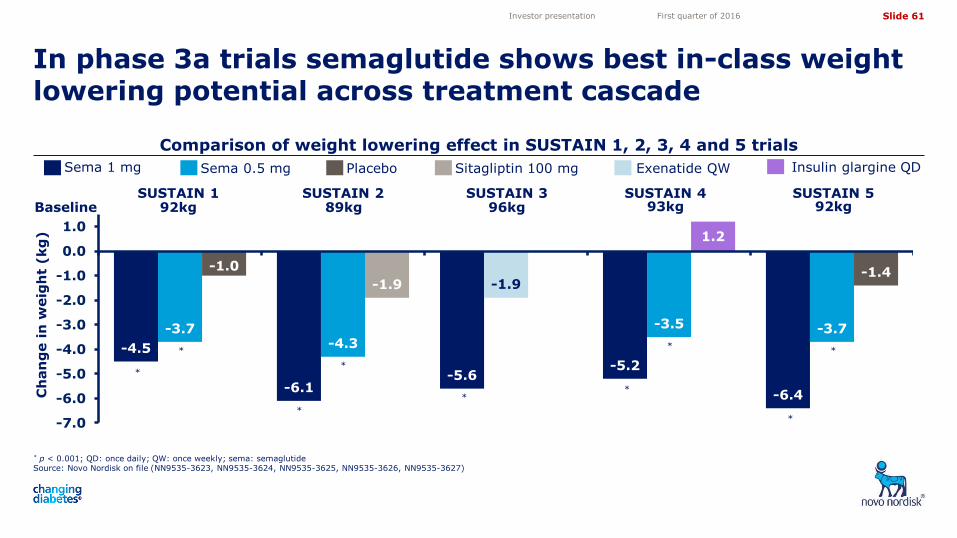
In phase 3a trials semaglutide shows best in-class weight lowering potential across treatment cascade
Comparison of weight lowering effect in SUSTAIN 1, 2, 3, 4 and 5 trials
* p < 0.001; QD: once daily; QW: once weekly; sema: semaglutide Source: Novo Nordisk on file (NN9535-3623, NN9535-3624, NN9535-3625, NN9535-3626, NN9535-3627)
Sema 1 mg Sema 0.5 mg Exenatide QW Insulin glargine QD Sitagliptin 100 mg
-4.5
-6.1 -5.6
-5.2
-6.4
-3.7 -4.3
-1.9
-3.5 -3.7
-1.0
-1.9
1.2
-1.4
-7.0
-6.0
-5.0
-4.0
-3.0
-2.0
-1.0
0.0
1.0
*
*
Baseline SUSTAIN 1
92kg SUSTAIN 3
96kg SUSTAIN 4
93kg SUSTAIN 2
89kg
Ch
an
ge i
n w
eig
ht
(kg
)
*
-6.1
*
* *
*
Placebo
SUSTAIN 5 92kg
*
*
Investor presentation First quarter of 2016
Slide 62
5,05
4,10
3,50
4,72
11,82 11,82
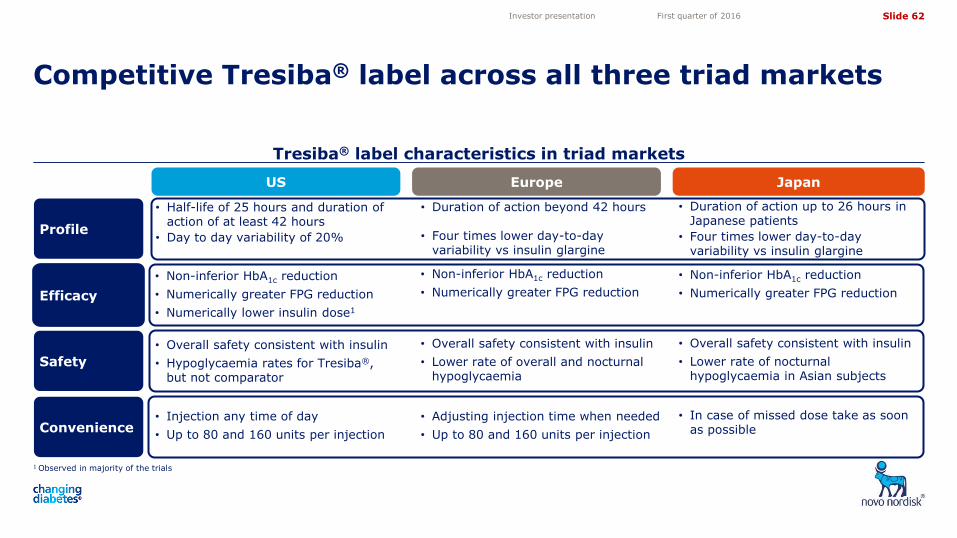
Tresiba® label characteristics in triad markets
1 Observed in majority of the trials
Competitive Tresiba® label across all three triad markets
Investor presentation First quarter of 2016
US Europe Japan
Efficacy
• Non-inferior HbA1c reduction
• Numerically greater FPG reduction
• Numerically lower insulin dose1
• Non-inferior HbA1c reduction
• Numerically greater FPG reduction
• Non-inferior HbA1c reduction
• Numerically greater FPG reduction
Profile
• Half-life of 25 hours and duration of action of at least 42 hours
• Day to day variability of 20%
• Duration of action beyond 42 hours
• Four times lower day-to-day variability vs insulin glargine
• Duration of action up to 26 hours in Japanese patients
• Four times lower day-to-day variability vs insulin glargine
Safety
• Overall safety consistent with insulin
• Lower rate of overall and nocturnal hypoglycaemia
• Overall safety consistent with insulin
• Lower rate of nocturnal hypoglycaemia in Asian subjects
Convenience • Injection any time of day
• Up to 80 and 160 units per injection
• Adjusting injection time when needed
• Up to 80 and 160 units per injection
• In case of missed dose take as soon as possible
• Overall safety consistent with insulin
• Hypoglycaemia rates for Tresiba®, but not comparator
Slide 63
5,05
4,10
3,50
4,72
11,82 11,82
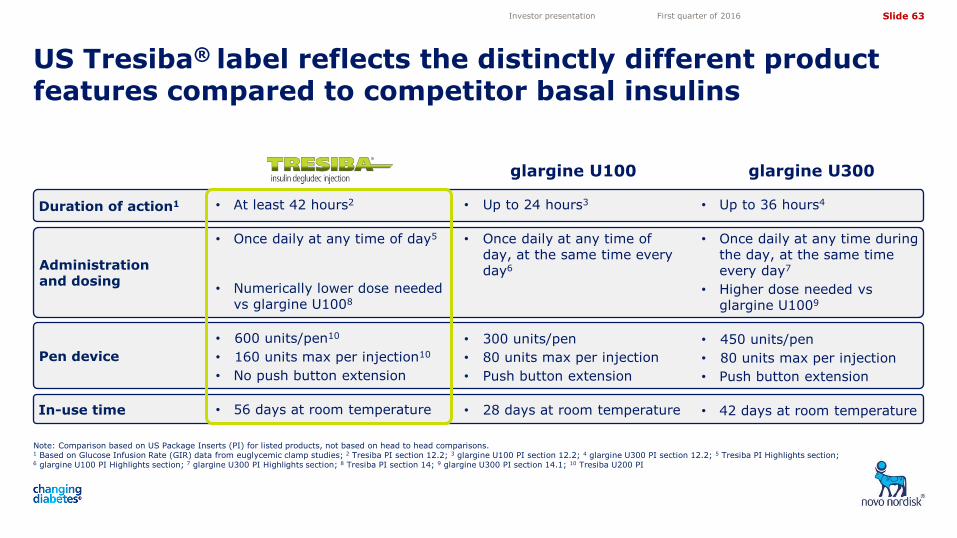
Duration of action1
Note: Comparison based on US Package Inserts (PI) for listed products, not based on head to head comparisons. 1 Based on Glucose Infusion Rate (GIR) data from euglycemic clamp studies; 2 Tresiba PI section 12.2; 3 glargine U100 PI section 12.2; 4 glargine U300 PI section 12.2; 5 Tresiba PI Highlights section; 6 glargine U100 PI Highlights section; 7 glargine U300 PI Highlights section; 8 Tresiba PI section 14; 9 glargine U300 PI section 14.1; 10 Tresiba U200 PI
Investor presentation First quarter of 2016
Administration and dosing
Pen device
In-use time
• Up to 24 hours3
• Once daily at any time of day, at the same time every day6
• 300 units/pen
• 80 units max per injection
• Push button extension
• 28 days at room temperature
• Up to 36 hours4
• Once daily at any time during the day, at the same time every day7
• Higher dose needed vs glargine U1009
• 450 units/pen
• 80 units max per injection
• Push button extension
• 42 days at room temperature
• At least 42 hours2
• Once daily at any time of day5
• Numerically lower dose needed vs glargine U1008
• 600 units/pen10
• 160 units max per injection10
• No push button extension
• 56 days at room temperature
glargine U100 glargine U300
US Tresiba® label reflects the distinctly different product features compared to competitor basal insulins
Slide 64
5,05
4,10
3,50
4,72
11,82 11,82
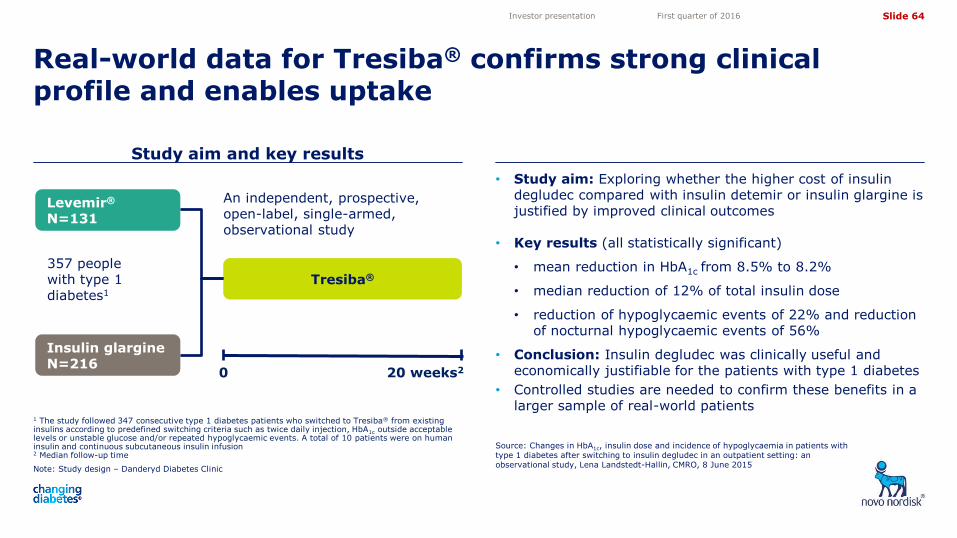
Note: Study design – Danderyd Diabetes Clinic
Study aim and key results
Source: Changes in HbA1c, insulin dose and incidence of hypoglycaemia in patients with type 1 diabetes after switching to insulin degludec in an outpatient setting: an observational study, Lena Landstedt-Hallin, CMRO, 8 June 2015
Real-world data for Tresiba® confirms strong clinical profile and enables uptake
Investor presentation First quarter of 2016
• Study aim: Exploring whether the higher cost of insulin degludec compared with insulin detemir or insulin glargine is justified by improved clinical outcomes
• Key results (all statistically significant)
• mean reduction in HbA1c from 8.5% to 8.2%
• median reduction of 12% of total insulin dose
• reduction of hypoglycaemic events of 22% and reduction of nocturnal hypoglycaemic events of 56%
• Conclusion: Insulin degludec was clinically useful and economically justifiable for the patients with type 1 diabetes
• Controlled studies are needed to confirm these benefits in a larger sample of real-world patients
20 weeks2
1 The study followed 347 consecutive type 1 diabetes patients who switched to Tresiba® from existing insulins according to predefined switching criteria such as twice daily injection, HbA1c outside acceptable levels or unstable glucose and/or repeated hypoglycaemic events. A total of 10 patients were on human insulin and continuous subcutaneous insulin infusion 2 Median follow-up time
0
Tresiba®
An independent, prospective, open-label, single-armed, observational study
Insulin glargine N=216
Levemir®
N=131
357 people with type 1 diabetes1
Slide 65
5,05
4,10
3,50
4,72
11,82 11,82
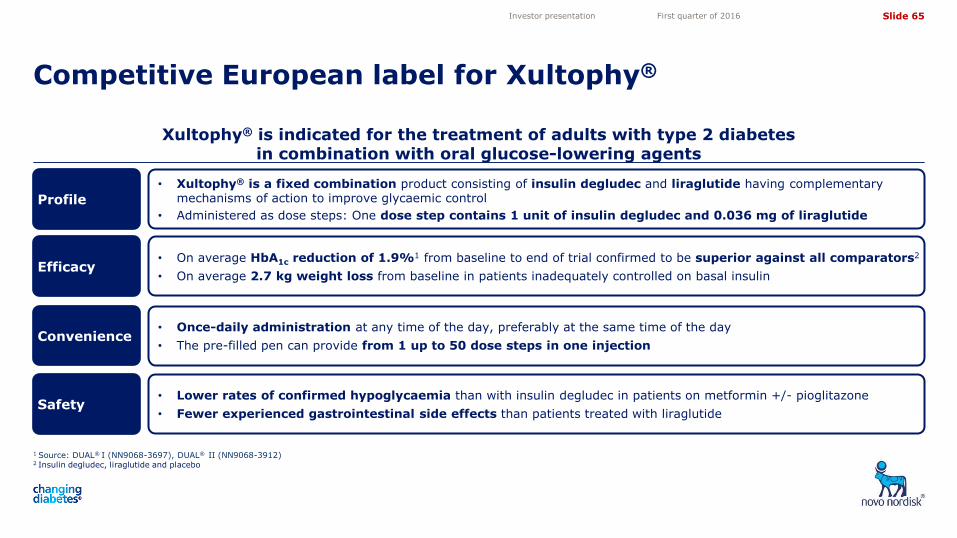
Xultophy® is indicated for the treatment of adults with type 2 diabetes in combination with oral glucose-lowering agents
1 Source: DUAL® I (NN9068-3697), DUAL® II (NN9068-3912)
2 Insulin degludec, liraglutide and placebo
Competitive European label for Xultophy®
Investor presentation First quarter of 2016
• Lower rates of confirmed hypoglycaemia than with insulin degludec in patients on metformin +/- pioglitazone
• Fewer experienced gastrointestinal side effects than patients treated with liraglutide
• On average HbA1c reduction of 1.9%1 from baseline to end of trial confirmed to be superior against all comparators2
• On average 2.7 kg weight loss from baseline in patients inadequately controlled on basal insulin
• Once-daily administration at any time of the day, preferably at the same time of the day
• The pre-filled pen can provide from 1 up to 50 dose steps in one injection
• Xultophy® is a fixed combination product consisting of insulin degludec and liraglutide having complementary mechanisms of action to improve glycaemic control
• Administered as dose steps: One dose step contains 1 unit of insulin degludec and 0.036 mg of liraglutide
Convenience
Efficacy
Profile
Safety
Slide 66
5,05
4,10
3,50
4,72
11,82 11,82
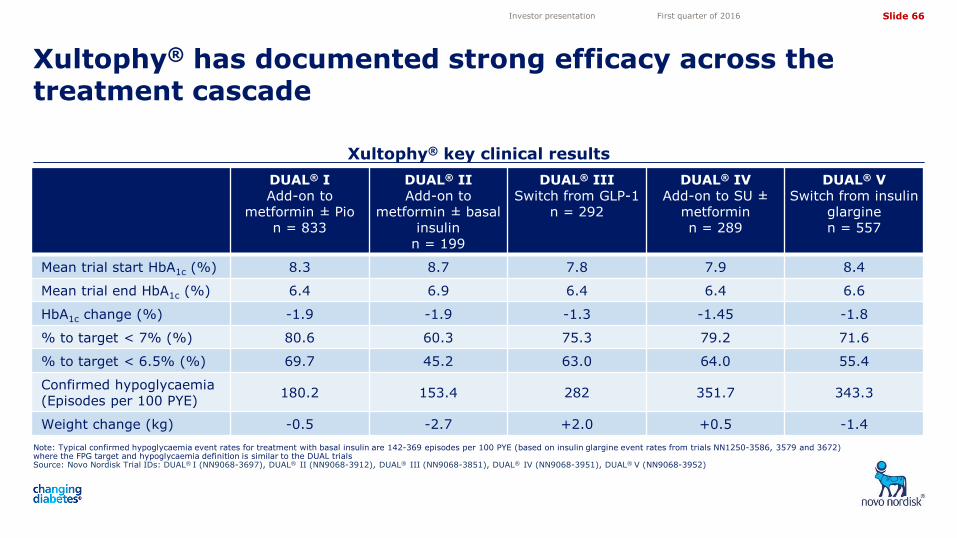
Xultophy® key clinical results
Note: Typical confirmed hypoglycaemia event rates for treatment with basal insulin are 142-369 episodes per 100 PYE (based on insulin glargine event rates from trials NN1250-3586, 3579 and 3672) where the FPG target and hypoglycaemia definition is similar to the DUAL trials Source: Novo Nordisk Trial IDs: DUAL® I (NN9068-3697), DUAL® II (NN9068-3912), DUAL® III (NN9068-3851), DUAL® IV (NN9068-3951), DUAL® V (NN9068-3952)
Xultophy® has documented strong efficacy across the treatment cascade
Investor presentation First quarter of 2016
DUAL® I Add-on to
metformin ± Pio n = 833
DUAL® II Add-on to
metformin ± basal insulin
n = 199
DUAL® III Switch from GLP-1
n = 292
DUAL® IV Add-on to SU ±
metformin n = 289
DUAL® V Switch from insulin
glargine n = 557
Mean trial start HbA1c (%) 8.3 8.7 7.8 7.9 8.4
Mean trial end HbA1c (%) 6.4 6.9 6.4 6.4 6.6
HbA1c change (%) -1.9 -1.9 -1.3 -1.45 -1.8
% to target < 7% (%) 80.6 60.3 75.3 79.2 71.6
% to target < 6.5% (%) 69.7 45.2 63.0 64.0 55.4
Confirmed hypoglycaemia (Episodes per 100 PYE)
180.2 153.4 282 351.7 343.3
Weight change (kg) -0.5 -2.7 +2.0 +0.5 -1.4
Slide 67
5,05
4,10
3,50
4,72
11,82 11,82
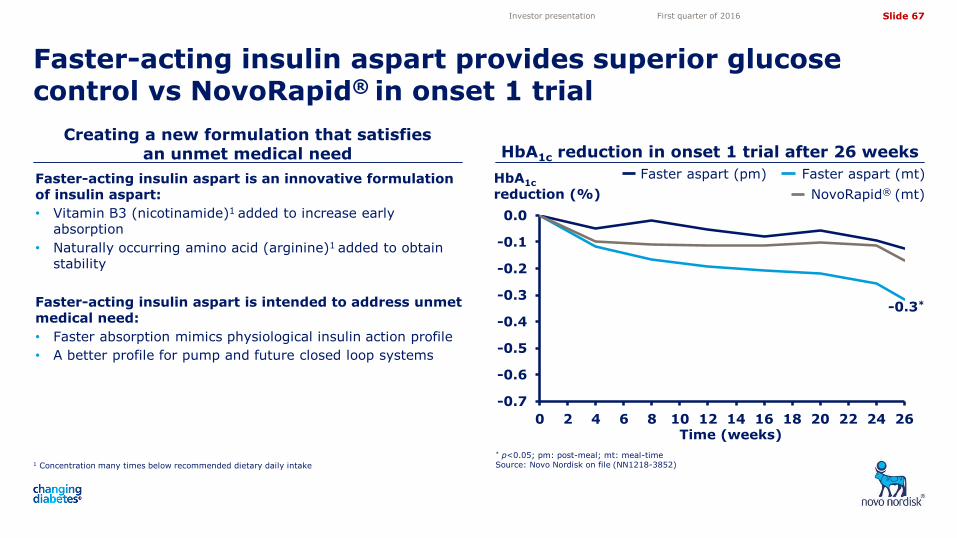
Faster-acting insulin aspart is an innovative formulation of insulin aspart:
• Vitamin B3 (nicotinamide)1 added to increase early absorption
• Naturally occurring amino acid (arginine)1 added to obtain stability
Faster-acting insulin aspart is intended to address unmet medical need:
• Faster absorption mimics physiological insulin action profile
• A better profile for pump and future closed loop systems
1 Concentration many times below recommended dietary daily intake
Creating a new formulation that satisfies an unmet medical need HbA1c reduction in onset 1 trial after 26 weeks
-0.3*
-0.7
-0.6
-0.5
-0.4
-0.3
-0.2
-0.1
0.0
0 2 4 6 8 10 12 14 16 18 20 22 24 26
Faster-acting insulin aspart provides superior glucose control vs NovoRapid® in onset 1 trial
* p<0.05; pm: post-meal; mt: meal-time Source: Novo Nordisk on file (NN1218-3852)
Investor presentation First quarter of 2016
HbA1c reduction (%)
Faster aspart (pm) Faster aspart (mt)
NovoRapid® (mt)
Time (weeks)
Slide 68
5,05
4,10
3,50
4,72
11,82 11,82
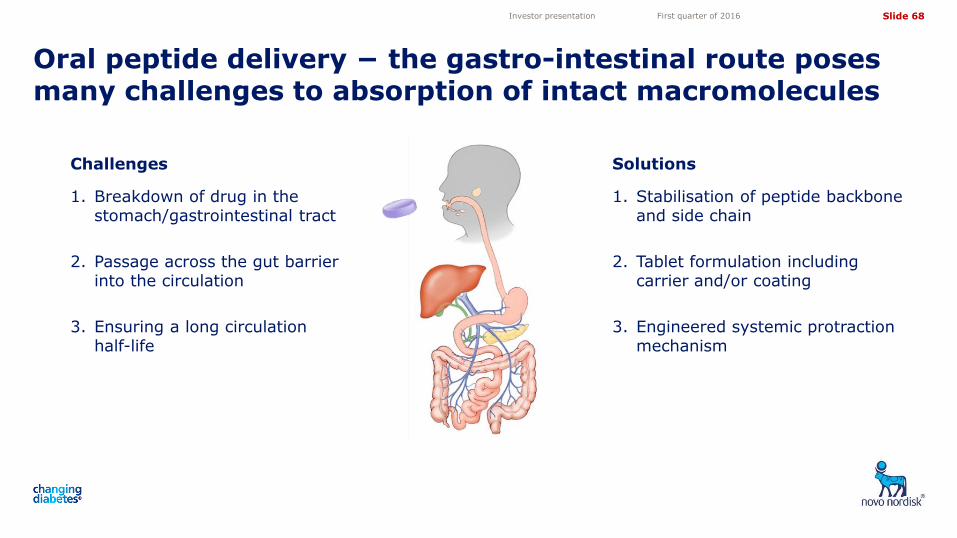
Oral peptide delivery − the gastro-intestinal route poses many challenges to absorption of intact macromolecules
Investor presentation First quarter of 2016
Challenges
1. Breakdown of drug in the stomach/gastrointestinal tract
2. Passage across the gut barrier into the circulation
3. Ensuring a long circulation half-life
Solutions
1. Stabilisation of peptide backbone and side chain
2. Tablet formulation including carrier and/or coating
3. Engineered systemic protraction mechanism
Slide 69
5,05
4,10
3,50
4,72
11,82 11,82
5.5
6.0
6.5
7.0
7.5
8.0
0 2 4 6 8 10 12 14 16 18 20 22 24 26
-8.0
-6.0
-4.0
-2.0
0.0
0 2 4 6 8 10 12 14 16 18 20 22 24 26
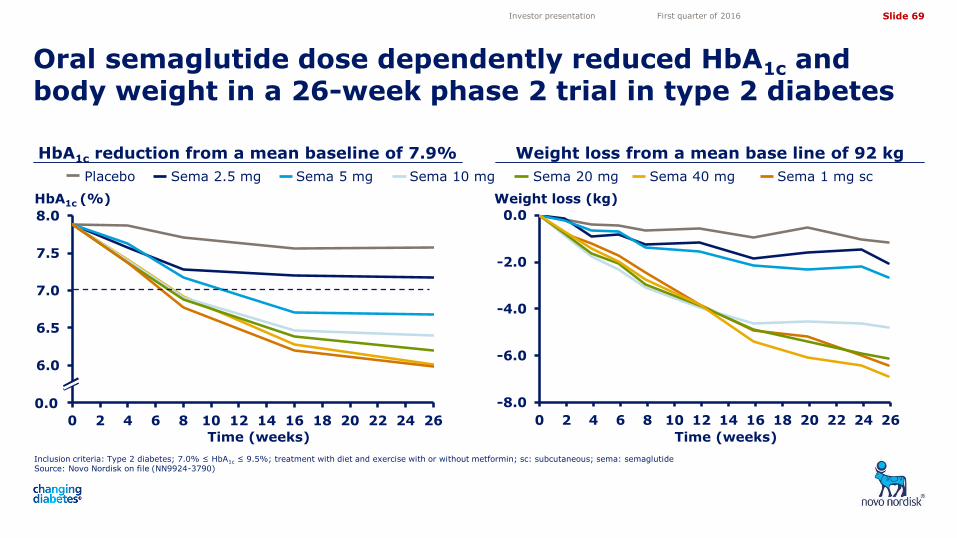
HbA1c reduction from a mean baseline of 7.9% Weight loss from a mean base line of 92 kg
Oral semaglutide dose dependently reduced HbA1c and body weight in a 26-week phase 2 trial in type 2 diabetes
Inclusion criteria: Type 2 diabetes; 7.0% ≤ HbA1c ≤ 9.5%; treatment with diet and exercise with or without metformin; sc: subcutaneous; sema: semaglutide Source: Novo Nordisk on file (NN9924-3790)
Investor presentation First quarter of 2016
Placebo Sema 2.5 mg Sema 5 mg Sema 10 mg Sema 20 mg Sema 1 mg sc Sema 40 mg
HbA1c (%) Weight loss (kg)
0.0
Time (weeks) Time (weeks)
Slide 70
5,05
4,10
3,50
4,72
11,82 11,82
PIONEER, the global phase 3a programme for oral semaglutide to include >9,300 people with type 2 diabetes
Investor presentation First quarter of 2016
Note: Preliminary estimated timing of trials from first patient first visit (FPFV) to last patient last visit (LPLV), n = approximate number of randomised people; MACE: Major Cardiovascular Events; OAD: oral anti-diabetic
2016 2017 2018
PIONEER 1: monotherapy 26 weeks, n=704
PIONEER 2: vs empagliflozin 52 weeks, n=816
PIONEER 3: vs sitagliptin 78 weeks, n=1,860
PIONEER 4: vs liraglutide 52 weeks, n=690
PIONEER 5: moderate renal impairment 26 weeks, n=324
PIONEER 6: cardiovascular outcomes Event driven (>122 MACE), n=3,176
PIONEER 7: flexible dose escalation 52 weeks, n=500
PIONEER 8: insulin add-on 26+26 weeks, n=720
PIONEER 9: JAPAN monotherapy 52 weeks, n=230
PIONEER 10: JAPAN OAD combination 52 weeks, n=336
Investor presentation Full year 2015
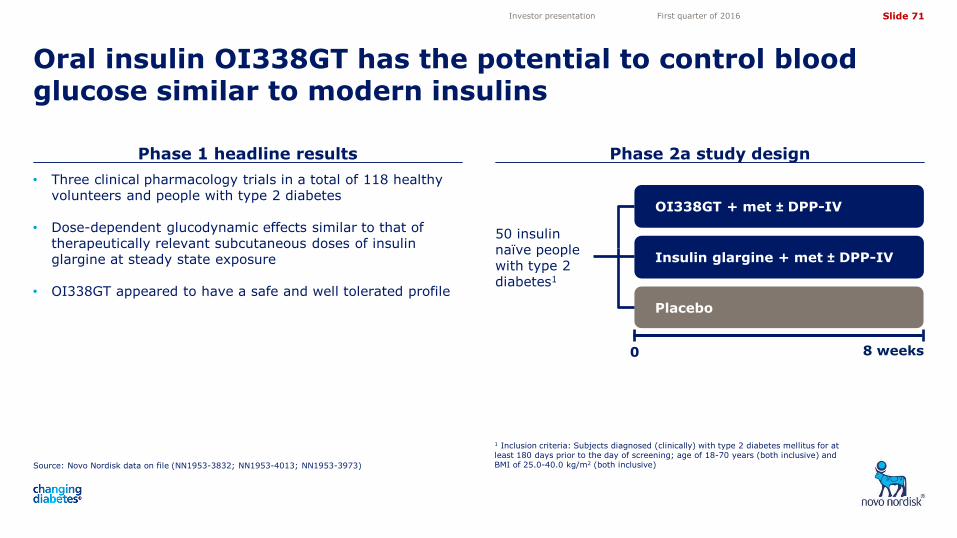
Slide 71
5,05
4,10
3,50
4,72
11,82 11,82
Phase 1 headline results Phase 2a study design
Oral insulin OI338GT has the potential to control blood glucose similar to modern insulins
Source: Novo Nordisk data on file (NN1953-3832; NN1953-4013; NN1953-3973)
1 Inclusion criteria: Subjects diagnosed (clinically) with type 2 diabetes mellitus for at least 180 days prior to the day of screening; age of 18-70 years (both inclusive) and BMI of 25.0-40.0 kg/m2 (both inclusive)
Investor presentation First quarter of 2016
Placebo
OI338GT + met ± DPP-IV
0 8 weeks
50 insulin naïve people with type 2 diabetes1
Insulin glargine + met ± DPP-IV
• Three clinical pharmacology trials in a total of 118 healthy volunteers and people with type 2 diabetes
• Dose-dependent glucodynamic effects similar to that of therapeutically relevant subcutaneous doses of insulin glargine at steady state exposure
• OI338GT appeared to have a safe and well tolerated profile
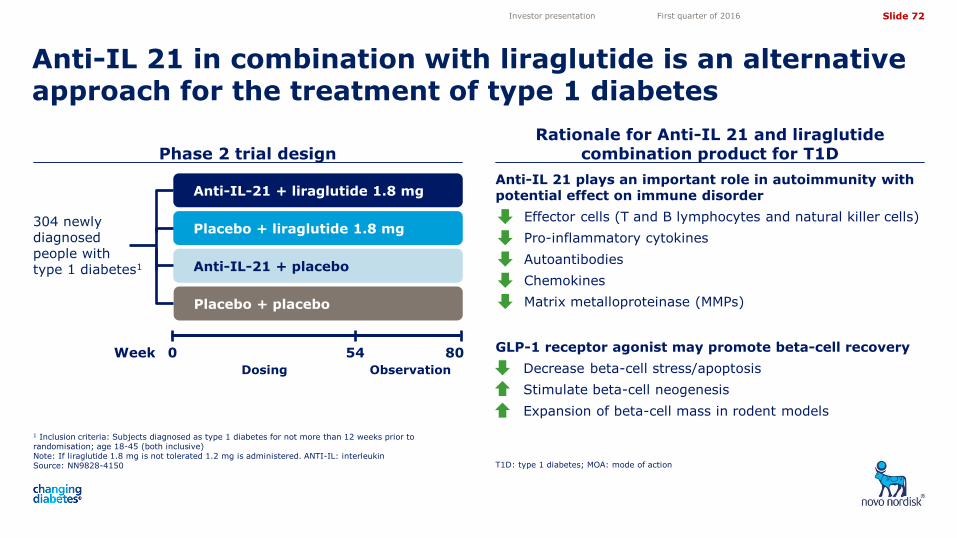
Slide 72
5,05
4,10
3,50
4,72
11,82 11,82
Phase 2 trial design Rationale for Anti-IL 21 and liraglutide
combination product for T1D
Anti-IL 21 in combination with liraglutide is an alternative approach for the treatment of type 1 diabetes
1 Inclusion criteria: Subjects diagnosed as type 1 diabetes for not more than 12 weeks prior to randomisation; age 18-45 (both inclusive) Note: If liraglutide 1.8 mg is not tolerated 1.2 mg is administered. ANTI-IL: interleukin Source: NN9828-4150 T1D: type 1 diabetes; MOA: mode of action
Investor presentation First quarter of 2016
Placebo + placebo
Placebo + liraglutide 1.8 mg
0 80
Anti-IL-21 + placebo
Anti-IL-21 + liraglutide 1.8 mg
304 newly diagnosed people with type 1 diabetes1
54
Dosing Observation
Week
Anti-IL 21 plays an important role in autoimmunity with potential effect on immune disorder
• Effector cells (T and B lymphocytes and natural killer cells)
• Pro-inflammatory cytokines
• Autoantibodies
• Chemokines
• Matrix metalloproteinase (MMPs)
GLP-1 receptor agonist may promote beta-cell recovery
• Decrease beta-cell stress/apoptosis
• Stimulate beta-cell neogenesis
• Expansion of beta-cell mass in rodent models
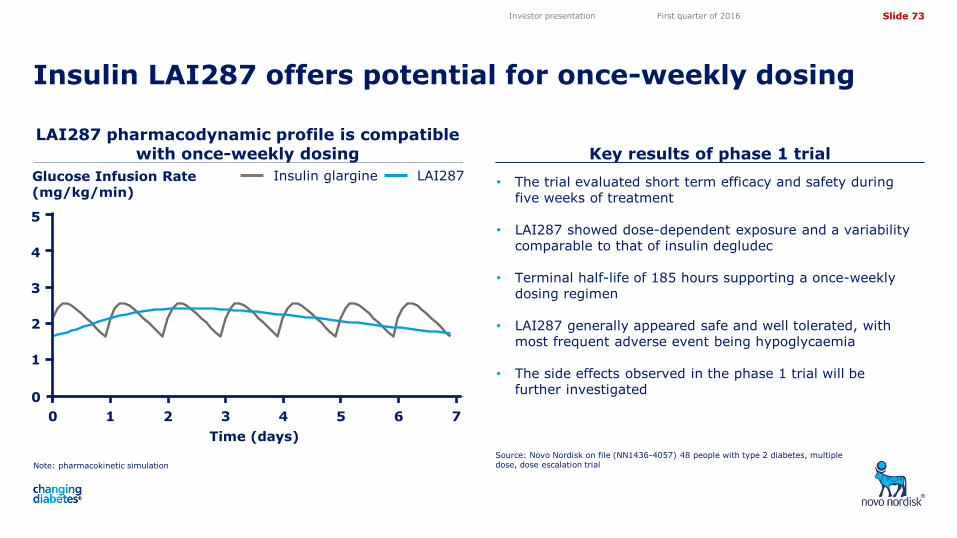
Slide 73
5,05
4,10
3,50
4,72
11,82 11,82
Glucose Infusion Rate vs. Time (Predicted Mean)
Time (days)
Glu
cose
Infu
sion
Rat
e (m
g/kg
/min
)
0 2 4 6
01
23
45
6 18 nmol/kgIGlar 0.4 U/kg
2013-Oct-25T11:20:20 E:/Project/NN1436/NN1436-3955/current/Splus/Final/09_MultipleDoseComparison.ssc
LAI287 pharmacodynamic profile is compatible with once-weekly dosing Key results of phase 1 trial
Insulin LAI287 offers potential for once-weekly dosing
Note: pharmacokinetic simulation
Source: Novo Nordisk on file (NN1436-4057) 48 people with type 2 diabetes, multiple dose, dose escalation trial
Investor presentation First quarter of 2016
• The trial evaluated short term efficacy and safety during five weeks of treatment
• LAI287 showed dose-dependent exposure and a variability comparable to that of insulin degludec
• Terminal half-life of 185 hours supporting a once-weekly dosing regimen
• LAI287 generally appeared safe and well tolerated, with most frequent adverse event being hypoglycaemia
• The side effects observed in the phase 1 trial will be further investigated
LAI287 Insulin glargine Glucose Infusion Rate (mg/kg/min)
1
3
2
5
4
0 2 4 6 5 1 3 7
Time (days)
0
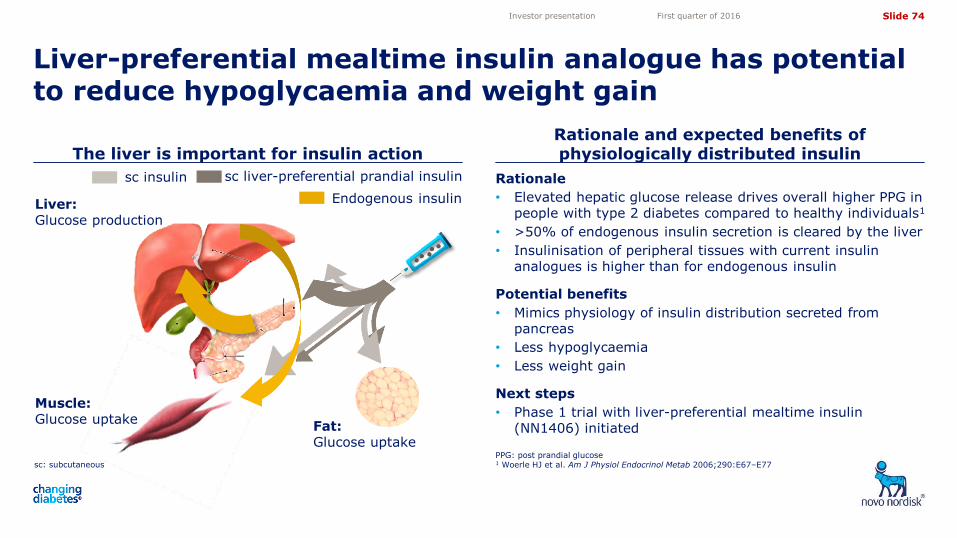
Slide 74
5,05
4,10
3,50
4,72
11,82 11,82
Rationale
• Elevated hepatic glucose release drives overall higher PPG in people with type 2 diabetes compared to healthy individuals1
• >50% of endogenous insulin secretion is cleared by the liver
• Insulinisation of peripheral tissues with current insulin analogues is higher than for endogenous insulin
Potential benefits
• Mimics physiology of insulin distribution secreted from pancreas
• Less hypoglycaemia
• Less weight gain
Next steps
• Phase 1 trial with liver-preferential mealtime insulin
(NN1406) initiated
sc: subcutaneous
The liver is important for insulin action Rationale and expected benefits of physiologically distributed insulin
Liver-preferential mealtime insulin analogue has potential to reduce hypoglycaemia and weight gain
PPG: post prandial glucose 1 Woerle HJ et al. Am J Physiol Endocrinol Metab 2006;290:E67–E77
Investor presentation First quarter of 2016
Liver: Glucose production
Muscle: Glucose uptake
Fat: Glucose uptake
sc insulin sc liver-preferential prandial insulin
Endogenous insulin
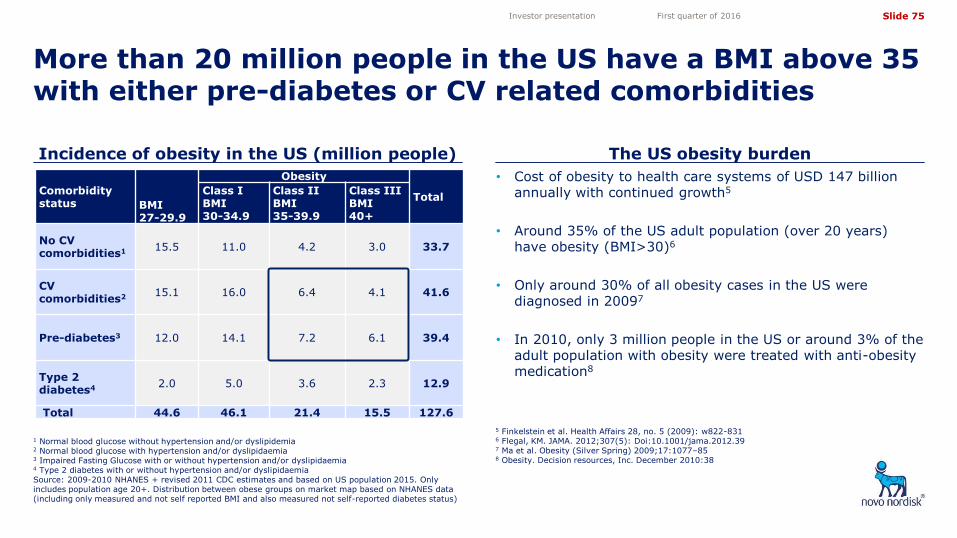
Slide 75
5,05
4,10
3,50
4,72
11,82 11,82
Comorbidity status
BMI 27-29.9
Obesity
Total Class I BMI 30-34.9
Class II BMI 35-39.9
Class III BMI 40+
No CV comorbidities1 15.5 11.0 4.2 3.0 33.7
CV comorbidities2 15.1 16.0 6.4 4.1 41.6
Pre-diabetes3 12.0 14.1 7.2 6.1 39.4
Type 2 diabetes4
2.0 5.0 3.6 2.3 12.9
Total 44.6 46.1 21.4 15.5 127.6
1 Normal blood glucose without hypertension and/or dyslipidemia 2 Normal blood glucose with hypertension and/or dyslipidaemia 3 Impaired Fasting Glucose with or without hypertension and/or dyslipidaemia 4 Type 2 diabetes with or without hypertension and/or dyslipidaemia Source: 2009-2010 NHANES + revised 2011 CDC estimates and based on US population 2015. Only includes population age 20+. Distribution between obese groups on market map based on NHANES data (including only measured and not self reported BMI and also measured not self-reported diabetes status)
Incidence of obesity in the US (million people) The US obesity burden
More than 20 million people in the US have a BMI above 35 with either pre-diabetes or CV related comorbidities
5 Finkelstein et al. Health Affairs 28, no. 5 (2009): w822-831 6 Flegal, KM. JAMA. 2012;307(5): Doi:10.1001/jama.2012.39 7 Ma et al. Obesity (Silver Spring) 2009;17:1077–85 8 Obesity. Decision resources, Inc. December 2010:38
Investor presentation First quarter of 2016
• Cost of obesity to health care systems of USD 147 billion annually with continued growth5
• Around 35% of the US adult population (over 20 years) have obesity (BMI>30)6
• Only around 30% of all obesity cases in the US were diagnosed in 20097
• In 2010, only 3 million people in the US or around 3% of the adult population with obesity were treated with anti-obesity medication8
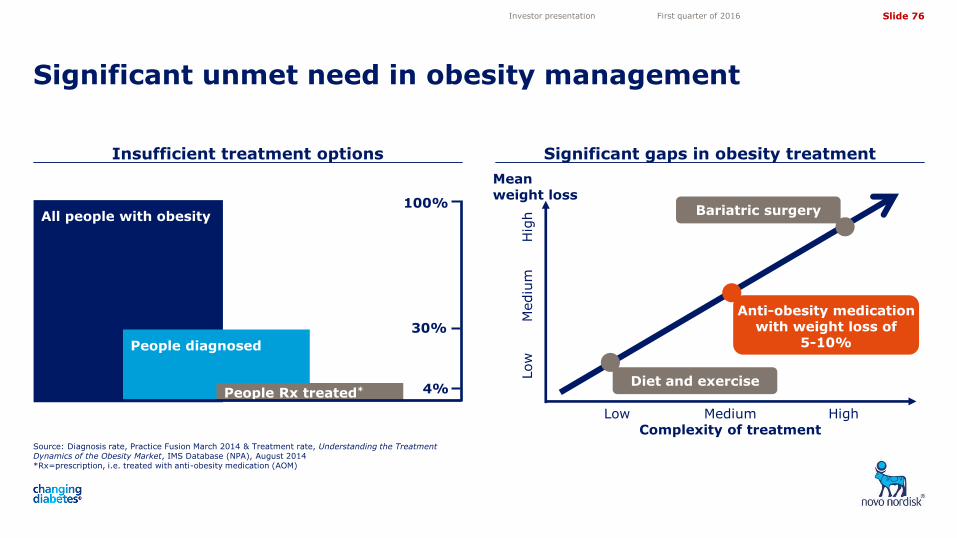
Slide 76
5,05
4,10
3,50
4,72
11,82 11,82
Insufficient treatment options Significant gaps in obesity treatment
Significant unmet need in obesity management
Source: Diagnosis rate, Practice Fusion March 2014 & Treatment rate, Understanding the Treatment Dynamics of the Obesity Market, IMS Database (NPA), August 2014 *Rx=prescription, i.e. treated with anti-obesity medication (AOM)
Investor presentation First quarter of 2016
All people with obesity
People diagnosed
People Rx treated*
100%
30%
4%
Complexity of treatment Low Medium High
Low
H
igh
Mediu
m
Anti-obesity medication with weight loss of
5-10%
Diet and exercise
Bariatric surgery
Mean weight loss
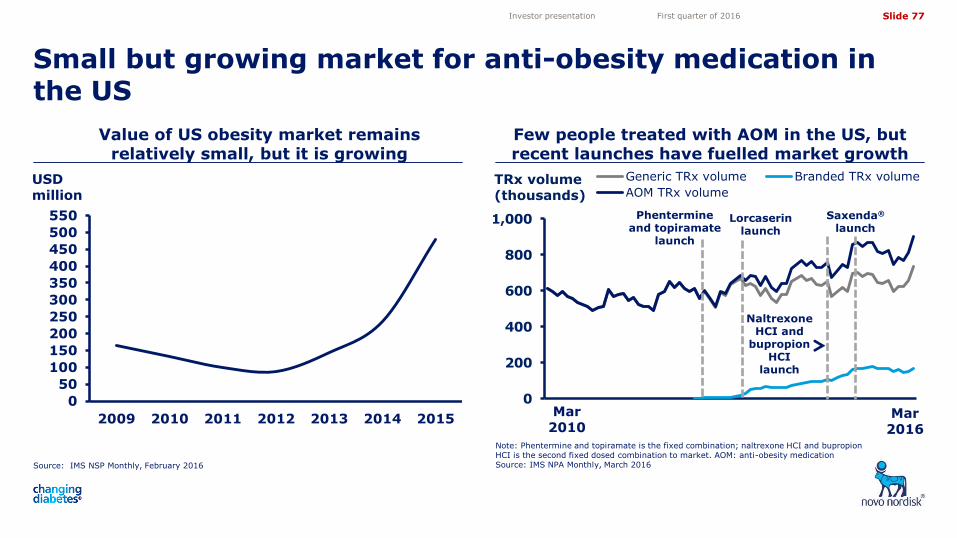
Slide 77
5,05
4,10
3,50
4,72
11,82 11,82
Small but growing market for anti-obesity medication in the US
Investor presentation First quarter of 2016
0
200
400
600
800
1,000
Generic TRx volume Branded TRx volume
AOM TRx volume
Naltrexone HCI and
bupropion HCI
launch
Value of US obesity market remains relatively small, but it is growing
Few people treated with AOM in the US, but recent launches have fuelled market growth
Source: IMS NSP Monthly, February 2016
Note: Phentermine and topiramate is the fixed combination; naltrexone HCI and bupropion HCI is the second fixed dosed combination to market. AOM: anti-obesity medication Source: IMS NPA Monthly, March 2016
TRx volume (thousands)
Phentermine and topiramate
launch
Lorcaserin
launch
USD million
Saxenda®
launch
Mar 2010
Mar 2016
0
50
100
150
200
250
300
350
400
450
500
550
2009 2010 2011 2012 2013 2014 2015
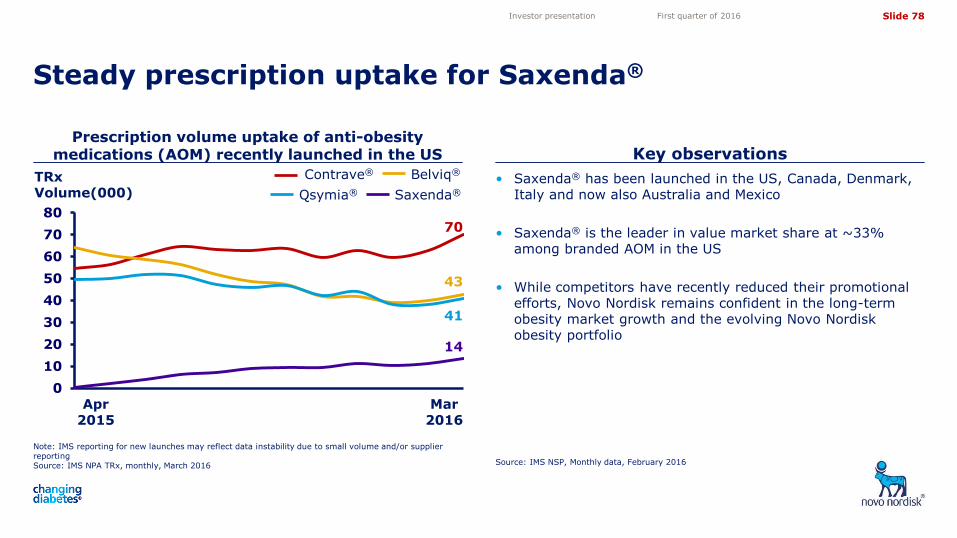
Slide 78
5,05
4,10
3,50
4,72
11,82 11,82
• Saxenda® has been launched in the US, Canada, Denmark, Italy and now also Australia and Mexico
• Saxenda® is the leader in value market share at ~33% among branded AOM in the US
• While competitors have recently reduced their promotional efforts, Novo Nordisk remains confident in the long-term obesity market growth and the evolving Novo Nordisk obesity portfolio
Note: IMS reporting for new launches may reflect data instability due to small volume and/or supplier reporting Source: IMS NPA TRx, monthly, March 2016
Prescription volume uptake of anti-obesity medications (AOM) recently launched in the US Key observations
Steady prescription uptake for Saxenda®
Source: IMS NSP, Monthly data, February 2016
Investor presentation First quarter of 2016
TRx Volume(000) Saxenda®
Belviq®
Qsymia®
Contrave®
Apr 2015
0
10
20
30
40
50
60
70
80
14
70
41
43
Mar 2016
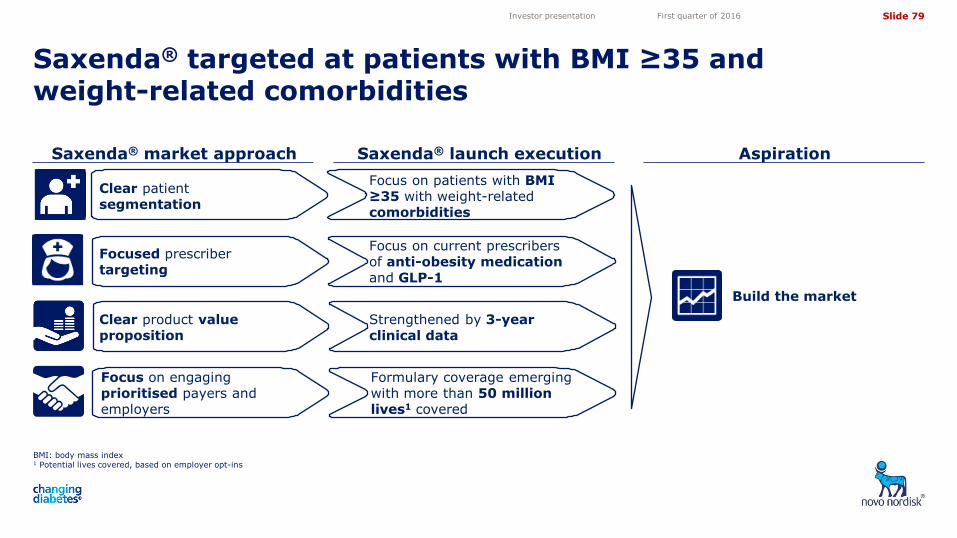
Slide 79
5,05
4,10
3,50
4,72
11,82 11,82
Saxenda® targeted at patients with BMI ≥35 and weight-related comorbidities
BMI: body mass index 1 Potential lives covered, based on employer opt-ins
Investor presentation First quarter of 2016
Aspiration Saxenda® launch execution Saxenda® market approach
Clear product value proposition
Focused prescriber targeting
Focus on engaging prioritised payers and employers
Clear patient segmentation
Build the market
Strengthened by 3-year clinical data
Focus on current prescribers of anti-obesity medication and GLP-1
Formulary coverage emerging with more than 50 million lives1 covered
Focus on patients with BMI ≥35 with weight-related comorbidities
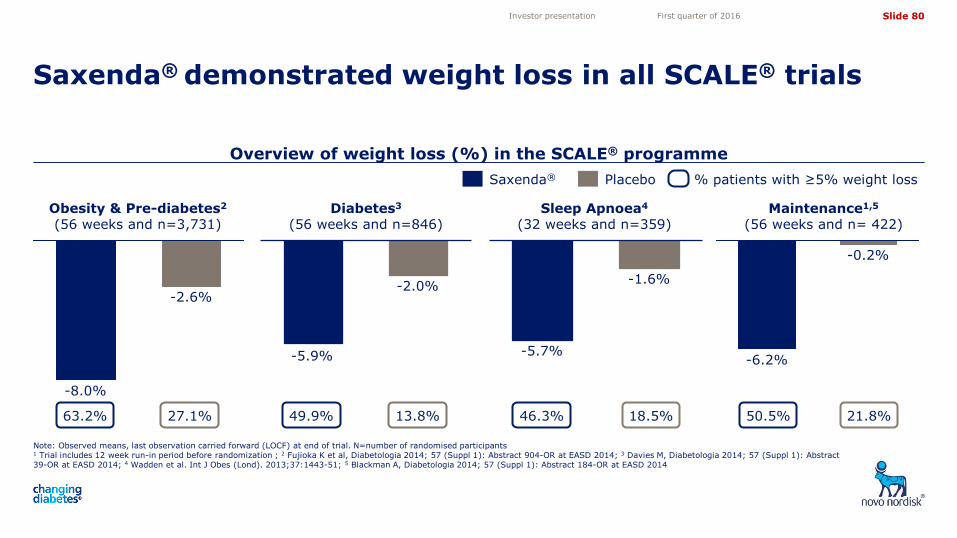
Slide 80
5,05
4,10
3,50
4,72
11,82 11,82
Overview of weight loss (%) in the SCALE® programme
Note: Observed means, last observation carried forward (LOCF) at end of trial. N=number of randomised participants
1 Trial includes 12 week run-in period before randomization ; 2 Fujioka K et al, Diabetologia 2014; 57 (Suppl 1): Abstract 904-OR at EASD 2014; 3 Davies M, Diabetologia 2014; 57 (Suppl 1): Abstract 39-OR at EASD 2014; 4 Wadden et al. Int J Obes (Lond). 2013;37:1443-51; 5 Blackman A, Diabetologia 2014; 57 (Suppl 1): Abstract 184-OR at EASD 2014
Saxenda® demonstrated weight loss in all SCALE® trials
Investor presentation First quarter of 2016
Saxenda® Placebo % patients with ≥5% weight loss
-2.0%
-5.9%
-0.2%
-6.2%
-1.6%
-5.7%
Maintenance1,5
(56 weeks and n= 422) Diabetes3
(56 weeks and n=846) Obesity & Pre-diabetes2 (56 weeks and n=3,731)
Sleep Apnoea4
(32 weeks and n=359)
-2.6%
-8.0%
63.2% 27.1% 49.9% 13.8% 50.5% 21.8% 46.3% 18.5%
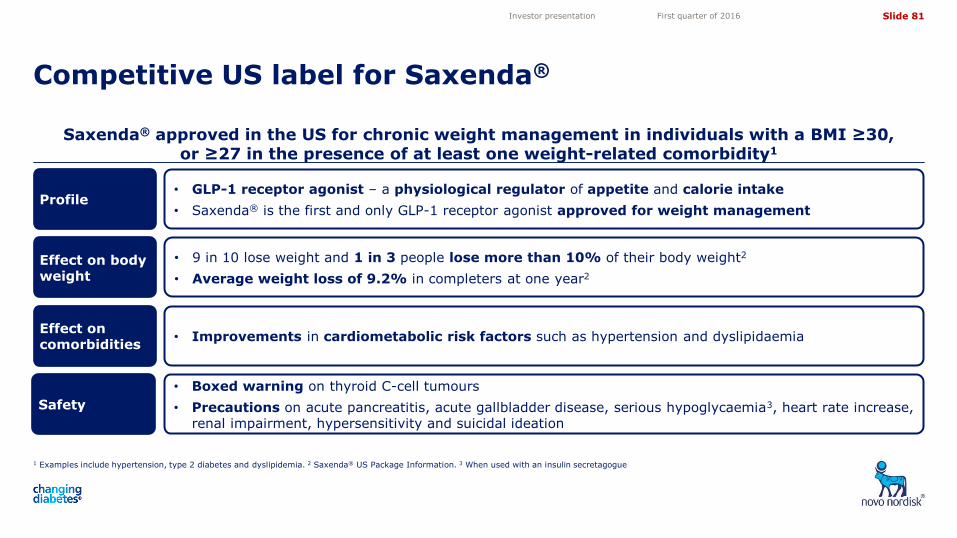
Slide 81
5,05
4,10
3,50
4,72
11,82 11,82
Saxenda® approved in the US for chronic weight management in individuals with a BMI ≥30, or ≥27 in the presence of at least one weight-related comorbidity1
1 Examples include hypertension, type 2 diabetes and dyslipidemia. 2 Saxenda® US Package Information. 3 When used with an insulin secretagogue
Competitive US label for Saxenda®
Investor presentation First quarter of 2016
• Improvements in cardiometabolic risk factors such as hypertension and dyslipidaemia
• Boxed warning on thyroid C-cell tumours
• Precautions on acute pancreatitis, acute gallbladder disease, serious hypoglycaemia3, heart rate increase, renal impairment, hypersensitivity and suicidal ideation
Profile
Safety
Effect on body weight
Effect on comorbidities
• GLP-1 receptor agonist – a physiological regulator of appetite and calorie intake
• Saxenda® is the first and only GLP-1 receptor agonist approved for weight management
• 9 in 10 lose weight and 1 in 3 people lose more than 10% of their body weight2
• Average weight loss of 9.2% in completers at one year2
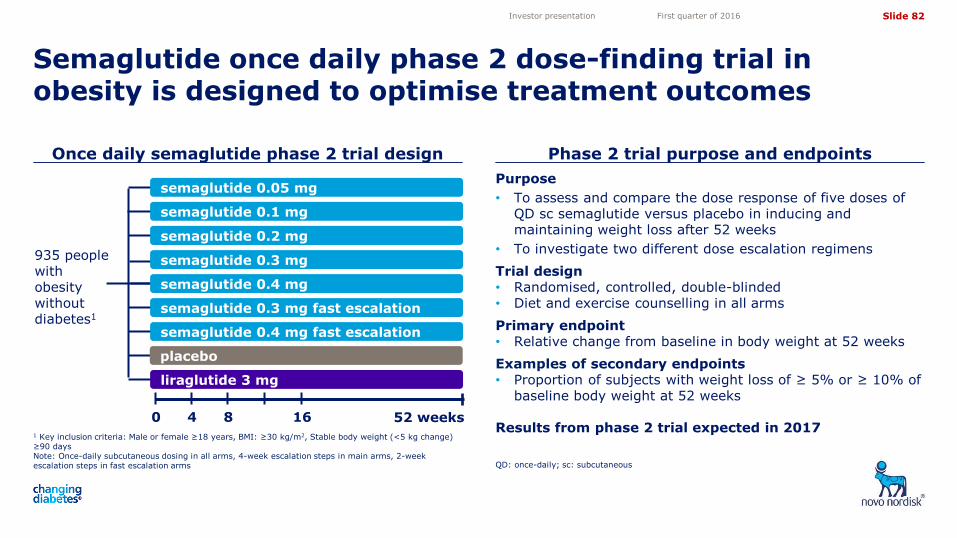
Slide 82
5,05
4,10
3,50
4,72
11,82 11,82
Purpose
• To assess and compare the dose response of five doses of QD sc semaglutide versus placebo in inducing and maintaining weight loss after 52 weeks
• To investigate two different dose escalation regimens
Trial design • Randomised, controlled, double-blinded • Diet and exercise counselling in all arms
Primary endpoint • Relative change from baseline in body weight at 52 weeks
Examples of secondary endpoints • Proportion of subjects with weight loss of ≥ 5% or ≥ 10% of
baseline body weight at 52 weeks
Results from phase 2 trial expected in 2017 1 Key inclusion criteria: Male or female ≥18 years, BMI: ≥30 kg/m2, Stable body weight (<5 kg change) ≥90 days Note: Once-daily subcutaneous dosing in all arms, 4-week escalation steps in main arms, 2-week escalation steps in fast escalation arms
Once daily semaglutide phase 2 trial design Phase 2 trial purpose and endpoints
Semaglutide once daily phase 2 dose-finding trial in obesity is designed to optimise treatment outcomes
QD: once-daily; sc: subcutaneous
Investor presentation First quarter of 2016
liraglutide 3 mg
0 52 weeks
935 people with obesity without diabetes1
semaglutide 0.05 mg
semaglutide 0.1 mg
semaglutide 0.2 mg
semaglutide 0.3 mg
semaglutide 0.4 mg
semaglutide 0.3 mg fast escalation
semaglutide 0.4 mg fast escalation
4 8 16
placebo
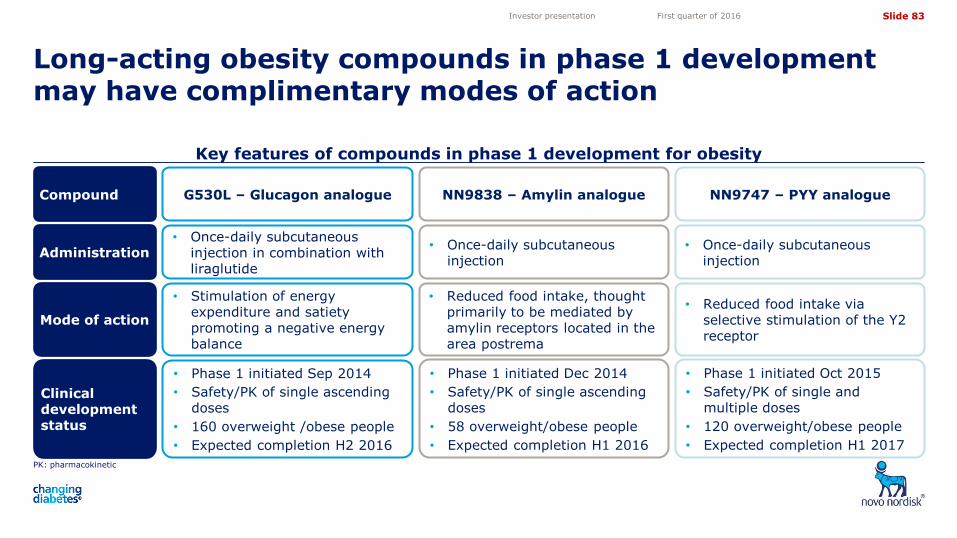
Slide 83
5,05
4,10
3,50
4,72
11,82 11,82
Key features of compounds in phase 1 development for obesity
PK: pharmacokinetic
Long-acting obesity compounds in phase 1 development may have complimentary modes of action
Investor presentation First quarter of 2016
Clinical development status
Administration
Compound
Mode of action
• Phase 1 initiated Dec 2014
• Safety/PK of single ascending doses
• 58 overweight/obese people
• Expected completion H1 2016
• Once-daily subcutaneous injection
NN9838 – Amylin analogue
• Reduced food intake, thought primarily to be mediated by amylin receptors located in the area postrema
• Phase 1 initiated Sep 2014
• Safety/PK of single ascending doses
• 160 overweight /obese people
• Expected completion H2 2016
• Once-daily subcutaneous injection in combination with liraglutide
G530L – Glucagon analogue
• Stimulation of energy expenditure and satiety promoting a negative energy balance
• Phase 1 initiated Oct 2015
• Safety/PK of single and multiple doses
• 120 overweight/obese people
• Expected completion H1 2017
• Once-daily subcutaneous injection
NN9747 – PYY analogue
• Reduced food intake via selective stimulation of the Y2 receptor
Slide 84
5,05
4,10
3,50
4,72
11,82 11,82
Biopharmaceuticals
Investor presentation First quarter of 2016
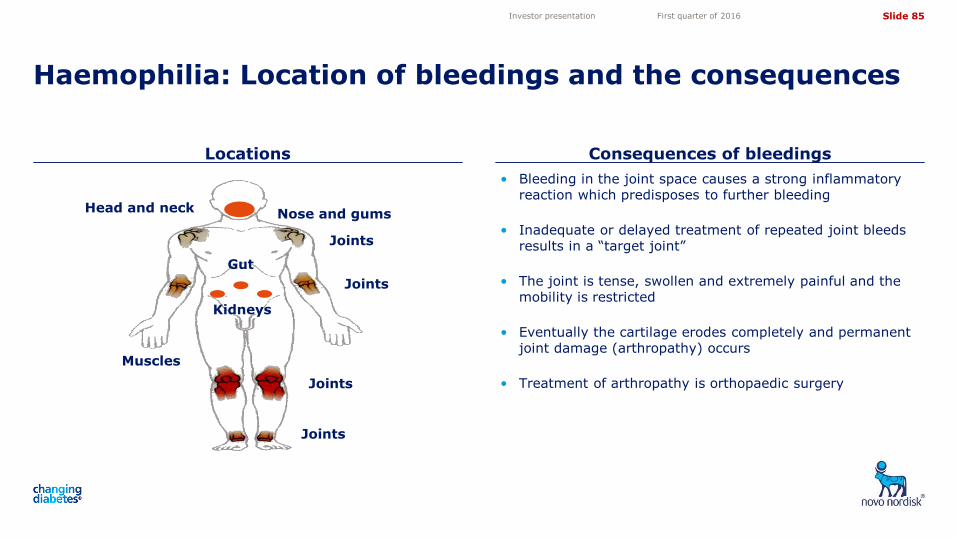
Slide 85
5,05
4,10
3,50
4,72
11,82 11,82
Locations Consequences of bleedings
Haemophilia: Location of bleedings and the consequences
Investor presentation First quarter of 2016
• Bleeding in the joint space causes a strong inflammatory reaction which predisposes to further bleeding
• Inadequate or delayed treatment of repeated joint bleeds results in a “target joint”
• The joint is tense, swollen and extremely painful and the mobility is restricted
• Eventually the cartilage erodes completely and permanent joint damage (arthropathy) occurs
• Treatment of arthropathy is orthopaedic surgery
Nose and gums
Joints
Gut
Kidneys
Head and neck
Joints
Joints
Muscles
Joints
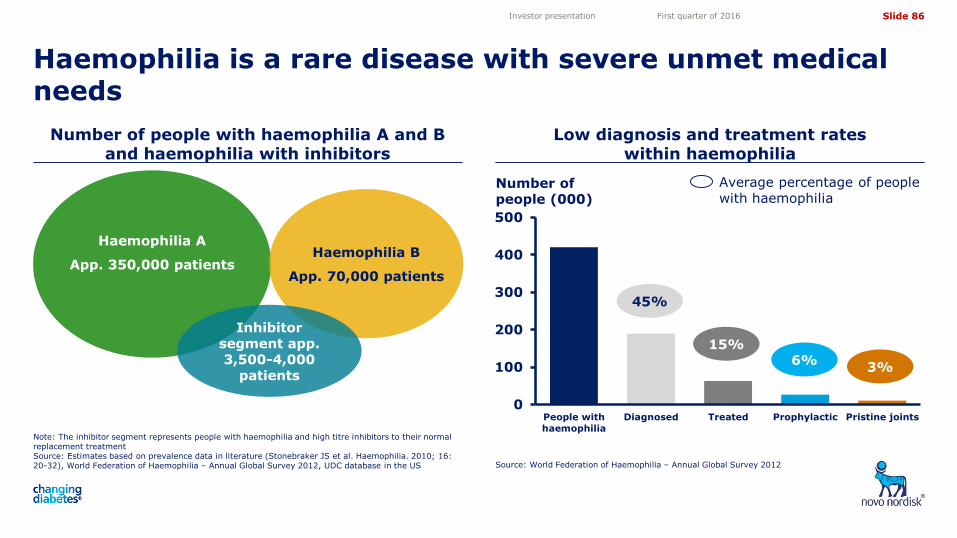
Slide 86
5,05
4,10
3,50
4,72
11,82 11,82
Number of people with haemophilia A and B and haemophilia with inhibitors
Low diagnosis and treatment rates within haemophilia
Haemophilia is a rare disease with severe unmet medical needs
Note: The inhibitor segment represents people with haemophilia and high titre inhibitors to their normal replacement treatment Source: Estimates based on prevalence data in literature (Stonebraker JS et al. Haemophilia. 2010; 16: 20-32), World Federation of Haemophilia – Annual Global Survey 2012, UDC database in the US Source: World Federation of Haemophilia – Annual Global Survey 2012
Investor presentation First quarter of 2016
Haemophilia A
App. 350,000 patients
Haemophilia B
App. 70,000 patients
Inhibitor segment app. 3,500-4,000
patients
Average percentage of people with haemophilia
0
100
200
300
400
500
People with
haemophilia
Diagnosed Treated Prophylactic Pristine joints
45%
15%
3% 6%
Number of people (000)
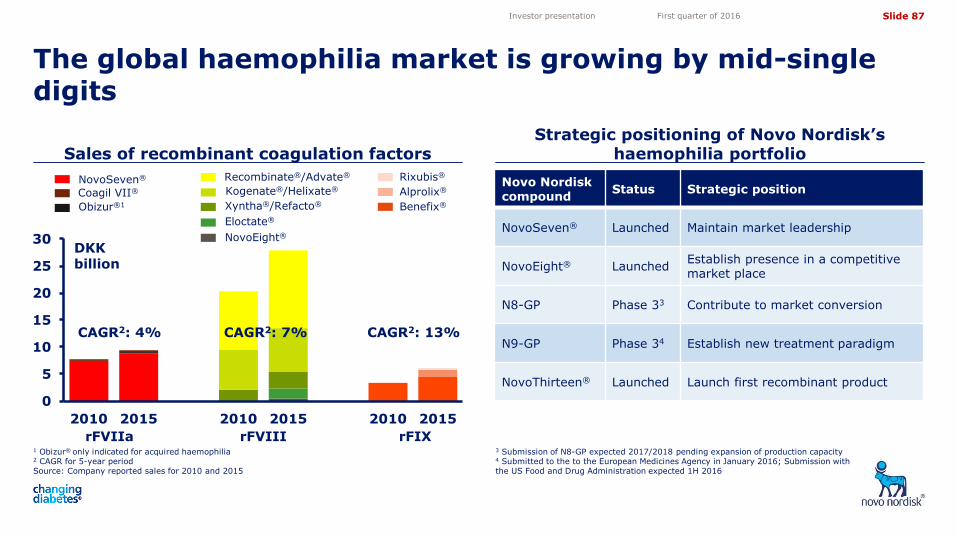
Slide 87
5,05
4,10
3,50
4,72
11,82 11,82
Novo Nordisk compound
Status Strategic position
NovoSeven® Launched Maintain market leadership
NovoEight® Launched Establish presence in a competitive market place
N8-GP Phase 33 Contribute to market conversion
N9-GP Phase 34 Establish new treatment paradigm
NovoThirteen® Launched Launch first recombinant product
Sales of recombinant coagulation factors Strategic positioning of Novo Nordisk’s
haemophilia portfolio
The global haemophilia market is growing by mid-single digits
1 Obizur® only indicated for acquired haemophilia 2 CAGR for 5-year period Source: Company reported sales for 2010 and 2015
3 Submission of N8-GP expected 2017/2018 pending expansion of production capacity 4 Submitted to the to the European Medicines Agency in January 2016; Submission with the US Food and Drug Administration expected 1H 2016
Investor presentation First quarter of 2016
0
5
10
15
20
25
30
2010 2015 2010 2015 2010 2015
DKK billion
rFVIIa rFVIII rFIX
CAGR2: 4% CAGR2: 7% CAGR2: 13%
Xyntha®/Refacto®
NovoSeven®
Kogenate®/Helixate®
Recombinate®/Advate®
Coagil VII®
Rixubis®
Obizur®1
Eloctate®
NovoEight®
Alprolix®
Benefix®
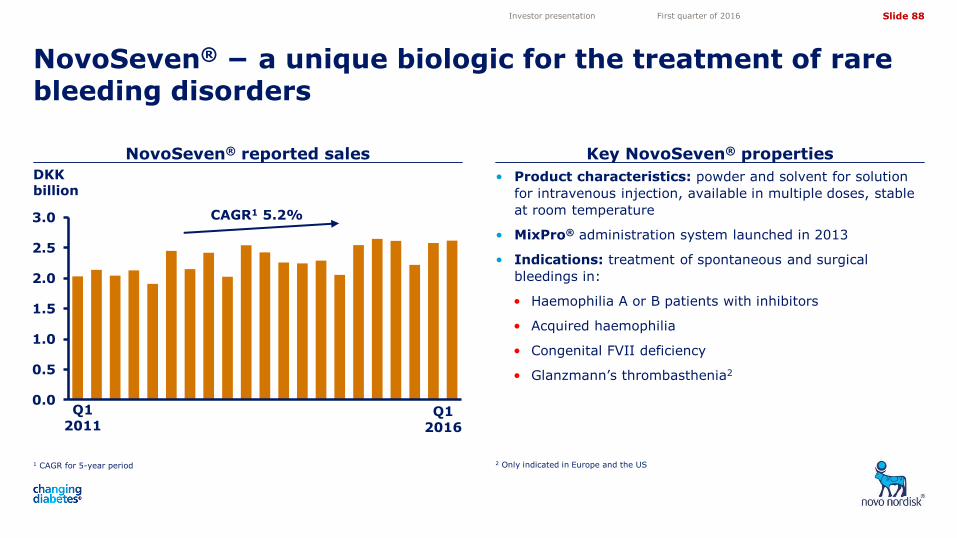
Slide 88
5,05
4,10
3,50
4,72
11,82 11,82
0.0
0.5
1.0
1.5
2.0
2.5
3.0
1 CAGR for 5-year period
NovoSeven® reported sales Key NovoSeven® properties
NovoSeven® − a unique biologic for the treatment of rare bleeding disorders
2 Only indicated in Europe and the US
Investor presentation First quarter of 2016
• Product characteristics: powder and solvent for solution
for intravenous injection, available in multiple doses, stable
at room temperature
• MixPro® administration system launched in 2013
• Indications: treatment of spontaneous and surgical
bleedings in:
• Haemophilia A or B patients with inhibitors
• Acquired haemophilia
• Congenital FVII deficiency
• Glanzmann’s thrombasthenia2
Q1 2011
Q1 2016
DKK billion
CAGR1 5.2%
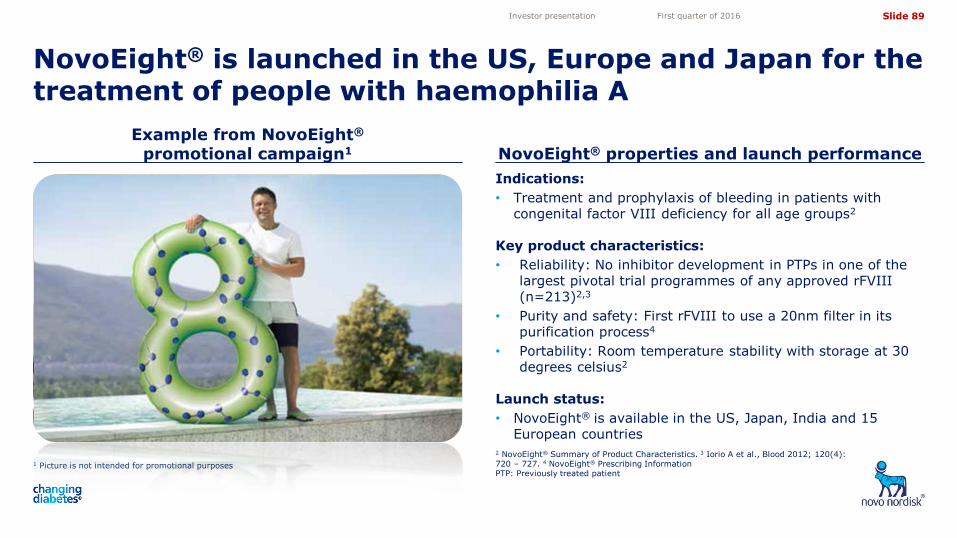
Slide 89
5,05
4,10
3,50
4,72
11,82 11,82
Indications:
• Treatment and prophylaxis of bleeding in patients with congenital factor VIII deficiency for all age groups2
Key product characteristics:
• Reliability: No inhibitor development in PTPs in one of the largest pivotal trial programmes of any approved rFVIII (n=213)2,3
• Purity and safety: First rFVIII to use a 20nm filter in its purification process4
• Portability: Room temperature stability with storage at 30 degrees celsius2
Launch status:
• NovoEight® is available in the US, Japan, India and 15 European countries
1 Picture is not intended for promotional purposes
Example from NovoEight® promotional campaign1 NovoEight® properties and launch performance
NovoEight® is launched in the US, Europe and Japan for the treatment of people with haemophilia A
2 NovoEight® Summary of Product Characteristics. 3 Iorio A et al., Blood 2012; 120(4): 720 – 727. 4 NovoEight® Prescribing Information PTP: Previously treated patient
Investor presentation First quarter of 2016
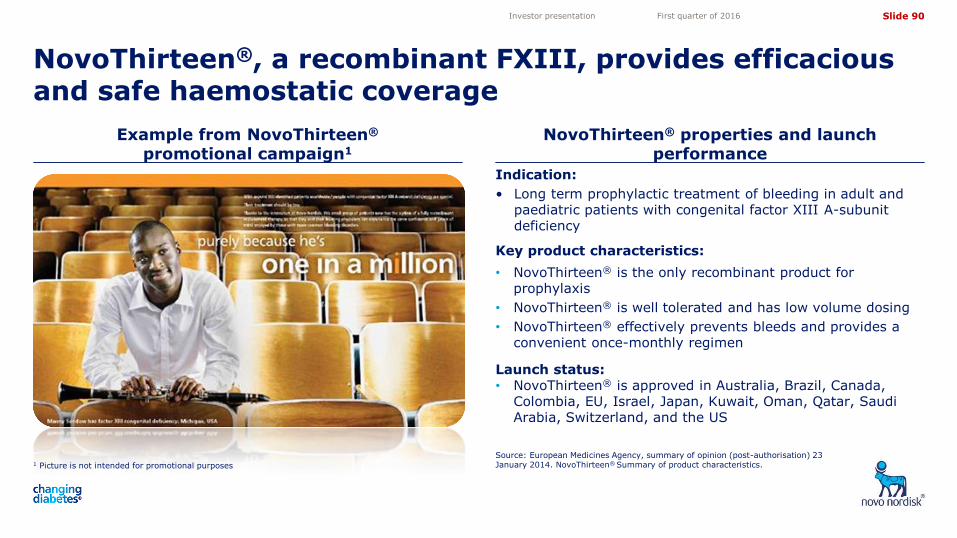
Slide 90
5,05
4,10
3,50
4,72
11,82 11,82
1 Picture is not intended for promotional purposes
Example from NovoThirteen® promotional campaign1
NovoThirteen® properties and launch performance
NovoThirteen®, a recombinant FXIII, provides efficacious and safe haemostatic coverage
Source: European Medicines Agency, summary of opinion (post-authorisation) 23 January 2014. NovoThirteen® Summary of product characteristics.
Investor presentation First quarter of 2016
Indication:
• Long term prophylactic treatment of bleeding in adult and paediatric patients with congenital factor XIII A-subunit deficiency
Key product characteristics:
• NovoThirteen® is the only recombinant product for prophylaxis
• NovoThirteen® is well tolerated and has low volume dosing
• NovoThirteen® effectively prevents bleeds and provides a convenient once-monthly regimen
Launch status: • NovoThirteen® is approved in Australia, Brazil, Canada,
Colombia, EU, Israel, Japan, Kuwait, Oman, Qatar, Saudi Arabia, Switzerland, and the US
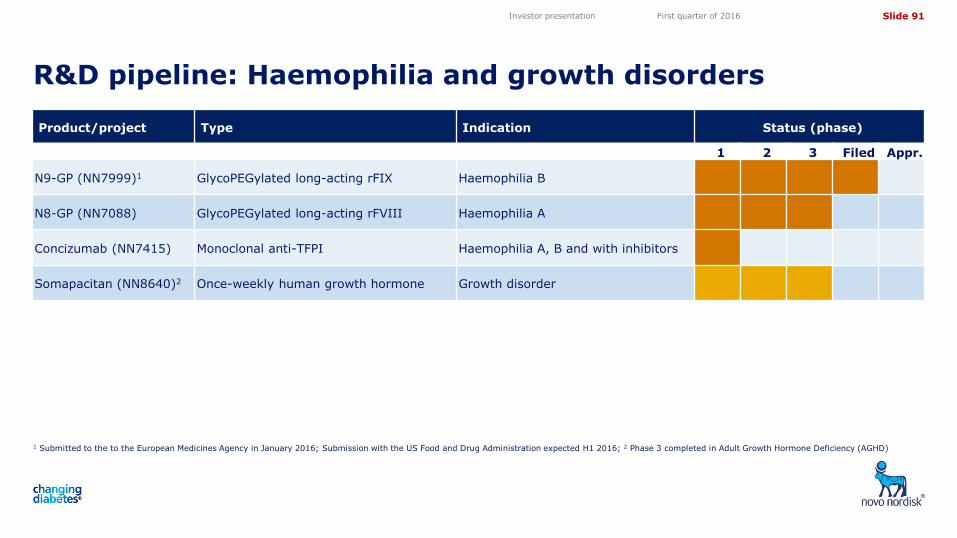
Slide 91
5,05
4,10
3,50
4,72
11,82 11,82
R&D pipeline: Haemophilia and growth disorders
1 Submitted to the to the European Medicines Agency in January 2016; Submission with the US Food and Drug Administration expected H1 2016; 2 Phase 3 completed in Adult Growth Hormone Deficiency (AGHD)
Investor presentation First quarter of 2016
Product/project Type Indication Status (phase)
1 2 3 Filed Appr.
N9-GP (NN7999)1 GlycoPEGylated long-acting rFIX Haemophilia B
N8-GP (NN7088) GlycoPEGylated long-acting rFVIII Haemophilia A
Concizumab (NN7415) Monoclonal anti-TFPI Haemophilia A, B and with inhibitors
Somapacitan (NN8640)2 Once-weekly human growth hormone Growth disorder
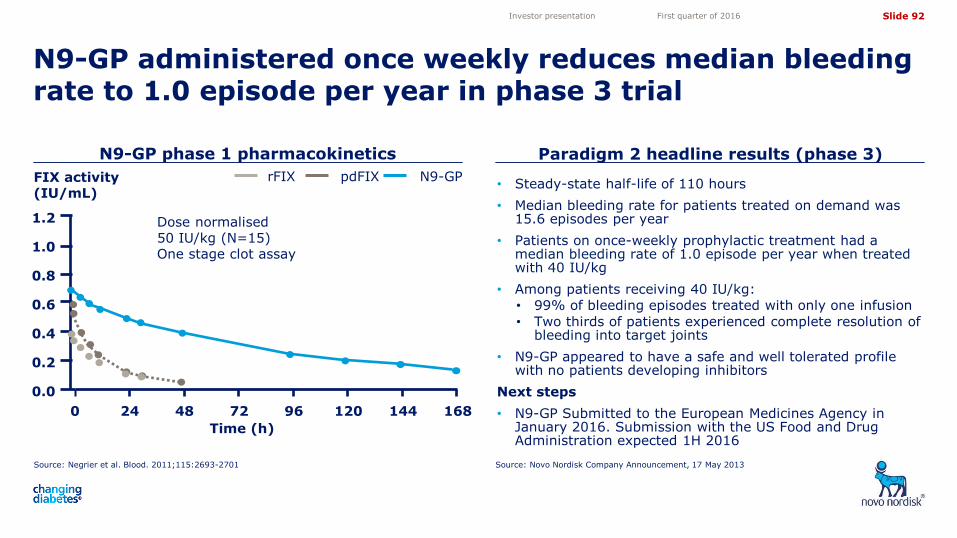
Slide 92
5,05
4,10
3,50
4,72
11,82 11,82
N9-GP phase 1 pharmacokinetics
Source: Novo Nordisk Company Announcement, 17 May 2013
N9-GP administered once weekly reduces median bleeding rate to 1.0 episode per year in phase 3 trial
Investor presentation First quarter of 2016
• Steady-state half-life of 110 hours
• Median bleeding rate for patients treated on demand was 15.6 episodes per year
• Patients on once-weekly prophylactic treatment had a median bleeding rate of 1.0 episode per year when treated with 40 IU/kg
• Among patients receiving 40 IU/kg:
• 99% of bleeding episodes treated with only one infusion
• Two thirds of patients experienced complete resolution of bleeding into target joints
• N9-GP appeared to have a safe and well tolerated profile with no patients developing inhibitors
Next steps
• N9-GP Submitted to the European Medicines Agency in January 2016. Submission with the US Food and Drug Administration expected 1H 2016
Dose normalised 50 IU/kg (N=15) One stage clot assay
FIX activity (IU/mL)
N9-GP pdFIX rFIX
1.2
1.0
0.8
0.6
0.4
0.2
0.0
168 0 24 48 72 96 120 144
Time (h)
Source: Negrier et al. Blood. 2011;115:2693-2701
Paradigm 2 headline results (phase 3)
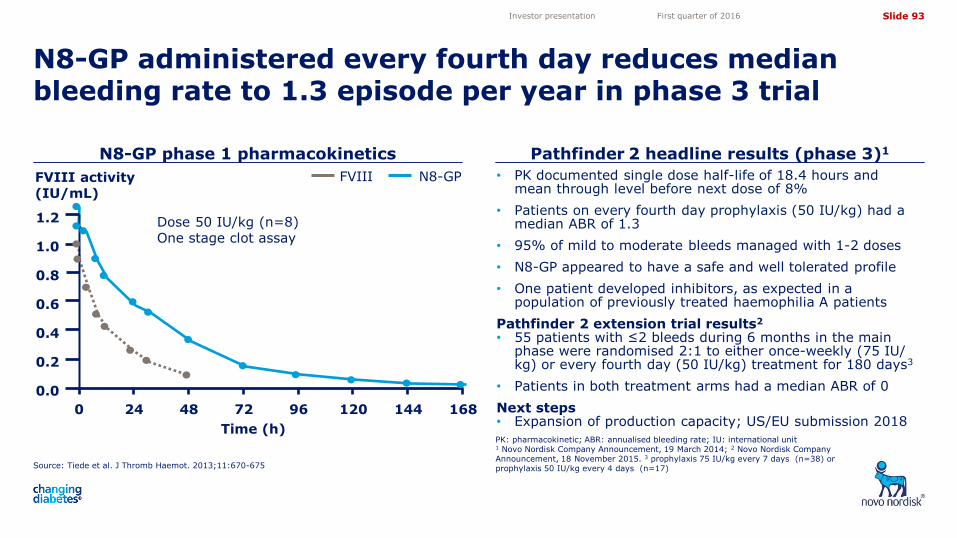
Slide 93
5,05
4,10
3,50
4,72
11,82 11,82
N8-GP
Source: Tiede et al. J Thromb Haemot. 2013;11:670-675
N8-GP phase 1 pharmacokinetics Pathfinder 2 headline results (phase 3)1
N8-GP administered every fourth day reduces median bleeding rate to 1.3 episode per year in phase 3 trial
PK: pharmacokinetic; ABR: annualised bleeding rate; IU: international unit 1 Novo Nordisk Company Announcement, 19 March 2014; 2 Novo Nordisk Company Announcement, 18 November 2015. 3 prophylaxis 75 IU/kg every 7 days (n=38) or prophylaxis 50 IU/kg every 4 days (n=17)
Investor presentation First quarter of 2016
FVIII activity (IU/mL)
FVIII
Dose 50 IU/kg (n=8) One stage clot assay
168
1.2
1.0
0.8
0.6
0.4
0.2
0.0
0 24 48 72 96 120 144
Time (h)
• PK documented single dose half-life of 18.4 hours and mean through level before next dose of 8%
• Patients on every fourth day prophylaxis (50 IU/kg) had a median ABR of 1.3
• 95% of mild to moderate bleeds managed with 1-2 doses
• N8-GP appeared to have a safe and well tolerated profile
• One patient developed inhibitors, as expected in a population of previously treated haemophilia A patients
Pathfinder 2 extension trial results2
• 55 patients with ≤2 bleeds during 6 months in the main phase were randomised 2:1 to either once-weekly (75 IU/ kg) or every fourth day (50 IU/kg) treatment for 180 days3
• Patients in both treatment arms had a median ABR of 0
Next steps • Expansion of production capacity; US/EU submission 2018
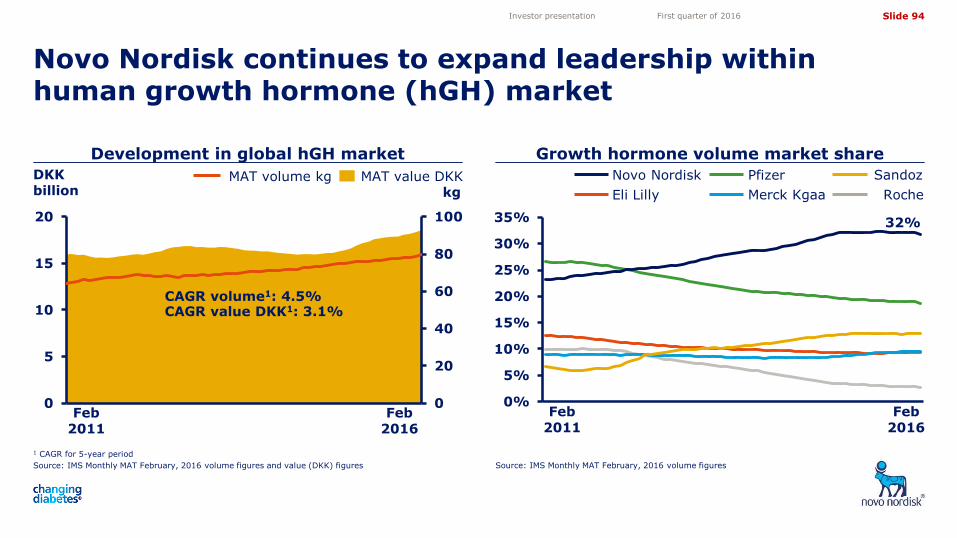
Slide 94
5,05
4,10
3,50
4,72
11,82 11,82
Development in global hGH market Growth hormone volume market share
Novo Nordisk continues to expand leadership within human growth hormone (hGH) market
1 CAGR for 5-year period
Source: IMS Monthly MAT February, 2016 volume figures and value (DKK) figures Source: IMS Monthly MAT February, 2016 volume figures
Investor presentation First quarter of 2016
Feb 2011
Feb 2016
32%
0%
5%
10%
15%
20%
25%
30%
35%
Sandoz
Roche Eli Lilly
Novo Nordisk Pfizer
Merck Kgaa
0
20
40
60
80
100
0
5
10
15
20
Thousands
Feb 2011
Feb 2016
CAGR volume1: 4.5% CAGR value DKK1: 3.1%
MAT value DKK MAT volume kg kg
DKK billion
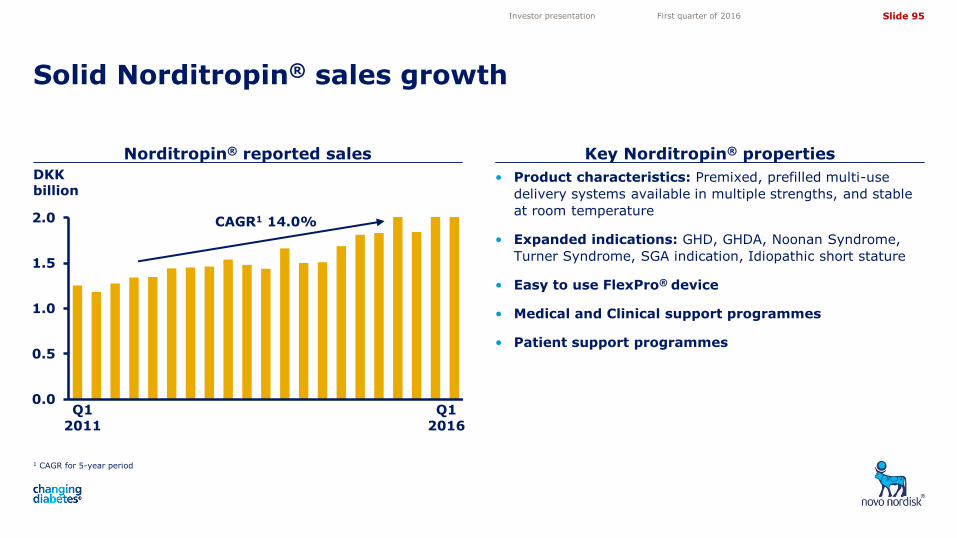
Slide 95
5,05
4,10
3,50
4,72
11,82 11,82
0.0
0.5
1.0
1.5
2.0
Norditropin® reported sales Key Norditropin® properties
Solid Norditropin® sales growth
1 CAGR for 5-year period
Investor presentation First quarter of 2016
CAGR1 14.0%
• Product characteristics: Premixed, prefilled multi-use
delivery systems available in multiple strengths, and stable
at room temperature
• Expanded indications: GHD, GHDA, Noonan Syndrome,
Turner Syndrome, SGA indication, Idiopathic short stature
• Easy to use FlexPro® device
• Medical and Clinical support programmes
• Patient support programmes
DKK billion
Q1 2011
Q1 2016
Slide 96
5,05
4,10
3,50
4,72
11,82 11,82
Financials
Investor presentation First quarter of 2016
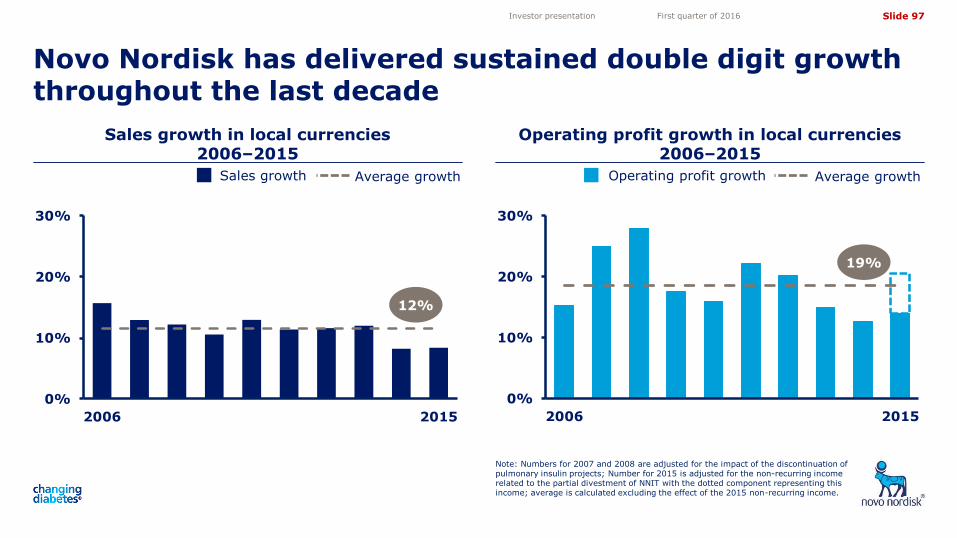
Slide 97
5,05
4,10
3,50
4,72
11,82 11,82
0%
10%
20%
30%
2006 2015
0%
10%
20%
30%
2006 2015
Sales growth in local currencies 2006–2015
Operating profit growth in local currencies 2006–2015
Novo Nordisk has delivered sustained double digit growth throughout the last decade
Note: Numbers for 2007 and 2008 are adjusted for the impact of the discontinuation of pulmonary insulin projects; Number for 2015 is adjusted for the non-recurring income related to the partial divestment of NNIT with the dotted component representing this income; average is calculated excluding the effect of the 2015 non-recurring income.
Investor presentation First quarter of 2016
12%
Sales growth Average growth Operating profit growth Average growth
19%
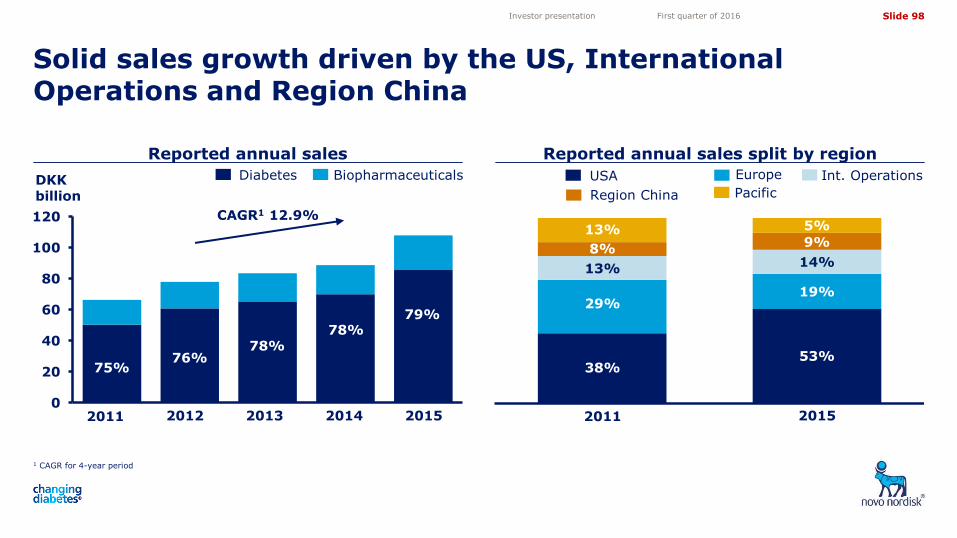
Slide 98
5,05
4,10
3,50
4,72
11,82 11,82
Reported annual sales Reported annual sales split by region
Solid sales growth driven by the US, International Operations and Region China
1 CAGR for 4-year period
Investor presentation First quarter of 2016
Europe USA Int. Operations
Pacific Region China
Biopharmaceuticals Diabetes
0
20
40
60
80
100
120
1 2 3 4 5
Th
ou
san
ds
2011 2012 2013 2014 2015
CAGR1 12.9%
75% 76%
78% 78%
79%
2011 2015
38%
29%
53%
19%
14%
5%
13%
13% 9%
DKK billion
8%
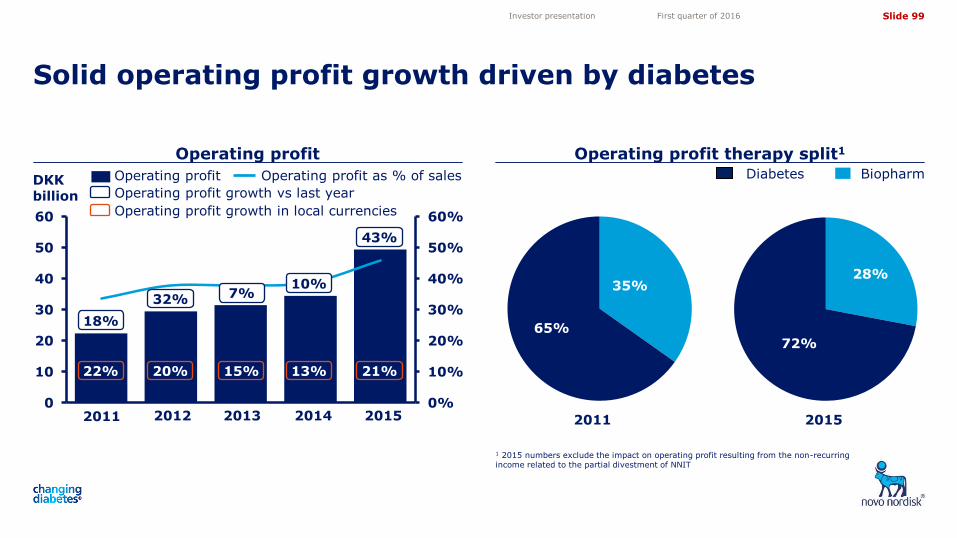
Slide 99
5,05
4,10
3,50
4,72
11,82 11,82
0%
10%
20%
30%
40%
50%
60%
0
10
20
30
40
50
60
1 2 3 4 5
Operating profit Operating profit therapy split1
Solid operating profit growth driven by diabetes
1 2015 numbers exclude the impact on operating profit resulting from the non-recurring income related to the partial divestment of NNIT
Investor presentation First quarter of 2016
Diabetes Biopharm
2011 2015
28%
72% 65%
35%
18%
32% 10%
7%
Operating profit growth vs last year
Operating profit as % of sales Operating profit
2011 2012 2013 2014 2015
Operating profit growth in local currencies
22% 20% 15% 13%
DKK billion
21%
43%
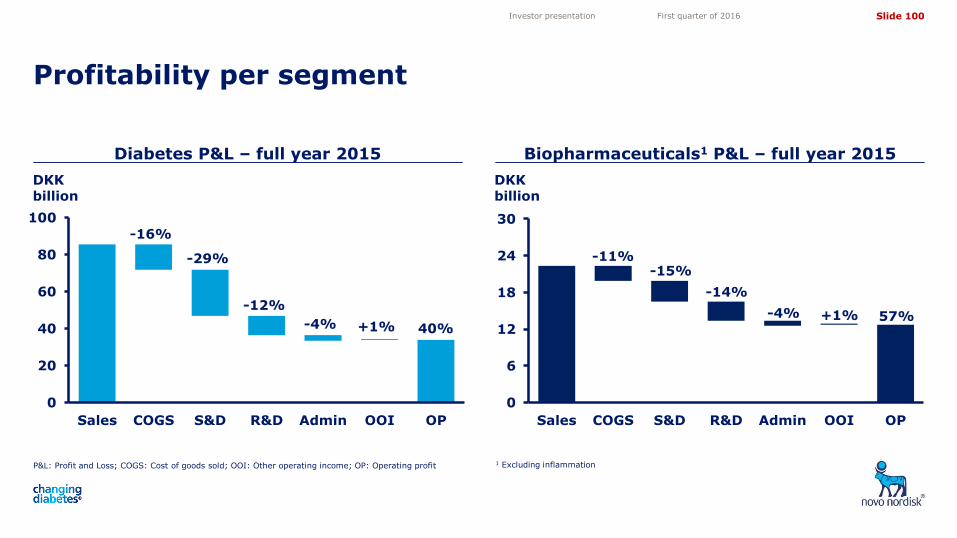
Slide 100
5,05
4,10
3,50
4,72
11,82 11,82
Diabetes P&L – full year 2015 Biopharmaceuticals1 P&L – full year 2015
Profitability per segment
P&L: Profit and Loss; COGS: Cost of goods sold; OOI: Other operating income; OP: Operating profit 1 Excluding inflammation
Investor presentation First quarter of 2016
0
20
40
60
80
100
Sales COGS S&D R&D Admin OOI OP
-16%
-29%
-12%
-4% 40% +1%
0
6
12
18
24
30
Sales COGS S&D R&D Admin OOI OP
-11% -15%
-14%
-4% 57% +1%
DKK billion
DKK billion
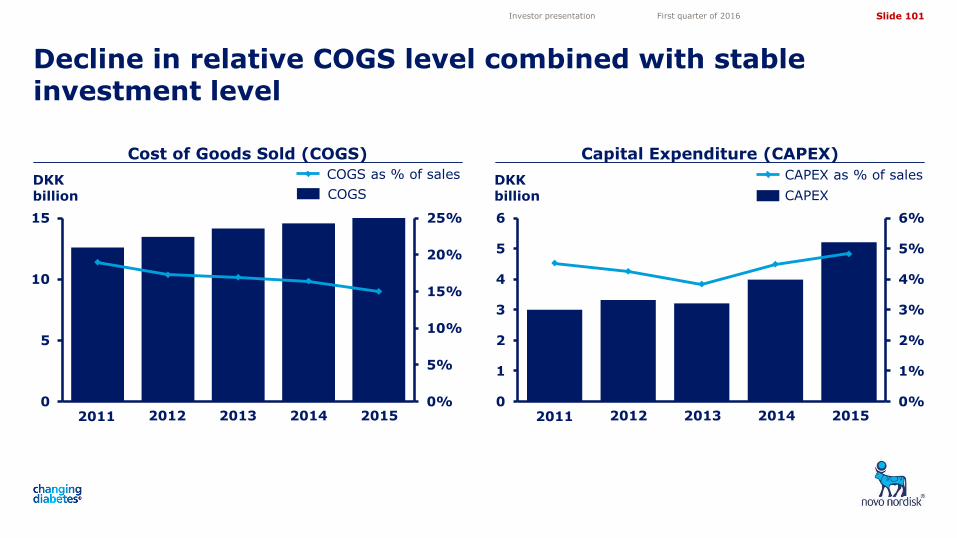
Slide 101
5,05
4,10
3,50
4,72
11,82 11,82
0%
5%
10%
15%
20%
25%
0
5
10
15
Th
ou
san
ds
Cost of Goods Sold (COGS) Capital Expenditure (CAPEX)
Decline in relative COGS level combined with stable investment level
Investor presentation First quarter of 2016
2011 2012 2013 2014 2015 0%
1%
2%
3%
4%
5%
6%
0
1
2
3
4
5
6
1 2 3 4 52011 2012 2013 2014 2015
COGS as % of sales CAPEX as % of sales
COGS CAPEX DKK billion
DKK billion
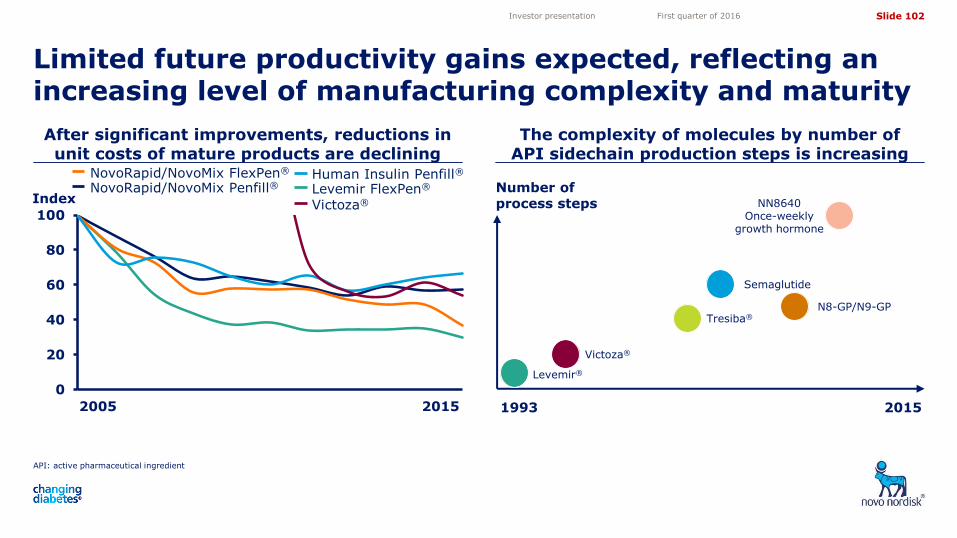
Slide 102
5,05
4,10
3,50
4,72
11,82 11,82
API: active pharmaceutical ingredient
After significant improvements, reductions in unit costs of mature products are declining
The complexity of molecules by number of API sidechain production steps is increasing
Limited future productivity gains expected, reflecting an increasing level of manufacturing complexity and maturity
Investor presentation First quarter of 2016
0
20
40
60
80
100
Index Levemir FlexPen® Human Insulin Penfill®
NovoRapid/NovoMix Penfill® NovoRapid/NovoMix FlexPen®
2005 2015
Victoza®
Number of process steps
Levemir®
Victoza®
Tresiba®
Semaglutide
N8-GP/N9-GP
NN8640 Once-weekly
growth hormone
1993 2015
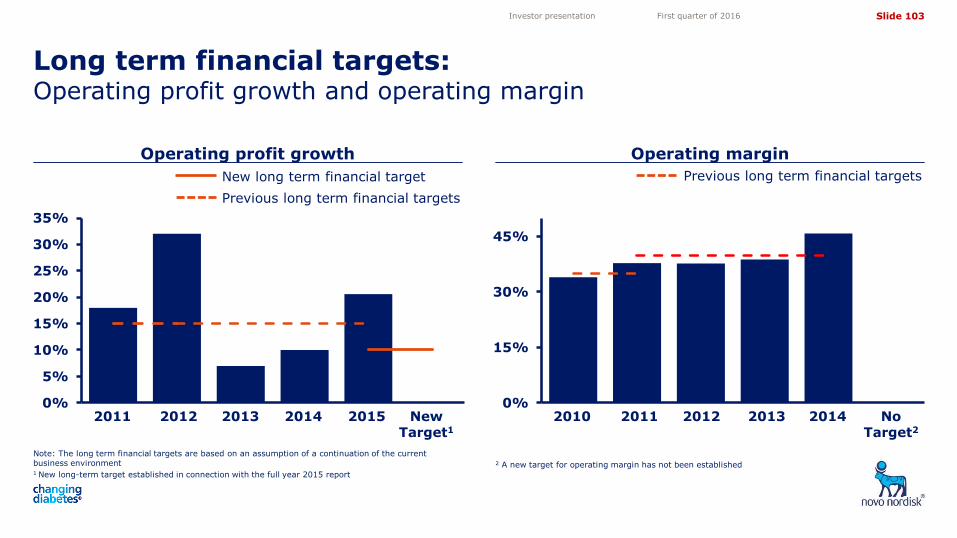
Slide 103
5,05
4,10
3,50
4,72
11,82 11,82
0%
5%
10%
15%
20%
25%
30%
35%
Operating profit growth Operating margin
Long term financial targets: Operating profit growth and operating margin
Note: The long term financial targets are based on an assumption of a continuation of the current business environment 1 New long-term target established in connection with the full year 2015 report
2 A new target for operating margin has not been established
Investor presentation First quarter of 2016
Previous long term financial targets New long term financial target
Previous long term financial targets
2011 2012 2013 2014 2015 0%
15%
30%
45%
2010 2011 2012 2013 2014 New Target1
No Target2
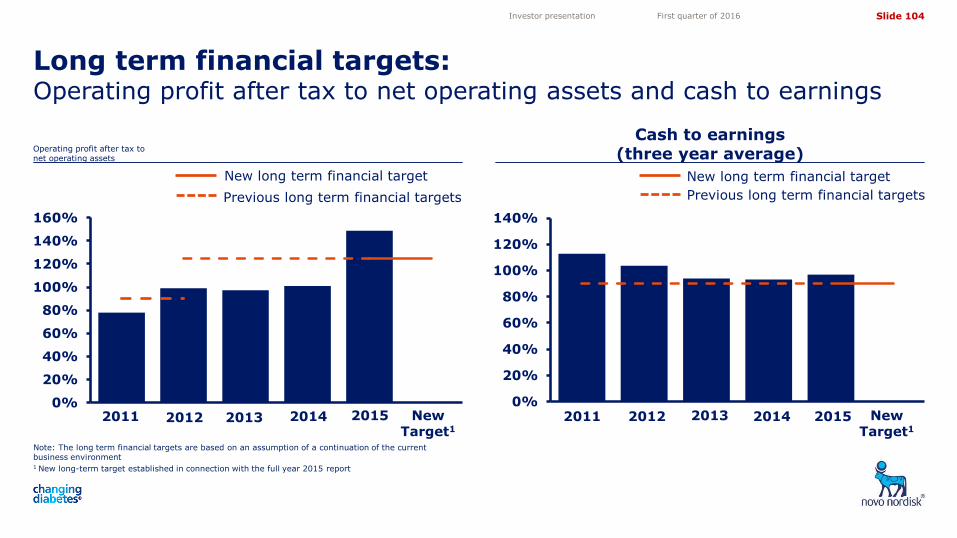
Slide 104
5,05
4,10
3,50
4,72
11,82 11,82
Cash to earnings (three year average)
Long term financial targets: Operating profit after tax to net operating assets and cash to earnings
Operating profit after tax to net operating assets
Investor presentation First quarter of 2016
0%
20%
40%
60%
80%
100%
120%
140%
160%
0%
20%
40%
60%
80%
100%
120%
140%
New long term financial target
Previous long term financial targets
New long term financial target
Previous long term financial targets
2011 2012 2013 2014 2015 2011 2012 2013 2014 2015 New Target1
New Target1
Note: The long term financial targets are based on an assumption of a continuation of the current business environment 1 New long-term target established in connection with the full year 2015 report
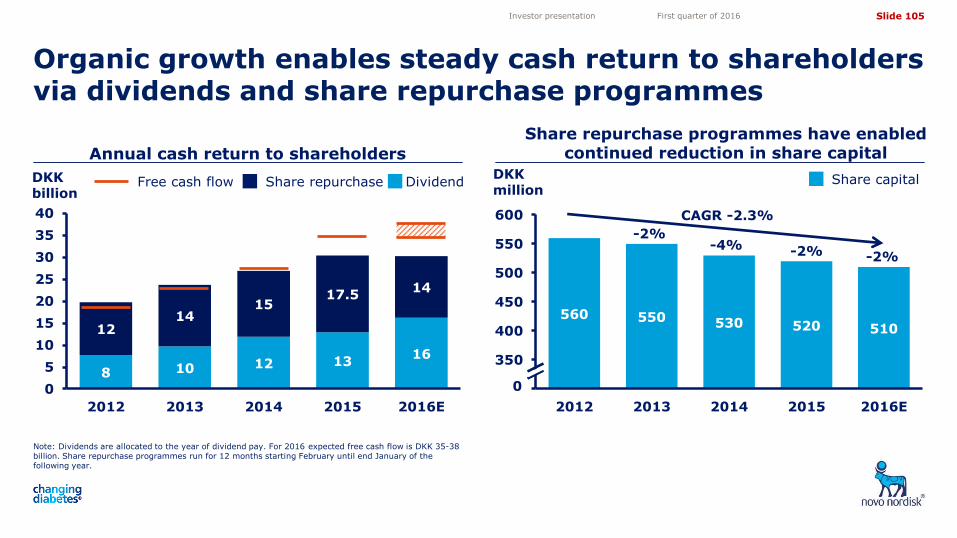
Slide 105
5,05
4,10
3,50
4,72
11,82 11,82
8 10 12 13 16
12 14
15 17.5
14
0
5
10
15
20
25
30
35
40
2012 2013 2014 2015 2016E
Annual cash return to shareholders
Organic growth enables steady cash return to shareholders via dividends and share repurchase programmes
Note: Dividends are allocated to the year of dividend pay. For 2016 expected free cash flow is DKK 35-38 billion. Share repurchase programmes run for 12 months starting February until end January of the following year.
Investor presentation First quarter of 2016
DKK billion
Share repurchase Dividend Free cash flow
Share repurchase programmes have enabled continued reduction in share capital
560 550 530 520 510
300
350
400
450
500
550
600
2012 2013 2014 2015 2016E
DKK million
0
Share capital
CAGR -2.3%
-2%
-4% -2%
-2%
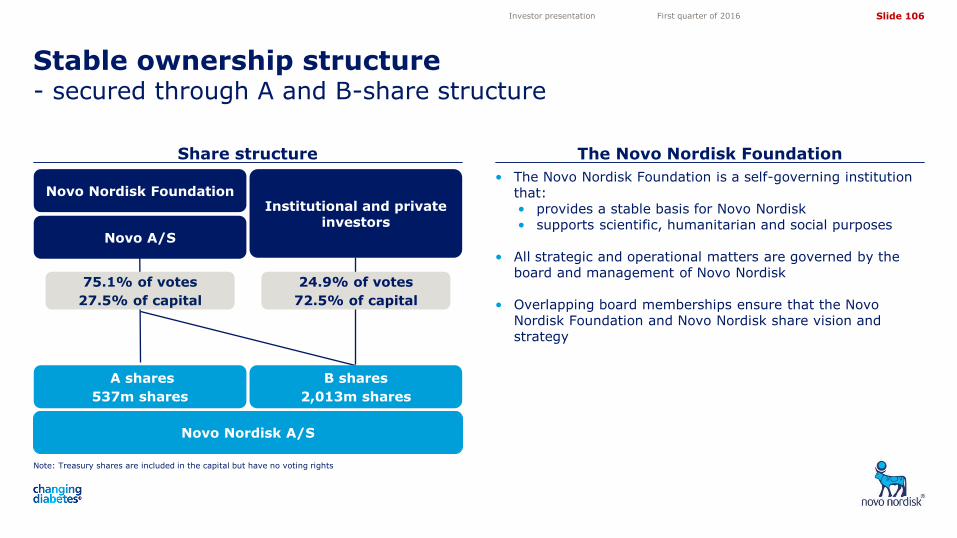
Slide 106
5,05
4,10
3,50
4,72
11,82 11,82
Note: Treasury shares are included in the capital but have no voting rights
Share structure The Novo Nordisk Foundation
Stable ownership structure - secured through A and B-share structure
Investor presentation First quarter of 2016
• The Novo Nordisk Foundation is a self-governing institution that: • provides a stable basis for Novo Nordisk • supports scientific, humanitarian and social purposes
• All strategic and operational matters are governed by the board and management of Novo Nordisk
• Overlapping board memberships ensure that the Novo Nordisk Foundation and Novo Nordisk share vision and strategy
Novo Nordisk A/S
Novo Nordisk Foundation Institutional and private
investors Novo A/S
A shares
537m shares
B shares
2,013m shares
75.1% of votes
27.5% of capital
24.9% of votes
72.5% of capital
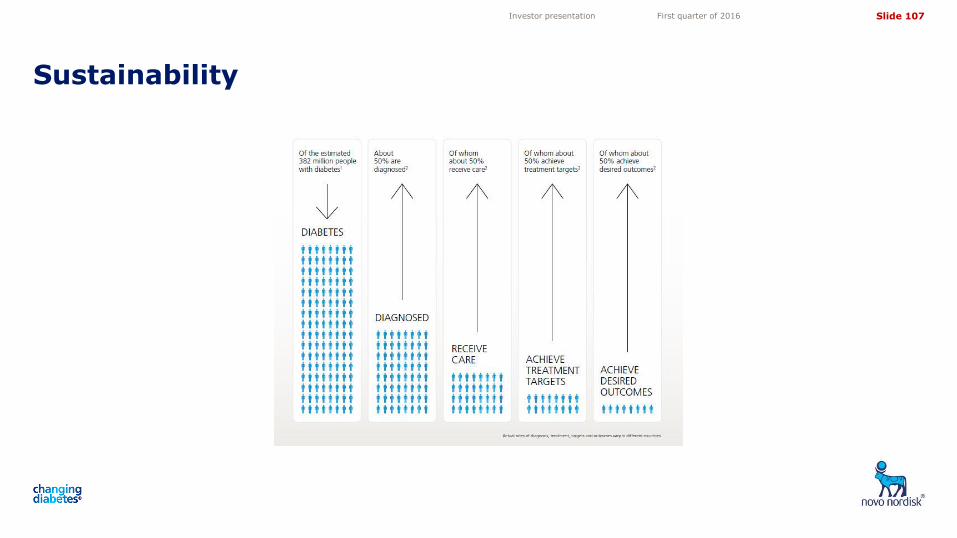
Slide 107
5,05
4,10
3,50
4,72
11,82 11,82
Sustainability
Investor presentation First quarter of 2016
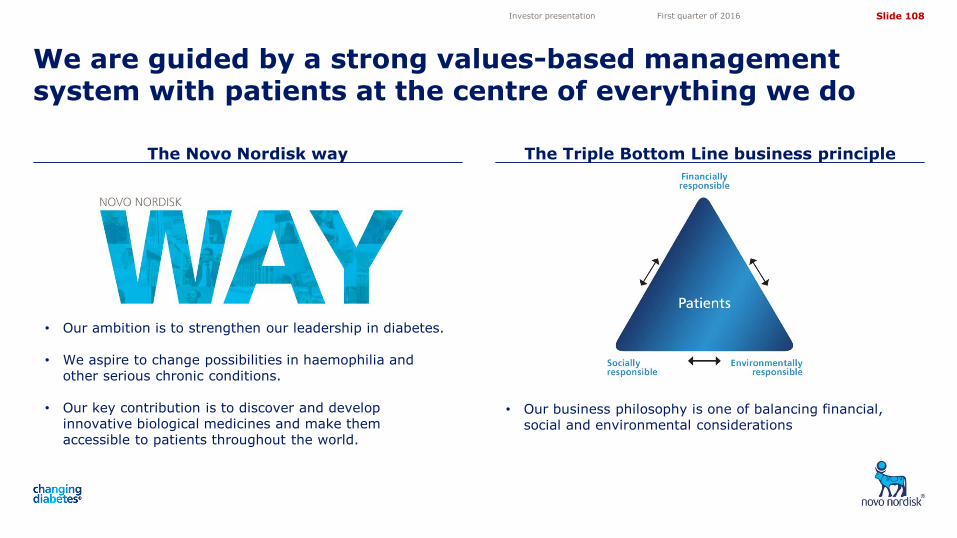
Slide 108
5,05
4,10
3,50
4,72
11,82 11,82
The Novo Nordisk way The Triple Bottom Line business principle
We are guided by a strong values-based management system with patients at the centre of everything we do
Investor presentation First quarter of 2016
• Our ambition is to strengthen our leadership in diabetes.
• We aspire to change possibilities in haemophilia and other serious chronic conditions.
• Our key contribution is to discover and develop innovative biological medicines and make them accessible to patients throughout the world.
• Our business philosophy is one of balancing financial, social and environmental considerations
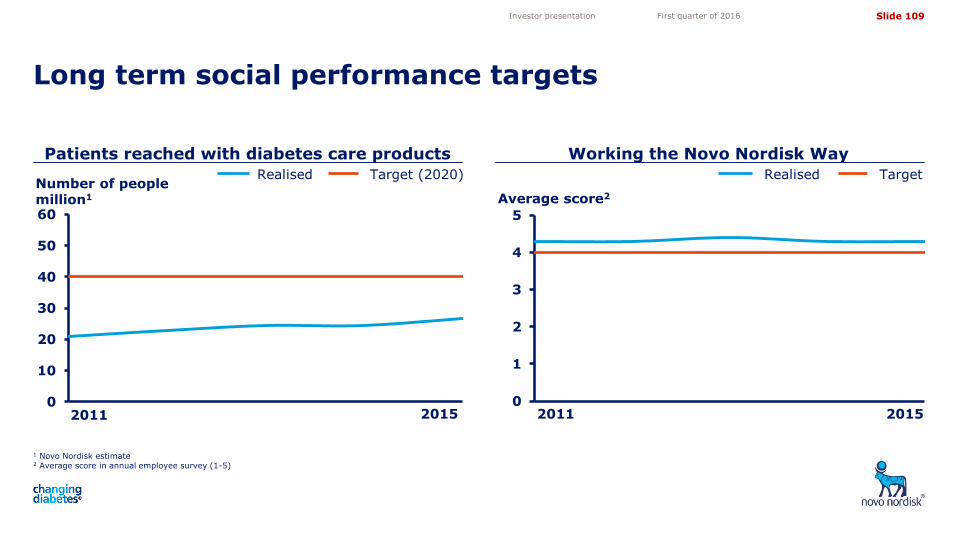
Slide 109
5,05
4,10
3,50
4,72
11,82 11,82
Patients reached with diabetes care products
Long term social performance targets
Investor presentation First quarter of 2016
Realised Target (2020) Realised Target Number of people million1 Average score2
0
1
2
3
4
5
0
10
20
30
40
50
60
2011 2015 2011 2015
1 Novo Nordisk estimate 2 Average score in annual employee survey (1-5)
Working the Novo Nordisk Way
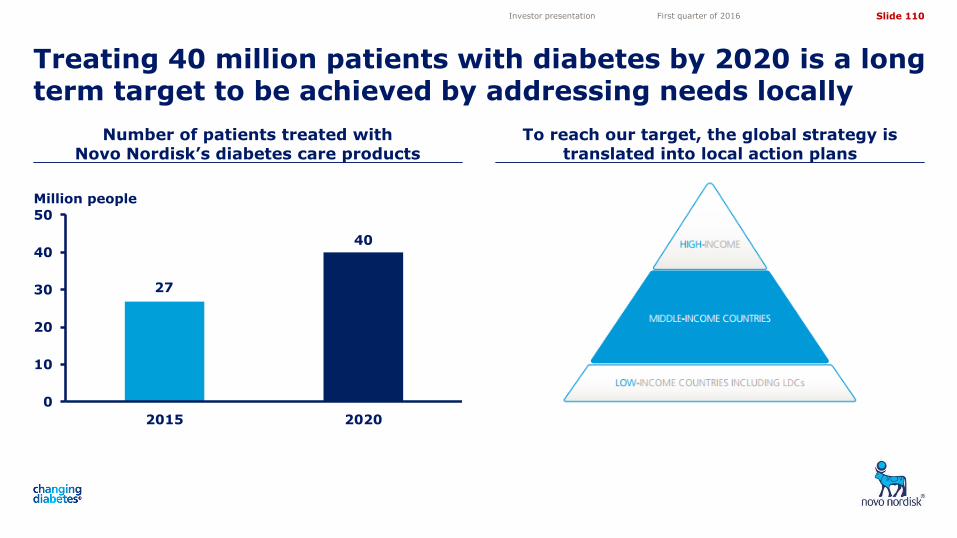
Slide 110
5,05
4,10
3,50
4,72
11,82 11,82
Number of patients treated with Novo Nordisk’s diabetes care products
To reach our target, the global strategy is translated into local action plans
Treating 40 million patients with diabetes by 2020 is a long term target to be achieved by addressing needs locally
Investor presentation First quarter of 2016
0
10
20
30
40
50
2015 2020
27
40
Million people
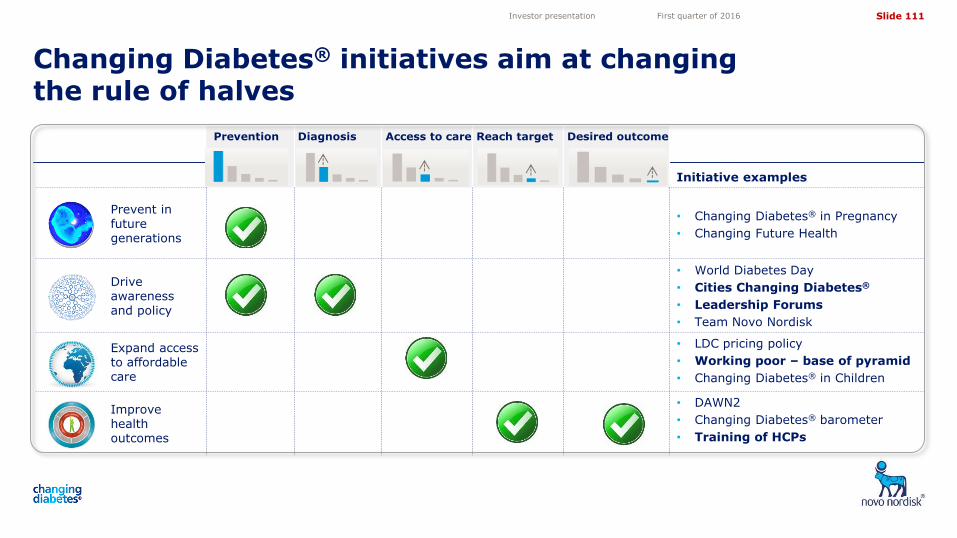
Slide 111
5,05
4,10
3,50
4,72
11,82 11,82
Changing Diabetes® initiatives aim at changing the rule of halves
Investor presentation First quarter of 2016
Prevention
Diagnosis Access to care Reach target Desired outcome
Initiative examples
Prevent in future generations
• Changing Diabetes® in Pregnancy
• Changing Future Health
Drive awareness and policy
• World Diabetes Day
• Cities Changing Diabetes®
• Leadership Forums
• Team Novo Nordisk
Expand access to affordable care
• LDC pricing policy
• Working poor – base of pyramid
• Changing Diabetes® in Children
Improve health outcomes
• DAWN2
• Changing Diabetes® barometer
• Training of HCPs
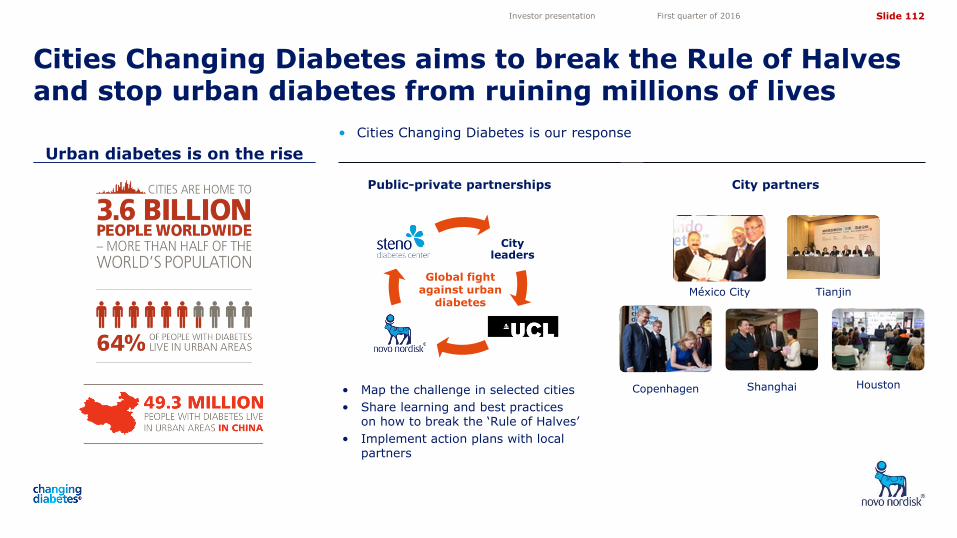
Slide 112
5,05
4,10
3,50
4,72
11,82 11,82
Urban diabetes is on the rise
• Cities Changing Diabetes is our response
Investor presentation First quarter of 2016
City leaders
University College London
Steno Diabetes Center
Public-private partnerships
Global fight against urban
diabetes
• Map the challenge in selected cities
• Share learning and best practices on how to break the ‘Rule of Halves’
• Implement action plans with local partners
City partners
México City
Copenhagen Houston
Tianjin
Shanghai
Cities Changing Diabetes aims to break the Rule of Halves and stop urban diabetes from ruining millions of lives
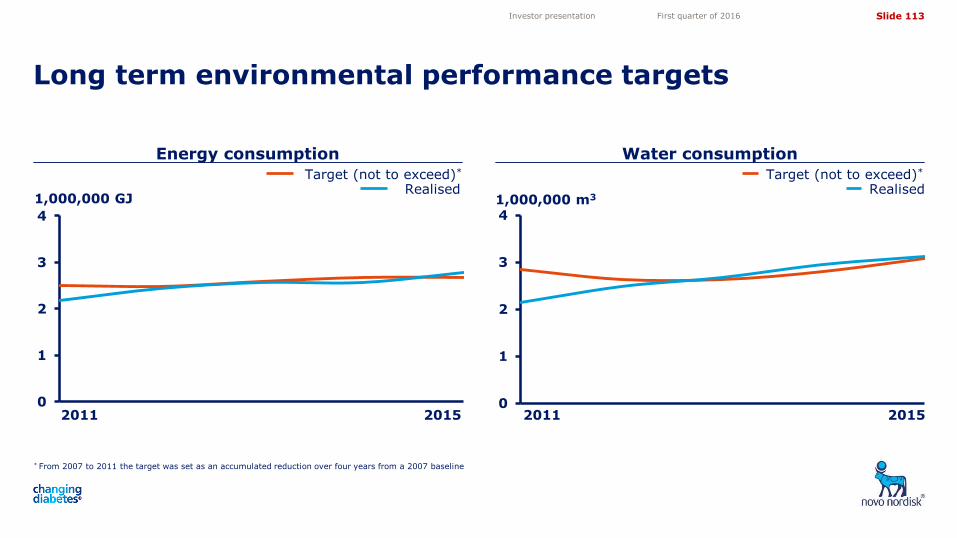
Slide 113
5,05
4,10
3,50
4,72
11,82 11,82
0
1
2
3
4
1,000,000 GJ
Energy consumption Water consumption
Long term environmental performance targets
Investor presentation First quarter of 2016
Realised Target (not to exceed)*
Realised Target (not to exceed)*
* From 2007 to 2011 the target was set as an accumulated reduction over four years from a 2007 baseline
0
1
2
3
41,000,000 m3
2011 2015 2011 2015