investor meetings february/march 2018 meetings february/march 2018 this presentation is made as of...
TRANSCRIPT
15 YEARS OF CONSISTENT PERFORMANCE
Investor Meetings
February/March 2018

This presentation is made as of the date hereof and contains “forward-looking statements” as defined in Rule 3b-6 of the Securities Exchange Act of
1934, Rule 175 of the Securities Act of 1933, and relevant legal decisions. The forward-looking statements are subject to risks and uncertainties. All
forward-looking statements should be considered in the context of the risk and other factors detailed from time to time in CMS Energy’s and Consumers
Energy’s Securities and Exchange Commission filings. Forward-looking statements should be read in conjunction with the “FORWARD-LOOKING
STATEMENTS AND INFORMATION” and “RISK FACTORS” sections of CMS Energy’s and Consumers Energy’s most recent Form 10-K and as updated
in reports CMS Energy and Consumers Energy file with the Securities and Exchange Commission. CMS Energy’s and Consumers Energy’s
“FORWARD-LOOKING STATEMENTS AND INFORMATION” and “RISK FACTORS” sections are incorporated herein by reference and discuss important
factors that could cause CMS Energy’s and Consumers Energy’s results to differ materially from those anticipated in such statements. CMS Energy and
Consumers Energy undertake no obligation to update any of the information presented herein to reflect facts, events or circumstances after the date
hereof.
This presentation also includes non-GAAP measures when describing CMS Energy’s results of operations and financial performance. A reconciliation of
each of these measures to the most directly comparable GAAP measure is included in the appendix and posted on our website at www.cmsenergy.com.
CMS Energy provides historical financial results on both a reported (GAAP) and adjusted (non-GAAP) basis and provides forward-looking guidance on
an adjusted basis. During an oral presentation, references to “earnings” are on an adjusted basis. All references to earnings per share are on a diluted
basis. Adjustments could include items such as discontinued operations, asset sales, impairments, restructuring costs, regulatory items from prior years,
or other items. Management views adjusted earnings as a key measure of the company’s present operating financial performance and uses adjusted
earnings for external communications with analysts and investors. Internally, the company uses adjusted earnings to measure and assess performance.
Because the company is not able to estimate the impact of specific line items, which have the potential to significantly impact, favorably or unfavorably,
the company's reported earnings in future periods, the company is not providing reported earnings guidance nor is it providing a reconciliation for the
comparable future period earnings. The adjusted earnings should be considered supplemental information to assist in understanding our business
results, rather than as a substitute for the reported earnings. Similarly, management views the ratio of Funds From Operations (FFO)/Average Debt as a
key measure of the company’s operating financial performance and its financial position, and uses the ratio for external communications with analysts
and investors. Because the company does not establish its target FFO/Average Debt ratio based on a specific target numerator and target denominator,
the company is unable to provide a reconciliation to a comparable GAAP financial measure for future periods.
Investors and others should note that CMS Energy routinely posts important information on its website and considers the Investor Relations section,
www.cmsenergy.com/investor-relations, a channel of distribution.
1

Overview
CMS Energy
(NYSE: CMS)
EnerBank Consumers
Energy
Gas
Electric
Enterprises
3
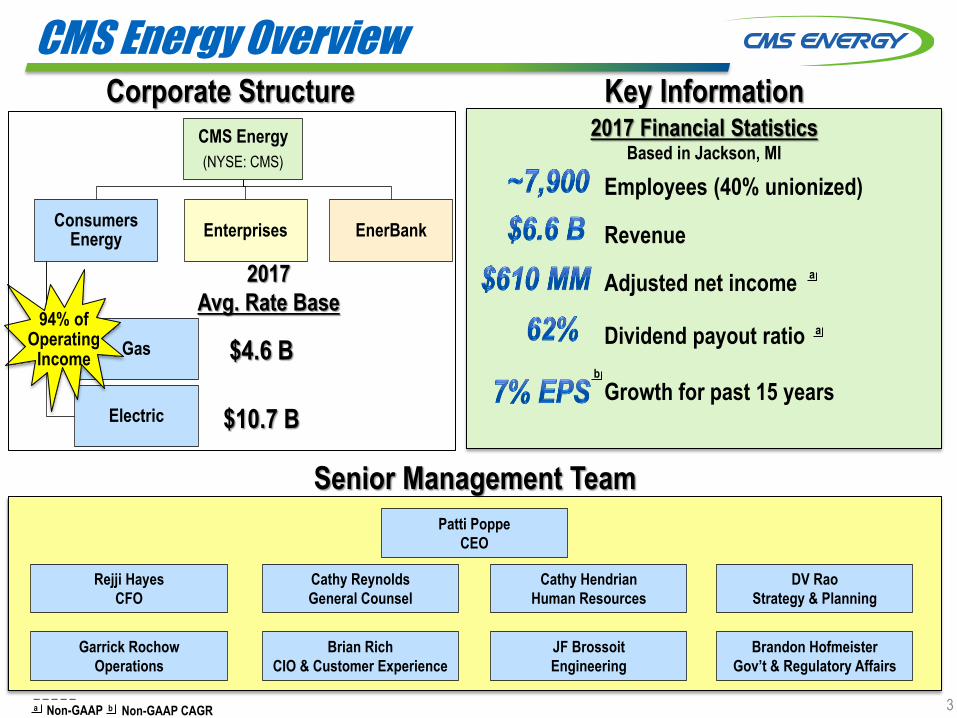
CMS Energy Overview Corporate Structure
Senior Management Team
Patti Poppe
CEO
Rejji Hayes
CFO
Brandon Hofmeister
Gov’t & Regulatory Affairs
DV Rao
Strategy & Planning
Cathy Reynolds
General Counsel
Cathy Hendrian
Human Resources
Garrick Rochow
Operations
Brian Rich
CIO & Customer Experience
JF Brossoit
Engineering
94% of Operating
Income
_ _ _ _ _
a Non-GAAP
2017
Avg. Rate Base
$10.7 B
$4.6 B
Key Information 2017 Financial Statistics
Based in Jackson, MI
Employees (40% unionized)
Revenue
Dividend payout ratio
Growth for past 15 years
a
Adjusted net income
b
a
_ _ _ _ _
b Non-GAAP CAGR
4
The Triple Bottom Line . . .
. . . world class performance delivering hometown service.
PERFORMANCE
PEOPLE PLANET
PEOPLE • PLANET • PROFIT
PROFIT
. . . is a world class utility. 5
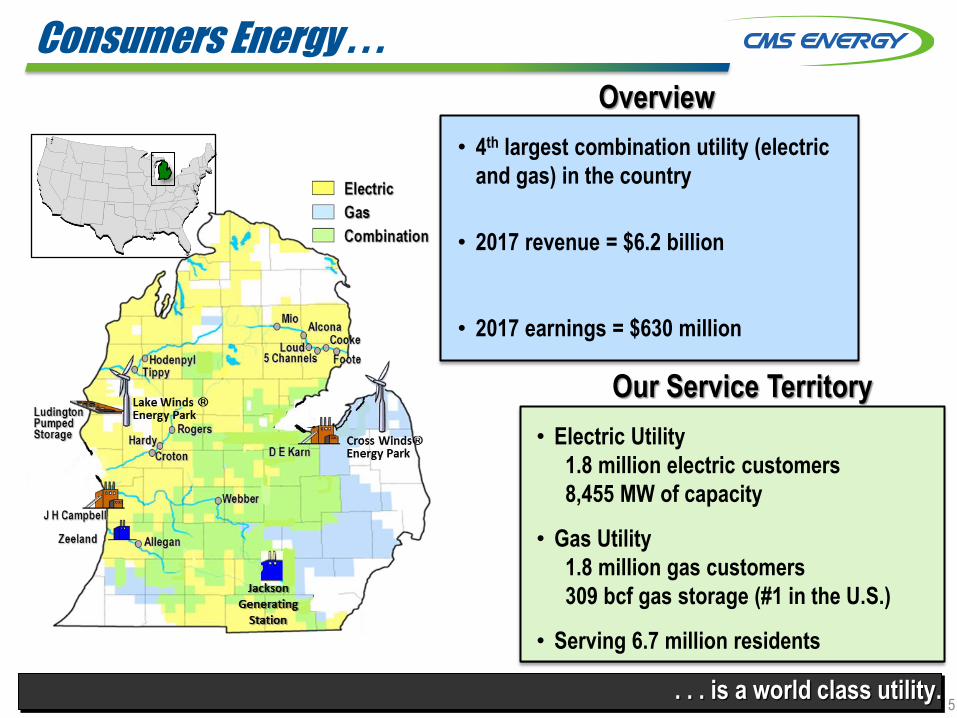
Consumers Energy . . .
• 4th largest combination utility (electric
and gas) in the country
• 2017 revenue = $6.2 billion
• 2017 earnings = $630 million
Overview
Our Service Territory
• Electric Utility
1.8 million electric customers
8,455 MW of capacity
• Gas Utility
1.8 million gas customers
309 bcf gas storage (#1 in the U.S.)
• Serving 6.7 million residents
6
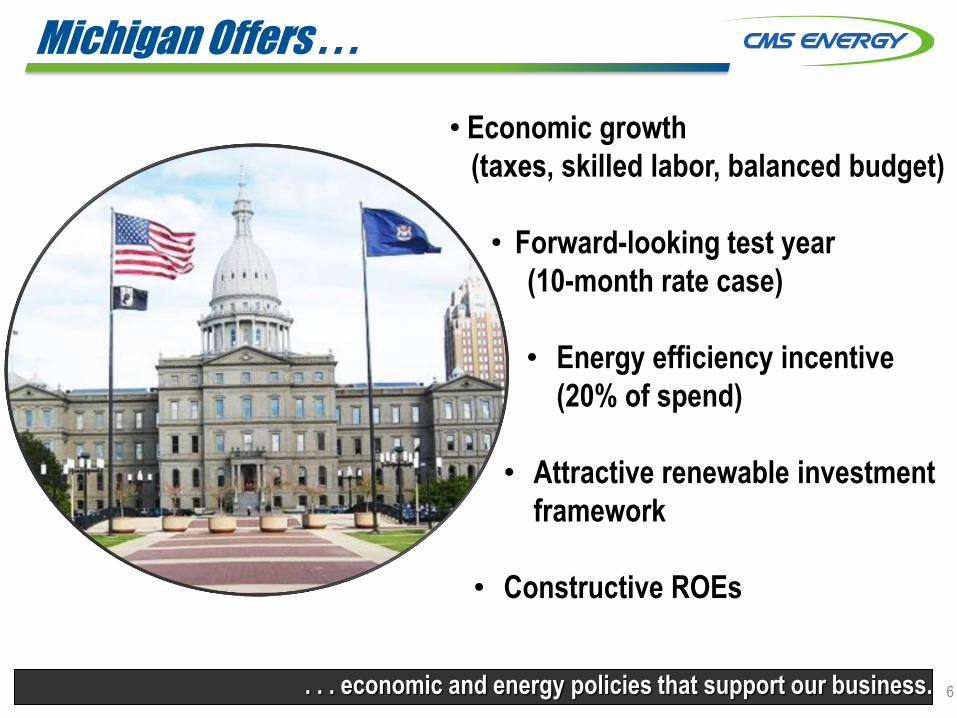
Michigan Offers . . .
. . . economic and energy policies that support our business.
• Economic growth
(taxes, skilled labor, balanced budget)
• Forward-looking test year
(10-month rate case)
• Energy efficiency incentive
(20% of spend)
• Attractive renewable investment
framework
• Constructive ROEs
. . . provides constructive energy policies.
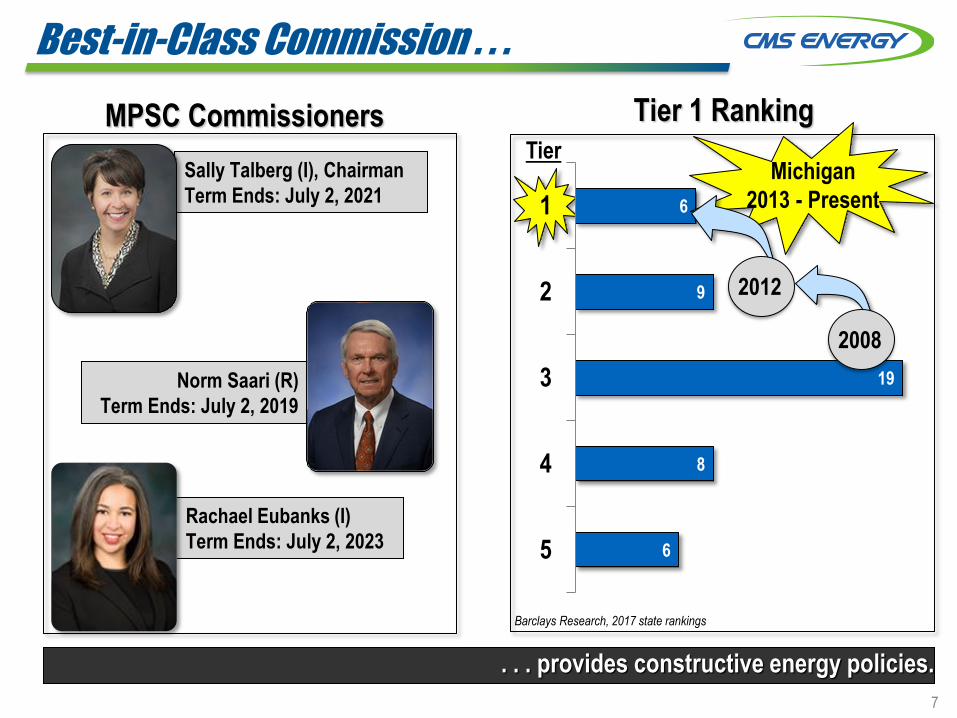
6
8
19
9
6
5
4
3
2
1
Tier 1 Ranking
Barclays Research, 2017 state rankings
Norm Saari (R)
Term Ends: July 2, 2019
Sally Talberg (I), Chairman
Term Ends: July 2, 2021
MPSC Commissioners
7
Rachael Eubanks (I)
Term Ends: July 2, 2023
Tier
Best-in-Class Commission . . .
Michigan
2013 - Present
2008
2012
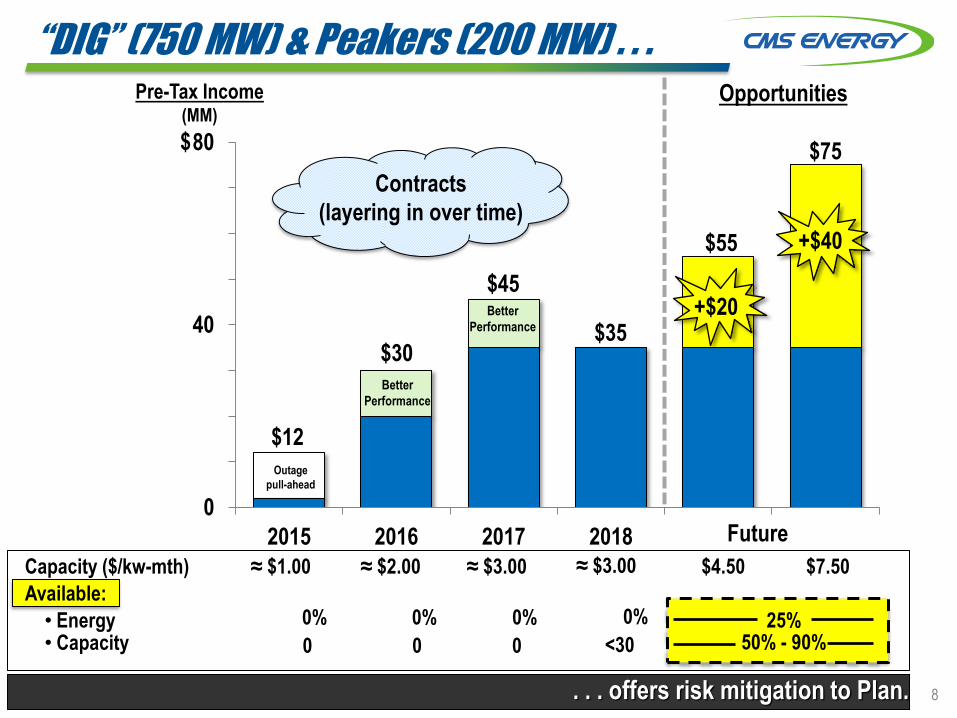
“DIG” (750 MW) & Peakers (200 MW) . . .
. . . offers risk mitigation to Plan.
0
10
20
30
40
50
60
70
80
2015 2016 2017 2018
Pre-Tax Income (MM)
$12
$30
$45
Outage
pull-ahead
Better
Performance
Future
Opportunities
Capacity ($/kw-mth) ≈ $1.00 ≈ $2.00 ≈ $3.00 $4.50 $7.50
Available:
• Energy • Capacity
0% 0% 25%
0 0 0
$
+$20
+$40
Contracts
(layering in over time)
$75
$55
50% - 90%
0%
Better
Performance $35
≈ $3.00
<30
0%
8
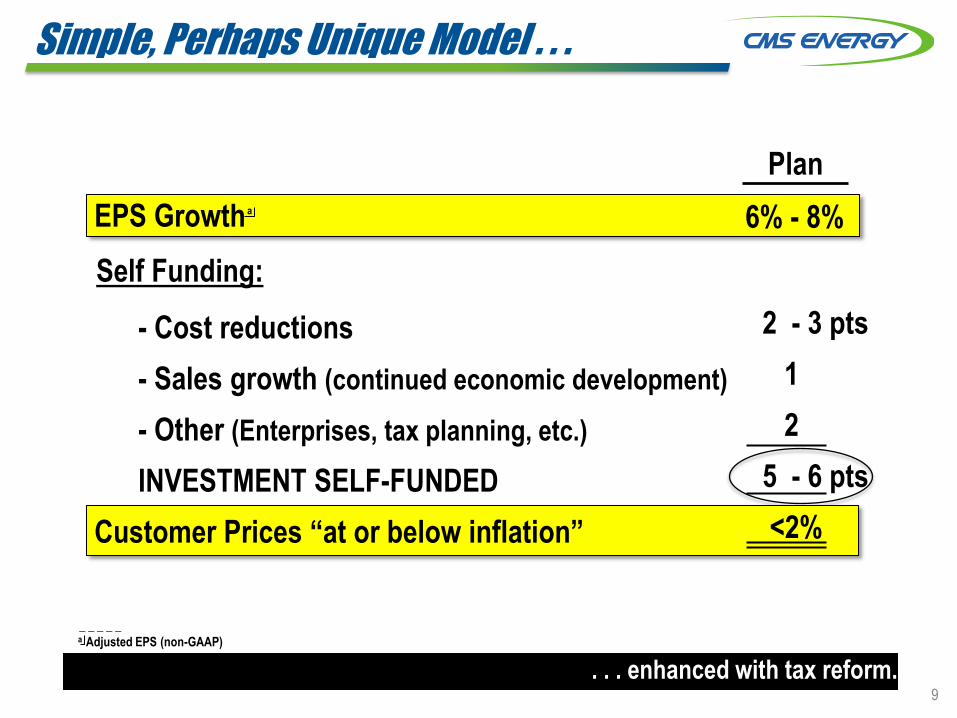
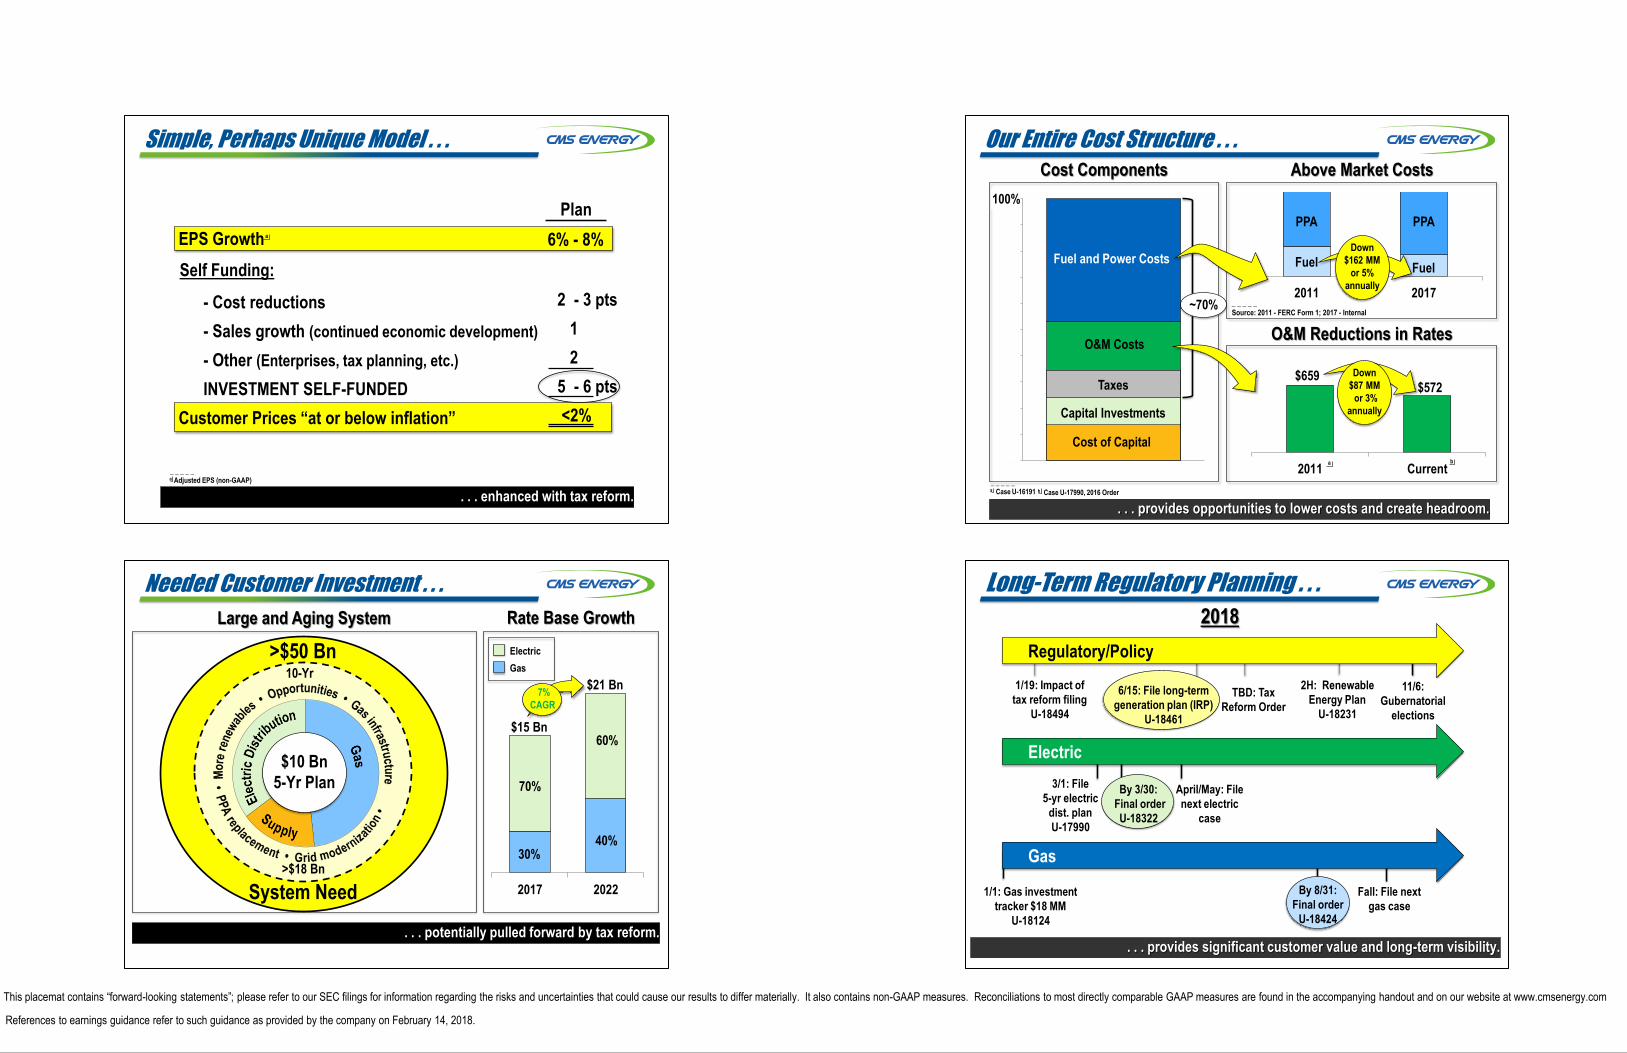
Simple, Perhaps Unique Model . . .
EPS Growth
- Cost reductions
- Sales growth (continued economic development)
- Other (Enterprises, tax planning, etc.)
INVESTMENT SELF-FUNDED
Customer Prices “at or below inflation”
Plan
6% - 8%
. . . enhanced with tax reform.
2 - 3 pts
1
2
5 - 6 pts
<2%
Self Funding:
9
_ _ _ _ _
a Adjusted EPS (non-GAAP)
a
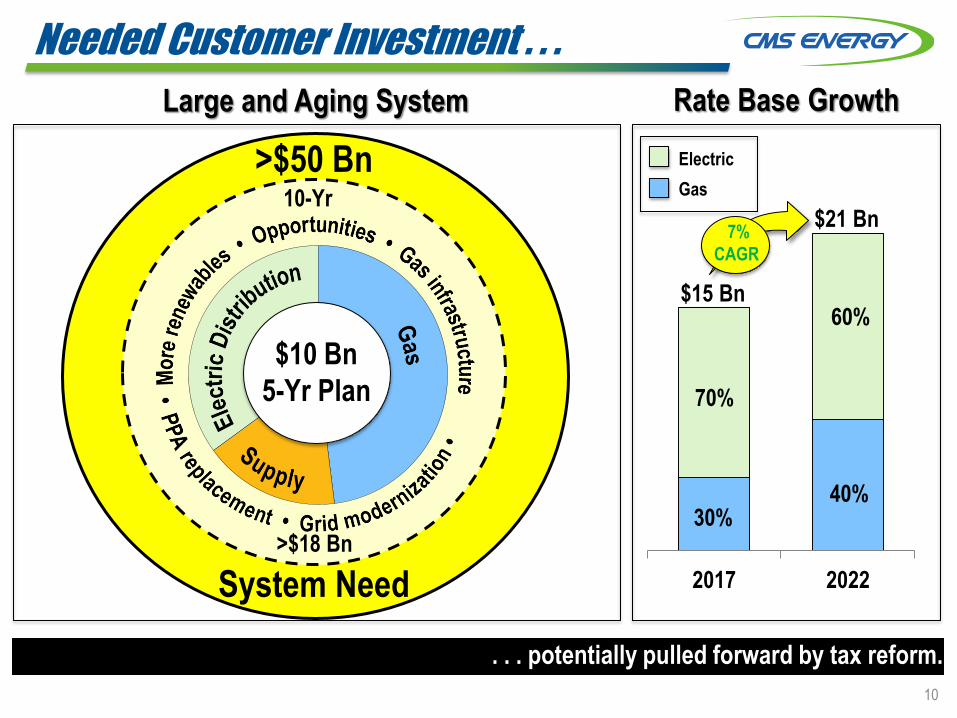
Needed Customer Investment . . .
. . . potentially pulled forward by tax reform.
2017 2022
$21 Bn
Rate Base Growth Large and Aging System
$15 Bn
>$50 Bn
System Need
$10 Bn
5-Yr Plan
Gas
Electric
7%
CAGR
30%
70%
40%
60%
10
>$18 Bn
10-Yr
11
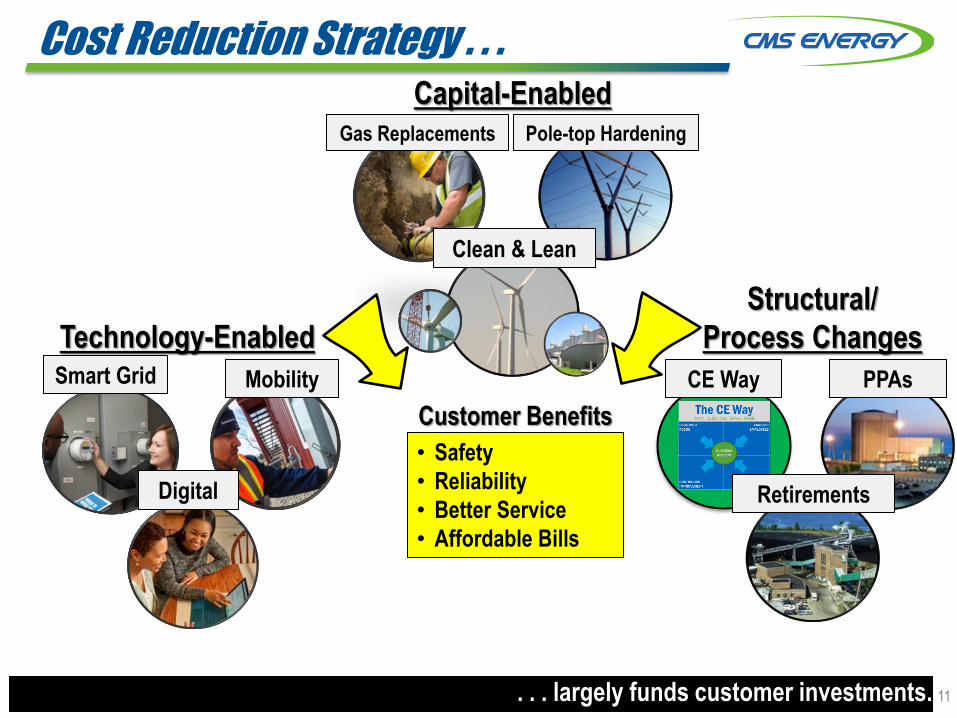
Cost Reduction Strategy . . .
. . . largely funds customer investments.
Capital-Enabled
Technology-Enabled
Structural/
Process Changes
Pole-top Hardening
Smart Grid Mobility CE Way
Gas Replacements
Digital
PPAs
Customer Benefits
• Safety
• Reliability
• Better Service
• Affordable Bills
Clean & Lean
Retirements
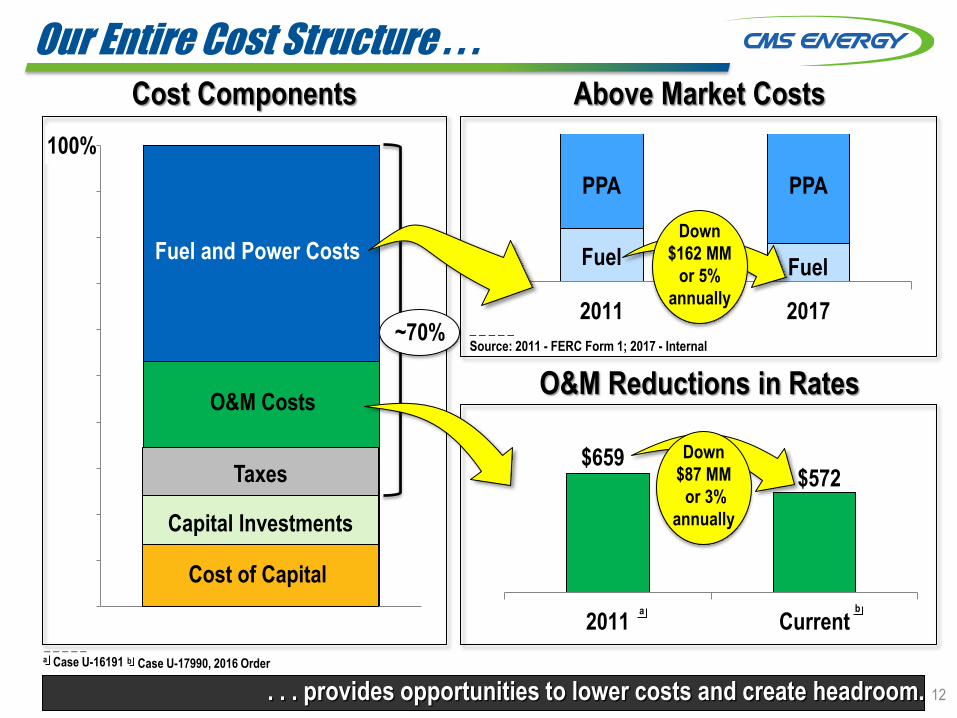
Our Entire Cost Structure . . .
Cost Components
0%
10%
20%
30%
40%
50%
60%
70%
80%
90%
100%
Fuel and Power Costs
Taxes
Above Market Costs
O&M Reductions in Rates
2011 Current
$659 $572
Down
$87 MM
or 3%
annually
100%
Capital Investments
O&M Costs
a
b
_ _ _ _ _
b Case U-17990, 2016 Order
_ _ _ _ _
a Case U-16191
Cost of Capital
. . . provides opportunities to lower costs and create headroom.
2011 2017
Fuel Fuel
PPA PPA
Down
$162 MM
or 5%
annually
~70% _ _ _ _ _
Source: 2011 - FERC Form 1; 2017 - Internal
12
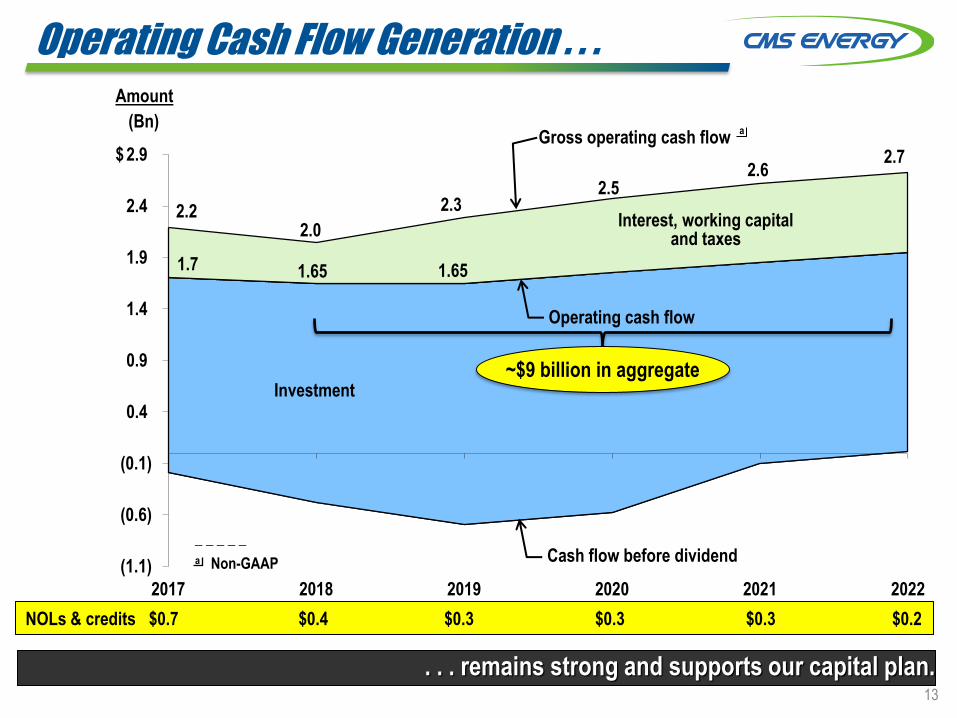
Operating Cash Flow Generation . . .
. . . remains strong and supports our capital plan.
(1.1)
(0.6)
(0.1)
0.4
0.9
1.4
1.9
2.4
2.9
2017 2018 2019 2020 2021 2022
Amount
(Bn)
$
Investment
Cash flow before dividend _ _ _ _ _
a Non-GAAP
NOLs & credits $0.7 $0.4 $0.3 $0.3 $0.3 $0.2
Interest, working capital and taxes
2.2
2.7 2.6
Operating cash flow
2.3
2.0
2.5
1.65 1.65
13
1.7
Gross operating cash flow a
~$9 billion in aggregate

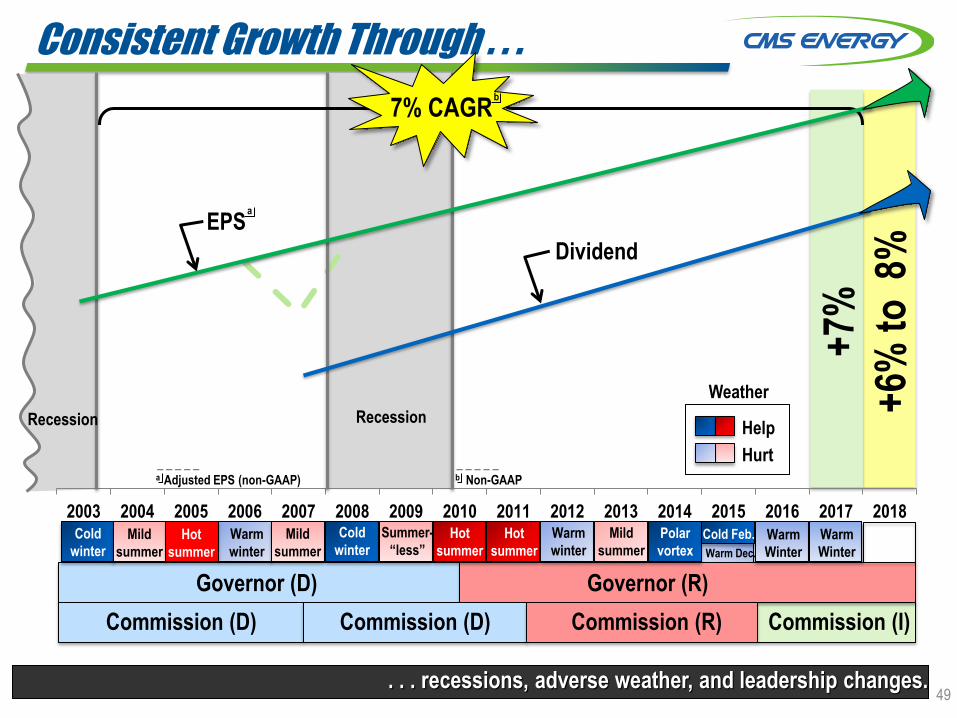
Consistent Growth Through . . .
2003 2004 2005 2006 2007 2008 2009 2010 2011 2012 2013 2014 2015 2016 2017 2018
Recession
Governor (R) Governor (D)
Commission (D) Commission (R)
Recession
7% CAGR
Polar
vortex
Cold
Feb.
Mild
summer
Warm
winter
Hot
summer
Hot
summer Cold
winter
Cold
winter
Summer-
“less” Mild
summer
Mild
summer
Commission (D)
Hurt
Help
EPS
_ _ _ _ _
a Adjusted EPS (non-GAAP)
a
Warm
winter
Hot
summer
Dividend
Weather
. . . recessions, adverse weather, and leadership changes.
Commission (I)
Cold Feb.
Warm Dec.
Warm
Winter
Warm
Winter
+7%
+6%
to
8%
14
b
_ _ _ _ _
b Non-GAAP
2003 2004 2005 2006 2007 2008 2009 2010 2011 2012 2013 2014 2015 2016 2017 2018 2019 2020 2025
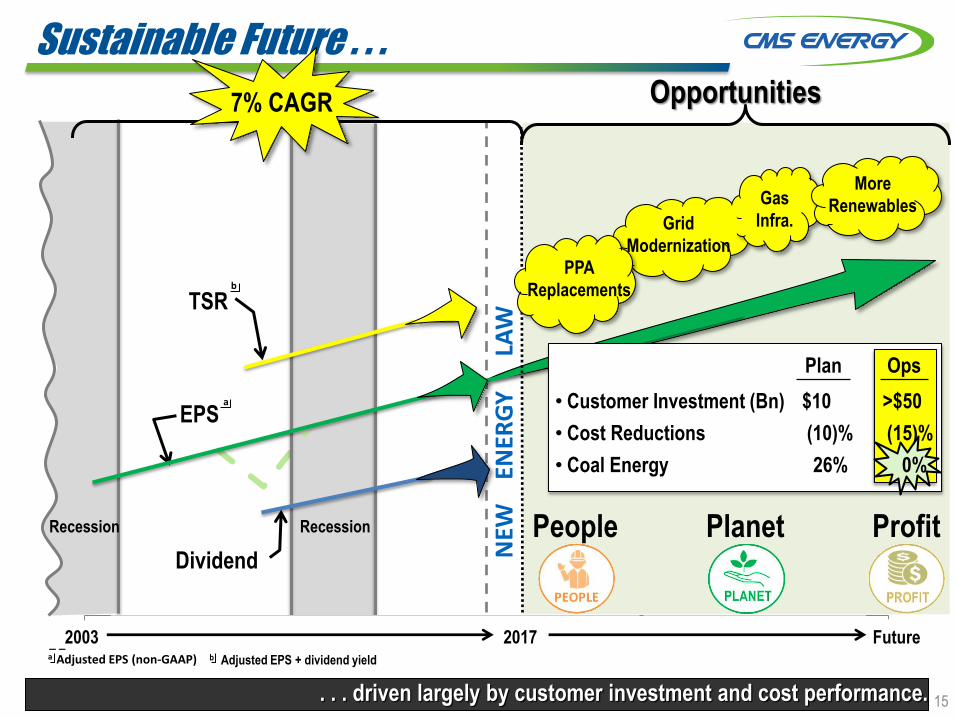
Sustainable Future . . .
Recession
7% CAGR
EPS
Recession
Opportunities
Gas
Infra.
2017
• Customer Investment (Bn)
• Cost Reductions
• Coal Energy
Plan
_ _ _ _ _
a Adjusted EPS (non-GAAP)
a
Future 2003
Ops
LAW
N
EW
EN
ERG
Y
Grid
Modernization
PPA
Replacements
People Planet Profit
15
More
Renewables
Dividend
TSR
_ _ _ _ _
b Adjusted EPS + dividend yield
b
. . . driven largely by customer investment and cost performance.
$10
(10)%
26%
>$50
(15)%
0%

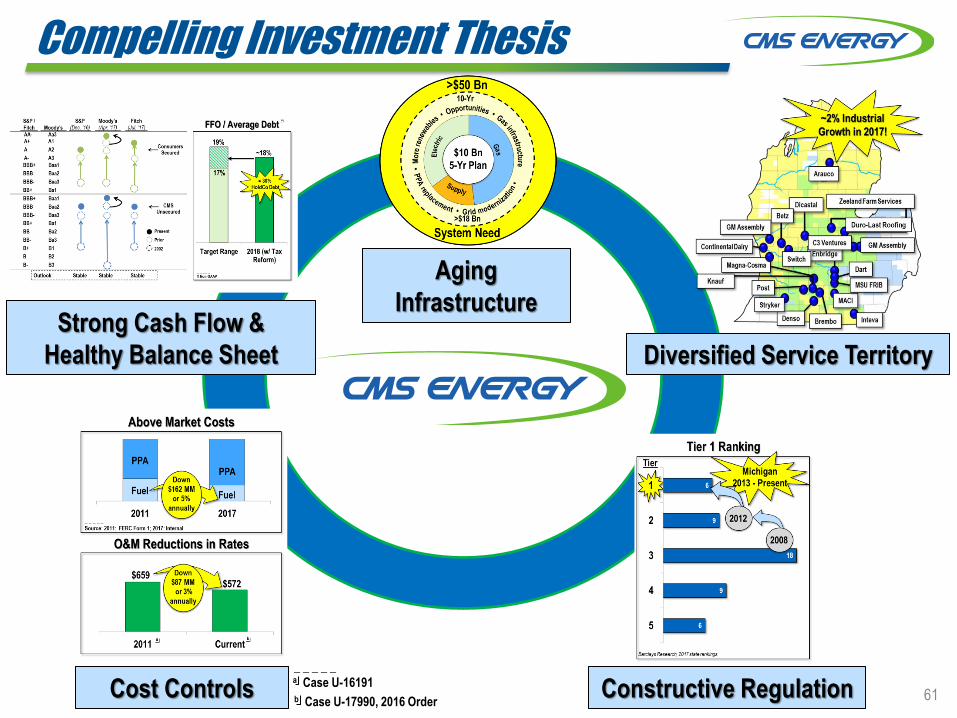
Compelling Investment Thesis
Aging
Infrastructure
Diversified Service Territory
Cost Controls
Strong Cash Flow &
Healthy Balance Sheet
Constructive Regulation 16 _ _ _ _ _
b Case U-17990, 2016 Order
_ _ _ _ _
a Case U-16191

Top of Mind
18
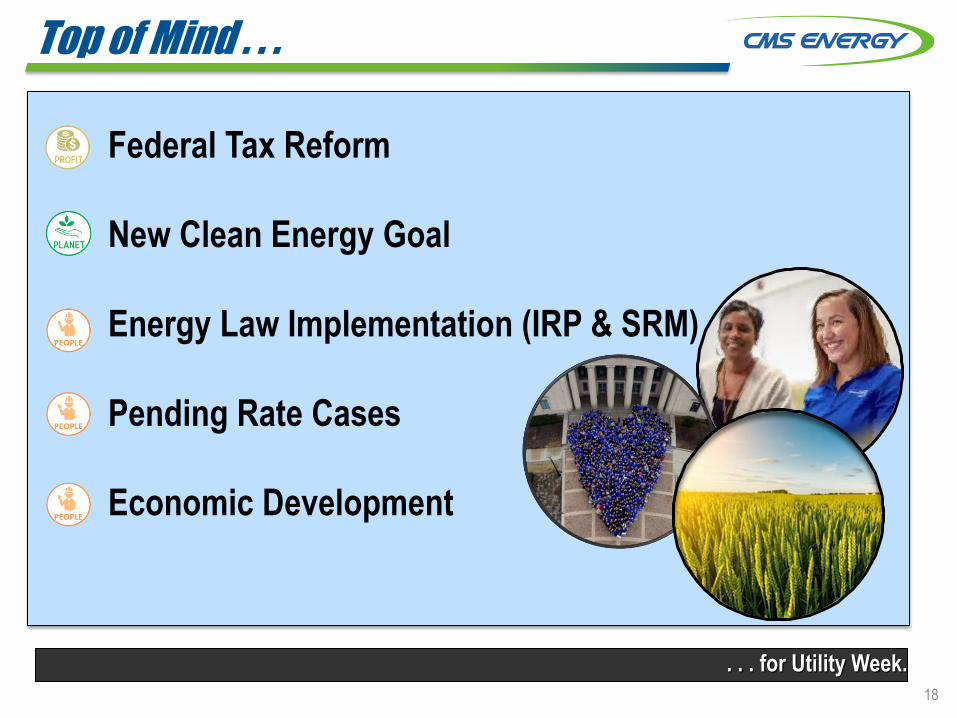
Top of Mind . . .
• Federal Tax Reform
• New Clean Energy Goal
• Energy Law Implementation (IRP & SRM)
• Pending Rate Cases
• Economic Development
. . . for Utility Week.
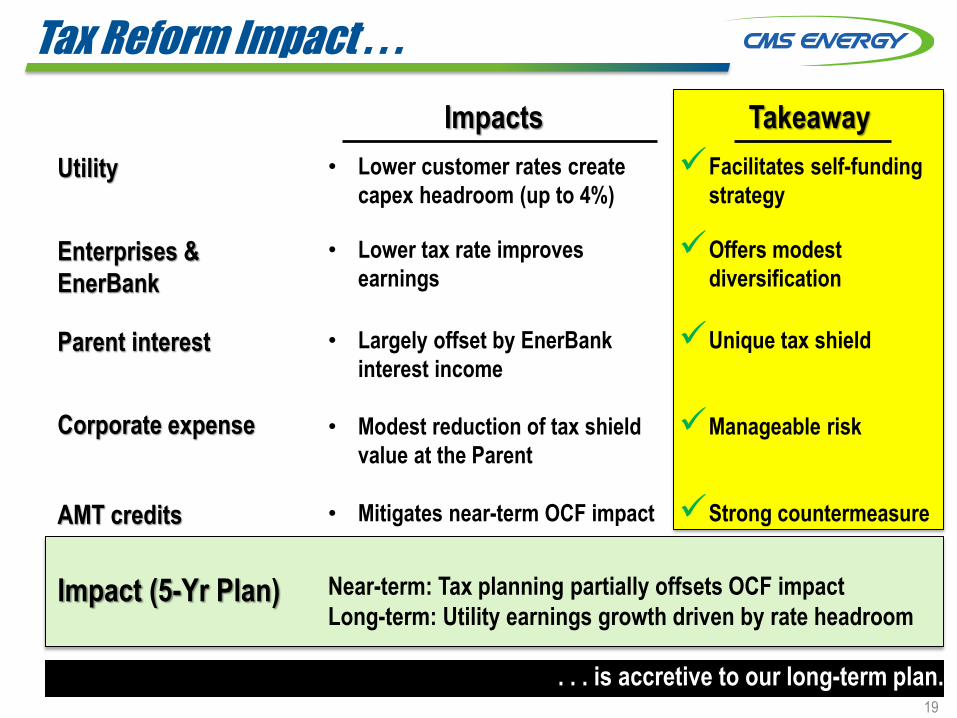
Tax Reform Impact . . .
. . . is accretive to our long-term plan.
Impacts Takeaway
Utility • Lower customer rates create
capex headroom (up to 4%)
Facilitates self-funding
strategy
Enterprises &
EnerBank
• Lower tax rate improves
earnings
Offers modest
diversification
Parent interest
Corporate expense
• Largely offset by EnerBank
interest income
• Modest reduction of tax shield
value at the Parent
Unique tax shield
Manageable risk
AMT credits • Mitigates near-term OCF impact Strong countermeasure
Impact (5-Yr Plan) Near-term: Tax planning partially offsets OCF impact
Long-term: Utility earnings growth driven by rate headroom
19

20
CMS Supply Mix . . .
. . . shifting away from coal.
Gas
38%
Coal
26%
Nuclear
17%
Renewables
9%
Net Interchange
Power & Other, 8%
Pumped
Storage, 2%
2017 Energy by Fuel Type
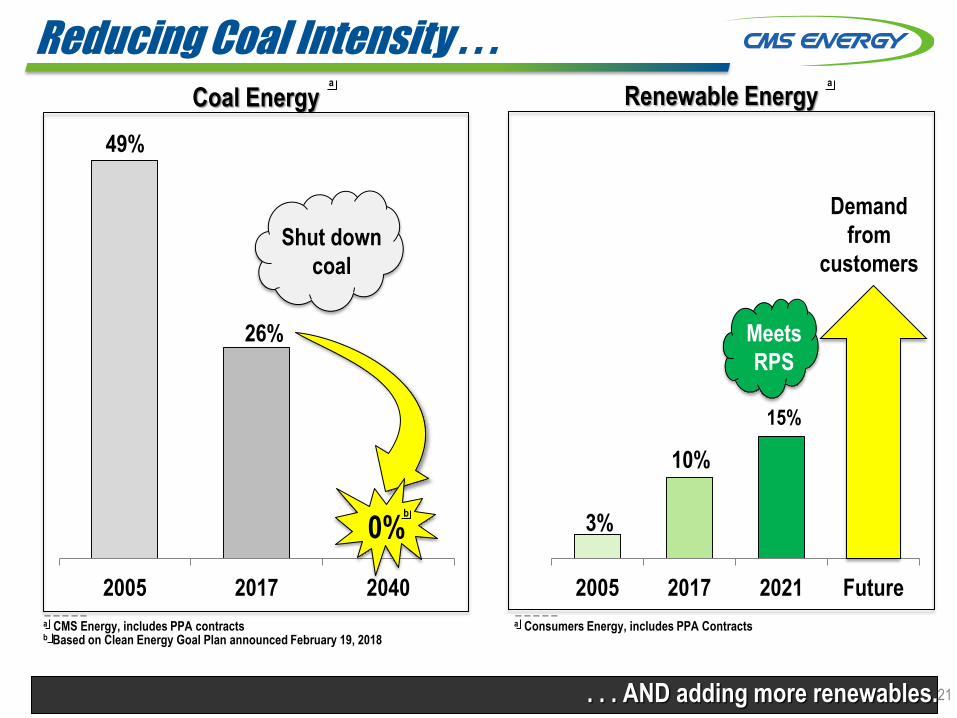
Reducing Coal Intensity . . .
2005 2017 2040 2005 2017 2021 Future
. . . AND adding more renewables.
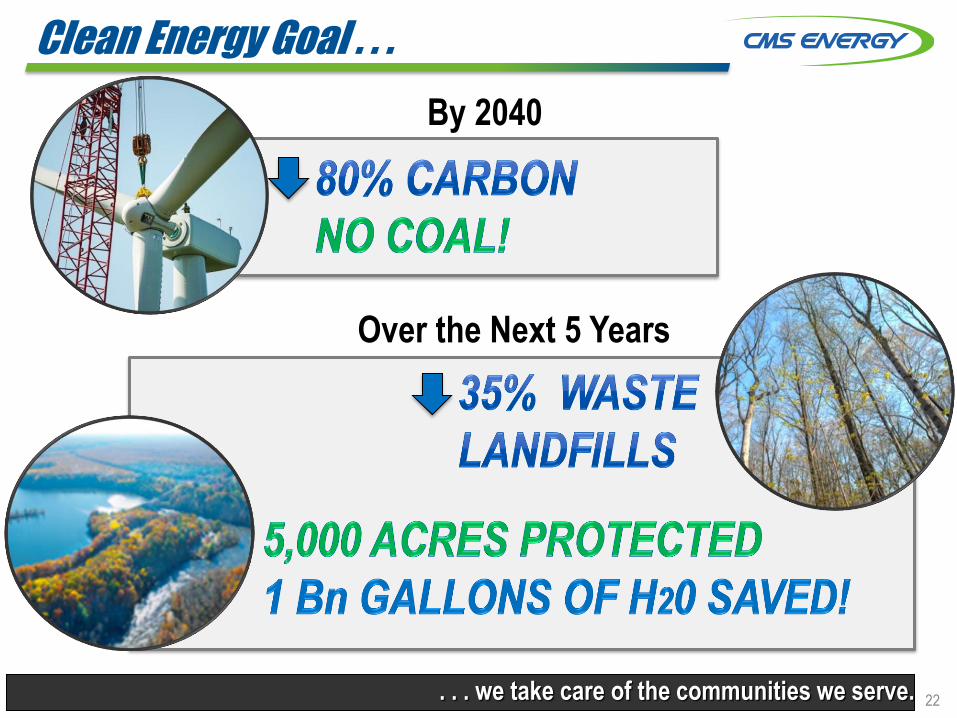
Coal Energy Renewable Energy
26%
10%
15%
_
b Based on Clean Energy Goal Plan announced February 19, 2018
49%
_ _ _ _ _
a CMS Energy, includes PPA contracts
Shut down
coal
Demand
from
customers
Meets
RPS
a
a
_ _ _ _ _
a Consumers Energy, includes PPA Contracts
3%
21
0% b
22
Clean Energy Goal . . .
. . . we take care of the communities we serve.
By 2040
Over the Next 5 Years
2H: Renewable
Energy Plan
U-18231
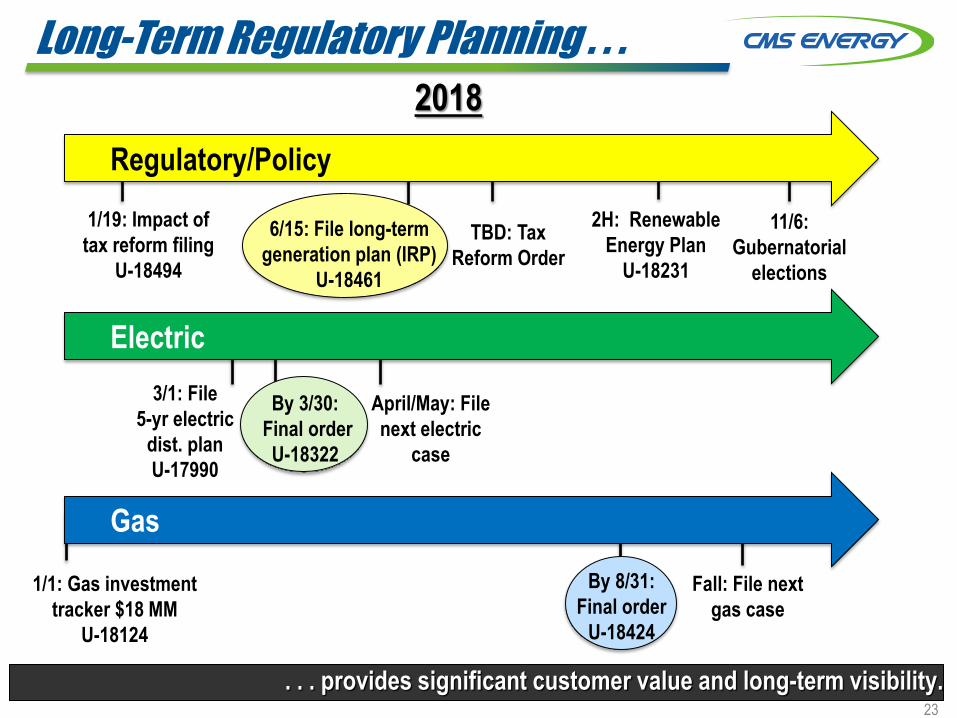
Long-Term Regulatory Planning . . .
. . . provides significant customer value and long-term visibility.
Gas
Electric
Regulatory/Policy
6/15: File long-term
generation plan (IRP)
U-18461
By 3/30:
Final order
U-18322
2018
1/1: Gas investment
tracker $18 MM
U-18124
3/1: File
5-yr electric
dist. plan
U-17990
By 8/31:
Final order
U-18424
Fall: File next
gas case
TBD: Tax
Reform Order
11/6:
Gubernatorial
elections
April/May: File
next electric
case
23
1/19: Impact of
tax reform filing
U-18494
24
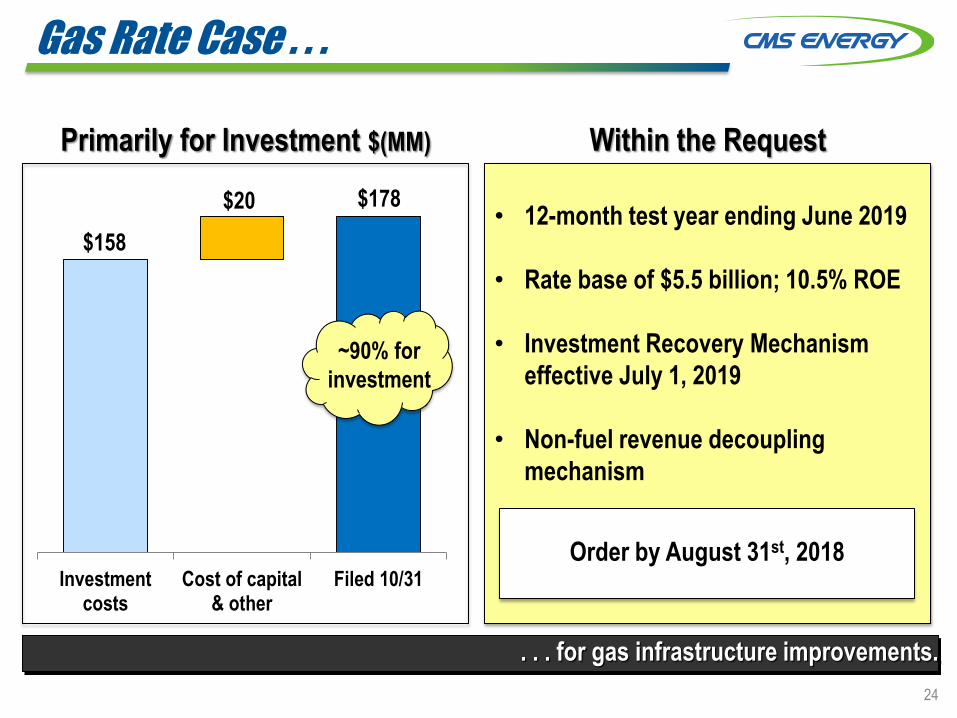
Gas Rate Case . . .
. . . for gas infrastructure improvements.
Primarily for Investment $(MM) Within the Request
Investmentcosts
Cost of capital& other
Filed 10/31
• 12-month test year ending June 2019
• Rate base of $5.5 billion; 10.5% ROE
• Investment Recovery Mechanism
effective July 1, 2019
• Non-fuel revenue decoupling
mechanism
$158
$20 $178
~90% for
investment
Order by August 31st, 2018
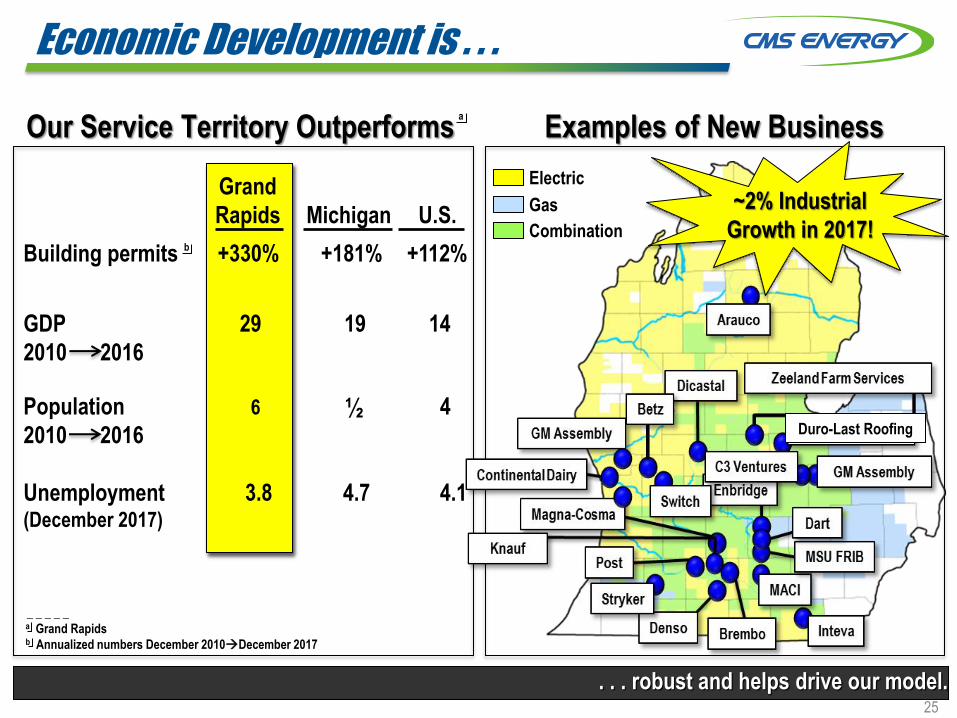
Economic Development is . . .
Examples of New Business
Electric
Gas
Combination
. . . robust and helps drive our model.
_ _ _ _ _
a Grand Rapids b Annualized numbers December 2010December 2017
Our Service Territory Outperforms
b
Grand
Rapids
Michigan
U.S.
Building permits +330% +181% +112%
GDP
2010 2016
29 19 14
Population
2010 2016
6 ½ 4
Unemployment (December 2017)
3.8
4.7 4.1
~2% Industrial
Growth in 2017!
25
a
Duro-Last Roofing
Customer Investment
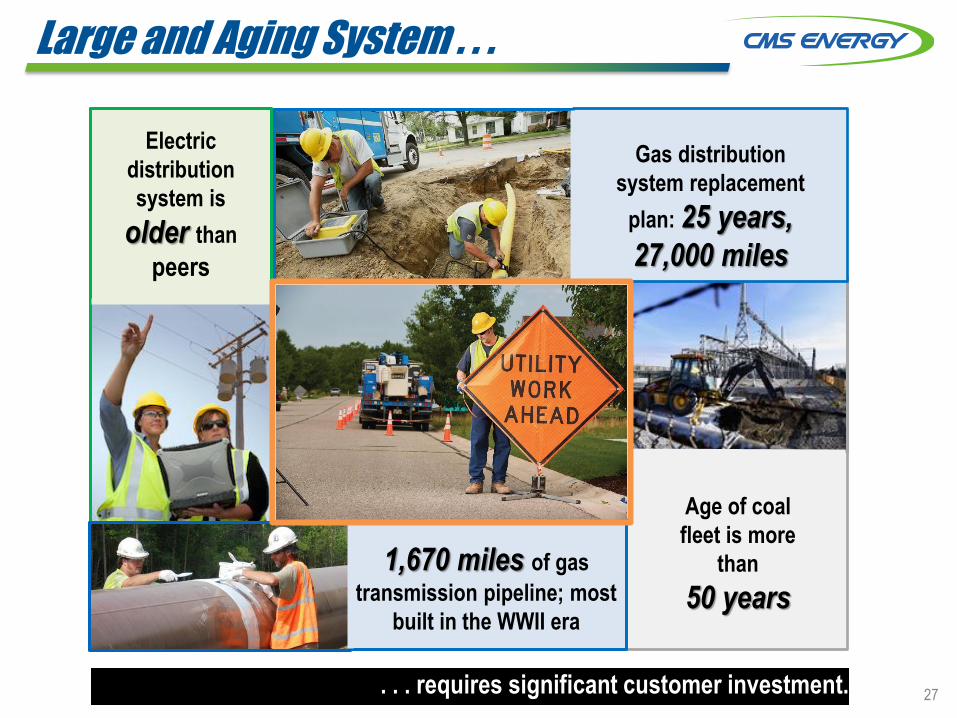
Large and Aging System . . .
. . . requires significant customer investment.
Electric
distribution
system is
older than
peers
1,670 miles of gas
transmission pipeline; most
built in the WWII era
Gas distribution
system replacement
plan: 25 years,
27,000 miles
Age of coal
fleet is more
than
50 years
27
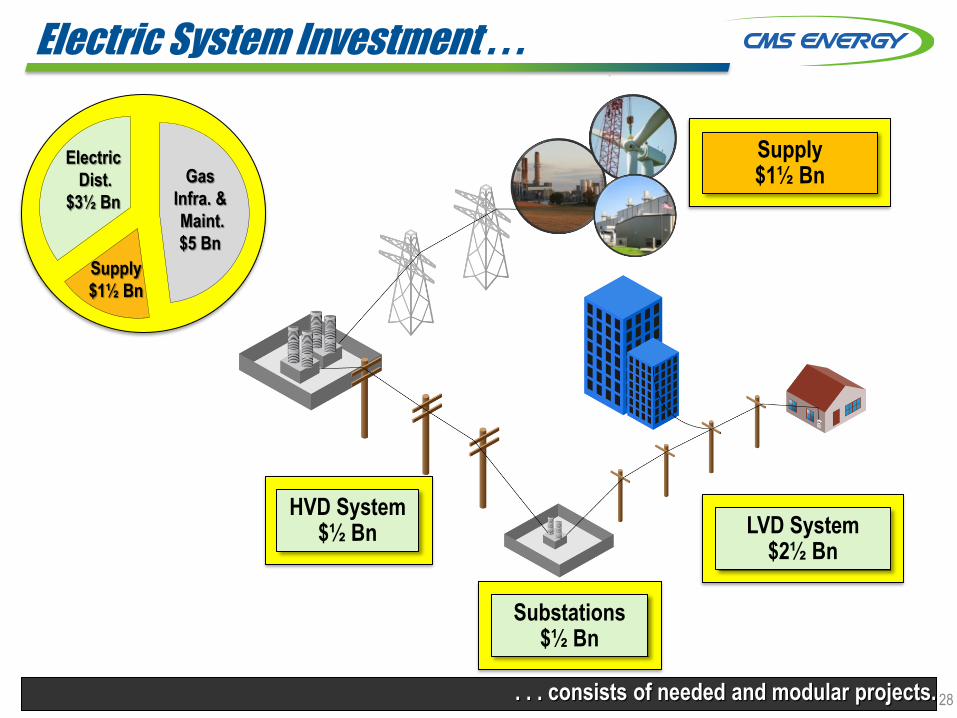
Electric System Investment . . .
. . . consists of needed and modular projects.
HVD System $½ Bn LVD System
$2½ Bn
Substations $½ Bn
Supply $1½ Bn
28
Supply
$1½ Bn
Electric
Dist.
$3½ Bn
Gas
Infra. &
Maint.
$5 Bn
29
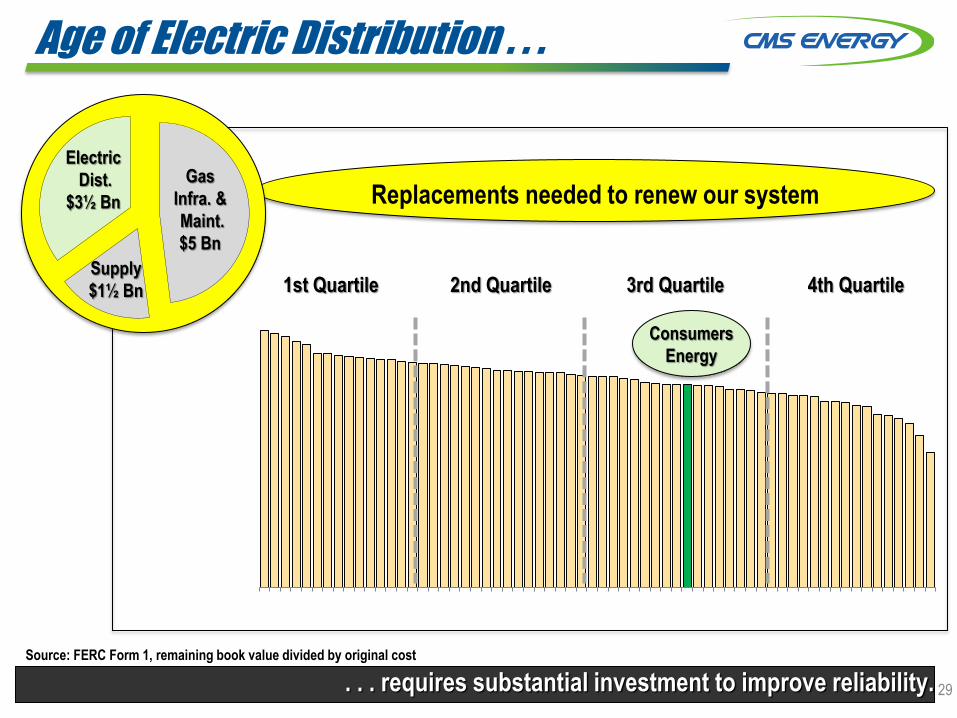
Age of Electric Distribution . . .
. . . requires substantial investment to improve reliability.
Consumers
Energy
1st Quartile 2nd Quartile 3rd Quartile 4th Quartile
Replacements needed to renew our system
Source: FERC Form 1, remaining book value divided by original cost
Supply
$1½ Bn
Electric
Dist.
$3½ Bn
Gas
Infra. &
Maint.
$5 Bn
30
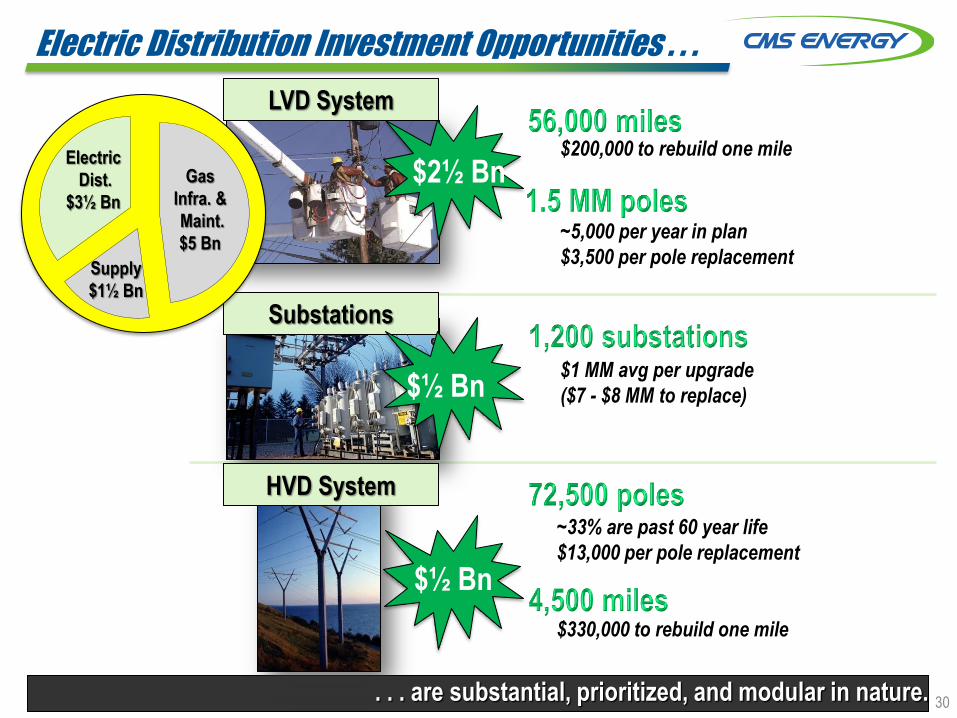
Electric Distribution Investment Opportunities . . .
. . . are substantial, prioritized, and modular in nature.
~5,000 per year in plan
$3,500 per pole replacement
~33% are past 60 year life
$13,000 per pole replacement
$1 MM avg per upgrade
($7 - $8 MM to replace)
HVD System
Substations
$2½ Bn
$½ Bn
$200,000 to rebuild one mile
$330,000 to rebuild one mile
LVD System
Supply
$1½ Bn
Electric
Dist.
$3½ Bn
Gas
Infra. &
Maint.
$5 Bn
$½ Bn
31
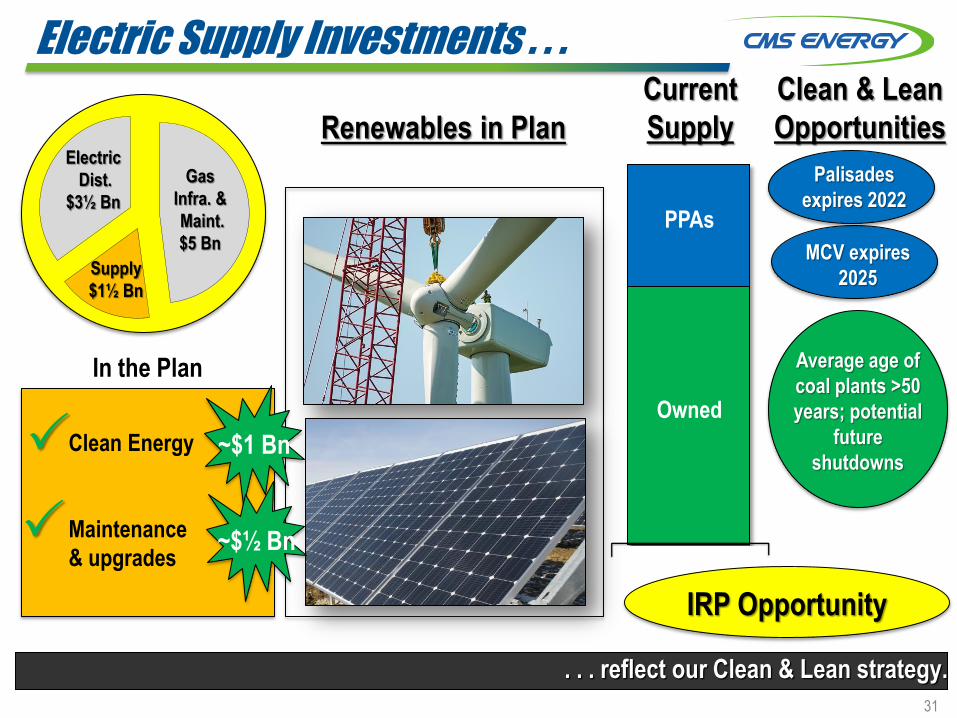
Electric Supply Investments . . .
. . . reflect our Clean & Lean strategy.
Clean & Lean
Opportunities
PPAs
Owned
Current
Supply
IRP Opportunity
Renewables in Plan
In the Plan
Clean Energy
Maintenance
& upgrades
MCV expires
2025
Palisades
expires 2022
Average age of
coal plants >50
years; potential
future
shutdowns ~$1 Bn
~$½ Bn
Supply
$1½ Bn
Electric
Dist.
$3½ Bn
Gas
Infra. &
Maint.
$5 Bn
32
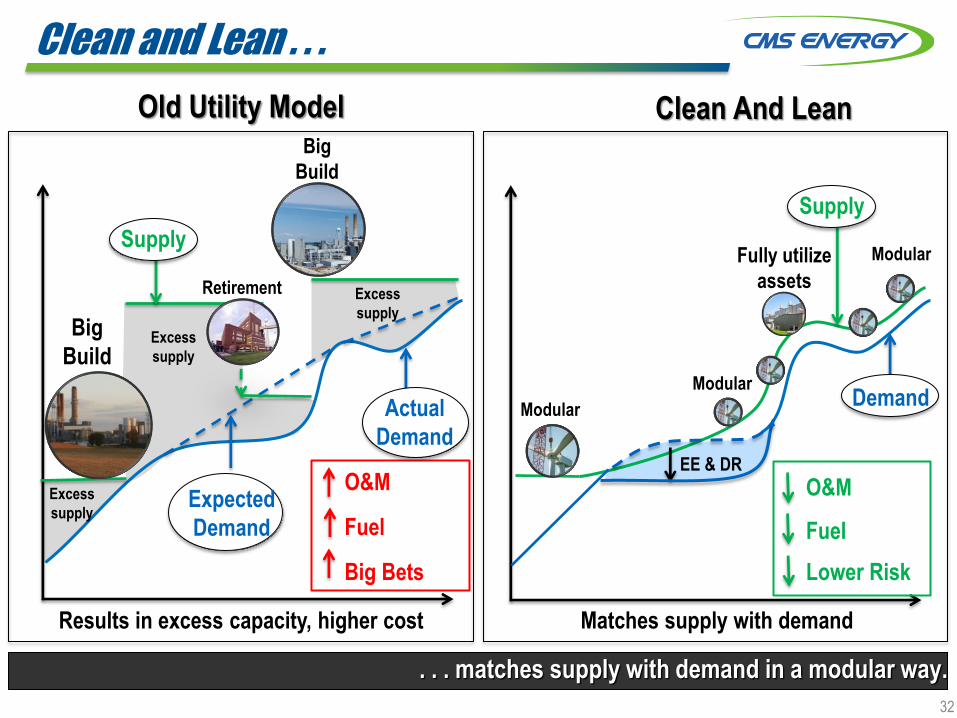
. . . matches supply with demand in a modular way.
Clean and Lean . . .
Old Utility Model Clean And Lean
Big
Build
Big
Build
O&M
Fuel
Big Bets
Modular
Fully utilize
assets
O&M
Fuel
Lower Risk
Results in excess capacity, higher cost Matches supply with demand
Excess
supply
Excess
supply
Retirement
Supply
Actual
Demand
Demand
EE & DR
Excess
supply
Modular
Modular
Expected
Demand
Supply
33
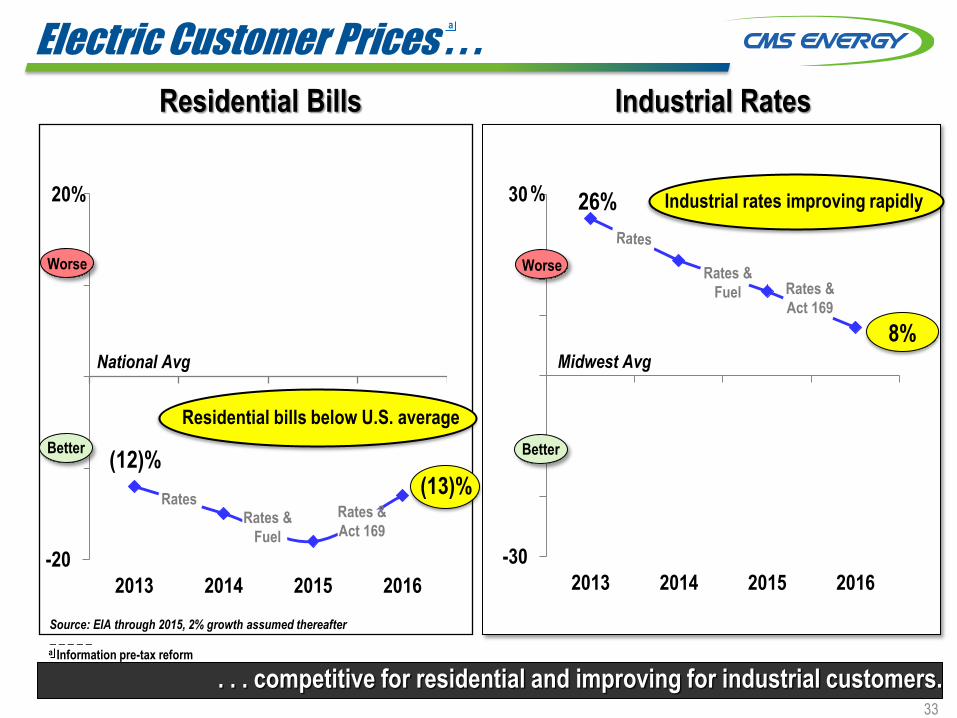
Electric Customer Prices . . .
Residential Bills Industrial Rates
. . . competitive for residential and improving for industrial customers.
-30
-20
-10
0
10
20
30
2013 2014 2015 2016
8%
% 26%
-20
-10
0
10
20
2013 2014 2015 2016
(12)%
National Avg
20%
Residential bills below U.S. average
Worse
Better
(13)%
Source: EIA through 2015, 2% growth assumed thereafter
Worse
Better
Midwest Avg
Industrial rates improving rapidly
Rates Rates &
Fuel
Rates &
Act 169
Rates &
Fuel Rates &
Act 169
_ _ _ _ _
a Information pre-tax reform
a
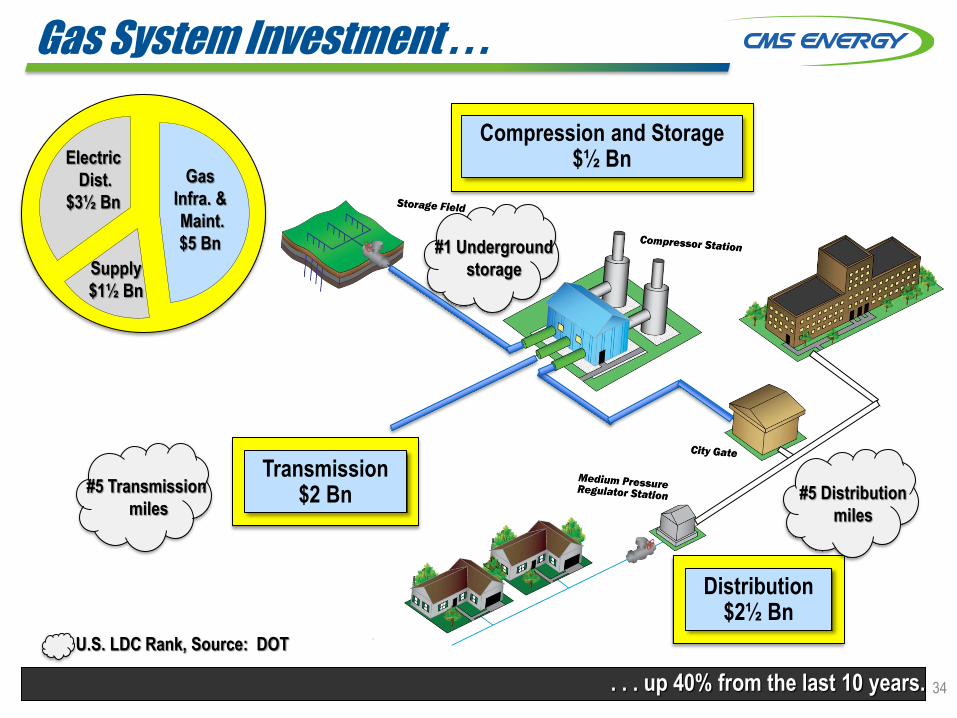
Gas System Investment . . .
Compression and Storage $½ Bn
. . . up 40% from the last 10 years. 34
Transmission $2 Bn
Distribution $2½ Bn
#1 Underground
storage
#5 Distribution
miles
U.S. LDC Rank, Source: DOT
#5 Transmission
miles
Supply
$1½ Bn
Electric
Dist.
$3½ Bn
Gas
Infra. &
Maint.
$5 Bn

35
Gas Transmission . . .
. . . significant investment over time.
PIC
TURE
94 miles, 24”
$636 MM
54 miles, 36”
$385 MM
22 miles
1,670 miles of transmission pipelines
South Oakland (3100)
Mid-Michigan (100A)
Saginaw Trail (2800)
Projects in Plan
Supply
$1½ Bn
Electric
Dist.
$3½ Bn
Gas
Infra. &
Maint.
$5 Bn
36
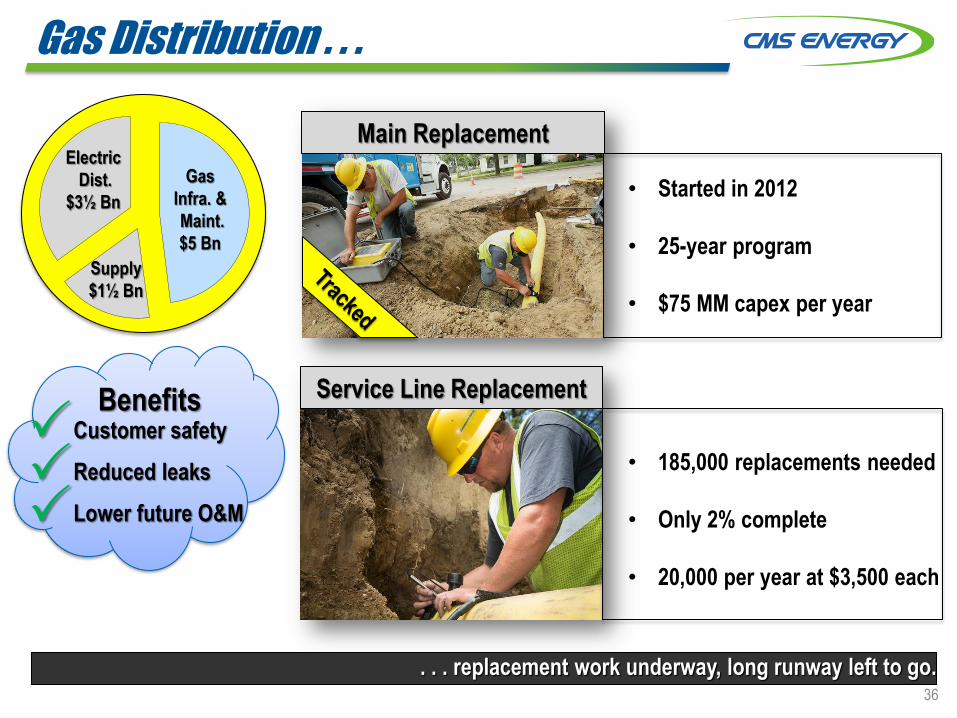
Gas Distribution . . .
. . . replacement work underway, long runway left to go.
• 185,000 replacements needed
• Only 2% complete
• 20,000 per year at $3,500 each
Main Replacement
Service Line Replacement
Customer safety
Reduced leaks
Lower future O&M
• Started in 2012
• 25-year program
• $75 MM capex per year
Benefits
Supply
$1½ Bn
Electric
Dist.
$3½ Bn
Gas
Infra. &
Maint.
$5 Bn
37
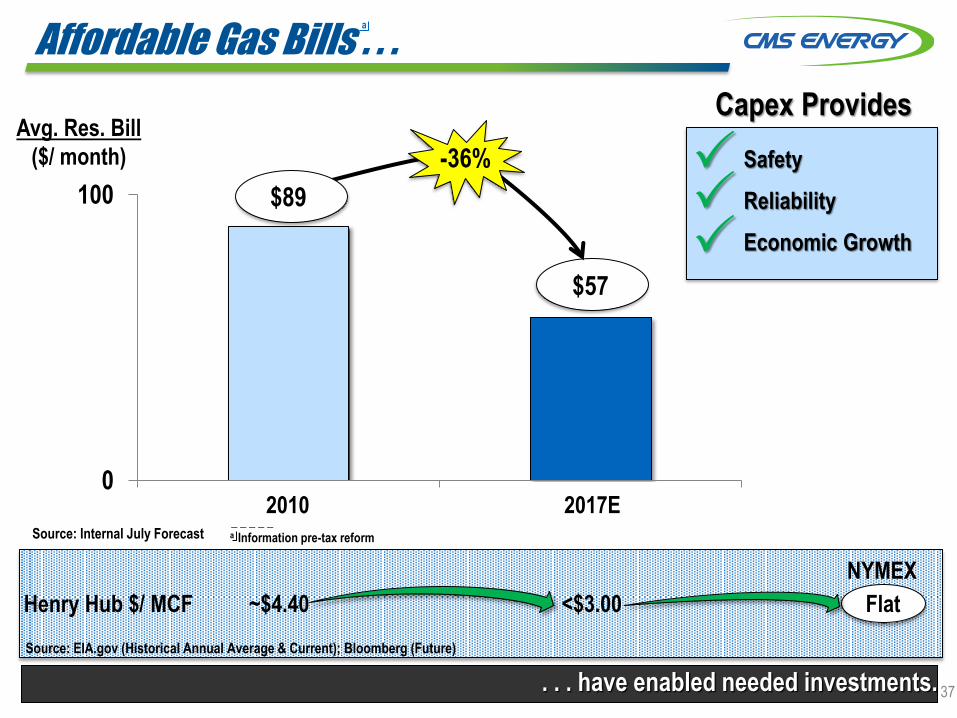
Affordable Gas Bills . . .
Henry Hub $/ MCF ~$4.40 <$3.00
. . . have enabled needed investments.
Flat
NYMEX
Source: EIA.gov (Historical Annual Average & Current); Bloomberg (Future)
0
100
2010 2017E
$57
$89
-36%
Avg. Res. Bill
($/ month)
Capex Provides
Safety
Reliability
Economic Growth
Source: Internal July Forecast _ _ _ _ _
a Information pre-tax reform
a
Year-End 2017 Earnings Call
Agenda
Business Update Patti Poppe
President & CEO
Performance -- The Consumers Energy Way
Financial Results & Outlook Rejji Hayes
Federal Tax Reform Update
2017 Results
2018 Outlook & Priorities
Executive VP & CFO
PEOPLE PLANET PROFIT
39

Financial Results & Outlook . . .
. . . 15th consecutive year of consistent financial performance.
Vs.
2017 Results Amount Prior Year
• EPS $2.17 +7%
• Operating cash flow (OCF, MM) $1,705 Up $76
2018 Updates
• EPS guidance raised $2.30 to $2.34 +6% to +8%
• Annual dividend $1.43 +7%
_ _ _ _ _
a Adjusted EPS (non-GAAP)
a
a
Long-Term Outlook
• EPS & DPS growth +6% to +8% a
40
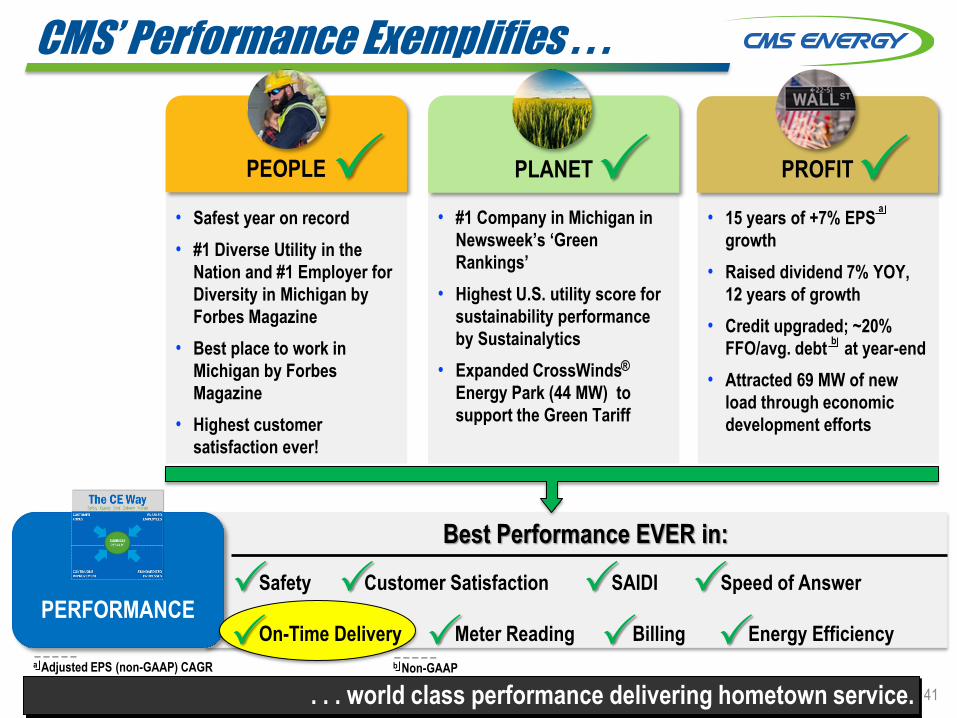
CMS’ Performance Exemplifies . . .
. . . world class performance delivering hometown service.
• 15 years of +7% EPS
growth
• Raised dividend 7% YOY,
12 years of growth
• Credit upgraded; ~20%
FFO/avg. debt at year-end
• Attracted 69 MW of new
load through economic
development efforts
PROFIT
• #1 Company in Michigan in
Newsweek’s ‘Green
Rankings’
• Highest U.S. utility score for
sustainability performance
by Sustainalytics
• Expanded CrossWinds
Energy Park (44 MW) to
support the Green Tariff
PLANET
• Safest year on record
• #1 Diverse Utility in the
Nation and #1 Employer for
Diversity in Michigan by
Forbes Magazine
• Best place to work in
Michigan by Forbes
Magazine
• Highest customer
satisfaction ever!
PEOPLE
PERFORMANCE
Best Performance EVER in:
®
_ _ _ _ _
a Adjusted EPS (non-GAAP) CAGR
a
Safety Customer Satisfaction SAIDI Speed of Answer
On-Time Delivery Meter Reading Billing Energy Efficiency
41
_ _ _ _ _
b Non-GAAP
b
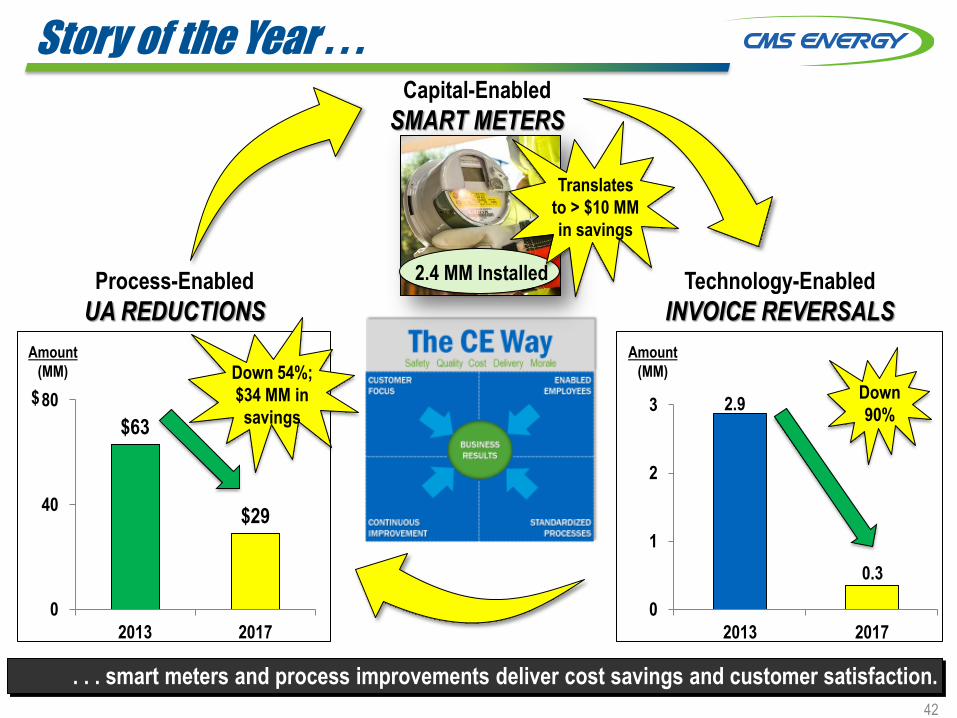
Story of the Year . . .
. . . smart meters and process improvements deliver cost savings and customer satisfaction.
0
1
2
3
2013 2017
Capital-Enabled
SMART METERS
Amount
(MM)
Technology-Enabled
INVOICE REVERSALS
Process-Enabled
UA REDUCTIONS
2.9
0.3
$63
$29
0
40
80
2013 2017
Amount
(MM)
2.4 MM Installed
Down 54%;
$34 MM in
savings
42
$
Translates
to > $10 MM
in savings
Down
90%
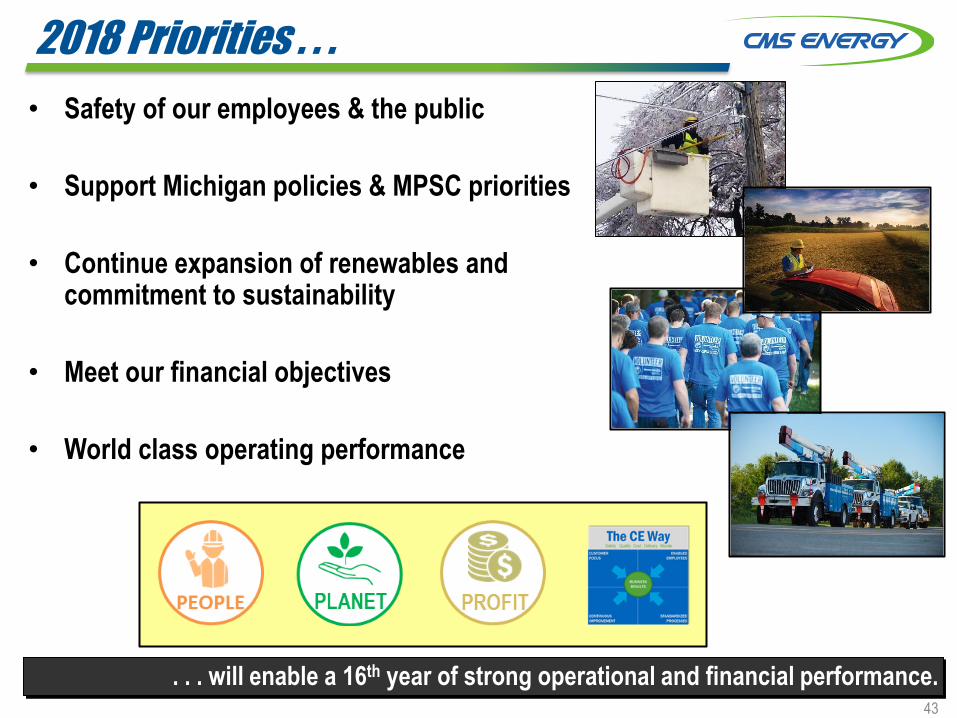
2018 Priorities . . .
. . . will enable a 16th year of strong operational and financial performance.
• Safety of our employees & the public
• Support Michigan policies & MPSC priorities
• Continue expansion of renewables and commitment to sustainability
• Meet our financial objectives
• World class operating performance
43

Simple, Perhaps Unique Model . . .
EPS Growth
- Cost reductions
- Sales growth (continued economic development)
- Other (Enterprises, tax planning, etc.)
INVESTMENT SELF-FUNDED
Customer Prices “at or below inflation”
Plan
6% - 8%
. . . enhanced with tax reform.
2 - 3 pts
1
2
5 - 6 pts
<2%
Self Funding:
44
_ _ _ _ _
a Adjusted EPS (non-GAAP)
a

Large and Aging System . . .
. . . requires significant customer investment.
Electric
distribution
system is
older than
peers
1,670 miles of gas
transmission pipeline; most
built in the WWII era
Gas distribution
system replacement
plan: 25 years,
27,000 miles
Age of coal
fleet is more
than
50 years
45

Our Entire Cost Structure . . .
Cost Components
0%
10%
20%
30%
40%
50%
60%
70%
80%
90%
100%
Fuel and Power Costs
Taxes
Above Market Costs
O&M Reductions in Rates
2011 Current
$659 $572
Down
$87 MM
or 3%
annually
100%
Capital Investments
O&M Costs
a
b
_ _ _ _ _
b Case U-17990, 2016 Order
_ _ _ _ _
a Case U-16191
Cost of Capital
. . . provides opportunities to lower costs and create headroom.
2011 2017
Fuel Fuel
PPA PPA
Down
$162 MM
or 5%
annually
~70% _ _ _ _ _
Source: 2011 - FERC Form 1; 2017 - Internal
46

Economic Development is . . .
Examples of New Business
Electric
Gas
Combination
. . . robust and helps drive our model.
_ _ _ _ _
a Grand Rapids b Annualized numbers December 2010December 2017
Our Service Territory Outperforms
b
Grand
Rapids
Michigan
U.S.
Building permits +330% +181% +112%
GDP
2010 2016
29 19 14
Population
2010 2016
6 ½ 4
Unemployment (December 2017)
3.8
4.7 4.1
~2% Industrial
Growth in 2017!
47
a
Duro-Last Roofing

2H: Renewable
Energy Plan
U-18231
Long-Term Regulatory Planning . . .
. . . provides significant customer value and long-term visibility.
Gas
Electric
Regulatory/Policy
6/15: File long-term
generation plan (IRP)
U-18461
By 3/30:
Final order
U-18322
2018
1/1: Gas investment
tracker $18 MM
U-18124
3/1: File
5-yr electric
dist. plan
U-17990
By 8/31:
Final order
U-18424
Fall: File next
gas case
TBD: Tax
Reform Order
11/6:
Gubernatorial
elections
April/May: File
next electric
case
48
1/19: Impact of
tax reform filing
U-18494
Consistent Growth Through . . .
2003 2004 2005 2006 2007 2008 2009 2010 2011 2012 2013 2014 2015 2016 2017 2018
Recession
Governor (R) Governor (D)
Commission (D) Commission (R)
Recession
7% CAGR
Polar
vortex
Cold
Feb.
Mild
summer
Warm
winter
Hot
summer
Hot
summer Cold
winter
Cold
winter
Summer-
“less” Mild
summer
Mild
summer
Commission (D)
Hurt
Help
EPS
_ _ _ _ _
a Adjusted EPS (non-GAAP)
a
Warm
winter
Hot
summer
Dividend
Weather
. . . recessions, adverse weather, and leadership changes.
Commission (I)
Cold Feb.
Warm Dec.
Warm
Winter
Warm
Winter
+7%
+6%
to
8%
49
b
_ _ _ _ _
b Non-GAAP
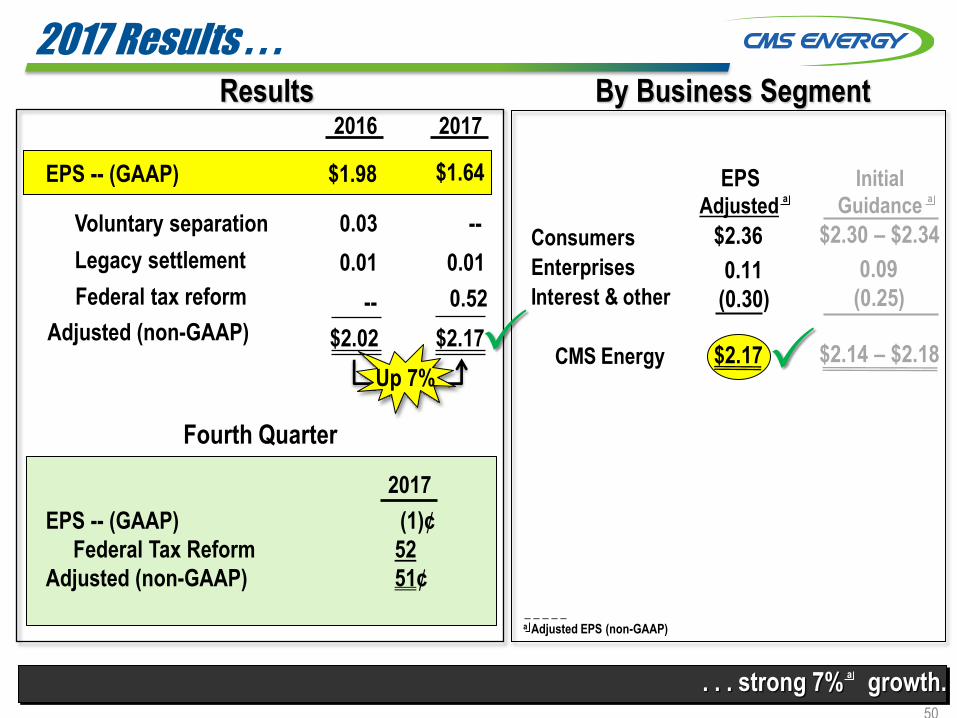
2017 Results . . .
. . . strong 7% growth.
Results
$1.98
2016 2017
$1.64 EPS -- (GAAP)
Up 7%
Voluntary separation
Legacy settlement
Adjusted (non-GAAP)
--
0.01
$2.17
0.03
0.01
$2.02
By Business Segment
Consumers
Enterprises
Interest & other
CMS Energy
$2.36
0.11
(0.30)
$2.17
EPS Adjusted
Federal tax reform -- 0.52
EPS -- (GAAP)
Federal Tax Reform
Adjusted (non-GAAP)
(1)¢
52
51¢
2017
Fourth Quarter
a
$2.30 – $2.34
0.09
(0.25)
$2.14 – $2.18
Initial
Guidance
50
_ _ _ _ _
a Adjusted EPS (non-GAAP)
a
a
$1.00
$1.20
$1.40
$1.60
$1.80
$2.00
$2.20
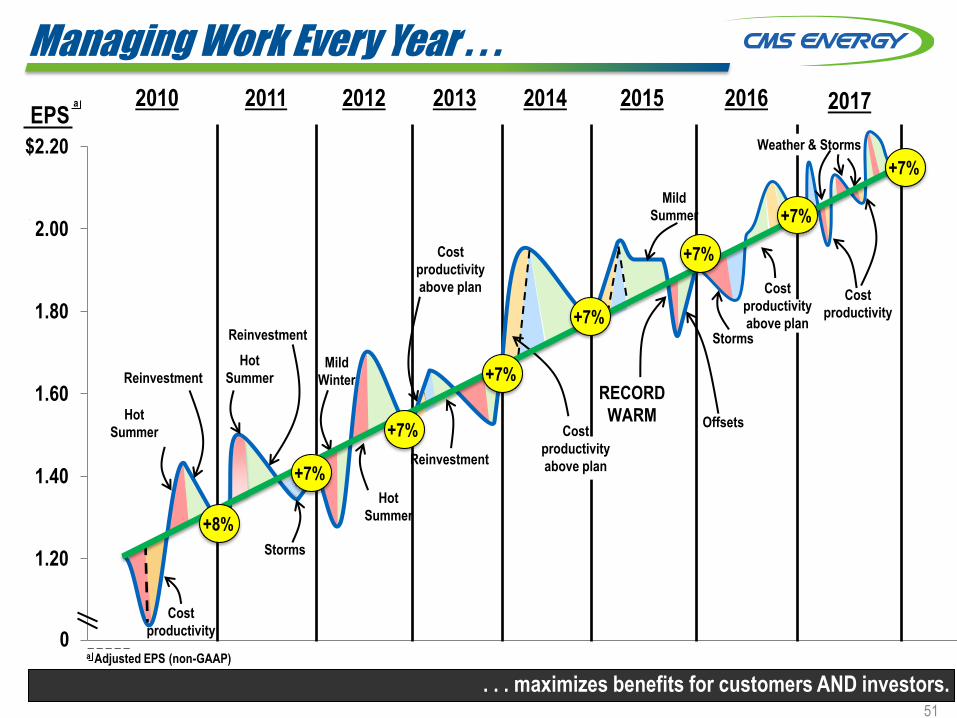
Managing Work Every Year . . .
. . . maximizes benefits for customers AND investors.
2010 2011 2012 2013 2014 2015
Offsets
RECORD
WARM
Mild
Summer
Cost
productivity
above plan
Reinvestment
Hot
Summer
Mild
Winter
Hot
Summer
Storms
Hot
Summer Cost
productivity
above plan
0
Cost
productivity
Reinvestment
Reinvestment
EPS
_ _ _ _ _
a Adjusted EPS (non-GAAP)
a 2016
Storms
Cost
productivity
above plan
Cost
productivity
2017
+7%
+7%
+7%
+7%
+8%
+7%
+7%
+7%
51
Weather & Storms

2017 Financial Targets Achieved . . .
Adjusted EPS (non-GAAP)
Operating cash flow (MM)
Dividend payout ratio (non-GAAP)
Customer price (excl. fuel)
Electric
Gas
FFO/average debt (non-GAAP)
Customer investment (Bn)
. . . 15th year of consistent, industry-leading financial performance.
Target
$2.14 to $2.18
+6% to +8%
$1,650
~2%
~18%
> 62%
$1.8
Actual
~2%
$2.17
+7%
$1,705
1.9%
~19¾%
62%
$1.9
1.2%
52
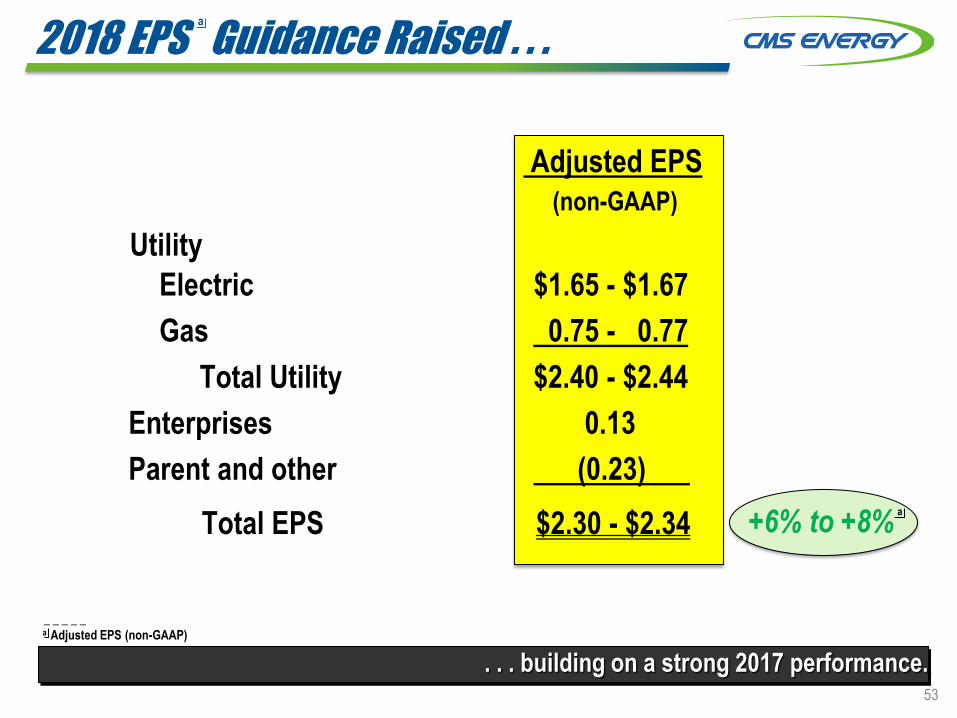
2018 EPS Guidance Raised . . .
. . . building on a strong 2017 performance.
Adjusted EPS
(non-GAAP)
Utility
Electric $1.65 - $1.67
Gas 0.75 - 0.77
Total Utility $2.40 - $2.44
Enterprises 0.13
Parent and other (0.23)
Total EPS $2.30 - $2.34
a
_ _ _ _ _
a Adjusted EPS (non-GAAP)
+6% to +8% a
53
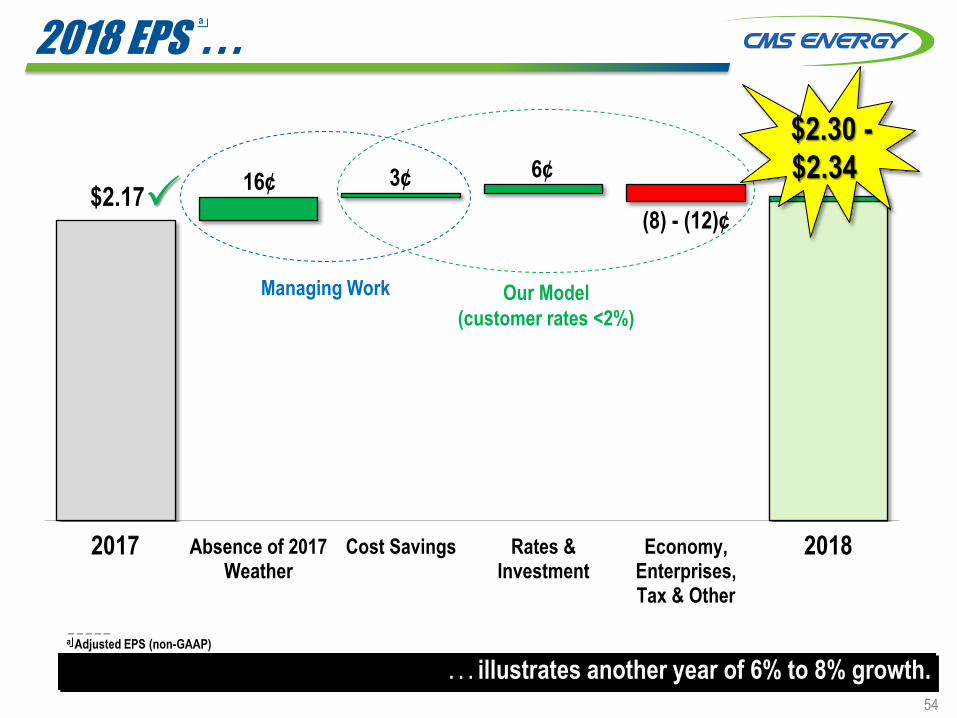
2018 EPS . . .
2016 Absence of 2017Weather
Cost Savings Rates &Investment
Economy,Enterprises,Tax & Other
2017
. . . illustrates another year of 6% to 8% growth.
(8) - (12)¢
a
_ _ _ _ _
a Adjusted EPS (non-GAAP)
3¢ 6¢
Managing Work Our Model
(customer rates <2%)
2017 2018
16¢ $2.17
$2.30 -
$2.34
54
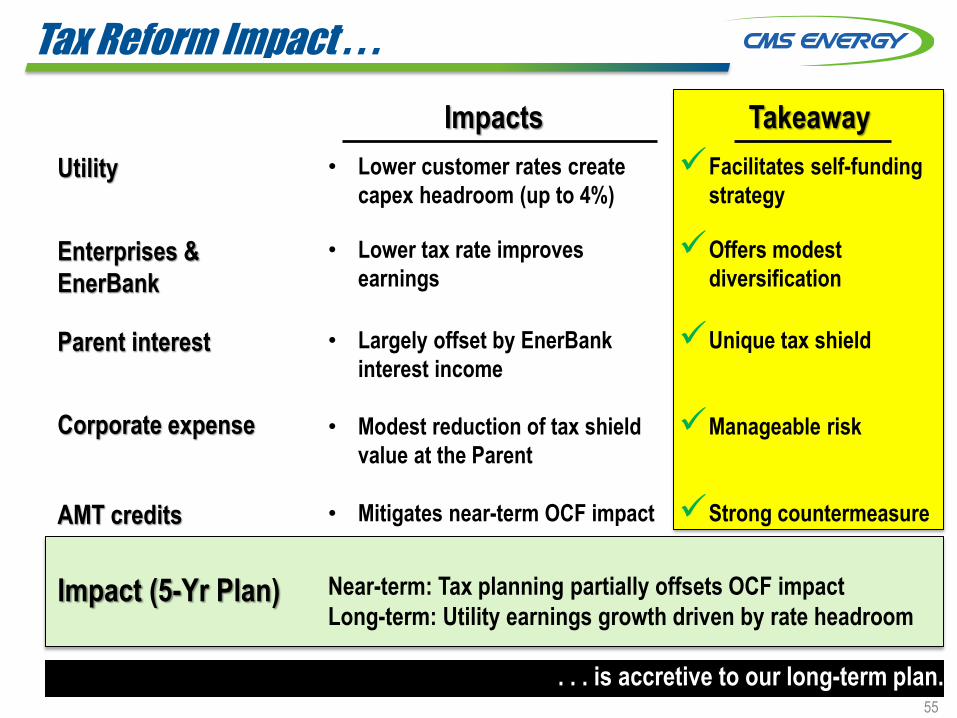
Tax Reform Impact . . .
. . . is accretive to our long-term plan.
Impacts Takeaway
Utility • Lower customer rates create
capex headroom (up to 4%)
Facilitates self-funding
strategy
Enterprises &
EnerBank
• Lower tax rate improves
earnings
Offers modest
diversification
Parent interest
Corporate expense
• Largely offset by EnerBank
interest income
• Modest reduction of tax shield
value at the Parent
Unique tax shield
Manageable risk
AMT credits • Mitigates near-term OCF impact Strong countermeasure
Impact (5-Yr Plan) Near-term: Tax planning partially offsets OCF impact
Long-term: Utility earnings growth driven by rate headroom
55

Needed Customer Investment . . .
. . . potentially pulled forward by tax reform.
2017 2022
$21 Bn
Rate Base Growth Large and Aging System
$15 Bn
>$50 Bn
System Need
$10 Bn
5-Yr Plan
Gas
Electric
7%
CAGR
30%
70%
40%
60%
56
>$18 Bn
10-Yr

Operating Cash Flow Generation . . .
. . . remains strong and supports our capital plan.
(1.1)
(0.6)
(0.1)
0.4
0.9
1.4
1.9
2.4
2.9
2017 2018 2019 2020 2021 2022
Amount
(Bn)
$
Investment
Cash flow before dividend _ _ _ _ _
a Non-GAAP
NOLs & credits $0.7 $0.4 $0.3 $0.3 $0.3 $0.2
Interest, working capital and taxes
2.2
2.7 2.6
Operating cash flow
2.3
2.0
2.5
1.65 1.65
57
1.7
Gross operating cash flow a
~$9 billion in aggregate

S&P /
Fitch Moody’s
S&P
(Dec. ‘16)
Moody’s
(Apr. ‘17)
Fitch
(Jul. ‘17)
AA- Aa3
A+ A1
A A2
A- A3
BBB+ Baa1
BBB Baa2
BBB- Baa3
BB+ Ba1
BBB+ Baa1
BBB Baa2
BBB- Baa3
BB+ Ba1
BB Ba2
BB- Ba3
B+ B1
B B2
B- B3
Outlook Stable Stable Stable
FFO / Average Debt
. . . at solid investment-grade levels.
Credit Metrics Maintained . . .
Target Range 2018 (w/ TaxReform)
~18%
19%
17%
Present
Prior
2002
Consumers Secured
CMS Unsecured
_ _ _ _ _
a Non-GAAP
a
< 30% HoldCo Debt
58
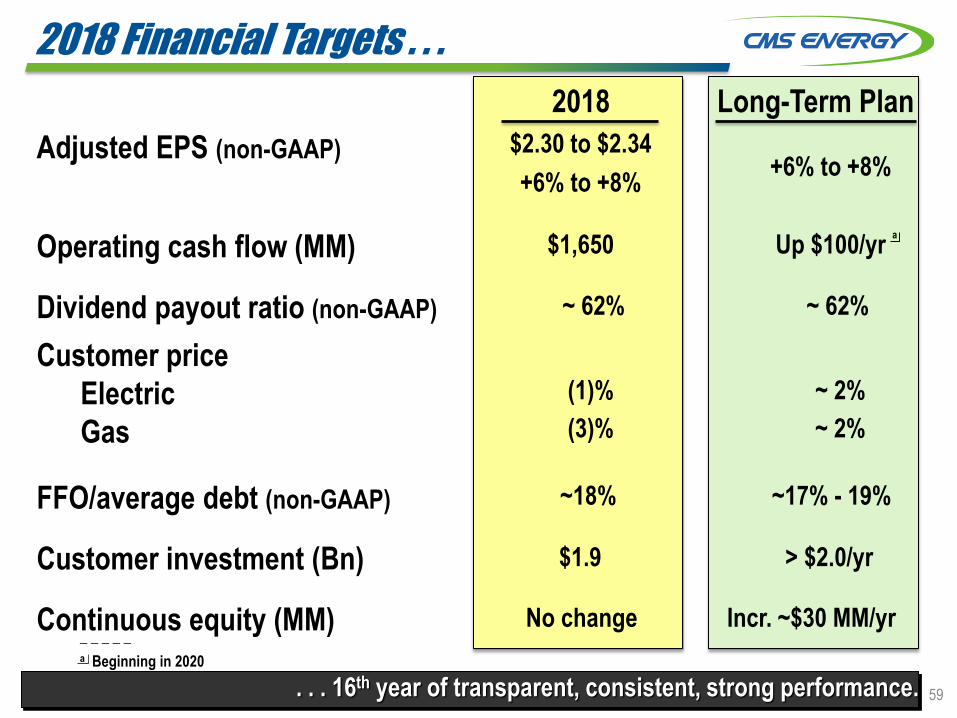
2018 Financial Targets . . .
Adjusted EPS (non-GAAP)
Operating cash flow (MM)
Dividend payout ratio (non-GAAP)
Customer price
Electric
Gas
FFO/average debt (non-GAAP)
Customer investment (Bn)
Continuous equity (MM)
. . . 16th year of transparent, consistent, strong performance.
2018
$2.30 to $2.34
+6% to +8%
$1,650
(1)%
~18%
~ 62%
$1.9
Long-Term Plan
+6% to +8%
Up $100/yr
~ 2%
~17% - 19%
~ 62%
> $2.0/yr
No change Incr. ~$30 MM/yr
(3)% ~ 2%
_ _ _ _ _
a Beginning in 2020
a
59
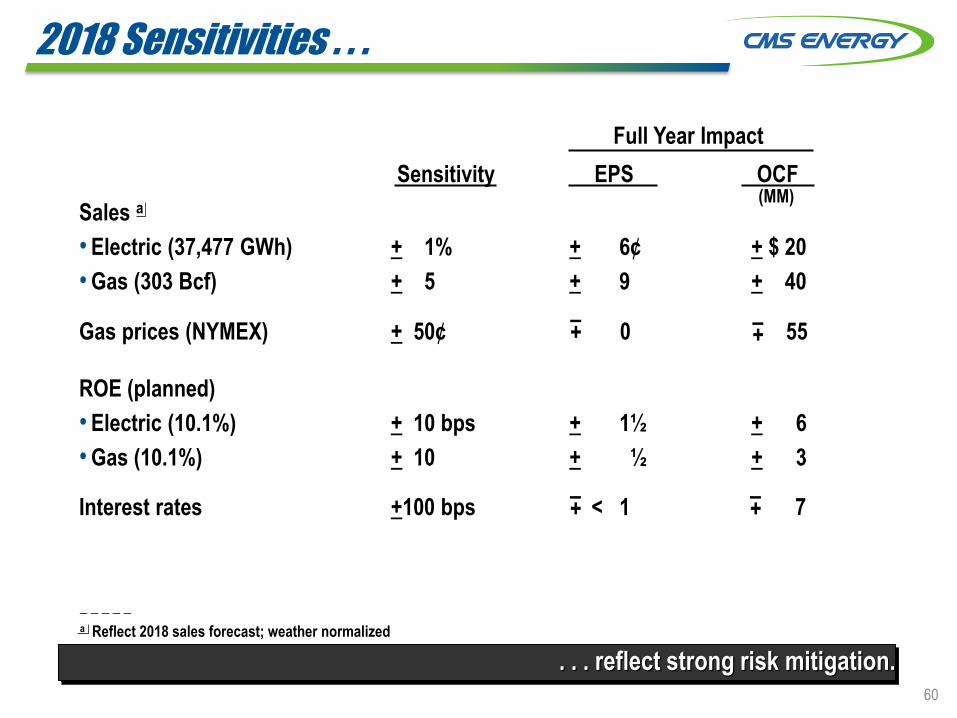
2018 Sensitivities . . .
Full Year Impact
Sensitivity EPS OCF
Sales a
• Electric (37,477 GWh)
• Gas (303 Bcf)
+ 1%
+ 5
+ 6¢
+ 9
+ $ 20
+ 40
Gas prices (NYMEX) + 50¢ 0 55
ROE (planned)
• Electric (10.1%)
• Gas (10.1%)
+ 10 bps
+ 10
+ 1½
+ ½
+ 6
+ 3
Interest rates
+100 bps
< 1
7
– +
. . . reflect strong risk mitigation.
– +
(MM)
_ _ _ _ _
a Reflect 2018 sales forecast; weather normalized
– +
– +
60
Compelling Investment Thesis
Aging
Infrastructure
Diversified Service Territory
Cost Controls
Strong Cash Flow &
Healthy Balance Sheet
Constructive Regulation 61 _ _ _ _ _
b Case U-17990, 2016 Order
_ _ _ _ _
a Case U-16191
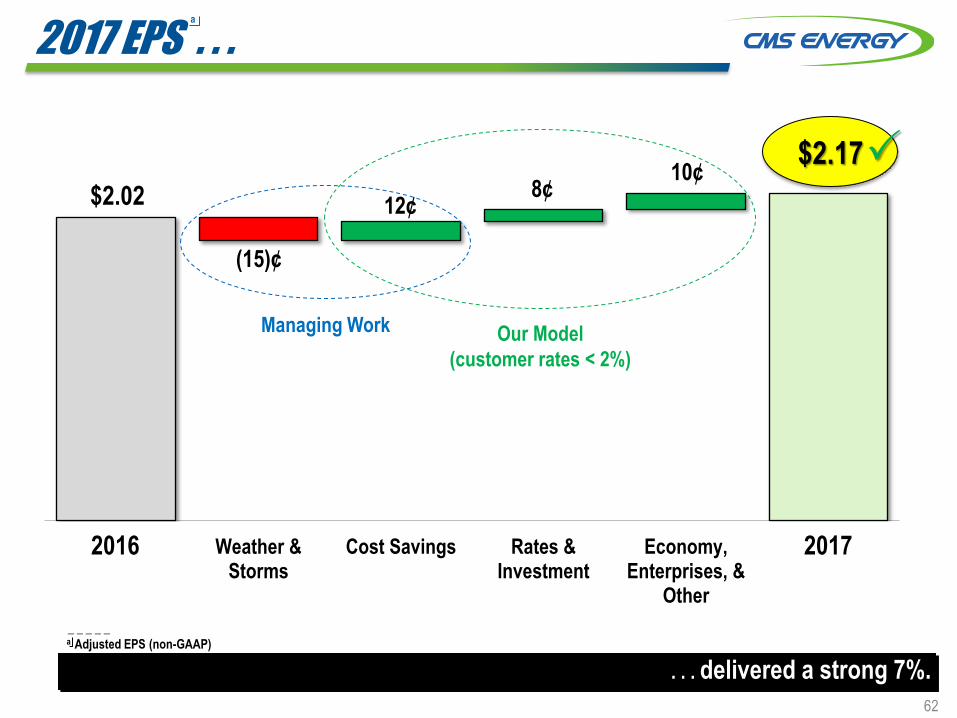
2017 EPS . . .
2016 Weather &Storms
Cost Savings Rates &Investment
Economy,Enterprises, &
Other
2017
. . . delivered a strong 7%.
10¢
a
_ _ _ _ _
a Adjusted EPS (non-GAAP)
12¢ 8¢
Managing Work Our Model
(customer rates < 2%)
2016 2017
(15)¢
$2.02
$2.17
62

“DIG” (750 MW) & Peakers (200 MW) . . .
. . . offers risk mitigation to Plan.
0
10
20
30
40
50
60
70
80
2015 2016 2017 2018
Pre-Tax Income (MM)
$12
$30
$45
Outage
pull-ahead
Better
Performance
Future
Opportunities
Capacity ($/kw-mth) ≈ $1.00 ≈ $2.00 ≈ $3.00 $4.50 $7.50
Available:
• Energy • Capacity
0% 0% 25%
0 0 0
$
+$20
+$40
Contracts
(layering in over time)
$75
$55
50% - 90%
0%
Better
Performance $35
≈ $3.00
<30
0%
63

2017 Cash Flow (non-GAAP)
CMS Energy Parent
Cash at year end 2016 43$
Sources
Consumers Energy dividend and tax sharing 523$
Enterprises & other 85
Sources 608$
Uses
Interest and preferred dividend (133)$
Overhead, tax payments, & other (57)
Equity infusion (450)
Pension contribution 0
Uses (640)$
Cash flow (32)$
Financing and Dividend
New issues 575$
Retirements (200)
DRP, continuous equity 83
Net short-term financing & other (19)
Common dividend (375)
Financing 64$
Cash at year end 2017 75$
Bank facility ($550) available 544$
Amount(MM)
Consumers Energy
b Includes restricted cash
Cash at year end 2016 152$
Sources
Operating (depreciation & amortization $872) 2,122$
Other working capital (198)
Sources 1,924$
Uses
Interest and preferred dividend (254)$
Capital expenditures (1,750)
Dividend and tax sharing CMS Energy Parent (523)
Pension contribution 0
Uses (2,527)$
Cash flow (603)$
Financing
Equity 450$
New issues 835
Retirements (530)
Net short-term financing & other (239)
Financing 516$
Cash at year end 2017 65$
Bank facilities ($900) available 703$
Amount(MM)
_ _ _ _ a Includes cost of removal and capital leases
64
b
b
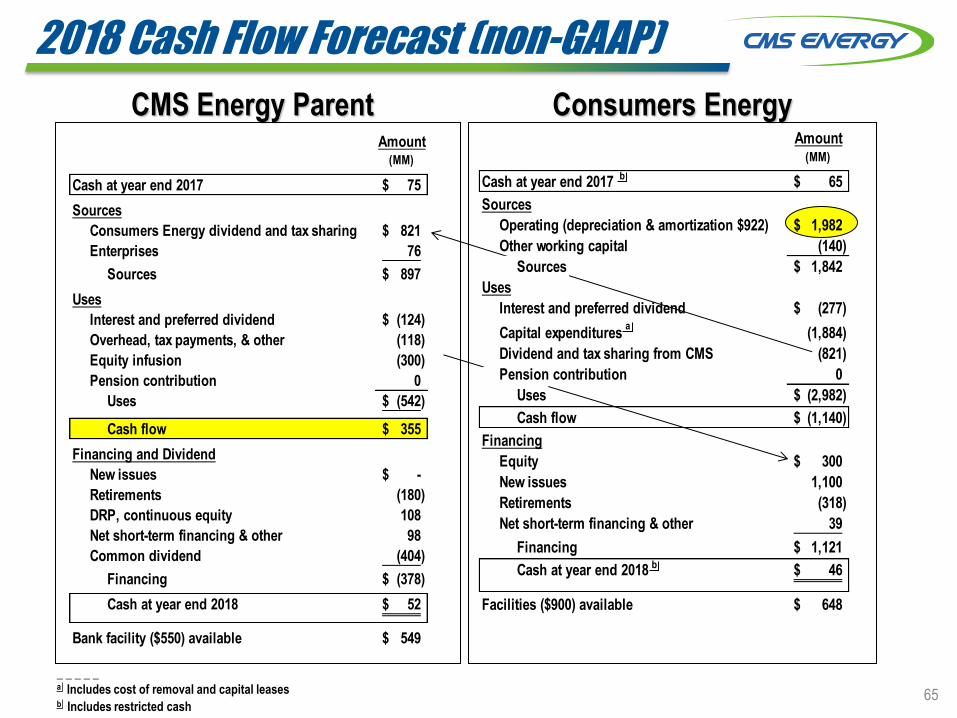
2018 Cash Flow Forecast (non-GAAP)
CMS Energy Parent
Cash at year end 2017 75$
Sources
Consumers Energy dividend and tax sharing 821$
Enterprises 76
Sources 897$
Uses
Interest and preferred dividend (124)$
Overhead, tax payments, & other (118)
Equity infusion (300)
Pension contribution 0
Uses (542)$
Cash flow 355$
Financing and Dividend
New issues -$
Retirements (180)
DRP, continuous equity 108
Net short-term financing & other 98
Common dividend (404)
Financing (378)$
Cash at year end 2018 52$
Bank facility ($550) available 549$
Amount(MM)
Consumers Energy
_ _ _ _ _ a Includes cost of removal and capital leases b Includes restricted cash
Cash at year end 2017 65$
Sources
Operating (depreciation & amortization $922) 1,982$
Other working capital (140)
Sources 1,842$
Uses
Interest and preferred dividend (277)$
Capital expenditures (1,884)
Dividend and tax sharing from CMS (821)
Pension contribution 0
Uses (2,982)$
Cash flow (1,140)$
Financing
Equity 300$
New issues 1,100
Retirements (318)
Net short-term financing & other 39
Financing 1,121$
Cash at year end 2018 46$
Facilities ($900) available 648$
Amount(MM)
65
a
b
b

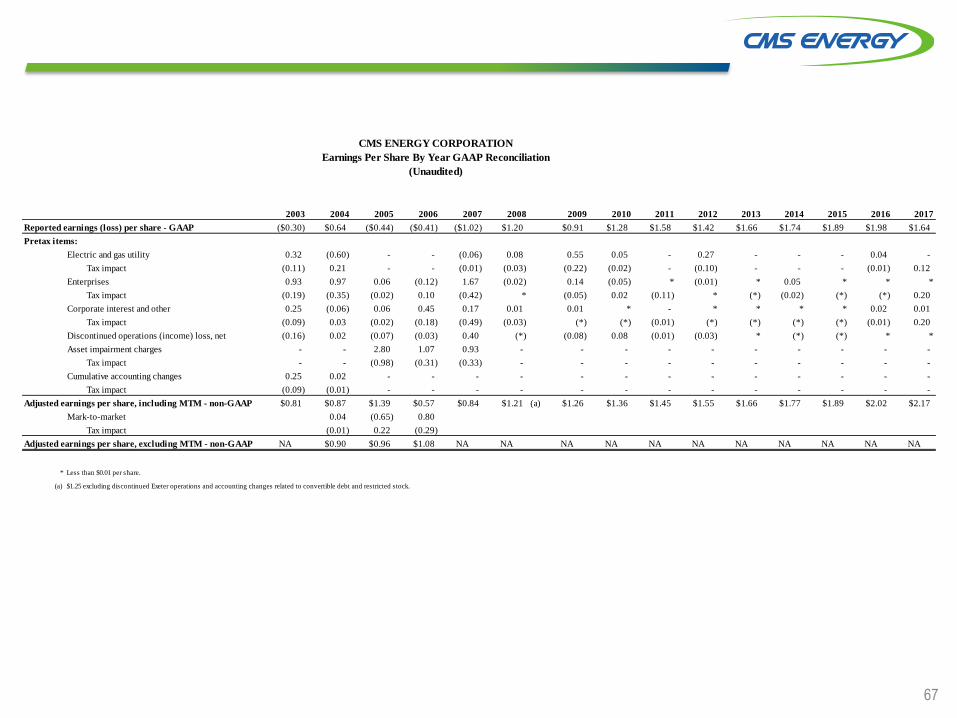
GAAP Reconciliation
67
2003 2004 2005 2006 2007 2008 2009 2010 2011 2012 2013 2014 2015 2016 2017
Reported earnings (loss) per share - GAAP ($0.30) $0.64 ($0.44) ($0.41) ($1.02) $1.20 $0.91 $1.28 $1.58 $1.42 $1.66 $1.74 $1.89 $1.98 $1.64
Pretax items:
Electric and gas utility 0.32 (0.60) - - (0.06) 0.08 0.55 0.05 - 0.27 - - - 0.04 -
Tax impact (0.11) 0.21 - - (0.01) (0.03) (0.22) (0.02) - (0.10) - - - (0.01) 0.12
Enterprises 0.93 0.97 0.06 (0.12) 1.67 (0.02) 0.14 (0.05) * (0.01) * 0.05 * * *
Tax impact (0.19) (0.35) (0.02) 0.10 (0.42) * (0.05) 0.02 (0.11) * (*) (0.02) (*) (*) 0.20
Corporate interest and other 0.25 (0.06) 0.06 0.45 0.17 0.01 0.01 * - * * * * 0.02 0.01
Tax impact (0.09) 0.03 (0.02) (0.18) (0.49) (0.03) (*) (*) (0.01) (*) (*) (*) (*) (0.01) 0.20
Discontinued operations (income) loss, net (0.16) 0.02 (0.07) (0.03) 0.40 (*) (0.08) 0.08 (0.01) (0.03) * (*) (*) * *
Asset impairment charges - - 2.80 1.07 0.93 - - - - - - - - - -
Tax impact - - (0.98) (0.31) (0.33) - - - - - - - - - -
Cumulative accounting changes 0.25 0.02 - - - - - - - - - - - - -
Tax impact (0.09) (0.01) - - - - - - - - - - - - -
Adjusted earnings per share, including MTM - non-GAAP $0.81 $0.87 $1.39 $0.57 $0.84 $1.21 (a) $1.26 $1.36 $1.45 $1.55 $1.66 $1.77 $1.89 $2.02 $2.17
Mark-to-market 0.04 (0.65) 0.80
Tax impact (0.01) 0.22 (0.29)
Adjusted earnings per share, excluding MTM - non-GAAP NA $0.90 $0.96 $1.08 NA NA NA NA NA NA NA NA NA NA NA
* Less than $0.01 per share.
(a) $1.25 excluding discontinued Exeter operations and accounting changes related to convertible debt and restricted stock.
CMS ENERGY CORPORATION
Earnings Per Share By Year GAAP Reconciliation
(Unaudited)
68
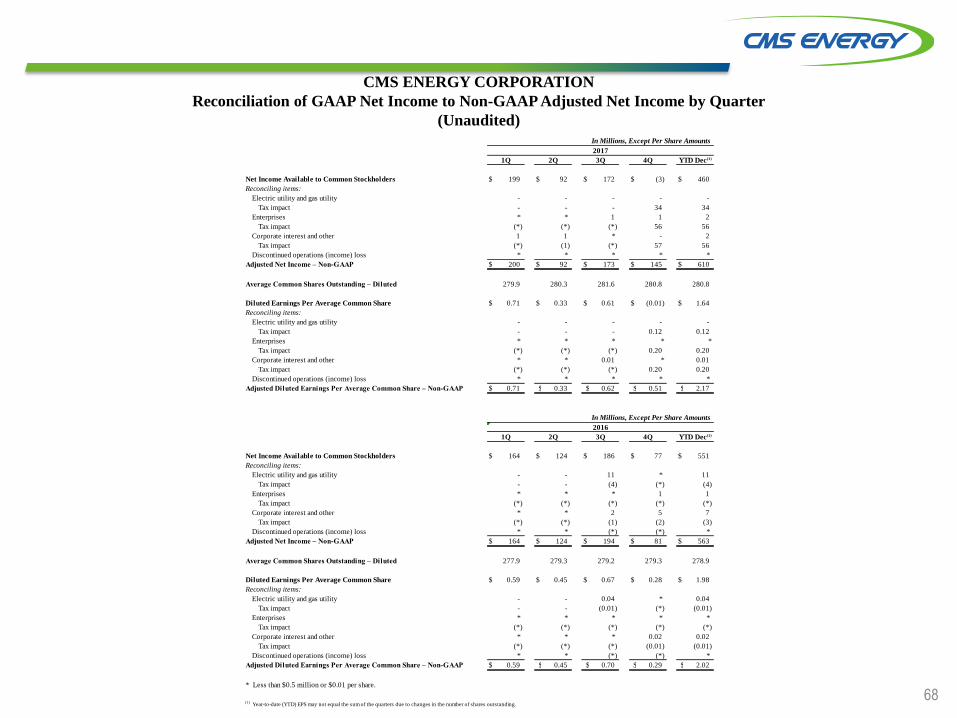
CMS ENERGY CORPORATION
Reconciliation of GAAP Net Income to Non-GAAP Adjusted Net Income by Quarter
(Unaudited)
Net Income Available to Common Stockholders $ 199 $ 92 $ 172 $ (3) $ 460
Reconciling items:
Electric utility and gas utility - - - - -
Tax impact - - - 34 34
Enterprises * * 1 1 2
Tax impact (*) (*) (*) 56 56
Corporate interest and other 1 1 * - 2
Tax impact (*) (1) (*) 57 56
Discontinued operations (income) loss * * * * *
Adjusted Net Income – Non-GAAP $ 200 $ 92 $ 173 $ 145 $ 610
Average Common Shares Outstanding – Diluted 279.9 280.3 281.6 280.8 280.8
Diluted Earnings Per Average Common Share $ 0.71 $ 0.33 $ 0.61 $ (0.01) $ 1.64
Reconciling items:
Electric utility and gas utility - - - - -
Tax impact - - - 0.12 0.12
Enterprises * * * * *
Tax impact (*) (*) (*) 0.20 0.20
Corporate interest and other * * 0.01 * 0.01
Tax impact (*) (*) (*) 0.20 0.20
Discontinued operations (income) loss * * * * *
Adjusted Diluted Earnings Per Average Common Share – Non-GAAP $ 0.71 $ 0.33 $ 0.62 $ 0.51 $ 2.17
Net Income Available to Common Stockholders $ 164 $ 124 $ 186 $ 77 $ 551
Reconciling items:
Electric utility and gas utility - - 11 * 11
Tax impact - - (4) (*) (4)
Enterprises * * * 1 1
Tax impact (*) (*) (*) (*) (*)
Corporate interest and other * * 2 5 7
Tax impact (*) (*) (1) (2) (3)
Discontinued operations (income) loss * * (*) (*) *
Adjusted Net Income – Non-GAAP $ 164 $ 124 $ 194 $ 81 $ 563
Average Common Shares Outstanding – Diluted 277.9 279.3 279.2 279.3 278.9
Diluted Earnings Per Average Common Share $ 0.59 $ 0.45 $ 0.67 $ 0.28 $ 1.98
Reconciling items:
Electric utility and gas utility - - 0.04 * 0.04
Tax impact - - (0.01) (*) (0.01)
Enterprises * * * * *
Tax impact (*) (*) (*) (*) (*)
Corporate interest and other * * * 0.02 0.02
Tax impact (*) (*) (*) (0.01) (0.01)
Discontinued operations (income) loss * * (*) (*) *
Adjusted Diluted Earnings Per Average Common Share – Non-GAAP $ 0.59 $ 0.45 $ 0.70 $ 0.29 $ 2.02
* Less than $0.5 million or $0.01 per share.
(1)Year-to-date (YTD) EPS may not equal the sum of the quarters due to changes in the number of shares outstanding.
1Q 2Q 3Q 4Q YTD Dec(1)
In Millions, Except Per Share Amounts
2016
In Millions, Except Per Share Amounts
2017
1Q 2Q 3Q 4Q YTD Dec(1)
69
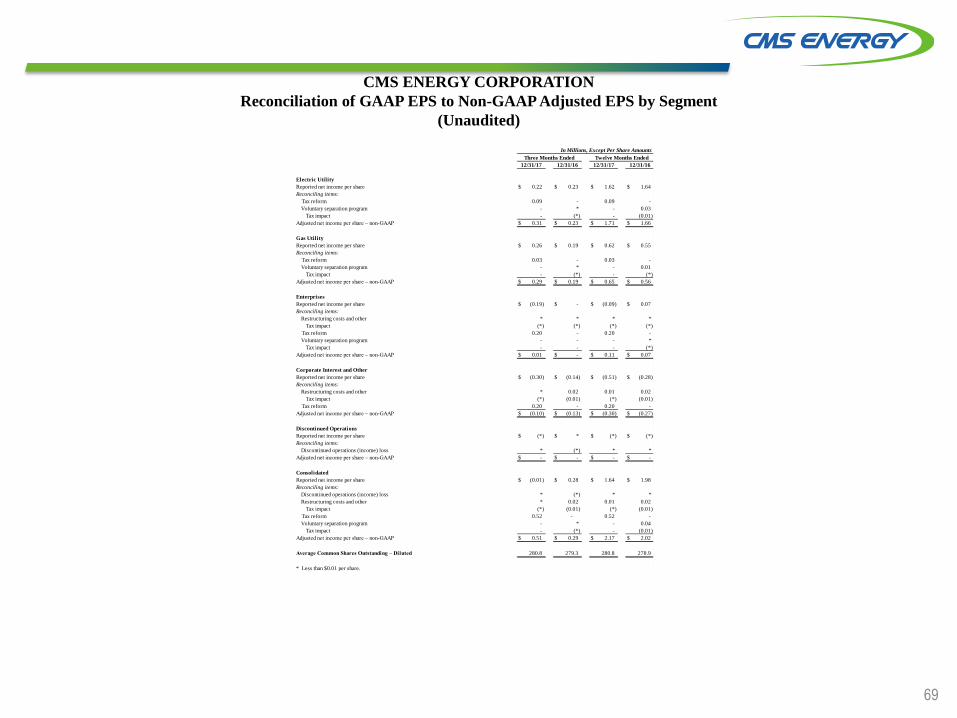
CMS ENERGY CORPORATION
Reconciliation of GAAP EPS to Non-GAAP Adjusted EPS by Segment
(Unaudited)
Electric Utility
Reported net income per share $ 0.22 $ 0.23 $ 1.62 $ 1.64
Reconciling items:
Tax reform 0.09 - 0.09 -
Voluntary separation program - * - 0.03
Tax impact - (*) - (0.01)
Adjusted net income per share – non-GAAP $ 0.31 $ 0.23 $ 1.71 $ 1.66
Gas Utility
Reported net income per share $ 0.26 $ 0.19 $ 0.62 $ 0.55
Reconciling items:
Tax reform 0.03 - 0.03 -
Voluntary separation program - * - 0.01
Tax impact - (*) - (*)
Adjusted net income per share – non-GAAP $ 0.29 $ 0.19 $ 0.65 $ 0.56
Enterprises
Reported net income per share $ (0.19) $ - $ (0.09) $ 0.07
Reconciling items:
Restructuring costs and other * * * *
Tax impact (*) (*) (*) (*)
Tax reform 0.20 - 0.20 -
Voluntary separation program - - - *
Tax impact - - - (*)
Adjusted net income per share – non-GAAP $ 0.01 $ - $ 0.11 $ 0.07
Corporate Interest and Other
Reported net income per share $ (0.30) $ (0.14) $ (0.51) $ (0.28)
Reconciling items:
Restructuring costs and other * 0.02 0.01 0.02
Tax impact (*) (0.01) (*) (0.01)
Tax reform 0.20 - 0.20 -
Adjusted net income per share – non-GAAP $ (0.10) $ (0.13) $ (0.30) $ (0.27)
Discontinued Operations
Reported net income per share $ (*) $ * $ (*) $ (*)
Reconciling items:
Discontinued operations (income) loss * (*) * *
Adjusted net income per share – non-GAAP $ - $ - $ - $ -
Consolidated
Reported net income per share $ (0.01) $ 0.28 $ 1.64 $ 1.98
Reconciling items:
Discontinued operations (income) loss * (*) * *
Restructuring costs and other * 0.02 0.01 0.02
Tax impact (*) (0.01) (*) (0.01)
Tax reform 0.52 - 0.52 -
Voluntary separation program - * - 0.04
Tax impact - (*) - (0.01)
Adjusted net income per share – non-GAAP $ 0.51 $ 0.29 $ 2.17 $ 2.02
Average Common Shares Outstanding – Diluted 280.8 279.3 280.8 278.9
* Less than $0.01 per share.
In Millions, Except Per Share Amounts
Three Months Ended Twelve Months Ended
12/31/17 12/31/16 12/31/17 12/31/16
70
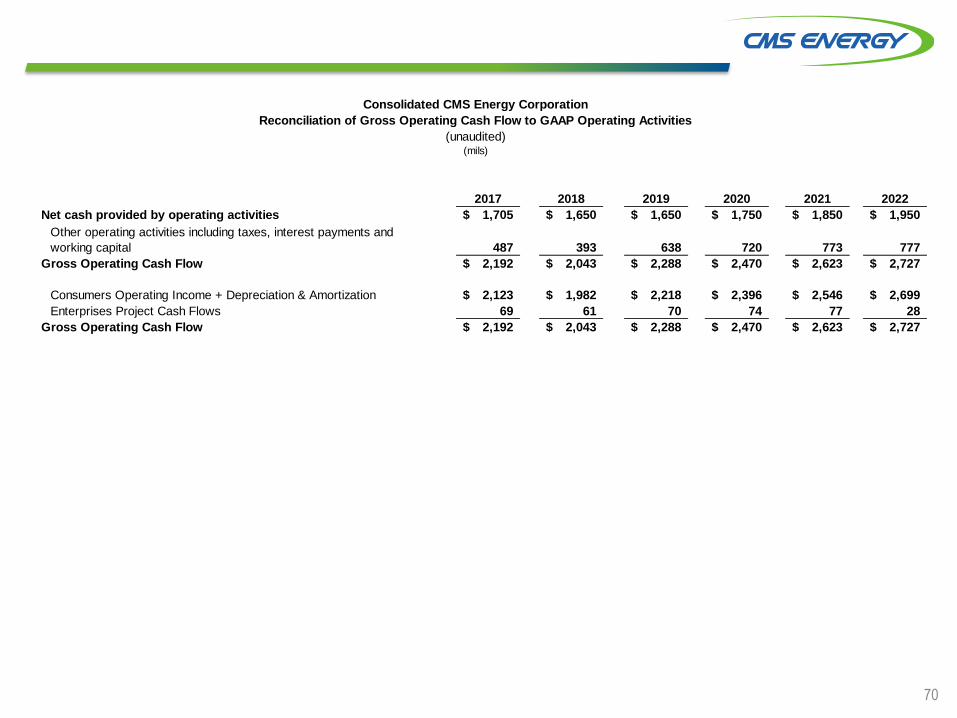
2017 2018 2019 2020 2021 2022
Net cash provided by operating activities 1,705$ 1,650$ 1,650$ 1,750$ 1,850$ 1,950$
487 393 638 720 773 777
Gross Operating Cash Flow 2,192$ 2,043$ 2,288$ 2,470$ 2,623$ 2,727$
Consumers Operating Income + Depreciation & Amortization 2,123$ 1,982$ 2,218$ 2,396$ 2,546$ 2,699$
Enterprises Project Cash Flows 69 61 70 74 77 28
Gross Operating Cash Flow 2,192$ 2,043$ 2,288$ 2,470$ 2,623$ 2,727$
Other operating activities including taxes, interest payments and
working capital
Consolidated CMS Energy Corporation
Reconciliation of Gross Operating Cash Flow to GAAP Operating Activities
(unaudited)(mils)

71
Interest/ Capital
Tax Other Financing Lease Pymts Securitization Common
GAAP Sharing Payments Other Investing and Other Debt Pymts Dividends non-GAAP
Amount Operating from Operating as Financing from Financing from Financing from Financing Amount Description
Cash at year end 2016 152$ -$ -$ -$ -$ -$ -$ 152$ Cash at year end 2016
Sources
2,122$ Operating (dep & amort $872)
Net cash provided by (198) Other working capital
operating activities 1,715$ 1$ 254$ (21)$ (25)$ -$ 1,924$ Sources
Uses
(254)$ Interest and preferred dividends
(1,750) Capital expenditures a
(523) Dividends/tax sharing to CMS
Net cash used in - Pension Contribution & Other
investing activities (1,751)$ (1)$ (254)$ 1$ -$ -$ (522)$ (2,527)$ Uses
Cash flow used in
operating and (36)$ -$ -$ 1$ (21)$ (25)$ (522)$ (603)$ Cash flow
investing activities
Financing
450$ Equity
835 New Issues
(530) Retirements
Net cash used in (239) Net short-term financing & other
financing activities (51)$ -$ -$ (1)$ 21$ 25$ 522$ 516$ Financing
Net change in cash (87)$ -$ -$ -$ -$ -$ -$ (87)$ Net change in cash
Cash at year end 2017 65$ -$ -$ -$ -$ -$ -$ 65$ Cash at year end 2017 b
a Includes cost of removal and capital leases
b Includes restricted cash
Consumers Energy Company
2017 Cash Flow GAAP Reconciliation (in millions) (unaudited)
Reclassifications From Sources and Uses to Statement of Cash Flows to Sources and Uses
Consolidated Statements of Cash Flows Presentation Sources and Uses
Description
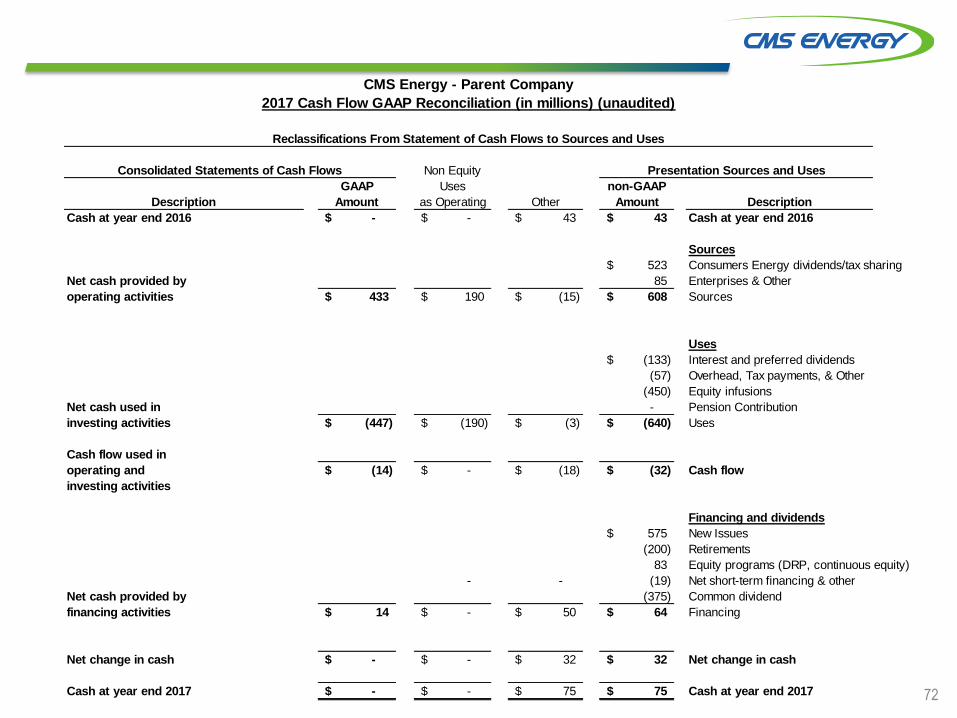
72
Non Equity
GAAP Uses non-GAAP
Amount as Operating Other Amount Description
Cash at year end 2016 -$ -$ 43$ 43$ Cash at year end 2016
Sources
523$ Consumers Energy dividends/tax sharing
Net cash provided by 85 Enterprises & Other
operating activities 433$ 190$ (15)$ 608$ Sources
Uses
(133)$ Interest and preferred dividends
(57) Overhead, Tax payments, & Other
(450) Equity infusions
Net cash used in - Pension Contribution
investing activities (447)$ (190)$ (3)$ (640)$ Uses
Cash flow used in
operating and (14)$ -$ (18)$ (32)$ Cash flow
investing activities
Financing and dividends
575$ New Issues
(200) Retirements
83 Equity programs (DRP, continuous equity)
- - (19) Net short-term financing & other
Net cash provided by (375) Common dividend
financing activities 14$ -$ 50$ 64$ Financing
Net change in cash -$ -$ 32$ 32$ Net change in cash
Cash at year end 2017 -$ -$ 75$ 75$ Cash at year end 2017
Description
CMS Energy - Parent Company
2017 Cash Flow GAAP Reconciliation (in millions) (unaudited)
Reclassifications From Statement of Cash Flows to Sources and Uses
Consolidated Statements of Cash Flows Presentation Sources and Uses
73
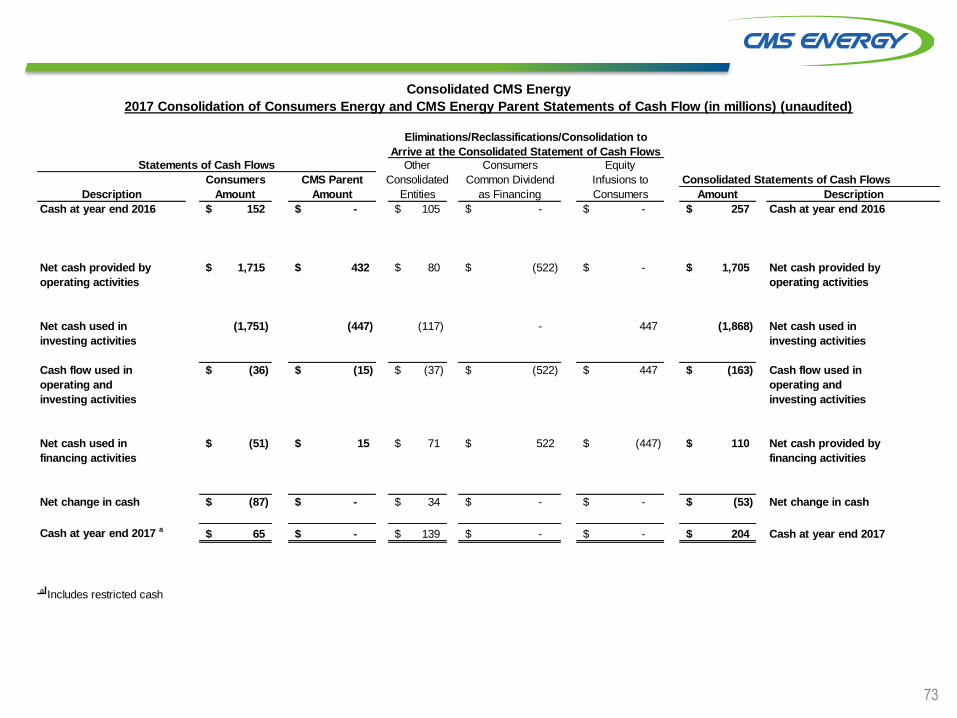
Other Consumers Equity
Consumers CMS Parent Consolidated Common Dividend Infusions to Consolidated Statements of Cash Flows
Description Amount Amount Entities as Financing Consumers Amount Description
Cash at year end 2016 152$ -$ 105$ -$ -$ 257$ Cash at year end 2016
Net cash provided by 1,715$ 432$ 80$ (522)$ -$ 1,705$ Net cash provided by
operating activities operating activities
Net cash used in (1,751) (447) (117) - 447 (1,868) Net cash used in
investing activities investing activities
Cash flow used in (36)$ (15)$ (37)$ (522)$ 447$ (163)$ Cash flow used in
operating and operating and
investing activities investing activities
Net cash used in (51)$ 15$ 71$ 522$ (447)$ 110$ Net cash provided by
financing activities financing activities
Net change in cash (87)$ -$ 34$ -$ -$ (53)$ Net change in cash
Cash at year end 2017 a
65$ -$ 139$ -$ -$ 204$ Cash at year end 2017
a Includes restricted cash
Consolidated CMS Energy
2017 Consolidation of Consumers Energy and CMS Energy Parent Statements of Cash Flow (in millions) (unaudited)
Eliminations/Reclassifications/Consolidation to
Arrive at the Consolidated Statement of Cash Flows
Statements of Cash Flows
74
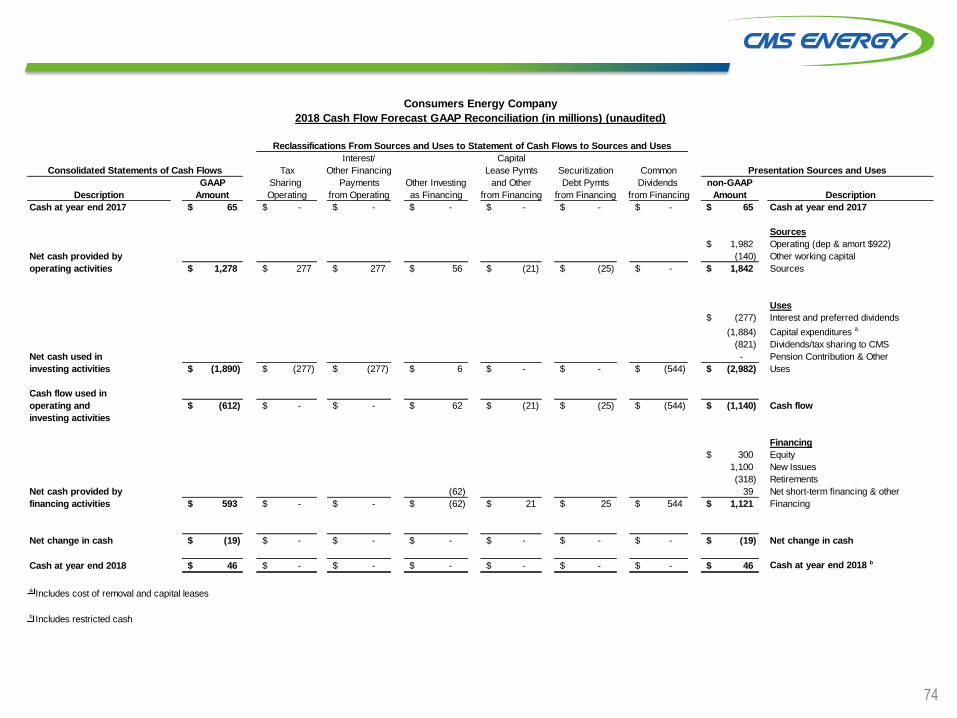
Interest/ Capital
Tax Other Financing Lease Pymts Securitization Common
GAAP Sharing Payments Other Investing and Other Debt Pymts Dividends non-GAAP
Amount Operating from Operating as Financing from Financing from Financing from Financing Amount Description
Cash at year end 2017 65$ -$ -$ -$ -$ -$ -$ 65$ Cash at year end 2017
Sources
1,982$ Operating (dep & amort $922)
Net cash provided by (140) Other working capital
operating activities 1,278$ 277$ 277$ 56$ (21)$ (25)$ -$ 1,842$ Sources
Uses
(277)$ Interest and preferred dividends
(1,884) Capital expenditures a
(821) Dividends/tax sharing to CMS
Net cash used in - Pension Contribution & Other
investing activities (1,890)$ (277)$ (277)$ 6$ -$ -$ (544)$ (2,982)$ Uses
Cash flow used in
operating and (612)$ -$ -$ 62$ (21)$ (25)$ (544)$ (1,140)$ Cash flow
investing activities
Financing
300$ Equity
1,100 New Issues
(318) Retirements
Net cash provided by (62) 39 Net short-term financing & other
financing activities 593$ -$ -$ (62)$ 21$ 25$ 544$ 1,121$ Financing
Net change in cash (19)$ -$ -$ -$ -$ -$ -$ (19)$ Net change in cash
Cash at year end 2018 46$ -$ -$ -$ -$ -$ -$ 46$ Cash at year end 2018 b
a Includes cost of removal and capital leases
b Includes restricted cash
Consumers Energy Company
2018 Cash Flow Forecast GAAP Reconciliation (in millions) (unaudited)
Reclassifications From Sources and Uses to Statement of Cash Flows to Sources and Uses
Consolidated Statements of Cash Flows Presentation Sources and Uses
Description
75
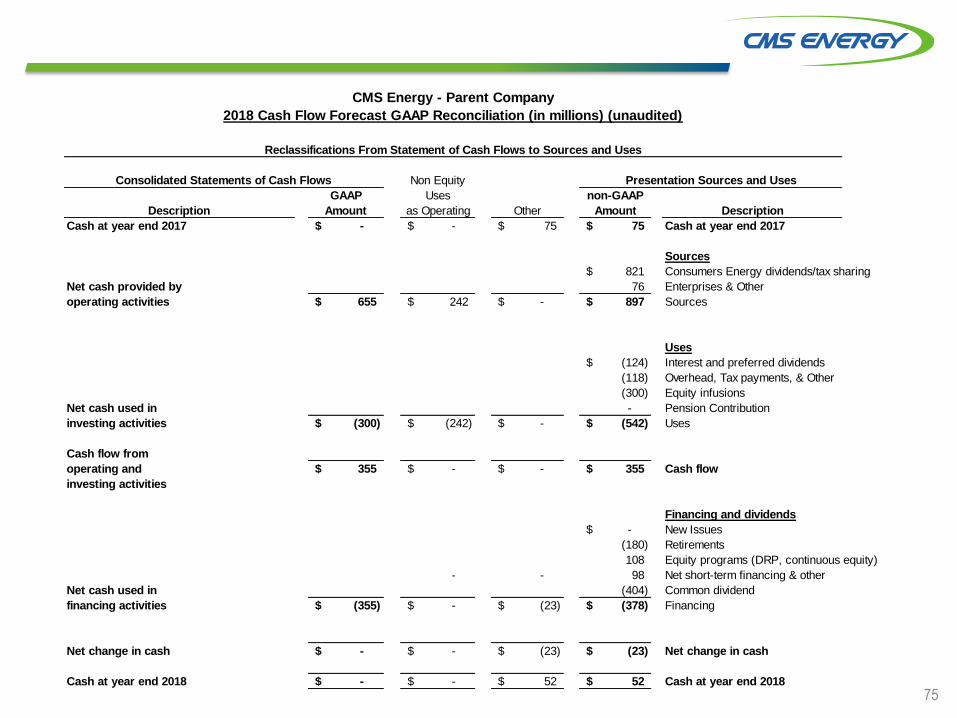
Non Equity
GAAP Uses non-GAAP
Amount as Operating Other Amount Description
Cash at year end 2017 -$ -$ 75$ 75$ Cash at year end 2017
Sources
821$ Consumers Energy dividends/tax sharing
Net cash provided by 76 Enterprises & Other
operating activities 655$ 242$ -$ 897$ Sources
Uses
(124)$ Interest and preferred dividends
(118) Overhead, Tax payments, & Other
(300) Equity infusions
Net cash used in - Pension Contribution
investing activities (300)$ (242)$ -$ (542)$ Uses
Cash flow from
operating and 355$ -$ -$ 355$ Cash flow
investing activities
Financing and dividends
-$ New Issues
(180) Retirements
108 Equity programs (DRP, continuous equity)
- - 98 Net short-term financing & other
Net cash used in (404) Common dividend
financing activities (355)$ -$ (23)$ (378)$ Financing
Net change in cash -$ -$ (23)$ (23)$ Net change in cash
Cash at year end 2018 -$ -$ 52$ 52$ Cash at year end 2018
Description
CMS Energy - Parent Company
2018 Cash Flow Forecast GAAP Reconciliation (in millions) (unaudited)
Reclassifications From Statement of Cash Flows to Sources and Uses
Consolidated Statements of Cash Flows Presentation Sources and Uses
76
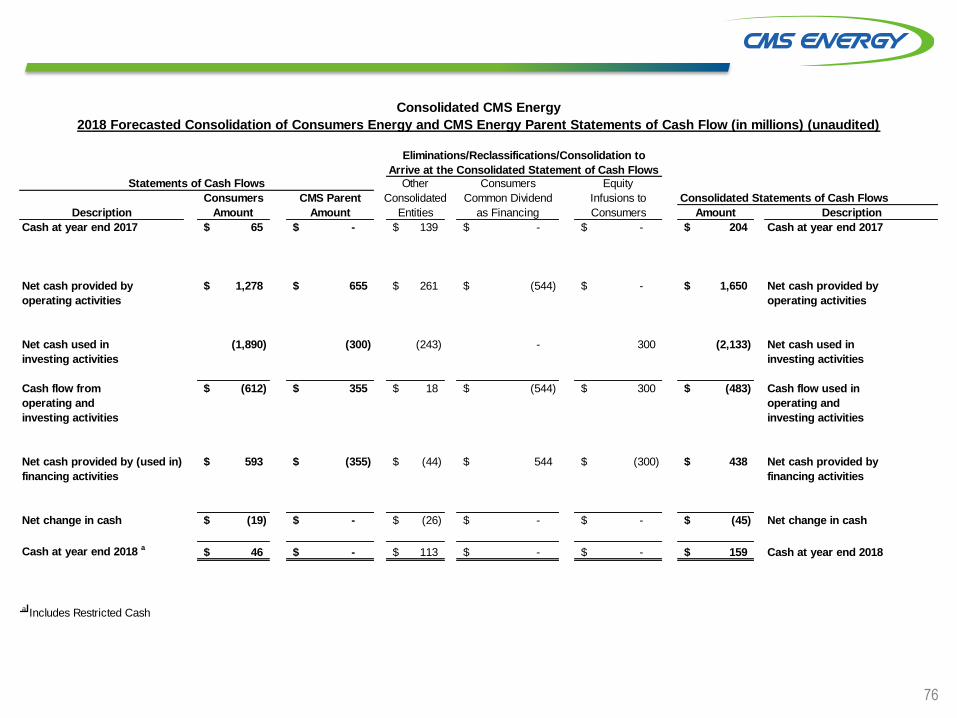
Other Consumers Equity
Consumers CMS Parent Consolidated Common Dividend Infusions to Consolidated Statements of Cash Flows
Description Amount Amount Entities as Financing Consumers Amount Description
Cash at year end 2017 65$ -$ 139$ -$ -$ 204$ Cash at year end 2017
Net cash provided by 1,278$ 655$ 261$ (544)$ -$ 1,650$ Net cash provided by
operating activities operating activities
Net cash used in (1,890) (300) (243) - 300 (2,133) Net cash used in
investing activities investing activities
Cash flow from (612)$ 355$ 18$ (544)$ 300$ (483)$ Cash flow used in
operating and operating and
investing activities investing activities
Net cash provided by (used in) 593$ (355)$ (44)$ 544$ (300)$ 438$ Net cash provided by
financing activities financing activities
Net change in cash (19)$ -$ (26)$ -$ -$ (45)$ Net change in cash
Cash at year end 2018 a
46$ -$ 113$ -$ -$ 159$ Cash at year end 2018
a Includes Restricted Cash
Consolidated CMS Energy
2018 Forecasted Consolidation of Consumers Energy and CMS Energy Parent Statements of Cash Flow (in millions) (unaudited)
Eliminations/Reclassifications/Consolidation to
Arrive at the Consolidated Statement of Cash Flows
Statements of Cash Flows
77
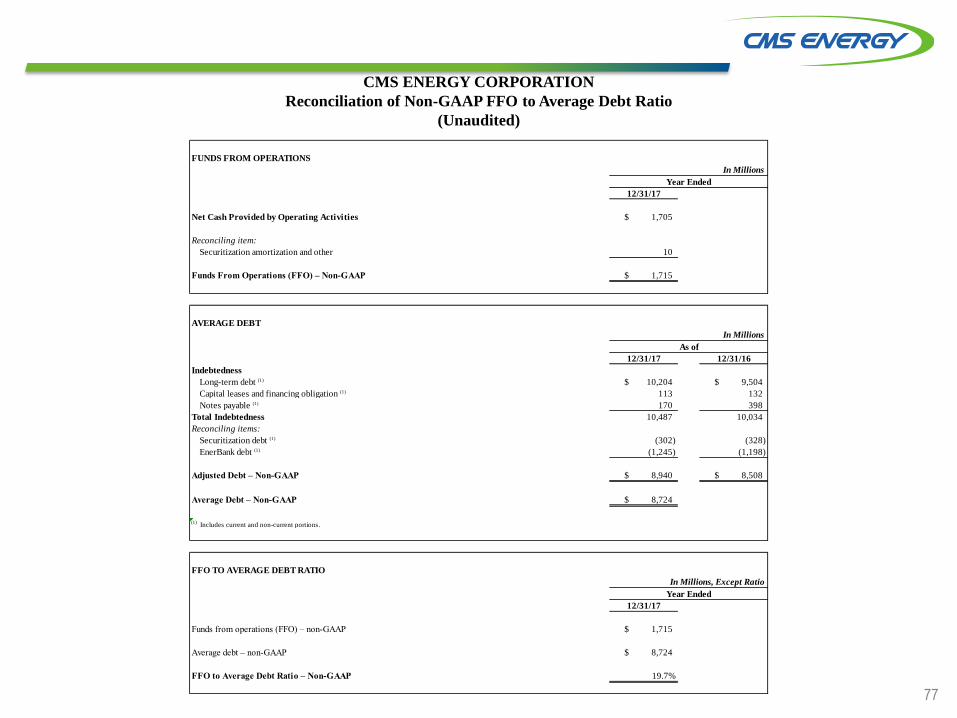
CMS ENERGY CORPORATION
Reconciliation of Non-GAAP FFO to Average Debt Ratio
(Unaudited)
FUNDS FROM OPERATIONS
Net Cash Provided by Operating Activities $ 1,705
Reconciling item:
Securitization amortization and other 10
Funds From Operations (FFO) – Non-GAAP $ 1,715
AVERAGE DEBT
Indebtedness
Long-term debt (1) $ 10,204 $ 9,504
Capital leases and financing obligation (1) 113 132
Notes payable (1) 170 398
Total Indebtedness 10,487 10,034
Reconciling items:
Securitization debt (1) (302) (328)
EnerBank debt (1) (1,245) (1,198)
Adjusted Debt – Non-GAAP $ 8,940 $ 8,508
Average Debt – Non-GAAP $ 8,724
(1)
FFO TO AVERAGE DEBT RATIO
Funds from operations (FFO) – non-GAAP $ 1,715
Average debt – non-GAAP $ 8,724
FFO to Average Debt Ratio – Non-GAAP 19.7%
Includes current and non-current portions.
In Millions, Except Ratio
Year Ended
12/31/17
12/31/17 12/31/16
In Millions
Year Ended
12/31/17
In Millions
As of
CMS Energy Corporation Phil McAndrews (517) 788-1464
Investor Relations Department Travis Uphaus (517) 768-3114
One Energy Plaza, Jackson, MI 49201 www.cmsenergy.com February 2018
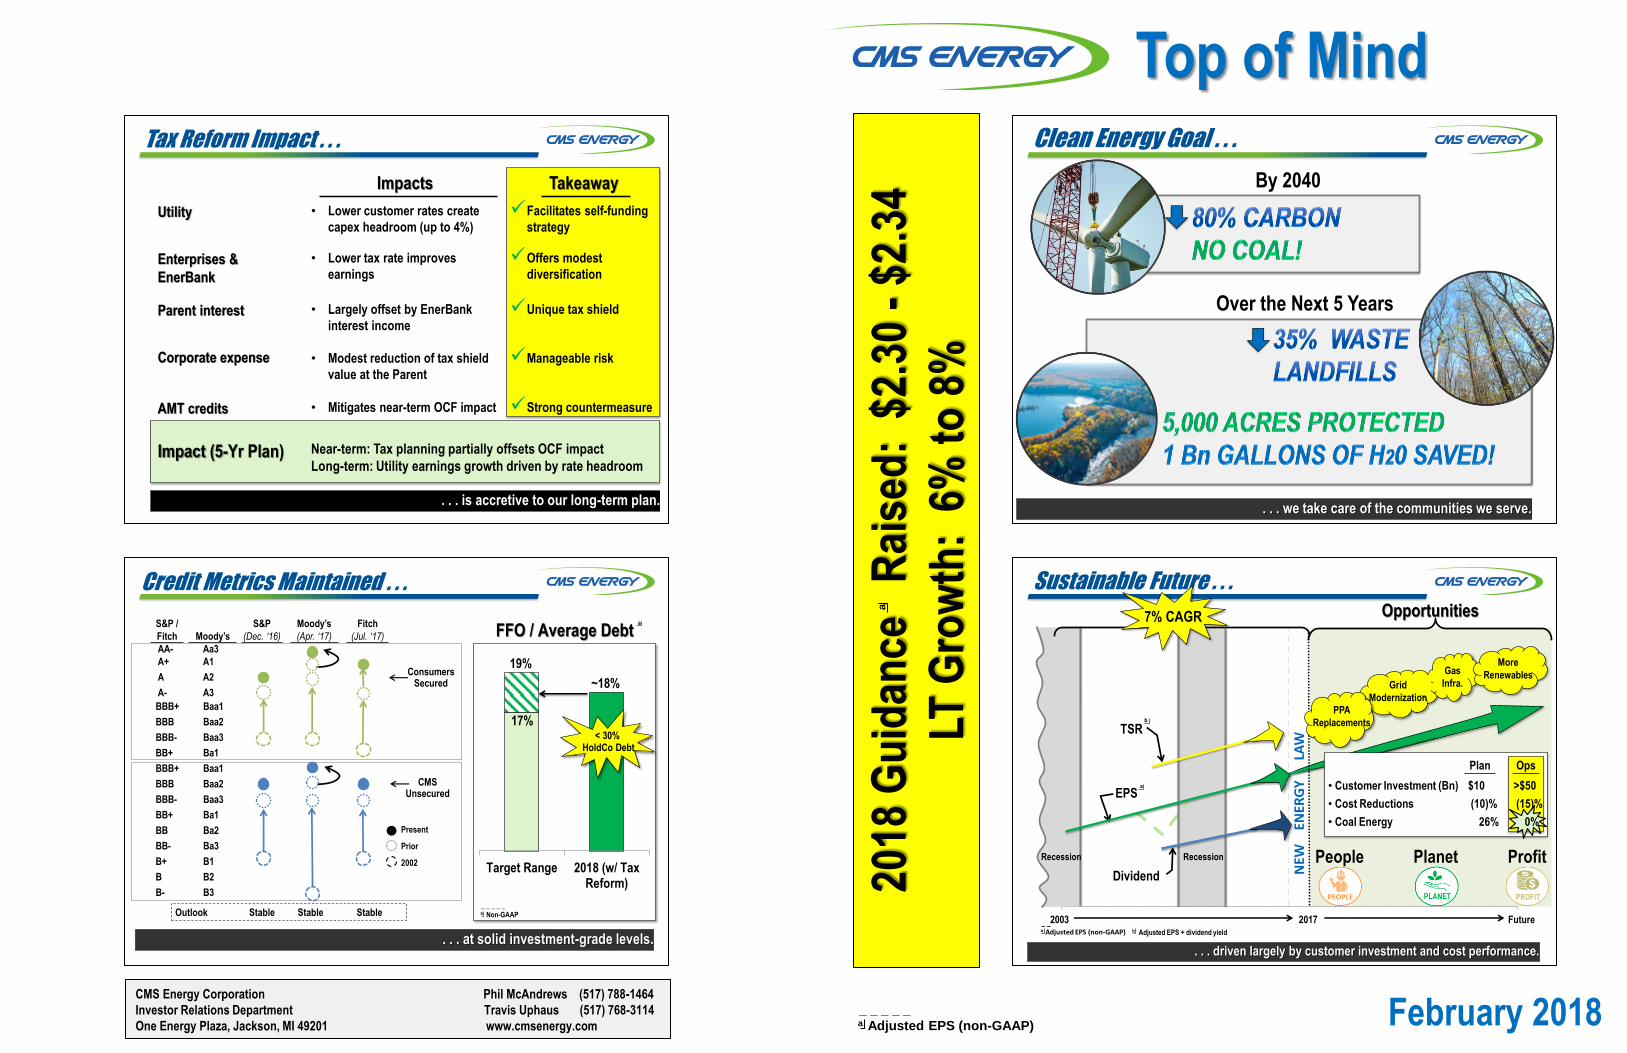
Top of Mind Tax Reform Impact . . .
. . . is accretive to our long-term plan.
Impacts Takeaway
Utility • Lower customer rates create
capex headroom (up to 4%)
Facilitates self-funding
strategy
Enterprises &
EnerBank
• Lower tax rate improves
earnings
Offers modest
diversification
Parent interest
Corporate expense
• Largely offset by EnerBank
interest income
• Modest reduction of tax shield
value at the Parent
Unique tax shield
Manageable risk
AMT credits • Mitigates near-term OCF impact Strong countermeasure
Impact (5-Yr Plan) Near-term: Tax planning partially offsets OCF impact
Long-term: Utility earnings growth driven by rate headroom
S&P /
Fitch Moody’s
S&P
(Dec. ‘16)
Moody’s
(Apr. ‘17)
Fitch
(Jul. ‘17)
AA- Aa3
A+ A1
A A2
A- A3
BBB+ Baa1
BBB Baa2
BBB- Baa3
BB+ Ba1
BBB+ Baa1
BBB Baa2
BBB- Baa3
BB+ Ba1
BB Ba2
BB- Ba3
B+ B1
B B2
B- B3
Outlook Stable Stable Stable
FFO / Average Debt
. . . at solid investment-grade levels.
Credit Metrics Maintained . . .
Target Range 2018 (w/ TaxReform)
~18%
19%
17%
Present
Prior
2002
ConsumersSecured
CMSUnsecured
_ _ _ _ _a Non-GAAP
a
< 30%HoldCo Debt
Clean Energy Goal . . .
. . . we take care of the communities we serve.
By 2040
Over the Next 5 Years
2018
Gu
idan
ce
Rai
sed
: $
2.30
- $
2.34
LT G
row
th:
6%
to
8%
2003 2004 2005 2006 2007 2008 2009 2010 2011 2012 2013 2014 2015 2016 2017 2018 2019 2020 2025
Sustainable Future . . .
Recession
7% CAGR
EPS
Recession
Opportunities
Gas
Infra.
2017
• Customer Investment (Bn)
• Cost Reductions
• Coal Energy
Plan
_ _ _ _ _a Adjusted EPS (non-GAAP)
a
Future2003
Ops
LAW
NEW
E
NER
GY
Grid
Modernization
PPA
Replacements
People Planet Profit
More
Renewables
Dividend
TSR
_ _ _ _ _b Adjusted EPS + dividend yield
b
. . . driven largely by customer investment and cost performance.
$10
(10)%
26%
>$50
(15)%
0%
_ _ _ _ _
a Adjusted EPS (non-GAAP)
a
References to earnings guidance refer to such guidance as provided by the company on February 14, 2018.
This placemat contains “forward-looking statements”; please refer to our SEC filings for information regarding the risks and uncertainties that could cause our results to differ materially. It also contains non-GAAP measures. Reconciliations to most directly comparable GAAP measures are found in the accompanying handout and on our website at www.cmsenergy.com
Simple, Perhaps Unique Model . . .
EPS Growth
- Cost reductions
- Sales growth (continued economic development)
- Other (Enterprises, tax planning, etc.)
INVESTMENT SELF-FUNDED
Customer Prices “at or below inflation”
Plan
6% - 8%
. . . enhanced with tax reform.
2 - 3 pts
1
2
5 - 6 pts
<2%
Self Funding:
_ _ _ _ _a Adjusted EPS (non-GAAP)
a
Needed Customer Investment . . .
. . . potentially pulled forward by tax reform.
2017 2022
$21 Bn
Rate Base GrowthLarge and Aging System
$15 Bn
>$50 Bn
System Need
$10 Bn
5-Yr Plan
Gas
Electric
7%
CAGR
30%
70%
40%
60%
>$18 Bn
10-Yr
Our Entire Cost Structure . . .
Cost Components
0%
10%
20%
30%
40%
50%
60%
70%
80%
90%
100%
Fuel and Power Costs
Taxes
Above Market Costs
O&M Reductions in Rates
2011 Current
$659$572
Down
$87 MM
or 3%
annually
100%
Capital Investments
O&M Costs
a b
_ _ _ _ _b Case U-17990, 2016 Order
_ _ _ _ _a Case U-16191
Cost of Capital
. . . provides opportunities to lower costs and create headroom.
2011 2017
Fuel Fuel
PPA PPA
Down
$162 MM
or 5%
annually
~70% _ _ _ _ _
Source: 2011 - FERC Form 1; 2017 - Internal
2H: Renewable
Energy Plan
U-18231
Long-Term Regulatory Planning . . .
. . . provides significant customer value and long-term visibility.
Gas
Electric
Regulatory/Policy
6/15: File long-term
generation plan (IRP)
U-18461
By 3/30:
Final order
U-18322
2018
1/1: Gas investment
tracker $18 MM
U-18124
3/1: File
5-yr electric
dist. plan
U-17990
By 8/31:
Final order
U-18424
Fall: File next
gas case
TBD: Tax
Reform Order
11/6:
Gubernatorial
elections
April/May: File
next electric
case
1/19: Impact of
tax reform filing
U-18494