investor information pack august 2011 full... · company overview 4. ... manufacturing, automotive,...
TRANSCRIPT

Investor Information PackAugust 2013

Contents
Company Overview Slide 3
Pooling Solutions Overview Slide 7
Pallet Pooling Models Slide 24
FY13 Results Presentation Slide 29
Contacts Slide 86
2
Company Overview

Company profile
• Leading global provider of supply-chain equipment pooling solutions through CHEP and IFCO brands
• Operations in more than 50 countries
• Approximately 18,500 employees
• Net assets of US$3,025M at 30 June 2013
• Owner and operator of Recall information management business, expected to be demerged as separate ASX-listed company in December 2013
Company Overview
4

Three primary brands
• Global leader in pallet, crate and container pooling services
• Partners with customers to develop pooling solutions that ensure reduced product damage, offer enhanced delivery efficiencies, eliminate waste and reduce supply-chain costs
• Customers primarily in consumer goods, fresh produce, general manufacturing, automotive, aerospace and chemicalindustries
• Acquired by Brambles effective 31 March 2011
• World’s leading provider of reusable plastic crate (RPC) pooling services
• Customers primarily in fresh produce, consumer goods and retail sectors
• In the USA, sorts repairs and reissues more than 200 million non-pooled pallets a year through IFCO Pallet Management Services
• A leader in the management of information throughout its lifecycle
• Provides one-stop, end-to-end, information management solutions
• Provides secure storage, retrieval and destruction of digital and physical information
• Customers primarily in transaction-intensive sectors such as financials services, insurance, legal, healthcare, retail and government
Company Overview
5

Key dates in Brambles’ history
1875 Walter Bramble establishes butchery business in Newcastle,
Australia, and expands into transport and logistics
1925 W E Bramble & Sons Limited formed
1950 Australian Government takes ownership of Commonwealth Handling Equipment Pool (CHEP), a collection of pallets and other assets left by the
US Army after World War II
1958 Brambles buys CHEP
1970s CHEP expands into UK, Western Europe and South Africa
1990 CHEP USA launched
2006 Brambles sells waste
management and other businesses to focus on CHEP and information
management business, Recall
September 2010 Brambles enters aerospace pooling by
acquiring Unitpool
February 2011Brambles buys CAPS, a US
pooler of intermediate bulk containers (IBCs)
December 2012CHEP expands in IBCs in Europe
and Asia-Pacific as Brambles acquires CEVA Pallecon
1900 1925 1950 1975 2000 2010 2011 2012 2013
July 2013Brambles announces intention to demerge
Recall and focus on Pooling Solutions in three segments: Pallets, RPCs and Containers
March 2011Brambles acquires IFCO Systems,
world’s leading pooler of reusable produce crates (RPCs)
November 2011CHEP Aerospace Solutions
launches after Brambles acquires JMI Aerospace and Driessen
Services
November 2011Brambles acquires
Canada’s Paramount Pallet 2001 Brambles merges with the support services arm
of GKN, its joint venture partner, and forms a dual-listed companies structure on the Australian and
London stock exchanges
Company Overview
6
Pooling Solutions Overview
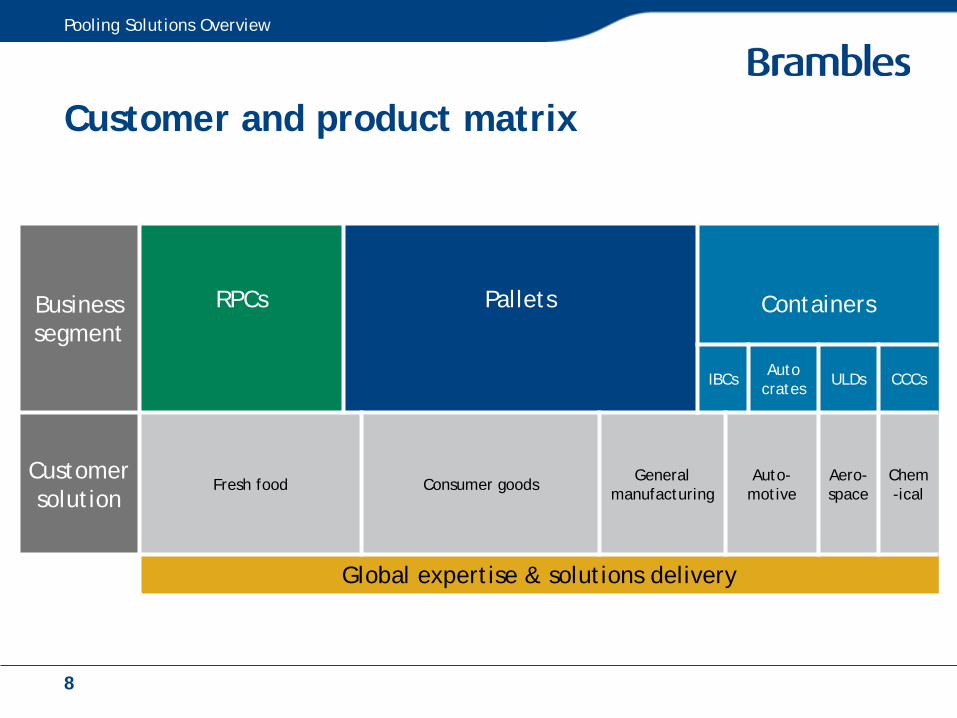
Customer and product matrix
Pooling Solutions Overview
Business segment
RPCs Pallets Containers
IBCs Auto crates ULDs CCCs
Customer solution
Fresh food Consumer goods General manufacturing
Auto-motive
Aero-space
Chem-ical
Global expertise & solutions delivery
8
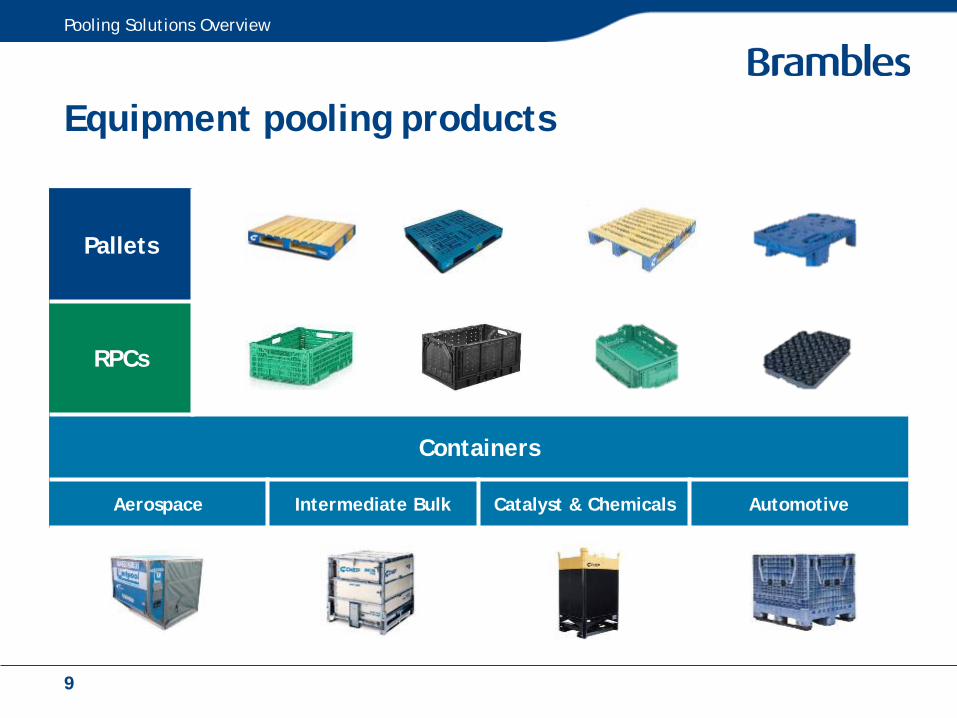
Equipment pooling products
Pallets
RPCs
Containers
Aerospace Intermediate Bulk Catalyst & Chemicals Automotive
Pooling Solutions Overview
9
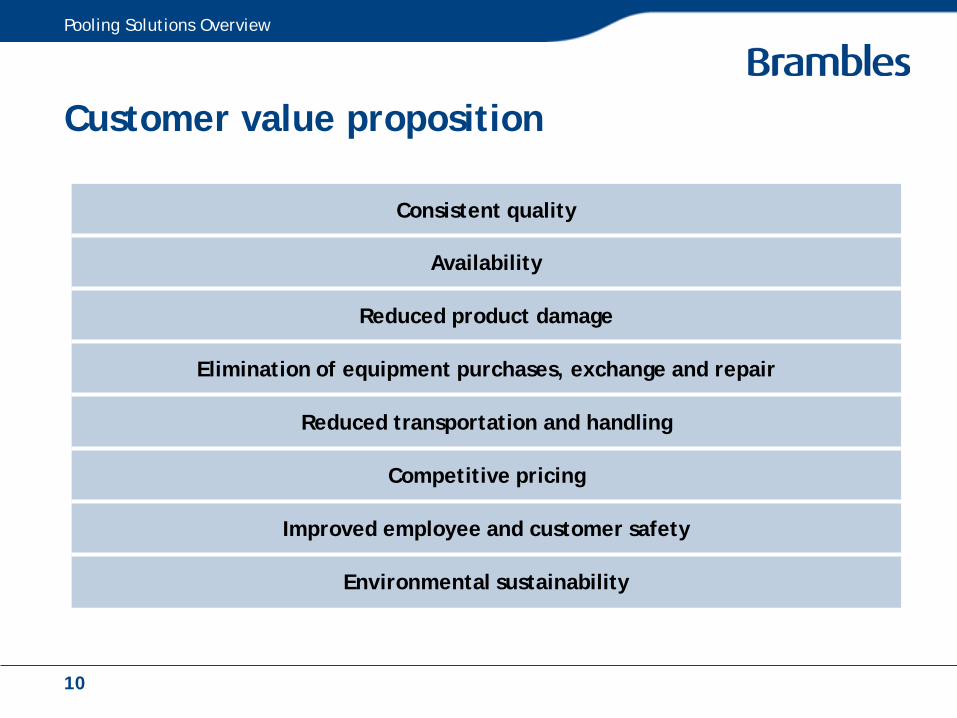
Customer value proposition
Consistent quality
Availability
Reduced product damage
Elimination of equipment purchases, exchange and repair
Reduced transportation and handling
Competitive pricing
Improved employee and customer safety
Environmental sustainability
Pooling Solutions Overview
10
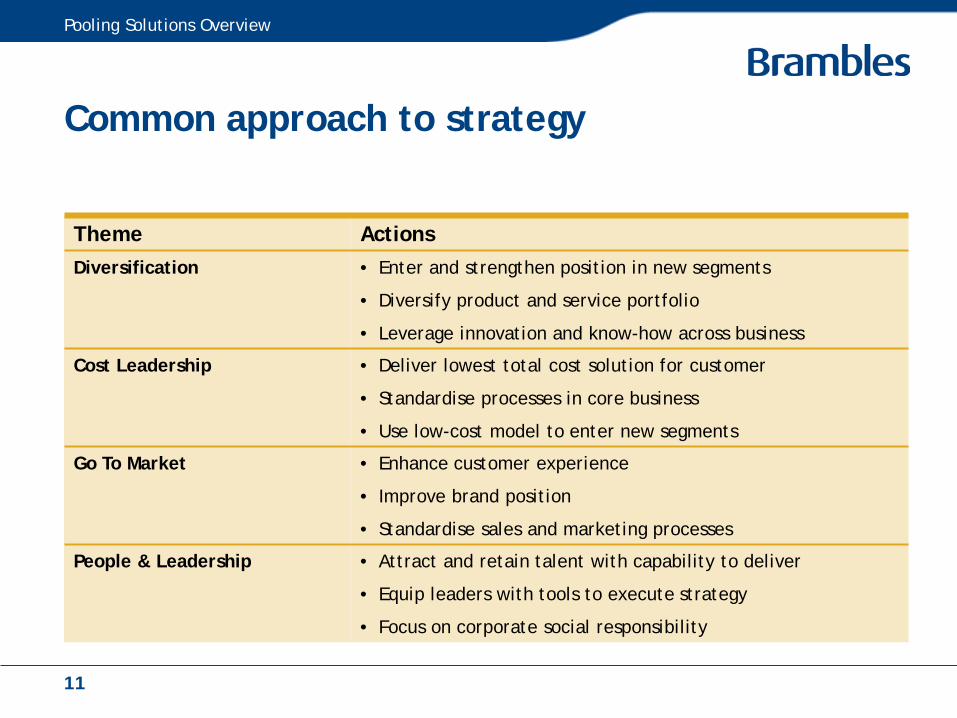
Common approach to strategy
Theme ActionsDiversification • Enter and strengthen position in new segments
• Diversify product and service portfolio
• Leverage innovation and know-how across business
Cost Leadership • Deliver lowest total cost solution for customer
• Standardise processes in core business
• Use low-cost model to enter new segments
Go To Market • Enhance customer experience
• Improve brand position
• Standardise sales and marketing processes
People & Leadership • Attract and retain talent with capability to deliver
• Equip leaders with tools to execute strategy
• Focus on corporate social responsibility
Pooling Solutions Overview
11
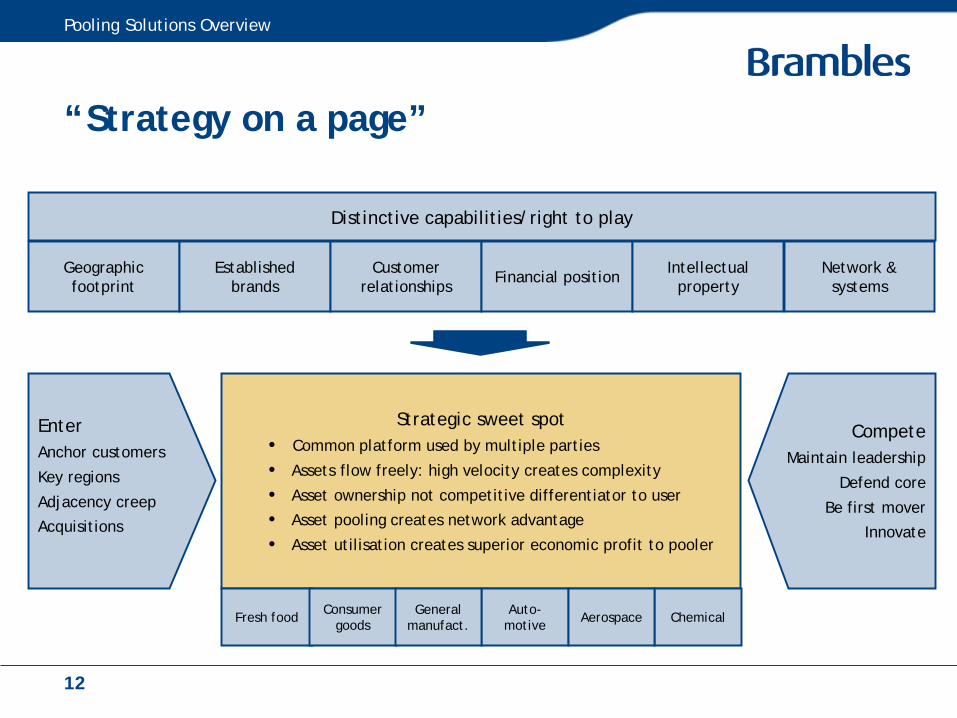
“Strategy on a page”
EnterAnchor customers
Key regions
Adjacency creep
Acquisitions
CompeteMaintain leadership
Defend core
Be first mover
Innovate
Strategic sweet spot• Common platform used by multiple parties
• Assets flow freely: high velocity creates complexity
• Asset ownership not competitive differentiator to user
• Asset pooling creates network advantage
• Asset utilisation creates superior economic profit to pooler
ChemicalFresh food Consumer goods
Auto-motive AerospaceGeneral
manufact.
Geographic footprint
Established brands
Customer relationships Financial position Intellectual
propertyNetwork &
systems
Distinctive capabilities/right to play
Pooling Solutions Overview
12
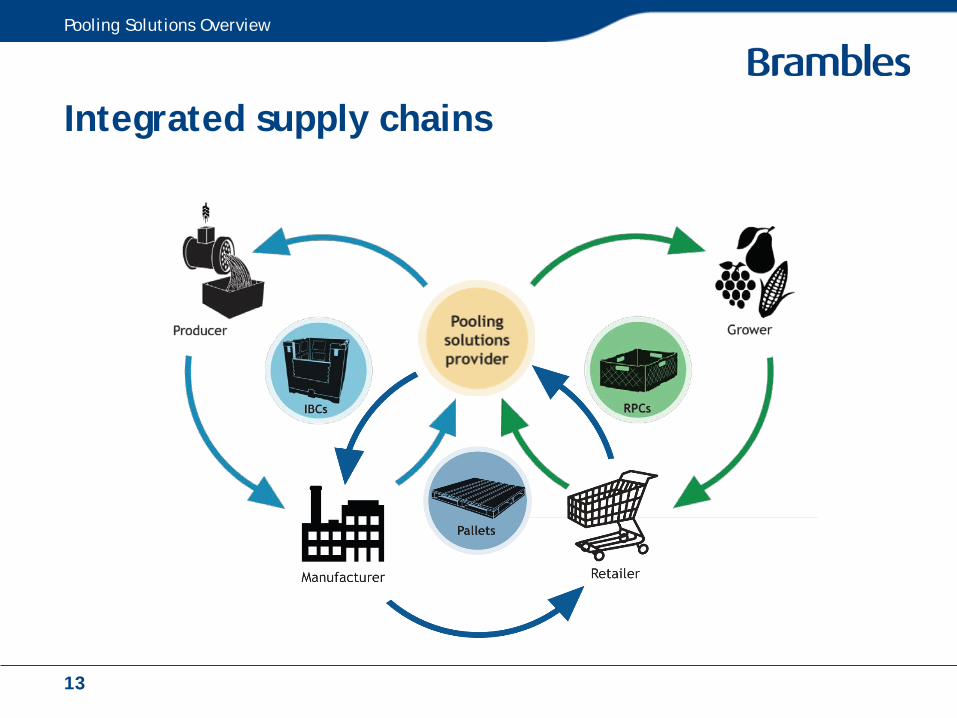
Integrated supply chains
Pooling Solutions Overview
13

Specialty supply chains
Pooling Solutions Overview
14
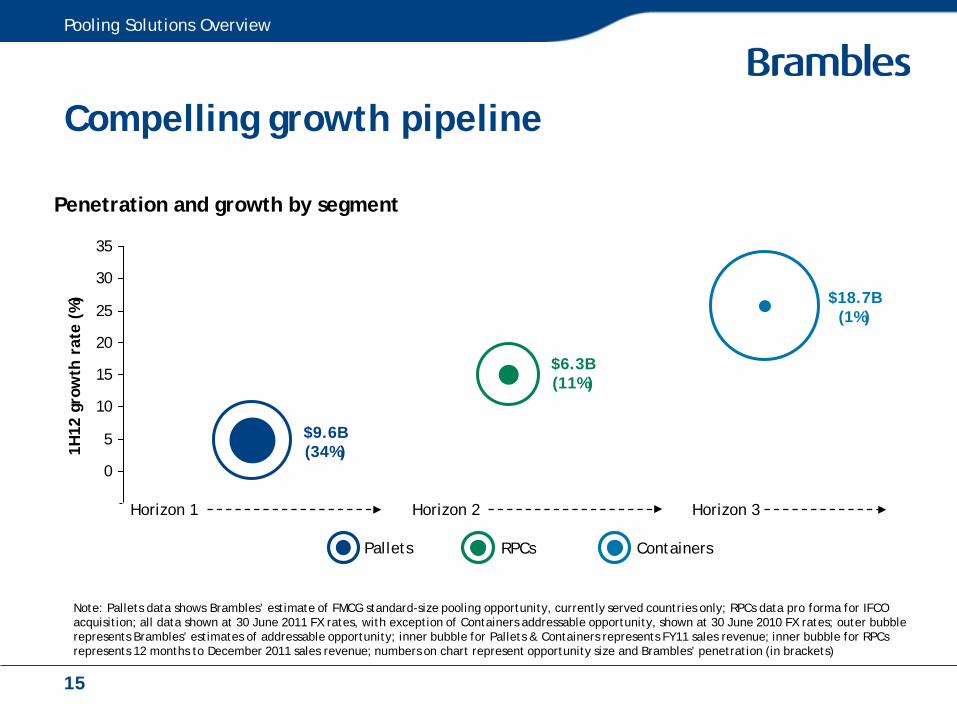
Compelling growth pipeline
Pooling Solutions Overview
Penetration and growth by segment
-5
0
5
10
15
20
25
30
35
0.5
1H12
gro
wth
rat
e (%
)
Pallets RPCs Containers
Horizon 2 Horizon 3 Horizon 1
Note: Pallets data shows Brambles’ estimate of FMCG standard-size pooling opportunity, currently served countries only; RPCs data pro forma for IFCO acquisition; all data shown at 30 June 2011 FX rates, with exception of Containers addressable opportunity, shown at 30 June 2010 FX rates; outer bubble represents Brambles’ estimates of addressable opportunity; inner bubble for Pallets & Containers represents FY11 sales revenue; inner bubble for RPCs represents 12 months to December 2011 sales revenue; numbers on chart represent opportunity size and Brambles’ penetration (in brackets)
$9.6B(34%)
$6.3B(11%)
$18.7B(1%)
15
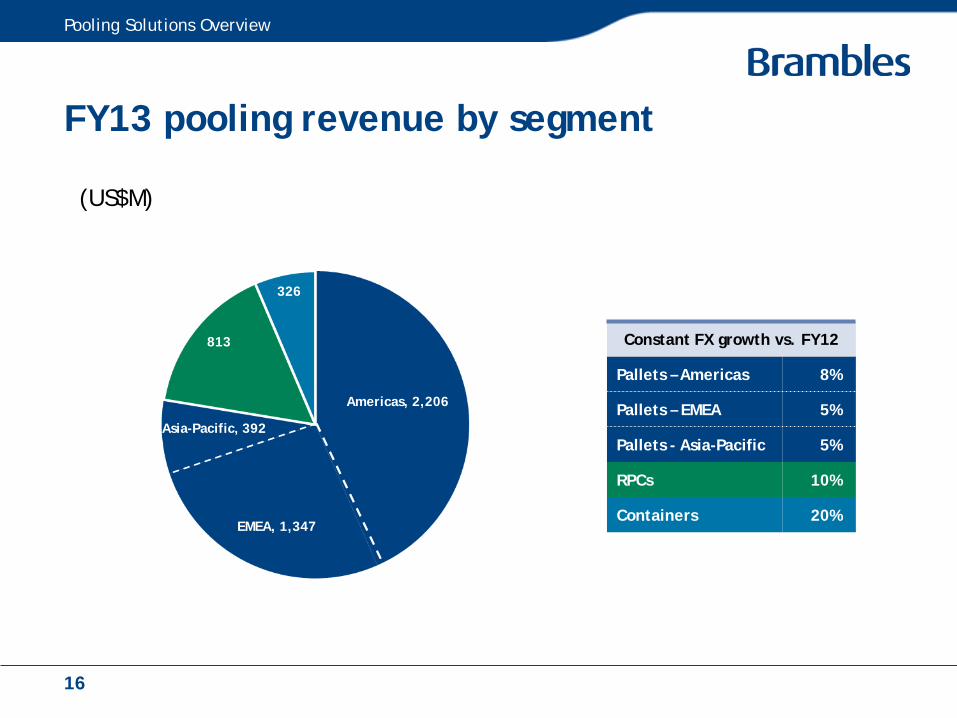
FY13 pooling revenue by segment
(US$M)
Pooling Solutions Overview
Constant FX growth vs. FY12
Pallets – Americas 8%
Pallets – EMEA 5%
Pallets - Asia-Pacific 5%
RPCs 10%
Containers 20%
Americas, 2,206
Asia-Pacific, 392
EMEA, 1,347
813
326
16
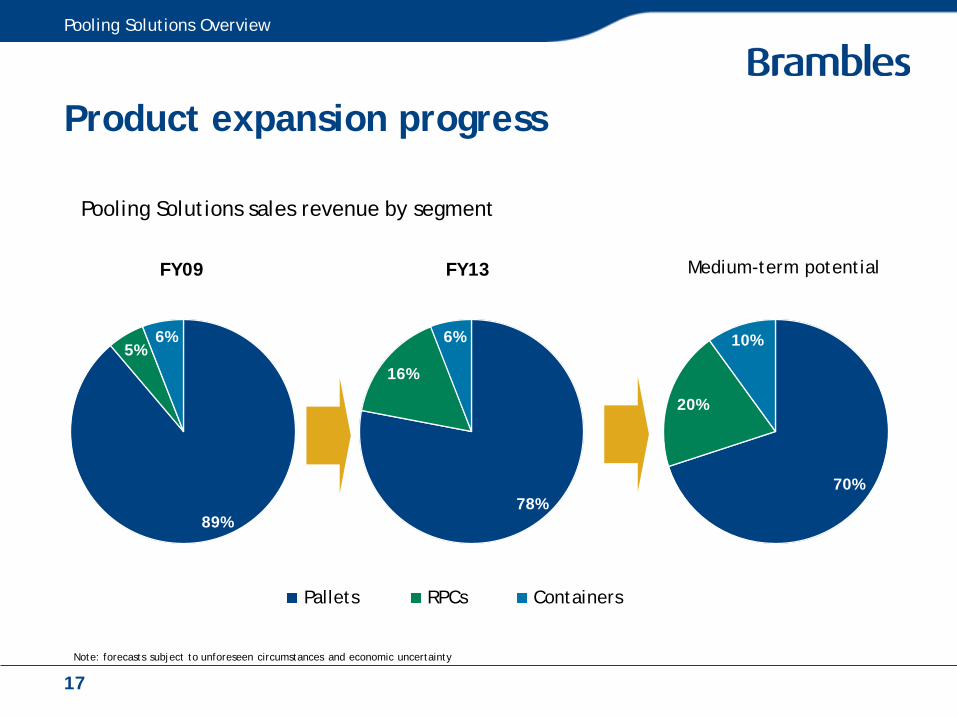
89%
5%6%
FY09
78%
16%
6%
FY13
70%
20%
10%
Medium-term potential
Product expansion progress
Pooling Solutions sales revenue by segment
Pallets RPCs Containers
Pooling Solutions Overview
Note: forecasts subject to unforeseen circumstances and economic uncertainty
17

Pallets - addressable opportunity by region
Pooling Solutions Overview
48%
36%
16%
47%
11%
42%
6%
28%
66%
Asia-Pacific:$1.0B
Americas:$3.8B
EMEA:$4.8B
Unserved by poolersCHEP Other poolers
Note: Brambles’ estimate of addressable FMCG standard-size pallet opportunity, currently served countries only; all financial information shown at 30 June 2011 FX rates; Brambles’ share based on FY11 sales revenue
18
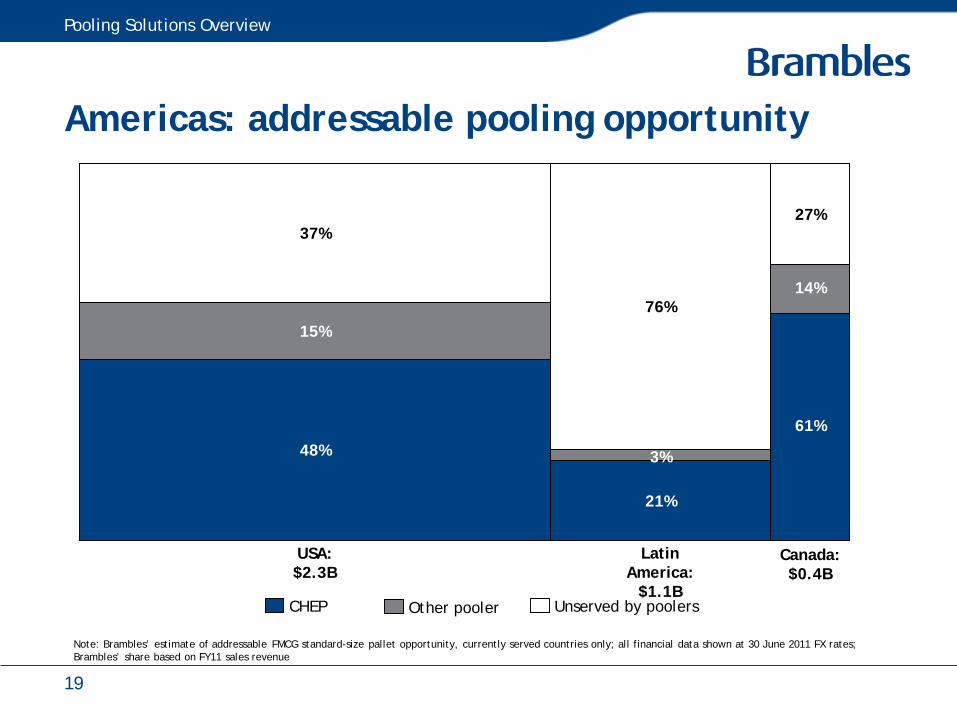
Americas: addressable pooling opportunity
Pooling Solutions Overview
Latin America:
$1.1B
USA:$2.3B
Canada:$0.4B
76%
48%
15%
37%
61%
14%
27%
21%
3%
Unserved by poolersCHEP Other pooler
Note: Brambles’ estimate of addressable FMCG standard-size pallet opportunity, currently served countries only; all financial data shown at 30 June 2011 FX rates; Brambles’ share based on FY11 sales revenue
19

EMEA & Asia-Pacific: addressable opportunities
Note: Brambles’ estimate of addressable FMCG standard-size pallet opportunity, currently served countries only, except for Asia, which includes South-East Asian countries in which Brambles is not present; all financial information shown at 30 June 2011 FX rates; Brambles’ share based on FY11 sales revenue. All $ figures are US dollars.
Unserved by poolersCHEP Other poolers
CEE:$1.1B
Western Europe:$3.6B
ANZ:$0.6B
Asia:$0.4B
MEA:$0.2B
94%
4%2%
33%
7%
60%
53%
18%
29%
8%
12%
80%
71%
13%
16%
Pooling Solutions Overview
20
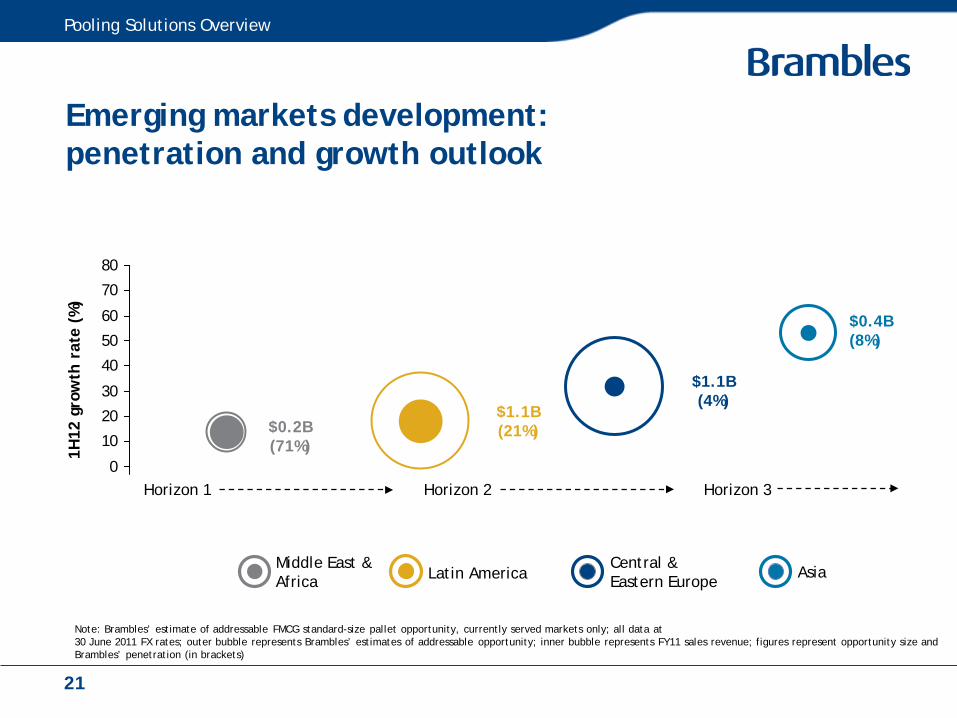
Emerging markets development:penetration and growth outlook
Pooling Solutions Overview
-10
0
10
20
30
40
50
60
70
80
1H12
gro
wth
rat
e (%
)
Middle East & Africa
Central & Eastern EuropeLatin America Asia
Horizon 2 Horizon 3
$0.2B(71%)
$0.4B(8%)
$1.1B(21%)
$1.1B(4%)
Note: Brambles’ estimate of addressable FMCG standard-size pallet opportunity, currently served markets only; all data at 30 June 2011 FX rates; outer bubble represents Brambles’ estimates of addressable opportunity; inner bubble represents FY11 sales revenue; figures represent opportunity size and Brambles’ penetration (in brackets)
Horizon 1
21
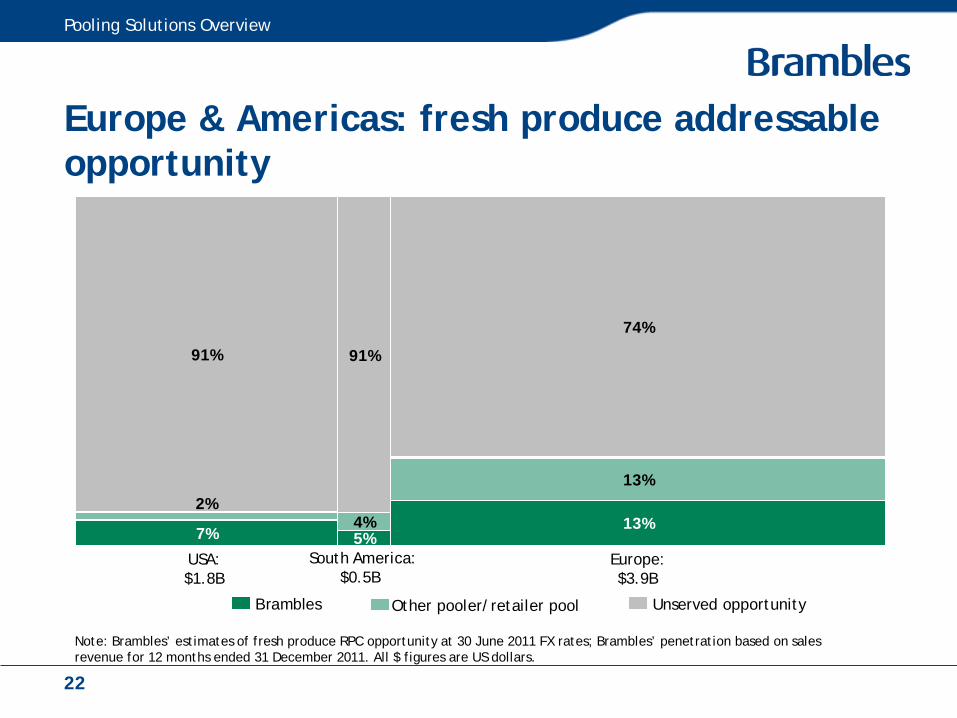
Europe & Americas: fresh produce addressable opportunity
13%
74%
13%
91%
4%5%
91%
7%
2%
USA:$1.8B
Europe:$3.9B
South America:$0.5B
Brambles Other pooler/retailer pool Unserved opportunity
Note: Brambles’ estimates of fresh produce RPC opportunity at 30 June 2011 FX rates; Brambles’ penetration based on sales revenue for 12 months ended 31 December 2011. All $ figures are US dollars.
Pooling Solutions Overview
22
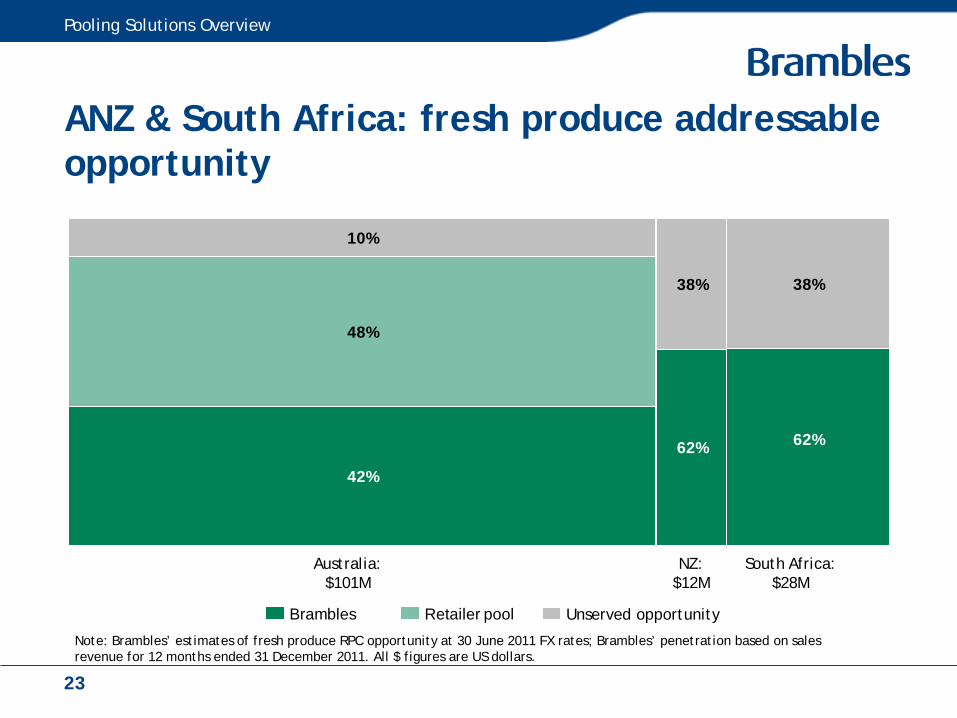
ANZ & South Africa: fresh produce addressable opportunity
NZ:$12M
Australia:$101M
South Africa:$28M
62%
38%
42%
48%
10%
62%
38%
Brambles Retailer pool Unserved opportunity
Note: Brambles’ estimates of fresh produce RPC opportunity at 30 June 2011 FX rates; Brambles’ penetration based on sales revenue for 12 months ended 31 December 2011. All $ figures are US dollars.
Pooling Solutions Overview
23

Pallet Pooling Models

How pallet pooling worksService centre
Service centre
Manufacturer/producer
Retailer/distributor
Service Centre Manufacturer/producer Retailer/distributor Service centre
1. Issue of ready-for-use equipment to manufacturer/ producer.
2. Manufacturer/producer loads products on to equipment and ships through the supply chain.
3. Receiving retailer or distributor offloads goods and returns empty equipment to service centre or arranges collection.
4. Inspection/repair of equipment as necessary prior to reissue.
Pallet Pooling Models
25
2
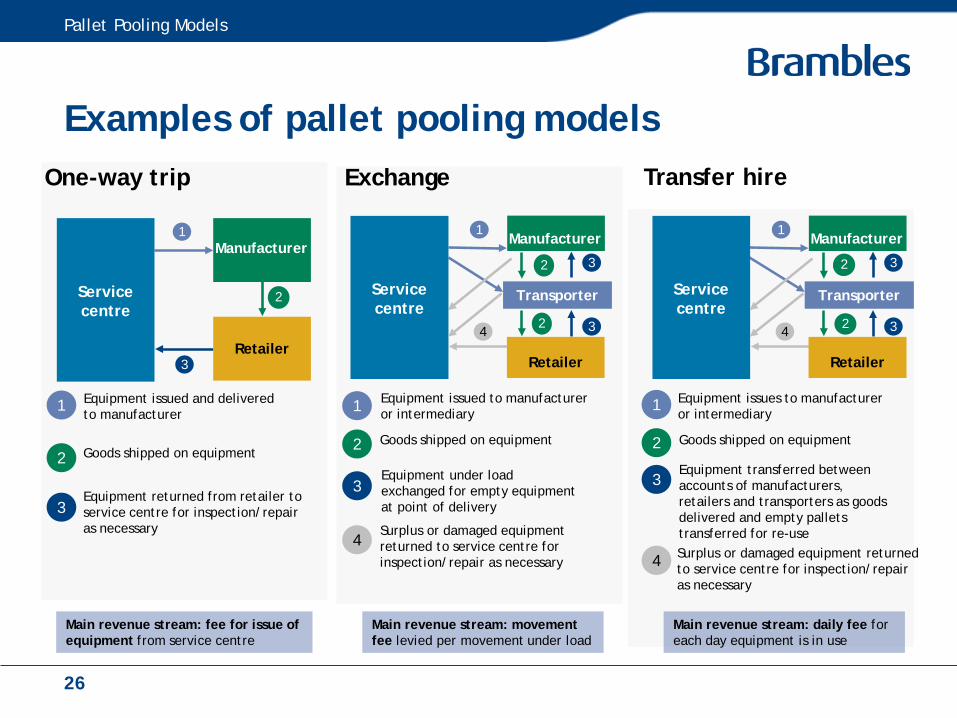
Examples of pallet pooling models
Pallet Pooling Models
One-way trip Exchange Transfer hire
Service centre
Retailer
Manufacturer1
3
Retailer
Manufacturer
Service centre
1
4
Transporter
3
Retailer
Manufacturer
Service centre
1
4
Transporter
Goods shipped on equipment
Equipment returned from retailer to service centre for inspection/repair as necessary
3
Equipment issued and delivered to manufacturer
1
Surplus or damaged equipment returned to service centre for inspection/repair as necessary
4
Equipment issued to manufacturer or intermediary1
2 Goods shipped on equipment
Equipment under load exchanged for empty equipment at point of delivery
3
Equipment issues to manufacturer or intermediary
1
2 Goods shipped on equipment
Equipment transferred between accounts of manufacturers, retailers and transporters as goods delivered and empty pallets transferred for re-use
3
Surplus or damaged equipment returned to service centre for inspection/repair as necessary
4
3
3 3
Main revenue stream: fee for issue of equipment from service centre
Main revenue stream: movement fee levied per movement under load
Main revenue stream: daily fee for each day equipment is in use
2
2
2
2
2
2
2
26

Pallet pooling pricing architecture
One-way Exchange Transfer hire
Issue feeFee for issue of a quality assured pallet from a service centre
Daily hire feeFee for each day that a customer uses or remains responsible for a pallet
Transfer feeFee for use as equipment transfers into retail channel
Movement feeFee levied per movement under load prior to return to CHEP
Transport fee Pallet delivery and/or collection fees
Administrative fee Fees for lost equipment and/or late declaration
Note: The above illustrates the principal pricing structure across CHEP’s pallets business. It does not explain fees across all Brambles’ equipment pooling businesses or for any particular customer.
Pallet Pooling Models
27
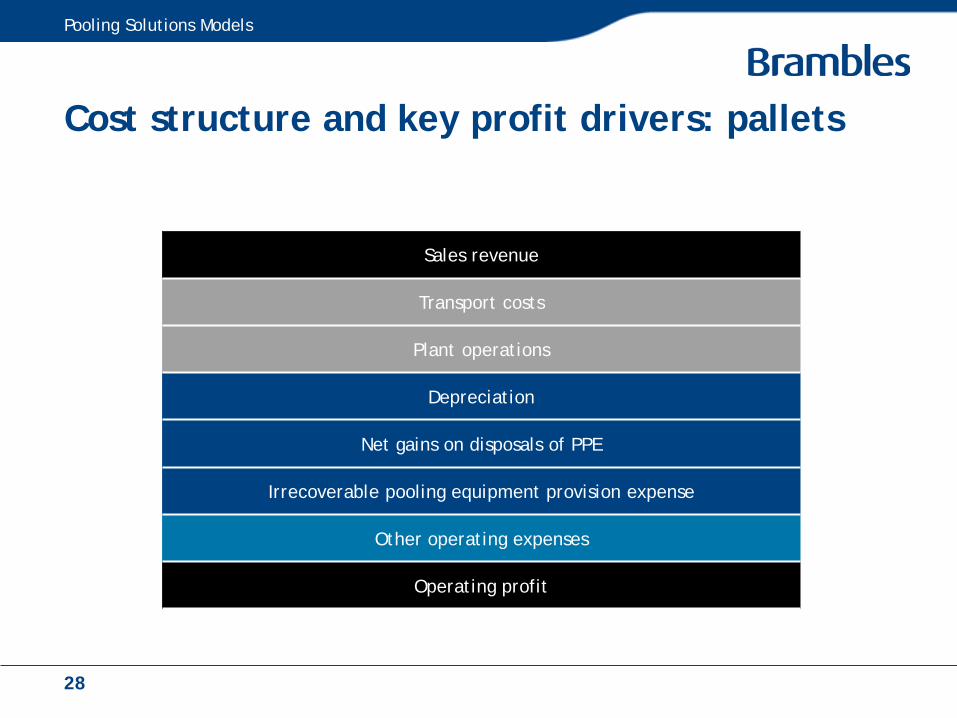
Cost structure and key profit drivers: pallets
Sales revenue
Transport costs
Plant operations
Depreciation
Net gains on disposals of PPE
Irrecoverable pooling equipment provision expense
Other operating expenses
Operating profit
Pooling Solutions Models
28
FY13 Results Presentation
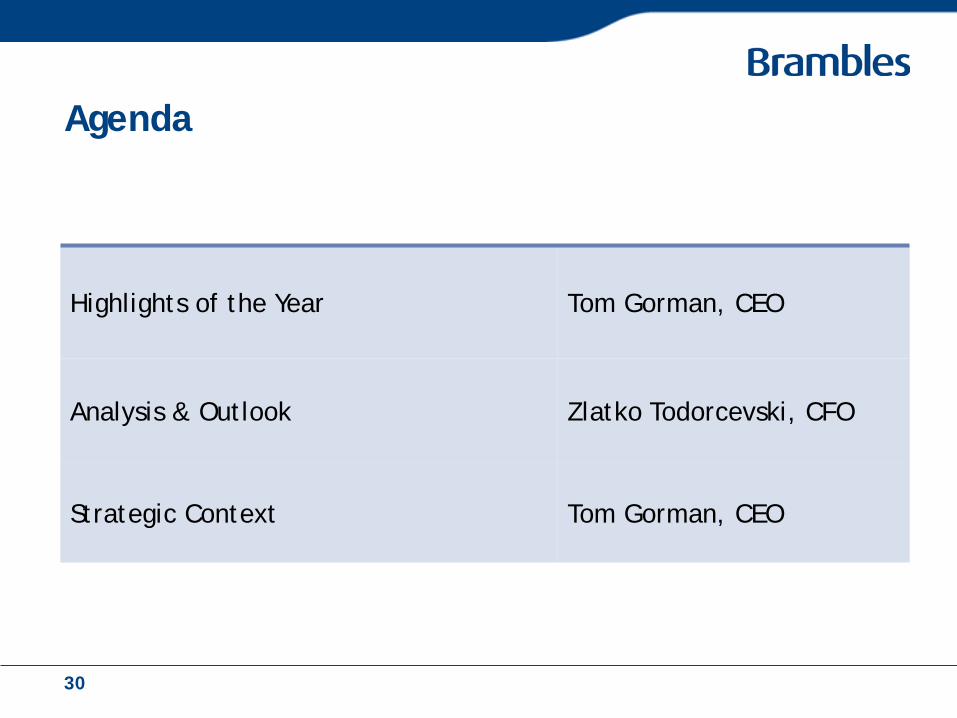
Agenda
Highlights of the Year Tom Gorman, CEO
Analysis & Outlook Zlatko Todorcevski, CFO
Strategic Context Tom Gorman, CEO
30

Key messages
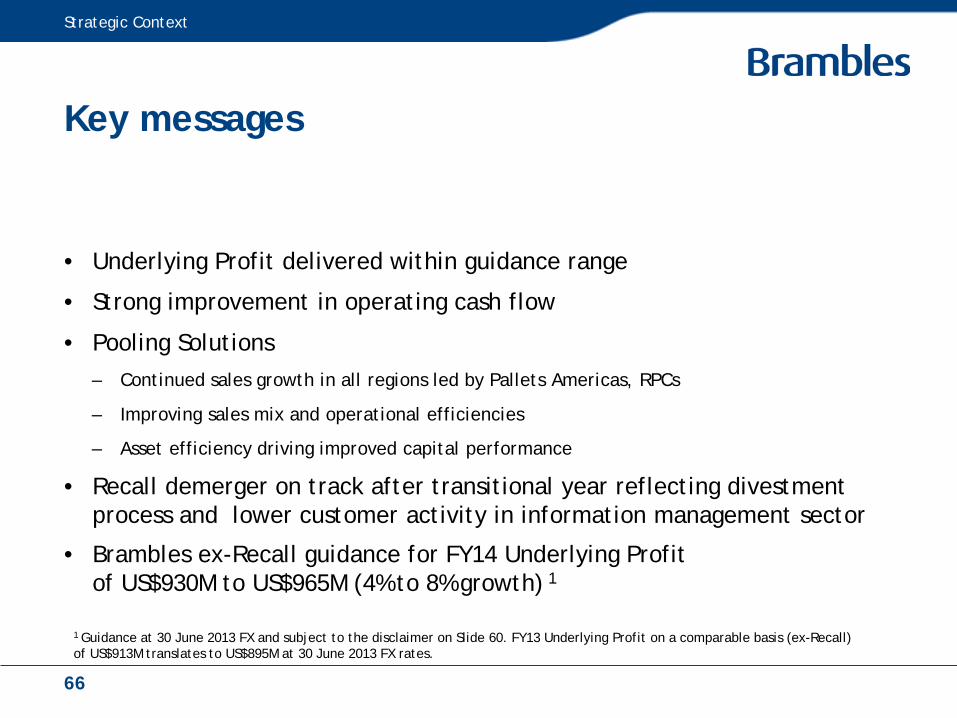
• Underlying Profit delivered within guidance range
• Strong improvement in operating cash flow
• Pooling Solutions– Continued sales growth in all regions led by Pallets Americas, RPCs
– Improving sales mix and operational efficiencies
– Asset efficiency driving improved capital performance
• Recall demerger on track after transitional year reflecting divestment process and lower customer activity in information management sector
• Brambles ex-Recall guidance for FY14 Underlying Profit of US$930M to US$965M (4% to 8% growth) 1
Key Messages
1Guidance at 30 June 2013 FX and subject to the disclaimer on Slide 60. FY13 Underlying Profit on a comparable basis (ex-Recall) of US$913M translates to US$895M at 30 June 2013 FX rates.
31
Highlights of the Year
Tom GormanCEO
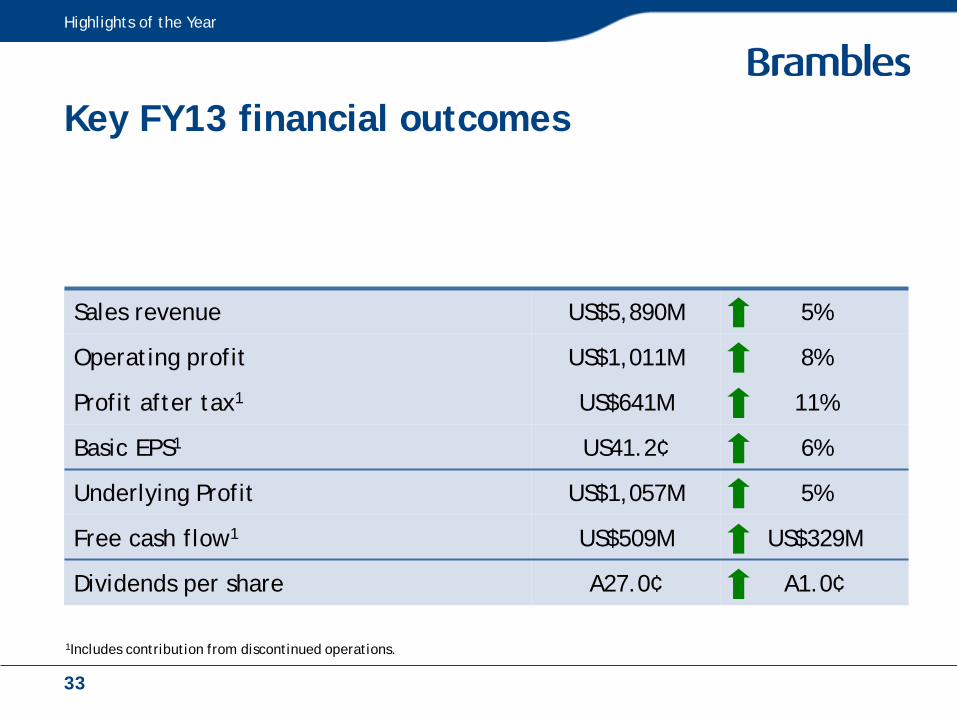
Key FY13 financial outcomes
Sales revenue US$5,890M 5%
Operating profit US$1,011M 8%
Profit after tax1 US$641M 11%
Basic EPS1 US41.2¢ 6%
Underlying Profit US$1,057M 5%
Free cash flow1 US$509M US$329M
Dividends per share A27.0¢ A1.0¢
Highlights of the Year
1Includes contribution from discontinued operations.
33
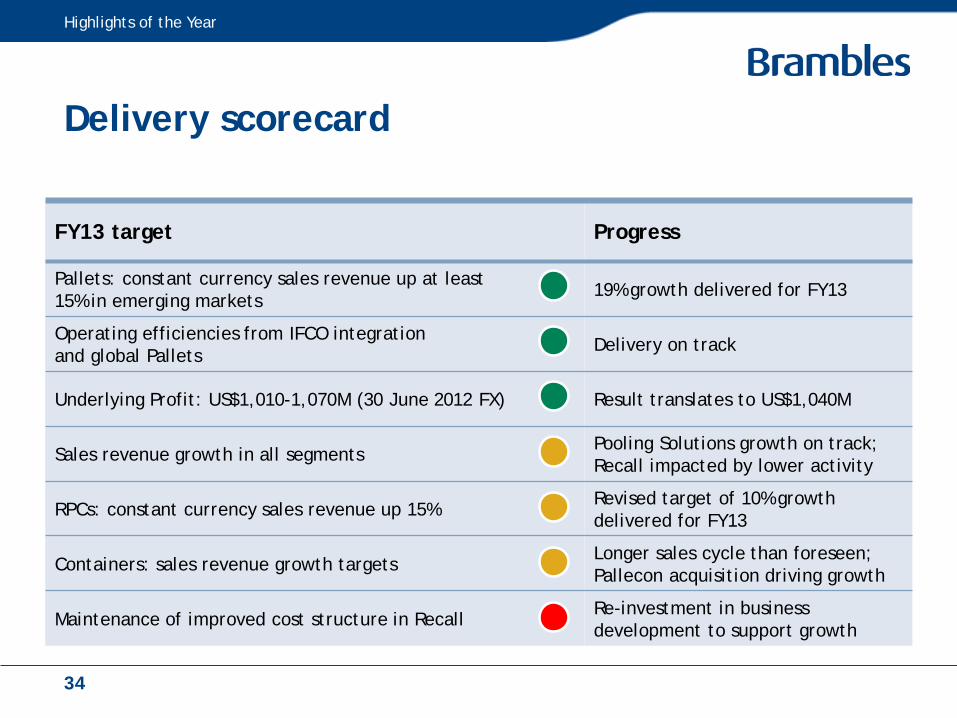
FY13 target Progress
Pallets: constant currency sales revenue up at least 15% in emerging markets
19% growth delivered for FY13
Operating efficiencies from IFCO integration and global Pallets
Delivery on track
Underlying Profit: US$1,010-1,070M (30 June 2012 FX) Result translates to US$1,040M
Sales revenue growth in all segmentsPooling Solutions growth on track; Recall impacted by lower activity
RPCs: constant currency sales revenue up 15% Revised target of 10% growth delivered for FY13
Containers: sales revenue growth targetsLonger sales cycle than foreseen; Pallecon acquisition driving growth
Maintenance of improved cost structure in RecallRe-investment in business development to support growth
Delivery scorecard
Highlights of the Year
34
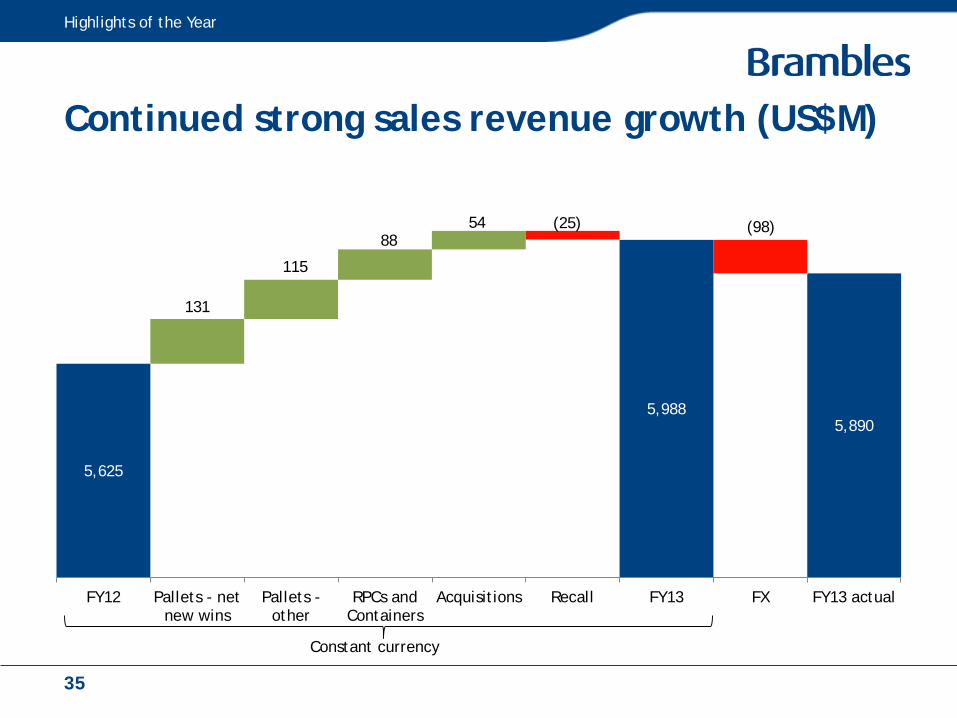
Continued strong sales revenue growth (US$M)
5,625
5,9885,890
131
115
8854 (98)(25)
FY12 Pallets - netnew wins
Pallets -other
RPCs andContainers
Acquisitions Recall FY13 FX FY13 actual
Constant currency
Highlights of the Year
35
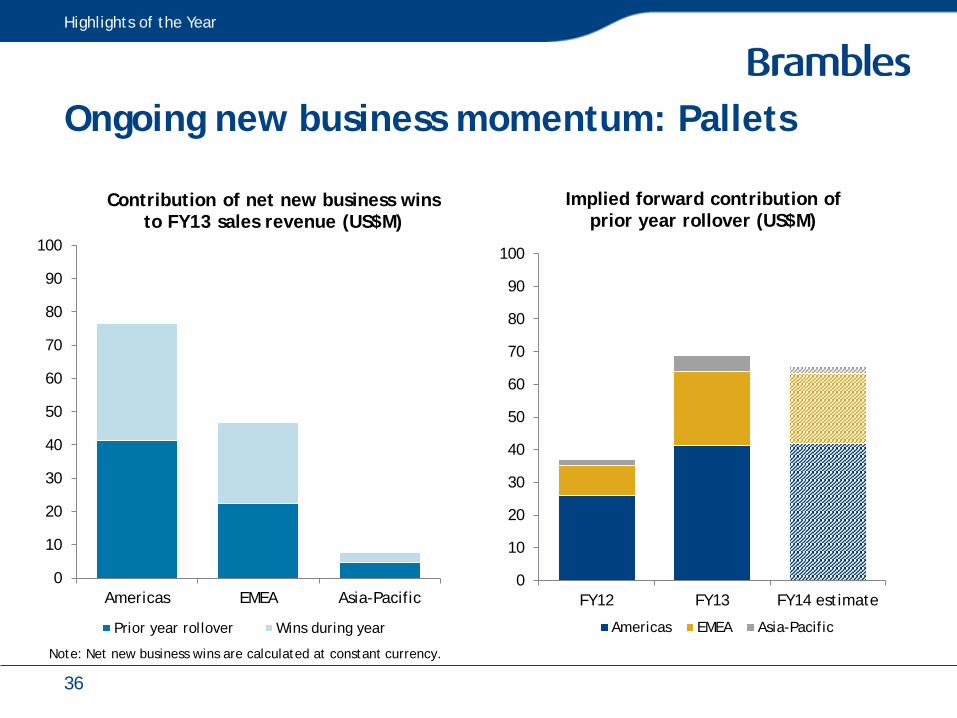
0
10
20
30
40
50
60
70
80
90
100
Americas EMEA Asia-Pacific
Contribution of net new business wins to FY13 sales revenue (US$M)
Prior year rollover Wins during year
Ongoing new business momentum: Pallets
Highlights of the Year
0
10
20
30
40
50
60
70
80
90
100
FY12 FY13 FY14 estimate
Implied forward contribution of prior year rollover (US$M)
Americas EMEA Asia-Pacific
Note: Net new business wins are calculated at constant currency.
36
Operational highlights: Pallets – Americas
• Sales revenue up 8% to US$2,206M
• Strong contribution from all businesses– Led by CHEP USA customer wins
– Supported by growth in all other businesses
• Underlying Profit up 15% to US$419M– Operational efficiencies/synergies more than offsetting higher lumber costs
• Further incremental asset efficiency gains
• Return on capital invested up 1.9 points to 19.2%
Highlights of the Year
37
Operational highlights: Pallets – EMEA
• Sales revenue up 2% to US$1,347M– Constant currency sales revenue up 5%
• Progress in under-penetrated Germany and Italy
• Momentum continuing in emerging markets
• Underlying Profit up 3% to US$282M– Constant currency Underlying Profit up 7%
• Operational and capital efficiencies offsetting investment in emerging markets
• Return on capital invested up 1.3 points to 22.8%
Highlights of the Year
38

Operational highlights: Pallets – Asia-Pacific
• Sales revenue up 4% to US$392M– Constant currency sales revenue up 5%
• Modest growth amid subdued economic conditions in ANZ
• Operations in Asia continue to grow
• Underlying Profit up 3% to US$79M– Constant currency Underlying Profit up 4%
• Improved second-half margin performance
• Return on capital invested down 0.8 points to 18.8%
Highlights of the Year
39

Operational highlights: RPCs
• Sales revenue up 7% to US$813M– Constant currency sales revenue up 10%
• Strong growth momentum– Displacement of disposable/unvended alternatives
– Expansion with existing and new retailers
• Underlying Profit up 11% to US$139M– Constant currency Underlying Profit up 13%
• Return on capital invested up 0.4 points to 9.5%
Highlights of the Year
40
Operational highlights: Containers
• Sales revenue up 18% to US$326M– Constant currency sales revenue up 20%
• Pallecon operations acquired in December 2012
• New business wins in CHEP Aerospace Solutions, US IBC
• Weak industry conditions in Australian automotive business
• Underlying Profit down 13% to US$28M– Constant currency Underlying Profit down 10%
– Business development costs to support global growth
• Return on capital invested down 5.8 points to 8.3%
Highlights of the Year
41
Operational highlights: Recall
• Sales revenue down 4% to US$807M– Constant currency sales revenue down 3%
• Carton volumes up 3% with increased carton storage sales revenue
• Tough year for customer transactional activity in document management and secure destruction
• Underlying Profit down 17% to US$144M– Constant currency Underlying Profit down 16%
• Reinvestment in business development following lower expenditure in FY12
• Return on capital invested down 2.6 points to 13.2%
Highlights of the Year
42

Analysis & Outlook
Zlatko Todorcevksi CFO

Results summary
Continuing operations Actual FX Constant FX
(US$M) FY13 FY12 Change Change
Sales revenue 5,889.9 5,625.0 5% 6%
Underlying Profit 1,057.2 1,009.7 5% 7%
Operating profit 1,011.2 939.2 8% 10%
Profit after tax 639.9 574.9 11% 14%
Analysis & Outlook
44
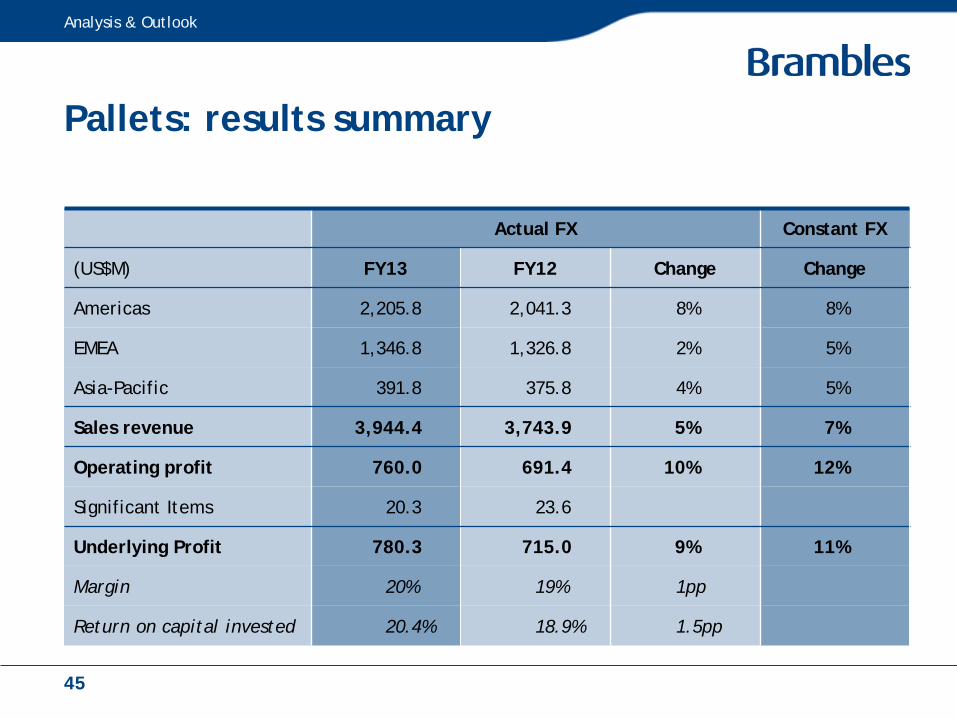
Pallets: results summary
Actual FX Constant FX
(US$M) FY13 FY12 Change Change
Americas 2,205.8 2,041.3 8% 8%
EMEA 1,346.8 1,326.8 2% 5%
Asia-Pacific 391.8 375.8 4% 5%
Sales revenue 3,944.4 3,743.9 5% 7%
Operating profit 760.0 691.4 10% 12%
Significant Items 20.3 23.6
Underlying Profit 780.3 715.0 9% 11%
Margin 20% 19% 1pp
Return on capital invested 20.4% 18.9% 1.5pp
Analysis & Outlook
45

346
415
68
40
134 (9)
(43)
(4)
FY12 Volume/price/mix
PMS impacts Efficiencies/synergies
Directcosts
Businessdevelopment
Other SignificantItems
FY13
Pallets – Americas: operating profit (US$M)
Analysis & Outlook
46

Pallets – EMEA: operating profit (US$M)
Analysis & Outlook
269281
268
437
0
(6)(23)
(9)(13)
FY12 Volume/price/mix
Efficiencies Businessdevelopment
Other SignificantItems
FY13 FX FY13actual
Constant currency
47

76 78 77
11 (3)
(2)(3)
(1) (1)
FY12 Volume/price/mix
Directcosts
Businessdevelopment
Other SignificantItems
FY13 FX FY13actual
Constant currency
Pallets – Asia-Pacific: operating profit (US$M)
Analysis & Outlook
48
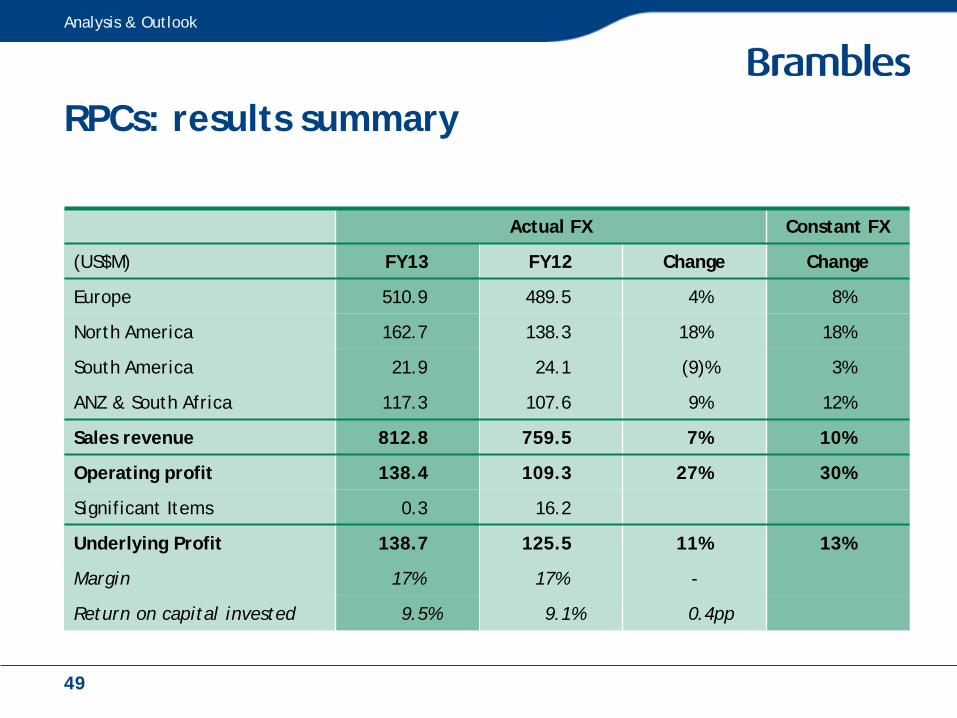
RPCs: results summary
Actual FX Constant FX
(US$M) FY13 FY12 Change Change
Europe 510.9 489.5 4% 8%
North America 162.7 138.3 18% 18%
South America 21.9 24.1 (9)% 3%
ANZ & South Africa 117.3 107.6 9% 12%
Sales revenue 812.8 759.5 7% 10%
Operating profit 138.4 109.3 27% 30%
Significant Items 0.3 16.2
Underlying Profit 138.7 125.5 11% 13%
Margin 17% 17% -
Return on capital invested 9.5% 9.1% 0.4pp
Analysis & Outlook
49
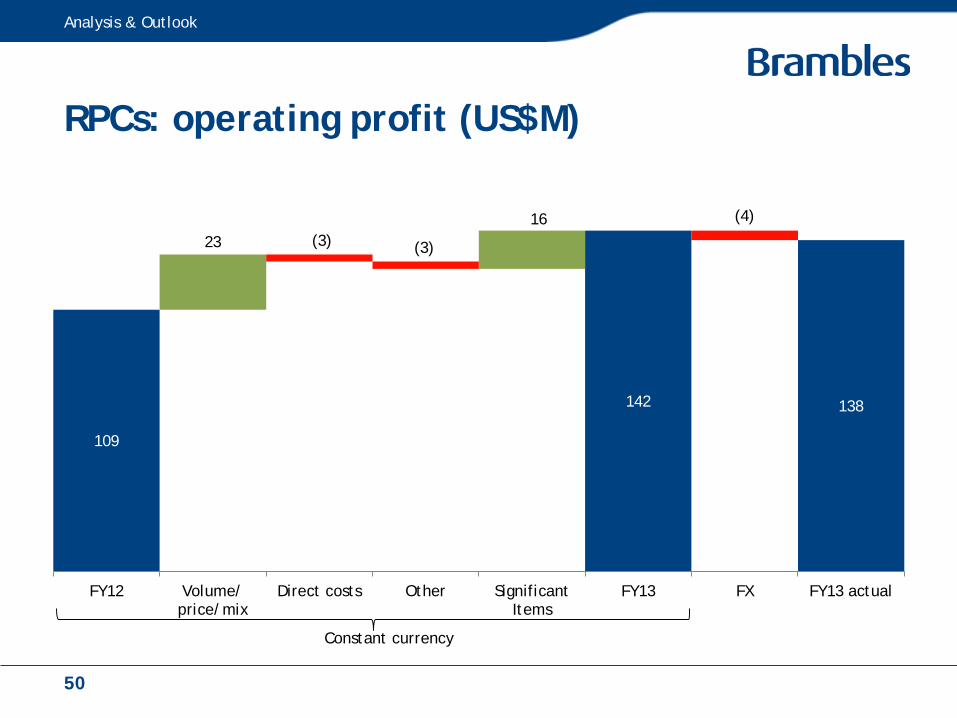
RPCs: operating profit (US$M)
Analysis & Outlook
109
142 138
2316
(3) (3)
(4)
FY12 Volume/price/mix
Direct costs Other SignificantItems
FY13 FX FY13 actual
Constant currency
50
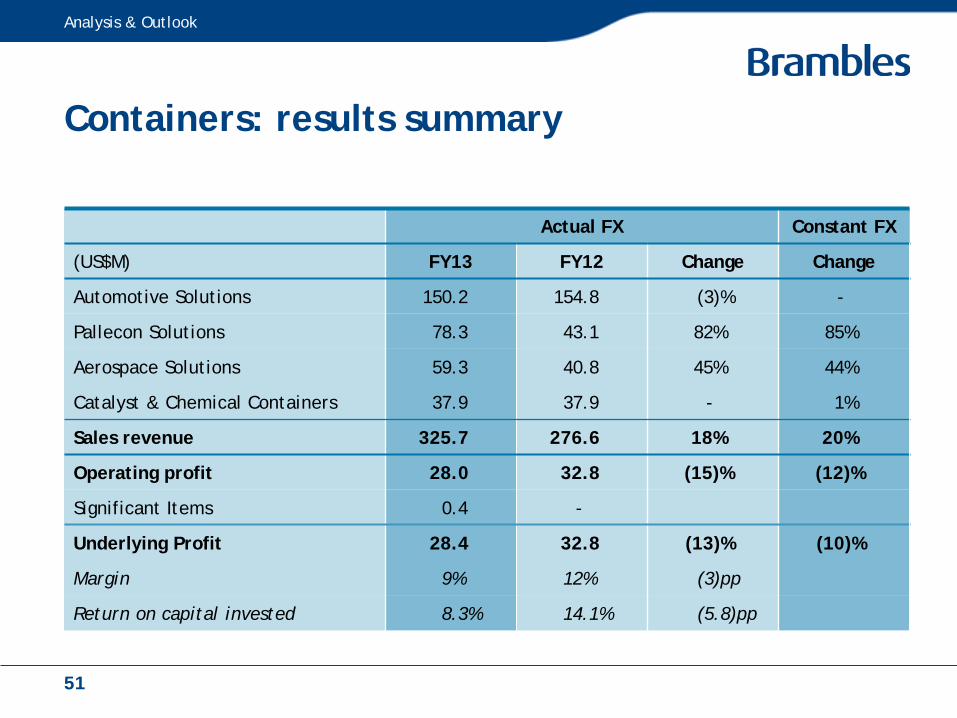
Containers: results summary
Actual FX Constant FX
(US$M) FY13 FY12 Change Change
Automotive Solutions 150.2 154.8 (3)% -
Pallecon Solutions 78.3 43.1 82% 85%
Aerospace Solutions 59.3 40.8 45% 44%
Catalyst & Chemical Containers 37.9 37.9 - 1%
Sales revenue 325.7 276.6 18% 20%
Operating profit 28.0 32.8 (15)% (12)%
Significant Items 0.4 -
Underlying Profit 28.4 32.8 (13)% (10)%
Margin 9% 12% (3)pp
Return on capital invested 8.3% 14.1% (5.8)pp
Analysis & Outlook
51
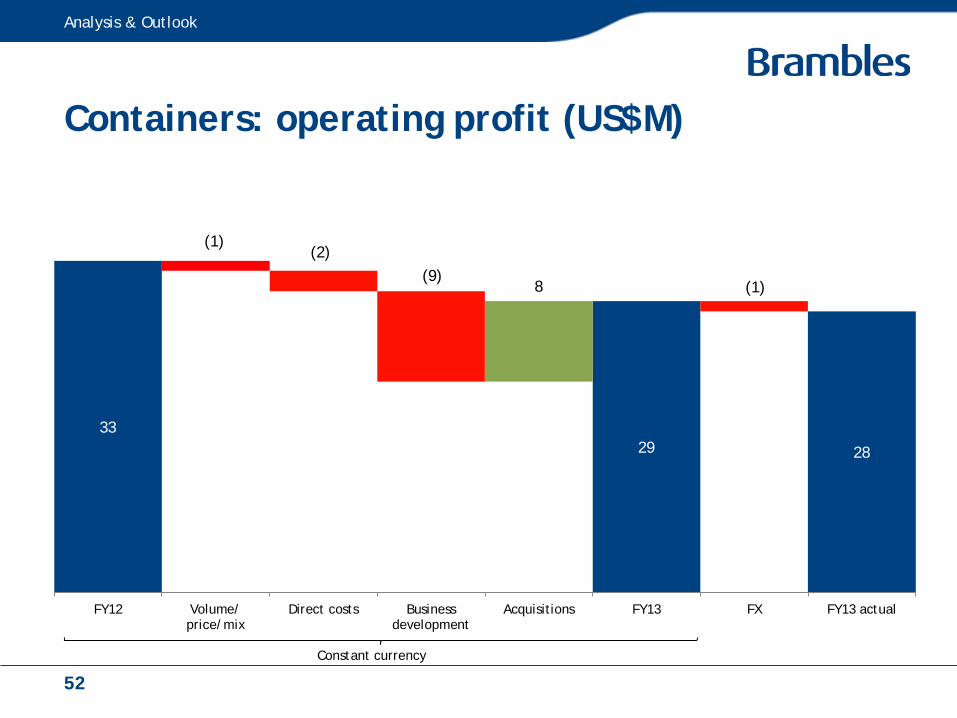
Containers: operating profit (US$M)
Analysis & Outlook
3329 28
8
(1)(2)
(9)(1)
FY12 Volume/price/mix
Direct costs Businessdevelopment
Acquisitions FY13 FX FY13 actual
Constant currency
52

Recall: results summary
Actual FX Constant FX
(US$M) FY13 FY12 Change Change
Americas 349.2 370.7 (6)% (4)%
Europe 199.5 218.9 (9)% (7)%
Rest of World 258.3 255.4 1% 2%
Sales revenue 807.0 845.0 (4)% (3)%
Operating profit 128.2 160.1 (20)% (18)%
Significant Items 16.0 14.1
Underlying Profit 144.2 174.2 (17)% (16)%
Margin 18% 21% (3)pp
Return on capital invested 13.2% 15.8% (2.6)pp
Analysis & Outlook
53

Recall: operating profit (US$M)
Analysis & Outlook
160
131 128
3
(4)(16)
(10)
(2) (3)
FY12 SDSprice
Volume/price/mix
Direct costs Other SignificantItems
FY13 FX FY13actual
Constant currency
54
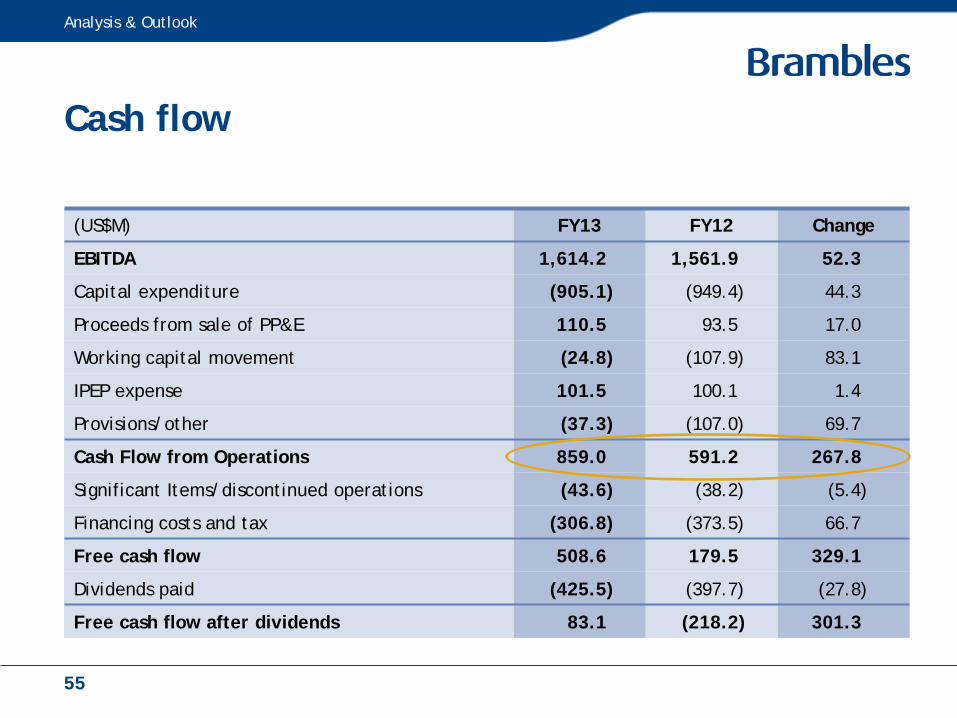
Cash flow
(US$M) FY13 FY12 Change
EBITDA 1,614.2 1,561.9 52.3
Capital expenditure (905.1) (949.4) 44.3
Proceeds from sale of PP&E 110.5 93.5 17.0
Working capital movement (24.8) (107.9) 83.1
IPEP expense 101.5 100.1 1.4
Provisions/other (37.3) (107.0) 69.7
Cash Flow from Operations 859.0 591.2 267.8
Significant Items/discontinued operations (43.6) (38.2) (5.4)
Financing costs and tax (306.8) (373.5) 66.7
Free cash flow 508.6 179.5 329.1
Dividends paid (425.5) (397.7) (27.8)
Free cash flow after dividends 83.1 (218.2) 301.3
Analysis & Outlook
55
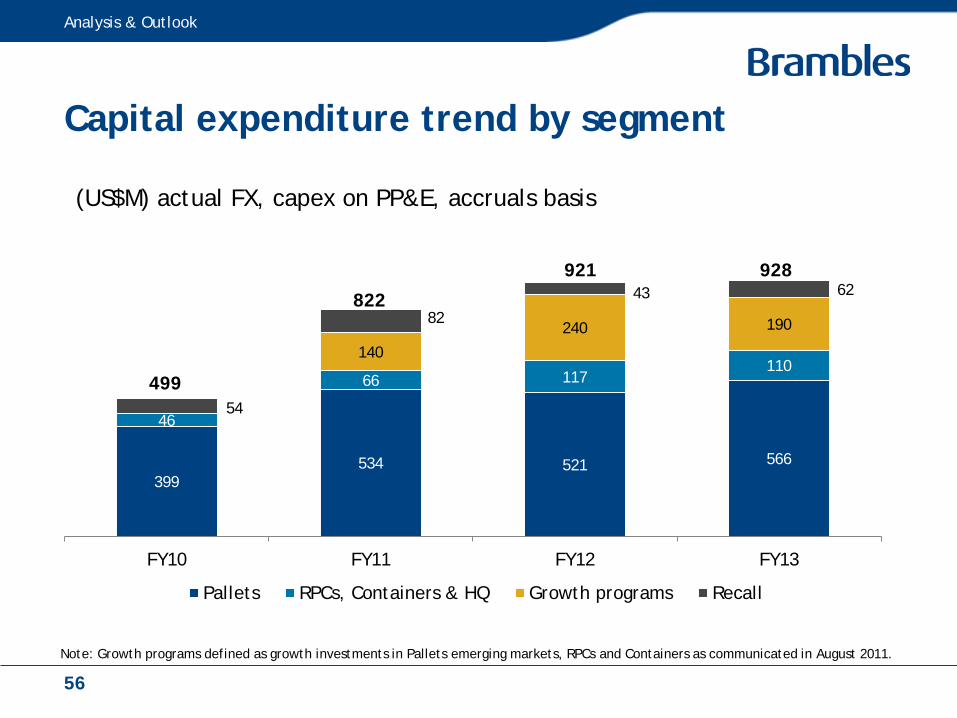
Capital expenditure trend by segment
(US$M) actual FX, capex on PP&E, accruals basis
399534 521 566
46
66 117110
140
240 190
54
82
43 62
FY10 FY11 FY12 FY13
Pallets RPCs, Containers & HQ Growth programs Recall
499
822
921 928
Analysis & Outlook
Note: Growth programs defined as growth investments in Pallets emerging markets, RPCs and Containers as communicated in August 2011.
56
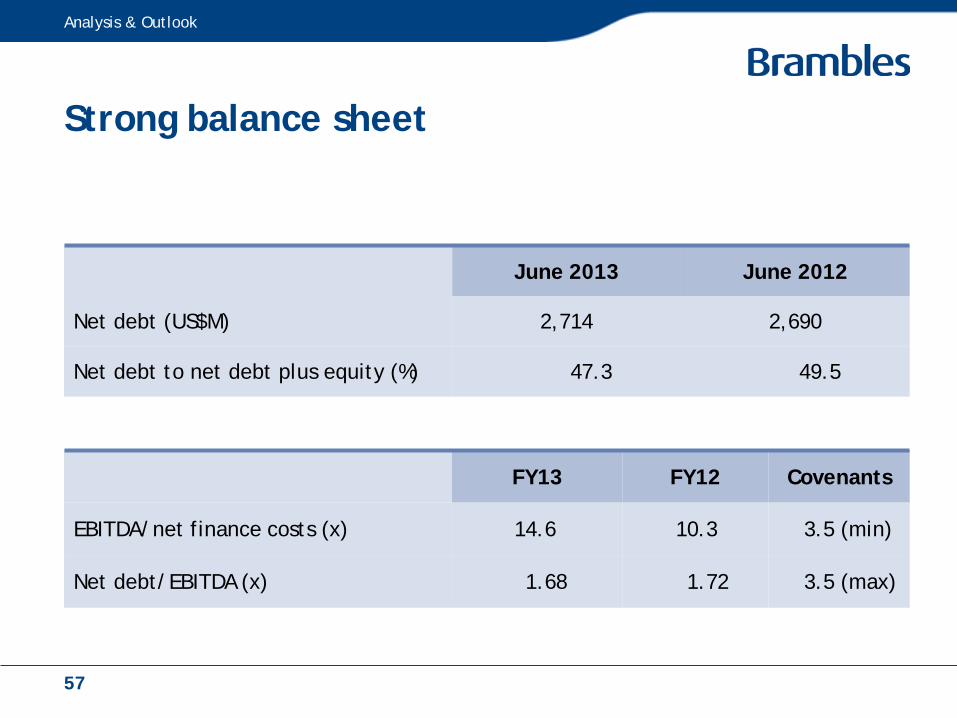
Strong balance sheet
June 2013 June 2012
Net debt (US$M) 2,714 2,690
Net debt to net debt plus equity (%) 47.3 49.5
FY13 FY12 Covenants
EBITDA/net finance costs (x) 14.6 10.3 3.5 (min)
Net debt/EBITDA (x) 1.68 1.72 3.5 (max)
Analysis & Outlook
57
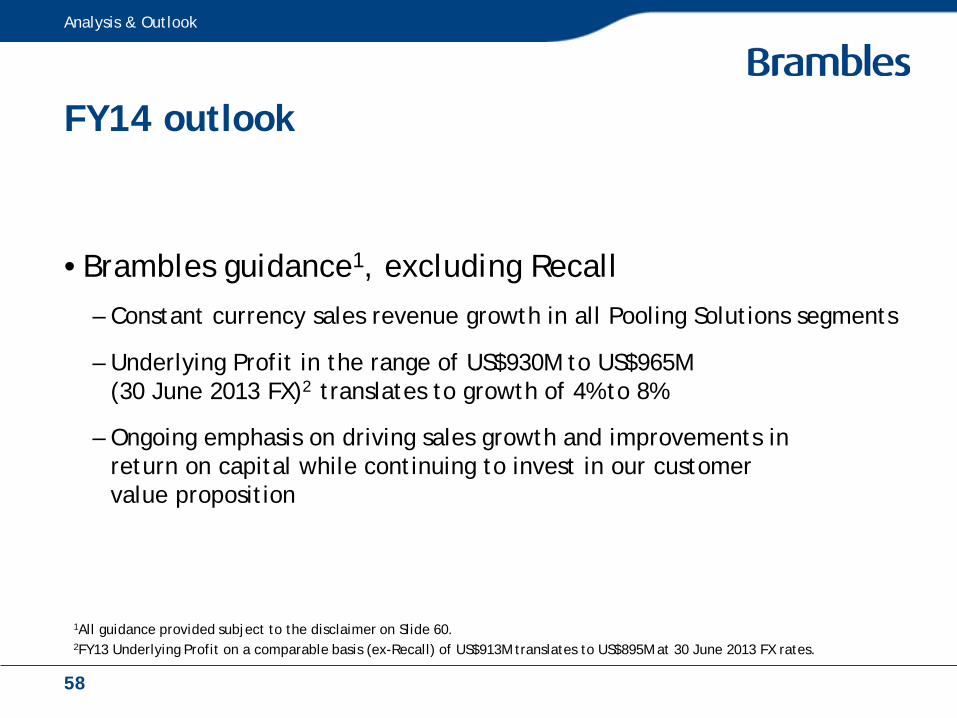
FY14 outlook
•Brambles guidance1, excluding Recall– Constant currency sales revenue growth in all Pooling Solutions segments
– Underlying Profit in the range of US$930M to US$965M (30 June 2013 FX)2 translates to growth of 4% to 8%
– Ongoing emphasis on driving sales growth and improvements in return on capital while continuing to invest in our customer value proposition
1All guidance provided subject to the disclaimer on Slide 60.2FY13 Underlying Profit on a comparable basis (ex-Recall) of US$913M translates to US$895M at 30 June 2013 FX rates.
Analysis & Outlook
58

Strategic Context
Tom GormanCEO
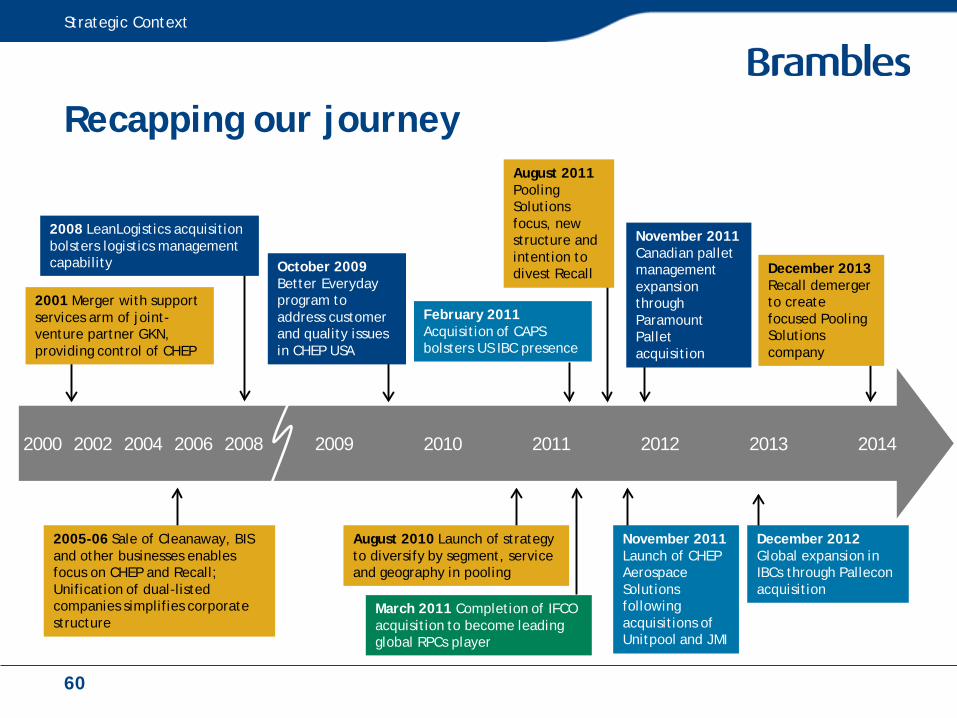
Recapping our journey
Strategic Context
March 2011 Completion of IFCO acquisition to become leading global RPCs player
2000 2002 2004 2006 2008 2009 2010 2011 2012 2013 2014
November 2011 Launch of CHEP Aerospace Solutions following acquisitions of Unitpool and JMI
December 2012 Global expansion in IBCs through Pallecon acquisition
2005-06 Sale of Cleanaway, BIS and other businesses enables focus on CHEP and Recall; Unification of dual-listed companies simplifies corporate structure
August 2010 Launch of strategy to diversify by segment, service and geography in pooling
February 2011 Acquisition of CAPS bolsters US IBC presence
November 2011Canadian pallet management expansion through Paramount Pallet acquisition
2001 Merger with support services arm of joint-venture partner GKN, providing control of CHEP
December 2013Recall demerger to create focused Pooling Solutions company
October 2009 Better Everyday program to address customer and quality issues in CHEP USA
August 2011Pooling Solutions focus, new structure and intention to divest Recall
2008 LeanLogistics acquisition bolsters logistics management capability
60

80%68%
9%
10%
5%16%
6% 6%
FY09 FY13
Pooling Solutions sales revenue composition
Pallets - developed Pallets - emerging RPCs Containers
61
Delivering our diversification strategy
0
100
200
300
400
500
600
FY09 FY10 FY11 FY12 FY13
Pallets emerging markets sales revenue (US$M)
Strategic Context
1 CAGR (compound annual growth rate) calculated at constant 30 June 2013 foreign exchange rates.
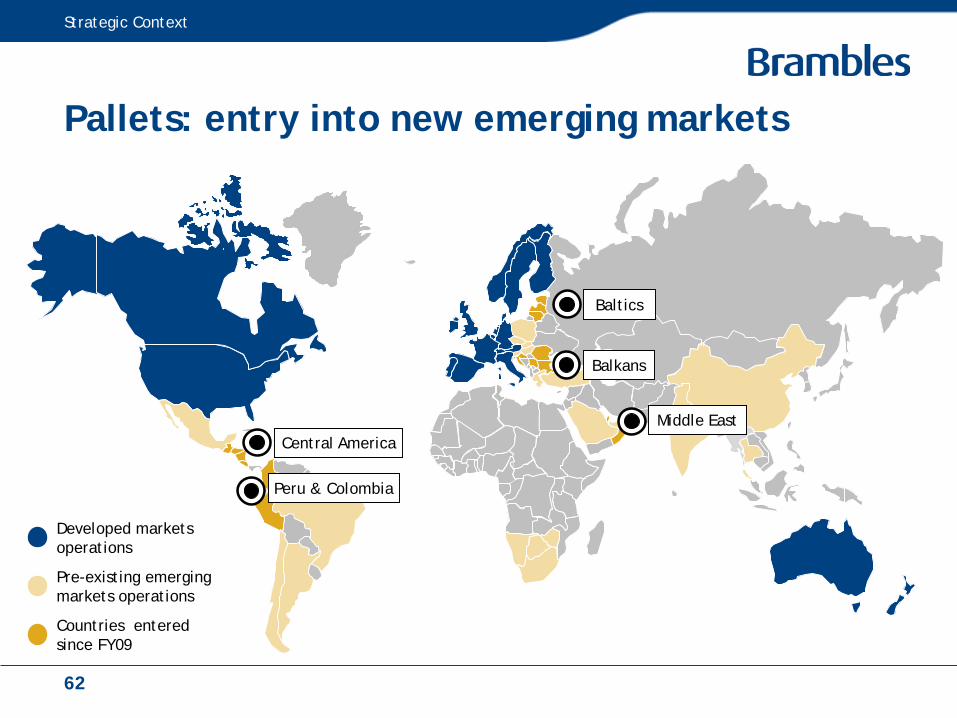
Pallets: entry into new emerging markets
Strategic Context
Pre-existing emerging markets operations
Developed markets operations
Countries entered since FY09
Baltics
Central America
Peru & Colombia
Balkans
Middle East
62
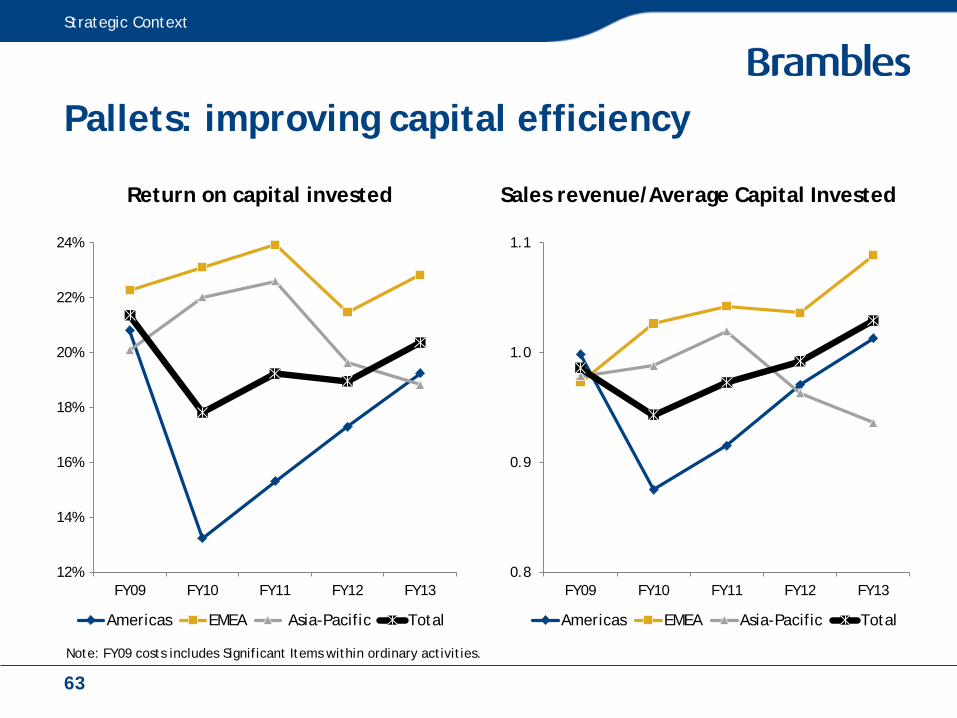
Return on capital invested Sales revenue/Average Capital Invested
Pallets: improving capital efficiency
12%
14%
16%
18%
20%
22%
24%
FY09 FY10 FY11 FY12 FY13
Americas EMEA Asia-Pacific Total
0.8
0.9
1.0
1.1
FY09 FY10 FY11 FY12 FY13
Americas EMEA Asia-Pacific Total
Strategic Context
Note: FY09 costs includes Significant Items within ordinary activities.
63

24%
26%
28%
30%
32%
34%
36%
38%
40%
42%
FY09 FY10 FY11 FY12 FY13
Americas Americas excl. PMS EMEA Asia-Pacific Total
Pallets: managing our cost base
Net transport costs/sales revenue
10%
12%
14%
16%
18%
20%
22%
FY09 FY10 FY11 FY12 FY13
Plant costs/sales revenue
Strategic Context
Note: FY09 costs includes Significant Items within ordinary activities.
64

Global Pooling Solutions agenda
Disciplined RPCs and Containers growth
Entry into high potential emerging markets
New pallet offerings in developed businesses
Allocate capital to high value growth
opportunities
Deliver savings through global Pallets structure
Continued asset management improvements
Review and improve overhead structure
Emphasise operational and asset efficiency
Develop and drive shared services models
Leverage global network and brands
Nurture one global business culture
Leverage global scale, networks and footprint
Focus areas for value creation
Strategic Context
65
Key messages
Strategic Context
1 Guidance at 30 June 2013 FX and subject to the disclaimer on Slide 60. FY13 Underlying Profit on a comparable basis (ex-Recall) of US$913M translates to US$895M at 30 June 2013 FX rates.
• Underlying Profit delivered within guidance range
• Strong improvement in operating cash flow
• Pooling Solutions– Continued sales growth in all regions led by Pallets Americas, RPCs
– Improving sales mix and operational efficiencies
– Asset efficiency driving improved capital performance
• Recall demerger on track after transitional year reflecting divestment process and lower customer activity in information management sector
• Brambles ex-Recall guidance for FY14 Underlying Profit of US$930M to US$965M (4% to 8% growth) 1
66

Appendices

Except where noted, common terms and measures used in this document are based upon the following definitions:
Actual rates/FX In the statutory financial statements, Brambles translates foreign currency results into US dollars at the applicable actual monthly exchange rates ruling in each period.
Average Capital Invested (ACI)
Brambles defines Average Capital Invested as a 12-month average of capital invested, calculated as net assets before tax balances, cash and borrowings but after adjustment for accumulated pre-tax Significant Items, actuarial gains and losses and net equity adjustments for equity-settled share-based payments.
Capital expenditure (capex)
Unless otherwise stated, capital expenditure is presented on an accruals basis and excludes intangible assets, investments in associates and equity acquisitions. It is shown gross of any fixed asset disposals proceeds.
Cash Flow from Operations
Brambles defines Cash Flow from Operations as operating cash flow generated after net capital expenditure but excluding Significant Items that are outside the ordinary course of business.
Constant currency/FX Constant currency results are presented by translating both current and comparable period foreign currency results into US dollars at the actual monthly exchange rates applicable in the comparable period, so as to show relative performance between the two periods before the translation impact of currency fluctuations.
Earnings per share (EPS) Profit after tax, minority interests and Significant Items, divided by shares in issue.
Free cash flow Brambles defines free cash flow as cash flow generated after net capital expenditure, finance costs and tax, but excluding the net cost of acquisitions and proceeds from business disposals.
Net new business Brambles defines net new business wins as the change in sales revenue in the reporting period resulting from business won or lost in that period and the previous financial year. The revenue impact of net new business wins is included across reporting periods for a total of 12 months from the date of the win or loss and calculated on a constant currency basis.
Appendix 1: Glossary of terms and measures
Appendices
68

Except where noted, common terms and measures used in this document are based upon the following definitions:
Operating profit Operating profit is profit before finance costs and tax, as shown in the statutory financial statements.
Organic growth The change in sales revenue in the reporting period resulting from like–for-like sales of the same products with the same customers.
PMS Pallet Management Services, a division of Brambles operating under the IFCO brand in the USA.
Return on capital invested (ROCI)
Return on capital invested is Underlying Profit divided by Average Capital Invested (a twelve-month average of capital invested calculated as net assets before tax balances, cash and borrowings but after adjustment for accumulated pre-tax Significant Items, actuarial gains or losses and net equity adjustments for equity-settled share-based payments).
RPC Reusable plastic crate, used to transport fresh produce.
Sales revenue Excludes revenues of associates and non-trading revenue.
Significant Items Brambles defines Significant Items as items of income or expense which are, either individually or in aggregate, material to Brambles or to the relevant business segment and: • Outside the ordinary course of business (e.g. gains or losses on the sale or termination of operations, the cost of significant reorganisations or restructuring); or • Part of the ordinary activities of the business but unusual due to their size and nature.
Underlying Profit Brambles defines Underlying Profit as profit from Continuing Operations before finance costs, tax and Significant Items.
Appendix 1: Glossary of terms and measures (continued)
Appendices
69
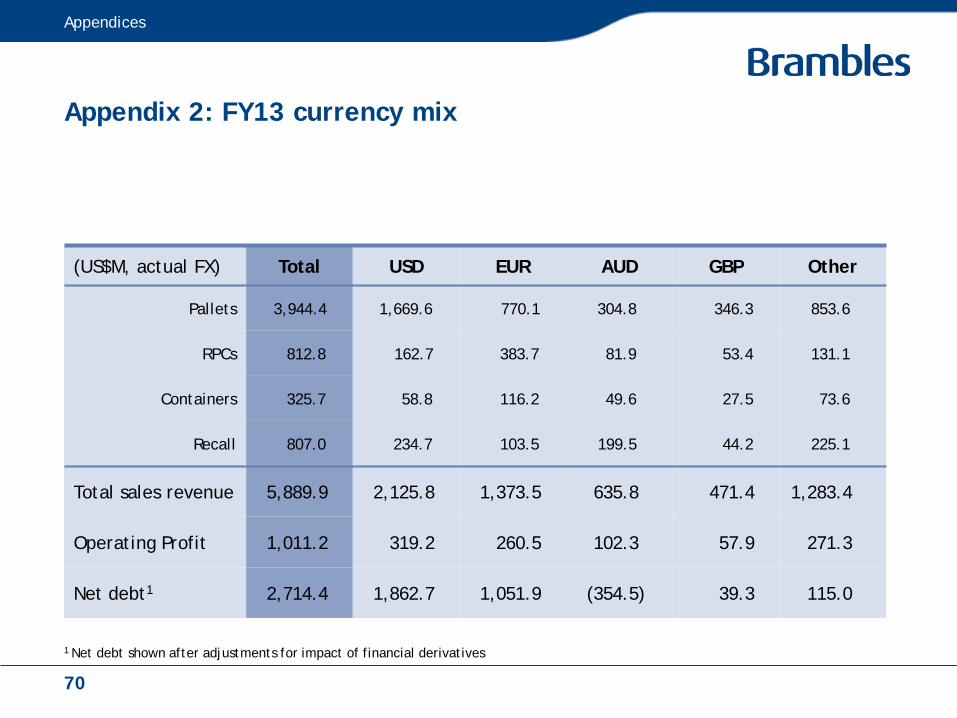
(US$M, actual FX) Total USD EUR AUD GBP Other
Pallets 3,944.4 1,669.6 770.1 304.8 346.3 853.6
RPCs 812.8 162.7 383.7 81.9 53.4 131.1
Containers 325.7 58.8 116.2 49.6 27.5 73.6
Recall 807.0 234.7 103.5 199.5 44.2 225.1
Total sales revenue 5,889.9 2,125.8 1,373.5 635.8 471.4 1,283.4
Operating Profit 1,011.2 319.2 260.5 102.3 57.9 271.3
Net debt1 2,714.4 1,862.7 1,051.9 (354.5) 39.3 115.0
Appendix 2: FY13 currency mix
Appendices
1 Net debt shown after adjustments for impact of financial derivatives
70

Appendix 3: Major currency exchange rates
Appendices
USD vs. USD EUR AUD GBP CAD ZAR MXN
AverageFY13 1.0000 1.2939 1.0212 1.5667 0.9919 0.1124 0.0779
FY12 1.0000 1.3325 1.0304 1.5834 0.9944 0.1289 0.0760
As at30 June 13 1.0000 1.3015 0.9134 1.5206 0.9507 0.1010 0.0772
30 June 12 1.0000 1.2440 1.0032 1.5515 0.9673 0.1189 0.0734
Share of actual FY13 sales revenue
36% 23% 11% 8% 6% 3% 3%
71

Appendix 4: Effective tax rate
Continuing Operations
(US$M) actual FX
FY13 FY12
Statutory Underlying Statutory Underlying
Profit before tax 900.3 946.3 787.2 857.7
Tax expense 260.4 269.1 212.3 233.2
Effective tax rate 28.9% 28.4% 27.0% 27.2%
Appendices
72

(US$M) actual FX FY13 FY12
Underlying Profit 1,057.2 1,009.7
Significant Items:
Acquisition-related costs (4.6) (2.8)
Restructuring & integration costs (22.0) (53.2)
Recall transaction costs (4.1) (21.2)
Impairment of software development costs (15.3) -
Pension costs - (5.8)
Foreign exchange gain on capital repatriation - 12.5
Subtotal (46.0) (70.5)
Operating Profit 1,011.2 939.2
Appendix 5: Significant Items
Appendices
73
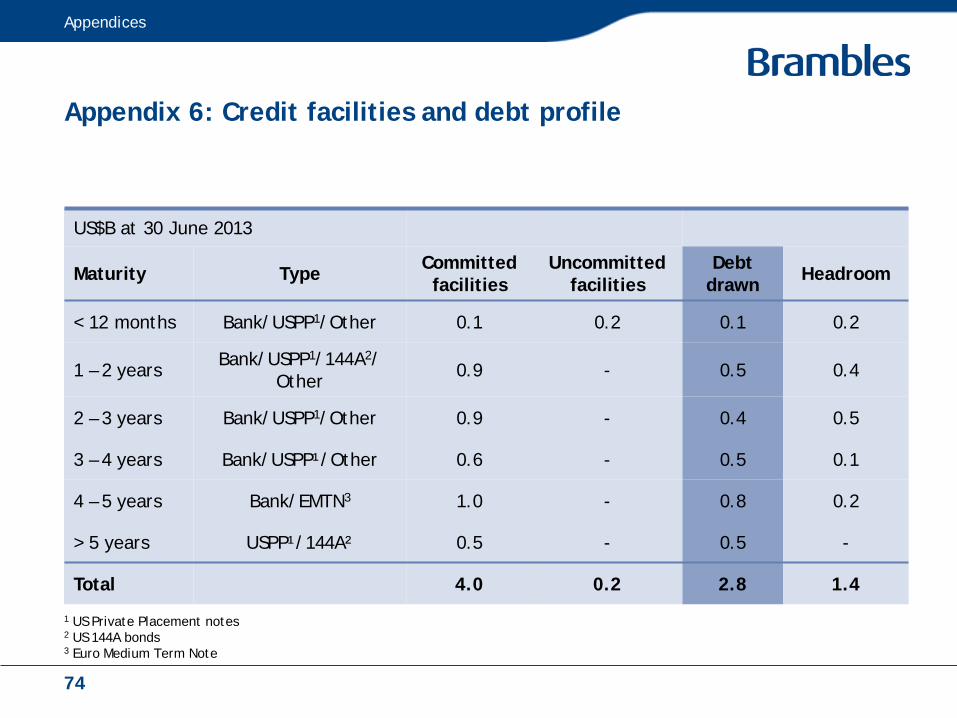
Appendix 6: Credit facilities and debt profile
US$B at 30 June 2013
Maturity Type Committed facilities
Uncommitted facilities
Debt drawn Headroom
< 12 months Bank/USPP1/Other 0.1 0.2 0.1 0.2
1 – 2 yearsBank/USPP1/144A2/
Other0.9 - 0.5 0.4
2 – 3 years Bank/USPP1/Other 0.9 - 0.4 0.5
3 – 4 years Bank/USPP¹/Other 0.6 - 0.5 0.1
4 – 5 years Bank/EMTN3 1.0 - 0.8 0.2
> 5 years USPP¹/144A² 0.5 - 0.5 -
Total 4.0 0.2 2.8 1.4
Appendices
1 US Private Placement notes2 US 144A bonds3 Euro Medium Term Note
74

(US$M) Actual Forecast
Incremental year-on-year improvement FY15
totalInitiatives FY12 FY13 FY14 FY15
IFCO PMS Integration 5 11 19 - 35
IFCO RPC Integration 5 - - - 5
Operations and logistics efficiencies in Pallets 10 10 20 20 60
Total 20 21 39 20 100
Appendix 7: Efficiencies and synergies
Appendices
75

Appendix 8: Capital expenditure breakdown by nature (accruals basis)
554209
46
6943
573183
29
81
62
Appendices
FY12Total US$921M
Note: Property, plant and equipment cash capex in FY13 was US$905M compared with US$949M in FY12
FY13 Total US$928M
76
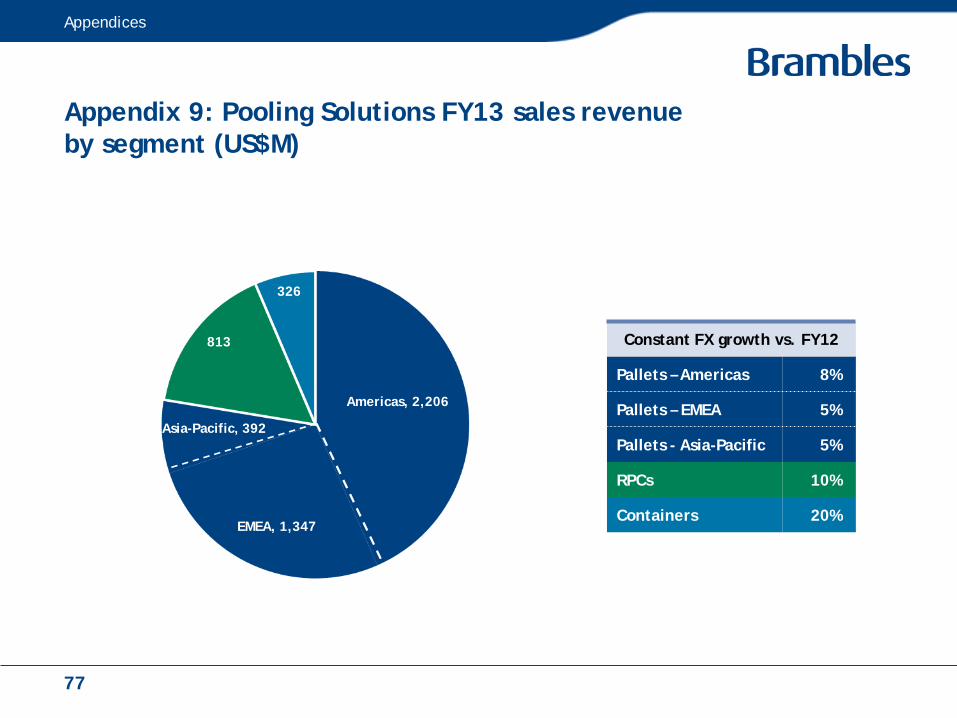
Appendix 9: Pooling Solutions FY13 sales revenue by segment (US$M)
Appendices
Constant FX growth vs. FY12
Pallets – Americas 8%
Pallets – EMEA 5%
Pallets - Asia-Pacific 5%
RPCs 10%
Containers 20%
Americas, 2,206
Asia-Pacific, 392
EMEA, 1,347
813
326
77

Appendix 10: Pallets FY13 sales revenue by Customer Business Unit (US$M)
1,248
278
257
22
401
360
242
164
366
78
137 340
52
Constant FX growth vs. FY12
USA 7%
Canada 9%
Latin America 14%
LeanLogistics 14%
Pallet Management Services 9%
Western Europe 2%
UK & Ireland 4%
Iberia (3)%
France 0%
Other 5%
Central & Eastern Europe 47%
Middle East & Africa 14%
Australia & NZ 2%
Asia 25%
Appendices
Other Western Europe
France
UK & Ireland
Iberia
78
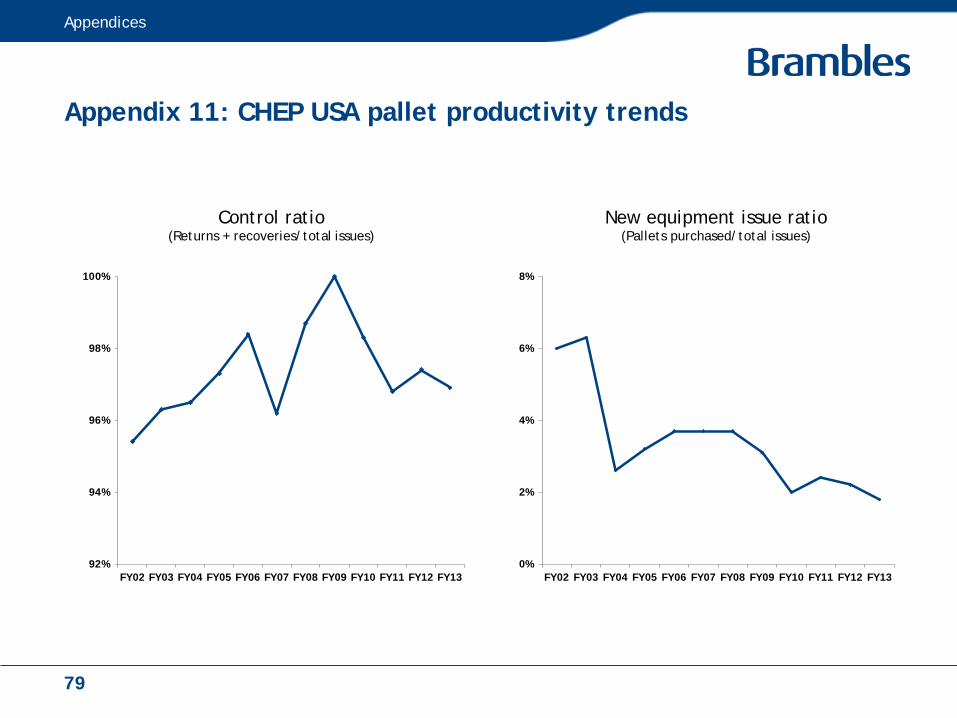
Appendix 11: CHEP USA pallet productivity trends
92%
94%
96%
98%
100%
FY02 FY03 FY04 FY05 FY06 FY07 FY08 FY09 FY10 FY11 FY12 FY130%
2%
4%
6%
8%
FY02 FY03 FY04 FY05 FY06 FY07 FY08 FY09 FY10 FY11 FY12 FY13
Appendices
Control ratio(Returns + recoveries/total issues)
New equipment issue ratio(Pallets purchased/total issues)
79
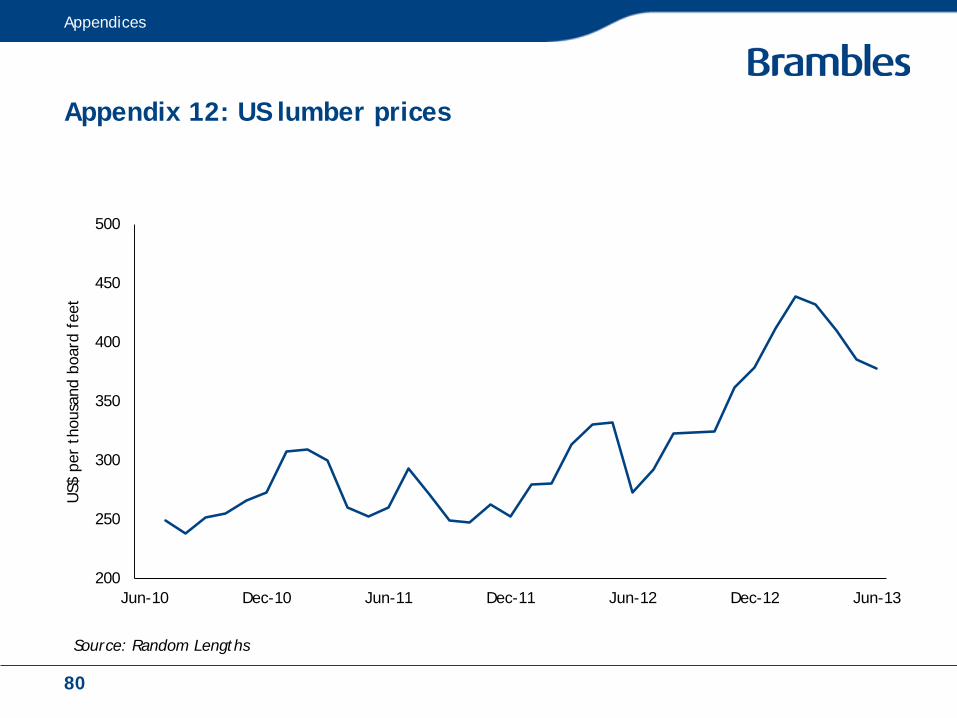
Appendix 12: US lumber prices
Appendices
200
250
300
350
400
450
500
Jun-10 Dec-10 Jun-11 Dec-11 Jun-12 Dec-12 Jun-13
US$
per
tho
usan
d bo
ard
feet
Source: Random Lengths
80

Appendix 13: CHEP Europe pallet productivity trends
90%
92%
94%
96%
98%
100%
FY02 FY03 FY04 FY05 FY06 FY07 FY08 FY09 FY10 FY11 FY12 FY130%
2%
4%
6%
8%
10%
FY02 FY03 FY04 FY05 FY06 FY07 FY08 FY09 FY10 FY11 FY12 FY13
Appendices
Control ratio(Returns + recoveries/total issues)
New equipment issue ratio(Pallets purchased/total issues)
81

Appendix 14: RPCs FY13 sales revenue by region (US$M)
511
163
22
117
Appendices
Constant FX growth vs. FY12
Europe 8%
North America 18%
South America 3%
ANZ & South Africa 12%
82

Appendix 15: Containers FY13 sales revenue by sector (US$M)
150
59
78
38
Appendices
Constant FX growth vs. FY12
Automotive 0%
Aerospace 44%
IBCs 85%
CCC 1%
83
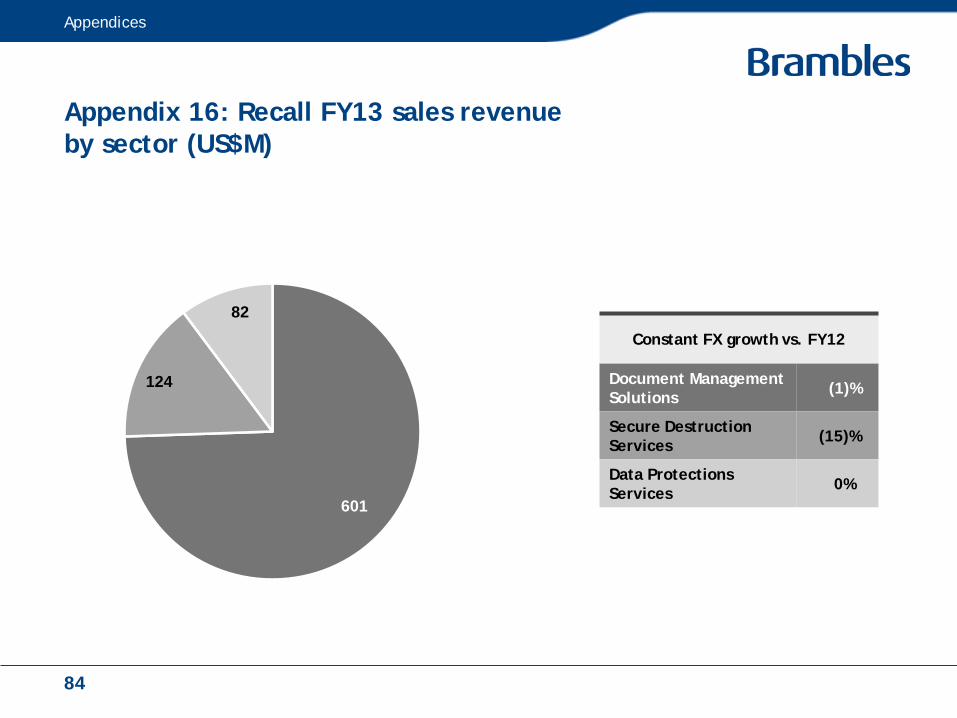
Appendix 16: Recall FY13 sales revenue by sector (US$M)
601
124
82
Appendices
Constant FX growth vs. FY12
Document Management Solutions (1)%
Secure Destruction Services (15)%
Data Protections Services 0%
84

50
90
130
170
210
250
290
Jun-08 Dec-08 Jun-09 Dec-09 Jun-10 Dec-10 Jun-11 Dec-11 Jun-12 Dec-12 Jun-13
Pric
e pe
r to
n
Appendix 17: paper prices – North America
US$
Appendices
85

Contacts
Investor Relations Contacts
Cathy PressGroup Vice President, Capital [email protected]+61 (2) 9256 5241+61 (0) 419 290 745 (mobile)
James HallSenior Director, Investor Relations & Corporate [email protected]+61 (2) 9256 5262+61 (0) 401 524 645 (mobile)
brambles.com/investor-centre
Contacts
87

Disclaimer
The release, publication or distribution of this presentation in certain jurisdictions may be restricted by law and therefore persons in such jurisdictions into which this presentation is released, published or distributed should inform themselves about and observe such restrictions.This presentation does not constitute, or form part of, an offer to sell or the solicitation of an offer to subscribe for or buy any securities, nor the solicitation of any vote or approval in any jurisdiction, nor shall there be any sale, issue or transfer of the securities referred to in this presentation in any jurisdiction in contravention of applicable law.Persons needing advice should consult their stockbroker, bank manager, solicitor, accountant or other independent financial advisor. Certain statements made in this presentation are forward-looking statements.These forward-looking statements are not historical facts but rather are based on Brambles’ current expectations, estimates and projections about the industry in which Brambles operates, and beliefs and assumptions. Words such as "anticipates," "expects," "intends," "plans," "believes," "seeks,” "estimates," and similar expressions are intended to identify forward-looking statements.These statements are not guarantees of future performance and are subject to known and unknown risks, uncertainties and other factors, some of which are beyond the control of Brambles, are difficult to predict and could cause actual results to differ materially from those expressed or forecasted in the forward-looking statements. Brambles cautions shareholders and prospective shareholders not to place undue reliance on these forward-looking statements, which reflect the view of Brambles only as of the date of this presentation.The forward-looking statements made in this presentation relate only to events as of the date on which the statements are made. Brambles will not undertake any obligation to release publicly any revisions or updates to these forward-looking statements to reflect events, circumstances or unanticipated events occurring after the date of this presentation except as required by law or by any appropriate regulatory authority.
Disclaimer
88