investor event at eular 2009 copenhagen, 12 june 2009aa643d56-6ea3-47b0... · investor event at...
TRANSCRIPT
Investor event at EULAR 2009Copenhagen, 12 June 2009
2
This presentation contains certain forward-looking statements. These forward-looking statements may be identified by words such as ‘believes’, ‘expects’, ‘anticipates’, ‘projects’, ‘intends’, ‘should’, ‘seeks’, ‘estimates’, ‘future’ or similar expressions or by discussion of, among other things, strategy,
goals, plans or intentions. Various factors may cause actual results to differ materially in the future from those reflected in forward-looking statements contained in this presentation, among others:
1 pricing and product initiatives of competitors;
2 legislative and regulatory developments and economic conditions;
3 delay or inability in obtaining regulatory approvals or bringing products to market;
4 fluctuations in currency exchange rates and general financial market conditions;
5 uncertainties in the discovery, development or marketing of new products or new uses of existing products, including without limitation negative results of clinical trials or research projects, unexpected side-effects of pipeline or marketed products;
6 increased government pricing pressures;
7 interruptions in production
8 loss of or inability to obtain adequate protection for intellectual property rights;
9 litigation;
10 loss of key executives or other employees; and
11 adverse publicity and news coverage.
Any statements regarding earnings per share growth is not a profit forecast and should not be interpreted to mean
that Roche’s earnings or earnings per share for this year or any subsequent period will necessarily match or
exceed the historical published earnings or earnings per share of Roche.
For marketed products discussed in this presentation, please see full prescribing information on our website –www.roche.com
All mentioned trademarks are legally protected

3
Agenda
Overview of Roche’s Inflammation/ RA franchise
– Richard Erwin, Actemra Task Force Leader, Roche, Switzerland
Actemra data presented at EULAR
– Andrea Rubbert-Roth, Head of Rheumatology, University of Cologne, Germany
MabThera/ Rituxan data presented at EULAR
– Paul-Peter Tak, Professor of Medicine, Academic Medical Center/University of
Amsterdam, The Netherlands
Questions & Answers
Richard Erwin, Actemra Task Force Leader, Roche
Fighting Inflammation – Rebuilding Patients’ Lives

5
RA COPD Asthma Other Autoimmune
Shaping future treatment and rebuilding patients’ lives
Inflammation strategy
Focus on core areas – complement with line extensions in other autoimmune diseases
Biomarkers and Personalised Healthcare
Focus R&D on core indications
Maximise current assets (line extensions, new formulations)
6
Roche’s Inflammation portfolio
Innovative molecules with diversity of mechanisms
Phase IIPhase I Phase IIIFiled/
To be filed
GENaCD4 RA
Arthritis
NME Additional Indications
Approved
MabTheraRA (aTNF IR)
Actemra–USRA
GEN=Genentech managed, CHU=Chugai managed, BTI=BioTie opt-in
Actemra sJIA
Other AI & other
GEN (MabThera)ANCA vasculitis
CellCeptLupus
R3477S1P1
Psoriasis
OcrelizumabLupus
CHU (ED-71)osteoporosis
GENIFN-alpha Ab
SLE
GENrhuMAb Beta 7ulcerative colitis
Actemra - EURA
Respiratory R7103VPAC2 COPD
R1671aIL-13 Asthma
R4930aOX40L asthma
R667RARg COPD
GENaIL-13 Asthma
Actemra - JRA, sJIA, pJIAXolair
ped. asthma
MabTheraRA (MTX naiveDMARD IR, PJD)
OcrelizumabRA
OcrelizumabRA (PJD)
XolairIdiopath. urithcaria
BTIVAP-1 inflam dis.
R1646pain
Status as of March 31, 2009
7
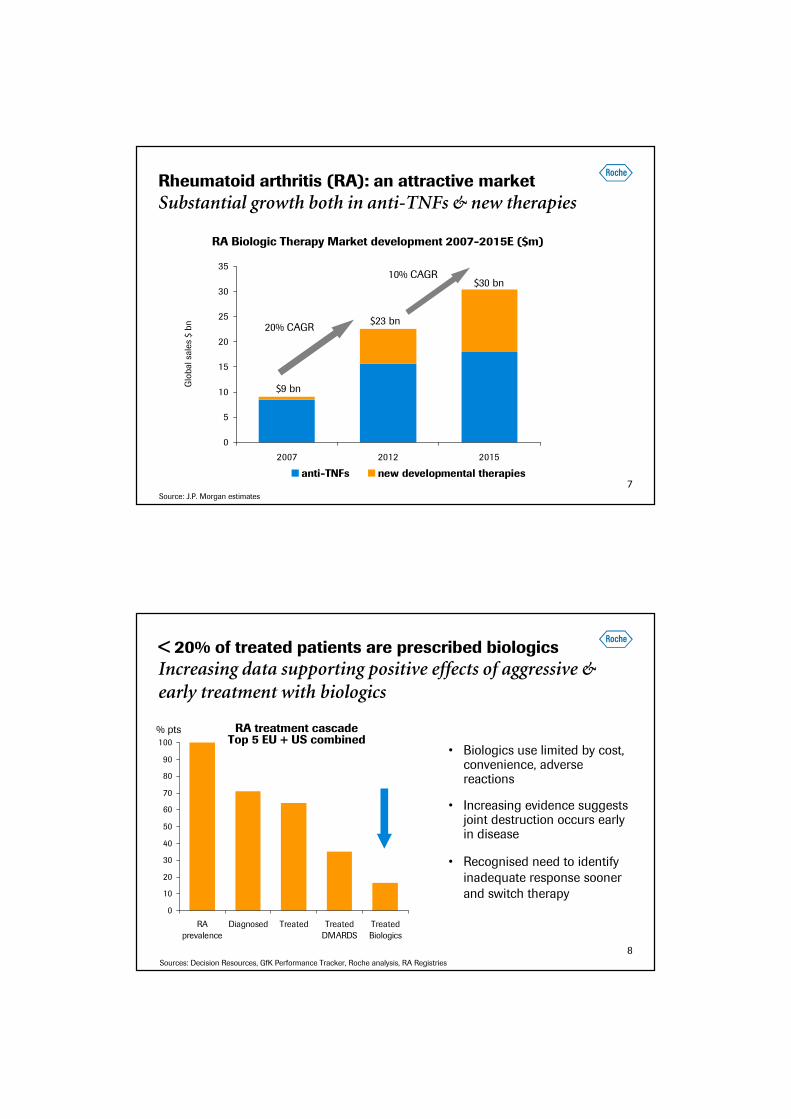
Rheumatoid arthritis (RA): an attractive market
Substantial growth both in anti-TNFs & new therapies
0
5
10
15
20
25
30
35
2007 2012 2015
anti-TNFs new developmental therapies
$9 bn
Source: J.P. Morgan estimates
RA Biologic Therapy Market development 2007-2015E ($m)
Glo
ba
l sa
les
$ b
n $23 bn
$30 bn10% CAGR
20% CAGR
8
< 20% of treated patients are prescribed biologics
Increasing data supporting positive effects of aggressive & early treatment with biologics
• Biologics use limited by cost, convenience, adverse reactions
• Increasing evidence suggests joint destruction occurs early in disease
• Recognised need to identify
inadequate response sooner
and switch therapy
Sources: Decision Resources, GfK Performance Tracker, Roche analysis, RA Registries
0
10
20
30
40
50
60
70
80
90
100
RA
prevalence
Diagnosed Treated Treated
DMARDS
Treated
Biologics
RA treatment cascadeTop 5 EU + US combined
% pts
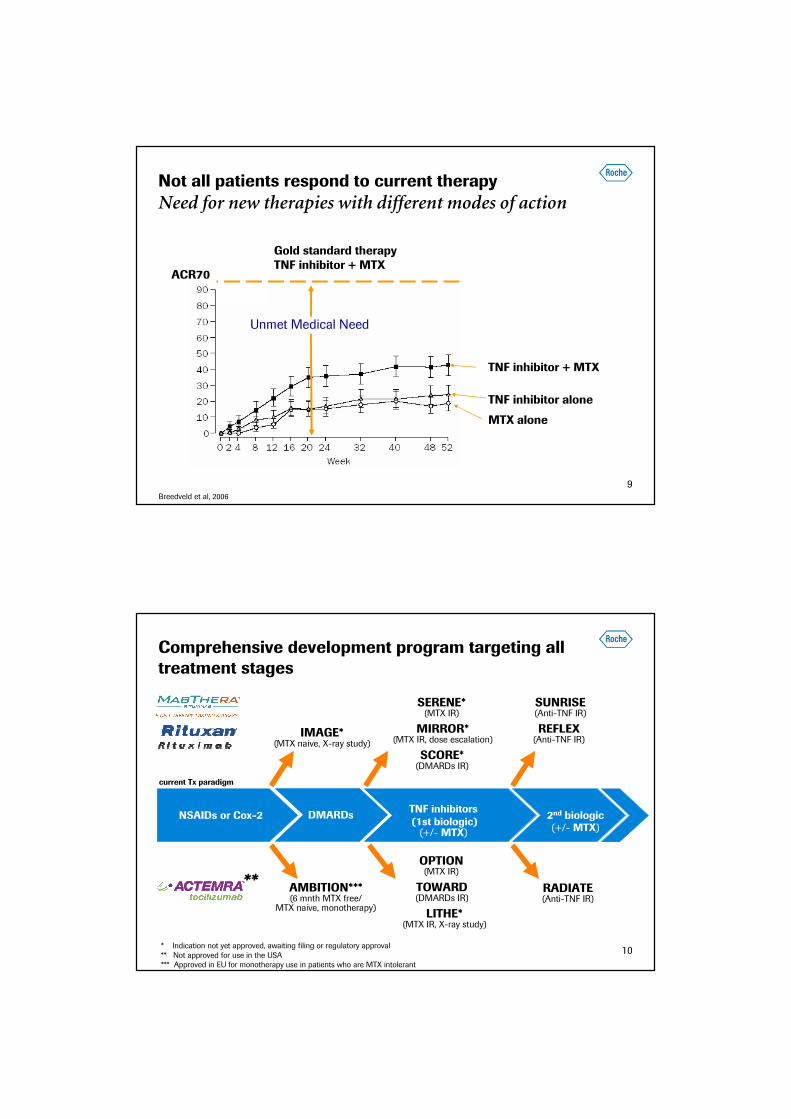
9Breedveld et al, 2006
Not all patients respond to current therapy
Need for new therapies with different modes of action
TNF inhibitor + MTX
TNF inhibitor alone
MTX alone
Gold standard therapyTNF inhibitor + MTX
Unmet Medical Need
ACR70
10
Comprehensive development program targeting all treatment stages
** TOWARD(DMARDs IR)
RADIATE(Anti-TNF IR)
MIRROR*(MTX IR, dose escalation)
SCORE*(DMARDs IR)
LITHE*(MTX IR, X-ray study)
current Tx paradigm
IMAGE*(MTX naive, X-ray study)
OPTION(MTX IR)
REFLEX(Anti-TNF IR)
SERENE*(MTX IR)
AMBITION***(6 mnth MTX free/
MTX naive, monotherapy)
NSAIDs or Cox-2TNF inhibitors(1st biologic)
2nd biologic
(+/- MTX) (+/- MTX)DMARDs
* Indication not yet approved, awaiting filing or regulatory approval
** Not approved for use in the USA*** Approved in EU for monotherapy use in patients who are MTX intolerant
SUNRISE(Anti-TNF IR)

11
MabThera/ Rituxan: first & only B cell therapy in RA
Leading biologic for anti-TNF-IRs in Europe
• Achieved ~800 m CHF sales globally in 2008 in RA
(in labelled indication)
• Moving up the treatment line:
– US submitted sBLA Q3 ’08 (DMARD-IR), 2nd
filing 2009 (MTX-naïve, PJD)
– EU filing 2009 (MTX-naïve, DMARD-IR, PJD)
• Strong additional data:
– Inhibition of radiographic progression in MTX
naïve pts (IMAGE)1, 2
– Identify patients with enhanced response3
– Efficacy maintained or increased over time; no
increase in safety concerns4
Patient Share aTNF-IRsTop 5 EU (2008)
Sources: Decision Resources, GfK Performance Tracker, Roche analysis, RA Registries1 Tak et al., EULAR 2009, Abstract OP-0022 2 Rigby et al., EULAR 2009, Abstract SAT01213 Isaacs et al., EULAR 2009, Abstract FRI0256 4 van Vollenhoven et al., EULAR 2009, Abstract OP-0026
12
Actemra: first IL-6 receptor inhibitor
Consistently high and durable remission rates - across all disease stages
• Largest clinical programme of any biologic in RA
• Approved in EU (RA broad label) & Japan (RA, sJIA,
pJIA); US re-submission on track Q3 ‘09
• Subcutaneous dose form in development
• Continued strong efficacy data:
– Demonstrated long-term safety with increasing
efficacy over time1,2,3,5
– Only biologic to have demonstrated superiority
vs. methotrexate as monotherapy4
– Significant inhibition in progression of joint
damage5 with benefits maintained at 2 yrs6
mIL-6R mIL-6R
gp130
Actemra
1 Smolen et al., EULAR 2009, Abstract FRI0133 2 Keystone et al., EULAR 2009, Abstract THU01653 van Vollenhoven et al., EULAR 2009, Abstract SAT0111 4 Jones et al., EULAR 2009, Abstract FRI0252 ann Rheum Dis 2009, Mar 175 Kremer et al., EULAR 2009, Abstracts OP-0157 & FRI0262 6 Data to be presented at an upcoming conference
13
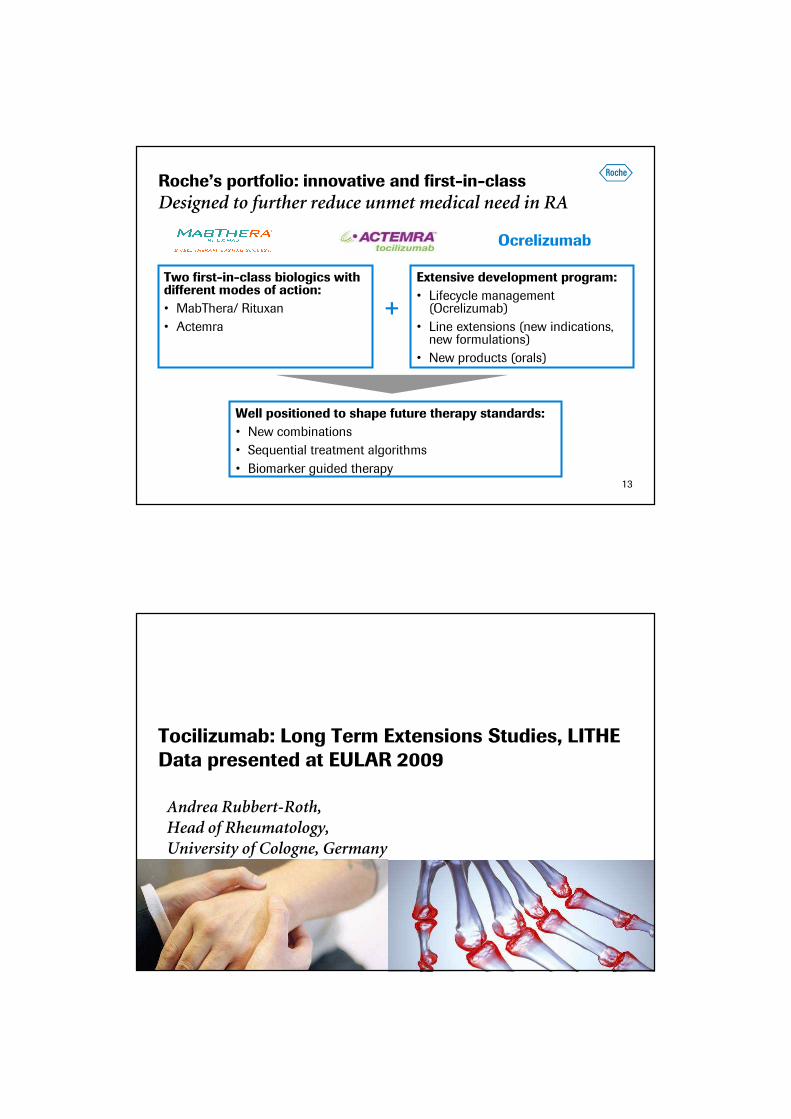
Roche’s portfolio: innovative and first-in-class
Designed to further reduce unmet medical need in RA
Two first-in-class biologics with different modes of action:
• MabThera/ Rituxan
• Actemra
Well positioned to shape future therapy standards:
• New combinations
• Sequential treatment algorithms
• Biomarker guided therapy
Ocrelizumab
Extensive development program:
• Lifecycle management (Ocrelizumab)
• Line extensions (new indications, new formulations)
• New products (orals)
+
Tocilizumab: Long Term Extensions Studies, LITHEData presented at EULAR 2009
Andrea Rubbert-Roth, Head of Rheumatology,University of Cologne, Germany
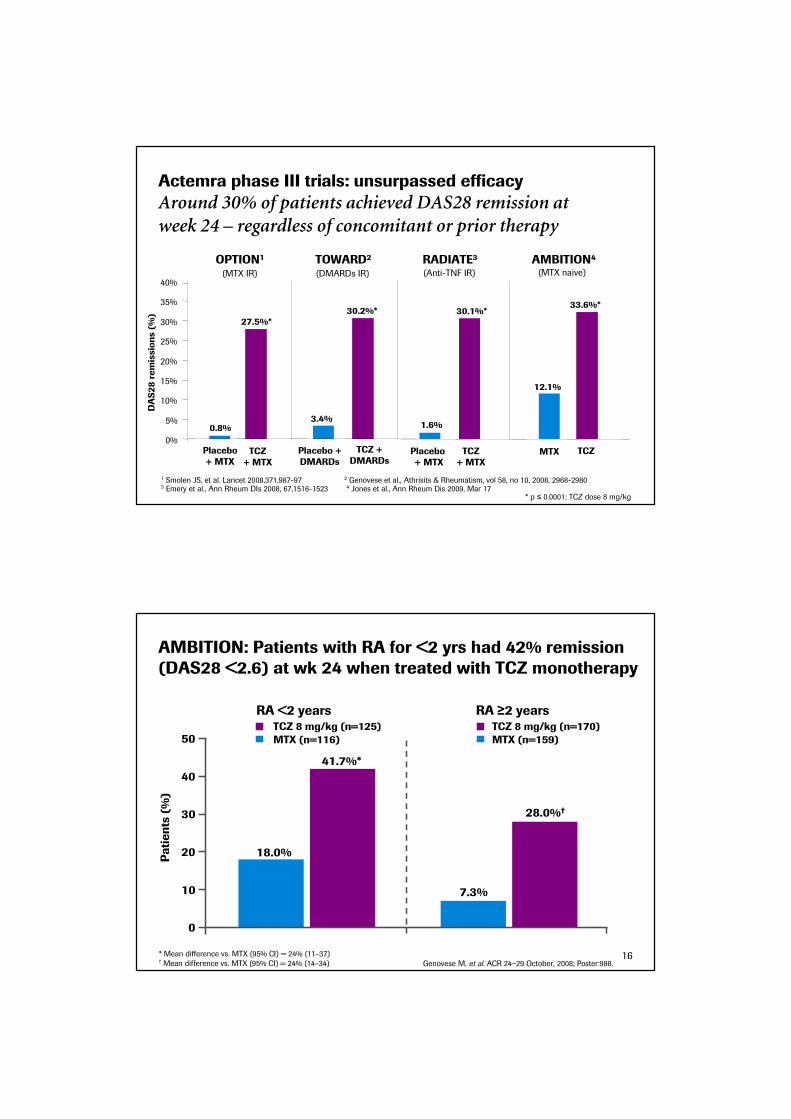
Actemra phase III trials: unsurpassed efficacy
Around 30% of patients achieved DAS28 remission at week 24 – regardless of concomitant or prior therapy
* p ≤ 0.0001; TCZ dose 8 mg/kg
1 Smolen JS, et al. Lancet 2008,371,987-97 2 Genovese et al., Athrisits & Rheumatism, vol 58, no 10, 2008, 2968-29803 Emery et al., Ann Rheum DIs 2008, 67,1516-1523 4 Jones et al., Ann Rheum Dis 2009, Mar 17
Placebo+ MTX
TCZ + MTX
Placebo +DMARDs
TCZ +DMARDs
MTX TCZ
OPTION1 TOWARD2 RADIATE3 AMBITION4
Placebo + MTX
TCZ+ MTX
0.8%
27.5%*
3.4%
30.2%*
1.6%
30.1%*
12.1%
33.6%*
0%
5%
10%
15%
20%
25%
30%
35%
40%
DAS28remissions (%)
(DMARDs IR) (Anti-TNF IR)(MTX IR) (MTX naive)
18.0%
28.0%†
7.3%
0
10
20
30
40
50
Patients (%)
41.7%*
Genovese M, et al. ACR 24−29 October, 2008; Poster:988.
* Mean difference vs. MTX (95% CI) = 24% (11–37)† Mean difference vs. MTX (95% CI) = 24% (14–34)
RA <2 years RA ≥2 years
MTX (n=116)
TCZ 8 mg/kg (n=125) TCZ 8 mg/kg (n=170)
MTX (n=159)
AMBITION: Patients with RA for <2 yrs had 42% remission (DAS28 <2.6) at wk 24 when treated with TCZ monotherapy
16

Josef Smolen
Medical University of Vienna, Vienna, Austria
Efficacy of tocilizumab in rheumatoid arthritis: Interim analysis of long-term extension trials
of up to 2.5 years
Poster FRI0133
R Alten, J Gomez-Reino, W Rizzo, C Davies, E Alecock, R van Vollenhoven
17
Patient population
Close to 90% of eligible patients entered the long-term extension (LTE) trials
Monotherapy566/673 (84%)
N=2,733 (91%)
N=2,583 (86%)
Anti-TNF-IR400/499 (80%)
DMARD-IR1,617/1,843
(87%)
Randomized in the four Phase III studies*
Reached Week 24 in the four Phase III studies
N=3,015
GROWTH95/GROWTH96 ITT population†
* OPTION, AMBITION, TOWARD and RADIATE† Comprises all patients who received ≥1 dose of tocilizumab
18

ACR50 response rates: rapid improvement which is maintained over time in all RA populations (ITT)
Week
0
20
40
60
80
Baseline 12 24 36 48 60 72 84 96 108 120 132
n =n =n =
5664001,617
5463911,578
5383891,551
5043671,441
4863541,421
4153181,373
166170948
84103653 403 228
3602951,279
2522951,156
Patients (%)
100 Anti-TNF-IR DMARD-IRMonotherapy
MonotherapyAnti-TNF-IRDMARD-IR
ACR70 response rates
0
20
40
60
80
Baseline 12 24 36 48 60 72 84 96 108 120 132
n =n =n =
5664001,617
5463911,578
5383891,551
5043671,441
4863541,421
4153181,373
166170948
84103653 403 228
3602951,279
2522951,156
Patients (%)
100 Anti-TNF-IR DMARD-IRMonotherapy
MonotherapyAnti-TNF-IRDMARD-IR
Week
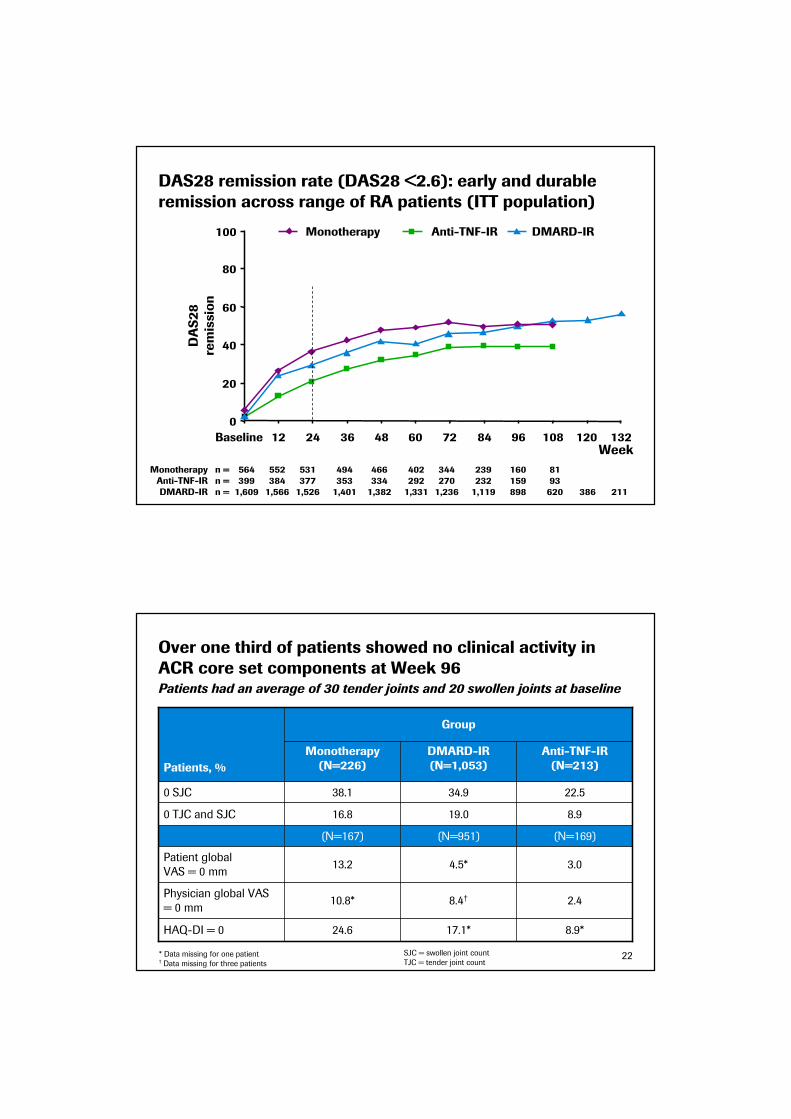
DAS28 remission rate (DAS28 <2.6): early and durable remission across range of RA patients (ITT population)
n =n =n =
0
20
40
60
80
Baseline 12 24 36 48 60 72 84 96 108 120 132
5643991,609
5523841,566
5313771,526
4943531,401
4663341,382
4022921,331
160159898
8193620 386 211
3442701,236
2392321,119
DAS28
remission
100 Anti-TNF-IR DMARD-IRMonotherapy
MonotherapyAnti-TNF-IRDMARD-IR
Week
Over one third of patients showed no clinical activity in ACR core set components at Week 96
8.9*
2.4
3.0
(N=169)
8.9
22.5
Anti-TNF-IR(N=213)
17.1*
8.4†
4.5*
(N=951)
19.0
34.9
DMARD-IR(N=1,053)
Group
24.6
10.8*
13.2
(N=167)
16.8
38.1
Monotherapy(N=226)
HAQ-DI = 0
Patient global
VAS = 0 mm
Physician global VAS
= 0 mm
0 TJC and SJC
0 SJC
Patients, %
* Data missing for one patient† Data missing for three patients
Patients had an average of 30 tender joints and 20 swollen joints at baseline
SJC = swollen joint count
TJC = tender joint count22

Summary: Long-term Remission/ Efficacy Data
Tocilizumab delivers a rapid onset of action and an efficacy that continues improving over time
• Efficacy with long-term tocilizumab treatment was maintained over >2 years,
in all three patient groups
– ACR response rates
– DAS28
• Major improvements in ACR core components at week 96
• Major clinical response (maintenance of ACR70 response for 24 consecutive
weeks)
• Low rate of withdrawal (3%) due to insufficient response
• Sustained efficacy in monotherapy
23
Long-term safety and tolerability of tocilizumab in patients with a mean treatment
duration of 1.5 years
Poster SAT0111
RF van Vollenhoven, A Rubbert-Roth, A Cantagrel,
D Ridley, J Dudler, D Grimaldi, E Alecock, J Smolen
24
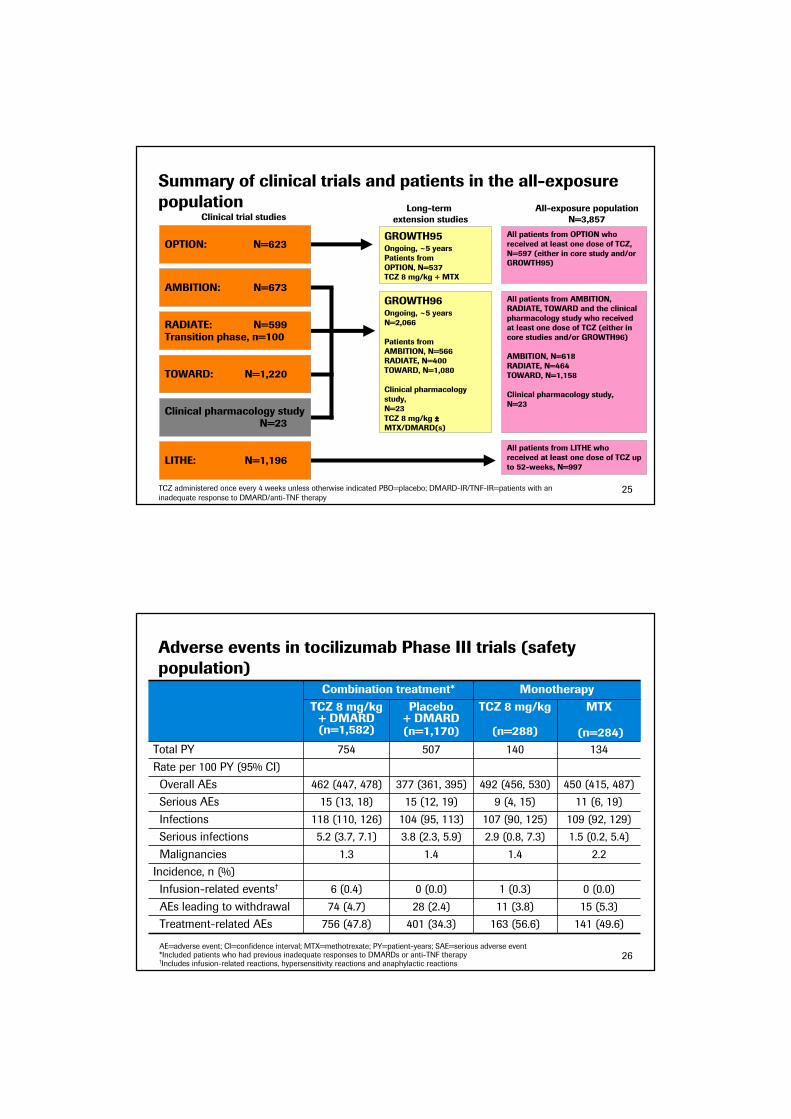
Summary of clinical trials and patients in the all-exposure population
TCZ administered once every 4 weeks unless otherwise indicated PBO=placebo; DMARD-IR/TNF-IR=patients with an
inadequate response to DMARD/anti-TNF therapy
LITHE: N=1,196
Clinical trial studies
All patients from LITHE who received at least one dose of TCZ up to 52-weeks, N=997
OPTION: N=623
AMBITION: N=673
RADIATE: N=599Transition phase, n=100
TOWARD: N=1,220
Clinical pharmacology study N=23
All patients from OPTION who received at least one dose of TCZ, N=597 (either in core study and/or GROWTH95)
All patients from AMBITION, RADIATE, TOWARD and the clinical pharmacology study who received at least one dose of TCZ (either in core studies and/or GROWTH96)
AMBITION, N=618RADIATE, N=464TOWARD, N=1,158
Clinical pharmacology study,N=23
All-exposure populationN=3,857
Long-term extension studies
GROWTH95Ongoing, ~5 yearsPatients from OPTION, N=537TCZ 8 mg/kg + MTX
GROWTH96Ongoing, ~5 yearsN=2,066
Patients fromAMBITION, N=566RADIATE, N=400TOWARD, N=1,080
Clinical pharmacology study,N=23
TCZ 8 mg/kg ±±±±MTX/DMARD(s)
25
Adverse events in tocilizumab Phase III trials (safety population)
15 (5.3)11 (3.8)28 (2.4)74 (4.7)AEs leading to withdrawal
0 (0.0)1 (0.3)0 (0.0)6 (0.4)Infusion-related events†
Incidence, n (%)
1.5 (0.2, 5.4)2.9 (0.8, 7.3)3.8 (2.3, 5.9)5.2 (3.7, 7.1)Serious infections
134140507754Total PY
Combination treatment* Monotherapy
TCZ 8 mg/kg + DMARD(n=1,582)
Placebo + DMARD (n=1,170)
TCZ 8 mg/kg
(n=288)
MTX
(n=284)
Rate per 100 PY (95% CI)
Overall AEs 462 (447, 478) 377 (361, 395) 492 (456, 530) 450 (415, 487)
Serious AEs 15 (13, 18) 15 (12, 19) 9 (4, 15) 11 (6, 19)
Infections 118 (110, 126) 104 (95, 113) 107 (90, 125) 109 (92, 129)
Malignancies 1.3 1.4 1.4 2.2
Treatment-related AEs 756 (47.8) 401 (34.3) 163 (56.6) 141 (49.6)
AE=adverse event; CI=confidence interval; MTX=methotrexate; PY=patient-years; SAE=serious adverse event*Included patients who had previous inadequate responses to DMARDs or anti-TNF therapy†Includes infusion-related reactions, hypersensitivity reactions and anaphylactic reactions
26

Rates of serious infections did not increase with continued treatment with TCZ
• Most common infections were pneumonia (n=66) and cellulitis (n=31)
• Nine opportunistic infections were reported (0.2/100 PY)
– M. avium complex infection, TB (n=2), mycobacterial urinary tract infection, P. jiroveci pneumonia, Candida osteomyelitis, GI candidiasis, fungal oesophagitis and fungal sinusitis
• Overall rate of serious infections = 4.37/100 PY (n=249), rate of deaths attributed to infections = 0.18/100 PY (n=10)
All-exposure population
1
12
No. events per PY
0 – 6 7 – 12 13 – 18 19 – 24 25 – 30 31 – 36 37 – 42
27
Atherogenic indices during long-term TCZ treatment
September 2008 safety update to FDA
Median ApoB/ApoA1 and total cholesterol/HDL
0.56
0.58
0.6
0.62
0.64
0.66
0.68
0.7
0.72
0 12 24 36 48 60 72 84 96 108 120 132
Study Week
ApoB/A
poA1
3.3
3.35
3.4
3.45
3.5
3.55
3.6
3.65
3.7
3.75
3.8
3.85
TC/H
DL
Median ApoB/ApoA1 Median TC/HDL
28
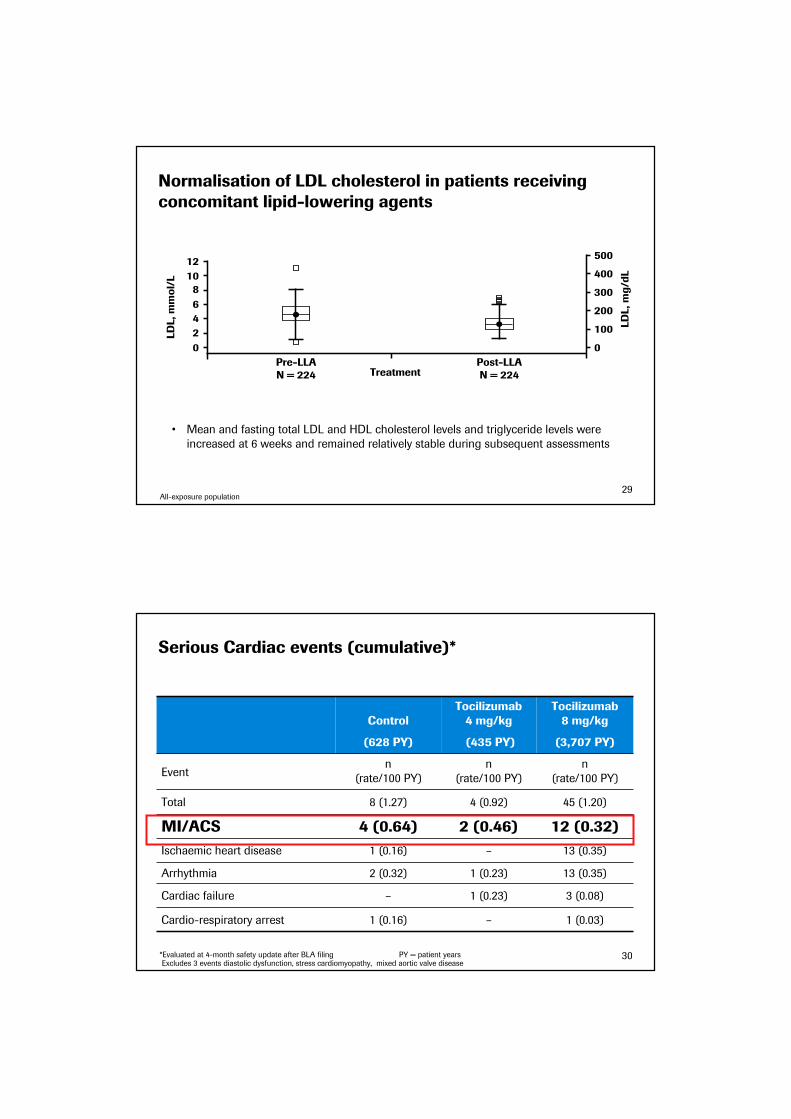
Normalisation of LDL cholesterol in patients receiving concomitant lipid-lowering agents
• Mean and fasting total LDL and HDL cholesterol levels and triglyceride levels were
increased at 6 weeks and remained relatively stable during subsequent assessments
12
LDL, mmol/L 10
8
6
4
2
0
TreatmentPre-LLAN = 224
Post-LLAN = 224
LDL, mg/dL
500
400
300
200
100
0
All-exposure population29
*Evaluated at 4-month safety update after BLA filing PY = patient yearsExcludes 3 events diastolic dysfunction, stress cardiomyopathy, mixed aortic valve disease
1 (0.16)
–
2 (0.32)
1 (0.16)
4 (0.64)
8 (1.27)
n
(rate/100 PY)
Control
(628 PY)
Tocilizumab4 mg/kg
(435 PY)
Tocilizumab 8 mg/kg
(3,707 PY)
Eventn
(rate/100 PY)
n
(rate/100 PY)
Total 4 (0.92) 45 (1.20)
MI/ACS 2 (0.46) 12 (0.32)
Ischaemic heart disease – 13 (0.35)
Arrhythmia 1 (0.23) 13 (0.35)
Cardiac failure 1 (0.23) 3 (0.08)
Cardio-respiratory arrest – 1 (0.03)
Serious Cardiac events (cumulative)*
30

Cardiovascular events: Long-term follow-up
The most frequent cardiovascular events were arrhythmias and ischaemic events
–––0.13 (0.0, 0.70)
0.18(0.02, 0.66)
0.39(0.14, 0.85)
0.35(0.13, 0.76)
0.26(0.15, 0.43)
Myocardial
infarction
–
31−−−−36
0
19−−−−24
0.13(0.20, 0.47)
7−−−−12
0.18 (0.08, 0.32)
Event rates per 100 PY (95% CI)
Event rates per 100 PY by 6-month periods (95% CI)
0−−−−6 13−−−−18 25−−−−30 37−−−−42
Stroke 0.35(0.13, 0.76)
0.18(0.02, 0.66)
– –
All-exposure population31
• 67 (1.7%) patients discontinued treatment because of elevations in transaminase levels
• Incidence of elevations in ALT/AST levels did not increase after prolonged administration of TCZ
• In the AMBITION study, shifts in ALT and AST levels were similar for TCZ 8mg/Kg as monotherapy and MTX treatment groups, regardless of previous MTX or DMARD exposure
• Elevations in transaminase levels were not associated with clinical hepatic events
ALT AST
0–6n=3,850
7–12n=3,531
13–18n=2,985
>18n=1,868
Follow-up, months
25
20
15
10
5
0
Patients, %
3.7
14.9
1.7
15.4
1.2
18.0
1.8
17.9
0–6n=3,850
7–12n=3,527
13–18n=2,974
>18n=1,863
Follow-up, months
20
16
12
8
4
0
Patients, %
1.4
15.0
0.7
13.4
0.4
12.4
0.6
14.6
>3x ULN
>1–3x ULN
The incidence of elevations in ALT/AST levels did not increase after prolonged administration of TCZ
All-exposure population32

Tocilizumab: Safety summary
Well-defined and manageable safety profile
• No new safety signals emerged after prolonged exposure to TCZ
– Incidences and types of AEs reported after long-term exposure to TCZ were similar to those reported in controlled 6-month studies
• Rates of serious infections, malignancy and other SAEs did not increase with continued treatment with TCZ
– With >10,000 patient-years of TCZ exposure, six cases of Mycobacterium tuberculosis infection have been reported
• The incidence of elevations in ALT/AST levels did not increase after prolonged administration of TCZ
• Elevations in lipid levels were observed with TCZ treatment and decreased when statins were prescribed
• Rates of MI/stroke were comparable with those reported for RA patients receiving biologics (<0.5 per 100 PY) and remained stable over time
33
Summary: Consistent results across all trials
Maintained over long-term
• 86% of eligible patients from four controlled 24-week studies entered the LTE
programme, suggesting that these patients and their physicians consider ongoing
treatment with ACTEMRA has a favourable benefit/risk profile
• Response rates to therapy with ACTEMRA 8 mg/kg (+ DMARD) were maintained
from the preceding 24-week core studies and tended to improve further with
increasing duration of treatment
• The adverse events reported are consistent with the known mode of action of
Actemra and were manageable with existing guidelines and practice
• Tocilizumab is efficacious in the long term
34
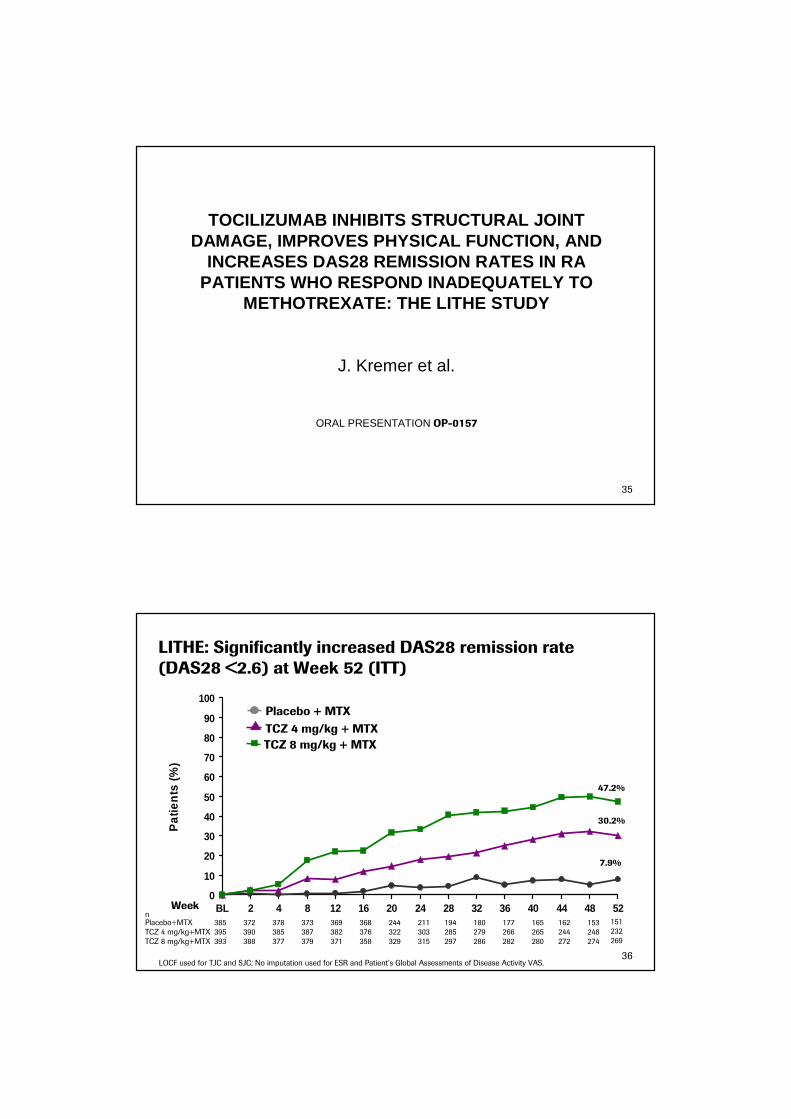
TOCILIZUMAB INHIBITS STRUCTURAL JOINT DAMAGE, IMPROVES PHYSICAL FUNCTION, AND
INCREASES DAS28 REMISSION RATES IN RAPATIENTS WHO RESPOND INADEQUATELY TO
METHOTREXATE: THE LITHE STUDY
J. Kremer et al.
ORAL PRESENTATION OP-0157
35
LITHE: Significantly increased DAS28 remission rate (DAS28 <2.6) at Week 52 (ITT)
0
10
20
30
40
50
60
70
80
90
100
BL 2 4 8 12 16 20 24 28 32 36 40 44 48 52
Pat
ient
s (%
)
TCZ 8 mg/kg + MTX
TCZ 4 mg/kg + MTX
Placebo + MTX
Week
47.2%
30.2%
7.9%
LOCF used for TJC and SJC; No imputation used for ESR and Patient’s Global Assessments of Disease Activity VAS.
nPlacebo+MTX 385TCZ 4 mg/kg+MTXTCZ 8 mg/kg+MTX
372 378 373 369 153162165177180194211244368395 390 385 387 382 376 322 303 285 279 266 265 244 248393 388 377 379 371 358 329 315 297 286 282 280 272 274
151232269
36

Total Sharp–Genant score
Erosion score Joint space narrowing score
p<0.0001
p<0.0001
p<0.0001
p<0.0001
p<0.01
p<0.01
Placebo + MTX (n=393)
TCZ 8 mg/kg + MTX (n=398)
TCZ 4 mg/kg + MTX (n=399)
1.13
0.71
0.42
0.210.13
0.29
0.170.12
0.34
0
0.2
0.4
0.6
0.8
1.0
1.2
Mean change from baseline
n= 290 339 348 290 339 348 290 339 348
LITHE: Significant inhibition of radiographic progression at Week 52 (linear extrapolation method; ITT)
37
67.2 70.0
84.582.6
90.684.5 86.8 90.5
80.5
20
40
60
80
100
Patients without progression (%)
p<0.001
p<0.001
p<0.001
p<0.001
p<0.05
p<0.05
Total Sharp–Genant score
Erosion score Joint space narrowing score
0n= 290 339 348 290 339 348 290 339 348
LITHE: Significantly greater proportion of patients without progression at Week 52 (linear extrapolation method; ITT)
Placebo+MTX(n=393)
TCZ 8 mg/kg +MTX(n=398)
TCZ 4 mg/kg +MTX(n=399)
38

39
LITHE: Summary
• Tocilizumab 8 mg/kg showed substantial (74%) inhibition of radiographic
progression at Week 52
• Continuous growth of effects over time in DAS28 and ACR scores
• Rapid and sustained improvement in HAQ-DI with tocilizumab, significantly
superior to control
• Safety profile without new signals as compared to earlier studies
39
Rituximab: IMAGE, Long Term Safety, Biomarkers Data presented at EULAR 2009
Paul P. Tak, Professor of MedicineAcademic Medical Center/University of AmsterdamThe Netherlands

Inhibition of joint damage and improved clinical outcomes with a combination of rituximab and
methotrexate in patients with early active rheumatoid arthritis who are naive to MTX:A randomised active comparator placebo- controlled trial (IMAGE)
P. P. Tak, W. Rigby, A. Rubbert, C. Peterfy, R. F. van Vollenhoven, W. Stohl, E. Hessey,
A. Chen, H. Tyrrell, T. Shaw
On behalf of the IMAGE Study Group
Presentation # OP-0022
41
The IMAGE study
Objectives
• Determine effectiveness of rituximab in prevention of progression in structural joint damage in patients with active RA initiating treatment with MTX
• Evaluate efficacy of rituximab in improving signs and symptoms of RA and patients’physical function
• Evaluate safety in patients with active RA initiating treatment with MTX
Key inclusion criteria
• RA diagnosed for ≥8 weeks but ≤4 years
• Naïve to, and considered to be candidates for, MTX
• Active disease, defined as;
– SJC ≥ 8 TJC ≥ 8 (66/68 joint count) at screening and baseline
– CRP ≥ 1.0mg/dL (10mg/L) at screening
• For rheumatoid factor (RF)-negative patients: radiographic evidence of at least one joint with definite erosion attributable to RA
42
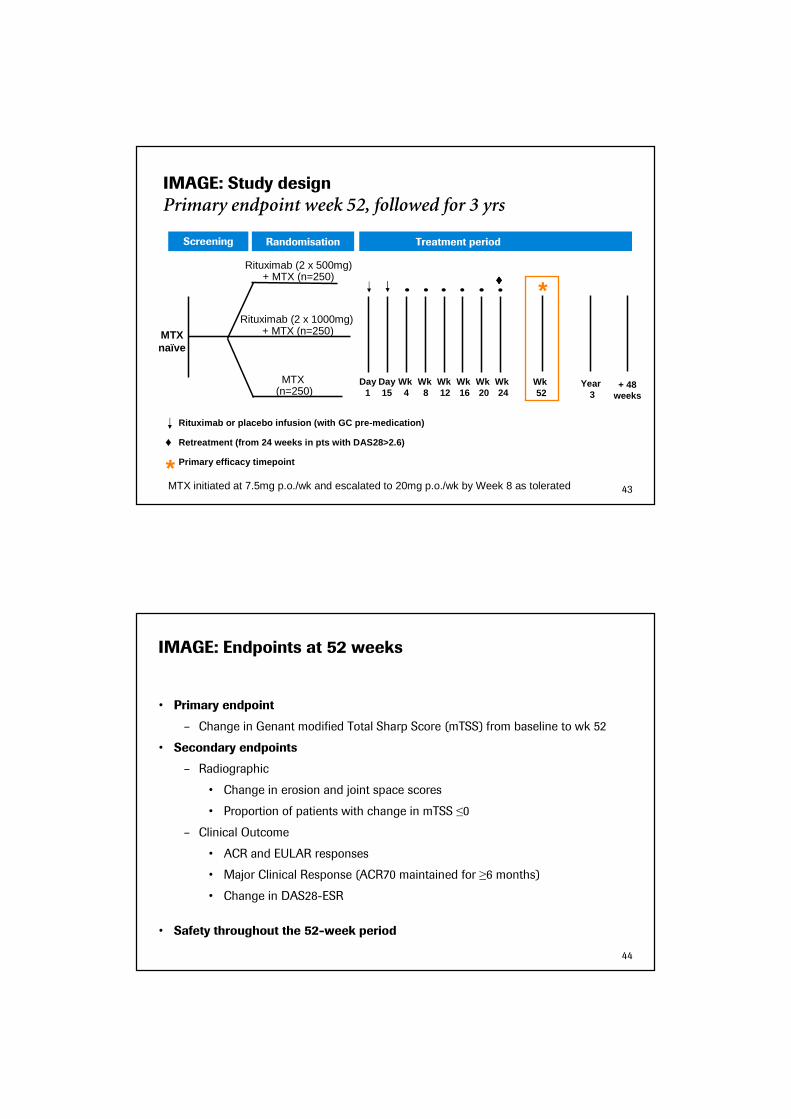
IMAGE: Study design
Primary endpoint week 52, followed for 3 yrs
Randomisation Treatment period
Year 3
MTX (n=250)
Screening
MTX naïve
Rituximab (2 x 500mg)+ MTX (n=250)
Rituximab or placebo infusion (with GC pre-medicati on)
Retreatment (from 24 weeks in pts with DAS28>2.6)
Primary efficacy timepoint*
Rituximab (2 x 1000mg)+ MTX (n=250)
+ 48weeks
Wk 24
Wk 16
Wk 20
Wk 8
Wk 4
Day15
Day1
Wk 12
*
♦
Wk 52
♦♦♦♦
MTX initiated at 7.5mg p.o./wk and escalated to 20mg p.o./wk by Week 8 as tolerated 43
IMAGE: Endpoints at 52 weeks
• Primary endpoint
– Change in Genant modified Total Sharp Score (mTSS) from baseline to wk 52
• Secondary endpoints
– Radiographic
• Change in erosion and joint space scores
• Proportion of patients with change in mTSS ≤0
– Clinical Outcome
• ACR and EULAR responses
• Major Clinical Response (ACR70 maintained for ≥6 months)
• Change in DAS28-ESR
• Safety throughout the 52-week period
44
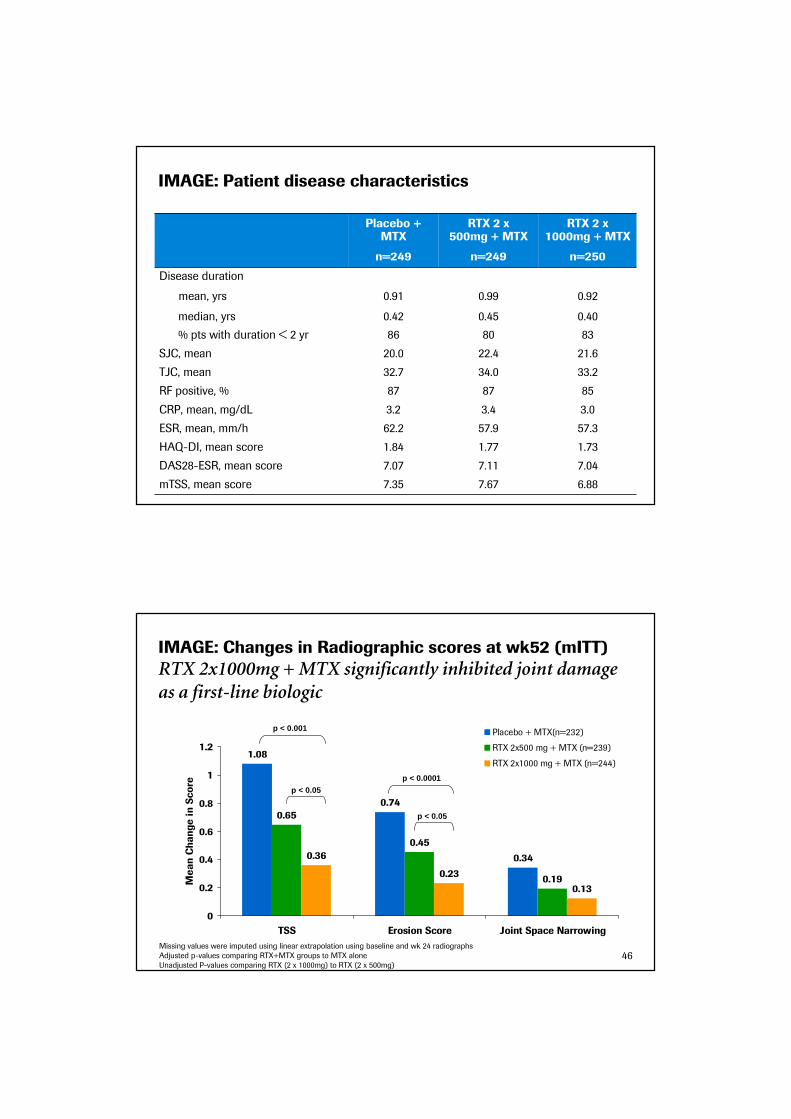
IMAGE: Patient disease characteristics
Placebo + MTX
n=249
RTX 2 x 500mg + MTX
n=249
RTX 2 x 1000mg + MTX
n=250
Disease duration
mean, yrs
median, yrs
0.91
0.42
0.99
0.45
0.92
0.40
% pts with duration < 2 yr 86 80 83
SJC, mean 20.0 22.4 21.6
TJC, mean 32.7 34.0 33.2
RF positive, % 87 87 85
CRP, mean, mg/dL 3.2 3.4 3.0
ESR, mean, mm/h 62.2 57.9 57.3
HAQ-DI, mean score 1.84 1.77 1.73
DAS28-ESR, mean score 7.07 7.11 7.04
mTSS, mean score 7.35 7.67 6.88
IMAGE: Changes in Radiographic scores at wk52 (mITT)
RTX 2x1000mg + MTX significantly inhibited joint damage as a first-line biologic
1.08
0.74
0.34
0.65
0.45
0.19
0.36
0.23
0.13
0
0.2
0.4
0.6
0.8
1
1.2
TSS Erosion Score Joint Space Narrowing
Mean Change in Score
Placebo + MTX(n=232)
RTX 2x500 mg + MTX (n=239)
RTX 2x1000 mg + MTX (n=244)
Missing values were imputed using linear extrapolation using baseline and wk 24 radiographs
Adjusted p-values comparing RTX+MTX groups to MTX alone
Unadjusted P-values comparing RTX (2 x 1000mg) to RTX (2 x 500mg)
p < 0.001
p < 0.05
p < 0.0001
p < 0.05
46

IMAGE: Change in radiographic scores (6-month periods)
Over 90% inhibition of bone damage after second treatment
Missing values were imputed using linear extrapolation using baseline and wk 24 radiographs
Adjusted p-values comparing RTX+MTX groups to MTX alone
Placebo+MTX (n=226) MTX + RTX 2x500 mg (n=238) MTX + RTX 2x1000 mg (n=242)
Baseline to 24 weeks 24 weeks to 52 weeks
0
0.2
0.4
0.6
0.8
TSS ES JSN TSS ES JSN
Mean Change in Score
p < 0.05
0.70
0.49
0.21
0.58
0.40
0.18
0.33
0.22
0.11
0.38
0.24
0.14
0.060.05
0.010.03
0.02 0.02
p < 0.01
p < 0.05p < 0.05
p < 0.01
p < 0.01p < 0.01
p < 0.001
47
IMAGE: ACR & Major Clinical Response (MCR) at week 52
All analyses between RTX and placebo statistically significant
64%
42%
25%
9% 8%
77%
59%
42%
17% 17%
80%
65%
47%
16% 18%
0%
10%
20%
30%
40%
50%
60%
70%
80%
90%
ACR20 ACR50 ACR70 ACR90 MCR
Placebo + MTX
RTX 500 mg + MTX
RTX 1000 mg + MTX
Patients (%)
Major Clinical Response (MCR) = ACR70 response maintained for at least 6 consecutive monthsP-values from CMH test, comparing the placebo group with each rituximab groupAdjusted p-values comparing RTX+MTX groups to MTX alonePatients with insufficient data to calculate an ACR response are classed as non-responders
p < 0.0001
p < 0.0001
p < 0.0001
p < 0.05 p < 0.0006
48

IMAGE: Significantly more patients on Rituximab reached DAS remission and low disease at week 52
13
20
25
40
31
43
0
5
10
15
20
25
30
35
40
45
50
DAS28 <2.6 DAS28 <3.2
Placebo + MTX (n=247)
RTX 2x500 mg + MTX (n=248)
RTX 2x1000 mg + MTX (n=249)
Patients (%)
remission low disease activity
49
p < 0.0001
p < 0.0001 p < 0.0001
p < 0.001
Infection rate was equal across treatment arms
Placebo + MTX
n=250
RTX 2 x 500mg + MTX
n=249
RTX 2 x 1000mg + MTX
n=249
Total pt-years 229.75 238.77 241.06
All infections
No. infections 264 248 305
Infections per 100 pt-year 115 104 127
95% CI 102, 130 92, 118 113, 142
Serious infections (SIEs)
No. SIEs 14 11 9
SIEs per 100 pt-year 6.09 4.61 3.73
95% CI 3.61, 10.29 2.55, 8.32 1.94, 7.18
Infections as per MedDRA basket terms, plus investigator classificationAll events counted, including duplicates in the same individual
*Serious and/or those requiring i.v. anti-infectives 50

IMAGE: Conclusions
• In patients with early, active RA, RTX (2 x 1000mg) + MTX significantly inhibited
joint damage compared with MTX alone
– Inhibition of joint damage evident at 6 months
• RTX (2 x 500mg) improved clinical outcomes but did not significantly slow the rate
of joint damage over the full 52-week period
• Safety outcomes are consistent with previous data, with no new signals identified
51
Long-term Safety of Rituximab: Follow-up of the RA Clinical Trials and Re-treatment
Population
RF van Vollenhoven,1 P Emery,2 CO Bingham III,3 E Keystone,4 R Fleischmann,5 DE Furst,6 KM Macey,7 MT
Sweetser,8 A Kelman,9 R Rao7
European League Against Rheumatism OP0026Thu 11 Jun, 10.15-11.45, Auditorium 1
52

Duration of rituximab exposure (as of April 2008)
Duration of observation Patients (n=2579)
>1 year 2417
>2 years 1198
>3 years 743
>4 years 564
>5 years 109
Total exposure (patient-years) 5964
C2(n=1926)
C3(n=1228)
C4(n=794)
C5(n=282)
C1(n=2579)
Treatment course numbern=no. of treated patients
van Vollenhoven et al. EULAR 2009 [Abstract 2363]53
Rates of serious infection remained constant with repeated courses of rituximab
0
2
4
6
8
10
12
14
16
18
C1 C2 C3 C4 C5(n=2594) (n=1877) (n=900) (n=409) (n=119)
Serious infections
Serious infections/100 pt-years
54van Vollenhoven et al. EULAR 2009 [Abstract 2363]

Long-term Safety: Serious Infections per 100 Patient-years
1. Dixon et al, Arthritis Rheum 2006;54:2368–76; 2. Listing et al, Arthritis Rheum 2005;52:3403–12;
3. Moreland et al, J Rheum 2006 33:854–61; 4. Schiff Ann Rheum Dis 2006 65(7): 889–94;
5. Westhovens et al, J Rheum 2009;36(4):1–7.
Etanercept-treated (n=714)3
Adalimumab-treated (n=10,050)4
Abatacept-treated (n=235)5
Biologic-treated (n=928)(German Biologics Register)2
Biologic-treated (n=7664)
(BSR Biologics Register)1
Rituximab–treated (n=2579)
DMARD-treated (n=1354)
(BSR Biologics Register)1
DMARD-treated (n=601)(German Biologics Register)2
Incidence of serious infections/100 patient-years
1 2 3 4 5 6 7 8
4.26
Re
gis
trie
sE
xte
nsi
on
tria
ls
55
Patients, n (%)
Biologic treatment following rituximab
0
50
100
150
200
250
TNF inhibitors abatacept anakinra
178 (82)
31 (14)9 (4)
Of patients who withdrew into post-clinical trial safety follow-up
216 were subsequently treated with another biologic therapy
Genovese M et al. EULAR 2009 [Abstract 2333]56
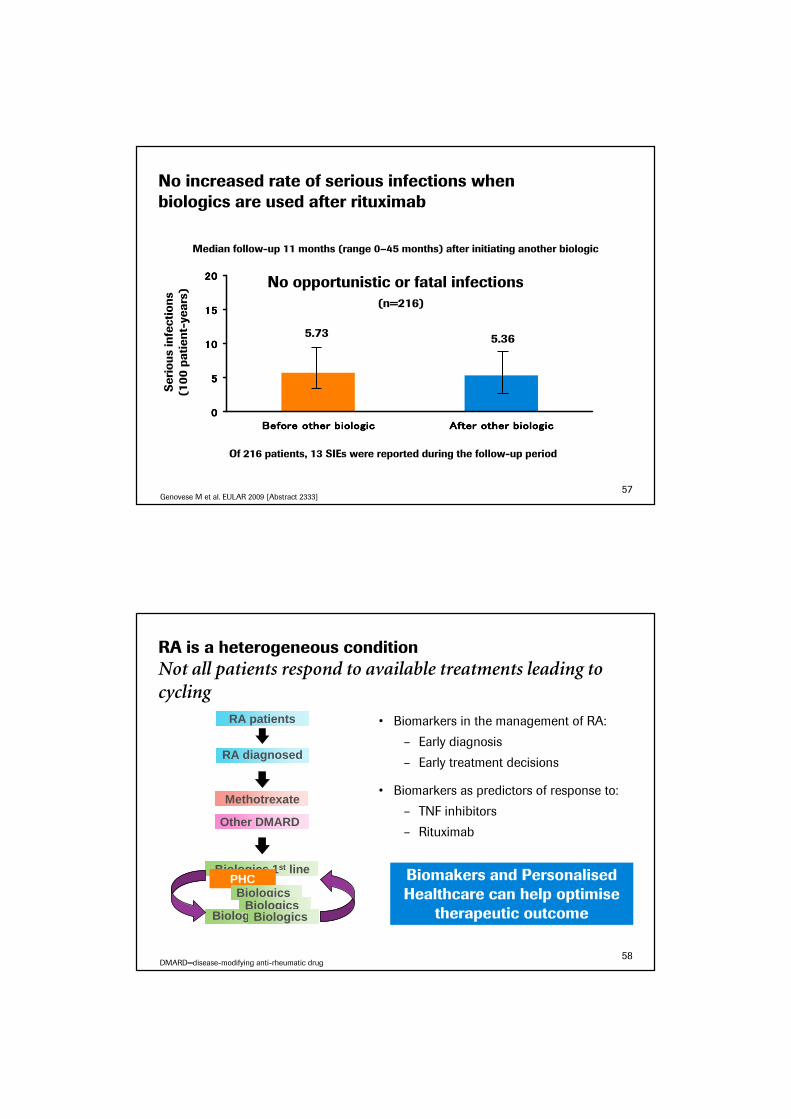
No increased rate of serious infections when biologics are used after rituximab
0000
5555
10101010
15151515
20202020
Before other biologicBefore other biologicBefore other biologicBefore other biologic After other biologicAfter other biologicAfter other biologicAfter other biologic
(n=216)
Serious infections
(100 patient-years)
5.73 5.36
No opportunistic or fatal infections
Of 216 patients, 13 SIEs were reported during the follow-up period
Median follow-up 11 months (range 0–45 months) after initiating another biologic
Genovese M et al. EULAR 2009 [Abstract 2333]57
RA is a heterogeneous condition
Not all patients respond to available treatments leading to cycling
RA patients
Biologics 1 st line
Biologics 2 nd line
Methotrexate
RA diagnosed
Other DMARD
PHCBiologics
BiologicsBiologics
DMARD=disease-modifying anti-rheumatic drug
• Biomarkers in the management of RA:
– Early diagnosis
– Early treatment decisions
• Biomarkers as predictors of response to:
– TNF inhibitors
– Rituximab
Biomakers and Personalised Healthcare can help optimise
therapeutic outcome
58
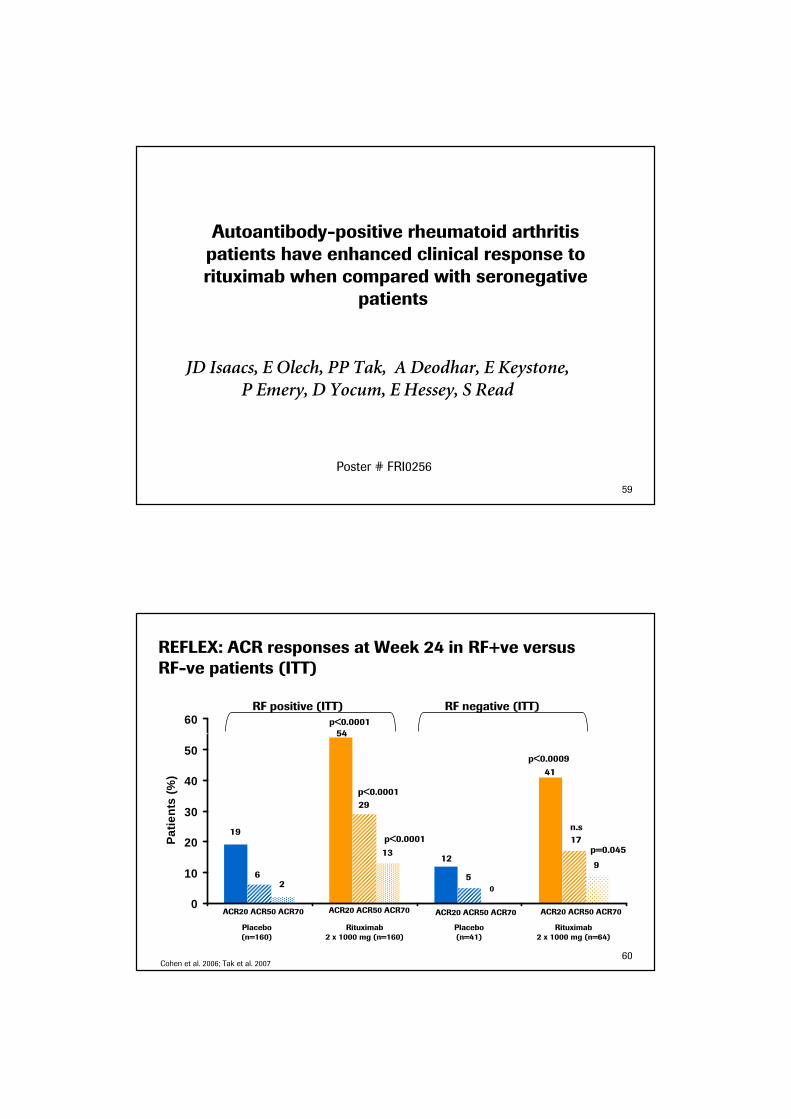
Autoantibody-positive rheumatoid arthritis patients have enhanced clinical response to rituximab when compared with seronegative
patients
JD Isaacs, E Olech, PP Tak, A Deodhar, E Keystone, P Emery, D Yocum, E Hessey, S Read
Poster # FRI0256
59
REFLEX: ACR responses at Week 24 in RF+ve versus RF-ve patients (ITT)
0
10
20
30
40
50
60
Placebo (n=160) Rituximab 1000mg x 2(n=234)
Placebo (n=41) Rituximab 1000mg x 2 (n=64)
Pat
ient
s (%
)
p<0.0001
p<0.0001
19
62
p<0.0001
54
29
1312
5
41
p<0.0009
17
n.s
9
p=0.045
0
Placebo(n=160)
Rituximab2 x 1000 mg (n=160)
Rituximab2 x 1000 mg (n=64)
Placebo(n=41)
ACR20 ACR50 ACR70 ACR20 ACR50 ACR70 ACR20 ACR50 ACR70 ACR20 ACR50 ACR70
Cohen et al. 2006; Tak et al. 2007
RF positive (ITT) RF negative (ITT)
60

ACR20
ACR50
ACR70
a Placebo-adjusted ACR responses
RF positive RF negative
Rituximab 2 x 1000 mg (n=234)
Rituximab 2 x 1000 mg (n=64)
Patients (%)
35
29
23
12119
0
20
40
REFLEX studya DANCER study
Rituximab 2 x 1000 mg(n=122)
Rituximab 2 x 1000 mg(n=63)
Patients (%)
RF positive RF negative
-4
21
1615
6
24
-10
-5
0
5
10
15
20
25
30
Cohen et al. Arthritis Rheum. 2006;54:2793–2806.; Emery et al. 200654:1390–1400; Tak et al. EULAR 2007
Placebo-adjusted ACR responses with rituximab at week 24 are greater in RF positive patients
61
REFLEX: Superior radiographic outcomes with rituximab in RF and/or anti-CCP seropositive patients at week 56
2
1.1
0.89
1.19
0.75
0.44
0.98
0.540.44
1.040.92
0.12
0
0.5
1
1.5
2
2.5
Total Score ErosionScore
Joint SpaceNarrowing
Total Score ErosionScore
Joint SpaceNarrowing
Mea
n ch
ange
in s
core
Placebo (n=158/14) Rituximab 2 x 1000 mg (n=227/23)
p=0.0085
p=0.0225
p=0.0018
RF and/or anti-CCP positive RF negative and anti-CCP negative
Roche, data on file62
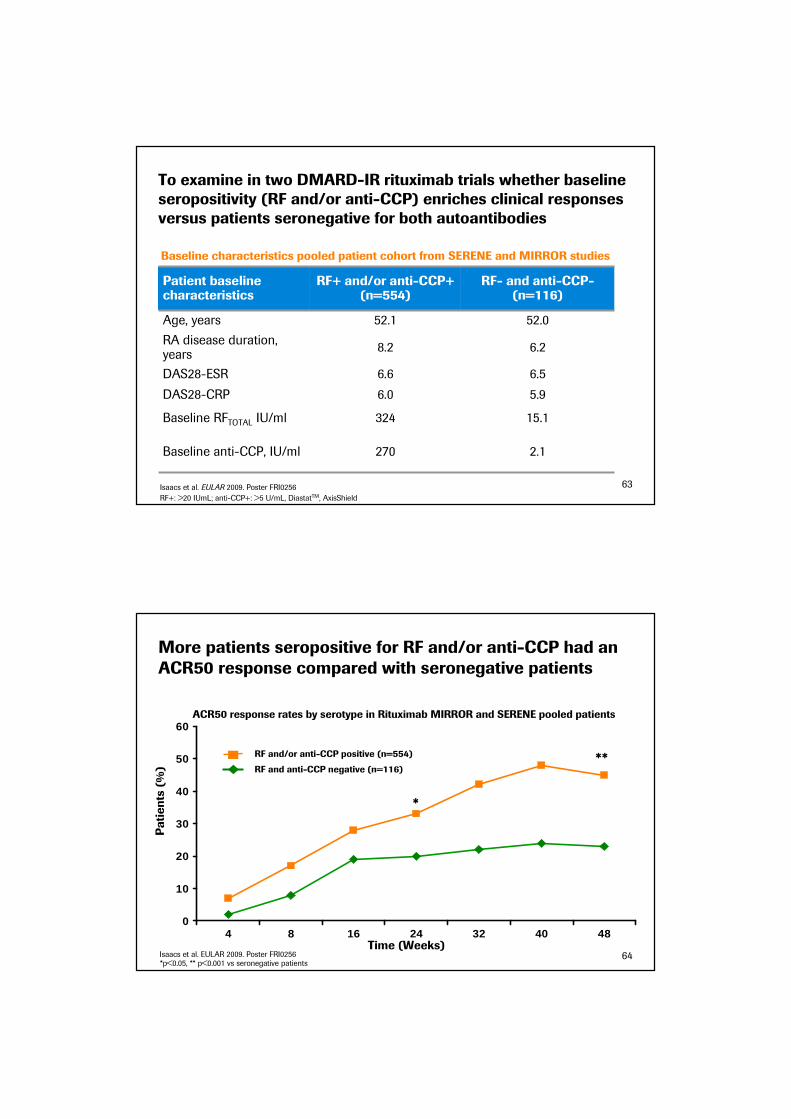
To examine in two DMARD-IR rituximab trials whether baseline seropositivity (RF and/or anti-CCP) enriches clinical responses versus patients seronegative for both autoantibodies
Patient baseline characteristics
RF+ and/or anti-CCP+ (n=554)
RF- and anti-CCP-(n=116)
Age, years 52.1 52.0
RA disease duration, years
8.2 6.2
DAS28-ESR 6.6 6.5
DAS28-CRP 6.0 5.9
Baseline RFTOTAL IU/ml 324 15.1
Baseline anti-CCP, IU/ml 270 2.1
RF+: >20 IUmL; anti-CCP+: >5 U/mL, DiastatTM, AxisShield
Isaacs et al. EULAR 2009. Poster FRI0256 63
Baseline characteristics pooled patient cohort from SERENE and MIRROR studies
More patients seropositive for RF and/or anti-CCP had an ACR50 response compared with seronegative patients
0
10
20
30
40
50
60
4 8 16 24 32 40 48
*
ACR50 response rates by serotype in Rituximab MIRROR and SERENE pooled patients
Time (Weeks)
Patients (%)
**
*p<0.05, ** p<0.001 vs seronegative patients
RF and/or anti-CCP positive (n=554)
RF and anti-CCP negative (n=116)
Isaacs et al. EULAR 2009. Poster FRI0256 64
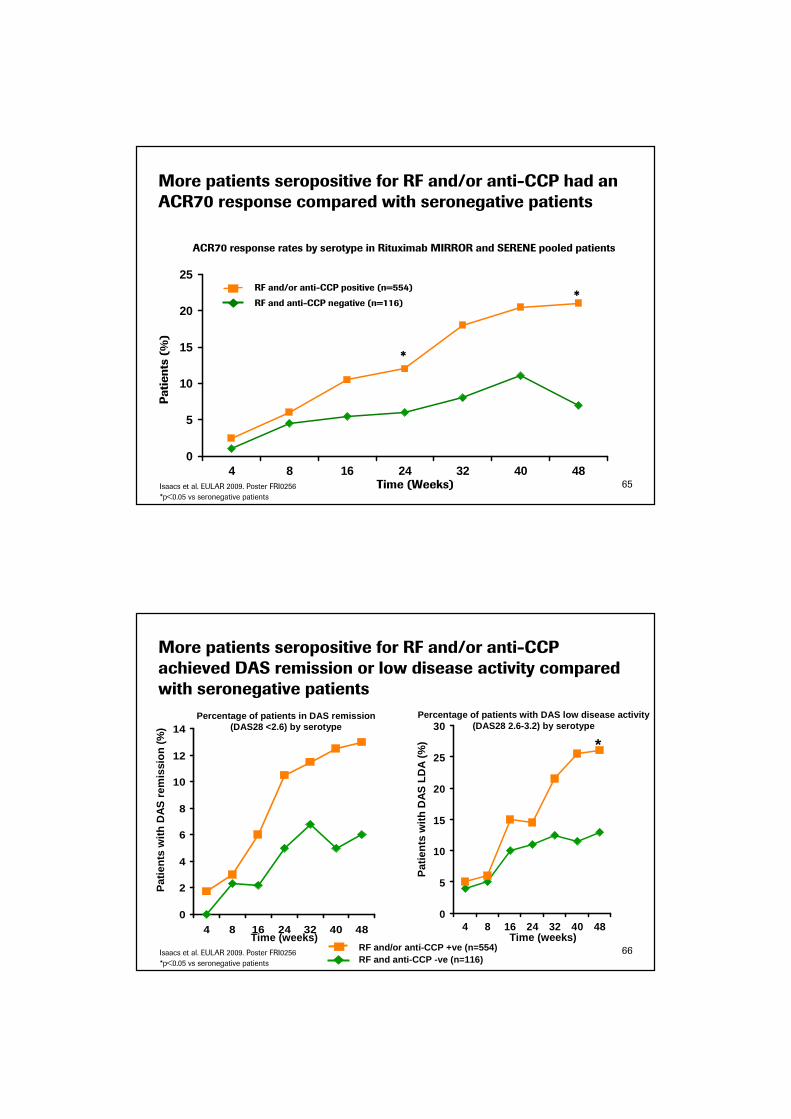
More patients seropositive for RF and/or anti-CCP had an ACR70 response compared with seronegative patients
0
5
10
15
20
25
4 8 16 24 32 40 48Time (Weeks)
Patients (%)
*
*
65
ACR70 response rates by serotype in Rituximab MIRROR and SERENE pooled patients
*p<0.05 vs seronegative patients
Isaacs et al. EULAR 2009. Poster FRI0256
RF and/or anti-CCP positive (n=554)
RF and anti-CCP negative (n=116)
More patients seropositive for RF and/or anti-CCP achieved DAS remission or low disease activity compared with seronegative patients
0
2
4
6
8
10
12
14
4 8 16 24 32 40 48
Percentage of patients in DAS remission (DAS28 <2.6) by serotype
Time (weeks)
Pat
ient
s w
ith D
AS
rem
issi
on (
%)
0
5
10
15
20
25
30
4 8 16 24 32 40 48
Percentage of patients with DAS low disease activit y (DAS28 2.6-3.2) by serotype
Time (weeks)
Pat
ient
s w
ith D
AS
LD
A (
%) *
RF and anti-CCP -ve (n=116)RF and/or anti-CCP +ve (n=554) 66
*p<0.05 vs seronegative patients
Isaacs et al. EULAR 2009. Poster FRI0256
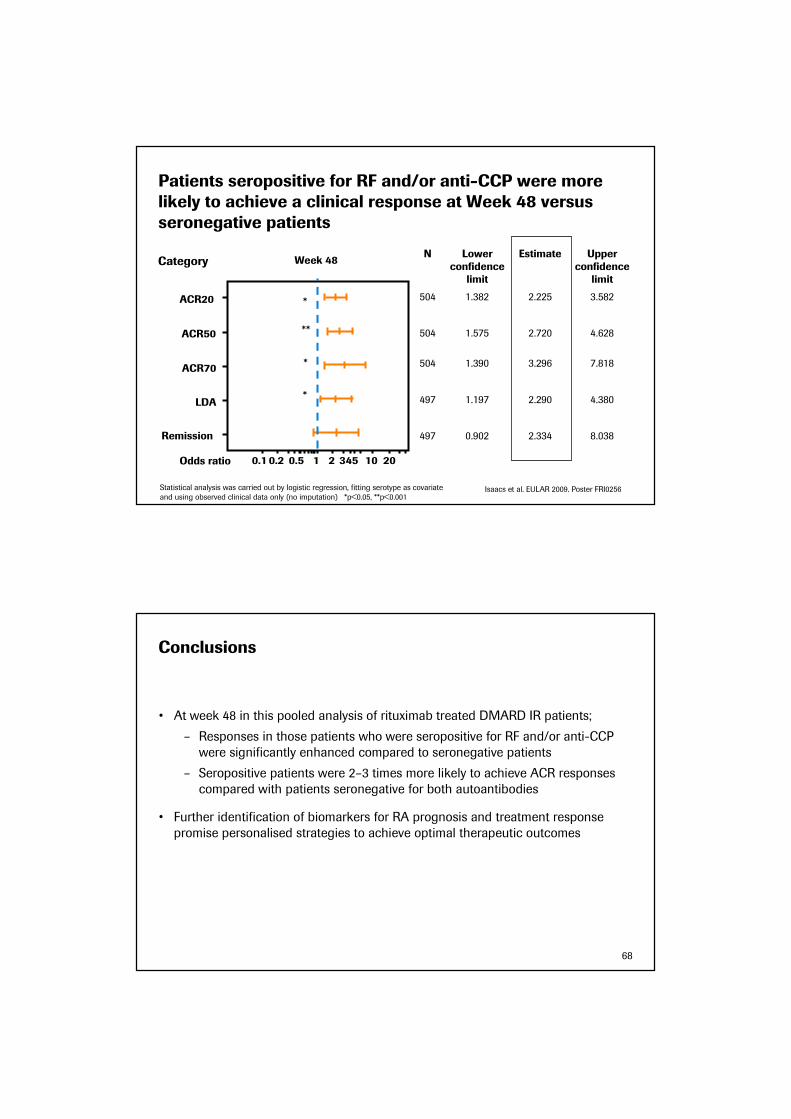
Patients seropositive for RF and/or anti-CCP were more likely to achieve a clinical response at Week 48 versus seronegative patients
N Lower confidence
limit
Estimate Upper confidence
limit
504 1.382 2.225 3.582
504 1.575 2.720 4.628
504 1.390 3.296 7.818
497 1.197 2.290 4.380
497 0.902 2.334 8.038
Category
Statistical analysis was carried out by logistic regression, fitting serotype as covariate
and using observed clinical data only (no imputation) *p<0.05, **p<0.001
Week 48
Remission
LDA
ACR70
ACR50
ACR20
0.1 0.2 0.5 1 2 345 10 20Odds ratio
**
*
*
*
Isaacs et al. EULAR 2009. Poster FRI0256
Conclusions
• At week 48 in this pooled analysis of rituximab treated DMARD IR patients;
– Responses in those patients who were seropositive for RF and/or anti-CCP
were significantly enhanced compared to seronegative patients
– Seropositive patients were 2–3 times more likely to achieve ACR responses
compared with patients seronegative for both autoantibodies
• Further identification of biomarkers for RA prognosis and treatment response
promise personalised strategies to achieve optimal therapeutic outcomes
68
69
Questions & Answers
70
ongoingOpen-label long-term
extension studies for safety
and efficacy
1,902TCZ 8mg/kg + standard anti-rheumatic therapy
pts from AMBITION,
RADIATE, TOWARD
GROWTH96LTE
ongoingOpen-label long-term extension studies for safety
and efficacy
537TCZ 8mg/kg + standard anti-rheumatic therapy
pts from OPTIONGROWTH95LTE
Initiated Q2 ‘08108TCZ 8dosed by body weight ranges (8 or 12mg/kg x6)Placebo
Systemic juvenile
idiopathic arthritis (sJIA)
TENDERPh III
met 1o
endpointACR 20 (24 wks)Sharp Score (52, 104 wks)Physical function (104 wks)
1,196TCZ 4mg/kg + MTXTCZ 8mg/kg + MTXMTX
MTX IRLITHE
Filed Q4 ‘07ACR 20 (24 wks)623TCZ 4mg/kg + MTXTCZ 8mg/kg + MTXMTX
MTX IROPTION
Filed Q4 ‘07ACR 20 (24 wks)673TCZ 8mg/kg (esc. dose)MTX
MTX naiveAMBITION
TCZ 4mg/kg + MTXTCZ 8mg/kg + MTXMTX
TCZ 8mg/kg + DMARDsDMARDs
Treatment
Filed Q4 ‘07ACR 20 (24 wks)1,200DMARD IRTOWARD
anti-TNF IR
Patient population
ACR 20 r(24 wks)
Endpoints
Filed Q4 ‘07499RADIATE
Trial StatusSize
IL-6 Receptor Inhibition: Actemra (tocilizumab)
LTE = long term extensions studies

71
Met primary endpoint Q4 ‘08EU: filing planned 2009
Inhibition of structural joint damage (52wks)
750MTXMTX+RTX 2x0.5gMTX+RTX 2x1g
MTX naïve(X-ray study)
IMAGE
marketed US, EUACR 20 (24 wks)Radiographic Progression
521MTXMTX +RTX 2 x 1g
anti-TNF IRREFLEX
Data expected 2010MRI changes at 6 months
180MTXMTX +RTX 2 x 0.5gMTX +RTX 2 x 1g
DMARD-IRSCORE
MTX +RTX 2 x 0.5g retx 2 x 0.5gMTX +RTX 2 x 0.5g retx 2 x 1gMTX +RTX 2 x 1g retx 2 x 1g
MTX MTX +RTX 2 x 0.5gMTX +RTX 2 x 1g
Treatment
Met primary endpoint Q1 ’08US: submitted sBLA Q3 ’08EU: filing planned 2009
ACR 20 (24 wks)509DMARD-IRSERENE
DMARD-IRDose
escalation
Patient population
ACR 20 (48 wks)Effect of further courses and dose escalation
Endpoints
Met primary endpoint Q1 ’08
US: submitted sBLA Q3 ’08EU: filing planned 2009
375MIRROR
Trial StatusSize
Anti-CD20: MabThera/ Rituxan (rituximab) in RA
Roche’s ongoing phase III program
7272
Initiated Q2 ’07Data expected 2010
Inhibition of structural joint damage at 52 and 104 Wks
600MTXMTX + Ocrelizumab
MTX naïveFILMPh III
TrialPatient population
Treatment Size Endpoints Status
STAGEPh III
MTX-IR MTXMTX + Ocrelizumab
1,000 ACR 20 (24&48 wks)Inhibition of structural joint damage
Initiated Q4 ‘06Data expected Q4 ‘09
SCRIPTPh III
anti-TNF IR DMARDDMARD + Ocrelizumab
800 ACR 20 (24 and 48 wks)Inhibition of structural joint damage
Initiated Q2 ’07Data expected 2010
FEATUREPh III
MTX-IR anti-TNF IR
MTXMTX + Ocrelizumab
300 ACR 20 (24 and 48 wks) OngoingData expected 2010
CINEMAPh II
Anti-TNF IR(cycling study)
Ocrelizumabinfliximab
290 Mean change from baseline in DAS28
Initiated Q4 ’08Data expected 2011
Anti-CD20: Ocrelizumab in RA
Global Phase III program in RA by Roche and Genentech
• Fully humanised
• Potential clinical benefits - less immunogenicity, better tolerability, shorter infusion time, single infusion

73
Initiated Q4 ’07Data expected 2011
Renal response at 52 wks
369SOCSOC + Ocrelizumab(2x 400mg, 2x1000mg)
Lupus NephritisBELONGPh III
1st cycle placebo, then ocrelizumab1st cycle IFN b-1a, then ocrelizumabOcrelizumab (600mg) Ocrelizumab (1000mg)
Treatment
Completed enrolment Q2 ‘09Data expected Q4 ‘09
Total number gadolinium-enhancing T1 lesions observed on MRI scans of the brain at wks 12, 16, 20 & 24
200Relapsing Remitting Multiple
Sclerosis
Dose finding studyPh II
Patient population
EndpointsTrial StatusSize
Anti-CD20: Ocrelizumab in other Automimmune
conventional therapy
(cyclophosphamide)
RTX + glucocorticoids
Treatment
Initiated Q4 ’04Non-inferiority efficacy and safety
197ANCA-Associated Vasculitis
RAVEPh II/ III
Patient population
EndpointsTrial StatusSize
Anti-CD20: MabThera/ Rituxan in other Automimmune
74
Xolair Development Program
Patient
Population
Asthma Urticaria
Asthma
Pediatric Asthma
(Children ages
6 to 11)
Asthma
Chronic
Idiopathic
Urticaria
Study
Phase II
AQUA
Liquid Formulation Study
Phase III
Novartis Study
Phase IIIb
EXTRA
Add-on therapy to high-dose ICS and LABA
Phase II
# of Patients N=61 N=570 N=850 N=76
Status • Expect data Q2 2009 • Data presented at the 2008 European
Respiratory Society meeting
• Submitted sBLA Q4 2008
• PDUFA date October 5, 2009
• Completed enrollment Q3 2008
• Expect data Q4 2009
• FPI Q1 2009
In collaboration with NovartissBLA = supplemental Biologics License Applications; PDUFA = Prescription Drug User Fee Act; ICS = Inhaled Corticosteroids; LABA = Long-Acting Beta-Agonists; IND = Investigational New Drug.
75
Inflammation
Molecule Anti-Beta7
Anti-CD4
In collaboration with Tolerx
Anti-IFN alpha Anti-IL13 Anti-OX40L
Patient Population
Ulcerative Colitis
Rheumatoid
Arthritis
Systemic Lupus Erythematosus
Asthma Asthma
Study
Phase I
Global Study
N=70
Phase I
N=65Phase II
Phase II
N=24Phase I
Status • FPI Q3 2008 • FPI Q3 2008
• Expect to
complete
enrollment H2 2009
• Phase Ia/b study completed
enrollment Q3
2008
• Expect FPI mid-
2009
• FPI Q4 2008
• Expect data Q3
2009
• Phase I studies completed
enrollment Q4
2008
• Expect Phase II
‘go/no go’
decision Q2
2009
Other Early-stage Programs
FPI = first-patient-in.
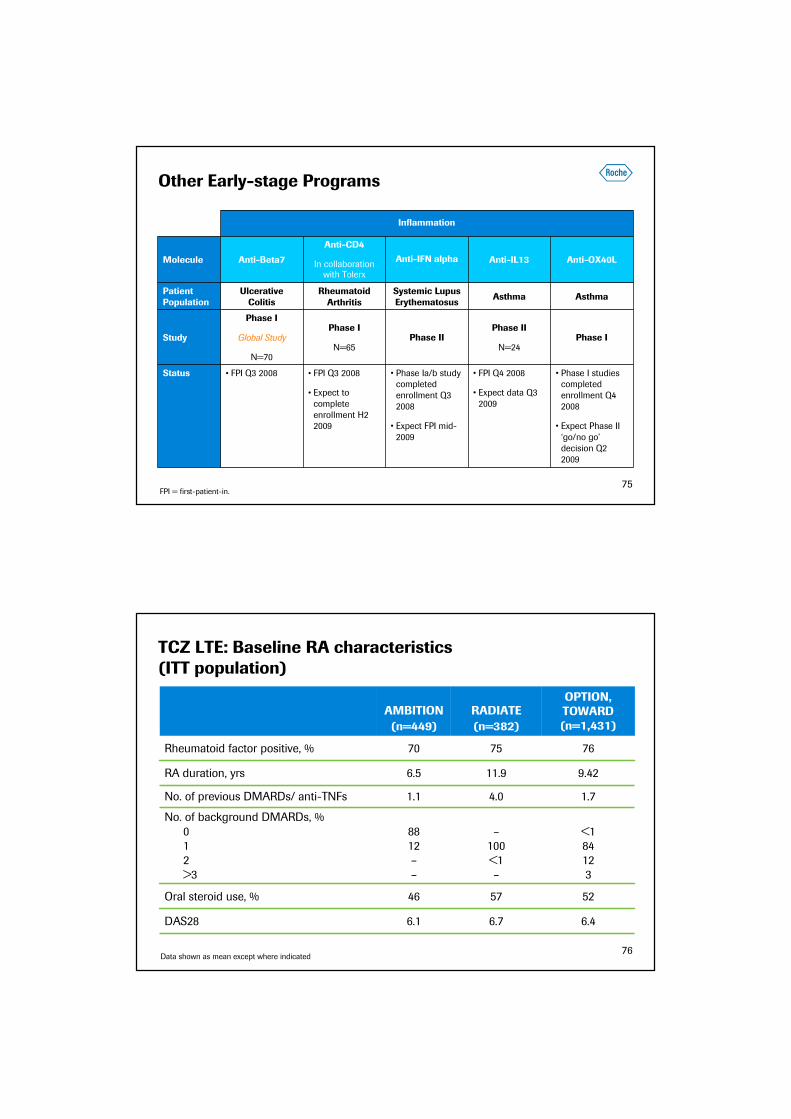
525746Oral steroid use, %
767570Rheumatoid factor positive, %
AMBITION
(n=449)
RADIATE
(n=382)
OPTION, TOWARD (n=1,431)
RA duration, yrs 6.5 11.9 9.42
No. of previous DMARDs/ anti-TNFs 1.1 4.0 1.7
No. of background DMARDs, %
0
1
2
>3
88
12
–
–
–
100
<1
–
<1
84
12
3
DAS28 6.1 6.7 6.4
Data shown as mean except where indicated
TCZ LTE: Baseline RA characteristics (ITT population)
76

77
Tocilizumab (TCZ) exposure during the clinical trial programme (Roche and Chugai) up to 30 June 2008
PY*PY*PY*
Roche + ChugaiChugaiRocheDoseIndication
NNN
10,5525,0882,9281,3107,6243,778All
dosesTotal all indications
604338604338−−−−−−−−8 mg/kgNon-RA
7471,470852896621,181<8 mg/kgRA
9,2013,9252,2396836,9623,242≥8 mg/kg†
9,9484,7502,3249727,6243,778All doses‡Total RA
• Patient-years of exposure are estimated† For Roche, this included a drug-drug interactions study in RA patients (23 patients dosed at 10 mg/kg)‡ Some patients received 4 mg/kg and 8 mg/kg and are accounted for twice in the number for ‘<8’ and ‘≥8’ but only once in the ‘total all
doses’ category
IMAGE: Summary of patient disposition at week 52
Placebo+ MTX
RTX 2 x 500mg+ MTX
RTX 2 x 1000mg + MTX
Randomised 252 (100%) 252 (100%) 251 (100%)
Treated 250 (99.2%) 249 (98.8%) 249 (99.2%)
Completed Wk 52 213 (84.5%) 227 (90.1%) 230 (91.6%)
Withdrew before Wk 52 39 (15.5%) 25 (9.9%) 21 (8.4%)
AE/intercurrent illness 5 (2%) 3 (1.2%) 3 (1.2%)
Death 3 (1%) - -
Insufficient therapeutic response
19 (7.5%) 9 (3.6%) 4 (1.6%)
Failure to return 4 (1.6%) 2 (0.8%) 4 (1.6%)
Protocol violation 2 (0.8%) 2 (0.8%) -
Refused treatment 3 (1.2%) 1 (0.4%) 1 (0.4%)
Withdrew consent 5 (2%) 8 (3.2%) 4 (1.6%)
Admin/other 1 (0.4%) - 5 (2.0%)
78

IMAGE: Patients with no radiographic change (change mTTS<0)
53 5558 59
6467
0
20
40
60
80
TSS Erosion
% Patients
MTX (n=232) RTX 2 x 500 mg (n=239) RTX 2 x 1000 mg (n=244)
Missing values were imputed using linear extrapolation using baseline and Wk 24 radiographs
* p<0.05, **p<0.01, ***p<0.001, ****p≤0.0001 comparing RTX+MTX groups to MTX alone
* **
79
IMAGE: Overview of safety
Placebo + MTX
n=250
RTX 2 x 500mg + MTX
n=249
RTX 2 x 1000mg + MTX
n=249
Any adverse event 203 (81%) 189 (76%) 197 (79%)
Grade 3 29 (12%) 18 (7%) 22 9%)
Grade 4 1 (<1%) 4 (1.6%) -
Any Serious AE 26 (10%) 23 (9%) 24 (10%)
Infusion-related reaction 45 (18%) 43 (17%) 58 (23%)
Serious infusion reactions - - 1 (<1%)
Infectious AE 124 (50%) 127 (51%) 129 (52%)
Serious infection 13 (5%) 6 (2%) 8 (3%)
AEs leading to withdrawal 12 (5%) 4 (2%) 5 (2%)
Deaths 3 (1%) - -
Number of patients (%) 80

81
Adverse events observed with rituximab with repeat treatment courses – stable over time
C1(n=2579)
C2(n=1926)
C3(n=1228)
C4(n=794)
C5(n=282)
Exposure(pt-yrs)
2594 1877 900 409 119
AEsRate/100 pt-yrs 379 313 319 329 330
Serious AEsRate/100 pt-yrs 18.3 17.4 16.6 12.0 13.4
van Vollenhoven et al. EULAR 2009 [Abstract 2363]
82
Rituximab Infusion-related reactions(courses 1 and 2)
10
4
8
3
12
5
8
4
15
5
9
3
0
5
10
15
20
1st infusion 2nd infusion 1st infusion 2nd infusion
Placebo (n=250) Rituximab 2 x 500mg (n=249) Rituximab 2 x 1000mg (n=249)
Second course a
aOne of the IRRs in the rituximab 2 x 1000mg group was reported as serious
Pat
ient
s (%
)
First course