investor day 2016 presentation
TRANSCRIPT

The world's leading premium schools organization
Nord Anglia Education
1

Nord Anglia Education presenters
Andrew Fitzmaurice
Chief Executive Officer
Graeme Halder
Chief Finance Officer
Philippe Lagger
Corporate Development Director
Alison Copus
Chief Admissions and Marketing Officer
George Ghantous
Chief Operating Officer,
Regional Managing Director, Europe
Vanessa Cardonnel
Corporate Finance and IR Director
The world's leading premium schools organization 2
The world's leading premium schools organization 3
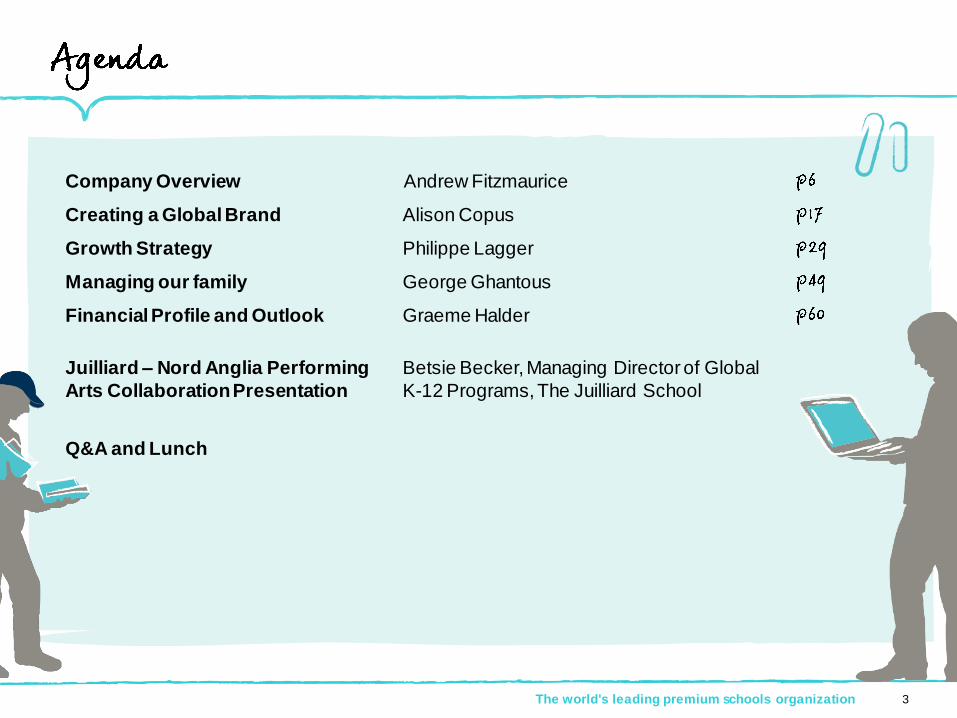
Company Overview Andrew Fitzmaurice
Creating a Global Brand Alison Copus
Growth Strategy Philippe Lagger
Managing our family George Ghantous
Financial Profile and Outlook Graeme Halder
Juilliard – Nord Anglia Performing
Arts Collaboration Presentation
Betsie Becker, Managing Director of Global
K-12 Programs, The Juilliard School
Q&A and Lunch
Neither Nord Anglia Education, Inc. (NYSE: NORD) nor any of its subsidiaries or affiliates
is making any representation or warranty, expressed or implied, as to the accuracy or
completeness of the attached materials.
Please note that the attached materials and our oral explanations of the attached materials
may constitute forward-looking statements within the meaning of applicable U.S. securities
laws and such forward-looking statements are made based on our current
expectations. Forward-looking statements relate to events involving certain risks and
uncertainties, and actual results may differ materially from the views expressed.
A number of potential risks and uncertainties are outlined in our public filings with the
Securities and Exchange Commission. Nord Anglia Education, Inc. does not undertake
any obligation to update any forward-looking statement, except as required under
applicable law. You are cautioned not to place undue reliance on any forward-looking
statements.
Disclaimer
The world's leading premium schools organization 4
5
Our brand

The world's leading premium schools organization
Company
6

Acknowledged
as the
ONE GOAL
schools
organization
The world's leading premium schools organization 7
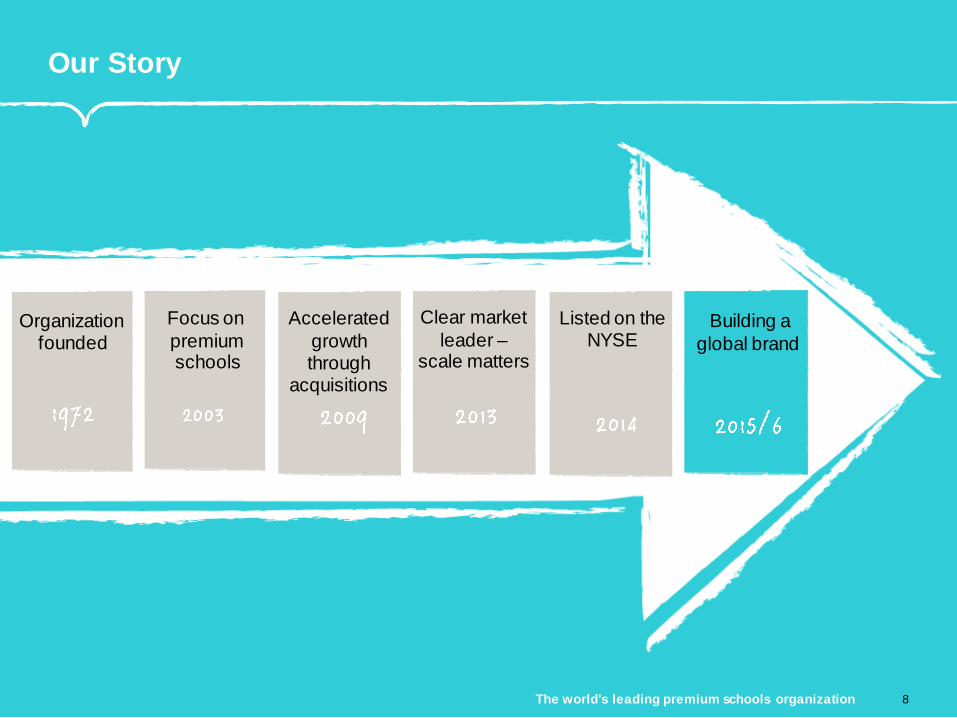
Our Story
Organization founded
Focus on
premium schools
Accelerated
growth through
acquisitions
Listed on the NYSE
Building a
global brand
Clear market
leader –scale matters
The world's leading premium schools organization 8
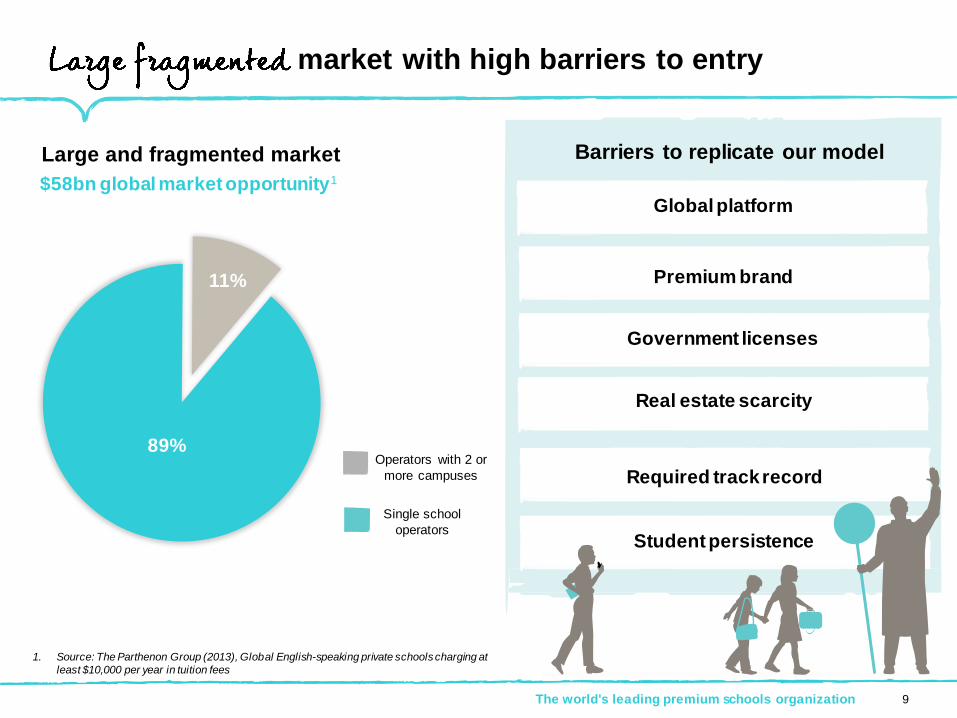
market with high barriers to entry
Large and fragmented market
Single school
operators
Operators with 2 or
more campuses
$58bn global market opportunity1
1. Source: The Parthenon Group (2013), Global English-speaking private schools charging at
least $10,000 per year in tuition fees
Global platform
Barriers to replicate our model
Premium brand
Real estate scarcity
Government licenses
Required track record
Student persistence
11%
89%
The world's leading premium schools organization 9
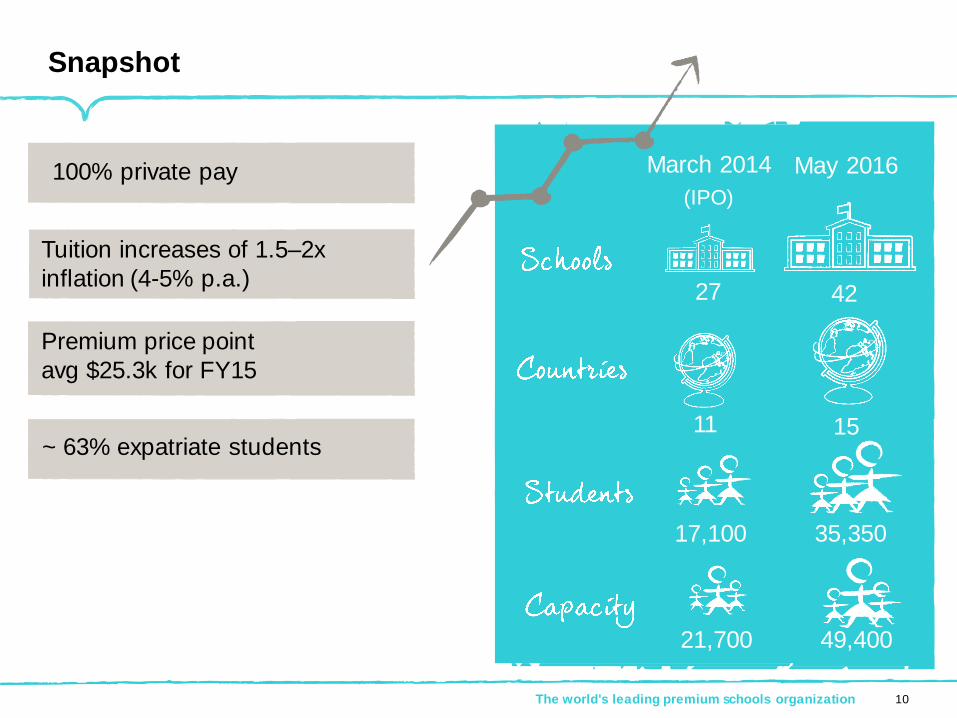
Snapshot
March 2014
(IPO)
11
May 2016
15
4227
17,100
21,700
35,350
49,400
The world's leading premium schools organization 10
100% private pay
Tuition increases of 1.5–2x
inflation (4-5% p.a.)
Premium price point
avg $25.3k for FY15
~ 63% expatriate students
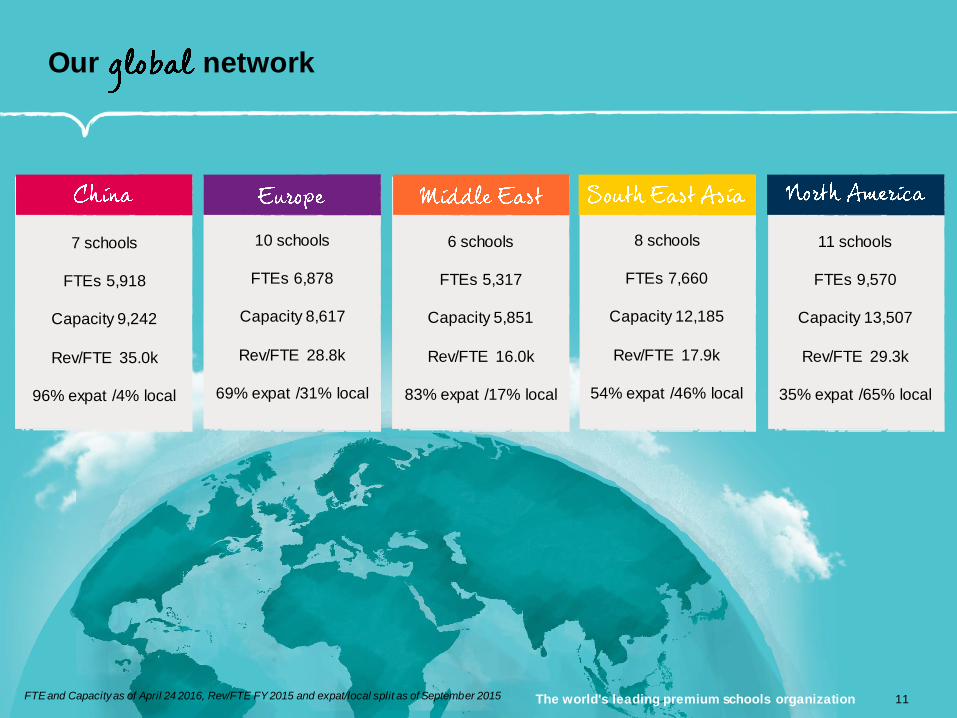
Our network
7 schools
FTEs 5,918
Capacity 9,242
Rev/FTE 35.0k
96% expat /4% local
10 schools
FTEs 6,878
Capacity 8,617
Rev/FTE 28.8k
69% expat /31% local
6 schools
FTEs 5,317
Capacity 5,851
Rev/FTE 16.0k
83% expat /17% local
8 schools
FTEs 7,660
Capacity 12,185
Rev/FTE 17.9k
54% expat /46% local
11 schools
FTEs 9,570
Capacity 13,507
Rev/FTE 29.3k
35% expat /65% local
FTE and Capacity as of April 24 2016, Rev/FTE FY 2015 and expat/local split as of September 2015 The world's leading premium schools organization 11
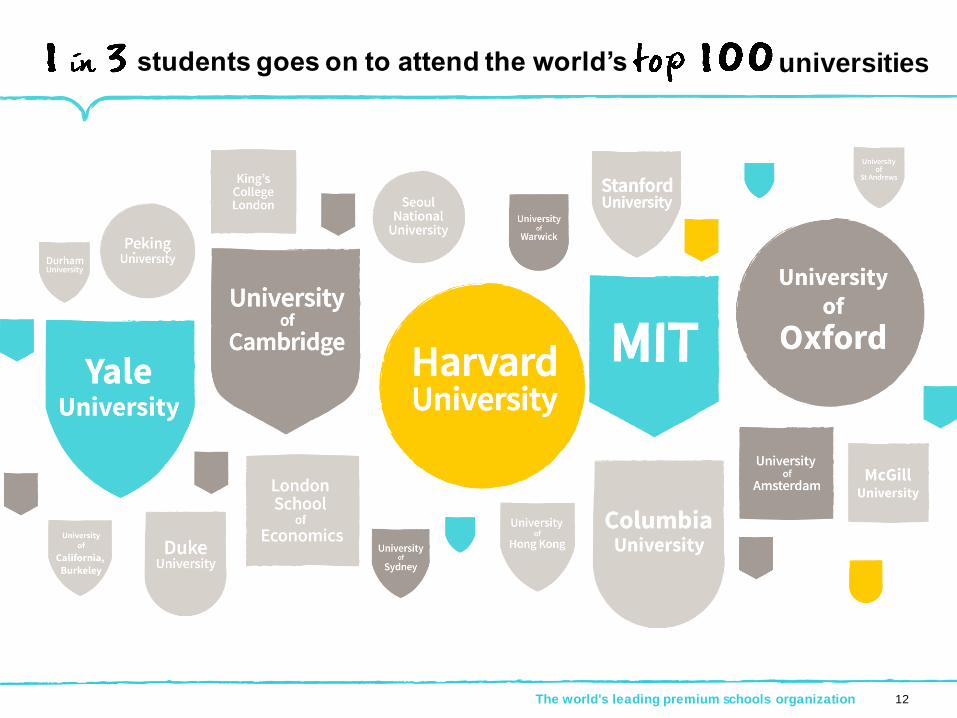
students goes on to attend the world’s universities
The world's leading premium schools organization 12
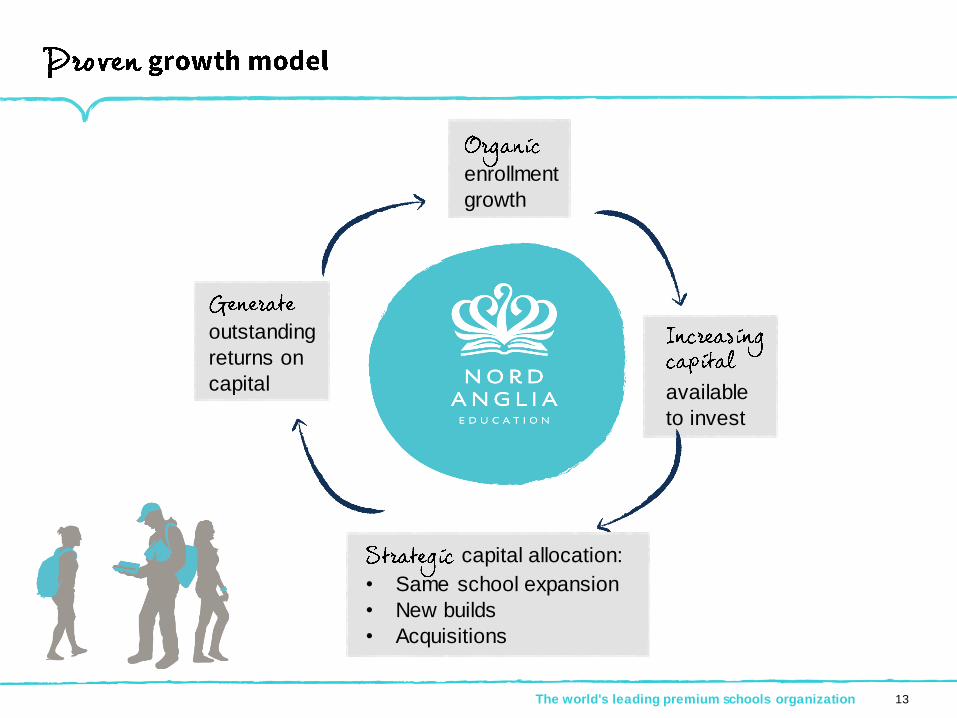
The world's leading premium schools organization 13
capital allocation:
• Same school expansion
• New builds
• Acquisitions
outstanding
returns on
capital available
to invest
enrollment
growth
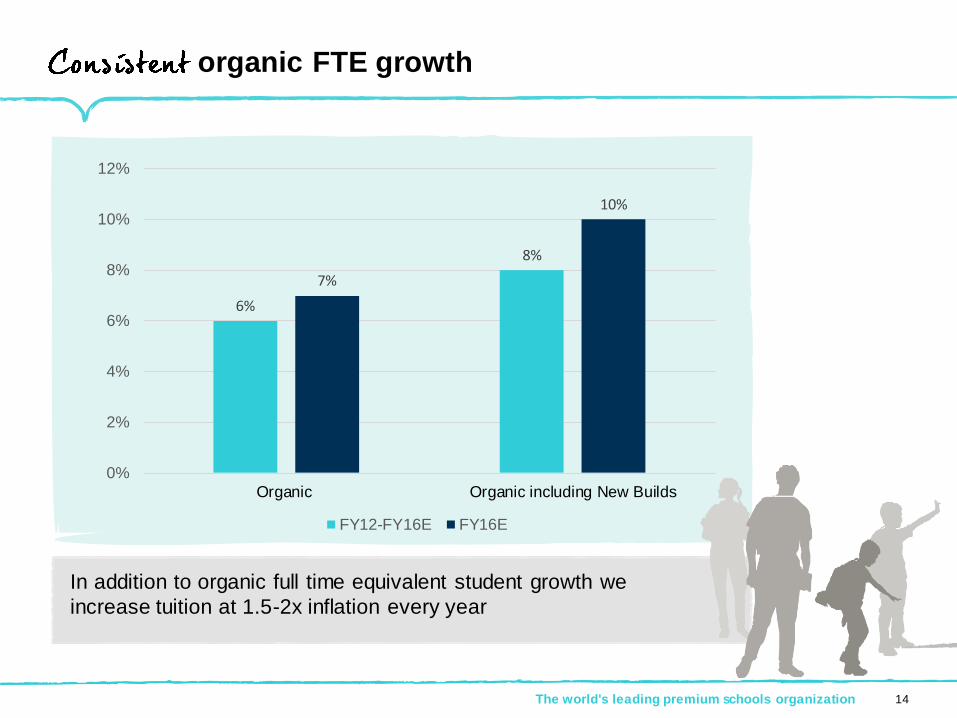
organic FTE growth
The world's leading premium schools organization 14
6%
8%
7%
10%
0%
2%
4%
6%
8%
10%
12%
Organic Organic including New Builds
FY12-FY16E FY16E
In addition to organic full time equivalent student growth we
increase tuition at 1.5-2x inflation every year
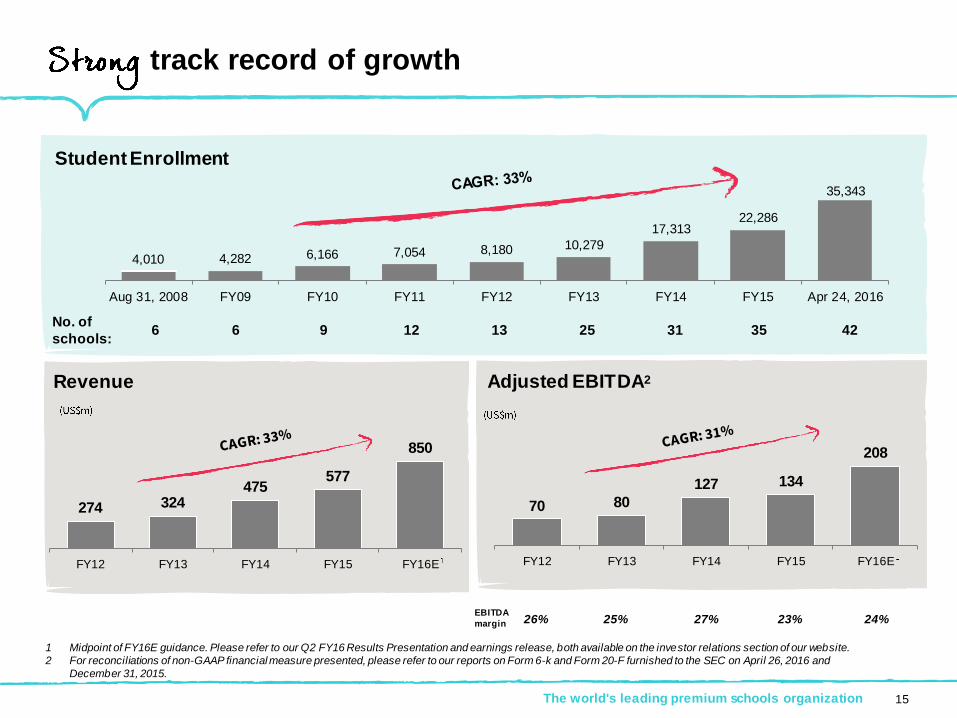
35,343
4,010 4,282 6,166 7,054 8,180 10,279
17,31322,286
Aug 31, 2008 FY09 FY10 FY11 FY12 FY13 FY14 FY15 Apr 24, 2016
No. of
schools:6 6 9 12 13 25 31 35 42
274 324 475
577
850
FY12 FY13 FY14 FY15 FY16E
70 80
127 134
208
FY12 FY13 FY14 FY15 FY16E
EBITDA
margin 26% 25% 27% 23% 24%
1 Midpoint of FY16E guidance. Please refer to our Q2 FY16 Results Presentation and earnings release, both available on the investor relations section of our website.
2 For reconciliations of non-GAAP financial measure presented, please refer to our reports on Form 6-k and Form 20-F furnished to the SEC on April 26, 2016 and
December 31, 2015.
Student Enrollment
track record of growth
Revenue Adjusted EBITDA2
The world's leading premium schools organization 15
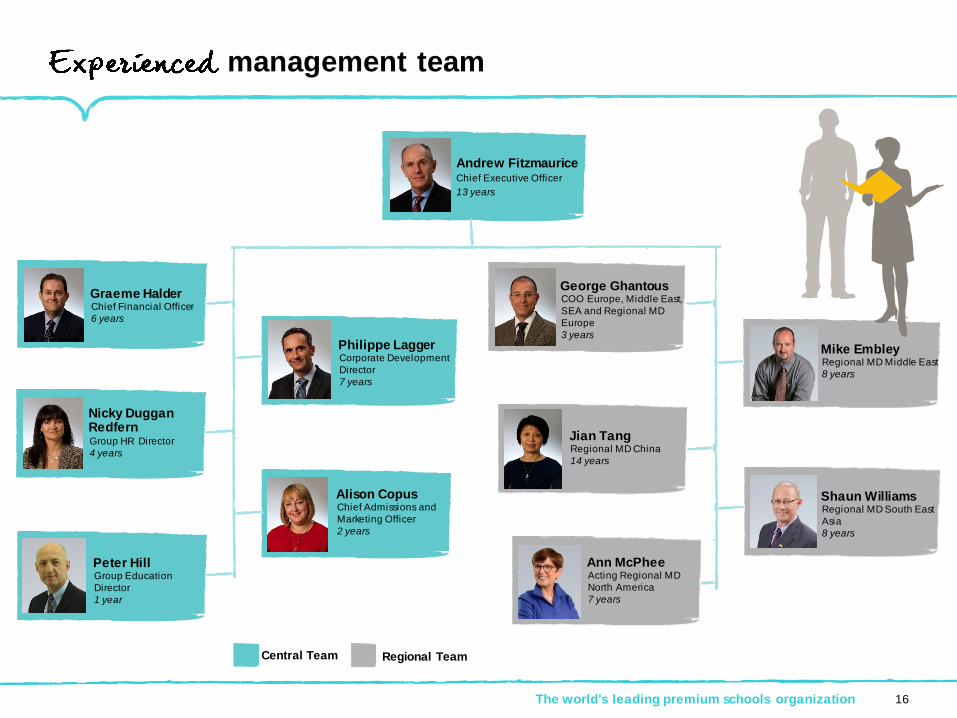
management team
Andrew FitzmauriceChief Executive Officer
13 years
Graeme HalderChief Financial Officer
6 years
Philippe LaggerCorporate Development
Director
7 years
Nicky Duggan RedfernGroup HR Director
4 years
Alison CopusChief Admissions and
Marketing Officer
2 years
George GhantousCOO Europe, Middle East,
SEA and Regional MD
Europe
3 years
Jian TangRegional MD China
14 years
Shaun WilliamsRegional MD South East
Asia
8 years
Mike EmbleyRegional MD Middle East
8 years
Ann McPheeActing Regional MD
North America
7 years
Central Team Regional Team
The world's leading premium schools organization 16
Peter HillGroup Education
Director
1 year

The world's leading premium schools organization
Building a
17
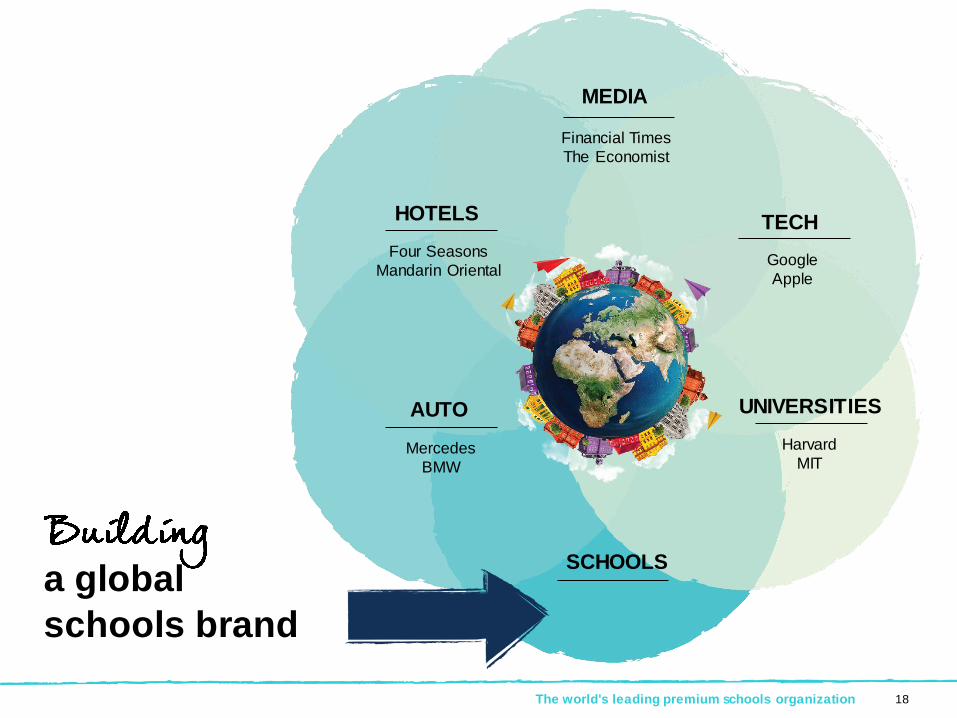
a global
schools brand
AUTO
HOTELS
MEDIA
TECH
UNIVERSITIES
SCHOOLS
Mercedes
BMW
Four Seasons
Mandarin Oriental
Financial Times
The Economist
Apple
Harvard
MIT
The world's leading premium schools organization 18

Leveraging our to set us apart
The world's leading premium schools organization 19
Students Faculty Schools

Global Campus
The world's leading premium schools organization 20

The world's leading premium schools organization
Global Campus: Unique global experiences
We believe learning should not be
confined to the classroom
Expedition Programs
Tanzania Les Martinets
Summer Programs Summer Performing Arts with
Juilliard Nord Anglia Summer Leadership
Academy at Balliol College, Oxford
Global Experiences
Cambridge Science Festival Global Orchestra Global Games
21
Citizenship expedition film -
22
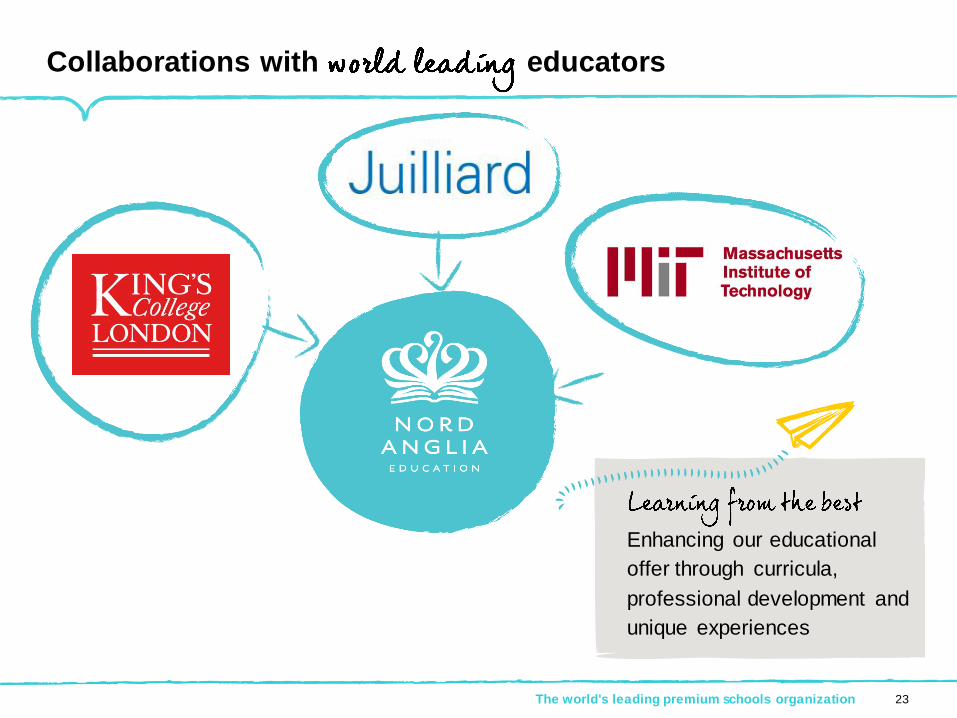
Collaborations with educators
The world's leading premium schools organization 23
Enhancing our educational
offer through curricula,
professional development and
unique experiences

24
Our collaboration film
25The world's leading premium schools organization
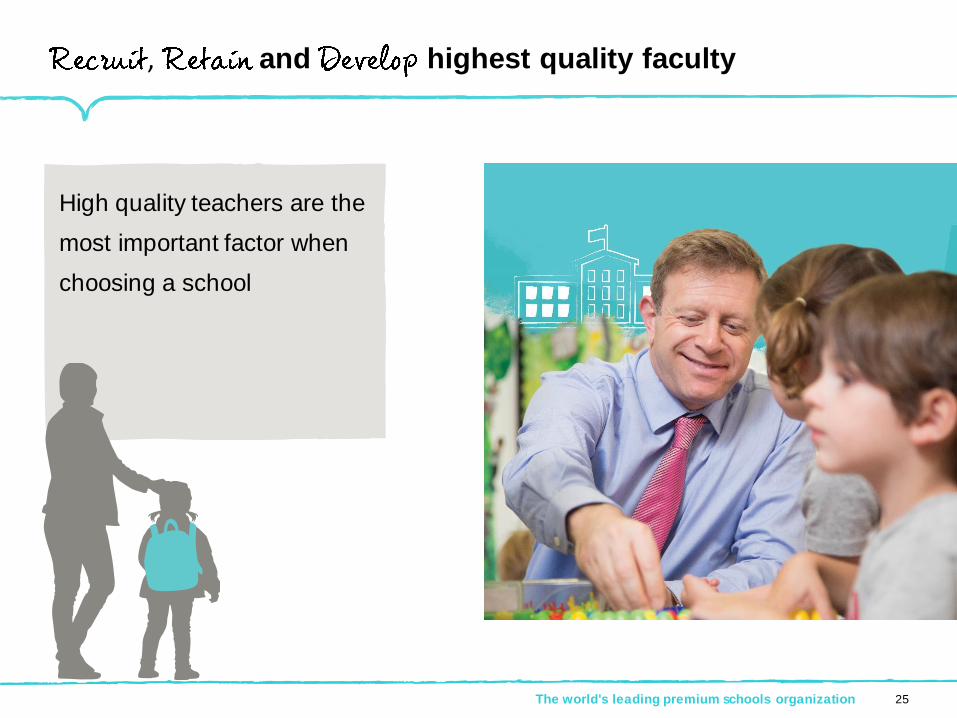
High quality teachers are the
most important factor when
choosing a school
, and highest quality faculty

The world's leading premium schools organization 26
Making our schools
FIRSTchoice for families
27
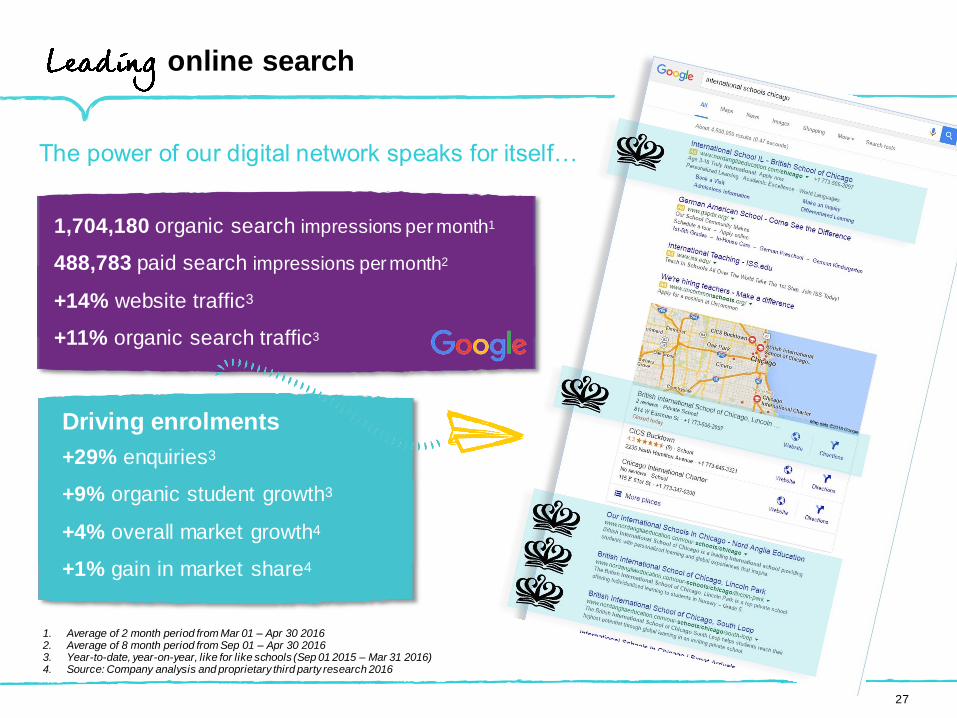
+29% enquiries3
+9% organic student growth3
+4% overall market growth4
+1% gain in market share4
online search
The power of our digital network speaks for itself…
1,704,180 organic search impressions per month1
488,783 paid search impressions per month2
+14% website traffic3
+11% organic search traffic3
1. Average of 2 month period from Mar 01 – Apr 30 20162. Average of 8 month period from Sep 01 – Apr 30 20163. Year-to-date, year-on-year, like for like schools (Sep 01 2015 – Mar 31 2016) 4. Source: Company analysis and proprietary third party research 2016
Driving enrolments
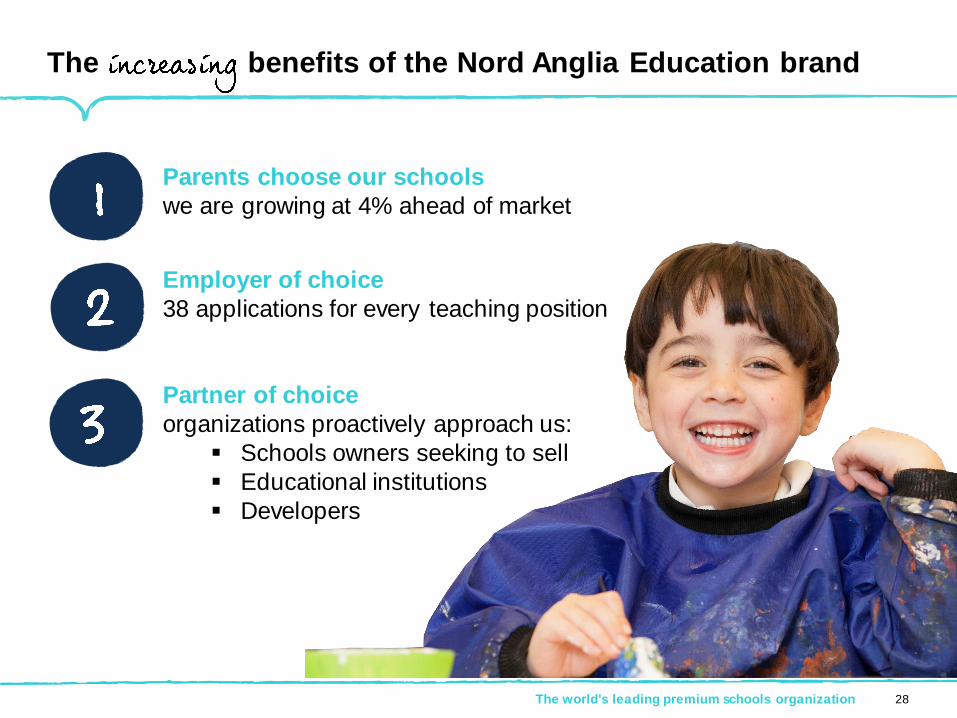
The benefits of the Nord Anglia Education brand
The world's leading premium schools organization 28
Parents choose our schools
we are growing at 4% ahead of market
Employer of choice
38 applications for every teaching position
Partner of choice
organizations proactively approach us:
Schools owners seeking to sell
Educational institutions
Developers
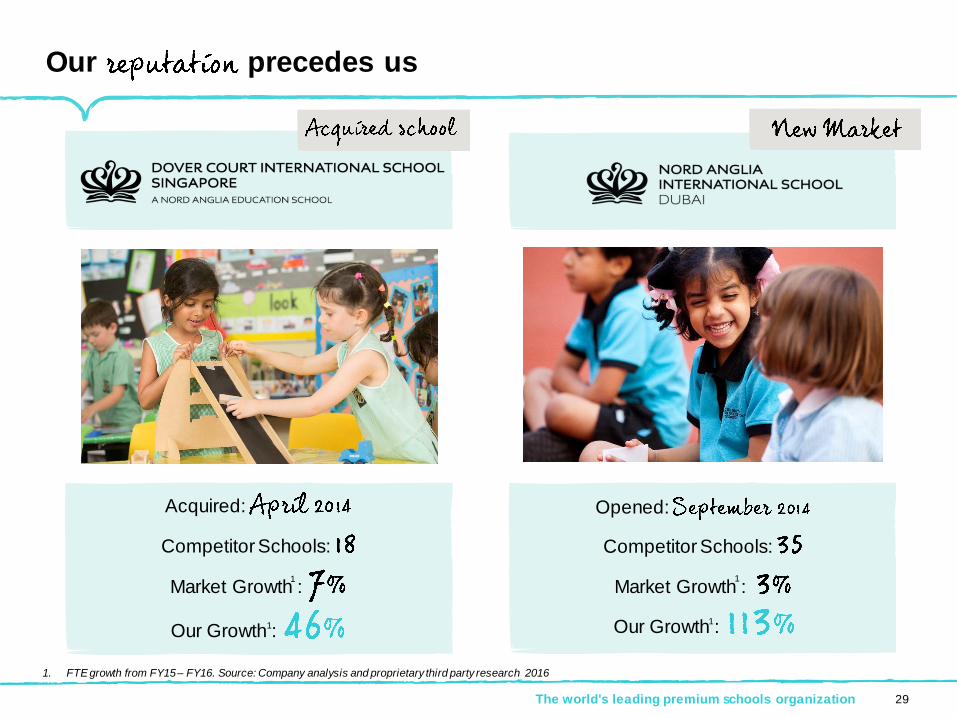
Our precedes us
29The world's leading premium schools organization
Competitor Schools:
Market Growth :
Our Growth :
Competitor Schools:
Market Growth :
Our Growth :
1. FTE growth from FY15 – FY16. Source: Company analysis and proprietary third party research 2016
1
1 1
1
Acquired: Opened:

The world's leading premium schools organization
Strategy30
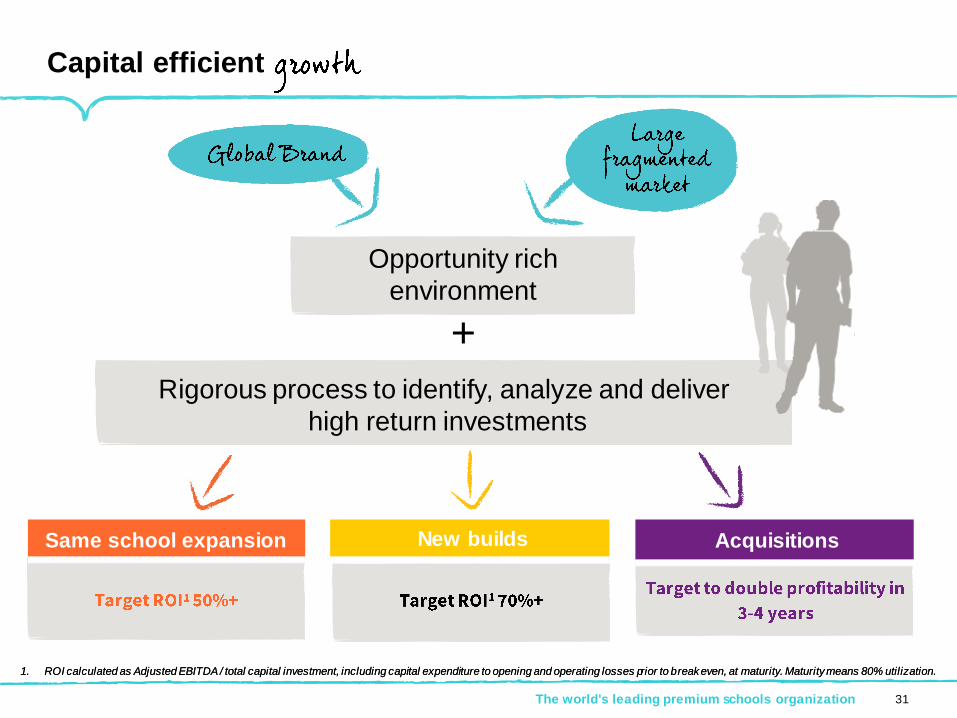
Capital efficient
The world's leading premium schools organization 31
1. ROI calculated as Adjusted EBITDA / total capital investment, including capital expenditure to opening and operating losses prior to break even, at maturity. Maturity means 80% utilization.
Same school expansion New builds Acquisitions
1. ROI calculated as Adjusted EBITDA / total capital investment, including capital expenditure to opening and operating losses prior to break even, at maturity. Maturity means 80% utilization.
Opportunity rich
environment
+
Rigorous process to identify, analyze and deliver
high return investments
The world's leading premium schools organization 32
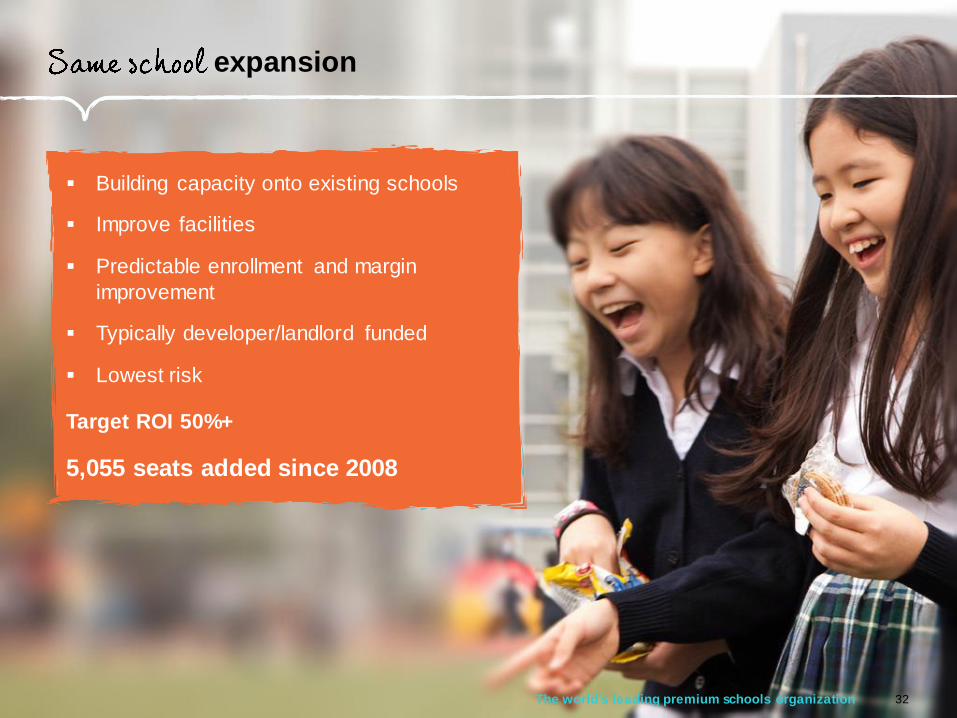
expansion
Building capacity onto existing schools
Improve facilities
Predictable enrollment and margin
improvement
Typically developer/landlord funded
Lowest risk
Target ROI 50%+
5,055 seats added since 2008
0
500
1000
1500
2000
2500
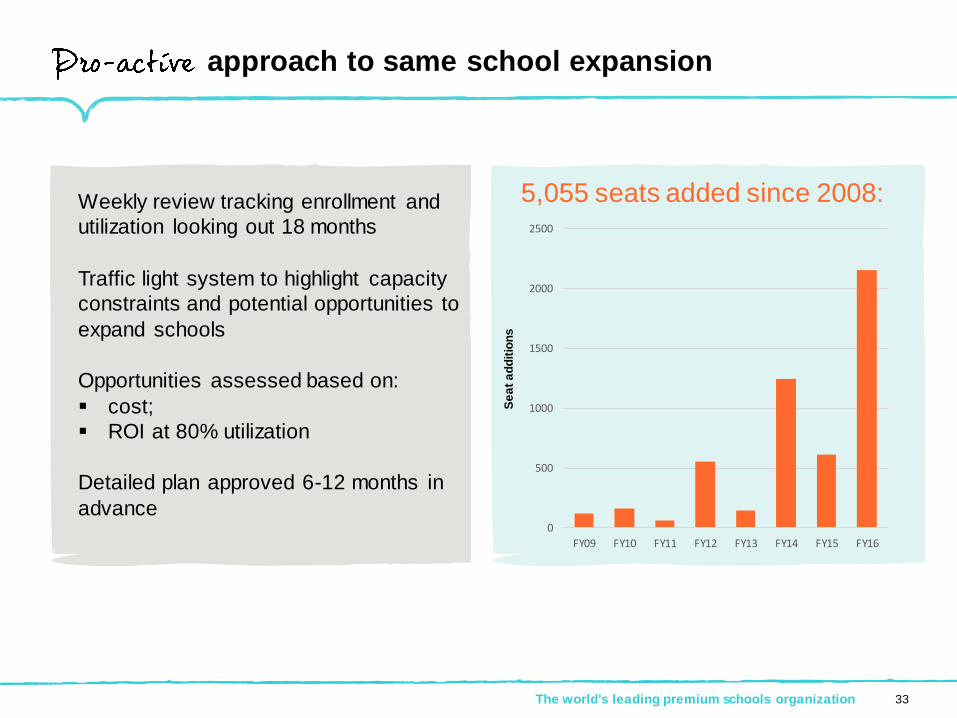
FY09 FY10 FY11 FY12 FY13 FY14 FY15 FY16
approach to same school expansion
The world's leading premium schools organization 33
Weekly review tracking enrollment and
utilization looking out 18 months
Traffic light system to highlight capacity
constraints and potential opportunities to
expand schools
Opportunities assessed based on:
cost;
ROI at 80% utilization
Detailed plan approved 6-12 months in
advanceS
ea
t a
dd
itio
ns
5,055 seats added since 2008:
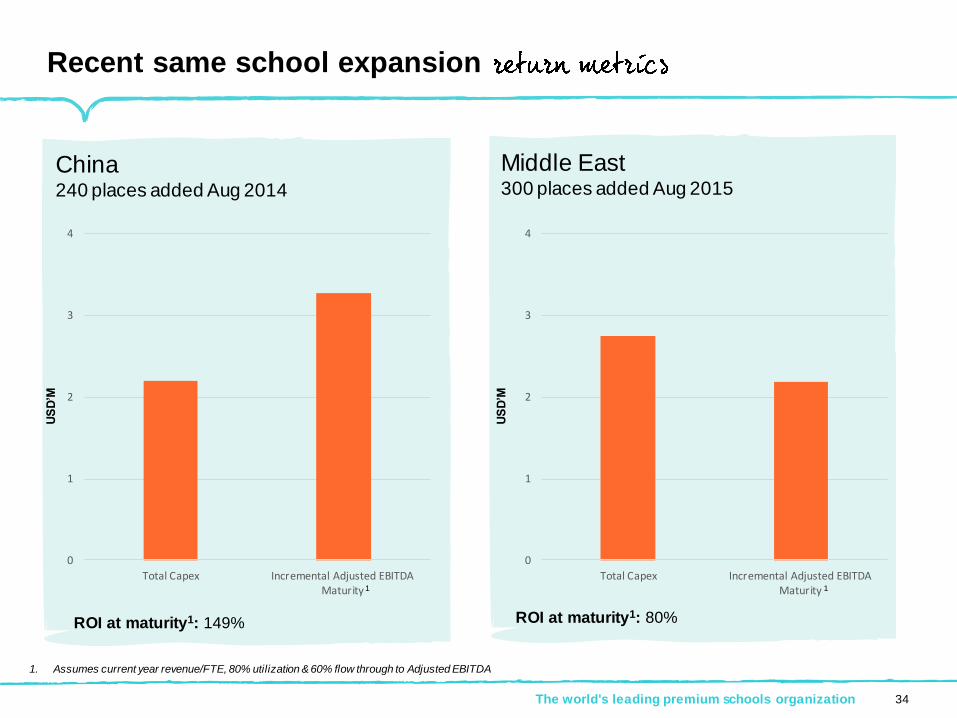
Recent same school expansion
China240 places added Aug 2014
US
D’M
Middle East 300 places added Aug 2015
ROI at maturity1: 80%ROI at maturity1: 149%
US
D’M
1. Assumes current year revenue/FTE, 80% utilization & 60% flow through to Adjusted EBITDA
The world's leading premium schools organization 34
1 1
0
1
2
3
4
Total Capex Incremental Adjusted EBITDAMaturity
0
1
2
3
4
Total Capex Incremental Adjusted EBITDAMaturity
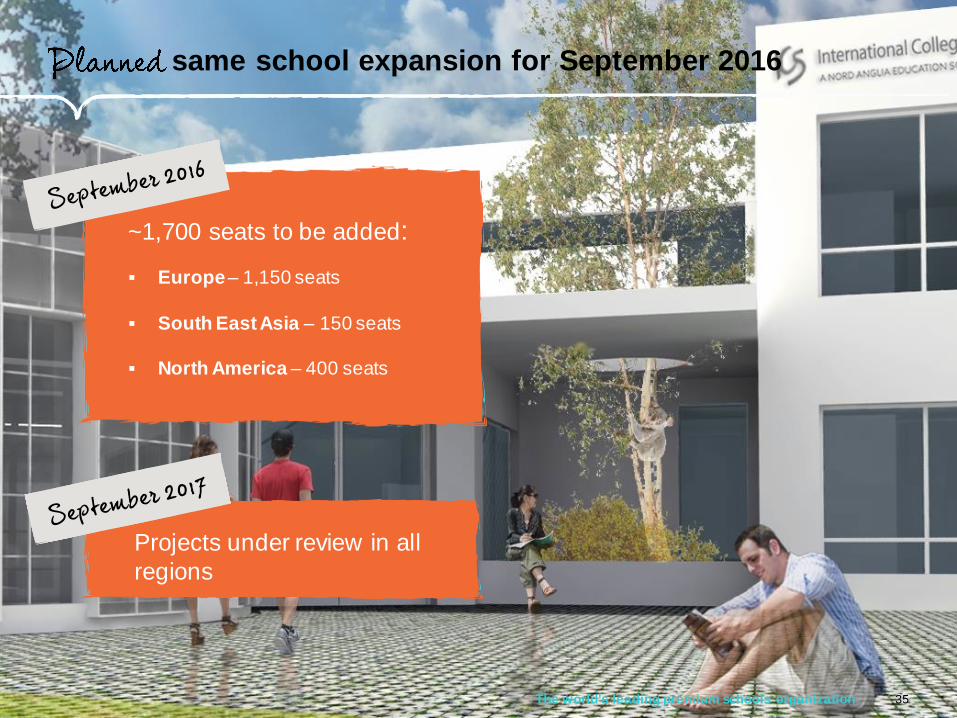
same school expansion for September 2016
The world's leading premium schools organization 35
~1,700 seats to be added:
Europe– 1,150 seats
South East Asia – 150 seats
North America – 400 seats
Projects under review in all
regions

Same school expansion film -
36

The world's leading premium schools organization
builds
37
Typically developer funded
Nord Anglia Education reputation for
quality
Adjacent property value enhanced
6 new schools opened since 2008:
Abu Dhabi, Beijing, Dubai, Aubonne, Hong Kong, Chicago
2 new schools opening Sept 2016:Shanghai, Houston
2 new schools opening Sept 2017:Abu Dhabi, Bangkok
Target ROI 70%+
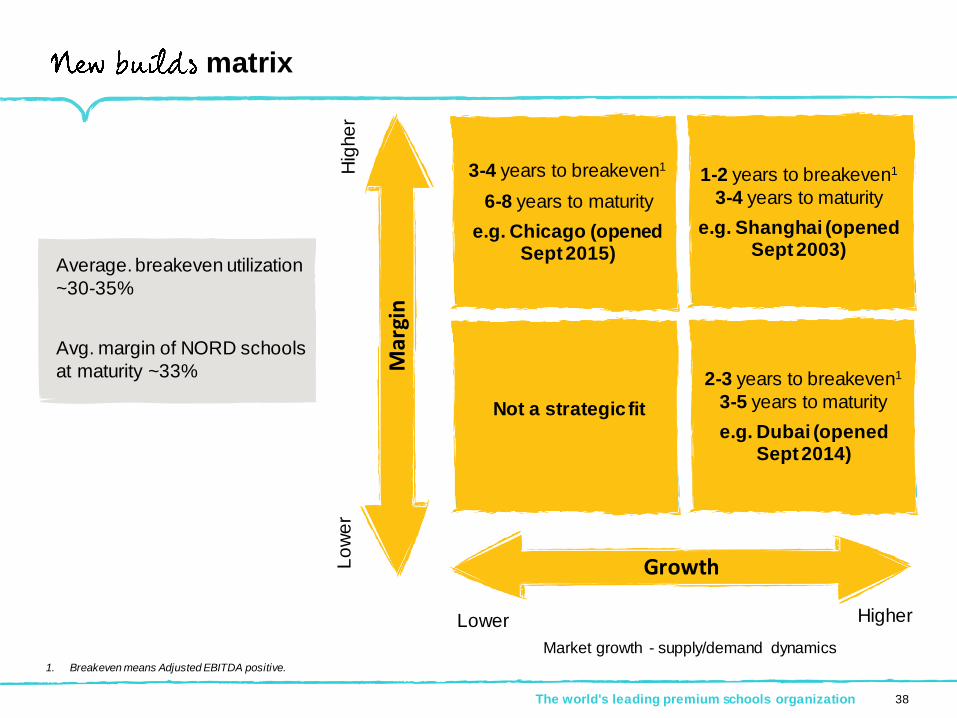
matrix
Lower Higher
Hig
he
rL
ow
er
Market growth - supply/demand dynamics1. Breakeven means Adjusted EBITDA positive.
The world's leading premium schools organization 38
3-4 years to breakeven1
6-8 years to maturity
e.g. Chicago (opened Sept 2015)
1-2 years to breakeven1
3-4 years to maturity
e.g. Shanghai (opened Sept 2003)
Not a strategic fit
2-3 years to breakeven1
3-5 years to maturity
e.g. Dubai (opened Sept 2014)
Growth
Margin
Average. breakeven utilization
~30-35%
Avg. margin of NORD schools
at maturity ~33%
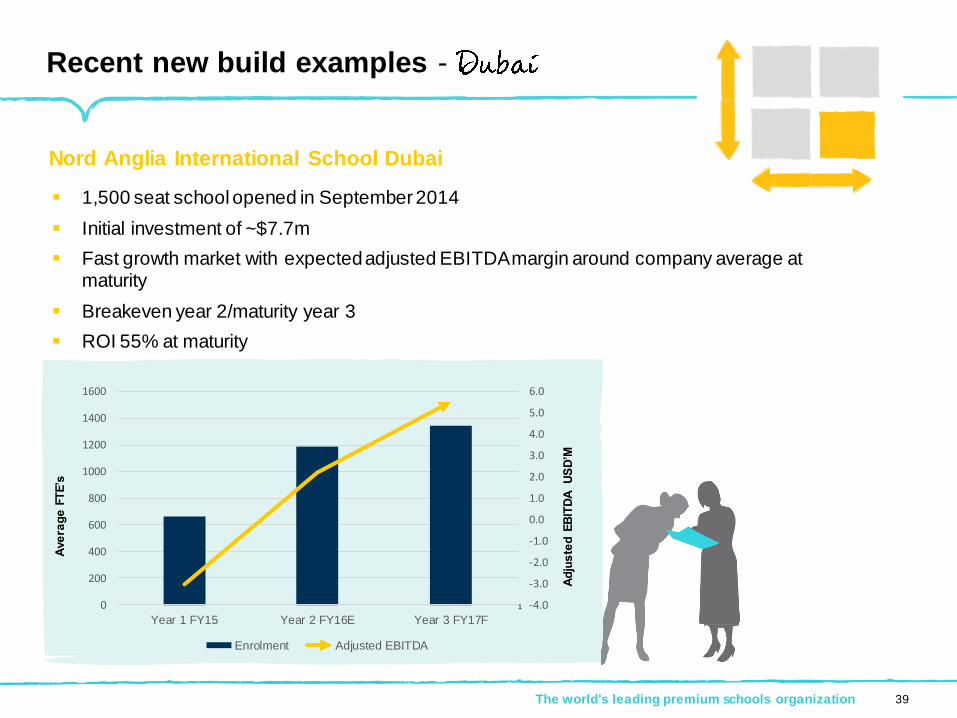
Recent new build examples -
The world's leading premium schools organization
Nord Anglia International School Dubai
1
1,500 seat school opened in September 2014
Initial investment of ~$7.7m
Fast growth market with expected adjusted EBITDA margin around company average at maturity
Breakeven year 2/maturity year 3
ROI 55% at maturity
Ad
jus
ted
EB
ITD
A
US
D’M
Ave
rag
e F
TE
’s
39
-4.0
-3.0
-2.0
-1.0
0.0
1.0
2.0
3.0
4.0
5.0
6.0
0
200
400
600
800
1000
1200
1400
1600
Year 1 FY15 Year 2 FY16E Year 3 FY17F
Enrolment Adjusted EBITDA
Ave
rag
e F
TE
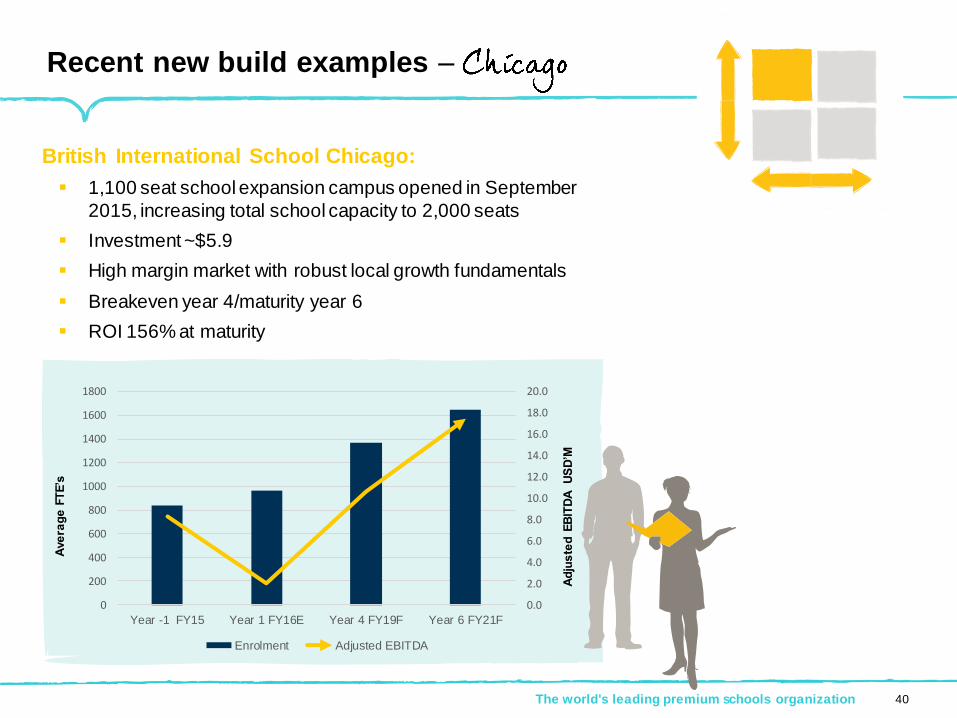
’sRecent new build examples –
The world's leading premium schools organization
British International School Chicago:
1,100 seat school expansion campus opened in September
2015, increasing total school capacity to 2,000 seats
Investment ~$5.9
High margin market with robust local growth fundamentals
Breakeven year 4/maturity year 6
ROI 156% at maturity
40
0.0
2.0
4.0
6.0
8.0
10.0
12.0
14.0
16.0
18.0
20.0
0
200
400
600
800
1000
1200
1400
1600
1800
Year -1 FY15 Year 1 FY16E Year 4 FY19F Year 6 FY21F
Enrolment Adjusted EBITDA
Ad
jus
ted
EB
ITD
A
US
D’M
Ave
rag
e F
TE
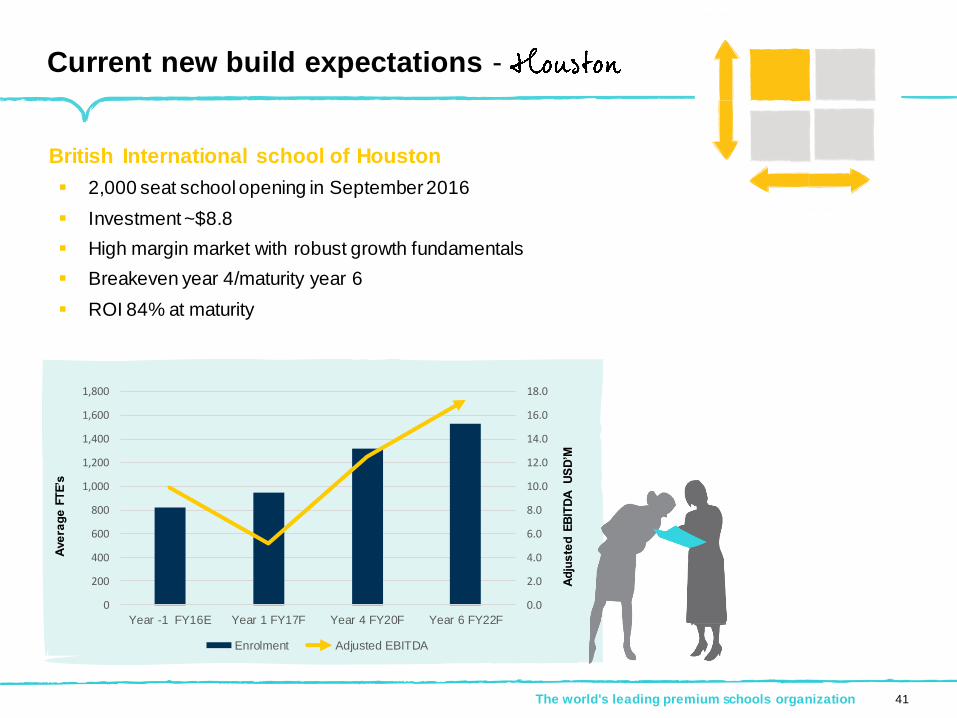
’sCurrent new build expectations -
The world's leading premium schools organization
British International school of Houston
2,000 seat school opening in September 2016
Investment ~$8.8
High margin market with robust growth fundamentals
Breakeven year 4/maturity year 6
ROI 84% at maturity
41
0.0
2.0
4.0
6.0
8.0
10.0
12.0
14.0
16.0
18.0
0
200
400
600
800
1,000
1,200
1,400
1,600
1,800
Year -1 FY16E Year 1 FY17F Year 4 FY20F Year 6 FY22F
Enrolment Adjusted EBITDA
Ad
jus
ted
EB
ITD
A
US
D’M
Ave
rag
e F
TE
’sCurrent new build expectations -
The world's leading premium schools organization
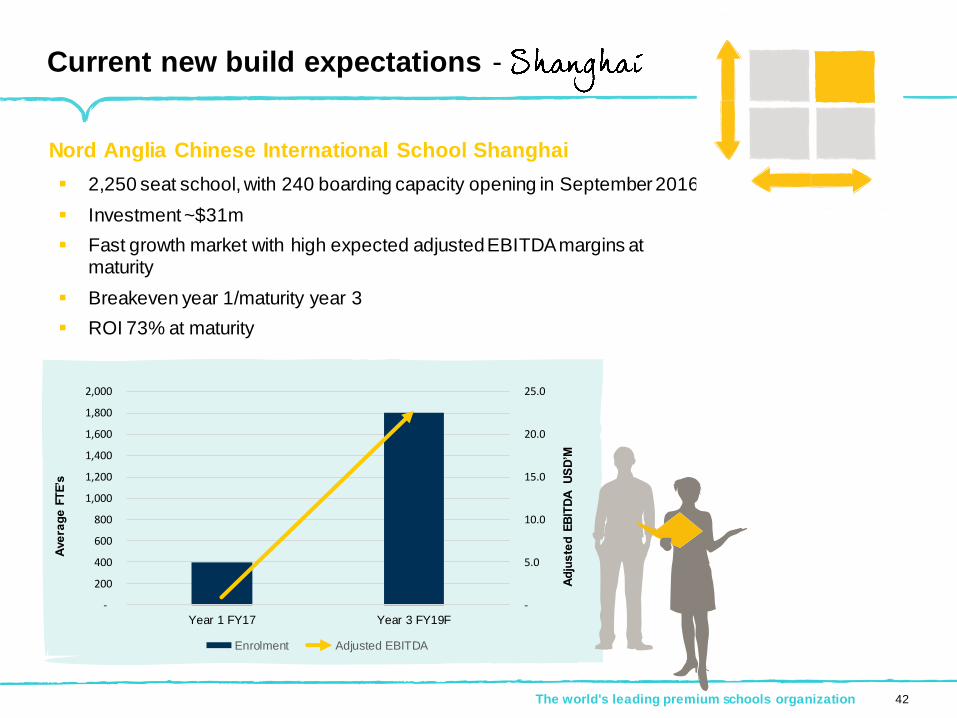
Nord Anglia Chinese International School Shanghai
2,250 seat school, with 240 boarding capacity opening in September 2016
Investment ~$31m
Fast growth market with high expected adjusted EBITDA margins at maturity
Breakeven year 1/maturity year 3
ROI 73% at maturity
42
-
5.0
10.0
15.0
20.0
25.0
-
200
400
600
800
1,000
1,200
1,400
1,600
1,800
2,000
Year 1 FY17 Year 3 FY19F
Enrolment Adjusted EBITDA
Ad
jus
ted
EB
ITD
A
US
D’M
New build film –
43
The world's leading premium schools organization
Combine with 47
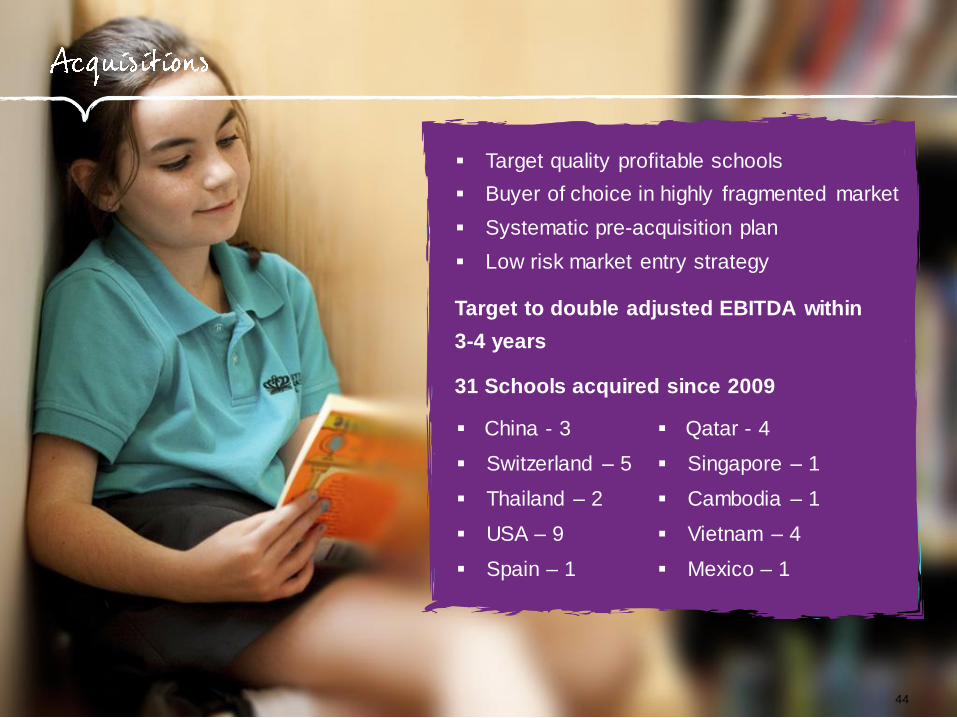
Target quality profitable schools
Buyer of choice in highly fragmented market
Systematic pre-acquisition plan
Low risk market entry strategy
Target to double adjusted EBITDA within
3-4 years
31 Schools acquired since 2009
China - 3 Qatar - 4
Switzerland – 5 Singapore – 1
Thailand – 2 Cambodia – 1
USA – 9 Vietnam – 4
Spain – 1 Mexico – 1
44
The world's leading premium schools organization 45
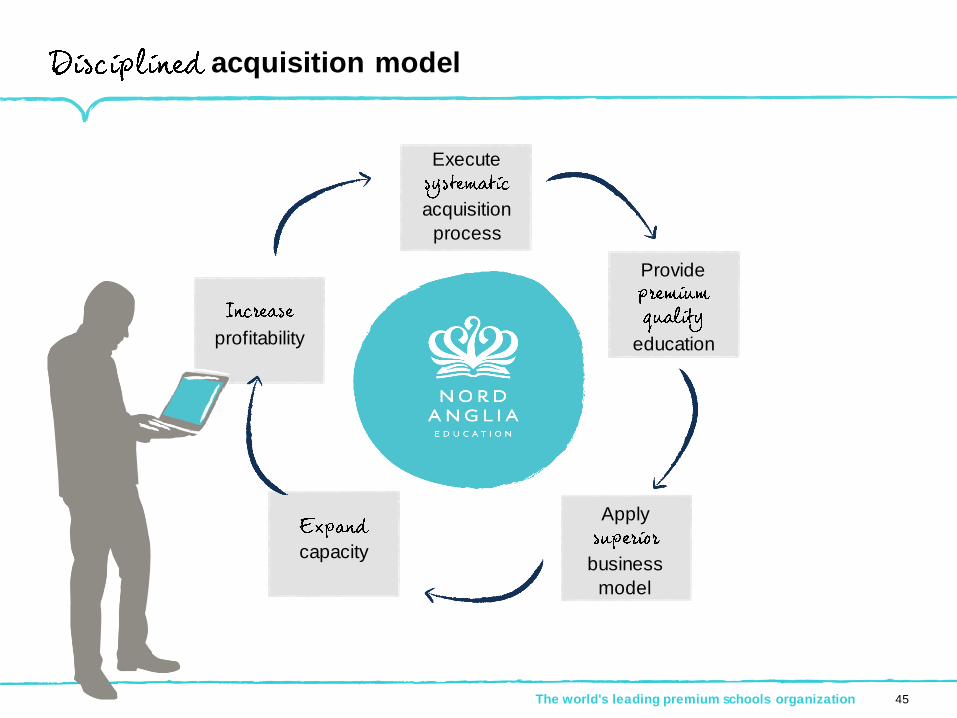
Execute
acquisition
process
Provide
education
Apply
business
model
capacity
profitability
acquisition model
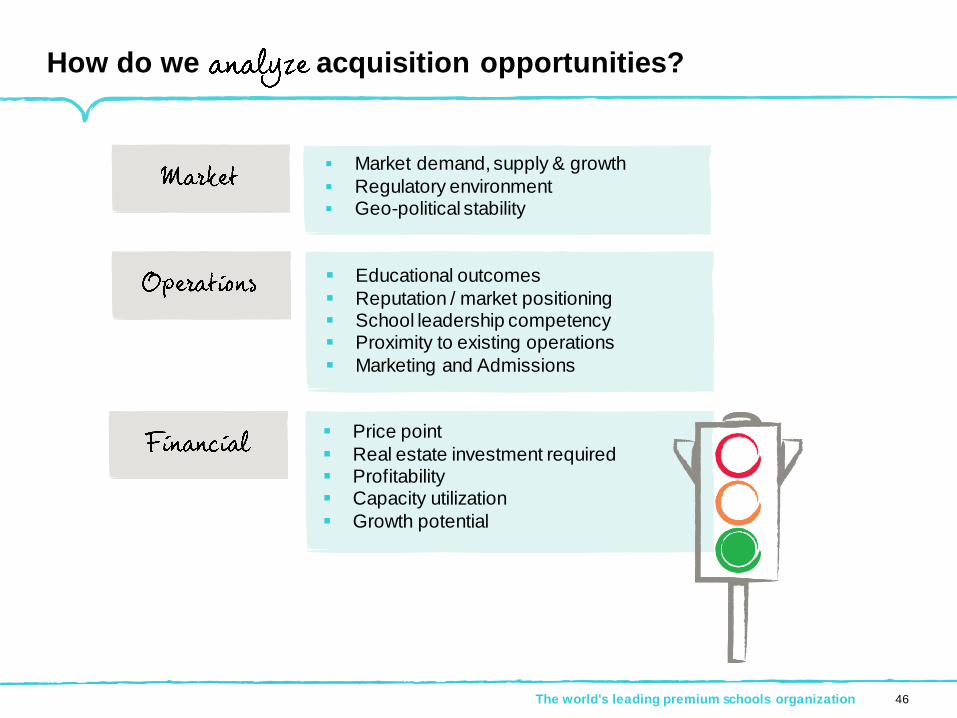
How do we acquisition opportunities?
The world's leading premium schools organization 46
Market demand, supply & growth
Regulatory environment Geo-political stability
Educational outcomes
Reputation / market positioning School leadership competency Proximity to existing operations
Marketing and Admissions
Price point
Real estate investment required Profitability Capacity utilization
Growth potential
The world's leading premium schools organization
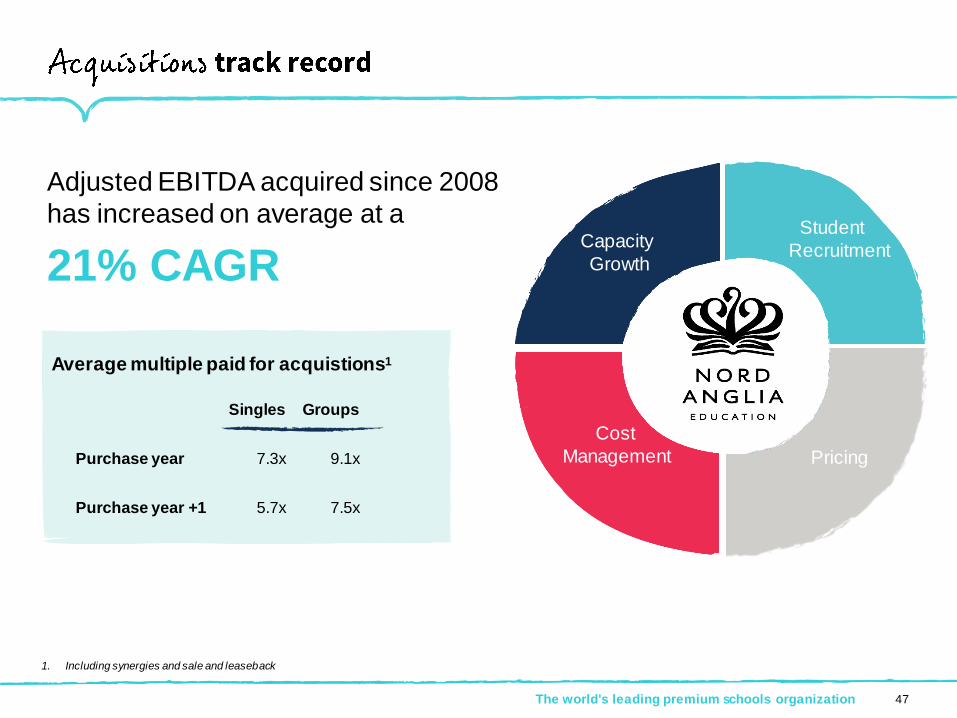
Adjusted EBITDA acquired since 2008
has increased on average at a
21% CAGR
Singles Groups
Purchase year 7.3x 9.1x
Purchase year +1 5.7x 7.5x
1. Including synergies and sale and leaseback
47
Average multiple paid for acquistions1
Capacity
Growth
Student
Recruitment
Pricing
Cost
Management
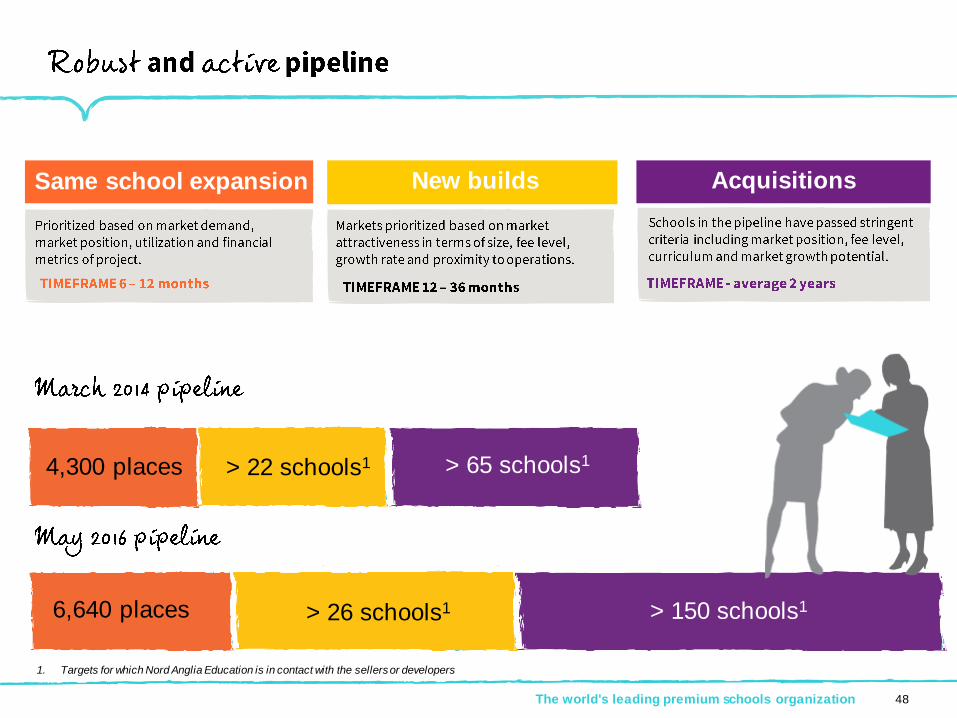
4,300 places > 22 schools1 > 65 schools1
6,640 places > 26 schools1 > 150 schools1
Same school expansion New builds Acquisitions
The world's leading premium schools organization 48
1. Targets for which Nord Anglia Education is in contact with the sellers or developers
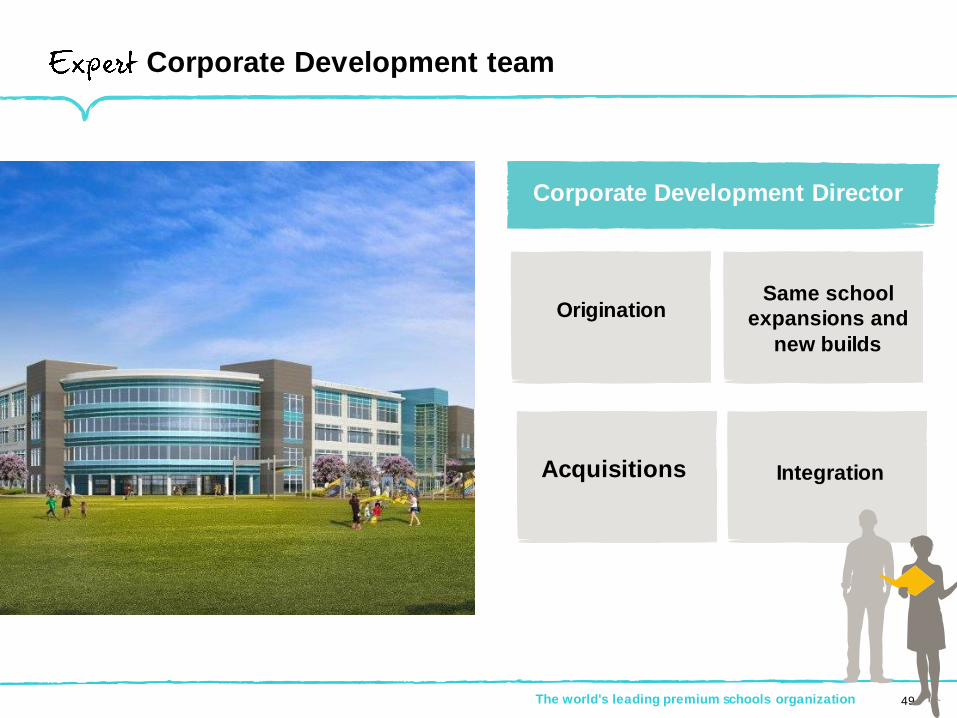
Corporate Development team
Corporate Development Director
Origination
The world's leading premium schools organization 49
Acquisitions
Same school
expansions and
new builds
Integration

The world's leading premium schools organization
our family
50

The world's leading premium schools organization
school, regional
and central
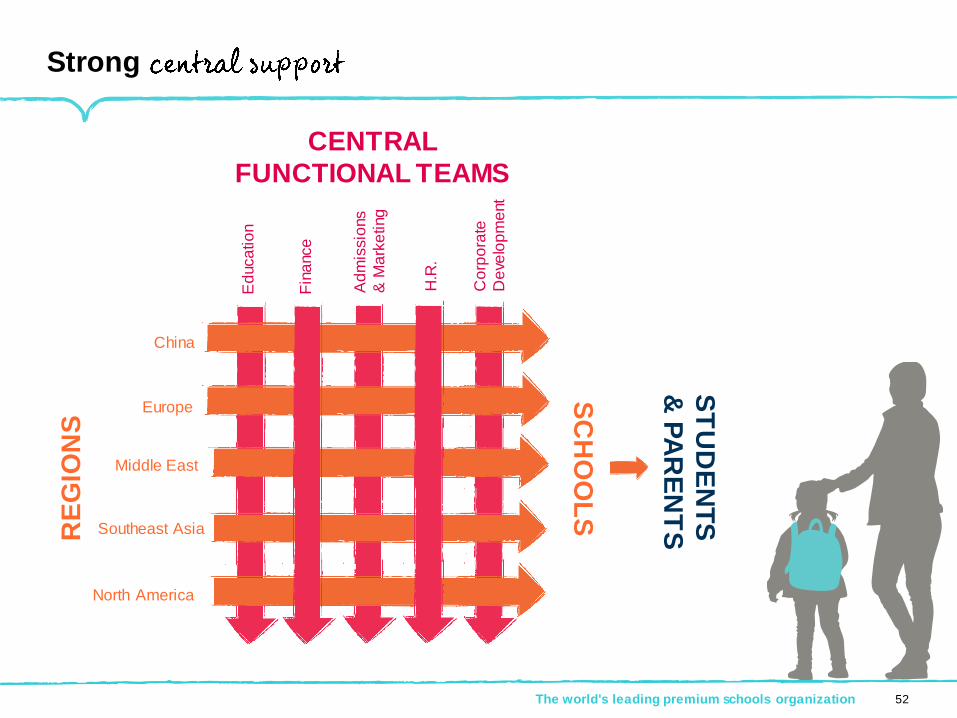
51
The world's leading premium schools organization
China
Europe
Middle East
Southeast Asia
North America
RE
GIO
NS
ST
UD
EN
TS
& P
AR
EN
TS
Fin
ance
Ed
uca
tio
n
Ad
mis
sio
ns
& M
ark
eting
H.R
.
Co
rpo
rate
De
velo
pm
ent
CENTRAL
FUNCTIONAL TEAMS
SC
HO
OL
S
Strong
52
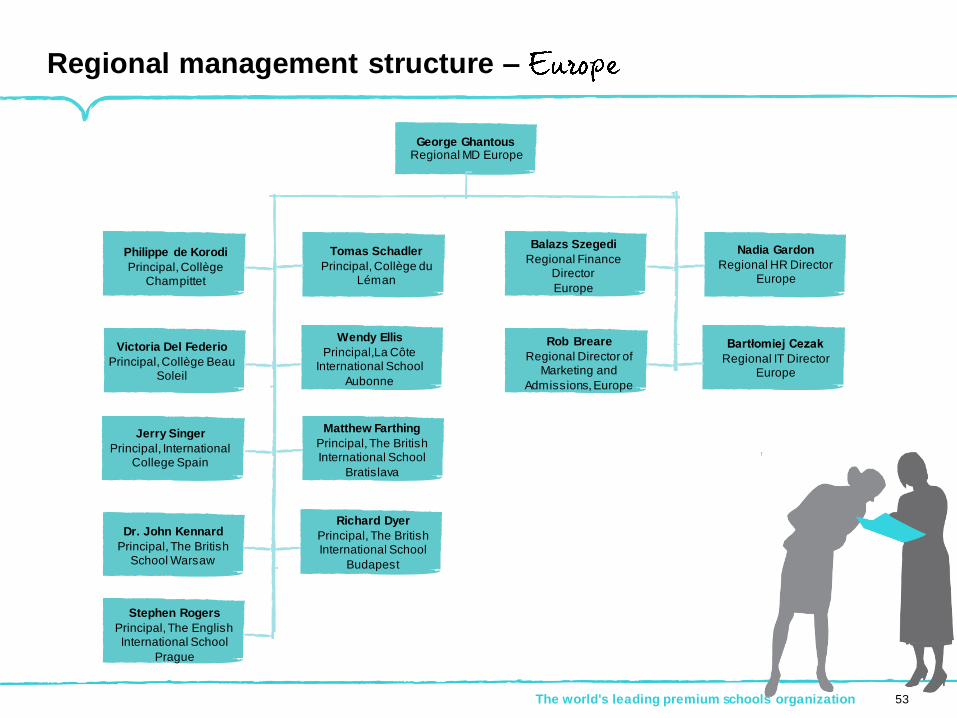
Regional management structure –
Balazs Szegedi
Regional Finance Director
Europe
Nadia Gardon
Regional HR DirectorEurope
Rob Breare
Regional Director of Marketing and
Admissions, Europe
Bartłomiej Cezak
Regional IT DirectorEurope
The world's leading premium schools organization 53
George GhantousRegional MD Europe
Philippe de Korodi
Principal, Collège Champittet
Tomas Schadler
Principal, Collège du Léman
Victoria Del Federio
Principal, Collège Beau Soleil
Wendy Ellis
Principal,La Côte International School
Aubonne
Jerry Singer
Principal, International College Spain
Matthew Farthing
Principal, The British International School
Bratislava
Dr. John Kennard
Principal, The British School Warsaw
Richard Dyer
Principal, The British International School
Budapest
Stephen Rogers
Principal, The English International School
Prague
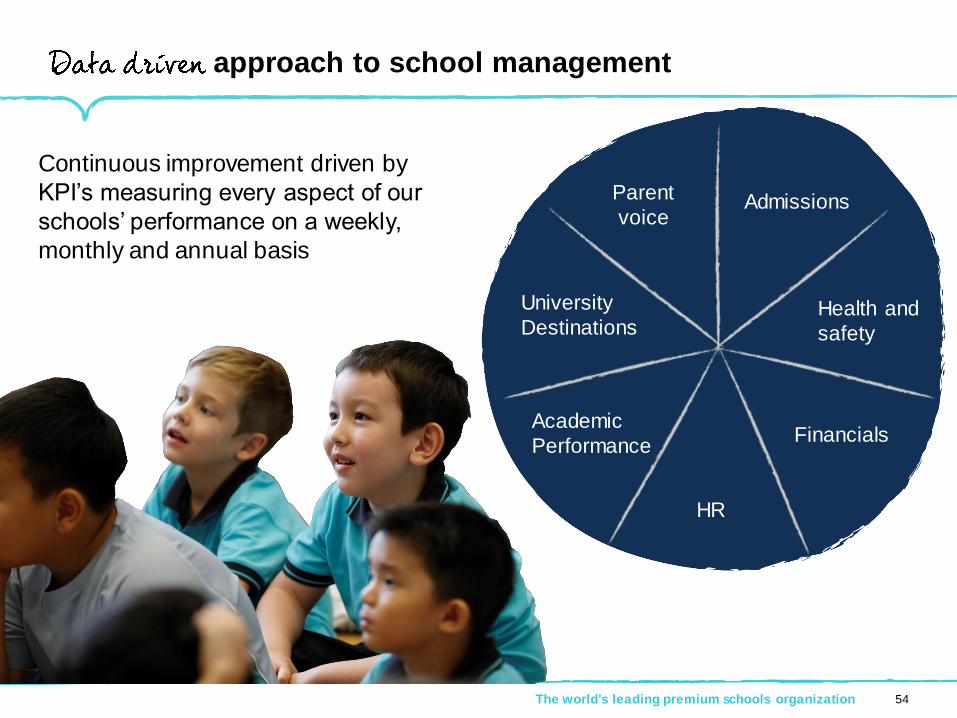
approach to school management
Continuous improvement driven by
KPI’s measuring every aspect of our
schools’ performance on a weekly,
monthly and annual basis
The world's leading premium schools organization 54
Admissions
Health and
safety
Financials
HR
Academic
Performance
University
Destinations
Parent
voice
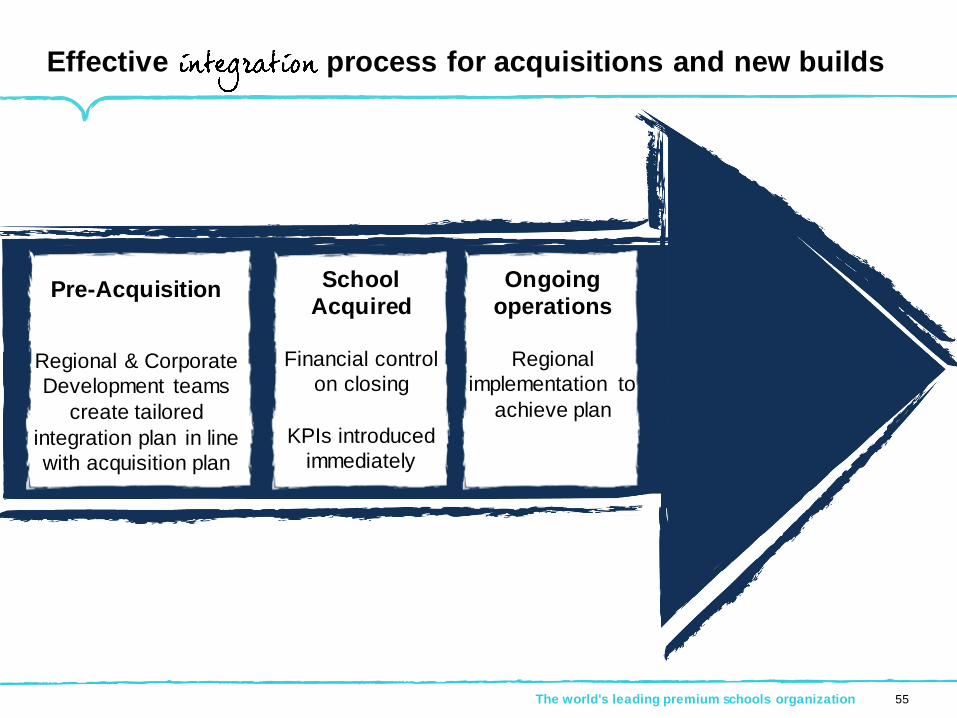
Effective process for acquisitions and new builds
55The world's leading premium schools organization
Pre-Acquisition
Regional & Corporate
Development teams
create tailored
integration plan in line
with acquisition plan
School
Acquired
Financial control
on closing
KPIs introduced
immediately
Ongoing
operations
Regional
implementation to
achieve plan
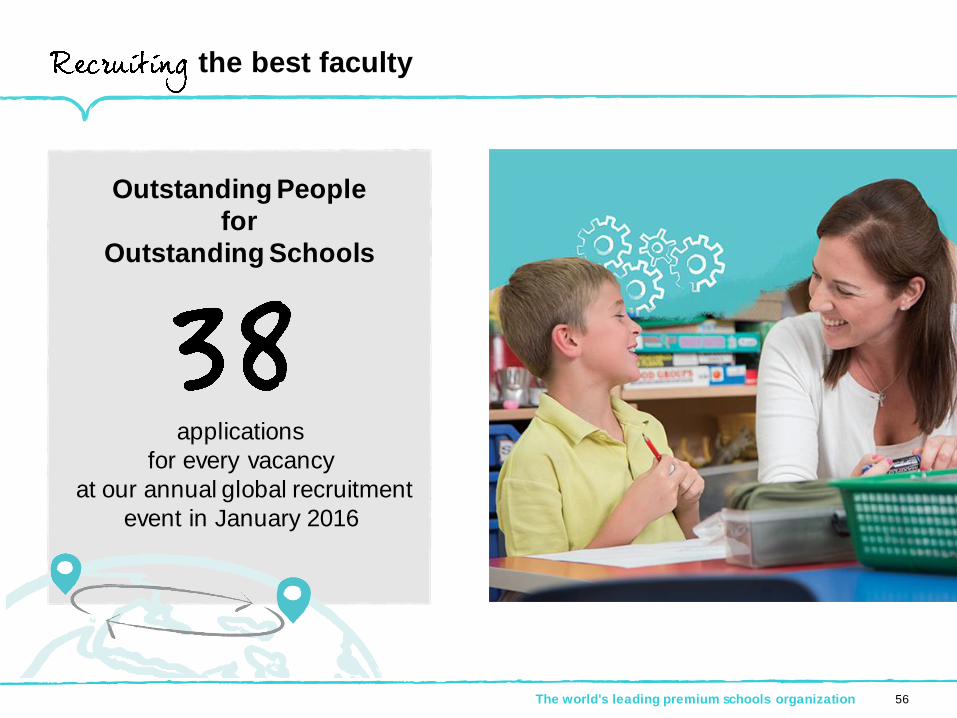
The world's leading premium schools organization
the best faculty
applications
for every vacancy
at our annual global recruitment
event in January 2016
Outstanding People
for
Outstanding Schools
56
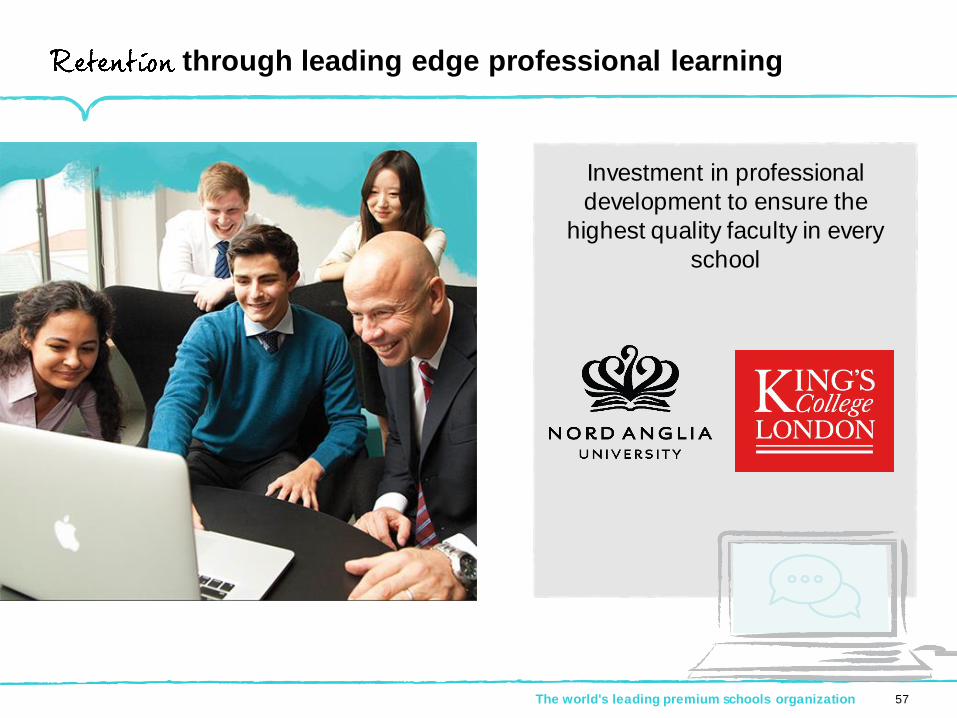
through leading edge professional learning
The world's leading premium schools organization
Investment in professional
development to ensure the
highest quality faculty in every
school
57
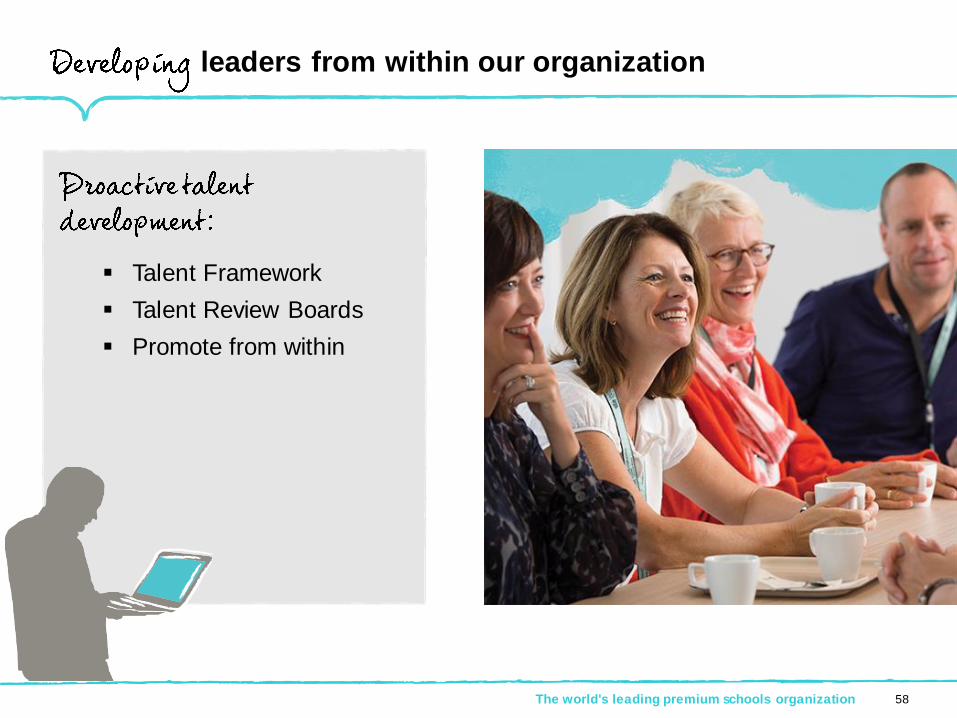
leaders from within our organization
The world's leading premium schools organization 58
Talent Framework
Talent Review Boards
Promote from within
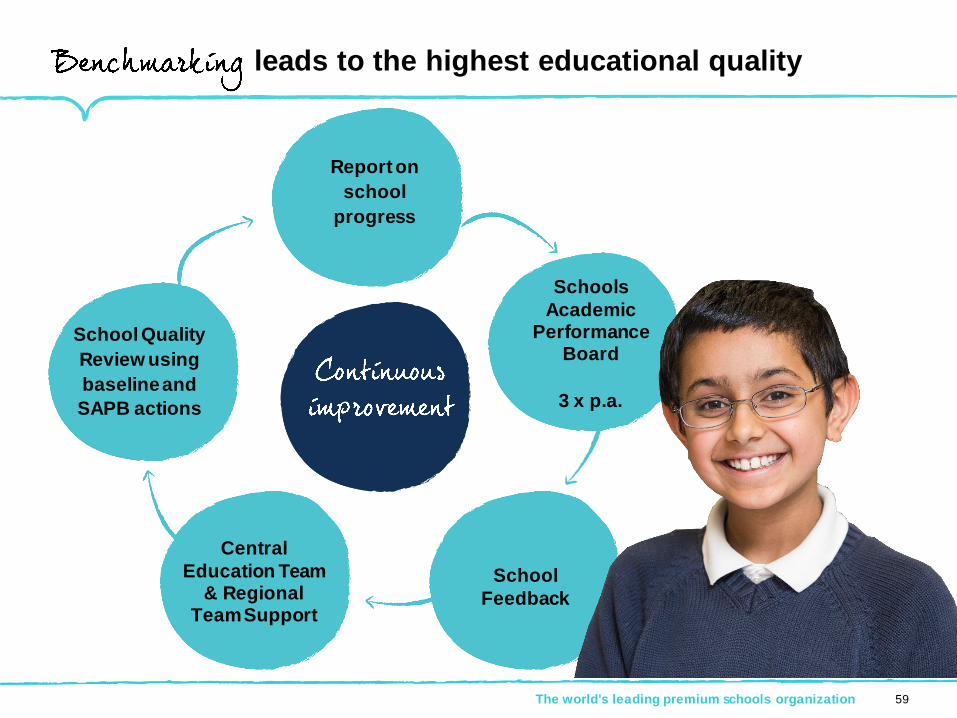
leads to the highest educational quality
The world's leading premium schools organization
Report on
school
progress
59
Schools
Academic Performance
Board
3 x p.a.
School
Feedback
Central
Education Team & Regional
Team Support
School Quality
Review using
baseline and
SAPB actions
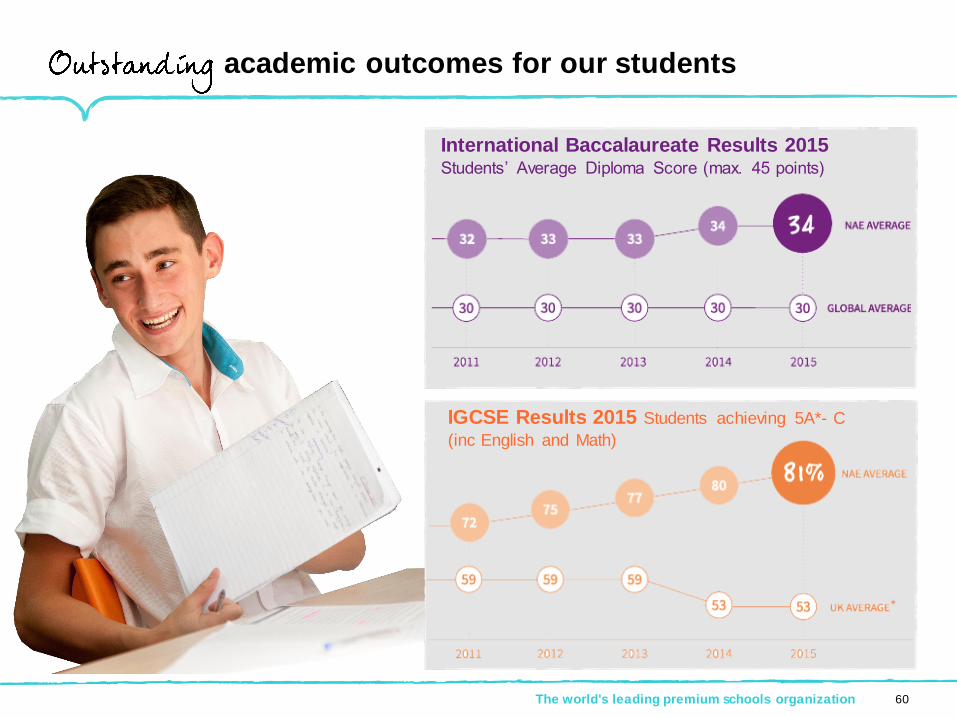
academic outcomes for our students
International Baccalaureate Results 2015Students’ Average Diploma Score (max. 45 points)
IGCSE Results 2015 Students achieving 5A*- C
(inc English and Math)
The world's leading premium schools organization 60

The world's leading premium schools organization
profile and targets61
The world's leading premium schools organization
financial profile
62
High growth
Strong visibility
High margins and operating leverage
Significant free cashflow
Outstanding returns on investment
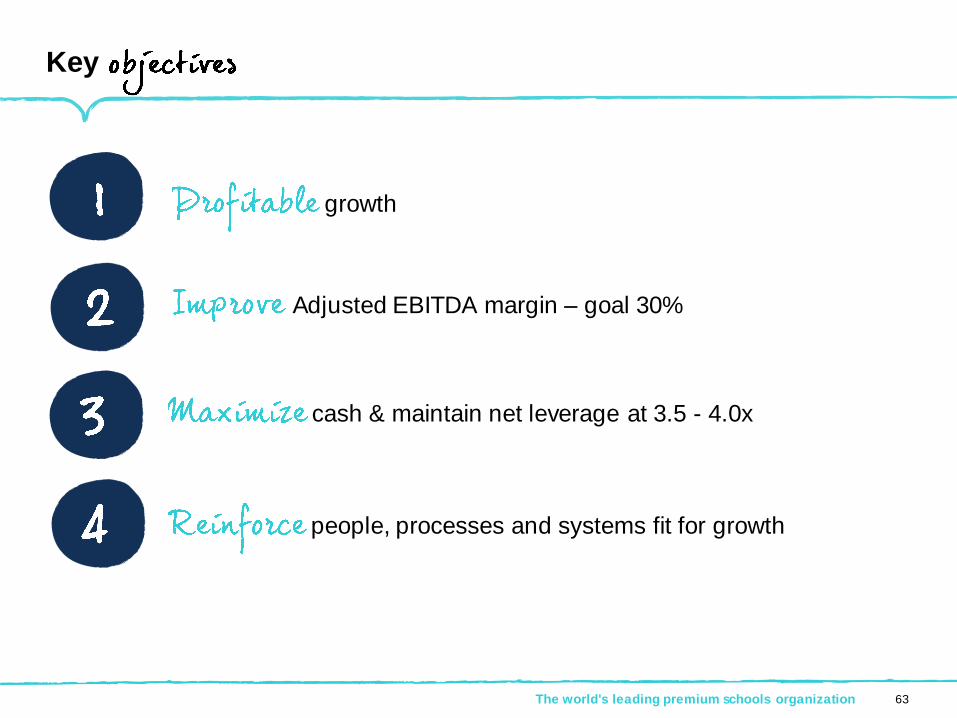
Key
63The world's leading premium schools organization
growth
cash & maintain net leverage at 3.5 - 4.0x
people, processes and systems fit for growth
Adjusted EBITDA margin – goal 30%
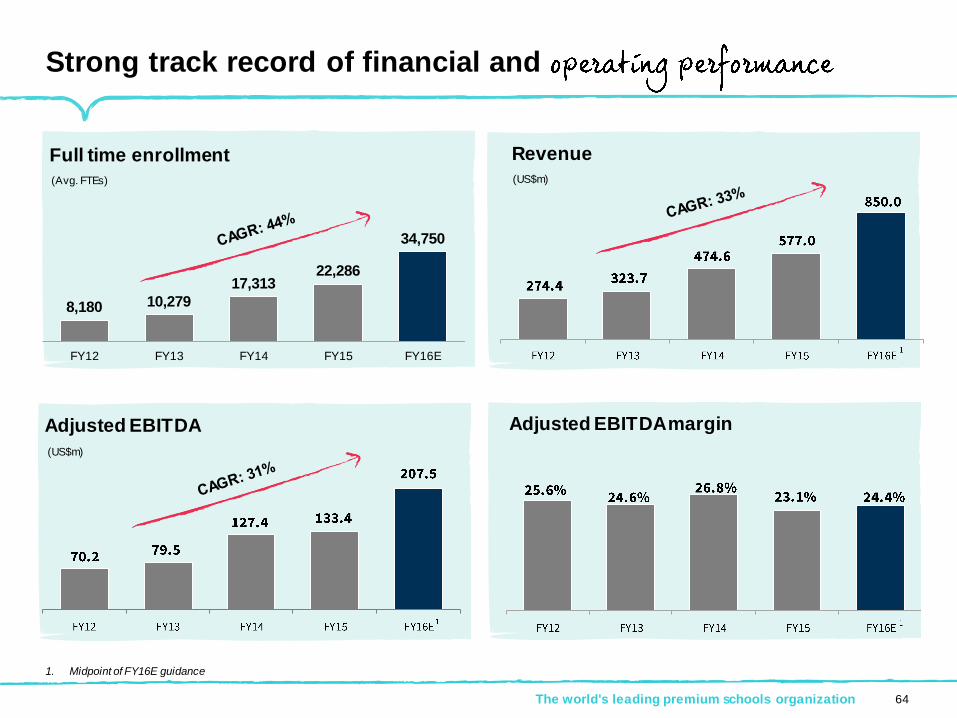
1. Midpoint of FY16E guidance
Strong track record of financial and
8,180 10,279
17,313 22,286
34,750
FY12 FY13 FY14 FY15 FY16E
Full time enrollment
(Avg. FTEs)
Revenue
(US$m)
Adjusted EBITDA
(US$m)
Adjusted EBITDA margin
The world's leading premium schools organization 64
The world's leading premium schools organization
Adjusted
EBITDA
margin
goal
65
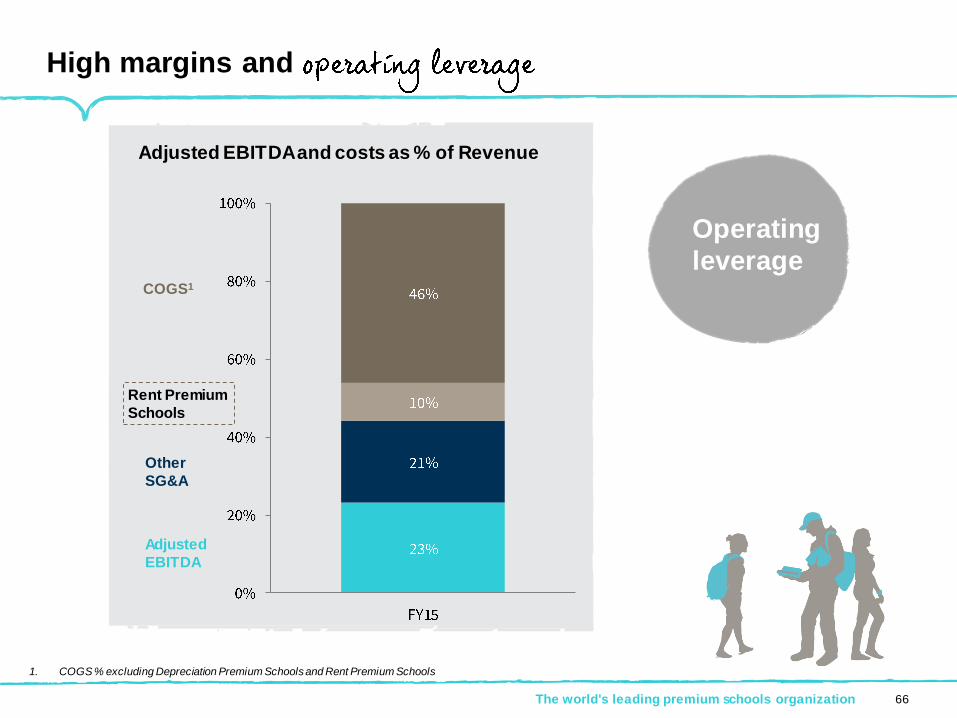
High margins and
Other
SG&A
COGS1
Adjusted
EBITDA
Rent Premium
Schools
1. COGS % excluding Depreciation Premium Schools and Rent Premium Schools
The world's leading premium schools organization 66
Adjusted EBITDA and costs as % of Revenue
Operating
leverage
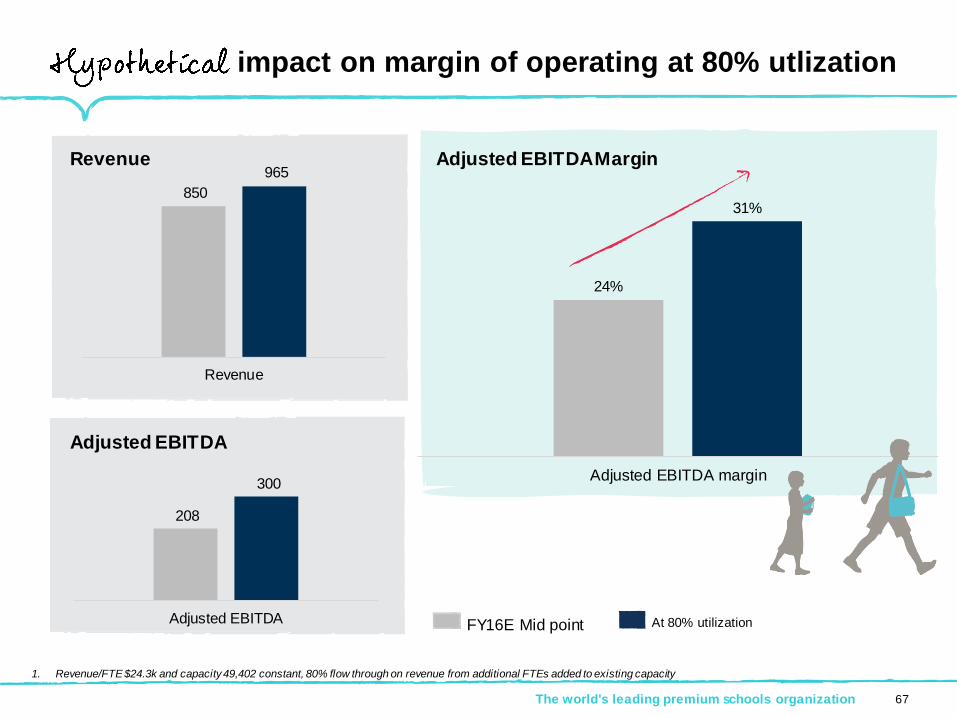
impact on margin of operating at 80% utlization
1. Revenue/FTE $24.3k and capacity 49,402 constant, 80% flow through on revenue from additional FTEs added to existing capacity
The world's leading premium schools organization 67
850
965
Revenue
208
300
Adjusted EBITDA
24%
31%
Adjusted EBITDA margin
Revenue
Adjusted EBITDA
Adjusted EBITDA Margin
FY16E Mid point At 80% utilization
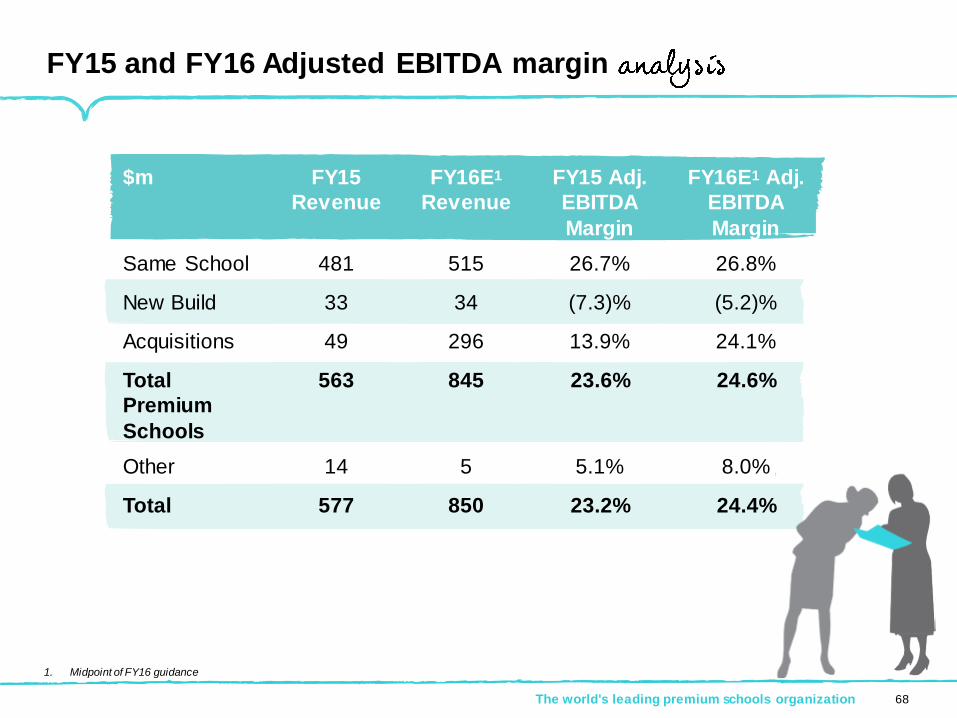
The world's leading premium schools organization
$m FY15
Revenue
FY16E1
Revenue
FY15 Adj.
EBITDA
Margin
FY16E1 Adj.
EBITDA
Margin
Same School 481 515 26.7% 26.8%
New Build 33 34 (7.3)% (5.2)%
Acquisitions 49 296 13.9% 24.1%
Total
Premium
Schools
563 845 23.6% 24.6%
Other 14 5 5.1% 8.0%
Total 577 850 23.2% 24.4%
FY15 and FY16 Adjusted EBITDA margin
68
1. Midpoint of FY16 guidance
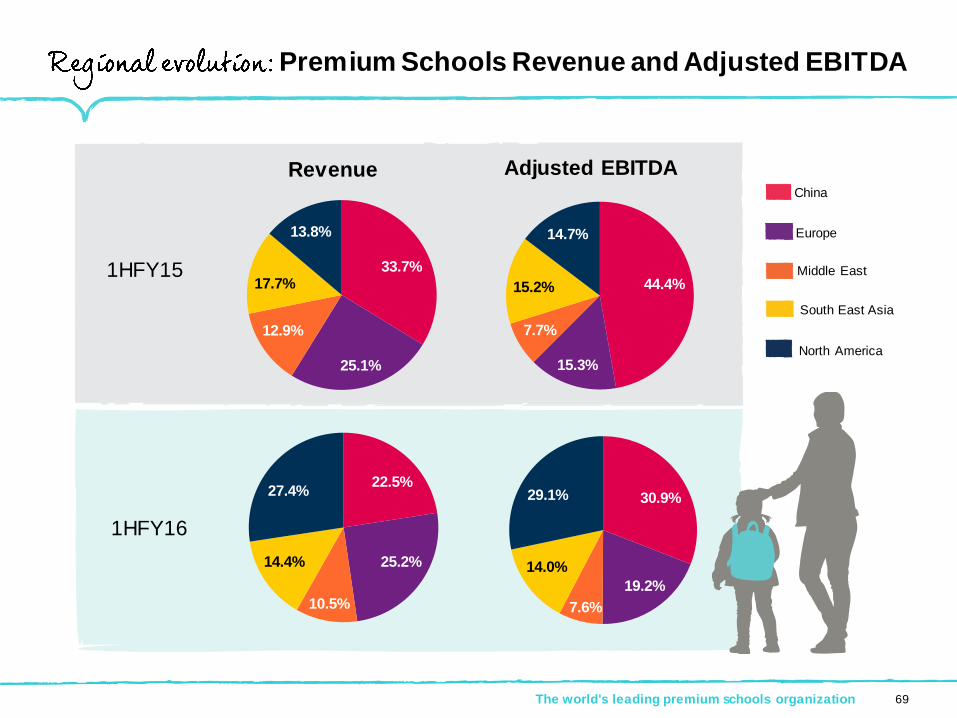
Premium Schools Revenue and Adjusted EBITDA
30.9%
19.2%
7.6%
14.0%
29.1%
Adjusted EBITDA
44.4%
15.3%
7.7%
15.2%
14.7%
China
Europe
Middle East
South East Asia
North America
1HFY16
The world's leading premium schools organization 69
Revenue
33.7%
25.1%
12.9%
17.7%
13.8%
22.5%
25.2%
10.5%
14.4%
27.4%
1HFY15
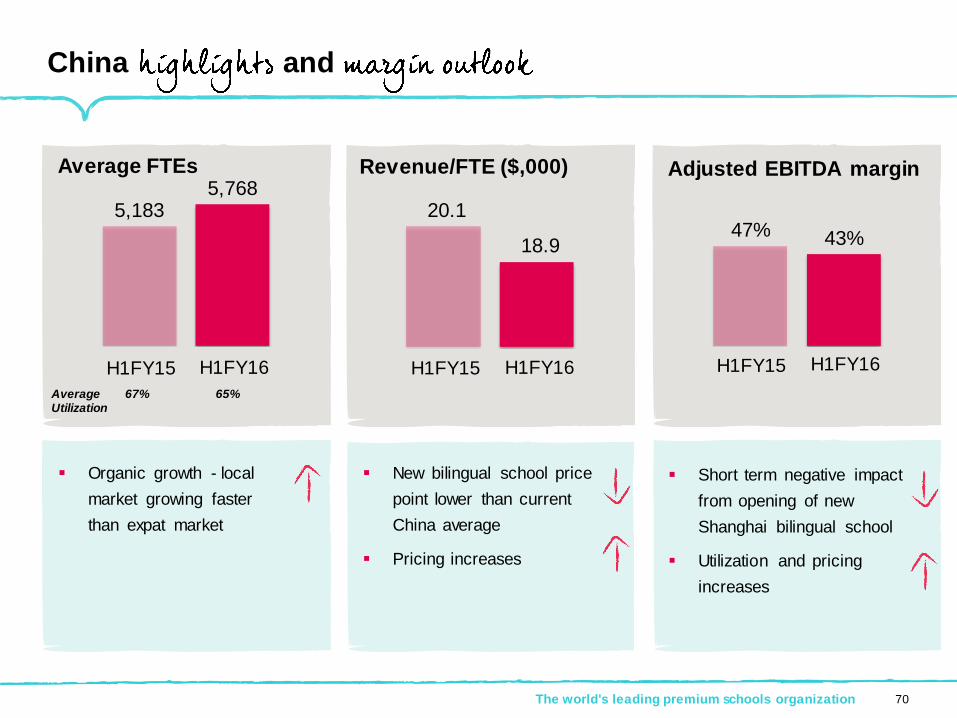
5,1835,768
20.1
18.9
China and
Organic growth - local
market growing faster
than expat market
H1FY15 H1FY16
The world's leading premium schools organization 70
47% 43%
H1FY15 H1FY16
Average 67% 65%Utilization
H1FY15 H1FY16
Revenue/FTE ($,000) Adjusted EBITDA margin Average FTEs
Short term negative impact
from opening of new
Shanghai bilingual school
Utilization and pricing
increases
New bilingual school price
point lower than current
China average
Pricing increases
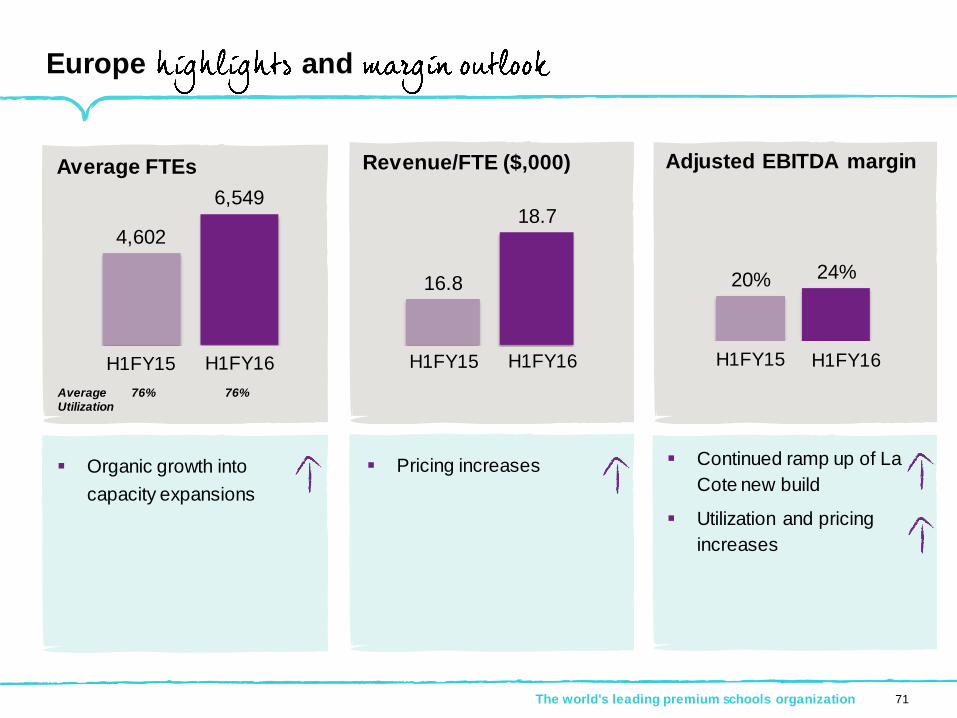
16.8
18.74,602
6,549
Europe and
The world's leading premium schools organization 71
H1FY15 H1FY16
20% 24%
H1FY15 H1FY16
Average 76% 76%Utilization
Revenue/FTE ($,000) Adjusted EBITDA margin Average FTEs
H1FY15 H1FY16
Continued ramp up of La
Cote new build
Utilization and pricing
increases
Pricing increases Organic growth into
capacity expansions
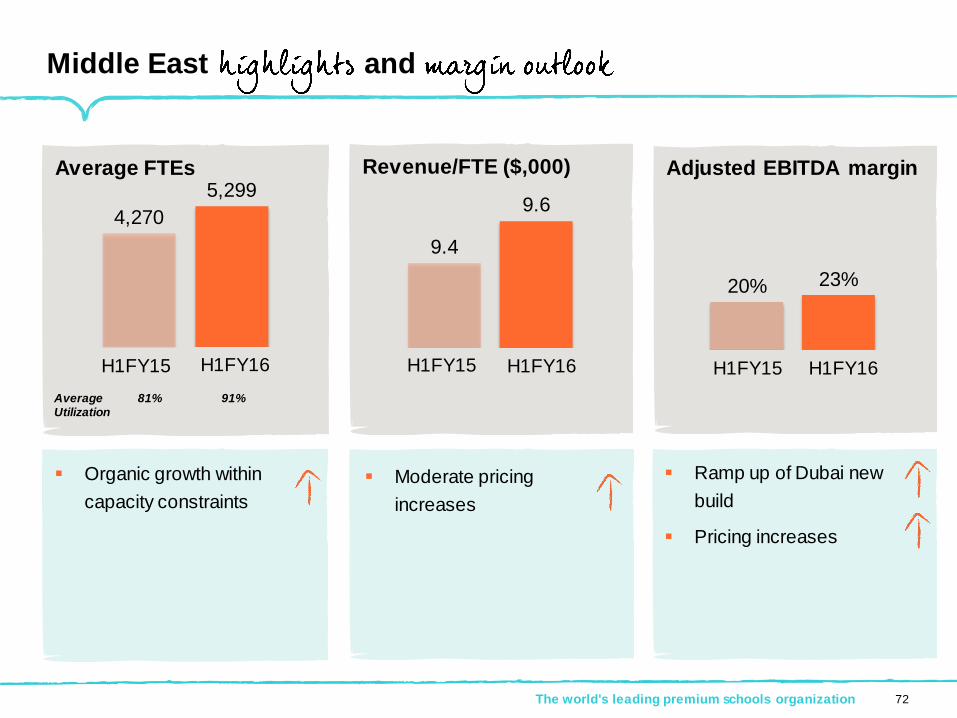
9.4
9.6
Middle East and
The world's leading premium schools organization 72
20% 23%
H1FY15 H1FY16
4,270
5,299
H1FY15 H1FY16
Average 81% 91%Utilization
Adjusted EBITDA margin Average FTEs Revenue/FTE ($,000)
Ramp up of Dubai new
build
Pricing increases
Moderate pricing
increases
Organic growth within
capacity constraints
H1FY15 H1FY16
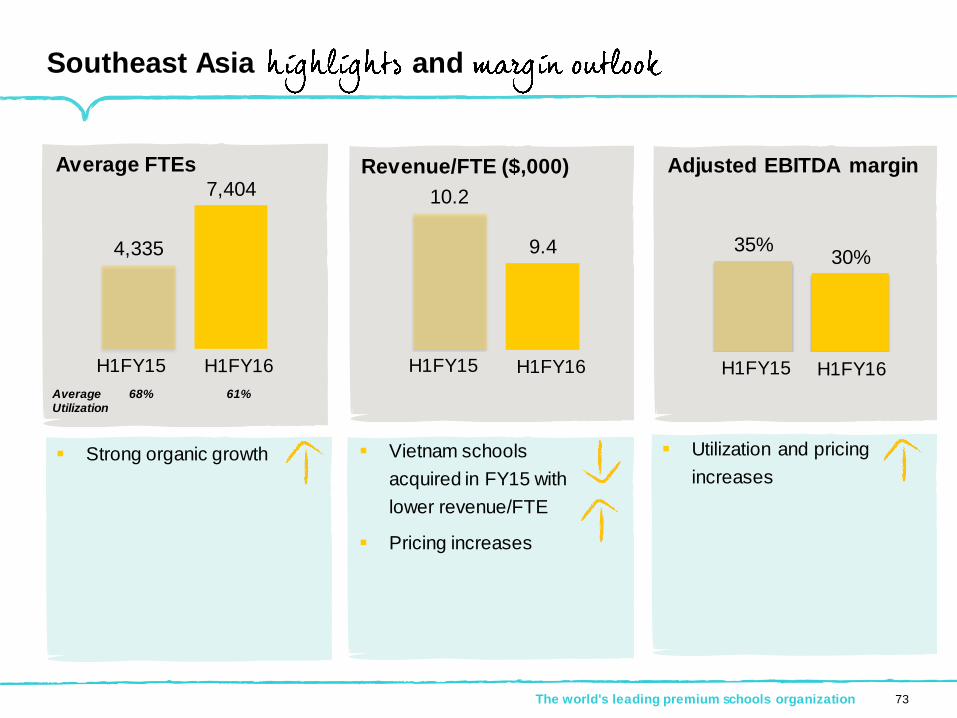
35%30%
Southeast Asia and
The world's leading premium schools organization 73
H1FY15 H1FY16
Average 68% 61%Utilization
4,335
7,404
H1FY15 H1FY16
Adjusted EBITDA margin Average FTEs Revenue/FTE ($,000)
10.2
9.4
H1FY15 H1FY16
Utilization and pricing
increases
Vietnam schools
acquired in FY15 with
lower revenue/FTE
Pricing increases
Strong organic growth
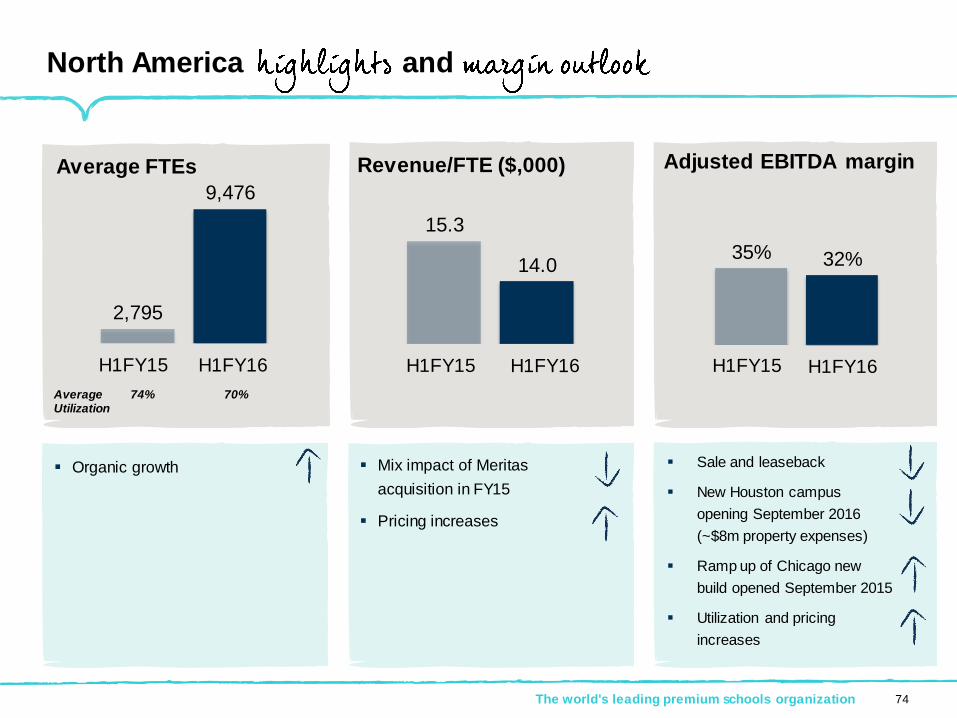
35% 32%
15.3
14.0
2,795
9,476
North America and
The world's leading premium schools organization 74
H1FY15 H1FY16H1FY15 H1FY16
Adjusted EBITDA margin Average FTEs Revenue/FTE ($,000)
H1FY15 H1FY16
Sale and leaseback
New Houston campus
opening September 2016
(~$8m property expenses)
Ramp up of Chicago new
build opened September 2015
Utilization and pricing
increases
Mix impact of Meritas
acquisition in FY15
Pricing increases
Organic growth
Average 74% 70%Utilization

The world's leading premium schools organization
Maximize
and maintain
75
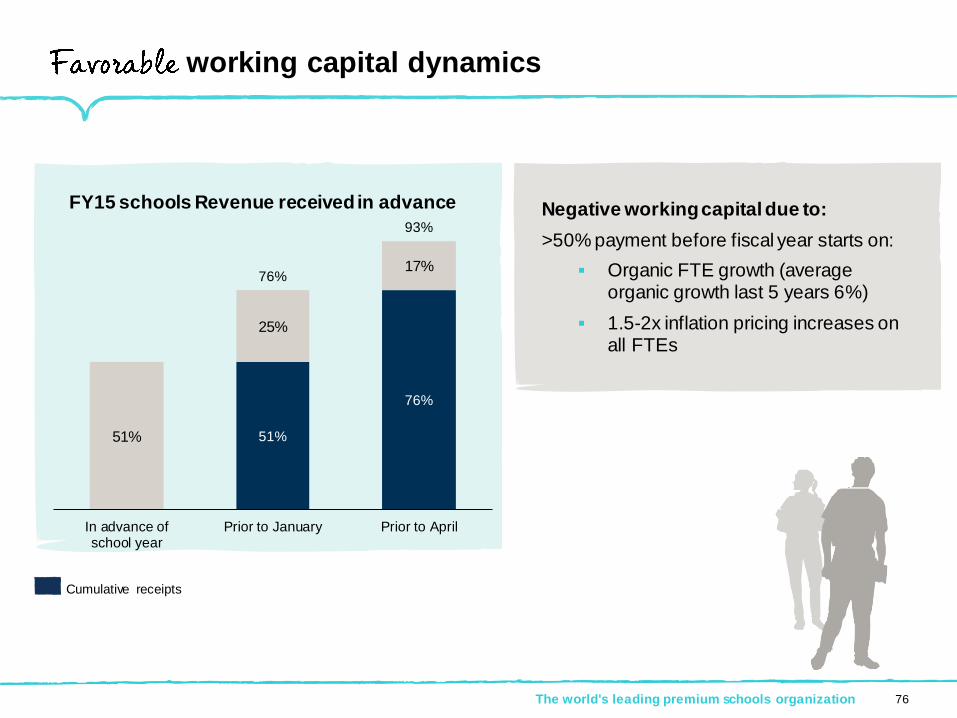
Negative working capital due to:
>50% payment before fiscal year starts on:
Organic FTE growth (average organic growth last 5 years 6%)
1.5-2x inflation pricing increases on all FTEs
The world's leading premium schools organization
working capital dynamics
51%
76%
51%
25%
17%76%
93%
In advance ofschool year
Prior to January Prior to April
76
FY15 schools Revenue received in advance
Cumulative receipts
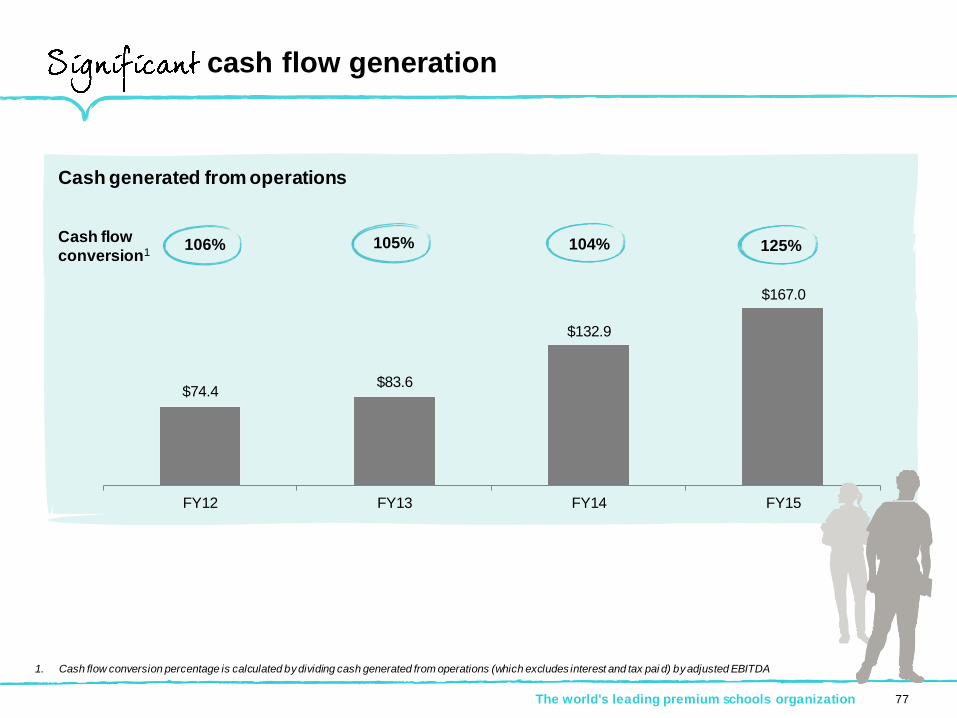
cash flow generation
$74.4$83.6
$132.9
$167.0
FY12 FY13 FY14 FY15
Cash flow
conversion1
1. Cash flow conversion percentage is calculated by dividing cash generated from operations (which excludes interest and tax pai d) by adjusted EBITDA
The world's leading premium schools organization 77
Cash generated from operations
106% 105% 104% 125%
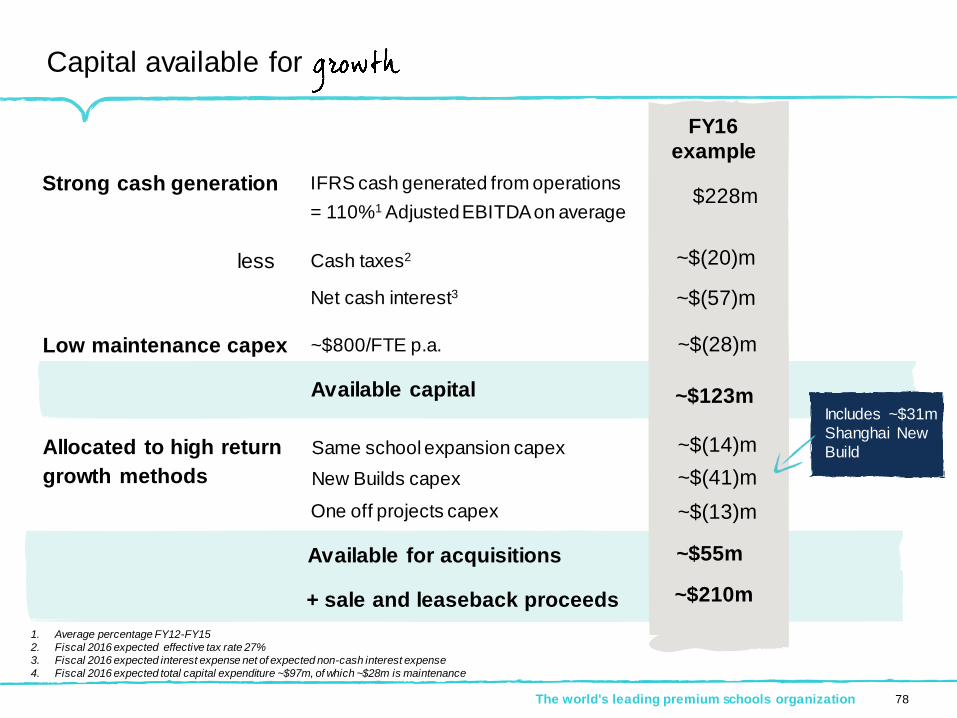
Strong cash generation
Capital available for
78The world's leading premium schools organization
IFRS cash generated from operations
= 110%1 Adjusted EBITDA on average
FY16
example
less Cash taxes2
Net cash interest3
Low maintenance capex ~$800/FTE p.a.
Available capital
Same school expansion capex
New Builds capex
One off projects capex
Allocated to high return
growth methods
~$(14)m
~$(41)m
~$(28)m
~$(57)m
~$(20)m
$228m
~$123m
~$(13)m
~$55m
1. Average percentage FY12-FY15
2. Fiscal 2016 expected effective tax rate 27%
3. Fiscal 2016 expected interest expense net of expected non-cash interest expense
4. Fiscal 2016 expected total capital expenditure ~$97m, of which ~$28m is maintenance
Includes ~$31m
Shanghai New
Build
Available for acquisitions
+ sale and leaseback proceeds ~$210m
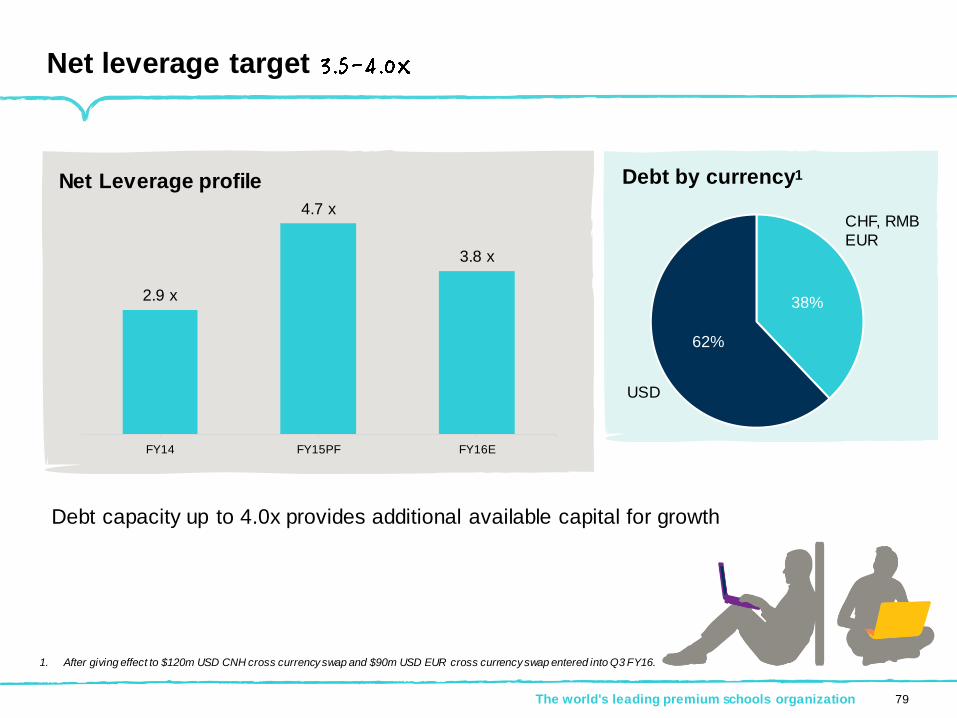
79The world's leading premium schools organization
Net leverage target
2.9 x
4.7 x
3.8 x
FY14 FY15PF FY16E
38%
62%
Net Leverage profile Debt by currency1
USD
CHF, RMB
EUR
Debt capacity up to 4.0x provides additional available capital for growth
1. After giving effect to $120m USD CNH cross currency swap and $90m USD EUR cross currency swap entered into Q3 FY16.
The world's leading premium schools organization
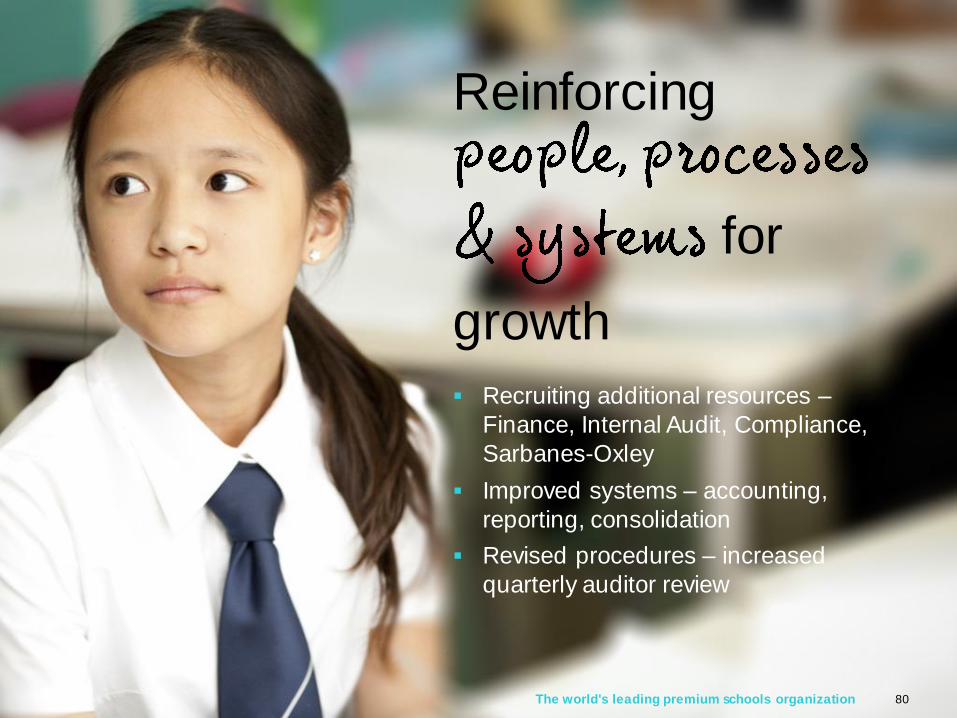
Reinforcing
for
growth
80
Recruiting additional resources –
Finance, Internal Audit, Compliance,
Sarbanes-Oxley
Improved systems – accounting,
reporting, consolidation
Revised procedures – increased
quarterly auditor review

The world's leading premium schools organization 81
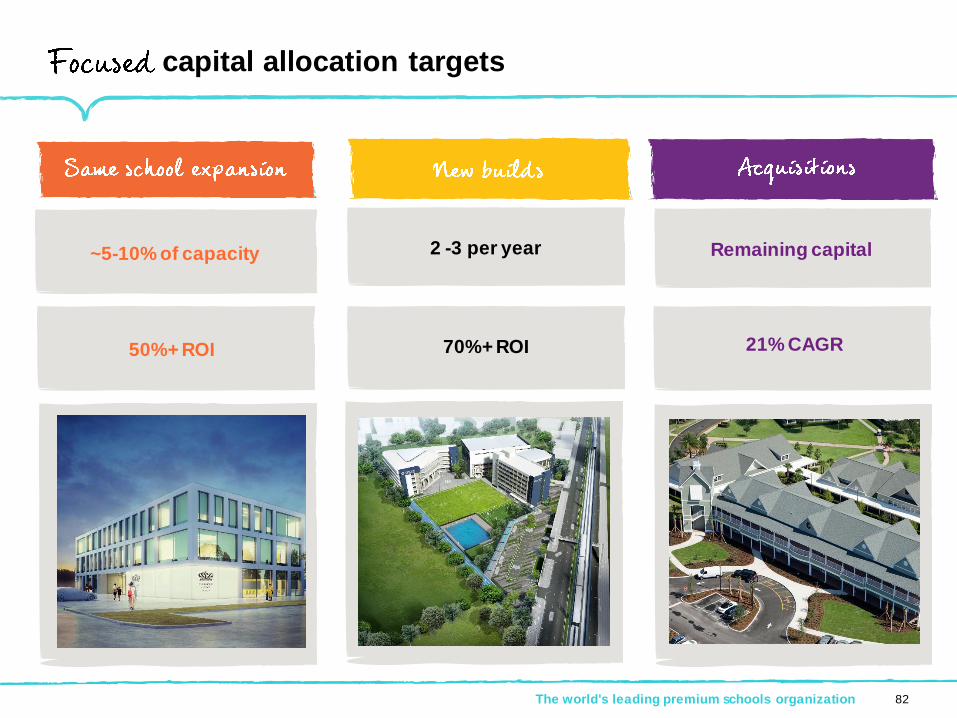
capital allocation targets
~5-10% of capacity 2 -3 per year
The world's leading premium schools organization 82
Remaining capital
50%+ ROI 70%+ ROI 21% CAGR

Favorable
demographics
83The world's leading premium schools organization
Constantly exceptional new opportunities
Unique
Opportunities
Strength of
Nord Anglia
Education
Brand
=+

The world's leading premium schools organization
Building a global brand that everyone
84

The world's leading premium schools organization 85