investment trust discounts and abnormal returns: uk evidence
TRANSCRIPT
Journnl of Business Finance MAccountinE, 21(6), September 1994, 0306 686X
INVESTMENT TRUST DISCOUNTS AND ABNORMAL RETURNS: UK EVIDENCE
A. CHENG, L. COPELAND AND J. O’HANLON*
INTRODUCTION
An investment trust company (ITC) is a UK public limited company, the business of which ‘consists of investing its funds mainly in securities, with the aim of spreading investment risk and giving members of the company the benefit of the results of the management of its funds’.’ The shares of an ITC are traded on the stock exchange and the issued share capital of an ITC may only be varied with the authority of the shareholders. This contrasts with the unit trust, which is a similar investment vehicle with a variable capital, units of which can be created or cancelled by the manager of the trust. In the United States, organisations similar to ITCs and unit trusts are known as ‘closed-end’ funds and ‘open-ended’ funds, these terms reflecting the difference in capital flexibility between the two types of organisation. ITCs are subject to various restrictions, including a prohibition on the retention of more than 15 per cent of the income derived from their investments in shares and securities. UK ITCs are not permitted to distribute realised or unrealised capital gains.
The market capitalisation of ITCs (and closed-end funds) is frequently different from the value of the net assets owned by the companies, this difference usually taking the form of a substantial discount to Net Asset Value. Due to the relative ease with which Net Asset Value can be measured and the belief on the part of the academic finance community that it should not be possible to buy differently packaged bundles of identical assets at different prices, the investment trust discount has become a frequently researched ‘anomaly’. As with other apparent anomalies in finance, academics have sought an economic explanation for it. However, the academic community has yet to come up with a convincing explanation for the existence of discounts, for cross-sectional differences in discounts or for the ways in which discounts change over time. The suspicion persists that the existence and behaviour of discounts is evidence of persistent mis-pricing of assets resulting from inefficiency in the market. A number of published US studies have suggested market inefficiency by showing that abnormal returns could have been earned by following simple trading strategies based on the level or recent movement of the discount.
There is certainly evidence that professional analysts of ITC s believe that high discounts tend to be caused by underpricing of ITC shares. For example,
* The first and third authors are from Lancaster University and the second author is from Stirling University. (Paper received September 1992, revised and accepted December 1992)
0 Basil Blackwell Ltd. 1994, 108 Cowley Road, Oxford OX4 lJF, UK and 238 Main Street, Cambridge, MA 02142, USA. 813
a14 CHENG, COPELAND AND O’HANLON
one of the leading UK brokerage firms in drawing up its list of ‘buy’ recommendations favours ITCs of which the current discount is high relative to other trusts and ITCs of which the discount has recently risen.
In this paper we use UK data to test for evidence that abnormal returns can be earned by holding ITC shares in accordance with a simple discount based strategy. We also test for evidence that the Net Asset Values and Prices of ITCs are cointegrated. The existence of a cointegration relationship would suggest the possibility of using an Error Correction Mechanism to forecast Price from the relationship between Net Asset Value and Price. In the next section we briefly review previous studies. In the third section we compare the abnormal returns earned by high discount ITCs with those earned by low discount ITCs and investigate the autocorrelation patterns in the disaggregated Net Asset Value and Discount components of ITC returns. The final section reports the results of our cointegration tests.
PREVIOUS STUDIES
Malkiel (1977) identified statistical relationships between US closed-end fund discounts and a number of variables which might be expected to be related to discounts: unrealised capital appreciation, capital gains distribution policy and the level of investment in illiquid stocks. However, Malkiel’s rational explanations were only able to explain a small proportion of the discount and he concluded that the remainder of the discount represented a market imperfection in asset pricing. Brickley and Schallheim (1985) documented the earning of positive abnormal returns by the holders of closed-end funds which open-ended or liquidated, and concluded from this that discounts to Net Asset Value were not simply an illusion generated by inaccurate reporting of the Net Asset Values of the funds. They also reported the availability of abnormal returns on the shares of closed-end funds in periods subsequent to that in which the announcement of open-ending or liquidation occurred. The latter finding suggested market inefficiency.
Brauer (1984) reported that market reaction, as evidenced by the observation of positive abnormal return, to the news of a fund’s intention to open-end was rapid and he concluded that the market for closed-end fund shares was generally efficient. He extrapolated from this finding to suggest that the existence of closed-end fund discounts was unlikely to be the result of inefficiency in the market. Brauer also reported that high discount companies were more likely to open-end as were those companies with low management expense ratios. It was suggested that the negative relationship between the probability of open-ending and expense ratio was caused by the fact that the latter is a proxy for managerial resistance to open-ending. Brickley, Manaster and Schallheim (1991) found evidence consistent with the hypothesis that the investment trust discount is partly driven by the fact that, whilst a portfolio of
0 Basil Blackwell Ltd. 1994

INVESTMENT TRUST DISCOUNTS AND ABNORMAL RETURNS 8 15
shares gives to its holder a portfolio of tax timing options, an investment in an ITC merely gives its holder a less valuable option on the portfolio of tax timing options.2
A number of studies have reported results which suggest that it may be possible to predict the returns of ITCs/closed-end funds from the past series of returns and/or discounts. Thompson (1978) tested relatively simple discount based trading rules, which he observed were unlikely to have used all of the information contained in the discounts, and found that positive abnormal returns could have been earned using these rules. Although he acknowledged that his results may have been partly due to empirical estimation problems or to the inapplicability of the asset pricing model used, the findings suggest that high discounts tend to represent some sort of underpricing and that the market is inefficient in that it does not recognise this.
Anderson (1 986) reported evidence that abnormal returns could be earned by the use of filter rules involving the purchase of the shares of closed-end investment companies of which the discounts had widened and the sale of the shares of those companies of which the discounts had narrowed. Brauer (1988) suggested that the profitability of strategies based on the purchase of high discount closed-end fund shares was due to the fact that the level of the discount was one of the variables that could be used to predict a revision in the market’s view of the probability of open-ending. He suggested a trading strategy based on the identification of likely candidates for open-ending which was based on both (i) the size of the discount, which he suggests is positively related to the probability of open-ending, and (ii) the management expense ratio, which as he suggests in his 1984 paper, is likely to be positively related to managerial resistance to open-ending and thus negatively related to the probability of open-ending. Fraser and Power (1991) find evidence of significant autocorrelation in the excess returns of UK ITC shares and suggest that the returns on ITC shares may be predictable.
Draper (1989), in an extensive empirical study of the UK investment trust industry, finds that ITC share prices react rapidly to news of impending takeovers, unitisations (open-endings) and liquidations. This constitutes evidence that the market for ITC shares is efficient. Draper concludes, however, that ‘the size of the discount remains . . . an enigma’.
In summary, a variety of explanations have been suggested for the existence of discounts on ITC/closed-end fund shares. Also, the evidence suggests that the market for ITC (closed-end fund) shares appears efficient in that it tends to react rapidly to news of an impending event which will eliminate the discount by forcing a company’s value to Net Asset Value. However, some studies have suggested the existence of market inefficiency by showing that there appear to exist profitable discount based trading strategies. In the following two sections we investigate the possibility that there may exist patterns in ITC price behaviour such as to suggest that such trading strategies may be available in the UK.
0 Basil Blackwell Ltd. 1994

816 CHENG, COPELAND AND O’HANLON
THE ABNORMAL RETURN PERFORMANCE O F HIGH DISCOUNT PORTFOLIOS: EMPIRICAL EVIDENCE
The Performance of High and Low Discount Investment Trusts
If cross-sectional differences in ITC discounts are explainable by economic fundamentals, one would not expect to observe significant differences between the abnormal returns earned by ITCs which at the beginning of the holding period had relatively high discounts and the abnormal returns earned by ITCs which at the beginning of the holding period had relatively low discounts. If, on the other hand, there is an inefficiency in the market for ITC shares which causes, for example, a high discount to represent some sort of underpricing, one might well observe such a difference. In this section we seek evidence concerning the efficiency of the investment trust market by comparing the mean abnormal return of ITCs with high start of period discounts with that of ITCs with low start of period discounts.
The sample chosen for the study consisted of those ITCs which formed part of the Financial Times All Share Index throughout the period December 1984 to June 1990. This selection criterion was chosen because it made it relatively straightforward for us to collect the data necessary to create 60 month series of dividend adjusted returns and discounts for each ITC. Using this criterion, we obtained a sample of 63 ITCs. The five years of data collected for these 63 ITCs is used in the three tests which we perform and which are described in this and the following section. In order to satisfy ourselves that the exclusion of non-surviving ITCs induced by this criterion did not distort our results, we also carried out our first test on an augmented sample including non-surviving ITCs (see below).
The test period for the study was January 1985 to December 1989 inclusive. For each of the 63 ITCs which met our initial selection criterion, a discount series for the 49 month ends from 31 December 1984 to 31 December 1988 was constructed as follows:
where: DIS,, = the discount for ITC i at the end of yea r j month t ,
L‘,(
PI,,
= the Net Asset Value per share of ITC i at the end of year j
= the Price of ITC i’s shares at the end of y e a r j month t month t (collected from Datastream),
(collected from Datastream).
In Table 1 we provide descriptive statistics of the discounts of the 63 ITCs in our sample. We also provide details of the movement of the Financial Times Investment Trust Total Return Index for our test period. It is interesting to note the tendency of the discount to narrow as the market rises and widen as it falls.
0 Basil Blackwell Ltd. 1994

INVESTMENT TRUST DISCOUNTS AND ABNORMAL RETURNS 81 7
Table 1
Descriptive Statistics
Panel A: Descriptive statistics of discounts on the 63 ITCs in our sample as at each calendar year end from 31 December 1984 to 31 December 1989 inclusive
Year Mean Min.' el2 Med.3 03' Max.5 + VE6 - VE'
1984 0.23 -0.12 0.20 0.24 0.27 0.32 62 1 1985 0.21 0.05 0.19 0.22 0.25 0.27 63 0 1986 0.19 0.09 0.17 0.19 0.22 0.35 63 0 1987 0.23 0.00 0.20 0.24 0.26 0.34 63 0 1988 0.19 -0.02 0.16 0.19 0.23 0.28 62 1 1989 0.14 -0.05 0.11 0.15 0.17 0.32 61 2
Panel B: Summary of levels and annual total returns of the Financial Times Investment
Year Level at Year End Total Return for Year
1984 1397 23 % 1985 1640 17% 1986 2268 38 % 1987 2112 - 7 % 1988 2599 23 % 1989 3749 44 7%
Trust Total Return Index, 1984- 1989
~ _ _ _ _ _ _ - ~
Notes ' Minimum
1st Quartile Median
' 3rd Quartile ' Maximum
Number of ITCs (out of 63) with positive discounts ' Number of ITCs (out of 63) with negative discounts
For each of the ITCs a return series was also constructed as follows:
where: R , =
Pit =
Pijt-l =
D,t =
the return for ITC i for year j month t , as defined above, the Price of ITC i 's shares at the end of the month prior to y e a r j month t , the dividend in respect of which the shares of ITC i went ex- div in year j month t .
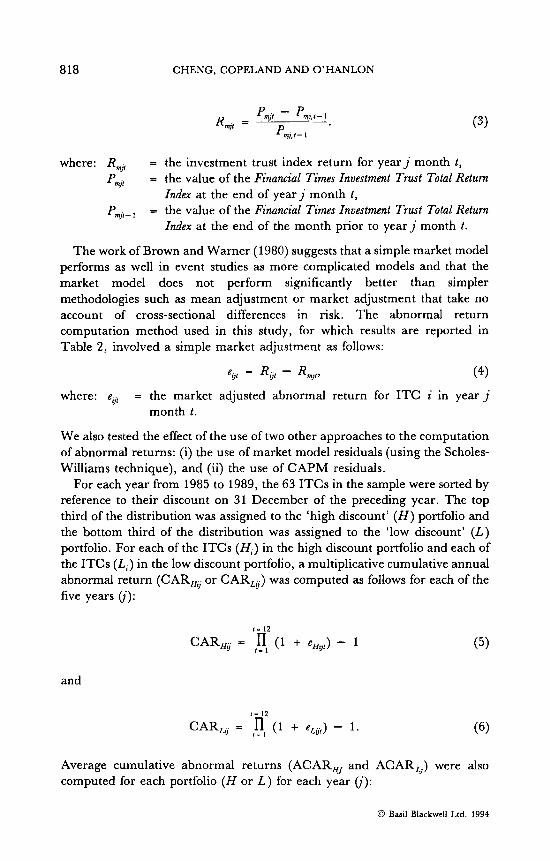
For the purpose of abnormal return computation, the Financial Times Investment Trust Total Return Index3 (which assumes reinvestment of dividends) was used, returns being computed as follows:
0 Basil Blackwell Ltd. 1994
818 CHENG, COPELAND AND O’HANLON
where: R , Pmjf
Pm,-
= the investment trust index return for year j month t , = the value of the Financial Times Investment Trust Total Return
Index at the end of year j month t , = the value of the Financial Times Investment Trust Total Return
Index at the end of the month prior to year j month t .
The work of Brown and Warner (1 980) suggests that a simple market model performs as well in event studies as more complicated models and that the market model does not perform significantly better than simpler methodologies such as mean adjustment or market adjustment that take no account of cross-sectional differences in risk. The abnormal return computation method used in this study, for which results are reported in Table 2, involved a simple market adjustment as follows:
where: e,, = the market adjusted abnormal return for ITC i in year j month t .
We also tested the effect of the use of two other approaches to the computation of abnormal returns: (i) the use of market model residuals (using the Scholes- Williams technique), and (ii) the use of CAPM residuals.
For each year from 1985 to 1989, the 63 ITCs in the sample were sorted by reference to their discount on 31 December of the preceding year. The top third of the distribution was assigned to the ‘high discount’ ( H ) portfolio and the bottom third of the distribution was assigned to the ‘low discount’ ( L ) portfolio. For each of the ITCs ( H , ) in the high discount portfolio and each of the ITCs ( L , ) in the low discount portfolio, a multiplicative cumulative annual abnormal return (CAR, or CAR,,) was computed as follows for each of the five years (j):
1 - 1 2
1 - 1 CAR, = ll (1 + e,,,) - 1 (5)
and
1 - 1 2
CAR,, = 1 - 1 ll (1 + eLi1> - 1. (6)
Average cumulative abnormal returns (ACAR, and ACAR,,) were also computed for each portfolio ( H or L ) for each year (j):
@ Basil Blackwell Ltd. 1994

INVESTMENT TRUST DISCOUNTS AND ABNORMAL RETURNS 819
Table 2
Mean Annual Abnormal Returns for Portfolios Formed on Basis of Beginning of Year Discount (High or Low)
Year Portfolios Formed From Top and Bottom Thirds
of the Discount Distribution
Podfolios Formed From Top and Bottom Sixths
of the Discount Distribution
Hiph Low H - L Hieh Low H - L
1985 T-Stat.
1986 T-Stat.
1987 T-Stat.
1988 T-Stat.
1989 T-Stat.
All T-Stat.
0.0368 2.38'
0.0362 1.59
0,0565 1.84
0.0568 2.52'
-0.0169 -0.55
0.0339 2.99'
-0.1 176 -4.37'
-0.0573 - 1.81
-0.0362 - 1 .oo -0.0596 -2.92'
-0.0671 -1.91
-0.0676 -4.94'
0.1544 4.98'
0.0935 2.39'
0.0927 1.95
0.1164 3.83'
0.0502 1.08
0.1015 5.71'
0.0625 4.43'
0.0811 2.96'
0.0496 1.18
0.0775 2.02
-0.0266 -0.78
0.0488 3.23'
- 0.1842 - 5.01
-0.1469 -6.61'
- 0.033 1 -0.51
-0.0636 -2.90'
-0.1163 -3.53.
- 0.1088 -5.91'
0.2467 6.27.
0.2280 6.47'
0.0827 1.08
0.1411 3.19'
0.0897 1.89
0.1576 6.62'
~~~~ ~~~ ~
Notes: ' The figures in the columns labelled 'High' are the average cumulative abnormal returns earned by
the ITCs of which the discounts fell in the highest third (or sixth) of the distribution of discounts at the start of the yearly holding period commencing 1 January (t-statistics underneath).
* The figures in the columns labelled 'Low' are the average cumulative abnormal returns earned by the ITCs of which the discounts fell in the lowest third (or sixth) of the distribution of discounts at the start of the yearly holding period commencing 1 January (t-statistics underneath).
' The figures in the columns labelled 'H - L' represent the 'High' average less the 'Low' average (t-statistics generated by a test of the null hypothesis of equality of means underneath).
' *: t-statistic significant at the 5 per cent level. The results reported here relate to 63 ITCs which formed part of the Financial Times All Share Zndm throughout the test period. In order to test for the possibility that our sample selection procedure might have induced a survivorship bias, the test was replicated on a sample of 88 ITCs which consist of the 63 ITCs for which results are reported in this Table pZur 25 ITCs which formed part of the Financial Times All Share Index at some time during the period. These include 20 ITCs that did not survive the test period. A summary of the overall results when the test is carried out on the augmented sample is given in the table below which corresponds to the last row of Table 2:
Year Portfolios Formed From Top and Bottom Thirds
of the Discount Distribution
Portfolios Formed From Top and Bottom Sixths
of the Discount Distribution
Hi'h Low H - L H[ch Low H - L
1985-89 0.0215 -0.0739 0.0954 0.0343 -0.1116 0.1459 T-Stat. 1.89 -5.73. 5.55. 1.87 -6.04. 5.61'
0 Basil Blackwell Ltd. 1994

820 CHENG, COPELAND AND O'HANLON
i - N/3
II CAR, i- 1
Nl3 ACAR, =
and
I = N / 3
I - 1 n CARL,
Nl3 ACARLJ =
(7)
where N is the number of ITCs in our sample. (Here, N = 63 for each year).* In addition, five year means of the annual cumulative abnormal returns were computed:
J - 5 t - N / 3
j - 1 i - 1 E E CAR,
5 * (N13) ACAR, =
and
(9)
For each year,j, and for each portfolio, a t-test was carried out in order to test the null hypothesis that the population mean abnormal return was zero, the alternative hypothesis being that it was not zero. T-tests were also carried out to test the null hypothesis that the population mean abnormal return of the high discount ITCs was equal to the population mean of the low discount ITCs, the alternative hypothesis being that the two means were not equal. Similar tests were also carried out on the overall five year means. In order to observe the effect of using a more extreme criterion in forming the discount based portfolios, we replicated the whole process including only the top (bottom) sixth of the discount distribution in the high (low) discount portf01io.~.
The results obtained when December is used as the portfolio formation month are summarised in Table 2 which reports the mean abnormal returns that would have been obtained if one had followed a policy of purchasing the shares of ITCs, selected from our main sample of 63, of which the discounts were relatively high or relatively low at the beginning of each of the five years from 1984 to 1988 inclusive.
0 Basil Blackwell Ltd. 1994

INVESTMENT TRUST DISCOUNTS AND ABNORMAL RETURNS 82 1
As a result of the inclusion only of trusts that formed part of the Financial Times All Share Index throughout the test period, our tests could potentially suffer from a survivorship bias. In order to investigate this possibility, the test on annual abnormal returns for which results are reported in Table 2 was repeated using a subset of trusts which was drawn from the set of all ITCs which had formed part of the Financial Times All Share Index at any time during the period December 1984 to December 1989. The complete set of such trusts consisted of 104 trusts, including the 63 which fulfilled our initial selection criterion plus 41 additional trusts. Of the 41 additional trusts, we were able to obtain net asset value, price and dividend data from a variety of sources6 in respect of 25 of those trusts either from 31 December, 1984 to 31 December, 1989 (in respect of the five of these 25 trusts which survived our test period) or from 3 1 December, 1984 up to the date at which they were merged, liquidated or taken over (in respect of the remaining 20 of these 25 trusts). The test for which results are reported in Table 2 was thus carried out on (i) the 63 trusts which met our initial selection criterion for which results are reported in full in the table, and (ii) 88 trusts, of which 20 (23 per cent) failed to survive the test period. The results of this test on the augmented sample are similar to those of the test on our sample of 63 ITCs and are not reported in detail. They are, however, summarised in note 5 to Table 2. The similarity in the patterns found in our main sample of 63 ITCs and in our augmented sample suggest that the results reported on the basis of our sample of 63 ITCs do not suffer from survivorship bias.
The results reported both in our sample of 63 ITCs and in our augmented sample suggest that positive and negative abnormal returns are not randomly distributed amongst high and low discount portfolios. The high discount portfolio less low discount portfolio mean return is positive for all years whether one forms portfolios based on the top and bottom thirds of the discount distribution or the top and bottom sixths of the distribution. When testing this hypothesis for the whole five-year period, the null hypothesis of equality of means is rejected at a low level of significance on both bases. The average abnormal return difference between the high and low discount ITCs is about 10 or 16 per cent, depending upon whether one forms portfolios based on the extreme thirds or the extreme sixths of the distribution.
It is informative to note that the overall average difference between the abnormal returns of the high and low discount portfolios is greater in magnitude in the case of portfolios formed from the extreme sixths of the distribution than in the case of portfolios formed on the basis of the extreme thirds of the distribution. If high (low) discounts are caused by underpricing (overpricing) this magnification of the effect as one moves to more extreme portfolios is what one would expect to see. A further point to note is the asymmetry between the magnitude of the positive abnormal return for the high discount portfolios and the greater magnitude of the negative abnormal return for the low discount ITCs.
0 Basil Blackwell Ltd. 1994
822 CHENG, COPELAND AND O’HANLON
What do these results suggest about the efficiency of the ITC market? There are, of course, a number of definitions of ‘efficiency’. Fama (1976) defines an efficient market as one which correctly uses all available information. In this context, one notes that the difference between the abnormal return behaviour of beginning of period high discount ITCs and that of beginning of period low discount ITCs suggests that, in pricing ITC shares at the start of the holding periods, the market may not have been correctly using the information available in the relatively easily available discount data. A more popular definition among empirical researchers has been that of Jensen (1978) who regards a market as efficient with respect to a given information set if it is impossible to make economic profits, net of all costs, by trading on that information set.’ In order for us to conclude that the market for ITC shares was ‘Jensen inefficient’, we would have to show that the abnormal returns available were larger than the costs of transacting. It does not appear that this is the case for round trip transactions. Most of the High-Low difference is generated by the negative abnormal returns accruing to the low discount ITCs and the practical constraints on short selling would make it difficult for a round trip transactor to take advantage of this. As far as the high discount ITCs are concerned, attempts to capture the abnormal return by buying and holding portfolios of high discount ITCs for a year would probably generate transaction costs in excess of the abnormal return. Table 2 suggests that the average positive annual abnormal return on high discount ITCs is in the region of three to five per cent. However, the average round trip cost, including both spread and commission, incurred on the purchase and sale of a holding of ITC shares is about four per cent.’ Of course, an investor who is going to transact anyway and who is therefore not going to incur additional transaction costs could profit from use of the information in the discounts. It should also be remembered that our excess returns are measured relative to a benchmark portfolio which is itself costly to buy and sell.
Autocorrelation in the ‘Net Asset Value Return’ and the ‘Discount Return’
Examination of the results (not reported) generated by the use of market model residuals and CAPM residuals to perform the test described in the previous sub- section revealed an interesting phenomenon. The results using CAPM residuals were similar to those reported in Table 2, but those generated by the use of market model residuals were considerably more extreme with the high (low) discount portfolios producing even larger positive (negative) abnormal returns. The contrast between the results generated by the market adjusted returns and the CAPM residuals on the one hand, and the market model residuals on the other hand, is similar to that which one might expect to see if one used these abnormal return computation techniques in a stock market overreaction test of the type carried out by DeBondt and Thaler (1985).
In such a test, the use of market model residuals would tend to overstate the
@ Basil Blackwell Ltd. 1994

INVESTMENT TRUST DISCOUNTS AND ABNORMAL RETURNS 823
difference between the abnormal returns of the prior period ‘losers’ and the prior period ‘winners’ because the prior period ‘losers’ would tend to have negative as, tending to give rise to positive test period abnormal returns, whilst the prior period ‘winners’ would tend to have positive as, tending to give rise to negative test period abnormal returns. The pattern that we observed thus suggests that, in forming portfolios of high (low) discount ITCs, we may in fact be forming portfolios that consist of prior period ‘losers7 (‘winners’). This, together with the findings of Anderson (1986) and the methods used by analysts in forming buy/sell recommendations, suggests the possibility that profitable discount based trading rules may be driven by some sort of mean reversion process in the discount series. To put it another way, perhaps the patterns observed in this study are partly caused by the market’s overreaction in setting the discount.
In order to investigate this matter further, we decomposed our 63 ITCs’ total return series for the period January 1985 to December 1989 inclusive into (a) that part which derives from the change in the value of the net assets held plus dividend (hereafter ‘Net Asset Value return’ (NAVR)), and (b) that part which derives from the change in the discount (hereafter ‘Discount return’ (DR)). This was done by re-expressing equation (2) in terms of Net Asset Values and discounts:
where: DISCv, = Pl,, - K,,, vl,- 1 = the Net Asset Value of ITC i at the month before year j
month t , D I s ~ v , - , = P$-l - Y,f-l.
This decomposes to:
YJl - YJJ-1 + D,, P p 1
NAVR,, =
and
Monthly decomposed return series were created for each ITC. For the three series in respect of each ITC, autocorrelation coefficients of order 1 were computed. Means and medians of the coefficients are reported in Table 3. Here one notes that the average order 1 autocorrelation coefficient is 0.064 in the case of the total return series and 0.136 in the case of the ‘Net Asset Value
0 Basil Blackwell Ltd. 1994

824 CHENG, COPELAND AND O’HANLON
Table 3
Mean and Median Order 1 Autocorrelation Coefficients and Average (and Average of Absolute Values) for Monthly Total Return, ‘Discount Return’
and ‘Net Asset Value Return’ Series for the 63 ITCs in the Sample
Order 1 Autocorrelation Average of Average .f Coefficient Computed Monthly Absolute
From Monthly Returns Returns Value of
Mean Median Monthly-
Returns
Total Return 0.064 0.016 0.017 0.050 Discount
Return -0.234 -0.232 -0.001 0.031 Net Asset
Value Return 0.136 0.145 0.018 0.050
Note: For our sample size, an autocorrelation coefficient is significantly different from zero at the five per cent (ten per cent) level if its absolute value exceeds 0.247 (0.207).
return’ series. Both of these findings are consistent with patterns normally observed in share returns in a developed market. The most striking feature here, however, is the relatively high average negative order 1 autocorrelation in the ‘discount return’ series (-0.234). Of the 63 series, all but five have negative order 1 autocorrelation coefficients and almost half are significantly different from zero at the five per cent level. There is thus a tendency for a discount change above (below) the mean discount change for the ITC to be followed by a discount change below (above) the mean value. The question that now arises is whether the ‘discount returns’ are of significant magnitude to enable these peculiar patterns to generate the portfolio based results reported earlier. An indication of the relative magnitudes of the monthly ‘Net Asset Value return’ and ‘discount return’ is given in Table 3. Here one notes that, although the average ‘discount return’ is very close to zero and is dwarfed by the average ‘Net Asset Value return’, the average of the absolute value of the ‘discount return’ is over half the size of that of the ‘Net Asset Value return’ which suggests that the negative autocorrelation in the ‘discount returns’ could well be driving the results reported earlier.
COINTEGRATION AND THE LONG RUN DISCOUNT
The results already reported suggest the possibility that, for any ITC, the long run discount may be constant, with deviations from this level being essentially temporary phenomena. Of course, in the benchmark efficient market model
0 Basil Blackwell Ltd. 1994

INVESTMENT TRUST DISCOUNTS AND ABNORMAL RETURNS 825
with no transactions costs or barriers to arbitrage, that long run level of the discount ought to be zero - indeed, it is difficult to see why it ought not to be zero at all times. However, at the very least, one would expect fluctuations to be temporary about a constant (apparently non-zero) long run mean level.
In the jargon of time series econometrics, the discount ought to be stationary, which would in turn imply the existence of a cointegration relationship between the Price, on the one hand, and Net Asset Value on the other. In this section, we first examine the evidence on whether Price and NAV are cointegrated and then present estimates of the cointegration relationships.
The relevance of cointegration to the problem at hand is straightforward. In general, if two variables are cointegrated, then despite the fact that neither of the two variables exhibits any affinity for a constant mean value, some (linear) combination of the two does so. Putting this more formally, given two variables, X, and y, each integrated of order 1 (written Z(l)),’ it will normally be the case that any arbitrary linear combination of the two, 2, = Y, - a - OX, will also be Z(1). However, if this linear combination happens to be stationary (written Z(O)), then the two variables are said to be cointegrated.
Moreover, it has been shown (Engle and Granger, 1987) that the existence of a cointegration relationship implies that the short run behaviour of the variables in question can be described by an Error Correction Mechanism (ECM) of the following form:
In the present case, this means that, if we identify X, and Y, with the Net Asset Value ( V , ) and Price (P,) respectively of the ith ITC, where both variables are Z( l), the existence of a cointegration relationship:
P,, = a,’ + b,’V,, + e,, (15)
where e,, is Z(O), would imply a long run link between Price and Net Asset Value given by the values of at’ and b ,’. If a ,‘ and b were found to satisfy the constraints: a,’ = 0 and bl’ = 1, then the long run deviation from Net Asset Value could be said to be zero. The existence of a long run non-zero deviation would be evidenced by a finding either that a,’ # 0 orb ,’ # 1 or both, depending on whether the deviation was additive or multiplicative or both. Since an additive deviation would be both improbable and difficult to interpret, the decision taken here was to estimate the cointegration relationship in log terms:
(16)
where p,, is the natural log of P,, and u,, is the natural log of V,,. In this form, as long as b, = 1, the intercept can be identified with the proportional premium or discount defined in the normal way (equation (1) above).
pt, = a, + b,v,, + Y,, a,, b, constants i = 1 * - * 63
0 Basil Blackwell Ltd. 1994

826 CHENG, COPELAND AND O'HANLON
The ECM has the interpretation of a forecasting equation, allowing future price movements to be predicted from a knowledge of the current discount and, if necessary, the past history of the Price and Net Asset Value. It would take the form:
where the first variable on the right-hand side of equation (17), Y,,-,, is the extent to which, for the ith ITC, the previous period's Price was above its long run level, as determined by its Net Asset Value and its steady state discount. The remaining terms reflect the delays in adjustment of the Price to the disequilibrium carried over from previous periods.
Preliminary tests (results not presented) strongly indicated that, as would be expected, all prices and NAVs were I(1). The first two columns of Table 4 give descriptive statistics for the values of the Phillips-Perron Z ( a ') unit root testdo (see Perron, 1988) on the first differences of the Price and Net Asset Value respectively of the 63 ITCs in the sample." As can be seen from these two columns, in the case of each ITC the test statistic was below the critical value below which the null hypothesis of a unit root (non-stationarity) could be rejected. The evidence is overwhelming that the two series are stationary ( I (0)) in first differences.
The estimation of the coefficients of cointegration regressions is fraught with difficulties, particularly in the case of financial data, where error processes are often characterised by heteroscedasticity and non-normality. In order to remedy this, the Phillips-Hansen fully modified maximum likelihood estimation method was used (see Phillips and Hansen, 1990). Descriptive statistics summarising the output of the 63 cointegration regressions are given in columns 3 to 1 1 of Table 4.
The salient features of the estimates are as follows. First, the average point estimate of b, is greater than unity. In fact, the estimated value is greater than unity in 51 of the 63 cases, in the vast majority of cases significantly so. The average value of the intercept is negative. In fact, in about three-quarters of the cases, the intercept is significantly negative. A chi-square test of the joint hypothesis that the intercept coefficient (a,) = 0 and the slope coefficient (6,) = 1 , for which the results are summarised in column 9 of Table 4, enables us to reject the hypothesis in every case. However, the existence of the cointegration relationship is confirmed by the results of the Phillips-Perron Z ( a ) unit root tests, which confirm the stationarity of the residuals (columns 10 and 1 1 of Table 4).
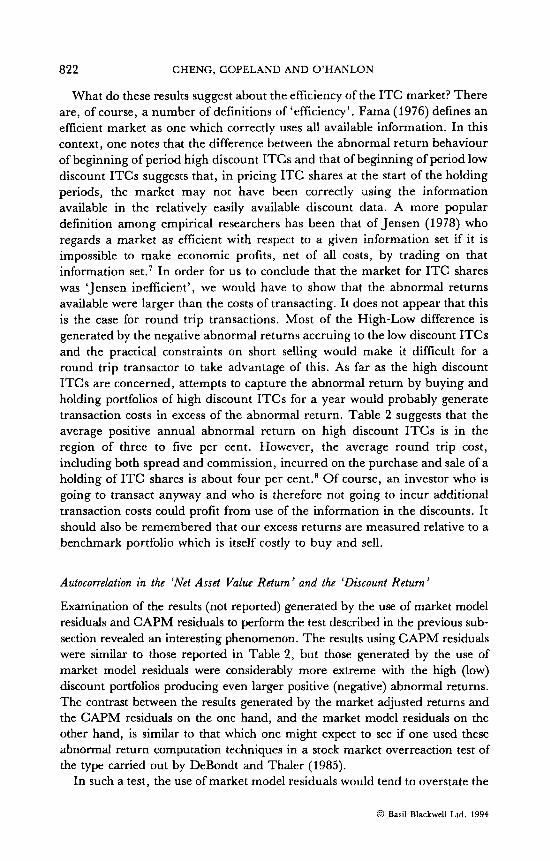
The implications for the typical ITC are illustrated in Figure 1, where the price line is given by the antilog of equation (16):
P,, = A,Vf; A , = e"', constant (18)
@ Basil Blackwell Ltd. 1994

INVESTMENT TRUST DISCOUNTS AND ABNORMAL RETURNS 827
0 Basil Blackwell Ltd. 1994

828 CHENG. COPELAND AND O’HANLON
Figure 1
Relationship Between Price and Net Asset Value for a Typical ITC
P = v
Since bi is typically greater than unity, the line is upward-sloping, with a gradient which increases as Net Asset Value rises. This implies that, over the range of values observed in the current sample, the long run discount tended to fall as Net Asset Value rose, a finding which is broadly consistent with the views of some professional analysts (see, for example, the discussion in Arnaud, 1985) and reflects the patterns discernible in the descriptive statistics reproduced in Table 1.
It should be emphasised that Figure 1 depicts the long run relationship between the variables. For example, when Net Asset Value is V,, the cointegration relationship suggests that, in the absence of further disturbances, the Price will tend towards the level Po with the passage of time, along a path determined by the ECM for the variables. Since Po < V,, this is equivalent to saying that the long run discount will be given by (V, - Po)/ V,.
The significance of finding a cointegration regression is less in the actual values of the coeficients than in the implications for trading opportunities. In view of the well-established result already mentioned that any cointegration relationship implies the existence of an ECM, it follows that the evidence presented in this section is consistent with the presence of unexploited profit opportunities.
0 Basil Blackwell Ltd. 1994
INVESTMENT TRUST DISCOUNTS AND ABNORMAL RETURNS 829
CONCLUSION
Some of the findings of academic studies of the ITC discount have suggested that the discount is not explainable by fundamentals and that the existence of the discount, or the time series and cross-sectional variation in it, may be due in part to inefficiency in the market for ITC shares. Some published US studies have furthered this suspicion by demonstrating the profitability of mechanical discount based trading strategies involving the purchase of high discount closed-end fund shares and the sale of low discount closed-end fund shares. Some brokerage firms seem to believe that such inefficiency exists since they partly base their buyhell recommendations on the level and recent movement of discounts. The evidence reported in the present study suggests that, in the UK, positive (negative) abnormal returns may be earned from holding portfolios of high (low) discount ITC shares. Whilst our results are not strong enough to enable us to infer that positive abnormal returns are available to round trip trading strategies, very substantial returns would be available to a strategy of selling one’s existing holding of low discount ITCs and replacing it by high discount ITCs. The availability of such returns suggests the possibility of market inefficiency. The fact that positive abnormal returns are earned by high discount ITC shares and that negative abnormal returns are earned by low discount ITC shares suggests that there may be (as yet unidentified) fundamental bases for discounts but that the market overreacts in setting discounts at the extremes of the spectrum. The patterns identified in the time series of ‘Net Asset Value returns’ and ‘discount returns’ strengthen this impression. The fact that the Net Asset Value per share and Price of ITC shares seem to be cointegrated points to the possibility that Error Correction Mechanisms can be identified in respect of ITCs and used to forecast price movements.
NOTES
The quotation is of a requirement of the UK Companies Act 1985 concerning a company’s recognition as an ‘investment company’. Though it should be noted that this explanation fails to account for the coexistence of open- and closed-end funds, where the former are equally subject to the tax-timing option penalty. It could be argued that it might be inappropriate to use a n ITC index rather than a general stock market index as a benchmark because the ITC index return may suffer from some sort of systematic depression in comparison with the general stock market index return. In order to ensure that no problem of this sort existed, we compared the average monthly return of the Financial Times All Share Total Return Index with that of the Financial T i m s Investment Trust Total Return Indm for the period 1984 to 1989 inclusive. We found that there was no significant difference between the average monthly return of the general index (1.73 per cent) and that of the ITC index (1.85 per cent) (I-statistic: 0.11). Note, however, that in order to satisfy ourselves that our results were not being distorted by survivorship bias, we also performed this test on an augmented sample containing non- surviving firms. In this case, for which summarised results are presented in Table 2 along with the detailed results of the test on our main sample, the number of companies in the sample varied from year to year.
0 Basil Blackwell Ltd. 1994

830 CHENG. COPELAND AND O’HANLON
In order to test the sensitivity of the results of the test to the choice of portfolio formation month, the whole process was repeated using discounts at 30 June as the portfolio formation bases and the four years 1 July, 1985-30 June, 1986 to 1 July, 1988-30 June, 1989 as the test periods. The results obtained from the use ofJune rather than December as the portfolio formation month are very similar to those obtained when December is used and are not reported. Data was obtained from Datastream (inchdine the ‘dead’ companies database) from ” research literature prepared by SG Warburg Securities, County NatWest WoodMac and the Association of Investment Trust Companies and from the Financial Times. Ball (1989), however, has pointed out that the Jensen definition has certain drawbacks. For example, it is possible to imagine circumstances in which a market is demonstrably deficient in its utilisation of an information set in setting prices but in which transaction costs are so high that it is impossible to trade profitably upon the information set that the market is failing to use. In such a case, the Fama definition would properly categorise the market as inefficient, whereas the Jensen definition would fail to do so. Sources: Q.ali9 of Markets: Companies Book 1991 (London Stock Exchange, 1991) and Directory of World Sfock Exchanges (The Economist Publications, 1988). An I ( d ) series is one that needs to be differenced d times in order for it to achieve stationarity. Phillips-Perron tests are preferred to Dickey-Fuller tests in the present context because of their superior robustness in the face of the likely serial correlation andfor heteroscedasticity of the error processes in the current case. The results reported in this section were obtained using Rootine (Version 1.21) written by Peter Burridge, University of Birmingham, September 1991.
REFERENCES
Anderson, S. (1986), ‘Closed-End Funds versus Market Efficiency’, Journal of Portfolio Management
Arnaud, A.A. (1985), Investment Trusts Explained (2nd ed., Woodhead-Faulkner, 1985). Ball, R. (1989), ‘What Do We Know About Stock Market “Efficiency”?’ in R. Guimaraes,
B. Kingsman and S. Taylor (eds.), A Reappraisal of the EfFciency of Financial Markets (Springer-Verlag, 1989).
Brauer, G.A. (1984), ‘Open-Ending Closed-End Funds’, Journal of Financial Economics, Vol. 13 (1984), pp. 491-507.
~ (1988), ‘Closed-End Fund Shares, Abnormal Returns and the Information Content of Discounts and Premiums’,Journal ofFinance, Vol. 43, No. 1 (1988), pp. 113- 128.
Brickley, J.R., S. Manaster and J.S. Schallheim (1991), ‘The Tax Timing Option and the Discounts on Closed-End Investment Companies’, Journal ofBwiness (1991), pp. 287-312.
__ and J.S. Schallheim (1985), ‘Lifting the Lid on Closed-End Investment Companies: A Case of Abnormal Returns’, Journal of Financial and Quantitative Analysis, Vol. 20, No. 1 (1985), pp. 98-117.
Brown, S . and J . Warner (1980), ‘Measuring Security Price Performance’, Journal Df Financial Economics, Vol. 8 , No. 3 (1980), pp. 205-258.
DeBondt, W.F.M. and R.H. Thaler (1985), ‘Does the Stock Market Over-React?’, Journal of Finance, Vol. 40, No. 3 (1985), pp. 793-805.
Draper, P.R. (1989), The Investment Twst Industry in the UK (Gower, 1989). Engle, R.F. and C.W.J. Granger (1987), ‘Cointegration and Error Correction: Representation,
Fama, E.F. (1976), Foundations of Finance (Basic Books, 1976). Fraser, P. and D.M. Power (1991), ‘Predictability, Trends and Seasonalities: An Empirical
Jensen, M. (1978), ‘Some Anomalous Evidence Regarding Market Efficiency’,Journal ofFinancia1
Malkiel, B.G. (1977), ‘The Valuation of Closed-End Investment Company Shares’, Journal of
(Fall, 1986), pp. 63-65.
Estimation and Testing’, Econometrica, Vol. 55, No. 2 (1987), pp. 251-276.
Analysis of UK Investment Trust Portfolios, 1970- 1990’ (University of Dundee, 1991).
Economics, Vol. 6, Nos 213 (1978), pp. 95- 101.
Finance, Vol. 32, No. 3 (1977), pp. 847-859.
0 Basil Blackwell Ltd. 1994

INVESTMENT TRUST DISCOUNTS AND ABNORMAL RETURNS 83 1
Perron, P. (1988), ‘Trends and Random Walks in Macroeconomic Time Series’, Journal of’
Phillips, P.C.B. and B.E. Hansen (1990), ‘Statistical Inference in Instrumental Variables
Thompson, R. (1978), ‘The Information Content of Discounts and Premiums on Closed-End
Economic Dynamics and Control, Vol. 12 (1988), pp. 297-332.
Regression with Z(1) Processes’, Review of’ Economic StudicS, Vol. 57 (1990), pp. 99- 125.
Fund Shares’, Journal of Financial Economics, Vol. 6, Nos 2/3 (1978), pp. 151- 186.
0 Basil Blackwell Ltd. 1994