investment outlook july 2017.pdf · 2017-07-20 · investment outlook july 2017 1. research ......
TRANSCRIPT
Document meant for Information purpose only and should not be construed as Investment Advice
Investment Outlook
July 2017
1
Research Notes
2
Nimish ShahHead – Investments & Research, SBI Exclusif
Sources: SBI Wealth Management Research, SBI Economics Research Department (ERD), SBICAP Securities, CRISIL Research, RBI, Bloomberg, CMIE, Reuters, World Bank
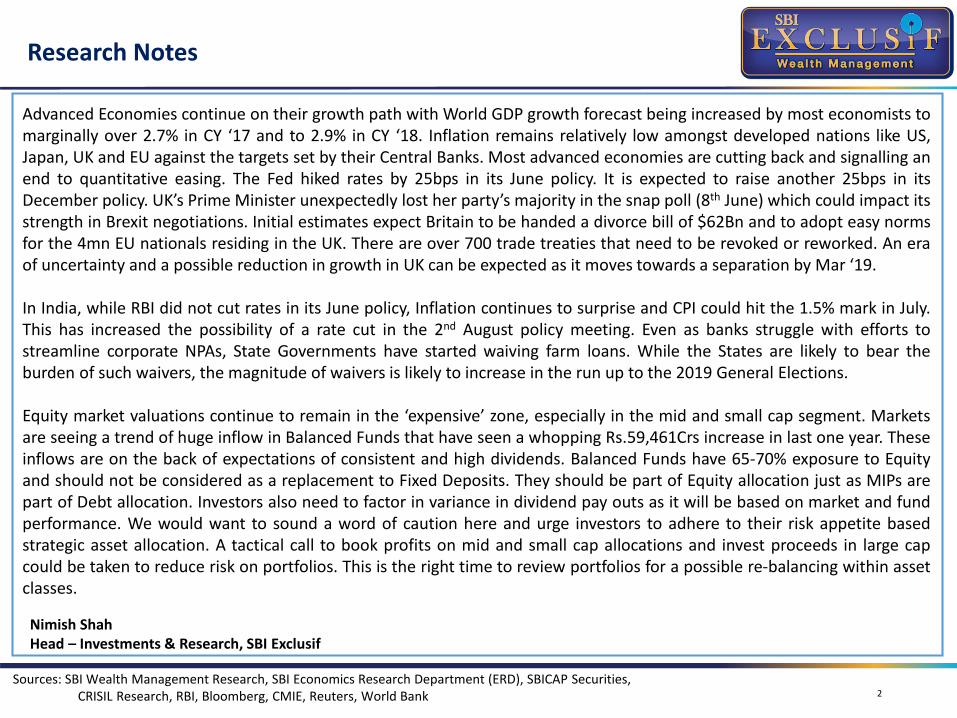
Advanced Economies continue on their growth path with World GDP growth forecast being increased by most economists tomarginally over 2.7% in CY ‘17 and to 2.9% in CY ‘18. Inflation remains relatively low amongst developed nations like US,Japan, UK and EU against the targets set by their Central Banks. Most advanced economies are cutting back and signalling anend to quantitative easing. The Fed hiked rates by 25bps in its June policy. It is expected to raise another 25bps in itsDecember policy. UK’s Prime Minister unexpectedly lost her party’s majority in the snap poll (8th June) which could impact itsstrength in Brexit negotiations. Initial estimates expect Britain to be handed a divorce bill of $62Bn and to adopt easy normsfor the 4mn EU nationals residing in the UK. There are over 700 trade treaties that need to be revoked or reworked. An eraof uncertainty and a possible reduction in growth in UK can be expected as it moves towards a separation by Mar ‘19.
In India, while RBI did not cut rates in its June policy, Inflation continues to surprise and CPI could hit the 1.5% mark in July.This has increased the possibility of a rate cut in the 2nd August policy meeting. Even as banks struggle with efforts tostreamline corporate NPAs, State Governments have started waiving farm loans. While the States are likely to bear theburden of such waivers, the magnitude of waivers is likely to increase in the run up to the 2019 General Elections.
Equity market valuations continue to remain in the ‘expensive’ zone, especially in the mid and small cap segment. Marketsare seeing a trend of huge inflow in Balanced Funds that have seen a whopping Rs.59,461Crs increase in last one year. Theseinflows are on the back of expectations of consistent and high dividends. Balanced Funds have 65-70% exposure to Equityand should not be considered as a replacement to Fixed Deposits. They should be part of Equity allocation just as MIPs arepart of Debt allocation. Investors also need to factor in variance in dividend pay outs as it will be based on market and fundperformance. We would want to sound a word of caution here and urge investors to adhere to their risk appetite basedstrategic asset allocation. A tactical call to book profits on mid and small cap allocations and invest proceeds in large capcould be taken to reduce risk on portfolios. This is the right time to review portfolios for a possible re-balancing within assetclasses.
Market IndicatorsEquities
3
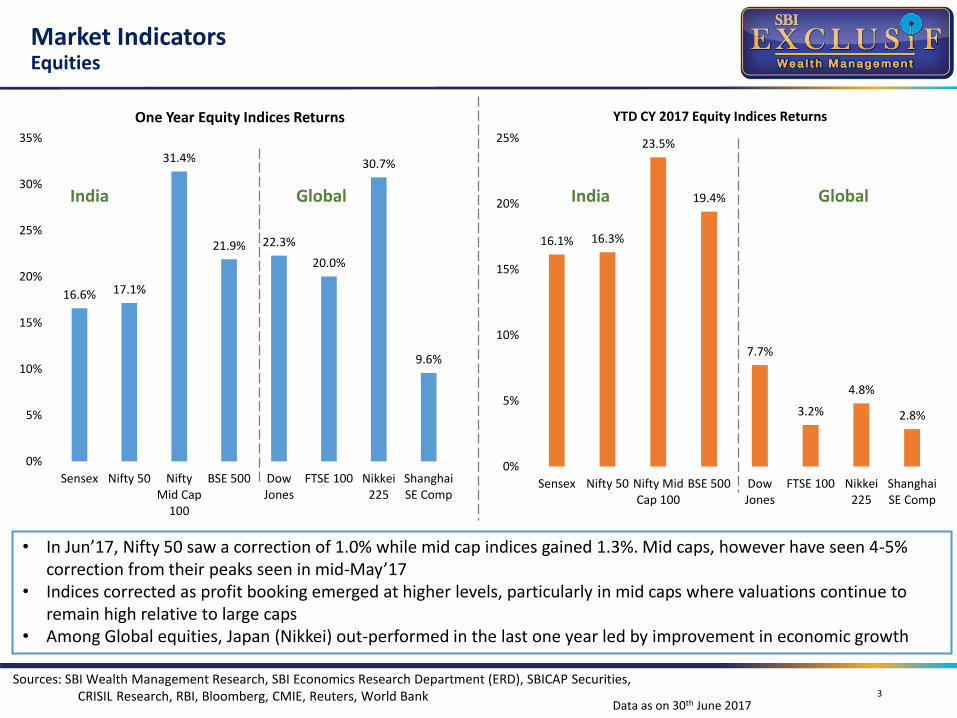
• In Jun’17, Nifty 50 saw a correction of 1.0% while mid cap indices gained 1.3%. Mid caps, however have seen 4-5% correction from their peaks seen in mid-May’17
• Indices corrected as profit booking emerged at higher levels, particularly in mid caps where valuations continue to remain high relative to large caps
• Among Global equities, Japan (Nikkei) out-performed in the last one year led by improvement in economic growth
India Global India Global
Data as on 30th June 2017
Sources: SBI Wealth Management Research, SBI Economics Research Department (ERD), SBICAP Securities, CRISIL Research, RBI, Bloomberg, CMIE, Reuters, World Bank
16.6% 17.1%
31.4%
21.9% 22.3%
20.0%
30.7%
9.6%
0%
5%
10%
15%
20%
25%
30%
35%
Sensex Nifty 50 NiftyMid Cap
100
BSE 500 DowJones
FTSE 100 Nikkei225
ShanghaiSE Comp
One Year Equity Indices Returns
16.1% 16.3%
23.5%
19.4%
7.7%
3.2%
4.8%
2.8%
0%
5%
10%
15%
20%
25%
Sensex Nifty 50 Nifty MidCap 100
BSE 500 DowJones
FTSE 100 Nikkei225
ShanghaiSE Comp
YTD CY 2017 Equity Indices Returns
Market IndicatorsFixed Income, Commodity, Currency
4
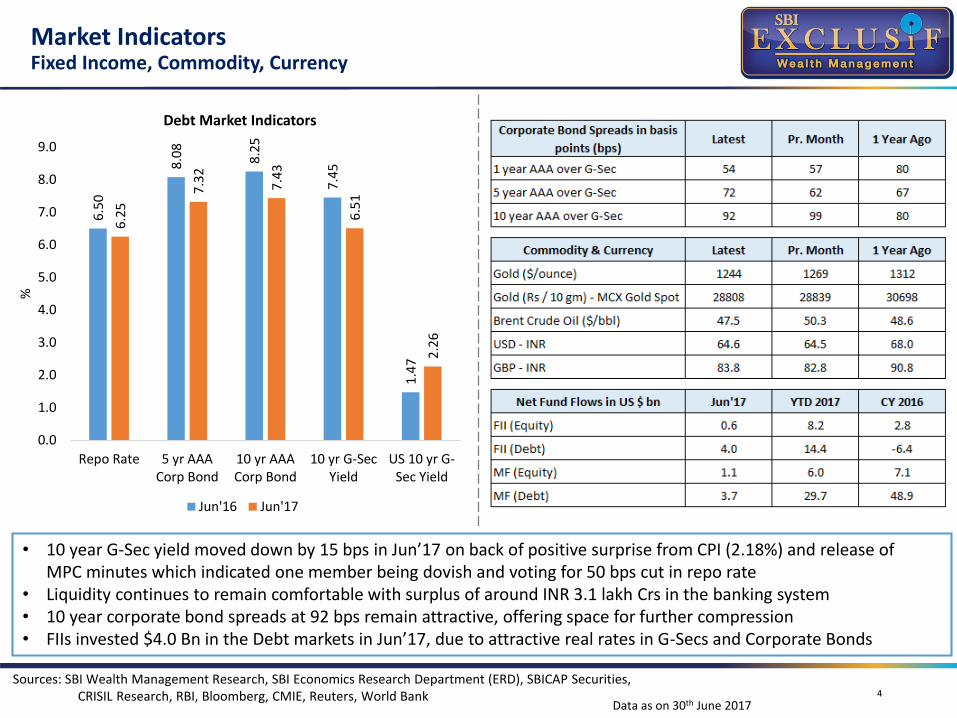
• 10 year G-Sec yield moved down by 15 bps in Jun’17 on back of positive surprise from CPI (2.18%) and release of MPC minutes which indicated one member being dovish and voting for 50 bps cut in repo rate
• Liquidity continues to remain comfortable with surplus of around INR 3.1 lakh Crs in the banking system• 10 year corporate bond spreads at 92 bps remain attractive, offering space for further compression• FIIs invested $4.0 Bn in the Debt markets in Jun’17, due to attractive real rates in G-Secs and Corporate Bonds
Sources: SBI Wealth Management Research, SBI Economics Research Department (ERD), SBICAP Securities, CRISIL Research, RBI, Bloomberg, CMIE, Reuters, World Bank
6.5
0
8.0
8
8.2
5
7.4
5
1.4
7
6.2
5
7.3
2
7.4
3
6.5
1
2.2
60.0
1.0
2.0
3.0
4.0
5.0
6.0
7.0
8.0
9.0
Repo Rate 5 yr AAACorp Bond
10 yr AAACorp Bond
10 yr G-SecYield
US 10 yr G-Sec Yield
%
Debt Market Indicators
Jun'16 Jun'17
Data as on 30th June 2017
Global Economy UpdateGlobal Growth – Fragile Recovery
5
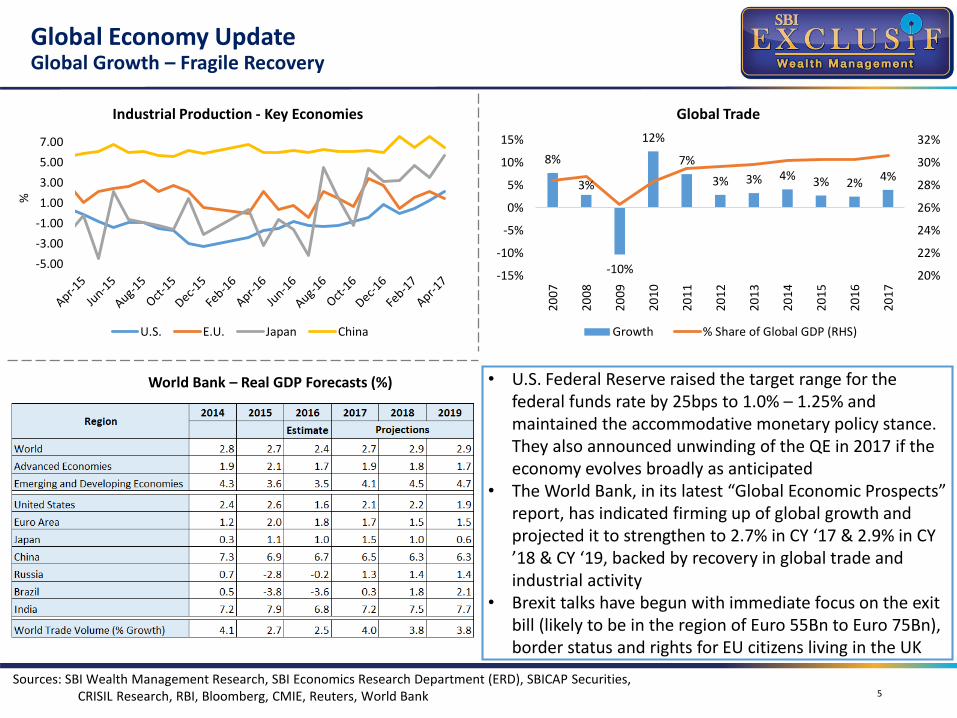
• U.S. Federal Reserve raised the target range for the federal funds rate by 25bps to 1.0% – 1.25% and maintained the accommodative monetary policy stance. They also announced unwinding of the QE in 2017 if the economy evolves broadly as anticipated
• The World Bank, in its latest “Global Economic Prospects” report, has indicated firming up of global growth and projected it to strengthen to 2.7% in CY ‘17 & 2.9% in CY ’18 & CY ‘19, backed by recovery in global trade and industrial activity
• Brexit talks have begun with immediate focus on the exit bill (likely to be in the region of Euro 55Bn to Euro 75Bn), border status and rights for EU citizens living in the UK
World Bank – Real GDP Forecasts (%)
-5.00
-3.00
-1.00
1.00
3.00
5.00
7.00
%
Industrial Production - Key Economies
U.S. E.U. Japan China
Sources: SBI Wealth Management Research, SBI Economics Research Department (ERD), SBICAP Securities, CRISIL Research, RBI, Bloomberg, CMIE, Reuters, World Bank
8%
3%
-10%
12%
7%
3% 3% 4% 3% 2%4%
20%
22%
24%
26%
28%
30%
32%
-15%
-10%
-5%
0%
5%
10%
15%
20
07
20
08
20
09
20
10
20
11
20
12
20
13
20
14
20
15
20
16
20
17
Global Trade
Growth % Share of Global GDP (RHS)
India Economy UpdateGrowth on the Horizon
6
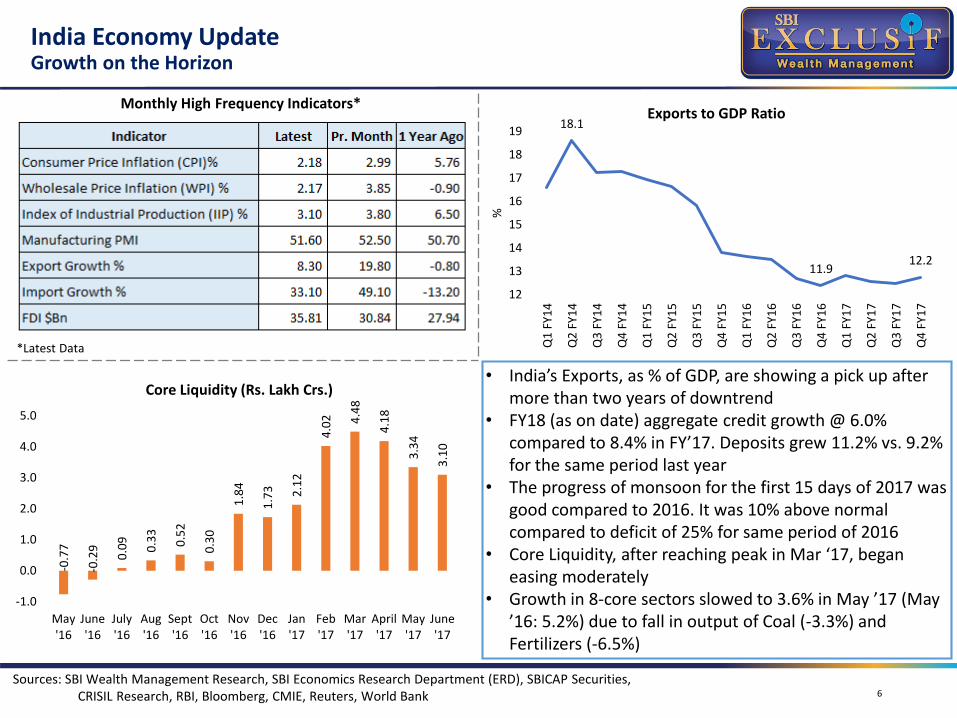
• India’s Exports, as % of GDP, are showing a pick up after more than two years of downtrend
• FY18 (as on date) aggregate credit growth @ 6.0% compared to 8.4% in FY’17. Deposits grew 11.2% vs. 9.2% for the same period last year
• The progress of monsoon for the first 15 days of 2017 was good compared to 2016. It was 10% above normal compared to deficit of 25% for same period of 2016
• Core Liquidity, after reaching peak in Mar ‘17, began easing moderately
• Growth in 8-core sectors slowed to 3.6% in May ’17 (May ’16: 5.2%) due to fall in output of Coal (-3.3%) and Fertilizers (-6.5%)
Monthly High Frequency Indicators*
*Latest Data
18.1
11.912.2
12
13
14
15
16
17
18
19
Q1
FY1
4
Q2
FY1
4
Q3
FY1
4
Q4
FY1
4
Q1
FY1
5
Q2
FY1
5
Q3
FY1
5
Q4
FY1
5
Q1
FY1
6
Q2
FY1
6
Q3
FY1
6
Q4
FY1
6
Q1
FY1
7
Q2
FY1
7
Q3
FY1
7
Q4
FY1
7
%
Exports to GDP Ratio
Sources: SBI Wealth Management Research, SBI Economics Research Department (ERD), SBICAP Securities, CRISIL Research, RBI, Bloomberg, CMIE, Reuters, World Bank
-0.7
7
-0.2
9
0.0
9
0.3
3
0.5
2
0.3
0
1.8
4
1.7
3 2.1
2
4.0
2 4.4
8
4.1
8
3.3
4
3.1
0
-1.0
0.0
1.0
2.0
3.0
4.0
5.0
May'16
June'16
July'16
Aug'16
Sept'16
Oct'16
Nov'16
Dec'16
Jan'17
Feb'17
Mar'17
April'17
May'17
June'17
Core Liquidity (Rs. Lakh Crs.)
India Equities – June 2017Monthly Update
7
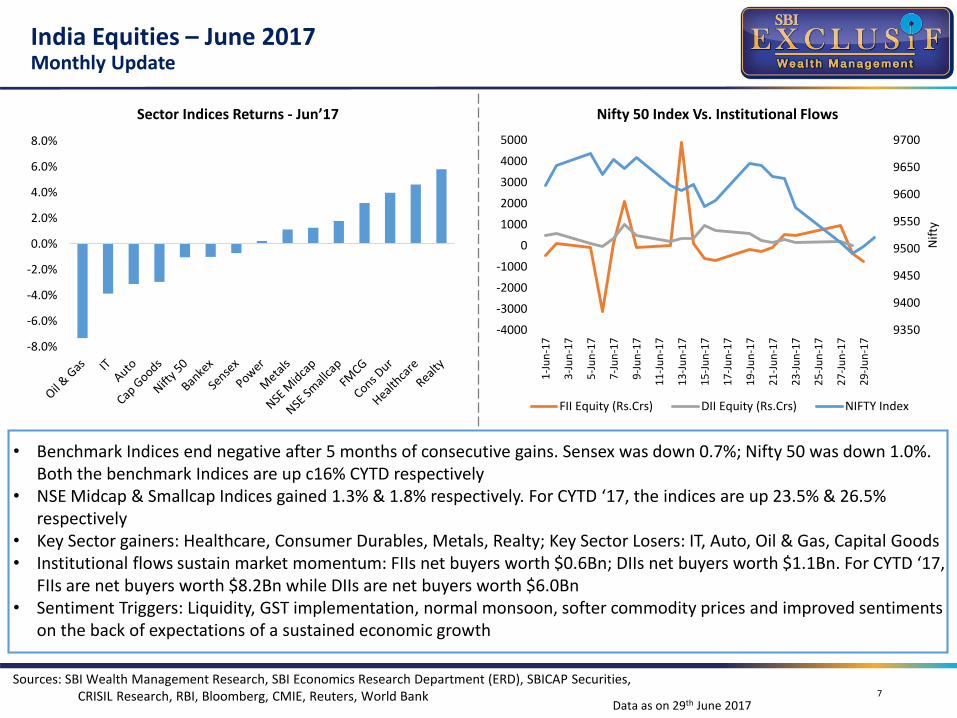
• Benchmark Indices end negative after 5 months of consecutive gains. Sensex was down 0.7%; Nifty 50 was down 1.0%. Both the benchmark Indices are up c16% CYTD respectively
• NSE Midcap & Smallcap Indices gained 1.3% & 1.8% respectively. For CYTD ‘17, the indices are up 23.5% & 26.5% respectively
• Key Sector gainers: Healthcare, Consumer Durables, Metals, Realty; Key Sector Losers: IT, Auto, Oil & Gas, Capital Goods• Institutional flows sustain market momentum: FIIs net buyers worth $0.6Bn; DIIs net buyers worth $1.1Bn. For CYTD ‘17,
FIIs are net buyers worth $8.2Bn while DIIs are net buyers worth $6.0Bn• Sentiment Triggers: Liquidity, GST implementation, normal monsoon, softer commodity prices and improved sentiments
on the back of expectations of a sustained economic growth
Sources: SBI Wealth Management Research, SBI Economics Research Department (ERD), SBICAP Securities, CRISIL Research, RBI, Bloomberg, CMIE, Reuters, World Bank
Data as on 29th June 2017
-8.0%
-6.0%
-4.0%
-2.0%
0.0%
2.0%
4.0%
6.0%
8.0%
Sector Indices Returns - Jun’17
9350
9400
9450
9500
9550
9600
9650
9700
-4000
-3000
-2000
-1000
0
1000
2000
3000
4000
5000
1-J
un
-17
3-J
un
-17
5-J
un
-17
7-J
un
-17
9-J
un
-17
11
-Ju
n-1
7
13
-Ju
n-1
7
15
-Ju
n-1
7
17
-Ju
n-1
7
19
-Ju
n-1
7
21
-Ju
n-1
7
23
-Ju
n-1
7
25
-Ju
n-1
7
27
-Ju
n-1
7
29
-Ju
n-1
7
Nif
ty
Nifty 50 Index Vs. Institutional Flows
FII Equity (Rs.Crs) DII Equity (Rs.Crs) NIFTY Index
India Equities – OutlookMomentum depends on a sustainable Earnings Recovery
8
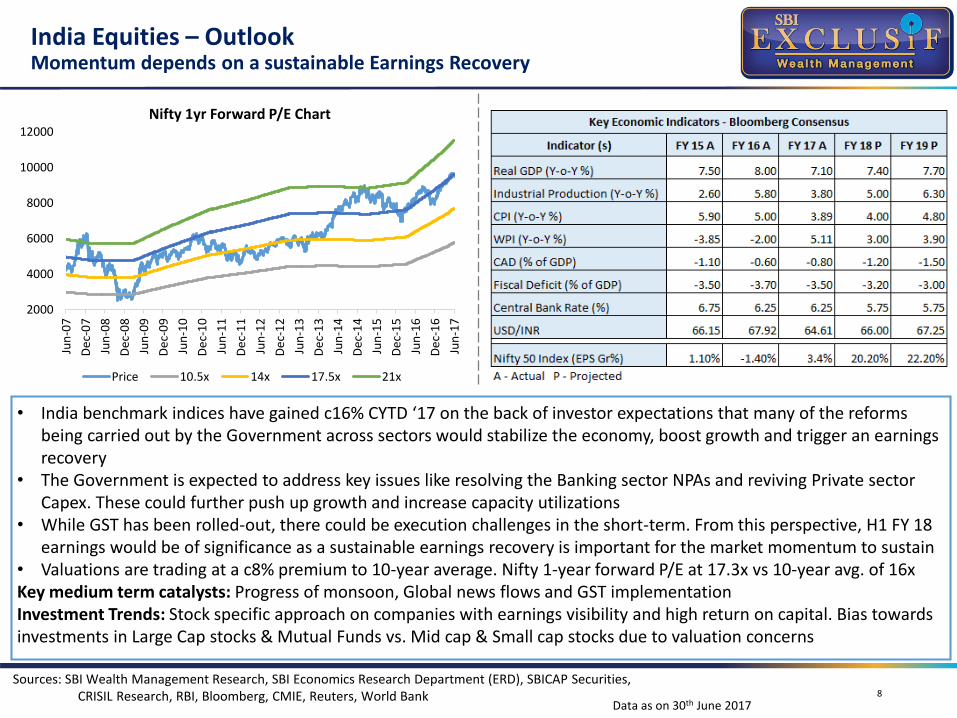
• India benchmark indices have gained c16% CYTD ‘17 on the back of investor expectations that many of the reforms being carried out by the Government across sectors would stabilize the economy, boost growth and trigger an earnings recovery
• The Government is expected to address key issues like resolving the Banking sector NPAs and reviving Private sector Capex. These could further push up growth and increase capacity utilizations
• While GST has been rolled-out, there could be execution challenges in the short-term. From this perspective, H1 FY 18 earnings would be of significance as a sustainable earnings recovery is important for the market momentum to sustain
• Valuations are trading at a c8% premium to 10-year average. Nifty 1-year forward P/E at 17.3x vs 10-year avg. of 16xKey medium term catalysts: Progress of monsoon, Global news flows and GST implementationInvestment Trends: Stock specific approach on companies with earnings visibility and high return on capital. Bias towards investments in Large Cap stocks & Mutual Funds vs. Mid cap & Small cap stocks due to valuation concerns
2000
4000
6000
8000
10000
12000
Jun
-07
De
c-0
7
Jun
-08
De
c-0
8
Jun
-09
De
c-0
9
Jun
-10
De
c-1
0
Jun
-11
De
c-1
1
Jun
-12
De
c-1
2
Jun
-13
De
c-1
3
Jun
-14
De
c-1
4
Jun
-15
De
c-1
5
Jun
-16
De
c-1
6
Jun
-17
Nifty 1yr Forward P/E Chart
Price 10.5x 14x 17.5x 21x
Sources: SBI Wealth Management Research, SBI Economics Research Department (ERD), SBICAP Securities, CRISIL Research, RBI, Bloomberg, CMIE, Reuters, World Bank
Data as on 30th June 2017
India Fixed Income - OutlookInflation to be watched closely, Accrual remains preferred option
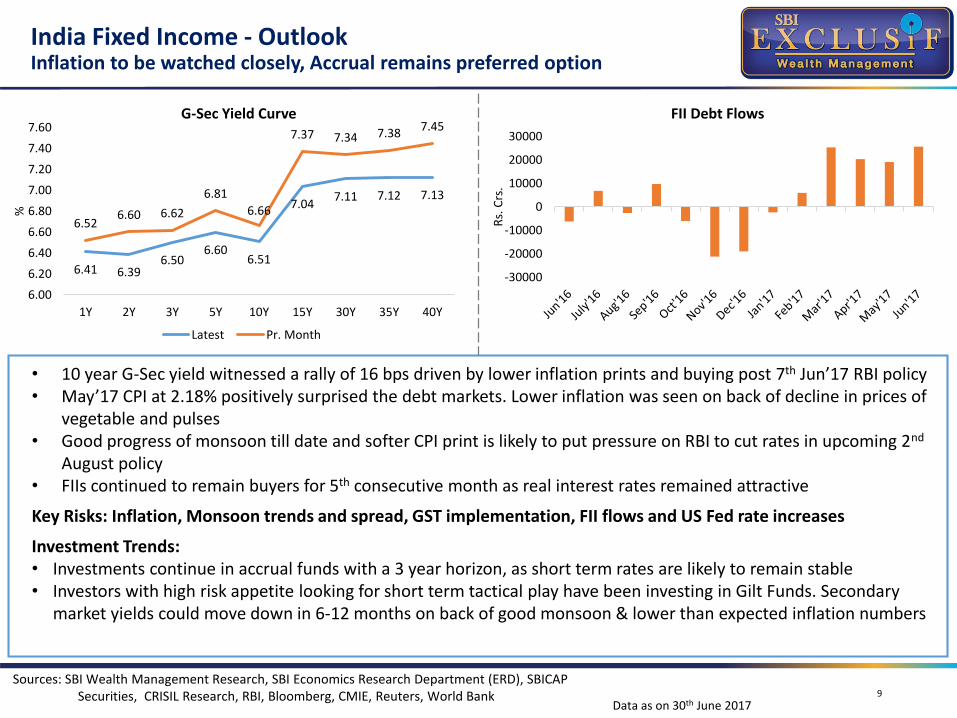
• 10 year G-Sec yield witnessed a rally of 16 bps driven by lower inflation prints and buying post 7th Jun’17 RBI policy• May’17 CPI at 2.18% positively surprised the debt markets. Lower inflation was seen on back of decline in prices of
vegetable and pulses• Good progress of monsoon till date and softer CPI print is likely to put pressure on RBI to cut rates in upcoming 2nd
August policy • FIIs continued to remain buyers for 5th consecutive month as real interest rates remained attractive
Key Risks: Inflation, Monsoon trends and spread, GST implementation, FII flows and US Fed rate increases
Investment Trends:• Investments continue in accrual funds with a 3 year horizon, as short term rates are likely to remain stable• Investors with high risk appetite looking for short term tactical play have been investing in Gilt Funds. Secondary
market yields could move down in 6-12 months on back of good monsoon & lower than expected inflation numbers
9
Sources: SBI Wealth Management Research, SBI Economics Research Department (ERD), SBICAP Securities, CRISIL Research, RBI, Bloomberg, CMIE, Reuters, World Bank
6.41 6.396.50
6.606.51
7.047.11 7.12 7.13
6.526.60 6.62
6.81
6.66
7.37 7.34 7.387.45
6.00
6.20
6.40
6.60
6.80
7.00
7.20
7.40
7.60
1Y 2Y 3Y 5Y 10Y 15Y 30Y 35Y 40Y
%
G-Sec Yield Curve
Latest Pr. Month
-30000
-20000
-10000
0
10000
20000
30000
Rs.
Crs
.
FII Debt Flows
Data as on 30th June 2017
Investment Trends – Mutual FundsAccrual Funds
10
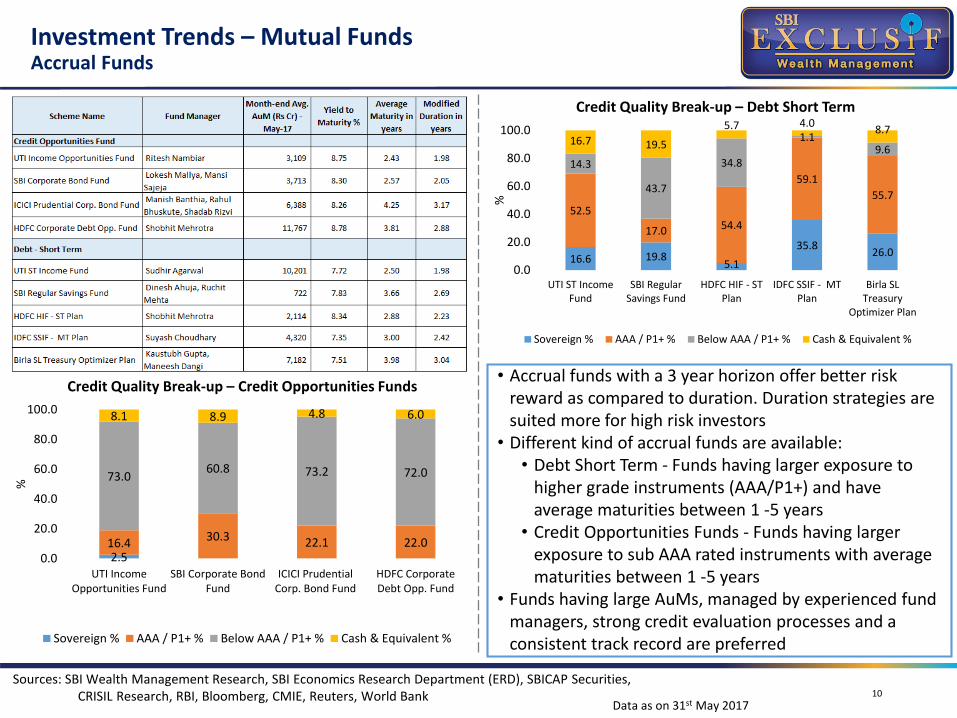
• Accrual funds with a 3 year horizon offer better risk reward as compared to duration. Duration strategies are suited more for high risk investors
• Different kind of accrual funds are available:• Debt Short Term - Funds having larger exposure to
higher grade instruments (AAA/P1+) and have average maturities between 1 -5 years
• Credit Opportunities Funds - Funds having larger exposure to sub AAA rated instruments with average maturities between 1 -5 years
• Funds having large AuMs, managed by experienced fund managers, strong credit evaluation processes and a consistent track record are preferred
2.516.4
30.3 22.1 22.0
73.060.8 73.2 72.0
8.1 8.9 4.8 6.0
0.0
20.0
40.0
60.0
80.0
100.0
UTI IncomeOpportunities Fund
SBI Corporate BondFund
ICICI PrudentialCorp. Bond Fund
HDFC CorporateDebt Opp. Fund
%
Credit Quality Break-up – Credit Opportunities Funds
Sovereign % AAA / P1+ % Below AAA / P1+ % Cash & Equivalent %
16.6 19.85.1
35.826.0
52.5
17.0 54.4
59.1
55.7
14.3
43.7
34.8
1.19.6
16.7 19.5
5.7 4.08.7
0.0
20.0
40.0
60.0
80.0
100.0
UTI ST IncomeFund
SBI RegularSavings Fund
HDFC HIF - STPlan
IDFC SSIF - MTPlan
Birla SLTreasury
Optimizer Plan
%
Credit Quality Break-up – Debt Short Term
Sovereign % AAA / P1+ % Below AAA / P1+ % Cash & Equivalent %
Sources: SBI Wealth Management Research, SBI Economics Research Department (ERD), SBICAP Securities, CRISIL Research, RBI, Bloomberg, CMIE, Reuters, World Bank
Data as on 31st May 2017
Investment Trends – Mutual FundsSIP – Simple & Consistent Tool for Wealth Creation
11
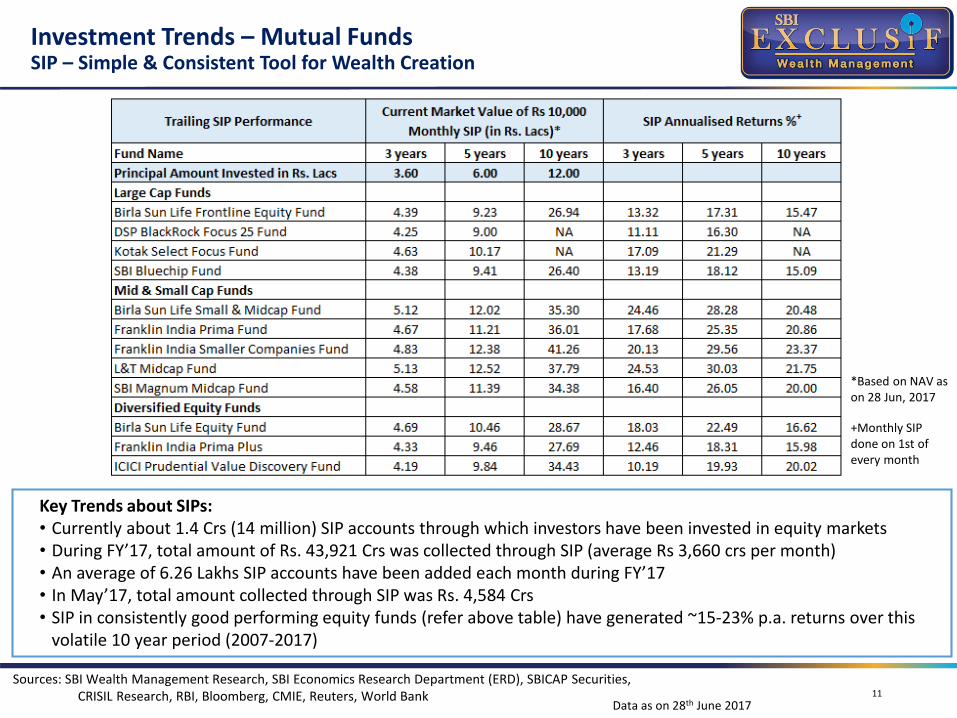
Key Trends about SIPs:• Currently about 1.4 Crs (14 million) SIP accounts through which investors have been invested in equity markets• During FY’17, total amount of Rs. 43,921 Crs was collected through SIP (average Rs 3,660 crs per month)• An average of 6.26 Lakhs SIP accounts have been added each month during FY’17• In May’17, total amount collected through SIP was Rs. 4,584 Crs• SIP in consistently good performing equity funds (refer above table) have generated ~15-23% p.a. returns over this
volatile 10 year period (2007-2017)
*Based on NAV as on 28 Jun, 2017
+Monthly SIP done on 1st of every month
Sources: SBI Wealth Management Research, SBI Economics Research Department (ERD), SBICAP Securities, CRISIL Research, RBI, Bloomberg, CMIE, Reuters, World Bank
Data as on 28th June 2017
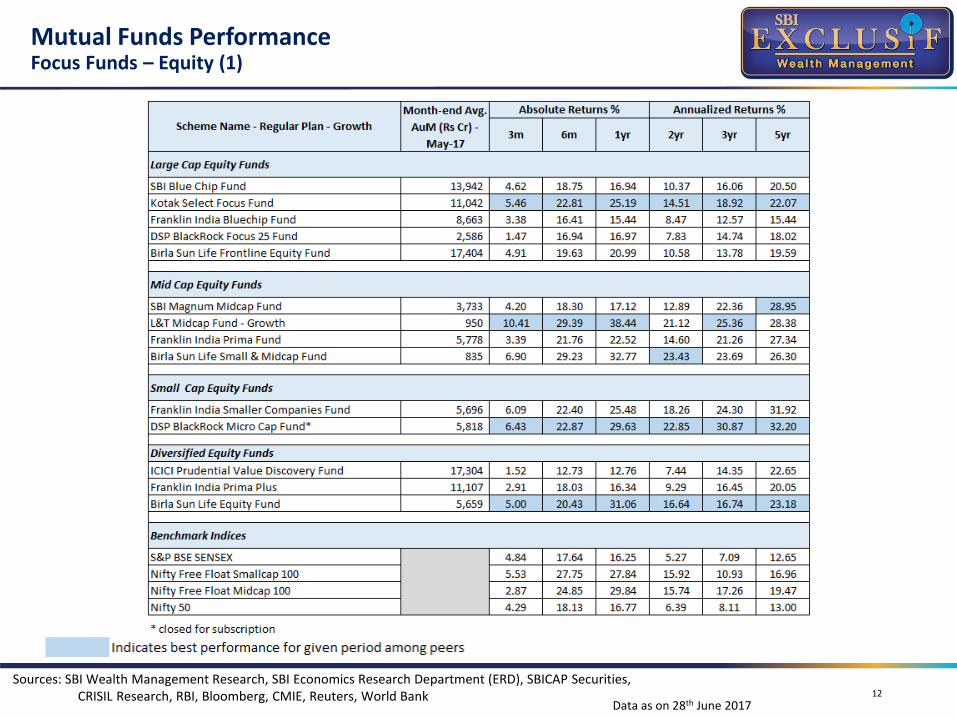
Mutual Funds PerformanceFocus Funds – Equity (1)
12
Sources: SBI Wealth Management Research, SBI Economics Research Department (ERD), SBICAP Securities, CRISIL Research, RBI, Bloomberg, CMIE, Reuters, World Bank
Data as on 28th June 2017
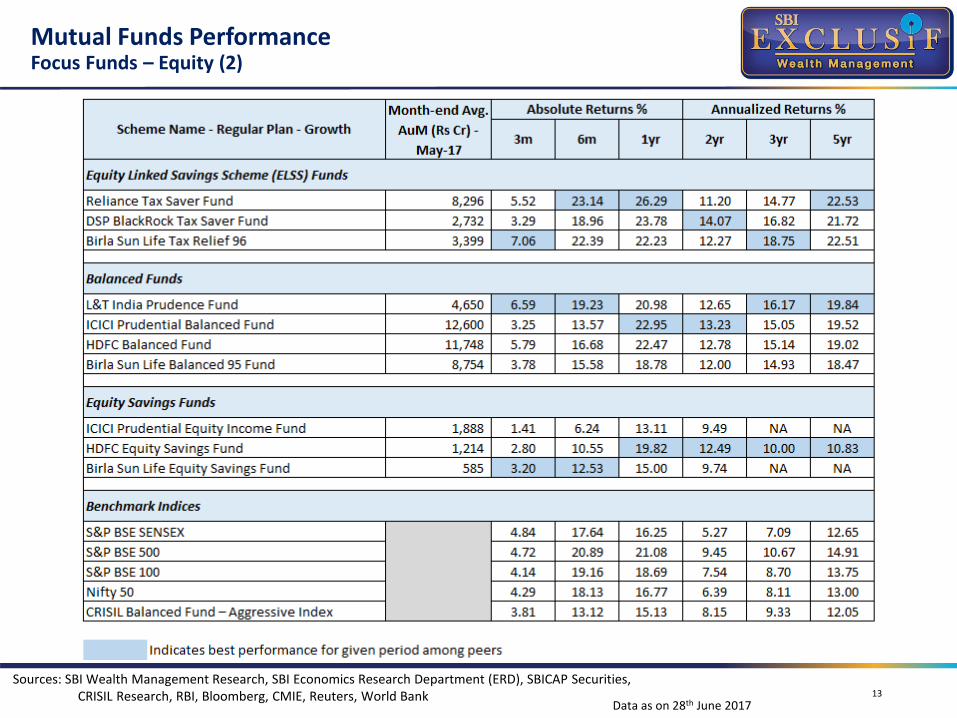
Mutual Funds PerformanceFocus Funds – Equity (2)
13
Sources: SBI Wealth Management Research, SBI Economics Research Department (ERD), SBICAP Securities, CRISIL Research, RBI, Bloomberg, CMIE, Reuters, World Bank
Data as on 28th June 2017
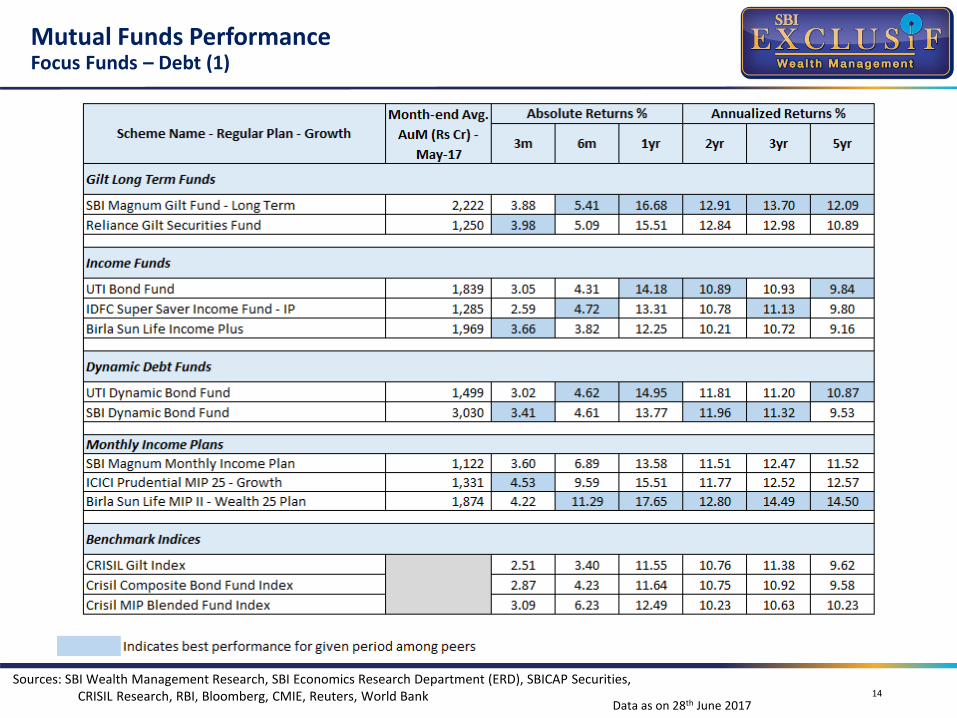
Mutual Funds PerformanceFocus Funds – Debt (1)
14
Sources: SBI Wealth Management Research, SBI Economics Research Department (ERD), SBICAP Securities, CRISIL Research, RBI, Bloomberg, CMIE, Reuters, World Bank
Data as on 28th June 2017
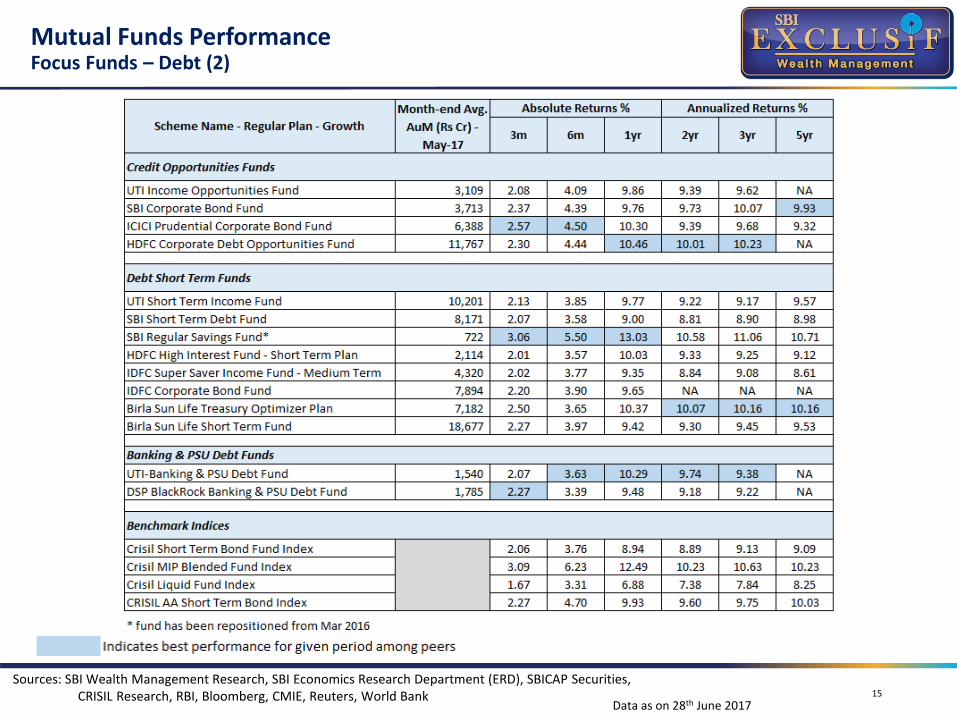
Mutual Funds PerformanceFocus Funds – Debt (2)
15
Sources: SBI Wealth Management Research, SBI Economics Research Department (ERD), SBICAP Securities, CRISIL Research, RBI, Bloomberg, CMIE, Reuters, World Bank
Data as on 28th June 2017
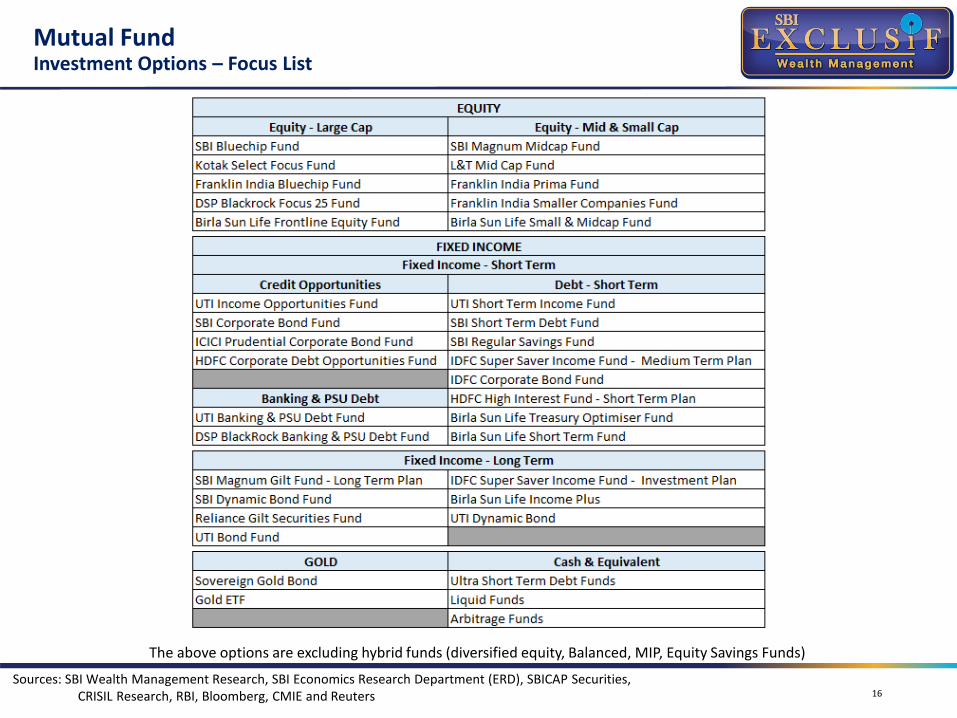
Mutual FundInvestment Options – Focus List
16
The above options are excluding hybrid funds (diversified equity, Balanced, MIP, Equity Savings Funds)
Sources: SBI Wealth Management Research, SBI Economics Research Department (ERD), SBICAP Securities, CRISIL Research, RBI, Bloomberg, CMIE and Reuters
15%
30%
50% 50%10%
10%
15%25%
50%
20%
10%
30%
25%20%
15%25%
20%
15%
5% 5%5%
5%5%
5%15%
20%
VeryConservative
Conservative Moderate Aggressive VeryAggressive
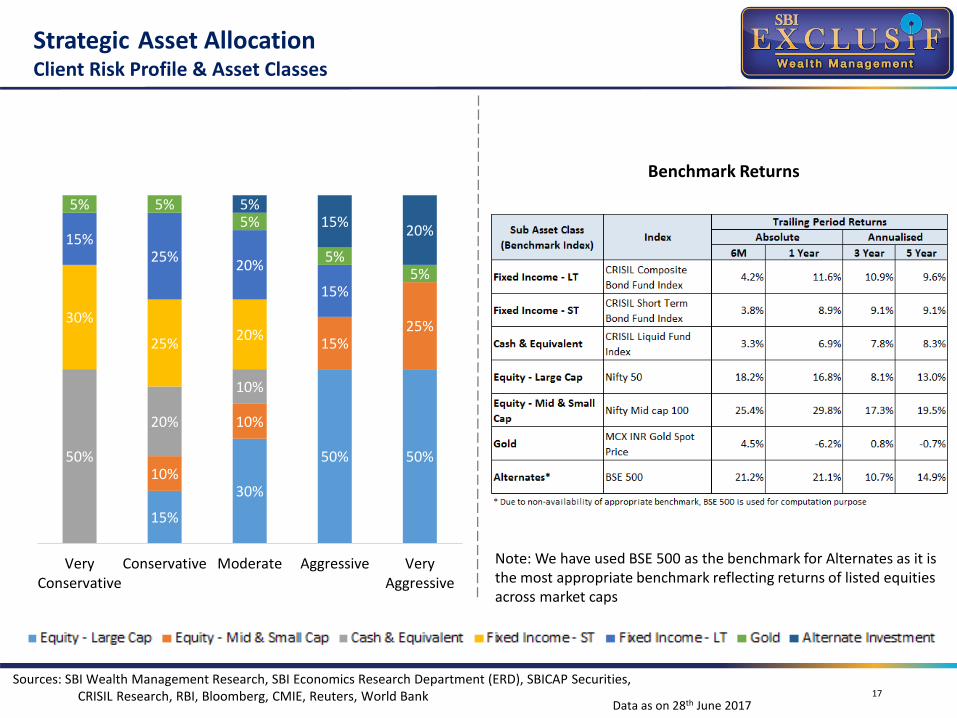
Strategic Asset AllocationClient Risk Profile & Asset Classes
17
Benchmark Returns
Note: We have used BSE 500 as the benchmark for Alternates as it is the most appropriate benchmark reflecting returns of listed equities across market caps
Sources: SBI Wealth Management Research, SBI Economics Research Department (ERD), SBICAP Securities, CRISIL Research, RBI, Bloomberg, CMIE, Reuters, World Bank
Data as on 28th June 2017
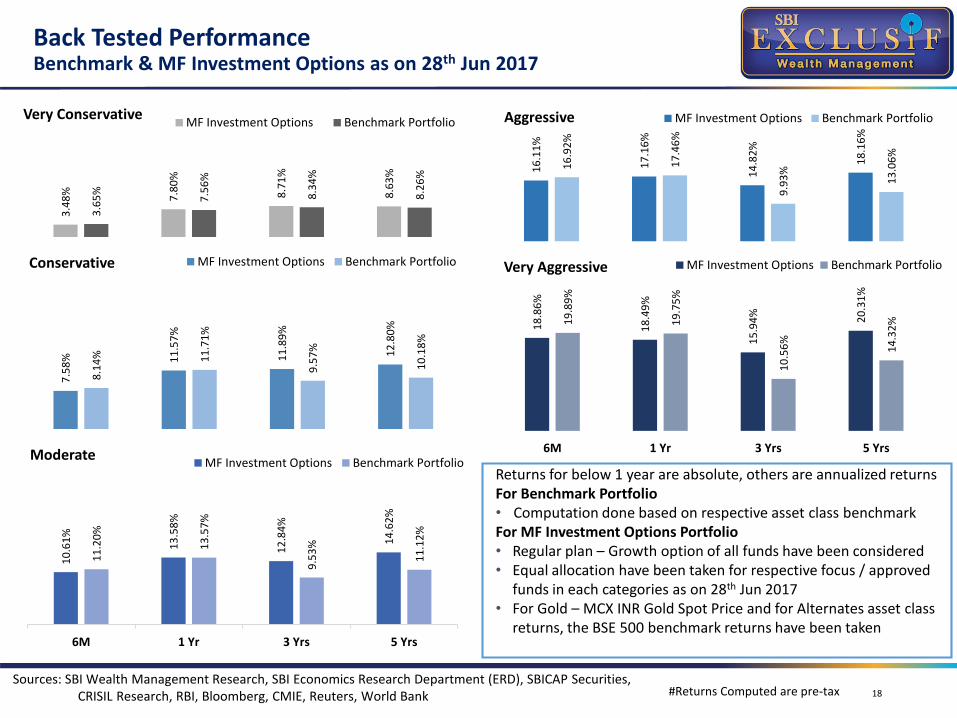
Back Tested Performance Benchmark & MF Investment Options as on 28th Jun 2017
18#Returns Computed are pre-tax
Returns for below 1 year are absolute, others are annualized returnsFor Benchmark Portfolio• Computation done based on respective asset class benchmarkFor MF Investment Options Portfolio• Regular plan – Growth option of all funds have been considered• Equal allocation have been taken for respective focus / approved
funds in each categories as on 28th Jun 2017• For Gold – MCX INR Gold Spot Price and for Alternates asset class
returns, the BSE 500 benchmark returns have been taken
3.4
8% 7.8
0%
8.7
1%
8.6
3%
3.6
5%
7.5
6%
8.3
4%
8.2
6%
Very ConservativeMF Investment Options Benchmark Portfolio
7.5
8% 11
.57
%
11
.89
%
12
.80
%
8.1
4% 11
.71
%
9.5
7%
10
.18
%
Conservative MF Investment Options Benchmark Portfolio
10
.61
%
13
.58
%
12
.84
%
14
.62
%
11
.20
%
13
.57
%
9.5
3%
11
.12
%
6M 1 Yr 3 Yrs 5 Yrs
ModerateMF Investment Options Benchmark Portfolio
16
.11
%
17
.16
%
14
.82
%
18
.16
%
16
.92
%
17
.46
%
9.9
3%
13
.06
%
Aggressive MF Investment Options Benchmark Portfolio
18
.86
%
18
.49
%
15
.94
% 20
.31
%
19
.89
%
19
.75
%
10
.56
%
14
.32
%
6M 1 Yr 3 Yrs 5 Yrs
Very Aggressive MF Investment Options Benchmark Portfolio
Sources: SBI Wealth Management Research, SBI Economics Research Department (ERD), SBICAP Securities, CRISIL Research, RBI, Bloomberg, CMIE, Reuters, World Bank
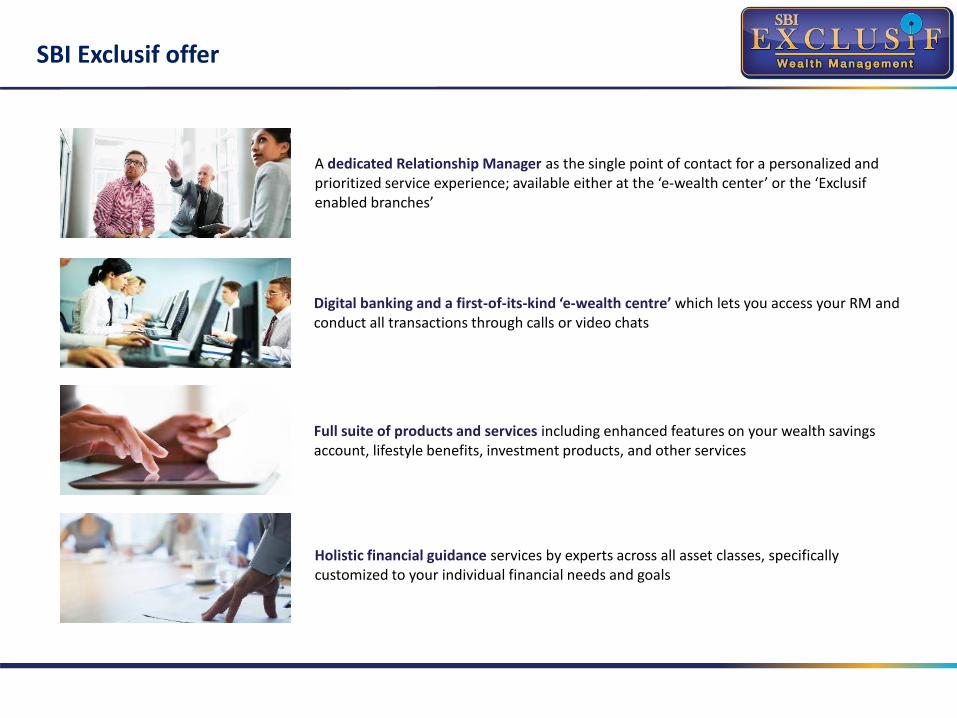
SBI Exclusif offer
A dedicated Relationship Manager as the single point of contact for a personalized and prioritized service experience; available either at the ‘e-wealth center’ or the ‘Exclusif enabled branches’
Digital banking and a first-of-its-kind ‘e-wealth centre’ which lets you access your RM and conduct all transactions through calls or video chats
Full suite of products and services including enhanced features on your wealth savings account, lifestyle benefits, investment products, and other services
Holistic financial guidance services by experts across all asset classes, specifically customized to your individual financial needs and goals
Single point of contact
Your SBI Exclusif team includes:
▪A dedicated RM as your sole point of contact with the bank and to provide you with any sort of financial and business assistance at any time
▪This RM will be available to you at the ‘Exclusif enabled branch’ or on call/chat at the ‘e-wealth centre’, as you choose
▪The RM is backed by a team of experts that includes financial planning and investment counsellors with specialized and extensive experience in various investment products
▪The program also lets you access best-in-class firms for online will drafting and other services, such as legacy and taxation planning
▪Should you find it difficult to reach us at our branch, our executives will be available for hassle-free pickup and delivery of documents for your convenience
Dedicated Relationship model
21
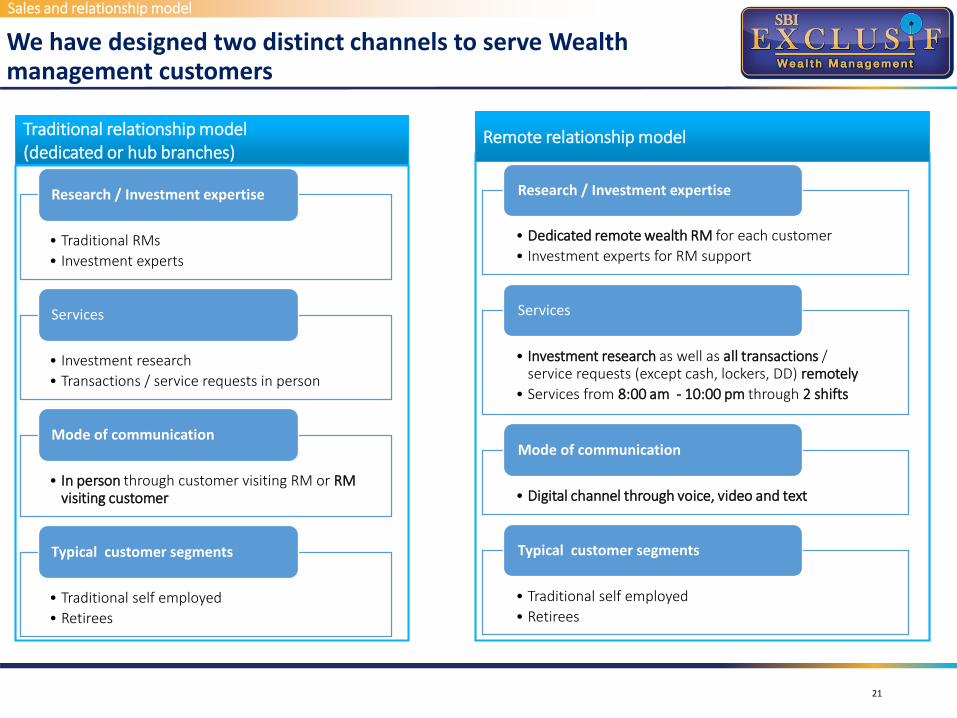
We have designed two distinct channels to serve Wealthmanagement customers
Remote relationship modelTraditional relationship model (dedicated or hub branches)
Sales and relationship model
• Traditional RMs
• Investment experts
Research / Investment expertise
• Investment research
• Transactions / service requests in person
Services
• In person through customer visiting RM or RM visiting customer
Mode of communication
• Traditional self employed
• Retirees
Typical customer segments
• Dedicated remote wealth RM for each customer
• Investment experts for RM support
Research / Investment expertise
• Investment research as well as all transactions / service requests (except cash, lockers, DD) remotely
• Services from 8:00 am - 10:00 pm through 2 shifts
Services
• Digital channel through voice, video and text
Mode of communication
• Traditional self employed
• Retirees
Typical customer segments
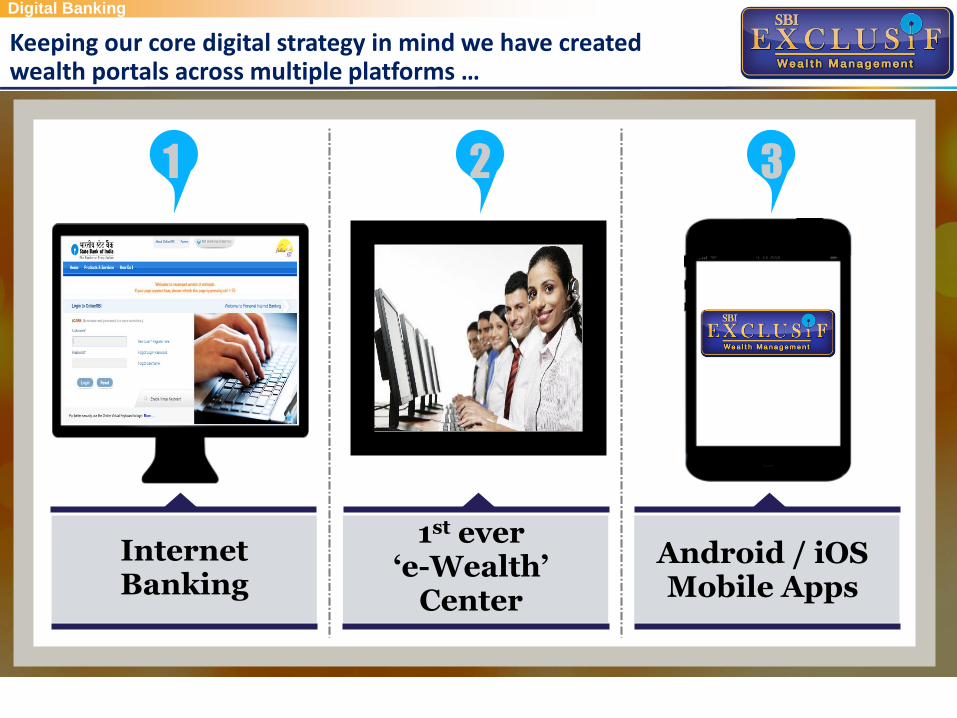
Keeping our core digital strategy in mind we have created wealth portals across multiple platforms …
Internet Banking
1 2 3
1st ever‘e-Wealth’
Center
Android / iOS Mobile Apps
Digital Banking
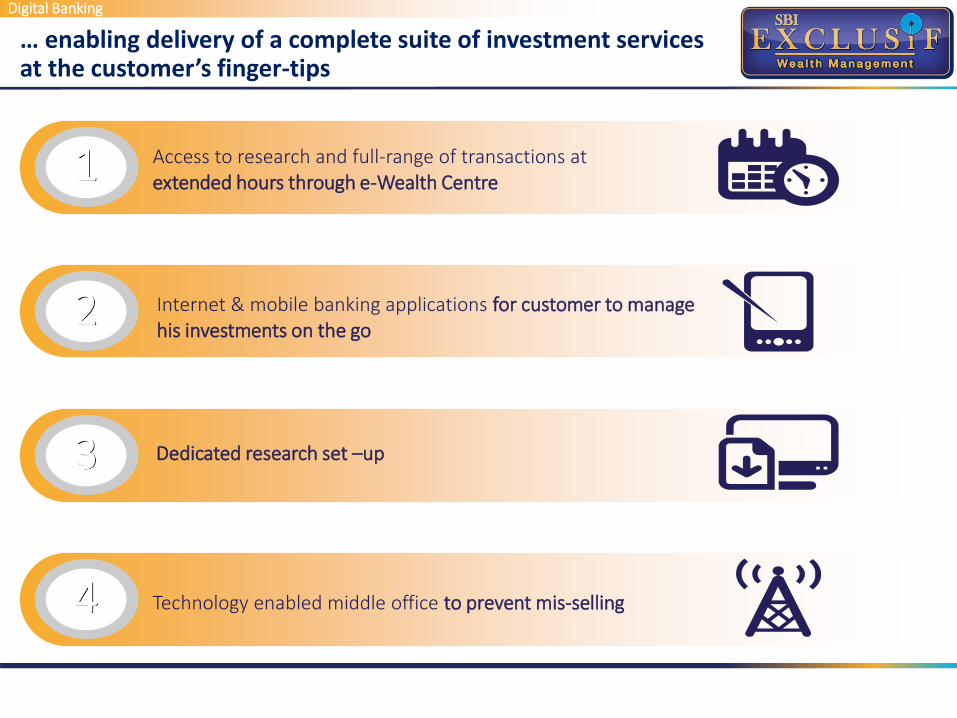
… enabling delivery of a complete suite of investment services at the customer’s finger-tips
1
2
3
4
Access to research and full-range of transactions at extended hours through e-Wealth Centre
Internet & mobile banking applications for customer to manage his investments on the go
Dedicated research set –up
Technology enabled middle office to prevent mis-selling
Digital Banking
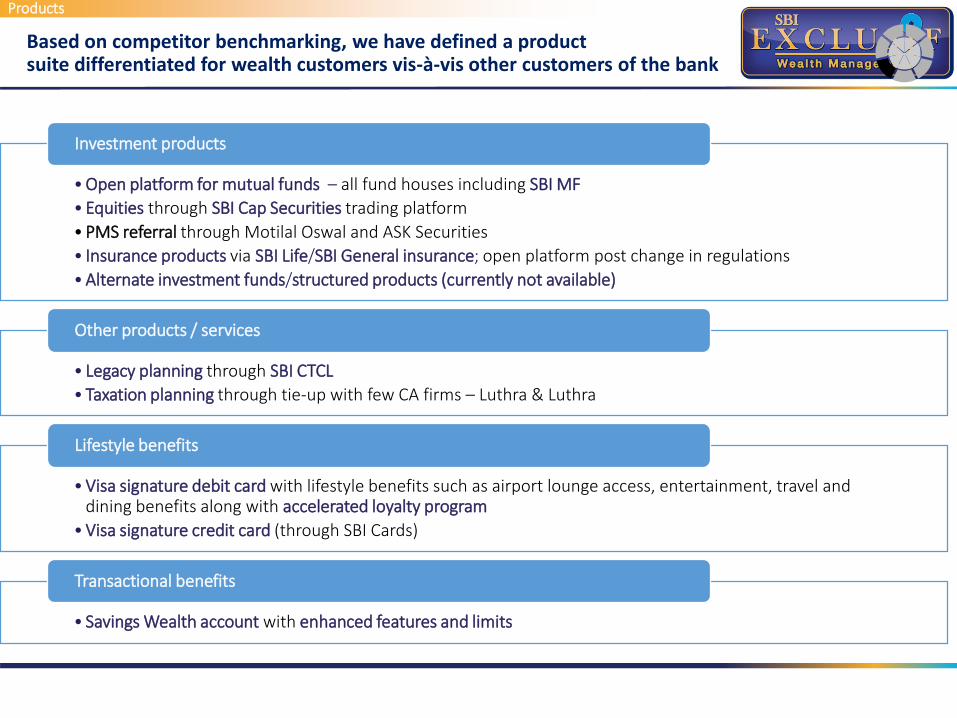
Based on competitor benchmarking, we have defined a productsuite differentiated for wealth customers vis-à-vis other customers of the bank
Products
• Open platform for mutual funds – all fund houses including SBI MF
• Equities through SBI Cap Securities trading platform
• PMS referral through Motilal Oswal and ASK Securities
• Insurance products via SBI Life/SBI General insurance; open platform post change in regulations
• Alternate investment funds/structured products (currently not available)
Investment products
• Legacy planning through SBI CTCL
• Taxation planning through tie-up with few CA firms – Luthra & Luthra
Other products / services
• Visa signature debit card with lifestyle benefits such as airport lounge access, entertainment, travel and dining benefits along with accelerated loyalty program
• Visa signature credit card (through SBI Cards)
Lifestyle benefits
• Savings Wealth account with enhanced features and limits
Transactional benefits
SOURCE: Team Analysis
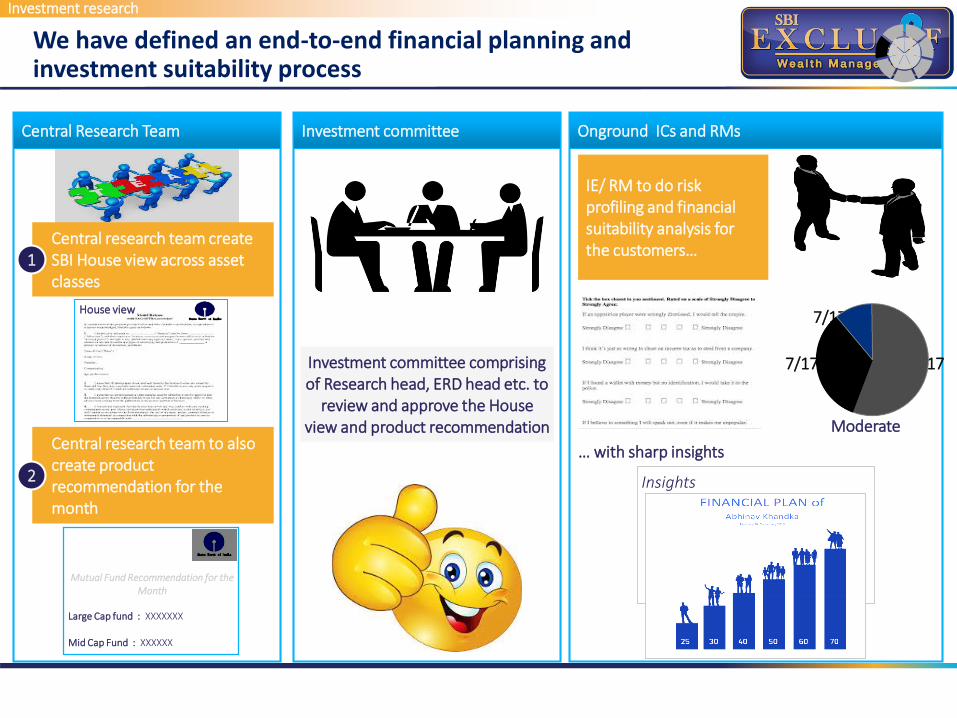
We have defined an end-to-end financial planning and investment suitability process
Central Research Team Investment committee Onground ICs and RMs
Central research team create SBI House view across asset classes
Central research team to also create product recommendation for the month
1
2
Investment committee comprising of Research head, ERD head etc. to
review and approve the House view and product recommendation
IE/ RM to do risk profiling and financial suitability analysis for the customers…
… with sharp insights
Insights
House view
Mutual Fund Recommendation for the Month
Large Cap fund : XXXXXXX
Mid Cap Fund : XXXXXX
7/17/2017
7/17/20177/17/2017
Moderate
Investment research
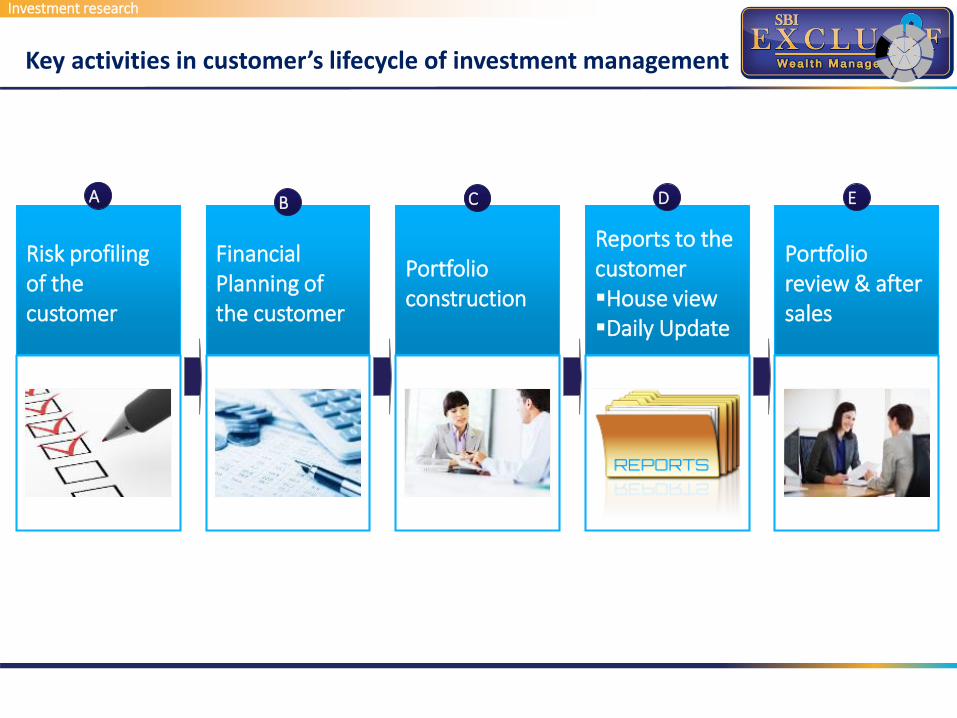
Key activities in customer’s lifecycle of investment management
Risk profiling of the customer
A
Financial Planning of the customer
B
Portfolio construction
C
Reports to the customerHouse viewDaily Update
D
Portfolio review & after sales
E
Investment research
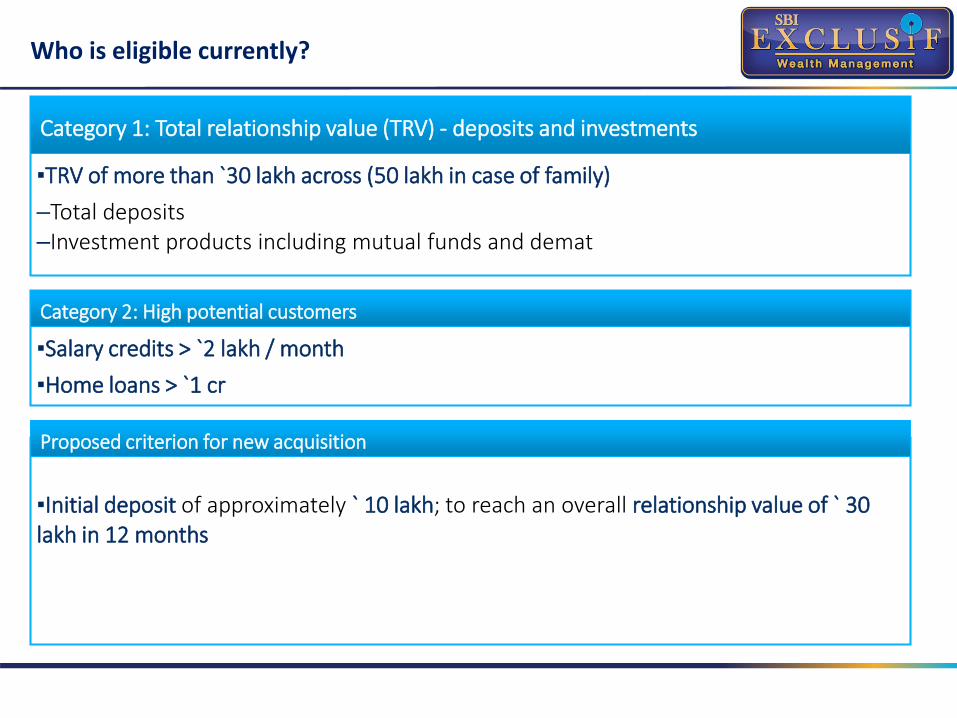
Who is eligible currently?
Category 1: Total relationship value (TRV) - deposits and investments
Category 2: High potential customers
Proposed criterion for new acquisition
▪TRV of more than `30 lakh across (50 lakh in case of family)
–Total deposits–Investment products including mutual funds and demat
▪Salary credits > `2 lakh / month
▪Home loans > `1 cr
▪Initial deposit of approximately ` 10 lakh; to reach an overall relationship value of ` 30 lakh in 12 months
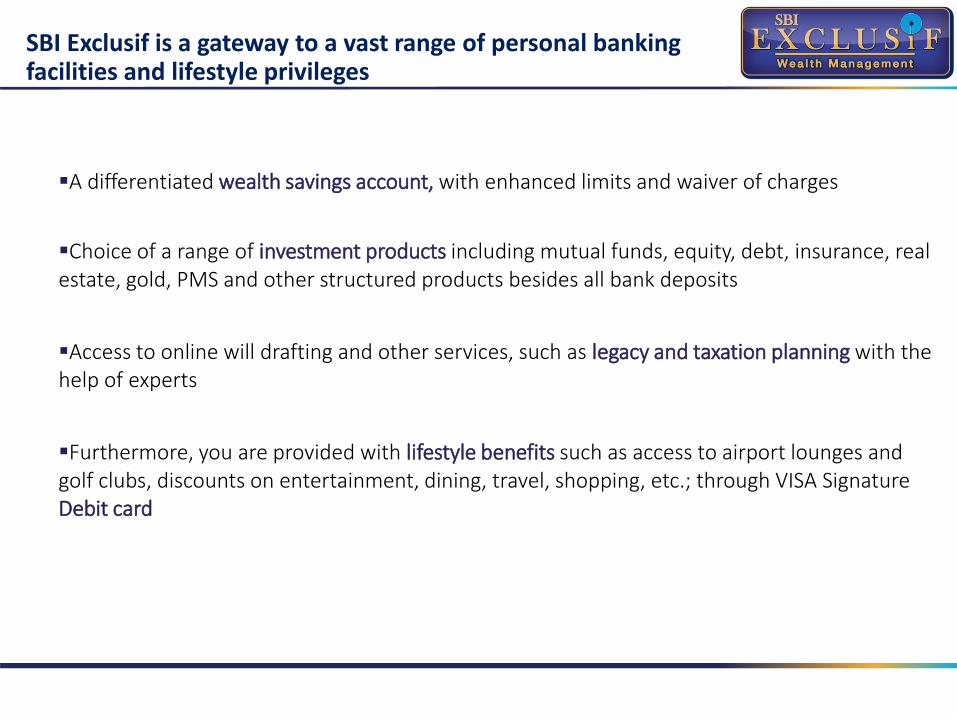
SBI Exclusif is a gateway to a vast range of personal banking facilities and lifestyle privileges
A differentiated wealth savings account, with enhanced limits and waiver of charges
Choice of a range of investment products including mutual funds, equity, debt, insurance, real estate, gold, PMS and other structured products besides all bank deposits
Access to online will drafting and other services, such as legacy and taxation planning with the help of experts
Furthermore, you are provided with lifestyle benefits such as access to airport lounges and golf clubs, discounts on entertainment, dining, travel, shopping, etc.; through VISA Signature Debit card
Convenience of digital banking and the e-wealth center
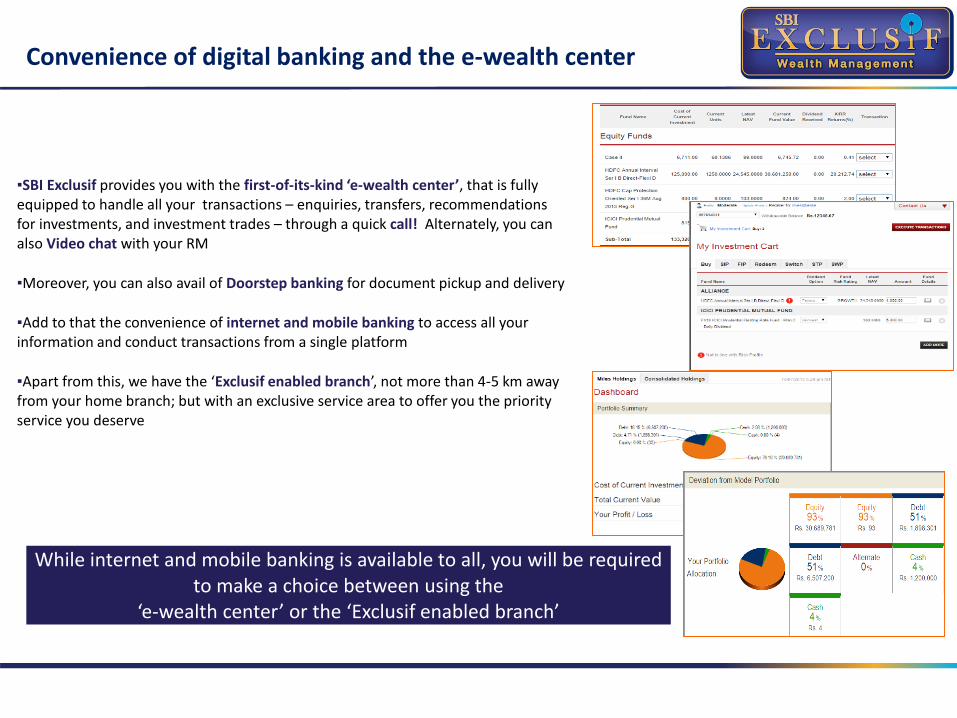
▪SBI Exclusif provides you with the first-of-its-kind ‘e-wealth center’, that is fully equipped to handle all your transactions – enquiries, transfers, recommendations for investments, and investment trades – through a quick call! Alternately, you can also Video chat with your RM
▪Moreover, you can also avail of Doorstep banking for document pickup and delivery
▪Add to that the convenience of internet and mobile banking to access all your information and conduct transactions from a single platform
▪Apart from this, we have the ‘Exclusif enabled branch’, not more than 4-5 km away from your home branch; but with an exclusive service area to offer you the priority service you deserve
While internet and mobile banking is available to all, you will be required to make a choice between using the
‘e-wealth center’ or the ‘Exclusif enabled branch’
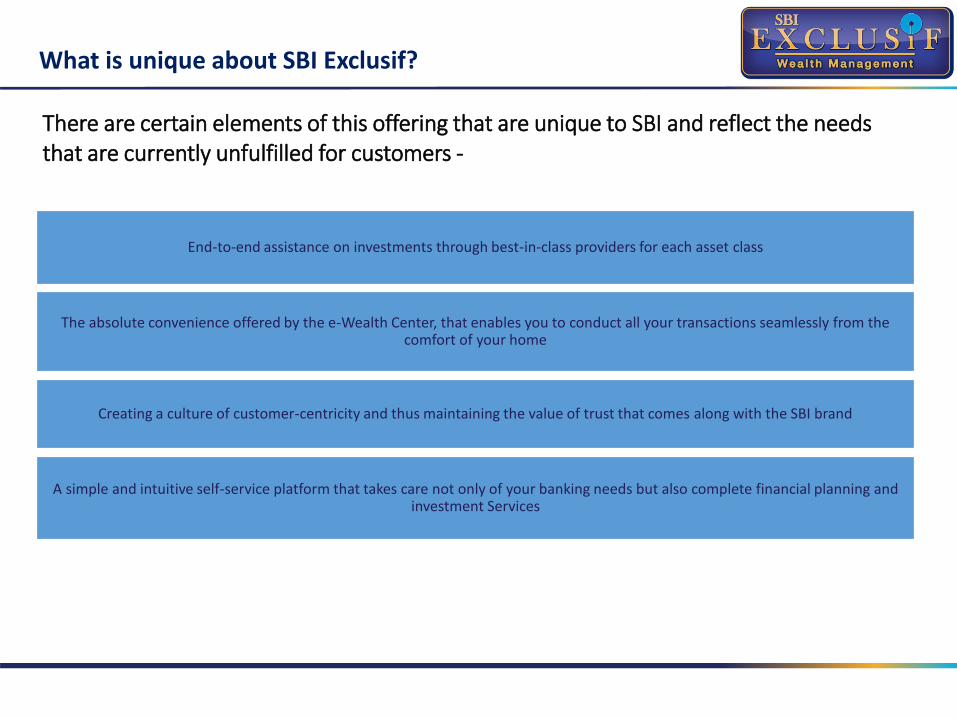
What is unique about SBI Exclusif?
There are certain elements of this offering that are unique to SBI and reflect the needs that are currently unfulfilled for customers -
The absolute convenience offered by the e-Wealth Center, that enables you to conduct all your transactions seamlessly from the comfort of your home
Creating a culture of customer-centricity and thus maintaining the value of trust that comes along with the SBI brand
End-to-end assistance on investments through best-in-class providers for each asset class
A simple and intuitive self-service platform that takes care not only of your banking needs but also complete financial planning and investment Services
Requirements for sign up
The Exclusif program is available by signing a few documents and maintaining a TRV of Rs. 30 lakhs across deposits and investments, or a crore worth of loan through the SBI group (For family onboarding the TRV requirement is 50 lakh)
Documents required:
▪Consent formFor upgrading your regular savings account to a wealth savings account and for conducting transactions through any of our alternate channels
▪KYC documentsAny one document towards proof of identity and proof of address
▪Investment Services Account formIf you wish to invest in mutual funds and other services▪Demat/Trading Account Application formIf you wish to invest in equities and debt instruments▪Credit Card Application formIf you wish to apply for any of our credit card offerings
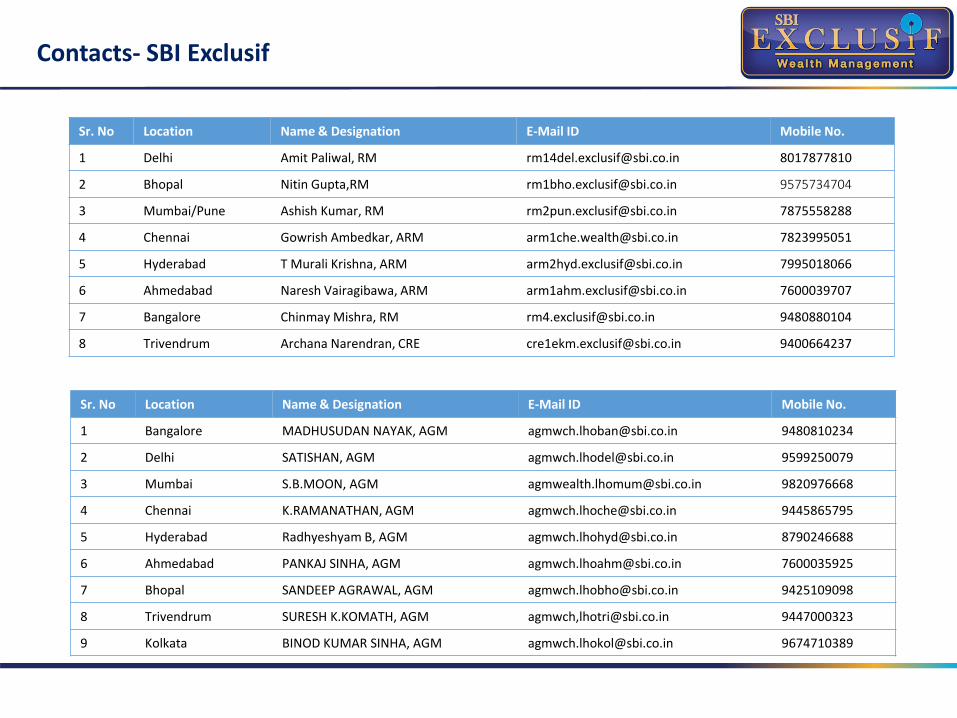
Sr. No Location Name & Designation E-Mail ID Mobile No.
1 Bangalore MADHUSUDAN NAYAK, AGM [email protected] 9480810234
2 Delhi SATISHAN, AGM [email protected] 9599250079
3 Mumbai S.B.MOON, AGM [email protected] 9820976668
4 Chennai K.RAMANATHAN, AGM [email protected] 9445865795
5 Hyderabad Radhyeshyam B, AGM [email protected] 8790246688
6 Ahmedabad PANKAJ SINHA, AGM [email protected] 7600035925
7 Bhopal SANDEEP AGRAWAL, AGM [email protected] 9425109098
8 Trivendrum SURESH K.KOMATH, AGM agmwch,[email protected] 9447000323
9 Kolkata BINOD KUMAR SINHA, AGM [email protected] 9674710389
Sr. No Location Name & Designation E-Mail ID Mobile No.
1 Delhi Amit Paliwal, RM [email protected] 8017877810
2 Bhopal Nitin Gupta,RM [email protected] 9575734704
3 Mumbai/Pune Ashish Kumar, RM [email protected] 7875558288
4 Chennai Gowrish Ambedkar, ARM [email protected] 7823995051
5 Hyderabad T Murali Krishna, ARM [email protected] 7995018066
6 Ahmedabad Naresh Vairagibawa, ARM [email protected] 7600039707
7 Bangalore Chinmay Mishra, RM [email protected] 9480880104
8 Trivendrum Archana Narendran, CRE [email protected] 9400664237
Contacts- SBI Exclusif
Disclaimers
Disclaimer: The report and information contained herein is of confidential nature and meant only for the selected recipient and should not be altered in anyway, transmitted to, copied or distributed, in any manner and form, to any other person or to the media or reproduced in any form, without prior writtenapproval of State Bank of India. The material in this document/report is based on facts, figures and information that are obtained from publicly available mediaor other sources believed to be reliable and hence considered true, correct, reliable and accurate but State Bank of India does not guarantee or represent(expressly or impliedly) that the same are true, correct, reliable and accurate, not misleading or as to its genuineness, fitness for the purpose intended and itshould not be relied upon as such. State Bank of India does not in any way through this material solicit any offer for purchase, sale or entering into any financialtransaction/commodities/products of any financial instrument dealt in this material. All recipients of this material should before dealing and or transacting inany of the products referred to in this material make their own investigation, and seek appropriate professional adviceProspective investors and others are cautioned and should be alert that any forward-looking statements are not predictions and may be subject to changewithout providing any notice. Actual results may differ materially from those suggested by the forward looking statements due to risks or uncertaintiesassociated with our expectations with respect to, but not limited to, exposure to market risks, general economic and political conditions in India and othercountries globally, which have an impact on our services and / or investments, the monetary and interest policies of India, inflation, deflation, unanticipatedturbulence in interest rates, foreign exchange rates, equity prices or other rates or prices, the performance of the financial markets in India and globally, changesin domestic and foreign laws, regulations and taxes and changes in competition in the industry. By their nature, certain market risk disclosures are onlyestimates and could be materially different from what actually occurs in the future. As a result, actual future gains or losses could materially differ from thosethat have been estimated.State Bank of India (including its subsidiaries) and any of its officers directors, personnel and employees, shall not liable for any loss, damage of any nature,including but not limited to direct, indirect, punitive, special, exemplary, consequential, as also any loss of profit in any way arising from the use of this materialin any manner and any action on decision taking to buy, sale, invest, subscribe or entering into any contract for any financial product or services.The recipient alone shall be fully responsible/ are liable for any decision taken on the basis of this material. The investments discussed in this material may notbe suitable for all investors. Any person subscribing to or investing in any product/financial instruments should do so on the basis of and after verifying the termsattached to such product/financial instrument. Financial products and instruments, are subject to market risks and yields may fluctuate depending on variousfactors affecting capital/debt markets. Please note that past performance of the financial products and instruments does not necessarily indicate the futureprospects and performance thereof. Such past performance may or may not be sustained in future. State Bank of India (including its subsidiaries) or its officers,directors, personnel and employees, including persons involved in the preparation or issuance of this material may; (a) from time to time, have long or shortpositions in, and buy or sell the securities mentioned herein or (b) be engaged in any other transaction involving such securities and earn brokerage or othercompensation in the financial instruments/products/commodities discussed herein or act as advisor or lender / borrower in respect of such securities/financialinstruments/products/commodities or have other potential conflict of interest with respect to any recommendation and related information and opinions. Thesaid persons may have acted upon and/or in a manner which is in conflict with the information contained here. Purchase of any Insurance product by a Bank'sCustomer, is purely voluntary in nature and is not linked to any other facility from the Bank. Mutual Fund and all Financial investments are subject to marketrisks. Please read the offer document and scheme related information carefully before investing.
For Queries, Please Contact Your Relationship Manager Or Write us at [email protected]