investment funds for development program - world...
TRANSCRIPT

INVESTMENT FUNDS FOR
DEVELOPMENT PROGRAM Programmatic Approach
Background Concept Note
Fin4Dev - Investment Funds Group
Table of Contents
Acknowledgments ......................................................................................................................................... 1
Executive Summary ....................................................................................................................................... 2
Program Rationale .................................................................................................................................... 2
(i) Developing PE/VC ecosystems .......................................................................................................... 4
(ii) Developing frameworks for infrastructure PPPs .......................................................................... 4
(iii) Developing SIFs and the domestic investment component of SWFs ........................................... 4
Program Activities ..................................................................................................................................... 5
I: Development objective .............................................................................................................................. 6
II: Intermediate outcomes ............................................................................................................................ 6
III Strategic relevance .................................................................................................................................... 6
IV: Program context/description ................................................................................................................ 24
IV.1 Program context .............................................................................................................................. 24
IV.1.1 Developing the PE/VC ecosystem ............................................................................................. 24
IV.1.2 Develop the framework for infrastructure PPPs ...................................................................... 27
IV.1.3 Develop strategic investment funds (SIFs) and the domestic investment component of SWFs
............................................................................................................................................................ 31
IV.2 Program activities ............................................................................................................................ 34
IV.2.1 Global engagements ................................................................................................................. 34
IV.2.2 Sub-regional and country engagements ................................................................................... 36
V: Program risks .......................................................................................................................................... 39
VI: Roles of clients and partners ................................................................................................................. 39
VII: Dissemination and outreach strategy ................................................................................................... 40
Annex I: Program Tables ............................................................................................................................... 0
Annex II: Team composition ......................................................................................................................... 0
Bibliography .................................................................................................................................................. 1

Table of Figures
Figure 1: Private Equity Assets under Management December 2000 - June 2014 (US$ billion) .. 8
Figure 2: Make-up of LPs in the Average Fund by LP Type (Capital Committed to Funds Closed
in 2009-2014) .................................................................................................................................. 9
Figure 3: Primary Strategy of Private Debt Fund Managers Established Since 2008 .................. 10
Figure 4: Proportion of Number and Aggregate Value of Venture Capital Deals by Industry 2012
– 2014............................................................................................................................................ 11
Figure 5: Evolution on PE investments in Emerging Markets by region, in US$ billion............. 12
Figure 6: Cumulative World Energy Sector Investment by Scenario -2015-2030 ....................... 14
Figure 7: Proportion of Bank Loan Maturities by Country Income Level ................................... 16
Figure 8: Unlisted Infrastructure Assets under Management December 2002 - June 2014 ......... 18
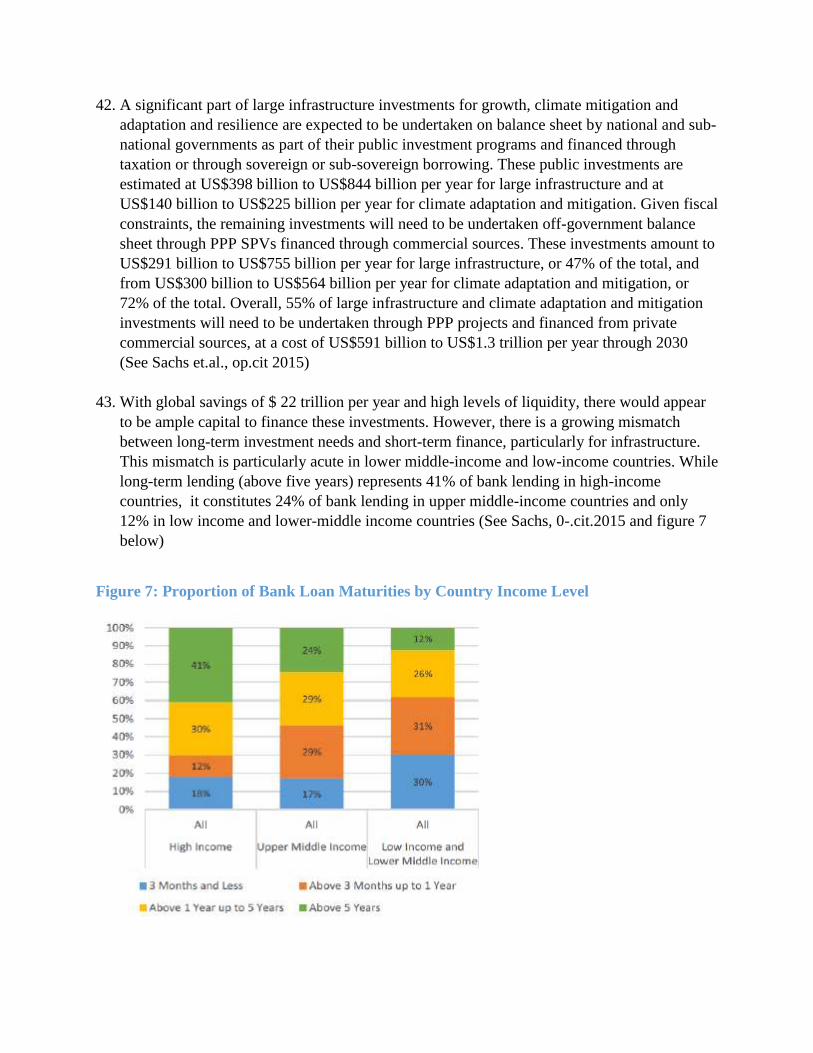
Figure 9: Breakdown of Infrastructure Deals by Industry 2008-2014 .......................................... 18
Figure 10: Breakdown of Average Current and Target Allocations to Infrastructure by Investor
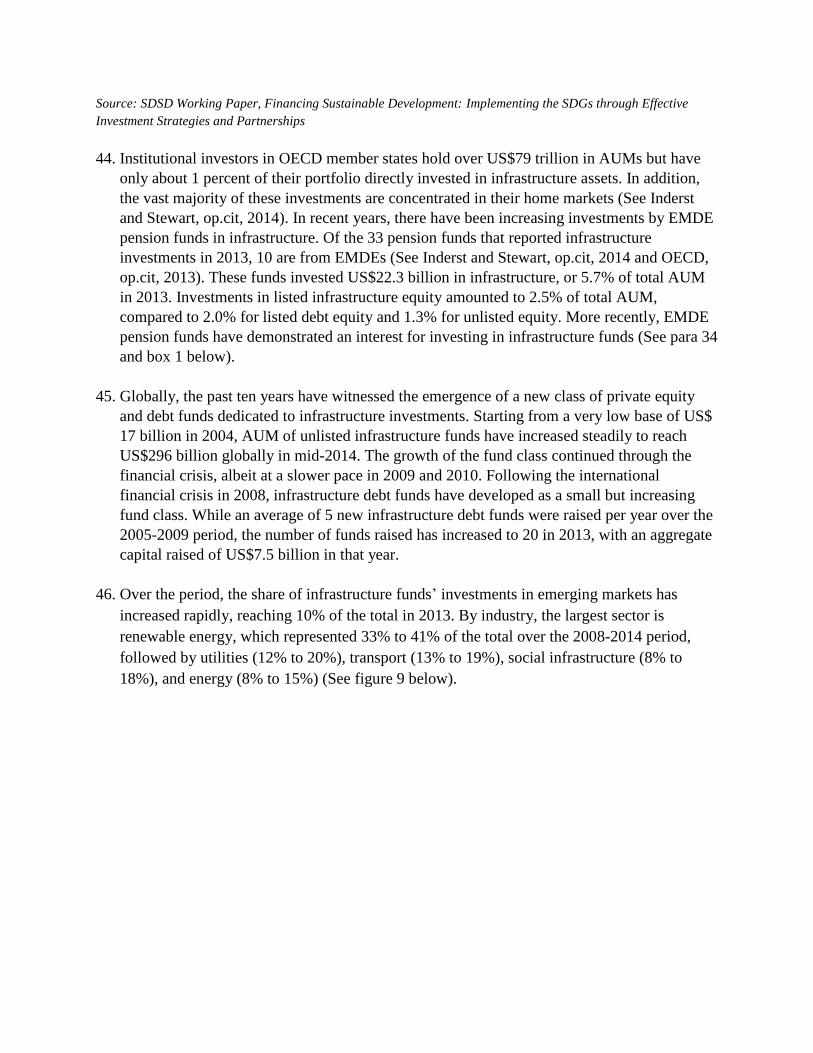
Type, 2014 .................................................................................................................................... 19
Figure 11: Preqin Index: Infrastructure vs All Private Equity December 2007-June 2014 .......... 20
Figure 12: Unlisted infrastructure debt funds in market over time: January 2006-January 2015 21
Figure 13: Infrastructure project preparation costs: experience of IFC ........................................ 30
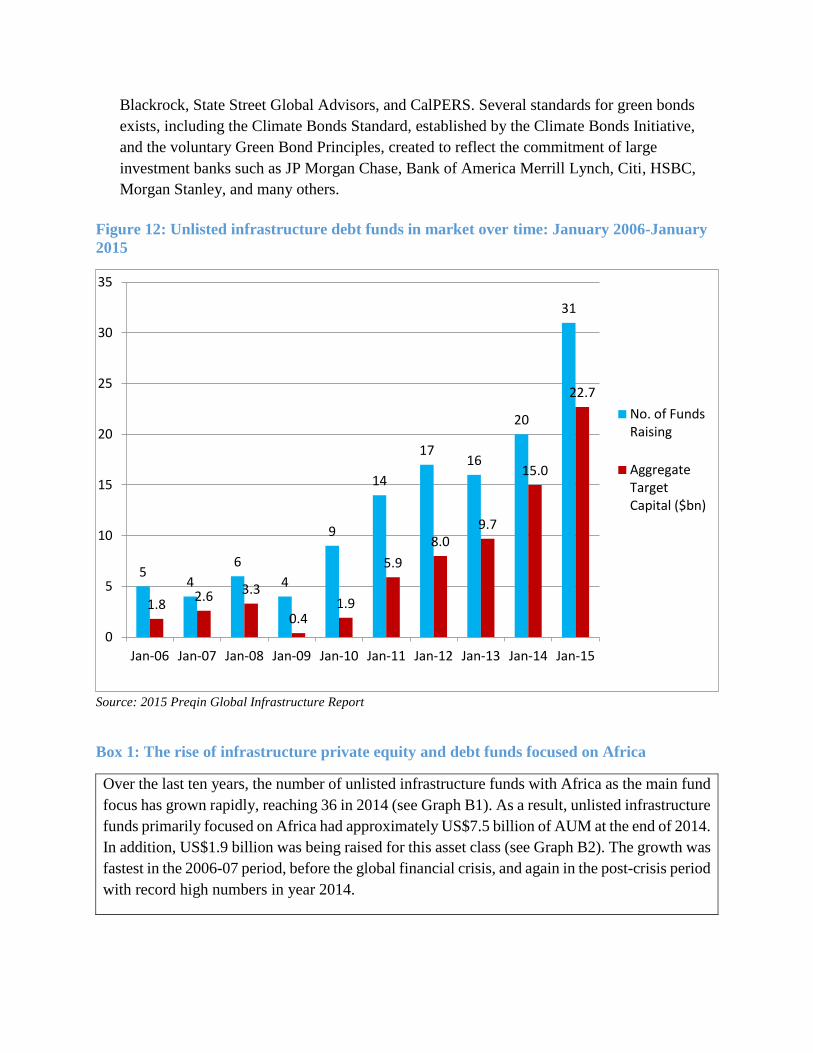
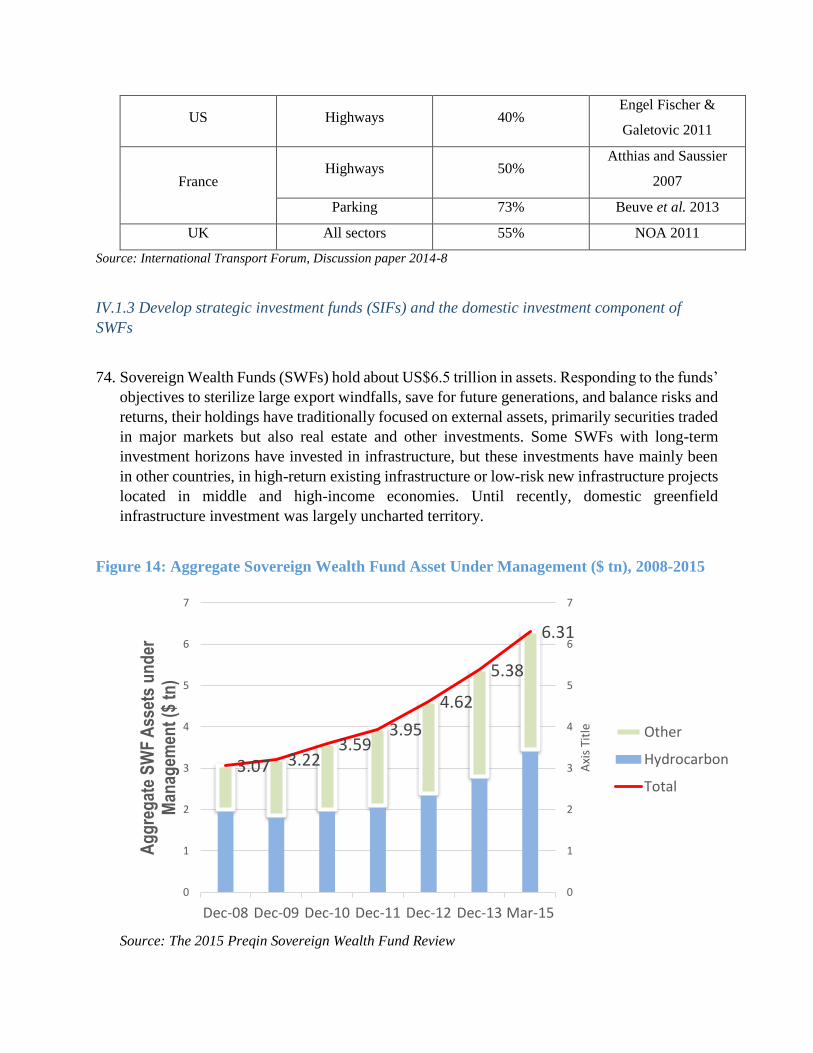
Figure 14: Aggregate Sovereign Wealth Fund Asset Under Management ($ tn), 2008-2015 ..... 31
Table of Tables
Table 1: Comparison of adaptation cost estimates by the UNFCCC and the EACC ................... 14
Table 2: Percentage of renegotiated contracts by region and sector ............................................. 30
Table 3: SWF/SIF global engagements: ongoing and planned engagements ............................... 36
Table 4: PE/VC development business line: ongoing and planned engagements ........................ 37
Table 5: SWF development business line: ongoing and planned engagements ........................... 38
Table 6: SIF development business line: ongoing and planned engagements .............................. 38
Table of Boxes
Box 1: The rise of infrastructure private equity and debt funds focused on Africa ...................... 21
Box 2: The South Africa Green X Infrastructure Debt Fund........................................................ 23
Box 3: Definition of Private Finance PPP .................................................................................... 27
Box 4: PPP framework: procedures and decision criteria ............................................................ 29

1
Acknowledgments
The Investment Funds for Development Program Background Note has been prepared by
Shanthi Divakaran (Senior Financial Sector Specialist, GFMDR), Havard Halland (Senior
Economist, GFMDR), and Michel Noel (Head, Investment Funds, GFMDR) with the research
analysis contribution of Sevara Atamuratova (Research Analyst, GFMDR).
Executive Summary
Program Rationale
1. The overall objective of the SDGs is to overcome poverty and save the planet. To meet the
SDGs, total incremental investment needs in developing countries through 2030 are
estimated at US$1.5 to US$2.5 trillion per year, of which US$800 billion to US$ 1.4 trillion
(or about 60%) from private sources. At US$ 22 trillion per year, the world has adequate
savings to finance private investments in the SDGs, but to date private financing directed
towards sustainable development remains vastly insufficient. This is particularly the case for
achieving the SDGs of growth and employment (SDG8), resilient infrastructure (SDG9), and
climate mitigation and adaptation (SDG13). This raises the critical challenge on how to
mobilize financing for SMEs and infrastructure investments to support growth, job creation,
and climate mitigation and adaptation in emerging markets and developing countries
(EMDEs).
2. Globally, young SMEs are the primary source of job creation. Access of young patenting
firms to seed and early stage venture capital is critical to finance innovation. Access by firms
to private equity at all stages of their development from start-up through growth to pre-IPO
has a major impact on innovation, productivity, employment creation and competitiveness.
However to date the penetration of private equity and venture capital remains low across
many EMDEs, and the private equity financing gap in EMDEs is estimated at US$ 270
billion in 2014.
3. Globally, infrastructure investments have a strong impact on growth: a 1 percent increase in
physical infrastructure stocks temporarily raises GDP growth by as much as 1-2 percentage
points. Physical infrastructure in roads and telecommunications facilitates spatial access and
information flows, raising labor productivity, boosting rural incomes and reducing poverty.
Broad access to electricity leads to increased overall productivity, rising female employment,
as well as more time to study and increased use of computers. Better transportation systems
and safer roads raise school attendance. The investments in large infrastructure required to
achieve the SDGs are estimated at US$ 900 billion to US$ 1.6 trillion per year through 2030.
4. Required investments in climate mitigation and adaptation are estimated at US$ 440 billion
to US$ 780 billion per year over the same period. Adaptation investments are part of a
broader set of resilience investments to be undertaken under comprehensive disaster risk
management (DRM) strategies. These encompass a broad range of resilience infrastructure
investments by governments, business investments by enterprises, and community and
individual investments by households. Resilience investments yield a triple dividend,
avoiding losses, unlocking suppressed economic potential, and generating co-benefit through
increased employment opportunities in environmental services, value chain development in
protected areas, and improved access to services through improved resilience of transport
networks. Climate mitigation efforts face the challenge of designing more powerful incentive
schemes to attract private capital, including investment funds, to clean energy research,

development and deployment. In addition to environmental tax policy, this requires
investment incentives that bring the risk-return trade-off for private investors within the
commercial realm for a larger range of clean energy investments.
5. A significant part of large infrastructure investments for growth, climate mitigation and
adaptation are expected to be undertaken on balance sheet by national and sub-national
governments as part of their public investment programs, and financed through taxation or
sovereign and sub-sovereign borrowing. However, due to fiscal constraints, about 55% of
these investments will need to be undertaken through PPP projects and financed from private
commercial sources, at a cost of US$ 591 billion to US$ 1.3 trillion per year through 2030.
6. Private equity and debt funds can play a critical role in mobilizing resources from
international and domestic institutional investors for the financing of SMEs and resilient
infrastructure, as well as for climate adaptation and mitigation investments in EMDEs.
7. Globally, private equity (PE) assets under management have grown rapidly over the last
decade, reaching US$ 3.8 trillion in 2014, of which about 10 percent are invested in EMDEs.
The investor base for PE funds is broad-based and includes public and private pension funds,
insurance companies, high net-worth individuals and family offices, private foundations,
government agencies and Sovereign Wealth Funds (SWFs). Following the international
financial crisis, venture capital (VC) funds have rebounded sharply following the
international financial crisis, with new fundraising reaching about US$ 50 billion in 2014.
VC funds now finance a broad range of SMEs, from angel deals to various rounds of VC
funding in a broad range of sectors including internet, healthcare, IT and clean technology. In
recent years, private debt funds have also emerged to complement bank lending to enterprises
that has been constrained by regulatory pressures and deleveraging.
8. Over the past ten years, a new class of PE and debt funds has emerged that are dedicated to
infrastructure investments, with assets under management reaching US$ 296 billion in 2014 .
The share of infrastructure equity and debt funds in emerging markets has increased steadily,
reaching 10% of the total. The investor base encompasses a broad range of investors,
including superannuation schemes, endowment plans, public and private pension funds,
foundations, and asset managers. Infrastructure funds have consistently outperformed other
private equity firms over the 2007-2014 period.
9. The development of PE and debt funds for SMEs, infrastructure, as well as climate
mitigation and adaptation finance in EMDEs depends on three key pillars: (i) developing the
PE/VC ecosystem; (ii) developing the framework for infrastructure PPPs; and (iii)
developing Strategic Investment Funds (SIFs) and the domestic investment component of
SWFs as anchor investors for international and domestic institutional investors in domestic
projects and funds.
(i) Developing PE/VC ecosystems
10. The establishment of an efficient and transparent legal and regulatory framework is a critical
element for the development of the PE/VC industry. This encompasses the broad legal and
regulatory framework for the operations of off-shore and on-shore funds in the country, as
well as the legal and regulatory framework for the domestic registration and supervision of
on-shore funds. The second element is the legal and regulatory environment for investments
by institutional investors, including pension funds and insurance companies, in the PE/VC
asset class, both under rules-based and risk-based regulatory systems. The third element is
the business enabling environment, encompassing a number of supply-side and demand-side
policies. Supply-side policies include tax credits, seed funds that co-invest with qualified
angel investor groups, and technical assistance and training for angel investor groups, as well
as hybrid (public-private) funds to stimulate equity finance to early-stage enterprises and
technical assistance funds to support VC funds reaching down to smaller deal sizes. Demand-
side measures include entrepreneurship training and support to the development of a network
of business incubators and accelerators linked with research centers and with angel investor
groups and VC funds.
(ii) Developing frameworks for infrastructure PPPs
11. The development of a comprehensive framework for the delivery of the PPP program is
critical to mobilize private equity and debt funds for infrastructure finance in a country,
including clean energy and other climate mitigation or adaptation infrastructure. This
includes framework objectives, scope, legal and administrative instruments, procedures and
decision criteria, procedures for management of unsolicited proposals, and contract
management including contract renegotiations. The preparation cost of PPP transactions
ranges from 2-3% in middle-income countries that already have experience with PPPs, to
3%- 10% of total project costs in new sectors in low-income countries. To overcome this
constraint, several governments are considering the establishment of infrastructure PPP
project venture funds, responsible for managing all stages of the preparation of PPP
transactions up to financial close and taking an equity and/or mezzanine stake in the PPP
project SPV.
(iii) Developing SIFs and the domestic investment component of SWFs
12. The third pillar is the development of SIFs and of the domestic investment component of
SWFs, to serve as anchor investors for domestic and international institutional investors in
domestic projects and funds. A number of SWFs established since the 1990s have been set up
to undertake strategic domestic investments, starting with Malaysia’s Khazanah and
continuing since 2000 with several oil or mineral-based funds in the Gulf and in Africa. In
parallel with increased allocation by oil or mineral-based SWFs to domestic investments, a
growing number of EMDEs are establishing SIFs, funded by fiscal surpluses, borrowing, or
other non-resource revenues, to serve as anchor investors for domestic and international
institutional investors, including international private equity and debt funds interested in
investing in the domestic economy. SWFs that invest domestically and SIFs take on very
similar roles, investing for a combined financial and economic return in infrastructure PPP
projects, SME funds and SOE investment or turnaround projects.
Program Activities
13. The Investment Funds Group delivers the Program through a mix of global and sub-regional
and country engagements.
14. Global engagements include (i) management of the investment funds Community of Practice,
including a private equity/venture capital C4D platform jointly managed with the Emerging
Market Private Equity Association (EMPEA) and a SWF C4D platform jointly managed with
the Fletcher Network for Sovereign Wealth and Global Capital; (ii) co-management with
Treasury (TRE) of the SWF Corporate Secretariat and Advisory Group, (iii) preparation of a
global review of SIFs, in partnership with the Public-Private Infrastructure Advisory Facility
(PPIAF); (iv) preparation of guidelines for the design of SIFs, in partnership with PPIAF;
and (v) co-management with the Sustainable Urban, Rural and Resilience Global Practice
(SURR GP) of a feasibility study for a Global Resilience Investment Fund (GRIF), in
partnership with the Global Fund for Disaster Relief and Recovery (GFDRR)/Disaster Risk
Finance and Insurance (DRFI) window.
15. Sub-regional and country engagements are driven by country demand, internal partnerships
across IFC, World Bank Global Practices (GPs), Cross-Cutting Sector Areas (CCSAs) and
TRE, external partnerships with Governments through reimbursable advisory services
(RAS), and with donors through multi-donor and bilateral trust funds, and line of sight (LSI)
lending or guarantee operations aimed at achieving monitorable performance indicators
towards the three SDGs of growth and employment, resilient infrastructure, and climate
mitigation and adaptation. These engagements are structured around three business lines: (i)
development of PE/VC ecosystems; (ii) development of SWFs in resource-rich LICs; and
(iii) development of SIFs.in EMDEs.
Fin4Dev – Investment Funds Group
Investment Funds for Development Program - Background Concept Note
16. The objective of this Note is to discuss the development objective, intermediate outcomes,
strategic relevance, program context/description, program risks, roles of clients and partners,
and dissemination and outreach strategy for the Investment Funds for Development program
managed by the Investment Funds Group team in Fin4Dev.
I: Development objective
17. The development objective of the Investment Funds for Development (IFD) program is to
enable EMDE governments and regional economic communities to create the conditions
to mobilize investment fund resources for SMEs and infrastructure finance, with the
objective to contribute to the achievement of the SDGs of growth and employment (SDG8),
resilient infrastructure (SDG9), and climate adaptation and mitigation (SDG13).
II: Intermediate outcomes
18. The program will have the following intermediate outcomes:
(i) Increase in penetration of private equity and venture capital assets under management
(AUM) invested in EMDEs by 10% by 2020
(ii) Increase in private equity and debt funds AUM invested in infrastructure in EMDEs
by 10% by 2020
(iii) Increase private equity and debt funds assets AUM invested in climate mitigation and
adaptation in EMDEs by 15% by 2020
III Strategic relevance
19. The overall objective of the SDGs is to overcome poverty and save the planet. Following
developments in the global economy over the last decade, large amounts of investable
resources, mostly private, are available in advanced and emerging economies (See IMF-
World Bank op.cit, 2015). To meet the SDGs, total incremental investment needs in
developing countries through 2030 are estimated at US$ 1.5 to US$2.5 trillion per year, of
which US$800 billion to US$ 1.4 trillion (or about 60%) from private sources. At $ 22
trillion per year, the world has adequate savings to finance the private investments in the
SDGs, but to date private financing directed towards sustainable development remains vastly
insufficient (See Sachs et..al, op.cit, 2015).
20. This is particularly the case for achieving the SDGs of growth and employment (SDG8),
resilient infrastructure (SDG9), and climate adaptation and mitigation (SDG13). This raises
the question on how to mobilize investment funds for financing SMEs that are prime
contributors to job creation and growth, and for financing infrastructure and climate
adaptation and mitigation investments.
(i) Role of investment funds in SME finance for growth and employment
21. Globally, young SMEs are the primary source of job creation. A recent OECD study across
18 countries over the 2001-2011 period shows that young SMEs (less than 5 years), although
representing on average 17% of employment, contribute 42% of total job creation and only
22% of all job destruction, making them net job creators. By contrast, older SMEs are
generally net job destroyers. The disproportionate contribution of young firms to
employment creation holds across all economies, sectors and years considered (See
Criscuolo, Gal and Menon, op cit. 2014). A similar relationship was found by a World Bank
study in India, which showed a strong positive correlation between entrepreneurship and job
growth across Indian states between 1989 and 2005 (See Ghani, E. , W. Kerr and S. D.
O’Connell, op.cit. 2015).
22. Access of young firms to finance varies greatly across countries. A recent OECD study
across 23 OECD countries over the 2003-2010 period shows that resource flows to patenting
firms tend to be stronger in countries with more developed financial markets, and this effect
is particularly important for young firms. In particular, resources flow more freely to young
patenting firms in countries with more developed markets for seed and early-stage venture
capital. Access to seed and early stage venture capital therefore plays an important role for
ensuring the growth of young patenting firms and the development of radical innovations.
Specifically, the study shows that increasing access to early stage venture capital from the
lowest level to the average of the sample implies that capital flows to patenting firms would
be 30% higher than otherwise (See Andrews, Criscuolo and Menon, op.cit. 2014).
23. More broadly, increasing access of firms to private equity at all stages of their development
from venture through growth to pre-IPO has a major impact on innovation, productivity,
employment creation and competitiveness. A recent EVCA study showed that patents
granted to private equity-backed companies tend to be more economically significant than
patterns on average, with evidence from the US suggesting that private equity participation
increases the number of citations of a patent by 25%. The study also shows that private
equity-backing improves the operating performance of portfolio companies by 4.5% to 8.5%
during the first three years after investment, and that private equity participation leads to
improved productivity as measured by EBITDA per employee of 6.9% on average. The study
also shows that private equity-backed firms are more focused on internationalization by
comparison with other firms (See Frontier Economics Europe, op.cit. 2013)
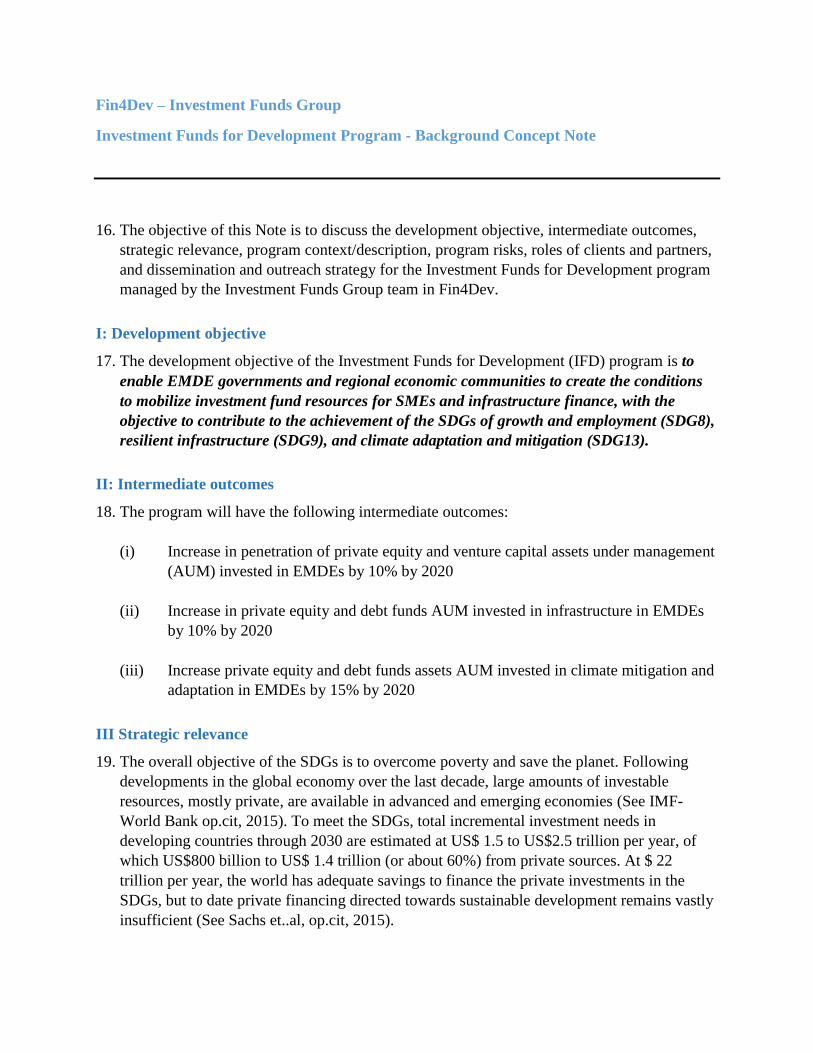
24. Globally, private equity funds assets under management (AUM) have grown rapidly over the
last ten years, reaching US$ 3.8 trillion in 2014 (See figure 1). The boom period from 2004
to 2007 was followed by a flattening out of AUM following the international financial crisis
in 2008. The crisis resulted in a sharp decline in exit activity between 2008 and 2010,
resulting in increases in unrealized values, lower capital returned to investors, and a more
competitive fund raising environment. Since then, exit activity has increased, translating into
higher levels of distributions and an upturn in new funds commitments, with global AUM
breaking the US$ 3 trillion mark in 2012.
Figure 1: Private Equity Assets under Management December 2000 - June 2014 (US$
billion)
Source: 2015 Preqin Global Private Equity Report
25. By type of fund, buyout funds are the leading asset class with 37% of global dry powder in
2013, followed by real estate funds (17%), venture capital funds (11%) and infrastructure
funds (9%). However, the last ten years have witnessed a significant transformation among
asset classes. Between 2004 and 2013, the share of buyout funds declined from 43% to 37%
and the share of venture capital funds was halved, dropping from 23% to 11%. By contrast,
the share of infrastructure funds increased from 3% to 9%, and the share of growth funds
increased from 2% to 7% over the same period.
26. In terms of exits, after peaking at US$ 266 billion in 2007, private equity-backed exits
dropped sharply following the international financial crisis in 2008, reaching a low of US$
298 377 407 402 409 563806
1,011 1,075 1,067 993 1,007 941 1,074 1,144418 374 360 465 554
675
898
1,265 1,2041,413
1,7832,029
2,332
2,5462,644
0
500
1,000
1,500
2,000
2,500
3,000
3,500
4,000
De
c-0
0
De
c-0
1
De
c-0
2
De
c-0
3
De
c-0
4
De
c-0
5
De
c-0
6
De
c-0
7
De
c-0
8
De
c-0
9
De
c-1
0
De
c-1
1
De
c-1
2
De
c-1
3
Jun-1
4Dry Powder Unrealized Value
82 billion in 2009. Starting in 2010 however, exits rebounded sharply and broke the US$ 300
billion mark in 2013. Among exit strategies, trade sales represented 51% of exit transactions
in 2013, followed by sales to general partners (26%), and IPOs (19%).
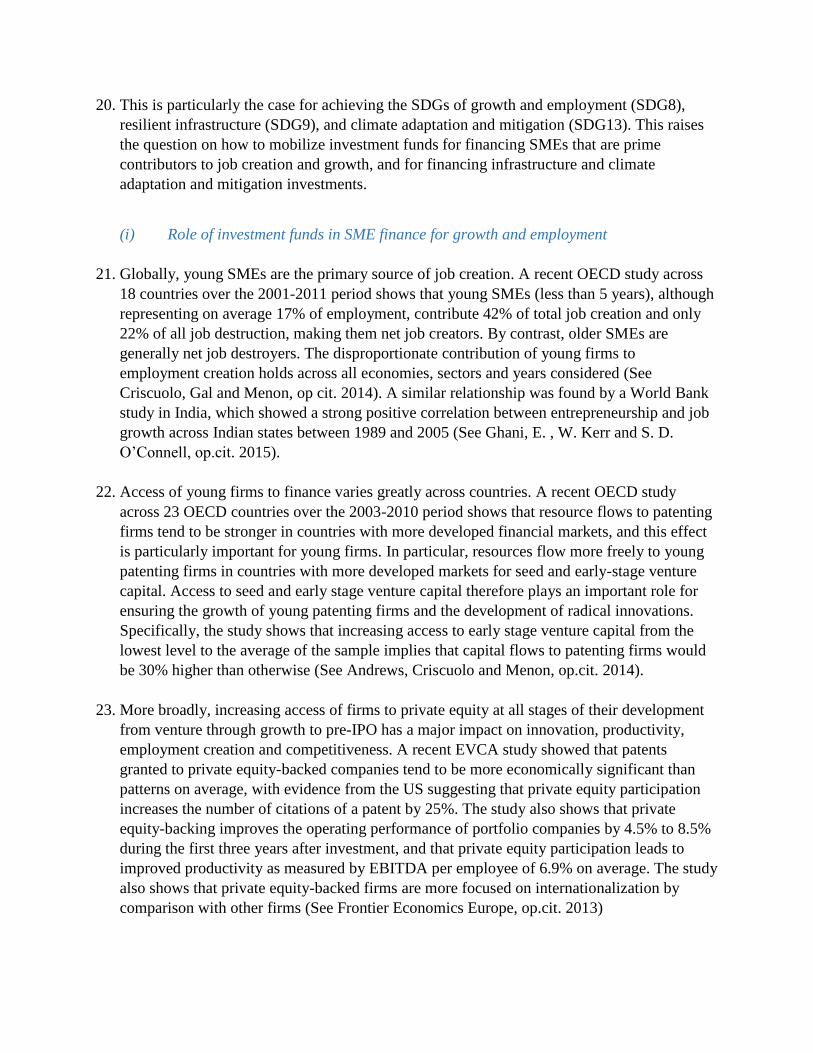
27. The investor base of PE funds has undergone significant transformation over the last six
years. Between 2009 and 2011, the largest investors were public pension funds, averaging
28% of the total, followed by fund of funds (13%) and endowment plans (8%). By contrast,
over the 2012-2014 period, the share of public pension funds and of endowment plans
dropped to 22% and 6% respectively, while the share of high-net-worth individuals, private
sector pension funds and insurance companies, increased from 3% to 10%, from 7% to 10%
and from 6% to 12%respectively. At the same time, the share of fund of funds managers
remained stable.
Figure 2: Make-up of LPs in the Average Fund by LP Type (Capital Committed to Funds
Closed in 2009-2014)
Source: 2015 Preqin Global Private Equity Report
28. In terms of performance, private equity horizon IRRs outperformed major market indices,
generating a return of 21.7% at the 10 year 2013 horizon. However, this performance was
driven primarily by buyout funds, while venture capital funds underperformed major market
indices at those horizons. As of mid-2013, buyout funds generated a 10-year horizon return
28%
13%
3%
8%7%
4%6% 6%
5%4%
1% 2%
22%
13%10%
6%
10%
6%
3%
12%
3%
5%
2% 3%
0%
5%
10%
15%
20%
25%
30%
Pu
blic
Pen
sio
nFu
nd
s
Fun
d o
f Fu
nd
sM
anag
ers
Hig
h-N
et-W
ort
hIn
div
idu
als
End
ow
men
t P
lan
s
Pri
vate
Sec
tor
Pe
nsi
on
Fu
nd
s
Fam
ily O
ffic
es
Fou
nd
atio
ns
Insu
ran
ceC
om
pan
ies
Ban
ks &
Inve
stm
ent
Ban
ks
Go
vern
men
tA
gen
cies
Co
rpo
rate
Inve
sto
rs
Sove
reig
n W
ealt
hFu
nd
s
Pro
po
rtio
n o
f C
apit
al C
om
mit
ted
Investor Type
2009-2011
2012-2014
of 25.5%, compared to 4.5% for venture capital, 7.3% for the S&P 500 and 13.7% percent
for the MSCI emerging markets.
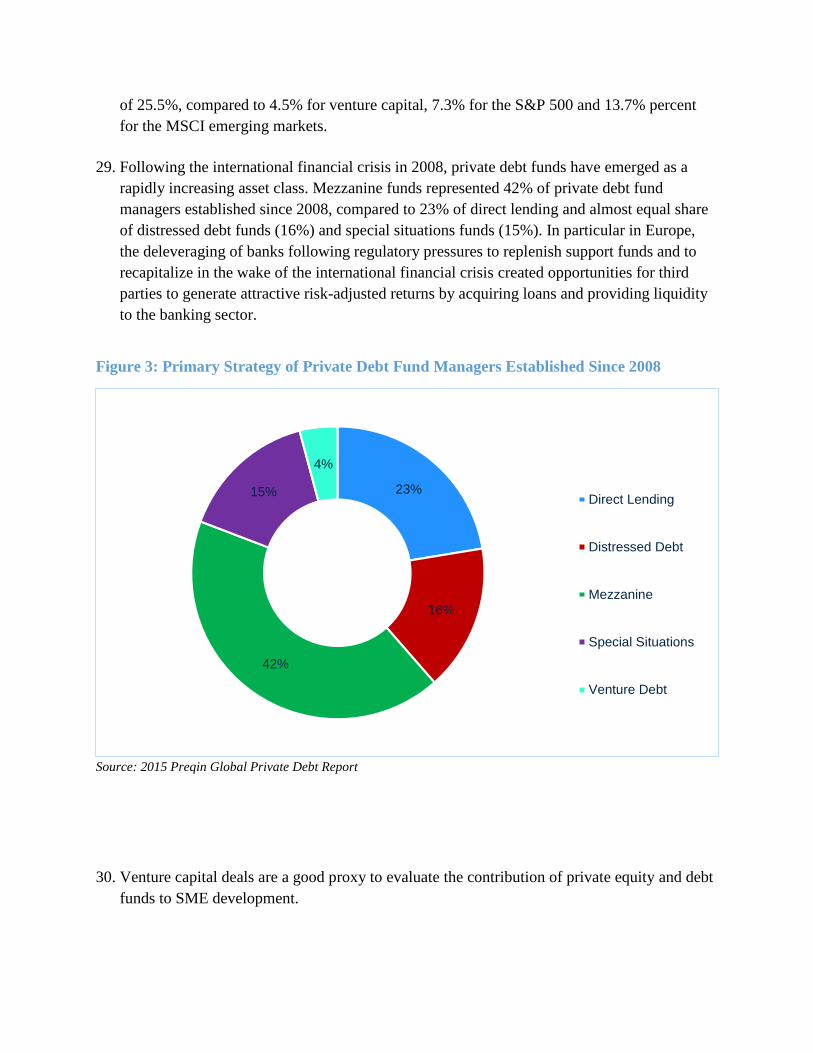
29. Following the international financial crisis in 2008, private debt funds have emerged as a
rapidly increasing asset class. Mezzanine funds represented 42% of private debt fund
managers established since 2008, compared to 23% of direct lending and almost equal share
of distressed debt funds (16%) and special situations funds (15%). In particular in Europe,
the deleveraging of banks following regulatory pressures to replenish support funds and to
recapitalize in the wake of the international financial crisis created opportunities for third
parties to generate attractive risk-adjusted returns by acquiring loans and providing liquidity
to the banking sector.
Figure 3: Primary Strategy of Private Debt Fund Managers Established Since 2008
Source: 2015 Preqin Global Private Debt Report
30. Venture capital deals are a good proxy to evaluate the contribution of private equity and debt
funds to SME development.
23%
16%
42%
15%
4%
Direct Lending
Distressed Debt
Mezzanine
Special Situations
Venture Debt

31. After reaching a peak of US$ 52 billion in 2008, venture capital fundraising dropped
significantly following the international financial crisis. Fundraising rebounded significantly
in 2011 to US$ 42 billion followed by decrease in 2012 and 2013, and significant increase to
US$ 46 billion in 2014. In 2013, 299 venture capital funds held a final close raising a total of
US$ 31 billion globally, the smallest annual amount since 2010.
Figure 4: Proportion of Number and Aggregate Value of Venture Capital Deals by
Industry 2012 – 2014
Source: 2015 Preqin Global Private Equity Report
32. By geographical area, the main areas of focus are North America, with 55% of global dry
powder in 2013, followed by Europe (25 %) and Asia (15%). In recent years, PE investments
have increased rapidly in EMDEs, reaching US$ 34.7 billion in 2014 (See figure 5) with
emerging Asia leading with 77% of total EMDE investments (mainly driven by China and
India), followed by Latin America, with 12% (mainly driven by Brazil), Sub-Saharan Africa
(5.9%) and Central and Eastern Europe (2.8%).
33. Despite this positive evolution, the penetration of private equity and venture capital remains
low across EMDEs to date. Private equity investment to GDP were at or below 0.2 percent of
GDP across EMDEs in 2014, compared to 1.84% in Israël, 1.23% in the USA, and 0.81% in
27% 22% 25% 23% 26% 29%
18%
14%
21%20%
20% 17%
18%25%
16% 22% 15% 15%
12%9%
14% 10%15% 16%
8%8%
8% 9% 9% 7%2%
2%
3% 2% 3% 3%4% 9%3% 3% 3% 3%4% 2% 3% 4% 3% 3%3% 2% 2% 1% 2% 2%3% 3% 2% 3% 2% 2%3% 3% 3% 3% 2% 3%
0%
10%
20%
30%
40%
50%
60%
70%
80%
90%
100%
No. of Deals AggregateDealValue
No. of Deals AggregateDealValue
No. of Deals AggregateDealValue
2012 2013 2014
Pro
po
rtio
n o
f T
ota
l
Internet Software & RelatedHealthcare TelecomsOther IT Business ServicesClean Technology Consumer Discretionary

the US. The EMDE private equity financing gap is estimated at US$ 270 billion in 2014
(World Bank staff estimates).
Figure 5: Evolution on PE investments in Emerging Markets by region, in US$ billion
Source: EMPEA Database
(ii) Role of investment funds in resilient infrastructure and climate mitigation and
adaptation finance
34. Infrastructure is critical for promoting economic growth and social inclusion and for climate
mitigation and adaptation.
35. There is widespread empirical evidence that infrastructure investments have a positive
impact on growth. While the magnitude of the estimates vary greatly across empirical
studies, growth regressions using infrastructure stocks almost invariably find significant
growth effects: a 1 percent increase in physical infrastructure stocks temporarily raises GDP
growth by as much as 1-2 percentage points, although the growth acceleration gradually
tapers off as the economy approaches its long-run per capita income (See Calderon and
Serven, op.cit, 2014). Some studies also find that physical infrastructure in roads and
communications facilitates spatial access and information flows, raising labor mobility
boosting rural non-farm economies, and reducing the incidence of poverty in some
-
5.00
10.00
15.00
20.00
25.00
30.00
2009 2010 2011 2012 2013 2014
Emerging Asia China India
CEE and CIS Russia Latin America
Brazil MENA Sub-Saharan Africa
geographic areas. Recent studies on the roll-out of the electricity grid in South Africa show
that electrification leads to rising female employment, with women working nearly 9 hours
more per week in districts that experienced an average increase in electrification. Other
studies show that better road transportation systems and safer roads help raise school
attendance, while improved access to electricity allows more time to study and the use of
computers (See Calderon and Serven, op.ci. 2014). The investments in large infrastructure
required to achieve the SDGs are estimated at US$900 billion to US$1.6 trillion per year
through 2030 (See Sachs et. al, op.cit, 2015).
36. Investments in climate mitigation and adaptation are estimated at US$440 billion to US$780
billion per year over the same period. Investments in climate mitigation required to limit the
rise in average global temperatures to no more than 2 degrees Celsius relative to pre-
industrial levels (agreed at the UNFCCC in Cancun in 2010) are estimated to range from
US$380 billion to US$680 billion per year through 2030 (See Sachs et. al, op.cit 2015).
Investments in climate adaptation required to adapt to a 2 degrees Celsius warmer world are
estimated in the range of US$70 billion to US$100 billion per year through 2050 (See World
Bank, op.cit, 2010).
37. Energy production and use account for around two thirds of global greenhouse-gas (GHG)
emissions. As of mid-October 2015, more than 150 countries accounting for around 90% of
global economic activity and almost 90% of global energy-related GHG emissions have
submitted national climate pledges (Intended Nationally Determined Contributions - INDCs).
If the INDCs are implemented fully, they will help to achieve the necessary decoupling
between growth and energy-related GHG emissions. The full implementation of INDCs will
require the energy sector to invest US$13.5 trillion in energy efficiency and low-carbon
technologies over the 2015-2030 period, representing almost 40% of total energy sector
investment. Within this total, around US$8.3 trillion is needed to improve energy efficiency
in the transport, buildings and industry sectors, while much of the remaining investments are
required to decarbonize the power sector (See IEA, op. cit 2015).
38. However, the implementation of the INDCs will result in an average temperature increase of
around 2.7 degree Celsius by 2100, falling short of the UNFCCC goal. Additional measures
required to achieve the 2 degree Celsius goal (the IEA “Bridge scenario”) include improving
energy efficiency in the industry, buildings and transport sectors, phasing out the use of least-
efficient coal-fired power plants, further boosting investments in renewables-based power
generation technologies, gradually phasing-out fuel subsidies, and reducing methane
emissions from oil and gas production. This would translate into additional US$3 trillion (or
20%) of cumulative investments in energy efficiency and low-carbon technologies through
2030 (See figure 6 below).
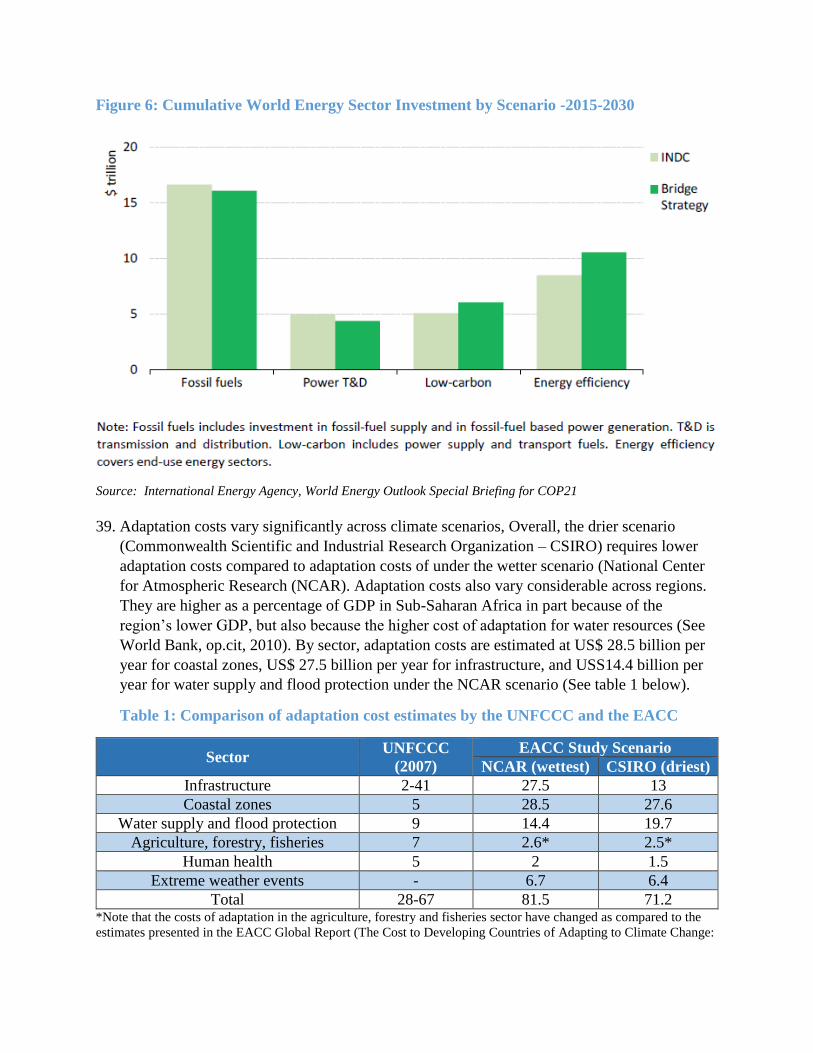
Figure 6: Cumulative World Energy Sector Investment by Scenario -2015-2030
Source: International Energy Agency, World Energy Outlook Special Briefing for COP21
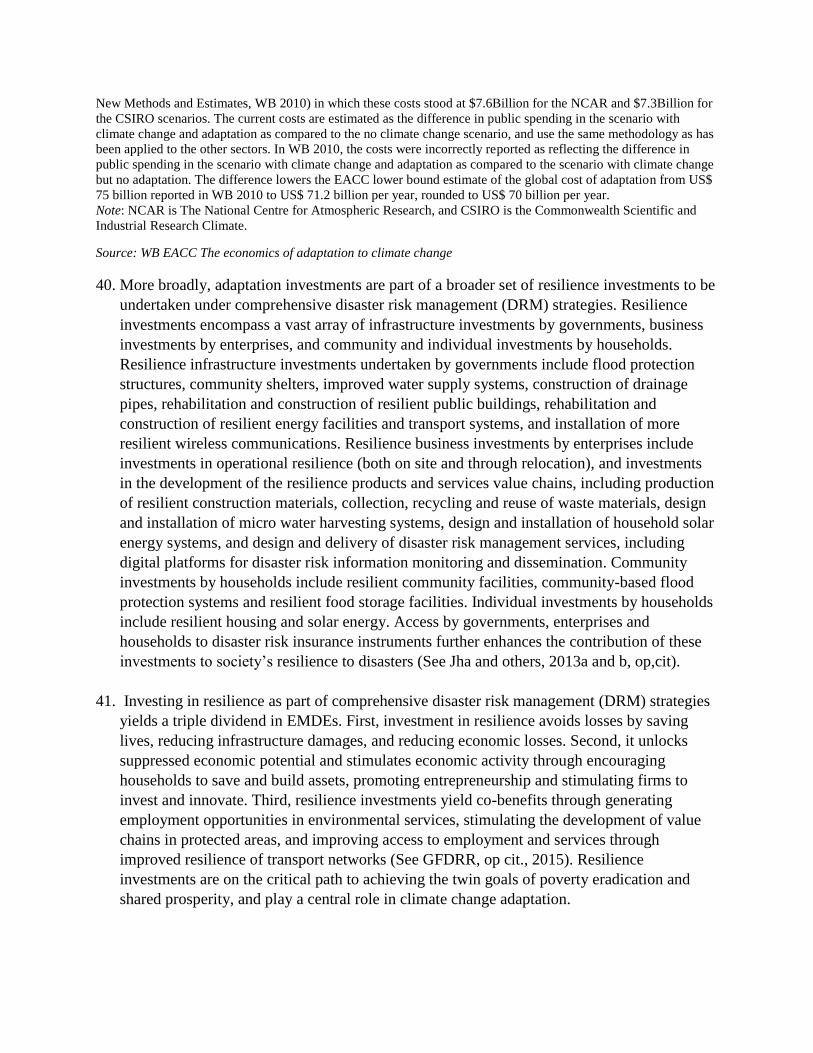
39. Adaptation costs vary significantly across climate scenarios, Overall, the drier scenario
(Commonwealth Scientific and Industrial Research Organization – CSIRO) requires lower
adaptation costs compared to adaptation costs of under the wetter scenario (National Center
for Atmospheric Research (NCAR). Adaptation costs also vary considerable across regions.
They are higher as a percentage of GDP in Sub-Saharan Africa in part because of the
region’s lower GDP, but also because the higher cost of adaptation for water resources (See
World Bank, op.cit, 2010). By sector, adaptation costs are estimated at US$ 28.5 billion per
year for coastal zones, US$ 27.5 billion per year for infrastructure, and USS14.4 billion per
year for water supply and flood protection under the NCAR scenario (See table 1 below).
Table 1: Comparison of adaptation cost estimates by the UNFCCC and the EACC
Sector UNFCCC
(2007)
EACC Study Scenario
NCAR (wettest) CSIRO (driest)
Infrastructure 2-41 27.5 13
Coastal zones 5 28.5 27.6
Water supply and flood protection 9 14.4 19.7
Agriculture, forestry, fisheries 7 2.6* 2.5*
Human health 5 2 1.5
Extreme weather events - 6.7 6.4
Total 28-67 81.5 71.2 *Note that the costs of adaptation in the agriculture, forestry and fisheries sector have changed as compared to the
estimates presented in the EACC Global Report (The Cost to Developing Countries of Adapting to Climate Change:
New Methods and Estimates, WB 2010) in which these costs stood at $7.6Billion for the NCAR and $7.3Billion for
the CSIRO scenarios. The current costs are estimated as the difference in public spending in the scenario with
climate change and adaptation as compared to the no climate change scenario, and use the same methodology as has
been applied to the other sectors. In WB 2010, the costs were incorrectly reported as reflecting the difference in
public spending in the scenario with climate change and adaptation as compared to the scenario with climate change
but no adaptation. The difference lowers the EACC lower bound estimate of the global cost of adaptation from US$
75 billion reported in WB 2010 to US$ 71.2 billion per year, rounded to US$ 70 billion per year.
Note: NCAR is The National Centre for Atmospheric Research, and CSIRO is the Commonwealth Scientific and
Industrial Research Climate.
Source: WB EACC The economics of adaptation to climate change
40. More broadly, adaptation investments are part of a broader set of resilience investments to be
undertaken under comprehensive disaster risk management (DRM) strategies. Resilience
investments encompass a vast array of infrastructure investments by governments, business
investments by enterprises, and community and individual investments by households.
Resilience infrastructure investments undertaken by governments include flood protection
structures, community shelters, improved water supply systems, construction of drainage
pipes, rehabilitation and construction of resilient public buildings, rehabilitation and
construction of resilient energy facilities and transport systems, and installation of more
resilient wireless communications. Resilience business investments by enterprises include
investments in operational resilience (both on site and through relocation), and investments
in the development of the resilience products and services value chains, including production
of resilient construction materials, collection, recycling and reuse of waste materials, design
and installation of micro water harvesting systems, design and installation of household solar
energy systems, and design and delivery of disaster risk management services, including
digital platforms for disaster risk information monitoring and dissemination. Community
investments by households include resilient community facilities, community-based flood
protection systems and resilient food storage facilities. Individual investments by households
include resilient housing and solar energy. Access by governments, enterprises and
households to disaster risk insurance instruments further enhances the contribution of these
investments to society’s resilience to disasters (See Jha and others, 2013a and b, op,cit).
41. Investing in resilience as part of comprehensive disaster risk management (DRM) strategies
yields a triple dividend in EMDEs. First, investment in resilience avoids losses by saving
lives, reducing infrastructure damages, and reducing economic losses. Second, it unlocks
suppressed economic potential and stimulates economic activity through encouraging
households to save and build assets, promoting entrepreneurship and stimulating firms to
invest and innovate. Third, resilience investments yield co-benefits through generating
employment opportunities in environmental services, stimulating the development of value
chains in protected areas, and improving access to employment and services through
improved resilience of transport networks (See GFDRR, op cit., 2015). Resilience
investments are on the critical path to achieving the twin goals of poverty eradication and
shared prosperity, and play a central role in climate change adaptation.
42. A significant part of large infrastructure investments for growth, climate mitigation and
adaptation and resilience are expected to be undertaken on balance sheet by national and sub-
national governments as part of their public investment programs and financed through
taxation or through sovereign or sub-sovereign borrowing. These public investments are
estimated at US$398 billion to US$844 billion per year for large infrastructure and at
US$140 billion to US$225 billion per year for climate adaptation and mitigation. Given fiscal
constraints, the remaining investments will need to be undertaken off-government balance
sheet through PPP SPVs financed through commercial sources. These investments amount to
US$291 billion to US$755 billion per year for large infrastructure, or 47% of the total, and
from US$300 billion to US$564 billion per year for climate adaptation and mitigation, or
72% of the total. Overall, 55% of large infrastructure and climate adaptation and mitigation
investments will need to be undertaken through PPP projects and financed from private
commercial sources, at a cost of US$591 billion to US$1.3 trillion per year through 2030
(See Sachs et.al., op.cit 2015)
43. With global savings of $ 22 trillion per year and high levels of liquidity, there would appear
to be ample capital to finance these investments. However, there is a growing mismatch
between long-term investment needs and short-term finance, particularly for infrastructure.
This mismatch is particularly acute in lower middle-income and low-income countries. While
long-term lending (above five years) represents 41% of bank lending in high-income
countries, it constitutes 24% of bank lending in upper middle-income countries and only
12% in low income and lower-middle income countries (See Sachs, 0-.cit.2015 and figure 7
below)
Figure 7: Proportion of Bank Loan Maturities by Country Income Level
Source: SDSD Working Paper, Financing Sustainable Development: Implementing the SDGs through Effective
Investment Strategies and Partnerships
44. Institutional investors in OECD member states hold over US$79 trillion in AUMs but have
only about 1 percent of their portfolio directly invested in infrastructure assets. In addition,
the vast majority of these investments are concentrated in their home markets (See Inderst
and Stewart, op.cit, 2014). In recent years, there have been increasing investments by EMDE
pension funds in infrastructure. Of the 33 pension funds that reported infrastructure
investments in 2013, 10 are from EMDEs (See Inderst and Stewart, op.cit, 2014 and OECD,
op.cit, 2013). These funds invested US$22.3 billion in infrastructure, or 5.7% of total AUM
in 2013. Investments in listed infrastructure equity amounted to 2.5% of total AUM,
compared to 2.0% for listed debt equity and 1.3% for unlisted equity. More recently, EMDE
pension funds have demonstrated an interest for investing in infrastructure funds (See para 34
and box 1 below).
45. Globally, the past ten years have witnessed the emergence of a new class of private equity
and debt funds dedicated to infrastructure investments. Starting from a very low base of US$
17 billion in 2004, AUM of unlisted infrastructure funds have increased steadily to reach
US$296 billion globally in mid-2014. The growth of the fund class continued through the
financial crisis, albeit at a slower pace in 2009 and 2010. Following the international
financial crisis in 2008, infrastructure debt funds have developed as a small but increasing
fund class. While an average of 5 new infrastructure debt funds were raised per year over the
2005-2009 period, the number of funds raised has increased to 20 in 2013, with an aggregate
capital raised of US$7.5 billion in that year.
46. Over the period, the share of infrastructure funds’ investments in emerging markets has
increased rapidly, reaching 10% of the total in 2013. By industry, the largest sector is
renewable energy, which represented 33% to 41% of the total over the 2008-2014 period,
followed by utilities (12% to 20%), transport (13% to 19%), social infrastructure (8% to
18%), and energy (8% to 15%) (See figure 9 below).
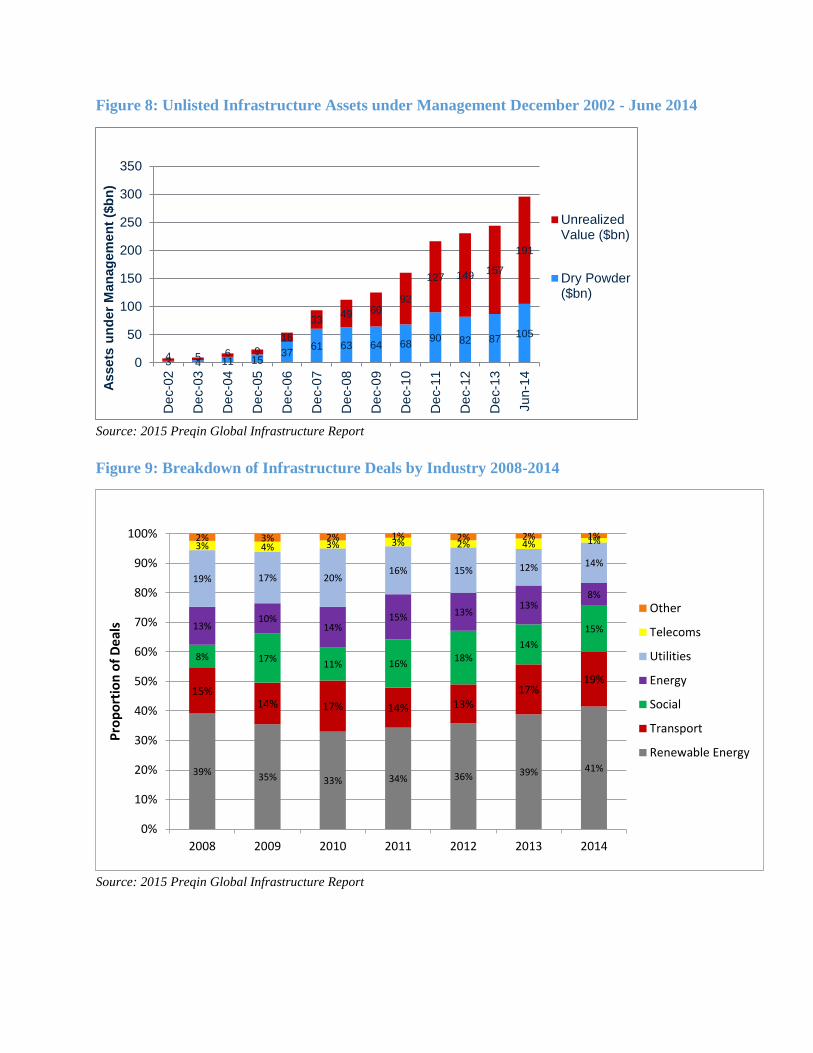
Figure 8: Unlisted Infrastructure Assets under Management December 2002 - June 2014
Source: 2015 Preqin Global Infrastructure Report
Figure 9: Breakdown of Infrastructure Deals by Industry 2008-2014
Source: 2015 Preqin Global Infrastructure Report
3 4 11 1537
61 63 64 6890 82 87
105
4 5 6 9
16
3349 60
92
127 149157
191
0
50
100
150
200
250
300
350D
ec-0
2
De
c-0
3
De
c-0
4
De
c-0
5
De
c-0
6
De
c-0
7
De
c-0
8
De
c-0
9
De
c-1
0
De
c-1
1
De
c-1
2
De
c-1
3
Jun-1
4
Assets
un
der
Man
ag
em
en
t ($
bn
)
UnrealizedValue ($bn)
Dry Powder($bn)
39% 35% 33% 34% 36% 39% 41%
15%14% 17% 14% 13%
17%19%
8% 17%11% 16%
18%14%
15%13%10%
14%15% 13%
13%8%
19% 17% 20%16% 15% 12% 14%
3% 4% 3% 3% 2% 4% 1%2% 3% 2% 1% 2% 2% 1%
0%
10%
20%
30%
40%
50%
60%
70%
80%
90%
100%
2008 2009 2010 2011 2012 2013 2014
Pro
po
rtio
n o
f D
eal
s
Other
Telecoms
Utilities
Energy
Social
Transport
Renewable Energy
47. Superannuation schemes are the leading investor type in the infrastructure fund class, with
7% and 9% of AUM of average current and target allocations in 2014 respectively, followed
by endowment plans (4.4% and 6.6%) and public pension funds (3.3% and 5.2%) (See figure
10 below).
Figure 10: Breakdown of Average Current and Target Allocations to Infrastructure by
Investor Type, 2014
Source: 2015 Preqin Global Infrastructure Report
48. In terms of performance, infrastructure funds outperformed other private equity funds over
the 2007-2014 period. Specifically, taking 2007 as a base, the Preqin infrastructure index
reached 161.0 in June 2014, compared to 142.8 for the all private equity index (See figure 11
below).
7.0%
4.4%
3.3%
2.7%3.1%
4.4%
9.0%
6.6%
5.2% 4.9%4.5% 4.4%
0.0%
1.0%
2.0%
3.0%
4.0%
5.0%
6.0%
7.0%
8.0%
9.0%
10.0%
Sup
eran
nu
atio
nSc
he
me
End
ow
me
nt
Pla
n
Pu
blic
Pe
nsi
on
Fu
nd
Pri
vate
Se
cto
rP
en
sio
n F
un
d
Fou
nd
atio
n
Ass
et
Man
ager
Ave
rage
In
fras
tru
ctu
re A
lloca
tio
n
(As
a P
rop
ort
ion
of
AU
M)
Average CurrentAllocation
Average TargetAllocation
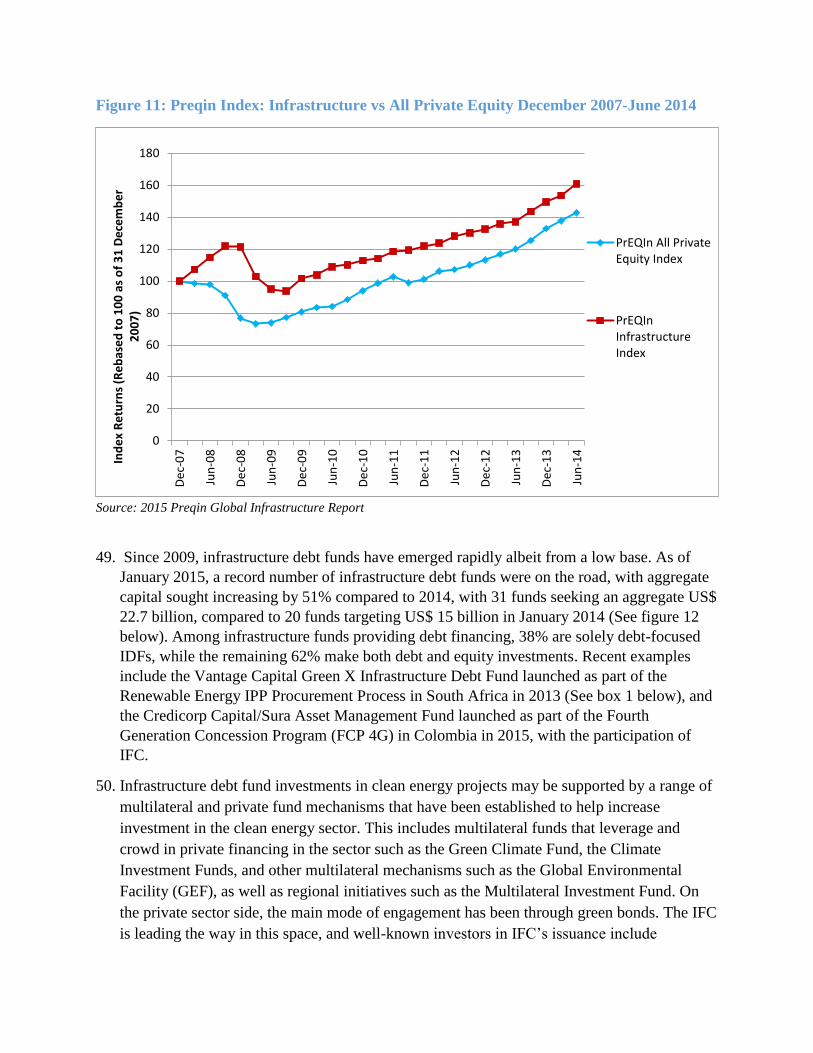
Figure 11: Preqin Index: Infrastructure vs All Private Equity December 2007-June 2014
Source: 2015 Preqin Global Infrastructure Report
49. Since 2009, infrastructure debt funds have emerged rapidly albeit from a low base. As of
January 2015, a record number of infrastructure debt funds were on the road, with aggregate
capital sought increasing by 51% compared to 2014, with 31 funds seeking an aggregate US$
22.7 billion, compared to 20 funds targeting US$ 15 billion in January 2014 (See figure 12
below). Among infrastructure funds providing debt financing, 38% are solely debt-focused
IDFs, while the remaining 62% make both debt and equity investments. Recent examples
include the Vantage Capital Green X Infrastructure Debt Fund launched as part of the
Renewable Energy IPP Procurement Process in South Africa in 2013 (See box 1 below), and
the Credicorp Capital/Sura Asset Management Fund launched as part of the Fourth
Generation Concession Program (FCP 4G) in Colombia in 2015, with the participation of
IFC.
50. Infrastructure debt fund investments in clean energy projects may be supported by a range of
multilateral and private fund mechanisms that have been established to help increase
investment in the clean energy sector. This includes multilateral funds that leverage and
crowd in private financing in the sector such as the Green Climate Fund, the Climate
Investment Funds, and other multilateral mechanisms such as the Global Environmental
Facility (GEF), as well as regional initiatives such as the Multilateral Investment Fund. On
the private sector side, the main mode of engagement has been through green bonds. The IFC
is leading the way in this space, and well-known investors in IFC’s issuance include
0
20
40
60
80
100
120
140
160
180
De
c-0
7
Jun
-08
De
c-0
8
Jun
-09
De
c-0
9
Jun
-10
De
c-1
0
Jun
-11
De
c-1
1
Jun
-12
De
c-1
2
Jun
-13
De
c-1
3
Jun
-14
Ind
ex
Re
turn
s (R
eb
ase
d t
o 1
00
as
of
31
De
cem
be
r 2
00
7)
PrEQIn All PrivateEquity Index
PrEQInInfrastructureIndex
Blackrock, State Street Global Advisors, and CalPERS. Several standards for green bonds
exists, including the Climate Bonds Standard, established by the Climate Bonds Initiative,
and the voluntary Green Bond Principles, created to reflect the commitment of large
investment banks such as JP Morgan Chase, Bank of America Merrill Lynch, Citi, HSBC,
Morgan Stanley, and many others.
Figure 12: Unlisted infrastructure debt funds in market over time: January 2006-January
2015
Source: 2015 Preqin Global Infrastructure Report
Box 1: The rise of infrastructure private equity and debt funds focused on Africa
Over the last ten years, the number of unlisted infrastructure funds with Africa as the main fund
focus has grown rapidly, reaching 36 in 2014 (see Graph B1). As a result, unlisted infrastructure
funds primarily focused on Africa had approximately US$7.5 billion of AUM at the end of 2014.
In addition, US$1.9 billion was being raised for this asset class (see Graph B2). The growth was
fastest in the 2006-07 period, before the global financial crisis, and again in the post-crisis period
with record high numbers in year 2014.
54
6
4
9
14
1716
20
31
1.82.6 3.3
0.41.9
5.9
8.09.7
15.0
22.7
0
5
10
15
20
25
30
35
Jan-06 Jan-07 Jan-08 Jan-09 Jan-10 Jan-11 Jan-12 Jan-13 Jan-14 Jan-15
No. of FundsRaising
AggregateTargetCapital ($bn)
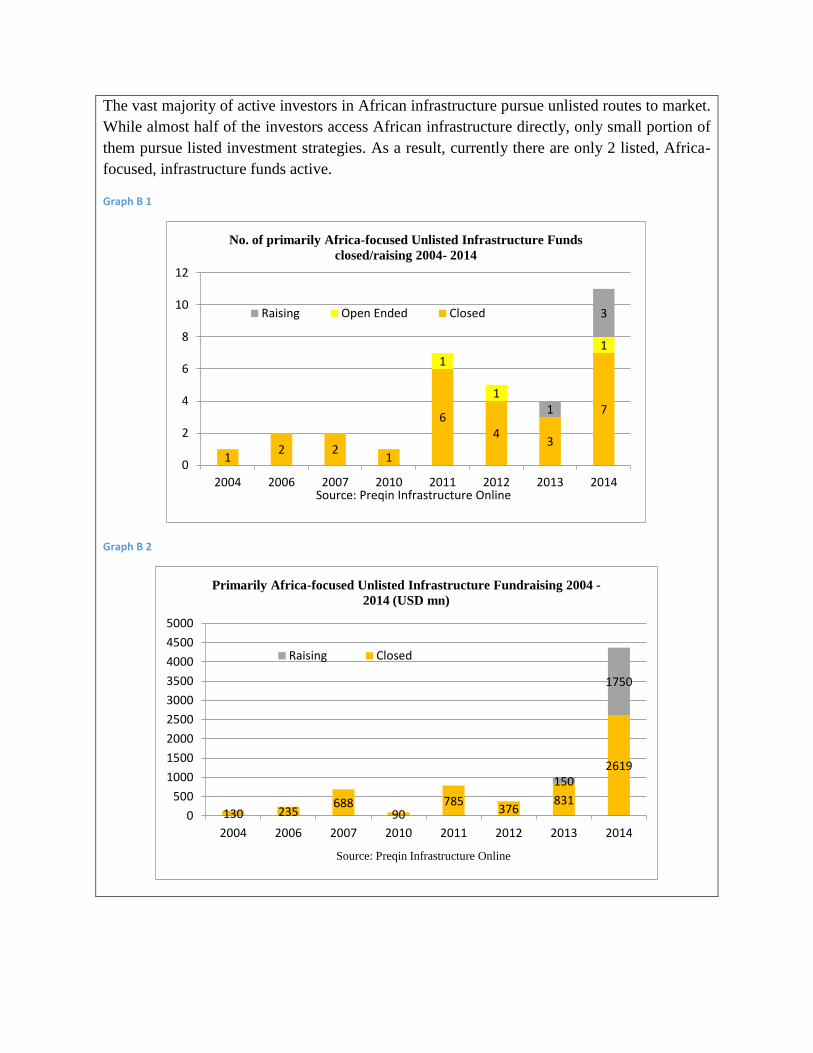
The vast majority of active investors in African infrastructure pursue unlisted routes to market.
While almost half of the investors access African infrastructure directly, only small portion of
them pursue listed investment strategies. As a result, currently there are only 2 listed, Africa-
focused, infrastructure funds active.
Graph B 1
Graph B 2
12 2
1
64
3
7
1
1
1
1
3
0
2
4
6
8
10
12
2004 2006 2007 2010 2011 2012 2013 2014Source: Preqin Infrastructure Online
No. of primarily Africa-focused Unlisted Infrastructure Funds
closed/raising 2004- 2014
Raising Open Ended Closed
130 235688
90785
376831
2619150
1750
0
500
1000
1500
2000
2500
3000
3500
4000
4500
5000
2004 2006 2007 2010 2011 2012 2013 2014
Source: Preqin Infrastructure Online
Primarily Africa-focused Unlisted Infrastructure Fundraising 2004 -
2014 (USD mn)
Raising Closed

The top ten Africa-focused funds are presented in the table below (see Table B1). Almost all of
these funds have originated in the past 5 years and half of them have started investing in the
period since 2012.
Table B 1
Box 2: The South Africa Green X Infrastructure Debt Fund
1. The Vantage GreenX Fund (GreenX) was launched as an infrastructure debt fund by Vantage
Capital Group in South Africa in November 2013. The fund first close (Note I) raised ZAR 2.5
billion entirely from South African pension and provident funds. The fund invests in senior
debt in energy and renewable energy projects in South Africa.
2. GreenX Note I focuses on deals that are structured along limited recourse project finance
principles. Investments under Note I focus on projects that have been successful in the South
Africa Department of Energy Renewable Energy IPP Procurement Process (REIPPPP). These
projects include solar plants and wind plants in the provinces of Eastern Cape, Northern Cape
and Mpumalanga. Note I focuses on refinancing of bank debt on the secondary market and is
now fully invested.
3. Vantage Capital is now raising GreenX Note II, which will have a wider remit. In addition to
projects under REIPPPP, Note II will also target investments in sustainable energy projects
which will include natural gas and cogeneration projects run by the South Africa Department
of Energy. By contrast with Note I, Note II is targeted at primary finance and aims to enter
deals post selection as preferred bidder but before financial close.
Fund Fund Manager Vintage Strategy
Final/Target
Size USD (mn) Status
Pan African Infrastructure
Development Fund II Harith 2014 Primary 1200 First Close
COMESA Infrastructure Fund PTA Bank 2014 Primary 1000 Raising
Pan African Infrastructure
Development Fund Harith 2007 Primary 630 Closed
African Infrastructure
Investment Fund II
African Infrastructure
Investment Managers 2011 Primary 500 Closed
Pembani Remgro
Infrastructure Fund
Pembani Remgro
Infrastructure
Managers 2014 Debt/Mezzanine, Primary 500 First Close
I3PA - Infrastructure PPP
Africa Fund Edifice Capital 2013 Primary 400 First Close
Encha Fund Encha Group 2014 Primary 400 Raising
Eaglestone Sub-Saharan
Africa Infrastructure Fund
Eaglestone Asset
Management 2014 Primary 350 Raising
Meridiam Infrastructure
Africa Fund Meridiam 2014 Primary 330 First Close
Mergence Renewable
Energy Portfolio
Mergence Investment
Managers 2012 Debt/Mezzanine 251 First Close
Largest Primarily Africa-targeting unlisted infrastrucutre funds by Target Size

IV: Program context/description
IV.1 Program context
51. The development of PE and debt funds for SME and infrastructure finance in EMDEs
depends on three key pillars: (i) developing the PE/VC ecosystem; (ii) developing the
framework for infrastructure PPPs; and (iii) developing Strategic Investment Funds (SIFs)
and the domestic investment component of Sovereign Wealth Funds (SWFs) as anchor
investors for international and domestic institutional investors.
IV.1.1 Developing the PE/VC ecosystem
(i) Legal and regulatory framework
52. The establishment of an efficient and transparent legal and regulatory framework is the first
element for the development of the PE/VC industry in EMDEs. This encompasses the broad
legal and regulatory framework for operations of off-shore and on-shore funds in the country,
as well as the legal and regulatory framework for the domestic registration and supervision of
on-shore funds.
53. The broad legal and regulatory framework for off-shore and on-shore fund operations in the
country includes tax treatment (tax residency for foreign investment funds, tax implications
of alternative fund legal structures, capital gains tax, withholding tax, tax efficiency for
foreign investors in domestic funds, and double taxation agreements (DTAs)), investor
protection (minority shareholder rights in investee companies, investors in funds), restrictions
on issue or transfer of shares, buyout regulations (public auction, listed companies),
protection of intellectual property rights, bankruptcy procedures and creditor rights/partner
liability, exits (listing rules on main stock exchange and on SME exchange), exchange
controls (inward investments, outward transfers of profits and capital gains), corporate
governance requirements for listed companies, and contract enforcement (court system,
dispute resolution framework) (See LAVCA, op. cit., 2013).
54. The legal and regulatory framework for the domestic registration and supervision of on-shore
funds covers fund and fund manager laws and regulations, including fund legal structures
(including fund compartments), qualified assets, qualified investors, management company
legal structure, qualification and disclosure of persons who conduct the business of the
management company, disclosure and resolution of conflicts of interest, delegation of core
manager functions, own funds, asset valuation rules, contents of fund prospectus, disclosure
to investors, auditing, reporting, depositary rules, cooperation with the supervisory agency,
and penalties for non-compliance.
(ii) Environment for investment by institutional investors in the asset class
55. The second element for the development of the PE/VC funds in EMDEs is the environment
for investment by institutional investors, including pension funds and insurance companies,
in the asset class.
56. Across many EMDEs, regulators apply a rules-based approach to the regulation of pension
funds and insurance companies, which includes the setting of fixed upper or lower limits on
portfolio allocations to specific investment instruments. For example, among 28 on-OECD
countries that responded to the OECD annual survey of investment regulation of pension
funds, only 3 countries had no limits on pension fund allocation to private investment funds,
13 had limits, and 12 did not allow investment in the asset class (See OECD, op. cit., 2014a).
57. At the same time, in a growing number of EMDEs, regulators are developing and
implementing multi-year roadmaps towards risk-based supervision of institutional investors,
which imply the progressive removal of asset allocation limits and their replacement by
allocations based on external or internal portfolio optimization models. This opens the door
for greater investment by institutional investors in the private equity and debt asset class as
part of their portfolio optimization strategies.
58. For pension funds, international best practice for the risk-based regulatory framework is the
benchmark portfolio approach. In this framework, a body independent from the government
and separate from the fund management industry establishes a target objective for pension
funds. This objective is expressed in terms of the replacement rate, ie the expected pension
income expressed as a percentage of final salary. Given the target replacement rate and the
level of contribution to the funds, a target return asset and a benchmark portfolio established
with the maximum probability of achieving the desired return with the minimum amount of
risk based on projected returns, volatility and correlations among various asset classes. The
benchmark portfolio should be a lifecycle portfolio which reduces exposure to risky assets as
individuals reach retirement. The supervisory authority then integrates this analysis into their
overall internal risk assessment of the pension funds. Under this framework, limits on
investments in specific asset classes are removed, and pension funds are free to optimize
their portfolios in line with the benchmark portfolio (Stewart, op. cit. 2014).
59. For insurance companies, the international best practice for risk-based regulatory framework
is provided by EU Solvency II and comparable frameworks such as the US insurance
financial solvency framework. Under Solvency II, companies may use either standard
formula approach or the internal model approach. Under the standard formula approach,
investments in European Venture Capital Funds (EuVECA) and in other closed-ended
alternative investment funds, including private equity funds and infrastructure funds, receive
favorable treatment in terms of capital charges (See EU, op.cit, 2015, art 168-169). Under the
internal model approach, risk capital charges are determined by the internal model of the
company as approved by the regulator. Recent research suggests that insurance companies
applying an economically sound internal model may expect significantly lower capital
charges for private equity investments (See Braun, Schmeiser and Siegel, op. cit, 2012).
(iii) Business enabling environment
60. The third element for the development of PE and debt funds in EMDEs is the business
enabling environment.
61. Globally, innovation tends to be underfinanced even in well-functioning markets as a result
of information asymmetries and appropriation risks. This problem is exacerbated for new
entrants and start-ups because they lack a track record to signal their ability to investors, and
because they produce an intangible asset that does not constitute acceptable collateral (See
Hall and Lerner, op cit, 2009). In many EMDEs, the lack of a robust and continuous pipeline
of promising start-ups, stalls the development of a strong angel investor community which
can back innovative companies in early stages, and of the associated legal and IP agreement
services. This in turn hampers the development of a stream of promising early-stage
companies in which venture funds can invest, and consequently the development of the
venture capital and PE industry.
62. This market failure can be addressed through a carefully balanced set of supply-side and
demand-side policies aimed at supporting the development of the angel investment and the
VC market (See SME Finance Forum, op.cit. 2012)
63. To develop the angel investment market, key supply-side policies include tax credits for
angel investors, seed funds that co-invest with qualified angel investor groups, and technical
assistance and training for angel investor groups. Angel group training may include platform
set-up, group management, deal sourcing and due diligence, investment tracking,
entrepreneur mentorship, follow-on financing and exit management (See InfoDev, op.cit,
2014a and b). Key demand-side measures include entrepreneurship training and support to
the development of a network of business incubators and business accelerators, based on
three groups of best practices: (i) incubator creation and management, including strategy.
positioning and long-term sustainability, and internal organization and governance; (ii)
incubation process, including admission, incubation and exit mechanisms, and (iii)
performance assessment, including monitoring and evaluation for incubator and added value
of the incubator in fostering business development. In many countries, the development of
the angel investment market requires resolution of coordination failures, in particular the
development of close linkages between university research and business incubators and
between business incubators and accelerators and angel investor groups (See Infodev, op.cit,
2002).
64. The development of the VC market also depends on a careful balance between supply-side
and demand-side policies. On the supply-side, an increasing number of EMDEs are setting
up hybrid funds to stimulate equity finance to capital constrained but high potential, early-
stage enterprises. In these hybrid structures, the government participates as a LP together
with institutional investors and leaves full operational autonomy to the GP fund manager,
following similar models developed in the US, UK and Australia. Hybrid funds employ a
variety of investor return enhancing mechanisms including differential timing of investment
draw-downs of public and private investors, leveraging the returns of private investors with
debt, capping the profit entitlement of the public investor, and partial guarantee of
compensation to the private investor for loss of invested capital. In addition, mechanisms are
used to skew the risk-return trade-off for the GP to compensate for small fund size and/or the
small carry of VC funds, with the objective to avoid adverse selection of fund managers with
less experience and lower opportunity costs (See Murray, op cit. 2012). In parallel, several
EMDEs are designing and implementing reimbursable technical assistance funds (TAFs)
with the objective to support VC funds in reaching down to smaller deal sizes (See
Divakaran et al, op.cit, 2014). On the demand-side, governments are developing
comprehensive entrepreneurship policies, including networking, mentorship, and promotion
of entrepreneurship training at all levels of the education system. Globally, the SME Finance
Forum has developed “Enterprise for All” as a comprehensive entrepreneurship on-line
training portal (See SME Finance Forum, 2013).
IV.1.2 Develop the framework for infrastructure PPPs
65. The development of a comprehensive framework for the delivery of the PPP program is
critical to mobilize private equity and debt funds for infrastructure finance in a country. The
framework covers the objectives of the PPP program, its scope, legal and administrative
instruments, procedures and decision criteria, institutional responsibilities, management of
fiscal commitments, and program oversight.
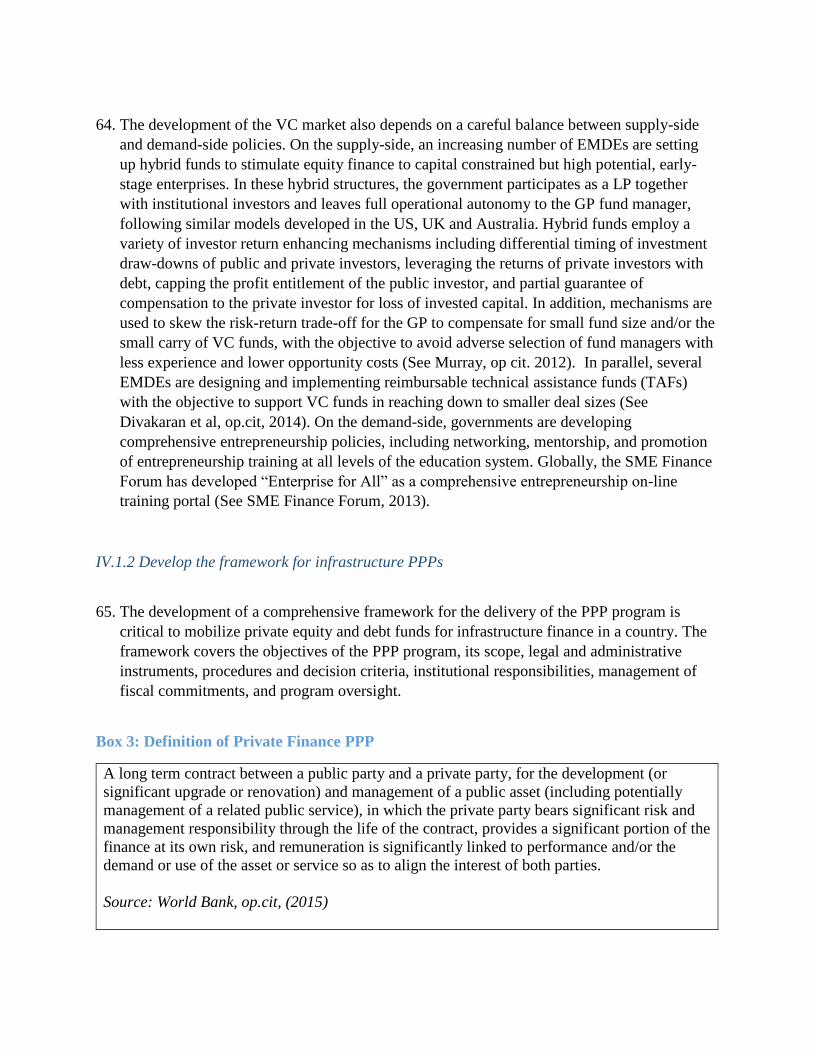
Box 3: Definition of Private Finance PPP
A long term contract between a public party and a private party, for the development (or
significant upgrade or renovation) and management of a public asset (including potentially
management of a related public service), in which the private party bears significant risk and
management responsibility through the life of the contract, provides a significant portion of the
finance at its own risk, and remuneration is significantly linked to performance and/or the
demand or use of the asset or service so as to align the interest of both parties.
Source: World Bank, op.cit, (2015)

66. Framework objectives may vary considerably across countries. These may include enabling
more investment in infrastructure by increasing project financing options, achieving value for
money, improving accountability in the provision of infrastructure and public services,
harnessing private sector innovation and efficiency, and stimulating growth and development
in the country (see World Bank, op.ci. 2015).
67. Framework scopes may be defined by jurisdiction, sector, project size, and contract type. In
countries with established PPP programs, PPP frameworks are often applied across all
sectors, and in some cases across multiple jurisdictions (sovereign and sub-sovereign levels).
Unified frameworks have the advantage of great efficiency for the private sector resulting in
greater bidder interest. On the other hand, unified framework are difficult to develop and
inflexible to change, and may not be able to address unique infrastructure challenges in
specific sectors. In federal systems, unified frameworks promulgated by the federal
government may not extend to sub-national levels of government and may need to be
supplemented by separate frameworks at the sub-national level. Unified frameworks may
also vary in terms of sectoral coverage depending on the infrastructure development priorities
of the country. Many frameworks also establish a minimum size for PPP projects below
which it would not be economically feasible to structure a PPP given the high transaction
costs of this contractual structure. Finally, the framework may define the types of PPP
contracts allowed in the country, which may fall into two main categories: (i) government
pay contracts, in which public bodies are purchasers of services from the private sector; and
(ii) user-pay or concession contracts, in which the private sector leases a government asset,
delivers public services and generates income from supplying the service. (See World Bank,
op.cit, 2015).
68. The legal and administrative instruments to support the PPP framework vary greatly across
countries based on their legal tradition. While concession contracts have a long history in
civil law countries, investor-owned utilities have provided used-pay infrastructure services in
common law countries. Common law countries also developed the government pays PPP
model, which has progressively been adopted in an increasing number of civil law countries.
At the same time, mixed models have emerged, in which user pays PPPs have some level of
government payment. In general, common law countries often use policy documents, not
laws to establish PPP frameworks, although some common law jurisdictions may pass PPP
laws in order to override existing laws that prevent PPP transactions (See World Bank, op.cit.
2015).
69. At the core of the PPP framework are the set of procedures and decision criteria for the
preparation and completion of PPP transactions (See Box 4 below).
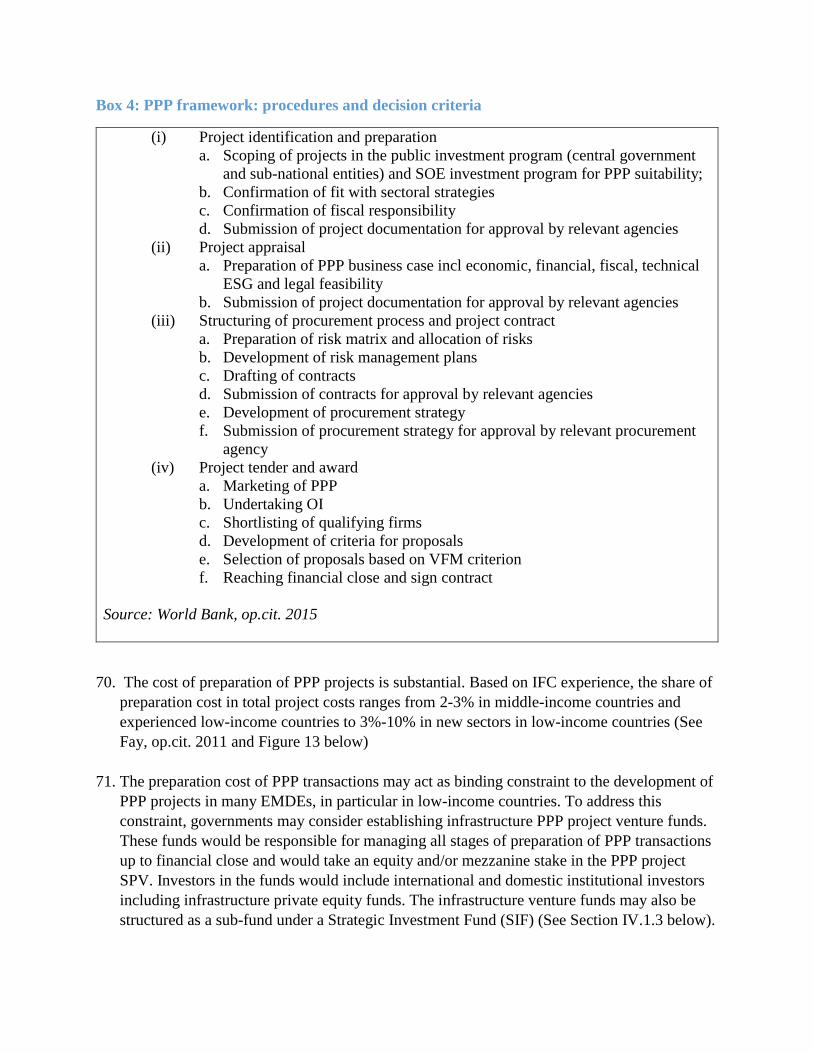
Box 4: PPP framework: procedures and decision criteria
(i) Project identification and preparation
a. Scoping of projects in the public investment program (central government
and sub-national entities) and SOE investment program for PPP suitability;
b. Confirmation of fit with sectoral strategies
c. Confirmation of fiscal responsibility
d. Submission of project documentation for approval by relevant agencies
(ii) Project appraisal
a. Preparation of PPP business case incl economic, financial, fiscal, technical
ESG and legal feasibility
b. Submission of project documentation for approval by relevant agencies
(iii) Structuring of procurement process and project contract
a. Preparation of risk matrix and allocation of risks
b. Development of risk management plans
c. Drafting of contracts
d. Submission of contracts for approval by relevant agencies
e. Development of procurement strategy
f. Submission of procurement strategy for approval by relevant procurement
agency
(iv) Project tender and award
a. Marketing of PPP
b. Undertaking OI
c. Shortlisting of qualifying firms
d. Development of criteria for proposals
e. Selection of proposals based on VFM criterion
f. Reaching financial close and sign contract
Source: World Bank, op.cit. 2015
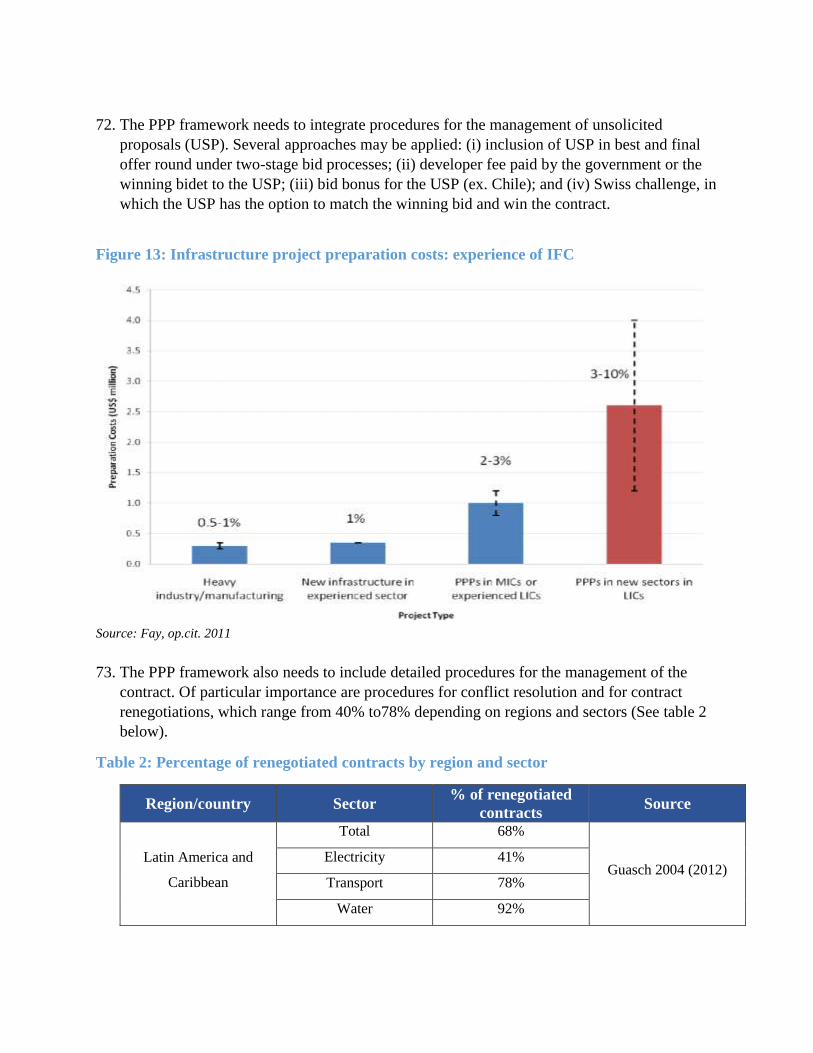
70. The cost of preparation of PPP projects is substantial. Based on IFC experience, the share of
preparation cost in total project costs ranges from 2-3% in middle-income countries and
experienced low-income countries to 3%-10% in new sectors in low-income countries (See
Fay, op.cit. 2011 and Figure 13 below)
71. The preparation cost of PPP transactions may act as binding constraint to the development of
PPP projects in many EMDEs, in particular in low-income countries. To address this
constraint, governments may consider establishing infrastructure PPP project venture funds.
These funds would be responsible for managing all stages of preparation of PPP transactions
up to financial close and would take an equity and/or mezzanine stake in the PPP project
SPV. Investors in the funds would include international and domestic institutional investors
including infrastructure private equity funds. The infrastructure venture funds may also be
structured as a sub-fund under a Strategic Investment Fund (SIF) (See Section IV.1.3 below).
72. The PPP framework needs to integrate procedures for the management of unsolicited
proposals (USP). Several approaches may be applied: (i) inclusion of USP in best and final
offer round under two-stage bid processes; (ii) developer fee paid by the government or the
winning bidet to the USP; (iii) bid bonus for the USP (ex. Chile); and (iv) Swiss challenge, in
which the USP has the option to match the winning bid and win the contract.
Figure 13: Infrastructure project preparation costs: experience of IFC
Source: Fay, op.cit. 2011
73. The PPP framework also needs to include detailed procedures for the management of the
contract. Of particular importance are procedures for conflict resolution and for contract
renegotiations, which range from 40% to78% depending on regions and sectors (See table 2
below).
Table 2: Percentage of renegotiated contracts by region and sector
Region/country Sector % of renegotiated
contracts Source
Latin America and
Caribbean
Total 68%
Guasch 2004 (2012) Electricity 41%
Transport 78%
Water 92%
US Highways 40% Engel Fischer &
Galetovic 2011
France Highways 50%
Atthias and Saussier
2007
Parking 73% Beuve et al. 2013
UK All sectors 55% NOA 2011
Source: International Transport Forum, Discussion paper 2014-8
IV.1.3 Develop strategic investment funds (SIFs) and the domestic investment component of
SWFs
74. Sovereign Wealth Funds (SWFs) hold about US$6.5 trillion in assets. Responding to the funds’
objectives to sterilize large export windfalls, save for future generations, and balance risks and
returns, their holdings have traditionally focused on external assets, primarily securities traded
in major markets but also real estate and other investments. Some SWFs with long-term
investment horizons have invested in infrastructure, but these investments have mainly been
in other countries, in high-return existing infrastructure or low-risk new infrastructure projects
located in middle and high-income economies. Until recently, domestic greenfield
infrastructure investment was largely uncharted territory.
Figure 14: Aggregate Sovereign Wealth Fund Asset Under Management ($ tn), 2008-2015
Source: The 2015 Preqin Sovereign Wealth Fund Review
3.07 3.223.59
3.95
4.62
5.38
6.31
0
1
2
3
4
5
6
7
0
1
2
3
4
5
6
7
Dec-08 Dec-09 Dec-10 Dec-11 Dec-12 Dec-13 Mar-15
Axi
s Ti
tle
Ag
gre
gat
e S
WF
Ass
ets
un
der
M
anag
emen
t ($
tn
)
Other
Hydrocarbon
Total
75. A number of the SWFs established since the turn of the millennium have been set up to
undertake strategic domestic investment, including several of the Gulf funds, Kazakhstan’s
Samruk-Kazyna and Malaysia’s Kazanah. During the last four years, Nigeria and Angola have
established funds with a domestic investment function. More are in the making or are being
discussed, including in Kenya, Myanmar, Mongolia, Tanzania, Uganda, Mozambique, Sierra
Leone, and elsewhere. These funds will be capitalized by revenue from oil or mineral exports.
Currently, 12 members of the International Forum for SWFs (IFSWF) have domestic and/or
strategic mandates. The use of SWFs as a tool for strategic domestic investments opens up a
range of new possibilities for deepening undercapitalized domestic financial markets and
crowding in private capital to infrastructure in priority sectors such as power and transport.
However, the approach also carries significant risk, and previous experience suggests great
caution.
76. The interest in SWFs as a tool for strategic domestic investment is driven by four distinct
factors. First, although several high-income countries have strategic investment funds, the
countries currently contemplating strategic investment functions for their planned funds tend
to be low and middle-income with a large infrastructure deficit and looking for ways to increase
infrastructure investment. Second, amongst governments and international financial
institutions, there has been a loosening in the interpretation of the permanent income
hypothesis, which holds that countries should save enough of their revenues from non-
renewable resources abroad to maintain a permanent income flow into the indefinite future. If
returns are higher at home than abroad, or if future generations can be expected to be wealthier
than the current one, it might make sense to save less and invest more at home now. Third, the
global financial crisis and shrinking aid flows have led to decreased availability of long-term
finance for developing countries, which have been looking to supplement foreign capital with
their own. Fourth, public investment in low-income countries frequently poses significant
management and governance challenges, including low capacity, weak governance and
regulation, and lack of coordination among public entities. Given this type of shortcomings,
many countries have not been able to offset the depletion of their natural resources by
investment in produced capital, as is required to maintain wealth and sustain growth (Hartwick
rule). In this type of setting, some governments may see a fund as a means to improve the
quality of public spending, and crowd in private investors to strengthen investment discipline.
77. In parallel with the increased allocation by oil- or mineral-based SWFs to domestic investment,
a growing number of EMDEs are establishing Strategic Investment Funds (SIFs), funded by
fiscal surpluses, borrowing or other non-resource revenues, to serve as anchor investors for
international private equity and debt funds interested in investing in the domestic economy, in
particular in infrastructure PPPs and in SME funds. This is in line with similar funds
established in advanced countries and regions, such as BPI (France), FSI (Italy), and more
recently by the European Fund for Strategic Investments (EFSI).
78. SWFs that invest domestically and SIFs face many of the same challenges, whereas others are
specific to each. SWFs that are capitalized by inflows of foreign exchange from oil or mineral
sales must address macroeconomic challenges such as exchange rate appreciation (Dutch
disease) and macroeconomic volatility. To avoid contributing to asset bubbles, macroeconomic
volatility and exchange rate appreciation, SWFs domestic investment needs coordination with
overall fiscal and monetary policy, especially if the fund is large relative to the size of the
national economy. It is imperative to determine the appropriate allocations to domestic
investment and foreign savings. Also, the political economy of resource-based SWFs differs
from that of SIFs, since resource funds do not need to raise capital in financial markets, and do
not rely on fiscal surpluses. This arguably makes SWFs that invest domestically more
vulnerable than SIFs to political interference, in turn putting the wealth objectives of the SWFs
at risk.
79. In terms of their domestic investment function, SWFs that invest domestically and SIFs take
on very similar roles. In both cases, their main objective(s) is to i) act as anchor investors for
strategic infrastructure PPPs that may provide economic externalities, such as the stimulation
of private investments and jobs, which are not fully captured by its financial return; or they
may (ii) be used to improve the access to capital for SMEs by co-financing with private
investors in the SME financing space. The use of SWFs and SIFs for domestic investment
generates a number of challenges with regard to governance, mandate, and policy.
80. The legal, regulatory, and institutional environment in LICs and MICs that wish to establish
SIFs or SWFs with a domestic investment function may require significant upgrading for such
funds to be able to operate efficiently. This may include reviews of the legal and regulatory
framework for: i) private equity and private debt funds; ii) limited partnerships; iii) investments
by domestic insurance companies and pension funds in the private equity and debt asset class;
and iv) inward investment, outward repatriation of distributions and dividends, and double
taxation treaties.
81. Although the risks of SWFs and SIFs domestic investment cannot be eliminated, mitigation of
these risks is possible. For SWFs and SIFs alike there should be a clear separation between the
type of investments that can be undertaken by the funds, and investments that should go
through the government budget. In that regard, allowing the SWF/SIF to undertake only
investments that can be expected to yield a combined commercial and economic return (double
trigger) can strengthen the integrity and discipline of the investment process.
82. Investing with private investors, pooling with other SWFs, and co-financing with the regional
development banks can help the fund to reduce risk, bring in additional expertise and enhance
the credibility of the investment decision. As an example, the Nigeria Infrastructure Fund, the
domestic subsidiary of the Nigeria Sovereign Investment Authority, has signed cooperation
agreements with the Africa Finance Corporation, the IFC and, for power sector investments,
with General Electric. Limiting investments to minority shares serves to reduce risks of
politically motivated allocations.
83. Funds need strong corporate governance, professional staffing, transparent reporting, and
independent audit. There is a large body of knowledge on effective corporate governance,
including the Santiago Principles, the Revised Guidelines for Foreign Exchange Reserves, and
general principles of corporate governance, including for state owned enterprises, published
by the OECD. Independent nominating committees, as well as clear skill requirements, can
facilitate the independence of boards. Ownership and supervisory roles should be clearly
separated. To operate as an expert investor, fund need to be staffed with qualified professionals,
a capacity that may need to be built up over time.
84. IFG support for the establishment of SWFs that invest domestically, mainly funded by RAS
and TFs, has so far focused on early stage mapping and benchmarking of options with regard
to the funds’ role; mandate; macroeconomic policy (stabilization, allocation to foreign savings
vs. domestic investment); governance, ownership, and oversight structures; management
structure; and investment strategy including investment horizon, liquidity requirements,
eligible investment universe, and strategic asset allocation. Increasingly, as governments
advance in the process of setting up SIFs/SWFs domestic investment function, demand
includes contractual relations with the funds’ counterparts, in particular with external
investment managers.
85. IFG support for the establishment of SIFs has been structured as to include i) international
benchmarking of role and modes of intervention of Sovereign Wealth Funds and Strategic
Investment Funds in infrastructure finance, ii) assessment of in-country infrastructure
financing needs and demand, iii) assessment and definition of fund strategy to enable it to act
as a financial adviser and a financier through the development of optimal financial instruments
for PPP projects, iv) capacity building for the funds through the preparation of PPP pilot
transactions, and v) support for the implementation of recommendations with regard to the
above components through the establishment of the most optimal financial instruments
(venture and/or equity and/or debt fund) and through the preparation of specific PPP
transactions. In this space, IFG will be coordinating closely with multilateral and private funds
and instruments aimed at crowding in private investment in climate adaptation and mitigation,
including in green energy.
IV.2 Program activities
IV.2.1 Global engagements
IFG global engagements has five main components:
Manage a global focus point for investment professionals in the SWF/SIF and
PE/VC space, through the Investment Funds CoP and its two open online platforms.
Co-hosts for the two open platforms are, respectively, The Fletcher Network for
Sovereign Wealth and Global Capital at Tufts University (SWF C4D platform), and
the Emerging Markets Private Equity Association (EMPEA (PE/VC C4D platform).
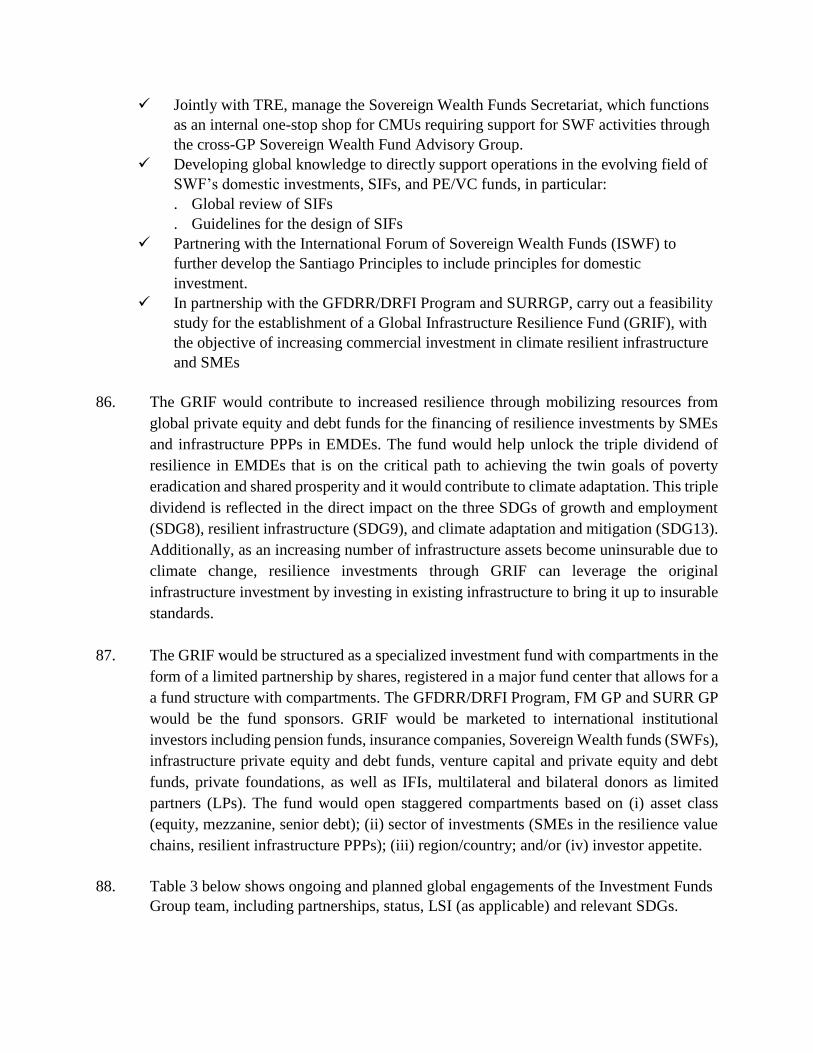
Jointly with TRE, manage the Sovereign Wealth Funds Secretariat, which functions
as an internal one-stop shop for CMUs requiring support for SWF activities through
the cross-GP Sovereign Wealth Fund Advisory Group.
Developing global knowledge to directly support operations in the evolving field of
SWF’s domestic investments, SIFs, and PE/VC funds, in particular:
. Global review of SIFs
. Guidelines for the design of SIFs
Partnering with the International Forum of Sovereign Wealth Funds (ISWF) to
further develop the Santiago Principles to include principles for domestic
investment.
In partnership with the GFDRR/DRFI Program and SURRGP, carry out a feasibility
study for the establishment of a Global Infrastructure Resilience Fund (GRIF), with
the objective of increasing commercial investment in climate resilient infrastructure
and SMEs
86. The GRIF would contribute to increased resilience through mobilizing resources from
global private equity and debt funds for the financing of resilience investments by SMEs
and infrastructure PPPs in EMDEs. The fund would help unlock the triple dividend of
resilience in EMDEs that is on the critical path to achieving the twin goals of poverty
eradication and shared prosperity and it would contribute to climate adaptation. This triple
dividend is reflected in the direct impact on the three SDGs of growth and employment
(SDG8), resilient infrastructure (SDG9), and climate adaptation and mitigation (SDG13).
Additionally, as an increasing number of infrastructure assets become uninsurable due to
climate change, resilience investments through GRIF can leverage the original
infrastructure investment by investing in existing infrastructure to bring it up to insurable
standards.
87. The GRIF would be structured as a specialized investment fund with compartments in the
form of a limited partnership by shares, registered in a major fund center that allows for a
a fund structure with compartments. The GFDRR/DRFI Program, FM GP and SURR GP
would be the fund sponsors. GRIF would be marketed to international institutional
investors including pension funds, insurance companies, Sovereign Wealth funds (SWFs),
infrastructure private equity and debt funds, venture capital and private equity and debt
funds, private foundations, as well as IFIs, multilateral and bilateral donors as limited
partners (LPs). The fund would open staggered compartments based on (i) asset class
(equity, mezzanine, senior debt); (ii) sector of investments (SMEs in the resilience value
chains, resilient infrastructure PPPs); (iii) region/country; and/or (iv) investor appetite.
88. Table 3 below shows ongoing and planned global engagements of the Investment Funds
Group team, including partnerships, status, LSI (as applicable) and relevant SDGs.
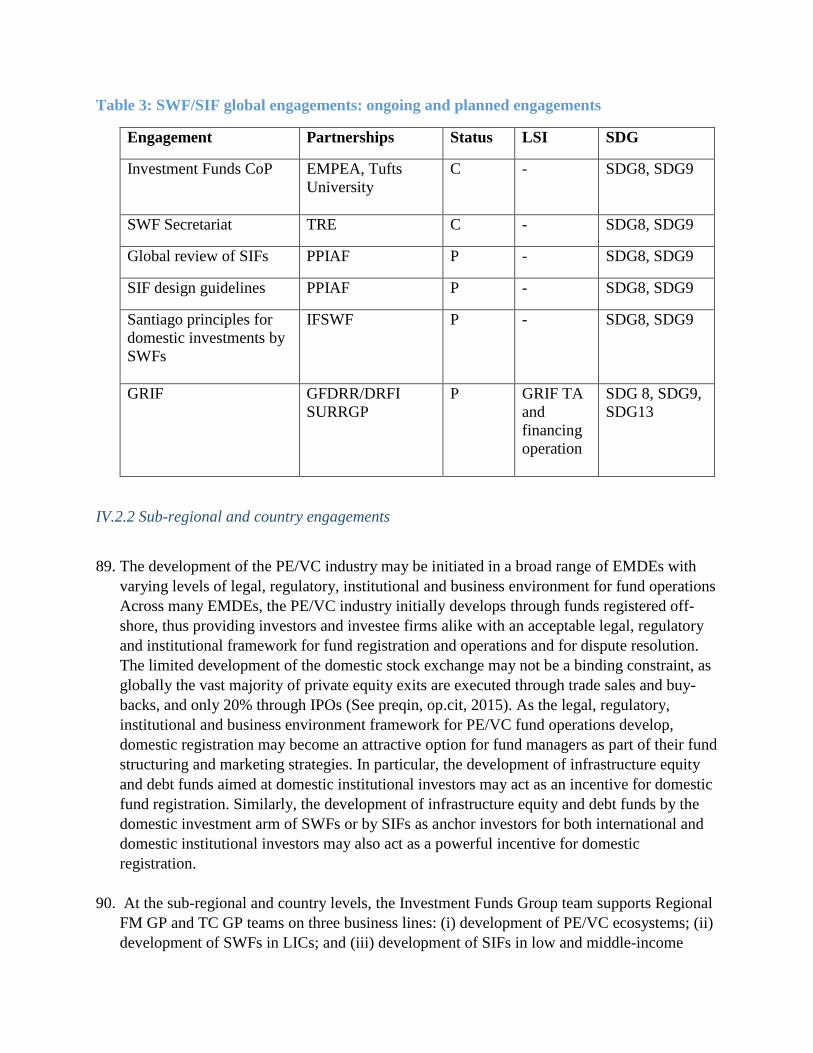
Table 3: SWF/SIF global engagements: ongoing and planned engagements
Engagement Partnerships Status LSI SDG
Investment Funds CoP EMPEA, Tufts
University
C - SDG8, SDG9
SWF Secretariat TRE C - SDG8, SDG9
Global review of SIFs PPIAF P - SDG8, SDG9
SIF design guidelines PPIAF P - SDG8, SDG9
Santiago principles for
domestic investments by
SWFs
IFSWF P - SDG8, SDG9
GRIF GFDRR/DRFI
SURRGP
P GRIF TA
and
financing
operation
SDG 8, SDG9,
SDG13
IV.2.2 Sub-regional and country engagements
89. The development of the PE/VC industry may be initiated in a broad range of EMDEs with
varying levels of legal, regulatory, institutional and business environment for fund operations
Across many EMDEs, the PE/VC industry initially develops through funds registered off-
shore, thus providing investors and investee firms alike with an acceptable legal, regulatory
and institutional framework for fund registration and operations and for dispute resolution.
The limited development of the domestic stock exchange may not be a binding constraint, as
globally the vast majority of private equity exits are executed through trade sales and buy-
backs, and only 20% through IPOs (See preqin, op.cit, 2015). As the legal, regulatory,
institutional and business environment framework for PE/VC fund operations develop,
domestic registration may become an attractive option for fund managers as part of their fund
structuring and marketing strategies. In particular, the development of infrastructure equity
and debt funds aimed at domestic institutional investors may act as an incentive for domestic
fund registration. Similarly, the development of infrastructure equity and debt funds by the
domestic investment arm of SWFs or by SIFs as anchor investors for both international and
domestic institutional investors may also act as a powerful incentive for domestic
registration.
90. At the sub-regional and country levels, the Investment Funds Group team supports Regional
FM GP and TC GP teams on three business lines: (i) development of PE/VC ecosystems; (ii)
development of SWFs in LICs; and (iii) development of SIFs in low and middle-income
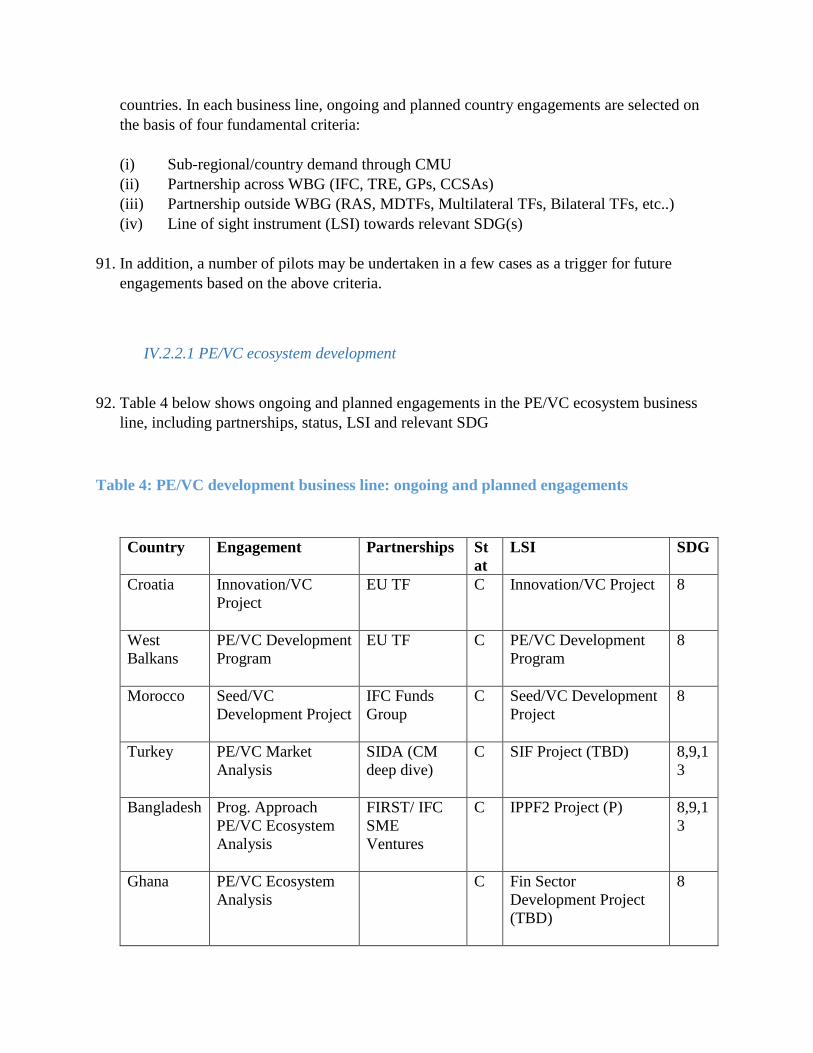
countries. In each business line, ongoing and planned country engagements are selected on
the basis of four fundamental criteria:
(i) Sub-regional/country demand through CMU
(ii) Partnership across WBG (IFC, TRE, GPs, CCSAs)
(iii) Partnership outside WBG (RAS, MDTFs, Multilateral TFs, Bilateral TFs, etc..)
(iv) Line of sight instrument (LSI) towards relevant SDG(s)
91. In addition, a number of pilots may be undertaken in a few cases as a trigger for future
engagements based on the above criteria.
IV.2.2.1 PE/VC ecosystem development
92. Table 4 below shows ongoing and planned engagements in the PE/VC ecosystem business
line, including partnerships, status, LSI and relevant SDG
Table 4: PE/VC development business line: ongoing and planned engagements
Country
Engagement Partnerships St
at
LSI SDG
Croatia
Innovation/VC
Project
EU TF C Innovation/VC Project 8
West
Balkans
PE/VC Development
Program
EU TF C PE/VC Development
Program
8
Morocco
Seed/VC
Development Project
IFC Funds
Group
C Seed/VC Development
Project
8
Turkey
PE/VC Market
Analysis
SIDA (CM
deep dive)
C SIF Project (TBD) 8,9,1
3
Bangladesh
Prog. Approach
PE/VC Ecosystem
Analysis
FIRST/ IFC
SME
Ventures
C IPPF2 Project (P) 8,9,1
3
Ghana
PE/VC Ecosystem
Analysis
- - C Fin Sector
Development Project
(TBD)
8
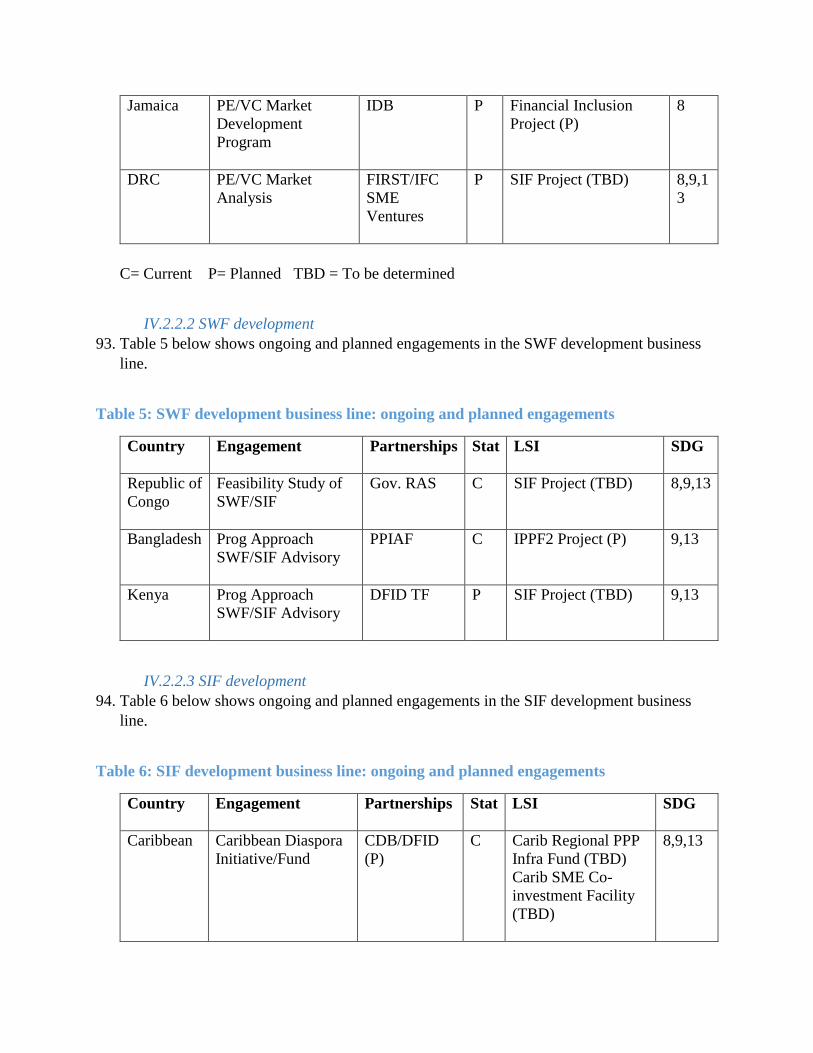
Jamaica
PE/VC Market
Development
Program
IDB P Financial Inclusion
Project (P)
8
DRC
PE/VC Market
Analysis
FIRST/IFC
SME
Ventures
P SIF Project (TBD) 8,9,1
3
C= Current P= Planned TBD = To be determined
IV.2.2.2 SWF development
93. Table 5 below shows ongoing and planned engagements in the SWF development business
line.
Table 5: SWF development business line: ongoing and planned engagements
Country
Engagement Partnerships Stat LSI SDG
Republic of
Congo
Feasibility Study of
SWF/SIF
Gov. RAS C SIF Project (TBD) 8,9,13
Bangladesh
Prog Approach
SWF/SIF Advisory
PPIAF C IPPF2 Project (P) 9,13
Kenya
Prog Approach
SWF/SIF Advisory
DFID TF P SIF Project (TBD) 9,13
IV.2.2.3 SIF development
94. Table 6 below shows ongoing and planned engagements in the SIF development business
line.
Table 6: SIF development business line: ongoing and planned engagements
Country
Engagement Partnerships Stat LSI SDG
Caribbean
Caribbean Diaspora
Initiative/Fund
CDB/DFID
(P)
C Carib Regional PPP
Infra Fund (TBD)
Carib SME Co-
investment Facility
(TBD)
8,9,13
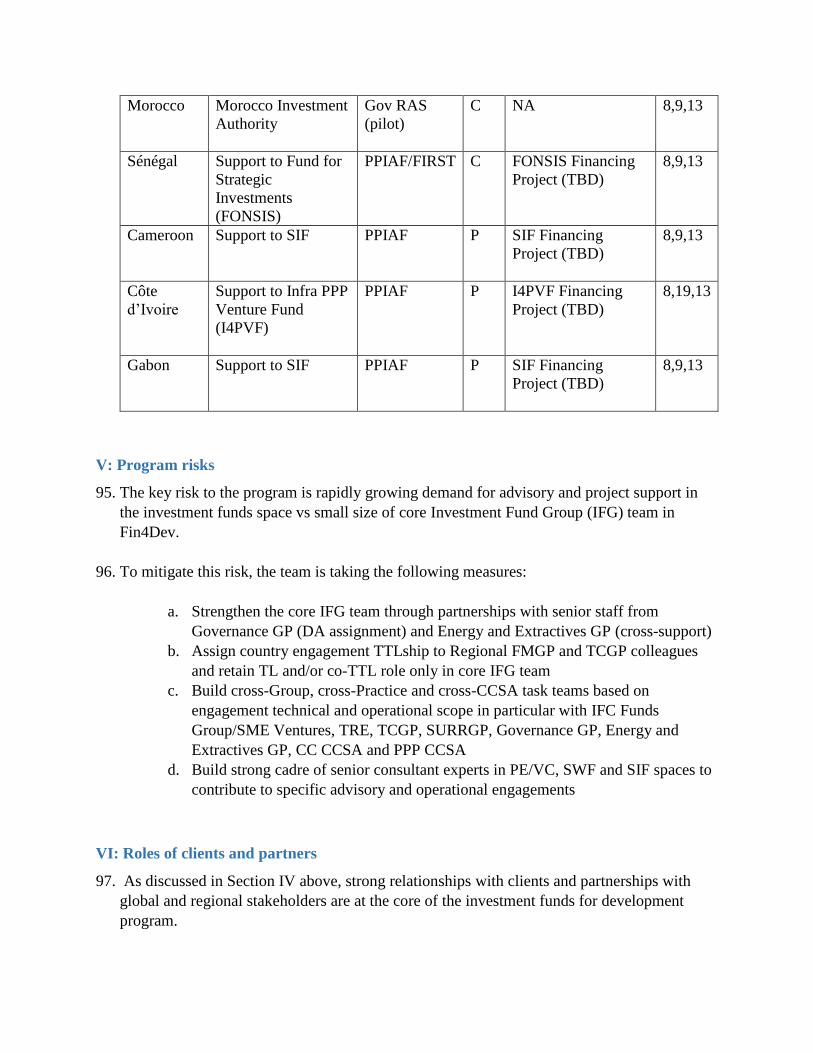
Morocco
Morocco Investment
Authority
Gov RAS
(pilot)
C NA 8,9,13
Sénégal
Support to Fund for
Strategic
Investments
(FONSIS)
PPIAF/FIRST C FONSIS Financing
Project (TBD)
8,9,13
Cameroon
Support to SIF PPIAF P SIF Financing
Project (TBD)
8,9,13
Côte
d’Ivoire
Support to Infra PPP
Venture Fund
(I4PVF)
PPIAF P I4PVF Financing
Project (TBD)
8,19,13
Gabon
Support to SIF PPIAF P SIF Financing
Project (TBD)
8,9,13
V: Program risks
95. The key risk to the program is rapidly growing demand for advisory and project support in
the investment funds space vs small size of core Investment Fund Group (IFG) team in
Fin4Dev.
96. To mitigate this risk, the team is taking the following measures:
a. Strengthen the core IFG team through partnerships with senior staff from
Governance GP (DA assignment) and Energy and Extractives GP (cross-support)
b. Assign country engagement TTLship to Regional FMGP and TCGP colleagues
and retain TL and/or co-TTL role only in core IFG team
c. Build cross-Group, cross-Practice and cross-CCSA task teams based on
engagement technical and operational scope in particular with IFC Funds
Group/SME Ventures, TRE, TCGP, SURRGP, Governance GP, Energy and
Extractives GP, CC CCSA and PPP CCSA
d. Build strong cadre of senior consultant experts in PE/VC, SWF and SIF spaces to
contribute to specific advisory and operational engagements
VI: Roles of clients and partners
97. As discussed in Section IV above, strong relationships with clients and partnerships with
global and regional stakeholders are at the core of the investment funds for development
program.
98. At the global level, critical partnerships are:
a. The Public-Private Infrastructure Advisory Facility (PPIAF), as multi-donor
forum for building ownership and for supporting the preparation of the global
review of SIFs and the preparation of guidelines for the design of SIFs.
b. The International Forum of Sovereign Wealth Funds (ISWF), as international
standard setter for SWFs governance (Santiago Principles)
c. The Emerging Markets Private Equity Association (EMPEA), as co-manager of
the PE/VC C4D platform
d. The Fletcher Network for Sovereign Wealth and Global Capital (FNSWGC), as
co-manager of the SWF C4D platform
99. At the sub-regional and country level, critical partnerships are:
a. The Global Fund for Disaster Reduction and Recovery (GFDRR), as multi-donor
forum for building ownership and funding mobilization for GRIF;
b. The Public-Private Infrastructure Advisory Facility (PPIAF), as multi-donor
forum for building ownership and funding mobilization for the SIF business line
c. The FIRST Initiative, as multi-donor forum for building ownership and funding
mobilization for the development of PE/VC legal and regulatory frameworks and
reforms under the PE/VC business line
d. The European Union Commission, as partner and donor for PE/VC development
programs in EU candidate countries and in EU Eastern Partnership countries
e. The UK Department for International Development (DFID), as partner and donor
for the proposed Caribbean Regional Infrastructure PPP Finance Fund (CRIP3F)
and for the Kenya SWF/SIF advisory
f. The Caribbean Development Bank (CDB), as partner in the proposed CRIP3F and
in the proposed regional diaspora co-investment facility
VII: Dissemination and outreach strategy
100. The core of the dissemination and outreach strategy for the investment fund for
development program is the Investment Funds for Development Community of Practice
(CoP), and its two dedicated C4D platforms co-managed and open to outside stakeholders in
the investment funds space (see Section IV.2.1 above).
101. In addition, the IFG core team and regional engagement task team leaders and team
members will participate actively through speaking and panel engagements in selected
international forums and conferences, in particular the IFSWF Annual Meeting, the
EMPEA/IFC Annual Conference, and the Fletcher Network Annual Infrastructure Forum.
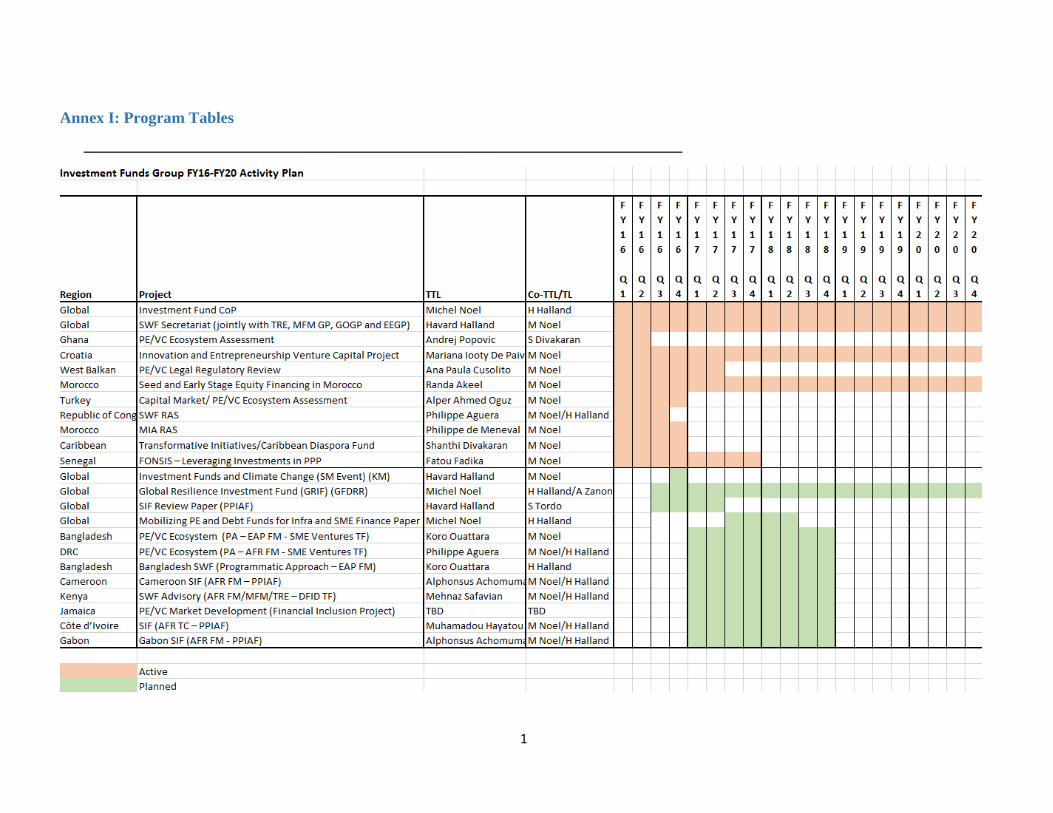
1
Annex I: Program Tables
___________________________________________________________________________
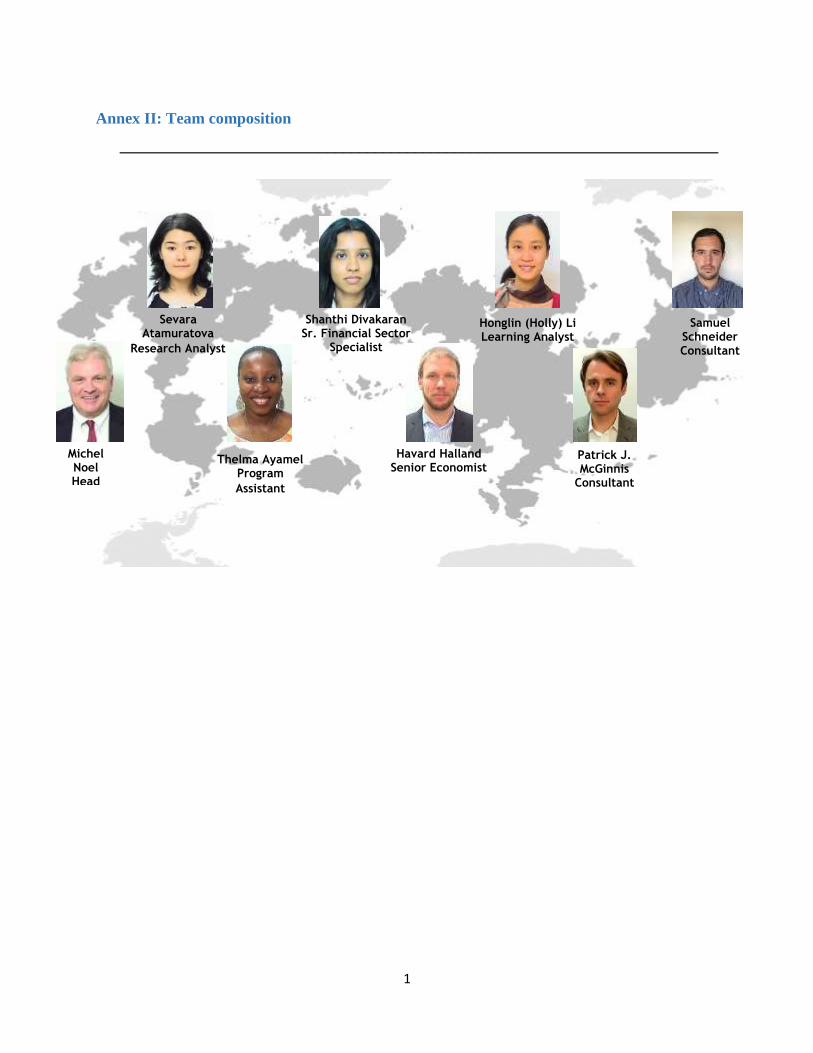
1
Annex II: Team composition
___________________________________________________________________________
Samuel Schneider
Consultant
Patrick J. McGinnis
Consultant
Sevara Atamuratova
Research Analyst
Shanthi Divakaran
Sr. Financial Sector Specialist
Michel Noel Head
Thelma Ayamel Program
Assistant
Havard Halland Senior Economist
Economist
Honglin (Holly) Li Learning Analyst
Bibliography
___________________________________________________________________________
Andrews, D., C. Criscuolo and C Menon: “Do resources flow to patenting firms? Cross-country
evidence from firm-level data”, OECD Economic Department Working Papers No 1127, OECD
Publishing, 2014
Braun, Alexander, H. Schmeiser and C. Siegel: “The impact of private equity on a life insurer’s
capital charges under Solvency II and Swiss Solvency Test”, University of St. Gallen Working
Papers on Risk Management and Insurance No 91, February 2012.
Calderon, Cesar. and L. Serven, “Infrastructure, growth and inequality”, World Bank Policy
Research Working Paper 7034, September 2014
Criscuolo, Chiara. P.N. Gal and C. Menon: “The dynamics of employment growth: new evidence
from 18 countries”, OECD Science, Technology and Industry Policy Papers, No. 14 OECD
Publishing, 2014
Divakaran, Shanthi. S. Masood and P. McGinnis: “Private equity and venture capital in SMEs in
developing countries: the role of technical assistance”, World Bank Policy Research Working
Paper, April 2014
Divakaran, Shanthi: “Brazil: private equity and venture capital”, World Bank mimeo, March
2015
European Investment Fund: “Institutional non-bank lending and the role of debt funds”, Working
Paper 2014/2015
European Union: “Commission Delegated Regulation (EU) 2015 of October 2014 supplementing
Directive 2009/138/EC of the European Parliament and of the Council on the taking-up and
pursuit of the business of insurance and reinsurance (Solvency II)”, January 2015
Fay, Marianne: “Transformational infrastructure in Africa: the role of regional initiative”, World
Bank, Sustainable Development Network, power point presentation, 2011
Frontier Economics Europe: “Exploring the impact of private equity on economic growth in
Europe”, Report prepared for the European Venture Capital Association (EVCA), 2013
Gelb, Alan, S. Tordo, H. Halland, A. Noora and G. Smith: “Sovereign wealth funds and long-
term development finance: risks and opportunities”, World Bank Policy Working Paper Series
56776, February 2014
Ghani, Ejaz, W. Kerr and S.D. O’Connell: “Who creates jobs?”. World Bank mimeo, 2015
GFDRR, “Unlocking the triple dividend of resilience”, Overseas Development Institute and
World Bank, 2015

Hall, Bronwyn and J. Lerner: The financing of R&D and innovation, NBER Working Paper
15325, September 2009
IFC, “Proposed investment in FCP 4G Credicorp Capital/Sura Asset Management – Republic of
Colombia”, 2015
IMF and World Bank: “From billions to trillions: transforming development finance – Post-2015
financing for development: multilateral development finance”, Development Committee
DC2015-0002, April 2015
Inderst, Georg and F. Stewart: “Institutional investment in infrastructure in emerging markets
and developing countries”, PPIAF, World Bank, 2014
InfoDev: “Incubators in developing countries: status and development perspectives”, 2002
InfoDev: “Developing angel investing in emerging markets: early insights from EPIC”,
December 2014a
InfoDev: “Creating your own angel investor group”, 2014b
International Energy Agency: “Energy and climate change”, World Energy Outlook- Special
briefing for COP 21, October 2015
Jha, Abbas, T. W. Miner and Z. Stanton-Geddes, eds. “Building urban resilience”, World Bank
2013a
Jha, Abbas and Z. Stanton-Geddes, eds: “Strong, safe and resilient”, World Bank, 2013b
Latin American Private Equity and Venture Capital Association (LAVCA): 2013 scorecard
Murray, Gordon, M. Cowling, W. Liu and O. Kalinoswka-Beszczynska: “Government co-
financed “hybrid” venture capital programmes: generalizing developed economy experience and
its relevance to emerging nations”, Kauffman International Research and Policy Roundtable,
Liverpool, March 2012
OECD, “Annual survey of large pension funds and public reserve pension funds”, 2013
OECD: “Annual survey of investment regulation of pension funds”, 2014a
OECD: “Non-Bank Debt Financing for SMEs: The Role of securitization, private placements
and bonds”, 2014b
Preqin, “Global private equity report and data base”, 2014
Preqin: “ Global infrastructure report and data base, 2014
Preqin: “Global private equity report and data base”, 2015
Preqin: Special Report: “Private debt – The new alternative?”, July 2014
Preqin: Special Report: “Private Debt”, November 2014
Preqin: Special Report:”The rise of infrastructure debt: new opportunities and investor interest”,
2013
Pricewaterhousecoopers (PWC): “Luxembourg limited partnership”, 2014
Sachs, Jeffrey and G. Schmidt-Traub, “Financing sustainable development: implementing the
SDGs through effective investment strategies and partnerships”, Sustainable development
solutions network working paper, 2015
SME Finance Forum; “APEC framework for innovative SMME financing mechanisms”, 2012
SME Finance Forum: “Enterprise for All”, Entrepreneurship training portal, 2013
Stewart, Fiona: Providing incentives for long-term investment by pension funds – The Use of
Outcome-Based Benchmarks; World Bank Research Working Paper 6885, May 2014
United Nations: “Transforming our world: the 2030 agenda for sustainable development”, UN
Assembly Resolution, 2015
United Nations: “Financing global climate change mitigation”, ECE Energy Series No 37,
Economic Commission for Europe, 2010
World Bank, “Economics of adaptation to climate change – Synthesis report”; 2010
World Bank: “Generating the funding needed for mitigation and adaptation”, in WDR 2010
World Bank, “GPC Body of Knowledge”, 2015