investment analysis & portfolio management
DESCRIPTION
For those who would like to know more on Liquidity,Solvency ratios,Capital Structure Ratios. Helpful ratios for understanding the fundamental health of an organization.TRANSCRIPT

Financial Analysis and Valuation
N.Gupta

Introduction
• Investments in capital markets primarily involve transactions in shares, bonds, debentures, and other financial products issued by companies.
• The decision to invest in these securities is thus linked to the evaluation of these companies, their earnings, and potential for future growth.
• In this chapter we look at one of the most important tools used for this purpose, Valuation.

Introduction
• The fundamental valuation of any asset (and companies are indeed assets into which we invest) is an examination of future returns, in other words, the cash flows expected from the asset.
• The ‘value’ of the asset is then simply what these cash flows are worth today, i.e., their present discounted value. Valuation is all about how well we predict these cash flows, their growth in future, taking into account future risks involved.
Financial Ratios (Return, Operating and, Profitability Ratios)
• Financial ratios are meaningful links between different entries of financial statements, as by themselves the financial entries offer little to examine a company.
• In addition to providing information about the financial health and prospects of a company, financial ratios also allow a company to be viewed, in a relative sense, in comparison with its own historical performance, others in its sector of the economy, or between any two companies in general.
• In this section we examine a few such ratios, grouped into categories that allow comparison of size, solvency, operating performance, growth profile and risks.
• The list below serves to illustrate a few of the important ones.
Financial Ratios (Return, Operating and, Profitability Ratios)
Measures of Profitability: RoA, RoE,RoCE• Return on Assets (RoA)
• This ratio indicates how profitable a company is relative to its total assets.
• The return on assets (ROA) ratio illustrates how well management is employing the company’s total assets to make a profit.
• The higher the return, the more efficient management is in utilizing its asset base.
• The ROA ratio is calculated by comparing net income to average total assets, and is expressed as a percentage.
Measures of Profitability: RoA, RoE, RoCE
• ROA = Net Income/Average total Assets
• Capital-intensive businesses (with a large investment in fixed assets) are going to be more asset heavy than technology or service businesses.
• In the case of capital-intensive businesses, which have to carry a relatively large asset base, will calculate their ROA based on a large number in the denominator of this ratio.
• Conversely, non-capital-intensive businesses (with a small investment in fixed assets) will be generally favoured with a relatively high ROA because of a low denominator number.
Measures of Profitability: RoA, RoE, RoCE
• If peer company comparisons are made, it is imperative that the companies being reviewed are similar in product line and business type. Simply being categorised in the same industry will not automatically make a company comparable.
• As a rule of thumb, investment professionals like to see a company’s ROA come in at no less than 5%.
• Of course, there are exceptions to this rule. An important one would apply to banks, which typically have a lower ROA.
Measures of Profitability: RoA, RoE, RoCE• Return On Equity
• This ratio indicates how profitable a company is by comparing its net income to its average shareholders’ equity.
• The return on equity ratio (ROE) measures how much the shareholders earned for their investment in the company.
• The higher the ratio percentage, the more efficient management is in utilizing its equity base and the better return is to investors.
Measures of Profitability: RoA, RoE, RoCE• ROE = Net Income / Average Shareholder’s Equity
• Widely used by investors, the ROE ratio is an important measure of a company’s earnings performance.
• The ROE tells common shareholders how effectively their money is being employed.
• Company peers and industry and overall market comparisons are appropriate; however, it should be recognized that there are variations in ROEs among some types of businesses.
Measures of Profitability: RoA, RoE, RoCE
• In general, financial analysts consider return on equity ratios in the 15-20% range as representing attractive levels of investment quality.
• While highly regarded as a profitability indicator, the ROE metric does have a recognized weakness.
• What???
Measures of Profitability: RoA, RoE, RoCE
• Investors need to be aware that a disproportionate amount of debt in a company’s capital structure would translate into a smaller equity base.
• Thus, a small amount of net income (the numerator) could still produce a high ROE off a modest equity base (the denominator).
Measures of Profitability: RoA, RoE, RoCE• ROCE(Return On Capital Employed)
• The return on capital employed (ROCE) ratio, expressed as a percentage, complements the return on equity (ROE) ratio by adding a company’s debt liabilities, or funded debt, to equity to reflect a company’s total “capital employed”.
• This measure narrows the focus to gain a better understanding of a company’s ability to generate returns from its available capital base.
Measures of Profitability: RoA, RoE, RoCE
• By comparing net income to the sum of a company’s debt and equity capital, investors can get a clear picture of how the use of leverage impacts a company’s profitability.
• Financial analysts consider the ROCE measurement to be a more comprehensive profitability indicator because it gauges management’s ability to generate earnings from a company’s total pool of capital.
Measures of Profitability: RoA, RoE, RoCE
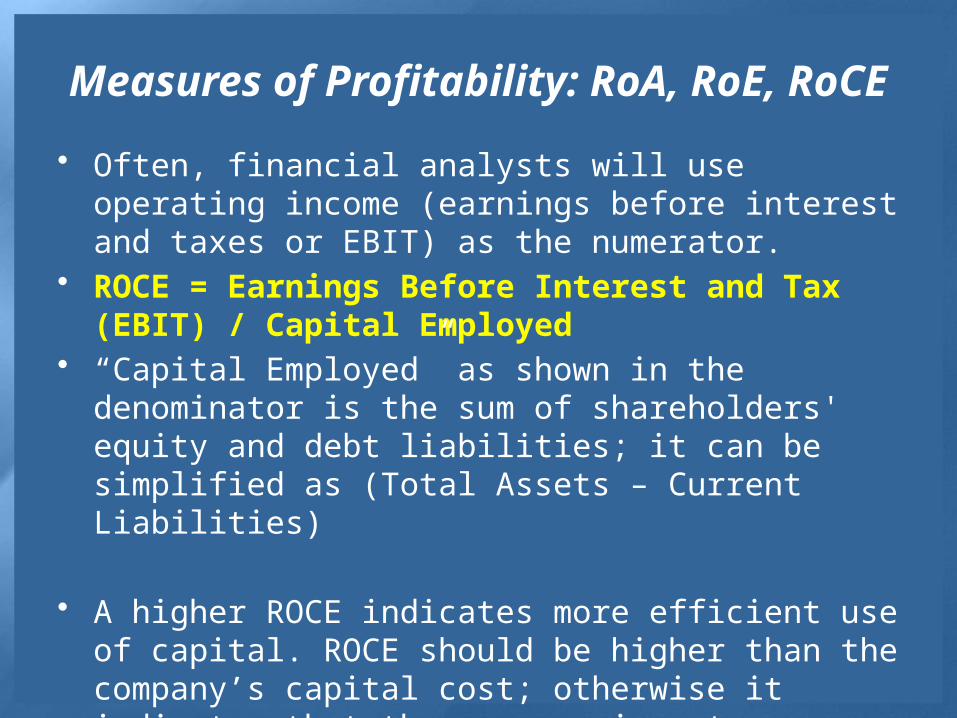
• Often, financial analysts will use operating income (earnings before interest and taxes or EBIT) as the numerator.
• ROCE = Earnings Before Interest and Tax (EBIT) / Capital Employed
• “Capital Employed” as shown in the denominator is the sum of shareholders' equity and debt liabilities; it can be simplified as (Total Assets – Current Liabilities)
• A higher ROCE indicates more efficient use of capital. ROCE should be higher than the company’s capital cost; otherwise it indicates that the company is not employing its capital effectively and is not generating shareholder value.
Measures of Liquidity/Solvency ratios
• Short-term liquidity is imperative for a company to remain solvent.
• The ratios below get increasingly conservative in terms of the demands on a firm to meet near-term payables.
• Current ratio
• Quick Ratio
• Cash Ratio
Measures of Liquidity/Solvency ratios• Solvency ratios measure how easily a company can
pay off long-term debt.
• When a company does not earn enough income to easily repay debts, it will fall into a negative cash flow pattern. In this case, the company will have to cut back employees or sell off assets to avoid defaulting on loans.
• Even with these measures, long-term negative cash flow can result in bankruptcy. Whether a company is "solvent" is an important factor in deciding to invest or hold on to shares of the company.
Measures of Liquidity/Solvency ratios• Acceptable solvency ratios will vary from industry to
industry, but as a general rule of thumb, a solvency ratio of greater than 20% is considered financially healthy.
• Generally speaking, the lower a company's solvency ratio, the greater the probability that the company will default on its debt obligations.
• Current Ratio, Quick Ratio, Current debts to inventory ratio, Current debts to net worth ratio , Total liabilities to net worth ratio, Fixed assets to net worth ratio.
Solvency Ratio and Bankruptcy• When you are evaluating whether to invest in a particular
company, the risk that it may go bankrupt is the largest single risk posed to your investment.
• Bankruptcy only occurs because of debt. If a company has no debt, when it closes its doors, it will pay off investors and walk away.
• If a company has debt, it must liquidate assets to pay off lenders prior to closing its doors. These liabilities are senior liens on the company and its assets. No investors will be repaid until lenders have been repaid. If a company is at risk of "insolvency" it has a very low solvency ratio. As a result, should the company experience any drop in profits, it is likely it would have to declare bankruptcy.
Using Solvency Ratio• It is important to understand solvency ratio can be
affected by industry and season. • Some industries can operate with a much lower ratio
because they have less risk of losing profits. For example, utilities companies have historically low solvency ratios.
• On the other hand, automobile manufacturers should maintain high solvency ratios.
• They are more subject to damage if there is a swing in the market, and these "luxury purchase" companies will often be the first to suffer bankruptcy if the market
Measures of Liquidity ratios
Current Ratio• The current ratio is a popular financial ratio used to test a
company’s liquidity (also referred to as its current or working capital position) by deriving the proportion of current assets available to cover current liabilities.
• The concept behind this ratio is to ascertain whether a company’s short-term assets (cash, cash equivalents, marketable securities, receivables and inventory) are readily available to pay off its short-term liabilities. In theory, the higher the current ratio, the better.
Measures of Liquidity ratios• Current Ratio = Current Assets/Current Liabilities
• The current ratio is used extensively in financial reporting. However, while easy to understand, it can be misleading in both a positive and negative sense - i.e., a high current ratio is not necessarily good, and a low current ratio is not necessarily bad.
• Current ratio is flawed because it is conceptually based on the liquidation of all of a company’s current assets to meet all of its current liabilities.
• In reality, this is not likely to occur. Investors have to look at a company as a going concern.
Measures of Liquidity ratios
• It’s the time it takes to convert a company’s working capital assets into cash to pay its current obligations that is the key to its liquidity.
• In a word, the current ratio can be “misleading.”
Measures of Liquidity ratios
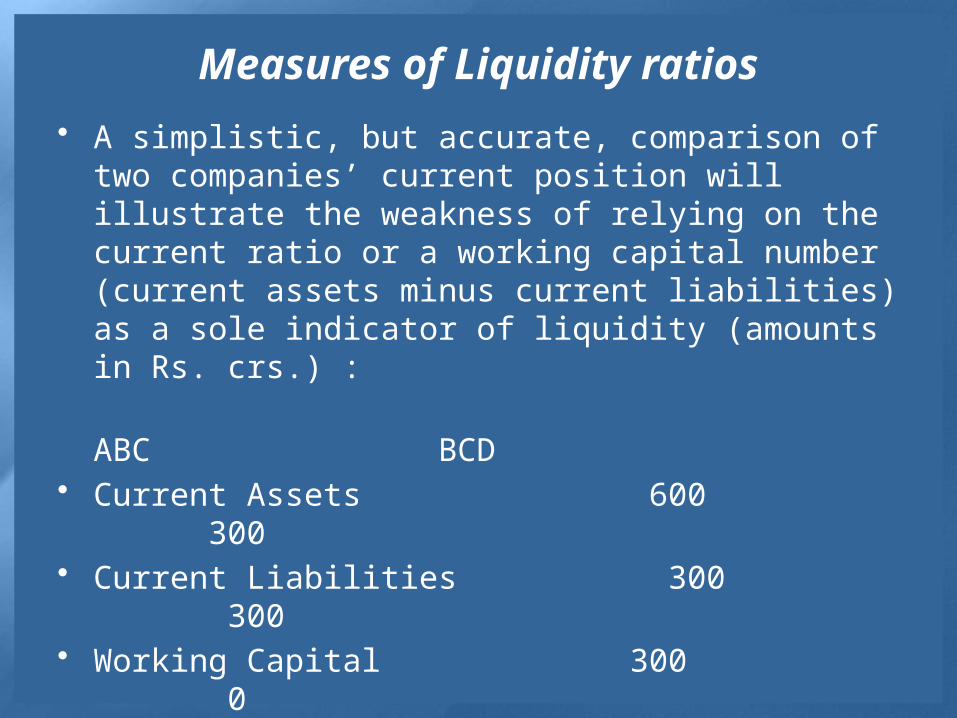
• A simplistic, but accurate, comparison of two companies’ current position will illustrate the weakness of relying on the current ratio or a working capital number (current assets minus current liabilities) as a sole indicator of liquidity (amounts in Rs. crs.) :
ABC BCD• Current Assets 600 300• Current Liabilities 300 300• Working Capital 300 0• Current Ratio 2 1
Important Findings
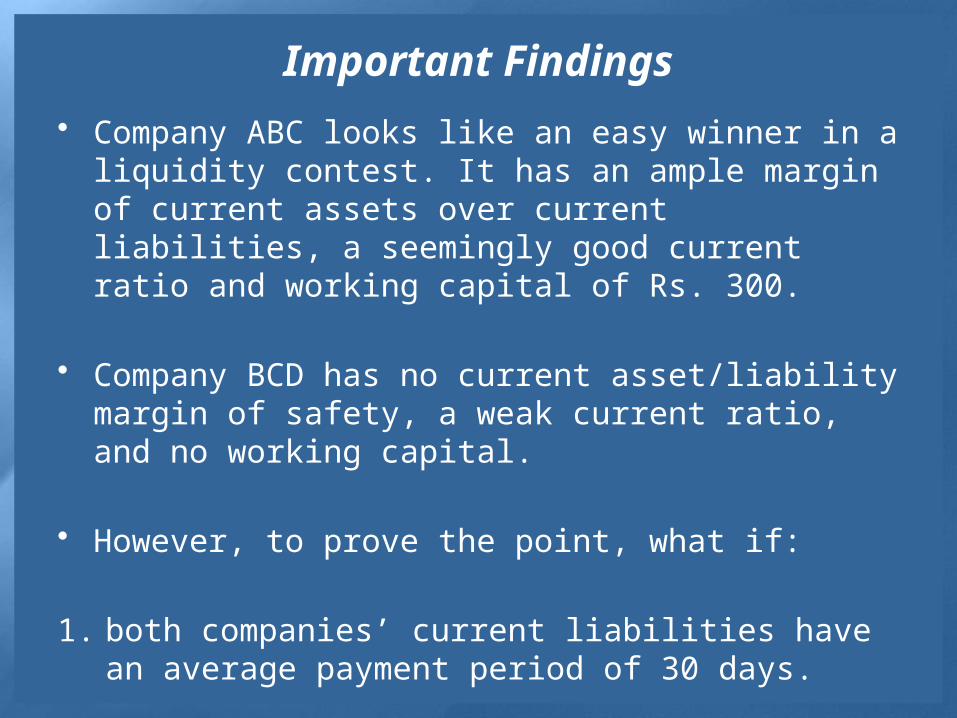
• Company ABC looks like an easy winner in a liquidity contest. It has an ample margin of current assets over current liabilities, a seemingly good current ratio and working capital of Rs. 300.
• Company BCD has no current asset/liability margin of safety, a weak current ratio, and no working capital.
• However, to prove the point, what if:
1. both companies’ current liabilities have an average payment period of 30 days.
Important Findings
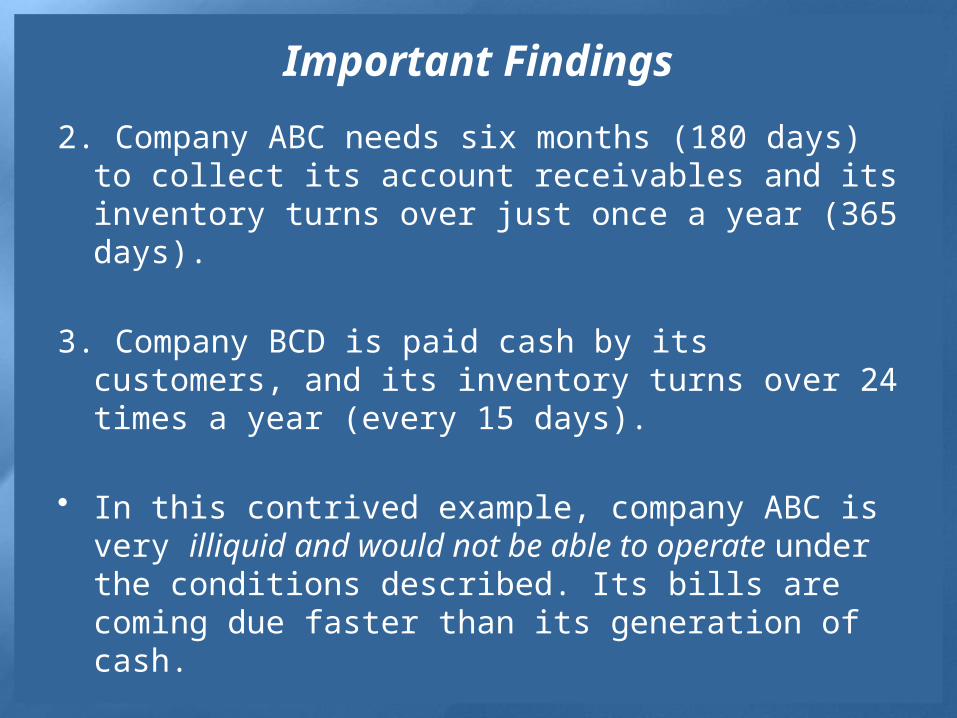
2. Company ABC needs six months (180 days) to collect its account receivables and its inventory turns over just once a year (365 days).
3. Company BCD is paid cash by its customers, and its inventory turns over 24 times a year (every 15 days).
• In this contrived example, company ABC is very illiquid and would not be able to operate under the conditions described. Its bills are coming due faster than its generation of cash.
• Remember,you can’t pay bills with working capital; you pay bills with cash!
Important Findings
• Company’s BCD’s seemingly tight current position is, in effect, much more liquid because of its quicker cash conversion.
• Try to understand the types of current assets the company has and how quickly these can be converted into cash to meet current liabilities.
Quick Ratio• The quick ratio - aka the quick assets ratio or the acid-
test ratio - is a liquidity indicator that further refines the current ratio by measuring the amount of the most liquid current assets there are to cover current liabilities.
• The quick ratio is more conservative than the current
ratio because it excludes inventory and other current assets, which are more difficult to turn into cash.
• Therefore, a higher ratio means a more liquid current position.
Quick Ratio
Quick Ratio Cash & Equivalents + Short term investments + A/C receivables
= ----------------------------------------------------------------------------
Current Liabilities
• By excluding inventory, the quick ratio focuses on the more-liquid assets of a company.
• Another beneficial use is to compare the quick ratio with the current ratio. If the current ratio is significantly higher, it is a clear indication that the company’s current assets are dependent on inventory.
Quick Ratio
Shortfall of the Quick Ratio
• If accounts receivable, as a component of the quick ratio, have, let’s say, a conversion time of several months rather than several days, the “quickness” attribute of this ratio is questionable.
Cash Ratio• The cash ratio is an indicator of a company’s liquidity
that further refines both the current ratio and the quick ratio by measuring the amount of cash; cash equivalents or invested funds there are in current assets to cover current liabilities.
Cash Ratio
Cash + Cash & Equivalents + Invested Funds
= ------------------------------------------------------------------
Current Liabilities
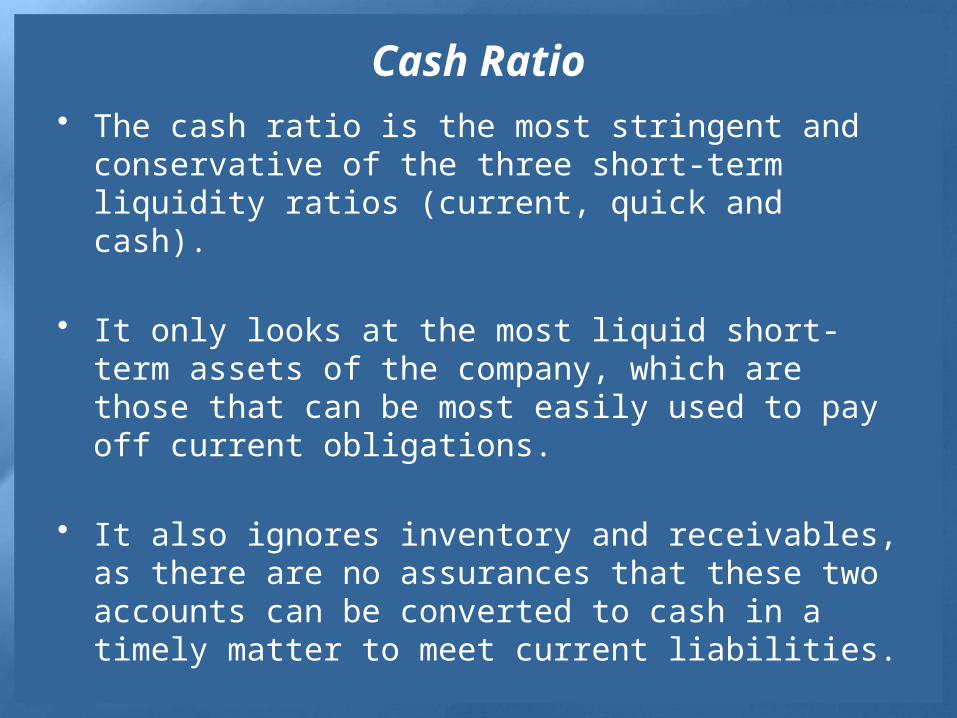
Cash Ratio• The cash ratio is the most stringent and conservative of
the three short-term liquidity ratios (current, quick and cash).
• It only looks at the most liquid short-term assets of the company, which are those that can be most easily used to pay off current obligations.
• It also ignores inventory and receivables, as there are no assurances that these two accounts can be converted to cash in a timely matter to meet current liabilities.
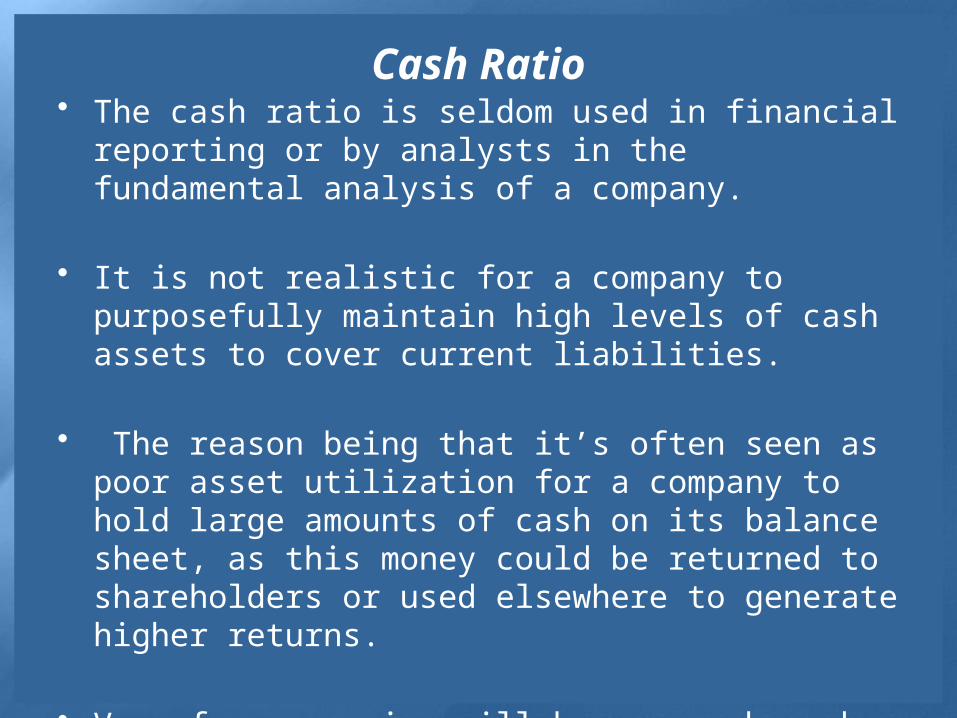
Cash Ratio• The cash ratio is seldom used in financial reporting or by
analysts in the fundamental analysis of a company.
• It is not realistic for a company to purposefully maintain high levels of cash assets to cover current liabilities.
• The reason being that it’s often seen as poor asset utilization for a company to hold large amounts of cash on its balance sheet, as this money could be returned to shareholders or used elsewhere to generate higher returns.
• Very few companies will have enough cash and cash equivalents to fully cover current liabilities, which isn’t necessarily a bad thing
Solvency Ratios
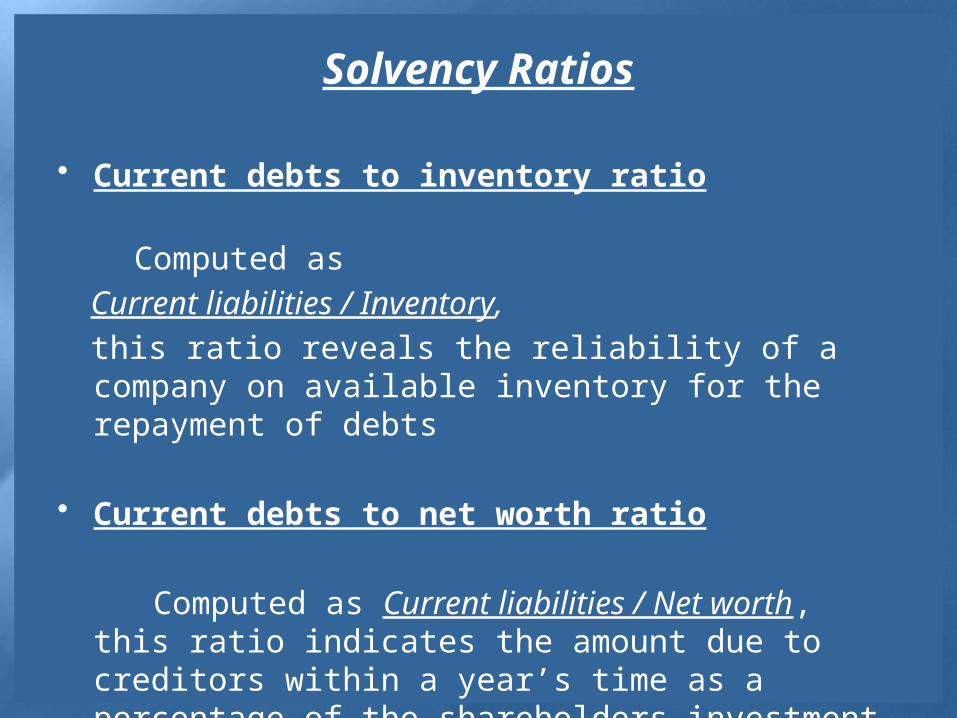
• Current debts to inventory ratio
Computed as
Current liabilities / Inventory,
this ratio reveals the reliability of a company on available inventory for the repayment of debts
• Current debts to net worth ratio
Computed as Current liabilities / Net worth, this ratio indicates the amount due to creditors within a year’s time as a percentage of the shareholders investment
Solvency Ratios
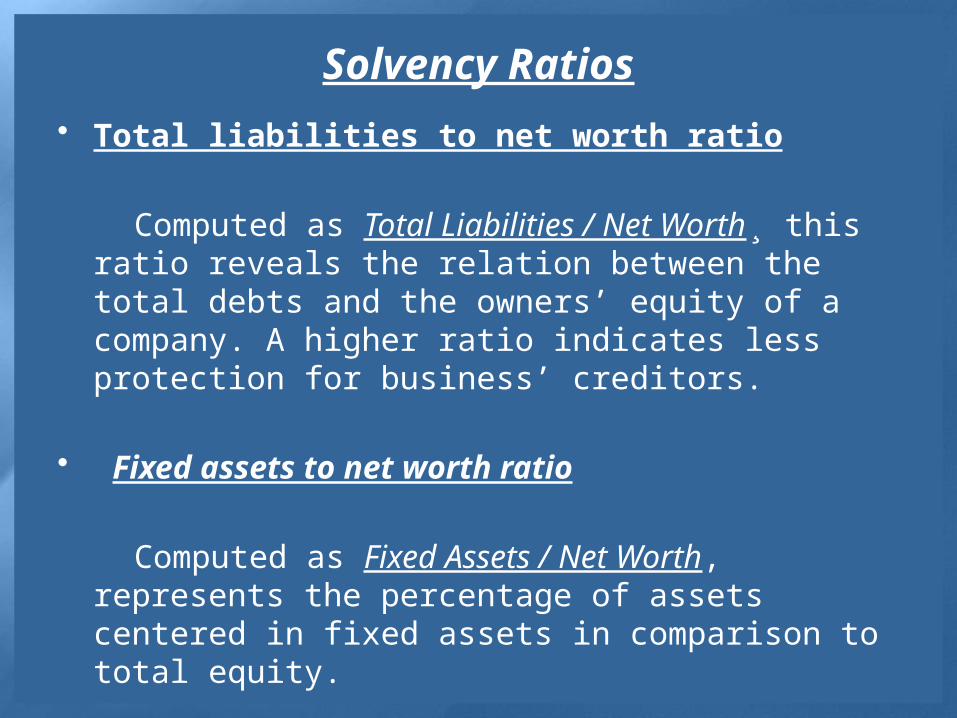
• Total liabilities to net worth ratio
Computed as Total Liabilities / Net Worth¸ this ratio reveals the relation between the total debts and the owners’ equity of a company. A higher ratio indicates less protection for business’ creditors.
• Fixed assets to net worth ratio
Computed as Fixed Assets / Net Worth, represents the percentage of assets centered in fixed assets in comparison to total equity.
Capital Structure
• The capital structure is how a firm finances its overall operations and growth by using different sources of funds.
• Debt comes in the form of bond issues or long-term notes payable, while equity is classified as common stock, preferred stock or retained earnings.
• Short-term debt such as working capital requirements is also considered to be part of the capital structure.
Capital Structure Ratios
The Debt Ratio
• The debt ratio compares a company’s total debt to its total assets, which is used to gain a general idea as to the amount of leverage being used by a company.
• A low percentage means that the company is less dependent on leverage, i.e., money borrowed from and/or owed to others.
• The lower the percentage, the less leverage a company is using and the stronger its equity position.
Capital Structure Ratios• In general, the higher the ratio, the more risk that
company is considered to have taken on.
Total Liabilities• Debt Ratio = ----------------------
Total Assets
• The more debt compared to assets a company has, which is signalled by a high debt ratio, the more leveraged it is and the riskier it is considered to be.
• Generally, large, well-established companies can push the liability component of their balance sheet structure to higher percentages without getting into trouble.
Capital Structure Ratios• However, one thing to note with this ratio: it isn’t a pure
measure of a company’s debt (or indebtedness), as it also includes operational liabilities, such as accounts payable and taxes payable.
• Companies use these operational liabilities as going concerns to fund the day-to-day operations of the business and aren’t really “debts” in the leverage sense of this ratio.
• The use of leverage, as displayed by the debt ratio, can be a double-edged sword for companies.
Capital Structure Ratios• If the company manages to generate returns above their
cost of capital, investors will benefit. However, with the added risk of the debt on its books, a company can be easily hurt by this leverage if it is unable to generate returns above the cost of capital.
• Basically, any gains or losses are magnified by the use of leverage in the company’s capital structure.
Capital Structure Ratios
Debt-Equity Ratio
• The debt-equity ratio is another leverage ratio that compares a company’s total liabilities to its total shareholders’ equity.
• This is a measurement of how much suppliers, lenders, creditors and obligors have committed to the company versus what the shareholders have committed.
Capital Structure Ratios
• To a large degree, the debt-equity ratio provides another vantage point on a company’s leverage position, in this case, comparing total liabilities to shareholders’ equity, as opposed to total assets in the debt ratio.
• Similar to the debt ratio, a lower the percentage means that a company is using less leverage and has a stronger equity position.
Total Liabilities• Debt-Equity Ratio = --------------------------
Shareholders Equity
Interest Coverage Ratio
• However, like the debt ratio, this ratio is not a pure measurement of a company’s debt because it includes operational liabilities in total liabilities.
• Generally, large, well-established companies can push the liability component of their balance sheet structure to higher percentages without getting into trouble.
Interest Coverage Ratio
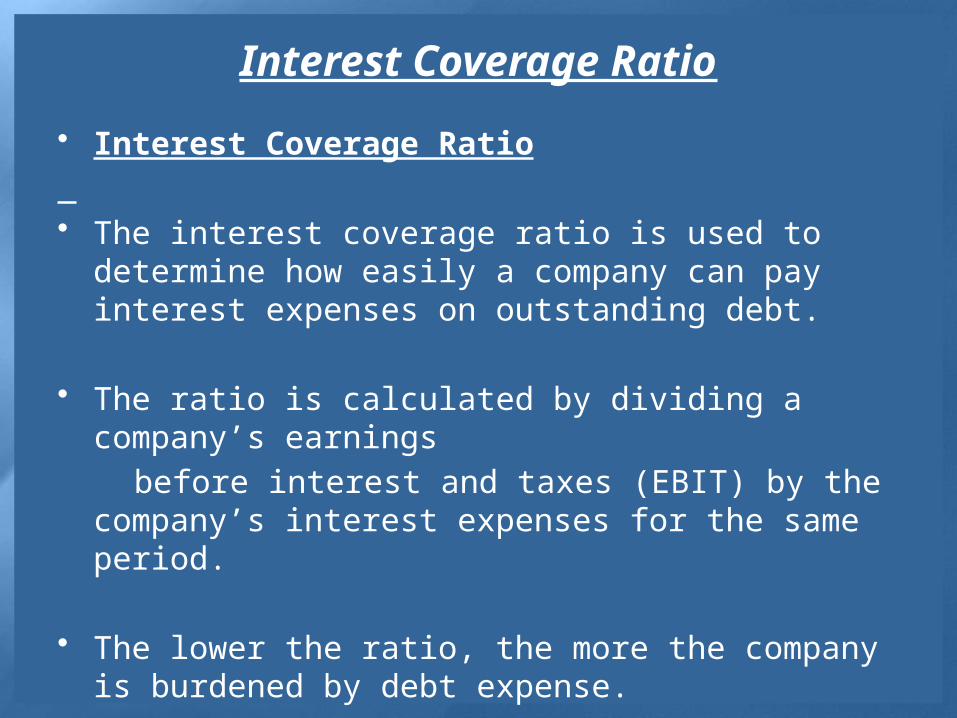
• Interest Coverage Ratio • The interest coverage ratio is used to determine how
easily a company can pay interest expenses on outstanding debt.
• The ratio is calculated by dividing a company’s earnings
before interest and taxes (EBIT) by the company’s interest expenses for the same period.
• The lower the ratio, the more the company is burdened by debt expense.
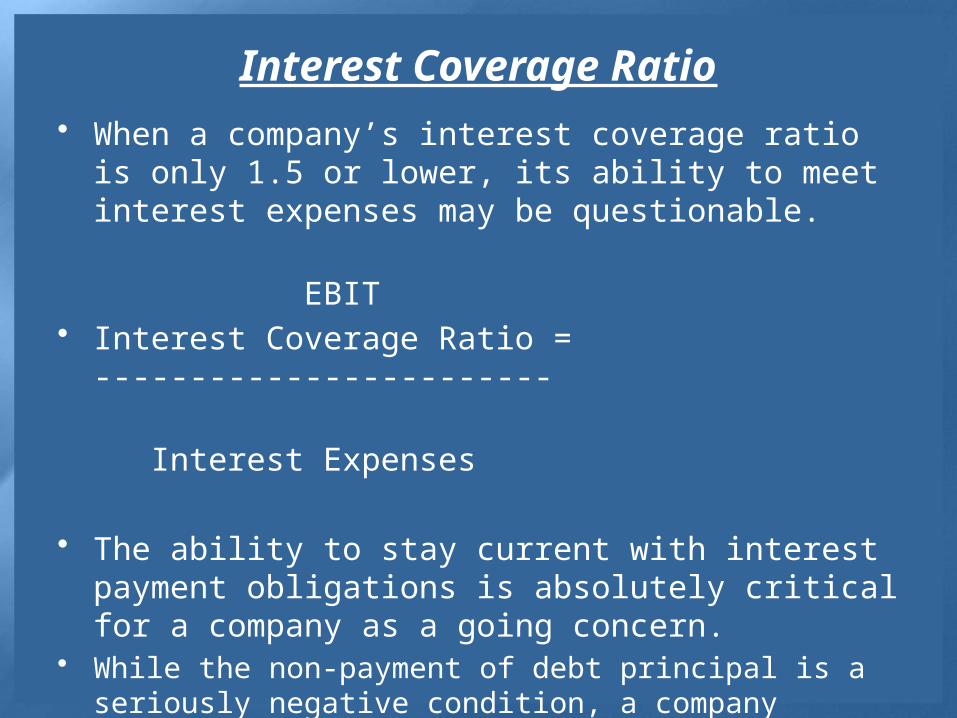
Interest Coverage Ratio• When a company’s interest coverage ratio is only 1.5 or
lower, its ability to meet interest expenses may be questionable.
EBIT• Interest Coverage Ratio = ------------------------
Interest Expenses
• The ability to stay current with interest payment obligations is absolutely critical for a company as a going concern.
• While the non-payment of debt principal is a seriously negative condition, a company finding itself in financial/operational difficulties can stay alive for quite some time as long as it is able to service its interest expenses.
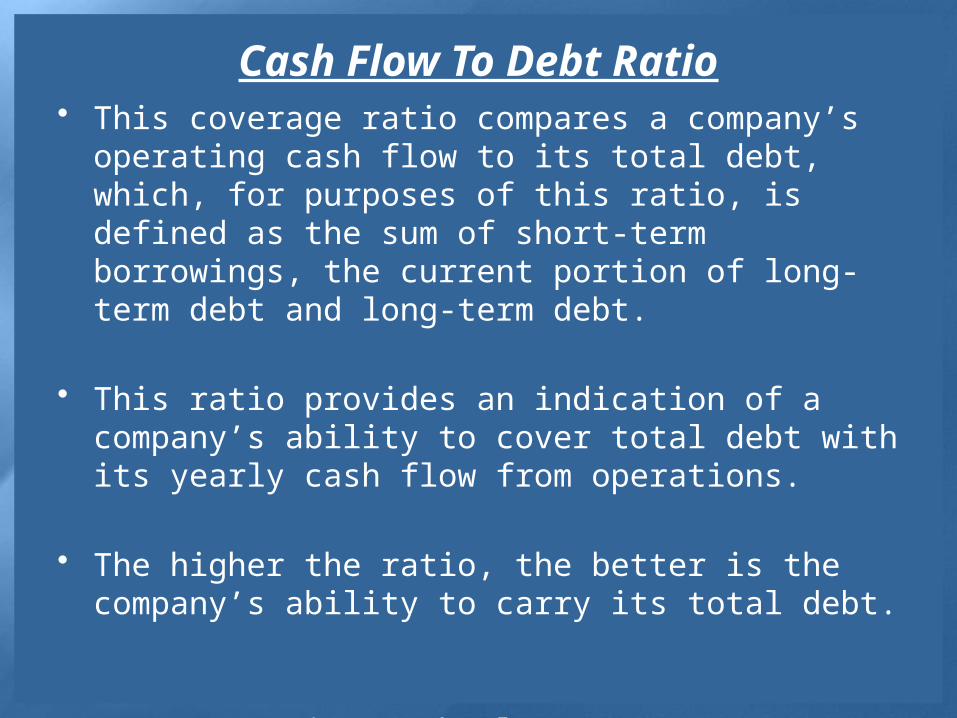
Cash Flow To Debt Ratio• This coverage ratio compares a company’s operating
cash flow to its total debt, which, for purposes of this ratio, is defined as the sum of short-term borrowings, the current portion of long-term debt and long-term debt.
• This ratio provides an indication of a company’s ability to cover total debt with its yearly cash flow from operations.
• The higher the ratio, the better is the company’s ability to carry its total debt.
Operating Cash Flow• Cash Flow to Debt Ratio = -------------------------------
Total Debt
Operating Performance
• The next series of ratios we’ll look at are the operating performance ratios.
• The ratios do give users insight into the company’s performance and management during the period being measured.
• These ratios look at how well a company turns its assets into revenue as well as how efficiently a company converts its sales into cash.
• In general, the better these ratios are, the better it is for shareholders.
Operating Performance Fixed-Asset Turnover
• This ratio is a rough measure of the productivity of a company’s fixed assets (property, plant and equipment or PP&E) with respect to generating sales.
• For most companies, their investment in fixed assets represents the single largest component of their total assets.
• This annual turnover ratio is designed to reflect a company’s efficiency in managing these significant assets.
Operating Performance• Simply put, the higher the yearly turnover rate, the better.
Net Sales• Fixed Asset Turnover Ratio = ---------------------------------
Property,Plant,Equipment
• Before putting too much faith into this ratio, it’s important to determine the type of company that you are using the ratio on because a company’s investment in fixed assets is very much linked to the requirements of the industry in which it conducts its business.
• For example, an IT company, like XYZ, has less of a fixed-asset base than a heavy manufacturer like BHEL.
Operating Performance
Sales/Revenue per Employee
• As a gauge of personnel productivity, this indicator simply measures the amount of rupee sales, or revenue, generated per employee.
• The higher the figure the better.
• Here again, labour-intensive businesses (eg. mass market retailers) will be less productive in this metric than a high-tech, high product-value manufacturer.
Operating Performance
Net Sales
Sales Per Employee = -----------------------------------------
Average number of employees
• An ‘Earnings per Employee’ ratio could also be calculated using net income (as opposed to net sales) in the numerator.
• Industry and product-line characteristics will influence this indicator of employee productivity.
• Tracking this figure historically and comparing it to peer-group companies will make this quantitative amount more meaningful in an analytical sense.

Relative valuation
• Relative valuation models calculate the share price but they are generally based on the valuation of comparable firms in the industry.
• Various valuation multiples such as price-earning ratio, enterprise value multiples, etc. are used by the finance professionals which depends on the industry, current economic scenario, etc.
• Most of these models are generally used for evaluation purpose as to whether a particular stock is overvalued or undervalued and less for actual valuation of the shares.
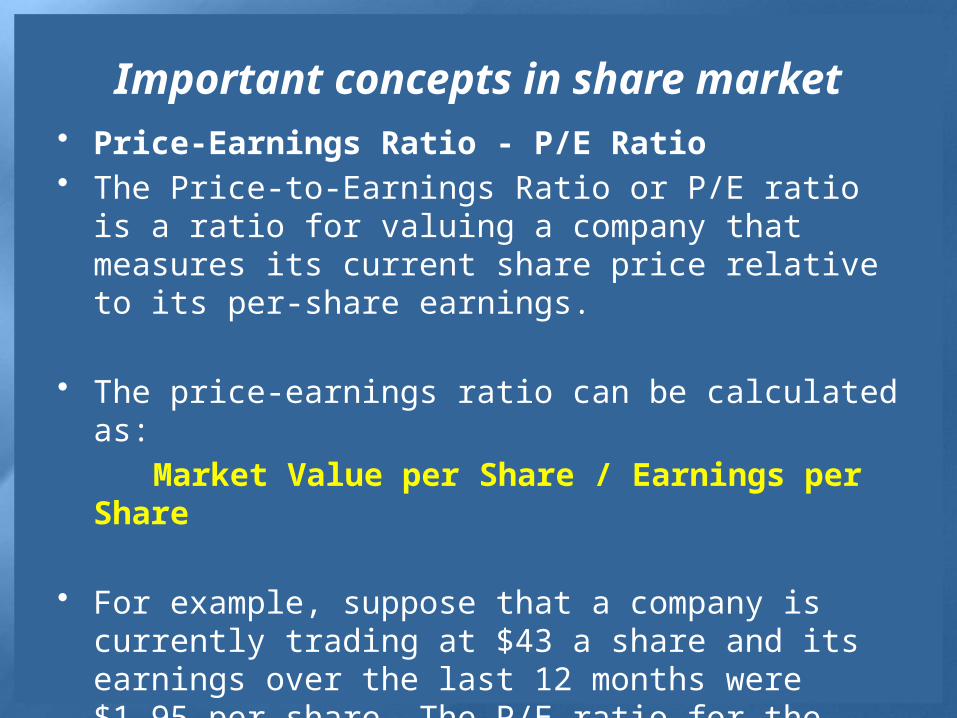
Important concepts in share market• Price-Earnings Ratio - P/E Ratio• The Price-to-Earnings Ratio or P/E ratio is a ratio for
valuing a company that measures its current share price relative to its per-share earnings.
• The price-earnings ratio can be calculated as:
Market Value per Share / Earnings per Share
• For example, suppose that a company is currently trading at $43 a share and its earnings over the last 12 months were $1.95 per share. The P/E ratio for the stock could then be calculated as 43/1.95, or 22.05.
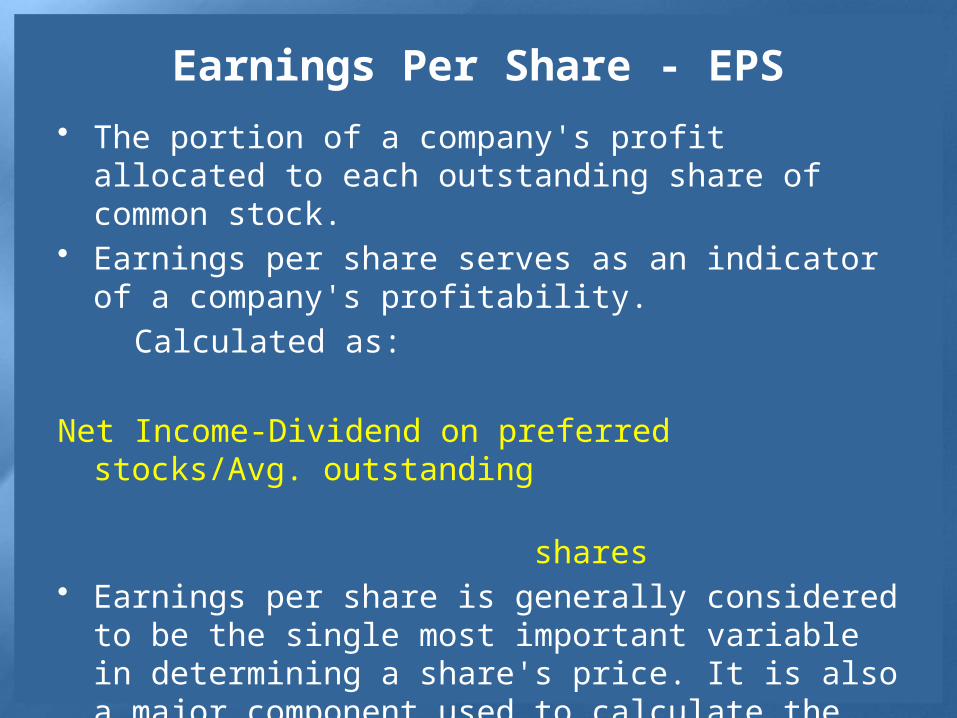
Earnings Per Share - EPS
• The portion of a company's profit allocated to each outstanding share of common stock.
• Earnings per share serves as an indicator of a company's profitability.
Calculated as:
Net Income-Dividend on preferred stocks/Avg. outstanding
shares• Earnings per share is generally considered to be the
single most important variable in determining a share's price. It is also a major component used to calculate the price-to-earnings valuation ratio.
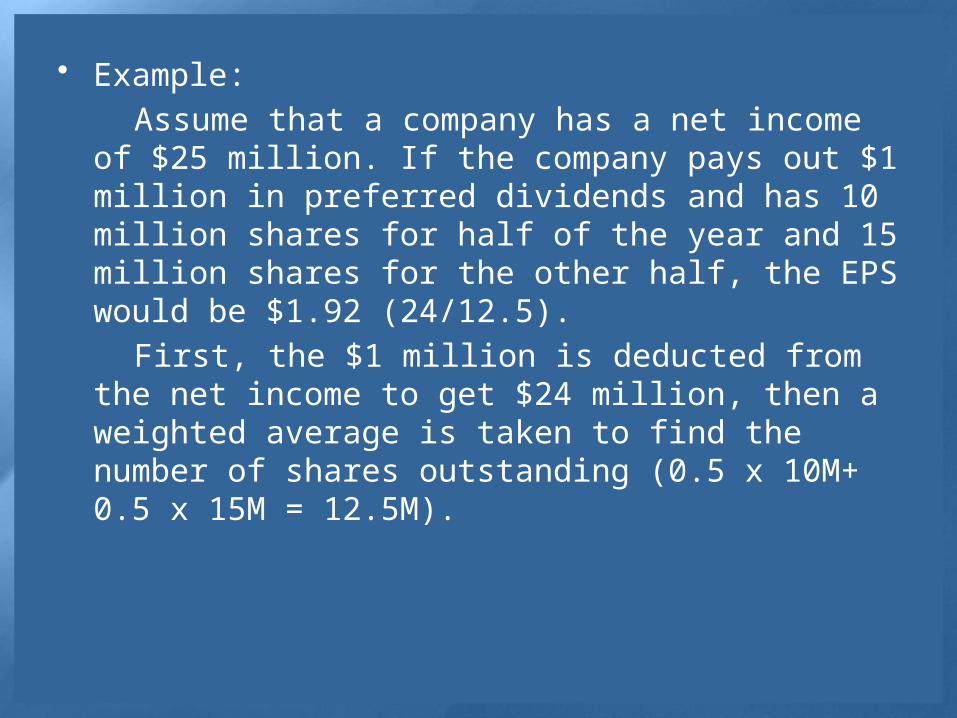
• Example:
Assume that a company has a net income of $25 million. If the company pays out $1 million in preferred dividends and has 10 million shares for half of the year and 15 million shares for the other half, the EPS would be $1.92 (24/12.5).
First, the $1 million is deducted from the net income to get $24 million, then a weighted average is taken to find the number of shares outstanding (0.5 x 10M+ 0.5 x 15M = 12.5M).
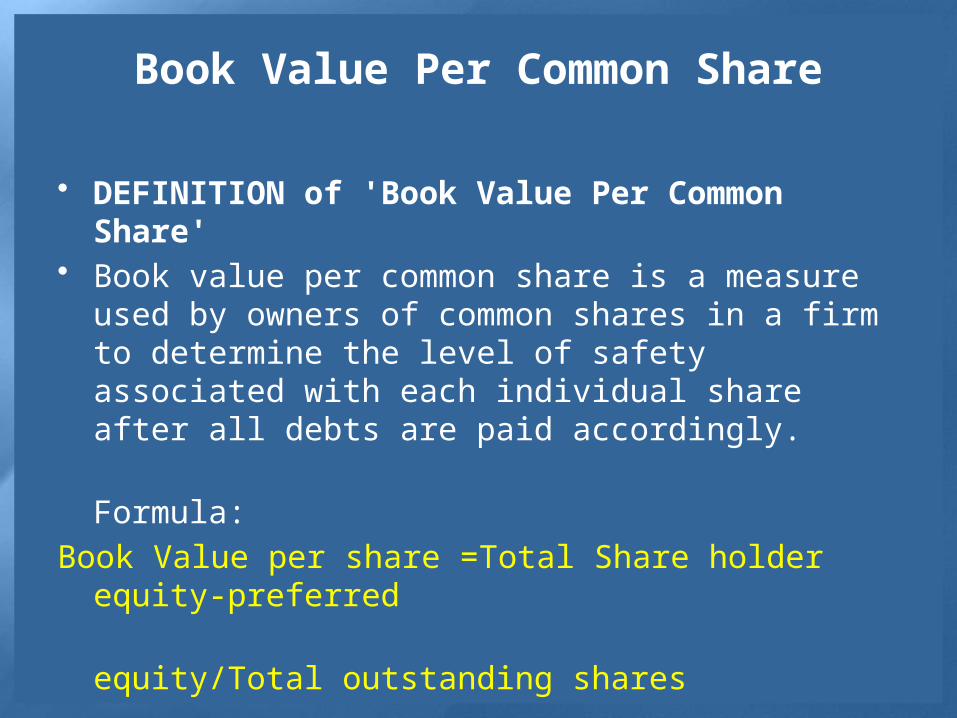
Book Value Per Common Share
• DEFINITION of 'Book Value Per Common Share'• Book value per common share is a measure used by
owners of common shares in a firm to determine the level of safety associated with each individual share after all debts are paid accordingly.
Formula:
Book Value per share =Total Share holder equity-preferred
equity/Total outstanding shares
Explaination
• Should the company decide to dissolve, the book value per common indicates the dollar value remaining for common shareholders after all assets are liquidated and all debtors are paid.
• In simple terms it would be the amount of money that a holder of a common share would get if a company were to liquidate.
Price-To-Book Ratio - P/B Ratio
• A ratio used to compare a stock's market value to its book value. It is calculated by dividing the current closing price of the stock by the latest quarter's book value per share.
• Also known as the "price-equity ratio".
Formula:
P/B Ratio = Market value per share/Book value per
share
Explaination
• A lower P/B ratio could mean that the stock is undervalued. However, it could also mean that something is fundamentally wrong with the company. As with most ratios, be aware that this varies by industry.
• This ratio also gives some idea of whether you're paying too much for what would be left if the company went bankrupt immediately.

Thank you