investigations of the chymotrypsin-catalyzed hydrolysis of ... · investigations of the...
TRANSCRIPT
THIJOUBNAL ~~BIOLO~~ALCREF~~ISTRY Vol.242, No.17,Iasue of &ptembezlO,pp. 397%3992,1967
Printed in U.S.A.
Investigations of the Chymotrypsin-catalyzed Hydrolysis of Specific Substrates
III. DETERMINATION OF INDIVIDUAL RATE CONSTANTS AND ENZYME-SUBSTRATE BINDING CONSTANTS FOR SPECIFIC AMIDE AND ESTER SUBSTRATES*
(Received for publication, February 23, 1967)
KARL G. BRANDT,$ ALBERT HIMOE,~ AND GEORGE P. HESS~
From the Section of Biochemistry and Molecular Biology, Division of Biological Sciences, Cornell University. Ithaca, New York: 14.860
SUMMARY
Enzyme-substrate binding constants, K’e, for chymotrypsin and specific amide (N-acetyl-Mryptophanamide and N- acetyl-L-phenylalaninamide) and ester (N-acetyl-L-tryp- tophan ethyl ester) substrates have been measured by a proflavin-displacement method. Also, the rate constant for the formation of one intermediate in the chymotrypsin- catalyzed hydrolysis of the ester has been determined at selected pH values. These constants have not previously been determined.
The proflavin-displacement method used to measure the enzyme complex concentration has previously been found to yield results in agreement with those obtained by measuring the spectral changes of the enzyme at 290 mp. These spectral changes at 290 rnp, observed in all chymotrypsin- catalyzed reactions studied, have been shown to arise during the reversible formation of an enzyme-substrate complex which precedes the bond-breaking step.
New information important to an understanding of chymo- trypsin-catalyzed hydrolysis in general has been obtained from this work. It is shown directly, for the Crst time, that in the chymotrypsin-catalyzed hydrolysis of at least two specific amide substrates, the rate-limiting bond-breaking step follows the reversible formation of an enzyme-substrate complex with a dissociation constant K’s, and that Kls and the steady state kinetic parameter K, (app) are equivalent. The pH-dependent rate constant (ks) measured in the chymotrypsin-catalyzed hydrolysis of the ester we have studied is shown to pertain to a second intermediate detected
* This research was supported by grants from the National Institutes of Health and the National Science Foundation.
$ National Institutes of Health Postdoctoral Fellow. Present address, Department of Biochemistry, Purdue University, Lafayette, Indiana 47907.
6 United States Public Health Service Postdoctoral Trainee. Present address, Department of Biochemistry, Baylor University College of Medicine. Houston. Texas 77025.
7 To whom reprint reques& should be addressed at 210 Savage Hall, Cornell University, Ithaca, New York 14850.
in this reaction, an intermediate not seen in the chymotrypsin- catalyzed hydrolysis of the specific substrate amides.
The K’, values at pH 8.0 for the complexes of cu-chymo- trypsin with N-acetyl-Mryptophanamide and N-acetyl-L- phenylalaninamide were found to be 4.7 nmr and 29 mu, respectively, in excellent agreement with the steady state kinetic parameter K, (app). In the case of the cr-chymo- trypsin-catalyzed hydrolysis of N-acetyl-Mryptophan ethyl ester, data on the pH dependence of k23 was found to be consistent with a pK (app) value of 6.6 for the group of the enzyme controlling the rate, and with a limiting pH-inde- pendent value for k23 of 1800 see-? The K/e value for this ester and a-chymotrypsin at, for instance, pH 5.0, was found to be 2.3 m&r, while K, (app) has been reported as -0.08 mM. Values of K’, and k28, determined in these experiments, together with previously determined values of the steady
. . state kmetm parameter, &, allowed a calculation of K,,, (app). At pH 5.0, this calculated value is -0.06 mu, in reasonable agreement with the experimentally observed value.
Investigations of chymotrypsin-catalyzed reactions, although extensive, have relied almost exclusively on the steady state kinetic approach, and therefore very little is known about the individual steps in these reactions (1). We have undertaken an investigation of these steps in order to gain further understanding of the catalytic processes involved in the reactions.
The work was begun with a study of the reaction of chymo- trypsin with its specific inhibitor diisopropyl fluorophosphate and with model substrates &lo), because these reactions, in contrast to chymotrypsin-catalyzed hydrolyses of specific substrates, are known to proceed via long lived, covalently bonded chymotrypsin compounds (11-13). Physical changes in the enzyme which were observed to accompany these reactions were characterized; these include spectral changes near 290 rncc (2, 5), changes in optical
3973
by guest on January 17, 2020http://w
ww
.jbc.org/D
ownloaded from

Chymotrypsin-catalyzed Hydrolysis of XpeciJic Substrates. III Vol. 242, No. 17
rotatory properties (4, 6, 14, 15), and changes in the acid disso- ciation constant of an ionizing group with a pK (app) of about 8.5 (4, 9, 10, 16, 17). Further information was obtained from kinetic investigations (8, 9) of the physical changes of the enzyme which accompany its stoichiometric reaction with diisopropyl fluorophosphate. We have now extended these investigations of individual reaction steps to the chymotrypsin-catalyzed hydrol- ysis of specific substrates, ester or amide derivatives of aromatic amino acids. In these reactions, only transient enzyme-sub- strate complexes are known to appear.
In an accompanying paper (18) we report preliminary kinetic as well as static equilibrium investigations of the spectral changes of the enzyme near 290 rnp which result when chymotrypsin binds the specific amide substrate N-acetyl-n-phenylalaninamide. These measurements (18) permitted the determination of an over- all enzyme-substrate dissociation constant, K’s, and the pH dependence of this constant. Extension of the experimental method used in these studies to the chymotrypsin-catalyzed hydrolysis of specific substrates which are derivatives of tyrosine or tryptophan is, however, precluded by the high absorbance of these residues in the 290 rnp region. We have therefore used another approach to the determination of K’s values and to the investigation of the pre-steady state kinetics of the chymotryp- sin-catalyzed hydrolysis of specific substrates: a spectro- photometric procedure based on the competitive binding of the dye proflavin (3,6-diaminoacridine) by the enzyme.
The competitive inhibition of chymotrypsin by proflavin, first reported by Wallace, Kurtz, and Niemann (19), has been used by Weiner and Koshland (20) and Weiner et al. (21) as the basis of a determination of dissociation constants of complexes between chymotrypsin and “virtual” substrates by equilibrium dialysis techniques. This approach cannot be extended to real substrates because these compounds become hydrolyzed during the time required for equilibrium dialysis. In the present study, a spec- trophotometric technique is used to measure, in the presence and absence of substrate, a perturbation of the absorption spectrum of proflavin which occurs upon binding to chymotrypsin. This perturbation, first reported by Bernhard and Lee (22) and Bernhard, Lee, and Tashjian (23), has been used to measure the dissociation constants for the proflavin complexes of both tryp- sin and chymotrypsin (24, 25), and for the detection of transient compounds in trypsin- and chymotrypsin-catalyzed reactions (23, 25). The magnitude of the difference spectrum, exhibiting a maximum at 465 rnp, which appears when proflavin binds to chymotrypsin, is proportional to the amount of enzyme-proflavin complex (22, 23). Introduction into the system of a substrate which competes with proflavin for the enzyme decreases the amount of enzyme-proflavin complex. Also, the substrate itself forms a weak complex with proflavin which absorbs at 465 rnp. Accordingly, the observed reduction of intensity of the difference spectrum depends on the relative concentrations of substrate and inhibitor, the dissociation constants of their complexes with the enzyme, the proflavin-substrate dissociation constant, and the molar absorption coefficients of the various proflavin complexes. Since the constants pertaining to the enzyme- and substrate- proflavin complexes can be determined independently, the chymotrypsin-substrate dissociation constant, K’,, can be calcu- lated.
In the experiments reported in this paper, dissociation con- stants were determined at selected pH levels for the complexes of chymotrypsin with the amide and the ethyl ester of N-acetyl-
n-tryptophan, and with the amides of N-acetyl-n-phenylalanine and N-acetyl-n-phenylahmine. We are also reporting the use of the proflavin-displacement method for determination of the pre- steady state kinetics in the cu-chymotrypsin-catalyzed hydrolysis of N-acetyl-n-tryptophan ethyl ester over an extended pH range. This work includes the determination of rate constants not previously accessible experimentally.
In the experiments with specific amide substrates, static deter- minations could be made, since with amides the extent of hydroly- sis during the time required for measurement is negligible. The experiments with the ester, however, required the use of stopped- flow techniques.
A preliminary report of a part of these data has appeared (26).
EXPERIMENTAL PROCEDURE
Materials and Apparatus
Salt-free oc-chymotrypsin crystallized three times (Lots CDI 6148-9, CD1 6127-8, CD1 6164, and CDI 6094~5), trypsin crystallized twice, and erystalline chymotrypsinogen were obtained from Worthington. &Chymotrypsin was prepared just before each use by activating chymotrypsinogen with trypsin under conditions known to yield essentially the 6 form of the enzyme (27). Enzyme concentrations were determined spec- trophotometrically at 280 rnp with use of a molar extinction coefficient of 50,000 M-I cm-l (28). A molecular weight of 25,000 (29) was assumed.
N-Acetyl-n-tryptophanamide, Lot R 4739, chromatographi- tally pure, with melting point of 192-193” and [o(]i3 +19.1 + 1.2 (c, 1, in methanol); N-acetyl-L-phenylalaninamide, Lots K-4782 and K-46361, chromatographically pure, with melting point of 184-185” and [cr]E4 $31” (c, 1.5, in methanol); and N-acetyl-n- phenylalaninamide, Lot K-3150, were obtained from Cycle Chemical Corporation. N-Acetyl-n-tryptophan ethyl ester, Lot J 1322, chromatographically pure, with melting point of 10% log”, and proflavin sulfate, Lot M 2200, with a molar extinction coefficient at 444 mp of 37,900 Me’ cm-l, were obtained from Mann. All other reagents were reagent grade and obtained from Mallinckrodt.
Cary recording spectrophotometers, either model 14 or model 15, equipped with both 0 to 1.0 and 0 to 0.1 slide wires, were used for measurements of difference spectra; l.O- or 2.0-cm cells were used. Determinations of pH were made on a Radiometer pH meter, type TTTlc, with reference to Beckman pH 7.0 standard buffer. For the stopped flow experiments, a Gibson-Durrum stopped flow spectrophotometer was used. This instrument has a 2-cm light path and a tungsten iodide light source with grating monochromator.
Methods
Determination of Enzyme-Substrate Dissociation Constants for Speci$c Substrate Amides-Difference spectra for enzyme- proflavin, substrate-proflavin, and enzyme-substrate-proflavin systems were measured in the 410 to 500 rnp region at room temperature, 24” f 0.3. Since these proflavin-contahlhlg solu- tions showed maxima at 465 rnp (22,23), and since the absorption maximum for proflavin alone is at 444 mp, the difference in opti- cal density readings between 465 rnp and 440 rnp, designated AAit&dO, was used as a measure of the concentration of complex. Data were handled as discussed under “Results.”
Experimental solutions were prepared from stock solutions of
by guest on January 17, 2020http://w
ww
.jbc.org/D
ownloaded from
Issue of Sept.ember 10, 1967 K. G. Brand, A. Himoe, and G. P. Hess 3975
4.
3.
O.%44ln 1
2.
I
Proflovin Concentration (pLM)
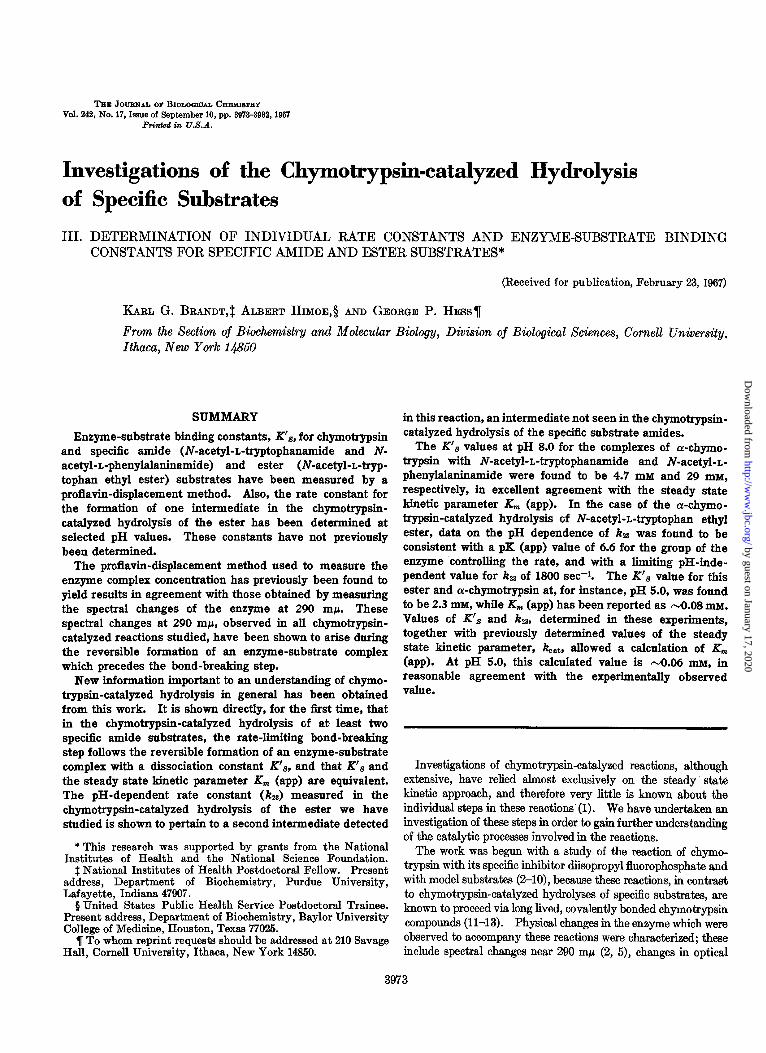
FIG. 1. Proflavin concentrations against optical density at 444 rnp. Solutions, 0.1 M in potassium phosphate and 0.1 M in KC1 at pH 8.0, were measured with a Cary model 15 spectrophotometer in l.O-cm cells.
t.he reactants and buffer. Enzyme stock solution concentrations were 5 mg per ml for the enzyme-substrate-proflavin measure- ments and 10 mg per ml for the enzyme-proflavin measurements. These enzyme stock solutions mere prepared in 0.01 in acetate buffer (pH 5.0) for the experiments at pH levels 8.0 to 4.0, and in 0.39 M KC1 adjusted to pH 2.5 with concentrated HCl for the experiments at pH 2.5; they were stored at 0”. Stock solutions of substrate a-ere 10 mM in concentration for ATA,’ and 20 to 40 nlM for APA. Solutions of proflavin sulfate, 400 PM, were pre- pared fresh daily in boiled eater which had been cooled under nitrogen and were protected from the light. The experimental solutions were prepared by mixing the appropriate amounts (see Tables I, II, and III) of reactant solutions with buffer solutions of composition such that each final solution in the pH 8.0 to 5.7 region was 0.1 M in potassium phosphate, each solution in the pH 5.4 to 4.0 region was 0.1 M in sodium acetate, and all solutions had sufficient KC1 to give an ionic strength of 0.39. The correct pH level was obtained by prior adjustment of the buffer solution by addition of concentrated KOH or HCl. Since acridine dyes are known to associate at rather low concentrations (30), and significant deviations from Beer’s law were observed with solutions of concentration greater than SO
1 The abbreviations used are: ATA, N-acetyl-n-tryptophan- amide ; APA, N-acetyl-r,-phenylalaninamide; ATE, N-acetyl- n-tryptophanethyl ester; D-APA, N-acetyl-n-phenylalaninamide.
pM (see Fig. l), all experiments were carried out with final concentrations of proflavin no greater than 70 FM.
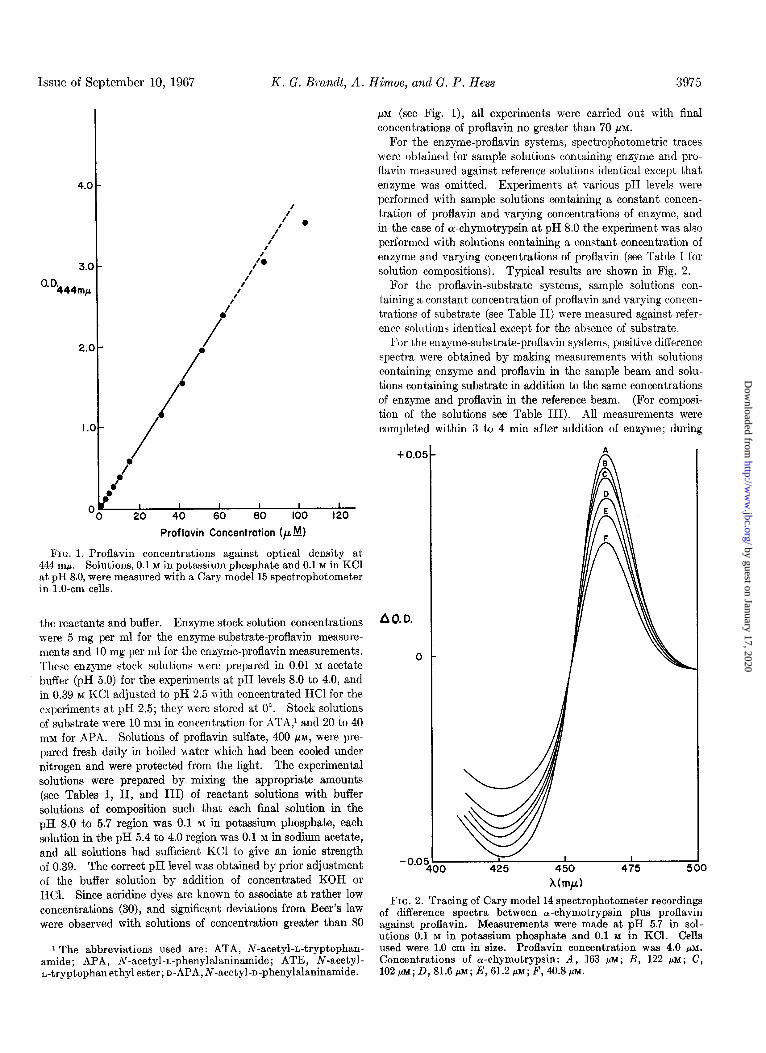
For the enzyme-proflavin systems, spectrophotometric traces were obtained for sample solutions containing enzyme and pro- flavin measured against reference solutions identical except that enzyme was omitted. Experiments at various pH levels were performed with sample solutions containing a constant concen- tration of proflavin and varying concentrations of enzyme, and in the case of ol-chymotrypsin at pH 8.0 the experiment was also performed with solutions containing a constant concentration of enzyme and varying concentrations of proflavin (see Table I for solution compositions). Typical results are shown in Fig. 2.
For t.he proflavin-substrate systems, sample solutions con- taining a constant concentration of proflavin and varying concen- trations of substrate (see Table II) were measured against refer- ence solutions identical except for the absence of substrate.
For the enzyme-substrate-proflavin systems, positive difference spectra were obtained by making measurements with solutions containing enzyme and proflavin in the sample beam and solu- tions containing substrate in addition to the same concentrations of enzyme and proflavin in the reference beam. (For composi- tion of the solutions see Table III). All measurements were completed within 3 to 4 min after addition of enzyme; during
+ 0.05
AO.0.
0
-0.05
X(mp)
FIG. 2. Tracing of Cary model 14 spectrophotometer recordings of difference spectra between a:-chvmotrvpsin plus nroflavin against proflavin. Measurements were made at pH 5.f in sol- utions 0.1 M in notassium nhosohate and 0.1 M in KCl. Cells used were 1.0 cm in size. Proiavin concentration was 4.0 pM. Concentrations of or-chymotrypsin: A, 163 pM; B, 122 pM; C, 102j.t~;D,81.6p~;E,61.2p~;F,hO.8p~.
by guest on January 17, 2020http://w
ww
.jbc.org/D
ownloaded from
3976 Chymotrypsin-catalyzed Hydrolysis of Specific Xubstrates. III Vol. 242, No. 17
this time only a negligible amount of substrate hydrolyzes, as shown by calculation from the known steady state kinetic param- eters of these systems (31-33). In the most unfavorable cases in these experiments, the percentages of substrate hydrolyzed in 4 min, neglecting proflavin inhibition, are calculated to be 9% for 40 pM a-chymotrypsin and 1.0 mM ATA at pH 8.0, and 2% for 41 PM a-chymotrypsin and 2.0 mM APA at pH 8.0. The presence of proflavin reduces the amount of substrate hydrolyzed by about one-third.
Determination of Enzyme-Substrate Dissociation Constants for Specijic Substrate Ester and Investigations of Pre-steady State Kinetics-Experiments with ATE were performed in the stopped flow spectrophotometer at 28” + 0.3”. Solutions containing cy- chymotrypsin and proflavin in buffer were mixed according to the experimental stopped flow procedure with solutions containing substrate in the same buffer. Final concentrations were 10 pM a-chymotrypsin, 50 PM proflavin, and varying concentrations of substrate (see Table IV). For the experiments at pH levels 4.3, 4.6,5.0, and 5.4,0.1 M acetate buffer was used, and for the experi- ments at pH levels 5.7 and 6.0, 0.1 M phosphate buffer was used; all solutions contained KC1 to give an ionic strength of 0.39. The solutions were brought to the desired pH by prior adjust- ment of the buffers with concentrated HCl. The time-dependent change in concentration of the enzyme-proflavin complex was then followed in the stopped flow apparatus at 465 rnp.
Values of kobs were determined at the various substrate concen- trations as discussed under “Results” (see Equation 19). Values of KBF, the dissociation constant of the enzyme-proflavin com- plex, were determined at each pH value as described above in the method for determination of enzyme-substrate dissociation constants for specific substrate amides; these values are listed in Table I. From these data, and values of ks4 obtained as keat in steady state kinetic experiments, the constants kza and K’s were determined by means of a digital computer program written for the Lineweaver-Burk form of the Michaelis-Menten rate equation (Equation 20 under “Results”). Data weighting and the calcu- lation of the standard errors were performed as discussed by Wilkinson (34).
RESULTS
Determination of Dissociation Constants of Chymotrypsin-speci,fic Substrate Amide Complexes-The calculation of K’s for a specific substrate amide depends on the following conditions and assump- tions. (a) So >> Eo, Fo, so that S % So. Here E, S, and F refer to the molar concentrations of free enzyme, substrate, and pro- flavin, respectively, and the subscript zero indicates initial analytical concentration. (b) The equilibria between enzyme and substrate and between enzyme and proflavin are reached in a time that is short compared to the subsequent steps in which substrate is converted to product. Recent stopped flow experi- ments with the systems chymotrypsin + APA and chymotrypsin + APA + proflavin (18), in addition to the experiments reported here, indicate that this condition is fulfilled. (c) Substrate and proflavin are not bound simultaneously to the same enzyme molecule. Experiments at selected pH values indicate that chymotrypsin has only a single binding site for proflavin (20-24), and the experiments of Wallace et al. (19) and of Bernhard et al. (23) indicate that proflavin is a competitive inhibitor at pH 8.0 when acetyl-L-valine methyl ester or acetyl-n-tyrosine ethyl ester is the substrate. Then
Eo= E+ES+EFs
and
Fo= F+EF,y+SF (1)
where ES is the molar concentration of enzyme-substrate com- plex, EFs is the molar concentration of enzyme-proflavin complex in the presence of substrate, and SF is the substrate-proflavin complex. Also
K (E)(F) IF = EF
where EF is the molar concentration of enzyme-proflavin complex in the system, and
K, s
_ (E)(So) -~ ES
With appropriate use of Equations 1 and 2, Equation 3 becomes
K’~=~(K~F)(s~)[E~-EF~(~+~)]-’ (4)
Therefore, determination of EFs at various initial substrate con- centrations allows computation of K’s according to Equation 4.
The required values of EFs can be calculated from difference spectrum data obtained by measuring solutions containing con- stant concentrations of enzyme and proflavin and varying concentrations of substrate against solutions identical except for absence of substrate. The pertinent equation is
AA:::ma40 = (EF) (A$) - (EFs) (AegF) - (SF)(Aer) (5)
where AA’&, is the experimental difference spectrum measure- ment (see “Experimental Procedure”), EF represents the molar concentration of enzyme-proflavin complex in the absence of substrate, and EFs is, as above, the molar concentration of enzyme-proflavin complex in the presence of substrate. Needed for the calculation of EFs from this equation are the values of EF and SF, which can be calculated as
EF = ) ( (K,TF + Eo + Fo) i [(KEP + EO + Fd2 - 4EoFolt) (6)
SF = So so + KSF @‘o - EFs) (7)
Evaluation of Equations 6 and 7 requires a knowledge of the dissociation constants for enzyme-proflavin, KEY, and for sub- strate-proflavin, KsF. In order to obtain these constants, separate experiments were performed with solutions containing either enzyme and proflavin or substrate and proflavin under conditions identical with those used in the experiments in which the solutions contained all three components. Calculation of these constants, KEF. and KSF, from the experimental AA%,,, values can be carried out according to Equations 8 to 10. In these equations, A represents molar concentration of either enzyme or substrate, C is molar concentration of the complex, KAR represents either KEF or KSF, and the subscript zero indi- cates initial analytical concentration.
K (nAo - C)(Fo - c)
AF = c
where 12 represents the number of binding sites per molecule of A. When A0 >> C
by guest on January 17, 2020http://w
ww
.jbc.org/D
ownloaded from
Issue of September 10, 1967 K. G. Bran&, A. Himoe, and G. P. Hess 3977
TABLE I Dissociation constants for chumotrypsin-pro$avin complexes
and when Fo > C Determinations were made spectrophotometrically at 465 rnN and 440 mM. Temperature was 24”.
1 -=- A
- kF 00)
From Equations 9 and 10 it can be seen that a plot of A? or For against [AA~&-i in the manner of Benesi and Hilde- brand (35) should give a straight line from which KAp (which is is either Kgp or KsP) and A& can be determined.
In the present work, the calculations of EF, SF, EFs, KM, and K’, were carried out by computer, with use of KsF values de- termined graphically. A program using Equations 4, 5, 6, 7, and 9 was written, and values of K’s for each substrate concentra- tion were obtained. In the calculations of KBF, a value of 2.6 x lo4 ~-1 cm-1 was used for A$; this value was determined under conditions in which Fe = 43 PM.
Table I includes the values of Kep determined for the c~- chymotrypsin-proflavin complex at various levels of pH in the region 2.5 to 8.0, and the Lchymotrypsin-proflavin complex at pH 8.0. It can be seen in the table that these results are compat- ible with values obtained previously both spectrophotometrically (23, 24) and by equilibrium dialysis (20, 21). The agreement at pH 8.0 between the KEF values obtained with constant enzyme and varied proflavin concentration, and with constant proflavin and varied enzyme concentration, indicates (see Equations 9 and 10) that only one proflavin binds per molecule of enzyme; this was found to be the case with oc-chymotrypsin and riboflavin also (36). The data in Table I also show that the binding of proflavin by a-chymotrypsin decreases at low pH.
Table II lists the values obtained graphically for the dissocia- tion constants, KSP, and molar extinction difference coefficients, A$“, of the complexes between proflavin and the various amide substrates.
The calculated values of K’s for complexes between chymo- trypsin and specific amide substrates ATA and APA are given in Table III, along with some comparative values of K, (app) obtained in other studies (33, 37, 38) of these substrates. It can be seen that reasonably good agreement was obtained between the statically determined K’s and the kinetically deter- mined Km (app) values. Also, a K’s value for the cu-chymotryp- sin-D-APA complex compares reasonably well with a value of KI
determined from inhibition studies of the cr-chymotrypsin- catalyzed hydrolysis of chloroacetyl-n-tyrosinamide (39), as well as with a Kls value determined from static measurements of spectral changes of the enzyme at 290 m/* (18). The values for ATA at pH levels 8.0 and 5.7 are refinements of the values previ- ously reported (26), based on more data. It was previously found (32, 33) that for ATA the values of K,,, (app) are essentially pH- independent in the pH region 5.7 to 8.0, and this observation seems to be confirmed by the results cited in Table III. The data in Table III indicate that at pH 2.5, however, K’s for this specific substrate amide is somewhat greater than at the higher pH levels; a similar increase in K’s with decreasing pH is indi- cated by the data obtained with the corresponding specific sub- strate ester (Table IV). (It may be noted, however, that since KEF increases with decreasing pH, higher concentrations of chymotrypsin had to be used at lower pH values, making the values for both K,w and K’s less reliable.) Steady state data for the cr- and 6-chymotrypsin-catalyzed hydrolysis of ATA at pH
Material
t-Chymotrypsin (39 to 155 PM) -proflavin (4.0 ELM), pH %O..............................
c&hymotrypsin (39 to 163 PM) -proflavin (4.0 PM), pH 8.0..............................
a-Chymotrypsin (3.5 bM)-proflavin (10 to 60 PM), pH 8.0.
c&hymotrypsin (40 to 161 PM)-proflavin (4.0 /AM), pH 6.0..............................
a-Chymotrypsin (41 to 163 PM) -proflavin (4.0 /LM), pH 5.7..............................
or-Chymotrypsin (41 to 163 PM)-proflavin (4.0 /AM), pH 5.4..............................
a-Chymotrypsin (40 to 158 PM) -proflavin (4.0 /AM), pH 5.0.
&Zhymotrypsin (40 t.o 160 PM) -proflavin (4.0 PM), pH 4.6.
a-Chymotrypsin (40 to 160 PM)-proflavin (4.0 PM), pH 4.3..............................
a-Chymotrypsin (43 to 174 PM)-proflavin (4.0 /AM), ~1-1 4.0..............................
a-Chymotrypsin (39 to 161 PM)-proflavin (4.0 PM), pH 2.5.............................
or-Chymotrypsin-proflavin (spectrophoto- metric), pH 7.6.
a-Chymotrypsin-proflavin (spectrophoto- metric), pH 8.0.
c&hymotrypsin-proflavin (inhibition stud- ies), p1-I 7.9.. . .
a-Chymotrypsin-proflavin (equilibrium di- alysis), pH 7.0.
.- KEF
M x 106
4.9 f 0.2
2.7 f 0.1
2.3 f 0.4
4.4 f 0.4
4.3 f 0.4
3.3 f 0.2
3.9 f 0.2
7.3 f 0.5
7.9 f 0.4
8.4 f 0.6
14.1 f 0.8
2.2 (24)
3.8 (23)
13” (19)
2.5 (20, 21)
0 KI determined by inhibition studies of the cu-chymotrypsin- catalyzed hydrolysis of chloroacetyl-n-valine methyl ester.
TABLE II Dissociation constants for complexes of projlavin and
specific substrate amides Measurements were made spectrophotometrically at 465 rnp and
440 mp. Temperature was 24”.
system KSF SF AS&f
M x 102 ar’ cm-l x 10-a
ATA (2.5 to 14.0 X 10-a M)-proflavin (5.0 X KY5 M), pH %O............
ATA (2.0 to 10.5 X 10-a M)-proflavin (4.0 X lo-” M), PI-I 5.7............
ATA (1.0 to 7.1 X 10e3 M)-proflavin (4.0 X 1O-5 M), pH 2.5............
APA and D-APA (2.0 to 32.0 X lo+ M)-proflavin (4.0 X 10-b M), pH 8.0.
3.2 3.6
2.6 6.0
4.5 8.3
6.7 2.5
8.0 (32,33) have indicated that b-chymotrypsin binds ATA about twice as well as cr-chymotrypsin. The accuracy of the static experiments reported here is not sufficient for a defmite conclusion on this point to be drawn, but it does appear that the 6 form binds ATA better (Table III). In general, it can be concluded that the present results with static determination of K’s for specific
by guest on January 17, 2020http://w
ww
.jbc.org/D
ownloaded from
3978 Chymotrypsin-catalyzed Hydrolysis of Specific Substrates. III Vol. 242, No. 17
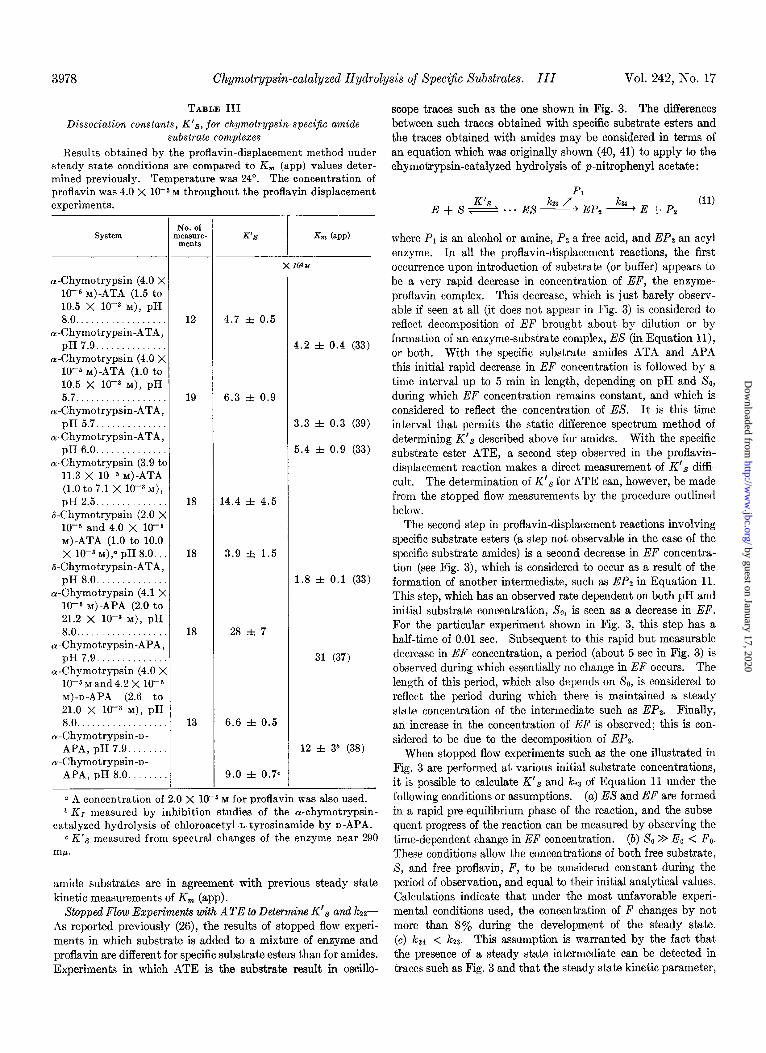
TABLE III Dissociation constants, K’s, for chymotrypsin-specijic amide
substrate complexes
Results obtained by the proflavin-displacement method under steady state conditions are compared to K, (app) values deter- mined previously. Temperature was 24”. The concentration of proflavin was 4.0 X 10-S M throughout the proflavin displacement experiments.
System
a-Chymotrypsin (4.0 X 1O-5 M)-ATA (1.5 to 10.5 X lo- M), pH 8.0..
&Zhymotrypsin-ATA, pH 7.9..
a-Chymotrypsin (4.0 X 1O-5 M)-ATA (1.0 to 10.5 X lo-- M), pH 5.7..
au-Chymotrypsin-ATA, pH 5.7..
&Jhymotrypsin-ATA, pH 6.0.
a-Chymotrypsin (3.9 tc 11.3 X 1O-5 M)-ATA (1.0 t0 7.1 x lo-’ M),
pH 2.5.. 6Chymotrypsin (2.0 X
1r5 and 4.0 X 10-S M)-ATA (1.0 to 10.0 X 1OV M),a pH 8.0.
&Chymotrypsin-ATA, pH 8.0. _.
or-Chymotrypsin (4.1 X 10-b M)-APA (2.0 to 21.2 X lO-3 M), pH 8.0. .
&Zhymotrypsin-APA, pH 7.9..
a-Chymotrypsin (4.0 X 10-b M and 4.2 X 10-b M)-D-APA (2.6 to 21.0 X IO- M), pH 8.0..
a-Chymotrypsin-n- APA, pH 7.9..
a-Chymotrypsin-n- APA, pH 8.0..
12 4.7 f 0.5
19 6.3 f 0.9
18 14.4 f 4.5
18 3.9 f 1.5
18
13
28 f 7
6.6 f 0.5
9.0 f 0.76
K’S Km (~PP)
x 1oaz-l
4.2 i 0.4 (33)
3.3 f 0.3 (39)
5.4 i 0.9 (33)
1.8 i 0.1 (33)
31 (37)
12 i 3b (38)
Q A concentration of 2.0 X 10-S M for proflavin was also used. b KI measured by inhibition studies of the cu-chymotrypsin-
catalyzed hydrolysis of chloroacetyl-n-tyrosinamide by D-APA. c K’s measured from spectral changes of the enzyme near 290
w.
amide substrates are in agreement with previous steady state kinetic measurements of K, (app).
Stopped Flow Experiments with ATE to Determine K’s and LB- As reported previously (26), the results of stopped flow experi- ments in which substrate is added to a mixture of enzyme and proflavin are different for specific substrate esters than for amides. Experiments in which ATE is the substrate result in oscillo-
scope traces such as the one shown in Fig. 3. The differences between such traces obtained with specific substrate esters and the traces obtained with amides may be considered in terms of an equation which was originally shown (40, 41) to apply to the chymotrypsin-catalyzed hydrolysis of p-nitrophenyl acetate:
where P1 is an alcohol or amine, PZ a free acid, and EPs an acyl enzyme. In all the proflavin-displacement reactions, the first occurrence upon introduction of substrate (or buffer) appears to be a very rapid decrease in concentration of EF, the enzyme- proflavin complex. This decrease, which is just barely observ- able if seen at all (it does not appear in Fig. 3) is considered to reflect decomposition of EF brought about by dilution or by formation of an enzyme-substrate complex, ES (in Equation ll), or both. With the specific substrate amides ATA and APA this initial rapid decrease in EF concentration is followed by a time interval up to 5 min in length, depending on pH and SO, during which EF concentration remains constant, and which is considered to reflect the concentration of ES. It is this time int.erval that permits the static difference spectrum method of determining K’s described above for amides. With the specific substrate ester ATE, a second step observed in the proflavin- displacement reaction makes a direct measurement of K’s diffi- cult. The determination of K’s for ATE can, however, be made from the stopped flow measurements by the procedure outlined below.
The second step in proflavin-displacement reactions involving specific substrate esters (a step not observable in the case of the specific substrate amides) is a second decrease in EF concentra- tion (see Fig. 3), which is considered to occur as a result of the formation of another intermediate, such as EP2 in Equation 11. This step, which has an observed rate dependent on both pH and initial substrate concentration, X0, is seen as a decrease in EF. For the particular experiment shown in Fig. 3, this step has a half-time of 0.01 sec. Subsequent to this rapid but measurable decrease in EF concentration, a period (about 5 set in Fig. 3) is observed during which essentially no change in EF occurs. The length of this period, which also depends on So, is considered to reflect the period during which there is maintained a steady state concentration of the intermediate such as EP2. Finally, an increase in the concentration of EF is observed; this is con- sidered to be due to the decomposition of EPz.
When stopped flow experiments such as the one illustrated in Fig. 3 are performed at various initial substrate concentrations, it is possible to calculate K’s and kZ3 of Equation 11 under the following conditions or assumptions. (a) ES and EF are formed in a rapid pre-equilibrium phase of the reaction, and the subse- quent progress of the reaction can be measured by observing the time-dependent change in EF concentration. (b) SO >> EO < Fo. These conditions allow the concentrations of both free substrate, X, and free proflavin, F, to be considered constant during the period of observation, and equal to their initial analytical values. Calculations indicate that under the most unfavorable experi- mental conditions used, the concentration of F changes by not more than 8% during the development of the steady state. (c) ka4 < ,&. This assumption is warranted by the fact that the presence of a steady state intermediate can be detected in traces such as Fig. 3 and that the steady state kinetic parameter,
by guest on January 17, 2020http://w
ww
.jbc.org/D
ownloaded from

Issue of September 10, 1967 K. G. Brad, A. Himoe, and G. P. Hess
TABLE IV
3979
Determination of kza and K’e for complex of a-chymolrypsin and ATE from stopped flow experiments Measurements were made spectrophotometrically at 465 mp by the proflavin-displacement method. Concentrations of enzyme and
proflavin in the reaction mixtures are approximately 10 PM and 50 PM, respectively; ionic strength is 0.39; temperature was 28”.
&n @PP) PH ATE concentration km K’,q kw.t
Observed Calculated
MM xc- M x 10s set-1 M x 10s
6.0 0.5-2.7 138 f 10 0.6 f 0.1 5.7 0.5-2.5 156 & 26 1.7 zk 0.3 3.0 (37) 8.7 (37) 3.3 5.4 0.5-2.7 103 f 13 2.0 It 0.3 5.0 0.5-2.25 35 f 9 2.3 rfr 0.6 0.84 (37) 8.3 (37) 5.6 4.6 0.6-2.75 17.5 f 1.3 2.9 * 0.2 0.35 (37) 6.6 (37) 5.6 4.3 0.6-2.75 8.2 f 1.2 3.0 i 0.5
a The experimentally observed values K’e (1 + (FO/KBF)) ( see Equation 20) were converted to K’s by assuming an average value for KBF of 4.4 X lo+ M at all plI values.
kcst, is small compared to lcobs in Equation 16~. The steady state and kinetic constant kcat can therefore be considered a measure of ka4. (d) Proflavin is a competitive inhibitor for the substrate and does
d(Eo - EF@ dt = EF &r&t + k&S) - 4aEo (15)
not perturb the system in some unknown way. The pertinent equations are as follows. In these equations,
E, F, S, P, EF, SF, and EP2 refer to the molar concentrations Integration of Equation 15 gives the concentration of EF at
of these substances, and the subscript zero indicates initial time t
analytical concentration (total concentration of the substance in all its forms).
(EF)t = E” * k& -I- k&z
ka4 + kB - eBkobst 4 1 (16)
01
K (E) (Fo) EF = EF
(12) E = % (EF)
0 4.
,Qj = (E)(so) = EF !k% = EF@ K’S FoK’e
Since Eo = E + ES + EPz + EF ”
EP2 = E. - EF $- + =’ FK, i-1 =Eo-EF% 2 3
0 s
d (EP2) -- = kz3ES - k,,EP, dt
I
I
0.1 I
0.2 Time (sac)
I I
0.3 0.4
FIG. 4. Stopped flow data at 465 rnp for ATE added to a mixture of cu-chymotrypsin and proflavin. A function of absorbance at time t and at steady state is plotted against time in accordance
FIG. 3. Photographs of oscilloscope traces of transmittance with Equation 19 of the text; the slopes of the experimental lines at 465 mp in a stopped flow experiment with ATE at pH 6.0 (see yield k&s. Final solution concentrations are 10 PM cr-chymo- Table IV). The time scale for the first part of the experiment trypsin and 50 MM proflavin; ionic strength = 0.39; temperature is 0.02 set per cm; for the other part shown it is 5.0 set per cm. = 2g0. 0, pH 5.4, initial concentration of ATE solution (SO) = Recording of the initial fast increase in transmittance, not shown, 2.70 mM; kobs = 38.7 set-I. 0, pH 5.4, & = 0.90 mM; koba = would have required a third time scale. Temperature was 28”. 19.9 se@. A, pH 4.6, SO = 2.75 mn; koba = 5.70 set-I.
by guest on January 17, 2020http://w
ww
.jbc.org/D
ownloaded from
3980 Chymotrypsin-catalyzed Hydrolysis of Specijic Substrates. III Vol. 242, No. I7
is the molar absorption coefficient of the enzyme-proflavin complex at 465 rnp. Therefore, a plot according to
ln [(A466)t - (~465hsl = c - kobs t (19)
allows evaluation of k,,bs. Typical examples of first order plots of the pre-steady state portion of the stopped flow traces ac- cording to Equation 19 are shown in Fig. 4. The dependence of k&s, the slope, on substrate concentration is seen in the two plots at pH 5.4. The effect of pH on kobs is shown by the two plots at the same substrate concentration but different pH.
Values of k&s obtained at various substrate concentrations can then be plotted according to a rearrangement of Equation 16a
k obs -k3~=k33-[(k,b.~k3.)K~s(1+~)] (20)
Since Fo, KEP, and k34 are known, kz3 and K’, can be determined either graphically or, as in this study, by means of a digital computer program.
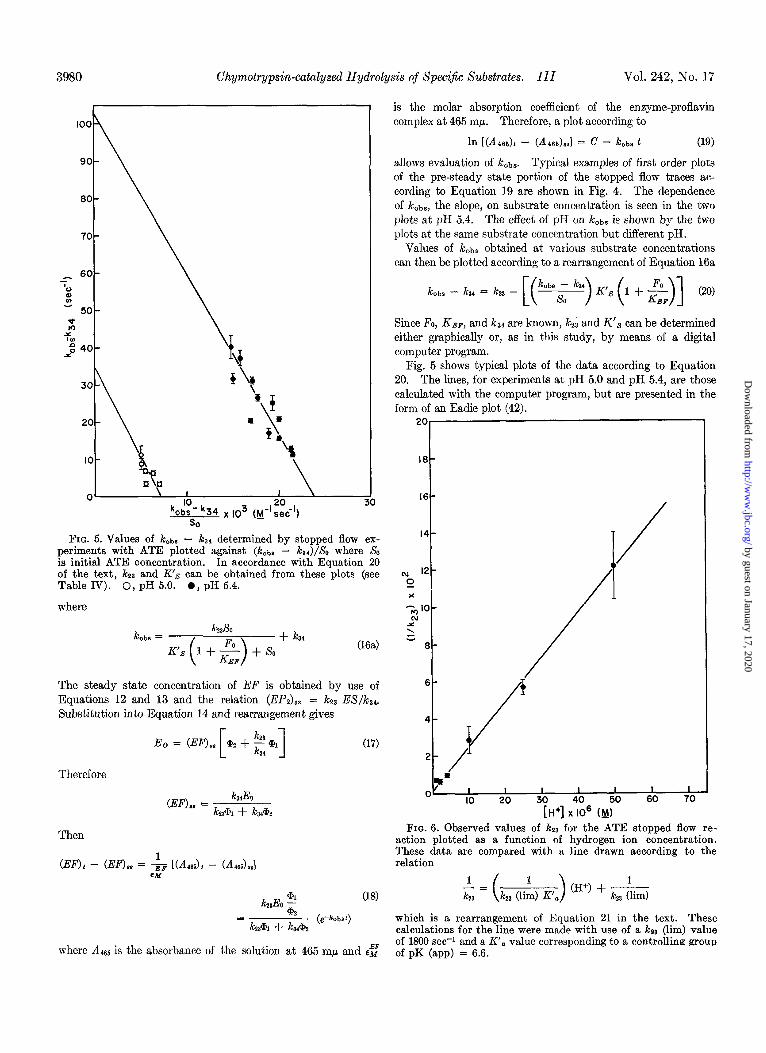
Fig. 5 shows typical plots of the data according to Equation 20. The lines, for experiments at pH 5.0 and pH 5.4, are those calculated with the computer program, but are presented in the form of an Eadie plot (42).
18
t
FIG. 5. Values of k&a - ka* determined by stopped flow ex- periments with ATE plotted against (k&s - k,a)/So where SO is initial ATE concentration. In accordance with Equation 20 of the text, kza and K’S can be obtained from these plots (see Table IV). 0, pH 5.0. 0, pH 5.4.
where
k k&Jo
oba = + ka
K’S (16a)
The steady state concentration of EF is obtained by use of Equations 12 and 13 and the relation (EPz),, = kt3 ES/kap. Substitution into Equation 14 and rearrangement gives
Therefore
Eo = (En,, (17)
Then
(EF) t - (E% = -&i IL4483, - L44dsJ 6.34
Ic230 - = k2~l + t4$ (e-k~bst)
08)
where AdG6 is the absorbance of the solution at 465 rnp and ez
FIG. 6. Observed values of kt3 for the ATE stopped flow re- action plotted as a function of hydrogen ion concentration. These data are compared with a line drawn according to the relation
which is a rearrangement of Equation 21 in the text. These calculations for the line were made with use of a kpg (lim) value of 1800 set-r and a K’, value corresponding to a controlline group of pK (app) = 6.6.
by guest on January 17, 2020http://w
ww
.jbc.org/D
ownloaded from
Issue of September 10, 1967 K. G. Bran&, A. Himoe, and G. P. Hess 3981
In Table IV are tabulated the values and standard deviations obtained for K’s and kZ3 for ATE in the pH region 4.3 to 6.0. Also shown for comparison are previously published (37) steady state kinetic data, and values of K, (app) calculated from experimentally determined constants in accordance with the relation K, (app) = K’S[k34/(k23 + k34)] (41). It can be seen that observed and calculated K, (app) values are in reasonable agreement considering that the calculated values are based on determinations of so many constants.
It also appears from the data in Table IV that k23 is pH de- pendent, although the accuracy of the data and the limited pH range investigated (above pH 6 the reactions are too fast to be measured by our stopped flow equipment) are not sufficient for definite conclusions to be drawn. In Fig. 6 the data in Table IV are plotted according to a rearrangement of the equa- tion
where lcZ3 is the observed rate at a given pH, K’, is the observed acid dissociation constant of an ionizing group of the enzyme which controls the rate, and ks3 (lim) is the limiting, pH-inde- pendent value of kZ3 reached at the pH at which the ionizing group is completely dissociated. Fig. 6, in which kzZ-r is plotted against [H+], shows that the ,& values obtained in the pH 4.3 to pH 5.7 region (Table IV) are consistent with but do not determine a pH-independent value for k23 of 1800 set? and a controlling pK (app) of 6.6; the line in Fig. 6 was calculated for these values. An ionizing group with about the same pK (app) value has been implicated in the pH dependence of all chymotrypsin-catalyzed reactions studied (37).
DISCUSSION
The relationships between the steady state parameters kcat and K, (app) and the constants K’s, k 23, an d k34 of Equation 11 have been set forth (41). These relationships can be expressed as
k oat = k2&34/(k23 + k34) (22)
Km (app) = K'&d(h + ksd cm
It was first suggested by Gutfreund and Sturtevant (43) that kZ3 is rate-limiting for specific amide substrates; this requires that K’, and K, (app) be equivalent (kar >> kna in Equation 23). In the case of specific ester substrates, it has been proposed (37, 44) that there is a rapid build-up of an intermediate, such as EP2 in Equation 11, to a steady state level, followed by the rate-limiting decomposition of this intermediate; this requires that Kls be different from K, (app), and specifically that Kls be larger (kz3 >> k34 in Equation 23).
These suggestions about the chymotrypsin-catalyzed hydroly- sis of specific substrates were based entirely. on steady state kinetic studies which do not permit identification of the steady state kinetic parameters, k,,t and K, (app), with K’,, i&, or ks4 in Equation 11. In addition, even the validity of Equation 11, which is based on investigations of the chymotrypsin-cata- lyzed hydrolysis of p-nitrophenyl acetate, has recently been questioned. Faller and Sturtevant (45) showed that in the chymotrypsin-catalyzed hydrolysis of p-nitrophenyl acetate the formation of EPz (Equation 11) gives bimolecular kinetics, and their re-evaluation of previously published data (41) on this
reaction revealed that these data also fail to give evidence for the existence of an enzyme-substrate complex such as ES in Equation 11. Recent investigations by Barman and Gutfreund (46) of the chymotrypsin-catalyzed hydrolysis of furylacryloyl-n- tyrosine ethyl ester suggested to these authors the existence of an additional intermediate between ES and EP2 in Equation 11. In this work, however, the only experiment reported with this substrate was performed under conditions such that initial enzyme concentration was approximately the same as initial substrate concentration, and quantitative interpretation of the data under these conditions requires the evaluation of non- linear differential equations, an operation the authors (46) did not attempt.
Interpretation of the data we have obtained so far is also hampered by some difficulties. (a) Due to limited solubility of ATE, it was not possible to use initial substrate concentra- tions that were sufficiently greater than K’s to make the values of kz3 and Kls as accurate as one might wish. (b) While the pH dependence of kt3 follows the ionization of a single ionizing group of the enzyme of pK (app) -6.6 up to pH 5.7, the values ob- tained for ksa above pH 5.7 do not provide such conclusive evi- dence for the origin of this pH dependence. The data in Table IV show that values for k23 at pH 6.0 are the same as, if not lower than, the & values at pH 5.7. (c) The proflavin-displace- ment method clearly establishes the presence of a steady state intermediate (such as EP2 in Equation 11) in the chymotrypsin- catalyzed hydrolysis of a specific substrate ester, but the presence of additional intermediates not shown in Equation 11 is not excluded. No evidence is obtained about the step in which PI (ethanol when ATE is the substrate) is liberated. (d) The as- sumption that proflavin is a competitive inhibitor at all pH values at which the reactsion steps were investigated and that proflavin does not perturb the system in some as yet unknown way is implicit in the evaluation of the data; but recent experiments of Bernhard et al. (23) suggested to these authors the possible existence of ternary complexes consisting of enzyme, dye, and cinnamoyl imidazole.
The present studies of individual steps in the chymotrypsin- catalyzed hydrolysis of specific substrates do, however, con- tribute some definite information. Direct evidence is obtained that in the catalytic hydrolysis of specific substrate amides, K, (app) is a direct measure of an enzyme-substrate dissociation constant, Kls. These results, obtained from spectrophotometric measurements by the proflavin-displacement method, are in agreement with experiments reported in an accompanying paper (18), in which perturbation of the enzyme chromophore at 290 rnp is used to measure a dissociation constant for the complex between the specific amide substrate APA and chymotrypsin. The spectrophotometric measurements at 290 rnp (18) show that the intermediate responsible for this perturbation of the ultraviolet absorption spectrum of chymotrypsin is formed in less than 3 msec; and the present stopped flow experiments show that the intermediate observed in the proflavin experiments with specific amide substrates is formed in less than 5 msec. Since the rate-limiting step in the chymotrypsin-catalyzed hy- drolysis of these two amide substrates has a rate constant less than 0.07 set-I, it follows (18) that in the catalytic hydrolysis of the specific amide substrates APA and ATA, the rate-limiting step follows the formation of the EX complex and not the for- mation of a subsequent intermediate such as is observed in the chymotrypsin-catalyzed hydrolysis of ATE.
by guest on January 17, 2020http://w
ww
.jbc.org/D
ownloaded from
3982 Chymotrypsin-catalyzed Hydrolysis of Supecific Substates. III Vol. 242, No. 17
In the case of the specific substrate ester ATE, direct evidence is obtained in the studies presented here that the rate-limiting step does not follow the formation of the first ES complex. In these experiments, the proflavin technique permitted direct observation (Fig. 3) of the build-up of an intermediate such as EP2 in Equation 11 to a steady state level, and the subsequent decay of this intermediate as the substrate is exhausted. Fur- thermore, analysis of this pre-steady state portion of the reaction according to Equation 20 allowed determination of Kls and ,&. As can be seen in Table IV, the values determined for K’s are considerably larger than the values of the steady state kinetic parameter K, (app), where such values are available for com- parison, and they are of the same order as the K’s values for the corresponding specific substrate amide (Table III). The values of kz3 are generally 30 to 40 times larger than the corresponding kcat values, indicating that, in terms of Equation 11, lcoat is effectively measuring kar. The use of Equations 22 and 23 permits calculation of values for K, (app) from the values of key and Krs determined in these experiments and the keat values reported for steady state experiments (37). These calculated values, presented in the last column of Table IV, can be seen to agree with the kinetically determined values of K, (app). The experiments presented constitute, therefore, direct evidence for a three-step mechanism, and the first direct determination of K’S and k23 in chymotrypsin-catalyzed hydrolysis of specific substrate esters. We have previously published the first direct determination of K’s values in the chymotrypsin-catalyzed hydrolysis of a specific substrate amide (18, 26).
REFERENCES
1. NIEMANN, C., Science, 143, 1287 (1964). 2. WOOTTON, J. F., AND HESS, G. P., J. Amer. Chem. Sot., 84,
440 (1962). 3. HAVSTEEN, B. H., AND HESS, G. P., J. Amer. Chem. Sot., 84,
448 (1962). 4. LABOUESSE, B., HAVSTEEN, B. H., ANP HENS, G. P., Proc.
Nat. Acad. Sci. U. S. A., 48, 2137 (1962). 5. OPPENHEIMER, H. L., MERCOUROFF, J., AND HESS, G. P.,
Biochim. Biophys. Acta, 71, 78 (1963). 6. HAVSTEEN, B. H., AND HESS, G. P., J. Amer. Chem. Sot., 85,
791 (1963). 7. HAVSTEEN, B. H., LABOUESSE, B., AND HESS, G. P., J. Amer.
Chem. Sot., 85, 796 (1963). 8. MOON, A Y., MERCOUROFF, J., AND HESS, G. P., J. Biol.
Chem., 240, 717 (1965). 9. MOON, A Y., STURTEVANT, J. M., AND HESS, G. P., J. Biol.
Chem., 240, 4204 (1965). 10. OPPENHEIMER, H. L., LABOUESSE, B., AND HESS, G. P., J.
Biol. Chem., 241, 2720 (1966). 11. JANSEN, E. F., NUTTING, M. D. F., JANG, R., AND BALLS, A.
K., J. Biol. Chem., 179, 189 (1949). 12. HARTLEY, B. S., AND KILBY, B. A., Biochem. J., 60, 672 (1952). 13. OOSTERBAAN, R. A., AND VAN ADRICHEM, M. E., Biochim.
Biophys. Acta, 27, 423 (1958).
14.
15.
16.
17.
18.
19.
20.
21.
22.
23.
24. 25.
26.
27.
28.
29.
30.
31.
32.
33.
34. WII,KINSON; G. N., Biochem. J., 80, 324 (1961). 35. BENESI. H. A.. AND HILDEBRAND. J. H.. J. Amer. Chem. Sot..
36.
37.
38.
39.
40. 41.
42. 43.
44.
45.
46.
WEINER, H., AND KOSHLAND, D. E., JR., J. Mol. Biol., 12, 881 (1965).
BILTONEN, R., LUMRY, R., MADISON, V., AND PARKER, H., Proc. Nat. Acad. Sci. U. S. A., 54, 1018 (1965).
ERLANGER, B. F.. CASTLEMAN, H., AND COOPER, A. G., J. Amer. Chem. So;., 85, 1872 (1963):
HAVSTEEN. B. H.. AND HESS. G. P.. Biochem. Bionhus. Res. Commun., 14, 3i3 (1964). ’ ’
L ”
HIMOE, A., BRANDT, K. G., AND HESS, G. P., J. Biol. Chem., 242, 3963 (1967).
WALLACE. R. A.. KURTZ. A. N.. AND NIEMANN, C.. Biochemis- try, 2,824 (1963). ’
WEINER, H., AND KOSHLAND, D. E., JR., J. Biol. Chem., 240, 2764 (1965).
WEINER, H.; WHITE, W. N., HOARE, D. G., AND KOSHLAND, D. E., JR., J. Amer. Chem. SOL, 88, 3851 (1966).
BERNHARD, S. A., AND LEE, B. F., Abstracts Sixth International Congress of Biochemistry, 196.4, IUB Vol. Sd, p. 297, IV-9
BERNHARD, S. A., LEE, B. F., AND TASHJIAN, Z. H., J. Mol. Biol., 18, 405 (1966).
GLAZER, A. N., Proc. Nat. Acad. Sei. U. S. A., 64, 171 (1965). BERNHARD, S. A., AND GUTFREUND, H., Proc. Nat. Acad. Sci.
U. S. A., 63, 1238 (1965). BRANDT, K. G., AND HESS, G. P., Biochem. Biophys. Res.
Commun., 22, 447 (1966). JACOBSEN, C. F., Compt. Rend. Trav. Lab. Carlsberg, Ser.
Chim., 26, 325 (1947). DIXON, G. H., AND NEURATH, H., J. Biol. Chem., 226, 1049
(1957). WILCOX, P. E., KRAUT, J., WADE, R. D., AND NEUR~TH, H.,
Biochim. Biiphys. A&a, .24, 72 (1957). ALBERT. A.. The acridines. Edward Arnold and Comvanv,
Londdn, 1951. _ “.
JENNINGS, R. R., AND NIEMANN, C., J. Amer. Chem. Sot., 75, 4687 (1953).
HIMOE, A., AND HESS, G. P., Biochem. Biophys. Res. Commun., 23, 234 (1966).
HIMOE, A., PARKS, P. C., AND HESS, G. P., J. Biol. Chem., 242, 919 (1967).
71, 2fO3 (1949). SWINEHART, J. H., AND HESS, G. P., Biochim. Biophys. Acta,
104, 205 (1965). BENDER, M. L., CLEMENT, G. E., K~ZDY, F. J., AND HECK,
H. D’A:, J. Amer. Chem. koc., 86; 3680 (1964). FOSTER, R. J., AND NIEMANN, C., J. Amer. Chem. SOL, 77,
1886 (1955). FOSTER, R. J., SHINE, H. J., AND NIEMANN, C., J. Amer.
Chem. Sot.. 77. 2378 (1955). HARTLEY, B.‘S., XND K;LBY,‘B. A., Biochem. J., 66, 288 (1954). GUTFREUND, H., AND STURTEVANT, J. M., Biochem. J., 63, 656
(1956). EADIE, G. S., J. Biol. Chem., 146, 85 (1942). GUTFREUND, H., AND STURTEVANT, J. M., Proc. lITat. Acad.
Sci. U. S. A., 42, 719 (1956). GUTFREUND, H., AND HAMMOND, B. R., Biochem. J., 73, 526
(1959). FALLLR, L., AND STURTEVANT, J. M., J. Biol. Chem., 241
4825 (1966). BARMAN, T. E., AND GUTFREUND, H., Biochem. J., 101, 411
(1966).
by guest on January 17, 2020http://w
ww
.jbc.org/D
ownloaded from
Karl G. Brandt, Albert Himoe and George P. HessAND ESTER SUBSTRATES
ENZYME-SUBSTRATE BINDING CONSTANTS FOR SPECIFIC AMIDEIII. DETERMINATION OF INDIVIDUAL RATE CONSTANTS AND
Investigations of the Chymotrypsin-catalyzed Hydrolysis of Specific Substrates:
1967, 242:3973-3982.J. Biol. Chem.
http://www.jbc.org/content/242/17/3973Access the most updated version of this article at
Alerts:
When a correction for this article is posted•
When this article is cited•
to choose from all of JBC's e-mail alertsClick here
http://www.jbc.org/content/242/17/3973.full.html#ref-list-1
This article cites 0 references, 0 of which can be accessed free at
by guest on January 17, 2020http://w
ww
.jbc.org/D
ownloaded from