investigations for obtaining desired strength of … for obtaining desired strength of nylon6 and fe...
TRANSCRIPT

FULL RESEARCH ARTICLE
Investigations for obtaining desired strength of Nylon6 and Fepowder-based composite wire for FDM feedstock filament
Harish K. Garg1 • Rupinder Singh2
Received: 1 June 2016 / Accepted: 20 April 2017 / Published online: 26 April 2017
� Springer International Publishing Switzerland 2017
Abstract In the present work, an effort has been made for
modelling the peak strength of Nylon6-Fe powder com-
posite-based feedstock filament (wire) for fused deposition
modelling (FDM) process. The developed filament has
been used to prepare functional prototypes with ferro-
magnetic characteristics. The methodology involves the
use of historical data approach of response surface
methodology (RSM) to study the effect of input process
parameters (namely: barrel temperature, die temperature,
screw speed, speed of the winding machine of single screw
extruder and melt flow index of composite material as
rheological property) on peak strength of the filament
developed. The model for prediction of peak strength of
Nylon6-Fe powder composite filament has been counter
verified by actual experimentation. Further, the results of
the study also highlights that Nylon6-Fe composite-based
FDM filament enabled successful run of this material
without any change in hardware/software of the commer-
cial FDM setup.
Keywords Fused deposition modelling � Wire strength �Acrylonitrile butadiene styrene � Screw extruder �Composite wire
1 Introduction
Rapid manufacturing (RM) is considered as one of the
revolution of 21st century and its opportunities and
advantages are extensive [1]. RM parts are made by using
additive manufacturing (AM) technologies and practically
no waste material is generated [2]. Moreover, RM can be
used in the case of even complex geometries and has given
freedom for new designs [3]. However, the tooling that is
required for manufacturing demands a sizeable investment
and a significant time is spent on the design of the product
[4]. RM is an enabling technology since it eliminates the
upfront expense and expedites manufacturing [5]. Reduc-
tion of product development cycle time is a major concern
in industries to remain competitive in the market place.
Hence, focus has shifted from traditional product devel-
opment methodology to rapid fabrication techniques [6].
With the idea of improvement of accuracy and materials is
considered, it can be envisioned to upgrade the conven-
tional techniques to so-called RM techniques in which the
single parts are made which will be the end product rather
than being a prototype [7].
Commercially, FDM (which is one of the cost effective
AM technology) uses ABS wire for production of RP
models. Some reported studies highlight that as a substi-
tute, metal polymer feed stock is prepared by mixing the
proportions of metals and polymers in powder form. With
this, the high-performance thermoplastic composite for
FDM process has been developed [8]. Further surfactants
and plasticizers are added to improve the flow, stiffness and
viscosity of the feed stock filament [9]. This composite
have thermo-tropic liquid crystal fibres, post processed by
dual extrusion process. The parts obtained by FDM using
this composite material have tensile modulus and strength
four times than acrylonitrile butadiene styrene (ABS).
& Rupinder Singh
1 Department of Mechanical Engineering, MRSPTU Bathinda,
Bathinda, India
2 Department of Production Engineering, GNDEC Ludhiana,
Ludhiana, India
123
Prog Addit Manuf (2017) 2:73–83
DOI 10.1007/s40964-017-0022-2

Product features, quality, cost, and time to market are
the important factors for a manufacturer to remain com-
petitive and for this AM offers an opportunity to make
products faster and usually at a lower price than the con-
ventional methods [10–12]. FDM is second most widely
used AM technology, after Stereo-lithography, in which a
filament of acrylonitrile–butadiene–styrene (ABS) material
is used [13]. ABS has good mechanical properties and
recently polycarbonate and polysulfonic materials have
been introduced with greater strength and temperature
range [14]. FDM is cheaper than other AM machines with
low maintenance and is extensively used for commercial
applications [13]. After the research of 20 years, the AM
continues to grow with the addition of new technologies,
methods and applications [15]. For fabricating functional
components by FDM, some researchers have developed
new metallic and ceramic materials of high mechanical and
thermal properties to fulfil the requirements of application.
Rutgers University in the USA have developed fused
deposition ceramics (FDC) and metals for industrial
applications. A variety of ceramic and metallic materials
such as silicon nitrate, aluminium oxide, hydroxypatite and
stainless steel are selected for a variety of structural,
electroceramic and bioceramics applications [8]. Modern
RM processes uses computer-aided design-based auto-
mated, AM techniques to construct parts that are used
directly as finished products or components. Although
current RM systems are being successfully used in spe-
cialist applications for the production of end-user parts,
however, many problems are still unsolved [16].
2 Fused deposition modelling
FDM machine dispenses two materials from which one
material is used to build the part, while the other is used for
the support structures. The material in the form of wire is
supplied to the head of the machine from a spool. The
filament is fed into a temperature-controlled head and
heated to a semi-liquid state to produce the part. The head
extrudes and deposits the material in thin layers onto a
fixtureless base [17, 18]. The head directs the material into
place with precision, as each layer is extruded; it bonds to
the previous layer and solidifies. The designed object
emerges as a solid three-dimensional part without the need
for tooling. The FDM machine operates in X-, Y- and Z-
axes, drawing the model one layer at a time. The .STL file
of a model is imported into pre-processing software of the
FDM machine and after reviewing the path data and gen-
erating the tool paths; the data is transferred into the FDM
machine. The best orientation is chosen and the part is
sliced into horizontal layers varying from ±0.127 to
0.254 mm thickness. A support structure is created where
needed which is based on the position and geometry of the
part. Once the part is completed the support structures are
removed and the surface is finished [10]. A key require-
ment for any material to be used in FDM is compatibility of
material with existing FDM setup without changing func-
tional hardware/software of machine. Apart from compat-
ibility, mechanical properties of material arealso important
to explore its industrial applications [19]. The FDM pro-
cess has been shown in Fig. 1.
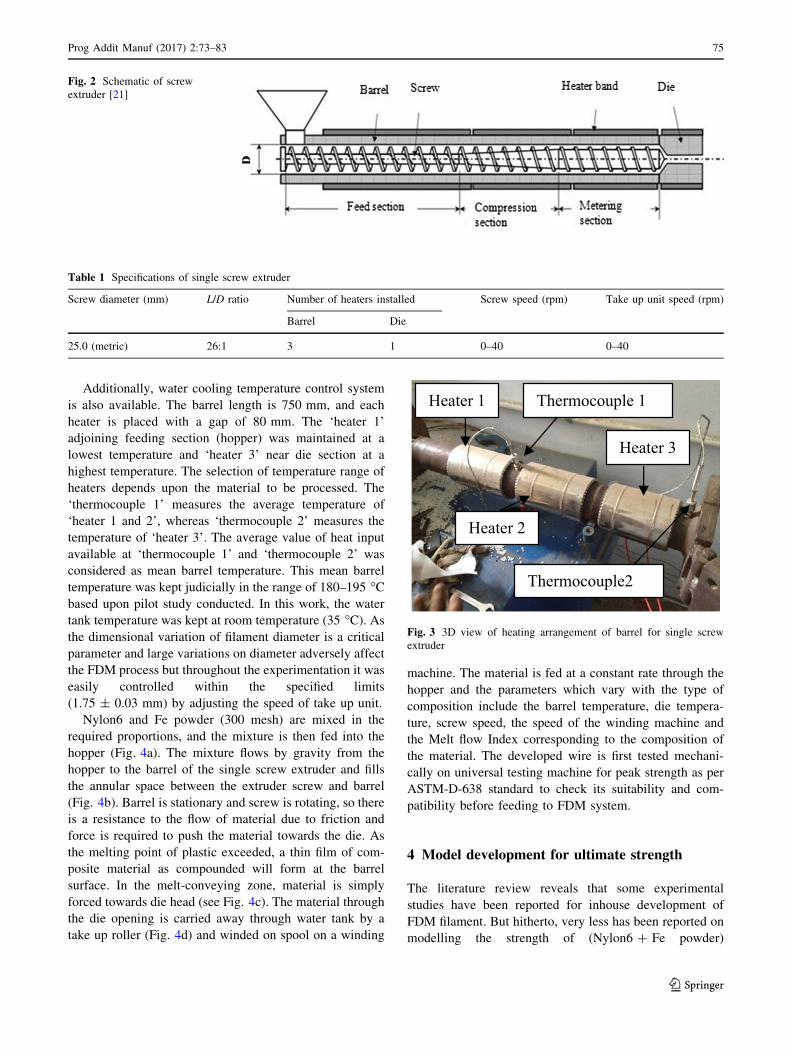
3 Screw extruder
The single screw extruder has been used to prepare the
composite wire to be finally used on the FDM setup. The
schematic of the screw extruder is shown in Fig. 2.
The variable parameters of extrusion process are: barrel
temperature, screw speed, die temperature, take up unit
speed, water tank temperature and die nozzle diameter. The
various specifications of single screw extruder for the
fabrication of filament are shown in Table 1. The die
nozzle diameter is 4 mm, and the diameter of extruded
filament was controlled by adjusting take up unit speed and
water tank temperature.
The barrel was hard tempered in order to reduce the
friction and wear during the processing of composite
materials. The screw and die nozzle was chrome plated so
that material flows continuously without sticking with
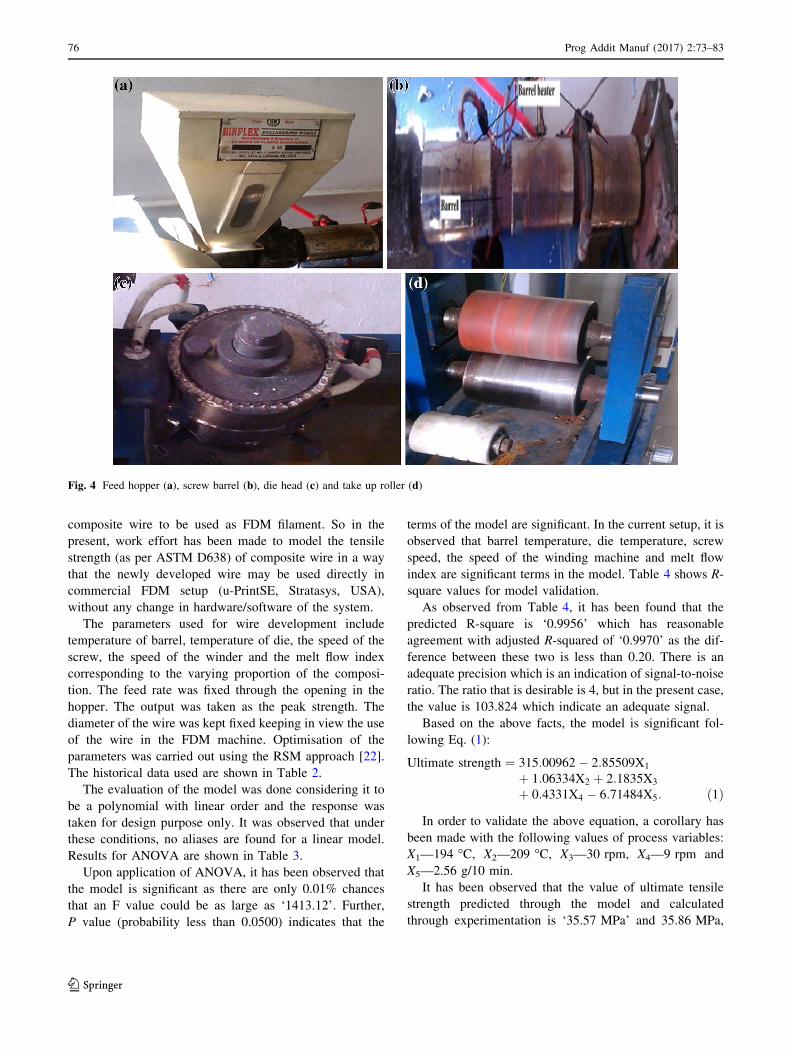
screw and nozzle surface. Four parameters such as material
composition, barrel temperature, die temperature and screw
speed were selected. The single screw extruder barrel
consist of three heaters (Heater 1, Heater 2 and Heater 3)
each having a capacity of 1 KW and equipped with zone
temperature control (see Fig. 3).
Fig. 1 Schematic of FDM [20]
74 Prog Addit Manuf (2017) 2:73–83
123
Additionally, water cooling temperature control system
is also available. The barrel length is 750 mm, and each
heater is placed with a gap of 80 mm. The ‘heater 1’
adjoining feeding section (hopper) was maintained at a
lowest temperature and ‘heater 3’ near die section at a
highest temperature. The selection of temperature range of
heaters depends upon the material to be processed. The
‘thermocouple 1’ measures the average temperature of
‘heater 1 and 2’, whereas ‘thermocouple 2’ measures the
temperature of ‘heater 3’. The average value of heat input
available at ‘thermocouple 1’ and ‘thermocouple 2’ was
considered as mean barrel temperature. This mean barrel
temperature was kept judicially in the range of 180–195 �Cbased upon pilot study conducted. In this work, the water
tank temperature was kept at room temperature (35 �C). Asthe dimensional variation of filament diameter is a critical
parameter and large variations on diameter adversely affect
the FDM process but throughout the experimentation it was
easily controlled within the specified limits
(1.75 ± 0.03 mm) by adjusting the speed of take up unit.
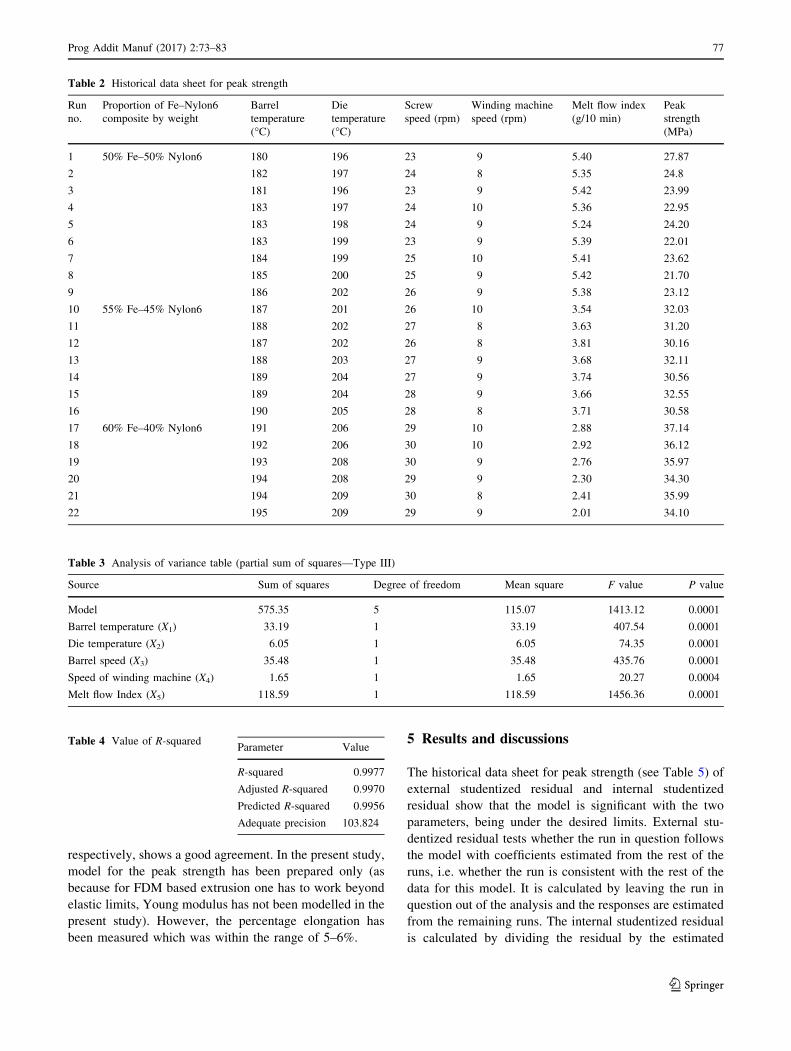
Nylon6 and Fe powder (300 mesh) are mixed in the
required proportions, and the mixture is then fed into the
hopper (Fig. 4a). The mixture flows by gravity from the
hopper to the barrel of the single screw extruder and fills
the annular space between the extruder screw and barrel
(Fig. 4b). Barrel is stationary and screw is rotating, so there
is a resistance to the flow of material due to friction and
force is required to push the material towards the die. As
the melting point of plastic exceeded, a thin film of com-
posite material as compounded will form at the barrel
surface. In the melt-conveying zone, material is simply
forced towards die head (see Fig. 4c). The material through
the die opening is carried away through water tank by a
take up roller (Fig. 4d) and winded on spool on a winding
machine. The material is fed at a constant rate through the
hopper and the parameters which vary with the type of
composition include the barrel temperature, die tempera-
ture, screw speed, the speed of the winding machine and
the Melt flow Index corresponding to the composition of
the material. The developed wire is first tested mechani-
cally on universal testing machine for peak strength as per
ASTM-D-638 standard to check its suitability and com-
patibility before feeding to FDM system.
4 Model development for ultimate strength
The literature review reveals that some experimental
studies have been reported for inhouse development of
FDM filament. But hitherto, very less has been reported on
modelling the strength of (Nylon6 ? Fe powder)
Fig. 2 Schematic of screw
extruder [21]
Heater 1
Heater 3
Heater 2
Thermocouple 1
Thermocouple2
Fig. 3 3D view of heating arrangement of barrel for single screw
extruder
Table 1 Specifications of single screw extruder
Screw diameter (mm) L/D ratio Number of heaters installed Screw speed (rpm) Take up unit speed (rpm)
Barrel Die
25.0 (metric) 26:1 3 1 0–40 0–40
Prog Addit Manuf (2017) 2:73–83 75
123
composite wire to be used as FDM filament. So in the
present, work effort has been made to model the tensile
strength (as per ASTM D638) of composite wire in a way
that the newly developed wire may be used directly in
commercial FDM setup (u-PrintSE, Stratasys, USA),
without any change in hardware/software of the system.
The parameters used for wire development include
temperature of barrel, temperature of die, the speed of the
screw, the speed of the winder and the melt flow index
corresponding to the varying proportion of the composi-
tion. The feed rate was fixed through the opening in the
hopper. The output was taken as the peak strength. The
diameter of the wire was kept fixed keeping in view the use
of the wire in the FDM machine. Optimisation of the
parameters was carried out using the RSM approach [22].
The historical data used are shown in Table 2.
The evaluation of the model was done considering it to
be a polynomial with linear order and the response was
taken for design purpose only. It was observed that under
these conditions, no aliases are found for a linear model.
Results for ANOVA are shown in Table 3.
Upon application of ANOVA, it has been observed that
the model is significant as there are only 0.01% chances
that an F value could be as large as ‘1413.12’. Further,
P value (probability less than 0.0500) indicates that the
terms of the model are significant. In the current setup, it is
observed that barrel temperature, die temperature, screw
speed, the speed of the winding machine and melt flow
index are significant terms in the model. Table 4 shows R-
square values for model validation.
As observed from Table 4, it has been found that the
predicted R-square is ‘0.9956’ which has reasonable
agreement with adjusted R-squared of ‘0.9970’ as the dif-
ference between these two is less than 0.20. There is an
adequate precision which is an indication of signal-to-noise
ratio. The ratio that is desirable is 4, but in the present case,
the value is 103.824 which indicate an adequate signal.
Based on the above facts, the model is significant fol-
lowing Eq. (1):
Ultimate strength ¼ 315:00962� 2:85509X1
þ 1:06334X2 þ 2:1835X3
þ 0:4331X4 � 6:71484X5: ð1Þ
In order to validate the above equation, a corollary has
been made with the following values of process variables:
X1—194 �C, X2—209 �C, X3—30 rpm, X4—9 rpm and
X5—2.56 g/10 min.
It has been observed that the value of ultimate tensile
strength predicted through the model and calculated
through experimentation is ‘35.57 MPa’ and 35.86 MPa,
Fig. 4 Feed hopper (a), screw barrel (b), die head (c) and take up roller (d)
76 Prog Addit Manuf (2017) 2:73–83
123
respectively, shows a good agreement. In the present study,
model for the peak strength has been prepared only (as
because for FDM based extrusion one has to work beyond
elastic limits, Young modulus has not been modelled in the
present study). However, the percentage elongation has
been measured which was within the range of 5–6%.
5 Results and discussions
The historical data sheet for peak strength (see Table 5) of
external studentized residual and internal studentized
residual show that the model is significant with the two
parameters, being under the desired limits. External stu-
dentized residual tests whether the run in question follows
the model with coefficients estimated from the rest of the
runs, i.e. whether the run is consistent with the rest of the
data for this model. It is calculated by leaving the run in
question out of the analysis and the responses are estimated
from the remaining runs. The internal studentized residual
is calculated by dividing the residual by the estimated
Table 2 Historical data sheet for peak strength
Run
no.
Proportion of Fe–Nylon6
composite by weight
Barrel
temperature
(�C)
Die
temperature
(�C)
Screw
speed (rpm)
Winding machine
speed (rpm)
Melt flow index
(g/10 min)
Peak
strength
(MPa)
1 50% Fe–50% Nylon6 180 196 23 9 5.40 27.87
2 182 197 24 8 5.35 24.8
3 181 196 23 9 5.42 23.99
4 183 197 24 10 5.36 22.95
5 183 198 24 9 5.24 24.20
6 183 199 23 9 5.39 22.01
7 184 199 25 10 5.41 23.62
8 185 200 25 9 5.42 21.70
9 186 202 26 9 5.38 23.12
10 55% Fe–45% Nylon6 187 201 26 10 3.54 32.03
11 188 202 27 8 3.63 31.20
12 187 202 26 8 3.81 30.16
13 188 203 27 9 3.68 32.11
14 189 204 27 9 3.74 30.56
15 189 204 28 9 3.66 32.55
16 190 205 28 8 3.71 30.58
17 60% Fe–40% Nylon6 191 206 29 10 2.88 37.14
18 192 206 30 10 2.92 36.12
19 193 208 30 9 2.76 35.97
20 194 208 29 9 2.30 34.30
21 194 209 30 8 2.41 35.99
22 195 209 29 9 2.01 34.10
Table 3 Analysis of variance table (partial sum of squares—Type III)
Source Sum of squares Degree of freedom Mean square F value P value
Model 575.35 5 115.07 1413.12 0.0001
Barrel temperature (X1) 33.19 1 33.19 407.54 0.0001
Die temperature (X2) 6.05 1 6.05 74.35 0.0001
Barrel speed (X3) 35.48 1 35.48 435.76 0.0001
Speed of winding machine (X4) 1.65 1 1.65 20.27 0.0004
Melt flow Index (X5) 118.59 1 118.59 1456.36 0.0001
Table 4 Value of R-squaredParameter Value
R-squared 0.9977
Adjusted R-squared 0.9970
Predicted R-squared 0.9956
Adequate precision 103.824
Prog Addit Manuf (2017) 2:73–83 77
123

standard deviation of that residual, and it gives the measure
of the number of standard deviations separating the actual
and predicted values.
The normal probability plot (see Fig. 5) compares the
distribution of the residuals to a normal percentage (%)
probability for peak strength. The plot clearly shows that
there is a probability of 50% that the values of residuals
will lie near ‘0’ and these will be majority in number and
the remaining residuals will be in the range of -0.805 to
?0.482 (where residuals is the difference between the
actual and the predicted value). The data and the graph give
an indication that the residuals will follow the normal
distribution curve.
The residual and predicted plot (see Fig. 6) checks for
constant variance across the range of predictions as com-
pared to the residual for peak strength. As the points are
randomly scattered between the extreme red lines, it is
confirmed that there is a constant variance in the data.
Figure 7 shows the plot between the predicted and the
actual values of peak strength. This is primarily used to
detect a value or group of values which have not been
predicted well by the model. As observed from Fig. 7,
predicted value and the actual values are close to each
other which signifies that the developed model is accurate
and gives consistent results.
The Cook’s distance (see Fig. 8) is a measure of how
much the regression changes if the case is omitted from the
analysis. All the points as per the runs are within the
defined limits which signify that the model is significant.
No two points are at a considerable distance from each
other except for run number 1 which is at a greater distance
Externally Studentized Residuals
Nor
mal
% P
roba
bilit
y
-2.00 -1.00 0.00 1.00 2.00 3.00
1
51020305070809095
99
Fig. 5 Variation of normal % probability with respect to externally
studentized residuals for peak strength
Table 5 Analysis of historical data sheet for peak strength
Run
order
Proportion of Fe–Nylon6
composite by weight
Predicted
value
Residual Leverage Internally studentized
residual
Externally studentized
residual
Cooks
distance
1 50% Fe–50% Nylon6 27.3676 0.5024 0.4508 2.3755 2.8588 0.7719
2 24.8069 -0.0069 0.2945 -0.0289 -0.0280 0.0001
3 24.3782 -0.3882 0.1792 -1.5017 -1.5688 0.0821
4 22.7509 0.1991 0.3767 0.8837 0.8773 0.0786
5 24.1869 0.0131 0.1020 0.0483 0.0468 0.00004
6 22.0595 -0.0495 0.4423 -0.2325 -0.2255 0.0071
7 23.8703 -0.2503 0.2388 -1.0052 -1.0055 0.0528
8 21.5783 0.1217 0.2678 0.4985 0.4865 0.0152
9 23.3020 -0.1820 0.4030 -0.8253 -0.8167 0.0766
10 55% Fe–45% Nylon6 32.1720 -0.1420 0.3206 -0.6035 -0.5911 0.0286
11 31.0932 0.1068 0.3555 0.4663 0.4546 0.0200
12 30.5561 -0.3961 0.1927 -1.5448 -1.6216 0.0949
13 32.2539 -0.1439 0.0861 -0.5274 -0.5152 0.0044
14 30.0592 0.5008 0.0758 1.8254 1.9863 0.0455
15 32.7799 -0.2299 0.1197 -0.8588 -0.8513 0.0167
16 30.2193 0.3607 0.2023 1.4151 1.4649 0.0846
17 60% Fe–40% Nylon6 37.0506 0.0894 0.3381 0.3850 0.3745 0.0126
18 36.1104 0.0096 0.3855 0.0427 0.0414 0.0002
19 36.0233 -0.0533 0.1988 -0.2087 -0.2024 0.0018
20 34.0736 0.2264 0.2657 0.9261 0.9217 0.0517
21 36.1487 -0.1587 0.2579 -0.6454 -0.6333 0.0241
22 34.2291 -0.1291 0.4464 -0.6081 -0.5957 0.0497
78 Prog Addit Manuf (2017) 2:73–83
123

relative to the other points but the run 1 is again within the
defined limits. Leverage is a measure as to how each point
influences the model fit. The point having leverage of 1.0
or very close to 1 means that the model exactly fits that
point and that point controls the model.
Figure 9 shows that the leverage of none of the points is
near 1 which again is an indication of a good model.
The optimization of the parameters has been carried out
using design expert software and number of optimal solu-
tions has been listed. The parameters selected, by keeping
the maximum peak strength as the goal, are given in
Table 6.
Melt flow index of 2.41 g/10 min was taken as the value
of MFI for ABS is in the similar range at 230 �C and 3.8 kg
load. Based on the above parameters, the peak strength
comes out to 42.379 MPa which is comparable with the
peak strength of ABS used in FDM machine.
Figure 10 shows the graph for desirability between the
die temperature and the barrel temperature keeping the
barrel speed as 27 rpm, speed of winding machine as
9.08 rpm and melt flow index equals to 2.411 g/10 min as
per optimisation. From the graph, it is clear that the red
shading gives the range which is desirable, while the other
colour shadings give an indication of decreasing desir-
ability. The optimum parameters that have been chosen
have a desirable value of 1 and are suitable for further
experimentation. Figure 11 shows the 3D model for
desirability between the die temperature and the barrel
temperature keeping the barrel speed as 30 rpm, speed of
winding machine as 9 rpm and melt flow index equals to
2.41 g/10 min as per the optimised parameters. The hori-
zontal portion that is parallel to the base gives the values of
die temperature and the barrel temperature which are
desirable having a desirability of 1, whereas the inclined
portion gives an indication of decreasing desirability. From
the graph, it is clear that the values that have been opti-
mised lie in the desirability range of 1.
In order to confirm the distribution of the Fe particles in
polymeric composites, SEM and EDS (as shown in
Predicted
Ext
erna
lly S
tude
ntiz
ed R
esid
uals
-4.00
-2.00
0.00
2.00
4.00
4035302520
Fig. 6 Variation of externally studentized residuals with respect to
predicted data plot for peak strength
Actual
Pre
dict
ed
20
25
30
35
40
4035302520
Fig. 7 Variation of predicted and actual data plot for peak strength
Run Number
Coo
k's
Dis
tanc
e
0
0.2
0.4
0.6
0.8
1
1 4 7 10 13 16 19 22
Fig. 8 Variation of Cook’s distance with respect to run number for
peak strength
Run Number
Leve
rage
0.00
0.20
0.40
0.60
0.80
1.00
1 4 7 10 13 16 19 22
Fig. 9 Variation of leverage with respect to run number for peak
strength
Prog Addit Manuf (2017) 2:73–83 79
123
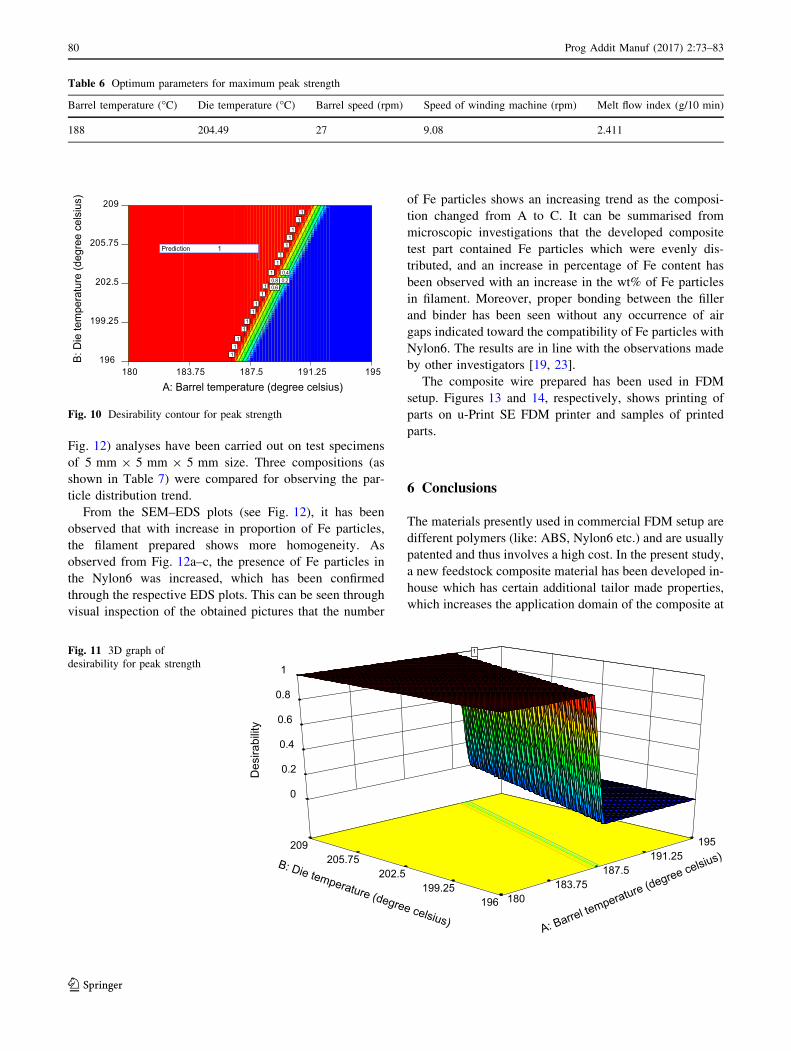
Fig. 12) analyses have been carried out on test specimens
of 5 mm 9 5 mm 9 5 mm size. Three compositions (as
shown in Table 7) were compared for observing the par-
ticle distribution trend.
From the SEM–EDS plots (see Fig. 12), it has been
observed that with increase in proportion of Fe particles,
the filament prepared shows more homogeneity. As
observed from Fig. 12a–c, the presence of Fe particles in
the Nylon6 was increased, which has been confirmed
through the respective EDS plots. This can be seen through
visual inspection of the obtained pictures that the number
of Fe particles shows an increasing trend as the composi-
tion changed from A to C. It can be summarised from
microscopic investigations that the developed composite
test part contained Fe particles which were evenly dis-
tributed, and an increase in percentage of Fe content has
been observed with an increase in the wt% of Fe particles
in filament. Moreover, proper bonding between the filler
and binder has been seen without any occurrence of air
gaps indicated toward the compatibility of Fe particles with
Nylon6. The results are in line with the observations made
by other investigators [19, 23].
The composite wire prepared has been used in FDM
setup. Figures 13 and 14, respectively, shows printing of
parts on u-Print SE FDM printer and samples of printed
parts.
6 Conclusions
The materials presently used in commercial FDM setup are
different polymers (like: ABS, Nylon6 etc.) and are usually
patented and thus involves a high cost. In the present study,
a new feedstock composite material has been developed in-
house which has certain additional tailor made properties,
which increases the application domain of the composite at
59152.1915.78157.381081196
199.25
202.5
205.75
209
A: Barrel temperature (degree celsius)
B: D
ie te
mpe
ratu
re (d
egre
e ce
lsiu
s)
0.20.4
0.60.8
11
1
11
11
11
1
11
11
1
11
Prediction 1
Fig. 10 Desirability contour for peak strength
196 199.25
202.5 205.75
209
180 183.75
187.5 191.25
195
0
0.2
0.4
0.6
0.8
1
Des
irabi
lity
A: Barrel temperature (degree celsius)B: Die temperature (degree celsius)
11Fig. 11 3D graph of
desirability for peak strength
Table 6 Optimum parameters for maximum peak strength
Barrel temperature (�C) Die temperature (�C) Barrel speed (rpm) Speed of winding machine (rpm) Melt flow index (g/10 min)
188 204.49 27 9.08 2.411
80 Prog Addit Manuf (2017) 2:73–83
123

Fig. 12 SEM–EDS plots of composition A (a), composition B (b) and composition C (c)
Prog Addit Manuf (2017) 2:73–83 81
123

a lower cost. The results obtained after experimentation are
summarised as below:
1. A composite feedstock filament which consists of Fe
and Nylon6 has been developed that can be used in the
existing FDM machine without any modifications. The
proportion of the filler (Fe) in Nylon6 has been
established using the MFI as the reference and a
loading of 60% Fe in the composite gave a MFI equal
to that of ABS that is currently put to use. In other
words, the optimum levels of barrel temperature, die
temperature, screw speed, speed of the winding
machine were chosen by considering melt flow index
as the reference property. The developed model for
peak strength is significant. The predicted R-squared
value is 0.9956 which is in reasonable agreement with
adjusted R-squared value of 0.9970. There is an
adequate precision which is an indication of high
signal-to-noise ratio. The ratio that is desirable is 4, but
in the present case, the value is 103.824 which indicate
an adequate signal.
2. Accurate models have been developed for peak
strength based on the input parameters of the screw
extruder. The optimisation of the screw extruder
parameters was performed using RSM through design
expert software. The mechanical testing of wire
fabricated at optimised parameters for composition
which contains 60% Fe and 40% Nylon6 on universal
tensile testing machine gave the peak strength compa-
rable with ABS material. The peak strength of the
alternative FDM filament enabled successful run of
this material without any feed stock filament breakage
and change in hardware/software of the system.
3. From the SEM–EDS plots, it has been observed that
the wt% content of Fe particles in Nylon-6 matrix was
uniform in the filament/wire prepared. Since the
composite developed in the present research work
has ferromagnetic properties, it can be used in
electrical/electronic/instrumentation sector.
Fig. 13 Printed cylindrical
section (a), printing of cubical
section (b) on u-print SE FDM
setup
Fig. 14 Printing of non
functional prototypes (a),printing of functional prototypes
with different cut sections
(b) on u-print SE FDM setup
Table 7 Compositions of Fe–Nylon6 (in wt%)
Composition Nylon6 Fe powder
A 50 50
B 45 55
C 40 60
82 Prog Addit Manuf (2017) 2:73–83
123
Acknowledgements The authors are thankful to manufacturing
research lab, Production Engineering, Guru Nanak Dev Engineering
College, Ludhiana (India) for technical support.
References
1. Garg HK, Singh R (2012) Experimental investigations for
development of pattern for dies using FDM. Mater Sci Forum
701:77–83
2. Kumar P, Ahuja IPS, Singh R (2012) Application of fusion
deposition modelling for rapid investment casting—a review. Int
J Mater Eng Innov 3:204–227
3. Garg HK, Singh R (2012) Pattern development for manufacturing
applications with fused deposition modelling-a case study. Int J
Autom Mech Eng 7:981–992
4. Chabbra M, Singh R (2011) Rapid casting solution. Rapid Pro-
totyp J 17:328–350
5. Jacobs PF, Hilton PD (2000) Rapid tooling and industrial appli-
cations. Marcel Dekker Ltd., ISBN-9780824787882, pp 10–18
6. Tromans G (2003) Developments in rapid casting. Professional
Engineering, pp 14–20. ISBN: 186058390392
7. Wohlers TT (2006) Wohlers report 2006: RP, RT, RM state of the
industry. Annual Worldwide Progress Report. Wohlers Associ-
ates Inc., Fort Collins CO
8. Masood SH, Song WQ (2004) Development of new metal/poly-
mer materials for rapid tooling using fused deposition modelling.
Mater Des 25:587–594
9. Masood SH, Song WQ (2005) Thermal Characteristics of a new
metal/polymer material for FDM rapid prototyping process.
Assem Autom 25:309–315
10. Upcraft S, Fletcher R (2003) The rapid prototyping technologies.
Assem Autom 23:318–330
11. Kruth JP (1991) Material manufacturing by rapid prototyping
technologies. CIRF Annu 40:603–614
12. Agarwala MK, Van WR, Bandyopadhyay A, Whalen PJ, Safari
A, Danforth SC (1996) Fused deposition of ceramics and metals:
an overview. In: Proceedings of the Solid Freeform Fabrication
Symposium, University of Texas, Austin, pp 385–392
13. Jain P, Kuthe AM (2013) Feasibility study of manufacturing
using rapid prototyping: FDM approach. Proc Eng 63:4–11
14. Dyrbus G (2010) Investigation on quality of rapid prototyping
FDM method. In: 14th International Research/Expert Conference,
Trend in the development of Machinery and Associated Tech-
nology, 11–18th September, TMT 2010, Mediterranean Cruise
15. Lee CW, Chua CK, Cheah CM, Tan LH, Feng C (2004) Rapid
investment casting: direct and indirect approaches via fused
deposition modelling. Int J Adv Manuf Technol 23:93–101
16. Singh R (2014) Process capability analysis of fused deposition
modelling for plastic components. Rapid Prototyp J 20:69–76
17. Bakar NSA, Alkahari MR, Boejang H (2010) Analysis on fused
deposition modelling performance. J Zhejiang Univ Sci A
11:972–977
18. Rochus P, Plesseria JY, Elsen MV, Kruth JP, Carrusc R, Dormal
T (2007) New applications of rapid prototyping and rapid man-
ufacturing (RP/RM). Act Astronautic 61:352–359
19. Singh R, Singh S (2014) Development of nylon based FDM fil-
ament for rapid tooling application. J Inst Eng 95:103–108
20. Zein I, Hutmacher DW, Tan KC, Teoh SH (2002) Fused depo-
sition modeling of novel scaffold architectures for tissue engi-
neering applications. Biomaterials 23:1169–1185
21. Das MK, Ghoshdastida PS (2002) Experimental validation of a
quasi three-dimensional conjugate heat transfer model for the
metering section of a single-screw plasticating extruder. J Mater
Process Technol 120:397–411
22. Kumar R, Dhiman S (2013) A study of sliding wear behaviour of
aluminium-7075 alloy and aluminium-7075 hybrid composite by
RSM. Mater Des 50:351–359
23. Garg HK, Singh R (2015) Comparison of wear behavior of ABS
and Nylon6—Fe powder composite parts prepared with fused
deposition modelling. J Cent S Univ 22(10):3705–3711
Prog Addit Manuf (2017) 2:73–83 83
123