investigation of the pathophysiology of migraine...
TRANSCRIPT
Sede Amministrativa: Università degli Studi di Padova
Dipartimento di Biologia
SCUOLA DI DOTTORATO DI RICERCA IN: BIOSCIENZE E BIOTECNOLOGIE
INDIRIZZO: NEUROBIOLOGIA
CICLO: XXVII
INVESTIGATION OF THE PATHOPHYSIOLOGY OF MIGRAINE
USING FAMILIAL HEMIPLEGIC MIGRAINE MOUSE MODELS
Direttore della Scuola: Ch.mo Prof. Giuseppe Zanotti
Coordinatore d’indirizzo: Ch.mo Prof. Daniela Pietrobon
Supervisore: Ch.mo Prof. Daniela Pietrobon
Dottorando: Clizia Capuani
1
INDEX
RIASSUNTO ............................................................................................................. 5
SUMMARY ............................................................................................................... 9
1. INTRODUCTION ............................................................................................... 13
1.1. Migraine ........................................................................................................ 13
1.1.1. Neurobiology of migraine ..................................................................... 13
1.1.2. CSD phenomenology ............................................................................. 15
1.1.3. Mechanisms of experimental CSD ........................................................ 16
1.1.4. CSD and migraine .................................................................................. 19
1.2. Familial Hemiplegic Migraine ...................................................................... 21
1.2.1. The α2 Na,K-ATPase and its functional roles ....................................... 23
1.2.2. Functional consequences of FHM mutations ........................................ 24
1.3. Cortex and its organization ............................................................................ 26
1.3.1. Cellular populations in the cortex .......................................................... 27
1.3.2. Astrocyte-neuron communication ......................................................... 29
1.3.2.1. Astrocytic glutamate uptake .......................................................... 30
1.3.2.2. Astrocytic potassium uptake .......................................................... 32
1.3.2.3. Synaptically-activated transporter-mediated current and K+ current
evoked in astrocytes by extracellular stimulation ....................................... 33
1.3.3. Excitation/inhibition balance in the cortex ............................................ 34
1.4. Cortical network electrical activity ............................................................... 36
1.4.1. Slow oscillations and their neuronal counterparts, up- and down-states 36
1.4.2. Initiation, propagation and termination of up-states .............................. 37
2. AIM OF WORK (I) ............................................................................................. 41
3. RESULTS (I) ....................................................................................................... 43
4. DISCUSSION (I) ................................................................................................. 55
5. AIM OF WORK (II) ........................................................................................... 59
2
6. RESULTS (II) ...................................................................................................... 61
6.1. Does W887R FHM2 mutation facilitate the induction and the propagation of
experimental cortical spreading depression (CSD) induced in cortical slices by high
KCl pulses? ........................................................................................................... 61
6.2. Does the loss-of-function of α2 Na,K-ATPase result in an impaired astrocyte-
mediated clearance of glutamate from the synaptic cleft during cortical neuronal
activity? ................................................................................................................ 64
6.3. Is the clearance of K+ by astrocytes during cortical neuronal activity impaired
as a consequence of the loss-of-function of α2 Na,K-ATPase? ........................... 72
6.4. Is Ca2+ content in the intracellular Ca2+ stores of astrocytes in FHM2 KI mice
increased and does Ca2+ release from stores contribute to the facilitation of
experimental CSD in FHM2 KI mice? ................................................................. 73
7. DISCUSSION (II) ................................................................................................ 77
8. MATERIALS AND METHODS ........................................................................ 83
8.1. Animals .......................................................................................................... 83
8.2. Coronal cortical slices preparation ................................................................ 83
8.2.1. Solutions ................................................................................................ 83
8.2.2. Slices preparation ................................................................................... 84
8.3. Patch clamp technique ................................................................................... 84
8.3.1. Patch clamp mode .................................................................................. 86
8.4. Patch clamp setup and recordings ................................................................. 86
8.4.1. Microscope ............................................................................................. 87
8.4.2. Electrophysiological setup ..................................................................... 87
8.4.3. Cell identification .................................................................................. 88
8.4.3.1. Pyramidal cells identification ......................................................... 88
8.4.3.2. Astrocytes identification ................................................................ 89
8.4.4. Solutions ................................................................................................ 90
8.4.4.1. Extracellular solutions .................................................................... 90
8.4.4.2. Intracellular solutions ..................................................................... 90
8.4.4.3. Drugs and toxins ............................................................................ 91
8.4.5. Electrodes ............................................................................................... 91
3
8.4.5.1. Recording electrode ....................................................................... 91
8.4.5.2. Stimulating electrode ..................................................................... 91
8.4.6. Data acquisition and analysis ................................................................. 91
8.4.6.1. Recordings and analysis of spontaneous recurrent cortical activity
...................................................................................................................... 92
8.4.6.2. Recordings and analysis of STC and K+ currents from astrocytes 93
8.5. Experimental CSD ......................................................................................... 94
8.6. Measurements of Ca2+ transients in astrocytic primary cultures ................... 95
8.7. Statistical analysis ......................................................................................... 95
ABBREVIATIONS .................................................................................................. 97
REFERENCES ........................................................................................................ 99

4
5
RIASSUNTO
L’emicrania è un disturbo neurologico comune e altamente invalidante, che
colpisce più del 10% della popolazione, dovuto ad una disfunzione primaria del
cervello che porta all’attivazione e alla sensibilizzazione episodica delle vie
nocicettive trigeminovascolari.
L’emicrania emiplegica familiare (FHM) è un rara forma di emicrania con aura
considerata un buon modello per lo studio dell’emicrania; infatti gli attacchi tipici di
FHM sono simili a quelli della normale emicrania con aura, eccetto per il sintomo
dell’emiparesi (Pietrobon and Moskowitz, 2013). Mutazioni missenso con guadagno
di funzione nel gene CACNA1A, codificante la subunità formante il poro dei canali del
Ca2+ voltaggio dipendenti CaV2.1 (denominati anche canali del Ca2+ di tipo P/Q),
causano FHM di tipo 1 (FHM1) e mutazioni con perdita di funzione nel gene ATP1A2,
codificante la subunità astrocitaria α2 della Na,K-ATPasi, causano FHM di tipo 2
(FHM2) (Ophoff et al., 1996; De Fusco et al., 2003).
Topi knock-in (KI) per le mutazioni che causano FHM1 e FHM2 presentano una
facilitazione nell’induzione e nella propagazione della cortical spreading depression
(CSD) (van den Maagdenberg et al., 2004, 2010; Leo et al., 2011), il fenomeno
neurologico alla base dell’aura emicranica e un evento chiave innescante l’attivazione
del sistema trigeminovascolare.
Topi FHM1 KI per la mutazione R192Q, mostrano un aumentato influsso di Ca2+
attraverso i canali del Ca2+ di tipo P/Q e un aumento nella probabilità di rilascio di
glutammato alle sinapsi piramidali della corteccia (Pietrobon, 2010; Tottene et al.,
2009), che potrebbe spiegare la facilitazione della CSD sperimentale osservata in
questi topi. Recentemente, nel nostro laboratorio, è stato dimostrato che la frequenza
degli up-state registrati in fettine acute di corteccia, simili alle oscillazioni lente
riportate in vivo (Steriade et al., 1993), è maggiore nel topo FHM1 KI che nel WT.
Questo dato suggerisce che il guadagno di funzione dei canali del Ca2+ di tipo P/Q
faciliti i meccanismi di generazione degli up-state e/o riduca il periodo refrattario dopo
un up-state (Fabbro, Sessolo, Vecchia and Pietrobon, dati non pubblicati).
Lo scopo della prima parte del mio lavoro è stato quello di approfondire il ruolo
dei canali del Ca2+ di tipo P/Q nell’attività ricorrente di circuito alla base degli up-state
nei topi WT. Ho studiato l’effetto dell’inibizione farmacologica dei canali del Ca2+ di
tipo P/Q sulla attività ad up-state registrata da neuroni piramidali dello strato 2/3 in
fettine acute di corteccia somatosensoriale di topo. Per questo scopo ho eseguito
esperimenti di singolo e doppio patch clamp. Ho trovato che il blocco di questi canali
del Ca2+ trasforma gli up-state in eventi che ricordano le scariche epilettiformi
interictali. Ho analizzato le conduttanze medie eccitatorie ed inibitorie (Ge and Gi)
durante gli up-state in controllo, durante gli eventi epilettiformi simil-interictali dopo
il blocco dei canali del Ca2+ di tipo P/Q e nel periodo iniziale di applicazione
6
dell’inibitore di questi canali, ovvero quando solo una parte dei canali era stata
bloccata. Ho trovato che 1) i canali del Ca2+ di tipo P/Q svolgono un ruolo
fondamentale nel controllare sia la trasmissione sinaptica eccitatoria sia quella
inibitoria sulle cellule piramidali durante l’attività ricorrente di circuito sottostante gli
up-state. Tuttavia, il blocco di questi canali riduce maggiormente l’inibizione
ricorrente rispetto all’eccitazione, spostando di conseguenza l’equilibrio eccitazione-
inibizione a favore dell’eccitazione. 2) Quando, come risultato del blocco dei canali
del Ca2+ di tipo P/Q, il rapporto Ge/Gi supera un valore critico, l’attività spontanea di
circuito cambia e gli up-state vengono trasformati in eventi simili alle scariche
epilettiformi interictali. Questi dati suggeriscono che, nella corteccia cerebrale, i canali
del Ca2+ di tipo P/Q svolgono un ruolo predominante nel controllo della trasmissione
sinaptica inibitoria rispetto a quella eccitatoria.
Dal momento che in molte sinapsi corticali, i canali del Ca2+ di tipo P/Q e di
tipo N (denominati anche CaV2.2) cooperano nel controllare la trasmissione sinaptica,
ho studiato anche l’effetto del blocco dei canali del Ca2+ di tipo N sull’attività ad up-
state. L’inibizione farmacologica di questi canali causa una riduzione della frequenza
degli up-state, suggerendo che i canali del Ca2+ di tipo N sono coinvolti nel regolarne
la frequenza. Dopo il blocco dei canali del Ca2+ di tipo N, il rapporto Ge/Gi aumenta
ma non sufficientemente a trasformare gli up-state in eventi epilettiformi simil-
interictali.
L’obiettivo della seconda parte del mio progetto è stato quello di studiare i
meccanismi, ancora non noti, alla base della facilitazione della CSD sperimentale nel
topo FHM2 KI. Dopo aver determinato le condizioni sperimentali in cui poter
osservare la facilitazione della CSD in vitro, ho indagato tre possibili meccanismi che
potrebbero spiegare la facilitazione della CSD nel topo eterozigote FHM2 KI, in fettine
acute di corteccia somatosensoriale di topo.
Dato lo specifico accoppiamento sia funzionale che strutturale negli astrociti
tra la α2 Na,K-ATPasi e i trasportatori del glutammato a livello delle sinapsi corticali
glutammatergiche (Cholet et al., 2002), ho verificato se la perdita di funzione della α2
Na,K-ATPasi compromettesse la rimozione, mediata dagli astrociti, del glutammato
dalla fessura sinaptica durante l’attività neuronale. Ho pertanto valutato il tasso di
rimozione del glutammato misurando elettrofisiologicamente la corrente attivata
sinapticamente mediata dai trasportatori del glutammato (STC), indotta negli astrociti
dello strato 1 attraverso la stimolazione extracellulare delle afferenze neuronali nello
stesso strato sia con singoli impulsi che con treni di impulsi ad alta frequenza (50 and
100 Hz). Ho isolato farmacologicamente la STC, al fine di misurarne il tempo di
decadimento che fornisce una misura relativa della rimozione del glutammato mediata
dagli astrociti (Bergles and Jahr, 1997; Diamond and Jahr, 2000). Ho trovato che la
rimozione del glutammato rilasciato è effettivamente più lenta nei topi FHM2 KI
rispetto ai topi WT. Il rallentamento della rimozione del glutammato era più
pronunciato dopo un treno di impulsi rispetto a dopo un singolo stimolo e aumentava
7
all’aumentare della frequenza del treno. I miei dati dimostrano che la perdita di
funzione della α2 Na,K-ATPasi compromette la rimozione del glutammato e
suggeriscono che la rimozione del glutammato diventa più inefficiente all’aumentare
della frequenza dell’attività corticale.
Sorprendentemente, l’ampiezza della STC dopo un singolo stimolo era più grande nel
topo FHM2 KI che nel topo WT. Dal momento che l’ampiezza della STC è
proporzionale al rilascio di glutammato evocato alle sinapsi dalla stimolazione
extracellulare (Bergles and Jahr, 1997; Diamond and Jahr, 2000), questo risultato
potrebbe suggerire che la stimolazione extracellulare provoca un rilascio di
glutammato maggiore nel topo FHM2 KI che nel topo WT. Infatti, durante
stimolazioni ripetute, la STC deprime di più nel topo FHM2 KI che nel topo WT, come
previsto nel caso di probabilità di rilascio di glutammato aumentata nel topo FHM2
KI.
Considerato il ruolo chiave dei recettori NMDA nel ciclo di feedback positivo che
innesca la CSD (Tottene et al., 2011; Pietrobon and Moskowitz, 2014), sia la ridotta
rimozione del glutammato sia l’aumentato rilascio del neurotrasmettitore potrebbero
essere implicati nella facilitazione osservata nel topo FHM2 KI.
Visto che molti modelli della CSD includono un aumento della concentrazione
extracellulare di K+ al di sopra di un valore critico, come un evento innescante la CSD
(Pietrobon and Moskowitz, 2014), e alla luce delle evidenze farmacologiche che
indicano che l’α2 e/o l’α3 Na,K-ATPasi partecipano alla rimozione del K+ dallo spazio
extracellulare durante l’attività neuronale intensa (D’Ambrosio et al., 2002; Kofuji and
Newman, 2004), ho indagato se la rimozione del K+ mediata dagli astrociti fosse
compromessa nel topo FHM2 KI. Ho registrato elettrofisiologicamente la corrente
sostenuta indotta negli astrociti dello strato 1 da stimolazione extracellulare; questa
corrente è per lo più dovuta all’influsso di K+ attraverso i canali Kir e il suo tempo di
decadimento fornisce una misura indiretta della velocità di rimozione del K+ mediata
dagli astrociti. Questi esperimenti preliminari evidenziano che il tempo di decadimento
della corrente di K+ evocata da treni di impulsi è simile nel topo FHM2 KI e nel topo
WT. Se tale risultato venisse confermato, indicherebbe che non ci sono variazioni nel
tasso di rimozione del K+ nel topo FHM2 KI rispetto al topo WT.
Dal momento che l’α2 Na,K-ATPasi è strettamente accoppiata allo
scambiatore Na+/Ca2+ a livello di microdomini di membrana sovrapposti al reticolo
endoplasmatico (Lencesova et al., 2004; Golovina et al., 2003), abbiamo valutato se il
contenuto di Ca2+ nei depositi intracellulari degli astrociti nel topo FHM2 KI fosse
aumentata. Abbiamo ottenuto una misura indiretta della quantità di Ca2+ nei depositi
andando a misurare negli astrociti corticali in coltura i transienti di Ca2+ indotti da
ionomicina in un mezzo senza Ca2+. Il transiente di Ca2+ nel topo FHM2 KI era
maggiore che nel topo WT, indicando un aumentato contenuto di Ca2+ nei depositi
degli astrociti del topo FHM2 KI.
8
Misurando la soglia e la velocita della CSD dopo aver svuotato i depositi di Ca2+
usando acido ciclopiazonico (CPA), un inibitore della SERCA, ho osservato che lo
svuotamento delle riserve di Ca2+ riduce la facilitazione della CSD nel topo FHM2 KI,
senza influenzare la CSD nel topo WT. Questo risultato suggerisce che l’aumentata
concentrazione di Ca2+ all’interno dei depositi degli astrociti è coinvolta nella
facilitazione della CSD sperimentale nel topo FHM2 KI.
9
SUMMARY
Migraine is a common, highly disabling episodic neurological disorder
affecting more than 10% of the population and arises from a primary brain dysfunction
that leads to episodic activation and sensitization of the trigeminovascular pain
pathway.
Familial hemiplegic migraine (FHM) is a rare and very severe monogenic autosomal
dominant subtype of migraine with aura. Apart from the motor aura and the possible
longer duration of the aura, typical FHM attacks resemble migraine with aura attacks
(Pietrobon and Moskowitz, 2013); thus, FHM can be considered as a model of the
common forms of migraine. Gain-of-function missense mutations in CACNA1A gene,
encoding the pore-forming subunit of the neuronal voltage-gated Ca2+ channel CaV2.1
(also known as P/Q-type Ca2+ channel), cause FHM type 1 (FHM1) and loss-of-
function mutations in ATP1A2, the gene encoding the astrocytic Na,K-ATPase α2
subunit, cause FHM type 2 (FHM2) (Ophoff et al., 1996; De Fusco et al., 2003). FHM
knock-in (KI) mice carrying mutations causing either FHM1 or FHM2 show
facilitation of induction and propagation of experimental CSD (van den Maagdenberg
et al., 2004, 2010; Leo et al., 2011), the phenomenon underlying migraine aura and a
key triggering event for trigeminovascular activation.
FHM1 KI mice, carrying the R192Q mutation, show an increased influx of Ca2+
through P/Q-type Ca2+ channels in neurons, including cortical pyramidal cells, and an
increased probability of glutamate release at cortical pyramidal cells synapses
(Pietrobon, 2010; Tottene et al., 2009), that may explain the facilitation of
experimental CSD. Recent findings in our laboratory (Fabbro, Sessolo, Vecchia and
Pietrobon, manuscript in preparation) show that the frequency of the up-states recorded
in acute cortical slices, that resemble slow oscillation in vivo (Steriade et al., 1993), is
larger in FHM1 KI than WT mice, suggesting that the gain-of-function of P/Q-type
Ca2+ channels facilitates the mechanisms of up-states generation and/or decreases the
refractory period after an up-state.
The first aim of my work was to further investigate the role of P/Q-type Ca2+
channels in the recurrent network activity underlying the up-states in WT mice. I
studied the effect of pharmacological inhibition of P/Q-type Ca2+ channels on the up-
state activity recorded from layer 2/3 pyramidal neurons in acute slices of mouse
somatosensory cortex, by performing single and double patch clamp experiments. I
found that the block of P/Q-type Ca2+ channels transforms the up-states into events
resembling interictal epileptiform discharges. I evaluated the mean excitatory and
inhibitory synaptic conductances (Ge and Gi) during the control up-states, during the
simil-interictal epileptiform events after P/Q-type Ca2+ channels block as well as
immediately after the application of the P/Q-type Ca2+ channels blocker when the
channels were not completely blocked. I showed that 1) P/Q-type Ca2+ channels have
10
a dominant role in controlling both excitatory and inhibitory synaptic transmission
onto pyramidal cells during the spontaneous recurrent network activity that underlies
the up-states. However, the block of P/Q-type Ca2+ channels reduces recurrent
inhibition more than recurrent excitation and shifts the cortical excitation-inhibition
balance towards excitation. 2) When, as a consequence of the block of P/Q-type Ca2+
channels, Ge/Gi increases above a critical value, the spontaneous network activity
changes and the up-states are transformed into events resembling simil-interictal
epileptiform discharges. These data suggest that, in the cerebral cortex, P/Q-type Ca2+
channels play a more prominent role in controlling inhibitory compared to excitatory
synaptic transmission.
Given that at many cortical synapses P/Q- and N-type (also known as CaV2.2)
Ca2+ channels cooperate in controlling synaptic transmission, I also investigated the
effect of blocking N-type Ca2+ channels on up-state activity. Pharmacological
inhibition of this channel strongly reduces the up-states frequency, indicating a role
for N-type Ca2+ channel in controlling up-states frequency. After the block of N-type
Ca2+ channels, Ge/Gi increases but not sufficiently to transform up-states in simil-
interictal epileptiform events.
The aim of my second project was to investigate the unknown mechanisms
underlying facilitation of experimental CSD in FHM2 KI mice. After setting the
conditions in which facilitation of CSD was observed in vitro, I studied three possible
mechanisms that may underlie the facilitation of CSD in heterozygous FHM2 KI mice,
in acute slices of mouse somatosensory cortex.
Given the specific localization and functional coupling of the α2 Na,K-ATPase
to glutamate transporters in astrocyte processes surrounding cortical glutamatergic
synapses (Cholet et al., 2002), I first investigated whether the loss-of-function of α2
Na,K-ATPase results in an impaired astrocyte-mediated clearance of glutamate from
the synaptic cleft during cortical neuronal activity. I monitored the rate of glutamate
clearance electrophysiologically, by measuring the synaptically-activated glutamate
transporter-mediated current (STC) evoked in astrocytes of layer 1 by extracellular
stimulation of neuronal afferents in the same layer. Either single pulse stimulation or
trains of stimuli at high frequencies (50 and 100 Hz) were delivered. I isolated the STC
pharmacologically in order to measure the STC decay time course that provides a
relative measure of the glutamate clearance by astrocytes (Bergles and Jahr, 1997;
Diamond and Jahr, 2000). I found that the clearance of glutamate release is slower in
FHM2 KI compared to WT mice. The slowing of glutamate clearance was more
pronounced after a train stimulation than a single stimulus and increased with
increasing frequency of the train. My data show that the loss-of-function of α2 Na,K-
ATPase results in an impairment of glutamate clearance and suggest that the
impairment increases with increasing frequency of cortical activity.
Surprisingly, the STC amplitude after a single pulse stimulation was higher in FHM2
KI than in WT mice. Given that the STC amplitude is proportional to the glutamate
11
release evoked at the synapses by the extracellular stimulation (Bergles and Jahr, 1997;
Diamond and Jahr, 2000), this result would suggest that the extracellular stimulation
elicits a larger glutamate release in FHM2 KI than in WT mice. Indeed, during
repetitive stimulation the STC depressed more in FHM2 KI than WT mice, as expected
if the probability of glutamate release is increased in the mutant mice.
Given the key role of NMDA receptors in the positive feedback cycle, that ignites CSD
(Tottene et al., 2011; Pietrobon and Moskowitz, 2014), both the reduced clearance of
glutamate and the increased glutamate release may be implicated in the facilitation of
CSD in FHM2 KI mice.
Given that most models of CSD include local increase of extracellular K+
concentration above a critical value, as a triggering event in the initiation of CSD
(Pietrobon and Moskowitz, 2014), and that pharmacological evidence indicates that
α2 and/or α3 Na,K-ATPase participate in the clearance of K+ from the extracellular
space during intense neuronal activity (D’Ambrosio et al., 2002; Kofuji and Newman,
2004), I investigated whether K+ clearance by astrocytes is impaired in FHM2 KI mice.
I evaluated the rate of K+ clearance from the interstitial space, by recording the slowly
decaying current, which is mainly due to K+ influx through Kir channels, evoked in
layer 1 astrocytes by extracellular stimulation. I measured the decay time course of
this current, which provides an indirect measure of the K+ clearance rate by astrocytes.
Preliminary experiments show that the decay time course of the K+ current evoked by
train stimulation is similar in WT and FHM2 KI mice. If confirmed, this result would
indicate that there are no changes in the rate of K+ clearance in FHM2 KI mice
compared to WT.
Given that α2 Na,K-ATPase is tightly coupled to the Na+/Ca2+ exchanger at
plasma membrane microdomains that overlay the endoplasmic reticulum (Lencesova
et al., 2004; Golovina et al., 2003) and hence its loss-of-function could influence Ca2+
homeostasis, we investigated whether the Ca2+ content in the intracellular Ca2+ stores
of astrocytes in FHM2 KI mice is increased. We obtained an indirect measure of the
amount of Ca2+ in the stores, by measuring in cultured cortical astrocytes the Ca2+
transient induced by ionomycin in Ca2+-free medium. This transient was larger in
FHM2 KI mice compared to WT mice, indicating that the Ca2+ content is increased in
the intracellular Ca2+ stores of astrocytes in FHM2 KI mice.
I measured CSD threshold and velocity after depletion of intracellular Ca2+ stores by
CPA, a SERCA inhibitor, and I observed that depletion of Ca2+ stores reduces the
facilitation of CSD in FHM2 KI mice, without affecting CSD in WT mice. This result
suggests a role of increased Ca2+ concentration within the astrocytes intracellular
stores in the facilitation of experimental CSD in FHM2 KI mice.

12
13
1. INTRODUCTION
1.1. Migraine
Migraine is a common, highly disabling episodic brain disorder that affects
more than 10% of the population in western countries with a higher prevalence in
women (15-25%) than men (6-8%). Given its strong impact in the quality of life for
individuals and society, migraine is classified by the World Health Organization as
one of the 20 most disabling disorders (Pietrobon and Striessnig, 2003).
Migraine can be divided in two major subtypes: migraine with aura (MA) and
without aura (MO). Migraine attacks are typically characterized by unilateral and
throbbing, often severe headache lasting from 4 to 72 hours, often accompanied by
nausea, phonophobia and photophobia (MO). In about one third of patients, the
headache is preceded by transient neurological symptoms, called ‘aura’ (MA). Aura
symptoms are most frequently visual, but may involve other senses or, rarely, can
cause motor or speech deficits. Migraine aura can last up to 60 minutes and frequently
consists in a scotoma (an area of lost vision) with a scintillating border, drifting slowly
across the visual field (Pietrobon and Striessnig, 2003).
Migraine has a strong (up to 50%) genetic component, higher in MA than in MO,
characterized by a multifactorial polygenic inheritance. External and internal factors
(migraine triggers) can modulate the inherent migraine threshold. Several loci have
been linked to migraine (both MA and MO) but the causative genes have not been
identified yet, except for Familial Hemiplegic Migraine (FHM), a rare autosomal
subtype of MA characterized by dominant inheritance (Vecchia and Pietrobon, 2012;
Pietrobon and Moskowitz, 2013).
1.1.1. Neurobiology of migraine
Most migraine attacks start in the brain, as suggested by the premonitory
symptoms (e.g., difficulty with speech and reading, increased emotionality, sensory
hypersensitivity) that in many patients may occur up to 12 hours before the attack and
are highly predictive of the attack, and by the nature of typical migraine triggers (stress,
sleep deprivation, oversleeping, hunger and prolonged sensory stimulation).
Moreover, psychophysical and neurophysiological studies have provided clear
evidence that in the period between attacks migraineurs show hypersensitivity to
sensory stimuli and abnormal processing of sensory information (Vecchia and
Pietrobon, 2012; Pietrobon and Moskowitz, 2013).
A large body of indirect evidence supports the prevailing view that the
development of migraine headache depends on the activation and sensitization of the
trigeminovascular system (Pietrobon and Moskowitz, 2013; Noseda et al., 2013).

14
Indeed, within the skull, pain sensitivity is primarily restricted to the meningeal blood
vessels, which are densely innervated by nociceptive sensory afferent fibers of the
ophthalmic division of the trigeminal nerve (Vecchia and Pietrobon, 2012; Pietrobon
and Moskowitz, 2013).
Figure 1.1. Neuronal structures and pathways involved in the trigeminovascular activation and
modulation of cephalic pain (from Vecchia and Pietrobon, 2012).
Schematic illustration of important neuronal structures and connections in the trigeminovascular
pathways involved in migraine headache. a) Afferent pathways. b) Efferent modulatory pathways.
TG, trigeminal ganglion; TCC, trigeminocervical complex; C1, C2, dorsal horns of the cervical spinal
cord; TNC, caudal division of the spinal trigeminal nucleus; SSN, salivatory nucleus; vlPAG,
ventrolateral periacqueductal grey; NCF, the nucleus cuneiformis; RVM, rostral ventromedial medulla;
VPM, ventroposteriomedial thalamic nucleus; Po, posterior thalamic nucleus; S1, S2, somatosensory
cortex; Ins, insular cortex; PH, posterior hypothalamus; A11, dopaminergic hypothalamic nucleus.
In several animal models, including non-human primates, activation of the meningeal
trigeminovascular afferents leads to activation of the so-called trigeminocervical
complex (TCC) comprising the C1 and C2 dorsal horns of the cervical spinal cord and
the caudal division of the spinal trigeminal nucleus (TNC). The TCC makes direct
ascending connections with different areas in the brainstem, including the superior
salivatory nucleus, the ventrolateral periacqueductal grey (vlPAG), the nucleus
cuneiformis and with higher structures, including several hypothalamic and thalamic
nuclei, which in turn make ascending connections with the cortex (Fig. 1.1a). Dura-
sensitive ventroposteriomedial thalamic neurons project mainly in the so-called ‘pain
matrix’ areas, formed by the trigeminal primary and secondary somatosensory (S1,
S2) and the insular (Ins) cortex and thus are likely to play a role in the perception of
the headache. Trigeminovascular posterior thalamic neurons project into non-
trigeminal S1, as well as auditory, visual, retrosplenial, ectorhinal, and parietal
association cortices, thus likely contributing to disturbances in neurological functions
15
involved in vision, auditory, memory, motor and cognitive performance. The
trigeminovascular projections to specific hypothalamic and brainstem nuclei are likely
to contribute to other aspects of the complex migraine symptomatology, such as loss
of appetite, sleepiness, irritability, stress, pursuit of solitude and autonomic symptoms
(Vecchia and Pietrobon, 2012; Pietrobon and Moskowitz, 2013, and references
therein). The TCC receives descending projections from brainstem and hypothalamic
nociceptive modulatory nuclei that may mediate descending modulation of
trigeminovascular nociceptive traffic (Fig. 1.1b). The TCC also receives descending
cortical projections from layer 5 pyramidal cells of the contralateral S1 and caudal Ins
cortex (Pietrobon and Moskowitz, 2013, and references therein).
The maintenance of the severe prolonged pain of migraine headache involves
sensitization of meningeal nociceptors and self-sustained sensitization of central
neurons of the trigeminovascular system (Vecchia and Pietrobon, 2012).
Nevertheless, the nature and the mechanisms underlying the episodic activation of the
trigeminovascular system is still debated (Pietrobon, and Moskowitz, 2013). Several
experimental and clinical observations show that vasodilation of meningeal and/or
extracranial arteries is neither necessary nor sufficient to cause migraine pain
(Pietrobon and Moskowitz, 2013 and references therein). Therefore, the ‘vascular
theory’, according to which the symptoms of migraine aura are caused by transient
ischemia induced by vasoconstriction and the headache arises from rebound abnormal
vasodilatation of intracranial arteries and consequent mechanical activation of
perivascular sensory fibers, is untenable (Charles and Brennan, 2009; Dodick, 2008;
Pietrobon and Moskowitz, 2013). It is now generally accepted that the primary cause
of migraine headache lies in the brain and, given the wide genetic and clinical
heterogeneity of migraine, several primary mechanisms presumably exist (Pietrobon
and Moskowitz, 2013). Recent findings point to cortical spreading depression (CSD)
as a key player in the pathogenesis of migraine (Levy et al., 2012; Vecchia and
Pietrobon, 2012; Pietrobon and Moskowitz, 2013, 2014).
1.1.2. CSD phenomenology
CSD consists in a slowly propagating (2-6 mm/min) wave of strong neuronal
and glial cells depolarization that progresses across the cerebral cortex, generating a
transient neuronal intense spike activity, followed by long-lasting neuronal
suppression (Charles and Brennan, 2009; Pietrobon and Moskowitz, 2014). CSD
causes no cell death or long-lasting damage in a normally metabolizing brain but
imposes a considerable bioenergetic burden on tissue (Pietrobon and Moskowitz,
2014).
CSD is a complex phenomenon that has different phases. Recent findings
indicate that during the early phase, lasting a few seconds, CSD-related depolarization
is initiated by the activation of channels located in apical dendrites of pyramidal

16
neurons. This is followed by the main phase, lasting 15-20 seconds, in which there is
the subsequent activation of other ion channels along most of the somatodendritic
membrane. After the main phase, there is a late phase, in which channels in the
somatobasal zone close and a net inward current is restricted to a narrow band in the
proximal apical dendrites (Pietrobon and Moskowitz, 2014 and references therein).
CSD is characterized by the collapse of ion homeostasis, profound disruption
of transmembrane ionic gradients and the release of neurotransmitters and other
molecules from cellular compartments.
The transient, strong near-complete neuronal depolarization is accompanied by a rapid
increase in K+ extracellular concentration, a rapid decrease in the extracellular
concentration of Na+, Cl- and Ca2+. The reduction in Na+ extracellular concentration is
greater than the increase in K+ extracellular concentration and electroneutrality is prob-
ably maintained by efflux of organic anions; indeed, several amino acids, including
glutamate and aspartate, are released during CSD (Pietrobon and Moskowitz, 2014).
CSD has also been associated with large increases in the intracellular concentration of
Ca2+ in both neurons and astrocytes in the cerebral cortex; however, the Ca2+
intracellular concentration increase in neurons precedes that in astrocytes and the
CSD-associated neuronal Ca2+ wave is unaffected by suppression of the Ca2+
concentration increase in astrocytes (Pietrobon and Moskowitz, 2014).
CSD onset is also associated with a transient increase in extracellular pH that is
followed by a decrease during the sustained depolarization. The transient increase in
extracellular pH reflects a transient proton influx into (and/or HCO3- efflux from)
neurons, as it is accompanied by a transient decrease in intracellular pH in neurons
(Pietrobon and Moskowitz, 2014).
Astrocyte depolarization during CSD seems to be largely passive, caused by an
increase in K+ extracellular concentration. Moreover, a fast mitochondrial
depolarization coincident with CSD occurs in neurons but not astrocytes (Pietrobon
and Moskowitz, 2014).
Upon the influx of Na+, Cl- and water, the interstitial space shrinks (by 40-70%) mainly
as a consequence of neuronal swelling in vivo and in vitro; by contrast, astrocytes
display only passive swelling in response to CSD-inducing solutions in cortical slices
and do not swell in vivo (Pietrobon and Moskowitz, 2014).
1.1.3. Mechanisms of experimental CSD
In migraineurs CSD occurs spontaneously in response to specific triggers,
which might coincide with known migraine triggers, such as stress or intense and
repetitive long lasting sensory stimulation, and the mechanisms that make the brain of
migraineurs susceptible to these episodic ‘spontaneous’ CSDs are still unknown.
CSD can be experimentally induced by focal mechanical (pinprick), electrical or
chemical (high concentrations of K+) stimulation of the cerebral cortex or by inhibition
17
of the Na+/K+ ATPase (Pietrobon and Moskowitz, 2014). The experimental stimuli
that can produce CSD in healthy brain tissue induce an anomalous increase in local
extracellular K+ concentration ([K+]out) and the release of glutamate (and other
neurotransmitters) owing to depolarization of presynaptic terminals accompanied by
increase in neuronal firing and activation of voltage-gated Ca2+ (CaV) channels (Fig.
1.2-1.3; Pietrobon and Moskowitz, 2014).
Both experimental data and computational models support the idea that an
increase in [K+]out above a critical value is a CSD key initiating event (Pietrobon and
Moskowitz, 2014). When stimuli sufficiently intense to ignite a CSD are applied, the
regulatory mechanisms that normally keep the [K+]out within the physiological range
are overwhelmed by a positive feedback cycle that produces a self-regenerating
increase of the [K+]out and of neuronal depolarization. This positive feedback cycle
initiates when a net self-sustaining inward current across the membrane is generated,
making the initial gradual neuronal depolarization self-regenerative. This is achieved
when a sufficient number of voltage-dependent and/or [K+]out-dependent cationic
channels carrying an inward current are activated. The net sustained inward current
leads to membrane depolarization and the release of K+, which in turn leads to further
activation of the cationic channels, further depolarization and an increase in local
[K+]out. This results in complete neuronal depolarization if the removal of K+ from the
interstitium, mainly by glial reuptake mechanisms, does not keep pace with its release
(Fig. 1.2; Pietrobon and Moskowitz, 2014).
Nevertheless, the nature of the cationic channels that are crucial for generating the
initial net inward current and that mediate local K+ release remains unclear and
controversial. There is a strong pharmacological evidence supporting a key role of
NMDA receptors, as NMDA receptors antagonists inhibit in vivo CSD induction and
propagation in a dose-dependent manner (Pietrobon and Moskowitz, 2014 and
references therein).
Pharmacological and functional analyses of mutant mice with an altered CSD
threshold show that the NMDA receptors implicated in CSD initiation are activated by
glutamate released from synaptic terminals after the opening of voltage-gated Ca2+
channels (Fig. 1.2; Pietrobon and Moskowitz, 2014). A recent evidence suggests that
P/Q-type Ca2+ channels (CaV2.1) have a particularly important role because CSD is
abolished after specific blockade of these channels, even when CSD is triggered by
largely suprathreshold stimuli (Tottene et al., 2011). Moreover, in mice, carrying
mutations that produce a partial loss-of-function of the P/Q-type Ca2+ channel
(Pietrobon, 2010), the threshold for CSD induction in the cerebral cortex in vivo is
greatly increased and K+-evoked glutamate release, measured by in vivo microdialysis,
is reduced by more than twofold (Ayata et al., 2000). Conversely, familial hemiplegic
migraine type 1 (FHM1) knockin (KI) mice, which carry gain-of-function mutations
in the gene encoding the P/Q-type Ca2+ channel, show increased action potential-
evoked glutamate release at cortical synapses (Tottene e al., 2009) and have a lowered
18
threshold for CSD induction in vivo (van den Maagdenberg et al., 2004; van den
Maagdenberg et al., 2010) and in cortical slices (Tottene e al., 2009). Indeed, in FHM1
knockin mice CSD threshold is restored to the wild-type (WT) value, by restoring
evoked glutamate release to the WT value through partial inhibition of P/Q-type Ca2+
channels (Tottene e al., 2009; see below). This supports a crucial role of P/Q-type Ca2+
channels in CSD induction and a causative relationship between increased P/Q-type
Ca2+ channels-dependent glutamate release and facilitation of CSD initiation.
Astrocytes are also implicated in CSD initiation (Fig. 1.2). In the adult brain, the α2
Na+/K+-ATPase is expressed almost exclusively in astrocytes (Cholet et al., 2002) and
heterozygous FHM type 2 (FHM2) KI mice, carrying a loss-function mutation in the
gene encoding α2 Na+/K+-ATPase (Leo et al., 2011; see below), exhibit a lowered
electrical threshold for CSD in vivo. Furthermore, in mouse brain slices it has been
shown that astrocyte-directed inactivation of the major astrocytic gap junction protein,
connexin 43, lowers the threshold for CSD generation (Theis et al., 2003), probably
as a consequence of deficient K+ spatial buffering by astrocytes (Kofuji and Newman,
2004).
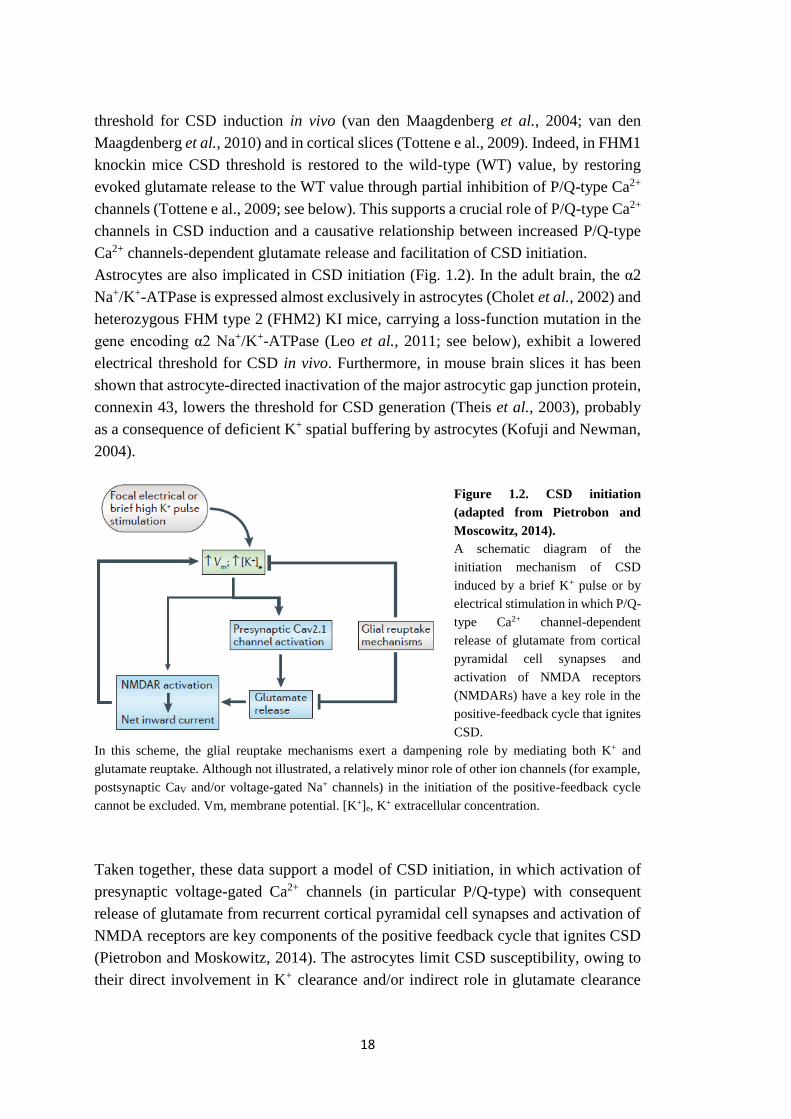
Figure 1.2. CSD initiation
(adapted from Pietrobon and
Moscowitz, 2014).
A schematic diagram of the
initiation mechanism of CSD
induced by a brief K+ pulse or by
electrical stimulation in which P/Q-
type Ca2+ channel-dependent
release of glutamate from cortical
pyramidal cell synapses and
activation of NMDA receptors
(NMDARs) have a key role in the
positive-feedback cycle that ignites
CSD.
In this scheme, the glial reuptake mechanisms exert a dampening role by mediating both K+ and
glutamate reuptake. Although not illustrated, a relatively minor role of other ion channels (for example,
postsynaptic CaV and/or voltage-gated Na+ channels) in the initiation of the positive-feedback cycle
cannot be excluded. Vm, membrane potential. [K+]e, K+ extracellular concentration.
Taken together, these data support a model of CSD initiation, in which activation of
presynaptic voltage-gated Ca2+ channels (in particular P/Q-type) with consequent
release of glutamate from recurrent cortical pyramidal cell synapses and activation of
NMDA receptors are key components of the positive feedback cycle that ignites CSD
(Pietrobon and Moskowitz, 2014). The astrocytes limit CSD susceptibility, owing to
their direct involvement in K+ clearance and/or indirect role in glutamate clearance
19
(through functional coupling with glutamate transporters; Rose et al., 2009; Pietrobon
and Moskowitz, 2014; see below) during intense neuronal activity (Fig. 1.2).
The mechanism of CSD propagation is still unclear and four hypotheses have been
proposed: two involve intercellular diffusion and opening of gap junctions in either
glial cells or neurons and the other two are based on interstitial diffusion of a humoral
agent, K+ or glutamate (Pietrobon and Moskowitz, 2014 and references therein).
1.1.4. CSD and migraine
After the discovery of migraine visual aura in 1941 by Karl Lashley, Leão and
Milner both pointed out the similarity between the velocity of CSD propagation and
the propagation of visual aura reported by Lashley (Lashley, 1941; Leão, 1945; Milner,
1958): similarly to CSD in mammalian cortex, the speed of migraine aura spread is
approximately 3 mm/min. Moreover, aura is characterized by negative symptoms (e.g.
loss of sensation, visual scotoma) often preceded by positive symptoms (e.g.
paresthesias, visual scintillations), that is reminiscent of the cessation of cortical
neuronal activity preceded by a brief burst of action potentials at the CSD wave-front
(Eikermann-Haerter and Ayata, 2010).
Accumulating evidences strongly implicate CSD in the genesis of visual aura
and blood-oxygen-level-dependent (BOLD) magnetic resonance imaging (MRI) in
humans has provided the most technically advanced demonstration of this (Pietrobon
and Striessnig, 2003; Pietrobon and Moskowitz, 2014 and references therein).
Three additional lines of investigation reinforce the link between aura, CSD and
migraine.
First, the discovery that certain genetic mutations cause FHM, increase the risk of
migraine aura in humans and facilitate CSD in mouse models (Pietrobon and
Moskowitz, 2013; Vecchia and Pietrobon, 2012). Indeed, two KI mice carrying human
mutations causing FHM1 and one KI mice carrying human mutations causing FHM2
show a decreased threshold for CSD initiation and an increased velocity of CSD
propagation (Eikermann-Haerter et al., 2009; van den Maagdenberg et al., 2004, 2010;
Leo et al., 2011).
Second, CSD activates the trigeminovascular system in animal models to cause head-
ache. It was clearly demonstrated that CSD is able to directly activate the meningeal
nociceptors and the second-order neurons in the TNC (Zhang et al., 2010, 2011) and
to elicit a long-lasting blood-flow increase within the middle meningeal artery and
plasma protein leakage in the dura mater (Bolay et al., 2002). CSD induces a large
increase in the extracellular concentration of K+ and hydrogen (H+) ions, nitric oxide
(NO), ATP, arachidonic acid and prostaglandins (Pietrobon 2005, 2007; Pietrobon and
Moskowitz, 2013). It is hypothesized that these substances may activate the meningeal
trigeminovascular afferents. Activation of the meningeal afferents leads to release of
proinflammatory vasoactive neuropeptides that may promote neurogenic

20
inflammation in the dura and possibly sustain the activation of the trigeminovascular
afferents and lead to their sensitization (Fig. 1.3; Charles and Brennan, 2009; Pietrobon
and Moskowitz, 2013).
Figure 1.3. From cortical
spreading depression (CSD) to
trigeminovascular nociception
(adapted from Pietrobon and
Moskowitz, 2013).
a) CSD is believed to be ignited
by local elevations of
extracellular K+ concentration
above a critical level because of
hyperactive neuronal circuits in
the cerebral cortex. b) CSD is a
slowly propagating wave of
strong neuronal and glial
depolarization accompanied by
depression of spontaneous and
evoked electroencephalographic
(EEG) activity and by a large
increase in extracellular K+
concentration. c) Other noxious
mediators (open circles), such as H+, NO, arachidonic acid (AA) and serotonin, are released during
CSD, in addition to glutamate and other neurotransmitters. The blue pathway represents the meningeal
trigeminovascular afferents; also shown is a parasympathetic reflex involving activation of the superior
salivatory nucleus (SSN) and the sphenopalatine ganglion (SPG) leading to release of vasoactive
intestinal peptide (VIP), NO and acetylcholine (ACh) from the meningeal parasympathetic efferents.
BBB, blood-brain barrier. TCC, trigeminocervical complex; TG: trigeminal ganglion; CGRP, calcitonin
gene–related peptide; SP, substance P; NKA, neurokinin A; MMP9, matrix metalloproteinase.
Third, prophylactic drugs raise the electrical and KCl thresholds to evoke CSD, as a
mechanism of prevention. At least five clinically used migraine prophylactic drugs,
belonging to different pharmacological classes (valproate, topiramate, propanolol,
amitriptyline and methysergide), which are effective in reducing the frequency of
migraine attacks with or without aura, dose-dependently suppress CSD susceptibility
in experimental animal models (Ayata et al., 2006; Pietrobon and Moskowitz, 2014).
Evidences pointing to CSD as the electrical phenomenon underlying migraine
aura symptoms are today widely accepted (Pietrobon and Moskowitz, 2014). Despite
this, the question whether CSD may initiate the headache mechanisms in migraine is
debated. In fact, most migraineurs do not experience aura, and even MA patients
experience attacks without aura; the possibility that silent CSDs (i.e. CSDs involving
areas of the brain that would not generate a perceived aura) may initiate the headache
mechanisms in MO is neither proven nor disproven by current evidences. Moreover,
21
therapeutic intervention may abolish aura but not headache in some patients or on the
contrary may help with headache without affecting aura in others (Pietrobon and
Moskowitz, 2014).
1.2. Familial hemiplegic migraine
Familial hemiplegic migraine (FHM) is a rare and very severe monogenic
autosomal dominant subtype of MA, whose aura symptoms include motor weakness
and hemiparesis (often, but not always, unilateral) lasting for hours to days (Pietrobon,
2007; Pietrobon and Moskowitz, 2013).
FHM can be considered as a model of the common forms of migraine because the
headache and aura features, apart from the hemiparesis, are identical (Thomsen et al.,
2002) and two-thirds of the FHM patients have, in addition to FHM attacks, also
attacks of common non-hemiplegic migraine (Ferrari et al., 2007); however, in FHM
aura symptoms and also headache stay longer than in the common form of migraine.
In addition to typical FHM attacks, some FHM patients can suffer atypical more severe
attacks with signs of diffuse encephalopathy, coma, confusion or impairment of
consciousness, prolonged hemiplegia (lasting up to several days) and in few cases
seizures (Thomsen et al., 2002). Furthermore, about 20% of FHM families show
permanent cerebellar symptoms of progressive cerebellar ataxia with or without
nystagmus (Thomsen et al., 2002). Emotional stress and minor head trauma are among
the most common triggers of FHM attacks (Pietrobon, 2007).
FHM is a genetically heterogeneous pathology and three FHM causative genes, all
encoding ion channels or transporters, have been identified. Mutations in the genes
CACNA1A at chromosome 19p13 (Ophoff et al., 1996), ATP1A2 at chromosome 1q23
(De Fusco et al., 2003) and SCNA1A at chromosome 2q24 (Dichgans et al., 2005) are
responsible for FHM1, FHM2 and FHM type3 (FHM3), respectively. From the clinical
point of view, these three types of FHM display similar symptoms with the exception
of FHM1 that is uniquely associated with cerebellar symptoms (Pietrobon, 2007).
The first gene identified is the CACNA1A (FHM1), which encodes the α1
subunit of neuronal voltage-dependent P/Q-type Ca2+ channels (Ophoff et al., 1996).
FHM1 shows an incomplete penetrance and other genetic or environmental factors
could explain symptoms variability between subjects affected by the same FHM1
mutation. All the twenty-one FHM1 discovered mutations are missense mutations;
some mutations are associated with a broad spectrum of clinical features besides
hemiplegic migraine, such as cerebellar ataxia and epilepsy, both during severe FHM
attacks or independent of FHM attacks (Pietrobon and Moskowitz, 2013).
The P/Q-type Ca2+ channels are widely expressed throughout the central nervous
system (CNS) (Westenbroek et al., 1995), including all brain regions implicated in the
pathogenesis of migraine. P/Q-type Ca2+ channels play a dominant role in controlling
neurotransmitter release, particularly at central synapses and their somatodendritic
22
localization points to additional postsynaptic roles, such as in neural excitability
(Pietrobon, 2010, and references therein). In particular, P/Q-type Ca2+ channel play a
predominant role in controlling the release of glutamate and GABA at both excitatory
and inhibitory synapses between pyramidal cells and somatostatin (SOM) interneurons
(Sessolo et al., unpublished data). Likewise, the excitatory synaptic transmission
between pyramidal cells and fast spiking (FS) interneurons in layer 2/3 somatosensory
and layer 5 motor cortex, are controlled by P/Q-type Ca2+ channels (Pietrobon, 2010;
Ali and Nelson, 2006; Tottene et al., 2009; Zaitsev et al., 2007; Rozov et al., 2001).
By contrast, synapses between layer 5 pyramidal cells and burst-firing bipolar
interneurons of motor cortex, strongly depend on N-type Ca2+ channels (CaV2.2; Ali
and Nelson, 2006). In different cortical areas, also inhibitory neurotransmission
between FS interneurons and pyramidal cells are totally mediated by P/Q-type Ca2+
channels (Ali and Nelson, 2006, Zaitsev et al., 2007), with the exception of layer 5 of
the motor cortex, where it is exclusively dependent on N-type Ca2+ channels (Ali and
Nelson, 2006).
FHM2 is caused by mutations in ATP1A2, the gene encoding the α2 Na+/K+-
ATPase (De Fusco et al., 2003). To date, more than 50 FHM2 mutations have been
discovered; almost all are missense mutations that produce substitutions of conserved
amino acids in important functional regions of the protein, but there are also small
deletions and a single mutation affecting the stop codon, which causes an extension of
the ATP1A2 protein by 27 amino acid residues (Riant et al., 2005; Jurkat-Rott et al.,
2004). Most of the ATP1A2 mutations are associated with pure FHM; however, some
are associated to complications like cerebellar ataxia, childhood convulsions, epilepsy
and mental retardation. Interestingly, some ATP1A2 mutations are associated with
non-hemiplegic migraine phenotypes, such as basilar migraine and even common
migraine (Russel and Ducros, 2011, and references therein). In the brain, α2 Na+/K+-
ATPase is expressed almost exclusively in astrocytes in the adult (Moseley et al.,
2003) and its colocalization with glial glutamate transporters (Rose et al., 2009) and
with the Na+/Ca2+ exchanger (Lencesova et al., 2004; Golovina et al., 2003) suggests
specific roles in glutamate clearance and in the regulation of intracellular Ca2+ (see
below for details).
FHM3 is caused by missense mutations in SCNA1A, the gene encoding the
pore-forming α1 subunit of neuronal voltage-gated sodium (Na+) channel NaV1.1; the
SCN1A gene was already known as an epilepsy gene previous to its identification as
the FHM3 gene (Dichgans et al., 2005). FHM3 can occur as pure hemiplegic migraine
or in association with epileptic seizures or with elicited repetitive daily blindness
attacks that are independent from the hemiplegic migraine attacks (Vecchia and
Pietrobon, 2012 and references therein). NaV1.1 channels are primarily expressed in
the central nervous system (CNS) during late postnatal stages, more in caudal than
rostral regions; in particular, they are highly expressed in certain inhibitory
23
interneurons, where they play an important role in sustaining high-frequency firing
(Catterall et al., 2010).
1.2.1. The α2 Na,K-ATPase and its functional roles
The Na,K-ATPase is a transmembrane P-type ion pump that utilizes the free
energy of ATP hydrolysis to exchange Na+ for K+ and maintains gross cellular
homeostasis. The stoichiometry of this transport consist of three Na+ ions pumped out
of and two K+ ions pumped into the cells for each ATP molecule that is splitted. Na,K-
ATPase is a heteromeric protein composed of a large α subunit, a smaller glycosylated
β subunit and an auxiliary tissue-specific γ-subunit belonging to the FXYD protein
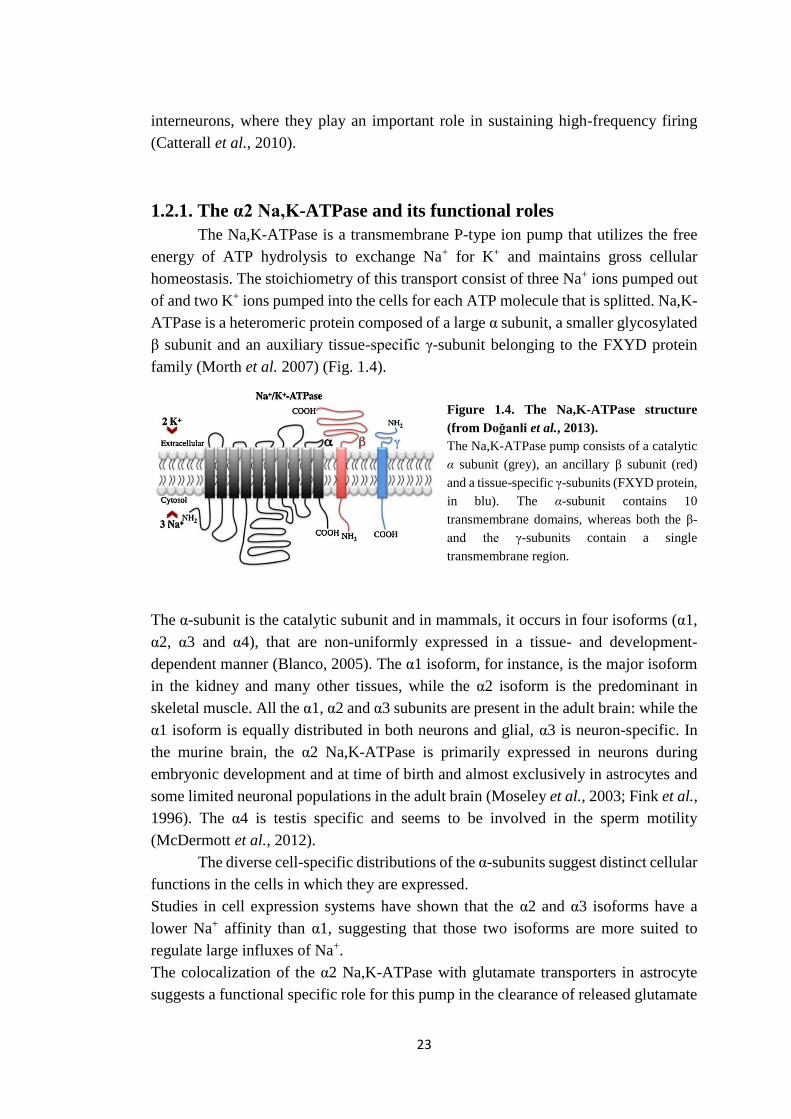
family (Morth et al. 2007) (Fig. 1.4).
Figure 1.4. The Na,K-ATPase structure
(from Doğanli et al., 2013).
The Na,K-ATPase pump consists of a catalytic
α subunit (grey), an ancillary β subunit (red)
and a tissue-specific γ-subunits (FXYD protein,
in blu). The α-subunit contains 10
transmembrane domains, whereas both the β-
and the γ-subunits contain a single
transmembrane region.
The α-subunit is the catalytic subunit and in mammals, it occurs in four isoforms (α1,
α2, α3 and α4), that are non-uniformly expressed in a tissue- and development-
dependent manner (Blanco, 2005). The α1 isoform, for instance, is the major isoform
in the kidney and many other tissues, while the α2 isoform is the predominant in
skeletal muscle. All the α1, α2 and α3 subunits are present in the adult brain: while the
α1 isoform is equally distributed in both neurons and glial, α3 is neuron-specific. In
the murine brain, the α2 Na,K-ATPase is primarily expressed in neurons during
embryonic development and at time of birth and almost exclusively in astrocytes and
some limited neuronal populations in the adult brain (Moseley et al., 2003; Fink et al.,
1996). The α4 is testis specific and seems to be involved in the sperm motility
(McDermott et al., 2012).
The diverse cell-specific distributions of the α-subunits suggest distinct cellular
functions in the cells in which they are expressed.
Studies in cell expression systems have shown that the α2 and α3 isoforms have a
lower Na+ affinity than α1, suggesting that those two isoforms are more suited to
regulate large influxes of Na+.
The colocalization of the α2 Na,K-ATPase with glutamate transporters in astrocyte
suggests a functional specific role for this pump in the clearance of released glutamate

24
from the synaptic cleft during neuronal activity in the adult cortex (Pellerin and
Magistretti, 1997; Rose et al., 2009). At the ultrastructural level, α2 Na,K-ATPase
appears preferentially localized in astrocytic processes around asymmetrical
glutamatergic synaptic junctions and not around GABAergic terminals (Cholet et al.,
2002). Rose et al. (2009) demonstrated that glutamate transporters and Na,K-ATPase
pumps are part of the same macromolecular complexes and operate as a functional unit
to regulate glutamatergic neurotransmission.
Pharmacological evidence shows that the α2 and α3 isoforms participate in the
clearance of K+ from the extracellular space during intense neuronal activity (Haglund
and Schwartzkroin, 1990; Ransom et al., 2000; D’Ambrosio et al., 2002). However,
the relative importance of neuronal α3 and glial α2 Na,K-ATPase pumps in K+
clearance and maintenance of extracellular K+ concentration within the physiological
range during neuronal activity remains unclear.
In cultured astrocytes, the α2 Na,K-ATPase has been found also localized in
microdomains that overlay the endoplasmic reticulum, where it is physically
(Lencesova et al., 2004) and functionally (Golovina et al., 2003) coupled to the
Na+/Ca2+ exchanger, thereby suggesting an additional functional role in the regulation
of intracellular Ca2⁺ concentration, particularly in the endoplasmic reticulum. Indeed,
elevated levels of cytoplasmic Ca2⁺ ions as well as in the endoplasmic endoplasmic
reticulum were measured in cultured astrocytes from Atp1a2-/- knock-out (KO) mice
(Golovina et al., 2003).
Impaired clearance of neurotransmitters and enhanced neuronal excitation in the
amygdala and piriform cortex were shown in ATP1A2-/- KO mice at the embryonic
stage (Ikeda et al., 2003). These mice die immediately after birth as a result of sever
motor deficits that also abolished respiration. Coimmunoprecipitation studies suggest
a specific coupling between the α2 Na,K-ATPase and the neuron-specific K⁺,Cl⁻-
cotransporter, which excludes Cl⁻ ions from the cytosol in respiratory center neurons
at birth. These data indicate that α2 isoform plays a key role for maintenance of Cl-
homeostasis in neurons and that this role does not seem to be compensated by α1 and
α3 isoforms. Therefore, the lack of α2 in Atp1a2-/- KO mice causes elevation of
intracellular Cl⁻ concentration that would switch the GABA response from
hyperpolarization to depolarization (Ikeda et al., 2004), leading to the functional
impairment of the brainstem respiratory neurons and to the lack of spontaneous
respiratory activity.
1.2.2. Functional consequences of FHM mutations
Two different FHM1 mouse models were generated by introducing the human
FHM1 R192Q or S218L mutations into the orthologous genes (van den Maagdenberg
et al., 2004, 2010) and both KI mice show facilitation of CSD threshold and velocity
(Eikermann-Haerter et al., 2009, 2011; van den Maagdenberg et al., 2010).
25
Analysis of the single channel properties of mutant recombinant human P/Q-type Ca2+
channels and of the P/Q-type Ca2+ current in different neurons of FHM1 R192Q and
S218L KI mice revealed that the mutations produce gain-of-function of P/Q-type Ca2+
channels, as a consequence of an increased channel open probability. The enhanced
Ca2+ influx in a wide range of depolarizations is mainly caused by a shift to lower
voltages of the channel activation curve which elicits a Ca2+ influx through the mutant
channels in response to small depolarizations insufficient to open wild type (WT)
channels (van den Maagdenberg et al., 2004; Tottene et al., 2002; Pietrobon and
Moskowitz, 2013).
The analysis of cortical synaptic transmission in FHM1 KI mice revealed a very
interesting differential effect of FHM1 mutations at excitatory and inhibitory synapses.
Indeed, Tottene et al. (2009) showed that in the FHM1 R192Q KI mice cerebral cortex
the gain-of-function of P/Q-type Ca2+ channel enhances excitatory synaptic
transmission, as a consequence of increased action potential-evoked glutamate release
at pyramidal cell synapses; congruently, short-term synaptic depression during trains
of action potentials is enhanced. In striking contrast, inhibitory neurotransmission at
FS interneuron synapses was unaltered, despite being initiated by P/Q-type Ca2+
channels. In agreement with this, analysis of inhibitory neurotransmission in
microcultures of cortical neurons from FHM1 R192Q and S218L KI mice, showed
that FHM1 mutation does not affect inhibitory transmission at autapses of cortical
mutipolar interneurons (Vecchia et al., 2014, 2015).
The increase in glutamate release may explain the facilitation of experimental CSD in
FHM1 KI mice. In fact, induction and propagation of CSD in FHM1 R192Q KI mice
can be rescued to WT values when glutamate release at pyramidal cell synapses is
brought back to WT values by applying sub-saturating concentration of ω-agatoxin
IVA (Tottene et al., 2009), a specific blocker of P/Q-type Ca2+ channels, indicating a
causative link between enhanced glutamate release and CSD facilitation.
These findings demonstrate that FHM1 mutations may differently affect synaptic
transmission and short-term plasticity at different cortical synapses, and, as a
consequence, very likely alter the neuronal circuits that coordinate and dynamically
adjust the balance between excitation and inhibition during cortical activity (Tottene
et al., 2009). Functional alterations in these circuits are expected to lead to abnormal
processing of sensory information suggesting that these alterations may render the
migraineurs cortex vulnerable to CSD ignition in response to migraine triggers such
as intense and repetitive sensory stimulation.
FHM2 mutations cause complete or partial loss-of-function of recombinant
Na+/K+-ATPases due to loss or reduction of catalytic activity and/or more subtle
functional impairments or impairment of plasma membrane delivery (Vecchia and
Pietrobon, 2012, and references therein). Recently the KI mouse carrying the W887R
ATP1A2 mutation, causing FHM2, was generated (Leo et al., 2011). The homozygous
mutants die just after birth because of lack of spontaneous respiratory activity due to

26
functional impairment of the brainstem respiratory neurons (as shown before for the
KO mice in paragraph 1.2.1), while the heterozygous mice are viable, fertile and show
no apparent clinical phenotype. The mutant α2 Na,K-ATPase protein was barely
detectable in the brain of homozygous mutants and reduced to half in the brain of
heterozygous mutants, likely as a consequence of endoplasmic reticulum retention and
subsequent proteasomal degradation (Leo et al., 2011). In vivo analysis of CSD,
induced by focal electrical stimulation of the cortex, revealed a decreased induction
threshold and an increased velocity of propagation in the heterozygous FHM2 KI mice.
Conflicting findings were obtained from the analysis of mutant recombinant
human NaV1.1 channels expressed in non-neuronal cells, pointing to either gain- or
loss-of-function effects of FHM3 mutations (Vecchia and Pietrobon, 2012; Cestéle et
al., 2013). Although FHM3 mouse models are not available, it was reported that FHM3
in two unrelated families cosegregates with a new eye phenotype of elicited repetitive
daily blindness. This new eye phenotype has clinical features similar to those of
experimental CSD in the retina (Vahedi et al., 2009), suggesting that also FHM3
mutations may facilitate CSD, by occasionally alteration of neuronal brain excitability.
1.3. Cortex and its organization
The cerebral cortex, the gray matter overlying each brain hemisphere,
constitutes nearly 80% of the human brain and is characterized by a double
organization defined by layer and columns. The most typical form of neocortex
contains six layers, numbered from the outer surface (pia mater) of the cortex to the
inner white matter (Kandel, 2000; Markram et al., 2004); this laminar organization can
be different at functionally different cortices.
Layer 1 (L1, molecular layer) is the most superficial layer, located right beneath the
pia mater. It is characterized by relatives few cell bodies and is mainly occupied by
the dendrites of the cells located deeper in the cortex and of the axons that travel
through or form connections in this layer.
Layer 2 (L2, external granule cells layer) is characterized mainly by small spherical
cells called granule cells and in mouse cortex is fused with the layer 3 (L3, external
pyramidal layer) which contains a variety of cell types, many of which are pyramidally
shaped; the neurons located deeper in layer 3 are typically larger than those located
more superficially.
Layer 4 (L4, internal granule cell layer), like layer 2, is populated primarily by granule
cells (also named spiny stellate cells as they are star-shaped and with spiny dendrites),
which are the principal recipient layer for thalamocortical inputs. The thalamocortical
inputs are in turn transmitted from granule cells to layers 2, 3, 5 and 6 (de Kock et al.,
2007).
Layer 5 (L5, internal pyramidal layer) contains mainly pyramidally shaped cells
typically larger than those in layer 3; layer 5 has been subdivided into a cell-sparse
27
layer 5A, containing mostly medium-sized pyramidal cells, and a cell-dense layer 5B
containing pyramidal neurons of variable size. Layer 5 pyramidal neurons project their
axons to subcortical regions and constitute the principal cortical output to excite other
cortical areas. Recent evidences indicate that, besides L4, also L5/6 neurons receive
thalamocortical inputs (Constantinople and Bruno, 2013).
Layer 6 (L6, polymorphic or multiform layer) is a fairly heterogeneous layer of
neurons. It blends into the white matter that forms the deep limit of the cortex and
carries axons to and from the cortex. Together with the layer 5, they project back to
the thalamus regulating thalamocortical interactions (de Kock et al., 2007).
Neurons in the neocortex are also distributed in functional, vertically oriented
columns that traverse the layers. A cortical column is a recurring module of signal
processing that would fit within a cylinder of 0.3 - 0.5 mm in diameter. Neurons within
a particular column tend to have very similar response properties, presumably because
they form a local processing network. The modular concept presumes that the neuronal
network in a cortical column performs basic signal transformations, which are then
integrated with the activity in other networks and more extended brain areas (Lübke
and Feldmeyer, 2007). In particular, in the rodent somatosensory cortex, which
processes the information from mouse vibrissae, each functional columns is defined
by discrete and well-defined structure in layer 4 known as ‘barrel’. These layer 4
barrels are somatotopically arranged in an almost identical fashion to the layout of the
whiskers in the snout (Petersen, 2007), and the barrels can be easily visualized in both
living and stained brain slices (Petersen and Sakmann, 2000).
The thickness of the cortex does not vary substantially in different species; it
is always around 2 to 4 mm thick. The surface area, however, is dramatically larger in
higher primates, particularly in the human brain. Thus, the number of neurons, and
therefore the number of columns, in the cerebral cortex is one of the crucial
determinants of the cortex capacity for information processing (Amaral, 2000).
1.3.1. Cellular populations in the cortex
The neocortical tissue is composed of neuronal and glial cells. Neurons in the
cortex can be divided in two principal groups: projection neurons and local
interneurons.
Projection neurons have pyramidally shaped cell bodies and constitute the
biggest population within the cortex; they are located mainly in layers 3, 5 and 6 and
use the excitatory amino acid glutamate as their primary neurotransmitter.
Interneurons, which represent 20-25% of the neurons in the neocortex, use the
inhibitory neurotransmitter γ-amino-butyric acid (GABA) (Beaulieu 1993; Fishell and
Rudy, 2011) and are located in all layers, where they do not generally create long range
projections with their axon.
28
Several types of GABAergic interneurons have been distinguished based on their
morphological diversity, in particular their axonal arborization and, as a consequence,
their postsynaptic targets. In fact, different types of inhibitory interneurons inhibit
distinct compartments of principal neurons (Rudy et al., 2011). The basket cells have
axons that terminate on somatic and perisomatic compartment; the ‘chandelier’ cells
selectively inhibit the axon initial segment; Martinotti cells target distal apical
dendrites of pyramidal cells.
Interneurons can also be subdivided in three non-overlapping populations based on the
expression of the Ca2+-binding protein parvalbumin (PV), the neuropeptide
somatostatin (SOM) and the ionotropic serotonin receptor 5HT3a (5HT3aR) (Isaacson
and Scanziani, 2011; Fishell and Rudy, 2011; Rudy et al., 2011). Each population is
heterogeneous in terms of morphology and firing properties of the interneurons
composing it and likely have different functions in the cortical circuit (Rudy et al.,
2011). The PV-expressing group constitutes the largest population of interneurons in
the neocortex and includes basket cells and chandelier cells; the large majority of PV
interneurons shows FS non-adapting firing. The SOM-expressing group includes the
Martinotti cells and a set of neurons that specifically target layer IV. The 5HT3aR-
expressing group is heterogeneous and remains to be fully characterized; it includes
all of the neurons that express the neuropeptide VIP as well as an equally numerous
subgroup of neurons that do not express VIP, and includes neurogliaform cells. (Rudy
et al., 2011). A large fraction of Martinotti cells and a fraction of 5HT3aR-expressing
interneurons show various types of regular or irregular adapting firing.
The neocortex also has a population of excitatory interneurons, located primarily in
L4. These cells have a stellate plexus of dendrites, use the amino acid glutamate as a
transmitter and form synapses with neurons near the cell body. These excitatory
interneurons are the primary recipients of sensory information received in the
neocortex from the thalamus (Amaral, 2000).
Strikingly, in contrast to the large amount of information that exists on the cellular
properties of the various types of cortical inhibitory neurons, knowledge of the specific
role that each of them plays in orchestrating cortical activity is limited (Isaacson and
Scanziani, 2011).
Astrocytes belong to the glia cell class that represents the most abundant cells
in the brain. Astrocytes are in strict contact with a high number of neurons, blood
vessels and other astrocytes. Astrocytes are also coupled by gap-junctions and form
the so-called ‘astrocytic syncytium’ (Giaume and McCarthy, 1996). A single astrocyte
can contact tens of thousands of synapses (Halassa et al., 2007); each astrocyte covers
a specific territory with minimal overlapping with the processes of neighboring
astrocytes (Halassa et al. 2007). Fraction of this territory can be controlled by
specialized astrocytes microdomains that include lamellipodia and filopodia that allow
highly dynamic interactions with the surrounding synapses and the end-feet of the
29
glial-vascular interface, from which signals can propagate to the next end-feet without
diffusing to the rest of the cell (Perea et al., 2014).
Astrocytes are known to play important roles in the homeostasis of the extracellular
environment, regulating the local concentrations of ions and neurotransmitters (K+ and
glutamate clearance; see below) and thus providing the adequate conditions for the
appropriate function of neurons and synapses.
Studies of mice that express enhanced green fluorescent protein (EGFP) under the
control of the glial fibrillary acid protein (GFAP) promoter have confirmed that the
astrocytic cell population is heterogeneous. Expression of GFAP is a prototypical
marker for immunohistochemical identification of astrocytes. About half the cells are
rich in GFAP and show the typical properties of protoplasmic astrocytes: an irregular
cell body with branched processes, low input resistance, a very negative membrane
potential, voltage- and time-independent K+ currents, prominent glutamate uptake and
extensive dye coupling, which is indicative of gap-junctional coupling. By contrast,
there is also a large population of fluorescent cells that is characterized by low GFAP
expression, larger input resistance, lower electronegative membrane potential, voltage-
dependent K+ and Na+ currents, AMPARs and low glutamate uptake; this population
is not coupled through gap junctions (Volterra and Meldolesi, 2005).
1.3.2. Astrocyte-neuron communication
Accumulating evidence obtained by many different groups has demonstrated
the existence of a dynamic reciprocal communication between astrocytes and neurons.
The term ‘tripartite synapse’ (Araque et al., 1999) is based on the ability of astrocytes
to receive signals from neurons and actively respond to neuronal and synaptic activity
with cytosolic Ca2+ elevations evoked by neurotransmitters. In turn, this Ca2+
elevations stimulate the release of different neuroactive substances, called
gliotransmitters, such as glutamate, D-serine, ATP, adenosine, GABA, tumor necrosis
factor alpha (TNFα), prostaglandins, atrial natriuretic peptide (ANP), brain-derived
neurotrophic factor (BDNF), etc., that can modulate neuronal activity and synaptic
physiology (Fig. 1.5; Perea et al., 2009, 2014 and references therein). In addition to
modulation of synaptic function, gliotransmitters released from astrocytes play
important roles in brain microcirculation (Zonta et al., 2003).
The astrocyte Ca2+ elevations are mainly the result of the mobilization of Ca2+ stored
in the endoplasmic reticulum. The synaptic control of the astrocyte Ca2+ signal is based
on the fact that astrocytes express a wide variety of functional neurotransmitters
receptors, many of which are metabotropic receptors. Astrocyte Ca2+ elevations can
also occur spontaneously as intrinsic oscillations in the absence of neuronal activity.
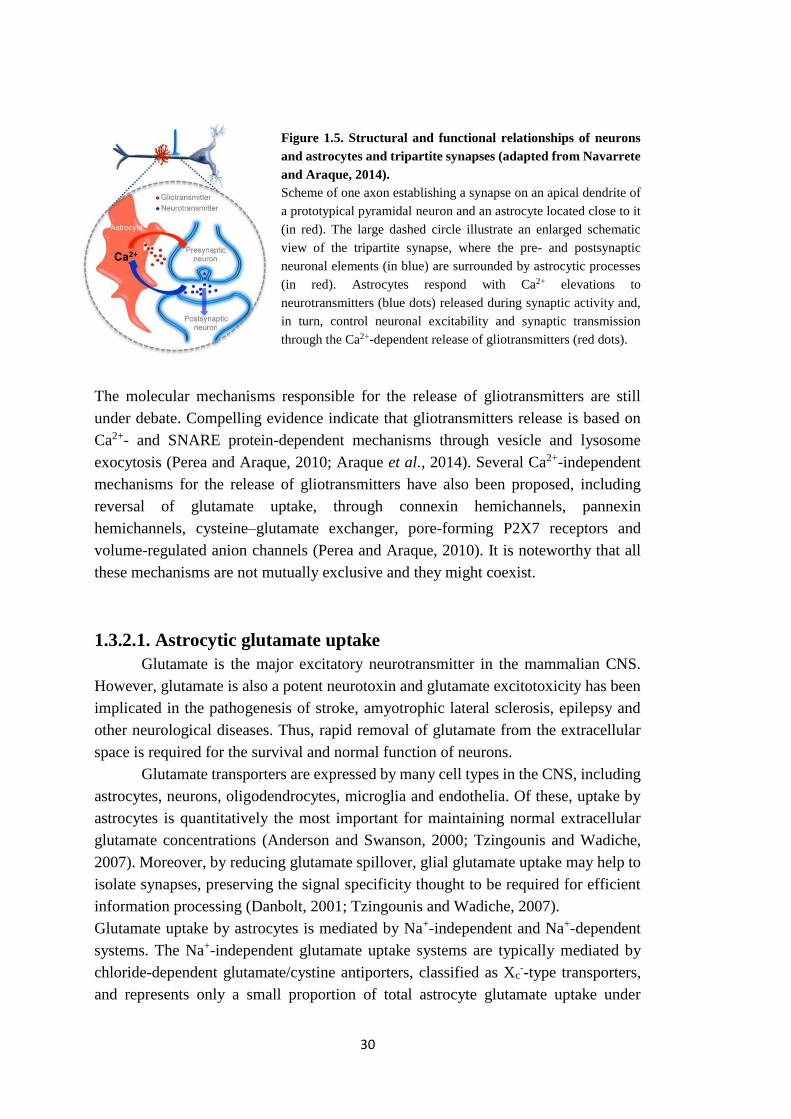
30
Figure 1.5. Structural and functional relationships of neurons
and astrocytes and tripartite synapses (adapted from Navarrete
and Araque, 2014).
Scheme of one axon establishing a synapse on an apical dendrite of
a prototypical pyramidal neuron and an astrocyte located close to it
(in red). The large dashed circle illustrate an enlarged schematic
view of the tripartite synapse, where the pre- and postsynaptic
neuronal elements (in blue) are surrounded by astrocytic processes
(in red). Astrocytes respond with Ca2+ elevations to
neurotransmitters (blue dots) released during synaptic activity and,
in turn, control neuronal excitability and synaptic transmission
through the Ca2+-dependent release of gliotransmitters (red dots).
The molecular mechanisms responsible for the release of gliotransmitters are still
under debate. Compelling evidence indicate that gliotransmitters release is based on
Ca2+- and SNARE protein-dependent mechanisms through vesicle and lysosome
exocytosis (Perea and Araque, 2010; Araque et al., 2014). Several Ca2+-independent
mechanisms for the release of gliotransmitters have also been proposed, including
reversal of glutamate uptake, through connexin hemichannels, pannexin
hemichannels, cysteine–glutamate exchanger, pore-forming P2X7 receptors and
volume-regulated anion channels (Perea and Araque, 2010). It is noteworthy that all
these mechanisms are not mutually exclusive and they might coexist.
1.3.2.1. Astrocytic glutamate uptake
Glutamate is the major excitatory neurotransmitter in the mammalian CNS.
However, glutamate is also a potent neurotoxin and glutamate excitotoxicity has been
implicated in the pathogenesis of stroke, amyotrophic lateral sclerosis, epilepsy and
other neurological diseases. Thus, rapid removal of glutamate from the extracellular
space is required for the survival and normal function of neurons.
Glutamate transporters are expressed by many cell types in the CNS, including
astrocytes, neurons, oligodendrocytes, microglia and endothelia. Of these, uptake by
astrocytes is quantitatively the most important for maintaining normal extracellular
glutamate concentrations (Anderson and Swanson, 2000; Tzingounis and Wadiche,
2007). Moreover, by reducing glutamate spillover, glial glutamate uptake may help to
isolate synapses, preserving the signal specificity thought to be required for efficient
information processing (Danbolt, 2001; Tzingounis and Wadiche, 2007).
Glutamate uptake by astrocytes is mediated by Na+-independent and Na+-dependent
systems. The Na+-independent glutamate uptake systems are typically mediated by
chloride-dependent glutamate/cystine antiporters, classified as Xc--type transporters,
and represents only a small proportion of total astrocyte glutamate uptake under
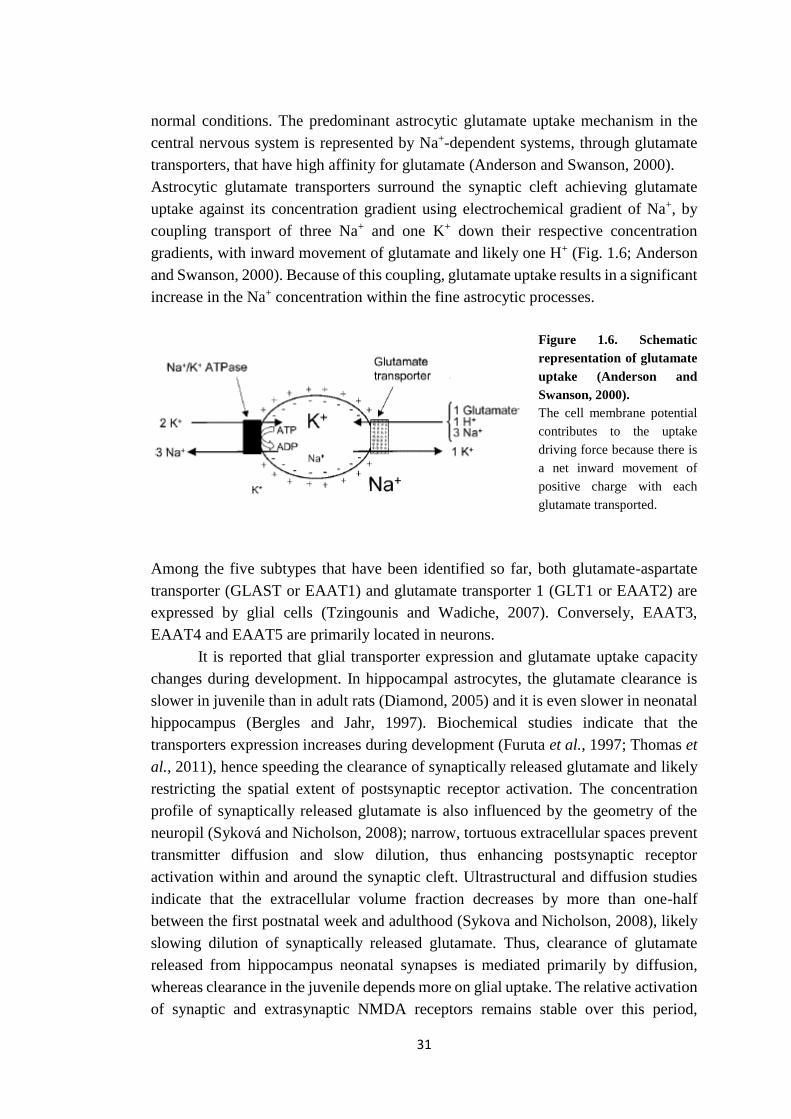
31
normal conditions. The predominant astrocytic glutamate uptake mechanism in the
central nervous system is represented by Na+-dependent systems, through glutamate
transporters, that have high affinity for glutamate (Anderson and Swanson, 2000).
Astrocytic glutamate transporters surround the synaptic cleft achieving glutamate
uptake against its concentration gradient using electrochemical gradient of Na+, by
coupling transport of three Na+ and one K+ down their respective concentration
gradients, with inward movement of glutamate and likely one H+ (Fig. 1.6; Anderson
and Swanson, 2000). Because of this coupling, glutamate uptake results in a significant
increase in the Na+ concentration within the fine astrocytic processes.
Figure 1.6. Schematic
representation of glutamate
uptake (Anderson and
Swanson, 2000).
The cell membrane potential
contributes to the uptake
driving force because there is
a net inward movement of
positive charge with each
glutamate transported.
Among the five subtypes that have been identified so far, both glutamate-aspartate
transporter (GLAST or EAAT1) and glutamate transporter 1 (GLT1 or EAAT2) are
expressed by glial cells (Tzingounis and Wadiche, 2007). Conversely, EAAT3,
EAAT4 and EAAT5 are primarily located in neurons.
It is reported that glial transporter expression and glutamate uptake capacity
changes during development. In hippocampal astrocytes, the glutamate clearance is
slower in juvenile than in adult rats (Diamond, 2005) and it is even slower in neonatal
hippocampus (Bergles and Jahr, 1997). Biochemical studies indicate that the
transporters expression increases during development (Furuta et al., 1997; Thomas et
al., 2011), hence speeding the clearance of synaptically released glutamate and likely
restricting the spatial extent of postsynaptic receptor activation. The concentration
profile of synaptically released glutamate is also influenced by the geometry of the
neuropil (Syková and Nicholson, 2008); narrow, tortuous extracellular spaces prevent
transmitter diffusion and slow dilution, thus enhancing postsynaptic receptor
activation within and around the synaptic cleft. Ultrastructural and diffusion studies
indicate that the extracellular volume fraction decreases by more than one-half
between the first postnatal week and adulthood (Sykova and Nicholson, 2008), likely
slowing dilution of synaptically released glutamate. Thus, clearance of glutamate
released from hippocampus neonatal synapses is mediated primarily by diffusion,
whereas clearance in the juvenile depends more on glial uptake. The relative activation
of synaptic and extrasynaptic NMDA receptors remains stable over this period,
32
suggesting that developmental increases in transporter expression compensate for
structural changes that slow transmitter dilution (Thomas et al., 2011).
GLT1 and GLAST are heterogeneously expresses during development and in different
brain areas. Several line of evidence indicate that in the cortex and hyppocampus,
GLT-1 dominates functional uptake in the mature astrocytes while GLAST plays a
more prominent role in immature astrocytes (Furuta et al., 1997; Armbruster et al.,
2014; Danbolt, 2001). By quantitative immunoblotting it was shown that the number
of GLT1 is about four times that of GLAST in the stratum radiatum of mature rat
hippocampus (Lehre and Danbolt, 1998). GLAST is the primary glutamate transporter
in the Bergmann glial cells of the mature cerebellum and fibrous astrocytes of the
ventral white matter tracts of the spinal cord (Furuta et al., 1997).
The glutamate transporters are differentially distributed also at the cellular level;
immunoreactivity studies in mice hippocampus indicated that GLT-1 did not entirely
cover astrocyte somata and exhibited clusters at processes and at end-feet on blood
vessels (Benediktsson et al., 2012; Schreiner et al., 2014); conversely, GLAST
immunoreactivity indicated no preferential localization to a specific cellular
compartment (Schreiner et al., 2014).
It also reported that the rate of glutamate transport is highly temperature dependent
(Q10 ~ 3) (Wadiche and Kavanaugh, 1998). Indeed, at physiological temperatures,
hippocampal glial transporters are capable of clearing glutamate released evoked by
high frequency extracellular stimulation very efficiently; on the contrary, at room
temperature, transporters appear overwhelmed during long high frequency stimulation
(Diamond and Jahr, 2000). Therefore, temperature effects on glutamate transport may
influence the extent to which glutamate can diffuse to neighbouring synapses.
1.3.2.2. Astrocytic potassium uptake
As a consequence of the low baseline concentration of extracellular K+ and to
the limited volume of extracellular space, even modest efflux of K+ from neurons can
elicit considerable changes in the extracellular concentration. These changes can
influence a wide variety of neuronal processes, including the maintenance of the
resting membrane potential, activation and inactivation of voltage-gated ion channels,
the efficacy of synaptic transmission and electrogenic transport of neurotransmitters.
One of the most important functions of astrocytes is the clearance of K+ from the
extracellular space, using two systems: net K+ uptake and a spatial buffer mechanism
(Kofuji and Newman, 2004).
Net K+ uptake can occur by an active process, by the action of Na+, K+-ATPase or
Na+-K+-Cl- cotransporters. The Na+ pump plays a principal role in K+ regulation. The
Na+-K+-Cl- transporters are integral membrane proteins that transport Na+, K+ and Cl-
ions into cells, often with a stoichiometry of 1Na+:1K+:2Cl-.
33
According to the spatial buffer mechanism, K+ ions are passively redistributed along
the glial syncytium by transferring K+ from sites of elevated concentration to those
with lower concentration. This mechanism depends critically on a high K+
permeability of the astrocyte cell membrane as well as on the presence of gap junctions
between astrocytes: the glial cells express inwardly rectifying K+ (Kir) channels, with
high open probability at the normal resting membrane potential, and form a syncytium
in which K+ currents can traverse relatively long distances. Given this high resting
conductance for potassium ions (K+), the astroglial membrane potential is close to the
Nernst equilibrium for K+ ions and are highly sensitive to changes in the extracellular
K+ levels associated with neuronal activity.
An important biophysical property of Kir channels is that their slope conductance
increases with elevations in extracellular K+ concentration by a square root relation.
This unique property of Kir channels allows K+ conductance increases in glial cells,
and therefore, enhanced K + clearance rates, when extracellular K+ concentration is
raised. The Kir channels have been recently cloned and over 20 genes are currently
known to encode various Kir channel subunits. Kir channels consist of two
transmembrane domains bridged by a re-entry loop (P-loop), with intracellular amino
and carboxyl termini. The Kir-channel subunits are usually categorized into seven
major subfamilies (Kir1 to Kir7) that are diversely regulated by intracellular and
extracellular factors. Within the seven described Kir family, the Kir4.1 subtype is
almost exclusively expressed by glia in the central nervous system and it is regulated
by intracellular ATP (Kofuji and Newman, 2004). Although glia may express
additional types of K+ channels, such as Ca2+- and voltage-dependent K+ channels,
these other channel types are largely inactive at the hyperpolarized glial resting
membrane potential. Astrocytes may also express two-pore domain K+ channels
(TASK and TREK), whose contribution to extracellular K+ concentration regulation
remains to be determined (Kofuji and Newman, 2004).
1.3.2.3. Synaptically-activated transporter-mediated current and K+
current evoked in astrocytes by extracellular stimulation
The extracellular stimulation evokes in astrocytes in acute slices a current
characterized by different components (Bergles and Jahr, 1997).
The first short-lived inward current, which is inhibited by application of specific
glutamate transporter inhibitor, is the synaptically-activated transporter-mediated
current, STC, reflecting glutamate transporter activity. Indeed, glutamate uptake by
high affinity transporters is electrogenic, a consequence of the translocation of net
positive charge during each transport cycle (see paragraph 1.3.2.1). The STC time
course appears to be shaped by the dynamics of glutamate clearance: the STC is slowed
by transporter antagonists, which slow glutamate clearance by decreasing uptake
capacity (Bergles and Jahr, 1997; Diamond and Jahr, 2000). The STC decay time
34
course provides a relative measure of the glutamate clearance, whereas the amplitude
of the STC reflects the amount of glutamate released at the synapses by extracellular
stimulation (Diamond and Jahr, 2000; Diamond, 2005). Indeed, changing stimulus
strength causes proportional changes in STC amplitude, with no effects on the STC
time course (Diamond and Jahr, 2000).
This transient initial current is followed by a sustained inward current described in the
literature as being an inward Ba+-sensitive K+ current mainly through Kir channels
(Bergles and Jahr, 1997), that decays much more slowly than the STC current (Meeks
and Mennerick, 2007; Bernardinelli and Chatton, 2008). This synaptically-activated
Ba+-sensitive K+ current is a measure of the synaptically-induced increase in
extracellular K+ concentration produced by neuronal K+ efflux, mostly through voltage
gated K+ channels during the action potential and through the NMDA receptor
(Dallérac at al., 2013; Poolos et al., 1987; Shih et al., 2013), and of the accompanying
change in driving force on Kir channels of astrocytes, that behave as K+ electrodes.
A recent study in hippocampus identified, in the astrocytic response evoked by the
stimulation, a current partially mediated by GABA transporters (GAT) and Kir4.1-
independent K+ channels (Sibille et al., 2014). Long-lasting GAT currents evoked
synaptically have been identified in astrocytes from other brain regions such as the
neocortex (Kinney and Spain, 2002), and display slow rise and decay kinetics, in
contrast to glutamate transporter-mediate currents.
The different kinetics of fast glutamate transporter-mediated current and slow
K+ and GAT-mediated currents in astrocytes probably reflect differences in
extracellular concentrations of glutamate, K+ and GABA over time, due to distinct
release and clearance properties. Indeed, glutamate is mostly released by presynaptic
elements at confined synaptic active zones and the close vicinity of glutamate release
sites and clustered astroglial glutamate transporters (Melone et al. 2009) probably
enables efficient fast glutamate clearance. In contrast, the distal location of astroglial
GATs to GABAergic synapses (Minelli et al. 1996) may underlie the slow kinetics of
the synaptically evoked GAT currents. Finally, despite abundant expression of Kir4.1
channels preferentially located on astrocytic processes enwrapping synapses (Higashi
et al. 2001), the slow astroglial K+ clearance may originate from uniform extracellular
K+ bulk rises, due to pre- and postsynaptic release of K+ (Poolos et al. 1987; Shih et
al., 2013) over large zones, which may be slowly redistributed though gap junction-
mediated networks (Pannasch et al. 2011).
1.3.3. Excitation/inhibition balance in the cortex
Synaptic excitation and inhibition are inseparable events in the cortex (Isaacson
and Scanziani, 2011). The interactions between GABAergic interneurons and
glutamatergic principal cells are reciprocal: interneurons inhibit principal cells and are
excited by them. In fact, the connectivity between these two neuronal classes is quite
35
high: individual interneurons can inhibit more than 50% of principal cells located
within about 100 μm and receive excitatory input from a large fraction of them (Kapfer
et al., 2007; Fino et al., 2013). Thus, not only GABAergic interneurons are excited in
proportion to the level of local network activity, but also they directly influence it
through their inhibitory feedback. This simple connectivity pattern is ubiquitous in
cortex and forms the basis for so-called feedback or recurrent inhibition.
Of course, not all cortical excitation received by inhibitory interneurons is locally
generated. Cortical cells receive excitatory inputs via long-range axons originating
from subcortical nuclei, as well as from other cortical regions and different cortical
layers. These excitatory afferent inputs diverge onto both principal cells and
interneurons, generating feedforward inhibitory circuits. Interestingly, the same
afferent fibers make stronger excitatory connections onto interneurons than they do on
principal cells, thereby ensuring that even minimal levels of afferent input generate
inhibition in cortical circuits (Gabernet et al., 2005).
In addition to principal cells, GABAergic interneurons also make inhibitory contacts
onto each other and the connectivity between interneurons is highly reciprocal. This
mutual connectivity between interneurons is also able to shape spatial and temporal
features of cortical inhibition (Isaacson and Scanziani, 2011).
Because of this massive interconnection, excitation and inhibition increase and
decrease together during physiological cortical activity and alterations of this
relationship shift cortical activity to hyperexcitable (epileptiform) or silent (comatose)
state. Thus, excitation-inhibition balance each other and this balance is important for
proper cortical functions. However, despite the overall proportionality of excitation
and inhibition, their exact ratio is not constant. For example, stimulus intensity or
shape can affect the excitation-inhibition balance and excitation-inhibition balance can
change over a short timescale as a result of adaptation, depending on stimulation
history and rate (Isaacson and Scanziani 2011).
How excitation-inhibition balance is established during development is largely
unknown. Consistent with the central importance of excitation-inhibition balance, a
variety of neurological and psychiatric disorders are currently viewed as pathologies
of brain excitability and are thought to involve or even be caused by disruption of this
delicate equilibrium. Among these pathologies are migraine, mental retardation, Rett
syndrome, fragile X syndrome, autism spectrum disorders and epilepsy. A growing
number of mutations in genes coding for proteins involved in neurotransmission (such
as Ca2+ channels, proton pumps, synaptic vesicle components, pre- and post-synaptic
constituents) have been found in familiar cases of these pathologies (Poduri and
Lowenstein, 2011; Rajakulendran et al., 2010; Vecchia and Pietrobon, 2012).
36
1.4. Cortical network electrical activity
Cortical neurons receive the great majority of their synaptic inputs from
neurons within the local network (more or less 1 mm distant) (Binzegger et al., 2004).
As a consequence of this dense and local connectivity, the cerebral cortex exhibits
spontaneous, persistent high synchronous activity in the absence of any external
stimulation, such as during natural sleep or anesthesia (Steriade et al., 2001; Petersen
et al., 2003; Buzsaki, 2010; Poulet and Petersen, 2008). This ongoing activity is
revealed by the rhythmic and synchronous oscillation of the membrane potential of
populations of neurons and can be measured by electroencephalography (EEG) or
extracellular (or intracellular) recordings in vivo.
The spatial and temporal patterns of spontaneous activity in the cortex differ markedly
across the various physiological conditions; EEG records, as time dependent signals,
are decomposed into five main frequency bands, ranging from low frequency delta (<
4 Hz) and theta (4-8 Hz) waves, commonly found during slow-wave sleep, through
alpha (8-12 Hz) and beta (13-30 Hz) waves, associated with an awake and alert brain,
to gamma waves (30-100 Hz), associated with intense multimodal information
processing.
1.4.1. Slow oscillations and their neuronal counterparts, up- and
down-states
In the cortex, the most well studied pattern of recurrent network activity is that
of the ‘slow’ (<1 Hz) oscillation, characterized by slow large amplitude membrane
potential fluctuations that occur synchronously in nearby neurons (Steriade et al.,
2001; Petersen et al., 2003; Poulet and Petersen, 2008). This fluctuations consist in
rhythmic cycles of sustained depolarization (of 15-25 mV), called up-states, that can
be subthreshold or can generate action potentials, followed by the cessation of firing
and the rescue of the membrane resting potential, called down-states (Steriade et al.,
1993; Haider et al., 2006; Petersen et al., 2003; Sanchez-Vives and McCormick,
2000).
Several lines of evidence confirm that both excitatory and inhibitory neurons
fire during up-states. Indeed, the up-states are generated by large synchronous bursts
of spontaneous excitatory and inhibitory postsynaptic currents, which arise from
correlated activity of a large population of presynaptic connected neurons generated
through recurrent synaptic network activity within cortical circuitry (Petersen et al.,
2003; Shu et al., 2003; Sanchez-Vives and McCormick, 2000; Haider et al., 2006;
Wilson, 2008; Okun and Lampl, 2008). This reflects the architecture of local cortical
circuits, in which pyramidal cells are connected to other pyramidal cells and to
inhibitory interneurons, in such a way that maintain a dynamic balance between
excitation and inhibition during up-states (see paragraph 1.3.3). Long-range
37
connections play a key role in the communication, propagation and synchronization of
this locally generated activity (Haider and McCormick, 2009 and references therein).
While the recurrent excitation of cortical pyramidal cells during the up-states appears
to originate from other pyramidal neurons, the source of the robust inhibitory
potentials is less known. Fast-spiking GABAergic interneurons are one likely input,
since these are highly active (Steriade et al., 2001; Haider et al., 2006; Fanselow and
Connors, 2010; Tahvildari et al., 2012). The importance of fast GABAergic inhibition
in controlling persistent activity is supported by the fact that blocking GABAA
receptors transforms up-states into epileptiform bursts (Sanchez-Vives and
McCormick, 2000; Shu et al., 2003).
The slow oscillations are thought to be essential for memory formation and
consolidation (Chauvette et al., 2012). Growing evidence supports the view that the
transition of memories from a labile, hippocampal-dependent state to a stable or
consolidated, hippocampal-independent state depends on activity-driven plasticity
processes that take place during sleep (Hoffman et al., 2007; Mölle and Born, 2011).
1.4.2. Initiation, propagation and termination of up-states
Spontaneous slow oscillations are disrupted by disconnection of intracortical
pathway while survive thalamic lesions and transection of the corpus callosum
(Steriade et al., 1993). Moreover, spontaneous up-states similar, although at a lower
frequency, to the ones observed in vivo, have also been reported in vitro in brain slices
of many cortical regions (Sanchez Vives and McCormick, 2000), maintained in a
solution with divalent ions concentrations similar to those found in natural
cerebrospinal fluid (Cossart et al., 2003; Sanchez-Vives and McCormick, 2000; Shu
et al., 2003). These findings indicate that the up-state activity originates intrinsically
within the cortex (Steriade et al., 1993; Sanchez-Vives and McCormick 2000), via
recurrent excitatory and inhibitory intracortical interactions, and then transmitted to
other brain areas.
Recent evidences suggests that the full expression of the slow oscillation
requires the balanced interaction of both neocortex and thalamus (Crunelli and
Hughes, 2010; Crunelli et al., 2015; David et al., 2013; Lemieux et al., 2014).
Nevertheless, the extent of the thalamic contribution to network activity is still a matter
of discussion. As neocortical neurons, almost all thalamic neurons exhibit the slow
oscillation with their up- and down- states occurring quasi-synchronously, both locally
and with cortical neurons. In thalamocortical slices from adult mice, the cutting of the
connections between thalamus and cortex reduced the frequency of up-states (Rigas
and Castro-Alamancos, 2007). Similarly, recordings from anesthetized and behaving
cats indicate that full or partial cortical deafferentation that removes thalamic inputs to
the neocortex dramatically reduced the expression of slow oscillations in affected
cortical areas (Lemieux et al., 2014).
38
The mechanisms underlying generation and maintenance of spontaneous up-
states activity within the cortex are still under debate: three hypotheses on the origin
of the up-states in local networks have been proposed (Chauvette et al., 2010;
Timofeev and Chauvette, 2011 and references therein).
The first one is the ‘spontaneous release hypothesis’; according to this hypothesis,
spontaneous transmitters release in large neuronal populations, occurring during a
down state, occasionally depolarizes some cells to the firing threshold, thus initiating
an active state in the network (Timofeev et al., 2000; Bazhenov et al., 2002).
Therefore, activity may start in any neuron, although cells receiving largest excitatory
convergence will have higher probability of being activated before the others in the
network.
According to the second proposed mechanism, the transition from silence to activity
is mediated by intrinsic firing of layer 5 pyramidal neurons, which are depolarized and
generate some spikes between the active states, when other cortical neurons are silent
(Sanchez-Vives and McCormick, 2000). This so called ‘layer 5 neuron hypothesis’
predicts that activity always originates in these neurons and then it propagates to other
cortical layers.
The third hypothesis attributes transitions from silent to active states to the selective
synchronization of spatially structured neuronal ensembles involving a small number
of cells (Cossart et al., 2003). The ‘selective synchronization’ hypothesis predicts that
even during the silent states, some neurons of the network still generate irregular
spontaneous firing.
Recent findings suggest that spontaneous recurrent cortical activity depends
also on the coordination between the activity of electrically excitable cells and the
neuromodulation by inexcitable glial cells (Poskanzer and Yuste, 2011; Fellin et al.,
2009). Indeed, the stimulation of a single astrocyte in vitro can activate the astrocytic
network and double the number of up-states, whereas inhibition of astrocytic activity,
with a Ca2+ chelator, blocks half of the up-states (Poskanzer and Yuste, 2011).
Moreover, in vivo recordings in combination with astrocyte-specific molecular
genetics showed that the inhibition of gliotransmission affects cortical slow
oscillations, reducing up-states duration (Fellin et al., 2009).
Recent studies provide insights on the contribution of specific cortical layers
to the initiation and propagation of spontaneous recurrent cortical activity.
Extracellular multiple-unit recordings in ferret cortical slices revealed that the slow
oscillation seems to be initiated in layer 5, as an excitatory interaction between
pyramidal neurons, and propagates through the neocortex (Sanchez-Vives and
McCormick, 2000).
More recently, multisite field potential recordings, extracellular multiunit and
intracellular recordings from closely located neurons in vivo in the cat neocortex
revealed that the active states could start at any depth, but activation of large pyramidal
cells from deep layers was more likely to occur first (Chauvette et al., 2010). This is
39
probably due to the large excitatory convergence on the layer 5 cells; indeed, given
their broad projection, there might be a higher probability for spontaneous synaptic
inputs summation in these cells than in neurons in other layers, leading to firing and
activation of the network.
Using a combination of intracellular recordings and of fast optical imaging with
voltage-sensitive dyes in thalamocortical-connected slices of rat barrel cortex, it was
shown that a single thalamic input typically triggers an up-state that initiates within a
column following a preferential L4 → L2/3 → L5 sequence, and then propagates via
layer 2/3 and layer 5 to neighboring columns. However, layer 5, but not layer 2/3, is
crucial for the spread of excitation both within a column and across columns. Indeed,
layer 5 can sustain and propagate activity to neighboring columns in the absence of
layer 2/3. Conversely, layer 2/3 cannot sustain activity in the absence of the underlying
layer 5, and often fails to propagate activity to neighboring columns. Thus, layer 5
amplifies activity in local layer 2/3 networks and distributes it over many columns
within the primary sensory cortex (Wester and Contreras, 2012).
A further confirmation of the specific role of layer 5 neurons in sustaining and
propagating up-states comes from a recent in vivo study using optogenetic activation
of infragranular or supragranular neurons. Optogenetic activation of a subset of
pyramidal neurons located in layer 5 generated network activity that resembled
spontaneous up-states, whereas photoinhibition of these same neurons substantially
attenuated ongoing up-states. In contrast, light activation and inhibition of layer 2/3
cells modestly affects spontaneous slow activity (Beltramo et al., 2013). The
differential role of layer 5 and layer 2/3 neurons in slow oscillation may be linked to
the better ability of layer 5 excitatory neurons to propagate depolarization within and
across cortical layers.
The mechanisms underlying the termination of up-states are also unclear. Phase
transitions from up-state to down-state can be triggered by the build-up of activity-
dependent K+ conductances (Sanchez-Vives and McCormick, 2000; Shu et al., 2003;
Sanchez-Vives et al., 2010). Other activity-dependent mechanisms such as synaptic
depression may also participate in the termination of the up-states (Mann et al., 2009;
Parga and Abbott, 2007). GABAB receptors appear to selectively contribute to the
termination of up-states in layer 2/3 pyramidal neurons in rat entorhinal cortex slices,
because GABAB antagonists drastically prolong the up-state duration and impair the
ability of layer 1 stimulation to terminate up-states (Mann et al., 2009).

40
41
2. AIM OF WORK (I)
Missense mutations in the gene encoding the pore forming subunit of P/Q-type
Ca2+ channel are associated with familial hemiplegic migraine type 1 (FHM1), a rare
form of autosomal dominant subtype of migraine with aura (Pietrobon and Moskowitz,
2013). KI mice carrying the R192Q mutation show gain of function of P/Q-type Ca2+
channels that determines an increased influx of Ca2+ in neurons, including pyramidal
cells, and an increased probability of glutamate release (Pietrobon, 2010; Tottene et
al., 2009). It was recently found in our laboratory that the frequency of the up-state
activity recorded in acute cortical slices, resembling spontaneous slow oscillations in
vivo, is increased in FHM1 KI mice (Fabbro, Sessolo, Vecchia, Conti and Pietrobon,
manuscript in preparation).
To further investigate the role of P/Q-type Ca2+ channels in the spontaneous
recurrent cortical activity underlying the up-states, I studied the effect of blocking the
P/Q-type Ca2+ channels on up-state activity recorded in acute slices of mouse
somatosensory cortex.
Given that at many cortical synapses P/Q- and N-type Ca2+ channels cooperate in
controlling synaptic transmission, I also investigated the effect of blocking N-type
Ca2+ channels on up-state activity.

42
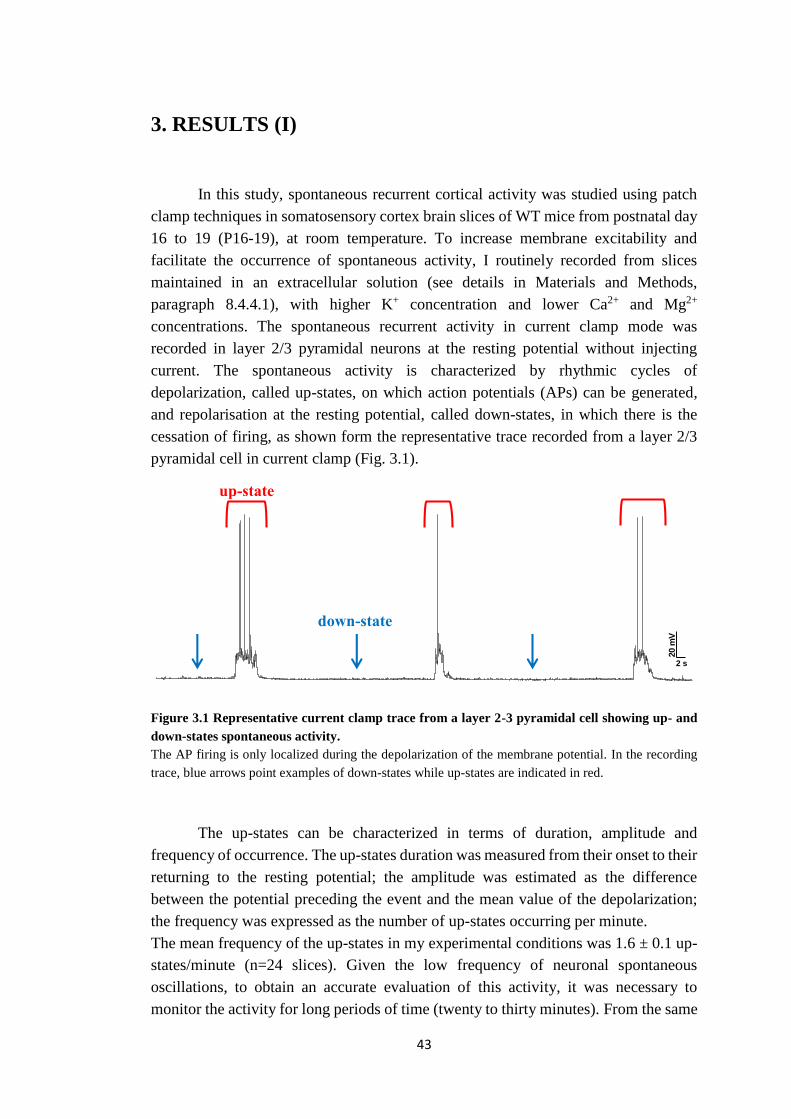
43
3. RESULTS (I)
In this study, spontaneous recurrent cortical activity was studied using patch
clamp techniques in somatosensory cortex brain slices of WT mice from postnatal day
16 to 19 (P16-19), at room temperature. To increase membrane excitability and
facilitate the occurrence of spontaneous activity, I routinely recorded from slices
maintained in an extracellular solution (see details in Materials and Methods,
paragraph 8.4.4.1), with higher K+ concentration and lower Ca2+ and Mg2+
concentrations. The spontaneous recurrent activity in current clamp mode was
recorded in layer 2/3 pyramidal neurons at the resting potential without injecting
current. The spontaneous activity is characterized by rhythmic cycles of
depolarization, called up-states, on which action potentials (APs) can be generated,
and repolarisation at the resting potential, called down-states, in which there is the
cessation of firing, as shown form the representative trace recorded from a layer 2/3
pyramidal cell in current clamp (Fig. 3.1).
Figure 3.1 Representative current clamp trace from a layer 2-3 pyramidal cell showing up- and
down-states spontaneous activity.
The AP firing is only localized during the depolarization of the membrane potential. In the recording
trace, blue arrows point examples of down-states while up-states are indicated in red.
The up-states can be characterized in terms of duration, amplitude and
frequency of occurrence. The up-states duration was measured from their onset to their
returning to the resting potential; the amplitude was estimated as the difference
between the potential preceding the event and the mean value of the depolarization;
the frequency was expressed as the number of up-states occurring per minute.
The mean frequency of the up-states in my experimental conditions was 1.6 ± 0.1 up-
states/minute (n=24 slices). Given the low frequency of neuronal spontaneous
oscillations, to obtain an accurate evaluation of this activity, it was necessary to
monitor the activity for long periods of time (twenty to thirty minutes). From the same
20 m
V2 s
20 m
V
2 s
up-state
down-state
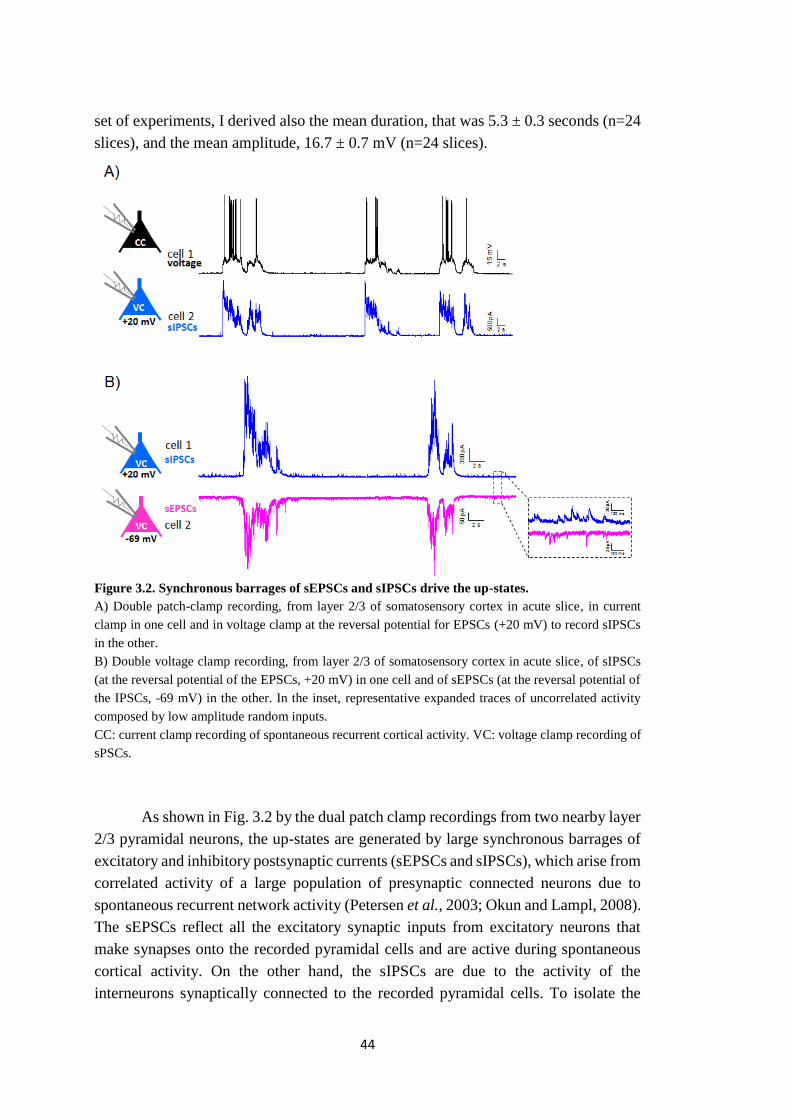
44
set of experiments, I derived also the mean duration, that was 5.3 ± 0.3 seconds (n=24
slices), and the mean amplitude, 16.7 ± 0.7 mV (n=24 slices).
Figure 3.2. Synchronous barrages of sEPSCs and sIPSCs drive the up-states.
A) Double patch-clamp recording, from layer 2/3 of somatosensory cortex in acute slice, in current
clamp in one cell and in voltage clamp at the reversal potential for EPSCs (+20 mV) to record sIPSCs
in the other.
B) Double voltage clamp recording, from layer 2/3 of somatosensory cortex in acute slice, of sIPSCs
(at the reversal potential of the EPSCs, +20 mV) in one cell and of sEPSCs (at the reversal potential of
the IPSCs, -69 mV) in the other. In the inset, representative expanded traces of uncorrelated activity
composed by low amplitude random inputs.
CC: current clamp recording of spontaneous recurrent cortical activity. VC: voltage clamp recording of
sPSCs.
As shown in Fig. 3.2 by the dual patch clamp recordings from two nearby layer
2/3 pyramidal neurons, the up-states are generated by large synchronous barrages of
excitatory and inhibitory postsynaptic currents (sEPSCs and sIPSCs), which arise from
correlated activity of a large population of presynaptic connected neurons due to
spontaneous recurrent network activity (Petersen et al., 2003; Okun and Lampl, 2008).
The sEPSCs reflect all the excitatory synaptic inputs from excitatory neurons that
make synapses onto the recorded pyramidal cells and are active during spontaneous
cortical activity. On the other hand, the sIPSCs are due to the activity of the
interneurons synaptically connected to the recorded pyramidal cells. To isolate the
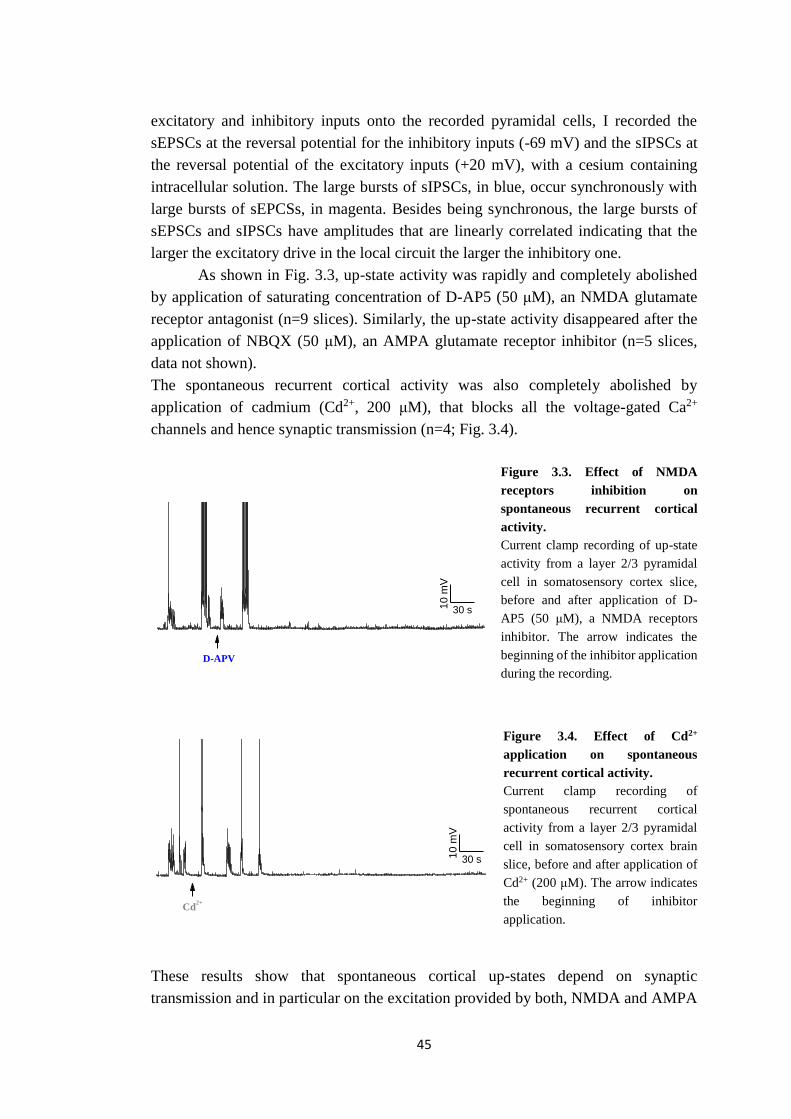
45
excitatory and inhibitory inputs onto the recorded pyramidal cells, I recorded the
sEPSCs at the reversal potential for the inhibitory inputs (-69 mV) and the sIPSCs at
the reversal potential of the excitatory inputs (+20 mV), with a cesium containing
intracellular solution. The large bursts of sIPSCs, in blue, occur synchronously with
large bursts of sEPCSs, in magenta. Besides being synchronous, the large bursts of
sEPSCs and sIPSCs have amplitudes that are linearly correlated indicating that the
larger the excitatory drive in the local circuit the larger the inhibitory one.
As shown in Fig. 3.3, up-state activity was rapidly and completely abolished
by application of saturating concentration of D-AP5 (50 μM), an NMDA glutamate
receptor antagonist (n=9 slices). Similarly, the up-state activity disappeared after the
application of NBQX (50 μM), an AMPA glutamate receptor inhibitor (n=5 slices,
data not shown).
The spontaneous recurrent cortical activity was also completely abolished by
application of cadmium (Cd2+, 200 μM), that blocks all the voltage-gated Ca2+
channels and hence synaptic transmission (n=4; Fig. 3.4).
Figure 3.3. Effect of NMDA
receptors inhibition on
spontaneous recurrent cortical
activity. Current clamp recording of up-state
activity from a layer 2/3 pyramidal
cell in somatosensory cortex slice,
before and after application of D-
AP5 (50 μM), a NMDA receptors
inhibitor. The arrow indicates the
beginning of the inhibitor application
during the recording.
Figure 3.4. Effect of Cd2+
application on spontaneous
recurrent cortical activity.
Current clamp recording of
spontaneous recurrent cortical
activity from a layer 2/3 pyramidal
cell in somatosensory cortex brain
slice, before and after application of
Cd2+ (200 μM). The arrow indicates
the beginning of inhibitor
application.
These results show that spontaneous cortical up-states depend on synaptic
transmission and in particular on the excitation provided by both, NMDA and AMPA
Cd2+
30 s10
mV
D-APV
30 s10 m
V
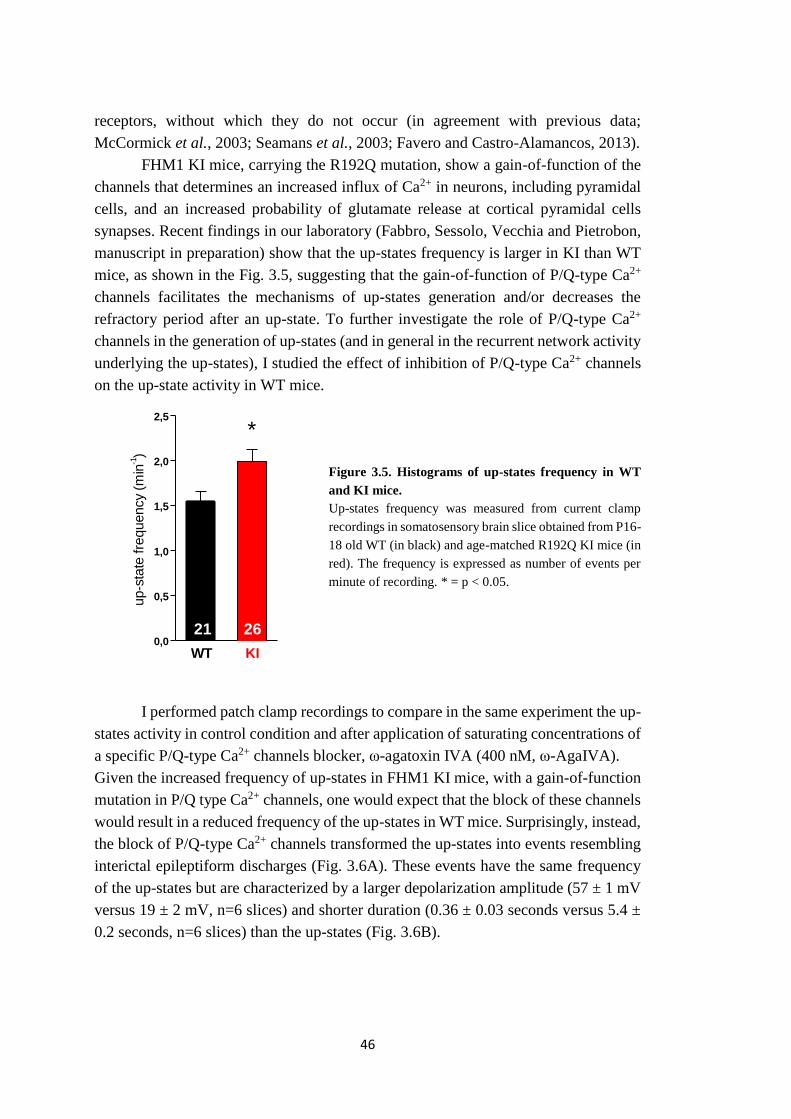
46
receptors, without which they do not occur (in agreement with previous data;
McCormick et al., 2003; Seamans et al., 2003; Favero and Castro-Alamancos, 2013).
FHM1 KI mice, carrying the R192Q mutation, show a gain-of-function of the
channels that determines an increased influx of Ca2+ in neurons, including pyramidal
cells, and an increased probability of glutamate release at cortical pyramidal cells
synapses. Recent findings in our laboratory (Fabbro, Sessolo, Vecchia and Pietrobon,
manuscript in preparation) show that the up-states frequency is larger in KI than WT
mice, as shown in the Fig. 3.5, suggesting that the gain-of-function of P/Q-type Ca2+
channels facilitates the mechanisms of up-states generation and/or decreases the
refractory period after an up-state. To further investigate the role of P/Q-type Ca2+
channels in the generation of up-states (and in general in the recurrent network activity
underlying the up-states), I studied the effect of inhibition of P/Q-type Ca2+ channels
on the up-state activity in WT mice.
Figure 3.5. Histograms of up-states frequency in WT
and KI mice.
Up-states frequency was measured from current clamp
recordings in somatosensory brain slice obtained from P16-
18 old WT (in black) and age-matched R192Q KI mice (in
red). The frequency is expressed as number of events per
minute of recording. * = p < 0.05.
I performed patch clamp recordings to compare in the same experiment the up-
states activity in control condition and after application of saturating concentrations of
a specific P/Q-type Ca2+ channels blocker, ω-agatoxin IVA (400 nM, ω-AgaIVA).
Given the increased frequency of up-states in FHM1 KI mice, with a gain-of-function
mutation in P/Q type Ca2+ channels, one would expect that the block of these channels
would result in a reduced frequency of the up-states in WT mice. Surprisingly, instead,
the block of P/Q-type Ca2+ channels transformed the up-states into events resembling
interictal epileptiform discharges (Fig. 3.6A). These events have the same frequency
of the up-states but are characterized by a larger depolarization amplitude (57 ± 1 mV
versus 19 ± 2 mV, n=6 slices) and shorter duration (0.36 ± 0.03 seconds versus 5.4 ±
0.2 seconds, n=6 slices) than the up-states (Fig. 3.6B).
0,0
0,5
1,0
1,5
2,0
2,5
0,0
0,5
1,0
1,5
2,0
2,5
**
1212 99
WT KIKI
sP
SC
burs
t fr
equency
(min
-1)
WT
*
2621
***
9
UPSTATES
KI
up-s
tate
fre
quency
(min
-1)
WT
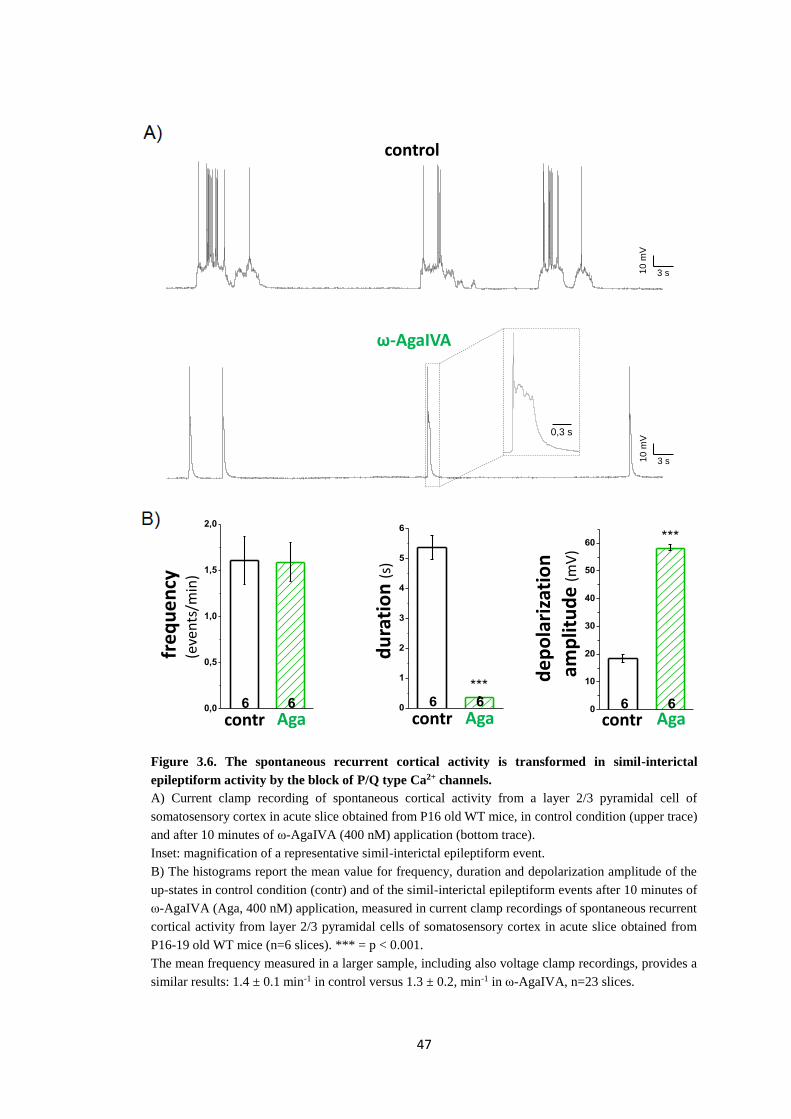
47
Figure 3.6. The spontaneous recurrent cortical activity is transformed in simil-interictal
epileptiform activity by the block of P/Q type Ca2+ channels.
A) Current clamp recording of spontaneous cortical activity from a layer 2/3 pyramidal cell of
somatosensory cortex in acute slice obtained from P16 old WT mice, in control condition (upper trace)
and after 10 minutes of ω-AgaIVA (400 nM) application (bottom trace).
Inset: magnification of a representative simil-interictal epileptiform event.
B) The histograms report the mean value for frequency, duration and depolarization amplitude of the
up-states in control condition (contr) and of the simil-interictal epileptiform events after 10 minutes of
ω-AgaIVA (Aga, 400 nM) application, measured in current clamp recordings of spontaneous recurrent
cortical activity from layer 2/3 pyramidal cells of somatosensory cortex in acute slice obtained from
P16-19 old WT mice (n=6 slices). *** = p < 0.001.
The mean frequency measured in a larger sample, including also voltage clamp recordings, provides a
similar results: 1.4 ± 0.1 min-1 in control versus 1.3 ± 0.2, min-1 in ω-AgaIVA, n=23 slices.
3 s10
mV
3 s10
mV
control
ω-AgaIVA
3 s10
mV
3 s10
mV
3 s
10
mV
0,3 s
0,0
0,5
1,0
1,5
2,0
2,5
6 66 6control +AgaIVA
control +AgaIVA
freq
uen
cy (
min
-1)
----
frequenza frequenza durata durata ampiezza ampiezza--
exp controllo +Aga controllo +Aga controllo +Aga
A CC0018B 0,57 0,82 5,92 0,43 22,57 59,20
B CC0030A 2,03 1,67 5,36 0,38 20,27 57,09
C SD139C 1,50 2,30 5,34 0,35 20,20 58,65
D SD141A 1,90 1,78 4,86 0,28 13,39 53,86
N 4 4 4 4 4 4
MEDIA 1,50 1,64 5,37 0,36 19,11 57,20
SEM 0,33 0,31 0,22 0,03 1,98 1,20
AGA inibizione up states
control +AgaIVA
4 40,0
0,5
1,0
1,5
2,0***
du
rati
on
(s)
0
10
20
30
40
50
60
dep
ola
rizati
on
am
plitu
de (
mV
)
0,0
0,5
1,0
1,5
2,0
2,5
6 6 6 6
control +AgaIVAcontrol +AgaIVA
freq
uen
cy (
min
-1)
----
frequenza frequenza durata durata ampiezza ampiezza--
exp controllo +Aga controllo +Aga controllo +Aga
A CC0018B 0,57 0,82 5,92 0,43 22,57 59,20
B CC0030A 2,03 1,67 5,36 0,38 20,27 57,09
C SD139C 1,50 2,30 5,34 0,35 20,20 58,65
D SD141A 1,90 1,78 4,86 0,28 13,39 53,86
N 4 4 4 4 4 4
MEDIA 1,50 1,64 5,37 0,36 19,11 57,20
SEM 0,33 0,31 0,22 0,03 1,98 1,20
AGA inibizione up states
control +AgaIVA
4 40
1
2
3
4
5
6***
du
rati
on
(s)
***
0
10
20
30
40
50
60
dep
ola
rizati
on
am
plitu
de (
mV
)
contr Aga
du
rati
on
(s)
contr Aga
de
po
lari
zati
on
am
plit
ud
e (m
V)
fre
qu
en
cy
(eve
nts
/min
)
contr Aga 0,0
0,5
1,0
1,5
2,0
2,5
6 66 6control +AgaIVA
control +AgaIVA
freq
uen
cy (
min
-1)
----
frequenza frequenza durata durata ampiezza ampiezza--
exp controllo +Aga controllo +Aga controllo +Aga
A CC0018B 0,57 0,82 5,92 0,43 22,57 59,20
B CC0030A 2,03 1,67 5,36 0,38 20,27 57,09
C SD139C 1,50 2,30 5,34 0,35 20,20 58,65
D SD141A 1,90 1,78 4,86 0,28 13,39 53,86
N 4 4 4 4 4 4
MEDIA 1,50 1,64 5,37 0,36 19,11 57,20
SEM 0,33 0,31 0,22 0,03 1,98 1,20
AGA inibizione up states
control +AgaIVA
4 40,0
0,5
1,0
1,5
2,0***
du
rati
on
(s)
0
10
20
30
40
50
60
dep
ola
rizati
on
am
plitu
de (
mV
)
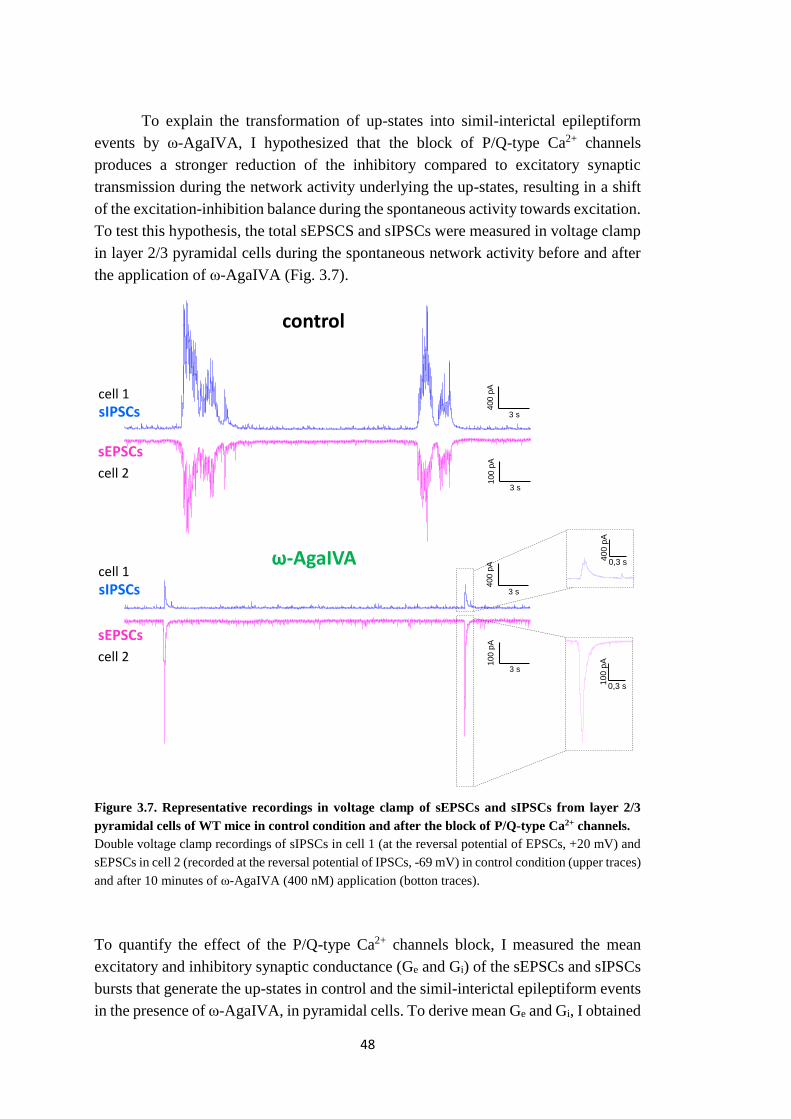
48
To explain the transformation of up-states into simil-interictal epileptiform
events by ω-AgaIVA, I hypothesized that the block of P/Q-type Ca2+ channels
produces a stronger reduction of the inhibitory compared to excitatory synaptic
transmission during the network activity underlying the up-states, resulting in a shift
of the excitation-inhibition balance during the spontaneous activity towards excitation.
To test this hypothesis, the total sEPSCS and sIPSCs were measured in voltage clamp
in layer 2/3 pyramidal cells during the spontaneous network activity before and after
the application of ω-AgaIVA (Fig. 3.7).
Figure 3.7. Representative recordings in voltage clamp of sEPSCs and sIPSCs from layer 2/3
pyramidal cells of WT mice in control condition and after the block of P/Q-type Ca2+ channels.
Double voltage clamp recordings of sIPSCs in cell 1 (at the reversal potential of EPSCs, +20 mV) and
sEPSCs in cell 2 (recorded at the reversal potential of IPSCs, -69 mV) in control condition (upper traces)
and after 10 minutes of ω-AgaIVA (400 nM) application (botton traces).
To quantify the effect of the P/Q-type Ca2+ channels block, I measured the mean
excitatory and inhibitory synaptic conductance (Ge and Gi) of the sEPSCs and sIPSCs
bursts that generate the up-states in control and the simil-interictal epileptiform events
in the presence of ω-AgaIVA, in pyramidal cells. To derive mean Ge and Gi, I obtained
3 s
400 p
A
3 s
100 p
A
0,3 s40
0 p
A
0,3 s10
0 p
A0,3 s4
00
pA
0,3 s10
0 p
A
3 s
400 p
A3 s
100 p
A
sEPSCs
cell 2
sIPSCs
cell 1
sEPSCs
cell 2
sIPSCs
cell 1
control
ω-AgaIVA
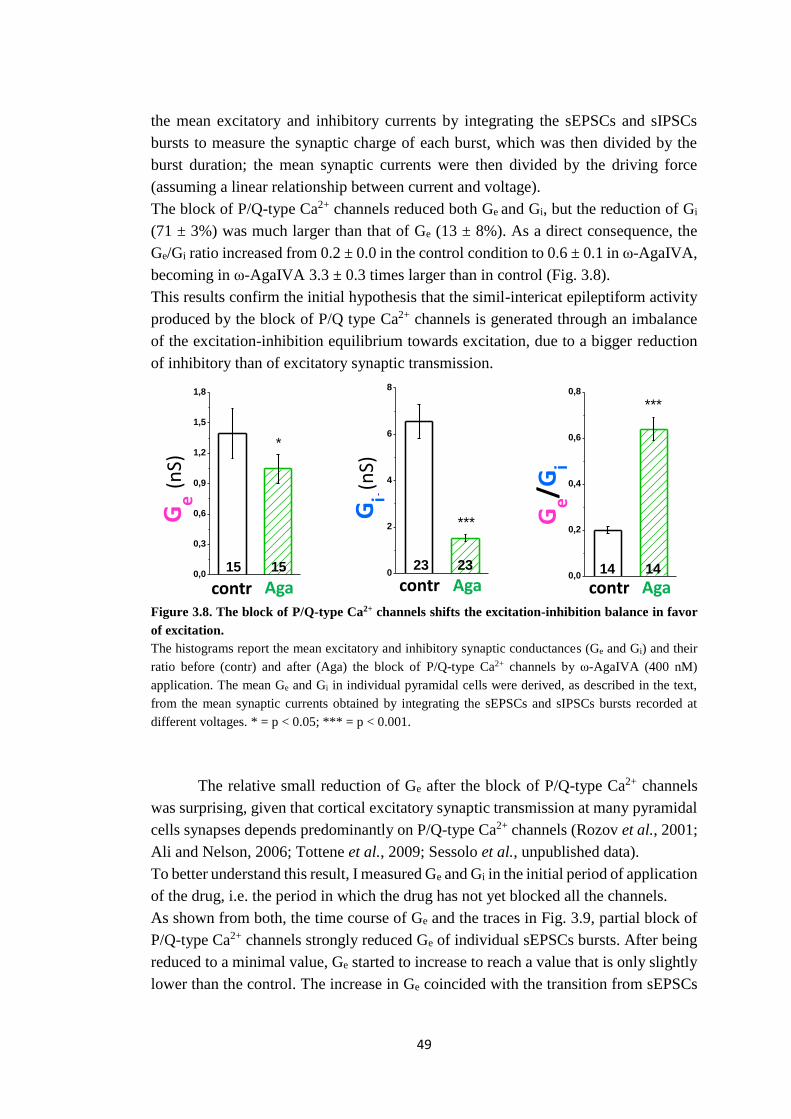
49
the mean excitatory and inhibitory currents by integrating the sEPSCs and sIPSCs
bursts to measure the synaptic charge of each burst, which was then divided by the
burst duration; the mean synaptic currents were then divided by the driving force
(assuming a linear relationship between current and voltage).
The block of P/Q-type Ca2+ channels reduced both Ge and Gi, but the reduction of Gi
(71 ± 3%) was much larger than that of Ge (13 ± 8%). As a direct consequence, the
Ge/Gi ratio increased from 0.2 ± 0.0 in the control condition to 0.6 ± 0.1 in ω-AgaIVA,
becoming in ω-AgaIVA 3.3 ± 0.3 times larger than in control (Fig. 3.8).
This results confirm the initial hypothesis that the simil-intericat epileptiform activity
produced by the block of P/Q type Ca2+ channels is generated through an imbalance
of the excitation-inhibition equilibrium towards excitation, due to a bigger reduction
of inhibitory than of excitatory synaptic transmission.
Figure 3.8. The block of P/Q-type Ca2+ channels shifts the excitation-inhibition balance in favor
of excitation.
The histograms report the mean excitatory and inhibitory synaptic conductances (Ge and Gi) and their
ratio before (contr) and after (Aga) the block of P/Q-type Ca2+ channels by ω-AgaIVA (400 nM)
application. The mean Ge and Gi in individual pyramidal cells were derived, as described in the text,
from the mean synaptic currents obtained by integrating the sEPSCs and sIPSCs bursts recorded at
different voltages. * = p < 0.05; *** = p < 0.001.
The relative small reduction of Ge after the block of P/Q-type Ca2+ channels
was surprising, given that cortical excitatory synaptic transmission at many pyramidal
cells synapses depends predominantly on P/Q-type Ca2+ channels (Rozov et al., 2001;
Ali and Nelson, 2006; Tottene et al., 2009; Sessolo et al., unpublished data).
To better understand this result, I measured Ge and Gi in the initial period of application
of the drug, i.e. the period in which the drug has not yet blocked all the channels.
As shown from both, the time course of Ge and the traces in Fig. 3.9, partial block of
P/Q-type Ca2+ channels strongly reduced Ge of individual sEPSCs bursts. After being
reduced to a minimal value, Ge started to increase to reach a value that is only slightly
lower than the control. The increase in Ge coincided with the transition from sEPSCs
contr Aga
Ge (n
S)
0,0
0,3
0,6
0,9
1,2
1,5
1,8
15 15
control AgaIVA
23 23
Ge
(n
S)
control AgaIVA
15 150
2
4
6
8
*
Gi
(nS
)
***
contr Aga
Ge/G
i
0,0
0,2
0,4
0,6
0,8
***
rati
o Ie
xc
/ Iin
hib
control AgaIVA
Iexc / Iinhib
14 140,0
0,5
1,0
1,5
2,0
2,5
3,0
3,5
4,0
contr Aga
Gi (n
S)
0,0
0,3
0,6
0,9
1,2
1,5
1,8
15 15
control AgaIVA
23 23
Ge
(n
S)
control AgaIVA
15 150
2
4
6
8
*
Gi
(nS
)
***

50
bursts resembling those underlying the up-states to a different type of network activity,
that eventually leads to that underlying the simil-interictal epileptiform events.
Figure 3.9. Immediately after addition of ω-AgaIVA, Ge of individual sEPSCs bursts was
inhibited.
The upper graph shows the time course of changes in Ge of individual sEPSCs bursts after addition of
ω-AgaIVA (400 nM), in a representative voltage clamp recording from a layer 2/3 pyramidal cell at -
69 mV: the black points represent up-state-generating events; the gray points represent events that
eventually result in simil-interictal epileptiform discharges. The bottom traces are representative
sEPSCs bursts.
Double voltage-clamp recordings, to record simultaneously the sEPSCs and sIPSCs
bursts in two cells, show that the transition from sPSCs bursts to a different type of
network activity occurs when Ge/Gi increases above a critical value (Fig. 3.10). During
this transition, ω-AgaIVA strongly reduced both Ge and Gi (Fig. 3.10A); after a brief
period in which Ge and Gi decreased in parallel and the excitation-inhibition balance
remained unaltered, Gi was reduced relatively more than Ge and, as a consequence, the
Ge/Gi ratio progressively increases. When this ratio reached a critical value, 2.2 ± 0.1
times larger than the control (n=7 slices), the network activity changed and Ge started
to increase reaching a value similar to that in control. At this time, Ge was reduced by
53 ± 6% while Gi was reduced by 74 ± 4% (Fig. 3.10B).
0,5 s
20
0 p
A
2 s
100 p
A
1 s
50 p
A
0 10 20 30 40 50
0
250
500
750
1000
0 10 20 30 40
0,0
0,5
1,0
1,5
2,0
AgaIVA
I ex
c
time (min)0,5 s2
00
pA
2 s
100 p
A
1 s
50 p
A
Ge (
nS)
ω-AgaIVA
0,5 s
20
0 p
A
1 s
50 p
A
1 s
50 p
A
0,5 s
20
0 p
A
2 s
100 p
A
2 s
100 p
A
1 s
50 p
A
sEPSCs
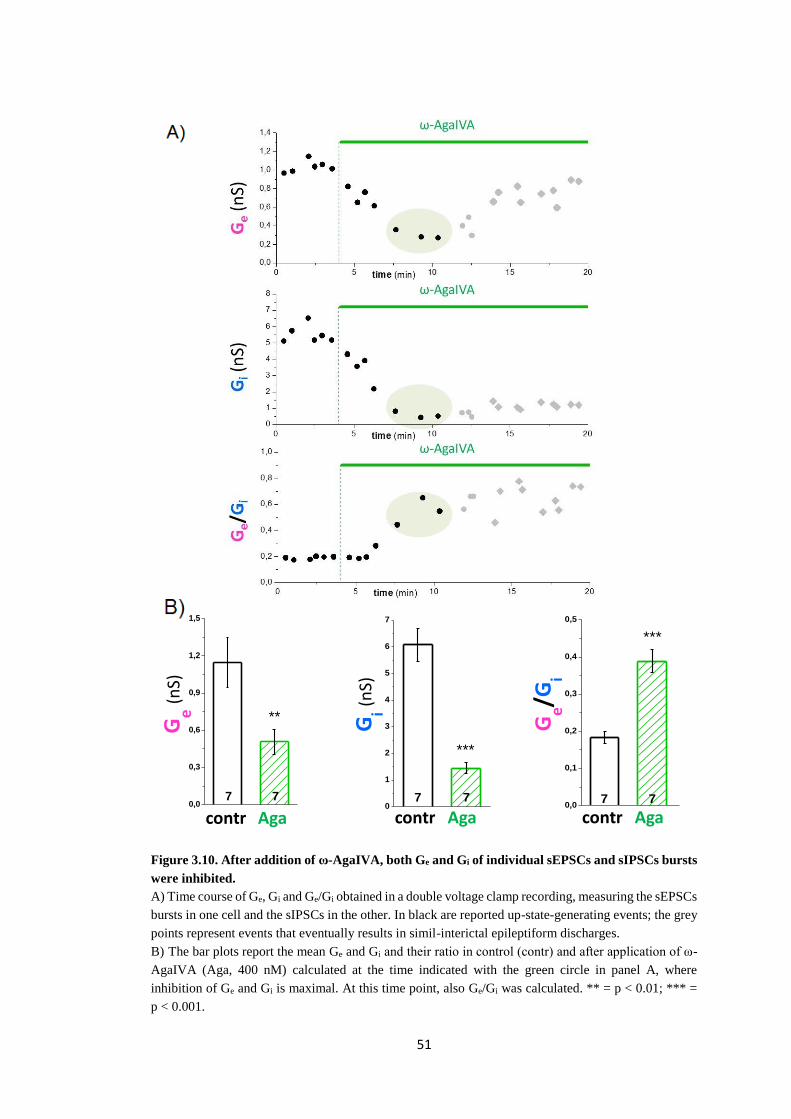
51
Figure 3.10. After addition of ω-AgaIVA, both Ge and Gi of individual sEPSCs and sIPSCs bursts
were inhibited.
A) Time course of Ge, Gi and Ge/Gi obtained in a double voltage clamp recording, measuring the sEPSCs
bursts in one cell and the sIPSCs in the other. In black are reported up-state-generating events; the grey
points represent events that eventually results in simil-interictal epileptiform discharges.
B) The bar plots report the mean Ge and Gi and their ratio in control (contr) and after application of ω-
AgaIVA (Aga, 400 nM) calculated at the time indicated with the green circle in panel A, where
inhibition of Ge and Gi is maximal. At this time point, also Ge/Gi was calculated. ** = p < 0.01; *** =
p < 0.001.
0,0
0,1
0,2
0,3
0,4
0,5
7 7 7
rati
o Iexc / Iin
hib
exp controllo +Agavariazione in aga di Iecc/Ii
nib
A CC014A 0,20 0,47 2,28
B CC015A 0,16 0,40 2,53
C CC017B 0,15 0,29 1,72
V CC34B 0,20 0,43 2,17
X CC35C 0,14 0,26 1,85
Y CC37A 0,17 0,46 2,67
Z CC37C 0,26 0,42 1,61
N 7 7 7
MEDIA 0,18 0,39 2,15
SEM 0,01623 0,03064 0,14401
p 1,786 *10^-4
Iecc/Iinib: controllo vs pre misto-steady steate
control AgaIVA
***
0,0
0,5
1,0
1,5
2,0
2,5
3,0
Ag
a/c
on
tro
l Iexc
/Iin
hib
contr Aga
Ge/G
i
contr Aga
Ge (n
S)
0,0
0,3
0,6
0,9
1,2
1,5
8 87 7
**
***
controllo +AgaIVA
I e
xc
corrente media (Ab/tb): controllo vs pre misto-steady state
controllo +AgaIVA
0
1
2
3
4
5
6
7
I in
hib
contr Aga
Gi (n
S)
0,0
0,3
0,6
0,9
1,2
1,5
7 77 7
**
***
controllo +AgaIVA
I e
xc
corrente media (Ab/tb): controllo vs pre misto-steady state
controllo +AgaIVA
0
1
2
3
4
5
6
7
I in
hib
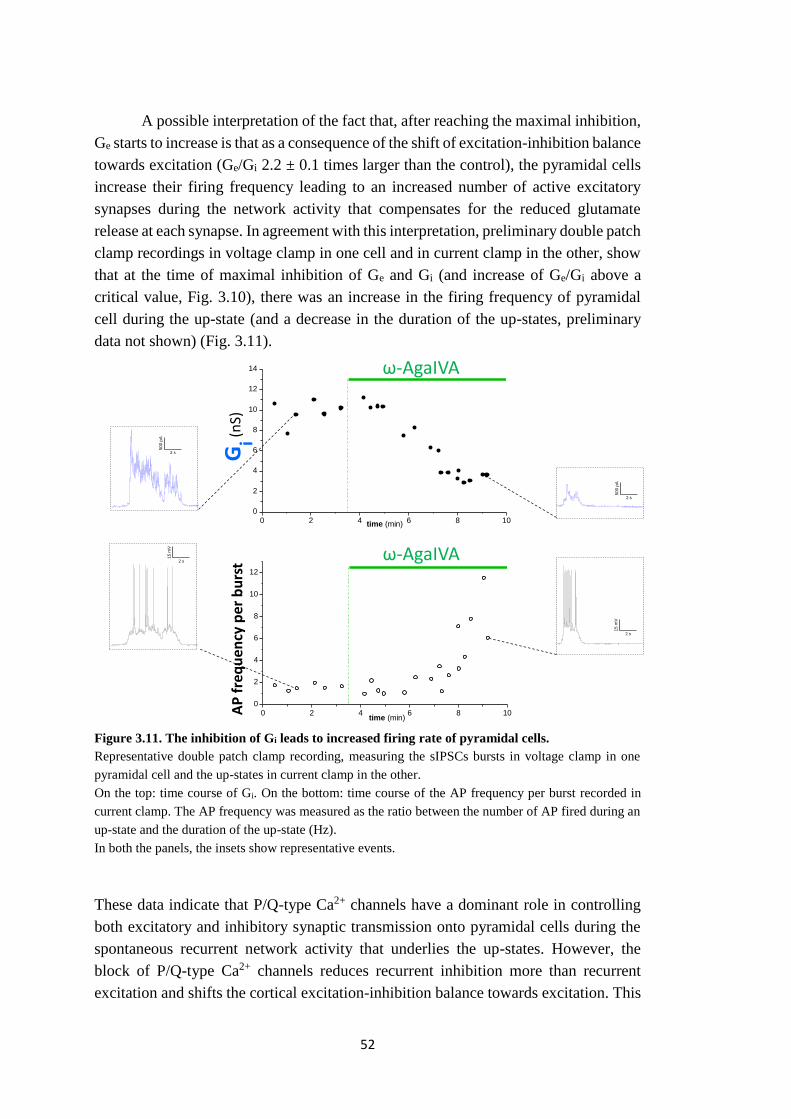
52
A possible interpretation of the fact that, after reaching the maximal inhibition,
Ge starts to increase is that as a consequence of the shift of excitation-inhibition balance
towards excitation (Ge/Gi 2.2 ± 0.1 times larger than the control), the pyramidal cells
increase their firing frequency leading to an increased number of active excitatory
synapses during the network activity that compensates for the reduced glutamate
release at each synapse. In agreement with this interpretation, preliminary double patch
clamp recordings in voltage clamp in one cell and in current clamp in the other, show
that at the time of maximal inhibition of Ge and Gi (and increase of Ge/Gi above a
critical value, Fig. 3.10), there was an increase in the firing frequency of pyramidal
cell during the up-state (and a decrease in the duration of the up-states, preliminary
data not shown) (Fig. 3.11).
Figure 3.11. The inhibition of Gi leads to increased firing rate of pyramidal cells.
Representative double patch clamp recording, measuring the sIPSCs bursts in voltage clamp in one
pyramidal cell and the up-states in current clamp in the other.
On the top: time course of Gi. On the bottom: time course of the AP frequency per burst recorded in
current clamp. The AP frequency was measured as the ratio between the number of AP fired during an
up-state and the duration of the up-state (Hz).
In both the panels, the insets show representative events.
These data indicate that P/Q-type Ca2+ channels have a dominant role in controlling
both excitatory and inhibitory synaptic transmission onto pyramidal cells during the
spontaneous recurrent network activity that underlies the up-states. However, the
block of P/Q-type Ca2+ channels reduces recurrent inhibition more than recurrent
excitation and shifts the cortical excitation-inhibition balance towards excitation. This
ω-AgaIVA
AP
fre
qu
ency
per
bu
rst 2 s
15
mV
2 s
50
0 p
A
0 2 4 6 8 10
0
2
4
6
8
10
12
AgaIVA
AP
fre
qu
en
cy p
er
bu
rst
time (min)
B
B
Control
fsetransbu
CC30A. current clamp
AP/tb
0 2 4 6 8 10
0
2
4
6
8
10
12
14
0 10 20 30 40 50
0
2
4
6
8
10
12
time (min)
AgaIVA
I in
hib p
C/s
Control
BurstAga
IleAga
fsetransbu
2 s
15 m
V
2 s
500 p
A
Gi (
nS)
2 s
15 m
V
2 s
500 p
A
2 s
15 m
V
2 s
500 p
A
ω-AgaIVA
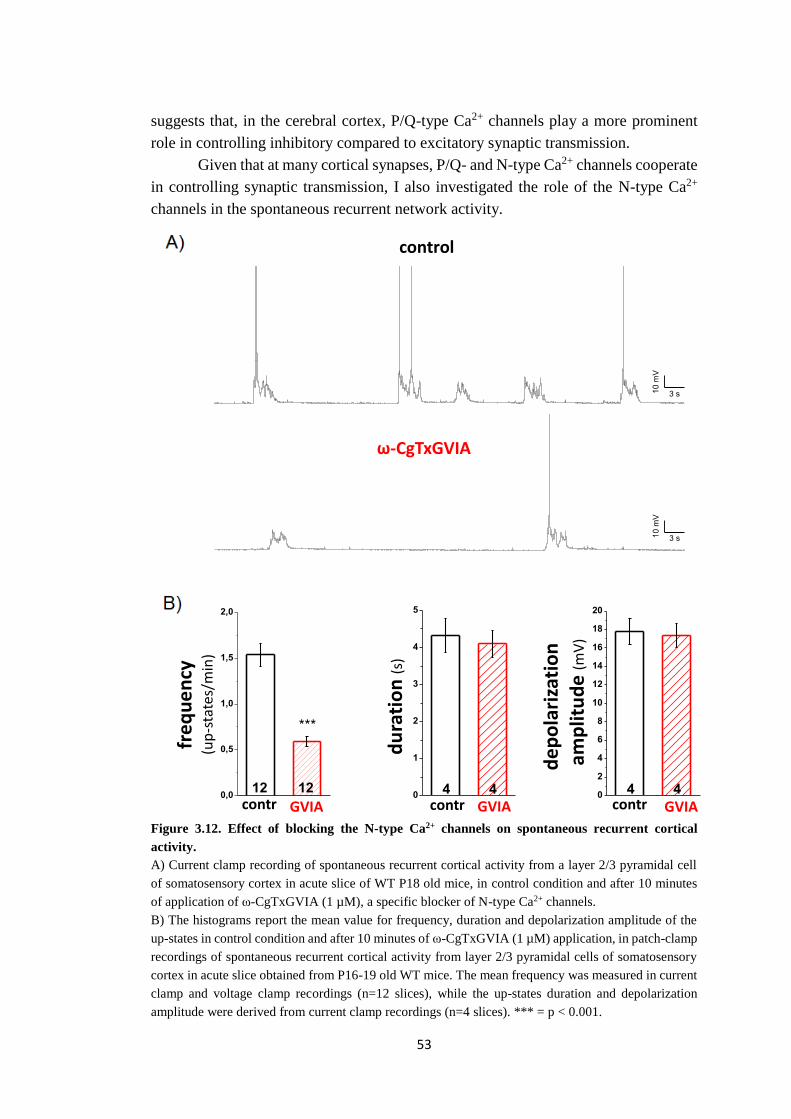
53
suggests that, in the cerebral cortex, P/Q-type Ca2+ channels play a more prominent
role in controlling inhibitory compared to excitatory synaptic transmission.
Given that at many cortical synapses, P/Q- and N-type Ca2+ channels cooperate
in controlling synaptic transmission, I also investigated the role of the N-type Ca2+
channels in the spontaneous recurrent network activity.
Figure 3.12. Effect of blocking the N-type Ca2+ channels on spontaneous recurrent cortical
activity.
A) Current clamp recording of spontaneous recurrent cortical activity from a layer 2/3 pyramidal cell
of somatosensory cortex in acute slice of WT P18 old mice, in control condition and after 10 minutes
of application of ω-CgTxGVIA (1 µM), a specific blocker of N-type Ca2+ channels.
B) The histograms report the mean value for frequency, duration and depolarization amplitude of the
up-states in control condition and after 10 minutes of ω-CgTxGVIA (1 µM) application, in patch-clamp
recordings of spontaneous recurrent cortical activity from layer 2/3 pyramidal cells of somatosensory
cortex in acute slice obtained from P16-19 old WT mice. The mean frequency was measured in current
clamp and voltage clamp recordings (n=12 slices), while the up-states duration and depolarization
amplitude were derived from current clamp recordings (n=4 slices). *** = p < 0.001.
3 s10
mV
3 s10
mV
3 s10
mV
3 s10
mV
ω-CgTxGVIA
control
GVIA contr GVIA
fre
qu
en
cy
(up
-sta
tes/
min
)
contr
du
rati
on
(s)
contr 0,0
0,5
1,0
1,5
2,0
2,5
3,0
4 44 4control +GVIAcontrol +GVIA
fre
qu
en
cy (
up
sta
te/m
in)
--
GVIA inibizione up states
control +GVIA
4 4
*
0
1
2
3
4
5
du
rati
on
(sec)
0
2
4
6
8
10
12
14
16
18
20
am
plitu
de (
mV
)
0,0
0,5
1,0
1,5
2,0
2,5
3,0
4 44 4control +GVIAcontrol +GVIA
fre
qu
en
cy (
up
sta
te/m
in)
--
GVIA inibizione up states
control +GVIA
4 4
*
0
1
2
3
4
5
du
rati
on
(sec)
0
2
4
6
8
10
12
14
16
18
20
am
plitu
de (
mV
)
GVIA
de
po
lari
zati
on
am
plit
ud
e (m
V)
0,0
0,5
1,0
1,5
2,0
10 10control +GVIAcontrol +GVIA
fre
qu
en
cy (
bu
rst/
min
)
--
--
--
--
--
--
--
GVIA inibizione BURST eccitatorio
control +GVIA
***
12 120
1
2
3
4
5
6
7
8
9
*
du
rati
on
(sec)
0,0
0,2
0,4
0,6
0,8
1,0
1,2
10 10
Ge (
nS
)
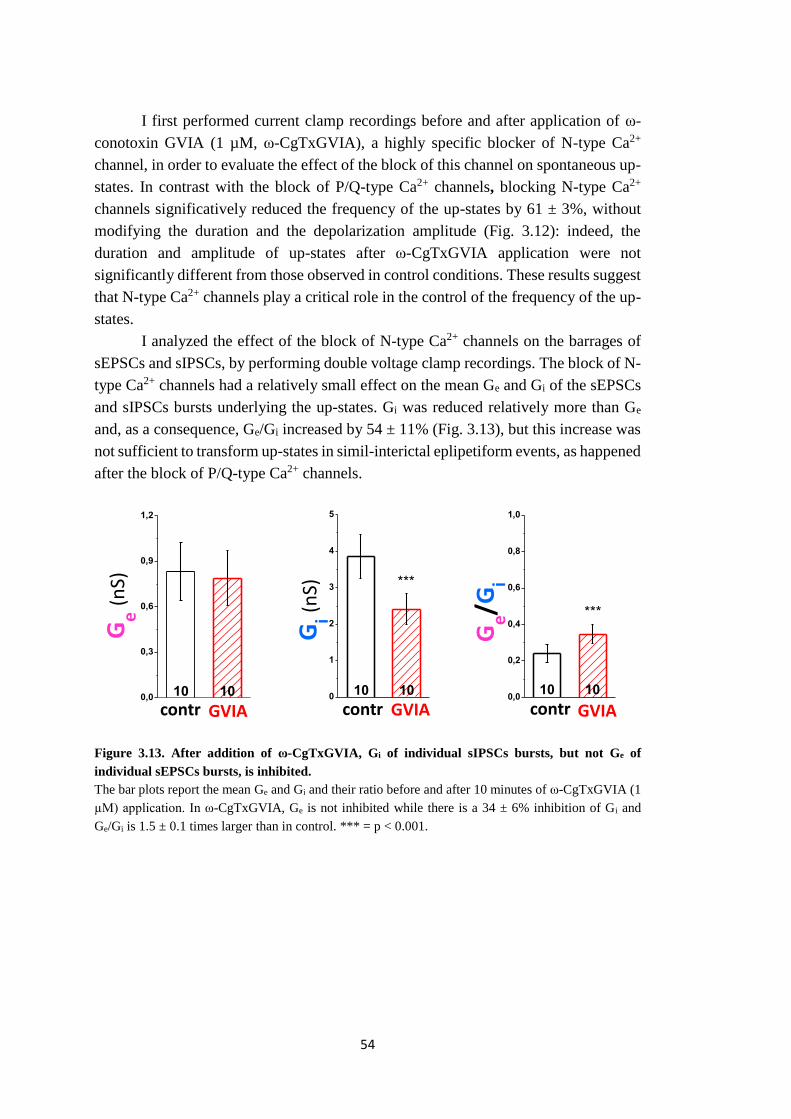
54
I first performed current clamp recordings before and after application of ω-
conotoxin GVIA (1 µM, ω-CgTxGVIA), a highly specific blocker of N-type Ca2+
channel, in order to evaluate the effect of the block of this channel on spontaneous up-
states. In contrast with the block of P/Q-type Ca2+ channels, blocking N-type Ca2+
channels significatively reduced the frequency of the up-states by 61 ± 3%, without
modifying the duration and the depolarization amplitude (Fig. 3.12): indeed, the
duration and amplitude of up-states after ω-CgTxGVIA application were not
significantly different from those observed in control conditions. These results suggest
that N-type Ca2+ channels play a critical role in the control of the frequency of the up-
states.
I analyzed the effect of the block of N-type Ca2+ channels on the barrages of
sEPSCs and sIPSCs, by performing double voltage clamp recordings. The block of N-
type Ca2+ channels had a relatively small effect on the mean Ge and Gi of the sEPSCs
and sIPSCs bursts underlying the up-states. Gi was reduced relatively more than Ge
and, as a consequence, Ge/Gi increased by 54 ± 11% (Fig. 3.13), but this increase was
not sufficient to transform up-states in simil-interictal eplipetiform events, as happened
after the block of P/Q-type Ca2+ channels.
Figure 3.13. After addition of ω-CgTxGVIA, Gi of individual sIPSCs bursts, but not Ge of
individual sEPSCs bursts, is inhibited.
The bar plots report the mean Ge and Gi and their ratio before and after 10 minutes of ω-CgTxGVIA (1
µM) application. In ω-CgTxGVIA, Ge is not inhibited while there is a 34 ± 6% inhibition of Gi and
Ge/Gi is 1.5 ± 0.1 times larger than in control. *** = p < 0.001.
0,0
0,2
0,4
0,6
0,8
1,0
***
10
Ie
xc /
Iin
hib
commenti
forse burst non speculari, attività asincrona intensa
--
Ra ecc varia
Ra inib varia
--
--
burst non speculari
burst inib piccoli,attività asincrona elevata
Ra ecc varia
GVIA inibizione BURST Iecc/Iinib
control +GVIA
10 10 0,0
0,5
1,0
1,5
2,0
rati
o G
e/G
i
Ge/G
i
contr GVIA
A
B
C
D
E
F
GH
I
J
K
L
A
B
C
D
E
F
G
H
I
J
K
L
A
B
C
D
E
F
G
H
I
K
L
A
B
C
D
E
F
GH
I
K
L
0
2
4
control +GVIA+GVIAcontrollo+GVIA
fre
qu
en
za (
up
sta
te/m
in)
--
--
--
--
--
--
--
GVIA inibizione BURST inibitorio
controllo0
2
4
6
8
10
12
du
rata
(se
c)
0
1
2
3
4
5
***
10 10
Gin
hib
(n
S)
contr GVIA
Gi (n
S)
Ge (n
S)
contr GVIA 0,0
0,5
1,0
1,5
2,0
10 10
control +GVIA
control +GVIA
fre
qu
en
cy (
bu
rst/
min
)
--
--
--
--
--
--
--
GVIA inibizione BURST eccitatorio
control +GVIA
***
12 120
1
2
3
4
5
6
7
8
9
*
du
rati
on
(sec)
0,0
0,3
0,6
0,9
1,2
10 10
Ge (
nS
)
55
6. Discussion (I)
I investigated the effect of blocking P/Q- and N-type Ca2+ channels on the
spontaneous up-states, recorded from layer 2/3 pyramidal neurons in acute cortical
slices, that resemble slow oscillation in vivo (Steriade et al., 1993). To facilitate the
occurrence of spontaneous up-states, the slices were maintained in an extracellular
solution with ionic composition mimicking that of the brain cerebrospinal fluid, with
relatively high K+ and low Ca2+ and Mg2+ concentrations (see details in Materials and
Methods, paragraph 8.4.4.1; Sanchez-Vives and McCormick, 2000; Rigas and
Castros-Alamancos, 2007), and a high perfusion flux was used to maximize slice
oxygenation (Hájos et al., 2009). Under these conditions, I was able to record
spontaneous up-states occurring at 1.6 ± 0.1 min-1, with a duration of 5.3 ± 0.3 seconds
and a depolarization amplitude of 16.7 ± 0.7 mV. The mean frequency of up-states
occurrence is lower and the mean duration of the up-states is larger in my recordings
than those reported in vivo (Steriade et al., 1993; Sanchez-Vives and McCormick,
2000; Fellin et al., 2009). Given the evidence that the thalamus actively contributes to
the generation of the slow oscillation (Crunelli and Hughes, 2010; Crunelli et al., 2015;
David et al., 2013; Lemieux et al., 2014), the fact that the thalamocortical connections
are cut in coronal slices likely contributes to the lower frequency of up-states. In
addition, the differences in frequency and duration of the up-states probably in part
reflect the fact that my recordings were performed at room temperature, unlike
physiological temperature in the studies in vivo (Steriade et al., 1993; Sanchez-Vives
and McCormick, 2000; Haider et al., 2006; Fellin et al., 2009) and the higher
temperature used in some studies in vitro (33-36°C; Sanchez-Vives and McCormick,
2000; Shu et al., 2003; Rigas and Castros-Alamancos, 2007; Wester and Contreras,
2012). Indeed, in a recent study on ferret cortical slices, the up-states frequency
decreased while the up-states duration increased when the temperature was lowered
from a physiological temperature of 36°C to 32°C (Reig et al., 2010).
In agreement with previous studies, I showed that the block of NMDA and
AMPA receptors suppresses spontaneous cortical up-states (McCormick et al., 2003;
Seamans et al., 2003; Favero and Castro-Alamancos, 2013), indicating that the up-
states depend critically on the excitation provided by both NMDA and AMPA
receptors. I also showed that Cd2+ application, which blocks all the voltage-gated Ca2+
channels and hence the synaptic transmission, completely abolishes the up-states.
These results are consistent with the evidence that the up-states are driven by large
synchronous barrages of sEPSCs and sIPSCs, arising from correlated activity of a large
population of presynaptic connected neurons generated through recurrent synaptic
network activity within cortical circuitry (Petersen et al., 2003; Shu et al., 2003;
Sanchez-Vives and McCormick, 2000; Haider et al., 2006; Wilson, 2008; Okun and
Lampl, 2008).
56
Given that at many cortical synapses neurotransmitter release and synaptic
transmission are predominantly mediated by P/Q- and N- type Ca2+ channels, the
network silencing by Cd2+ application points toward a critical role of these two
voltage-gated Ca2+ channels in the generation and/or expression of spontaneous up-
states in slices. Uncovering the role of P/Q-type Ca2+ channels is particularly
interesting since gain-of-function mutations in the gene encoding the pore forming
subunit of P/Q-type Ca2+ channel are associated with FHM1, a rare form of autosomal
dominant subtype of migraine with aura (Pietrobon and Moskowitz, 2013). KI mice
carrying the R192Q mutation show an increased Ca2+ influx through P/Q-type Ca2+
channels in neurons, including cortical pyramidal cells, and an increased probability
of glutamate release at cortical pyramidal cells synapses (Pietrobon, 2010; Tottene e
al., 2009). It was recently found in our laboratory that the frequency of the up-states,
recorded in acute cortical slices, is increased in FHM1 KI mice (Fabbro, Sessolo,
Vecchia and Pietrobon, manuscript in preparation). As up-states are synaptically
generated, the increased frequency in FHM1 KI mice is consistent with the hypothesis
that the enhanced glutamate release may lead to an increased probability of sEPSCs
summation, due to an increase in the frequency of sEPSCs.
By comparing the activity before and after application of ω-agatoxin IVA (a
specific pharmacological blockers of P/Q-type Ca2+ channel; ω-AgaIVA), I showed
that the block of P/Q-type Ca2+ channels transforms the up-states into events
resembling interictal epileptiform discharges. The evaluation of the mean excitatory
and inhibitory synaptic conductances (Ge and Gi) during the control up-states and the
simil-interictal epileptiform events in ω-agaIVA, demonstrated that this change in the
network activity occurs when Ge/Gi increases above a critical value (3.3 ± 0.3 times
larger than in control), as a consequence of a larger reduction of recurrent inhibition
than of recurrent excitation, by P/Q-type Ca2+ channels blocker (13 ± 8% inhibition of
Ge and 71 ± 3% of Gi). Given that cortical excitatory synaptic transmission at many
pyramidal cells synapses depends predominantly on P/Q-type Ca2+ channels
(Pietrobon, 2010; Ali and Nelson, 2006; Tottene et al., 2009; Zaitsev et al., 2007;
Rozov et al., 2001), the small reduction of Ge was surprising. However, by evaluating
the fraction of inhibition of Ge and Gi in the initial period of application of the blocker,
I showed that 1) both Ge and Gi are strongly reduced when only a fraction of P/Q-type
Ca2+ channels are blocked, but Gi is reduced relatively more than Ge (53 ± 6% and 74
± 4% maximal inhibition of Ge and Gi respectively); 2) after reaching the maximal
inhibition, Ge starts to increase toward a value similar to that in control condition. A
possible explanation for this observation comes from preliminary findings of an
increased firing rate of pyramidal cells at the time of maximal inhibition of Ge. The
increase in pyramidal cell firing frequency might lead to an increased number of active
excitatory synapses during the network activity that compensates for the reduced
glutamate release at each synapse.
57
These results indicate that P/Q-type Ca2+ channels have a dominant role in controlling
both excitatory and inhibitory synaptic transmission onto pyramidal cells during the
spontaneous recurrent network activity that underlies the up-states. However, the
block of P/Q-type Ca2+ channels reduces recurrent inhibition more than recurrent
excitation and shifts the cortical excitation-inhibition balance towards excitation. This
suggests that, in the cerebral cortex, P/Q-type Ca2+ channels play a more prominent
role in controlling inhibitory compared to excitatory synaptic transmission. When, as
a consequence of the block of P/Q-type Ca2+ channels, Ge/Gi increases above a critical
value, the spontaneous network activity changes and the up-states are transformed into
events resembling simil-interictal epileptiform discharges.
The data are consistent with the hypothesis that impairment of cortical inhibitory
synaptic transmission may contribute to the generation of the epileptic phenotype in
spontaneous mouse mutants and humans with loss-of-function mutations in P/Q-type
Ca2+ channel (Pietrobon, 2007, 2010 and references therein). Actually, this is
supported by a recent study demonstrating that conditional ablation of P/Q-type Ca2+
channels in cortical interneurons results in severe generalized epilepsy, due to
impairment of GABA release from fast-spiking interneurons (Rossignol et al., 2013).
Interestingly, blocking N-type Ca2+ channels with ω-conotoxin GVIA (ω-
CgTxGVIA) has a completely different effect on spontaneous cortical activity. The
block of this channel, reduces the frequency of the up-states without changing up-
states duration and depolarization amplitude, indicating that N-type Ca2+ channels play
a critical role in controlling up-states frequency. By measuring Ge and Gi, I found that
the excitation-inhibition balance is less affected by block of N-type Ca2+ channels than
by block of P/Q-type Ca2+ channels: after the block of N-type Ca2+ channels, Ge/Gi
increases (1.5 ± 0.1 times larger in ω-CgTxGVIA than in control) but not sufficiently
to transform up-states in simil-interictal eplipetiform events.
These results suggest that the frequency of the up-states seems not to be correlated to
the Ge/Gi ratio measured in layer 2/3 pyramidal neurons during the up-states. Indeed,
in ω-AgaIVA there is not a change in the frequency of the events, even if the Ge/Gi
triplicates, conversely, in ω-CgTxGVIA, the small increase of the ratio is accompanied
to a large reduction of the up-states frequency. The data might suggest a different role
of N-type Ca2+ channels in cortical physiology in layer 2/3 and in the layer where
relevant cells for up-states generation are.

58
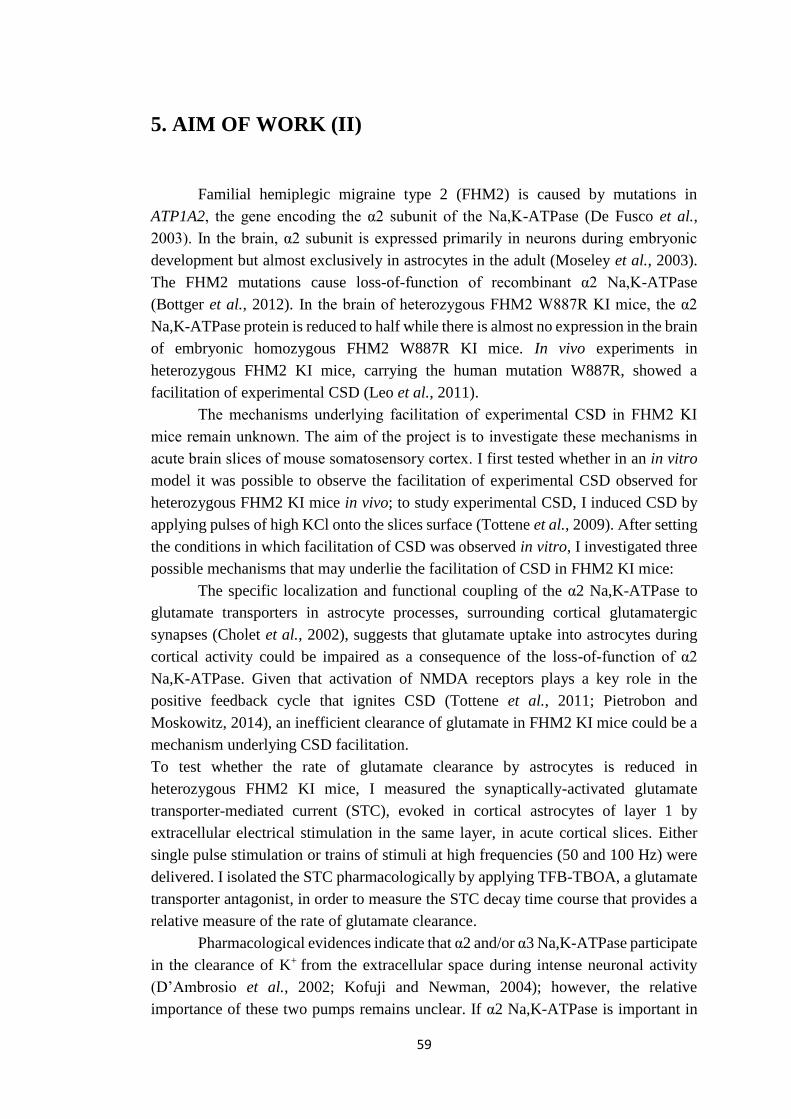
59
5. AIM OF WORK (II)
Familial hemiplegic migraine type 2 (FHM2) is caused by mutations in
ATP1A2, the gene encoding the α2 subunit of the Na,K-ATPase (De Fusco et al.,
2003). In the brain, α2 subunit is expressed primarily in neurons during embryonic
development but almost exclusively in astrocytes in the adult (Moseley et al., 2003).
The FHM2 mutations cause loss-of-function of recombinant α2 Na,K-ATPase
(Bottger et al., 2012). In the brain of heterozygous FHM2 W887R KI mice, the α2
Na,K-ATPase protein is reduced to half while there is almost no expression in the brain
of embryonic homozygous FHM2 W887R KI mice. In vivo experiments in
heterozygous FHM2 KI mice, carrying the human mutation W887R, showed a
facilitation of experimental CSD (Leo et al., 2011).
The mechanisms underlying facilitation of experimental CSD in FHM2 KI
mice remain unknown. The aim of the project is to investigate these mechanisms in
acute brain slices of mouse somatosensory cortex. I first tested whether in an in vitro
model it was possible to observe the facilitation of experimental CSD observed for
heterozygous FHM2 KI mice in vivo; to study experimental CSD, I induced CSD by
applying pulses of high KCl onto the slices surface (Tottene et al., 2009). After setting
the conditions in which facilitation of CSD was observed in vitro, I investigated three
possible mechanisms that may underlie the facilitation of CSD in FHM2 KI mice:
The specific localization and functional coupling of the α2 Na,K-ATPase to
glutamate transporters in astrocyte processes, surrounding cortical glutamatergic
synapses (Cholet et al., 2002), suggests that glutamate uptake into astrocytes during
cortical activity could be impaired as a consequence of the loss-of-function of α2
Na,K-ATPase. Given that activation of NMDA receptors plays a key role in the
positive feedback cycle that ignites CSD (Tottene et al., 2011; Pietrobon and
Moskowitz, 2014), an inefficient clearance of glutamate in FHM2 KI mice could be a
mechanism underlying CSD facilitation.
To test whether the rate of glutamate clearance by astrocytes is reduced in
heterozygous FHM2 KI mice, I measured the synaptically-activated glutamate
transporter-mediated current (STC), evoked in cortical astrocytes of layer 1 by
extracellular electrical stimulation in the same layer, in acute cortical slices. Either
single pulse stimulation or trains of stimuli at high frequencies (50 and 100 Hz) were
delivered. I isolated the STC pharmacologically by applying TFB-TBOA, a glutamate
transporter antagonist, in order to measure the STC decay time course that provides a
relative measure of the rate of glutamate clearance.
Pharmacological evidences indicate that α2 and/or α3 Na,K-ATPase participate
in the clearance of K+ from the extracellular space during intense neuronal activity
(D’Ambrosio et al., 2002; Kofuji and Newman, 2004); however, the relative
importance of these two pumps remains unclear. If α2 Na,K-ATPase is important in
60
this clearance, then its loss of function may results into an increase of extracellular K+
concentration during neuronal activity. Given that most models of CSD include local
increase of extracellular K+ concentration above a critical value as a key event for the
initiation of CSD (Pietrobon and Moskowitz, 2014), an inefficient clearance of K+
might lead to a facilitation of CSD.
In order to investigate if K+ clearance is reduced, I measured the decay time course of
the synaptically-activated K+ current, through Kir channels, evoked in cortical
astrocytes of layer 1 by electrical stimulation.
The tight coupling of α2 Na,K-ATPase with the Na+/Ca2+ exchanger at plasma
membrane microdomains that overlie the endoplasmic reticulum, suggests that Ca2+
homeostasis could be impaired as a consequence of the loss-of-function of α2 Na,K-
ATPase. Indeed, elevated levels of Ca2⁺ ions in the cytoplasm and in the endoplasmic
reticulum were measured in cultured astrocytes from ATP1A2-/- KO mice (Golovina et
al., 2003). An increased release of gliotransmitters, including glutamate, consequent
to increased release of Ca2+ from intracellular stores in response to synaptic activity
could be implicated in CSD facilitation.
I first investigated whether the Ca2+ content was increased in the Ca2+ stores. I obtained
an indirect measure of the amount of Ca2+ in the stores, by measuring in cultured
cortical astrocytes the Ca2+ transients induced by ionomycin in Ca2+-free medium.
I then performed measurements of the threshold for CSD induction and the velocity of
CSD propagation in acute cortical slices of FHM2 KI mice, before and after
application of cyclopiazonic acid (CPA), a SERCA inhibitor, which depletes the
intracellular Ca2+ stores preventing most of the release of gliotransmitters.
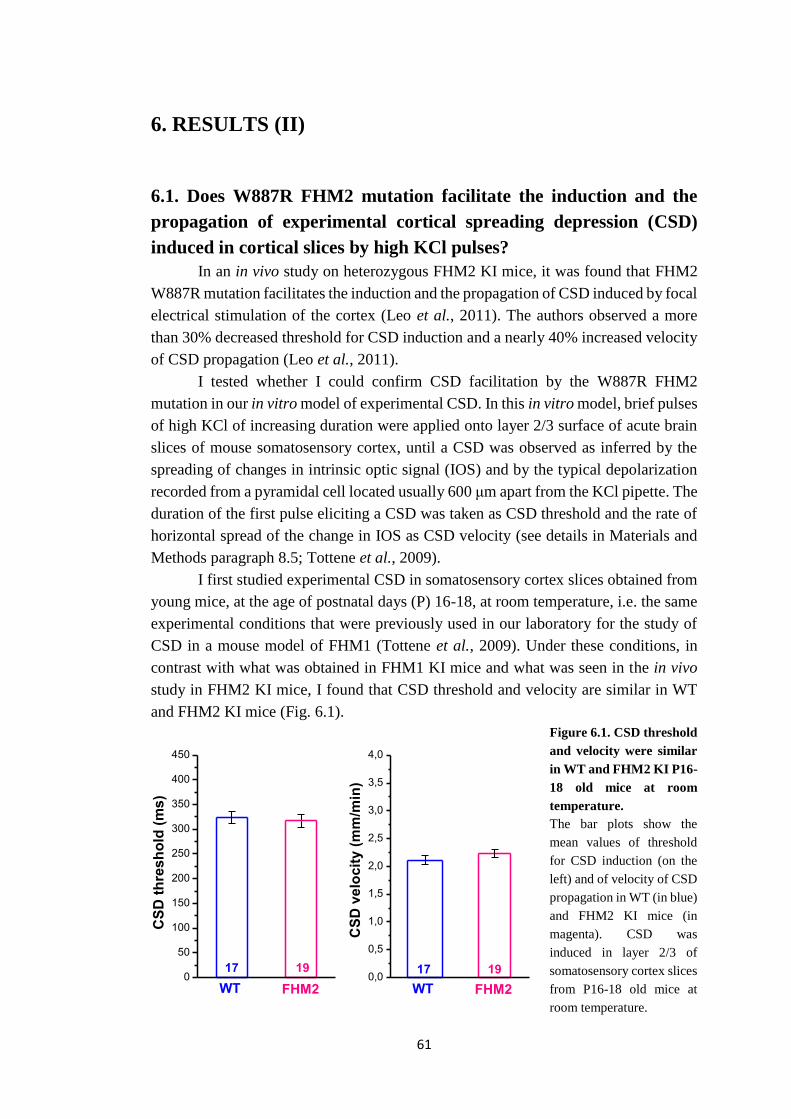
61
6. RESULTS (II)
6.1. Does W887R FHM2 mutation facilitate the induction and the
propagation of experimental cortical spreading depression (CSD)
induced in cortical slices by high KCl pulses?
In an in vivo study on heterozygous FHM2 KI mice, it was found that FHM2
W887R mutation facilitates the induction and the propagation of CSD induced by focal
electrical stimulation of the cortex (Leo et al., 2011). The authors observed a more
than 30% decreased threshold for CSD induction and a nearly 40% increased velocity
of CSD propagation (Leo et al., 2011).
I tested whether I could confirm CSD facilitation by the W887R FHM2
mutation in our in vitro model of experimental CSD. In this in vitro model, brief pulses
of high KCl of increasing duration were applied onto layer 2/3 surface of acute brain
slices of mouse somatosensory cortex, until a CSD was observed as inferred by the
spreading of changes in intrinsic optic signal (IOS) and by the typical depolarization
recorded from a pyramidal cell located usually 600 μm apart from the KCl pipette. The
duration of the first pulse eliciting a CSD was taken as CSD threshold and the rate of
horizontal spread of the change in IOS as CSD velocity (see details in Materials and
Methods paragraph 8.5; Tottene et al., 2009).
I first studied experimental CSD in somatosensory cortex slices obtained from
young mice, at the age of postnatal days (P) 16-18, at room temperature, i.e. the same
experimental conditions that were previously used in our laboratory for the study of
CSD in a mouse model of FHM1 (Tottene et al., 2009). Under these conditions, in
contrast with what was obtained in FHM1 KI mice and what was seen in the in vivo
study in FHM2 KI mice, I found that CSD threshold and velocity are similar in WT
and FHM2 KI mice (Fig. 6.1).
Figure 6.1. CSD threshold
and velocity were similar
in WT and FHM2 KI P16-
18 old mice at room
temperature. The bar plots show the
mean values of threshold
for CSD induction (on the
left) and of velocity of CSD
propagation in WT (in blue)
and FHM2 KI mice (in
magenta). CSD was
induced in layer 2/3 of
somatosensory cortex slices
from P16-18 old mice at
room temperature.
0
50
100
150
200
250
300
350
400
450
17 19
WT FHM2
17 19
CS
D t
hre
sh
old
(m
s)
FHM2WT0,0
0,5
1,0
1,5
2,0
2,5
3,0
3,5
4,0
2,11 ± 0,08 mm/min
2,23 ± 0,07 mm/min<=317 ± 19 ms
CS
D v
elo
cit
y (
mm
/min
)
<=324 ± 12 ms
Esperimenti su topi FHM2 giovani (P16 - P19)
200
250
300
350
400
450
So
glia
(m
s)
WT FHM2
1,5
2,0
2,5
3,0
3,5
Ve
locità
(m
m/m
in)
WT FHM2

62
In order to verify the hypothesis that the different findings in vitro and in vivo
were due to the different age of the animals (P16-18 versus adult) and/or to the
different temperature (room temperature versus physiological temperature), I repeated
the experiments first using mice of older age and then increasing the temperature.
In somatosensory cortex slices from one month old mice (P28-29), I observed a
significantly 13% lower threshold for CSD induction and also a 8% higher velocity of
CSD propagation in FHM2 KI mice than in WT mice (Fig. 6.2).
Figure 6.2. The threshold for CSD induction was lower and the velocity of CSD propagation was
higher in FHM2 KI mice compared to WT mice, in P28-29 old mice at room temperature.
The bar plots show the mean values of threshold for CSD induction (on the left) and of velocity of CSD
propagation in WT (in blue) and FHM2 KI mice (in magenta). CSD was induced in layer 2/3 of
somatosensory cortex slices, obtained from P28-29 old mice, at room temperature.
** = p < 0.01; *** = p < 0.001.
I tried older than one month old mice and I observed a small increase in the gain of
function effect of the mutation. Indeed, using P34-35 old mice, I observed a
significantly 20% lower threshold for CSD induction and a 20% higher velocity of
CSD propagation in FHM2 KI mice than in WT mice (Fig. 6.3).
These data are in agreement with the in vivo results, even though the difference
between WT and FHM2 KI mice were still smaller than those reported in the in vivo
study (Leo et al., 2011).
I then assessed the temperature effect carrying out the experiments at higher
temperature (30°C). Using P34-35 old mice and increasing the temperature, I found a
remarkable large increase of the gain of function effect of the mutation, with values
actually similar to the ones found in the in vivo study (Leo et al., 2011): I observed a
significantly 38% lower threshold for CSD induction and a 26% higher velocity of
CSD propagation in the FHM2 KI mice than in WT mice (Fig. 6.4).
0
50
100
150
200
250
300
26 27 26 27
CS
D v
elo
cit
y (
mm
/min
)
CS
D t
hre
sh
old
(m
s)
***
WT FHM2 WT FHM20,0
0,5
1,0
1,5
2,0
2,5
3,0
3,5
4,0
**
3,01 ± 0,03
mm/min 3,24 ± 0,07
mm/min<= 203 ± 5 ms (n=27)
205 ± 5 (n=26)
<=232 ± 6 ms (n=26)
237 ± 5 (n=23)
Esperimenti su topi FHM2 ADULTI (P28 - P29) già genotipizzati
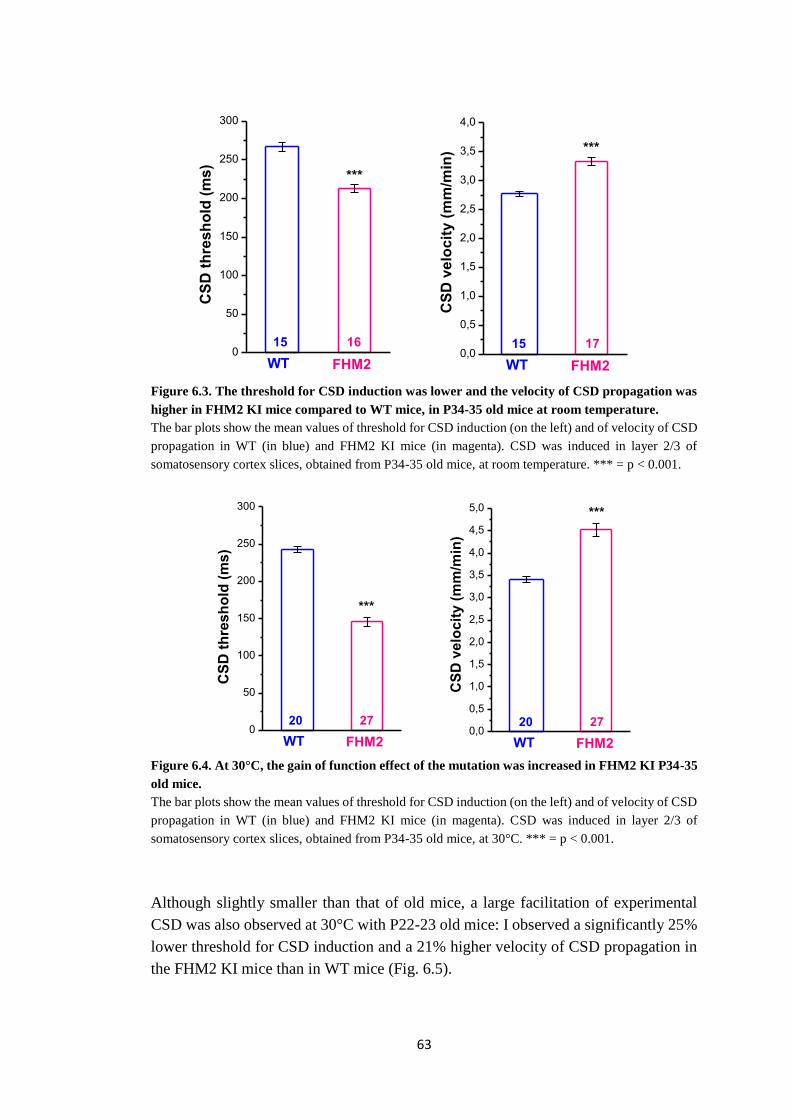
63
Figure 6.3. The threshold for CSD induction was lower and the velocity of CSD propagation was
higher in FHM2 KI mice compared to WT mice, in P34-35 old mice at room temperature. The bar plots show the mean values of threshold for CSD induction (on the left) and of velocity of CSD
propagation in WT (in blue) and FHM2 KI mice (in magenta). CSD was induced in layer 2/3 of
somatosensory cortex slices, obtained from P34-35 old mice, at room temperature. *** = p < 0.001.
Figure 6.4. At 30°C, the gain of function effect of the mutation was increased in FHM2 KI P34-35
old mice.
The bar plots show the mean values of threshold for CSD induction (on the left) and of velocity of CSD
propagation in WT (in blue) and FHM2 KI mice (in magenta). CSD was induced in layer 2/3 of
somatosensory cortex slices, obtained from P34-35 old mice, at 30°C. *** = p < 0.001.
Although slightly smaller than that of old mice, a large facilitation of experimental
CSD was also observed at 30°C with P22-23 old mice: I observed a significantly 25%
lower threshold for CSD induction and a 21% higher velocity of CSD propagation in
the FHM2 KI mice than in WT mice (Fig. 6.5).
0
50
100
150
200
250
300
***
0,0
0,5
1,0
1,5
2,0
2,5
3,0
3,5
4,0
***
2,77 ± 0,04
mm/min
3,33 ± 0,07
mm/min
<=213 ± 5 ms
ve
locità
(m
m/m
in)
267 ± 6 ms (n=15)
Esperimenti su topi FHM2 ADULTI (P34 - P35) già genotipizzati
15 16
WT FHM2
15 17
WT FHM2
CS
D v
elo
cit
y (
mm
/min
)
CS
D t
hre
sh
old
(m
s)
0
50
100
150
200
250
300
350
Sog
lia (
ms)
WT FHM2
0,0
0,5
1,0
1,5
2,0
2,5
3,0
3,5
4,0
Velo
cità
(m
m/m
in)
WT FHM2
0
50
100
150
200
250
300
***
0,0
0,5
1,0
1,5
2,0
2,5
3,0
3,5
4,0
4,5
5,0 ***
3,41 ± 0,07
mm/min
4,30 ± 0,06
mm/min
<=151 ± 7 ms ve
locità
(m
m/m
in)
243 ± 4 ms
Esperimenti su topi FHM2 ADULTI (P34 - P35) 29 - 30°C
File: FHM2_P35_30gradi.opj
CS
D t
hre
sh
old
(m
s)
CS
D v
elo
cit
y (
mm
/min
)
20 27
FHM2WT WT
20 27
FHM2
100
150
200
250
Sog
lia (
ms)
WT FHM2
3,0
3,5
4,0
4,5
5,0
Aumento velocità: 26 %
topi : WT n = 3
FHM2 n= 4
Considerando anche esperimenti a 32°C
WT: v = 3,6 ± 0,1 mm/min (n=23; topi n=4)
FHM2: v = 4,5 ± 0,1 ms (n=24; topi n=5)
aumento velocità: 25 %
Velo
cità (
mm
/min
)
WT FHM2
Diminuzione soglia: 38 %
topi : WT n = 3
FHM2 n= 4
Considerando anche esperimenti a 32°C
WT: Thr <=243 ± 4 ms (n=23; topi n=4)
FHM2: Thr <=146 ± 6 ms (n=30; topi n=5)
diminuzione soglia: 40 %
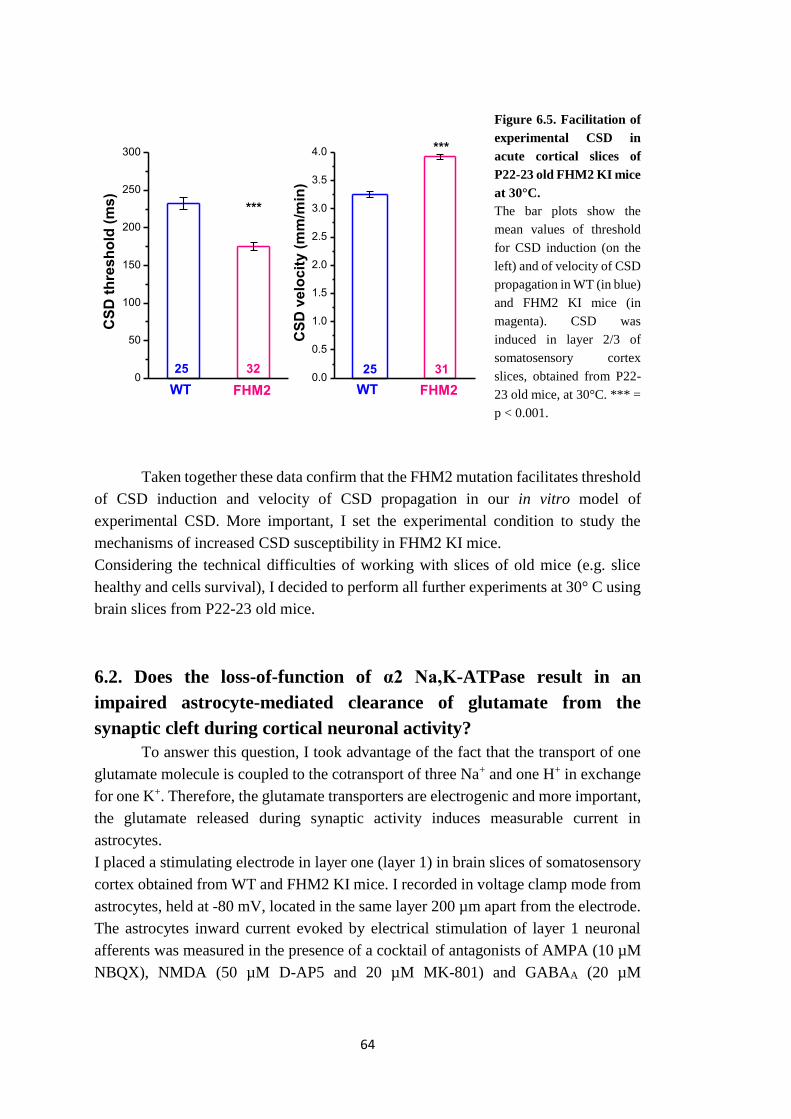
64
Figure 6.5. Facilitation of
experimental CSD in
acute cortical slices of
P22-23 old FHM2 KI mice
at 30°C. The bar plots show the
mean values of threshold
for CSD induction (on the
left) and of velocity of CSD
propagation in WT (in blue)
and FHM2 KI mice (in
magenta). CSD was
induced in layer 2/3 of
somatosensory cortex
slices, obtained from P22-
23 old mice, at 30°C. *** =
p < 0.001.
Taken together these data confirm that the FHM2 mutation facilitates threshold
of CSD induction and velocity of CSD propagation in our in vitro model of
experimental CSD. More important, I set the experimental condition to study the
mechanisms of increased CSD susceptibility in FHM2 KI mice.
Considering the technical difficulties of working with slices of old mice (e.g. slice
healthy and cells survival), I decided to perform all further experiments at 30° C using
brain slices from P22-23 old mice.
6.2. Does the loss-of-function of α2 Na,K-ATPase result in an
impaired astrocyte-mediated clearance of glutamate from the
synaptic cleft during cortical neuronal activity?
To answer this question, I took advantage of the fact that the transport of one
glutamate molecule is coupled to the cotransport of three Na+ and one H+ in exchange
for one K+. Therefore, the glutamate transporters are electrogenic and more important,
the glutamate released during synaptic activity induces measurable current in
astrocytes.
I placed a stimulating electrode in layer one (layer 1) in brain slices of somatosensory
cortex obtained from WT and FHM2 KI mice. I recorded in voltage clamp mode from
astrocytes, held at -80 mV, located in the same layer 200 µm apart from the electrode.
The astrocytes inward current evoked by electrical stimulation of layer 1 neuronal
afferents was measured in the presence of a cocktail of antagonists of AMPA (10 µM
NBQX), NMDA (50 µM D-AP5 and 20 µM MK-801) and GABAA (20 µM
0
50
100
150
200
250
300
25 31 25 32
CS
D v
elo
cit
y (
mm
/min
)
CS
D t
hre
sh
old
(m
s)
***
WT FHM2 WT FHM20.0
0.5
1.0
1.5
2.0
2.5
3.0
3.5
4.0 ***
3,01 ± 0,03
mm/min 3,24 ± 0,07
mm/min<= 203 ± 5 ms (n=27)
205 ± 5 (n=26)
<=232 ± 6 ms (n=26)
237 ± 5 (n=23)
Esperimenti su topi FHM2 ADULTI (P28 - P29) già genotipizzati

65
bicuculline) receptors (Bergles and Jahr, 1997; Bernardinelli and Chatton, 2008), to
block postsynaptic current flow (see below).
As shown in Fig. 6.6, the astrocytic inward current elicited by a single pulse
stimulation consists of two components. The fast transient component of this current
is blocked by application of 15 µM TFB-TBOA (TBOA), a glutamate transporter
antagonist, and it represents the so-called astrocytic synaptically-activated glutamate
transporter-mediated current (STC), generated by the uptake of the glutamate, through
the astrocytic glutamate transporters, released by the stimulation. Beside the STC,
there is a sustained TBOA-insensitive current that mainly represents a K+ current
mediated by Kir channels (Fig. 6.6, green trace; see below and see details in
Introduction, paragraph 1.3.2.3).
The STC was isolated pharmacologically by subtracting the response to a single pulse
stimulation recorded in the presence of TBOA from that recorded in control condition
(Fig. 6.6, blue trace) (Diamond, 2005).
Figure 6.6. Synaptically-activated inward currents evoked in a layer 1 cortical astrocyte by
extracellular stimulation.
A) Representative whole-cell current trace, recorded at 30°C from a layer 1 astrocyte (V = -80 mV) in
an acute coronal slice of barrel cortex from a P22 WT mouse, in response to a single pulse stimulation
of 100 μA in amplitude and 100 μs in duration (stimulation frequency of 0.05 Hz) in control condition
in the presence of AMPA, NMDA and GABAA receptors blockers (in black; as described in the text).
B) Besides the inward current recorded in control condition (in black), the response to single pulse
stimulation recorded in the presence of TBOA (15 µM) is reported in green. The transient current is the
STC while the sustained current is the TBOA-insensitive current, mainly mediated by Kir channels.
C) Synaptically-activated glutamate transporter-mediated current (STC; in blue) isolated by subtracting
the response to a single pulse in the presence of TBOA from that recorded in control condition. The
STC decay was fitted with a single exponential function (in red) to measure the time constant (τ).
In the three panels, the dashed grey line indicates the baseline and the arrow points the stimulus.
The STC decay time course provides a relative measure of the rate of glutamate
clearance (i.e. how rapidly synaptically released glutamate is taken up from the
extracellular space) and it is independent of the intensity of extracellular stimulation
(Bergles and Jahr, 1997; Diamond and Jahr, 2000; Diamond, 2005): the STC is slowed
by transporter antagonists, which slow glutamate clearance by decreasing uptake
capacity (Bergles and Jahr, 1997; Diamond and Jahr, 2000). If the rate of glutamate
isol farmacologico con tboa 25uM
20 ms
10
pA
-- --
-- --
-- --
-- --
-- --
-- --
--
--
--
--
--
--
-- --
-- --
-- --
-- --
-- -- -- --
-- -- -- --
-- -- -- --
-- --
-- --
-- --
--
-- -- --
-- -- --
-- -- --
--
--
--
--
--
--
-- --
-- --
-- --
-- --
-- -- -- --
-- -- -- --
-- -- -- --
-- --
-- --
-- --
-- --
-- -- -- --
-- -- -- --
-- -- -- --
isol farmacologico con tboa 25uM
20 ms
10
pA
isol farmacologico con tboa 25uM
20 ms
10
pA
-- --
-- --
-- --
-- --
-- --
-- --
--
--
--
--
--
--
-- --
-- --
-- --
-- --
-- -- -- --
-- -- -- --
-- -- -- --
-- --
-- --
-- --
--
-- -- --
-- -- --
-- -- --
--
--
--
--
--
--
-- --
-- --
-- --
-- --
-- -- -- --
-- -- -- --
-- -- -- --
-- --
-- --
-- --
-- --
-- -- -- --
-- -- -- --
-- -- -- --
isol farmacologico con tboa 25uM
20 ms
10
pA
isol farmacologico con tboa 25uM
20 ms
10
pA
-- --
-- --
-- --
-- --
-- --
-- --
--
--
--
--
--
--
-- --
-- --
-- --
-- --
-- -- -- --
-- -- -- --
-- -- -- --
-- --
-- --
-- --
--
-- -- --
-- -- --
-- -- --
--
--
--
--
--
--
-- --
-- --
-- --
-- --
-- -- -- --
-- -- -- --
-- -- -- --
-- --
-- --
-- --
-- --
-- -- -- --
-- -- -- --
-- -- -- --
isol farmacologico con tboa 25uM
20 ms
10
pA
A) B) C)
+ TBOA control
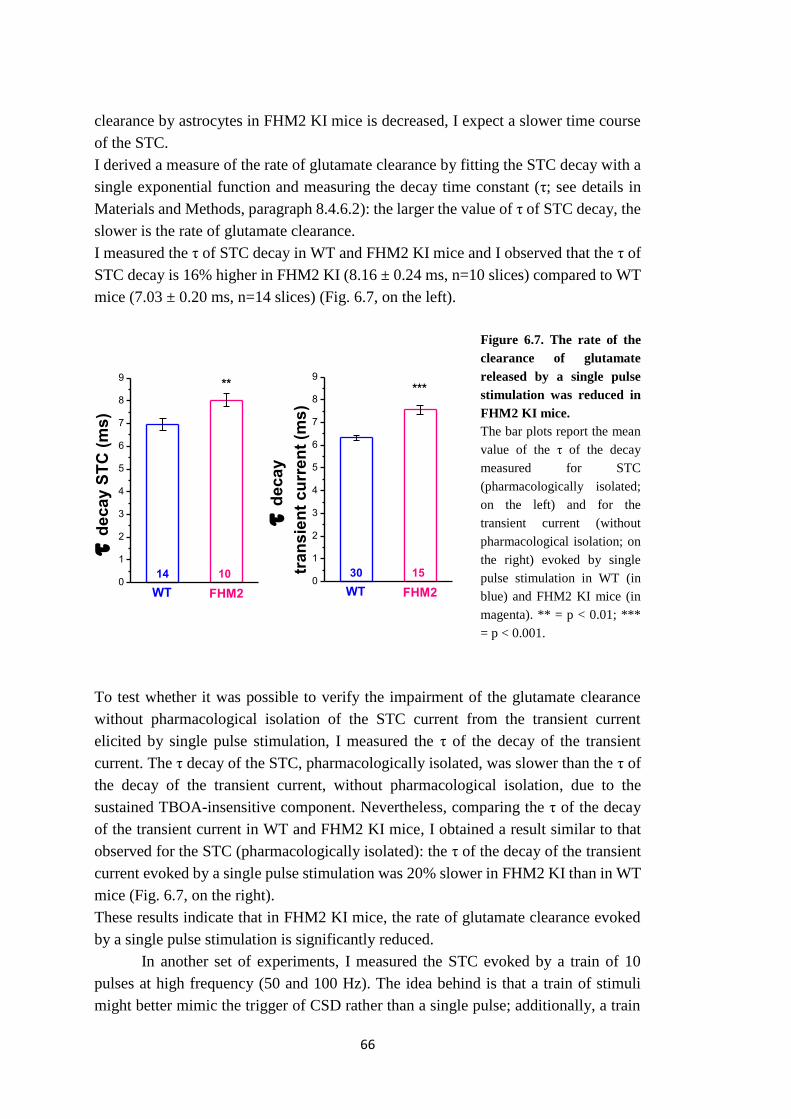
66
clearance by astrocytes in FHM2 KI mice is decreased, I expect a slower time course
of the STC.
I derived a measure of the rate of glutamate clearance by fitting the STC decay with a
single exponential function and measuring the decay time constant (τ; see details in
Materials and Methods, paragraph 8.4.6.2): the larger the value of τ of STC decay, the
slower is the rate of glutamate clearance.
I measured the τ of STC decay in WT and FHM2 KI mice and I observed that the τ of
STC decay is 16% higher in FHM2 KI (8.16 ± 0.24 ms, n=10 slices) compared to WT
mice (7.03 ± 0.20 ms, n=14 slices) (Fig. 6.7, on the left).
Figure 6.7. The rate of the
clearance of glutamate
released by a single pulse
stimulation was reduced in
FHM2 KI mice.
The bar plots report the mean
value of the τ of the decay
measured for STC
(pharmacologically isolated;
on the left) and for the
transient current (without
pharmacological isolation; on
the right) evoked by single
pulse stimulation in WT (in
blue) and FHM2 KI mice (in
magenta). ** = p < 0.01; ***
= p < 0.001.
To test whether it was possible to verify the impairment of the glutamate clearance
without pharmacological isolation of the STC current from the transient current
elicited by single pulse stimulation, I measured the τ of the decay of the transient
current. The τ decay of the STC, pharmacologically isolated, was slower than the τ of
the decay of the transient current, without pharmacological isolation, due to the
sustained TBOA-insensitive component. Nevertheless, comparing the τ of the decay
of the transient current in WT and FHM2 KI mice, I obtained a result similar to that
observed for the STC (pharmacologically isolated): the τ of the decay of the transient
current evoked by a single pulse stimulation was 20% slower in FHM2 KI than in WT
mice (Fig. 6.7, on the right).
These results indicate that in FHM2 KI mice, the rate of glutamate clearance evoked
by a single pulse stimulation is significantly reduced.
In another set of experiments, I measured the STC evoked by a train of 10
pulses at high frequency (50 and 100 Hz). The idea behind is that a train of stimuli
might better mimic the trigger of CSD rather than a single pulse; additionally, a train
1
2
3
4
5
6
7
89
10
0
1
2
3
4
5
6
7
8
9
10
11
FHM2
WT vs FHM2 1pulse stc corretto
wt
** p 0,01
16%
0
1
2
3
4
5
6
7
8
9
30 15
CS
D v
elo
cit
y (
mm
/min
)
d
ecay
tran
sie
nt
cu
rren
t (m
s)
***
WT FHM2
1
2
3
4
5
6
7
89
10
0
1
2
3
4
5
6
7
8
9
10
11
FHM2
WT vs FHM2 1pulse stc corretto
wt
** p 0,01
16%
0
1
2
3
4
5
6
7
8
9
14 10
CS
D v
elo
cit
y (
mm
/min
)
d
eca
y S
TC
(m
s)
**
WT FHM2
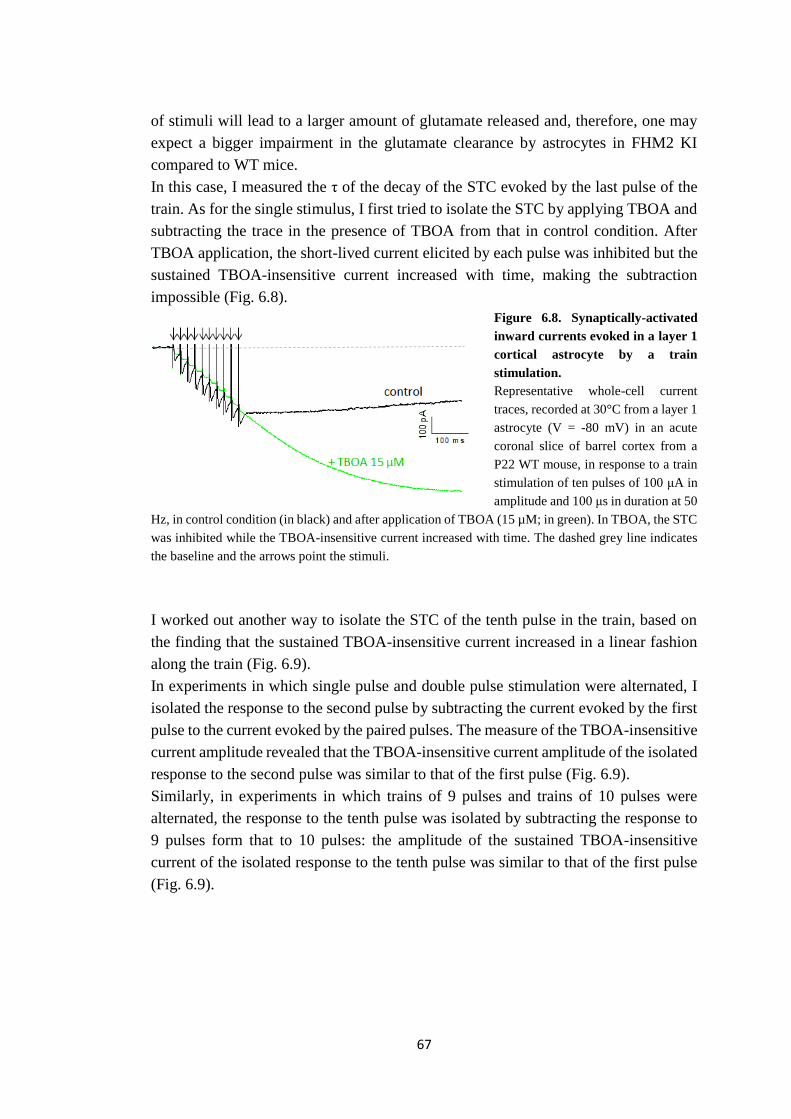
67
of stimuli will lead to a larger amount of glutamate released and, therefore, one may
expect a bigger impairment in the glutamate clearance by astrocytes in FHM2 KI
compared to WT mice.
In this case, I measured the τ of the decay of the STC evoked by the last pulse of the
train. As for the single stimulus, I first tried to isolate the STC by applying TBOA and
subtracting the trace in the presence of TBOA from that in control condition. After
TBOA application, the short-lived current elicited by each pulse was inhibited but the
sustained TBOA-insensitive current increased with time, making the subtraction
impossible (Fig. 6.8).
Figure 6.8. Synaptically-activated
inward currents evoked in a layer 1
cortical astrocyte by a train
stimulation.
Representative whole-cell current
traces, recorded at 30°C from a layer 1
astrocyte (V = -80 mV) in an acute
coronal slice of barrel cortex from a
P22 WT mouse, in response to a train
stimulation of ten pulses of 100 μA in
amplitude and 100 μs in duration at 50
Hz, in control condition (in black) and after application of TBOA (15 µM; in green). In TBOA, the STC
was inhibited while the TBOA-insensitive current increased with time. The dashed grey line indicates
the baseline and the arrows point the stimuli.
I worked out another way to isolate the STC of the tenth pulse in the train, based on
the finding that the sustained TBOA-insensitive current increased in a linear fashion
along the train (Fig. 6.9).
In experiments in which single pulse and double pulse stimulation were alternated, I
isolated the response to the second pulse by subtracting the current evoked by the first
pulse to the current evoked by the paired pulses. The measure of the TBOA-insensitive
current amplitude revealed that the TBOA-insensitive current amplitude of the isolated
response to the second pulse was similar to that of the first pulse (Fig. 6.9).
Similarly, in experiments in which trains of 9 pulses and trains of 10 pulses were
alternated, the response to the tenth pulse was isolated by subtracting the response to
9 pulses form that to 10 pulses: the amplitude of the sustained TBOA-insensitive
current of the isolated response to the tenth pulse was similar to that of the first pulse
(Fig. 6.9).

68
Figure 6.9. The TBOA-insensitive current amplitude increased in a linear fashion. A-D) Representative whole-cell current traces recorded at 30°C from a layer 1 astrocyte (V = -80 mV)
in an acute coronal slice of barrel cortex from a P23 WT mouse: a single pulse stimulation (A, in black)
was alternated to a paired pulse stimulation (B, in orange). By subtracting the two traces (C, single pulse
in black and paired pulses in dashed orange are superimposed), the response to the second pulse was
isolated (D, in magenta).
F-I) 9 pulses (F, in black) and 10 pulses (G, in orange) at 50 Hz were subtracted (H, 9 pulses in black
and 10 pulses in dashed orange are superimposed) to obtain the response to the tenth pulse (I, in
magenta).
The red dashed line in A-I panels indicates the baseline and the arrows point the stimuli.
E, L) The bar plots report the mean values of the TBOA-insensitive current amplitude for the single
pulse and the isolated response to the second pulse or to the tenth pulse.
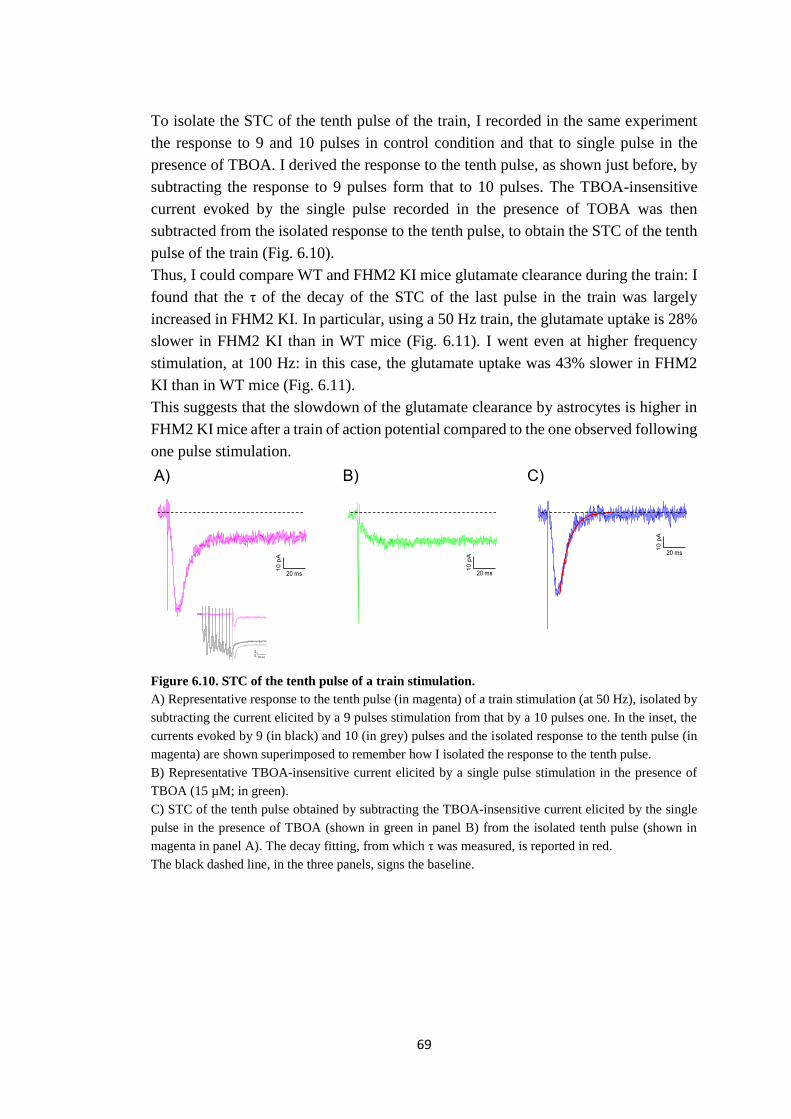
69
To isolate the STC of the tenth pulse of the train, I recorded in the same experiment
the response to 9 and 10 pulses in control condition and that to single pulse in the
presence of TBOA. I derived the response to the tenth pulse, as shown just before, by
subtracting the response to 9 pulses form that to 10 pulses. The TBOA-insensitive
current evoked by the single pulse recorded in the presence of TOBA was then
subtracted from the isolated response to the tenth pulse, to obtain the STC of the tenth
pulse of the train (Fig. 6.10).
Thus, I could compare WT and FHM2 KI mice glutamate clearance during the train: I
found that the τ of the decay of the STC of the last pulse in the train was largely
increased in FHM2 KI. In particular, using a 50 Hz train, the glutamate uptake is 28%
slower in FHM2 KI than in WT mice (Fig. 6.11). I went even at higher frequency
stimulation, at 100 Hz: in this case, the glutamate uptake was 43% slower in FHM2
KI than in WT mice (Fig. 6.11).
This suggests that the slowdown of the glutamate clearance by astrocytes is higher in
FHM2 KI mice after a train of action potential compared to the one observed following
one pulse stimulation.
Figure 6.10. STC of the tenth pulse of a train stimulation.
A) Representative response to the tenth pulse (in magenta) of a train stimulation (at 50 Hz), isolated by
subtracting the current elicited by a 9 pulses stimulation from that by a 10 pulses one. In the inset, the
currents evoked by 9 (in black) and 10 (in grey) pulses and the isolated response to the tenth pulse (in
magenta) are shown superimposed to remember how I isolated the response to the tenth pulse.
B) Representative TBOA-insensitive current elicited by a single pulse stimulation in the presence of
TBOA (15 µM; in green).
C) STC of the tenth pulse obtained by subtracting the TBOA-insensitive current elicited by the single
pulse in the presence of TBOA (shown in green in panel B) from the isolated tenth pulse (shown in
magenta in panel A). The decay fitting, from which τ was measured, is reported in red.
The black dashed line, in the three panels, signs the baseline.
20 ms
10
pA
Equation y = A1*exp(-x/t1) + y0
Reduced Chi-Sqr
13,68222
Adj. R-Square 0,95381
Value
stc y0 1
stc A1 -199,57554
stc t1 8,50099
Equation y = A1*exp(-x/t1) + y0
Reduced Chi-Sqr
13,68222
Adj. R-Square 0,95381
Value
stc y0 1
stc A1 -199,57554
stc t1 8,50099
Equation y = A1*exp(-x/t1) + y0
Reduced Chi-Sqr
9,43277
Adj. R-Square 0,95197
Value Standard Error
treno10 y0 -21 0
treno10 A1 -162,50582 3,8888
treno10 t1 9,77813 0,14648
Equation y = A1*exp(-x/t1) + y0
Reduced Chi-Sqr
9,43277
Adj. R-Square 0,95197
Value Standard Error
treno10 y0 -21 0
treno10 A1 -162,50582 3,8888
treno10 t1 9,77813 0,14648
50 ms20
pA
A) B) C)
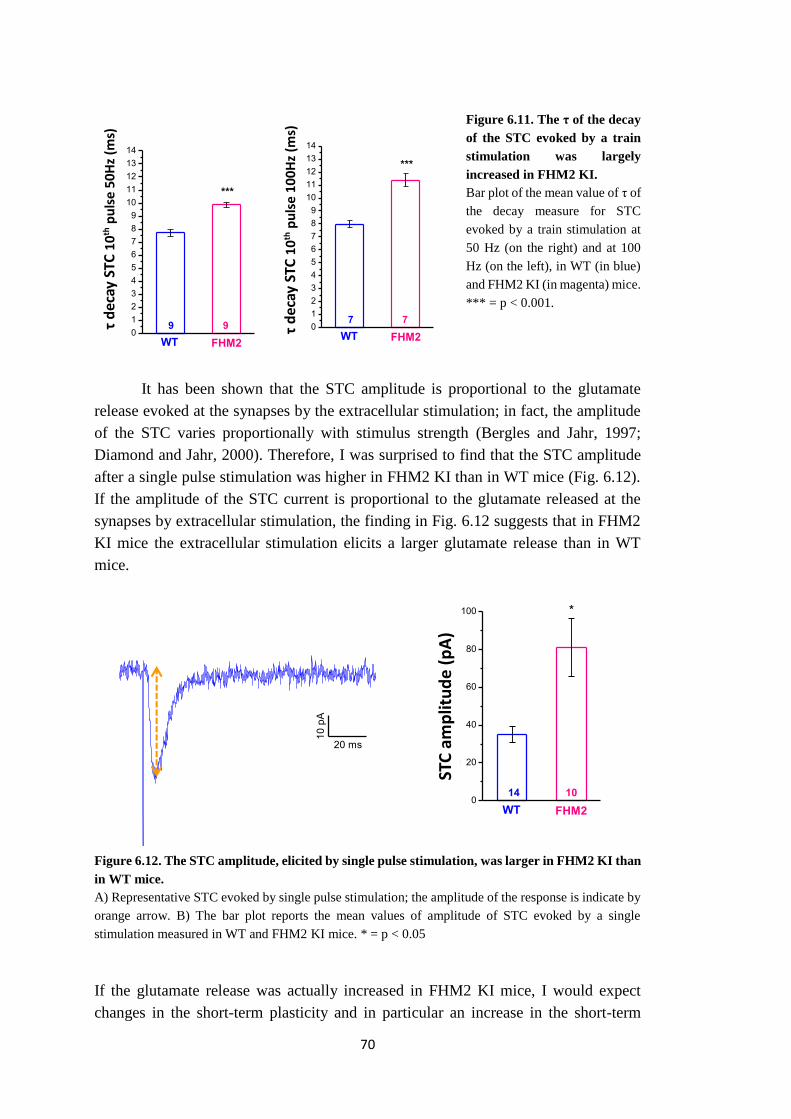
70
Figure 6.11. The τ of the decay
of the STC evoked by a train
stimulation was largely
increased in FHM2 KI.
Bar plot of the mean value of τ of
the decay measure for STC
evoked by a train stimulation at
50 Hz (on the right) and at 100
Hz (on the left), in WT (in blue)
and FHM2 KI (in magenta) mice.
*** = p < 0.001.
It has been shown that the STC amplitude is proportional to the glutamate
release evoked at the synapses by the extracellular stimulation; in fact, the amplitude
of the STC varies proportionally with stimulus strength (Bergles and Jahr, 1997;
Diamond and Jahr, 2000). Therefore, I was surprised to find that the STC amplitude
after a single pulse stimulation was higher in FHM2 KI than in WT mice (Fig. 6.12).
If the amplitude of the STC current is proportional to the glutamate released at the
synapses by extracellular stimulation, the finding in Fig. 6.12 suggests that in FHM2
KI mice the extracellular stimulation elicits a larger glutamate release than in WT
mice.
Figure 6.12. The STC amplitude, elicited by single pulse stimulation, was larger in FHM2 KI than
in WT mice.
A) Representative STC evoked by single pulse stimulation; the amplitude of the response is indicate by
orange arrow. B) The bar plot reports the mean values of amplitude of STC evoked by a single
stimulation measured in WT and FHM2 KI mice. * = p < 0.05
If the glutamate release was actually increased in FHM2 KI mice, I would expect
changes in the short-term plasticity and in particular an increase in the short-term
4
5
6
7
8910
0
1
2
3
4
5
6
7
8
9
10
11
12
13
43%FHM2
WT vs FHM2 tau stc treno reale 100Hz
(10-9 - tboa1p)
wt
***
7.98±0.27 vs 11.38±0.48, p=5.2*10-5, 43% (n= 7wt, 7fhm2).
0
1
2
3
4
5
6
7
8
9
10
11
12
13
14
d
eca
y
10
th p
uls
e (
100H
z)
ST
C (
ms)
7 7
CS
D v
elo
cit
y (
mm
/min
)
ST
C (
100H
z)
decay (
ms)
***
WT FHM2
τ d
ecay
STC
10
th p
uls
e 1
00
Hz
(ms)
τ d
ecay
STC
10
th p
uls
e 5
0H
z (m
s)
1
2
345
678
9
0
1
2
3
4
5
6
7
8
9
10
11
12
FHM2
WT vs FHM2 tau STC treno reale 50Hz
(10-9 - TBOA1p)
wt
***
28%
0
1
2
3
4
5
6
7
8
9
10
11
12
13
14
9 9
CS
D v
elo
cit
y (
mm
/min
)
d
eca
y
10
th p
uls
e (
50H
z)
ST
C (
ms)
***
WT FHM2
isol farmacologico con tboa 25uM
20 ms
10
pA
-- --
-- --
-- --
-- --
-- --
-- --
-- --
-- --
-- --
-- --
-- -- -- --
-- -- -- --
-- -- -- --
-- --
-- --
-- --
-- --
-- -- -- --
-- -- -- --
-- -- -- --
Equation y = A1*exp(-x/t1) + y0
Reduced Chi-Sqr
5,56537
Adj. R-Square 0,95182
Value Standard Error
stc y0 -2 0
stc A1 -2,02465E22 1,68872E22
stc t1 7,08343 0,12298
Equation y = A1*exp(-x/t1) + y0
Reduced Chi-Sqr
5,56537
Adj. R-Square 0,95182
Value Standard Error
stc y0 -2 0
stc A1 -2,02465E22 1,68872E22
stc t1 7,08343 0,12298
Equation y = A1*exp(-x/t1) + y0
Reduced Chi-Sqr
5,75463
Adj. R-Square 0,93736
Value Standard Error
stc y0 -1 0
stc A1 -1,53253E23 1,49644E23
stc t1 6,80162 0,13244
Equation y = A1*exp(-x/t1) + y0
Reduced Chi-Sqr
5,75463
Adj. R-Square 0,93736
Value Standard Error
stc y0 -1 0
stc A1 -1,53253E23 1,49644E23
stc t1 6,80162 0,13244
Equation y = A1*exp(-x/t1) + y0
Reduced Chi-Sqr
5,75463
Adj. R-Square 0,93736
Value Standard Error
stc y0 -1 0
stc A1 -1,53253E23 1,49644E23
stc t1 6,80162 0,13244
Equation y = A1*exp(-x/t1) + y0
Reduced Chi-Sqr
5,75463
Adj. R-Square 0,93736
Value Standard Error
stc y0 -1 0
stc A1 -1,53253E23 1,49644E23
stc t1 6,80162 0,13244
isol farmacologico con tboa 25uM
20 ms
10
pA
1
2
3
4
5
6
7
8
910
0
20
40
60
80
100
120
140
160
180
200
* p=0,02
FHM2
WT vs FHM2
Ipicco 1pulse stc corretto
wt
0
20
40
60
80
100
14 10
CS
D v
elo
cit
y (
mm
/min
)
I glu
am
plitu
de (
pA
)
*
WT FHM2
STC
am
plit
ud
e (
pA
)
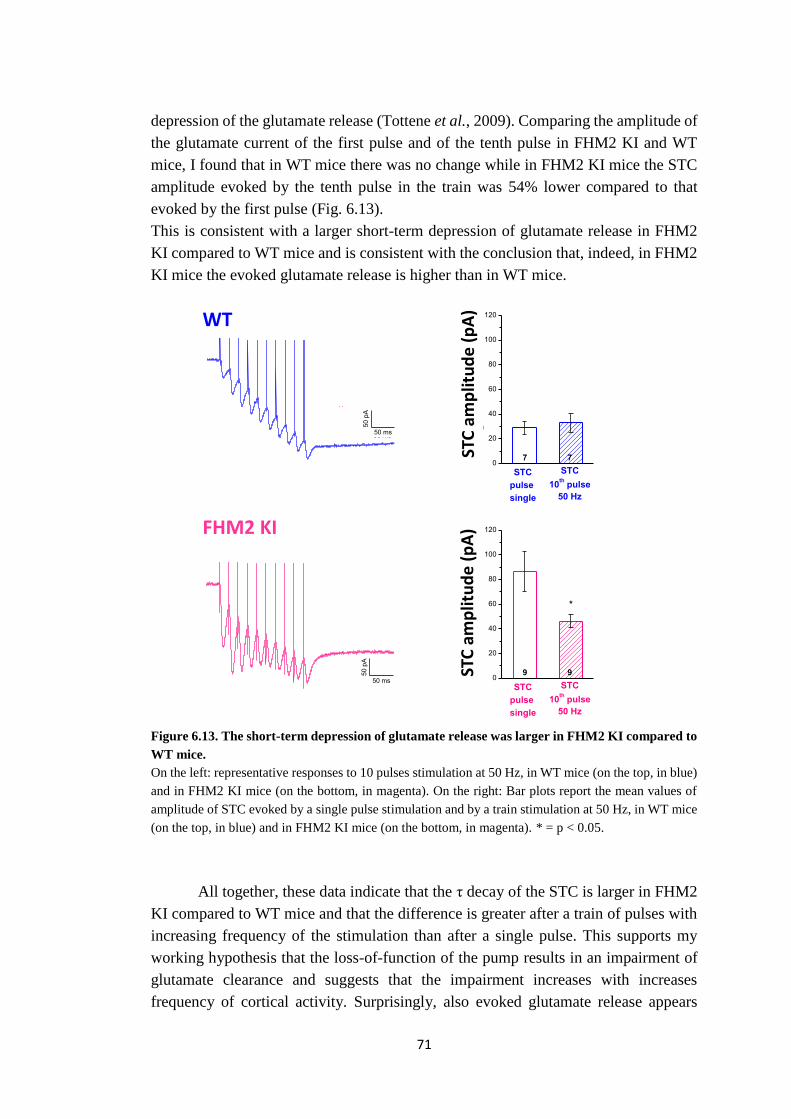
71
depression of the glutamate release (Tottene et al., 2009). Comparing the amplitude of
the glutamate current of the first pulse and of the tenth pulse in FHM2 KI and WT
mice, I found that in WT mice there was no change while in FHM2 KI mice the STC
amplitude evoked by the tenth pulse in the train was 54% lower compared to that
evoked by the first pulse (Fig. 6.13).
This is consistent with a larger short-term depression of glutamate release in FHM2
KI compared to WT mice and is consistent with the conclusion that, indeed, in FHM2
KI mice the evoked glutamate release is higher than in WT mice.
Figure 6.13. The short-term depression of glutamate release was larger in FHM2 KI compared to
WT mice. On the left: representative responses to 10 pulses stimulation at 50 Hz, in WT mice (on the top, in blue)
and in FHM2 KI mice (on the bottom, in magenta). On the right: Bar plots report the mean values of
amplitude of STC evoked by a single pulse stimulation and by a train stimulation at 50 Hz, in WT mice
(on the top, in blue) and in FHM2 KI mice (on the bottom, in magenta). * = p < 0.05.
All together, these data indicate that the τ decay of the STC is larger in FHM2
KI compared to WT mice and that the difference is greater after a train of pulses with
increasing frequency of the stimulation than after a single pulse. This supports my
working hypothesis that the loss-of-function of the pump results in an impairment of
glutamate clearance and suggests that the impairment increases with increases
frequency of cortical activity. Surprisingly, also evoked glutamate release appears
1
23
467
8
10
11
0
1
2
3
4
5
6
7
8
9
10
11
2-1
WT 1pulse vs 2-1
1p
*
p 0,03
0
20
40
60
80
100
120
7 7
I glu
am
plitu
de (
pA
)STC
pulse
single
STC
10th pulse
50 Hz
STC
am
plit
ud
e (
pA
)
treno10
treno9
109
FHM2_68d 100uA 50Hz WT
Model ExpDec1
Equation y = A1*exp(-x/t1) + y0
Reduced Chi-Sqr
1,77474
Adj. R-Square 0,96094
Value Standard Error
treno9 y0 -189,2 0
treno9 A1 -1,34846E37 1,88682E37
treno9 t1 7,03034 0,11896
Model ExpDec1
Equation y = A1*exp(-x/t1) + y0
Reduced Chi-Sqr
1,41457
Adj. R-Square 0,96699
Value Standard Error
treno10 y0 -207 0
treno10 A1 -1,08552E38 1,60631E38
treno10 t1 7,09773 0,12382
Model ExpDec1
Equation y = A1*exp(-x/t1) + y0
Reduced Chi-Sqr
4,04322
Adj. R-Square 0,89767
10-9 y0
10-9 A1
10-9 t1
50 ms
50
pA
50 ms
50
pA
50 ms
50
pA
WT FHM2 KI
1
23
467
8
10
11
0
1
2
3
4
5
6
7
8
9
10
11
2-1
WT 1pulse vs 2-1
1p
*
p 0,03
0
20
40
60
80
100
120
*
9 9
I glu
am
plitu
de (
pA
)
STC
pulse
single
STC
10th pulse
50 Hz
STC
am
plit
ud
e (
pA
)
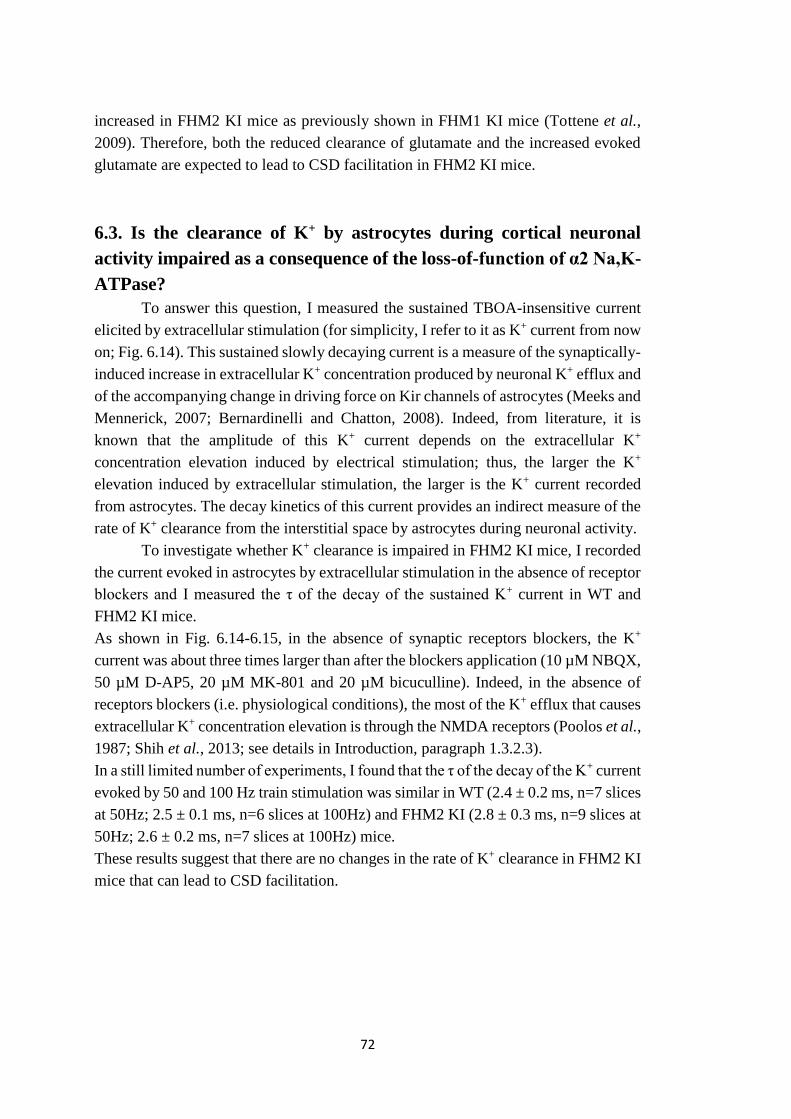
72
increased in FHM2 KI mice as previously shown in FHM1 KI mice (Tottene et al.,
2009). Therefore, both the reduced clearance of glutamate and the increased evoked
glutamate are expected to lead to CSD facilitation in FHM2 KI mice.
6.3. Is the clearance of K+ by astrocytes during cortical neuronal
activity impaired as a consequence of the loss-of-function of α2 Na,K-
ATPase?
To answer this question, I measured the sustained TBOA-insensitive current
elicited by extracellular stimulation (for simplicity, I refer to it as K+ current from now
on; Fig. 6.14). This sustained slowly decaying current is a measure of the synaptically-
induced increase in extracellular K+ concentration produced by neuronal K+ efflux and
of the accompanying change in driving force on Kir channels of astrocytes (Meeks and
Mennerick, 2007; Bernardinelli and Chatton, 2008). Indeed, from literature, it is
known that the amplitude of this K+ current depends on the extracellular K+
concentration elevation induced by electrical stimulation; thus, the larger the K+
elevation induced by extracellular stimulation, the larger is the K+ current recorded
from astrocytes. The decay kinetics of this current provides an indirect measure of the
rate of K+ clearance from the interstitial space by astrocytes during neuronal activity.
To investigate whether K+ clearance is impaired in FHM2 KI mice, I recorded
the current evoked in astrocytes by extracellular stimulation in the absence of receptor
blockers and I measured the τ of the decay of the sustained K+ current in WT and
FHM2 KI mice.
As shown in Fig. 6.14-6.15, in the absence of synaptic receptors blockers, the K+
current was about three times larger than after the blockers application (10 µM NBQX,
50 µM D-AP5, 20 µM MK-801 and 20 µM bicuculline). Indeed, in the absence of
receptors blockers (i.e. physiological conditions), the most of the K+ efflux that causes
extracellular K+ concentration elevation is through the NMDA receptors (Poolos et al.,
1987; Shih et al., 2013; see details in Introduction, paragraph 1.3.2.3).
In a still limited number of experiments, I found that the τ of the decay of the K+ current
evoked by 50 and 100 Hz train stimulation was similar in WT (2.4 ± 0.2 ms, n=7 slices
at 50Hz; 2.5 ± 0.1 ms, n=6 slices at 100Hz) and FHM2 KI (2.8 ± 0.3 ms, n=9 slices at
50Hz; 2.6 ± 0.2 ms, n=7 slices at 100Hz) mice.
These results suggest that there are no changes in the rate of K+ clearance in FHM2 KI
mice that can lead to CSD facilitation.
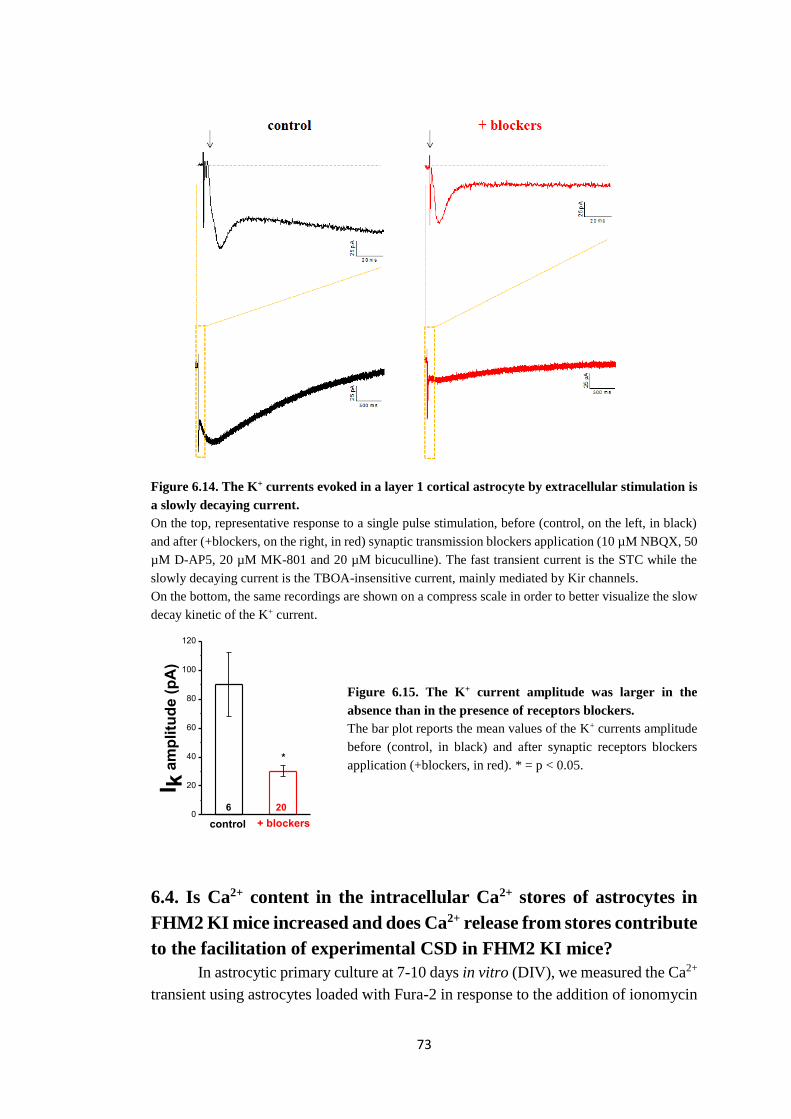
73
Figure 6.14. The K+ currents evoked in a layer 1 cortical astrocyte by extracellular stimulation is
a slowly decaying current.
On the top, representative response to a single pulse stimulation, before (control, on the left, in black)
and after (+blockers, on the right, in red) synaptic transmission blockers application (10 µM NBQX, 50
µM D-AP5, 20 µM MK-801 and 20 µM bicuculline). The fast transient current is the STC while the
slowly decaying current is the TBOA-insensitive current, mainly mediated by Kir channels.
On the bottom, the same recordings are shown on a compress scale in order to better visualize the slow
decay kinetic of the K+ current.
Figure 6.15. The K+ current amplitude was larger in the
absence than in the presence of receptors blockers.
The bar plot reports the mean values of the K+ currents amplitude
before (control, in black) and after synaptic receptors blockers
application (+blockers, in red). * = p < 0.05.
6.4. Is Ca2+ content in the intracellular Ca2+ stores of astrocytes in
FHM2 KI mice increased and does Ca2+ release from stores contribute
to the facilitation of experimental CSD in FHM2 KI mice?
In astrocytic primary culture at 7-10 days in vitro (DIV), we measured the Ca2+
transient using astrocytes loaded with Fura-2 in response to the addition of ionomycin
1
23
467
8
10
11
0
1
2
3
4
5
6
7
8
9
10
11
0
4
8
12
16
20
24
I k a
mp
litu
de (
pA
)
9 9
I k a
mp
litu
de (
pA
)
0
4
8
12
16
20
24
2nd
pulse
response
I k a
mp
litu
de (
pA
)
single
pulse
9 9
single
pulse
10th pulse
response
0
20
40
60
80
100
120
31 31 6 20
CS
D v
elo
cit
y (
mm
/min
)
I k a
mp
litu
de (
pA
)
*
+ blockerscontrol FHM2 +CPA0,0
0,5
1,0
1,5
2,0
2,5
3,0
3,5
4,0***
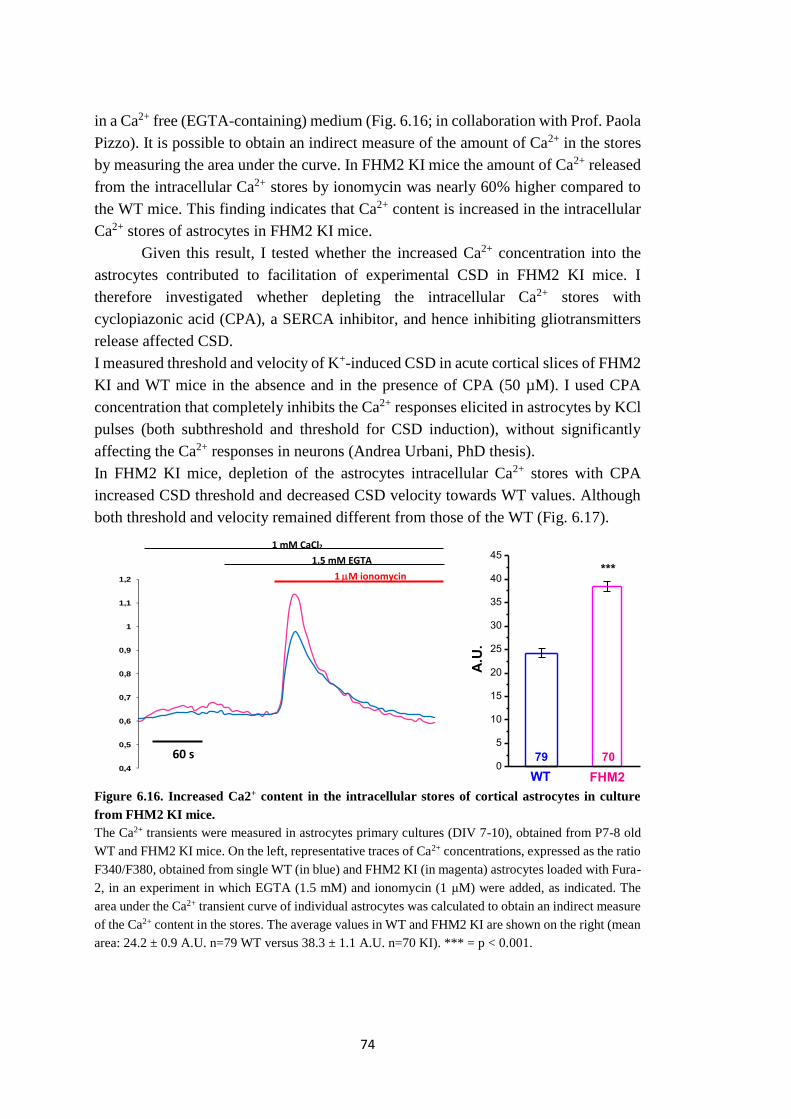
74
in a Ca2+ free (EGTA-containing) medium (Fig. 6.16; in collaboration with Prof. Paola
Pizzo). It is possible to obtain an indirect measure of the amount of Ca2+ in the stores
by measuring the area under the curve. In FHM2 KI mice the amount of Ca2+ released
from the intracellular Ca2+ stores by ionomycin was nearly 60% higher compared to
the WT mice. This finding indicates that Ca2+ content is increased in the intracellular
Ca2+ stores of astrocytes in FHM2 KI mice.
Given this result, I tested whether the increased Ca2+ concentration into the
astrocytes contributed to facilitation of experimental CSD in FHM2 KI mice. I
therefore investigated whether depleting the intracellular Ca2+ stores with
cyclopiazonic acid (CPA), a SERCA inhibitor, and hence inhibiting gliotransmitters
release affected CSD.
I measured threshold and velocity of K+-induced CSD in acute cortical slices of FHM2
KI and WT mice in the absence and in the presence of CPA (50 µM). I used CPA
concentration that completely inhibits the Ca2+ responses elicited in astrocytes by KCl
pulses (both subthreshold and threshold for CSD induction), without significantly
affecting the Ca2+ responses in neurons (Andrea Urbani, PhD thesis).
In FHM2 KI mice, depletion of the astrocytes intracellular Ca2+ stores with CPA
increased CSD threshold and decreased CSD velocity towards WT values. Although
both threshold and velocity remained different from those of the WT (Fig. 6.17).
Figure 6.16. Increased Ca2+ content in the intracellular stores of cortical astrocytes in culture
from FHM2 KI mice.
The Ca2+ transients were measured in astrocytes primary cultures (DIV 7-10), obtained from P7-8 old
WT and FHM2 KI mice. On the left, representative traces of Ca2+ concentrations, expressed as the ratio
F340/F380, obtained from single WT (in blue) and FHM2 KI (in magenta) astrocytes loaded with Fura-
2, in an experiment in which EGTA (1.5 mM) and ionomycin (1 μM) were added, as indicated. The
area under the Ca2+ transient curve of individual astrocytes was calculated to obtain an indirect measure
of the Ca2+ content in the stores. The average values in WT and FHM2 KI are shown on the right (mean
area: 24.2 ± 0.9 A.U. n=79 WT versus 38.3 ± 1.1 A.U. n=70 KI). *** = p < 0.001.
0
5
10
15
20
25
30
35
40
45
***
A.U
.
CS
D v
elo
cit
y (
mm
/min
)
79 70
WT FHM2 WT FHM2
17 230,0
0,5
1,0
1,5
2,0
2,5
3,0
3,5
4,0
4,5
5,0
***
3,2 ± 0,1
mm/min
3,9 ± 0,0
mm/min167 ± 5 ms
242 ± 11 ms
Esperimenti su topi FHM2 ADULTI (P22 - P23) 29°C
File: FHM2_P22_termo.opj
100
150
200
250
300
350
So
glia
(m
s)
WT FHM2
3,0
3,5
4,0
Aumento velocità: 22 %
topi : WT n = 2
FHM2 n= 7
Ve
locità
(m
m/m
in)
WT FHM2
Diminuzione soglia: 31 %
topi : WT n = 2
FHM2 n= 7
1 mM CaCl2
1.5 mM EGTA
1 M ionomycin
400
500
600
700
800
900
1000
1100
1200
0,4
0,5
0,6
0,7
0,8
0,9
1
1,1
1,2
60 s
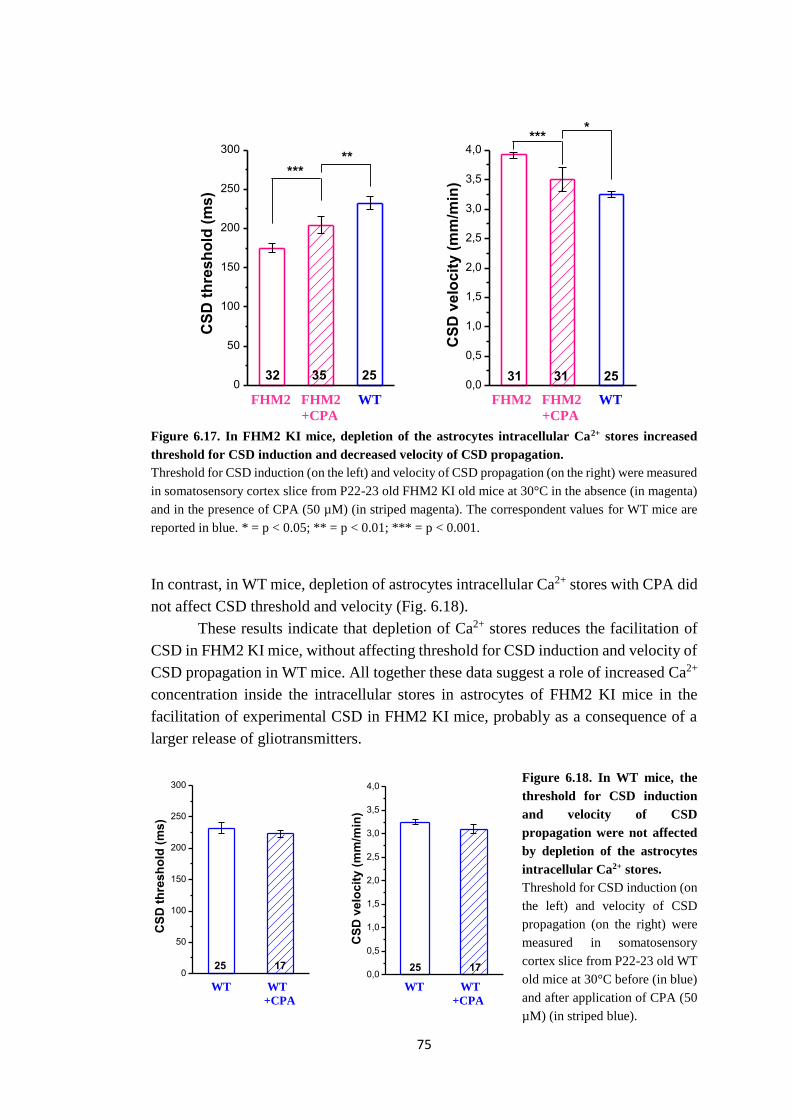
75
Figure 6.17. In FHM2 KI mice, depletion of the astrocytes intracellular Ca2+ stores increased
threshold for CSD induction and decreased velocity of CSD propagation.
Threshold for CSD induction (on the left) and velocity of CSD propagation (on the right) were measured
in somatosensory cortex slice from P22-23 old FHM2 KI old mice at 30°C in the absence (in magenta)
and in the presence of CPA (50 µM) (in striped magenta). The correspondent values for WT mice are
reported in blue. * = p < 0.05; ** = p < 0.01; *** = p < 0.001.
In contrast, in WT mice, depletion of astrocytes intracellular Ca2+ stores with CPA did
not affect CSD threshold and velocity (Fig. 6.18).
These results indicate that depletion of Ca2+ stores reduces the facilitation of
CSD in FHM2 KI mice, without affecting threshold for CSD induction and velocity of
CSD propagation in WT mice. All together these data suggest a role of increased Ca2+
concentration inside the intracellular stores in astrocytes of FHM2 KI mice in the
facilitation of experimental CSD in FHM2 KI mice, probably as a consequence of a
larger release of gliotransmitters.
Figure 6.18. In WT mice, the
threshold for CSD induction
and velocity of CSD
propagation were not affected
by depletion of the astrocytes
intracellular Ca2+ stores.
Threshold for CSD induction (on
the left) and velocity of CSD
propagation (on the right) were
measured in somatosensory
cortex slice from P22-23 old WT
old mice at 30°C before (in blue)
and after application of CPA (50
µM) (in striped blue).
0
50
100
150
200
250
300
***
31 31 25 32 35 25
CS
D v
elo
cit
y (
mm
/min
)
CS
D t
hre
sh
old
(m
s)
**
FHM2+CPA
FHM2 +CPA
0,0
0,5
1,0
1,5
2,0
2,5
3,0
3,5
4,0
*
WTWT
***
3,01 ± 0,03
mm/min 3,24 ± 0,07
mm/min<= 203 ± 5 ms (n=27)
205 ± 5 (n=26)
<=232 ± 6 ms (n=26)
237 ± 5 (n=23)
Esperimenti su topi FHM2 ADULTI (P28 - P29) già genotipizzati
FHM2 FHM2 WT +CPA
FHM2 FHM2 WT +CPA
0
50
100
150
200
250
300
25 17 25 17
CS
D v
elo
cit
y (
mm
/min
)
CS
D t
hre
sh
old
(m
s)
WT+CPA
WT+CPA
0,0
0,5
1,0
1,5
2,0
2,5
3,0
3,5
4,0
3,01 ± 0,03
mm/min 3,24 ± 0,07
mm/min<= 203 ± 5 ms (n=27)
205 ± 5 (n=26)
<=232 ± 6 ms (n=26)
237 ± 5 (n=23)
Esperimenti su topi FHM2 ADULTI (P28 - P29) già genotipizzati
WT WT +CPA
WT WT +CPA

76
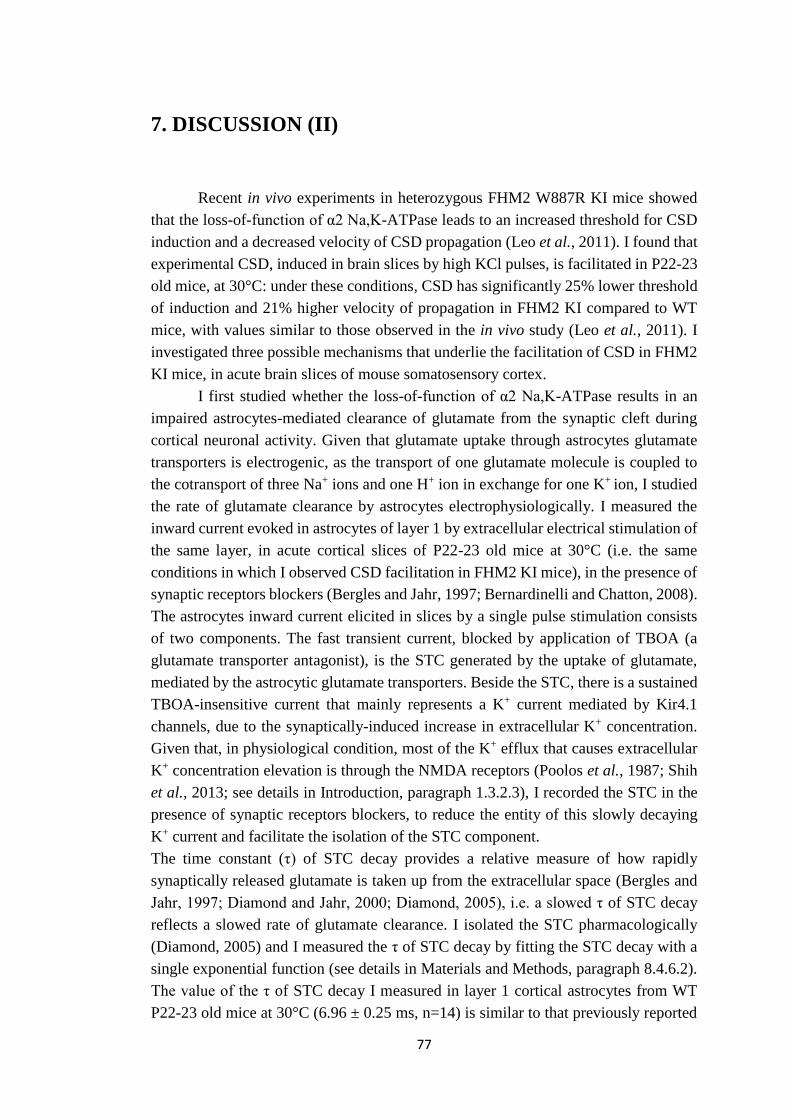
77
7. DISCUSSION (II)
Recent in vivo experiments in heterozygous FHM2 W887R KI mice showed
that the loss-of-function of α2 Na,K-ATPase leads to an increased threshold for CSD
induction and a decreased velocity of CSD propagation (Leo et al., 2011). I found that
experimental CSD, induced in brain slices by high KCl pulses, is facilitated in P22-23
old mice, at 30°C: under these conditions, CSD has significantly 25% lower threshold
of induction and 21% higher velocity of propagation in FHM2 KI compared to WT
mice, with values similar to those observed in the in vivo study (Leo et al., 2011). I
investigated three possible mechanisms that underlie the facilitation of CSD in FHM2
KI mice, in acute brain slices of mouse somatosensory cortex.
I first studied whether the loss-of-function of α2 Na,K-ATPase results in an
impaired astrocytes-mediated clearance of glutamate from the synaptic cleft during
cortical neuronal activity. Given that glutamate uptake through astrocytes glutamate
transporters is electrogenic, as the transport of one glutamate molecule is coupled to
the cotransport of three Na+ ions and one H+ ion in exchange for one K+ ion, I studied
the rate of glutamate clearance by astrocytes electrophysiologically. I measured the
inward current evoked in astrocytes of layer 1 by extracellular electrical stimulation of
the same layer, in acute cortical slices of P22-23 old mice at 30°C (i.e. the same
conditions in which I observed CSD facilitation in FHM2 KI mice), in the presence of
synaptic receptors blockers (Bergles and Jahr, 1997; Bernardinelli and Chatton, 2008).
The astrocytes inward current elicited in slices by a single pulse stimulation consists
of two components. The fast transient current, blocked by application of TBOA (a
glutamate transporter antagonist), is the STC generated by the uptake of glutamate,
mediated by the astrocytic glutamate transporters. Beside the STC, there is a sustained
TBOA-insensitive current that mainly represents a K+ current mediated by Kir4.1
channels, due to the synaptically-induced increase in extracellular K+ concentration.
Given that, in physiological condition, most of the K+ efflux that causes extracellular
K+ concentration elevation is through the NMDA receptors (Poolos et al., 1987; Shih
et al., 2013; see details in Introduction, paragraph 1.3.2.3), I recorded the STC in the
presence of synaptic receptors blockers, to reduce the entity of this slowly decaying
K+ current and facilitate the isolation of the STC component.
The time constant (τ) of STC decay provides a relative measure of how rapidly
synaptically released glutamate is taken up from the extracellular space (Bergles and
Jahr, 1997; Diamond and Jahr, 2000; Diamond, 2005), i.e. a slowed τ of STC decay
reflects a slowed rate of glutamate clearance. I isolated the STC pharmacologically
(Diamond, 2005) and I measured the τ of STC decay by fitting the STC decay with a
single exponential function (see details in Materials and Methods, paragraph 8.4.6.2).
The value of the τ of STC decay I measured in layer 1 cortical astrocytes from WT
P22-23 old mice at 30°C (6.96 ± 0.25 ms, n=14) is similar to that previously reported

78
in adult (> P60 old) rat hippocampal astrocytes (6.17 ± 0.95 ms, n=5; Diamond et al.,
2005). Measurements of the τ of STC decay in FHM2 KI mice revealed that the
clearance of glutamate released by single pulse stimulation is 20% slower in FHM2
KI than WT mice.
I measured also the τ of STC decay evoked by the last pulse of a train stimulation at
50-100 Hz, in FHM2 KI and WT mice. The idea behind is that a train of stimuli might
better mimic the trigger of CSD rather than a single pulse. Additionally, as a train of
stimuli will lead to a larger amount of glutamate released, one may expect a bigger
impairment in the glutamate clearance by astrocytes in the FHM2 KI compared to WT
mice. I found that the slowing of glutamate clearance in FHM2 KI mice was more
pronounced after a train stimulation than a single pulse and increased with increasing
frequency of the train stimulation: the glutamate clearance was 28% slower at 50 Hz
and 43% slower at 100 Hz in FHM2 KI than WT mice.
My data show that the loss-of-function of the α2 Na,K-ATPase in FHM2 KI mice
causes an impairment of the glutamate clearance. This is likely linked to the specific
localization and functional coupling between α2 Na,K-ATPase and the glutamate
transporters in astrocyte processes surrounding cortical glutamatergic synapses
(Cholet et al., 2002; Rose et al., 2009). The loss-of-function of the pump might lead
to a decreased density of glutamate transporters on the astrocytes plasma membrane
or to a slowing of the glutamate transporter activity due to an increase in the Na+
intracellular local concentration.
Glial cells express two types of glutamate transporters, GLAST and GLT1 (Tzingounis
and Wadiche, 2007), whose expression is different during development and among
brain areas.
The exact type of glutamate transporter involved in the glutamate uptake by layer 1
astrocytes in P22-23 old mice is unknown. However, several lines of evidence indicate
that in the cortex and hippocampus, GLT-1 dominates functional uptake in the mature
astrocytes while GLAST plays a more prominent role in immature astrocytes (Furuta
et al., 1997; Armbruster et al., 2014; Danbolt, 2001). According to this, a recent study
in mouse cortical brain slices, showed a large inhibition by DHK (a specific inhibitor
of GLT1) of the STC elicited in P26-34 astrocytes of the deep cortical layers by
photolysis of caged glutamate. This indicates that in astrocytes, only slightly older than
those I used, GLT1 plays a major role in the glutamate clearance in the cortex.
Interestingly, unpublished findings (in collaboration with Prof. Fiorenzo Conti) show
that in layer 2/3 perisynaptic astrocytic processes of FHM2 KI mice both total and
membrane densities of GLT1 are significantly reduced compared to WT. This
reduction of GLT1 is consistent with my result of an impaired clearance of glutamate
by FHM2 KI astrocytes and suggests that a decreased density of GLT1 contributes to
it.
I surprisingly found that the STC amplitude after a single pulse stimulation was
higher in FHM2 KI than in WT mice. Given that the STC amplitude is proportional to
79
the glutamate release evoked at the synapses by the extracellular stimulation (Bergles
and Jahr, 1997; Diamond and Jahr, 2000), my result suggests that extracellular
stimulation elicits a larger glutamate release in FHM2 KI than in WT mice. Comparing
the amplitude of the glutamate current of the first pulse and of the tenth pulse of a train
stimulation in FHM2 KI and WT mice, I found that in WT mice there was no change
while in FHM2 KI mice the STC amplitude evoked by the tenth pulse was 54% lower
compared to that evoked by the first pulse. This finding is consistent with a larger
short-term depression of glutamate release in FHM2 KI compared to WT mice and
supports the conclusion that in FHM2 KI mice the evoked glutamate release is higher
than in WT mice. The mechanisms underlying this surprising finding remain unknown.
Both the reduced clearance of glutamate and the increased evoked glutamate release
may be implicated in the facilitation of CSD in FHM2 KI mice, as these mechanisms
are expected to lead to an enhanced activation of NMDA receptors. Activation of
NMDA receptors by glutamate released from recurrent cortical pyramidal cell
synapses plays a key role in the positive feedback cycle that provokes CSD (Pietrobon
and Moskowitz, 2014). In FHM1 KI mice, the causal link between increased glutamate
release and facilitation of experimental CSD has been demonstrated (Tottene et al.,
2009). Indeed, in FHM1 KI mice, CSD threshold is restored to the WT value by
restoring evoked glutamate release to the WT value through partial inhibition of P/Q-
type Ca2+ channels (Tottene et al., 2009).
The observation that age of the animals and recording temperature are two critical
experimental conditions to observe CSD facilitation, in brain slices of FHM2 KI mice,
is consistent with a critical role of impaired glutamate clearance in CSD facilitation.
Indeed, the glutamate uptake capacity changes during development (Bergles and Jahr,
1997; Diamond, 2005; Thomas et al., 2011): in hippocampal astrocytes, the SCT are
faster in adult than in juvenile and in juvenile than in neonatal rats (Diamond, 2005;
Bergles and Jahr, 1997), in agreement with biochemical studies indicating also that the
glutamate transporters protein levels increase during development (Furuta et al., 1997;
Thomas et al., 2011). Additionally, it is also reported that the rate of glutamate
transport is highly temperature dependent (Wadiche and Kavanaugh, 1998; Diamond
and Jahr, 2000). At physiological temperatures, hippocampal glial transporters are
capable of clearing glutamate released by high frequency extracellular stimulation very
efficiently, whereas, at room temperature, transporters appear overwhelmed during
long high frequency stimulation.
The second potential mechanism of CSD facilitation that I studied is the
impaired clearance of K+ by astrocytes during cortical neuronal activity. Given the
astrocytes high resting conductance for K+ ions due to high density of Kir channels,
the astrocytes are highly sensitive to changes in the extracellular K+ levels associated
with neuronal activity (Kofuji and Newman, 2004). A measure of the external K+
increase produced by neuronal stimulation is provided by the TBOA-insensitive
slowly decaying current, that is mainly due to K+ influx through Kir channels and is
80
proportional to the change in K+ Nernst potential consequent to neuronal K+ efflux
produced by electrical stimulation (Meeks and Mennerick, 2007; Bernardinelli and
Chatton, 2008). The τ of the decay of this K+ current provides an indirect measure of
the rate of K+ clearance by astrocytes. I measured the τ of the decay of the K+ current
elicited in layer 1 astrocytes by extracellular stimulation of the same layer in the
absence of synaptic receptors blockers. Preliminary experiments showed that the τ of
the decay of the K+ current evoked by train stimulation was similar in WT and FHM2
KI mice, likely indicating that there are no changes in the rate of K+ clearance in FHM2
KI mice compared to WT. Pharmacological evidence indicates that α2 and/or α3 Na,K-
ATPase participate in the clearance of K+ during intense neuronal activity (Haglund
and Schwartzkroin, 1990; Ransom et al., 2000; D’Ambrosio et al., 2002), but the
relative importance of these two pumps remains unclear. If confirmed after increasing
the sample, my data suggest that the α2 Na,K-ATPase plays a minor role in K+
clearance. The observation of an unaltered CSD duration in the in vivo study between
FHM2 KI and WT mice (Leo et al., 2011) is consistent with this conclusion, since in
hippocampal slices it has been showed that blocking α3 and α2, by local administration
of ouabain (a Na,K-ATPase inhibitor), CSD duration increases (Haglund and
Schwartzkroin, 1990).
These data suggest that CSD facilitation in FHM2 KI mice is not primarily due to an
impaired K+ clearance by astrocytes, as a consequence of the 50% reduction in the
amount of α2 Na,K-ATPase (Leo et al., 2011).
I finally investigated whether the Ca2+ content in the intracellular Ca2+ stores
of astrocytes in FHM2 KI mice is increased. By integrating the Ca2+ transient, induced
in cultured cortical astrocytes by ionomycin in Ca2+-free medium, I obtained an
indirect measure of the Ca2+ amount in the stores. I found that in FHM2 KI mice the
amount of Ca2+ released from the intracellular Ca2+ stores by ionomycin was nearly
60% higher compared to WT mice, indicating that the Ca2+ content is increased in the
intracellular Ca2+ stores of astrocytes in FHM2 KI mice. This finding is in agreement
with previous measurements of elevated levels of Ca2⁺ ions in the cytoplasm and in
the endoplasmic reticulum in cultured astrocytes from in ATP1A2-/- KO mice
(Golovina et al., 2003).
The increased Ca2+ content in the stores is probable a consequence of the tight coupling
of the α2 Na,K-ATPase with the Na+/Ca2+ exchanger at plasma membrane
microdomains that overlay the endoplasmic reticulum (Lencesova et al., 2004;
Golovina et al., 2003). Indeed, the Na+/Ca2+ exchanger activity is regulated by the
Na,K-ATPase, via its influence on the Na+ electrochemical gradient across the plasma
membrane. Therefore, the reduction of the Na+ concentration gradient across the
plasma membrane at the level of this microdomains, caused by the loss-of-function of
α2 Na,K-ATPase, may result in local accumulation of Ca2+ in the space between the
plasma membrane microdomain and the adjacent endoplasmic reticulum, which can
account for the enhanced Ca2+ concentration into the Ca2+ stores.
81
I then investigated whether the increased Ca2+ concentration into the astrocytes
contributes to facilitation of experimental CSD in FHM2 KI mice. By evaluating CSD
threshold and velocity before and after depletion of intracellular Ca2+ stores by CPA
(a SERCA inhibitor), I observed that depletion of Ca2+ stores reduces the facilitation
of CSD in FHM2 KI mice, without affecting CSD in WT mice. These data suggest a
role of increased Ca2+ concentration inside the intracellular stores in astrocytes in the
facilitation of experimental CSD in FHM2 KI mice. A possible underlying hypothesis
is that the increased Ca2+ content may lead to a larger release of gliotransmitters,
including glutamate, in response to synaptic activity.

82
83
8. MATERIALS AND METHODS
8.1. Animals
The study of spontaneous recurrent cortical activity (described in Results I)
was performed using WT C57Bl/6J mice (genetic background: 87.5 %). The study was
performed using both male and female mice from postnatal day 16 to 19 (P16-19), and
summary data show results from both sexes.
All the experiments to study the mechanisms of susceptibility to CSD in a
mouse model of FHM2 (described in Results II) were performed on brain slices from
heterozygous KI mice carrying the human W887R mutation in the ATP1A2
orthologous gene (as described in Leo et al., 2011) and the corresponding WT mice.
FHM2 KI mice in the following age range P16-18, P22-23, P28-29 and P34-35,
together with age-matched WT mice were used. Experiments from WT and KI mice
of similar age were alternated on a daily basis. Both male and female mice were used
and summary data show results from both sexes. For confirmatory genotyping of the
heterozygous FHM2 KI mice, DNA was extracted from finger, ear clip or tail and
analyzed by PCR using the previously described primers (Leo et al., 2011).
Mice were housed under constant temperature (22 ± 1°C), humidity (50%) and
acoustic isolation conditions with a 12 hours light/dark cycle, and were provided with
food and water ad libitum.
All experimental procedures were carried out in accordance with the Italian Animal
Welfare Act and approved by the local authority veterinary service.
8.2. Coronal cortical slices preparation
Acute coronal slices of the barrel cortex were prepared for both the projects.
8.2.1. Solutions
standard Artificial Cerebrospinal Fluid (sACSF): NaCl 125 mM, KCl 2.5 mM,
MgCl2 1 mM, CaCl2 2 mM, NaHCO3 25 mM, NaH2PO4 1.25 mM, glucose 25 mM,
minocycline 50 nM, saturated with 95% O2 and 5% CO2 (pH 7.4 with NaOH).
Gluconate Cutting Solution (GCS): KGluconate 130 mM, KCl 15 mM, EGTA
0.2 mM, HEPES 20 mM, glucose 25 mM, kynurenic acid 2 mM, minocycline 50 nM
saturated with 100% O2 (pH 7.4).
Mannitol Cutting Solution (MCS): D-mannitol 225 mM, glucose 25 mM, KCl
2.5 mM, NaH2PO4 1.25 mM, NaHCO3 26 mM, CaCl2 0.8 mM, MgCl2 8 mM,
kynurenic acid 2 mM, minocycline 50 nM, saturated with 95% O2 and 5% CO2 (pH
7.4).
84
GCS, MCS and sACSF contain minocycline (SIGMA), a microglia inhibitor,
to prevent immune responses. GCS and MCS contain also kynurenic acid (Abcam
Biochemicals), a NMDA receptor blocker, to prevent excitotoxicity during slices
cutting.
8.2.2. Slices preparation
Slice cutting protocol adopted in our laboratory has been developed by Dr.
Stephane Dieudonné (École Normale de Paris) working in Prof Philippe Ascher’s
group. This protocol (described in Dugué et al., 2005) is characterized by the presence
of the GCS, which mimics the intracellular ionic composition to enhance the recovery
of neurons after cutting; moreover, the concentration of extracellular Ca2+ is set to 0
mM to prevent neuronal activity, thus preventing excitotoxicity.
Mice were anesthetized with isofluorane and decapitated; the whole head was
immediately put into ice-cold ACSF, where the scalp was removed and the skull
opened. The brain was quickly removed and placed, with its ventral surface up, in fresh
an ice-cold ACSF solution. A cut perpendicular to the anteroposterior axis was made
to remove the cerebellum and to create a basis surface for fixing the brain to the slicer
stage. The tissue was then lightly blotted on filter paper and glued with cyanoacrylate
glue onto the stage of a vibratome (Leica VT1000S) with the pial surface toward the
blade. The glue was allowed a few seconds to dry and then the tissue was totally
immersed in an ice-cold (2-3°C) GCS. A few (depending on brain size) slices were cut
and discarded; the remaining tissue was cut into 350 μm thick slices and left and right
hemispheres were separated. Slices putatively containing the barrel cortex were
transferred at room temperature (RT) for 1 minute in MCS. This solution present an
ionic composition intermediate between GCS and sACSF solution and allowed an
intermediate recovery passage for slices before being transferred in sACSF solution.
Slices were then transferred in sACSF solution at 30°C for 30 minutes and finally at
RT for 30 minutes, to allow neurons recovering from the cutting procedure. Each slice
was maintained for at least 20 minutes in recording solution before being used for
electrophysiological recordings.
All the experiments were performed within 6 hours from the decapitation of
the animal.
8.3. Patch clamp technique
The patch clamp technique allows single channel or whole cell currents to be
recorded with the advantage of controlling the intracellular medium.
A glass micropipette with an open tip diameter (~1-2 μm) is filled with a suitable
solution that usually matches the cytoplasm ionic composition. The pipette contains a
silver electrode covered with silver chloride that is connected to a feedback amplifying
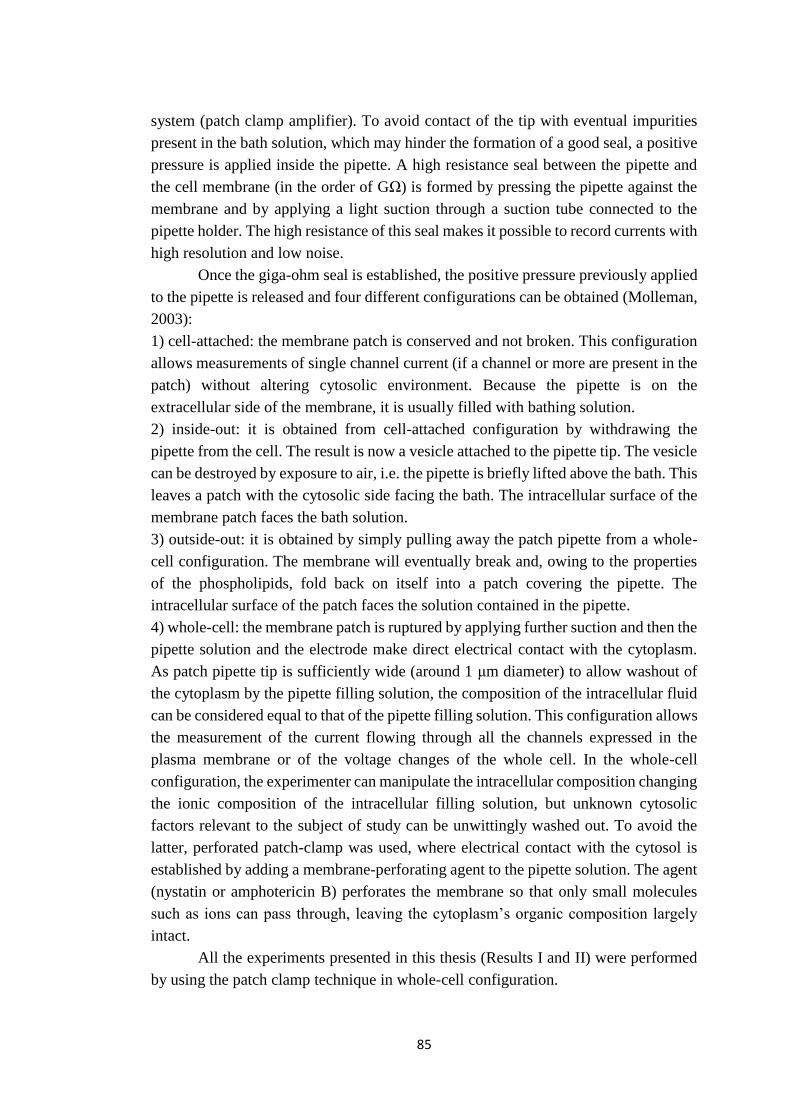
85
system (patch clamp amplifier). To avoid contact of the tip with eventual impurities
present in the bath solution, which may hinder the formation of a good seal, a positive
pressure is applied inside the pipette. A high resistance seal between the pipette and
the cell membrane (in the order of GΩ) is formed by pressing the pipette against the
membrane and by applying a light suction through a suction tube connected to the
pipette holder. The high resistance of this seal makes it possible to record currents with
high resolution and low noise.
Once the giga-ohm seal is established, the positive pressure previously applied
to the pipette is released and four different configurations can be obtained (Molleman,
2003):
1) cell-attached: the membrane patch is conserved and not broken. This configuration
allows measurements of single channel current (if a channel or more are present in the
patch) without altering cytosolic environment. Because the pipette is on the
extracellular side of the membrane, it is usually filled with bathing solution.
2) inside-out: it is obtained from cell-attached configuration by withdrawing the
pipette from the cell. The result is now a vesicle attached to the pipette tip. The vesicle
can be destroyed by exposure to air, i.e. the pipette is briefly lifted above the bath. This
leaves a patch with the cytosolic side facing the bath. The intracellular surface of the
membrane patch faces the bath solution.
3) outside-out: it is obtained by simply pulling away the patch pipette from a whole-
cell configuration. The membrane will eventually break and, owing to the properties
of the phospholipids, fold back on itself into a patch covering the pipette. The
intracellular surface of the patch faces the solution contained in the pipette.
4) whole-cell: the membrane patch is ruptured by applying further suction and then the
pipette solution and the electrode make direct electrical contact with the cytoplasm.
As patch pipette tip is sufficiently wide (around 1 μm diameter) to allow washout of
the cytoplasm by the pipette filling solution, the composition of the intracellular fluid
can be considered equal to that of the pipette filling solution. This configuration allows
the measurement of the current flowing through all the channels expressed in the
plasma membrane or of the voltage changes of the whole cell. In the whole-cell
configuration, the experimenter can manipulate the intracellular composition changing
the ionic composition of the intracellular filling solution, but unknown cytosolic
factors relevant to the subject of study can be unwittingly washed out. To avoid the
latter, perforated patch-clamp was used, where electrical contact with the cytosol is
established by adding a membrane-perforating agent to the pipette solution. The agent
(nystatin or amphotericin B) perforates the membrane so that only small molecules
such as ions can pass through, leaving the cytoplasm’s organic composition largely
intact.
All the experiments presented in this thesis (Results I and II) were performed
by using the patch clamp technique in whole-cell configuration.
86
8.3.1. Patch clamp mode
The patch clamp technique offers the possibility to perform experiments in two
different configurations: the voltage clamp and the current clamp.
The voltage clamp method (or voltage clamp recording mode) allows recording
of ionic currents across the cell membrane at potential set by the operator (holding
potential); this is achieved by a current-voltage converter that produces a voltage
output that is proportional to the current input. In this way, any deviation of the
recorded potential from the holding potential is instantly corrected by compensatory
current injection; this current is an accurate representation (but opposite in sign) of the
ionic current over the membrane under investigation.
The current clamp method (or current clamp recording mode) allows recording
of the membrane potential variations after injections into a cell of amounts of current
(even null) through the recording electrode.
Unlike the voltage clamp mode, in the current clamp mode the membrane potential is
not clamped but can vary freely and the amplifier records spontaneous voltage
variations or voltage deflections evoked by stimulations. Similarly to the voltage
clamp recording mode, the current flow through the electrode produces a voltage drop
across the electrode that depends on the product of the current and of the resistance of
the electrode and this voltage drop will add to the recorded potential. In current clamp
mode, the bridge balance control is used to balance out this voltage drop so that only
the membrane potential is recorded. A differential amplifier is used to subtract a scaled
fraction (the scaling factor is the pipette resistance) of the current from the voltage
recorded in order to give the true membrane potential. The capacitance of the pipette
is also corrected with the pipette capacitance neutralization function.
8.4. Patch clamp setup and recordings
During experiments, brain slices were put in a submerged recording chamber
mounted on the stage of an upright microscope (Nikon Instruments, Eclipse E600FN)
and held down with a handmade harp. The slice was continuously perfused with fresh
extracellular solution saturated with 95% O2 and 5% CO2 at 3-6 mL/min using a
peristaltic pump (Gilson, Miniplus 3). The extracellular solutions first passed through
5 ml syringes to avoid bubbles reaching the perfusion chamber and to create a break
in the solution lines thus preventing these acting as aerials for noise; the solutions
reached then the experimental chamber. Drugs were applied through separate
perfusion lines. Lines were primed to speed up the application (the time for solution
exchange was approximately 2 minutes).
Experiments described in Results (I) were performed at RT using a flow rate
of 3 mL/min.
Experiments presented in Results (II) were conducted at RT or at 30°C, as
indicated, with in general a flow rate of 3 mL/min. An exception to this are the
87
experiments to evaluate CSD threshold and velocity at 30°C, in which the flow rate
was increased to 6 mL/min, in order to ensure the best oxygenation of the slice, critical
for CSD recordings (Takano et al., 2007).
8.4.1. Microscope
Slices observations and recordings were made with an upright microscope
(Nikon Instruments, Eclipse E600FN) using infrared differential interference contrast
(IR DIC) optics to introduce contrast into nonabsorbent objects. Light is first polarized
and then passed through Wollaston prism, which splits light into two quasi-parallel
beams. The light then passes through the specimens so that some beams will pass
through the object and others to the edge of it. Beams that pass through the object will
be slightly refracted with respect to those that do not. Both of the beams then pass
through another Wollaston prism, which recombines them. Finally, the light passes
through a polarizing filter. Beams that have been refracted by an object will appear a
different shade to those that have not, due to constructive or destructive interference
on recombination of the beams, giving a perception of contrast.
Slices were first visually inspected with a 10X objective and then with a water
immersion objective (60X) for a detailed observation of cells and for the
electrophysiological recordings.
Two CCD cameras (Hamamatsu Photonics K.K., Hitachi) were fitted on the
microscope and connected to a monitor for a live view acquisition on two different
displays.
The microscope and the manipulators were supported by an anti-vibration table
(Micro-g, TMC) and surrounded by a homemade Faraday cage.
8.4.2. Electrophysiological setup
For both projects, electrical signals were recorded through a Multiclamp 700B
patch-clamp amplifier connected to an analogical to digital converter (Digidata 1550)
interface and pClamp software (all from Axon Instruments).
The CV-7B headstage contains a current to voltage (I-V) converter used in
voltage clamp mode and a voltage follower used in current clamp mode. A recording
electrode filled with the intracellular medium described before is introduced in an
appropriate holder containing a silver chloride wire linking the electrode to the
headstage. A silver chloride earth electrode links the bath to the headstage. The
headstage is connected to a motorized micromanipulator (Luigs & Neumann) allowing
precise positioning of the electrode under microscopic control.
All the experiments have been done using whole-cell single or double patch
clamp recordings in current clamp or voltage clamp mode. For dual, simultaneous

88
patch clamp experiments to record the spontaneous recurrent cortical activity (Results
I), cells were 100-150 μm apart from each other.
8.4.3. Cell identification
All the experiments were performed on coronal slices of somatosensory cortex
(barrel cortex). This cortical area was recognized by the presence of barrel-like typical
structures in the layer 4 (Petersen, 2007). In order to standardize the condition of slices
healthy, recordings were made only from slices in which the number of death cells at
45 μm depth was not greater than 3 in a 228 X 172 µm field.
8.4.3.1. Pyramidal cells identification
Recordings of the spontaneous recurrent cortical activity (Results I) were
performed on layer 2/3 pyramidal cells of barrel cortex. The cells recorded were deeper
than 45 μm from the surface with a dendritic arborization almost parallel to the plane
of the cut. The pyramidal cells were first visually identified according to their soma
shape (triangular soma with two basal dendrites, a main apical dendrite that elongates
to the layer 1 and the axon spreading in the deeper layers or other cortical regions)
(Fig. 8.1a-b).
Figure 8.1. Morphological and electrophysiological characterization of pyramidal cells in layer
2/3 of somatosensory cortex in WT mice brain slice.
a, b) A pair of pyramidal cells was recorded simultaneously in layer 2/3 of somatosensory cortex. Both
cells were filled with biocytin during whole-cell recording and processed with the Vector ABC method.
The pictures were acquired with an upright microscope using a DIC optics. On the left, a 10X
magnification; on the right, a 60X magnification.
c) Electrophysiological response of a pyramidal cell to a depolarizing step (200 pA injection). The cell
depolarizes from -70 mV and fires action potentials.
Additionally, the characteristic AP-firing induced by supra-threshold current
injections of increasing amplitudes up to 400 pA in current-clamp was evaluated (Fig.
8.1c). The firing of pyramidal cells indeed shows a typical spike frequency adaptation
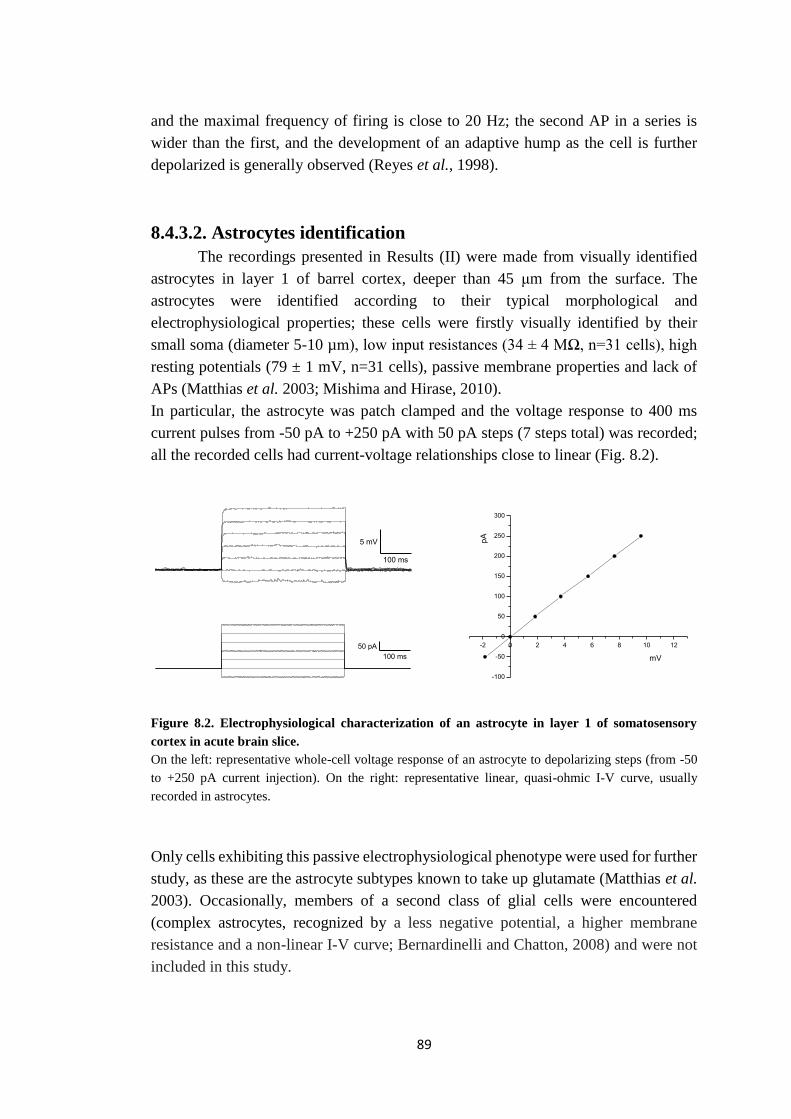
89
and the maximal frequency of firing is close to 20 Hz; the second AP in a series is
wider than the first, and the development of an adaptive hump as the cell is further
depolarized is generally observed (Reyes et al., 1998).
8.4.3.2. Astrocytes identification
The recordings presented in Results (II) were made from visually identified
astrocytes in layer 1 of barrel cortex, deeper than 45 μm from the surface. The
astrocytes were identified according to their typical morphological and
electrophysiological properties; these cells were firstly visually identified by their
small soma (diameter 5-10 µm), low input resistances (34 ± 4 MΩ, n=31 cells), high
resting potentials (79 ± 1 mV, n=31 cells), passive membrane properties and lack of
APs (Matthias et al. 2003; Mishima and Hirase, 2010).
In particular, the astrocyte was patch clamped and the voltage response to 400 ms
current pulses from -50 pA to +250 pA with 50 pA steps (7 steps total) was recorded;
all the recorded cells had current-voltage relationships close to linear (Fig. 8.2).
Figure 8.2. Electrophysiological characterization of an astrocyte in layer 1 of somatosensory
cortex in acute brain slice.
On the left: representative whole-cell voltage response of an astrocyte to depolarizing steps (from -50
to +250 pA current injection). On the right: representative linear, quasi-ohmic I-V curve, usually
recorded in astrocytes.
Only cells exhibiting this passive electrophysiological phenotype were used for further
study, as these are the astrocyte subtypes known to take up glutamate (Matthias et al.
2003). Occasionally, members of a second class of glial cells were encountered
(complex astrocytes, recognized by a less negative potential, a higher membrane
resistance and a non-linear I-V curve; Bernardinelli and Chatton, 2008) and were not
included in this study.
B
-80 mV
100 ms
5 mV
B
100 ms
50 pA -2 0 2 4 6 8 10 12
-100
-50
0
50
100
150
200
250
300
pA
mV
90
8.4.4. Solutions
8.4.4.1. Extracellular solutions
The experiments described in Results (I) were performed using a Modified
Artificial Cerebrospinal Fluid (mACSF): 125 mM NaCl, 3.5 mM KCl, 1 mM CaCl2,
0.5 mM MgCl2, 25 mM NaHCO3, 1.25 mM NaH2PO4, 25 mM Glucose, saturated with
95% O2 e 5% CO2 (pH 7.4 with 5% CO2).
The extracellular solution (mACSF) differs from the sACSF solution because
of a concentration of K+ ions slightly higher and a relatively lower concentration of
Ca2+ and Mg2+ ions, which make mACSF solution more similar to the cerebrospinal
fluid than sACSF solution. Under these conditions, the spontaneous activity of cortical
circuitry is increased compared to that observed in the presence of standard solution
(Sanchez-Vives et al., 2000).
For the experiments presented in Results (II), I used a mACSF solution (with
1 mM Mg2+, more similar to the concentration in the cerebrospinal fluid than 0.5 mM
used for up-states recordings) to measure CSD threshold and velocity. The
composition of the extracellular solution used for the recordings from astrocytes was:
125 mM NaCl, 2.5 mM KCl, 1 mM MgCl2, 1 mM CaCl2, 25 mM NaHCO3, 1.25 mM
NaH2PO4, 25 mM glucose, saturated with 95% O2 and 5% CO2 (pH 7.4 with NaOH).
This extracellular solution is similar to the sACSF solution, except for the reduced
Ca2+ content to 1 mM (instead of 2 mM) and for the absence of minocycline.
8.4.4.2. Intracellular solutions
The electrodes were filled with different intracellular solutions depending on
the recording mode.
For current clamp recordings from neurons, the pipette solutions contained (in
mM): 114 K-gluconate, 6 KCl, 4 MgATP, 0.3 NaGTP, 10 Na-Phosphocreatine, 10
HEPES (pH 7.25 with KOH, osmolarity 300 mOsm with sucrose).
The internal solution for voltage clamp recordings from neurons contained (in
mM): 114 CsMetansulfonate, 6 KCl, 4 MgATP, 0.3 NaGTP, 10 Na-Phosphocreatine,
5 QX-314, 10 HEPES (pH 7.25 with KOH, osmolarity 300 mOsm with sucrose). The
use of cesium instead of potassium allowed reducing the leak currents underlined by
potassium fluxes. QX-314 was used to block Na+ channels and prevent unwanted
unclamped APs.
The internal solution for voltage clamp recordings from astrocytes contained
(in mM): 115 K-gluconate, 6 KCl, 4 MgATP, 0.3 NaGTP, 10 Na-Phosphocreatine, 10
HEPES, 5 glucose (pH 7.25 with KOH, osmolarity 295 mOsm with sucrose).
The intracellular medium was filtered using a 0.2 µm filter (Sartorius).
91
8.4.4.3. Drugs and toxins
Concentrations used for the experiments in Results (I): D-AP5 50 µM (Abcam
Biochemicals), NBQX 10 µM (Abcam Biochemicals), ω-AgaIVA 400 nM (Peptide
Institute Inc.), ω-CgTxGVIA 1 µM (Bachem), QX-314 5 mM (Abcam Biochemicals).
Concentrations used for the experiments in Results (II): CPA 50 µM (Abcam
Biochemicals), TFB-TBOA 15 µM (Tocris), D-AP5 50 µM (Abcam Biochemicals),
NBQX 10 µM (Abcam Biochemicals), bicuculline 20 µM (Abcam Biochemicals),
MK-801 20 µM (Abcam Biochemicals).
Cytochrome C (0.1 mg/ml, Sigma-Aldrich) was added to the solutions with peptide
toxins.
8.4.5. Electrodes
8.4.5.1. Recording electrode
Patch-clamp pipettes were obtained from borosilicate capillaries (Wiretrol II 5-
000-2050), previously polished by fire and alcohol, using the puller P-95 (Sutter
Instruments). The resistance of pipettes in the bath used for recordings from neurons
ranged between 3 and 5 MΩ, while to record astrocytes the resistance was 5-7 MΩ.
8.4.5.2. Stimulating electrode
The layer 1 neuronal fibers (Results II) were stimulated using a concentric
bipolar electrode (WPI TM33CCINS Tungsten 3" 76 Imp 10-15K Probe outer
diameter 0.016 insulated 400 microm, core diameter 003" 76 microm y 0.4mm, X dim
w/polyimide .005" 127 microm). The stimulating electrode was lowered into the bath
and advanced towards the zone to be stimulated using a micromanipulator (Luigs &
Neumann). The stimulating electrode was positioned at least 200 μm apart from the
patch pipette in layer 1. The stimulating electrode was connected to a constant voltage
isolated stimulator (Digitimer LTD) and neuronal afferent fibers were stimulated by
applying a single pulse stimulus of 100 μsec of 100 µA, a double pulses at 20 Hz
frequency and 10-9 pulses stimulation at 50 Hz and 100 Hz frequencies.
8.4.6. Data acquisition and analysis
Current and voltage clamp recordings from neurons (Results I) were acquired
using Clampex 10.4 at a sampling rate of 10 kHz and filtered at 1-4 kHz using a 8-
pole Bessel filter built within the software and analyzed using Clampfit 10.4 of the
pClamp suite (PClamp 10.4, Axon, Molecular Devices).
92
Signals in voltage clamp from astrocytes (Results II) were low-pass filtered at
2 kHz and sampled at 10 kHz.
Data were corrected offline for the calculated liquid junction potential (LJP) of
each solution: LJP measured at the pipette tip was -10 mV for the intracellular solution
used in voltage clamp recordings from neurons and astrocytes, -12 mV for the
intracellular solution used in current clamp recordings from neurons and -12 mV for
intracellular solution used for recordings from astrocytes. LJP should be added to all
voltages to obtain the correct values of membrane potential in whole-cell recordings
(Neher, 1992).
8.4.6.1. Recordings and analysis of spontaneous recurrent cortical
activity
Only pyramidal cells with a resting potential between -70 mV and -80 mV and
an access resistance below 30 MΩ (with less than 25% variation) were included in the
analysis.
The spontaneous recurrent activity in current clamp mode was recorded at the
resting potential without injecting current. The up-states duration was measured from
their onset to their retuning to the resting potential (or, if a double exponential decay
was present, to the end of the first phase of the exponential decay). In the analysis of
the effect of P/Q-type Ca2+ channels block, the duration of both up-states and simil-
interictal epileptiform events was measured at half amplitude. The amplitude was
estimated as the difference between the potential preceding the events and the mean
value of the depolarization. The frequency was expressed as the number of up-states
per minute.
Pyramidal neurons were voltage-clamped at the Cl- reversal potential (-69 mV)
for spontaneous excitatory postsynaptic currents (sEPSCs) recordings and at the
reversal potential for excitatory currents (+20 mV) for spontaneous inhibitory
postsynaptic currents (sIPSCs) recordings, with no series resistance (Rs)
compensation.
sEPSCs and sIPSCs bursts durations were estimated by calculating the time between
their onset (at the beginning of the inputs temporal summation over baseline) and the
change of slope during the return of the current to the baseline level.
The mean excitatory and inhibitory synaptic conductances (Ge and Gi) in individual
pyramidal cells during the recurrent network activity underlying the up-states were
obtained by dividing the mean excitatory and inhibitory synaptic currents for the
driving force (assuming a linear I-V relationship). The mean excitatory and inhibitory
synaptic currents were obtained averaging the ratio of the synaptic charge (calculated
from the baseline-adjusted voltage clamp recordings by integrating the current over
time) of each sPSC over its duration.
93
A pharmacological approach with specific Ca2+ channel blockers was used to
investigate the involvement of Ca2+ channels in spontaneous recurrent cortical activity.
P/Q-type Ca2+ channel contribution was determined comparing the activity before and
after the continuous application of saturating concentration of a specific blocker for
this Ca2+ channel, ω-agatoxin IVA (400 nM), in the extracellular solution. The same
approach was used to determine the role of N-type Ca2+ channels by applying
saturating concentration of ω-conotoxin GVIA, a specific blocker for N-type Ca2+
channels.
8.4.6.2. Recordings and analysis of STC and K+ currents from
astrocytes
Only astrocytes with a -80 ± 5 mV resting potential and an access resistance
below 25 MΩ (with less than 25% variation) were included in the analysis.
In voltage-clamp recordings, astrocytes were clamped at -80 mV. To record the
STC, during whole-cell patch recordings from astrocytes in the layer 1 of
somatosensory cortex slices, AMPA, NMDA, and GABAA receptors were blocked
using specific antagonists (NBQX, D-AP5, MK-801 and bicuculline; Bergles and Jahr,
1997; Bernardinelli and Chatton, 2008). Under these conditions, stimulation of the
fibers in layer 1 generates an inward current comprising fast and slow components.
The transporter antagonist TFB-TBOA (15 µM) blocked the fast component,
identifying it as the STC. The slower component mainly reflects a K+ conductance
caused by an increase in extracellular K+ due to K+ efflux through voltage-gated K+
channels during the APs and through the NMDA receptors (Bergles and Jahr, 1997).
To isolate the STC of the single pulse, the response to single pulse in the
presence of TFB-TBOA was subtracted to the response in control condition. To isolate
the STC of the tenth pulse in a train of pulses delivered at 50 or 100 Hz, first the tenth
pulse was isolate by subtracting a train of nine pulses from a train of ten pulses. Then,
the current evoked in the presence of TFB-TBOA by a single stimulus was subtracted
to this isolated response to the tenth pulses, in order to obtain the STC of the tenth
pulse.
The STC decay was fitted with a single exponential function (y = A * exp(-x/τ)
+ y0, where A is the amplitude, y0 is the value at steady state, τ is the time constant, x
is the time at which the decay starts) and the time constant (τ) was obtained, providing
a measure of the rate of glutamate clearance.
The K+ current was recorded in separated experiments, delivering single and
train stimulation in the absence of synaptic receptors blockers (NBQX, D-AP5, MK-
801 and bicuculline; Bergles and Jahr, 1997; Bernardinelli and Chatton, 2008). The
K+ current decay was fitted with a single exponential function (y = A*exp(-x/τ) +y0)
and τ was obtained, providing a measure of the rate of K+ clearance.
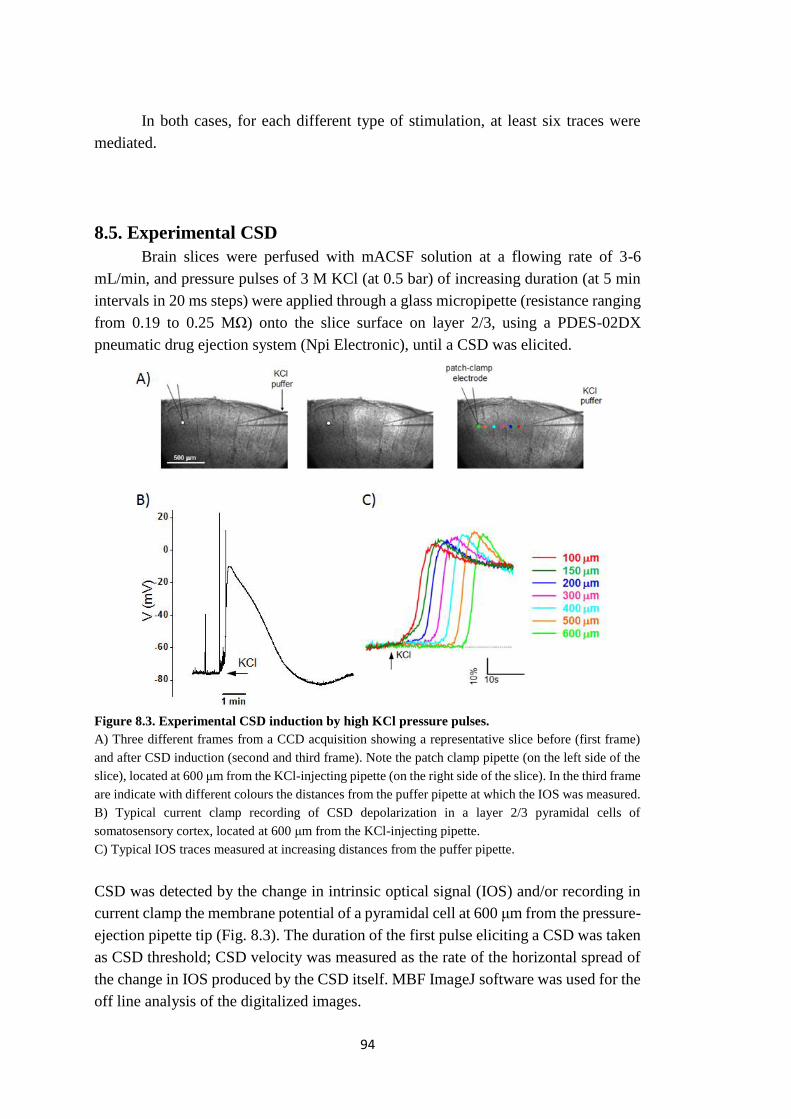
94
In both cases, for each different type of stimulation, at least six traces were
mediated.
8.5. Experimental CSD
Brain slices were perfused with mACSF solution at a flowing rate of 3-6
mL/min, and pressure pulses of 3 M KCl (at 0.5 bar) of increasing duration (at 5 min
intervals in 20 ms steps) were applied through a glass micropipette (resistance ranging
from 0.19 to 0.25 MΩ) onto the slice surface on layer 2/3, using a PDES-02DX
pneumatic drug ejection system (Npi Electronic), until a CSD was elicited.
Figure 8.3. Experimental CSD induction by high KCl pressure pulses.
A) Three different frames from a CCD acquisition showing a representative slice before (first frame)
and after CSD induction (second and third frame). Note the patch clamp pipette (on the left side of the
slice), located at 600 μm from the KCl-injecting pipette (on the right side of the slice). In the third frame
are indicate with different colours the distances from the puffer pipette at which the IOS was measured.
B) Typical current clamp recording of CSD depolarization in a layer 2/3 pyramidal cells of
somatosensory cortex, located at 600 μm from the KCl-injecting pipette.
C) Typical IOS traces measured at increasing distances from the puffer pipette.
CSD was detected by the change in intrinsic optical signal (IOS) and/or recording in
current clamp the membrane potential of a pyramidal cell at 600 μm from the pressure-
ejection pipette tip (Fig. 8.3). The duration of the first pulse eliciting a CSD was taken
as CSD threshold; CSD velocity was measured as the rate of the horizontal spread of
the change in IOS produced by the CSD itself. MBF ImageJ software was used for the
off line analysis of the digitalized images.
95
To test the effect of CPA, CSD threshold and velocity were measured in control
condition and in different experiments during the perfusion with mACSF solution plus
CPA.
8.6. Measurements of Ca2+ transients in astrocytic primary cultures
The Ca2+ transients were measured in cortical astrocytes primary cultures at 7-
10 DIV, obtained from P7-8 old WT and FHM2 KI mice; brain cortex was treated
following the procedure of Levi et al., 1984 and then the cells were cultured under
conditions promoting astrocytes growth.
For the Ca2+ transient recordings, cells, plated on coverslips, were loaded with
fura-2 by incubation with 3 μM fura-2/AM at RT for 30 minutes and then at 37°C for
another 30 minutes in modified Krebs-Ringer Buffer (mKRB, in mM: 140 NaCl, 2.8
KCl, 2 MgCl2, 1 CaCl2, 10 HEPES, 11 glucose, pH 7.4, at 37°C) containing 0.04%
pluronic acid. To prevent fura-2 leakage and sequestration, 250 μM sulfinpyrazone
was present throughout the loading procedure and the Ca2+ measurement. The
coverslips were washed with mKRB, mounted on a thermostated chamber, placed on
the stage of an inverted microscope (Zeiss, Axiovert 100 TV) equipped for single cell
fluorescence measurements and imaging analysis (TILL Photonics, Martinsried,
Germany). The sample was alternatively illuminated (t = 10 ms) by monochromatic
light (at 340 and 380 nm) every second through a 20X objective. The emitted
fluorescence passed through a dichroic beamsplitter, filtered at 505-530 nm and
captured by a cooled CCD camera. The ratios (F340/F380) were offline normalized to
the resting value measured within the first minute of the experiment.
The Ca2+ concentrations, expressed as the ratio F340/F380, were obtained from single
WT and FHM2 KI astrocytes loaded with Fura-2, in an experiment in which EGTA
(1.5 mM) and ionomycin (1 μM) were added. The area under the Ca2+ transient curve
of individual astrocytes was calculated to obtain an indirect measure of the Ca2+
content in the stores and the values from individual cells were averaged to obtain the
mean values in WT and FHM2 KI mice.
8.7. Statistical analysis
All averages were calculated with Microsoft Excel. Graphs, exponential fitting
and statistical comparison were obtained with the Origin software (Microcal Software,
Inc.). Data are given as mean ± standard error of the mean (SEM); stars indicate a
statistically significant difference from control assessed by the Student’s t test (* p <
0.05, ** p < 0.01 and *** p < 0.001).

96
97
ABBREVIATIONS
AMPA: (RS)-α-amino-3-hydroxy-5-methyl-4-isoxadepropionate
AP: action potential
ATP: adenosine-5'-triphosphate
BOLD: blood oxygenation level-dependent
Ca2+: calcium ion
CaV: voltage-gated Ca2+ channels
Cd2+: cadmium ion
Cl-: chloride ion
CPA: cyclopiazonic acid
CSD: cortical spreading depression
D-AP5: D(-)-2-amino-5-phosphonopentanoic acid
DIV: day in vitro
EGTA: ethylene glycolbis (b-aminoethyl ether) N,N,N',N'-tetraacetic acid
EPSC: excitatory postsynaptic current
EPSP: excitatory postsynaptic potential
FHM1: familial hemiplegic migraine type 1
FHM2: familial hemiplegic migraine type 2
FS: fast-spiking
GABA: γ-aminobutyric acid
GAT: GABA transporters
GCS: gluconate cutting solution
Ge: excitatory synaptic conductance
Gi: inhibitory synaptic conductance
GTP: guanosine-5'-triphosphate
H+: hydrogen ion
HEPES: N-2-hydroethylpiperazine-N'-2-ehanesulfonic acid
IOS: intrinsic optic signal
IPSC: inhibitory postsynaptic current
IPSP: inhibitory postsynaptic potential
IR: infrared
K+: potassium ion
KI: knock-in
KO: knock-out
LJP: liquid junction potential
MA: migraine with aura
MO: migraine without aura
mACSF: modified artificial cerebrospinal fluid
MCS: mannitol cutting solution
98
NBQX: 2,3-Dioxo-6-nitro-1,2,3,4-tetrahydrobenzo[f]quinoxaline-7-sulfonamide
NMDA: N-methyl-D-aspartate
P: postnatal day
PSC: postsynaptic current
RT: room temperature
sACSF: standard artificial cerebrospinal fluid
STC: synaptically-activated glutamate transporter-mediated current
WT: wild-type
ω-AgaIVA: ω-agatoxin IVA
ω-CgTxGVIA: ω-conotoxin GVIA

99
REFERENCES
Ali AB, Nelson C. Distinct Ca2+ channels mediate transmitter release at excitatory
synapses displaying different dynamic properties in rat neocortex. Cereb
Cortex 2006;16:386-393.
Amaral DG. Chapter 17: The Anatomical Organization of the Central Nervous System.
Principles of Neural Science, Kandel ER, Schwartz JS, Jessell TM. McGraw-
Hill 2000.
Anderson CM, Swanson RA. Astrocyte glutamate transport: review of properties,
regulation, and physiological functions. Glia 2000;32(1):1-14.
Araque A, Parpura V, Sanzgiri RP, Haydon PG. Tripartite synapses: glia, the
unacknowledged partner. Trends Neurosci 1999;22(5):208-15.
Araque A, Carmignoto G, Haydon PG, Oliet SH, Robitaille R, Volterra A.
Gliotransmitters travel in time and space. Neuron 2014;81(4):728-39.
Armbruster M, Hampton D, Yang Y, Dulla CG. Laser-scanning astrocyte mapping
reveals increased glutamate-responsive domain size and disrupted maturation
of glutamate uptake following neonatal cortical freeze-lesion. Front Cell
Neurosci 2014;8:277.
Ayata C, Shimizu-Sasamata M, Lo EH, Noebels JL, Moskowitz MA. Impaired
neurotransmitter release and elevated threshold for cortical spreading
depression in mice with mutations in the alpha1A subunit of P/Q type calcium
channels. Neuroscience 2000;95(3):639-45.
Ayata C, Jin H, Kudo C, Dalkara T, Moskowitz MA. Suppression of cortical spreading
depression in migraine prophylaxis. Ann. Neurol. 2006;59:652-661.
Bazhenov M, Timofeev I, Steriade M, Sejnowski TJ. Model of thalamocortical slow-
wave sleep oscillations and transitions to activated States. J Neurosci
2002;22(19):8691-704.
Beaulieu C. Numerical data on neocortical neurons in adult rats, with special reference
to the GABA population. Brain Res 1993;609:284-292.
Beltramo R, D'Urso G, Dal Maschio M, Farisello P, Bovetti S, Clovis Y, Lassi G,
Tucci V, De Pietri Tonelli D, Fellin T. Layer-specific excitatory circuits
differentially control recurrent network dynamics in the neocortex. Nat
Neurosci 2013;16(2):227-34.
Benediktsson AM, Marrs GS, Tu JC, Worley PF, Rothstein JD, Bergles DE, Dailey
ME. Neuronal activity regulates glutamate transporter dynamics in developing
astrocytes. Glia 2012;60(2):175-88.
Bergles DE, Jahr CE. Synaptic activation of glutamate transporters in hippocampal
astrocytes. Neuron 1997;19(6):1297-308.
100
Bernardinelli Y, Chatton JY. Differential effects of glutamate transporter inhibitors on
the global electrophysiological response of astrocytes to neuronal stimulation.
Brain Res 2008;1240, 47-53.
Binzegger T, Douglas RJ, Martin KA. A quantitative map of the circuit of cat primary
visual cortex. J Neurosci 2004;24:8441–8453.
Blanco G. Na,K-ATPase subunit heterogeneity as a mechanism for tissue-specific ion
regulation. Semin Nephrol 2005;25(5):292-303.
Bolay, H., Reuter, U., Dunn, A.K., Huang, Z., Boas, D.A., and Moskowitz, M.A.
Intrinsic brain activity triggers trigeminal meningeal afferents in a migraine
model. Nat Med 2002;8, 136-142.
Buzsaki G. Neural syntax: cell assemblies, synapsembles, and readers. Neuron
2010;68:362–385.
CatterallWA, Kalume F, Oakley JC. NaV1.1 channels and epilepsy. J Physiol
2010;588, 1849–1859
Cestèle S, Schiavon E, Rusconi R, Franceschetti S, Mantegazza M. Nonfunctional
NaV1.1 familial hemiplegic migraine mutant transformed into gain of function
by partial rescue of folding defects. Proc Natl Acad Sci USA
2013;110(43):17546-51.
Charles A, Brennan K. Cortical spreading depression-new insights and persistent
questions. Cephalalgia 2009, 29(10):1115-24.
Chauvette S, Volgushev M, Timofeev I. Origin of active states in local neocortical
networks during slow sleep oscillation. Cerebral Cortex 2010;20:2660-2674.
Chauvette S, Seigneur J, Timofeev I. Sleep oscillations in the thalamocortical system
induce long-term neuronal plasticity. Neuron 2012;75(6):1105-13.
Cholet N, Pellerin L, Magistretti PJ, Hamel E. Similar perisynaptic glial localization
for the Na+,K+ ATPase alpha 2 subunit and the glutamate transporters GLAST
and GLT-1 in the rat somatosensory cortex. Cereb Cortex 2002;12(5):515-25.
Cossart R, Aronov D, Yuste R. Attractor dynamics of network UP states in the
neocortex. Nature 2003;423:283–288.
Constantinople CM, Bruno RM. Deep cortical layers are activated directly by
thalamus. Science 2013;340(6140):1591-4.
Crunelli V, Hughes SW. The slow (<1 Hz) rhythm of non-REM sleep: a dialogue
between three cardinal oscillators. Nat Neurosci 2010;13(1):9-17.
Crunelli V, David F, Lőrincz ML, Hughes SW. The thalamocortical network as a
single slow wave-generating unit. Curr Opin Neurobiol 2015;31C:72-80.
Dallérac G, Chever O, Rouach N. How do astrocytes shape synaptic transmission?
Insights from electrophysiology. Front Cell Neurosci 2013;7:159.
Danbolt NC. Glutamate uptake. Prog Neurobiol 2001;65(1):1-105.
David F, Schmiedt JT, Taylor HL, Orban G, Di Giovanni G, Uebele VN, Renger JJ,
Lambert RC, Leresche N, Crunelli V. Essential thalamic contribution to slow
waves of natural sleep. J Neurosci 2013;33(50):19599-610.
101
D'Ambrosio R, Gordon DS, Winn HR. Differential role of KIR channel and Na+/K+-
pump in the regulation of extracellular K+ in rat hippocampus. J Neurophysiol
2002;87(1):87-102.
Diamond JS, Jahr CE. Synaptically released glutamate does not overwhelm
transporters on hippocampal astrocytes during high-frequency stimulation. J
Neurophysiol 2000; 83, 2835-2843.
Diamond, J.S. Deriving the glutamate clearance time course from transporter currents
in CA1 hippocampal astrocytes: transmitter uptake gets faster during
development. J Neurosci 2005;25, 2906-16.
Dichgans M, Freilinger T, Eckstein G, Babini E, Lorenz-Depiereux B, Biskup S,
Ferrari MD, Herzog J, van den Maagdenberg AM, Pusch M, Strom TM.
Mutation in the neuronal voltage-gated sodium channel SCN1A in familial
hemiplegic migraine. Lancet 2005;366(9483):371-7.
De Fusco M, Marconi R, Silvestri L, Atorino L, Rampoldi L, Morgante L, Ballabio A,
Aridon P, Casari G. Haploinsufficiency of ATP1A2 encoding the Na+/K+ pump
alpha2 subunit associated with familial hemiplegic migraine type 2. Nat Genet
2003;33(2):192-6.
de Kock CP, Bruno RM, Spors H, Sakmann B. Layer- and cell-type-specific
suprathreshold stimulus representation in rat primary somatosensory cortex. J
Physiol 2007;15;581:139-54.
Dodick DW. Examining the essence of migraine--is it the blood vessel or the brain? A
debate. Headache 2008;48:661–67.
Doğanli C, Oxvig C, Lykke-Hartmann K. Zebrafish as a novel model to assess Na+/K+-
ATPase-related neurological disorders. Neurosci Biobehav Rev 2013;37(10 Pt
2):2774-87.
Dugué GP, Dumoulin A, Triller A, Dieudonne S. Target-dependent use of co-released
inhibitory transmitters at central synapses. J Neurosci 2005;25:6490-6498.
Eikermann-Haerter K, Dileköz E, Kudo C, Savitz SI, Waeber C, Baum MJ, Ferrari
MD, van den Maagdenberg AM, Moskowitz MA, Ayata C. Genetic and
hormonal factors modulate spreading depression and transient hemiparesis in
mouse models of familial hemiplegic migraine type 1. J Clin Invest
2009;119(1):99-109.
Eikermann-Haerter K, Ayata C. Cortical spreading depression and migraine. Curr
Neurol Neurosci Rep 2010;10(3):167-73.
Eikermann-Haerter K, Yuzawa I, Qin T, Wang Y, Baek K, Kim YR, Hoffmann U,
Dilekoz E, Waeber C, Ferrari MD, van den Maagdenberg AM, Moskowitz
MA, Ayata C. Enhanced subcortical spreading depression in familial
hemiplegic migraine type 1 mutant mice. J Neurosci 2011;31:5755–5763.
Fanselow EE, Connors BW. The roles of somatostatin-expressing (GIN) and fast-
spiking inhibitory interneurons in UP-DOWN states of mouse neocortex. J
Neurophysiol 2010;104(2):596-606.
102
Favero M, Castro-Alamancos MA. Synaptic cooperativity regulates persistent network
activity in neocortex. J Neurosci 2013;33(7):3151-63.
Fellin T, Halassa MM, Terunuma M, Succol F, Takano H, Frank M, Moss SJ, Haydon
PG. Endogenous nonneuronal modulators of synaptic transmission control
cortical slow oscillations in vivo. Proc Natl Acad Sci USA
2009;106(35):15037-42.
Ferrari MD vdMA, Frants RR, Goadsby PJ Migraine as a cerebral ionopathy with
impaired central sensory processing. In: Waxman SG (ed) Molecular
neurology. Elsevier,Amsterdam. 2007:439-61.
Fink D, Knapp PE, Mata M. Differential expression of Na,K-ATPase isoforms in
oligodendrocytes and astrocytes. Dev Neurosci 1996;18(4):319-26.
Fino E, Packer AM, Yuste R. The logic of inhibitory connectivity in the neocortex.
Neuroscientist 2013;19:228-37.
Fishell G, Rudy B. Mechanisms of inhibition within the telencephalon: ‘Where the
wild things are’. Annu Rev Neurosci 2011;34:535–567.
Furuta A, Rothstein JD, Martin LJ. Glutamate transporter protein subtypes are
expressed differentially during rat CNS development. J Neurosci
1997;17(21):8363-75.
Gabernet L, Jadhav SP, Feldman DE, Carandini M, Scanziani M. Somatosensory
integration controlled by dynamic thalamocortical feed-forward inhibition.
Neuron 2005;48:315–327.
Giaume C, McCarthy KD. Control of gap-junctional communication in astrocytic
networks. Trends Neurosci 1996;19(8):319-25.
Golovina VA, Song H, James PF, Lingrel JB, Blaustein MP. Na+ pump alpha 2-subunit
expression modulates Ca2+ signaling. Am J Physiol Cell Physiol
2003;284(2):C475-86.
Haglund MM, Schwartzkroin PA. Role of Na-K pump potassium regulation and IPSPs
in seizures and spreading depression in immature rabbit hippocampal slices. J
Neurophysiol 1990;63(2):225-39.
Haider B, Duque A, Hasenstaub AR, McCormick DA. Neocortical network activity in
vivo is generated through a dynamic balance of excitation and inhibition. J
Neurosci 2006;26:4535-4545.
Haider B, McCormick DA. Rapid neocortical dynamics: cellular and network
mechanisms. Neuron 2009;62(2):171–189.
Hájos N, Ellender TJ, Zemankovics R, Mann EO, Exley R, Cragg SJ, Freund TF,
Paulsen O. Maintaining network activity in submerged hippocampal slices:
importance of oxygen supply. Eur J Neurosci 2009 Jan;29(2):319-27.
Halassa MM, Fellin T, Takano H, Dong JH, Haydon PG. Synaptic islands defined by
the territory of a single astrocyte. J Neurosci 2007;27(24):6473-7.
103
Higashi K, Fujita A, Inanobe A, Tanemoto M, Doi K, Kubo T, Kurachi Y. An inwardly
rectifying K+ channel, Kir4.1, expressed in astrocytes surrounds synapses and
blood vessels in brain. Am J Physiol Cell Physiol 2001;281(3):C922-31.
Hoffman KL, Battaglia FP, Harris K, MacLean JN, Marshall L, Mehta MR. The upshot
of up states in the neocortex: from slow oscillations to memory formation. J
Neurosci 2007;27(44):11838-41.
Ikeda K, Onimaru H, Yamada J, Inoue K, Ueno S, Onaka T, et al. Malfunction of
respiratory-related neuronal activity in Na+,K+-ATPase alpha2 subunit-
deficient mice is attributable to abnormal Cl- homeostasis in brainstem
neurons. J Neurosci 2004;24(47):10693-701.
Isaacson JS, Scanziani M. How inhibition shapes cortical activity. Neuron
2011;72:231-243.
Jurkat-Rott K, Freilinger T, Dreier JP, Herzog J, Gobel H, Petzold GC, Montagna P,
Gasser T, Lehmann-Horn F, Dichgans M. Variability of familial hemiplegic
migraine with novel A1A2 Na+/K+-ATPase variants. Neurology
2004;62(10):1857-61.
Kandel ER, Siegelbaum SA. Chapter 12: Synaptic Integration. Chapter 14: Transmitter
Release. Principles of Neural Science, Kandel ER, Schwartz JS, Jessell TM.
McGraw-Hill 2000.
Kapfer C, Glickfeld LL, Atallah BV, Scanziani M. Supralinear increase of recurrent
inhibition during sparse activity in the somatosensory cortex. Nat Neurosci
2007;10:743–753.
Kinney GA, Spain WA. Synaptically evoked GABA transporter currents in neocortical
glia. J Neurophysiol 2002;88:2899–2908.
Kofuji P, Newman EA. Potassium buffering in the central nervous system.
Neuroscience 2004;129(4):1045-56.
Lashley K. Patterns of cerebral integration indicated by the scotomas of migraine. Arch
Neurol Psychiatry 1941; 46:331-39.
Leão AAP, Morison RS. Propagation of spreading cortical depression. J Neurophysiol.
1945; 8:33-45.
Lehre KP, Danbolt NC. The number of glutamate transporter subtype molecules at
glutamatergic synapses: chemical and stereological quantification in young
adult rat brain. J Neurosci 1998;18(21):8751-7.
Lencesova L, O'Neill A, Resneck WG, Bloch RJ, Blaustein MP. Plasma membrane-
cytoskeleton-endoplasmic reticulum complexes in neurons and astrocytes. J
Biol Chem 2004;279(4):2885-93.
Leo L, Gherardini L, Barone V, De Fusco M, Pietrobon D, Pizzorusso T, Casari G.
Increased susceptibility to cortical spreading depression in the mouse model of
familial hemiplegic migraine type 2. PLoS Genet 2011;7(6):e1002129.
104
Lemieux M, Chen JY, Lonjers P, Bazhenov M, Timofeev I. The impact of cortical
deafferentation on the neocortical slow oscillation. J Neurosci
2014;34(16):5689-703.
Levi G, Aloisi F, Ciotti MT, Gallo V. Autoradiographic localization and
depolarization-induced release of acidic amino acids in differentiating
cerebellar granule cell cultures. Brain Res 1984;290(1):77-86.
Levy D, Moskowitz MA, Noseda R, Burstein R. Activation of the migraine pain
pathway by cortical spreading depression: do we need more evidence?
Cephalalgia 2012;32(7):581-2.
Lübke J, Feldmeyer D. Excitatory signal flow and connectivity in a cortical column:
focus on barrel cortex. Brain Struct Funct 2007;212:3–17.
Mann EO, Kohl MM, Paulsen O. Distinct roles of GABAA and GABAB receptors in
balancing and terminating persistent cortical activity. J Neurosci
2009;29:7513-7518.
Markram H, Toledo-Rodriguez M, Wang Y, Gupta A, Silberberg G, Wu C.
Interneurons of the neocortical inhibitory system. Nat Rev Neurosci
2004;5:793–807.
Matthias K, Kirchhoff F, Seifert G, Hüttmann K, Matyash M, Kettenmann H,
Steinhäuser C. Segregated expression of AMPA-type glutamate receptors and
glutamate transporters defines distinct astrocyte populations in the mouse
hippocampus. J Neurosci 2003;23(5):1750-8.
McDermott JP, Sánchez G, Chennathukuzhi V, Blanco G. Green fluorescence protein
driven by the Na,K-ATPase α4 isoform promoter is expressed only in male
germ cells of mouse testis. J Assist Reprod Genet 2012;29(12):1313-25.
Meeks, J.P., Mennerick, S. Astrocyte membrane responses and potassium
accumulation during neuronal activity. Hippocampus 2007; 17, 1100-8.
Melone M, Bellesi M, Conti F. Synaptic localization of GLT-1a in the rat somatic
sensory cortex. Glia 2009;57:108–117
Milner PM. Note on a possible correspondence between the scotomas of migraine and
spreading depression of Leao. Electroencephalogr Clin Neurophysiol
1958;10(4):705.
Minelli A, DeBiasi S, Brecha NC, Zuccarello LV, Conti F. GAT-3, a high-affinity
GABA plasma membrane transporter, is localized to astrocytic processes, and
it is not confined to the vicinity of GABAergic synapses in the cerebral cortex.
J Neurosci 1996;16:6255–6264.
Mishima T, Hirase H. In vivo intracellular recording suggests that grey matter
astrocytes in mature cerebral cortex and hippocampus are
electrophysiologically homogeneous. J Neurosci 2010;30(8):3093-100.
Mölle M, Born J. Slow oscillations orchestrating fast oscillations and memory
consolidation. Prog Brain Res 2011;193:93-110.
105
Molleman A. (2003). Patch Clamping: an introductory guide to patch clamp
electrophysiology. John Wiley & Sons, Ltd 2003.
Morth JP, Pedersen BP, Toustrup-Jensen MS, Sørensen TL, Petersen J, Andersen JP,
Vilsen B, Nissen P. Crystal structure of the sodium-potassium pump. Nature
2007;450(7172):1043-9.
Moseley AE, Lieske SP, Wetzel RK, James PF, He S, Shelly DA, et al. The Na,K-
ATPase alpha 2 isoform is expressed in neurons, and its absence disrupts
neuronal activity in newborn mice. J Biol Chem 2003;278(7):5317-24.
Navarrete M, Araque A. The Cajal school and the physiological role of astrocytes: a
way of thinking. Front Neuroanat 2014;8:33.
Neher E. Correction for liquid junction potentials in patch clamp experiments.
Methods Enzymol 1992;207:123-131.
Noseda R, Burstein R. Migraine pathophysiology: anatomy of the trigeminovascular
pathway and associated neurological symptoms, cortical spreading depression,
sensitization, and modulation of pain. Pain 2013;154 Suppl 1:S44-53.
Okun M, Lampl I. Instantaneous correlation of excitation and inhibition during
ongoing and sensory-evoked activities. Nat Neurosci 2008;11(5):535-7.
Ophoff RA, Terwindt GM, Vergouwe MN, van Eijk R, Oefner PJ, Hoffman SM,
Lamerdin JE, Mohrenweiser HW, Bulman DE, Ferrari M, Haan J, Lindhout D,
van Ommen GJ, Hofker MH, Ferrari MD, Frants RR. Familial hemiplegic
migraine and episodic ataxia type-2 are caused by mutations in the Ca2+
channel gene CACNL1A4. Cell 1996;87(3):543-52.
Pannasch U, Vargová L, Reingruber J, Ezan P, Holcman D, Giaume C, Syková E,
Rouach N. Astroglial networks scale synaptic activity and plasticity. Proc Natl
Acad Sci USA 2011;108(20):8467-72.
Parga N, Abbott LF. Network model of spontaneous activity exhibiting synchronous
transitions between up and down States. Front Neurosci 2007;1(1):57-66.
Pellerin L, Magistretti PJ. Glutamate uptake stimulates Na+,K+-ATPase activity in
astrocytes via activation of a distinct subunit highly sensitive to ouabain. J
Neurochem 1997;69(5):2132-7.
Perea G, Navarrete M, Araque A. Tripartite synapses: astrocytes process and control
synaptic information. Trends Neurosci 2009;32(8):421-31.
Perea G, Araque A. GLIA modulates synaptic transmission. Brain Res Rev 2010;63(1-
2):93-102.
Perea G, Sur M, Araque A. Neuron-glia networks: integral gear of brain function.
Front Cell Neurosci 2014;8:378.
Petersen CC, Sakmann B. The excitatory neuronal network of rat layer 4 barrel cortex.
J Neurosci 2000;20(20):7579-86.
Petersen CC, Hahn TT, Mehta M, Grinvald A, Sakmann B. Interaction of sensory
responses with spontaneous depolarization in layer 2/3 barrel cortex. Proc Natl
Acad Sci USA, 2003;100(23):13638-43.
106
Petersen CC. The functional organization of the barrel cortex. Neuron 2007;56(2):339-
55.
Pietrobon D, Striessnig J. Neurobiology of migraine. Nat Rev Neurosci 2003;4(5):386-
98.
Pietrobon D. Function and dysfunction of synaptic calcium channels: insights from
mouse models. Curr Opin Neurobiol 2005; 15:257-265
Pietrobon D. Familial hemiplegic migraine. Neurotherapeutics 2007;4(2):274-84.
Pietrobon, D. CaV2.1 channelopathies. Pflugers Arch 2010;460, 375-393.
Pietrobon D, Moskowitz MA. Pathophysiology of migraine. Annu Rev Physiol
2013;75:365-91.
Pietrobon D, Moskowitz MA. Chaos and commotion in the wake of cortical spreading
depression and spreading depolarizations. Nat Rev Neurosci 2014;15(6):379-
93.
Poduri A, Lowenstein D. Epilepsy genetics - past, present, and future. Curr Opin Genet
Dev 2011;21:325-32.
Poolos NP, Mauk MD, Kocsis JD. Activity-evoked increases in extracellular
potassium modulate presynaptic excitability in the CA1 region of the
hippocampus. J Neurophysiol 1987 Aug;58(2):404-16.
Poskanzer KE, Yuste R. Astrocytic regulation of cortical UP states. Proc Natl Acad
Sci USA 2011;108(45):18453-8.
Poulet JF, Petersen CC. Internal brain state regulates membrane potential synchrony
in barrel cortex behaving mice. Nature 2008;454(7206):881-5.
Rajakulendran S, Graves TD, Labrum RW, Kotzadimitriou D, Eunson L, Davis MB,
Davies R, Wood NW, Kullmann DM, Hanna MG, Schorge S. Genetic and
functional characterisation of the P/Q calcium channel in episodic ataxia with
epilepsy. J Physiol 2010;588:1905–1913.
Ransom CB, Ransom BR, Sontheimer H. Activity-dependent extracellular K+
accumulation in rat optic nerve: the role of glial and axonal Na+ pumps. J
Physiol 2000;522 Pt 3:427-42.
Reig R, Mattia M, Compte A, Belmonte C, Sanchez-Vives MV. Temperature
modulation of slow and fast cortical rhythms. J Neurophysiol 2010;103:1253–
1261, 2010.
Reyes A, Lujan R, Rozov A, Burnashev N, Somogyi P, Sakmann B. Target-cell-
specific facilitation and depression in neocortical circuits. Nat. Neurosci.
1998;1:279-285.
Riant F, De Fusco M, Aridon P, Ducros A, Ploton C, Marchelli F, et al. ATP1A2
mutations in 11 families with familial hemiplegic migraine. Hum Mutat
2005;26(3):281.
Rigas P, Castro-Alamancos MA. Thalamocortical up states: differential effects of
intrinsic and extrinsic cortical inputs on persistent activity. The Journal of
Neuroscience 2007;27(16):4261-4272.

107
Rose EM, Koo JC, Antflick JE, Ahmed SM, Angers S, Hampson DR. Glutamate
transporter coupling to Na,K-ATPase. J Neurosci 2009;29(25):8143-55.
Rossignol E, Kruglikov I, van den Maagdenberg AM, Rudy B, Fishell G. CaV2.1
ablation in cortical interneurons selectively impairs fast-spiking basket cells
and causes generalized seizures. Ann Neurol 2013;74(2):209-22.
Rozov A, Burnashev N, Sakmann B, Neher E. Transmitter release modulation by
intracellular Ca2+ buffers in facilitating and depressing nerve terminals of
pyramidal cells in layer 2/3 of the rat neocortex indicates a target cell-specific
difference in presynaptic calcium dynamics. J Physiol 2001;531:807-826.
Rudy B, Fishell G, Lee S, Hjerling-Leffler J. Three groups of interneurons account for
nearly 100% of neocortical GABAergic neurons. Dev Neurobiol 2011;71, 45–
61.
Russell MB, Ducros A. Sporadic and familial hemiplegic migraine:
pathophysiological mechanisms, clinical characteristics, diagnosis, and
management. Lancet Neurol 2011;10(5):457-70.
Sanchez-Vives MV, McCormick DA. Cellular and network mechanisms of rhythmic
recurrent activity in neocortex. Nat Neurosci 2000;3:1027–1034.
Schreiner AE, Durry S, Aida T, Stock MC, Rüther U, Tanaka K, Rose CR, Kafitz KW.
Laminar and subcellular heterogeneity of GLAST and GLT-1
immunoreactivity in the developing postnatal mouse hippocampus. J Comp
Neurol 2014;522(1):204-24.
Seamans JK, Nogueira L, Lavin A. Synaptic basis of persistent activity in prefrontal
cortex in vivo and in organotypic cultures. Cereb Cortex 2003;13(11):1242-50.
Shih PY, Savtchenko LP, Kamasawa N, Dembitskaya Y, McHugh TJ, Rusakov DA,
Shigemoto R, Semyanov A. Retrograde synaptic signaling mediated by K+
efflux through postsynaptic NMDA receptors. Cell Rep 2013;5(4):941-51.
Sibille J, Pannasch U, Rouach N. Astroglial potassium clearance contributes to short-
term plasticity of synaptically evoked currents at the tripartite synapse. J
Physiol 2014;592, 87–102.
Shu Y, Hasenstaub A, McCormick DA. Turning on and off recurrent balanced cortical
activity. Nature 2003;423:288–93.
Steriade M, Nuñez A, Amzica F. A novel slow (< 1 Hz) oscillation of neocortical
neurons in vivo: depolarizing and hyperpolarizing components. J Neurosci
1993;13(8):3252-65.
Steriade M, Timofeev I, Grenier F. Natural waking and sleep states: a view from inside
neocortical neurons. J Neurophysiol 2001;85(5):1969-85.
Syková E, Nicholson C. Diffusion in brain extracellular space. Physiol Rev
2008;88(4):1277-340.
Tahvildari B, Wölfel M, Duque A, McCormick DA. Selective functional interactions
between excitatory and inhibitory cortical neurons and differential contribution
to persistent activity of the slow oscillation. J Neurosci 2012;32(35):12165-79.
108
Takano T, Tian GF, Peng W, Lou N, Lovatt D, Hansen AJ, Kasischke KA, Nedergaard
M. Cortical spreading depression causes and coincides with tissue hypoxia. Nat
Neurosci 2007;10(6):754-62.
Theis M, Jauch R, Zhuo L, Speidel D, Wallraff A, Döring B, Frisch C, Söhl G, Teubner
B, Euwens C, Huston J, Steinhäuser C, Messing A, Heinemann U, Willecke K.
Accelerated hippocampal spreading depression and enhanced locomotory
activity in mice with astrocyte-directed inactivation of connexin43. J Neurosci
2003;23, 766–776.
Thomas CG, Tian H, Diamond JS. The relative roles of diffusion and uptake in
clearing synaptically released glutamate change during early postnatal
development. J Neurosci 2011;31(12):4743-54.
Thomsen LL, Eriksen MK, Roemer SF, Andersen I, Olesen J, Russell MB. A
population-based study of familial hemiplegic migraine suggests revised
diagnostic criteria. Brain 2002;125(Pt 6):1379-91.
Timofeev I, Grenier F, Bazhenov M, Sejnowski TJ, Steriade M. Origin of slow cortical
oscillations in deafferented cortical slabs. Cereb Cortex 2000;10:1185–1199.
Timofeev I, Chauvette S. Thalamocortical oscillations: local control of EEG slow
waves. Curr Top Med Chem 2011;11(19):2457-71.
Tottene A, Conti R, Fabbro A, Vecchia D, Shapovalova M, Santello M, et al. Enhanced
excitatory transmission at cortical synapses as the basis for facilitated
spreading depression in CaV2.1 knockin migraine mice. Neuron
2009;61(5):762-73.
Tottene A, Urbani A, Pietrobon D. Role of different voltage-gated Ca2+ channels in
cortical spreading depression: specific requirement of P/Q-type Ca2+ channels.
Channels (Austin) 2011; 5:110-114
Tzingounis AV, Wadiche JI. Glutamate transporters: confining runaway excitation by
shaping synaptic transmission. Nat Rev Neurosci 2007;8(12):935-47.
Vahedi K, Depienne C, Le Fort D, Riant F, Chaine P, Trouillard O, Gaudric A, Morris
MA, Leguern E, Tournier-Lasserve E, Bousser MG. Elicited repetitive daily
blindness: a new phenotype associated with hemiplegic migraine and SCN1A
mutations. Neurology 2009;72(13):1178-83.
van den Maagdenberg AM, Pietrobon D, Pizzorusso T, Kaja S, Broos LA, Cesetti T,
van de Ven RC, Tottene A, van der Kaa J, Plomp JJ, Frants RR, Ferrari MD.
A Cacna1a knockin migraine mouse model with increased susceptibility to
cortical spreading depression. Neuron 2004;41, 701-710.
van den Maagdenberg AM, Pizzorusso T, Kaja S, Terpolilli N, Shapovalova M,
Hoebeek FE, Barrett CF, Gherardini L, van de Ven RC, Todorov B, Broos LA,
Tottene A, Gao Z, Fodor M, De Zeeuw CI, Frants RR, Plesnila N, Plomp JJ,
Pietrobon D, Ferrari MD. High cortical spreading depression susceptibility and
migraine-associated symptoms in CaV2.1 S218L mice. Ann Neurol
2010;67(1):85-98.
109
Vecchia D, Pietrobon D. Migraine: a disorder of brain excitatory-inhibitory balance?
Trends Neurosci 2012;35(8):507-20.
Vecchia D, Tottene A, van den Maagdenberg AM, Pietrobon D. Mechanism
underlying unaltered cortical inhibitory synaptic transmission in contrast with
enhanced excitatory transmission in CaV2.1 knockin migraine mice. Neurobiol
Dis 2014;69:225-34.
Vecchia D, Angelita Tottene A, van den Maagdenberg AM, Pietrobon D. Cortical
synaptic transmission in CaV2.1 knockin mice with the S218L missense
mutation which causes a severe familial hemiplegic migraine syndrome in
humans. Front Cell Neurosci 2015
Volterra A, Meldolesi J. Astrocytes, from brain glue to communication elements: the
revolution continues. Nat Rev Neurosci 2005;6(8):626-40.
Wadiche JI, Kavanaugh MP. Macroscopic and microscopic properties of a cloned
glutamate transporter/chloride channel. J Neurosci 1998;18:7650–7661.
Westenbroek RE, Sakurai T, Elliott EM, Hell JW, Starr TV, Snutch TP, et al.
Immunochemical identification and subcellular distribution of the alpha 1A
subunits of brain calcium channels. J Neurosci 1995;15(10):6403-18.
Wester JC, Contreras D. Columnar interactions determine horizontal propagation of
recurrent network activity in neocortex. J Neurosci 2012;32(16):5454-71.
Wilson C. Up and down states. Scholarpedia Journal 2008;3(6):1410.
Zaitsev AV, Povysheva NV, Lewis DA, Krimer LS. P/Q-type, but not N-type, calcium
channels mediate GABA release from fast-spiking interneurons to pyramidal
cells in rat prefrontal cortex. J Neurophysiol 2007;97:3567-3573.
Zhang X, Levy D, Noseda R, Kainz V, Jakubowski M, Burstein R. Activation of
meningeal nociceptors by cortical spreading depression: implications for
migraine with aura. J Neurosci 2010;30(26):8807-14.
Zhang X, Levy D, Kainz V, Noseda R, Jakubowski M, Burstein R. Activation of
central trigeminovascular neurons by cortical spreading depression. Ann
Neurol 2011;69(5):855-65.
Zonta M, Angulo MC, Gobbo S, Rosengarten B, Hossmann KA, Pozzan T,
Carmignoto G. Neuron-to-astrocyte signaling is central to the dynamic control
of brain microcirculation. Nat Neurosci 2003;6(1):43-50.