investigation of seed and seedling predation and natural
TRANSCRIPT
Western Kentucky UniversityTopSCHOLAR®
Masters Theses & Specialist Projects Graduate School
Fall 2017
Investigation of Seed and Seedling Predation andNatural History of Bushveld Savanna RodentsChristopher BanotaiWestern Kentucky University, [email protected]
Follow this and additional works at: https://digitalcommons.wku.edu/theses
Part of the Behavior and Ethology Commons, and the Terrestrial and Aquatic Ecology Commons
This Thesis is brought to you for free and open access by TopSCHOLAR®. It has been accepted for inclusion in Masters Theses & Specialist Projects byan authorized administrator of TopSCHOLAR®. For more information, please contact [email protected].
Recommended CitationBanotai, Christopher, "Investigation of Seed and Seedling Predation and Natural History of Bushveld Savanna Rodents" (2017).Masters Theses & Specialist Projects. Paper 2055.https://digitalcommons.wku.edu/theses/2055
INVESTIGATION OF SEED AND SEEDLING PREDATION AND NATURAL
HISTORY OF BUSHVELD SAVANNA RODENTS
A Thesis
Presented to
the Faculty of the Department of Biology
Western Kentucky University
Bowling Green, Kentucky
In Partial Fulfillment
of the Requirements for the Degree
Master of Science
By
Christopher M Banotai
December 2017


I dedicate this thesis to my mother, Mary, who is the single most influential and
inspirational person in my life. I could not have competed my degree or this thesis
without her unending support

iv
ACKNOWLEDGEMENTS
I would like to thank Dr. Stokes for providing patient guidance and leadership in
the pursuit of attaining my master’s degree and in the research necessary to produce this
thesis. I would also like to thank the many volunteers from Transfrontier Africa who
assisted with trapping, photography and data collection: Sam Culton, Lewyn Maefala,
Zala Hajdinjak, Carole Cerny, Lisa Trueman, Amy Clark, Dudley Trolip, Andre
Combrinck, Amy Haselow, Rory Rosszell, Michel Henderikx, Iain Robertson, and so
many more. Thanks to Leonie Hofstra for establishing the screenhouse where seedlings
were grown. Thanks to Lilly for her companionship and inspiration. Much thanks to
Balule Nature Reserve for allowing us to conduct research on their land and for providing
accommodations. I would like to thank the other WKU Biology MS students for
providing a productive learning and working atmosphere. The Department of Biology,
Center for Biodiversity Studies, Ogden College of Science and Engineering, the WKU
RCAP and FUSE programs, and the Graduate School of Western Kentucky University
provided funding for this research.
v
Contents ACKNOWLEDGEMENTS ............................................................................................................ iv
Chapter 1: Natural History of Bushveld Savanna Rodents:
Abstract ............................................................................................................................................ v
Introduction: ................................................................................................................................. 1
Study organisms ........................................................................................................................... 2
Methods ....................................................................................................................................... 8
Results ........................................................................................................................................ 12
Discussion: ................................................................................................................................. 17
Chapter 2: Investigation of Seed and Seedling Predation by Selected Bushveld Savanna Rodent
Species on Native Trees
Abstract: ..................................................................................................................................... 20
Introduction: ............................................................................................................................... 21
Methods ..................................................................................................................................... 24
Study organisms and Study site: ................................................................................................ 24
Results ........................................................................................................................................ 30
Discussion .................................................................................................................................. 33
Appendix I: Habitat evaluations for the seven trapping sites used for this research ..................... 44
vi
List of figures
Figure 1) Models of traps used in rodent trapping at BNR ............................................................ 10
Figure 2) Number of rodents captured at each trapping site over time. ......................................... 14
Figure 3) The number of unique individuals per species captured over time, with each bar
representing a successful trapping event. ....................................................................................... 14
iv
List of Tables Table 1) GPS Coordinates of the seven trapping sites utilized in this experiment. ......................... 9
Table 2) Mean historical temperature (°C) and sum rainfall (mm) measured at Hoedspruit,
Airforce Base, Hoedspruit, South Africa for from 1 January, 1986 through 31 December, 2015
adapted from wunderground.com .................................................................................................. 13
Table 3) Measured mean temperature (Celsius) and sum of rainfall (mm) measured at Hoedspruit,
Airforce Base, Hoedspruit, South Africa in 2016 adapted from wunderground.com .................... 13
Table 4) Morphological statistics for 16 male and 9 female Namaqua rock mice (Micaelamys
namaquensis) ................................................................................................................................. 15
Table 5) Mean morphological statistics for 6 male and 12 female red veld rats (Aethomys
chrysophilus) .................................................................................................................................. 15
Table 6) Mean morphological statistics for 6 female bushveld gerbils (Tatera leucogaster) ....... 15
Table 7) Mean morphological statistics for 8 male individuals tentatively identified as chestnut
climbing mice (Dendromus mystacalis) ........................................................................................ 15
Table 8) Morphological statistical values from De Graaff (1981) for male D. mystacalis and
results of a t-test comparing them to individuals I captured and identified as D. mystacalis.
Asterisks denote statistically significant differences. .................................................................... 16
Table 9) Mean morphological statistics for 2 male and 2 female individuals identified as
multimammate mice (Mastomys natalensis).................................................................................. 16
Table 10) Reproductively active individuals and the dates on which they were captured ............ 16
Table 11) Kruskal-Wallis and Wilcoxon Rank Sum Test results for 18 seed predation trials by
Namaqua rock mice on S. birrea, C. apiculatum, and A. nigrescens seeds ................................... 30
Table 12) Kruskal-Wallis and Wilcoxon Rank Sum Test results for 18 seed predation trials by red
veld rats on S. birrea, C. apiculatum, and A. nigrescens seeds ..................................................... 30
Table 13) Wilcoxon Rank Sum pairwise comparisons over 33 seed trials (66 evaluations) for
marula, knobthorn acacia, false marula, and jackalberry. .............................................................. 31
Table 14) Z values between seedling species and damage done by rodents across thirty-four
feeding trials. ................................................................................................................................. 32
Table 15) Distribution of major and minor damage done across tree species by rodents .............. 32
Table A.1) Transect Evaluation for Trapping Site 1 ...................................................................... 44
Table A.2) Vegetation Evaluation Transects for Trapping Site 2 .................................................. 47
Table A.3) Vegetation Evaluation Transects for Trapping Site 3 .................................................. 50
Table A.5) Vegetation Evaluation Transects for Trapping Site 5 .................................................. 55
Table A.7) Vegetation Evaluation Transects for Trapping Site 7 .................................................. 61
Table A.8) Legend for coded habitat evaluation tables. Species are presented in no particular
order. .............................................................................................................................................. 64
v
Christopher Banotai December 2017 65 Pages
Directed by: Michael Stokes, Carl Dick, and Scott Grubbs
Department of Biology Western Kentucky University
There is currently a decline in large, old trees within many ecosystems where they
play important ecological and economic roles. One ecosystem suffering from this decline
is the bushveld savanna of South Africa. One particularly important species in decline is
the ecologically, economically, and culturally significant marula tree (Sclerocarya birrea
subsp. caffra). This species’ decline is characterized by a steep drop in recruitment of
seedlings into the population. Rodents are known to influence plant communities across
many ecosystems through herbivory of adult plants as well as predation of seeds and
seedlings. This research provides a record of rodent species present in the bushveld
savanna ecosystem of Balule Nature Reserve where a decline in marula recruitment is
taking place. Further, it offers a summary of morphological statistics and natural history
traits for these rodents. Morphological statistics can be used for species identification.
Reproductive status of individuals can inform researchers about reproductive phenology
and how it may be affected by environmental conditions. Finally, trapping for this study
took place during an historic regional drought. Trapping success was used to develop a
limited window into how reduced precipitation affects rodent abundances. Morphological
traits measured coincide with those available in the literature. Reproductive activity for
males and females of one species, Namaqua rock mouse (Micaelamys namaquensis ), did
not overlap completely, with females not being reproductively active while males were.
INVESTIGATION OF SEED AND SEEDLING PREDATION AND NATURAL
HISTORY OF BUSHVELD SAVANNA RODENTS

vi
Individuals captured and identified as chestnut climbing mice (Dendromus mystacalis)
had statistically significantly longer tails and hind feet, and were heavier than reported in
reference works.
1
Introduction:
Rodent species are known to show spatial and temporal fluctuations in
abundances and reproduction, which are often attributed to environmental conditions
(Massawe et al., 2011). Rodent population abundances and densities can change based on
fine-scale and coarse-scale influences (Massawe, 2011). Rodent reproduction has been
found to be correlated with coarse-scale climatic factors such as seasonal rainfall regimes
(Massawe et al., 2011). Rainfall facilitates primary production and availability of
nutritious seeds, seedlings, and vegetative cover, which are all beneficial resources for
rodent populations (Delany, 1972; Leirs, 1992, Massawe et al., 2011). Food availability
directly affects rodents’ rates of maturation and survival, which increase during the wet
season (Massawe, 2011; Sluydts et al., 2007). These positive effects on rodent abundance
and diversity occur after a species-specific lag period based on reproductive phenology
and resource availability (Yarnell et al., 2007). This lag period is largely unstudied in
South African rodents (Massawe et al., 2011). Examples of fine-scale influences on
population variability include availability of cover and nesting places, predation pressure
(Van Gulck et al., 1998; Vibe-Petersen et al., 2006), and intraspecific and interspecific
competition (Leirs et al., 1992). I set out to capture rodents in the lowveld savanna
ecosystem during an atypical, historic drought to investigate how environmental
conditions may influence rodent abundance and reproductive phenology. (“South
2
Africa”, 2015). Further, I wanted to compare morphological statistics of species that I
could capture to those in reference works such as De Graaff (1981) and Skinner &
Chimimba (2005).
Study organisms
Relatively little information is available on the natural history of the rodent
species in this study. The Namaqua rock mouse (Micaelamys namaquensis [A. Smith,
1843]) is usually very abundant relative to the other rodent species in their range (Kok et
al., 2012). They are known to be nocturnal generalist foragers with large spatial and
seasonal variability within their diets. Leaves, seeds, and arthropods have been found in
their feces (Abu Baker & Brown, 2012; Lancaster, 2009). Skinner and Chimimba (2005),
as well as De Graaff (1981), suggest that seeds constitute a large portion of this species'
diet. Namaqua rock mice usually occupy areas of rocky topography (Abu Baker &
Brown, 2012; Skinner & Chimimba, 2005). Breeding September-May, Namaqua rock
mice employ a polygynous reproductive strategy and live in family groups often larger
than 10 individuals (Fleming & Nicolson, 2004; Lancaster, 2009). There is no sexual
dimorphism (Lancaster, 2009). Two to seven pups are usually produced in each litter (De
Graaff, 1981). Family groups share nests made from grass or grass-like material jammed
into rock crevices or openings in trees (De Graaff, 1981). Walker (2015) estimated that
this species reaches densities of 33–300 individuals/ha depending on the season. This
species can live up to two years in the wild (Lancaster, 2009).
Red veld rats (Aethomys chrysophilus [de Winton, 1897]) are habitat generalists
and display significant morphological variation throughout the species’ distribution
(Linzey & Chimimba, 2008). This species’ diet is omnivorous, but they rely more heavily
on plant matter such as fallen fruit than other foods, with substantial geographic and
3
seasonal variation (De Graaff, 1981; Linzey & Chimimba, 2008). Red veld rats are
known to raid seed crops (Skinner & Chimimba, 2005). This species is nocturnal (De
Graaff, 1981). Although they usually occur at lower densities relative to some sympatric
rodent species, areas with plentiful groundcover such as vegetation and rocks, have
increased densities (Linzey & Chimimba, 2008). Breeding for this species is year-round,
peaks in summer, and animals usually produce litters of between two and seven pups (De
Graaff, 1981). Red veld rats build burrows with interconnecting runways, often
converging on old termite mounds or bushes (De Graaff, 1981). Red veld rats host a
broad diversity of ectoparasites and endoparasites (De Graaff, 1981). Because of this,
they are believed to be a potential reservoir for zoonotic diseases (De Graaff, 1981).
Nine subspecies are recognized within Smith’s bush squirrel (Paraxerus cepapi
[A. Smith, 1836]), varying in fur color and body size throughout the species’ geographic
distribution (Skinner & Chimimba, 2005). Males are usually slightly heavier than females
(Skinner & Chimimba, 2005). These squirrels are a savanna woodland species, relying on
the presence of trees for suitable habitats (Skinner & Chimimba, 2005). These squirrels
usually live in small groups consisting of a male, female, subadult offspring, and the most
recent offspring (Skinner & Chimimba, 2005). Within this group, sharing a nest,
grooming each other, marking each other with anal scent glands, foraging together, and
chasing unfamiliar individuals from a feeding area are common behaviors (Skinner &
Chimimba, 2005). Males defend the group’s territory, but the entire group may also
exhibit mobbing behavior upon detecting the presence of a predator (Skinner &
Chimimba, 2005; De Graaff, 1981). Smith’s bush squirrel is diurnal, often basking in the
sun before descending from the trees to forage (Skinner & Chimimba, 2005). Crevices in

4
trees are lined with leaves and grass to be used as nests (Skinner & Chimimba, 2005).
Flowers, leaves, seeds, berries, fruits, and bark of an array of species (including Acacia
spp.), and some insects make up this squirrel’s diet (Skinner & Chimimba, 2005). De
Graaff (1981) states that Smith’s bush squirrels have been reported eating the seedlings
of Acacia species. The species has also been reported to forage on undigested seeds,
including those of marula, remaining in elephant dung within Kruger National Park
(Pienaar, 1968). This was understood to be the extent of their impact on the recruitment
of that tree species, but recent research has shown that they can penetrate and eat
unprocessed marula seeds (Midgley et al., 2012). Like many squirrels, Smith’s bush
squirrel participates in scatter hoarding behaviors with seeds; this has been witnessed
with marula seeds (Midgley et al., 2012; Skinner & Chimimba, 2005). This behavior may
facilitate the dispersal of marula and any other plant species whose seeds are hoarded.
Producing litters of one to three pups, repoduction takes place year-round and peaks in
the warm and wet months of October-April (Skinner & Chimimba, 2005). Research is
deficient concerning the parasites and pathogens hosted by this species (De Graaff,
1981).
The bushveld gerbil (Tatera leucogaster [Peters, 1852]) is widely distributed
throughout southern Africa (Odhiambo et al., 2008). It generally occurs at low population
densities (Odhiambo et al., 2008). Bushveld gerbils have an affinity for sandy soils where
they develop well-maintained burrows at the bases of grass clumps (Skinner &
Chimimba, 2005; Saetnan & Skarpe, 2006). Male-female pairs share burrows; however,
complex warrens have been discovered that may be used communally to some extent
(Skinner & Chimimba, 2005). Peak reproductive activity for this species (based upon
5
captured, pregnant females) occurs February-June (Odhiambo et al., 2008). The bushveld
gerbil is nocturnal (De Graaff, 1981). During the dry season, their diet is mostly made up
of foliage, with the grass, seed (trees and bushes), and arthropod composition of their diet
increasing during the wet season (Odhiambo et al., 2008; De Graaff, 1981). However,
some feeding trials carried out in Botswana showed this species has preference for grass
blades over seeds and shoots of other plant species (Saetnan & Skarpe, 2006). Bushveld
gerbils frequently cover small stores of food (De Graaff, 1981). Population densities
fluctuate with the seasons, low during the wet season and increasing during the dry
season (Odhiambo et al., 2008). Timing of breeding varies by geographic location
(Skinner & Chimimba, 2005). Litters of two to nine young are produced (Skinner &
Chimimba, 2005; De Graaff, 1981).
Some individuals captured in this study were tentatively identified as chestnut
climbing mice (Dendromus mystacalis [Heuglin, 1863]) based on similar morphological
characteristics and statistics to those presented in De Graaff (1981) including the
presence of what appeared to be semi-prehensile tails. Although more prominent in
eastern and central Africa, this species’ distribution does extend into South Africa within
the regions of the extreme Eastern Cape, KwaZulu-Natal, Mpumalanga, Gauteng, and
Limpopo provinces (De Graaff, 1981; Skinner & Chimimba, 2005). Chestnut climbing
mice are known to be omnivivorous foragers, with a tendency toward granivory and
insectivory (De Graaff, 1981; Skinner & Chimimba, 2005). Chestnut climbing mice are
associated with trees and tall grass where they place their ball-shaped nests woven out of
vegetation (De Graaff, 1981; Skinner & Chimimba, 2005). Another strategy employed by
the species is to use unoccupied weaver or bishop bird nests (Skinner & Chimimba,
6
2005). These nests are used by the mice May-July for resting and raising young (Skinner
& Chimimba, 2005). New nests are made the following season (Skinner & Chimimba,
2005). Some reports have been made of these mice utilizing underground burrows,
though it is unclear if they excavate their own burrows or use those of other species
(Skinner & Chimimba, 2005). De Graaff (1981) reports that they are known to be
arboreal, descending to the ground at night, while Skinner & Chimimba (2005) state that
chestnut climbing mice are terrestrial. These mice are known to produce three to eight
pups (De Graaff, 1981). Notable anatomical features include an opposable thumb and
semi-prehensile tail (De Graaff, 1981).
Several rodents captured in this study were identified as multimammate mice
(Mastomys natalensis [Smith, 1834]). Females of this species possess 12 pairs of
mammae in two continuous rows extending from the chest to the inguinal area (Skinner
& Chimimba, 2005). Multimammate mice occur along the eastern coastal region,
extending to the northeastern corner (Skinner & Chimimba, 2005). Multimammate mice
occupy a wide range of habitats that experience over 40 cm of rainfall (De Graaff, 1981;
Skinner & Chimimba, 2005). In areas receiving less than 40 cm of rainfall, they are often
distributed along river valleys (De Graaff, 1981; Skinner & Chimimba, 2005). This
species can be commensal with humans, taking up residence in human habitations (De
Graaff, 1981; Skinner & Chimimba, 2005). Multimammate mice are known to be pioneer
colonizers of disturbed and recovering ecosystems, but are often pushed out by specialists
(Skinner & Chimimba, 2005). This species is nocturnal and terrestrial, excavating
burrows in the soil or utilizing unoccupied burrows created by other species (Skinner &
Chimimba, 2005). Home ranges for this species vary widely across individuals and this

7
difference is not correlated with seasonality (Skinner & Chimimba, 2005). Main food
sources for multimammate mice include the seeds of grasses and other plants, dried pods
of Acacia spp., dried and pulpy exteriors of fruits, and a smaller proportion of insect
matter from termites, grasshoppers, and coleoptera (Skinner & Chimimba, 2005). During
population explosions or times of food scarcity, multimammate mice are known to be
cannibalistic (Skinner & Chimimba, 2005). Breeding patterns do vary across the species’
distribution (Skinner & Chimimba, 2005). Multimammate mice reproduce year-round,
though rarely in winter, and most commonly with vegetation germination in the wet
season (Skinner & Chimimba, 2005). Massawe et al. (2011) determined that in Tanzania,
Namibia, and Swaziland, multimammate mouse breeding patterns were strongly
correlated with rainfall, with 70% of their adult females in breeding condition during the
wet season over a three-year period (2001-2009). Litter size is extremely variable and is
associated with environmental conditions (Skinner & Chimimba, 2005). Consequently,
this species is prone to population explosions in times of favorable environmental
conditions and food availability (Skinner & Chimimba, 2005).
This research set out to investigate natural history traits of rodents native to the
bushveld savanna ecosystem of South Africa. To date, much of the research focus in this
region has been limited to larger and more “charismatic megafauna” such as elephants,
rhinos, and lions. This leads to a void in the knowledge concerning a widespread group of
organisms that often produce significant effects on plant communities in other
ecosystems (Bricker et al., 2010; Edwards et al., 1999; Linzey & Washok, 2000; Midgley
et al., 2012; Ostfeld et al., 1997). Morphological statistics provide important information
that can be used for region-specific identification purposes as well as providing
8
references for comparison across a species’ distribution. Recording when a species is in
breeding condition allows for the tracking of part of its life history phenology.
Methods
During the week of 13 March 2016, six trapping sites representing different
microhabitats of Balule Nature Reserve (BNR) were selected. Sites were chosen under
the guidance of reserve staff to maximize diversity of ground cover, canopy cover,
proximity to surface water, presence of tree species of interest, and overall vegetation
community composition. Plant diversity and density as well as ground and canopy cover
were characterized by sampling at 1 m intervals along five transects placed across the
trapping site. Transects were oriented facing away from the nearest road, and were
spaced every 7 m apart across the site starting 2 m in from the left corner closest to the
road. These transects were also where the traps were placed. Woody plants were
identified to species when possible. Grasses were also identified to species; however, due
to the grazing of ungulates and potentially the drought, some grasses were lacking the
inflorescences necessary for identification. Identifications were based upon BNR staff
knowledge and reference works such as Van Wyk & Van Wyk (2011) and Van
Oudtshoorn, (1999).
Site 1 was selected because it possessed an open canopy, several adolescent
knobthorn (Acacia nigrescens) trees, and high percentage of grass coverage. Site 2 was
selected because it possessed a canopy with greater coverage and more living woody
content than site 1 and because of the presence of several downed trees, rocks, and a large
animal den site that may provide habitat for rodents. This site was dominated by red bush
willows (Combretum apiculatum [Sond]), a prolific seed producer. Site 3 was selected
9
due to its rocky topography, presence of downed trees that may provide habitat for
rodents, and the presence of several knobthorns. Site 4 was selected due to the presence
of two mature marula trees, one mature knobthorn, and the presence of large stones and
several downed trees that may provide habitat for rodents. Site 5 was selected due to its
proximity to the R40 (a main highway), the presence of three marula trees, very little
canopy cover, and exceptionally high grass coverage (79%). Site 6 was selected due to an
open canopy, high forb percentage (37%), and the presence of downed trees and
termitaria that may provide shelter for rodents. Overall, site selection was focused on best
representing the different microhabitats within the bushveld savanna ecosystem.
On 11 April, after the traps were baited at site 2, 21/25 traps at were crushed and
damaged. Elephants were the suspected culprits and the reserve staff warned that
elephants have a propensity to return to places where they find novel objects. Due to this,
trapping at site 2 was halted and site 7 was selected. Trapping site coordinates are in
Table 1.
Table 1) GPS Coordinates of the seven trapping sites utilized in this experiment.
Site Coordinates
1: Open Site S 24.21124, E 030.84408
2: Little Dam S 24.19713, E 030.84114
3: River Site S 24.18201, E 30.837565
4: Double Dam Slope S 24.19127, E 030.82509
5: Roadside S 24.21325, E 030.84747
6: Oxford Big Dam S 24.18860, E 030.84235
7: Below double Dam S 24.19078, E 030.82453
Trapping techniques were approved by the American Society of Mammalogists
(Sikes & Gannon, 2011) and the WKU Institutional Animal Care and Use Committee.
Trapping occurred between 22 March and 2 August. The types of traps employed were
Sherman® LNG12 traps and Sherman® LNG traps, made by H. B. Sherman Traps Inc.®
10
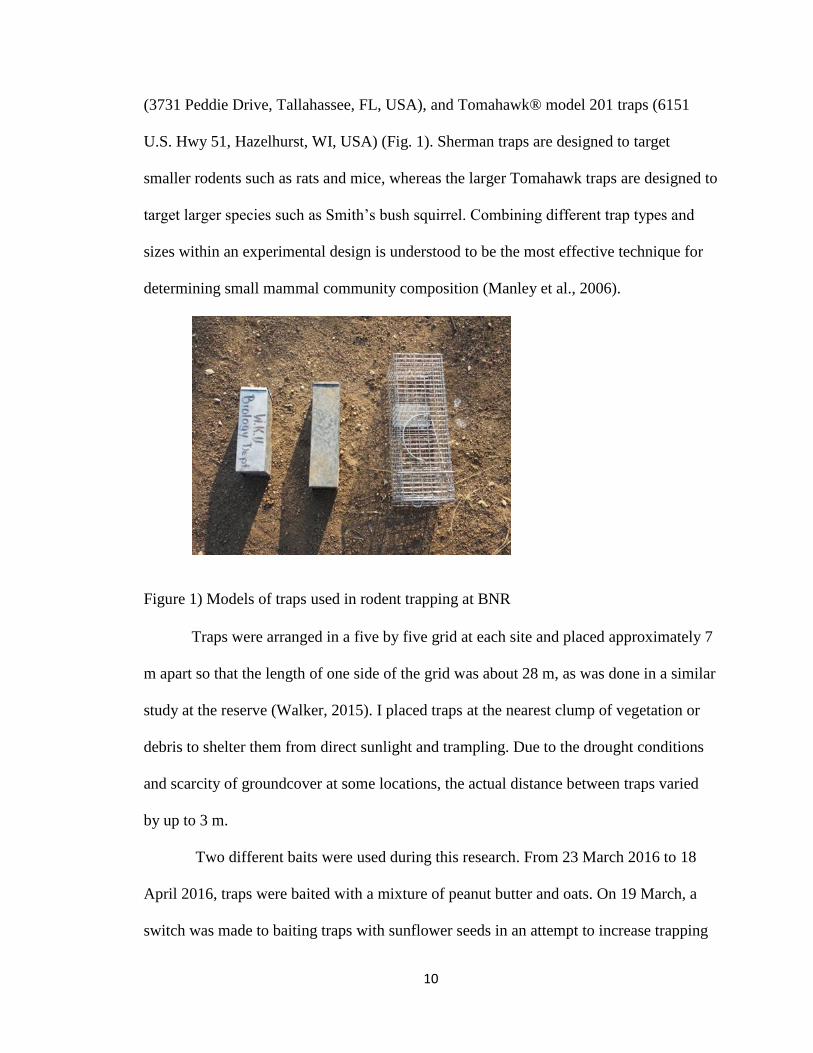
(3731 Peddie Drive, Tallahassee, FL, USA), and Tomahawk® model 201 traps (6151
U.S. Hwy 51, Hazelhurst, WI, USA) (Fig. 1). Sherman traps are designed to target
smaller rodents such as rats and mice, whereas the larger Tomahawk traps are designed to
target larger species such as Smith’s bush squirrel. Combining different trap types and
sizes within an experimental design is understood to be the most effective technique for
determining small mammal community composition (Manley et al., 2006).
Figure 1) Models of traps used in rodent trapping at BNR
Traps were arranged in a five by five grid at each site and placed approximately 7
m apart so that the length of one side of the grid was about 28 m, as was done in a similar
study at the reserve (Walker, 2015). I placed traps at the nearest clump of vegetation or
debris to shelter them from direct sunlight and trampling. Due to the drought conditions
and scarcity of groundcover at some locations, the actual distance between traps varied
by up to 3 m.
Two different baits were used during this research. From 23 March 2016 to 18
April 2016, traps were baited with a mixture of peanut butter and oats. On 19 March, a
switch was made to baiting traps with sunflower seeds in an attempt to increase trapping
11
success. This was maintained through August 2016. Traps were set in the late afternoon
and checked early the following morning. Traps were opened and closed at these times to
avoid confining the rodents during the heat of the day.
De Graaf (1981) was the diagnostic manual used for field identification of rodents
as no individuals could be sacrificed for later expert identification. Manual restraint and
grabbing the rodents by the nape of the neck were employed in handling captured
rodents. This is considered the best way to handle them and is not considered to be
painful (Sikes & Gannon, 2011; Manley et al., 2006). As requested by BNR staff, rodents
were placed in large plastic sandwich bags and measurements were taken through the
bags. Weight, total length, tail length, hind foot length, ear length, and sex were recorded
for each captured individual. Measurements were made in millimeters using a standard
metric ruler. Weights, in grams, were taken using a hanging Pesola scale (CH-8834
Schindellegi, SUI). For analysis of morphological measurements, individuals that were
captured at the same trap and on the same site or had exceptionally similar measurements
to another individual on the same grid were removed from analysis to avoid using
duplicate data of the same individual.
All captured rodents were marked for identification purposes with a permanent
marker or non-toxic dye. The identification marking was made with the intention of
estimating population densities and recording of recaptures using the Schumacher and
Eschmeyer variant of the Schnabel method (Krebs, 1999).
Weather data such as daily average temperature, humidity, and precipitation were
collected to observe how the drought conditions may affect rodent abundance and
density. These data were initially collected online from the Hoedspruit Airforce Base
12
weather station, located ca. 18 km from BNR
(www.wunderground.com/weather/za/hoedspruit-air-base).
Results
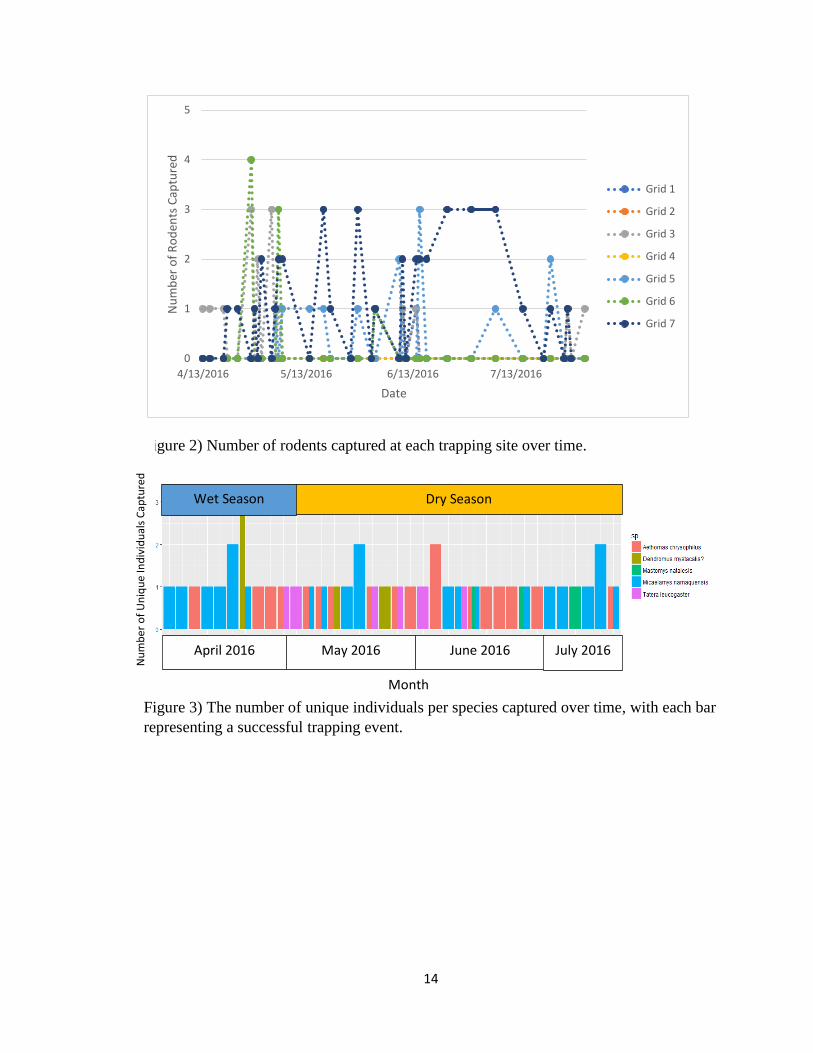
This study included 4282 trap nights. Considerable variability was present in the
number of individuals captured at each trapping site (Fig. 2). There was no seasonal
influence on rodent abundances (Fig. 3). Trapping techniques were successful in reducing
the exposure of captured rodents to the elements, with only four fatalities taking place
during this research project. All fatalities were of rodents captured in outbuildings,
therefore were likely to be the consequence of capture myopathy and could not be
attributed to exposure to severe conditions. Unfortunately, the marking methods were
unreliable and not enough recaptured individuals could be identified for population
abundance estimations.
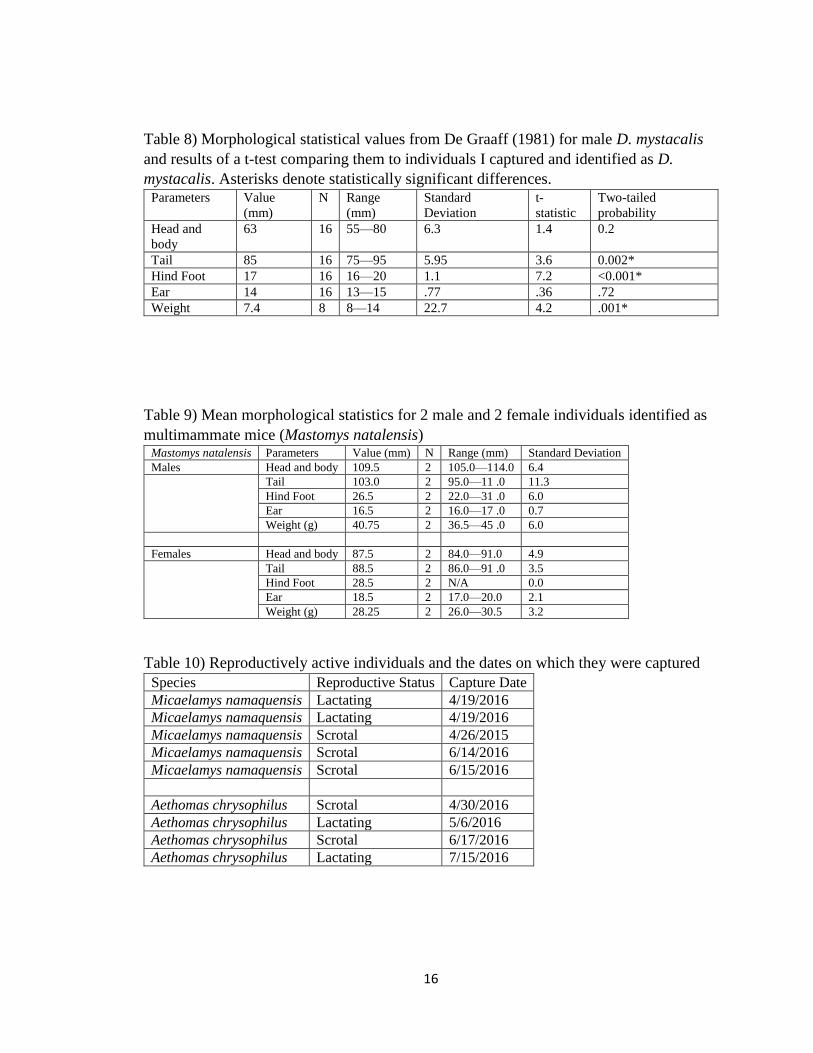
Reproductively active Namaqua rock mouse and red veld rat individuals and the
dates on which they were captured are displayed in Table 10. Namaqua rock mouse
females were not reproductively active during a period that I was capturing males with
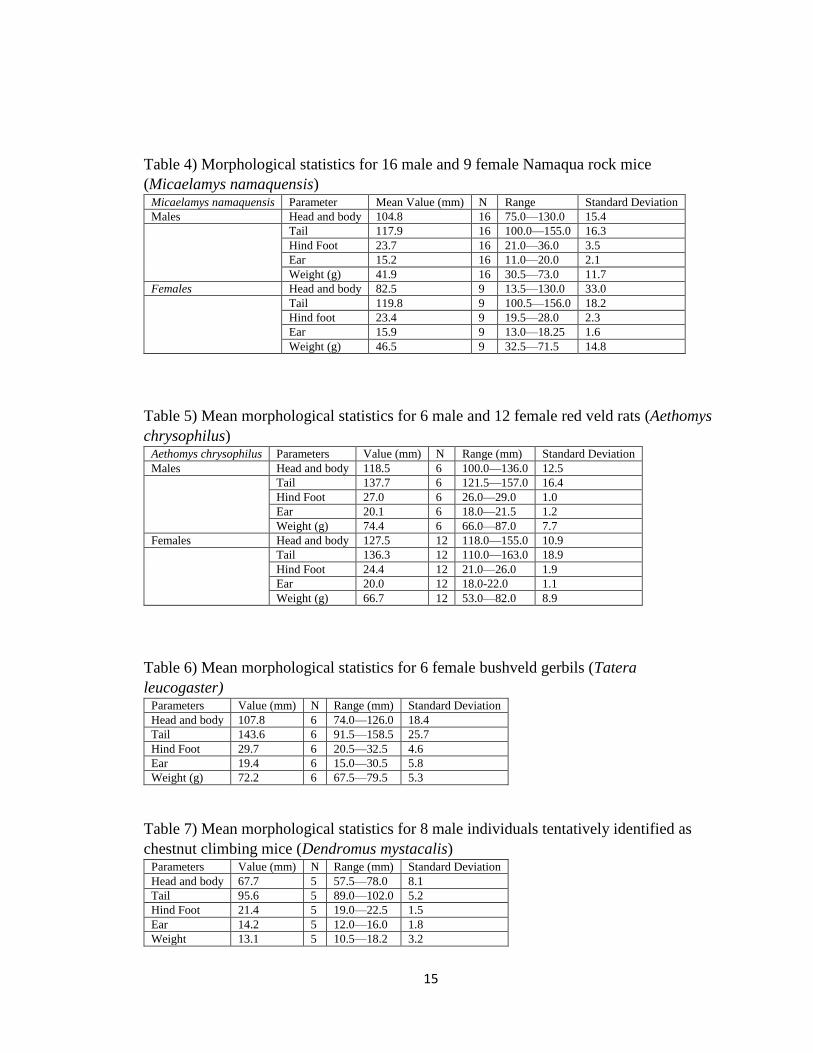
descendent testes. Summary statistics for the weight, head and body length, tail length,
hind foot length, and ear length for males and females are displayed in Tables 4-9. These
largely overlap with De Graaff (1981). However, the values of mean weight, tail length
and hind foot length of individuals otherwise identified as chestnut climbing mice were
statistically significantly higher than described in De Graaff (1981). Habitat assessments
for trapping grids are presented in Appendix 1.
The mean temperature measured each month at the weather station at Hoedspruit
Air Force Base from 1 January, 1986 through 31 December, 2015 as well as the mean
annual precipitation and number of days with rain are listed below in Table 1. The mean
13
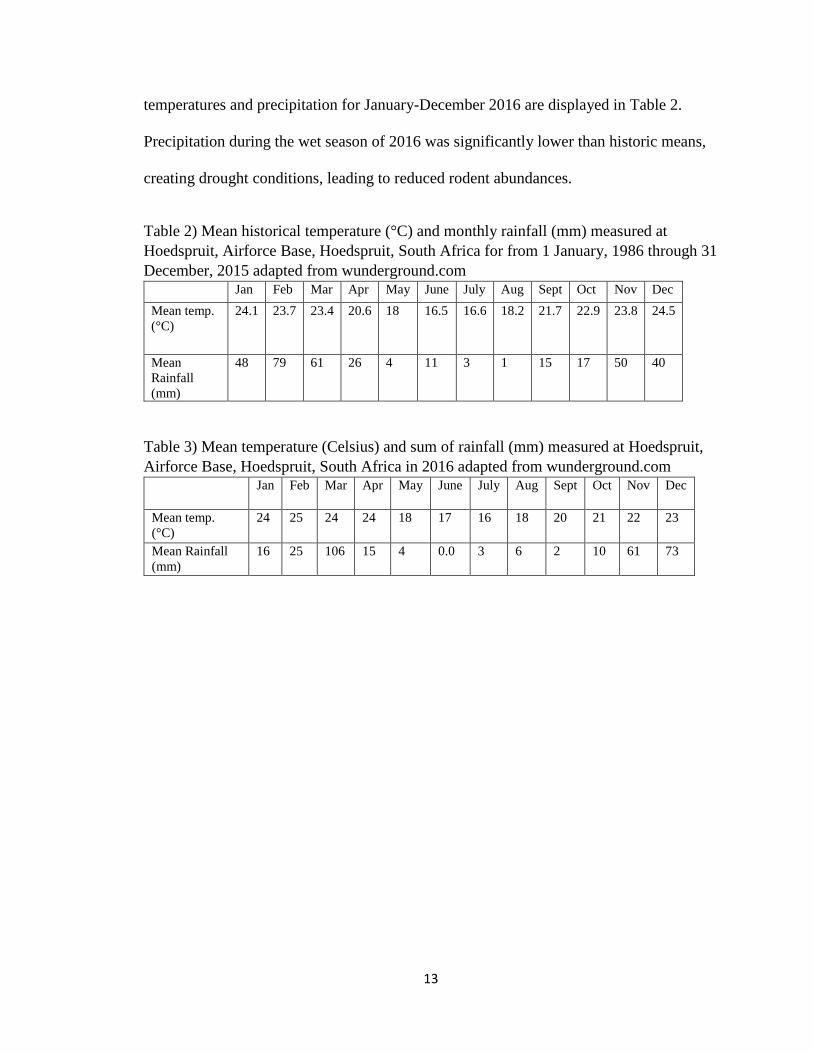
temperatures and precipitation for January-December 2016 are displayed in Table 2.
Precipitation during the wet season of 2016 was significantly lower than historic means,
creating drought conditions, leading to reduced rodent abundances.
Table 2) Mean historical temperature (°C) and monthly rainfall (mm) measured at
Hoedspruit, Airforce Base, Hoedspruit, South Africa for from 1 January, 1986 through 31
December, 2015 adapted from wunderground.com Jan Feb Mar Apr May June July Aug Sept Oct Nov Dec
Mean temp.
(°C)
24.1 23.7 23.4 20.6 18 16.5 16.6 18.2 21.7 22.9 23.8 24.5
Mean
Rainfall
(mm)
48 79 61 26 4 11 3 1 15 17 50 40
Table 3) Mean temperature (Celsius) and sum of rainfall (mm) measured at Hoedspruit,
Airforce Base, Hoedspruit, South Africa in 2016 adapted from wunderground.com Jan Feb Mar Apr May June July Aug Sept Oct Nov Dec
Mean temp.
(°C)
24 25 24 24 18 17 16 18 20 21 22 23
Mean Rainfall
(mm)
16 25 106 15 4 0.0 3 6 2 10 61 73
14
Figure 2) Number of rodents captured at each trapping site over time.
Figure 3) The number of unique individuals per species captured over time, with each bar
representing a successful trapping event.
0
1
2
3
4
5
4/13/2016 5/13/2016 6/13/2016 7/13/2016
Nu
mb
er o
f R
od
ents
Cap
ture
d
Date
Grid 1
Grid 2
Grid 3
Grid 4
Grid 5
Grid 6
Grid 7
April 2016 May 2016 June 2016
July 2016
Month
Nu
mb
er
of
Un
iqu
e In
div
idu
als
Cap
ture
d
Dry Season Wet Season
15
Table 4) Morphological statistics for 16 male and 9 female Namaqua rock mice
(Micaelamys namaquensis) Micaelamys namaquensis Parameter Mean Value (mm) N Range Standard Deviation
Males Head and body 104.8 16 75.0—130.0 15.4
Tail 117.9 16 100.0—155.0 16.3
Hind Foot 23.7 16 21.0—36.0 3.5
Ear 15.2 16 11.0—20.0 2.1
Weight (g) 41.9 16 30.5—73.0 11.7
Females Head and body 82.5 9 13.5—130.0 33.0
Tail 119.8 9 100.5—156.0 18.2
Hind foot 23.4 9 19.5—28.0 2.3
Ear 15.9 9 13.0—18.25 1.6
Weight (g) 46.5 9 32.5—71.5 14.8
Table 5) Mean morphological statistics for 6 male and 12 female red veld rats (Aethomys
chrysophilus) Aethomys chrysophilus Parameters Value (mm) N Range (mm) Standard Deviation
Males Head and body 118.5 6 100.0—136.0 12.5
Tail 137.7 6 121.5—157.0 16.4
Hind Foot 27.0 6 26.0—29.0 1.0
Ear 20.1 6 18.0—21.5 1.2
Weight (g) 74.4 6 66.0—87.0 7.7
Females Head and body 127.5 12 118.0—155.0 10.9
Tail 136.3 12 110.0—163.0 18.9
Hind Foot 24.4 12 21.0—26.0 1.9
Ear 20.0 12 18.0-22.0 1.1
Weight (g) 66.7 12 53.0—82.0 8.9
Table 6) Mean morphological statistics for 6 female bushveld gerbils (Tatera
leucogaster) Parameters Value (mm) N Range (mm) Standard Deviation
Head and body 107.8 6 74.0—126.0 18.4
Tail 143.6 6 91.5—158.5 25.7
Hind Foot 29.7 6 20.5—32.5 4.6
Ear 19.4 6 15.0—30.5 5.8
Weight (g) 72.2 6 67.5—79.5 5.3
Table 7) Mean morphological statistics for 8 male individuals tentatively identified as
chestnut climbing mice (Dendromus mystacalis) Parameters Value (mm) N Range (mm) Standard Deviation
Head and body 67.7 5 57.5—78.0 8.1
Tail 95.6 5 89.0—102.0 5.2
Hind Foot 21.4 5 19.0—22.5 1.5
Ear 14.2 5 12.0—16.0 1.8
Weight 13.1 5 10.5—18.2 3.2
16
Table 8) Morphological statistical values from De Graaff (1981) for male D. mystacalis
and results of a t-test comparing them to individuals I captured and identified as D.
mystacalis. Asterisks denote statistically significant differences. Parameters Value
(mm)
N Range
(mm)
Standard
Deviation
t-
statistic
Two-tailed
probability
Head and
body
63 16 55—80 6.3 1.4 0.2
Tail 85 16 75—95 5.95 3.6 0.002*
Hind Foot 17 16 16—20 1.1 7.2 <0.001*
Ear 14 16 13—15 .77 .36 .72
Weight 7.4 8 8—14 22.7 4.2 .001*
Table 9) Mean morphological statistics for 2 male and 2 female individuals identified as
multimammate mice (Mastomys natalensis) Mastomys natalensis Parameters Value (mm) N Range (mm) Standard Deviation
Males Head and body 109.5 2 105.0—114.0 6.4
Tail 103.0 2 95.0—11 .0 11.3
Hind Foot 26.5 2 22.0—31 .0 6.0
Ear 16.5 2 16.0—17 .0 0.7
Weight (g) 40.75 2 36.5—45 .0 6.0
Females Head and body 87.5 2 84.0—91.0 4.9
Tail 88.5 2 86.0—91 .0 3.5
Hind Foot 28.5 2 N/A 0.0
Ear 18.5 2 17.0—20.0 2.1
Weight (g) 28.25 2 26.0—30.5 3.2
Table 10) Reproductively active individuals and the dates on which they were captured
Species Reproductive Status Capture Date
Micaelamys namaquensis Lactating 4/19/2016
Micaelamys namaquensis Lactating 4/19/2016
Micaelamys namaquensis Scrotal 4/26/2015
Micaelamys namaquensis Scrotal 6/14/2016
Micaelamys namaquensis Scrotal 6/15/2016
Aethomas chrysophilus Scrotal 4/30/2016
Aethomas chrysophilus Lactating 5/6/2016
Aethomas chrysophilus Scrotal 6/17/2016
Aethomas chrysophilus Lactating 7/15/2016
17
Discussion:
South Africa’s dry season is normally April—October and wet season is
November-March. Instead, during 2016 this region of South Africa was suffering from
the worst drought it had seen in 30 years, accruing miniscule amounts of precipitation
(Tables 2 and 3) (“South Africa”, 2015). If the normal precipitation regime had occurred
during trapping, more rodents may have been captured in March and early April
compared to the rest of the trapping schedule. Rodent capture varied more by trapping
site than by season. Previous studies on BNR, conducted in a mild drought and utilizing
the same methods, captured seven species of rodents (Walker, 2015). In this study, only
five species were captured. This reduction in species richness can be expected with
reduced precipitation (Massawe et al., 2011). Smiths’ bush squirrel (Paraxerus cepapi),
captured in 2014 and not captured in 2016, was visibly active and abundant throughout
BNR during times of trapping. In fact, the greatest cause of mortality to seedlings in the
BNR screenhouse was predation by Smith’s bush squirrels. The decreases in rodent
abundance were likely due to the lack of a seasonal availability of food and vegetative
cover during the wet season (Delany, 1972; Leirs, 1992, Massawe et al., 2011).
Morphological measurements for all captured species fit within the ranges of
previously published data (De Graaff, 1981). The individuals captured in this study
tentatively identified as chestnut climbing mice had statistically significantly longer tail
and hind foot and were statistically significantly heavier than previously reported in De
Graaff (1981) (Tables 7 and 8).
18
Namaqua rock mice are known to breed September-May (Fleming & Nicolson,
2004). One lactating female of this species was captured 19 April, 2016. Scrotal males
were captured 14 and 15 June 2016. The female’s condition fits the description of
Namaqua rock mice breeding phenology; however, the males are in breeding condition
later than expected. Beatley (1969) tracked winter annual parameters, post-reproductive
rodent densities, and precipitation over five years in a Nevada desert, USA. He found that
in years with lower precipitation, there was a reduction in the reproduction of rodents. He
postulated that this reduction in rodent reproduction is due to reduced availability of
winter annual vegetation—a food, vitamin, and dietary water source necessary for
production of milk and offspring. Perhaps, a similar phenomenon is occurring in the
lowveld of South Africa with Namaqua rock mice with drought conditions causing
females not to be reproductively active, though more investigation is required. Red veld
rats are known to breed year-round, peaking in summer (De Graaff, 1981). Lactating
females of this species were captured 6 May and 15 July 2016. Scrotal males were
captured 30 April and 17 June 2016. No scrotal or lactating chestnut climbing mice,
bushveld gerbils, or multimammate mice were captured in this study.
I set out to investigate which rodents were present in the bushveld savanna
ecosystem of BNR and their natural history characteristics. Results from this research
generally support information presented by Skinner & Chimimba (2005) and De Graaff
(1981). No species were captured outside of their known distributions. Though few
individuals in reproductive status were captured, most who were in reproductive
condition fit into published phenologies. Walker (2015) and Barber (2015) collectively
captured 136 Namaqua rock mice, 32 Smith’s bush squirrels, three single-stripe mice
19
(Lemniscomys rosalia [Thomas, 1904]), 12 pygmy mice (Mus minutoides [Smith, 1834]),
22 red veld rats, two pouched mice (Sacostomys campestris [Peters, 1846]), and six
bushveld gerbils over 6370 trap nights from mid-June through mid-August 2014 at BNR.
Not only do their results show higher rodent abundances for most of the species that were
captured in 2016, they also display an increased species richness. Lower abundances of
rodents relative to Walker (2015) and Barber (2015) coincided with drought conditions.
This correlation is expected because rodent reproduction and overall abundance is known
to decrease in years of reduced precipitation (Delany 1972; Leirs 1992, Massawe et al.,
2011). It is unknown how drought conditions affect species turnover of bushveld savanna
rodents in this region. There are at least 25 additional rodent species whose distributions
overlap BNR (De Graaff, 1981; Skinner & Chimimba, 2005). Further investigation is
needed to determine if they are present in BNR and if so, which trapping methods are
effective in capturing them.
20
Chapter 2: Investigation of Seed and Seedling Predation by Selected Bushveld Savanna
Rodent Species on Native Trees
Abstract:
The abundance of large, old trees has been declining across many ecosystems.
These trees provide ecological and economic benefits to their local areas. One ecosystem
suffering high mortality of adult trees, as well as a decline in recruitment, is the South
African bushveld savanna which includes Kruger National Park and its associated parks
and nature reserves. I set out to investigate feeding ecology of bushveld savanna rodents,
including red veld rat (Aethomys chrysophilus [de Winton, 1897]), Namaqua rock mouse
(Micaelamys namaquensis [A. Smith, 1843]), bushveld gerbil (Tatera leucogaster
[Peters, 1852]), Smith’s bush squirrel (Paraxerus cepapi [A. Smith, 1836]),
multimammate mouse (Mastomys natalensis [Smith, 1834]), and chestnut climbing
mouse (Dendromus mystacalis [Heuglin, 1863]). Specifically, I investigated if they
would facultatively feed on the seeds and seedlings of several bushveld savanna tree
species, including marula (Sclerocarya birrea subsp. caffra [A. Rich, 1831]), jackalberry
(Diospyros mespiliformis [Hochst]), false marula (Lannea schweinfurthii [Stuhlmanii
engl]), and knobthorn acacia (Acacia nigrescens [Oliv.]). Rodents were trapped in Balule
Nature Reserve, Limpopo, South Africa and put through feeding trials where they were
presented the seeds and seedlings of these native tree species. Results showed significant
differences in rodents’ feeding preferences for seeds. Rodents of each species attacked
seedlings, excising cotyledons and inflicting other damage, though there was no evidence
of preferences among tree species. These results suggest that rodents may be influencing
the recruitment of these tree species.
21
Introduction:
There is currently a decline in the abundance of large, old trees across many
ecosystems and this is concerning because it has negative ecological effects ranging from
soil erosion and fluctuations in ground temperature to extirpation of cavity-nesting birds
and mammals (Lindenmayer, et al., 2012). This decline has been attributed to several
phenomena, namely fires, herbivory and trampling by large herbivores, deforestation, and
general anthropogenic disturbances (Lindenmayer et al., 2012). Before trees reach
maturity, they must first be recruited into the population, then survive adolescence.
Throughout these early stages, trees are subject to herbivory from all functional groups of
herbivores. African savanna ecosystems are experiencing a decline in the abundance of
some large, old trees by a reduction of seedling recruitment (Helm & Witkowski, 2012;
Helm et al., 2011).
Savannas are commonly misrepresented as vast open spaces without trees.
However, trees are an important structural component of the bushveld savanna, impacting
nutrient cycling, water availability, and patterns of space use by wildlife (Belsky, 1994;
Shaw et al., 2014). Savanna trees provide ecosystem services such as increasing the
primary production in their subcanopy areas, providing nesting sites and food to many
animal species as well as food, timber, and other commercial resources to local people
(Belsky, 1994; Lindenmayer et al., 2012; Munondo, 2005).
In South Africa’s savannas, older trees are in decline, and there also appears to be
a reduction in the recruitment of seedlings into the populations of certain species such as
the ecologically and economically important marula (Sclerocarya birrea subsp. caffra)
(Helm & Witkowski, 2012 Jacobs & Biggs, 2002). For example, Cook et al. (2017) found
22
only two marula seedlings in their sampling along eight, 40 m x 200 m transects between
marula trees within Jejane Private Nature Reserve, part of the greater Kruger National
Park (KNP). In Jejane, there were no reported fires between 2000 and 2016, so burning
could not have been a cause of seedling mortality in that study. Elephants are often
implicated in marula decline, but they are unlikely to influence the survivorship of sub-
adult trees, as elephants do not preferentially target seedlings and smaller size-classes of
trees as forage (Boundja & Midgley, 2010; Gadd, 2002; Jacobs & Biggs, 2002). Cook et
al. (2017) showed that elephants in the South African lowveld have a significant
preference for trees in the 5–8 m height class, followed by those in the 8–11 m height
class. If the reduction in recruitment is not caused by elephant, there must be other
factors.
Rodents can impact plant community composition via seed dispersal, as well as
seed and seedling predation (Bricker et al., 2010; Edwards et al., 1999; Linzey &
Washok, 2000; Midgley et al., 2012; Ostfeld et al., 1997). Bricker et al. (2010) showed
that excluding rodents from a western Montana, USA, grassland habitat increased the
emergence and establishment of several plant species, implying that post-dispersal seed
predation by rodents can severely limit the abundance of plants in early life stages.
Additionally, protecting seeds from predation by deer mice (Peromyscus maniculatus
[Gloger, 1841]) increased abundance of plant species of interest for up to three years after
the seeds were added to the habitat (Bricker et al., 2010). Ostfeld et al. (1997) found that
rodents were primary predators of seeds and seedlings of woody plants invading an old
field ecosystem in New York, USA. Moreover, Ostfeld & Canham (1993) established
that meadow voles (Microtus pennsylvanicus [Ord, 1815]) act as keystone species in their
23
environments. Meadow voles control invasion by woody plants by eating invading
seedlings, concentrating surviving seedlings in certain microsites, and altering relative
abundances of invading species such as red maple (Acer rubrum [L.]), sugar maple (A.
saccharum [Marshall]), white ash (Fraxinus Americana [L.]), white pine (Pinus strobus
[L.]), and tree-of-heaven (Ailanthis altissima [Mill]) (Ostfeld & Canham, 1993).
Although rodents clearly influence plant communities, much of Africa’s rodent ecology
has gone unstudied, creating a void of knowledge concerning species that are abundant,
widely distributed, and potentially influence at-risk savanna tree species (Bakker et al.,
2006; Midgley et al., 2012; Root-Bernstein & Ebensperger, 2012; Shaw et al., 2014).
Understanding the factors that impact recruitment of trees is critical to management and
conservation efforts.
To protect adult trees, current management strategies employed in bushveld
savannas include wrapping wire fencing around tree trunks to reduce bark stripping and
employing beehives to deter elephant foraging. Though these methods can be effective in
reducing mortality of adult trees by elephants (Derham et al., 2016; King et al., 2011;
King et al., 2017), they are ineffective at protecting seedlings. Kruger National Park and
its associated nature reserves, such as Balule Private Nature Reserve (BNR), exemplify
the lowveld savanna that is suffering from a decline in recruitment of large, ecologically
and economically important tree species (Helm & Witkowski, 2012). Therefore,
managers of these areas are searching for new management strategies to increase tree
recruitment (C. Spencer, pers. communication, 2016).
A primary focus of this project is the marula tree, a protected species in South
Africa since 1962 (Cook et al., 2017). Marula produce many fruits that are consumed by
24
humans and other animals (Nghitoolwa et al., 2003). There are also commercial uses for
every part of the tree. The marula tree has experienced a severe decline in abundance
within Kruger National Park in recent years with some populations in the northwestern
portion of the park becoming locally extinct (Helm & Witkowski, 2012). Between 2001
and 2010, annual mortality rates of adult trees ranged from 3—5% (Helm & Witkowski,
2012).
The purpose of this research was to investigate through a series of feeding trials
whether bushveld savanna rodents consume seeds and seedlings of local tree species.
Sources such as Skinner & Chimimba (2005) and De Graaff (1981) report many of these
species as seed predators or seed crop pests. Therefore, I hypothesized that, 1) rodents
will facultatively consume seeds of the tree species of interest. De Graaff (1981), Skinner
& Chimimba (2005), and Keesing (1998) list many of the native rodent species as
opportunistic foragers that readily consume vegetative matter. Therefore, I also
hypothesize that, 2) rodents will facultatively consume seedlings of the tree species of
interest.
Methods
Study organisms and Study site:
BNR is a ca. 52,400 ha nature reserve sharing an open border with KNP (Mucina
and Rutherford, 2006). This ecosystem exhibits a considerable diversity of rodents (Kok
et al., 2012). Rodent species used in this experiment and known to be seed and seedling
predators include: red veld rat (Aethomys chrysophilus [de Winton, 1897]), Namaqua
rock mouse (Micaelamys namaquensis [A. Smith, 1843]), bushveld gerbil (Tatera
leucogaster [Peters, 1852]), Smith’s bush squirrel (Paraxerus cepapi [A. Smith 1836]),
25
multimammate mouse (Mastomys natalensis [Smith, 1834]), and chestnut climbing
mouse (Dendromus mystacalis [Hueglin, 1863]) (Abu Baker & Brown, 2012; De Graaff,
1981; Lancaster, 2009; Linzey & Chimimba, 2008; Midgley et al., 2012; Pienaar, 1968;
Skinner & Chimimba, 2005). Notable large tree species in this area include marula,
jackalberry (Diospyros mespiliformis [Hochst. ex A. DC]), false marula (Lannea
schweinfurthii [Stuhlmanii engl]), and knobthorn acacia (B[Oliv.]).
The project of which this thesis is a part set out to determine the palatability of
several savanna tree species’ seeds and seedlings to the native rodents through trapping
and feeding trials in 2014 and 2016. In 2014, trials were conducted from mid-June until
mid-August by undergraduates from Western Kentucky University. In 2016 I conducted
trials March-July. In 2014, seeds for feeding trials were collected locally by BNR staff. In
February-March of 2016, relatively few trees set seed due to drought conditions,
therefore seeds were ordered from Silverhill Seeds and Books of Cape Town, South
Africa (P.O. Box 53108, Kenilworth, 7745 Cape Town, ZA).
During both years, rodent trapping sites were chosen under the guidance of
Olifants West Nature Reserve (part of BNR) staff to include diverse habitats based upon
the following variables: ground cover, canopy cover, proximity to surface water, presence
of tree species of interest, and overall vegetation community composition. Trapping
techniques approved by the American Society of Mammalogists and the Western
Kentucky Institutional Animal Care and Use Committee were used during both periods
(Sikes & Gannon, 2011). Three models of traps, LNG12 and LNG traps (H. B. Sherman
Traps Inc.®, 3731 Peddie Drive, Tallahassee, FL, USA), and model 201 traps
(Tomahawk Live Trap ®, 6151 U.S. Hwy 51, Hazelhurst, WI, USA) were used at each
26
site. Combining different trap types and sizes within an experimental design is
understood to be the most effective technique for determining small mammal community
composition (Manley et al., 2006). Traps were also deployed in maintenance buildings on
the property.
Three different baits were used in attempts to improve the success rate of
trapping. In June-August 2014, each trap was baited with a small amount of a grain and
peanut butter mixture that consisted of a 1:16 ratio of peanut butter to commercial bird
feed containing corn, sorghum and sunflower seeds. From March-April 2016, traps were
baited with a mixture of peanut butter and rolled oats, a readily available and standard
bait for trapping rodents. To increase trapping success, traps were baited with sunflower
seeds from 19 March, 2016 onwards. Traps were set in the late afternoon and checked
soon after sunrise. Traps were opened in the late afternoon and closed during the day to
avoid confining the rodents during the heat of the day.
Rodents were manually restrained and secured by the nape while measuring and
marking. This is considered the best way to handle them and is not considered to be
painful (Sikes & Gannon, 2011; Manley et al., 2006). For each individual, weight, total
length, tail length, hind foot length, and ear length were recorded. Sex and reproductive
status were determined by visual inspection. Each rodent’s morphological measurements
and general appearance were compared to De Graaf (1981) for identification. Individuals
not chosen for the feeding trials were released at the site of their capture immediately.
Lactating or pregnant females were measured, marked, and then released immediately at
site of capture to avoid causing them undue stress or separating them from their
offspring. The goal was to use all rodents that were captured for seed and seedling trials.
27
The number of individuals of a species captured determined how many could be used for
seed and seedling preference trials.
During 2014, captured rodents were held for a total of three days and nights. The
first 24 h was an acclimation period, followed by the feeding trial beginning the night of
the second day. Checks on feeding behavior were made throughout the third day, and
research subjects were release on the fourth morning. Rodents were held in cages 88 cm
wide x 113 cm long x 40 cm tall constructed from 13 mm hardware cloth. When
conducting seed preference trials, the seeds were presented on a tray consisting of four, 5
cm tall plastic cups. Cups were distributed approximately 2 cm apart. Seeds were
presented in a random order, with two seeds of different species in each cup. Each tray
contained two marula seeds, two red bushwillow seeds, two knobthorn seeds, and
supplemental grain (three sunflower seeds, three sorghum seeds, and three pieces of
cracked corn). Feeding trays were placed in the enclosure at 1630 h on the second day.
On day three, checks were done for seed fate at 0730 h, 1230 h, and 1630 h. After the last
check, the tray was removed and more supplemental food was added. The animal
remained in the enclosure overnight and was released at its original capture site on the
morning of day four. Each seed in the trial was given a ranking: completely eaten (1),
partially eaten (2), moved but not eaten (3), and untouched (4).
In 2014 trials, seed fates did not differ between days two and three, thus a
curtailed protocol was developed for 2016 trials—holding rodents for two days and two
nights, the first day and night being an acclimation period and the second night being the
testing period, with release on the third morning. During captivity, rodents had constant
28
access to ad lib. water and to food in the form of a commercial rodent food mixture and
apple slices.
During 2016, rodents were initially housed in 1 m x 1 m x 70 cm arenas made
from lumber and 13 mm hardware cloth. These arenas were harassed by vervet monkeys
(Chlorocebus pygerythrus [F. Cuvier, 1821]) and baboons (Papio ursinus [Kerr, 1792]),
thus I moved trials to 1 m x 57 cm commercial rodent cages (plastic base with wire top)
and 65 cm x 47 cm clear plastic tubs with wire mesh tops, both located in a plant nursery
constructed of shade cloth. A layer of soil ca. 1 to 3 cm thick was spread over the bottom
of each arena to create a more natural environment. In both types of cages, a Sherman
trap that was fixed open served as a shelter. From late May to early August, rodents were
provided with cotton wool as nesting material during cold nights. Between test subjects,
each arena and its accessories (water and food dishes) were thoroughly rinsed with water
to remove odors associated with the arena’s previous inhabitant that may affect feeding
behavior.
During the 2016 seed preference trials, animals were presented with functionally
unlimited water, two seeds of each tree species, and approximately 15 ml of sunflower
seeds on the feeding trays used in the 2014 study. Seeds were presented in a random
arrangement of cups to avoid spatial bias. The fates of the seeds were recorded at first
light the following morning. Seed fates were ranked undisturbed (1), undamaged and
cached (2), partially consumed (3), and fully consumed (4). Seed fate was determined
based on the seeds’ flesh rather than the seed coat and external features. Supplemental
sunflower seeds and grain were not assessed for damage as they were almost always
completely consumed.
29
To test for rodents’ inclination to facultatively feed on seedlings of the tree
species of interest, the following procedure was followed. Seedlings were germinated in
the on-site screenhouse from 22 March through 16 June under a heat lamp within a house
due to low soil temperatures. Seedlings along a gradient of growth and development
states were selected for trials. The number of leaves and cotyledons on each seedling
were recorded before and after each trial to provide a quantitative basis for the degree of
damage done during the trial. Photos were taken of each seedling before and after each
trial. After photographs were taken, seedlings were planted in a random arrangement in
the arena by pouring approximately 350 ml of damp soil into the arena and packing it
around the base of the seedling, maintaining it in an upright position.
Seedlings were planted between 19:00 and 21:00 pm. Fates of seedlings were
checked at first light. All seedlings were examined to determine the nature and extent of
damage and whether damage was caused by the rodents (detectable by bite patterns) or
insects. Categories of damage for seedlings are as follows: undisturbed (1), minor
herbivory (2), major herbivory (3), uprooted with no other damage (4), and completely
consumed (5). Minor herbivory scores were assigned when less than half of the leaves
were removed and there was no significant damage to the main stem. Major herbivory
scores were assigned when at least half of a seedling’s leaves were removed or there was
significant damage done to the stem or cotyledons.
Seed preference trials from 2014 were analyzed using Bonferroni-corrected
Kruskal-Wallis tests in Statistica© (StatSoft 2013) to determine if there were statistically
significant differences in the damage done to seeds of all species. Seed predation data
from 2016 were analyzed using Kruskal-Wallis and Wilcoxon Rank Sum Tests within R
30
Studio version 0.00.903. Some seedlings were uprooted without damage done the
seedling. This would still cause mortality of the seedling. Therefore, seedling fates were
lumped into either lethal (scores 1 and 2) or nonlethal (scores 3, 4, and 5) groups. Due to
this lethal: nonlethal binary relationship, seedling trial results were analyzed using a
logistic regression. The regression was performed on a GLM containing tree species and
damage (lethal and nonlethal). Model fits were evaluated with AIC values. The logistical
regression analysis was also performed within the statistical environment of R Studio
version 0.00.903.
Results
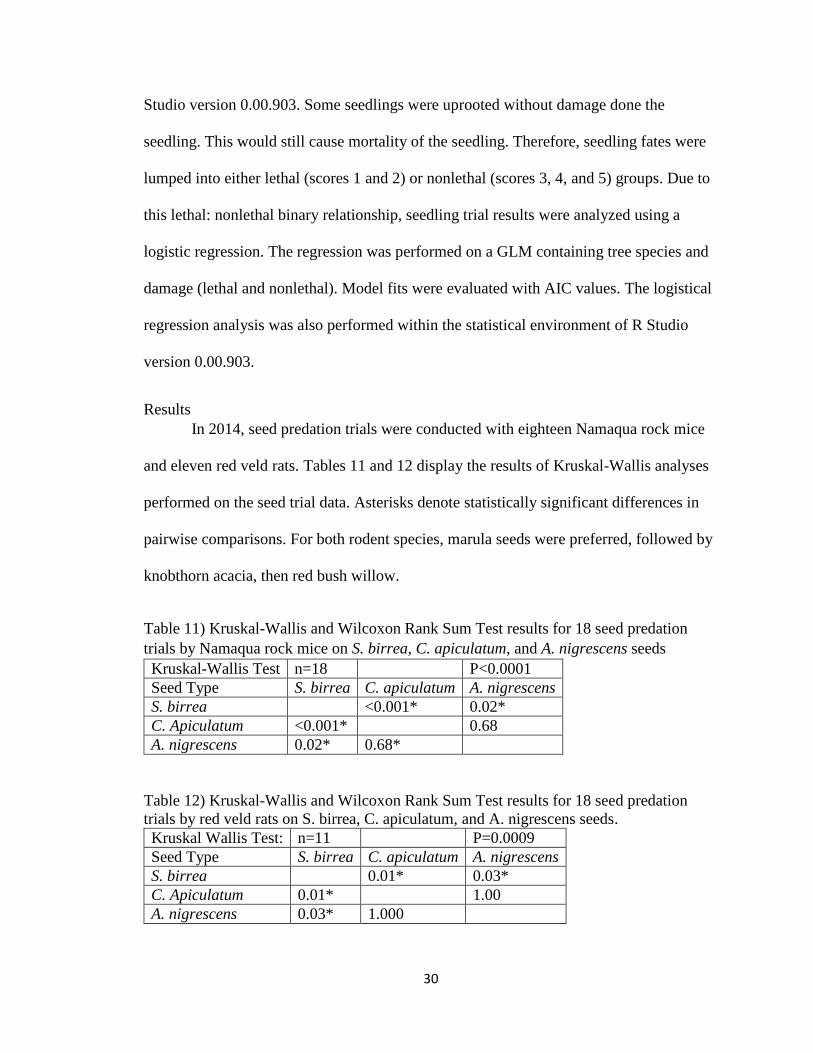
In 2014, seed predation trials were conducted with eighteen Namaqua rock mice
and eleven red veld rats. Tables 11 and 12 display the results of Kruskal-Wallis analyses
performed on the seed trial data. Asterisks denote statistically significant differences in
pairwise comparisons. For both rodent species, marula seeds were preferred, followed by
knobthorn acacia, then red bush willow.
Table 11) Kruskal-Wallis and Wilcoxon Rank Sum Test results for 18 seed predation
trials by Namaqua rock mice on S. birrea, C. apiculatum, and A. nigrescens seeds
Kruskal-Wallis Test n=18 P<0.0001
Seed Type S. birrea C. apiculatum A. nigrescens
S. birrea <0.001* 0.02*
C. Apiculatum <0.001* 0.68
A. nigrescens 0.02* 0.68*
Table 12) Kruskal-Wallis and Wilcoxon Rank Sum Test results for 18 seed predation
trials by red veld rats on S. birrea, C. apiculatum, and A. nigrescens seeds.
Kruskal Wallis Test: n=11 P=0.0009
Seed Type S. birrea C. apiculatum A. nigrescens
S. birrea 0.01* 0.03*
C. Apiculatum 0.01* 1.00
A. nigrescens 0.03* 1.000
31
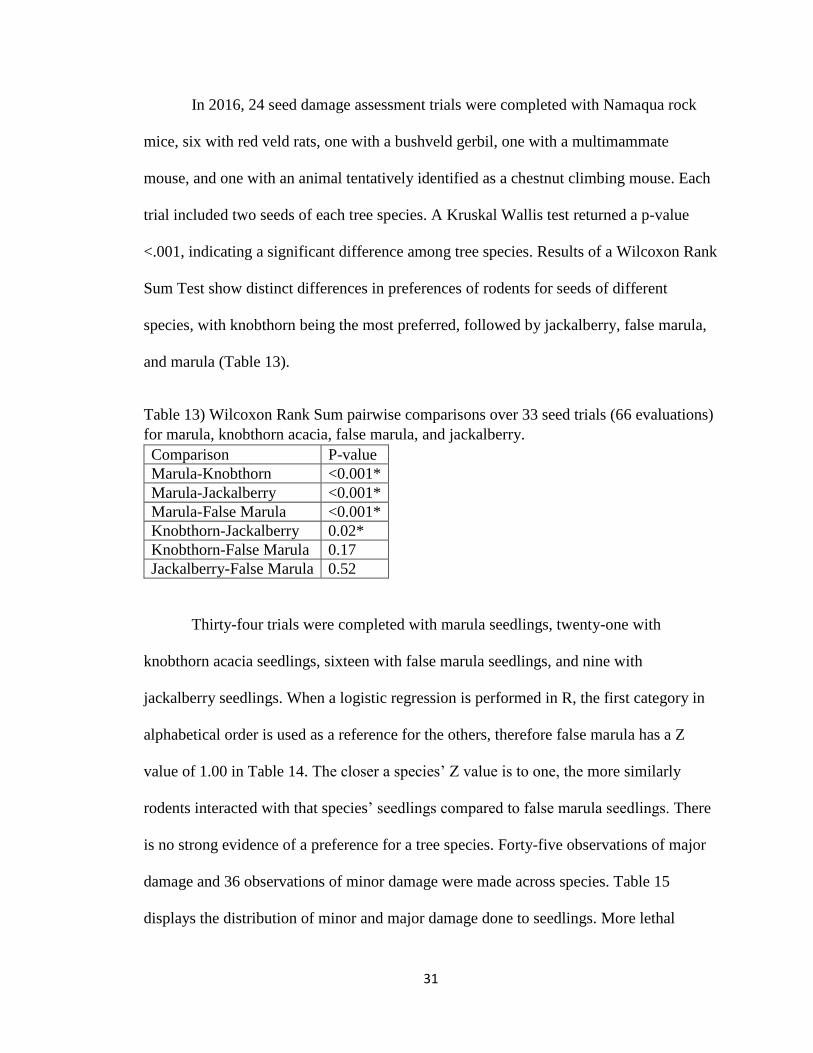
In 2016, 24 seed damage assessment trials were completed with Namaqua rock
mice, six with red veld rats, one with a bushveld gerbil, one with a multimammate
mouse, and one with an animal tentatively identified as a chestnut climbing mouse. Each
trial included two seeds of each tree species. A Kruskal Wallis test returned a p-value
<.001, indicating a significant difference among tree species. Results of a Wilcoxon Rank
Sum Test show distinct differences in preferences of rodents for seeds of different
species, with knobthorn being the most preferred, followed by jackalberry, false marula,
and marula (Table 13).
Table 13) Wilcoxon Rank Sum pairwise comparisons over 33 seed trials (66 evaluations)
for marula, knobthorn acacia, false marula, and jackalberry.
Comparison P-value
Marula-Knobthorn <0.001*
Marula-Jackalberry <0.001*
Marula-False Marula <0.001*
Knobthorn-Jackalberry 0.02*
Knobthorn-False Marula 0.17
Jackalberry-False Marula 0.52
Thirty-four trials were completed with marula seedlings, twenty-one with
knobthorn acacia seedlings, sixteen with false marula seedlings, and nine with
jackalberry seedlings. When a logistic regression is performed in R, the first category in
alphabetical order is used as a reference for the others, therefore false marula has a Z
value of 1.00 in Table 14. The closer a species’ Z value is to one, the more similarly
rodents interacted with that species’ seedlings compared to false marula seedlings. There
is no strong evidence of a preference for a tree species. Forty-five observations of major
damage and 36 observations of minor damage were made across species. Table 15
displays the distribution of minor and major damage done to seedlings. More lethal
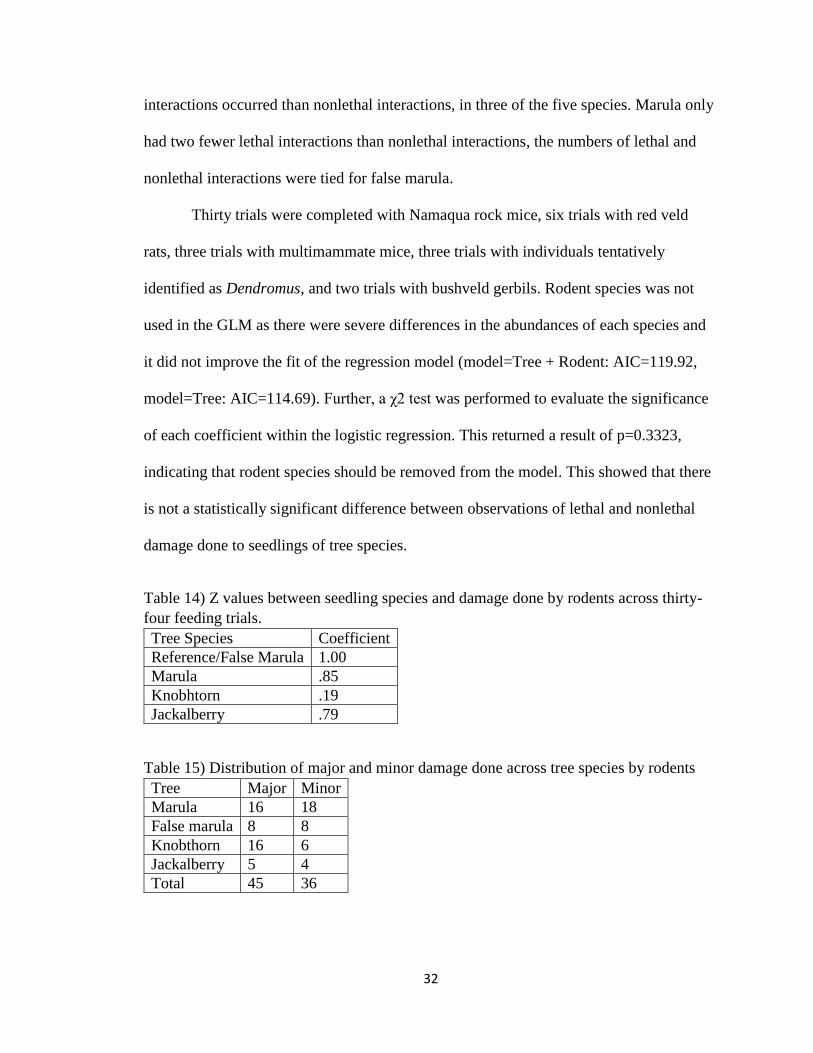
32
interactions occurred than nonlethal interactions, in three of the five species. Marula only
had two fewer lethal interactions than nonlethal interactions, the numbers of lethal and
nonlethal interactions were tied for false marula.
Thirty trials were completed with Namaqua rock mice, six trials with red veld
rats, three trials with multimammate mice, three trials with individuals tentatively
identified as Dendromus, and two trials with bushveld gerbils. Rodent species was not
used in the GLM as there were severe differences in the abundances of each species and
it did not improve the fit of the regression model (model=Tree + Rodent: AIC=119.92,
model=Tree: AIC=114.69). Further, a χ2 test was performed to evaluate the significance
of each coefficient within the logistic regression. This returned a result of p=0.3323,
indicating that rodent species should be removed from the model. This showed that there
is not a statistically significant difference between observations of lethal and nonlethal
damage done to seedlings of tree species.
Table 14) Z values between seedling species and damage done by rodents across thirty-
four feeding trials.
Tree Species Coefficient
Reference/False Marula 1.00
Marula .85
Knobhtorn .19
Jackalberry .79
Table 15) Distribution of major and minor damage done across tree species by rodents
Tree Major Minor
Marula 16 18
False marula 8 8
Knobthorn 16 6
Jackalberry 5 4
Total 45 36
33
Discussion
This project demonstrated that native bushveld savanna rodents will feed
facultatively on seeds of marula, knobthorn, false marula, and jackalberry. This supports
reports by De Graaf (1981) and Skinner & Chimimba (2005) that proposed Namaqua
rock mice, red veld rats, bushveld gerbils, Dendromus spp., and multimammate mice are
seed predators. Results of the 2014 seed trials showed that the Namaqua rock mice and
red veld rats significantly preferred marula seeds out of the three choices. However, in
the 2016 trials, rodents avoided eating marula seeds. The most preferred seed was
knobthorn, followed by jackalberry, false marula, and finally marula. In 2016 seed trials,
more supplementary food was provided to investigate how an increased abundance of
palatable and easy to manipulate food could change rodents’ likelihood to consume
native tree seeds. Access to palatable supplementary food on a functionally unlimited
based likely made the labor necessary to penetrate the tough endocarp of the marula
endocarp unappealing. In Jejane Private Nature Reserve, Cook et al. (2017) found 1033
endocarps under 30 female marula trees, 97.1% (n=1003) had at least one missing seed
missing. Of these, bite marks were present on 307 endocarps. Further, a total of 2289
locules were counted from the 1033 endocarps, of which 1928 had been opened and were
empty (Cook et al., 2017). This suggests that rodents prey upon marula seeds to a
significant extent. Damage to seeds likely leads to the mortality. Dalgleish et al. (2012)
found that even slight damage to a chestnut seed’s meat done by a weevil will drop
germination rate from 94 to 32%. Similarly, they found that seeds with more than 50%
damage would not germinate (Dalgleish et al., 2012). Rodents did severe damage to the
flesh of seeds. Additionally, partially consumed seeds in this study were not cached or
covered with soil, further reducing the probability of germination and survival.
34
Feeding trials also demonstrated that the savanna rodents will feed on seedlings of
the native trees. This is undocumented in literature. Young seedlings with fleshy,
untapped cotyledons were preferentially attacked. This was evident across all tree
species. In marula seedlings, young fleshy cotyledons were excised and completely
consumed. This would likely kill the seedlings. Cotyledon damage often produces
persistent and severe effects on the target’s survivorship, growth rates, reproductive
phenology, and ability to compete for space and resources (Bonfil 1998; Dube et al.,
2009; Hanley & Fegan, 2007; Kitajima, 2003; Zhang et al., 2011). In addition to being
preyed upon, some seedlings were uprooted. This would likely be lethal to the seedling.
The extent to which different categories of damage impact seedling success and
survival within bushveld savanna trees needs to be investigated further. This is especially
true for damage to cotyledons during early stages of development. During and after
germination, cotyledons transfer reserve materials (e.g. lipid, carbohydrates, mineral
nutrients) into developing shoots and roots (Dube et al., 2009). Losing these cotyledons
during development could reduce the ability for the seedling to continue developing and
compete with other surrounding plants for resources. It is important to investigate the
timing of herbivory on seedlings because this influences subsequent growth and
development (Bonfil, 1998; Dube et al., 2016). The tree species examined in this study
maintain their cotyledons for varying amounts of time (pers. observation, 2016).
Bonfil (1998) found that survival of seedlings was greatly reduced by cotyledon
removal in both of their study species, and cotyledon damage had lasting effects even up
to one month after germination. This suggests that analyzing how long each tree species
retains their cotyledons should be assessed because time before the seedlings drop their
35
cotyledons is seemingly when they are most appealing to rodents. The ability to achieve
rapid independence from the cotyledons may provide a significant advantage over
neighbours, whose growth and reproductive potential are limited by herbivore damage at
the same age (Hanley & Fegan, 2007). This would potentially decrease the seedlings’
allure to predators and reduce the amount of resources lost in an herbivory event. Further,
the time of damage during a seedling’s development can be important.
To investigate whether rodents can affect the recruitment of bushveld savannah
tree species via seedling predation, additional research needs to be conducted. There may
be a gradient of how important the cotyledons are to the development of the four tree
species in this study. Similarly, what role cotyledons play within each tree species’
development needs to be investigated. Damage to cotyledons that play a more
photosynthetic role may have a different impact than damage done to cotyledons that
serve as nutrient reservoirs during development (Hanley & Fegan, 2007). For example,
BNR staff has plans in place for studies in which cotyledons are manually removed from
nursery raised individuals and their survivorship recorded.
Results of this experiment supported the hypotheses that rodents will consume the
seeds and seedlings of these four tree species, even when other palatable food is
available. Additionally, observations of the preferential utilization of young cotyledons
by the rodents leads to more questions concerning the physiological effects on seedlings
when major damage occurs to their cotyledons as well as the roles that cotyledons play in
the development in each tree species’ seedling development. Increased mortality of
seedlings may explain at least part of the decline in marula recruitment.
36
Literature Cited:
Abu Baker, M. A., & Brown, J. S. (2012). Patch use behaviour of Elephantulus myurus
and Micaelamys namaquensis: The role of diet, foraging substrates and escape
substrates. African Journal of Ecology, 50, 167–175.
http://doi.org/10.1111/j.1365-2028.2011.01309.x
Bakker, E. S., Ritchie, M. E., Olff, H., Milchunas, D. G., & Knops, J. M. H. (2006).
Herbivore impact on grassland plant diversity depends on habitat productivity and
herbivore size. Ecology Letters, 9, 780–788. http://doi.org/10.1111/j.1461-
0248.2006.00925.x
"Balule Private Reserve | South African Safari." Balule Private Game Reserve. Accessed
September 17, 2015. Retrieved from http://balule.krugerpark.co.za/
Barber, B. (2015). Analysis of seed preference trials of red veld rats and Smith’s bush
squirrels and trap effectiveness in the Lowveld of South Africa (Unpublished
honors thesis). Western Kentucky University.
Beatley, J. C. (1969). Dependence of Desert Rodents on Winter Annuals and
Precipitation. Ecology, 50, 721-724. doi:10.2307/1936267
Belsky, A. J. (1994). Influences of Trees on Savanna Productivity: Tests of Shade,
Nutrients, and Tree-Grass Competition. Ecology, 75, 922-932.
doi:10.2307/1939416
Bonfil, C. (1998). The Effects of Seed Size, Cotyledon Reserves, and Herbivory on
Seedling Survival and Growth in Quercus rugosa and Q. laurina (Fagaceae).
American Journal of Botany, 85, 79. doi:10.2307/2446557
37
Boundja, R. P., & Midgley, J. J. (2010). Patterns of Elephant Impact on Woody Plants in
the Hluhluwe-Imfolozi Park, Kwazulu-Natal, South Africa. African Journal of
Ecology, 48, 206-214. doi:10.1111/j.1365-2028.2009.01104.x.
Bricker, M., Pearson, D., & Maron, J. (2010). Small-mammal seed predation limits the
recruitment and abundance of two perennial grassland forbs. Ecology, 91, 85-92.
doi:10.1890/08-1773.1
Cook, R. M., Witkowski, E. T., Helm, C. V., Henley, M. D., & Parrini, F. (2017). Recent
exposure to African Elephants After a Century of Exclusion: Rapid Accumulation
of Marula Tree Impact and Mortality, and Poor Regeneration. Forest Ecology and
Management, 401, 107-16.
Dalgleish, H. J., Shukle, J. T., & Swihart, R. K. (2012). Weevil seed damage reduces
germination and seedling growth of hybrid American chestnut. Canadian Journal
of Forest Research, 42, 1107-1114. doi:10.1139/x2012-067
De Graaff, G. (1981). The rodents of southern Africa: Notes on their identification,
distribution, ecology, and taxonomy. Durban: Burterworth's.
Delany, M. J. (1972). The ecology of small rodents in tropical Africa. Mammal
Review, 2, 1-42. doi:10.1111/j.1365-2907.1972.tb00155.
Derham, K., Henley, M. D., & Schulte, B. A. (2016). Wire netting reduces African
elephant (Loxodonta africana) impact to selected trees in South Africa. Koedoe,
58. doi:10.4102/koedoe.v58i1.1327
Dube, S., Mlambo, D., & Sebata, A. (2009). Response of Faidherbia albida (Del.) A.
Chev., Boliver. and Acacia nilotica (L.) Willd ex Del. seedlings to simulated
38
cotyledon and shoot herbivory in a semi-arid savanna in Zimbabwe. African
Journal of Ecology, 48, 361-367. doi:10.1111/j.1365-2028.2009.01119.x
Edwards, G. R., & Crawley, M. J. (1999). Herbivores, seed banks and seedling
recruitment in mesic grassland. Journal of Ecology, 87, 423-435.
doi:10.1046/j.1365-2745.1999.00363.x
Fleming, P. A., & Nicolson, S. W. (2004). Sex differences in space use, body condition
and survivorship during the breeding season in the Namaqua rock mouse,
Aethomys namaquensis. African Zoology, 39, 123-132.
Gadd, M. E. (2002). The impact of elephants on the marula tree Sclerocarya birrea.
African Journal of Ecology, 40, 328-336. doi:10.1046/j.1365-2028.2002.00385.x
Hanley, M. E., & Fegan, E. L. (2007). Timing of cotyledon damage affects growth and
flowering in mature plants. Plant, Cell & Environment, 30, 812-819.
doi:10.1111/j.1365-3040.2007.01671.x
Helm, C. V., Scott, S. L., & Witkowski, E. T. (2011). Reproductive potential and seed
fate of Sclerocarya birrea subsp. caffra (marula) in the low altitude savannas of
South Africa. South African Journal of Botany, 77, 650-664.
http://dx.doi.org/10.1016/j. sajb.2011.02.003.
Helm, C., & Witkowski, E. (2012). Continuing decline of a keystone tree species in the
Kruger National Park, South Africa. African Journal of Ecology, 51, 270-279.
http://onlinelibrary.wiley.com/doi/10.1111/aje.12032/full
Jacobs, O. S., & Biggs, R. (2002). The impact of the African Elephant on marula trees in
the Kruger National Park. South African Journal of Wildlife Research, 32.
39
Keesing, F. (1998). Impacts of ungulates on the demography and diversity of small
mammals in central Kenya., 116, 381-389. doi:10.1007/s004420050601
King, L. E., Douglas-Hamilton, I., & Vollrath, F. (2011). Beehive fences as effective
deterrents for crop-raiding elephants: field trials in northern Kenya. African
Journal of Ecology, 49, 431-439. doi:10.1111/j.1365-2028.2011.01275.x
King, L. E., Lala, F., Nzumu, H., Mwambingu, E., & Douglas-Hamilton, I. (2017).
Beehive fences as a multidimensional conflict-mitigation tool for farmers
coexisting with elephants. Conservation Biology, 31, 743-752.
doi:10.1111/cobi.12898
Kok, A. D., Parker, D. M., & Barker, N. P. (2012). Life on high: the diversity of small
mammals at high altitude in South Africa. Biodiversity and Conservation, 21,
2823-2843. doi:10.1007/s10531-012-0340-0
Krebs, C. (1999). Ecological methodology (2nd ed.). Menlo Park, CA:
Benjamin/Cummings
Lancaster, J. L. (2009). Population and life history characteristics of coexisting small
mammal species in a grassland habitat (Unpublished doctoral dissertation,
University of the Witwatersrand). Johannesburg
Leirs, H. (1992). Population ecology of Mastomys natalensis (Smith, 1834) – Implication
for rodent control in Africa (Unpublished doctoral dissertation, University of
Antwerpen). Antwerpen.
Lindenmayer, D. B., Laurance, W. F., & Franklin, J. F. (2012). Global Decline in Large
Old Trees. Science, 338, 1305-1306. doi:10.1126/science.1231070
40
Linzey, A. V., & Washok, K. A. (2000). Seed removal by ants, birds and rodents in a
woodland savanna habitat in Zimbabwe. African Zoology, 35, 295-299.
doi:10.1080/15627020.2000.11407202
Linzey, A. V., & Chimimba, C. T. (2008). Aethomys chrysophilus (Rodentia:
Muridae). Mammalian Species, 808, 1-10. doi:10.1644/808.1
Manley, P. N., Horne, B. V., Roth, J. K., Zielinski, W. J., McKenzie, M. M., Weller, T.
J., . . . Hargis, C. D. (2006). Multiple species inventory and monitoring technical
guide. Washington D.C.: United States Dept. of Agriculture, Forest Service.
Massawe, A. W., Mulungu, L. S., Makundi, R. H., Dlamini, N., Eiseb, S. J., Kirsten, F.,
Belmain, S. R. (2011). Spatial and Temporal Population Dynamics of Rodents in
Three Geographically Different Regions in Africa: Implication for Ecologically-
Based Rodent Management†. African Zoology, 46, 393-405.
doi:10.3377/004.046.0219
Midgley, J. J., Gallaher, K., & Kruger, L. M. (2012). The role of the elephant (Loxodonta
africana) and the tree squirrel (Paraxerus cepapi) in marula (Sclerocarya birrea)
seed predation, dispersal and germination. Journal of Tropical Ecology, 28, 227-
231. doi:10.1017/s0266467411000654
Midgley, J. J., Lawes, M. J., & Chamaillé-Jammes, S. (2010). Turner Review No. 19.
Savanna woody plant dynamics: the role of fire and herbivory, separately and
synergistically. Australian Journal of Botany, 58, 1. doi:10.1071/bt09034
Mucina, L. (2006). The vegetation of South Africa, Lesotho and Swaziland. Strelitzia, 19,
348-437.
41
Munondo, R. (2005). Population dynamics of Marula, Sclerocarya birrea sub sp. caffra
in Mwenezi. (Unpublished master's thesis). University of Zimbabwe.
Nghitoolwa, E., Hall, J. B., & Sinclair, F. L. (2003). Population status and gender
imbalance of the marula tree, Sclerocarya birrea subsp. caffra in northern
Namibia. Agroforestry Systems,59, 289-294.
doi:10.1023/b:agfo.0000005229.73175.07
Odhiambo, R. O., Makundi, R. H., Leirs, H., & Verhagen, R. (2008). Demography,
reproductive biology and diet of the bushveld gerbil Tatera leucogaster
(Rodentia: Gerbillinae) in the Lake Rukwa valley, south-western
Tanzania. Integrative Zoology, 3, 31-37. doi:10.1111/j.1749-4877.2008.00073.x
Ostfeld, R. S. (1997). Effects of Rodents on Survival of Tree Seeds and Seedlings
Invading Old Fields. Ecology, 78, 1531. doi:doi:10.2307/2266146
Ostfeld, R. S., & Canham, C. D. (1993). Effects of Meadow Vole Population Density on
Tree Seedling Survival in Old Fields. Ecology, 74, 1792-1801.
doi:doi:10.2307/1939937.
Pienaar, U. D. (1968). The ecological significance of roads in a National
Park. Koedoe, 11. doi:10.4102/koedoe.v11i1.759
Reader, R. J. (1991). Control of seedling emergence by ground cover: a potential
mechanism involving seed predation. Canadian Journal of Botany, 69, 2084-2087.
doi:http://dx. doi.org/10.1139/b91-260
Root-Bernstein, M., & Ebensperger, L. A. (2012). Meta-analysis of the effects of small
mammal disturbances on species diversity, richness and plant biomass. Austral
Ecology, 38, 289-299. doi:10.1111/j.1442-9993.2012.02403.x
42
Saetnan, E. R., & Skarpe, C. (2006). The effect of ungulate grazing on a small mammal
community in southeastern Botswana. African Zoology, 41, 9-16.
doi:10.3377/1562-7020(2006)41[9:teougo]2.0.co;2
Shaw, M. T., Keesing, F., & Ostfeld, R. S. (2014). Herbivory on Acacia seedlings in an
East African Savanna. OIKOS, 98, 385-392.
Sikes, R. S., & Gannon, W. L. (2011). Guidelines of the American Society of
Mammalogists for the use of wild mammals in research. Journal of
Mammalogy, 92, 235-253. doi:10.1644/10-mamm-f-355.1
Skinner, J., & Chimimba, C. (2005). The mammals of the Southern African Sub-
region (3rd ed.). New York: Cambridge University Press.
Sluydts, V., Crespin, L., Davis, S., Lima, M., & Leirs, H. (2007). Survival and maturation
rates of the African rodent, Mastomys natalensis: density-dependence and rainfall.
Integrative Zoology, 2, 220-232. doi:10.1111/j.1749-4877.2007.00065.x
Stephens, S. L., Moghaddas, J. J., Edminster, C., Fiedler, C. E., Haase, S., Harrington,
M., Youngblood, A. (2009). Fire treatment effects on vegetation structure, fuels,
and potential fire severity in western US forests. Ecological Applications, 19,
305-320. http://dx.doi.org/ 10.1890/07-1755.1.
Van Gulck, T., Stoks, R., Verhagen, R., Sabuni, C., Mwanjabe, P., & Leirs, H. (1998).
Short-term effects of avian predation variation on population size and local
survival of the multimammate rat, Mastomys natalensis (Rodentia, Muridae).
Mammalia, 62. doi:10.1515/mamm.1998.62.3.329
Van Wyk, B., & Van Wyk, P. (2011). The Field Guide to Trees of Southern Africa. (15th
ed.). Cape Town: Struik.
43
Vibe-Petersen, S., Leirs, H. & De Bruy, L. (2006). Effects of predation and dispersal on
Mastomys natalenis population dynamics in Tanzanian maize fields. Journal of
Animal Ecology 75, 213–220.
Yarnell, R. W., Scott, D. M., Chimimba, C. T., & Metcalfe, D. J. (2007). Untangling the
roles of fire, grazing and rainfall on small mammal communities in grassland
ecosystems. Oecologia, 154, 387-402. doi:10.1007/s00442-007-0841-9
Walker, W. (2015). Seed preference trials of Namaqua rock mice and rodent density
estimates in the lowveld savanna of South Africa (Unpublished honors thesis).
Western Kentucky University.
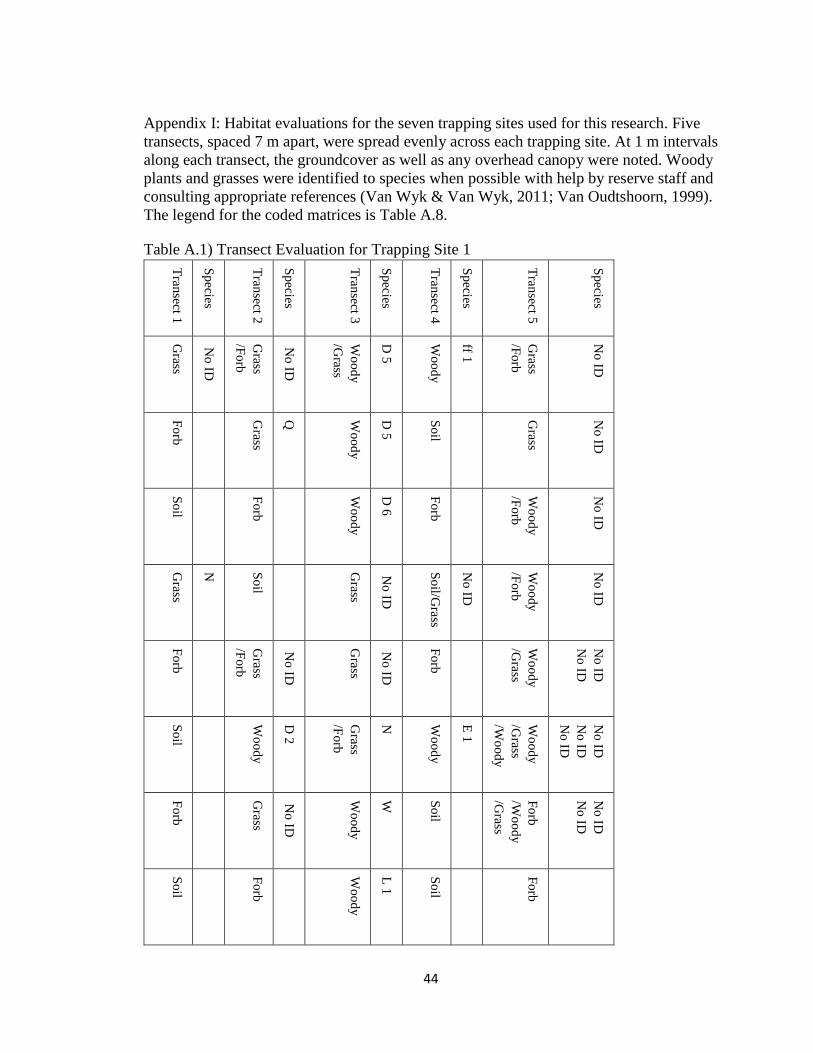
44
Appendix I: Habitat evaluations for the seven trapping sites used for this research. Five
transects, spaced 7 m apart, were spread evenly across each trapping site. At 1 m intervals
along each transect, the groundcover as well as any overhead canopy were noted. Woody
plants and grasses were identified to species when possible with help by reserve staff and
consulting appropriate references (Van Wyk & Van Wyk, 2011; Van Oudtshoorn, 1999).
The legend for the coded matrices is Table A.8.
Table A.1) Transect Evaluation for Trapping Site 1
Tran
sect 1
Sp
ecies
Tran
sect 2
Sp
ecies
Tran
sect 3
Sp
ecies
Tran
sect 4
Sp
ecies
Tran
sect 5
Sp
ecies
Grass
No
ID
Grass
/Fo
rb
No
ID
Wo
od
y
/Grass
D 5
Wo
od
y
ff 1
Grass
/Fo
rb
No
ID
Fo
rb
Grass
Q
Wo
od
y
D 5
So
il
Grass
No
ID
So
il
Fo
rb
Wo
od
y
D 6
Fo
rb
Wo
od
y
/Fo
rb
No
ID
Grass
N
So
il
Grass
No
ID
So
il/Grass
No
ID
Wo
od
y
/Fo
rb
No
ID
Fo
rb
Grass
/Fo
rb
No
ID
Grass
No
ID
Fo
rb
Wo
od
y
/Grass
No
ID
No
ID
So
il
Wo
od
y
D 2
Grass
/Fo
rb
N
Wo
od
y
E 1
Wo
od
y
/Grass
/Wo
od
y
No
ID
No
ID
No
ID
Fo
rb
Grass
No
ID
Wo
od
y
W
So
il
Fo
rb
/Wo
od
y
/Grass
No
ID
No
ID
So
il
Fo
rb
Wo
od
y
L 1
So
il
Fo
rb
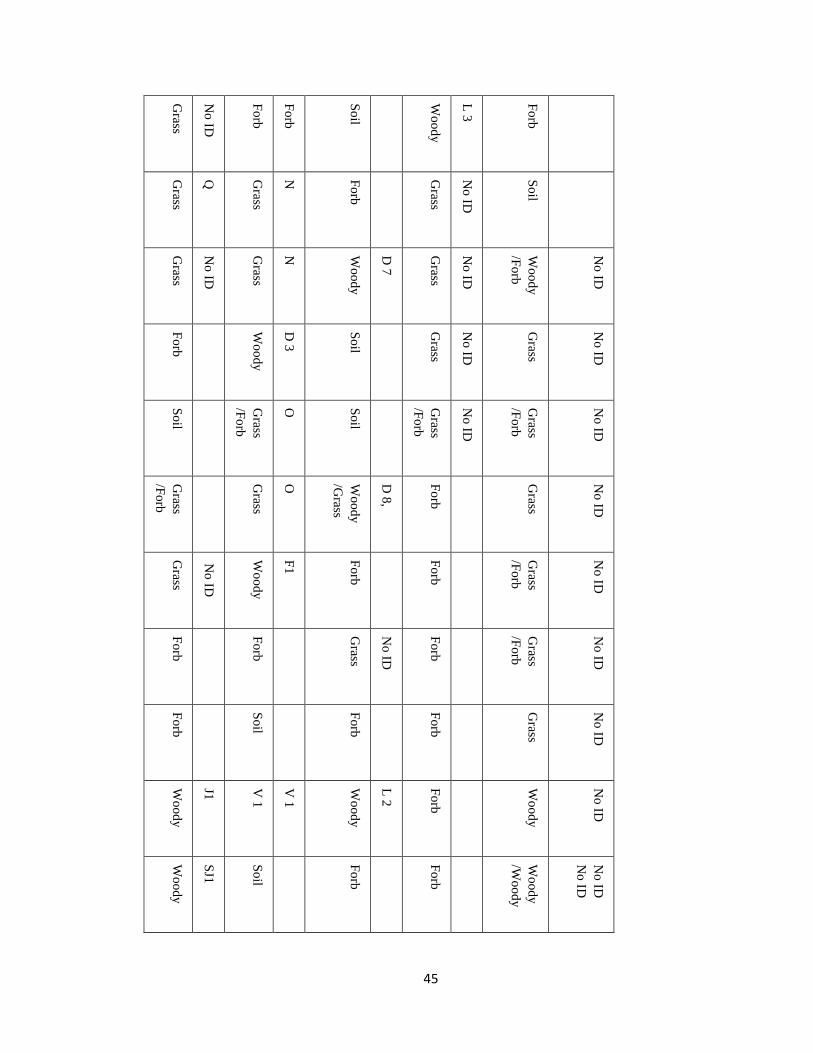
45
Grass
No
ID
Fo
rb
Fo
rb
So
il
Wo
od
y
L 3
Fo
rb
Grass
Q
Grass
N
Fo
rb
Grass
No
ID
So
il
Grass
No
ID
Grass
N
Wo
od
y
D 7
Grass
No
ID
Wo
od
y
/Fo
rb
No
ID
Fo
rb
Wo
od
y
D 3
So
il
Grass
No
ID
Grass
No
ID
So
il
Grass
/Fo
rb
O
So
il
Grass
/Fo
rb
No
ID
Grass
/Fo
rb
No
ID
Grass
/Fo
rb
Grass
O
Wo
od
y
/Grass
D 8
,
Fo
rb
Grass
No
ID
Grass
No
ID
Wo
od
y
F1
Fo
rb
Fo
rb
Grass
/Fo
rb
No
ID
Fo
rb
Fo
rb
Grass
No
ID
Fo
rb
Grass
/Fo
rb
No
ID
Fo
rb
So
il
Fo
rb
Fo
rb
Grass
No
ID
Wo
od
y
J1
V 1
V 1
Wo
od
y
L 2
Fo
rb
Wo
od
y
No
ID
Wo
od
y
SJ1
So
il
Fo
rb
Fo
rb
Wo
od
y
/Wo
od
y
No
ID
No
ID
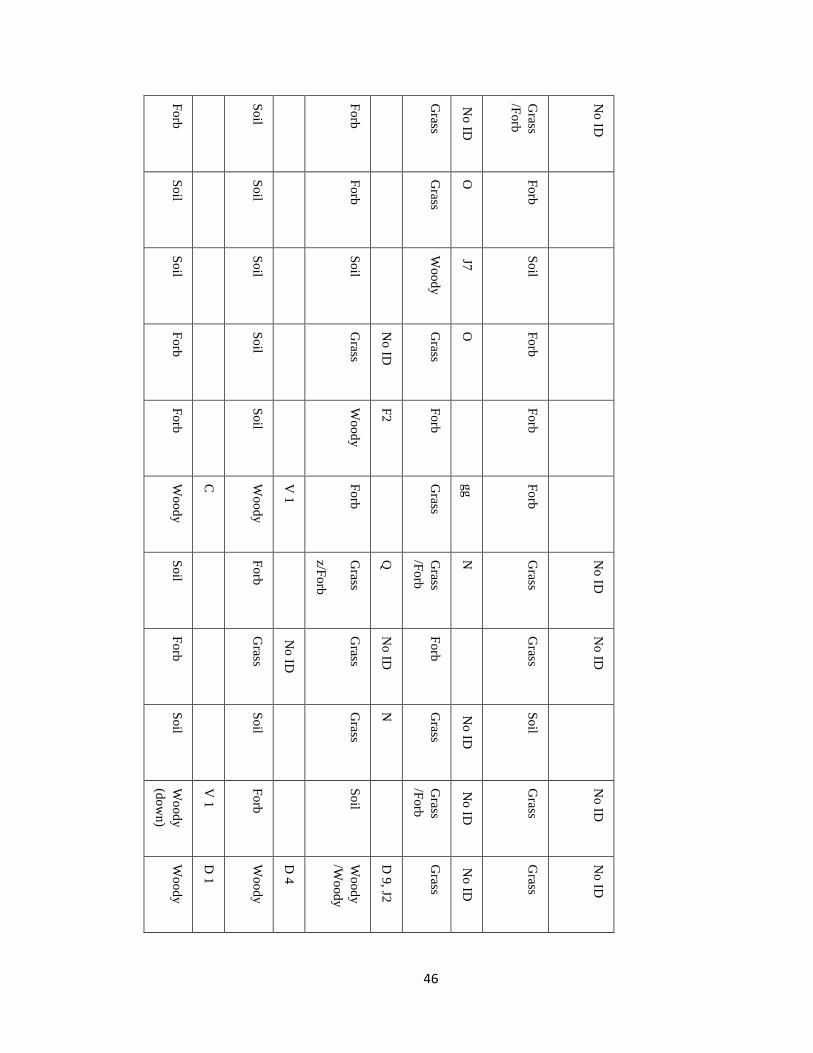
46
Fo
rb
So
il
Fo
rb
Grass
No
ID
Grass
/Fo
rb
No
ID
So
il
So
il
Fo
rb
Grass
O
Fo
rb
So
il
So
il
So
il
Wo
od
y
J7
So
il
Fo
rb
So
il
Grass
No
ID
Grass
O
Fo
rb
Fo
rb
So
il
Wo
od
y
F2
Fo
rb
Fo
rb
Wo
od
y
C
Wo
od
y
V 1
Fo
rb
Grass
gg
Fo
rb
So
il
Fo
rb
Grass
z/Fo
rb
Q
Grass
/Fo
rb
N
Grass
No
ID
Fo
rb
Grass
No
ID
Grass
No
ID
Fo
rb
Grass
No
ID
So
il
So
il
Grass
N
Grass
No
ID
So
il
Wo
od
y
(do
wn
)
V 1
Fo
rb
So
il
Grass
/Fo
rb
No
ID
Grass
No
ID
Wo
od
y
D 1
Wo
od
y
D 4
Wo
od
y
/Wo
od
y
D 9
, J2
Grass
No
ID
Grass
No
ID
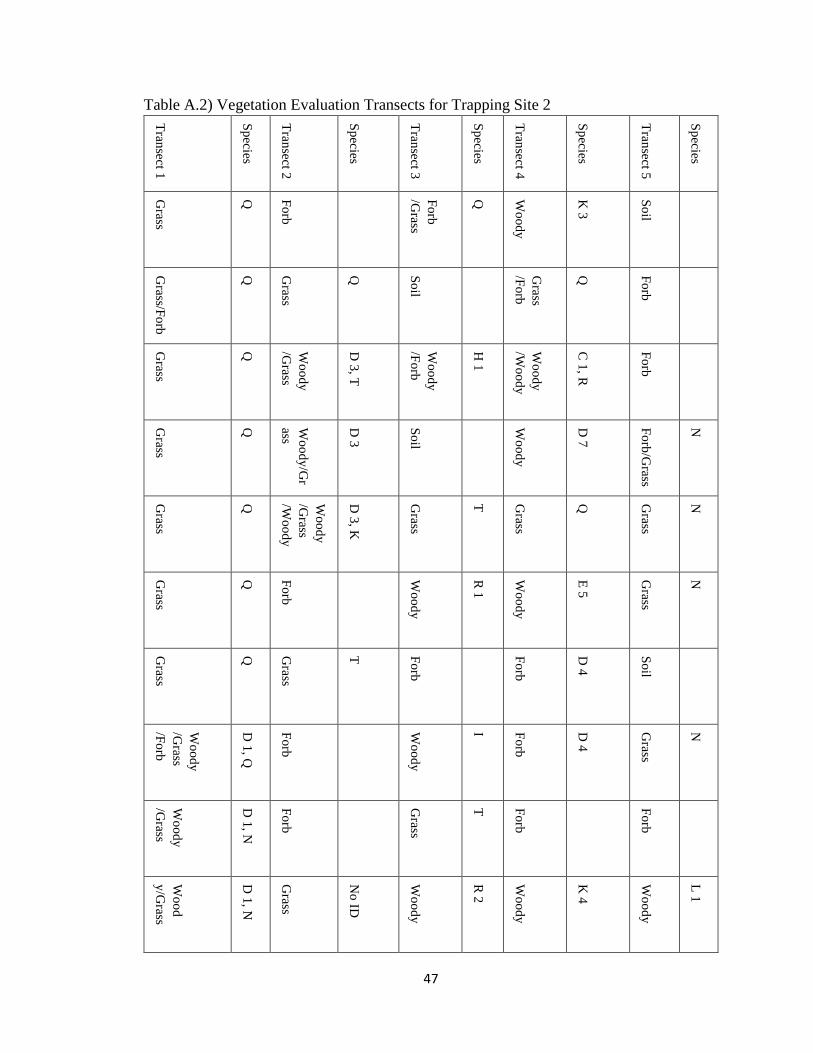
47
Table A.2) Vegetation Evaluation Transects for Trapping Site 2
Tran
sect 1
Sp
ecies
Tran
sect 2
Sp
ecies
Tran
sect 3
Sp
ecies
Tran
sect 4
Sp
ecies
Tran
sect 5
Sp
ecies
Grass
Q
Fo
rb
Fo
rb
/Grass
Q
Wo
od
y
K 3
So
il
Grass/F
orb
Q
Grass
Q
So
il
Grass
/Fo
rb
Q
Fo
rb
Grass
Q
Wo
od
y
/Grass
D 3
, T
Wo
od
y
/Fo
rb
H 1
Wo
od
y
/Wo
od
y
C 1
, R
Fo
rb
Grass
Q
Wo
od
y/G
r
ass
D 3
So
il
Wo
od
y
D 7
Fo
rb/G
rass
N
Grass
Q
Wo
od
y
/Grass
/Wo
od
y
D 3
, K
Grass
T
Grass
Q
Grass
N
Grass
Q
Fo
rb
Wo
od
y
R 1
Wo
od
y
E 5
Grass
N
Grass
Q
Grass
T
Fo
rb
Fo
rb
D 4
So
il
Wo
od
y
/Grass
/Fo
rb
D 1
, Q
Fo
rb
Wo
od
y
I Fo
rb
D 4
Grass
N
Wo
od
y
/Grass
D 1
, N
Fo
rb
Grass
T
Fo
rb
Fo
rb
Wo
od
y/G
rass
D 1
, N
Grass
No
ID
Wo
od
y
R 2
Wo
od
y
K 4
Wo
od
y
L 1
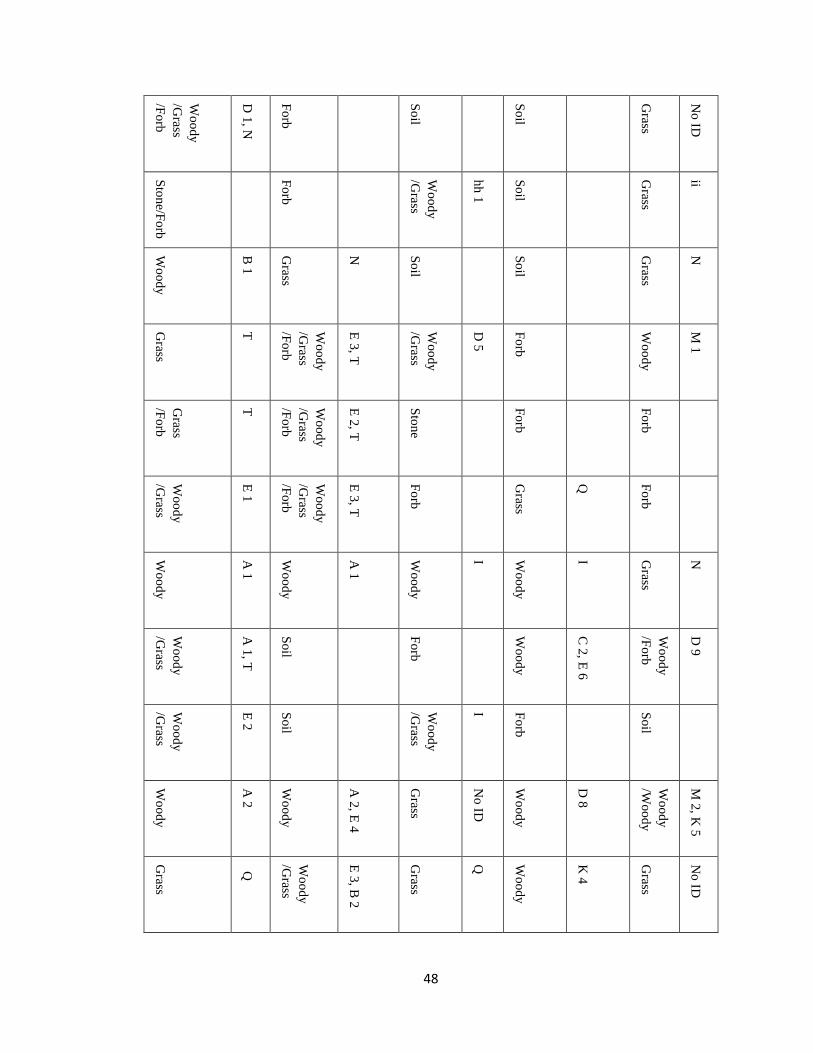
48
Wo
od
y
/Grass
/Fo
rb
D 1
, N
Fo
rb
So
il
So
il
Grass
No
ID
Sto
ne/F
orb
Fo
rb
Wo
od
y
/Grass
hh
1
So
il
Grass
ii
Wo
od
y
B 1
Grass
N
So
il
So
il
Grass
N
Grass
T
Wo
od
y
/Grass
/Fo
rb
E 3
, T
Wo
od
y
/Grass
D 5
Fo
rb
Wo
od
y
M 1
Grass
/Fo
rb
T
Wo
od
y
/Grass
/Fo
rb
E 2
, T
Sto
ne
Fo
rb
Fo
rb
Wo
od
y
/Grass
E 1
Wo
od
y
/Grass
/Fo
rb
E 3
, T
Fo
rb
Grass
Q
Fo
rb
Wo
od
y
A 1
Wo
od
y
A 1
Wo
od
y
I Wo
od
y
I Grass
N
Wo
od
y
/Grass
A 1
, T
So
il
Fo
rb
Wo
od
y
C 2
, E 6
Wo
od
y
/Fo
rb
D 9
Wo
od
y
/Grass
E 2
So
il
Wo
od
y
/Grass
I Fo
rb
So
il
Wo
od
y
A 2
Wo
od
y
A 2
, E 4
Grass
No
ID
Wo
od
y
D 8
Wo
od
y
/Wo
od
y
M 2
, K 5
Grass
Q
Wo
od
y
/Grass
E 3
, B 2
Grass
Q
Wo
od
y
K 4
Grass
No
ID
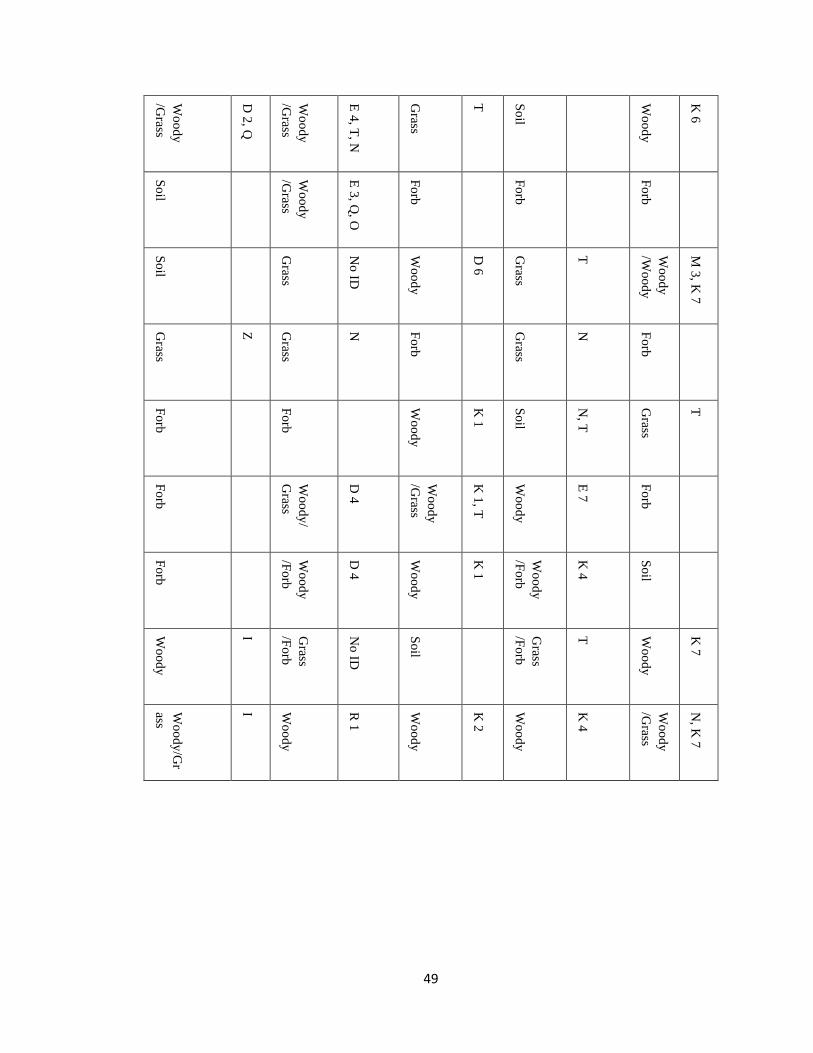
49
Wo
od
y
/Grass
D 2
, Q
Wo
od
y
/Grass
E 4
, T, N
Grass
T
So
il
Wo
od
y
K 6
So
il
Wo
od
y
/Grass
E 3
, Q, O
Fo
rb
Fo
rb
Fo
rb
So
il
Grass
No
ID
Wo
od
y
D 6
Grass
T
Wo
od
y
/Wo
od
y
M 3
, K 7
Grass
Z
Grass
N
Fo
rb
Grass
N
Fo
rb
Fo
rb
Fo
rb
Wo
od
y
K 1
So
il
N, T
Grass
T
Fo
rb
Wo
od
y/
Grass
D 4
Wo
od
y
/Grass
K 1
, T
Wo
od
y
E 7
Fo
rb
Fo
rb
Wo
od
y
/Fo
rb
D 4
Wo
od
y
K 1
Wo
od
y
/Fo
rb
K 4
So
il
Wo
od
y
I Grass
/Fo
rb
No
ID
So
il
Grass
/Fo
rb
T
Wo
od
y
K 7
Wo
od
y/G
r
ass
I Wo
od
y
R 1
Wo
od
y
K 2
Wo
od
y
K 4
Wo
od
y
/Grass
N, K
7
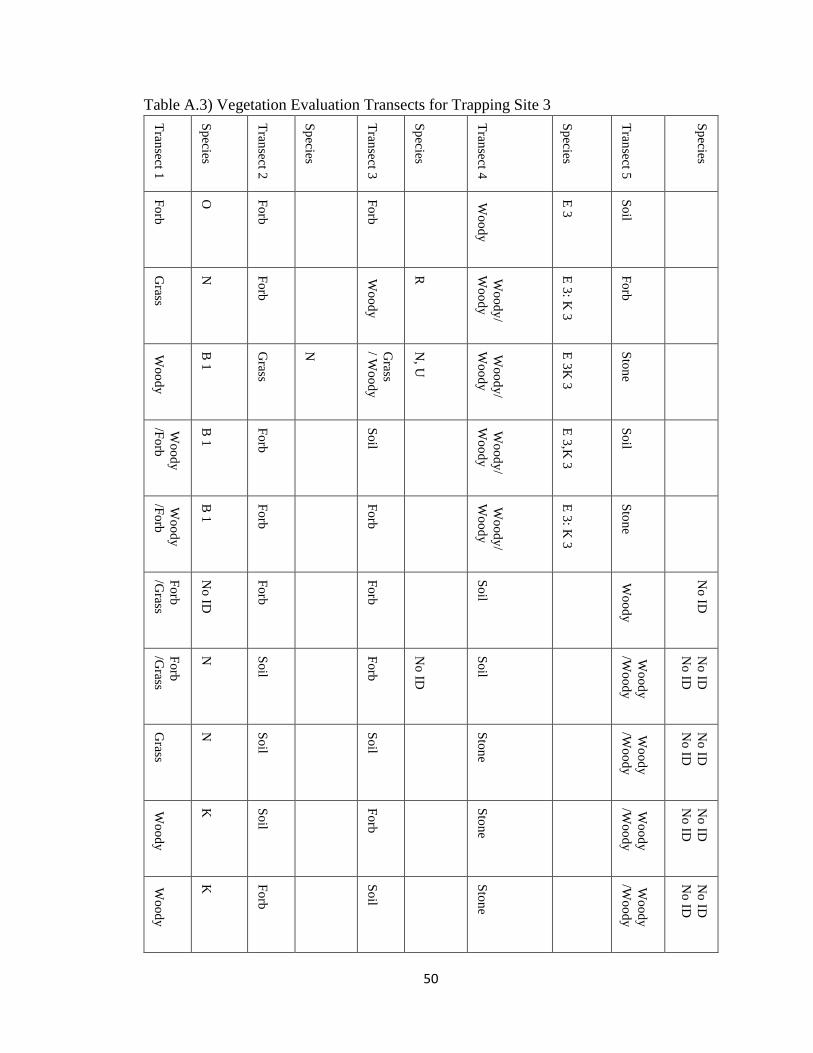
50
Table A.3) Vegetation Evaluation Transects for Trapping Site 3
Tran
sect 1
Sp
ecies
Tran
sect 2
Sp
ecies
Tran
sect 3
Sp
ecies
Tran
sect 4
Sp
ecies
Tran
sect 5
Sp
ecies
Fo
rb
O
Fo
rb
Fo
rb
Wo
od
y
E 3
So
il
Grass
N
Fo
rb
Wo
od
y
R
Wo
od
y/
Wo
od
y
E 3
: K 3
Fo
rb
Wo
od
y
B 1
Grass
N
Grass
/ Wo
od
y
N, U
Wo
od
y/
Wo
od
y
E 3
K 3
Sto
ne
Wo
od
y
/Fo
rb
B 1
Fo
rb
So
il
Wo
od
y/
Wo
od
y
E 3
,K 3
So
il
Wo
od
y
/Fo
rb
B 1
Fo
rb
Fo
rb
Wo
od
y/
Wo
od
y
E 3
: K 3
Sto
ne
Fo
rb
/Grass
No
ID
Fo
rb
Fo
rb
So
il
Wo
od
y
No
ID
Fo
rb
/Grass
N
So
il
Fo
rb
No
ID
So
il
Wo
od
y
/Wo
od
y
No
ID
No
ID
Grass
N
So
il
So
il
Sto
ne
Wo
od
y
/Wo
od
y
No
ID
No
ID
Wo
od
y
K
So
il
Fo
rb
Sto
ne
Wo
od
y
/Wo
od
y
No
ID
No
ID
Wo
od
y
K
Fo
rb
So
il
Sto
ne
Wo
od
y
/Wo
od
y
No
ID
No
ID
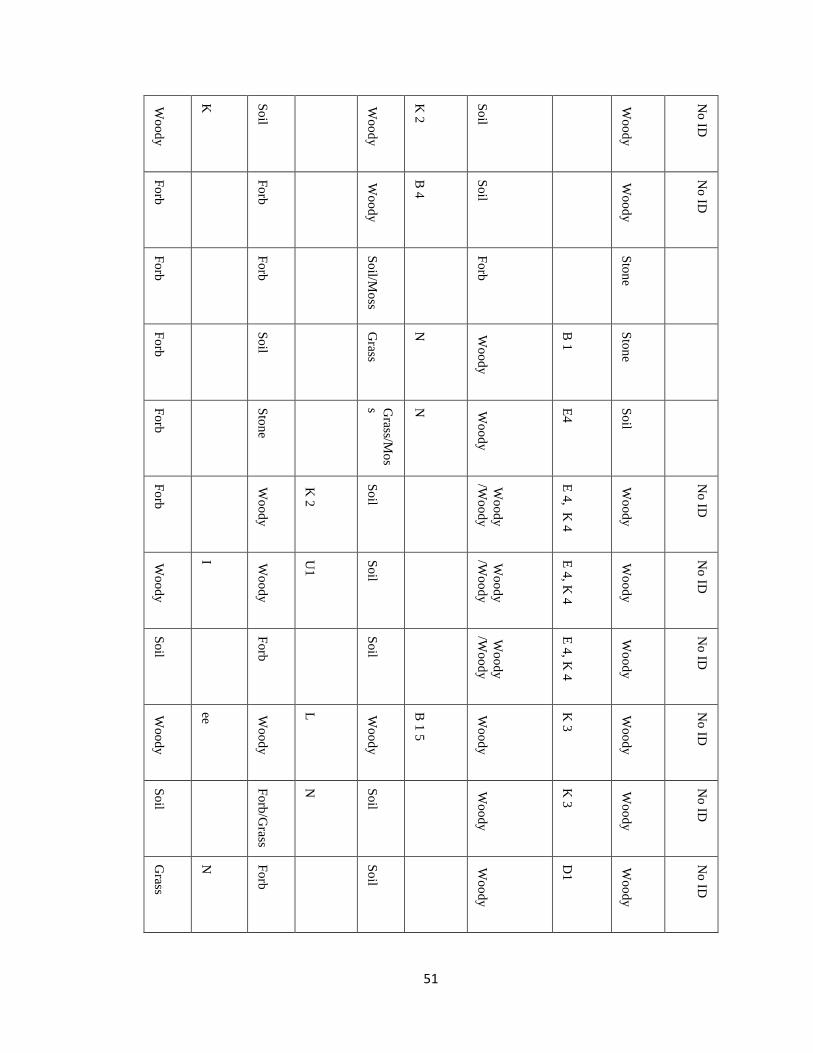
51
Wo
od
y
K
So
il
Wo
od
y
K 2
So
il
Wo
od
y
No
ID
Fo
rb
Fo
rb
Wo
od
y
B 4
So
il
Wo
od
y
No
ID
Fo
rb
Fo
rb
So
il/Mo
ss
Fo
rb
Sto
ne
Fo
rb
So
il
Grass
N
Wo
od
y
B 1
Sto
ne
Fo
rb
Sto
ne
Grass/M
os
s N
Wo
od
y
E4
So
il
Fo
rb
Wo
od
y
K 2
So
il
Wo
od
y
/Wo
od
y
E 4
, K 4
Wo
od
y
No
ID
Wo
od
y
I Wo
od
y
U1
So
il
Wo
od
y
/Wo
od
y
E 4
, K 4
Wo
od
y
No
ID
So
il
Fo
rb
So
il
Wo
od
y
/Wo
od
y
E 4
, K 4
Wo
od
y
No
ID
Wo
od
y
ee
Wo
od
y
L
Wo
od
y
B 1
5
Wo
od
y
K 3
Wo
od
y
No
ID
So
il
Fo
rb/G
rass
N
So
il
Wo
od
y
K 3
Wo
od
y
No
ID
Grass
N
Fo
rb
So
il
Wo
od
y
D1
Wo
od
y
No
ID
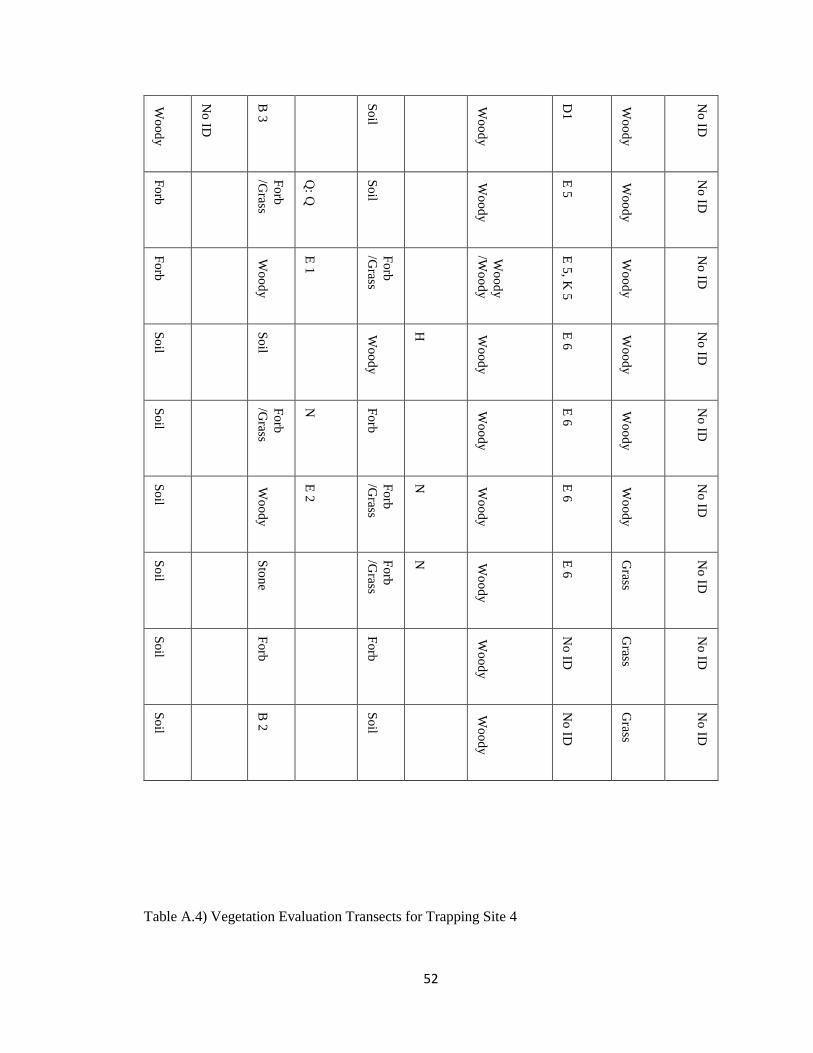
52
Wo
od
y
No
ID
B 3
So
il
Wo
od
y
D1
Wo
od
y
No
ID
Fo
rb
Fo
rb
/Grass
Q: Q
So
il
Wo
od
y
E 5
Wo
od
y
No
ID
Fo
rb
Wo
od
y
E 1
Fo
rb
/Grass
Wo
od
y
/Wo
od
y
E 5
, K 5
Wo
od
y
No
ID
So
il
So
il
Wo
od
y
H
Wo
od
y
E 6
Wo
od
y
No
ID
So
il
Fo
rb
/Grass
N
Fo
rb
Wo
od
y
E 6
Wo
od
y
No
ID
So
il
Wo
od
y
E 2
Fo
rb
/Grass
N
Wo
od
y
E 6
Wo
od
y
No
ID
So
il
Sto
ne
Fo
rb
/Grass
N
Wo
od
y
E 6
Grass
No
ID
So
il
Fo
rb
Fo
rb
Wo
od
y
No
ID
Grass
No
ID
So
il
B 2
So
il
Wo
od
y
No
ID
Grass
No
ID
Table A.4) Vegetation Evaluation Transects for Trapping Site 4

53
Tran
sect 1
Sp
ecies
Tran
sect 2
Sp
ecies
Tran
sect 3
Sp
ecies
Tran
sect 4
Sp
ecies
Tran
sect 5
Sp
ecies
So
il
Fo
rb
So
il
So
il
Wo
od
y
No
ID
Fo
rb
So
il
Grass
No
ID
Grass
No
ID
Wo
od
y
No
ID
Grass
N
Fo
rb
Grass
No
ID
Wo
od
y
A 1
Fo
rb
Fo
rb
Grass/F
orb
N
Grass
No
ID
Wo
od
y
A 1
Fo
rb
Fo
rb
Grass
/Fo
rb
N
Wo
od
y
(do
wn
)
/Fo
rb
No
ID
A 1
Wo
od
y
Fo
rb
Fo
rb
Fo
rb
Fo
rb
Wo
od
y
A 1
Wo
od
y
No
ID
So
il
So
il
Fo
rb
Wo
od
y
A 1
Grass
/Fo
rb
No
ID
Grass/F
orb
N
Fo
rb
/Grass
No
ID
So
il
Fo
rb
Grass
/Fo
rb
No
ID
Fo
rb
Wo
od
y
E 2
So
il
Wo
od
y
E 3
Grass
/Fo
rb
No
ID
Wo
od
y
D1
Wo
od
y
V 1
Fo
rb
Wo
od
y
E 3
Grass
/Fo
rb
No
ID
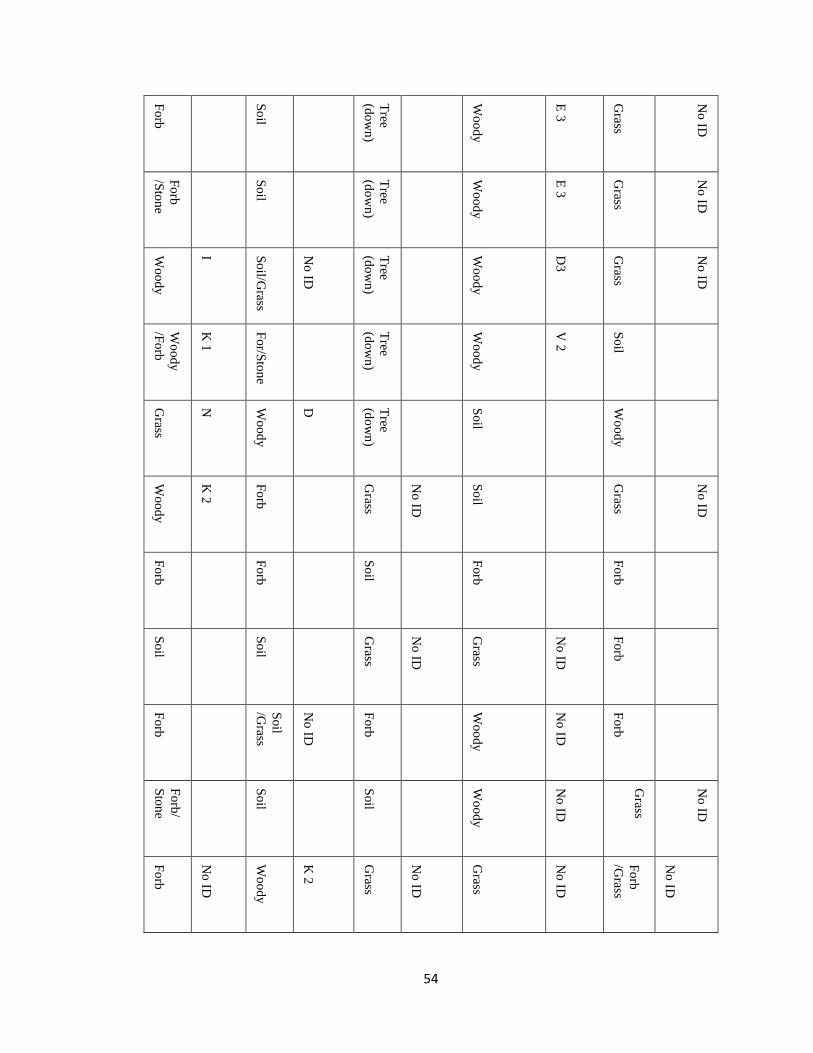
54
Fo
rb
So
il
Tree
(do
wn
)
Wo
od
y
E 3
Grass
No
ID
Fo
rb
/Sto
ne
So
il
Tree
(do
wn
)
Wo
od
y
E 3
Grass
No
ID
Wo
od
y
I So
il/Grass
No
ID
Tree
(do
wn
)
Wo
od
y
D3
Grass
No
ID
Wo
od
y
/Fo
rb
K 1
Fo
r/Sto
ne
Tree
(do
wn
)
Wo
od
y
V 2
So
il
Grass
N
Wo
od
y
D
Tree
(do
wn
)
So
il
Wo
od
y
Wo
od
y
K 2
Fo
rb
Grass
No
ID
So
il
Grass
No
ID
Fo
rb
Fo
rb
So
il
Fo
rb
Fo
rb
So
il
So
il
Grass
No
ID
Grass
No
ID
Fo
rb
Fo
rb
So
il
/Grass
No
ID
Fo
rb
Wo
od
y
No
ID
Fo
rb
Fo
rb/
Sto
ne
So
il
So
il
Wo
od
y
No
ID
Grass
No
ID
Fo
rb
No
ID
Wo
od
y
K 2
Grass
No
ID
Grass
No
ID
Fo
rb
/Grass
No
ID
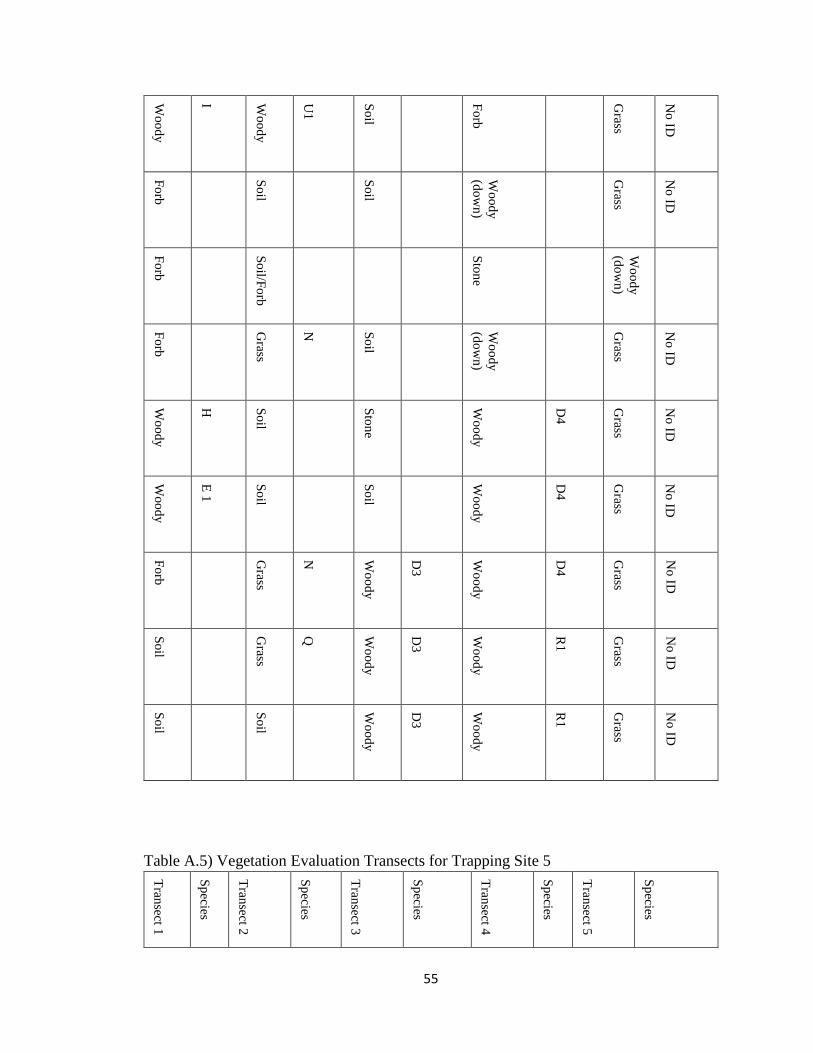
55
Wo
od
y
I Wo
od
y
U1
So
il
Fo
rb
Grass
No
ID
Fo
rb
So
il
So
il
Wo
od
y
(do
wn
)
Grass
No
ID
Fo
rb
So
il/Fo
rb
Sto
ne
Wo
od
y
(do
wn
)
Fo
rb
Grass
N
So
il
Wo
od
y
(do
wn
)
Grass
No
ID
Wo
od
y
H
So
il
Sto
ne
Wo
od
y
D4
Grass
No
ID
Wo
od
y
E 1
So
il
So
il
Wo
od
y
D4
Grass
No
ID
Fo
rb
Grass
N
Wo
od
y
D3
Wo
od
y
D4
Grass
No
ID
So
il
Grass
Q
Wo
od
y
D3
Wo
od
y
R1
Grass
No
ID
So
il
So
il
Wo
od
y
D3
Wo
od
y
R1
Grass
No
ID
Table A.5) Vegetation Evaluation Transects for Trapping Site 5
Tran
sect 1
Sp
ecies
Tran
sect 2
Sp
ecies
Tran
sect 3
Sp
ecies
Tran
sect 4
Sp
ecies
Tran
sect 5
Sp
ecies
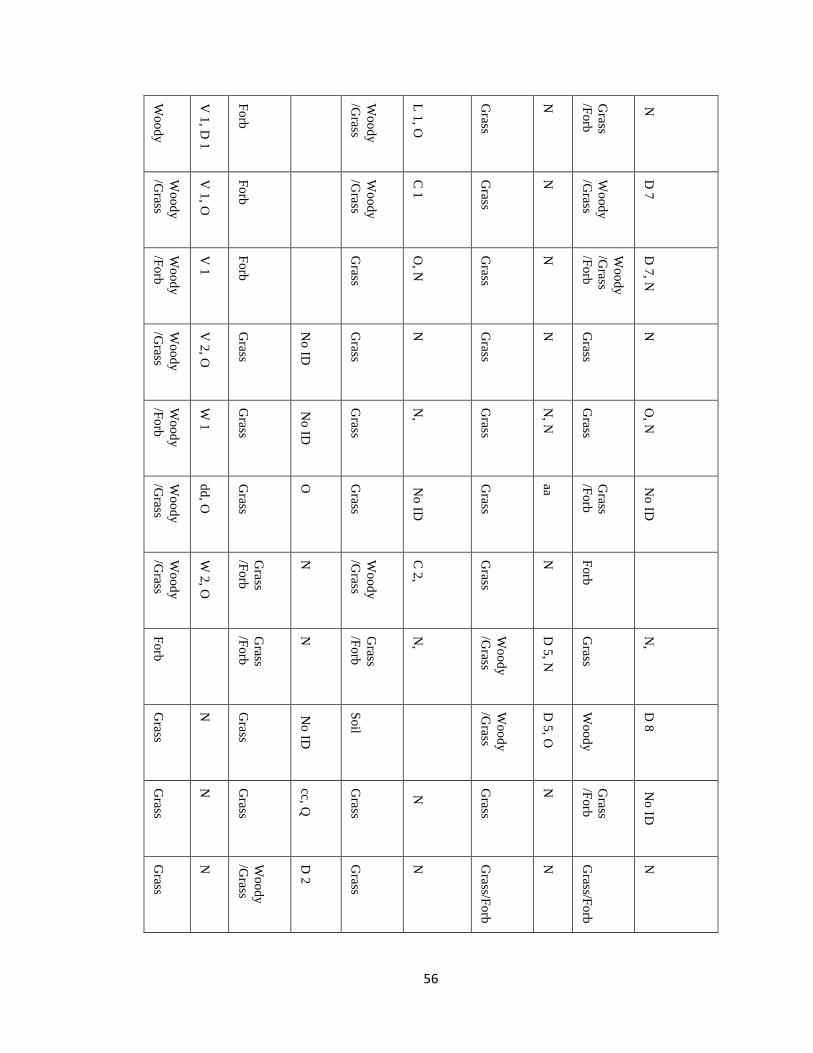
56
Wo
od
y
V 1
, D 1
Fo
rb
Wo
od
y
/Grass
L 1
, O
Grass
N
Grass
/Fo
rb
N
Wo
od
y
/Grass
V 1
, O
Fo
rb
Wo
od
y
/Grass
C 1
Grass
N
Wo
od
y
/Grass
D 7
Wo
od
y
/Fo
rb
V 1
Fo
rb
Grass
O, N
Grass
N
Wo
od
y
/Grass
/Fo
rb
D 7
, N
Wo
od
y
/Grass
V 2
, O
Grass
No
ID
Grass
N
Grass
N
Grass
N
Wo
od
y
/Fo
rb
W 1
Grass
No
ID
Grass
N,
Grass
N, N
Grass
O, N
Wo
od
y
/Grass
dd
, O
Grass
O
Grass
No
ID
Grass
aa
Grass
/Fo
rb
No
ID
Wo
od
y
/Grass
W 2
, O
Grass
/Fo
rb
N
Wo
od
y
/Grass
C 2
,
Grass
N
Fo
rb
Fo
rb
Grass
/Fo
rb
N
Grass
/Fo
rb
N,
Wo
od
y
/Grass
D 5
, N
Grass
N,
Grass
N
Grass
No
ID
So
il
Wo
od
y
/Grass
D 5
, O
Wo
od
y
D 8
Grass
N
Grass
cc, Q
Grass
N
Grass
N
Grass
/Fo
rb
No
ID
Grass
N
Wo
od
y
/Grass
D 2
Grass
N
Grass/F
orb
N
Grass/F
orb
N
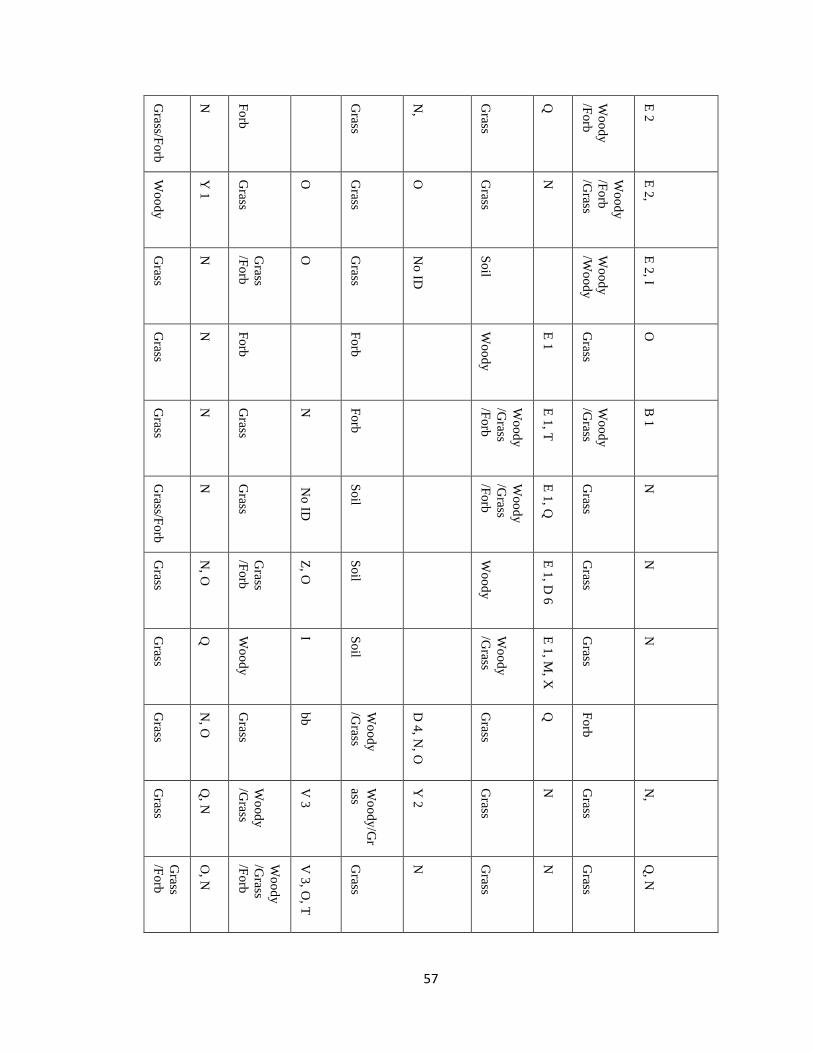
57
Grass/F
orb
N
Fo
rb
Grass
N,
Grass
Q
Wo
od
y
/Fo
rb
E 2
Wo
od
y
Y 1
Grass
O
Grass
O
Grass
N
Wo
od
y
/Fo
rb
/Grass
E 2
,
Grass
N
Grass
/Fo
rb
O
Grass
No
ID
So
il
Wo
od
y
/Wo
od
y
E 2
, I
Grass
N
Fo
rb
Fo
rb
Wo
od
y
E 1
Grass
O
Grass
N
Grass
N
Fo
rb
Wo
od
y
/Grass
/Fo
rb
E 1
, T
Wo
od
y
/Grass
B 1
Grass/F
orb
N
Grass
No
ID
So
il
Wo
od
y
/Grass
/Fo
rb
E 1
, Q
Grass
N
Grass
N, O
Grass
/Fo
rb
Z, O
So
il
Wo
od
y
E 1
, D 6
Grass
N
Grass
Q
Wo
od
y
I So
il
Wo
od
y
/Grass
E 1
, M, X
Grass
N
Grass
N, O
Grass
bb
Wo
od
y
/Grass
D 4
, N, O
Grass
Q
Fo
rb
Grass
Q, N
Wo
od
y
/Grass
V 3
Wo
od
y/G
r
ass
Y 2
Grass
N
Grass
N,
Grass
/Fo
rb
O, N
Wo
od
y
/Grass
/Fo
rb
V 3
, O, T
Grass
N
Grass
N
Grass
Q, N
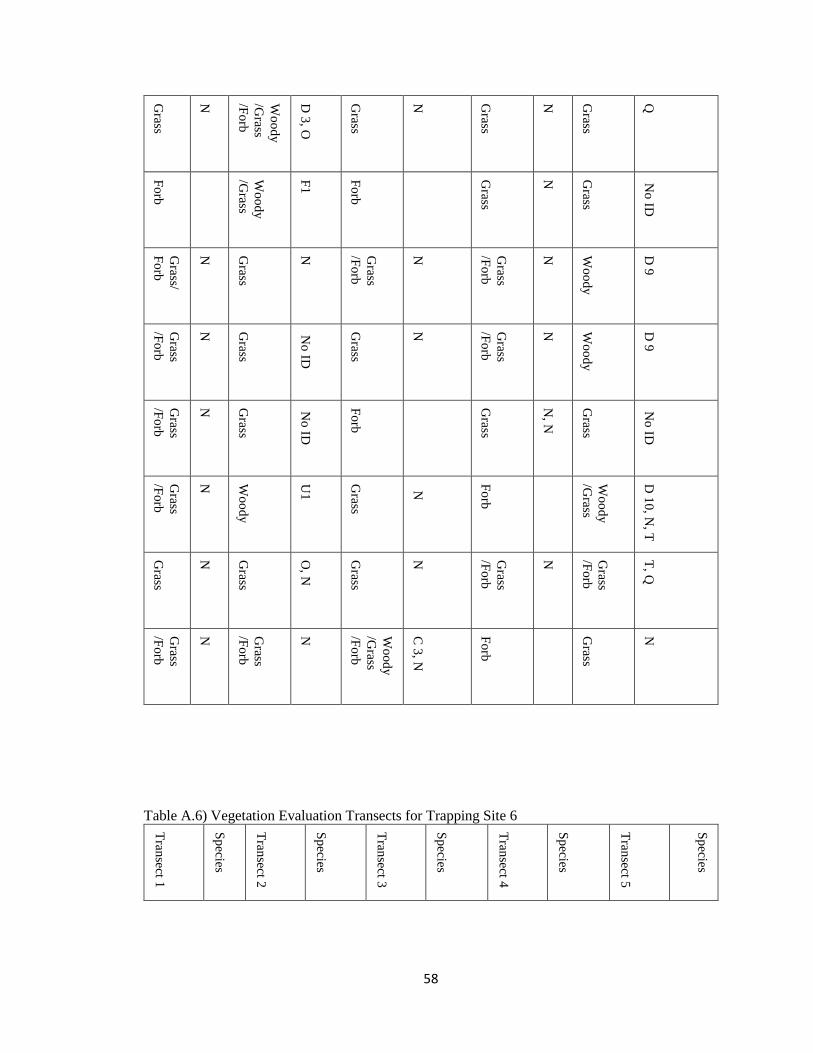
58
Grass
N
Wo
od
y
/Grass
/Fo
rb
D 3
, O
Grass
N
Grass
N
Grass
Q
Fo
rb
Wo
od
y
/Grass
F1
Fo
rb
Grass
N
Grass
No
ID
Grass/
Fo
rb
N
Grass
N
Grass
/Fo
rb
N
Grass
/Fo
rb
N
Wo
od
y
D 9
Grass
/Fo
rb
N
Grass
No
ID
Grass
N
Grass
/Fo
rb
N
Wo
od
y
D 9
Grass
/Fo
rb
N
Grass
No
ID
Fo
rb
Grass
N, N
Grass
No
ID
Grass
/Fo
rb
N
Wo
od
y
U1
Grass
N
Fo
rb
Wo
od
y
/Grass
D 1
0, N
, T
Grass
N
Grass
O, N
Grass
N
Grass
/Fo
rb
N
Grass
/Fo
rb
T, Q
Grass
/Fo
rb
N
Grass
/Fo
rb
N
Wo
od
y
/Grass
/Fo
rb
C 3
, N
Fo
rb
Grass
N
Table A.6) Vegetation Evaluation Transects for Trapping Site 6
Tran
sect 1
Sp
ecies
Tran
sect 2
Sp
ecies
Tran
sect 3
Sp
ecies
Tran
sect 4
Sp
ecies
Tran
sect 5
Sp
ecies
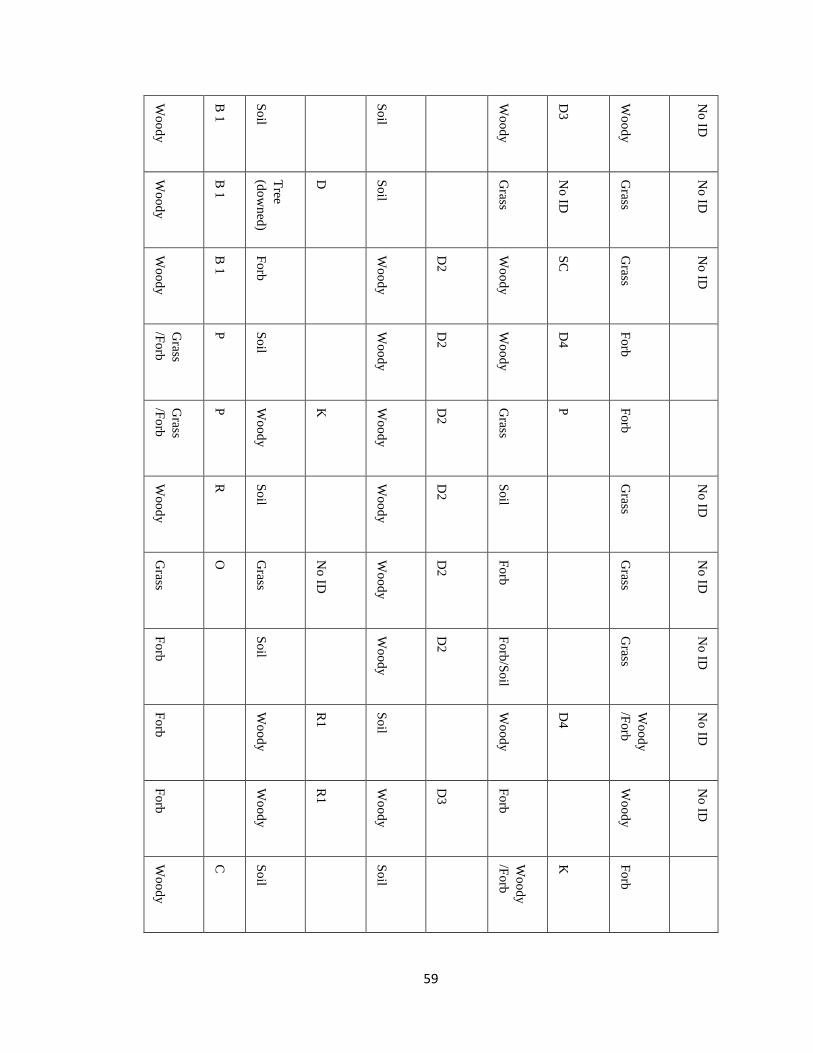
59
Wo
od
y
B 1
So
il
So
il
Wo
od
y
D3
Wo
od
y
No
ID
Wo
od
y
B 1
Tree
(do
wn
ed)
D
So
il
Grass
No
ID
Grass
No
ID
Wo
od
y
B 1
Fo
rb
Wo
od
y
D2
Wo
od
y
SC
Grass
No
ID
Grass
/Fo
rb
P
So
il
Wo
od
y
D2
Wo
od
y
D4
Fo
rb
Grass
/Fo
rb
P
Wo
od
y
K
Wo
od
y
D2
Grass
P
Fo
rb
Wo
od
y
R
So
il
Wo
od
y
D2
So
il
Grass
No
ID
Grass
O
Grass
No
ID
Wo
od
y
D2
Fo
rb
Grass
No
ID
Fo
rb
So
il
Wo
od
y
D2
Fo
rb/S
oil
Grass
No
ID
Fo
rb
Wo
od
y
R1
So
il
Wo
od
y
D4
Wo
od
y
/Fo
rb
No
ID
Fo
rb
Wo
od
y
R1
Wo
od
y
D3
Fo
rb
Wo
od
y
No
ID
Wo
od
y
C
So
il
So
il
Wo
od
y
/Fo
rb
K
Fo
rb
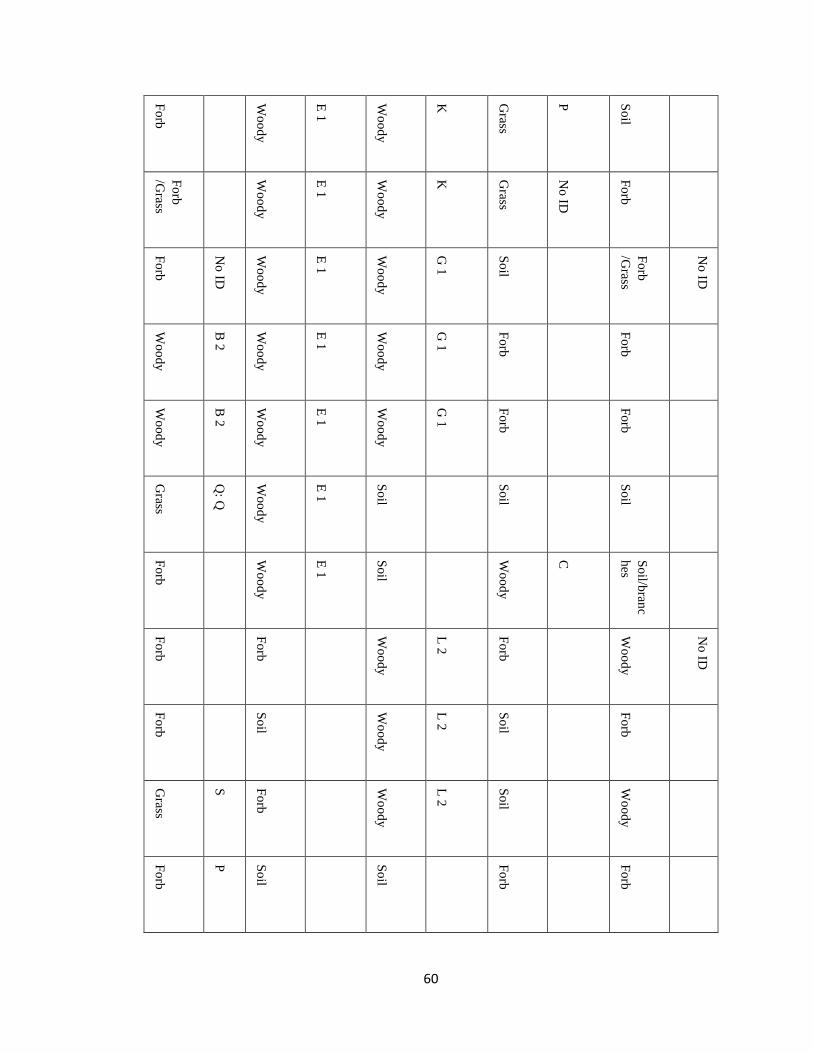
60
Fo
rb
Wo
od
y
E 1
Wo
od
y
K
Grass
P
So
il
Fo
rb
/Grass
Wo
od
y
E 1
Wo
od
y
K
Grass
No
ID
Fo
rb
Fo
rb
No
ID
Wo
od
y
E 1
Wo
od
y
G 1
So
il
Fo
rb
/Grass
No
ID
Wo
od
y
B 2
Wo
od
y
E 1
Wo
od
y
G 1
Fo
rb
Fo
rb
Wo
od
y
B 2
Wo
od
y
E 1
Wo
od
y
G 1
Fo
rb
Fo
rb
Grass
Q: Q
Wo
od
y
E 1
So
il
So
il
So
il
Fo
rb
Wo
od
y
E 1
So
il
Wo
od
y
C
So
il/bran
c
hes
Fo
rb
Fo
rb
Wo
od
y
L 2
Fo
rb
Wo
od
y
No
ID
Fo
rb
So
il
Wo
od
y
L 2
So
il
Fo
rb
Grass
S
Fo
rb
Wo
od
y
L 2
So
il
Wo
od
y
Fo
rb
P
So
il
So
il
Fo
rb
Fo
rb
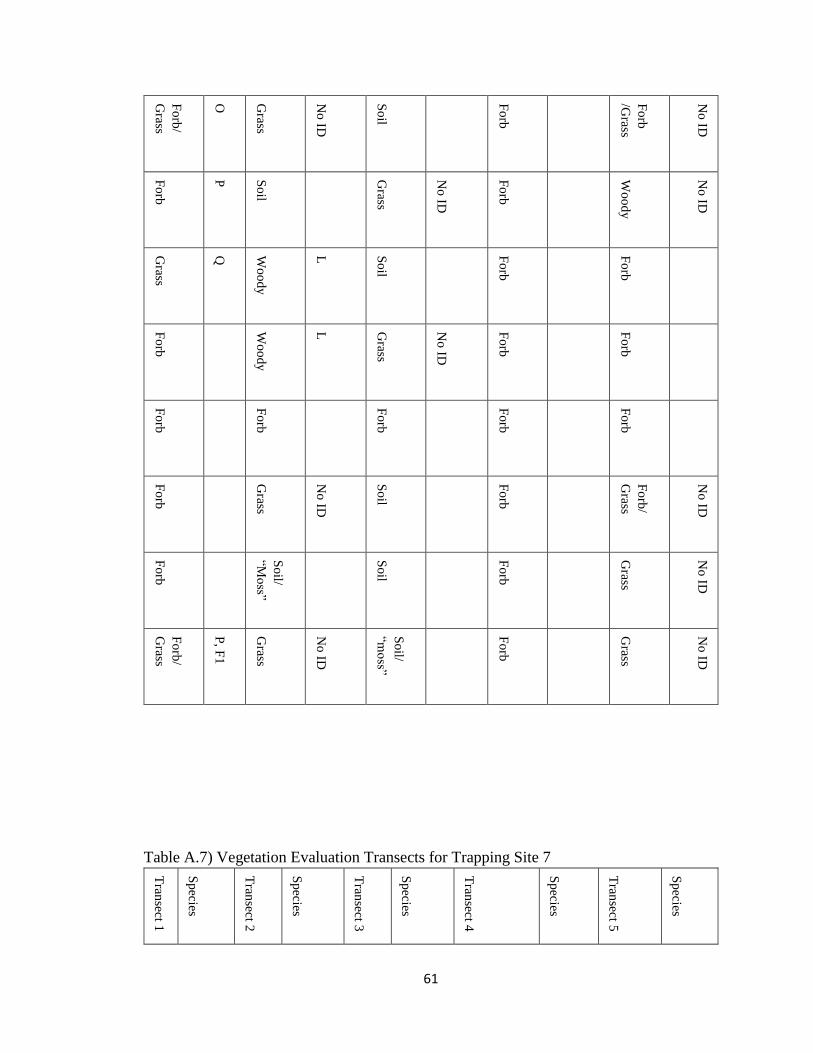
61
Fo
rb/
Grass
O
Grass
No
ID
So
il
Fo
rb
Fo
rb
/Grass
No
ID
Fo
rb
P
So
il
Grass
No
ID
Fo
rb
Wo
od
y
No
ID
Grass
Q
Wo
od
y
L
So
il
Fo
rb
Fo
rb
Fo
rb
Wo
od
y
L
Grass
No
ID
Fo
rb
Fo
rb
Fo
rb
Fo
rb
Fo
rb
Fo
rb
Fo
rb
Fo
rb
Grass
No
ID
So
il
Fo
rb
Fo
rb/
Grass
No
ID
Fo
rb
So
il/
“Mo
ss”
So
il
Fo
rb
Grass
No
ID
Fo
rb/
Grass
P, F
1
Grass
No
ID
So
il/
“mo
ss”
Fo
rb
Grass
No
ID
Table A.7) Vegetation Evaluation Transects for Trapping Site 7
Tran
sect 1
Sp
ecies
Tran
sect 2
Sp
ecies
Tran
sect 3
Sp
ecies
Tran
sect 4
Sp
ecies
Tran
sect 5
Sp
ecies
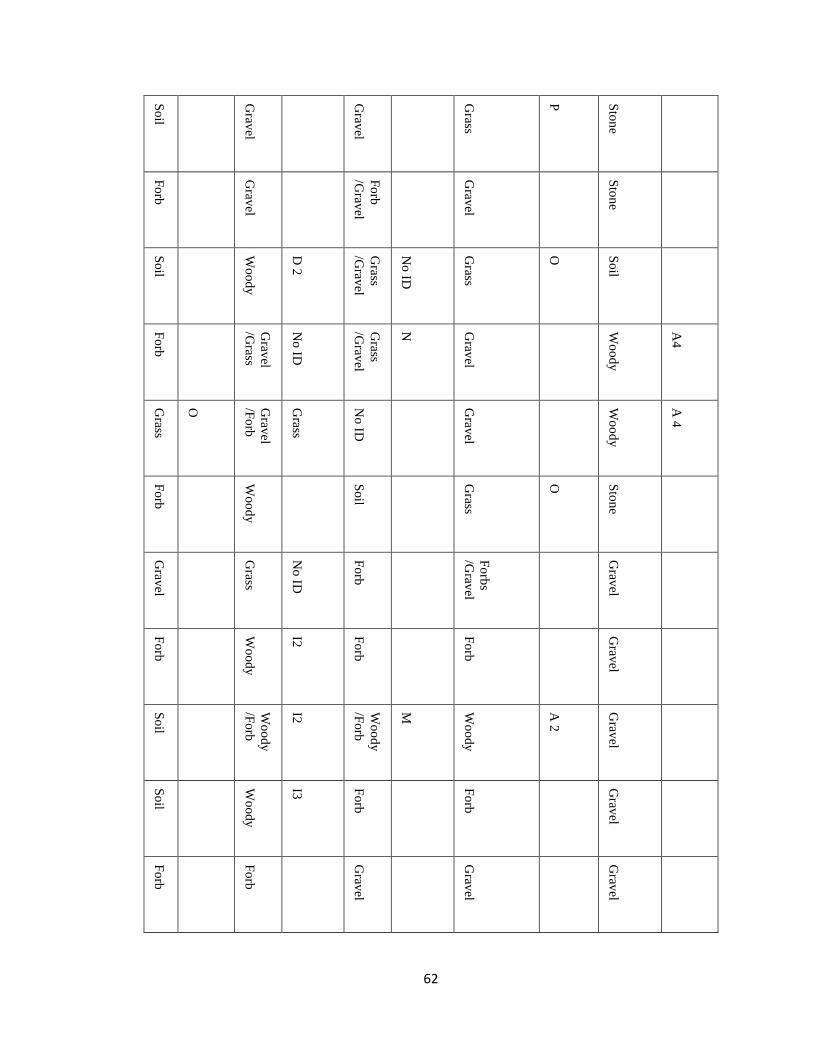
62
So
il
Grav
el
Grav
el
Grass
P
Sto
ne
Fo
rb
Grav
el
Fo
rb
/Grav
el
Grav
el
Sto
ne
So
il
Wo
od
y
D 2
Grass
/Grav
el
No
ID
Grass
O
So
il
Fo
rb
Grav
el
/Grass
No
ID
Grass
/Grav
el
N
Grav
el
Wo
od
y
A4
Grass
O
Grav
el
/Fo
rb
Grass
No
ID
Grav
el
Wo
od
y
A 4
Fo
rb
Wo
od
y
So
il
Grass
O
Sto
ne
Grav
el
Grass
No
ID
Fo
rb
Fo
rbs
/Grav
el
Grav
el
Fo
rb
Wo
od
y
I2
Fo
rb
Fo
rb
Grav
el
So
il
Wo
od
y
/Fo
rb
I2
Wo
od
y
/Fo
rb
M
Wo
od
y
A 2
Grav
el
So
il
Wo
od
y
I3
Fo
rb
Fo
rb
Grav
el
Fo
rb
Fo
rb
Grav
el
Grav
el
Grav
el
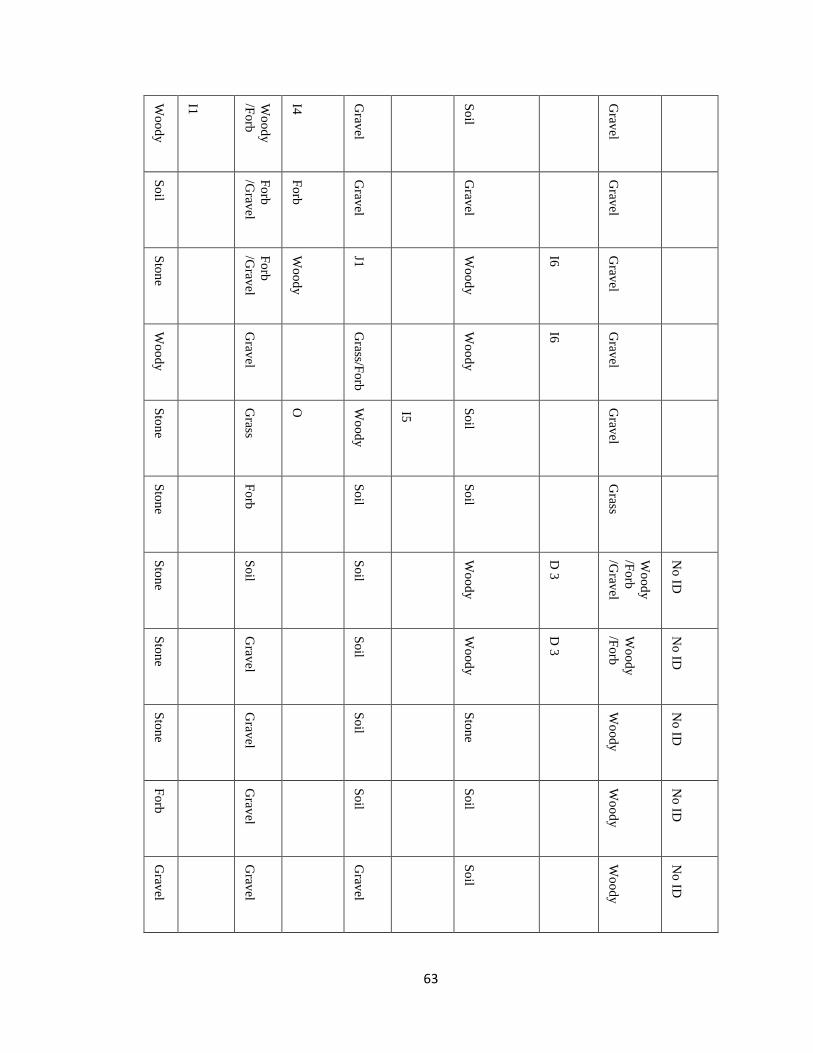
63
Wo
od
y
I1
Wo
od
y
/Fo
rb
I4
Grav
el
So
il
Grav
el
So
il
Fo
rb
/Grav
el
Fo
rb
Grav
el
Grav
el
Grav
el
Sto
ne
Fo
rb
/Grav
el
Wo
od
y
J1
Wo
od
y
I6
Grav
el
Wo
od
y
Grav
el
Grass/F
orb
Wo
od
y
I6
Grav
el
Sto
ne
Grass
O
Wo
od
y
I5
So
il
Grav
el
Sto
ne
Fo
rb
So
il
So
il
Grass
Sto
ne
So
il
So
il
Wo
od
y
D 3
Wo
od
y
/Fo
rb
/Grav
el
No
ID
Sto
ne
Grav
el
So
il
Wo
od
y
D 3
Wo
od
y
/Fo
rb
No
ID
Sto
ne
Grav
el
So
il
Sto
ne
Wo
od
y
No
ID
Fo
rb
Grav
el
So
il
So
il
Wo
od
y
No
ID
Grav
el
Grav
el
Grav
el
So
il
Wo
od
y
No
ID
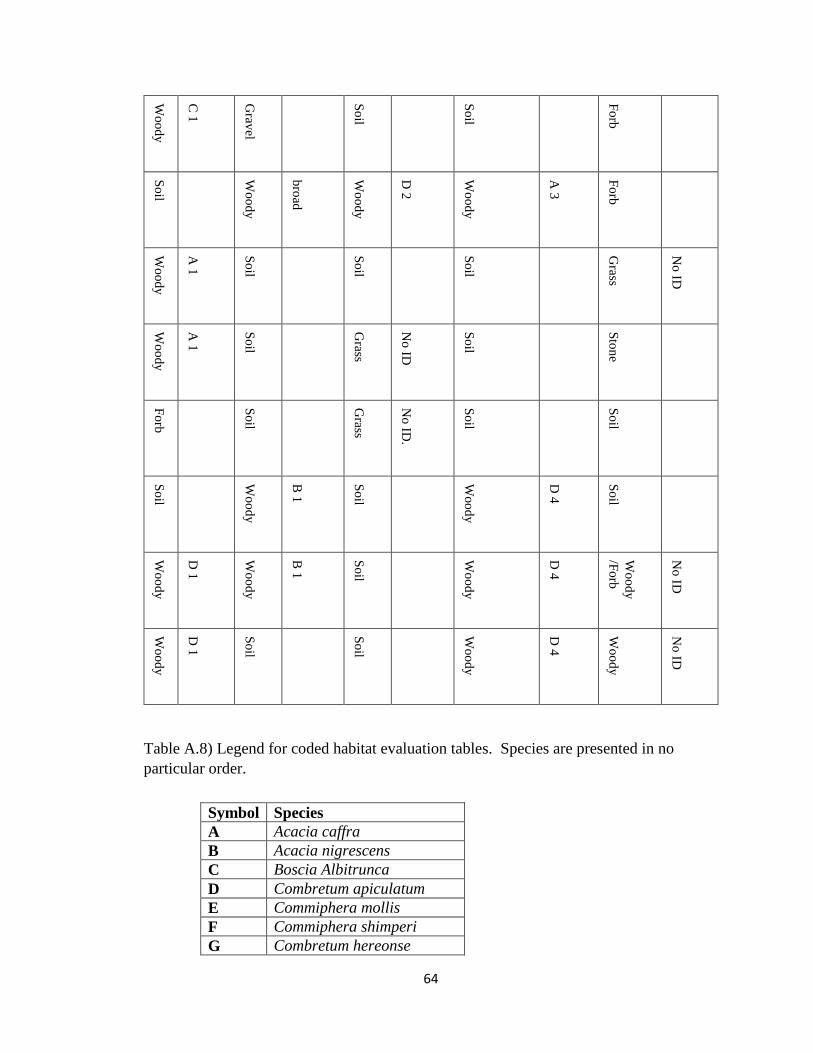
64
Wo
od
y
C 1
Grav
el
So
il
So
il
Fo
rb
So
il
Wo
od
y
bro
ad
Wo
od
y
D 2
Wo
od
y
A 3
Fo
rb
Wo
od
y
A 1
So
il
So
il
So
il
Grass
No
ID
Wo
od
y
A 1
So
il
Grass
No
ID
So
il
Sto
ne
Fo
rb
So
il
Grass
No
ID.
So
il
So
il
So
il
Wo
od
y
B 1
So
il
Wo
od
y
D 4
So
il
Wo
od
y
D 1
Wo
od
y
B 1
So
il
Wo
od
y
D 4
Wo
od
y
/Fo
rb
No
ID
Wo
od
y
D 1
So
il
So
il
Wo
od
y
D 4
Wo
od
y
No
ID
Table A.8) Legend for coded habitat evaluation tables. Species are presented in no
particular order.
Symbol Species
A Acacia caffra
B Acacia nigrescens
C Boscia Albitrunca
D Combretum apiculatum
E Commiphera mollis
F Commiphera shimperi
G Combretum hereonse
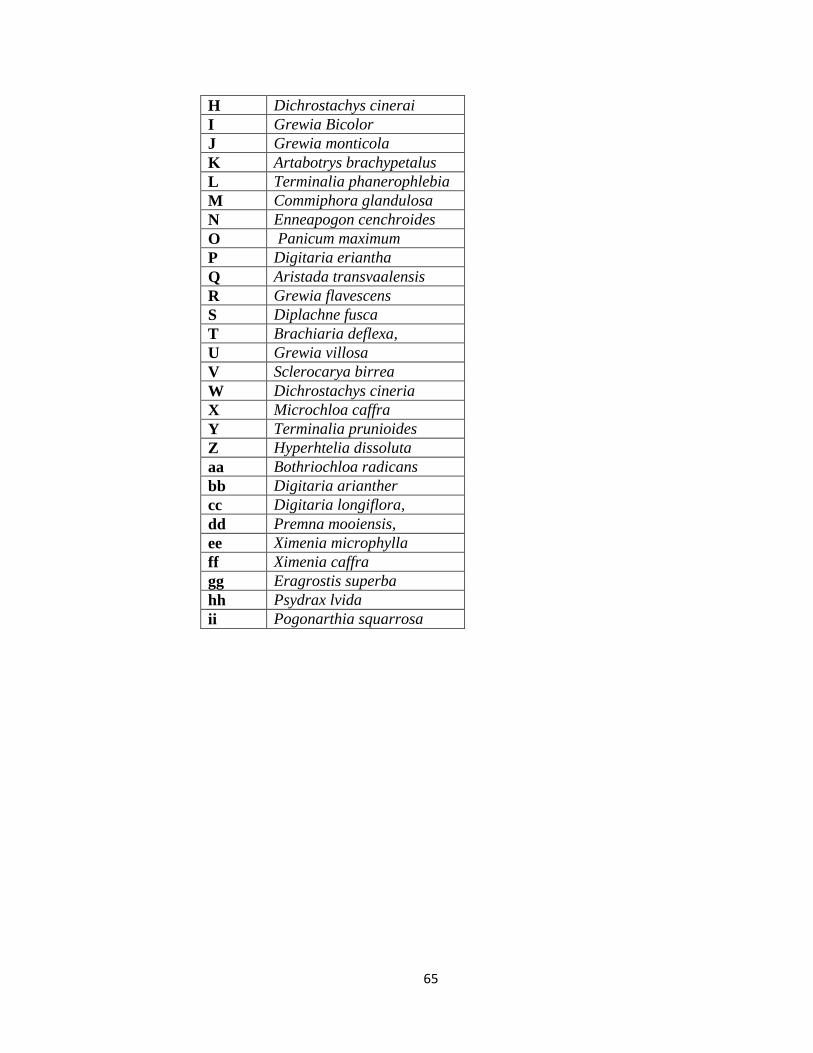
65
H Dichrostachys cinerai
I Grewia Bicolor
J Grewia monticola
K Artabotrys brachypetalus
L Terminalia phanerophlebia
M Commiphora glandulosa
N Enneapogon cenchroides
O Panicum maximum
P Digitaria eriantha
Q Aristada transvaalensis
R Grewia flavescens
S Diplachne fusca
T Brachiaria deflexa,
U Grewia villosa
V Sclerocarya birrea
W Dichrostachys cineria
X Microchloa caffra
Y Terminalia prunioides
Z Hyperhtelia dissoluta
aa Bothriochloa radicans
bb Digitaria arianther
cc Digitaria longiflora,
dd Premna mooiensis,
ee Ximenia microphylla
ff Ximenia caffra
gg Eragrostis superba
hh Psydrax lvida
ii Pogonarthia squarrosa