investigating the relationship between...
TRANSCRIPT

تحقیقات جدید در علوم انسانیفصلنامه
Human Sciences Research Journal
Vol 3 / No 12 / 2016 / P 23-37 39-97صص /5931 پاییز /دهمزادوشماره / سال سوم
Investigating the relationship between macroeconomic indicators
and indicator of Tehran Stock Exchange
Mehdi Parvaresh1, Mohsen Molaiesiroie
2, Vahab Ghasemi
3, Abdolreza
Mir4
1Department of Accounting, Roudan Branch, Islamic Azad University,
Roudan, Iran
Email:[email protected] 2MSc in Accounting and Auditor of Senior Hormozgan Audit Court,
Hormozgan, Iran
Email: [email protected] 3Auditor of Senior Hormozgan Audit Court, Hormozgan, Iran
Email:[email protected] 4Auditor of Senior Hormozgan Audit Court, Hormozgan, Iran
Email:[email protected] Abstract:
In studying the behavior of factors influencing market and therefore market
economy, the search for the variable or variables that could explain the relationship
between the financial sector of the economy and the real sector is very important.
Money and capital markets as pillars of the financial sector are responsible for
financing the real sector. Performance of the financial sector leads to the efficient
allocation of scarce resources to economic activities. Optimal allocation of
resources, in turn, leads to efficient savings and investment and thus economic
growth close to the potential of the economy. Financial sector of the economy of
each country is the supplier of financial resources and real economic activities
which are divided into two parts:
1. Money market mainly run by the banking system of a country the most
important function of which is providing short-term credits
ISSN (2476-7018) 5931، پاییز دوازدهم، شماره سال سوم، تحقیقات جدید در علوم انسانی/ 42
2. And capital markets the main function of which is long-term financing needed in
productive activities of production and services
Keywords: Behavior of factors influencing market, market economy, efficient
savings and investment, Money market
Introduction
In studying the behavior of factors influencing market and therefore market
economy, the search for the variable or variables that could explain the relationship
between the financial sector of the economy and the real sector is very important.
Money and capital markets as pillars of the financial sector are responsible for
financing the real sector.
Performance of the financial sector leads to the efficient allocation of scarce
resources to economic activities. Optimal allocation of resources, in turn, leads to
efficient savings and investment and thus economic growth close to the potential of
the economy. Economists such as Goldsmith (1969), Miknon (1973) and Shaw
(1973) believed that financial markets have a key role in the development and
economic growth.
Statement of the problem and the need for research
Generally, regarding economic policies, economists focus on issues such as full
employment, price stability (inflation), fair distribution of income, and steady
growth of the economy. Financial sector of the economy of each country is the
supplier of financial resources and real economic activities which are divided into
two parts:
1. Money market mainly run by the banking system of a country the most
important function of which is providing short-term credits
2. And capital markets the main function of which is long-term financing needed in
productive activities of production and services (Sahmiran. 1,2007)
Stock market works within a larger system called Iran's socio-economic system. it
is therefore severely affected by the environment. This influence is considerable
because the stock market in Iran is very young and is consequently affected by
environmental changes. Therefore, factors such as economic growth, exchange
rates, profit margins of other economic activities, foreign exchange earnings, the
degree of severity of liberalization and opening up and expanding the economy of
Iran, and increasing the liquidity are important environmental factors that affect the
stock market. The tax law can also be influential as a factor along with other
factors in the development of stock market (Moshrefi, 2,2005). Economic stability
is one of the most important factors affecting investment in each country. Among
the factors having effects on the capital markets in the world, as well as on the
amount of investment involved in these markets are macroeconomic variables that
affect the volatility of stock returns. During the economic boom with relatively
stable prices, manufacturing investment is in its normal process and investors
Investing the relationship between macroeconomic indicators ……. / 41
spend money to build factories, buy equipment, and increase inventory. As a result,
economic capacity goes up regularly, causing an increase in economic efficiency (
Tafazoli,1998, 564).
The effect of stock exchange on economic growth
According to classical economic theories, if efficient sectors of economy expand,
they will be able to absorb the additional production factors from inefficient parts.
Efficient and profitable companies and projects should be first identified. With an
efficient mechanism in the capital market this can be done easily. In an economy
whose capital markets function properly, on the one hand investment volume
increases and on the other hand the quality and security of investments go up.
In such a context, it is also possible to increase economic growth. Some economic
analysts believe that the stock market and the stock exchange in developing
countries do not have a positive effect on economic growth, but evidence and
recent studies have shown that the stock market can have a profound impact on
economic growth and development. By collecting liquidity, these markets can both
provide short-term capital for financing needy units and provide long-term capital
for profitable investments. In addition to stock market, banks are also major
sources of financing. In developing countries, due to lack of knowledge of
managers about efficient tools such as stock, the bulk of capital required is
provided through the banking system, as borrowing from the banking system has
severe inflation consequences (Mushrefi. 2005)
Index of Tehran Stock Exchange and its calculation method
As Tehran Stock resumed working in 1986, the need to calculate the price index
was put in the agenda of the Tehran Stock Exchange. The price index in the stock
market was called Tepix in 1986 and has been known internationally by this name,
ever after. Tepix is an abbreviation for TEHRAN PRICE INDEX.
Following this decision, the calculation of Tehran stock exchange index started in
1989 based on the average price of shares traded during the second half of 1986. In
the beginning of the year 1989, in the formula, the number of shares traded was
replaced by the number of shares issued by companies listed on the stock
exchange. The general formula prepared by the method of weighted average index
at Tehran Stock Exchange, as well as other exchanges in the world, is the formula
below(Davani ,: 2005,11): current value of stocks issued by listed companies/ the
base value of stocks shared by listed companies*100TEPIX
Generally, stock market index reflects the overall condition of the stock market. In
advanced economies, an increase in the index means the economy is booming it
and a decrease in it shows depression. To calculate the stock price index, the latest
information about the changes in stock prices and trading volumes is required.
The basis for calculating is base year, 1997. The index shows that the total market
value has multiplied compared to the base year. Price index at Tehran Stock
Exchange is calculated for three groups, namely:
ISSN (2476-7018) 5931، پاییز دوازدهم، شماره سال سوم، تحقیقات جدید در علوم انسانی/ 42
1. General Market Price Index: in its calculation, stock price of all companies
traded is taken into account.
2. Price index of the main hall: in calculating it, only stock price of traded
companies on the main board is taken into account.
3. Price index of secondary hall: in calculating it, only stock price of traded
companies on the secondary board is taken into account (ibid, p. 117). There is not
perfect correlation between rising equity prices and the general price index. Change
percentage of common stock is usually more than the percentage change in the
general level of price index. With inflation and rising interest rates, expected rate
of return goes up and consequently, common stock price decreases.
In assessing the environment, investor should consider several factors such
inflation, interest rate, risk of return, and business risk. Inflation, instability of
profits, and rising interest rates are factors considered undesirable and reduce the
stock price.
Research objectives
The main purpose of this research is to explain the relationship between
macroeconomic indicators and efficiency of Tehran Stock Exchange indicator
Research detailed objectives
- To explain the relationship between oil price yield and indicator of Tehran Stock
Exchange
- To explain the relationship between changes in GDP and returns of indicator of
Tehran Stock Exchange
- To explain the relationship between exchange rates yield and the yield of Tehran
Stock Exchange indicator
- To explain the relationship between inflation and the yield of Tehran Stock
Exchange indicator
Research Methodology
Research methodology is deductive – inductive. In terms of purpose, the present
study is applied and in terms of data collection, it is descriptive and correlational.
Realms of time and place of the research
Subject domain: To investigate the relationship between macroeconomic indicators
and indicators of Tehran Stock Exchange
Time domain: the time domain of the research is from 2009 to 2013 (a 5-year
period).
Place domain: it contains all companies listed on the Stock Exchange of Tehran.
Research Hypotheses
The main hypothesis: there is significant relationship between macroeconomic
indicators and return of Tehran Stock Exchange index
Investing the relationship between macroeconomic indicators ……. / 42
Secondary hypotheses
H1: There is a significant relationship between oil price and return of Tehran Stock
Exchange index.
H2: there is a significant relationship between changes in GDP and return of
Tehran Stock Exchange index.
H3: there is a significant relationship between the exchange rate yield and return of
Tehran Stock Exchange index
H 4: there is a significant relationship between inflation and return of Tehran Stock
Exchange index
Research variables and the method of measuring them
The relationship examined in this study is the following relationship:
Where,
In=inflation
OI= oil
GDP= gross domestic product
EX= exchange rate
Alpha and beta are the regression coefficients. Correlation coefficient is the best
criterion for diagnosis of relation between two or more variables and it is the
expression of strength or weakness. If the correlation is between two variables, it is
simple correlation and if it is between more than two variables, it is multivariable
correlation.
Kolmogorov-Smirnov test
Kolmogorov-Smirnov test is a simple non-parametric method to determine the
homogeneity of the experimental data with selected statistical distribution shown
2008, p. 310). Kolmogorov - Smirnov is a
correspondence of distribution test for quantity data. Using this test, it can be found
out whether sample data have a special theoretical distribution.
ed to compare four different distributions:
normal, Poisson, exponential, and uniform. The null distribution of this statistic is
calculated under the null hypothesis that the sample is drawn from the reference
distribution (in the one-sample case) or that the samples are drawn from the same
distribution (in the two-sample case). In each case, the distributions considered
under the null hypothesis are continuous distributions but are otherwise
n. If the test statistic is less than
the value in the table, the null hypothesis is confirmed. Otherwise, it is rejected.
The test statistic is obtained through the formula below:
oen FFMaximumD
ISSN (2476-7018) 5931، پاییز دوازدهم، شماره سال سوم، تحقیقات جدید در علوم انسانی/ 42
Correlation coefficient
In this study, regression and analysis of variance were used to test the hypotheses.
According to what was said earlier, the number of observations is more than 30 and
based on the central limit theorem data can be assumed normal. Therefore, t
distribution is used for testing the hypotheses and F is used for general
confirmation. Correlation coefficient is the best measure for the relationship
between two or more variables. If the correlation is between two variables, it is
simple correlation and if it is between more than two variables, it is multivariable
correlation. For calculating Pearson correlation coefficient, if the variables are
integers, the following formula is used:
R represents the linear relationship between x and y is, and its sign indicates the
direction of this relationship. The couple may be variables with strong relationship
without necessarily being linear. In this case, r is not an appropriate measure. In the
following, a table for linearity of the relationship between x and y is seen.
H0:β1=0 the existence of linear relationship
H1: β1=0 no linear relationship
The test of significance of coefficient correlation
The question that arises is that whether the correlation between the variables x and
y is significant or not? or whether the existence of a linear causal relationship can
be proven or the coefficient correlation has been obtained by chance and
correlation coefficient, shown as P, is equal to zero.
To test the correlation between two random variables x and y or to simply test
whether the correlation coefficient is zero or not, we need a proper statistic. This
statistic testing the correlation coefficient of zero with a distribution t and degrees
of freedom of n-2 is as follows:
With the following hypotheses:
If the statistic is in critical area, null hypothesis can-not be rejected and the
correlation coefficient obtained is not significant. If it is in critical area, H1 is
confirmed and the existence of a correlation is proven. Based on the results
obtained by SPSS software:
If p-value >0.05, the results are not significant.
If 0.01≤ p-value ≤0.05, the results are significant.
If 0.001≤ p-value ≤0.01, the results are highly significant.
If p-value ≤0.001, the results are highly significant.
Investing the relationship between macroeconomic indicators ……. / 43
Degree of freedom is obtained from n-2 formula, where n is the number of
observations.
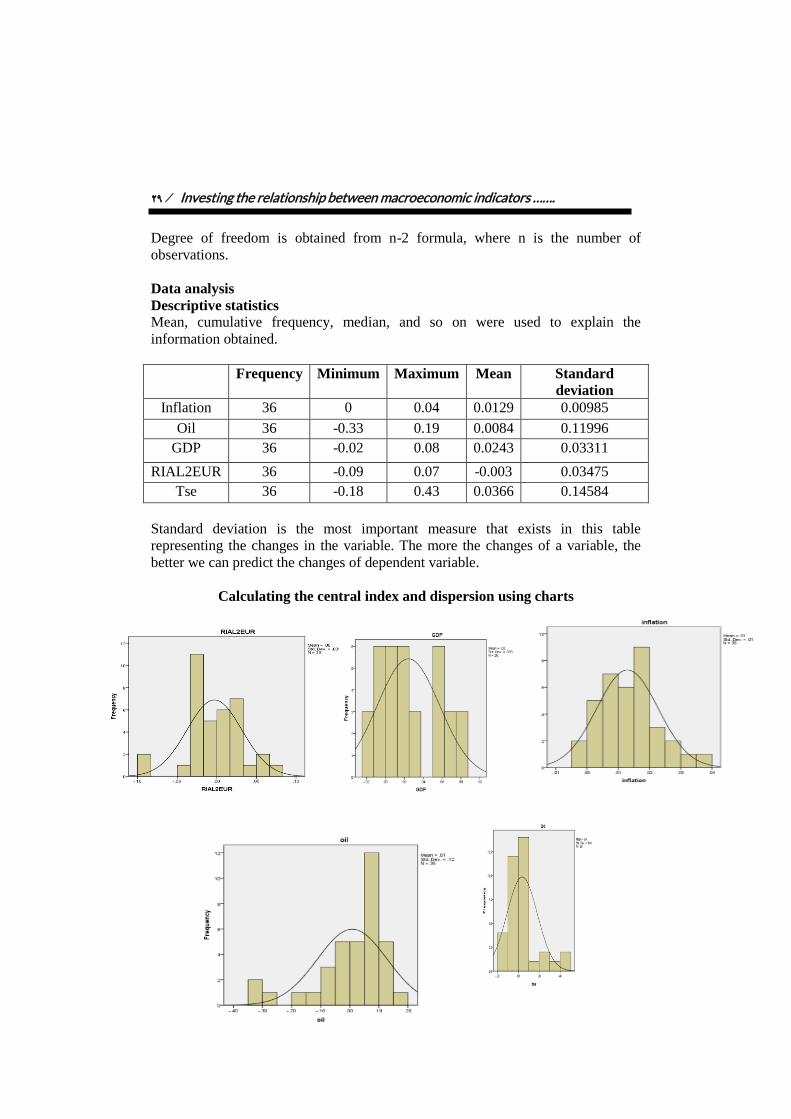
Data analysis
Descriptive statistics
Mean, cumulative frequency, median, and so on were used to explain the
information obtained.
Frequency Minimum Maximum Mean Standard
deviation
Inflation 36 0 0.04 0.0129 0.00985
Oil 36 -0.33 0.19 0.0084 0.11996
GDP 36 -0.02 0.08 0.0243 0.03311
RIAL2EUR 36 -0.09 0.07 -0.003 0.03475
Tse 36 -0.18 0.43 0.0366 0.14584
Standard deviation is the most important measure that exists in this table
representing the changes in the variable. The more the changes of a variable, the
better we can predict the changes of dependent variable.
Calculating the central index and dispersion using charts
ISSN (2476-7018) 5931، پاییز دوازدهم، شماره سال سوم، تحقیقات جدید در علوم انسانی/ 93
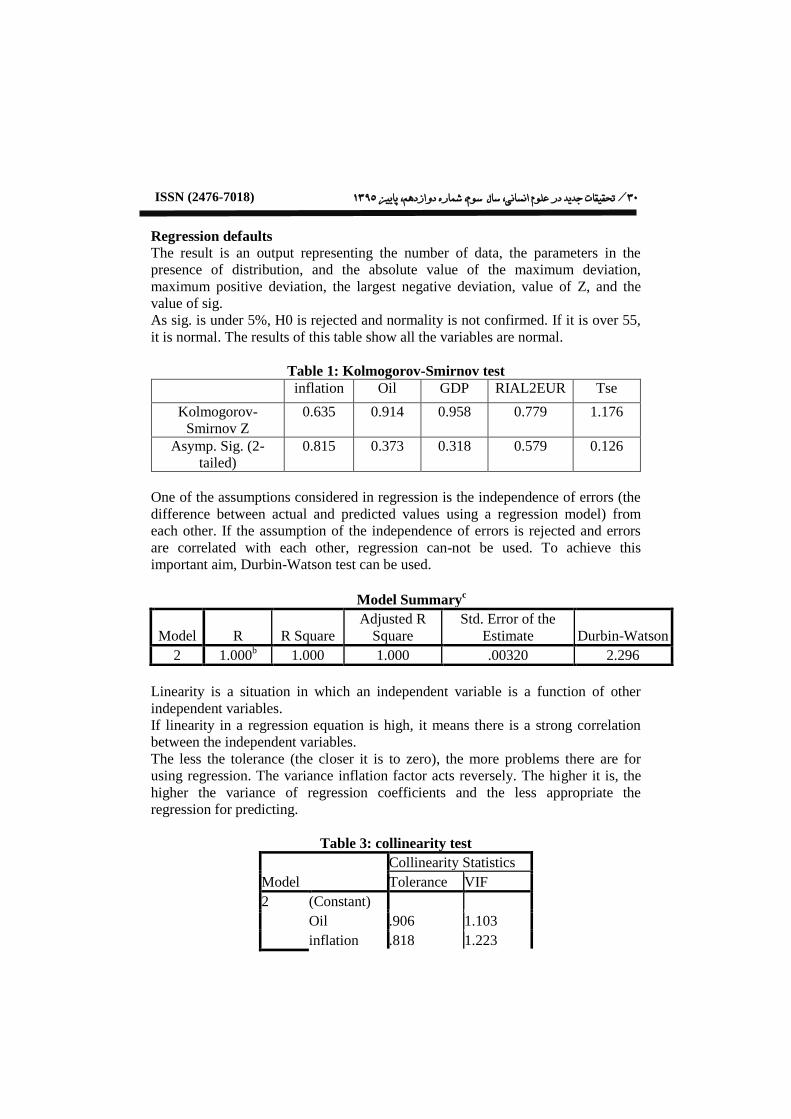
Regression defaults
The result is an output representing the number of data, the parameters in the
presence of distribution, and the absolute value of the maximum deviation,
maximum positive deviation, the largest negative deviation, value of Z, and the
value of sig.
As sig. is under 5%, H0 is rejected and normality is not confirmed. If it is over 55,
it is normal. The results of this table show all the variables are normal.
Table 1: Kolmogorov-Smirnov test
inflation Oil GDP RIAL2EUR Tse
Kolmogorov-
Smirnov Z
0.635 0.914 0.958 0.779 1.176
Asymp. Sig. (2-
tailed)
0.815 0.373 0.318 0.579 0.126
One of the assumptions considered in regression is the independence of errors (the
difference between actual and predicted values using a regression model) from
each other. If the assumption of the independence of errors is rejected and errors
are correlated with each other, regression can-not be used. To achieve this
important aim, Durbin-Watson test can be used.
Linearity is a situation in which an independent variable is a function of other
independent variables.
If linearity in a regression equation is high, it means there is a strong correlation
between the independent variables.
The less the tolerance (the closer it is to zero), the more problems there are for
using regression. The variance inflation factor acts reversely. The higher it is, the
higher the variance of regression coefficients and the less appropriate the
regression for predicting.
Table 3: collinearity test
Model
Collinearity Statistics
Tolerance VIF
2 (Constant)
Oil .906 1.103
inflation .818 1.223
Model Summaryc
Model R R Square
Adjusted R
Square
Std. Error of the
Estimate Durbin-Watson
2 1.000b 1.000 1.000 .00320 2.296
Investing the relationship between macroeconomic indicators ……. / 95
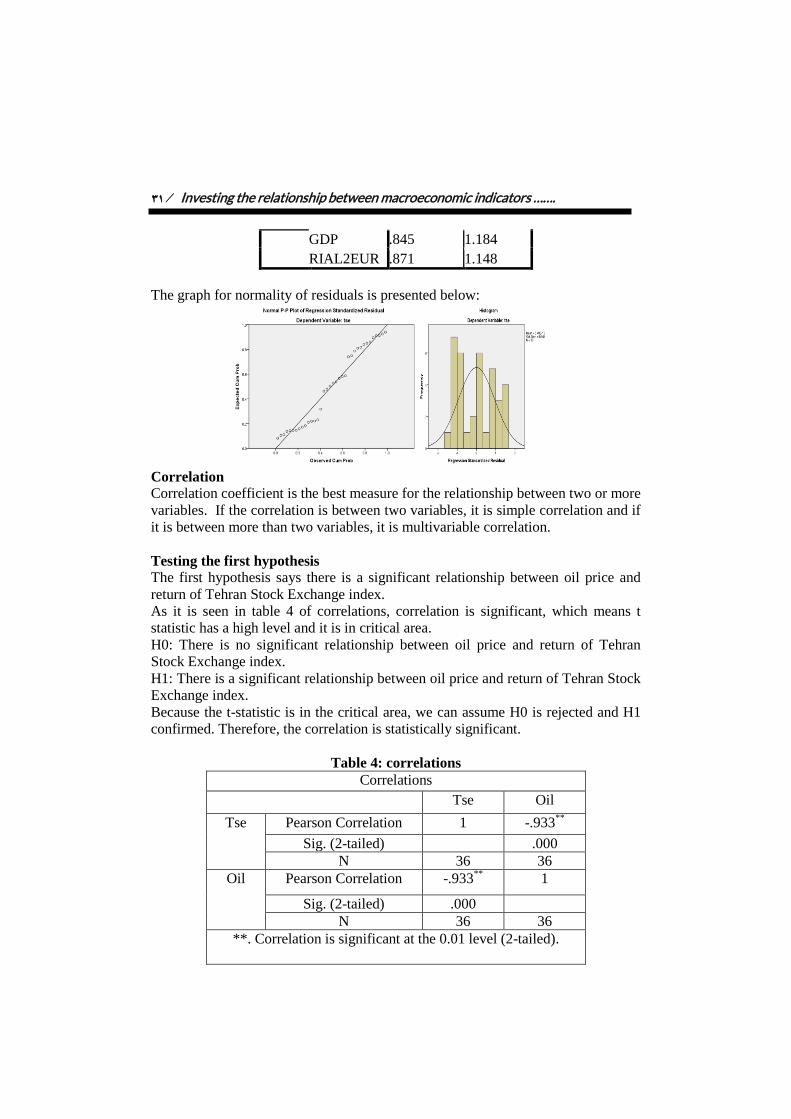
GDP .845 1.184
RIAL2EUR .871 1.148
The graph for normality of residuals is presented below:
Correlation
Correlation coefficient is the best measure for the relationship between two or more
variables. If the correlation is between two variables, it is simple correlation and if
it is between more than two variables, it is multivariable correlation.
Testing the first hypothesis
The first hypothesis says there is a significant relationship between oil price and
return of Tehran Stock Exchange index.
As it is seen in table 4 of correlations, correlation is significant, which means t
statistic has a high level and it is in critical area.
H0: There is no significant relationship between oil price and return of Tehran
Stock Exchange index.
H1: There is a significant relationship between oil price and return of Tehran Stock
Exchange index.
Because the t-statistic is in the critical area, we can assume H0 is rejected and H1
confirmed. Therefore, the correlation is statistically significant.
Table 4: correlations
Correlations
Tse Oil
Tse Pearson Correlation 1 -.933**
Sig. (2-tailed) .000
N 36 36
Oil Pearson Correlation -.933**
1
Sig. (2-tailed) .000
N 36 36
**. Correlation is significant at the 0.01 level (2-tailed).
ISSN (2476-7018) 5931، پاییز دوازدهم، شماره سال سوم، تحقیقات جدید در علوم انسانی/ 94
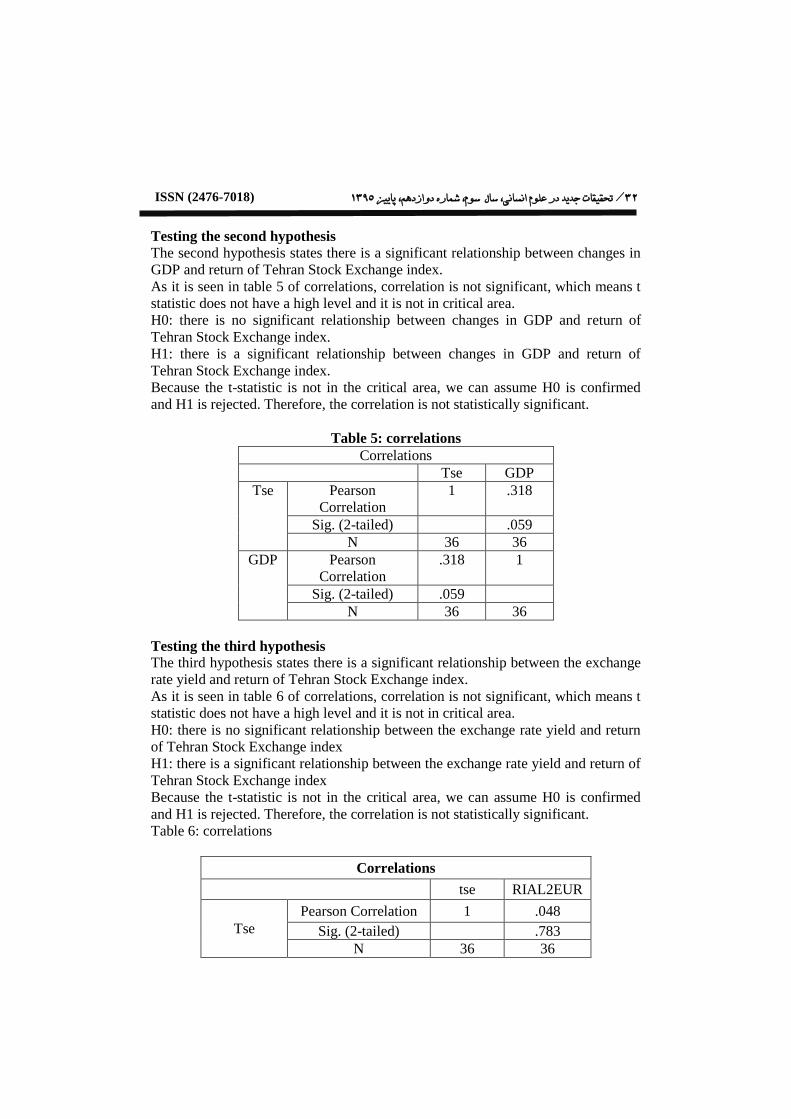
Testing the second hypothesis
The second hypothesis states there is a significant relationship between changes in
GDP and return of Tehran Stock Exchange index.
As it is seen in table 5 of correlations, correlation is not significant, which means t
statistic does not have a high level and it is not in critical area.
H0: there is no significant relationship between changes in GDP and return of
Tehran Stock Exchange index.
H1: there is a significant relationship between changes in GDP and return of
Tehran Stock Exchange index.
Because the t-statistic is not in the critical area, we can assume H0 is confirmed
and H1 is rejected. Therefore, the correlation is not statistically significant.
Table 5: correlations
Correlations
Tse GDP
Tse Pearson
Correlation
1 .318
Sig. (2-tailed) .059
N 36 36
GDP Pearson
Correlation
.318 1
Sig. (2-tailed) .059
N 36 36
Testing the third hypothesis
The third hypothesis states there is a significant relationship between the exchange
rate yield and return of Tehran Stock Exchange index.
As it is seen in table 6 of correlations, correlation is not significant, which means t
statistic does not have a high level and it is not in critical area.
H0: there is no significant relationship between the exchange rate yield and return
of Tehran Stock Exchange index
H1: there is a significant relationship between the exchange rate yield and return of
Tehran Stock Exchange index
Because the t-statistic is not in the critical area, we can assume H0 is confirmed
and H1 is rejected. Therefore, the correlation is not statistically significant.
Table 6: correlations
Correlations
tse RIAL2EUR
Tse
Pearson Correlation 1 .048
Sig. (2-tailed) .783
N 36 36
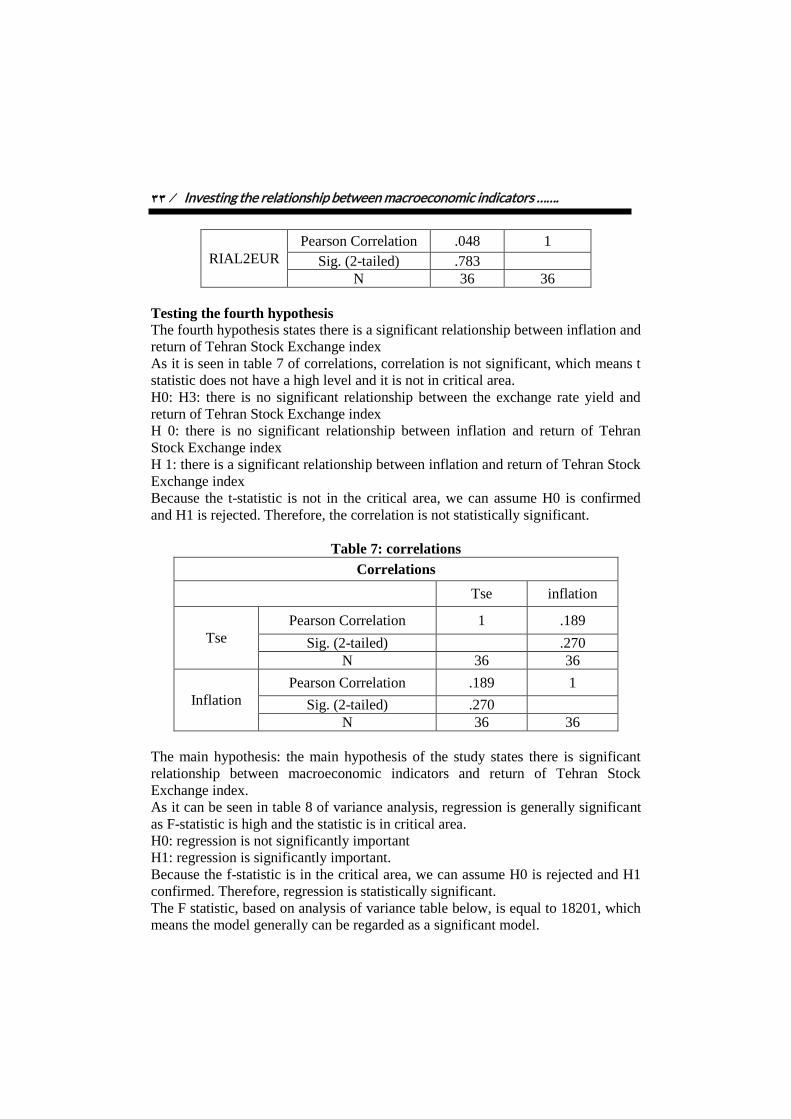
Investing the relationship between macroeconomic indicators ……. / 99
RIAL2EUR
Pearson Correlation .048 1
Sig. (2-tailed) .783
N 36 36
Testing the fourth hypothesis
The fourth hypothesis states there is a significant relationship between inflation and
return of Tehran Stock Exchange index
As it is seen in table 7 of correlations, correlation is not significant, which means t
statistic does not have a high level and it is not in critical area.
H0: H3: there is no significant relationship between the exchange rate yield and
return of Tehran Stock Exchange index
H 0: there is no significant relationship between inflation and return of Tehran
Stock Exchange index
H 1: there is a significant relationship between inflation and return of Tehran Stock
Exchange index
Because the t-statistic is not in the critical area, we can assume H0 is confirmed
and H1 is rejected. Therefore, the correlation is not statistically significant.
Table 7: correlations
Correlations
Tse inflation
Tse
Pearson Correlation 1 .189
Sig. (2-tailed) .270
N 36 36
Inflation
Pearson Correlation .189 1
Sig. (2-tailed) .270
N 36 36
The main hypothesis: the main hypothesis of the study states there is significant
relationship between macroeconomic indicators and return of Tehran Stock
Exchange index.
As it can be seen in table 8 of variance analysis, regression is generally significant
as F-statistic is high and the statistic is in critical area.
H0: regression is not significantly important
H1: regression is significantly important.
Because the f-statistic is in the critical area, we can assume H0 is rejected and H1
confirmed. Therefore, regression is statistically significant.
The F statistic, based on analysis of variance table below, is equal to 18201, which
means the model generally can be regarded as a significant model.
ISSN (2476-7018) 5931، پاییز دوازدهم، شماره سال سوم، تحقیقات جدید در علوم انسانی/ 92
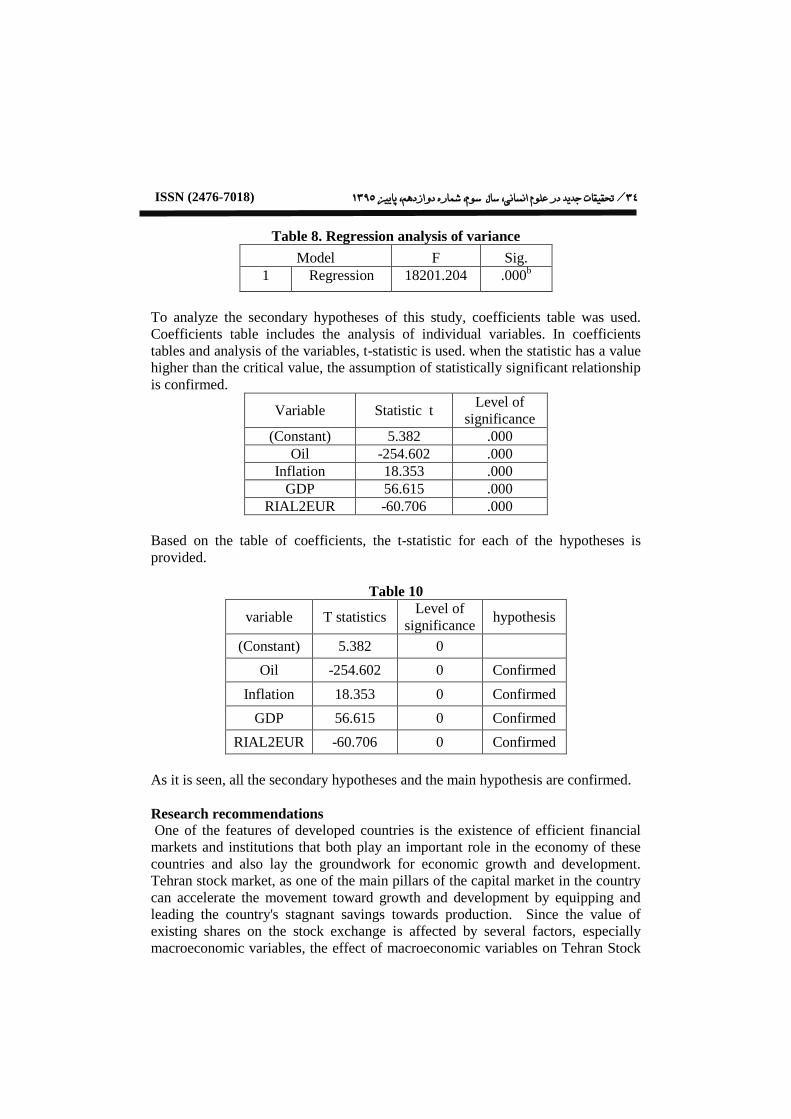
Table 8. Regression analysis of variance
Model F Sig.
1 Regression 18201.204 .000b
To analyze the secondary hypotheses of this study, coefficients table was used.
Coefficients table includes the analysis of individual variables. In coefficients
tables and analysis of the variables, t-statistic is used. when the statistic has a value
higher than the critical value, the assumption of statistically significant relationship
is confirmed.
Variable Statistic t Level of
significance
(Constant) 5.382 .000
Oil -254.602 .000
Inflation 18.353 .000
GDP 56.615 .000
RIAL2EUR -60.706 .000
Based on the table of coefficients, the t-statistic for each of the hypotheses is
provided.
Table 10
variable T statistics Level of
significance hypothesis
(Constant) 5.382 0
Oil -254.602 0 Confirmed
Inflation 18.353 0 Confirmed
GDP 56.615 0 Confirmed
RIAL2EUR -60.706 0 Confirmed
As it is seen, all the secondary hypotheses and the main hypothesis are confirmed.
Research recommendations
One of the features of developed countries is the existence of efficient financial
markets and institutions that both play an important role in the economy of these
countries and also lay the groundwork for economic growth and development.
Tehran stock market, as one of the main pillars of the capital market in the country
can accelerate the movement toward growth and development by equipping and
leading the country's stagnant savings towards production. Since the value of
existing shares on the stock exchange is affected by several factors, especially
macroeconomic variables, the effect of macroeconomic variables on Tehran Stock
Investing the relationship between macroeconomic indicators ……. / 91
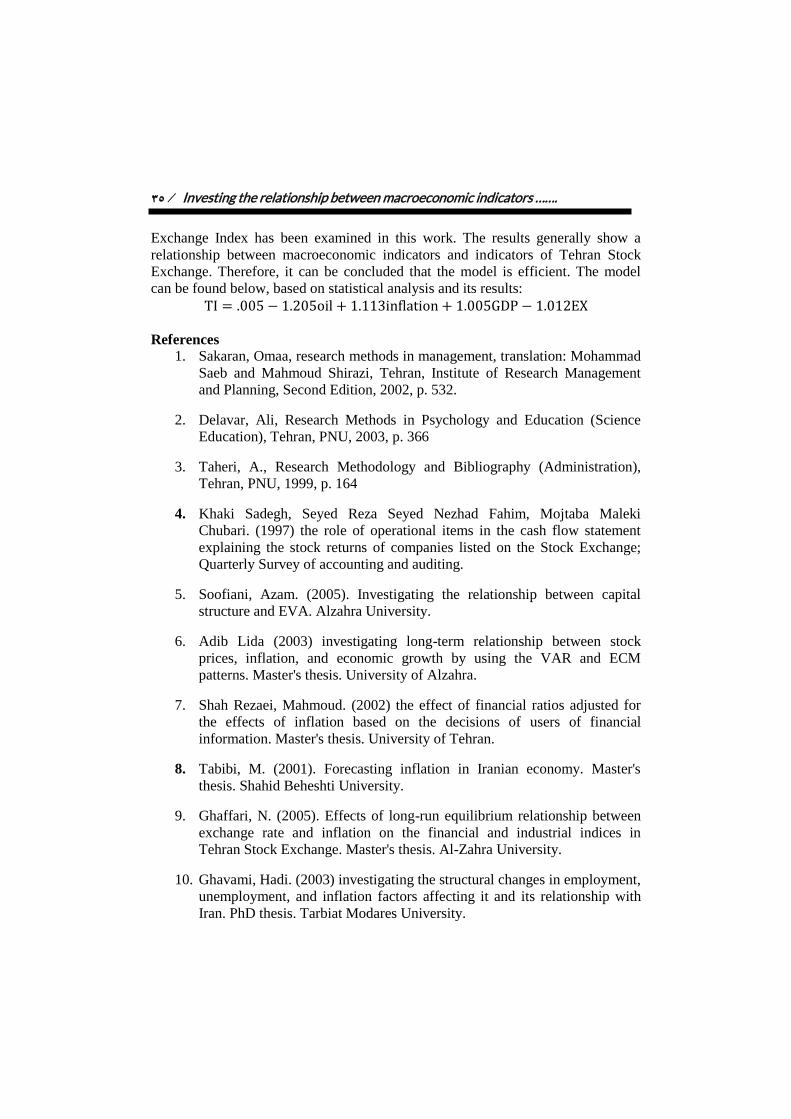
Exchange Index has been examined in this work. The results generally show a
relationship between macroeconomic indicators and indicators of Tehran Stock
Exchange. Therefore, it can be concluded that the model is efficient. The model
can be found below, based on statistical analysis and its results:
References
1. Sakaran, Omaa, research methods in management, translation: Mohammad
Saeb and Mahmoud Shirazi, Tehran, Institute of Research Management
and Planning, Second Edition, 2002, p. 532.
2. Delavar, Ali, Research Methods in Psychology and Education (Science
Education), Tehran, PNU, 2003, p. 366
3. Taheri, A., Research Methodology and Bibliography (Administration),
Tehran, PNU, 1999, p. 164
4. Khaki Sadegh, Seyed Reza Seyed Nezhad Fahim, Mojtaba Maleki
Chubari. (1997) the role of operational items in the cash flow statement
explaining the stock returns of companies listed on the Stock Exchange;
Quarterly Survey of accounting and auditing.
5. Soofiani, Azam. (2005). Investigating the relationship between capital
structure and EVA. Alzahra University.
6. Adib Lida (2003) investigating long-term relationship between stock
prices, inflation, and economic growth by using the VAR and ECM
patterns. Master's thesis. University of Alzahra.
7. Shah Rezaei, Mahmoud. (2002) the effect of financial ratios adjusted for
the effects of inflation based on the decisions of users of financial
information. Master's thesis. University of Tehran.
8. Tabibi, M. (2001). Forecasting inflation in Iranian economy. Master's
thesis. Shahid Beheshti University.
9. Ghaffari, N. (2005). Effects of long-run equilibrium relationship between
exchange rate and inflation on the financial and industrial indices in
Tehran Stock Exchange. Master's thesis. Al-Zahra University.
10. Ghavami, Hadi. (2003) investigating the structural changes in employment,
unemployment, and inflation factors affecting it and its relationship with
Iran. PhD thesis. Tarbiat Modares University.
ISSN (2476-7018) 5931، پاییز دوازدهم، شماره سال سوم، تحقیقات جدید در علوم انسانی/ 92
11. Mufti, Shadi. (2003) investigating the effect of exchange rate and inflation
on the pattern of exports and imports over the period 1350-1378. Master's
thesis. Al-Zahra University.
12. Balduzzi, Pierluingi, Stock Return inflation and the proxy hypothesis: A
new look at the data. Economics letters No48 1995,P.47-53
13. Boudoukh,J.,Richardson,M,1993.Stock returns and inflation: a long
horizon perspective. American Economic Review 83, 1346-1355.
14. Choudhry, T2001. Inflation and rates of return on stocks: evidence from
high inflation countries. Journal of International Financial Markets,
Institution &Money 11, 75-96
15. Engsted, T., Tanggaard,C., 2002. The relation between asset returns and
inflation at 16-short and long horizons. Journal of International Financial
Markets, Institutions &Money 12, 101-118
16. Evgene . F. Fama. Stock Returns, Real Activity, inflation and Money.
American Economic Review, Sep 1981.PP. 545-564
17. Fama,E.F.,Schwert,G.W.,1977.Stock market returns and inflation .Journal
of Financial Economics5, 115-146
18. Groene wold, Rolke,G,and Thomas .Stock returns and inflation :a macro
analysis .Applied financial economics 1992,No 7 , P127-136
19. Gultekin, N. Bulent . Stock Market Returns and Inflation :Evidence from
other countries .Journal of finance , No 38 march 1983, P.49-65
20. Solnik, B.,Solnik, V.,19997.Amulti-contry test of the Fisher model for
stock returns.Journal of International Financial Markets, Institution &
Money 7, 289-30
21. N. Bulent Gultekin, “Stock Market Returns and Inflation Evidence From
Other Countries”, The Journal of Finance, March 1983.
22. Bruno Solnik, “The Relation between Stock Prices and Inflationary
Exceptions; The International Evidence”, The Journal of Finance, March
1983.
23. Lev, B. (1974).Financial Statement Analysis: A New Approach. First
Edition, New Jersy, Engelwood Cliffs: Prentic Hall.
24. Marshall, Alfred.(1890). Principles of Economics . New York: MacMillan
& Co. Vol. 1,p. 142
Investing the relationship between macroeconomic indicators ……. / 92
25. Morely, KE (1988). The new organizational wealth: managing and
measuring knowledge based assets. Berret Koehler, San Francisco.
26. Tully, Shawn.(1993). “The Real Key to Creating Wealth,” Fortune,
September 20.
27. Weygandt , Jerry J., Paul D. Kimmel and Donald E. Kieso Financial
Accounting (2009) .John Wiley and Sons Vernon Kam.(1990). Accounting
theory. Wiley
28. Yook C. Kenneth and George M. McCabe. (2001) , “An Examination of
MVA in the Cross-Section of Expected Stock Returns, Journal of Portfolio
Management.