introduction to quaternary palaeoecology
DESCRIPTION
Introduction to Quaternary Palaeoecology. John and Hilary Birks Nordforsk PhD course, Abisko 2011. What is palaeoecology? How do we do a Q-Time palaeoecological study? Quaternary pollen analysis Quaternary plant-macrofossil analysis Quaternary chironomid analysis - PowerPoint PPT PresentationTRANSCRIPT
Introduction to Quaternary Palaeoecology
John and Hilary Birks
Nordforsk PhD course, Abisko 2011
What is palaeoecology?How do we do a Q-Time palaeoecological study?
Quaternary pollen analysisQuaternary plant-macrofossil analysisQuaternary chironomid analysisSome examples of Q-Time palaeoecological studies
Conclusions
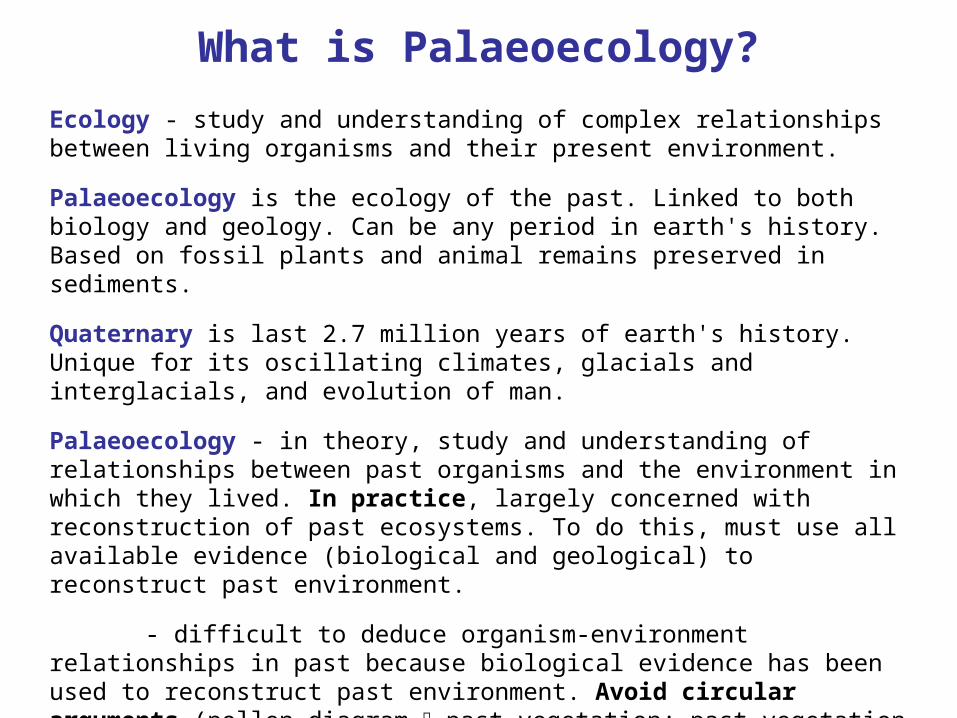
What is Palaeoecology?Ecology - study and understanding of complex relationships between living organisms and their present environment.Palaeoecology is the ecology of the past. Linked to both biology and geology. Can be any period in earth's history. Based on fossil plants and animal remains preserved in sediments.Quaternary is last 2.7 million years of earth's history. Unique for its oscillating climates, glacials and interglacials, and evolution of man.Palaeoecology - in theory, study and understanding of relationships between past organisms and the environment in which they lived. In practice, largely concerned with reconstruction of past ecosystems. To do this, must use all available evidence (biological and geological) to reconstruct past environment.
- difficult to deduce organism-environment relationships in past because biological evidence has been used to reconstruct past environment. Avoid circular arguments (pollen diagram past vegetation; past vegetation past climate; past climate to explain changes in pollen diagram). Pollen data tell us about past vegetation or past environment but not both. Need independent evidence, e.g. from another fossil type or isotope data.
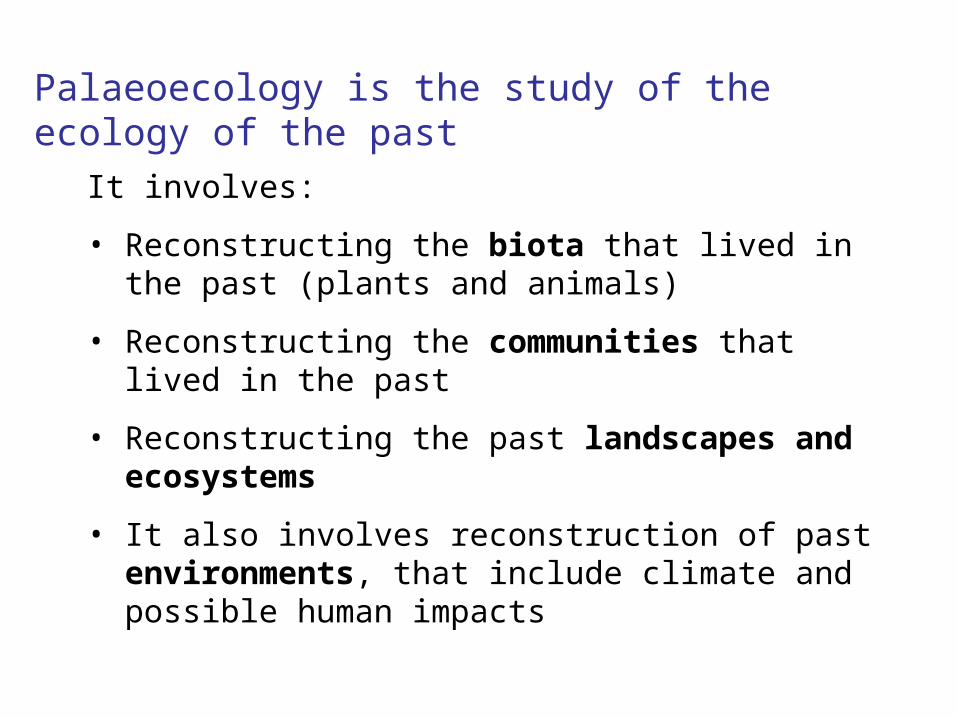
Palaeoecology is the study of the ecology of the past
It involves:• Reconstructing the biota that lived in the past
(plants and animals)• Reconstructing the communities that lived in
the past• Reconstructing the past landscapes and
ecosystems• It also involves reconstruction of past
environments, that include climate and possible human impacts
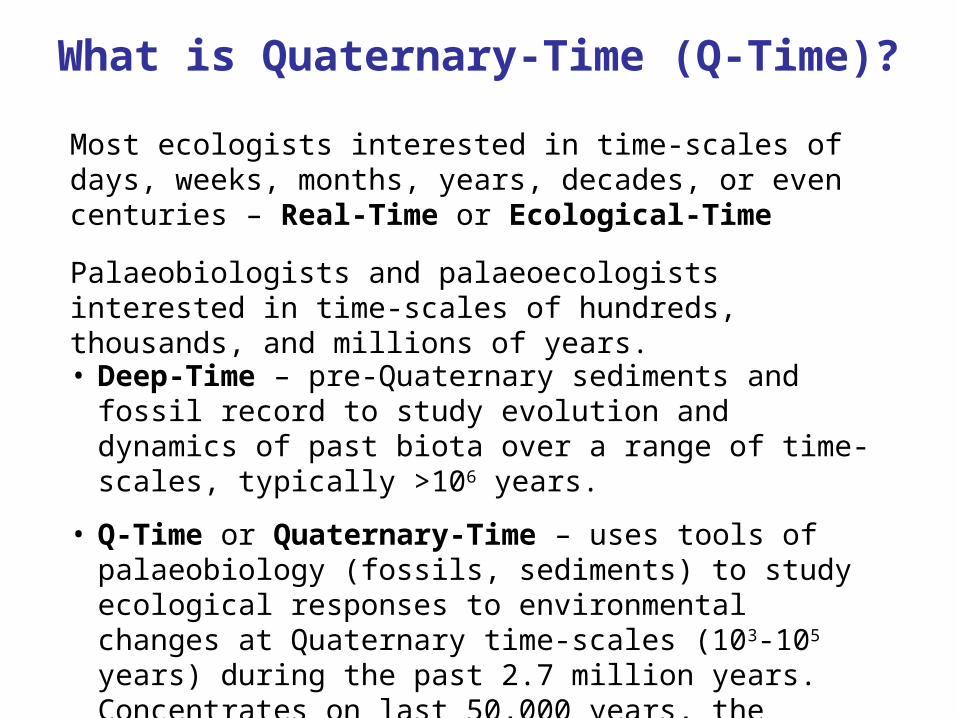
What is Quaternary-Time (Q-Time)?Most ecologists interested in time-scales of days, weeks, months, years, decades, or even centuries – Real-Time or Ecological-TimePalaeobiologists and palaeoecologists interested in time-scales of hundreds, thousands, and millions of years.• Deep-Time – pre-Quaternary sediments and fossil
record to study evolution and dynamics of past biota over a range of time-scales, typically >106 years.
• Q-Time or Quaternary-Time – uses tools of palaeobiology (fossils, sediments) to study ecological responses to environmental changes at Quaternary time-scales (103-105 years) during the past 2.7 million years. Concentrates on last 50,000 years, the window dateable by radiocarbon-dating. Also called Near-time (last 1-2 million years).
Deep-Time scientists are called palaeontologists or palaeobiologists
Q-Time scientists are called Quaternary scientists or palaeoecologists
Real-Time scientists are called ecologists and biogeographers
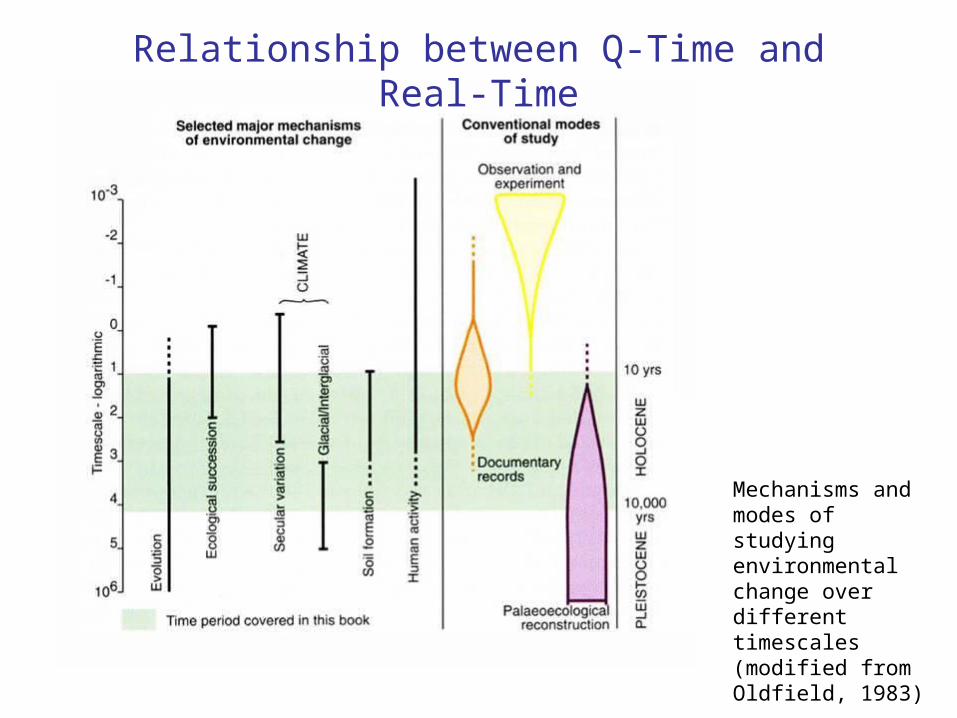
Mechanisms and modes of studying environmental change over different timescales (modified from Oldfield, 1983)
Relationship between Q-Time and Real-Time
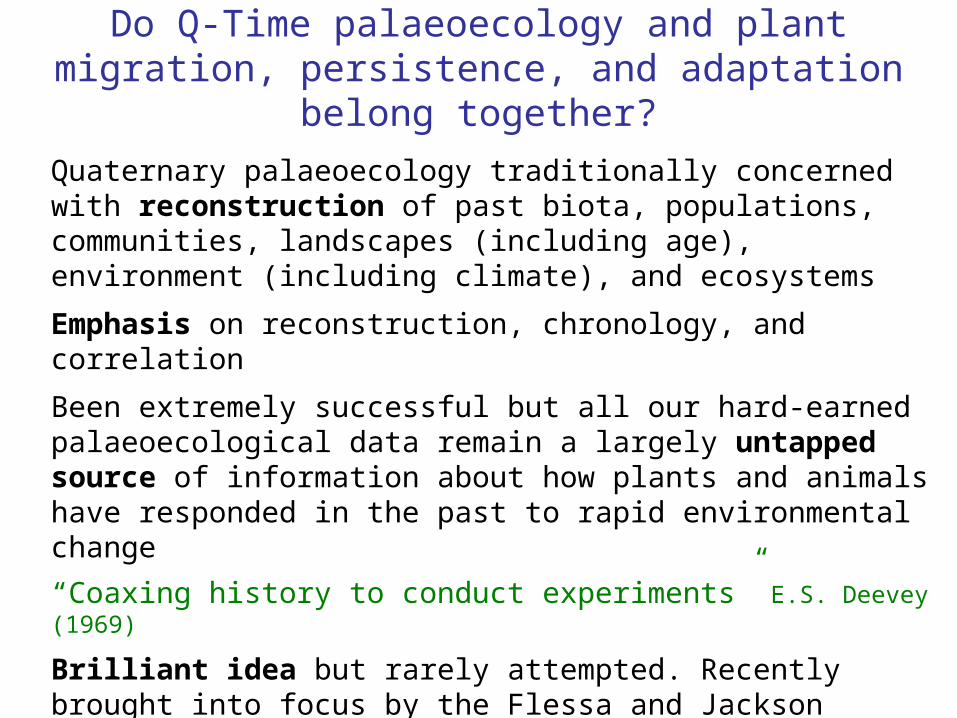
Do Q-Time palaeoecology and plant migration, persistence, and adaptation belong together?Quaternary palaeoecology traditionally concerned with reconstruction of past biota, populations, communities, landscapes (including age), environment (including climate), and ecosystemsEmphasis on reconstruction, chronology, and correlationBeen extremely successful but all our hard-earned palaeoecological data remain a largely untapped source of information about how plants and animals have responded in the past to rapid environmental change“Coaxing history to conduct experiments” E.S. Deevey (1969)Brilliant idea but rarely attempted. Recently brought into focus by the Flessa and Jackson (2005) report to the National Research Council of the National Academies (USA) on The Geological Record of Ecological Dynamics

Important and critical role for palaeoecology. The Geological Record of Ecological Dynamics – Understanding the Biotic Effects of Future Environmental Change (Flessa & Jackson 2005)
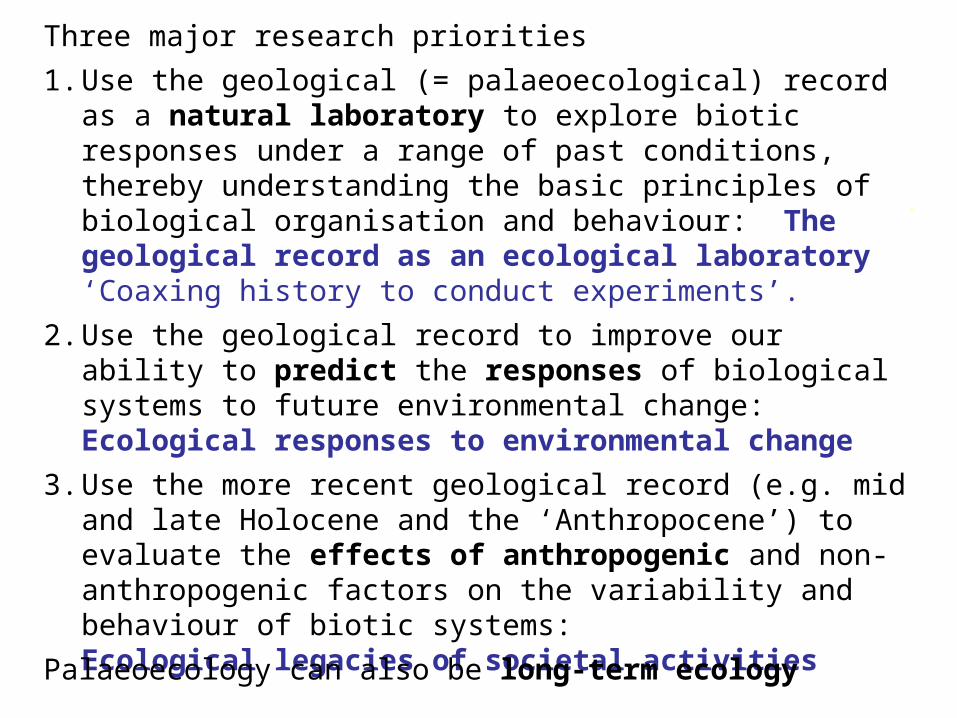
Three major research priorities1. Use the geological (= palaeoecological) record as a
natural laboratory to explore biotic responses under a range of past conditions, thereby understanding the basic principles of biological organisation and behaviour: The geological record as an ecological laboratory ‘Coaxing history to conduct experiments’.
2. Use the geological record to improve our ability to predict the responses of biological systems to future environmental change: Ecological responses to environmental change
3. Use the more recent geological record (e.g. mid and late Holocene and the ‘Anthropocene’) to evaluate the effects of anthropogenic and non-anthropogenic factors on the variability and behaviour of biotic systems: Ecological legacies of societal activities
.
Palaeoecology can also be long-term ecology

Basic essential needs in using the Q-Time palaeoecological record as a long-term ecological laboratory1. Detailed biostratigraphical data of organism
group of interest (e.g. plants – pollen and plant macrofossil data). Biotic response variables
2. Independent palaeoenvironmental reconstruction (e.g. July air temperature based on chironomids). Predictor variable or forcing function
3. Detailed fine-resolution chronologyCan look at ecological problems and biotic responses in a long-term Q-Time perspective
Why Study Q-Time Palaeoecology?
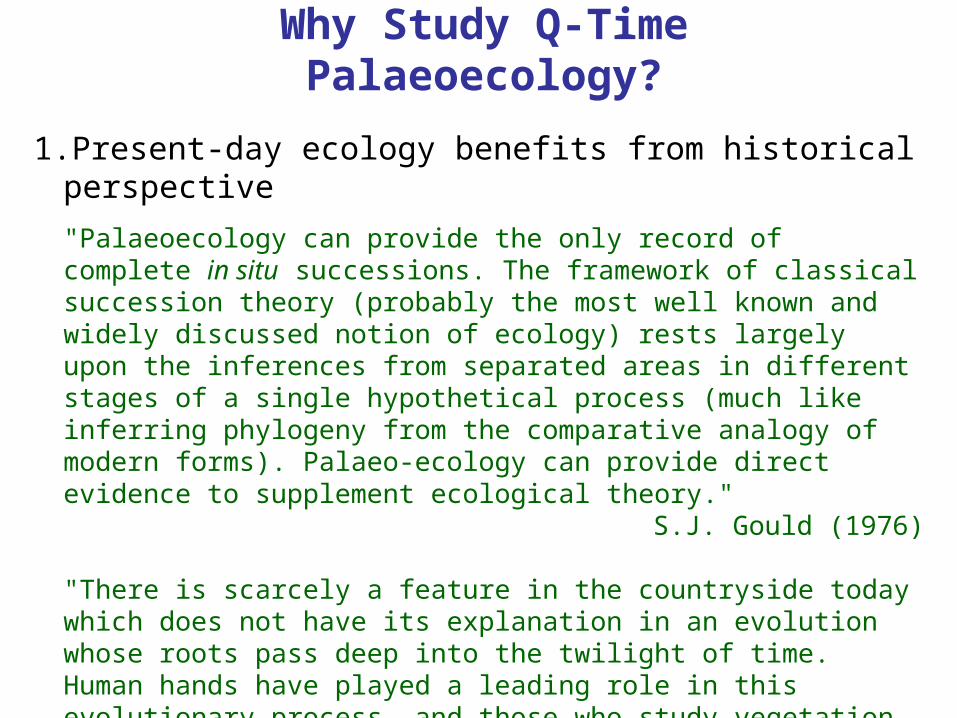
1.Present-day ecology benefits from historical perspective"Palaeoecology can provide the only record of complete in situ successions. The framework of classical succession theory (probably the most well known and widely discussed notion of ecology) rests largely upon the inferences from separated areas in different stages of a single hypothetical process (much like inferring phylogeny from the comparative analogy of modern forms). Palaeo-ecology can provide direct evidence to supplement ecological theory."
S.J. Gould (1976)
"There is scarcely a feature in the countryside today which does not have its explanation in an evolution whose roots pass deep into the twilight of time. Human hands have played a leading role in this evolutionary process, and those who study vegetation cannot afford to neglect history."
C.D. Pigott (1978)

2. Past analogue for future3. Intellectual challenge and desire to
understand our past4. Reconstructions of past environment
important to evaluate extent of natural variability
5. ‘Coaxing history to conduct experiments’6. Provides a long-term ecological observatory or
‘natural laboratory’ in which biotic response can be studied
7. Fun!
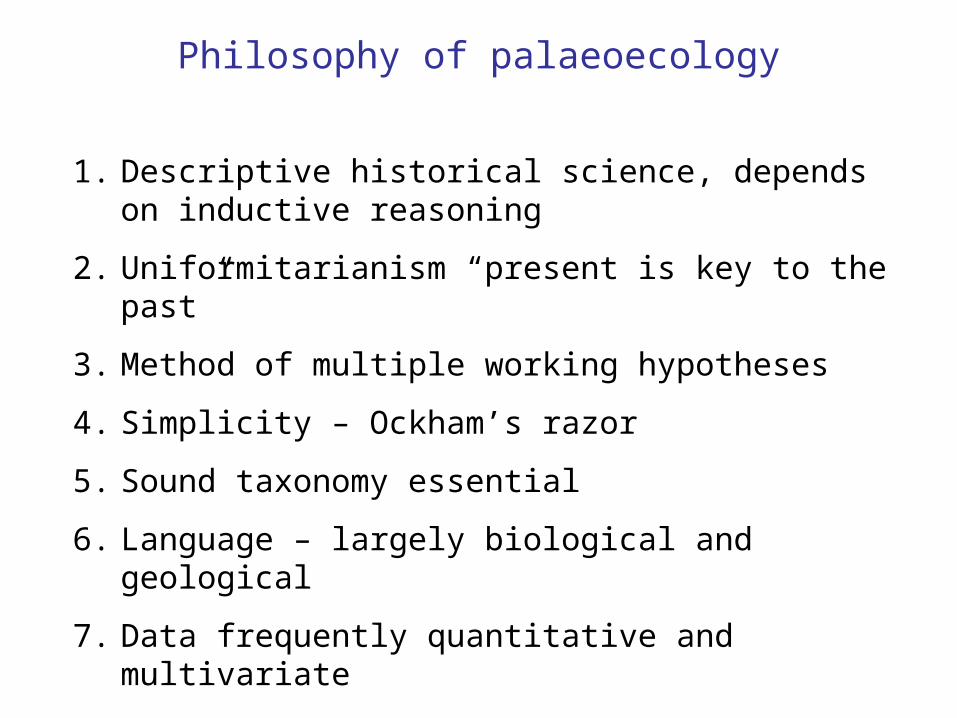
Philosophy of palaeoecology
1. Descriptive historical science, depends on inductive reasoning
2. Uniformitarianism “present is key to the past”3. Method of multiple working hypotheses4. Simplicity – Ockham’s razor5. Sound taxonomy essential6. Language – largely biological and geological7. Data frequently quantitative and multivariate
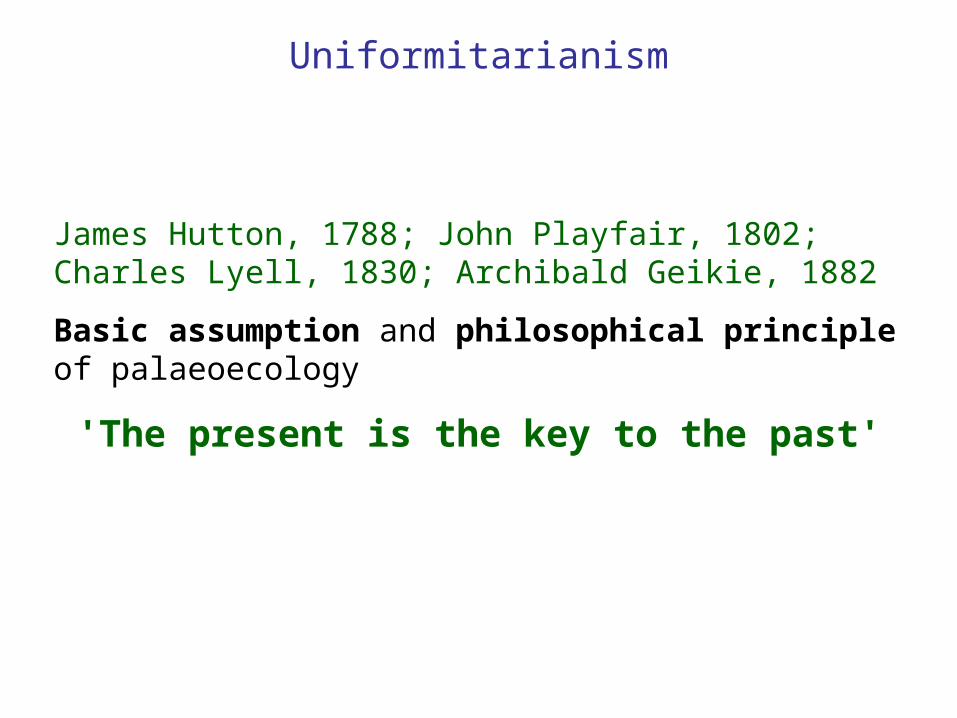
Uniformitarianism
James Hutton, 1788; John Playfair, 1802; Charles Lyell, 1830; Archibald Geikie, 1882Basic assumption and philosophical principle of palaeoecology
'The present is the key to the past'

Charles Lyell (1797-1875) Scottish geologist and also botanistPrinciples of Geology (1830-33)Presented idea of uniformitarianism to propose that processes at work today have operated over the immense span of geological time but that the rates may have changed
Archibald Geikie (1835-1924) Scottish geologistCoined the phrase“The present is the key to the past”
Important to distinguish between substantive uniformitarianism (rates of processes are invariant) and methodological uniformitarianism (processes are invariant).
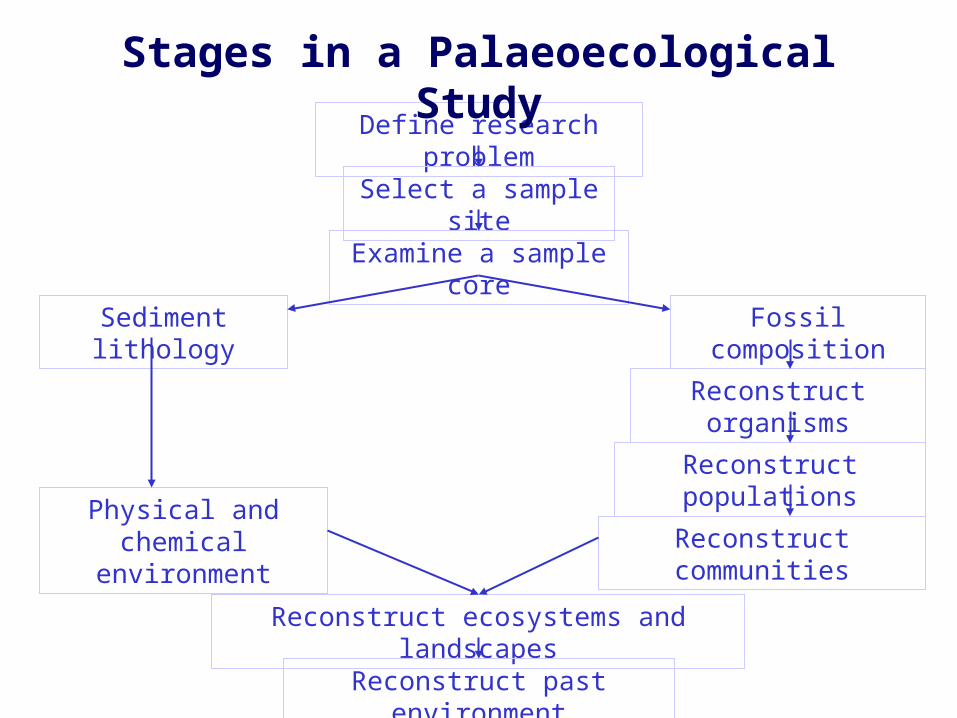
Define research problem
Select a sample site
Examine a sample core
Fossil composition
Reconstruct organisms
Reconstruct populations
Reconstruct communities
Sediment lithology
Physical and chemical
environmentReconstruct ecosystems and
landscapesReconstruct past
environment
Stages in a Palaeoecological Study

Important chronological terms
Quaternary – last 2.7 million yearsHolocene - ‘post-glacial’, last 11,700 cal yearsLate-glacial - transition between last glacial stage
(Weichselian) and Holoceneconsists of- Younger Dryas/Holocene boundary (YD/H) 11,700 cal yr BP- Younger Dryas stadial cold phase 12,700-11,700 cal yr BP- Allerød-Bølling interstadial temperate phase 15,000-12,700 cal yr BP
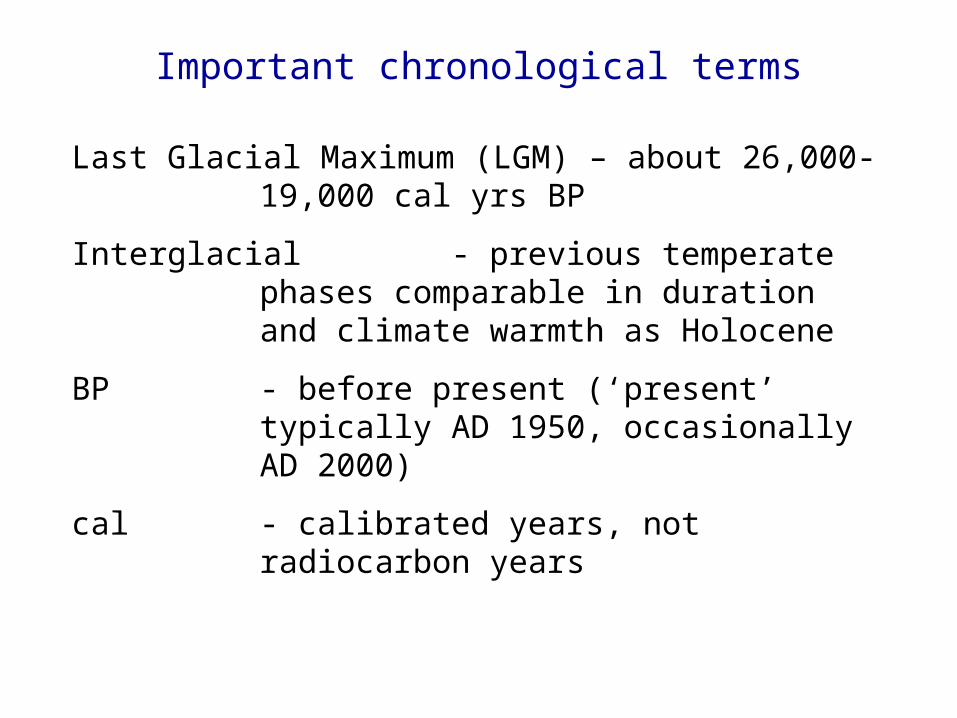
Important chronological terms
Last Glacial Maximum (LGM) – about 26,000-19,000 cal yrs BP
Interglacial - previous temperate phases comparable in duration and climate warmth as Holocene
BP - before present (‘present’ typically AD 1950, occasionally AD 2000)
cal - calibrated years, not radiocarbon years

How do we do a Q-Time Palaeoecological Study?
1. Set the question – aim of the work
2. Choose site(s)

3. Obtain sediment cores
Lake coring from open water
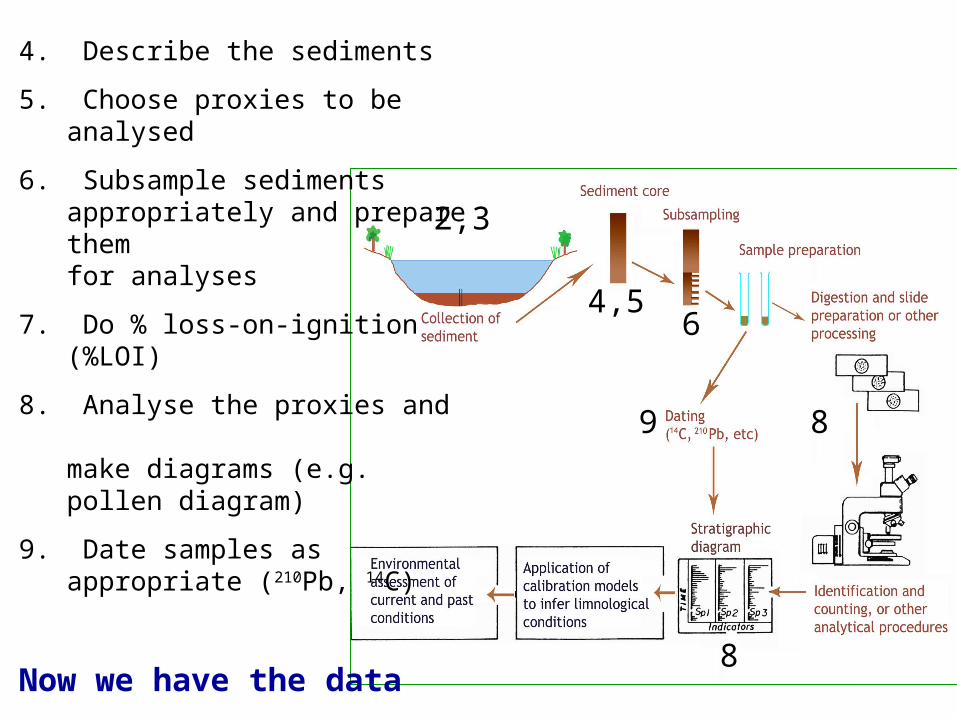
4. Describe the sediments5. Choose proxies to be analysed6. Subsample sediments
appropriately and prepare them
for analyses7. Do % loss-on-ignition
(%LOI)8. Analyse the proxies and
make diagrams (e.g. pollen diagram)
9. Date samples as appropriate (210Pb, 14C)
Now we have the data
2,3
4,56
8
8
9
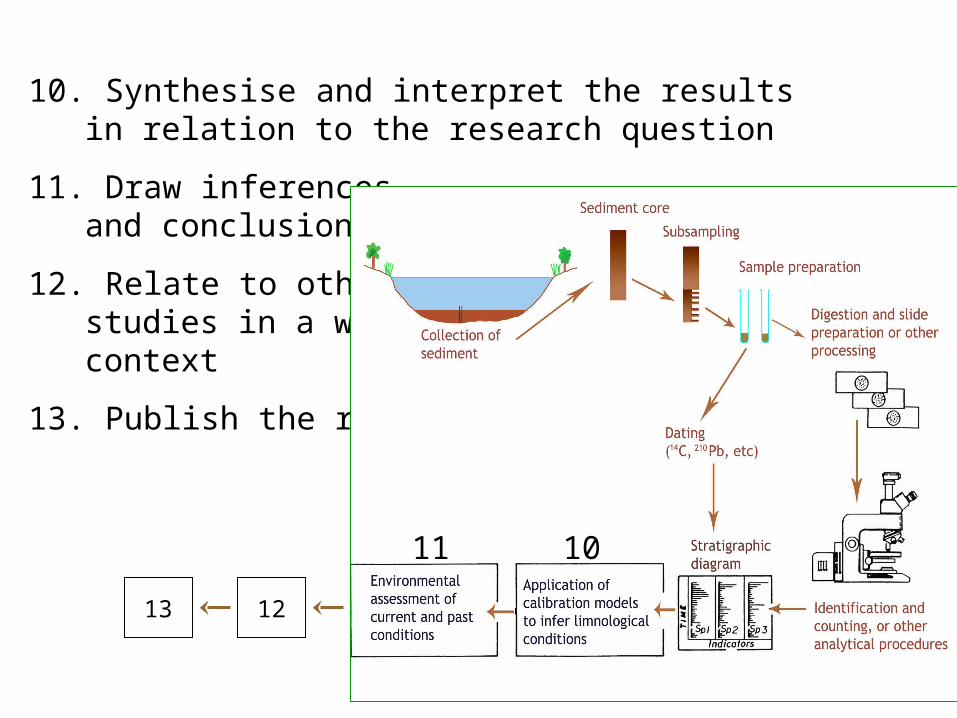
10. Synthesise and interpret the results in relation to the research question
11. Draw inferences and conclusions
12. Relate to other studies in a wider context
13. Publish the results
1213
1011
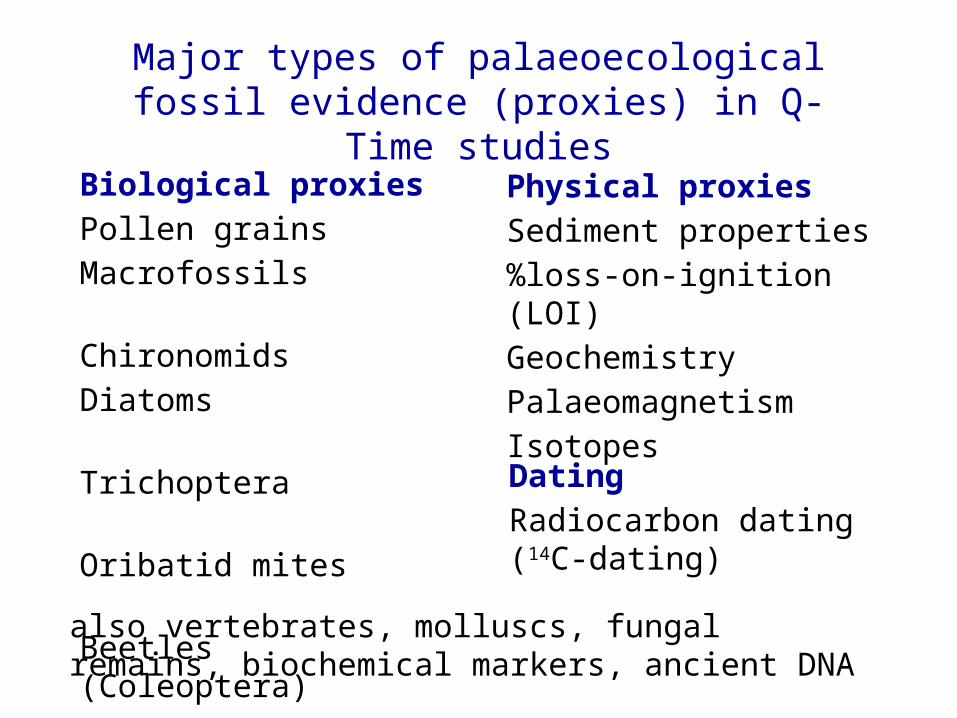
Biological proxies Pollen grains Macrofossils Chironomids Diatoms Trichoptera Oribatid mites Beetles (Coleoptera) Cladocera
Major types of palaeoecological fossil evidence (proxies) in Q-Time studies
Physical proxiesSediment properties %loss-on-ignition (LOI) Geochemistry Palaeomagnetism Isotopes
DatingRadiocarbon dating (14C-dating)
also vertebrates, molluscs, fungal remains, biochemical markers, ancient DNA

Proxies most relevant to this lecture are
• Pollen grains and spores of vascular plants• Macrofossils (seeds, fruits, leaves, etc.) of
vascular plants and mossesProvide evidence of past occurrences, past populations, past communities, past ecosystems and landscapes, and past environments. Biotic proxies and responses• Chironomid head-capsules (non-biting midges)Provide good ‘proxy’ for past summer temperature. Environmental predictor
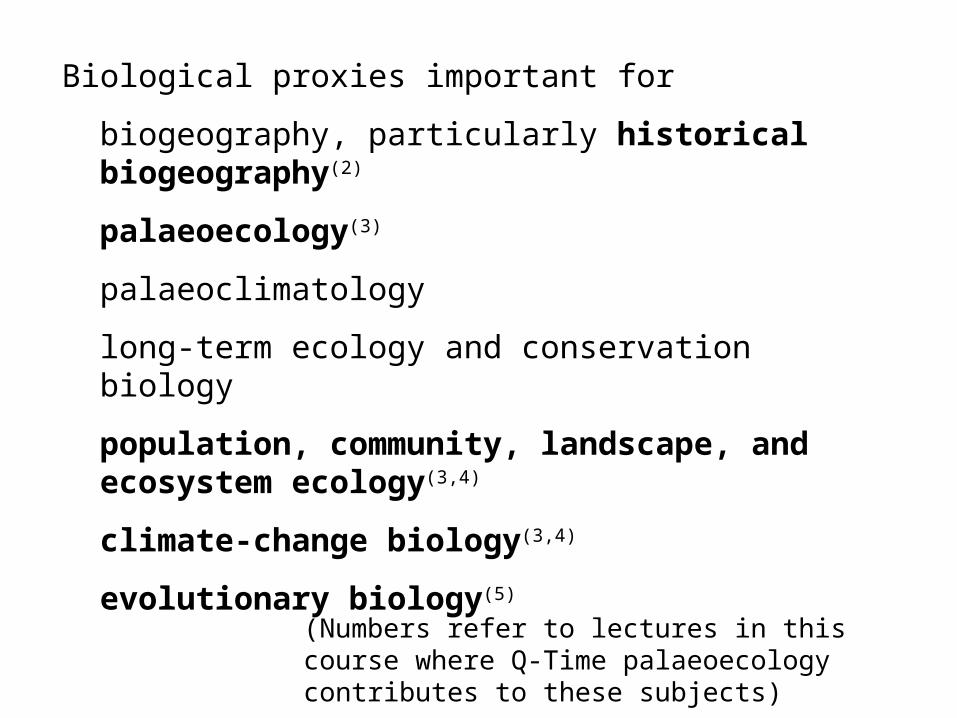
Biological proxies important for biogeography, particularly historical biogeography(2) palaeoecology(3)
palaeoclimatologylong-term ecology and conservation biology population, community, landscape, and ecosystem ecology(3,4)
climate-change biology(3,4) evolutionary biology(5)
(Numbers refer to lectures in this course where Q-Time palaeoecology contributes to these subjects)
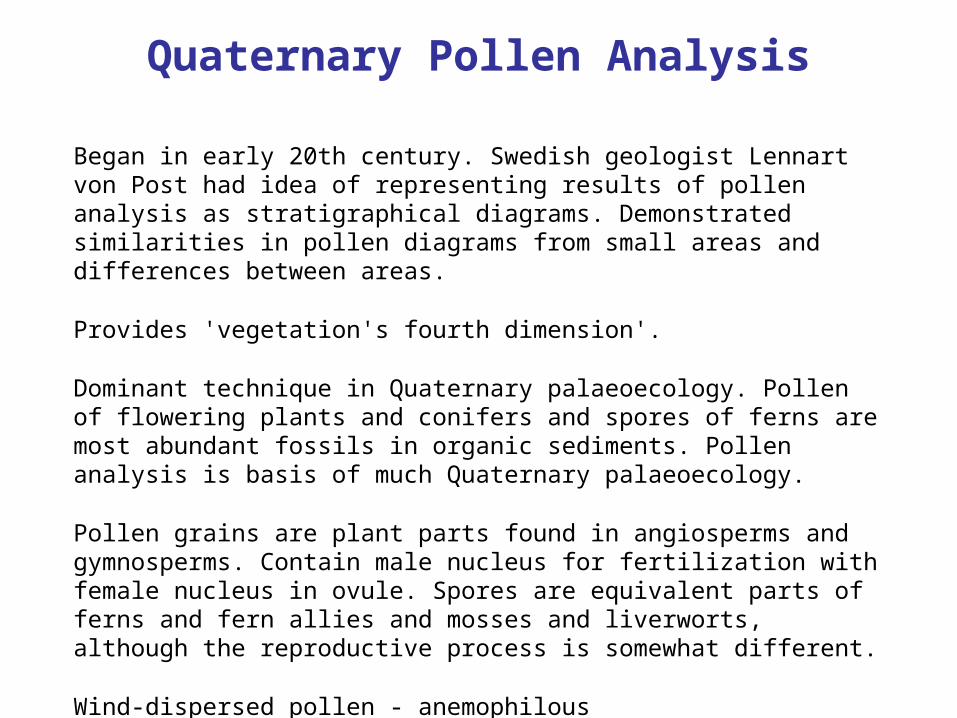
Quaternary Pollen Analysis
Began in early 20th century. Swedish geologist Lennart von Post had idea of representing results of pollen analysis as stratigraphical diagrams. Demonstrated similarities in pollen diagrams from small areas and differences between areas.
Provides 'vegetation's fourth dimension'.
Dominant technique in Quaternary palaeoecology. Pollen of flowering plants and conifers and spores of ferns are most abundant fossils in organic sediments. Pollen analysis is basis of much Quaternary palaeoecology.
Pollen grains are plant parts found in angiosperms and gymnosperms. Contain male nucleus for fertilization with female nucleus in ovule. Spores are equivalent parts of ferns and fern allies and mosses and liverworts, although the reproductive process is somewhat different.
Wind-dispersed pollen - anemophilousInsect-dispersed pollen - entomophilous
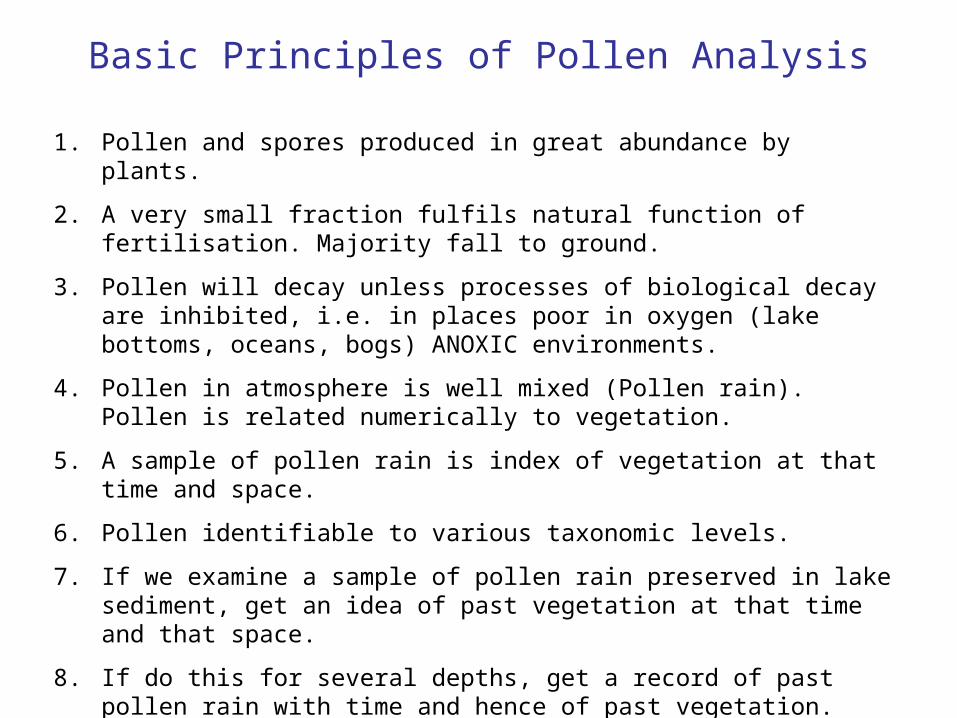
Basic Principles of Pollen Analysis
1. Pollen and spores produced in great abundance by plants. 2. A very small fraction fulfils natural function of fertilisation.
Majority fall to ground. 3. Pollen will decay unless processes of biological decay are
inhibited, i.e. in places poor in oxygen (lake bottoms, oceans, bogs) ANOXIC environments.
4. Pollen in atmosphere is well mixed (Pollen rain). Pollen is related numerically to vegetation.
5. A sample of pollen rain is index of vegetation at that time and space.
6. Pollen identifiable to various taxonomic levels. 7. If we examine a sample of pollen rain preserved in lake sediment,
get an idea of past vegetation at that time and that space. 8. If do this for several depths, get a record of past pollen rain with
time and hence of past vegetation. 9. If we study several sites, can study variation in pollen rain and
hence vegetation in time and space.
Pollen Analysis
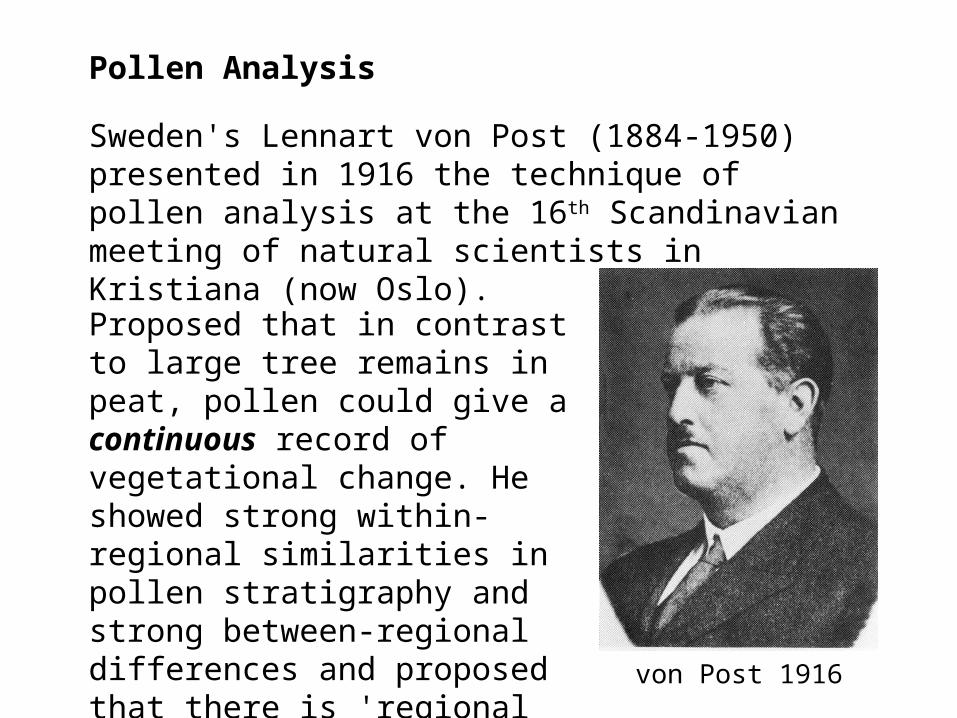
Sweden's Lennart von Post (1884-1950) presented in 1916 the technique of pollen analysis at the 16th Scandinavian meeting of natural scientists in Kristiana (now Oslo).
Proposed that in contrast to large tree remains in peat, pollen could give a continuous record of vegetational change. He showed strong within-regional similarities in pollen stratigraphy and strong between-regional differences and proposed that there is 'regional parallelism'.
von Post 1916
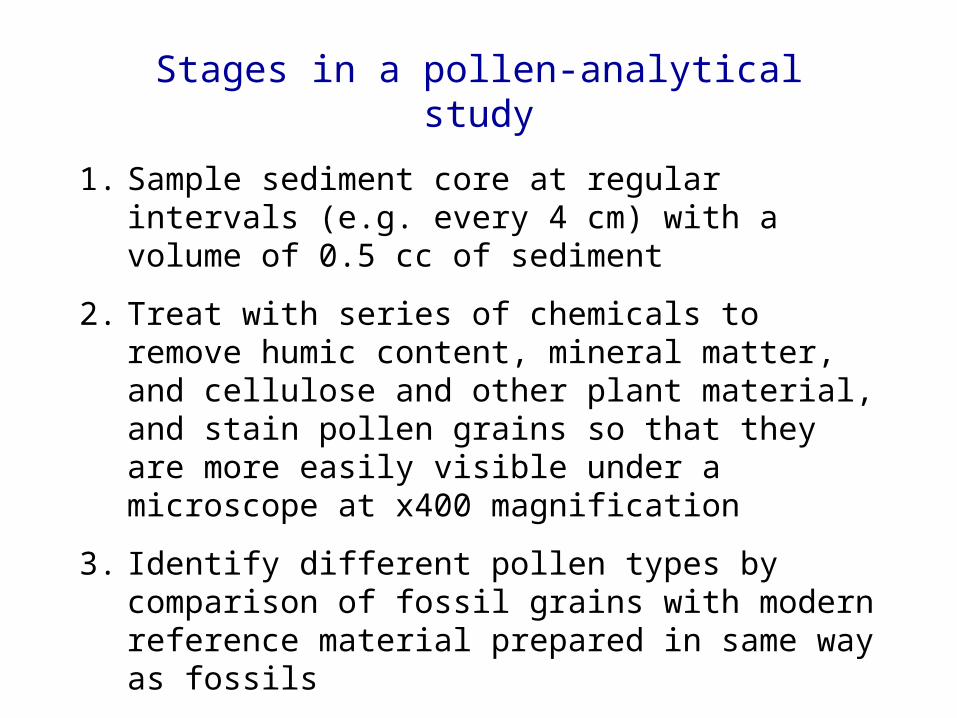
Stages in a pollen-analytical study
1. Sample sediment core at regular intervals (e.g. every 4 cm) with a volume of 0.5 cc of sediment
2. Treat with series of chemicals to remove humic content, mineral matter, and cellulose and other plant material, and stain pollen grains so that they are more easily visible under a microscope at x400 magnification
3. Identify different pollen types by comparison of fossil grains with modern reference material prepared in same way as fossils
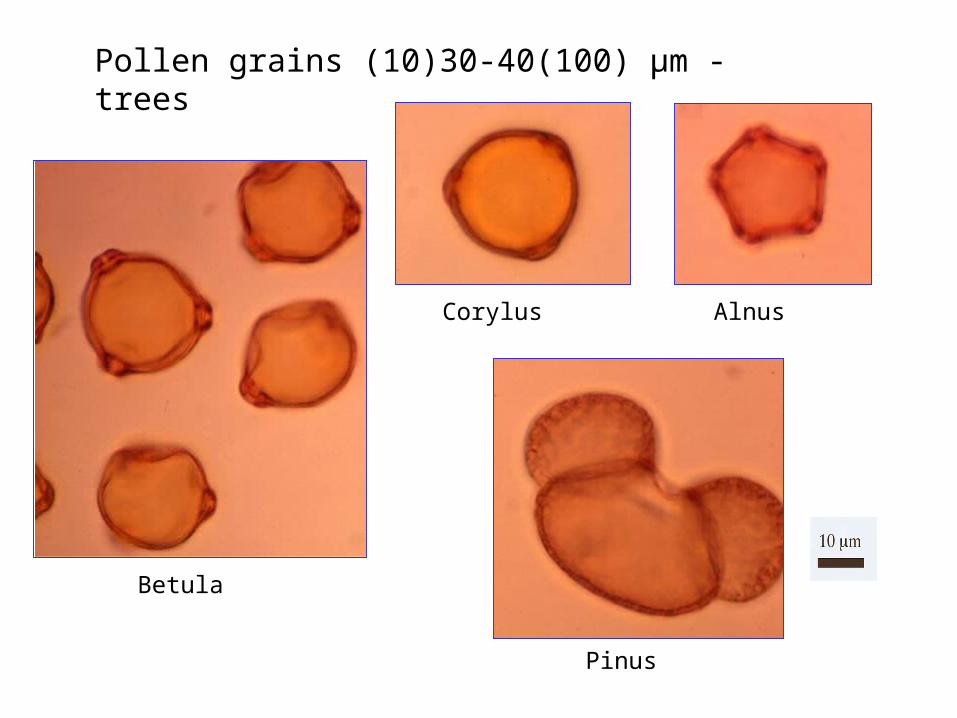
Betula
Corylus Alnus
Pinus
Pollen grains (10)30-40(100) μm - trees
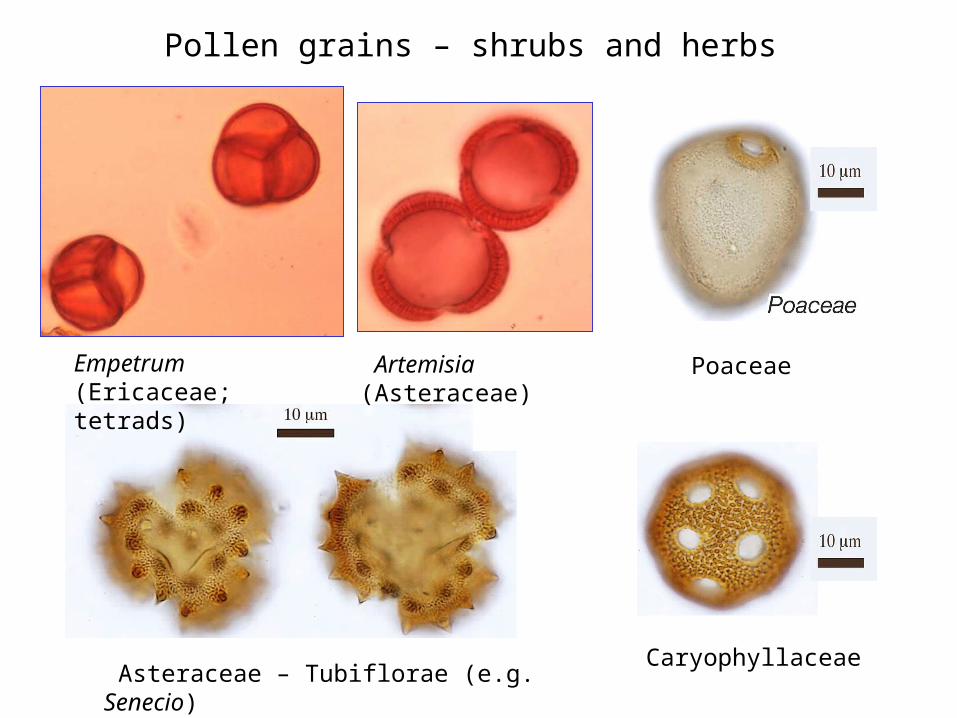
Empetrum (Ericaceae; tetrads)
Artemisia (Asteraceae)
Poaceae
Asteraceae – Tubiflorae (e.g. Senecio)
Caryophyllaceae
Pollen grains – shrubs and herbs
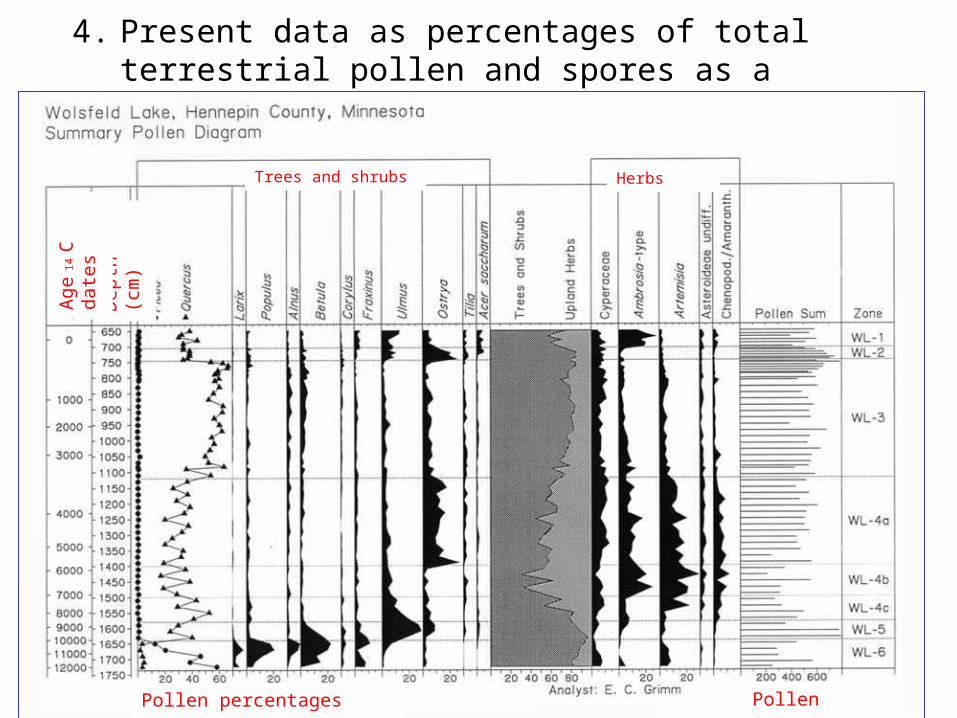
4. Present data as percentages of total terrestrial pollen and spores as a stratigraphical pollen diagram
Dep
th (c
m)
Pollen percentages Pollen sum
Trees and shrubs Herbs
Age
14C
da
tes

5. InterpretationPollen originates from flowering plants and gymnospermsTransported by wind, insects, other animals, waterRelated to the vegetation at different scales
Scale is regional for abundantly produced and well- dispersed pollen (regional pollen rain)
Scale is more local for less-well dispersed pollenReflects vegetation changes through time, shown in a pollen diagramPollen assemblages from a lake of about 500-750 m diameter reflects the distance weighted abundance of plants in about a 1 km radius of the lakePredominantly a regional landscape record

5. Interpretation (continued)Can be in terms of past flora, past populations, past communities, past ecosystems, past landscapes, or past environmentDepends on the original research questionsSee examples of different types of interpretation in this lecture and in the later lectures
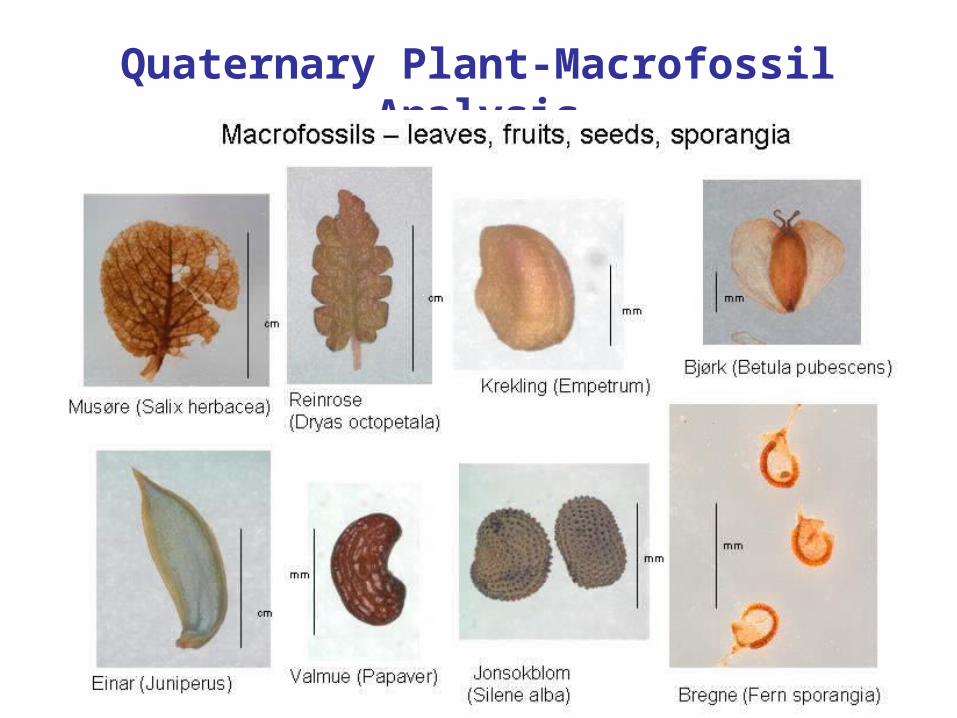
Quaternary Plant-Macrofossil Analysis

Methodology – simpleWash out known volume (25-50 cm3) of sediment through 125 μm sieve. Transfer residue to storage bottle. Keep cool.Suspend residue in 2-3 mm water in small dish and examine systematically under a stereo microscope. Identify fossils by comparison with modern reference material.
Parts larger than 0.5 mm (very large tree-trunks to very small seeds)Derived from all parts of plants. Most often identified are seeds, fruits, and leavesUsually they are locally derivedReflect: species that are present (good identification)
local vegetation, both aquatic and terrestrial

Comparison of pollen and macrofossils
Pollen MacrofossilsConcentration (No. ml-1)
X 105 X 100
Spatial resolution Low, mostly regional source
High, local source
Taxon resolution Genus or family, rarely species
Usually species
Usefulness Regional vegetation Local flora and vegetation
Factors affecting abundance
Production, vegetation cover, preservation, transport ability
Preservation, proximity to coring site, basin characters
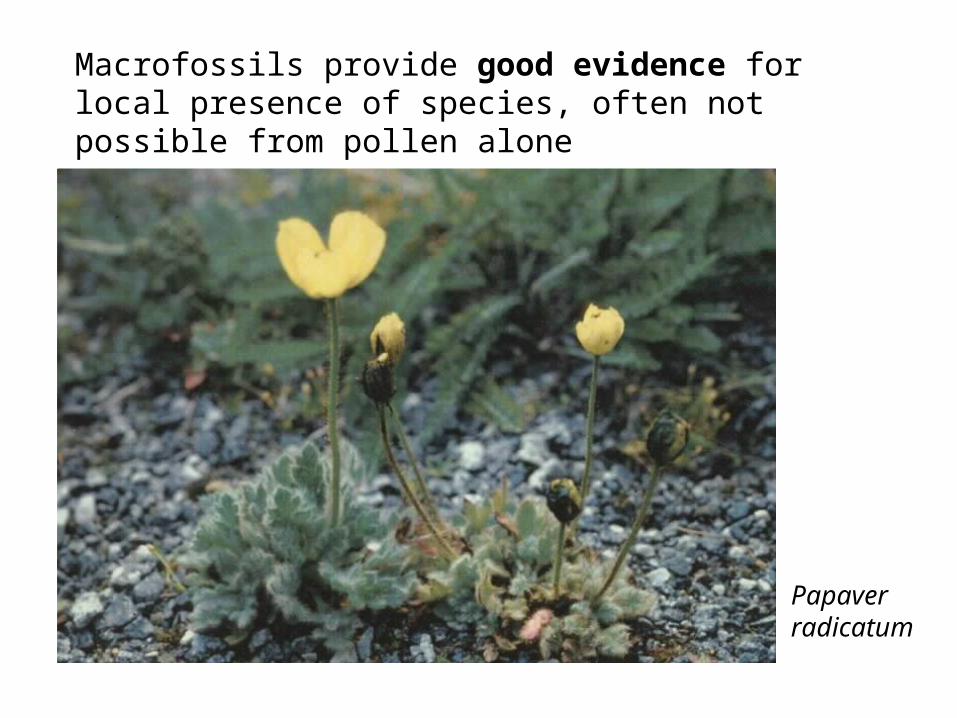
Macrofossils provide good evidence for local presence of species, often not possible from pollen alone
Papaver radicatum

Papaver radicatum agg. = modern distribution, = macrofossil finds (ages x 103 years)
Also provides important evidence of first occurrence of taxa, species identities, and assemblage composition and hence past vegetation.Problems – not all sites are ‘good’ for macrofossils whereas
almost all sites have reliable pollen records not many skilled plant macrofossil analysts world-wideneed good botanical knowledge and extensive modern reference collections
Macrofossils provide ‘The Factual Basis for Phytogeography’ (Godwin 1956)Pollen and macrofossils provide evidence for past flora, vegetation, and landscapes. Most useful when used togetherWhat about the past environment?
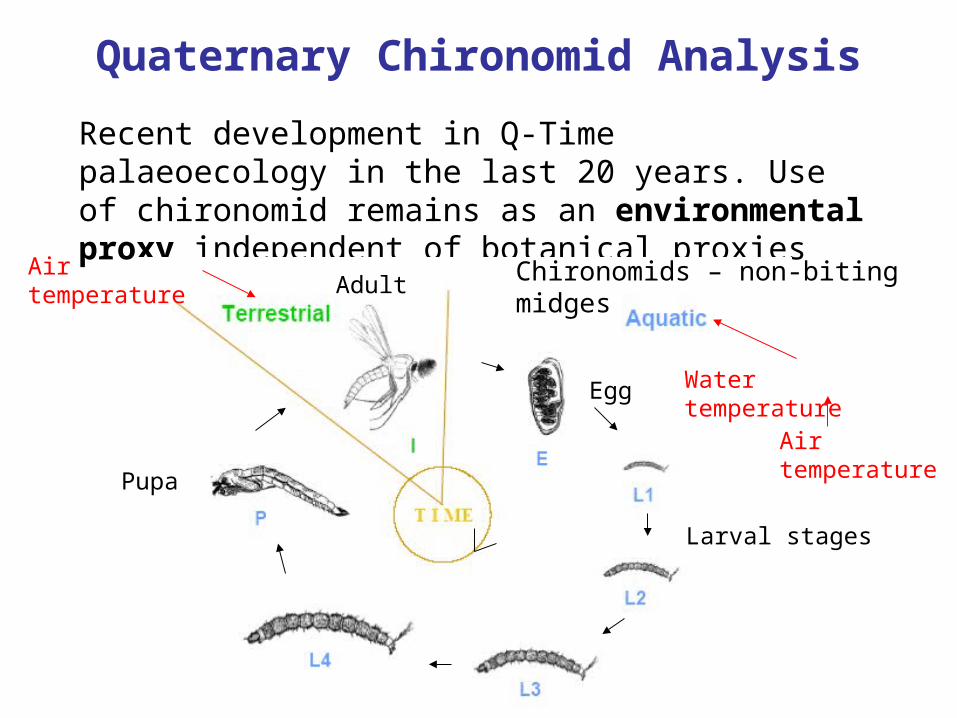
Quaternary Chironomid AnalysisRecent development in Q-Time palaeoecology in the last 20 years. Use of chironomid remains as an environmental proxy independent of botanical proxiesAir temperature
Water temperature
Air temperature
Egg
Larval stages
Pupa
Adult Chironomids – non-biting midges

Chironomid larva
Chitinised head capsule

Tanytarsus gracilentis
Need oxygenated water, Cool oxygenated lakes, Good indicators
Chaetocladius piger
Feed on algae; Need oxygenated water, Cool oligotrophic lakesGood indicators
Fossil chironomid head capsules
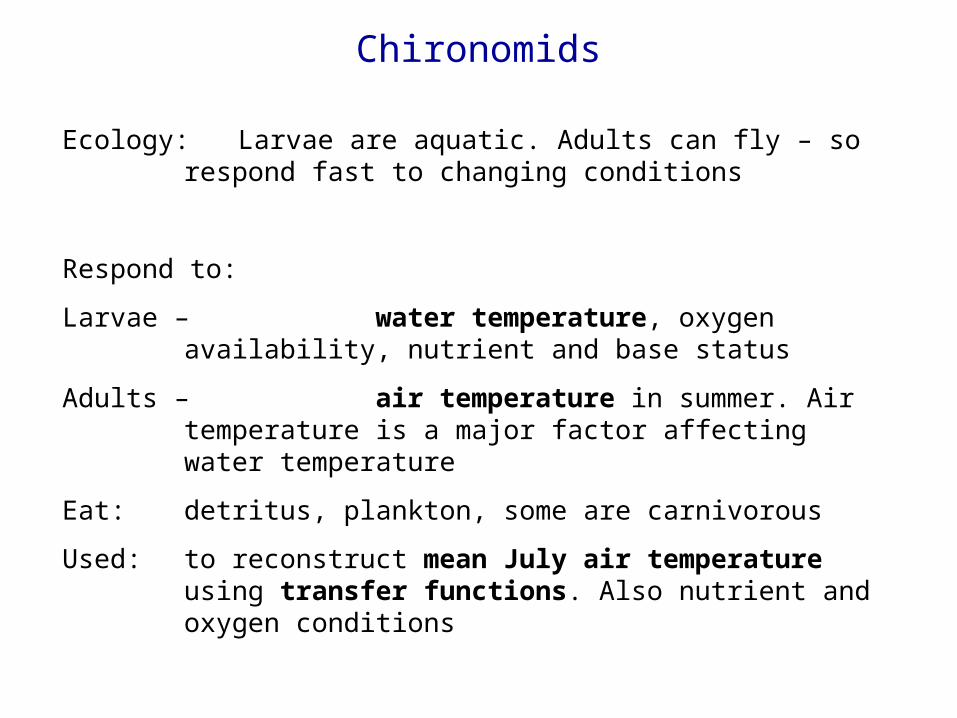
Chironomids
Ecology: Larvae are aquatic. Adults can fly – so respond fast to changing conditions
Respond to: Larvae – water temperature, oxygen availability, nutrient
and base statusAdults – air temperature in summer. Air temperature is a
major factor affecting water temperatureEat: detritus, plankton, some are carnivorousUsed: to reconstruct mean July air temperature using
transfer functions. Also nutrient and oxygen conditions
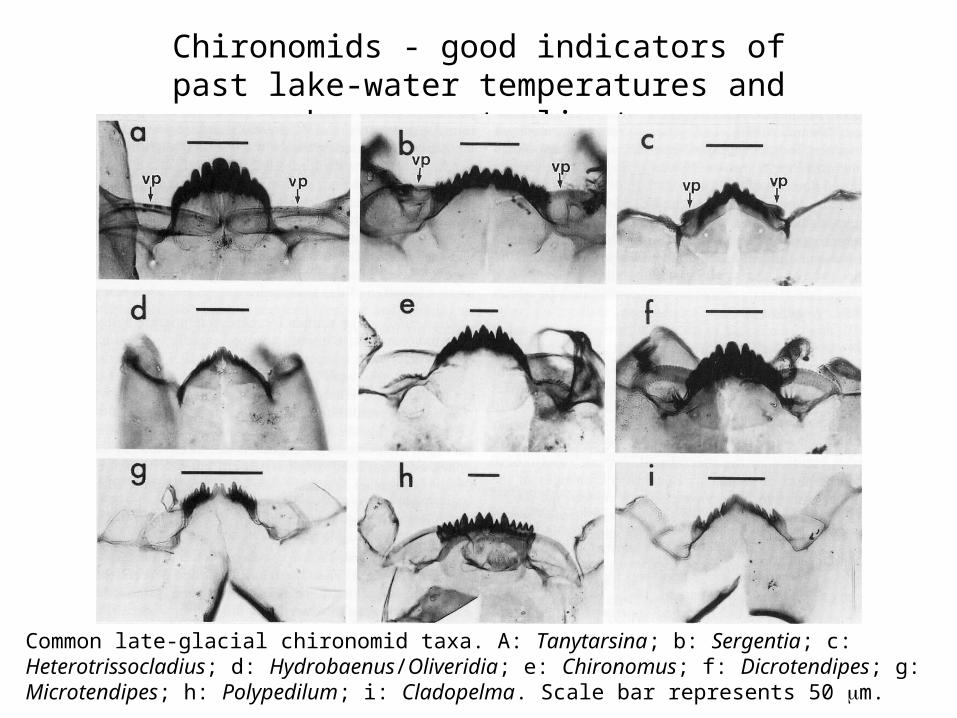
Chironomids - good indicators of past lake-water temperatures and hence past
climate
Common late-glacial chironomid taxa. A: Tanytarsina; b: Sergentia; c: Heterotrissocladius; d: Hydrobaenus/Oliveridia; e: Chironomus; f: Dicrotendipes; g: Microtendipes; h: Polypedilum; i: Cladopelma. Scale bar represents 50 m.
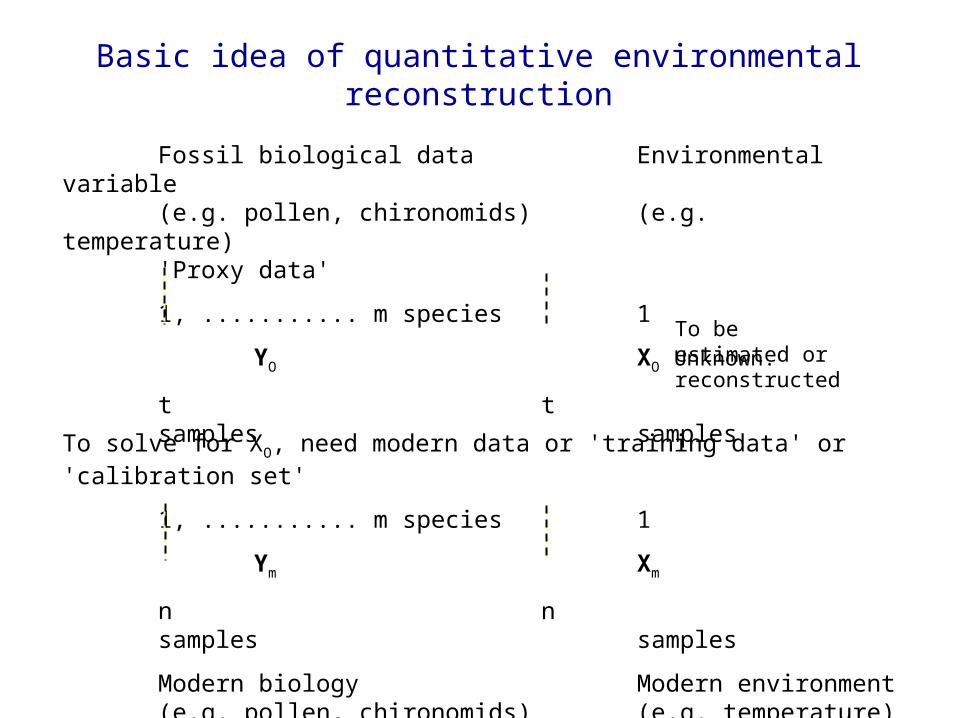
Basic idea of quantitative environmental reconstruction
Fossil biological data Environmental variable(e.g. pollen, chironomids) (e.g. temperature)'Proxy data'1, ........... m species 1
YO XO Unknown.
t tsamples samples
To be estimated or reconstructed
To solve for XO, need modern data or 'training data' or 'calibration set'
1, ........... m species 1Ym Xm
n nsamples samplesModern biology Modern environment(e.g. pollen, chironomids) (e.g. temperature)
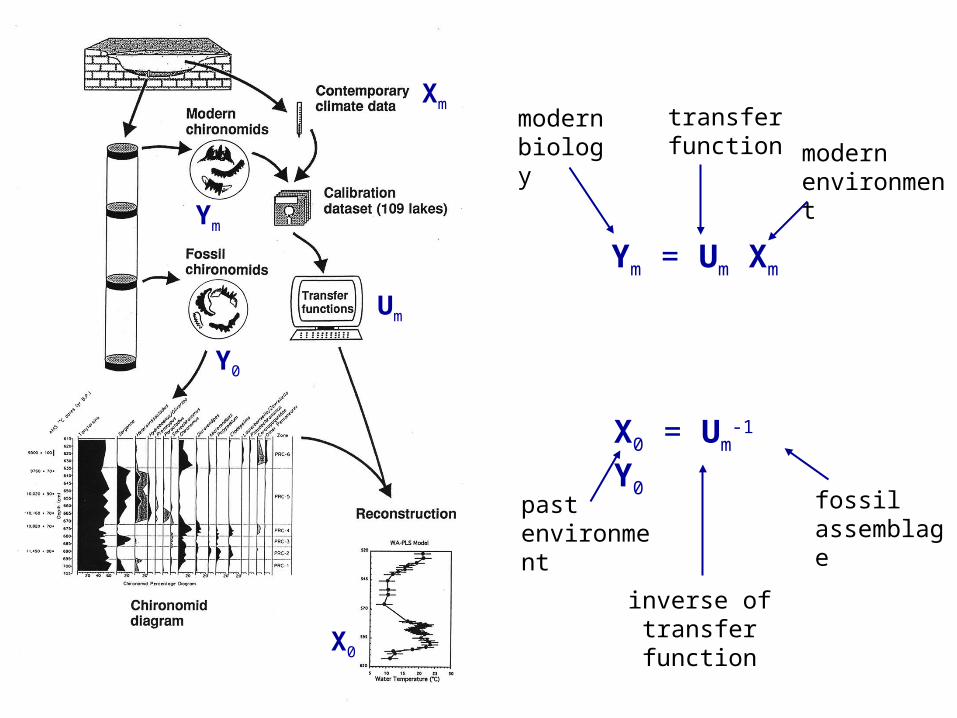
Ym
Y0
Xm
Um
X0
Ym = Um Xm
modern biology
transfer function modern
environment
X0 = Um-1
Y0past environment
inverse of transfer function
fossil assemblage

Late-glacial chironomid temperature reconstructions
Brooks & Birks (2000)
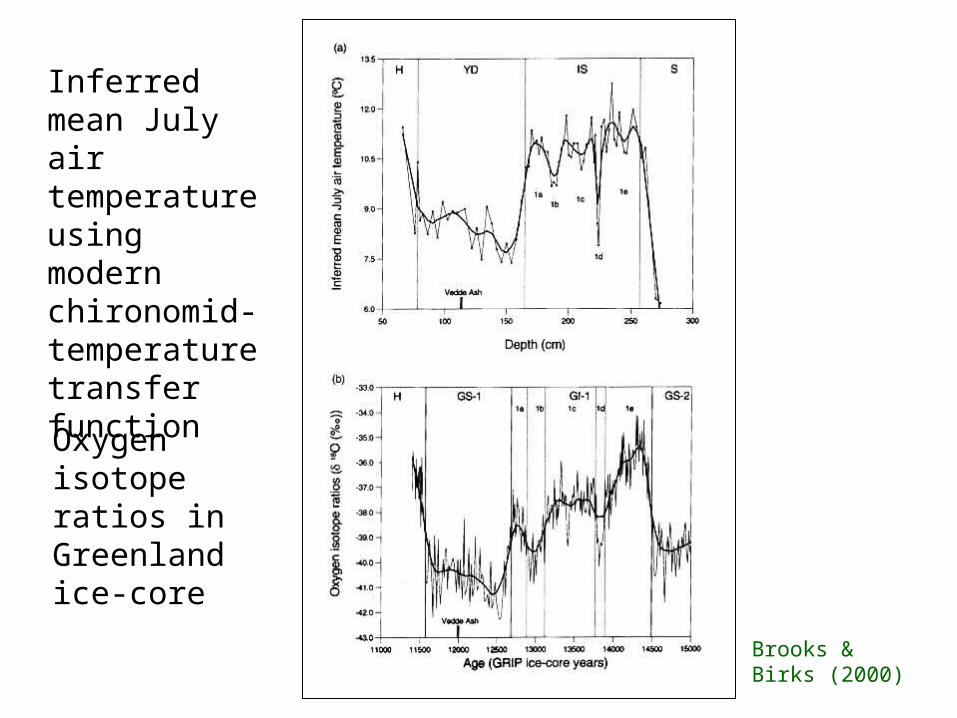
Oxygen isotope ratios in Greenland ice-core
Inferred mean July air temperature using modern chironomid-temperature transfer function
Brooks & Birks (2000)

Chironomid mean July air temperature reconstructions based on 157-lake modern ‘training-set’ across Norway and Svalbard. Prediction error in cross-validation about 1C.Use to provide palaeoenvironmental reconstruction, in this case, mean July air temperature, that is independent of botanical proxies.Thus we have plant ‘responses’ and environmental ‘predictor’. Can now look at long-term biotic responses.

Some Examples of Q-Time Palaeoecological Studies
1. Reconstruction of past vegetation in NW Minnesota using pollen analysis
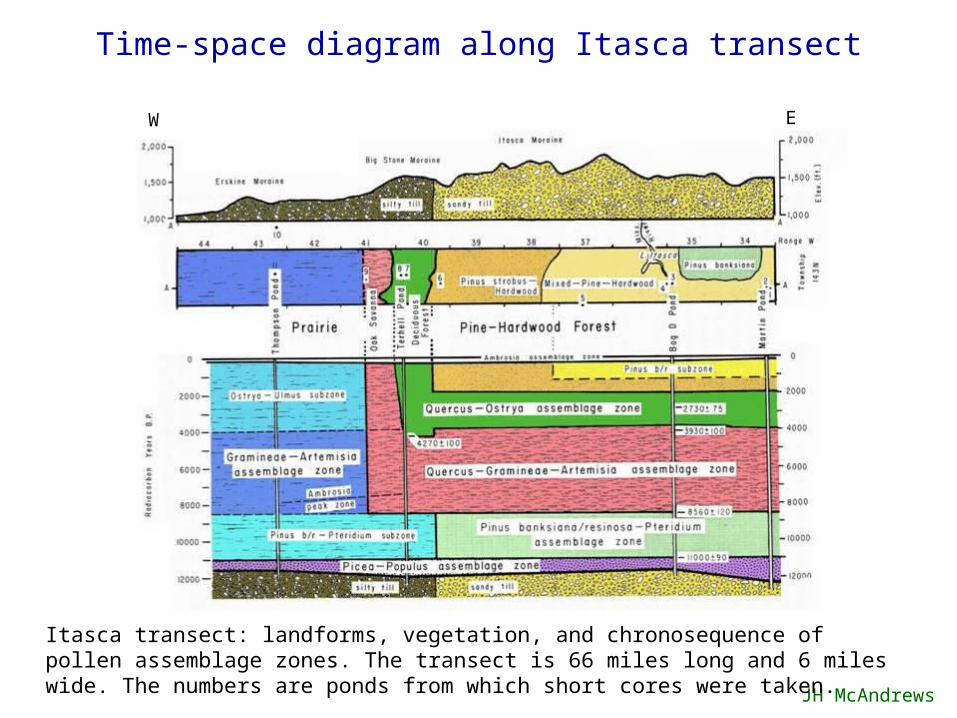
W EItasca transect: landforms, vegetation, and chronosequence of pollen assemblage zones. The transect is 66 miles long and 6 miles wide. The numbers are ponds from which short cores were taken.
JH McAndrews

Lake ItascaPine-hardwood forest
Pinus strobus, Betula papyrifera, Populus tremuloides
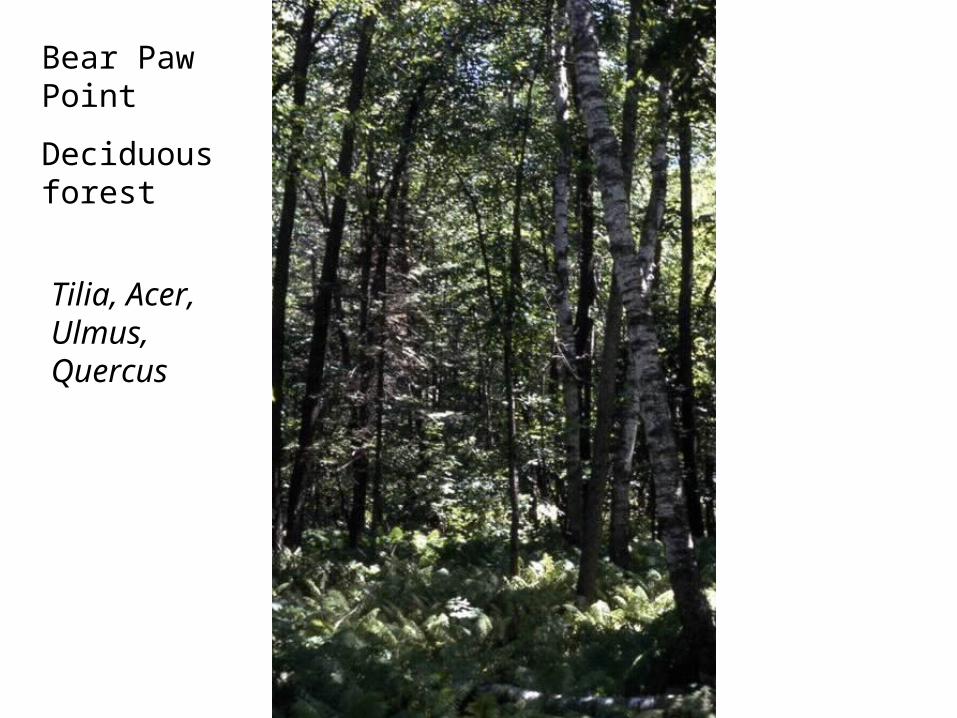
Bear Paw PointDeciduous forest
Tilia, Acer, Ulmus, Quercus
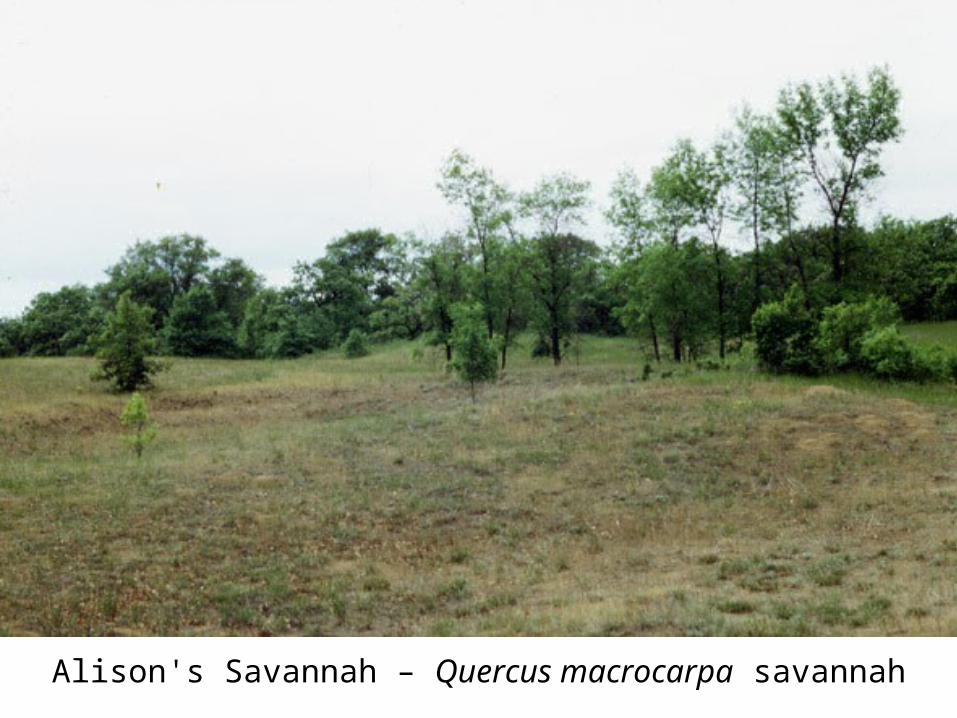
Alison's Savannah – Quercus macrocarpa savannah

Frenchman's Bluff – Prairie Short-grass
Artimisia prairie
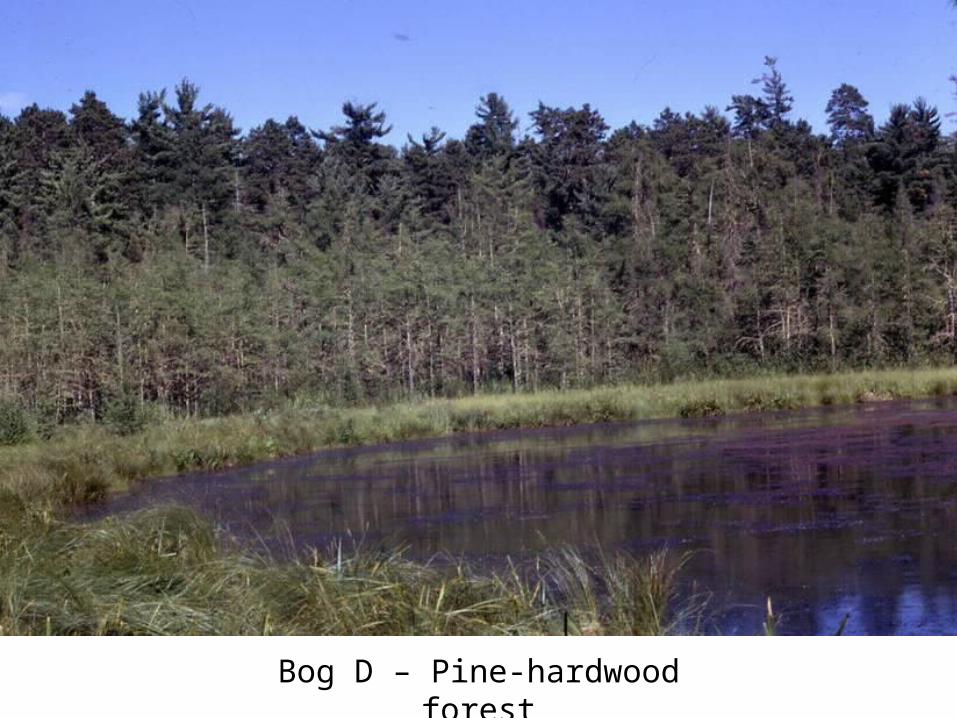
Bog D – Pine-hardwood forest
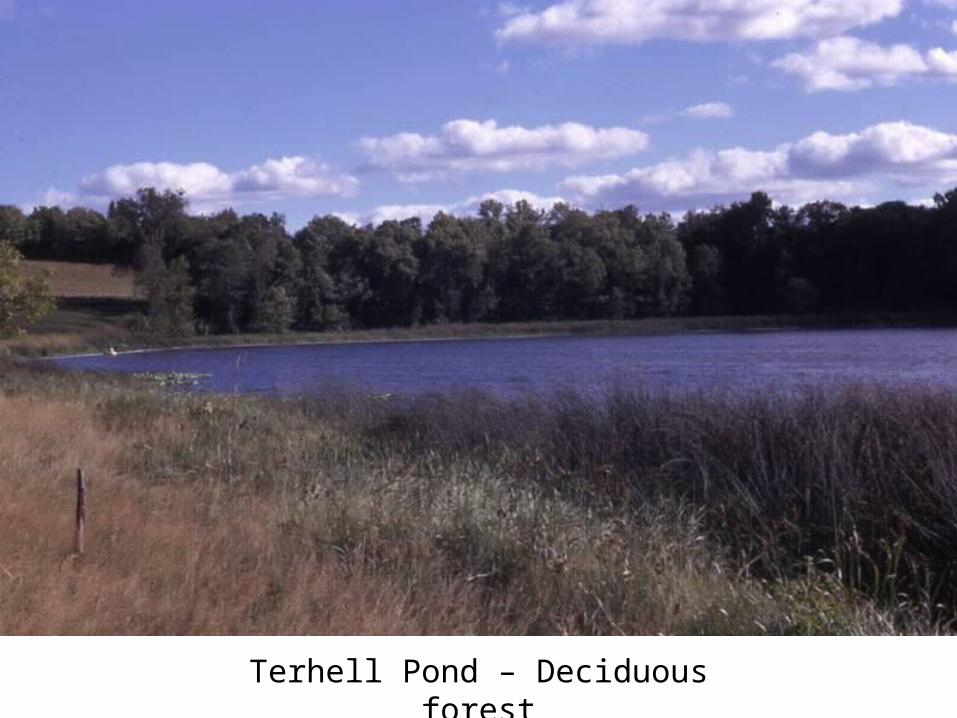
Terhell Pond – Deciduous forest

Thompson Pond - Prairie
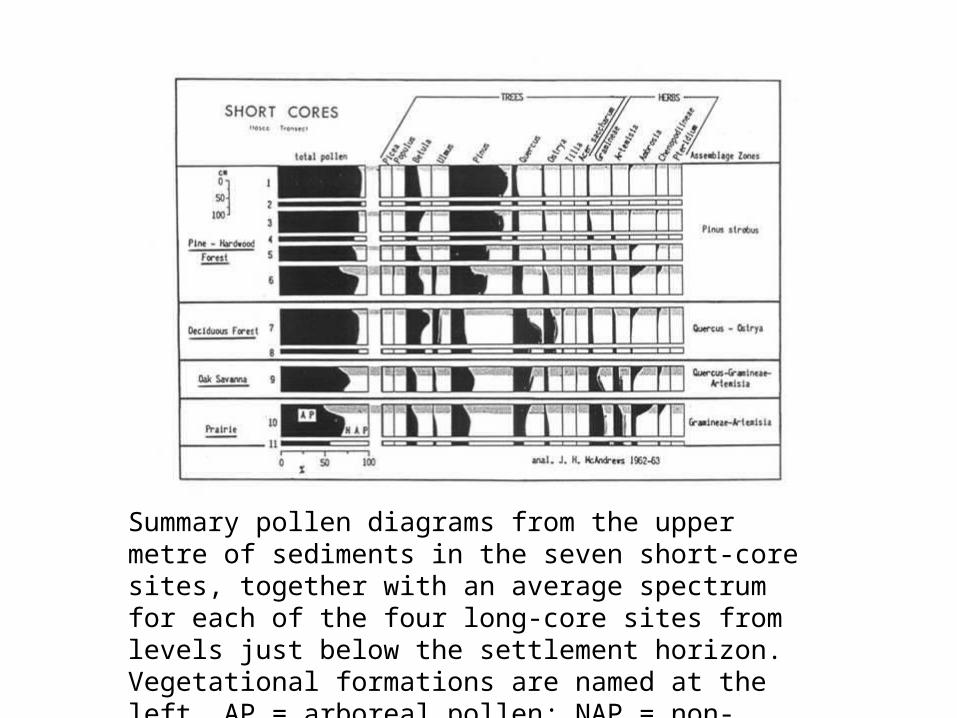
Summary pollen diagrams from the upper metre of sediments in the seven short-core sites, together with an average spectrum for each of the four long-core sites from levels just below the settlement horizon. Vegetational formations are named at the left. AP = arboreal pollen; NAP = non-arboreal pollen.
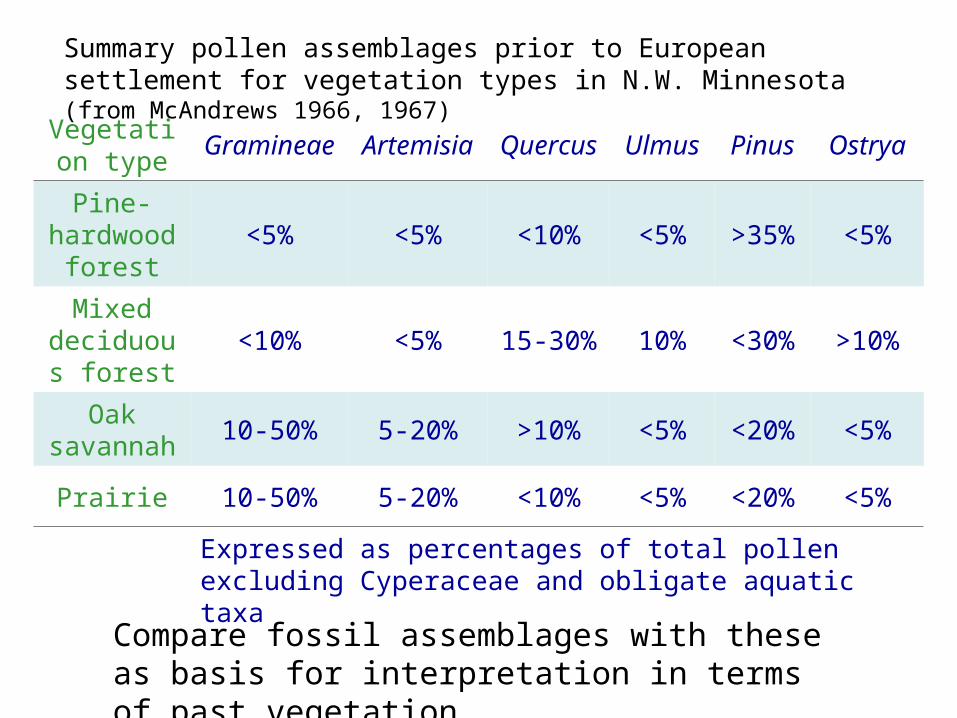
Summary pollen assemblages prior to European settlement for vegetation types in N.W. Minnesota (from McAndrews 1966, 1967)
Vegetation type
Gramineae
Artemisia
Quercus Ulmus Pinus Ostrya
Pine-hardwood
forest<5% <5% <10% <5% >35
% <5%
Mixed deciduous
forest<10% <5% 15-30% 10% <30
% >10%
Oak savannah 10-50% 5-20% >10% <5% <20
% <5%
Prairie 10-50% 5-20% <10% <5% <20% <5%
Expressed as percentages of total pollen excluding Cyperaceae and obligate aquatic taxa
Compare fossil assemblages with these as basis for interpretation in terms of past vegetation
JH McAndrews
Itasca transect: landforms, vegetation, and chronosequence of pollen assemblage zones. The transect is 66 miles long and 6 miles wide. The numbers are ponds from which short cores were taken.
W E
Time-space diagram along Itasca transect
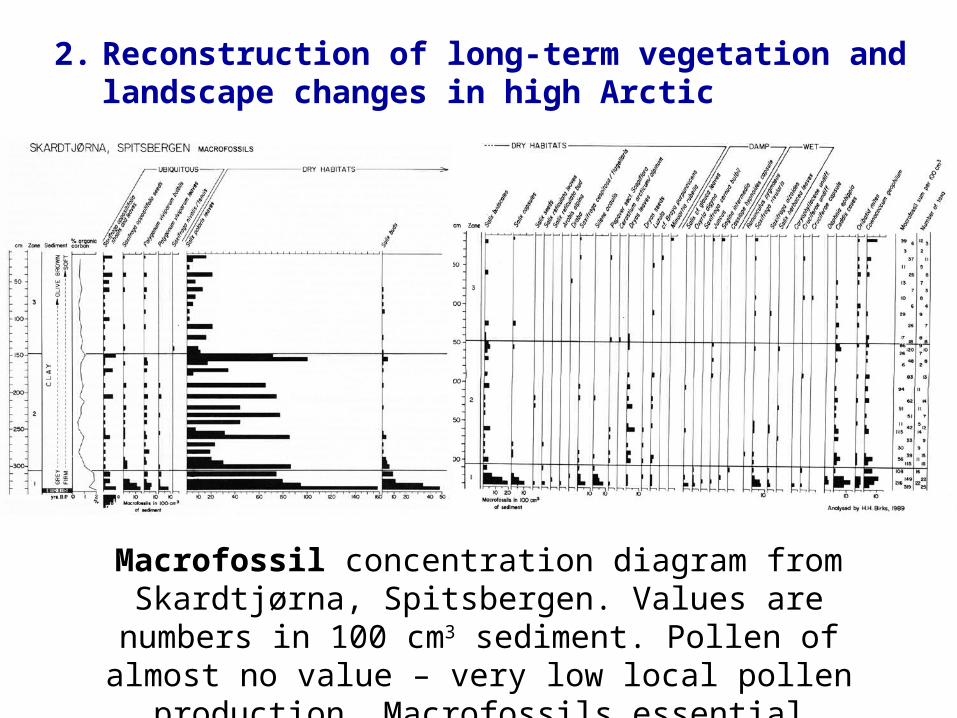
Macrofossil concentration diagram from Skardtjørna, Spitsbergen. Values are numbers in
100 cm3 sediment. Pollen of almost no value – very low local pollen production. Macrofossils essential
2. Reconstruction of long-term vegetation and landscape changes in high Arctic
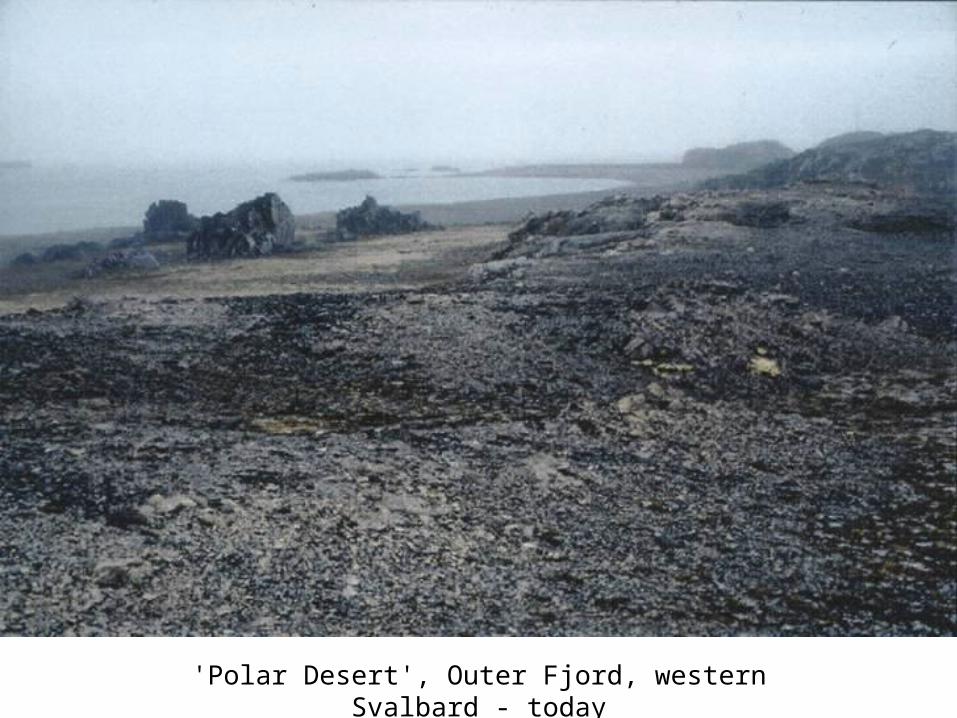
'Polar Desert', Outer Fjord, western Svalbard - today

Middle-arctic, Inner Fjord, western Svalbard – as it may have been in ‘Mid-Holocene Thermal Maximum’ about
5000 yrs ago
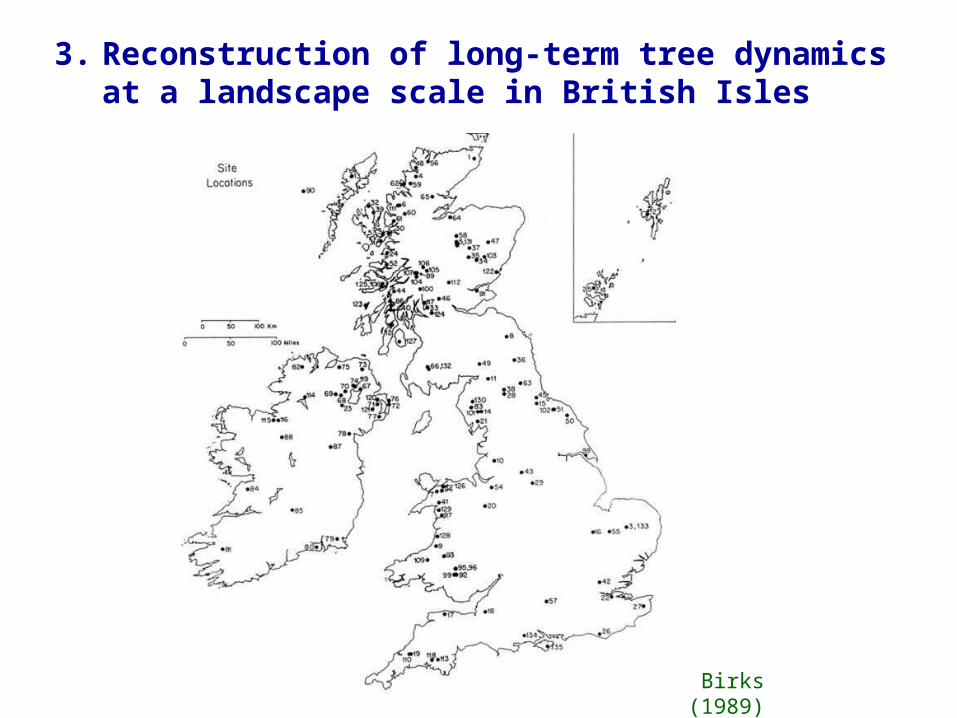
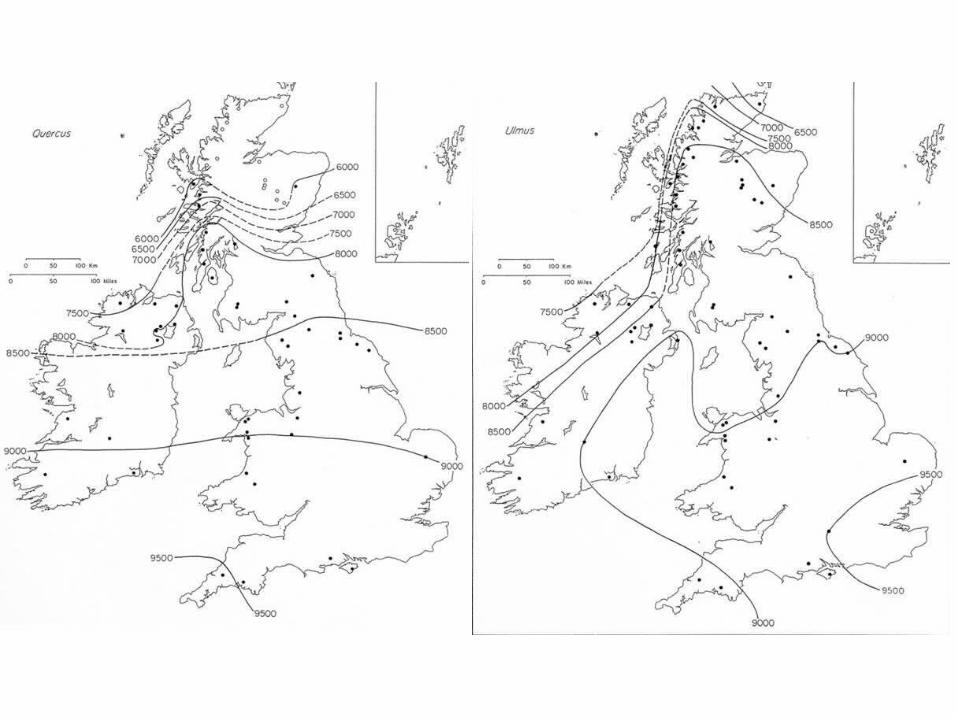
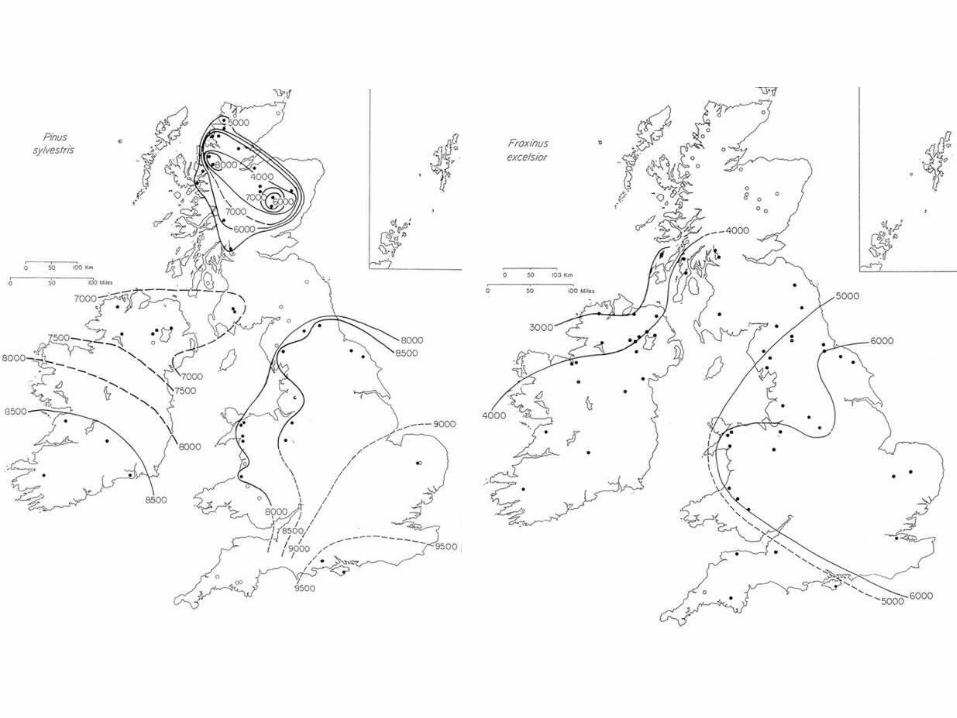
3. Reconstruction of long-term tree dynamics at a landscape scale in British Isles
Birks (1989)
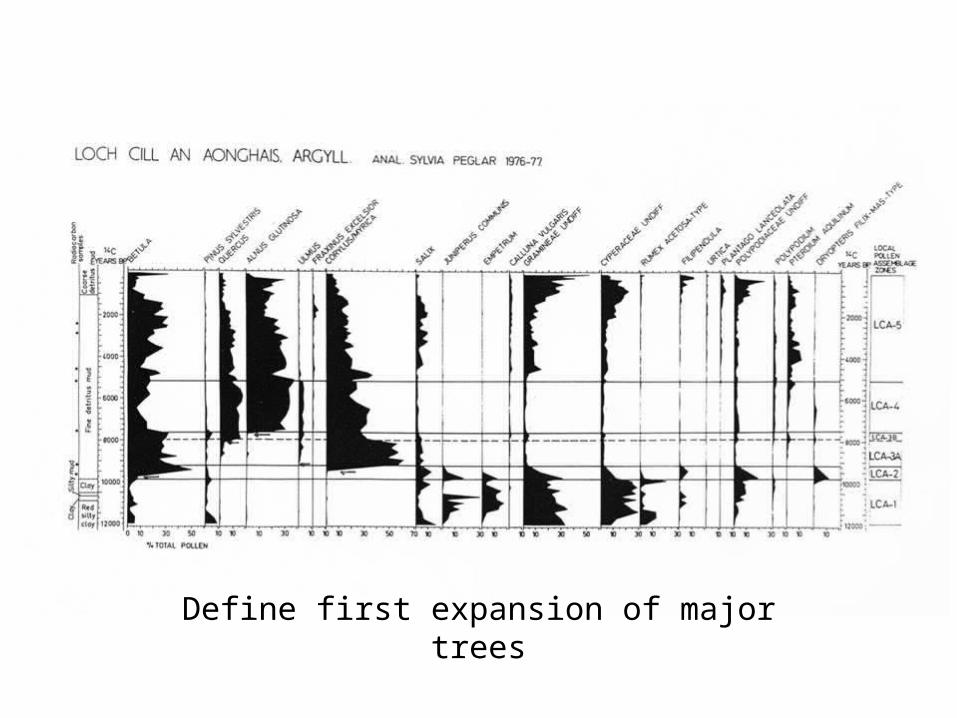
Define first expansion of major trees

Isochrones – times of first expansion in radiocarbon yrs BP

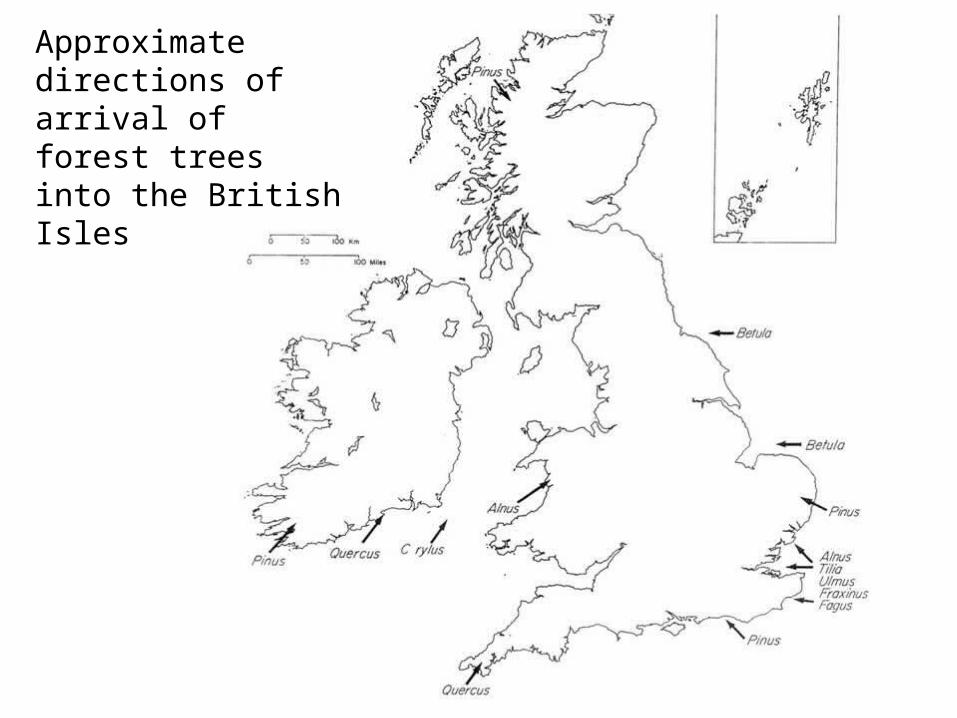
Approximate directions of arrival of forest trees into the British Isles

4.Reconstruction of ecosystem and landscape on Easter Island – Q-Time palaeoecology and Real-Time ecology meet
Easter Island, a remote volcanic island in the Pacific Ocean. Famous for Thor Heyerdahl’s Kon-Tiki expedition and its huge, stone statues or moai (about 800-1000 in number).
Unique amongst tropical Pacific islands in lacking trees over 3 m tall
Flenley & Bahn (2002)
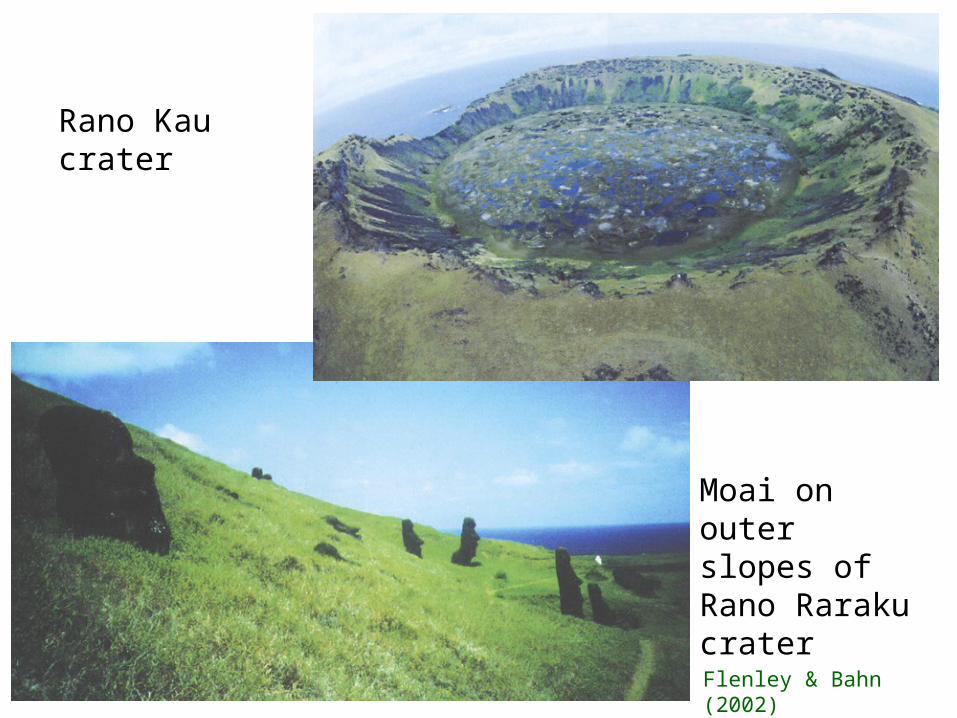
Moai on outer slopes of Rano Raraku crater
Rano Kau crater
Flenley & Bahn (2002)

Colonised by Polynesians about 1700 (~300 AD) years ago
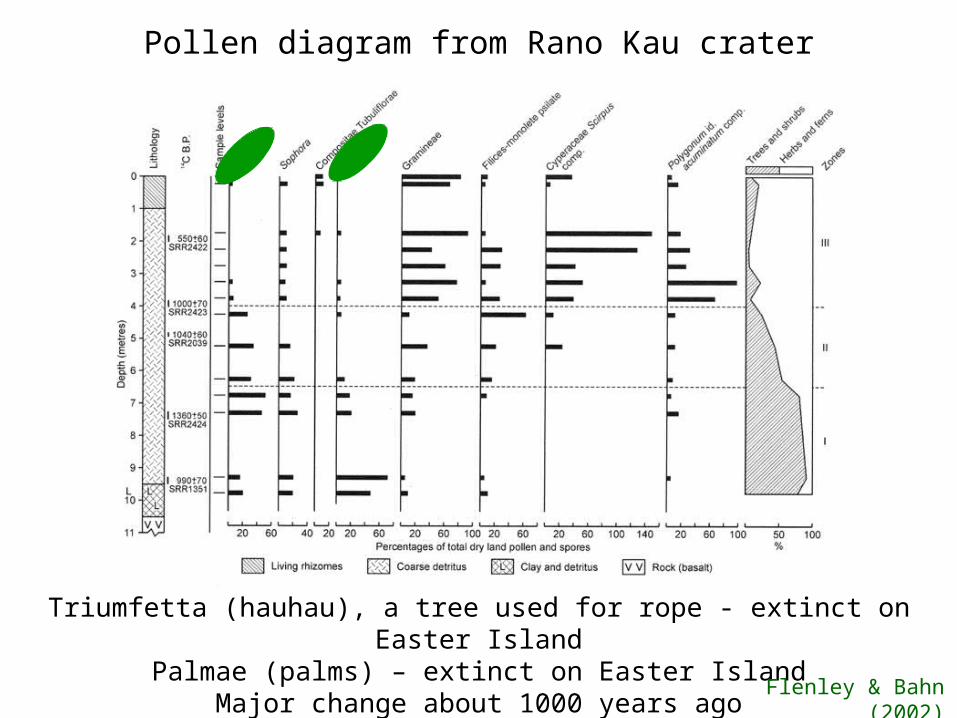
Triumfetta (hauhau), a tree used for rope - extinct on Easter Island
Palmae (palms) – extinct on Easter IslandMajor change about 1000 years ago
Pollen diagram from Rano Kau crater
Flenley & Bahn (2002)
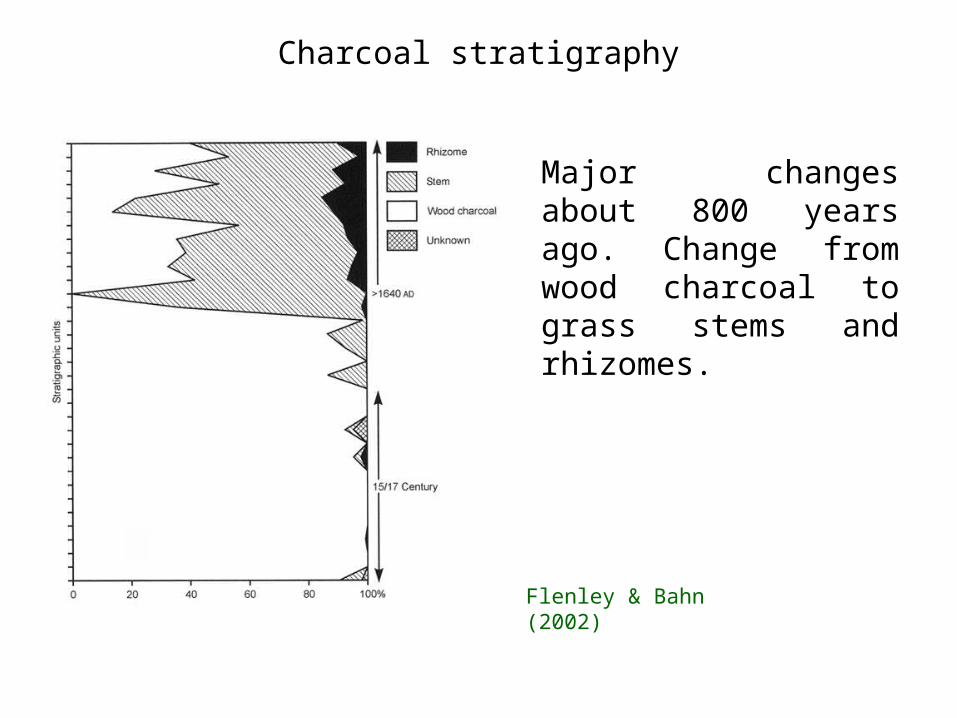
Charcoal stratigraphy
Major changes about 800 years ago. Change from wood charcoal to grass stems and rhizomes.
Flenley & Bahn (2002)
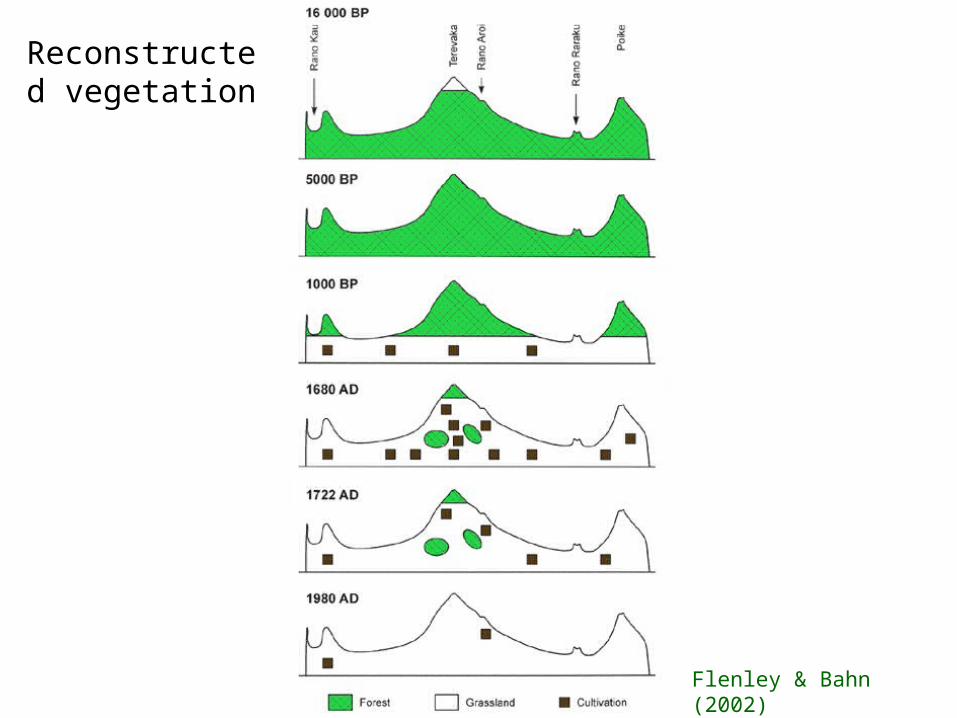
Reconstructed vegetation
Flenley & Bahn (2002)
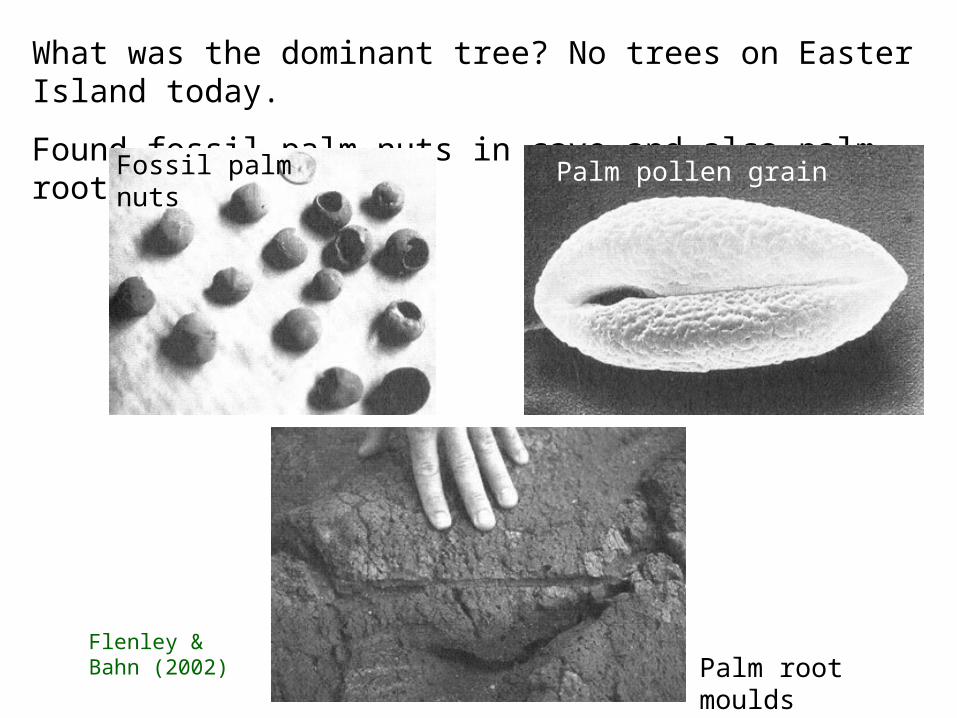
What was the dominant tree? No trees on Easter Island today.Found fossil palm nuts in cave and also palm root moulds.
Palm root moulds
Palm pollen grainFossil palm nuts
Flenley & Bahn (2002)
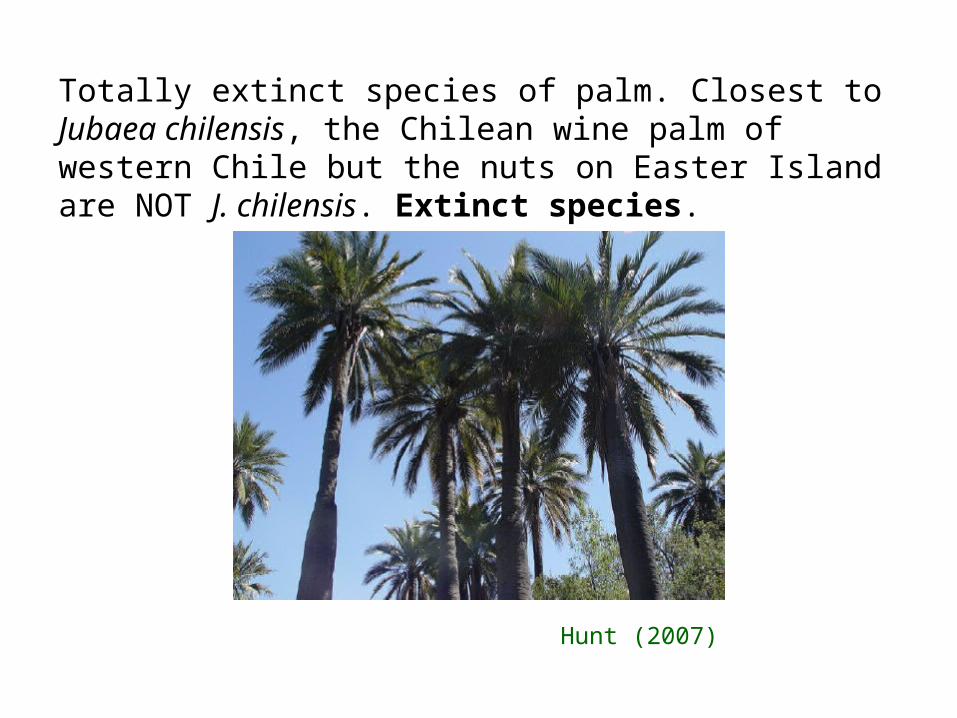
Totally extinct species of palm. Closest to Jubaea chilensis, the Chilean wine palm of western Chile but the nuts on Easter Island are NOT J. chilensis. Extinct species.
Hunt (2007)
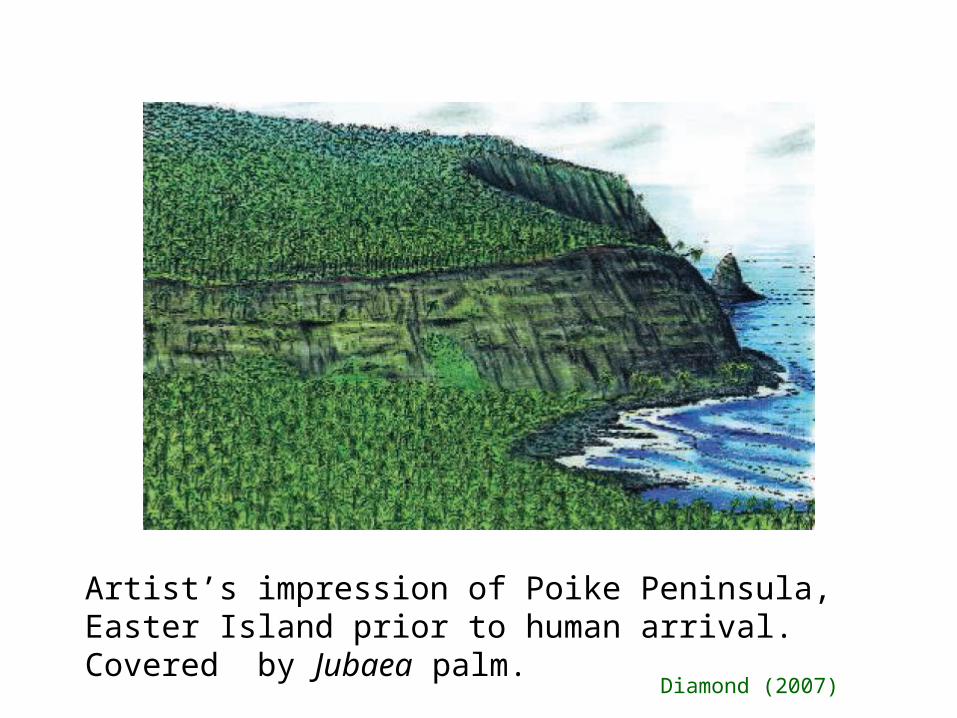
Artist’s impression of Poike Peninsula, Easter Island prior to human arrival. Covered by Jubaea palm. Diamond (2007)
Charcoal remains from ovens and middens show 20 other tree and woody plants exterminated during human settlement.
• Palm gone by AD 1450, other trees by AD 1650. • Islanders then burnt grasses and sedges for fuel.• Loss of trees meant loss of fibres, bark, wood, etc.• Major change in agricultural practices. • Major soil erosion, low crop yields by AD 1400.• AD 1400 – starting of ‘stone mulching’ – covered 50% of
island with stones averaging 2 kg in weight:•reduces evaporation •protects against erosion, •reduces temperature fluctuations, and •may fertilize soils.
• Soils very low in P. Islanders had exterminated sea-birds and hence their guano.

Islands once forested, deforested by Polynesian settlers. Oldest radiocarbon date for human occupation is 386 ± 100 AD, about 1700 years ago. Youngest is 1770 ± 60 AD.
1772 AD ‘islands destitute of trees’1774 AD Captain Cook – many statues
overturned, evidence for human fighting, rapid death, and cannibalism. Suggestive of great food shortage and societal collapse.
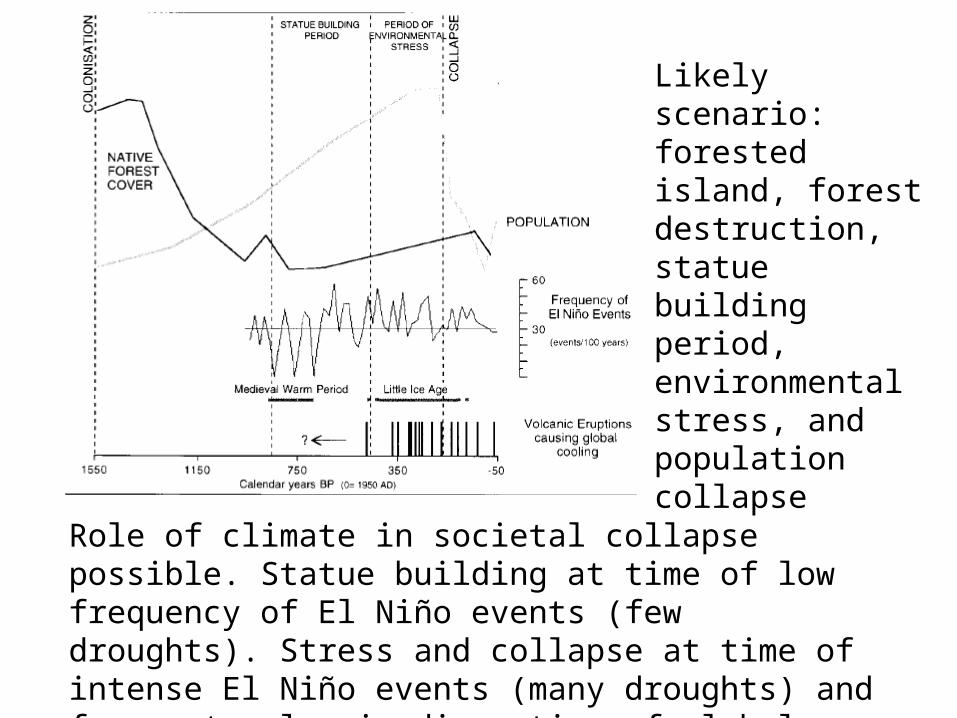
Likely scenario: forested island, forest destruction, statue building period, environmental stress, and population collapse
Role of climate in societal collapse possible. Statue building at time of low frequency of El Niño events (few droughts). Stress and collapse at time of intense El Niño events (many droughts) and frequent volcanic disruption of global climate (low temperatures).
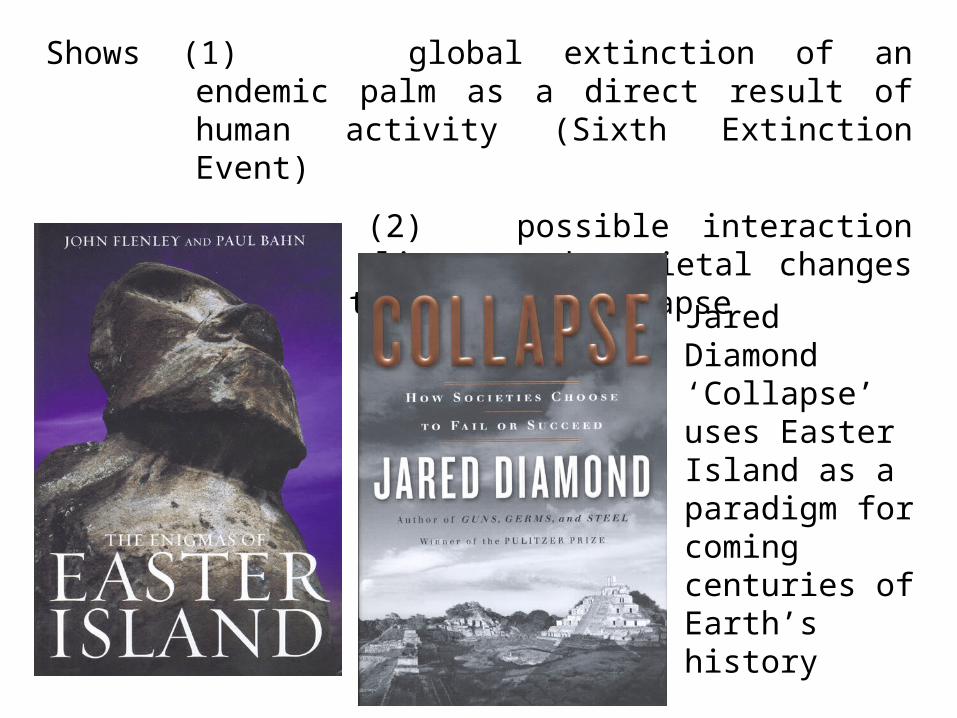
Shows (1) global extinction of an endemic palm as a direct result of human activity (Sixth Extinction Event)
(2)possible interaction between climate and societal changes leading to societal collapse
Jared Diamond ‘Collapse’ uses Easter Island as a paradigm for coming centuries of Earth’s history
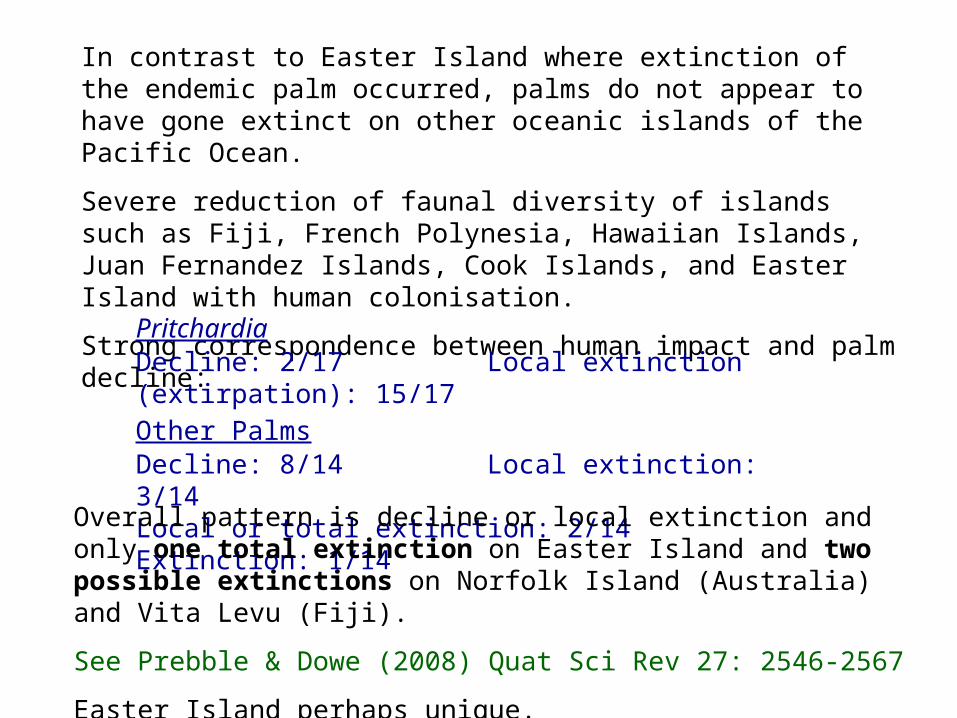
In contrast to Easter Island where extinction of the endemic palm occurred, palms do not appear to have gone extinct on other oceanic islands of the Pacific Ocean.Severe reduction of faunal diversity of islands such as Fiji, French Polynesia, Hawaiian Islands, Juan Fernandez Islands, Cook Islands, and Easter Island with human colonisation.Strong correspondence between human impact and palm decline:Pritchardia
Decline: 2/17 Local extinction (extirpation): 15/17Other PalmsDecline: 8/14 Local extinction: 3/14Local or total extinction: 2/14Extinction: 1/14Overall pattern is decline or local extinction and only one
total extinction on Easter Island and two possible extinctions on Norfolk Island (Australia) and Vita Levu (Fiji).See Prebble & Dowe (2008) Quat Sci Rev 27: 2546-2567Easter Island perhaps unique.
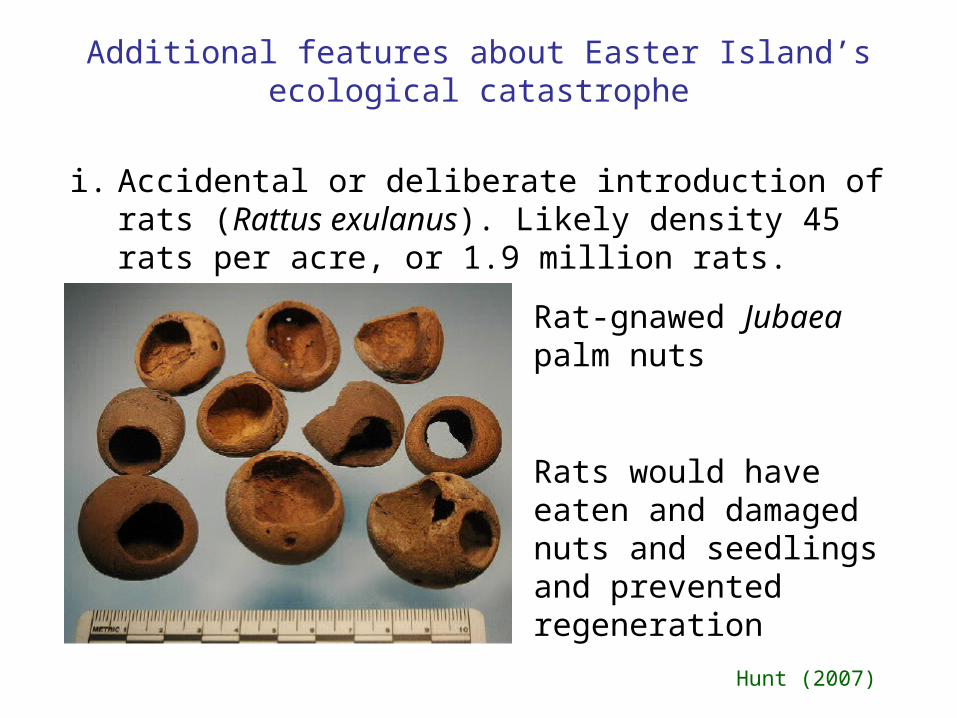
Additional features about Easter Island’s ecological catastrophe
i. Accidental or deliberate introduction of rats (Rattus exulanus). Likely density 45 rats per acre, or 1.9 million rats.
Rat-gnawed Jubaea palm nuts
Rats would have eaten and damaged nuts and seedlings and prevented regeneration
Hunt (2007)
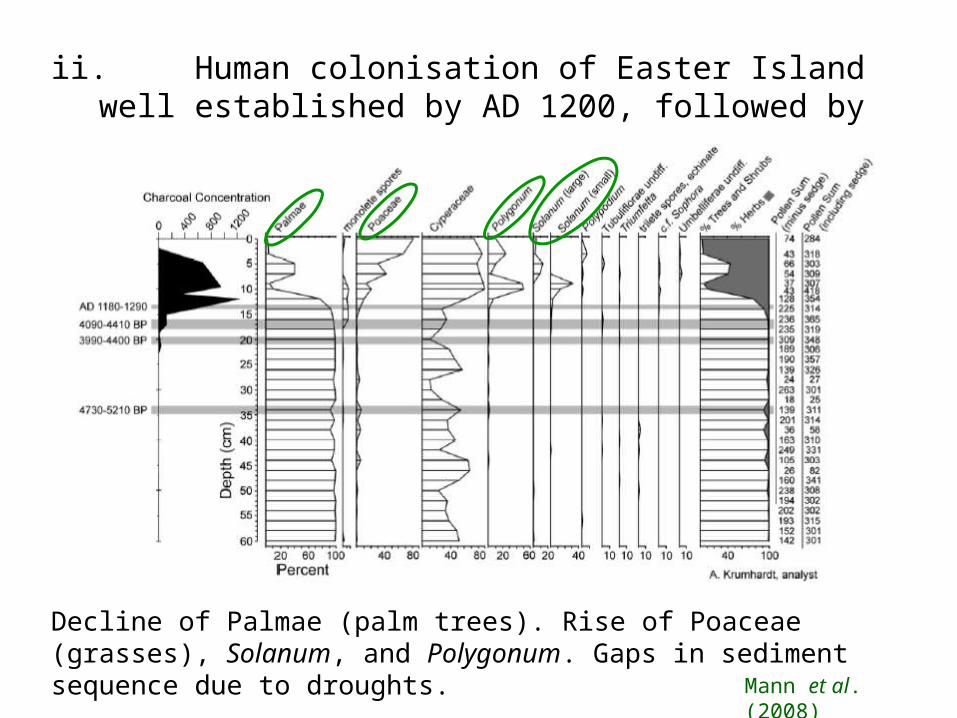
ii. Human colonisation of Easter Island well established by AD 1200, followed by rapid deforestation
Decline of Palmae (palm trees). Rise of Poaceae (grasses), Solanum, and Polygonum. Gaps in sediment sequence due to droughts. Mann et al.
(2008)
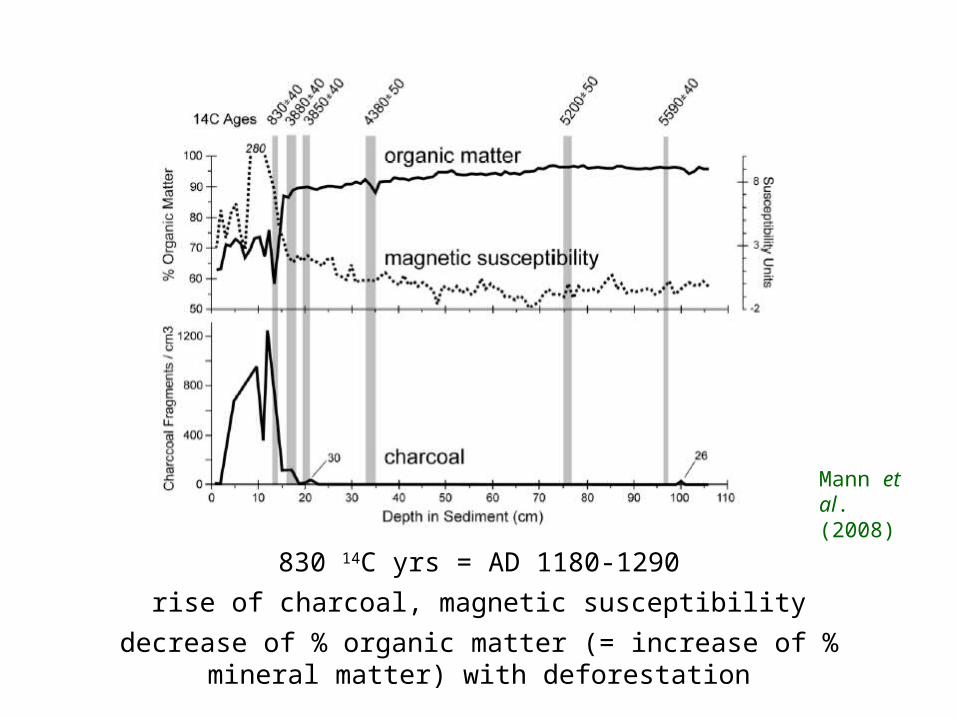
Mann et al. (2008)
830 14C yrs = AD 1180-1290rise of charcoal, magnetic susceptibility
decrease of % organic matter (= increase of % mineral matter) with deforestation

iii. Very fine-resolution studies and human-population growth models
1050 (top) to 1950 (bottom) AD – wrong way up!Suggests six adaptive cycles
Cole & Flenley (2008)

iv. 900 statues on Easter Island. Most from 19 quarries in Rano Raraku crater. Different size and style of statues on two sides of islandBy AD 1600, wood very scarce. Started to build stone buildings. Used caves and built stone walls to block entrances.Major changes before European arrival.
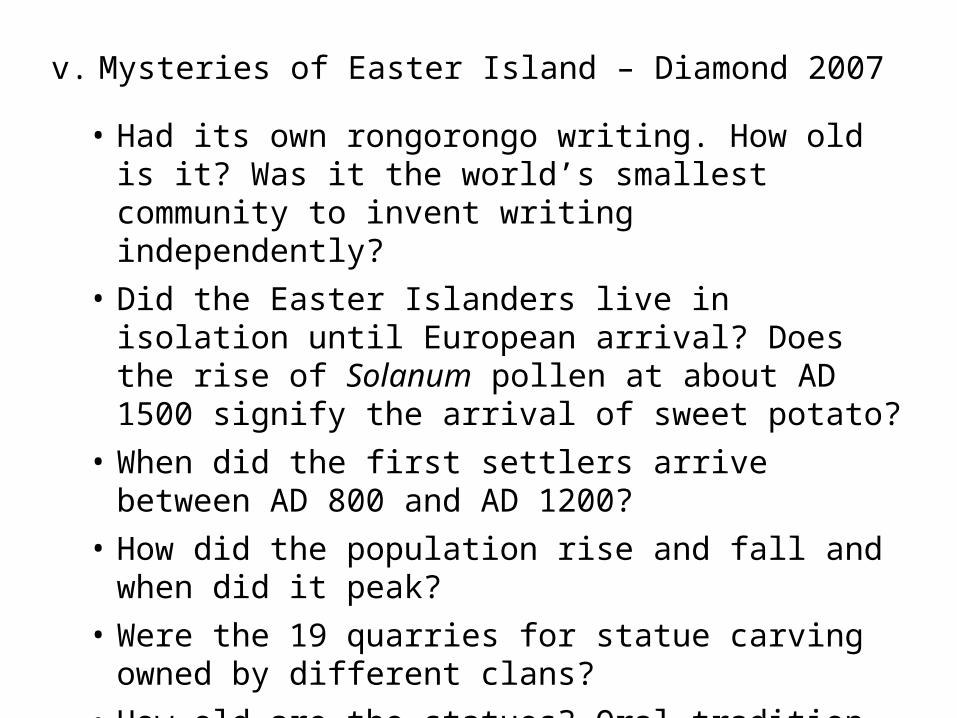
v. Mysteries of Easter Island – Diamond 2007• Had its own rongorongo writing. How old is it?
Was it the world’s smallest community to invent writing independently?
• Did the Easter Islanders live in isolation until European arrival? Does the rise of Solanum pollen at about AD 1500 signify the arrival of sweet potato?
• When did the first settlers arrive between AD 800 and AD 1200?
• How did the population rise and fall and when did it peak?
• Were the 19 quarries for statue carving owned by different clans?
• How old are the statues? Oral tradition says the last one was carved in AD 1680.
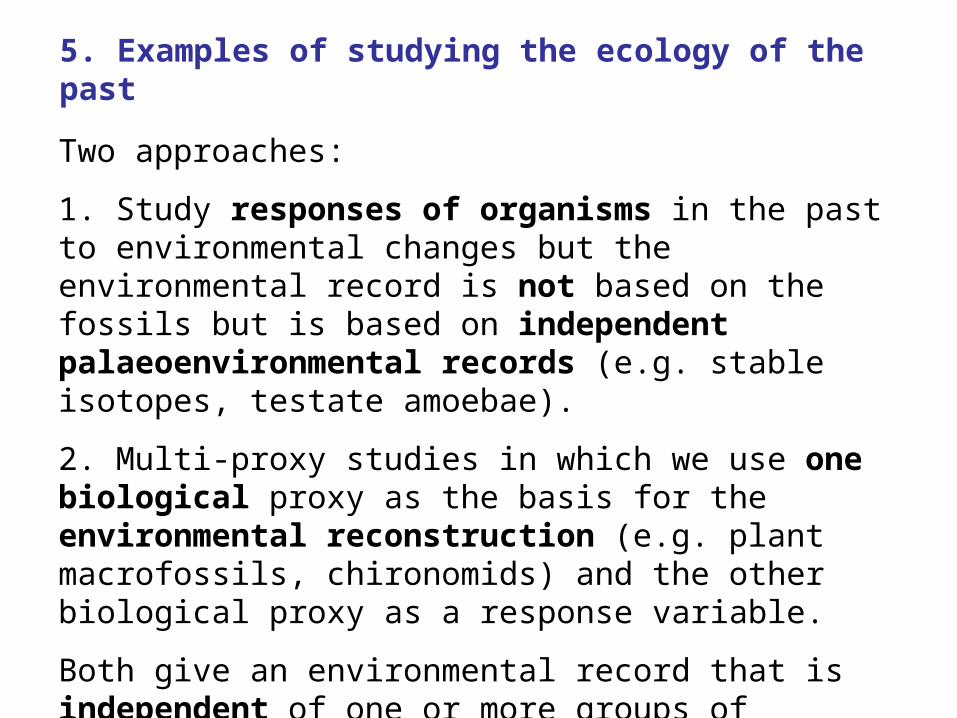
5. Examples of studying the ecology of the pastTwo approaches:1. Study responses of organisms in the past to environmental changes but the environmental record is not based on the fossils but is based on independent palaeoenvironmental records (e.g. stable isotopes, testate amoebae).2. Multi-proxy studies in which we use one biological proxy as the basis for the environmental reconstruction (e.g. plant macrofossils, chironomids) and the other biological proxy as a response variable.Both give an environmental record that is independent of one or more groups of fossils of interest.

Minden Bog, Michigan. Booth &
Jackson (2003)
Major change 1000 years ago towards drier conditions, decline in Fagus and rise in Pinus in charcoalClimate vegetation fire frequency
Black portions = wet periods, grey = dry periods
Multi-proxy studies and two biological proxies; one a response, other a predictor

Central New England, eastern USAEnvironmental proxies – hydrogen isotope ratios as temperature proxy (low values indicate colder temperatures)- lake levels indicate moisture balanceSee major pollen changes coincide with climatic transitionsClimate control of vegetational composition at millennial scalesShuman et al. (2004)
Multi-proxy studies of biological and physical proxies

These new approaches involving environmental reconstructions independent of the main fossil record can be used as a long-term ecological observatory or laboratory to study long-term ecological dynamics under a range of environmental conditions, not all of which exist on Earth today (e.g. lowered CO2 concentrations, low human impact).We will use the approach of different biotic proxies to consider plant migration, persistence, and adaptation in response to environmental change in a Q-Time perspective.
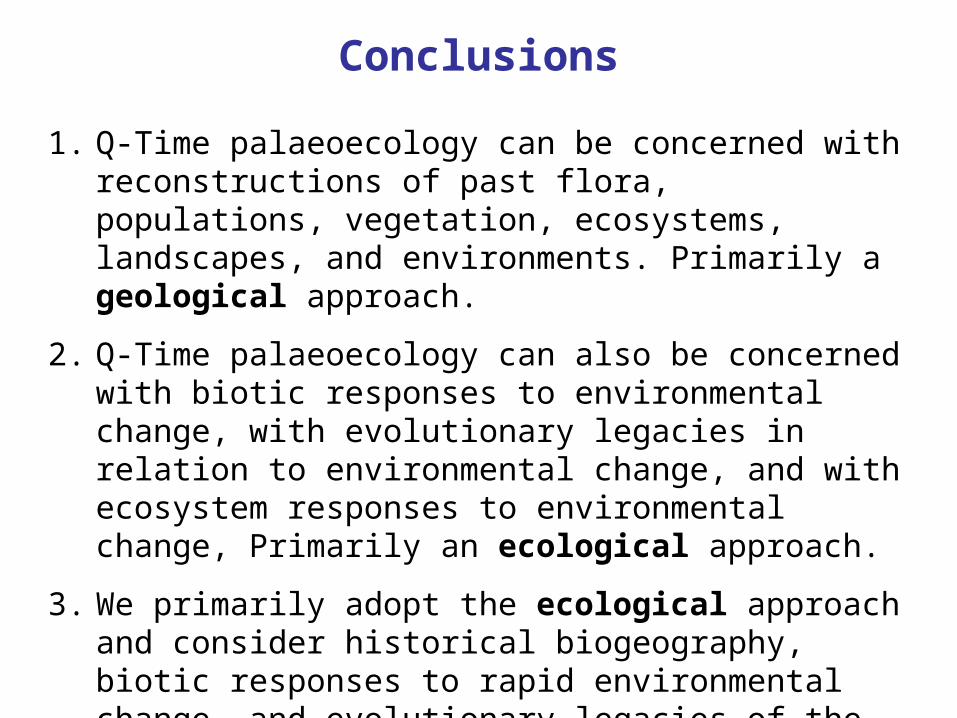
Conclusions1. Q-Time palaeoecology can be concerned with
reconstructions of past flora, populations, vegetation, ecosystems, landscapes, and environments. Primarily a geological approach.
2. Q-Time palaeoecology can also be concerned with biotic responses to environmental change, with evolutionary legacies in relation to environmental change, and with ecosystem responses to environmental change, Primarily an ecological approach.
3. We primarily adopt the ecological approach and consider historical biogeography, biotic responses to rapid environmental change, and evolutionary legacies of the Ice Ages.
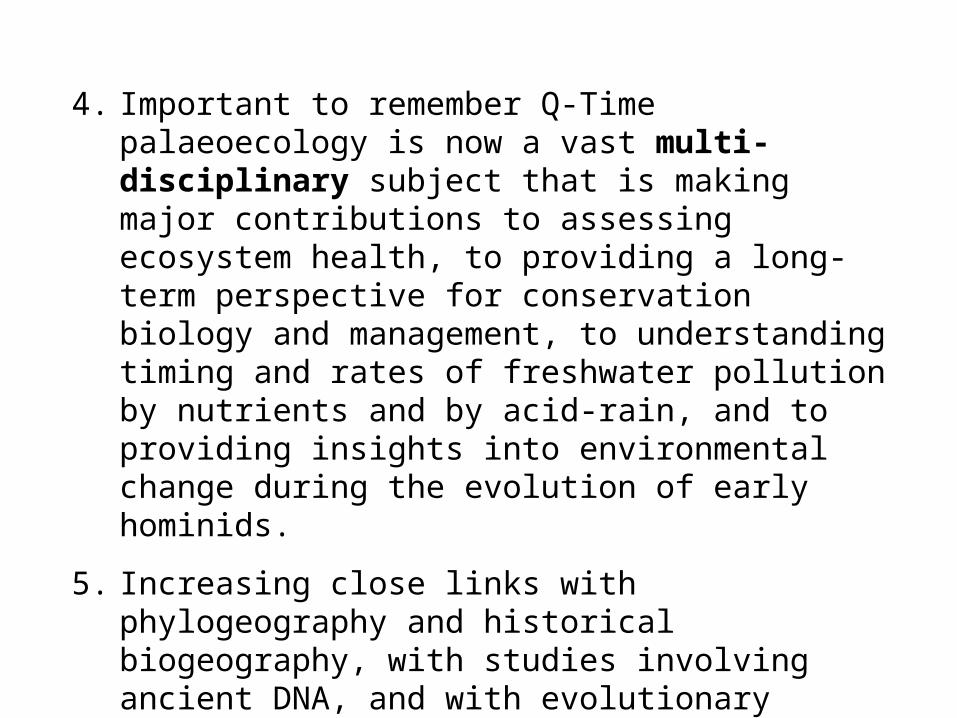
4. Important to remember Q-Time palaeoecology is now a vast multi-disciplinary subject that is making major contributions to assessing ecosystem health, to providing a long-term perspective for conservation biology and management, to understanding timing and rates of freshwater pollution by nutrients and by acid-rain, and to providing insights into environmental change during the evolution of early hominids.
5. Increasing close links with phylogeography and historical biogeography, with studies involving ancient DNA, and with evolutionary biology.
6. Major advances have come from the discovery of all the proxies preserved in lake sediments.
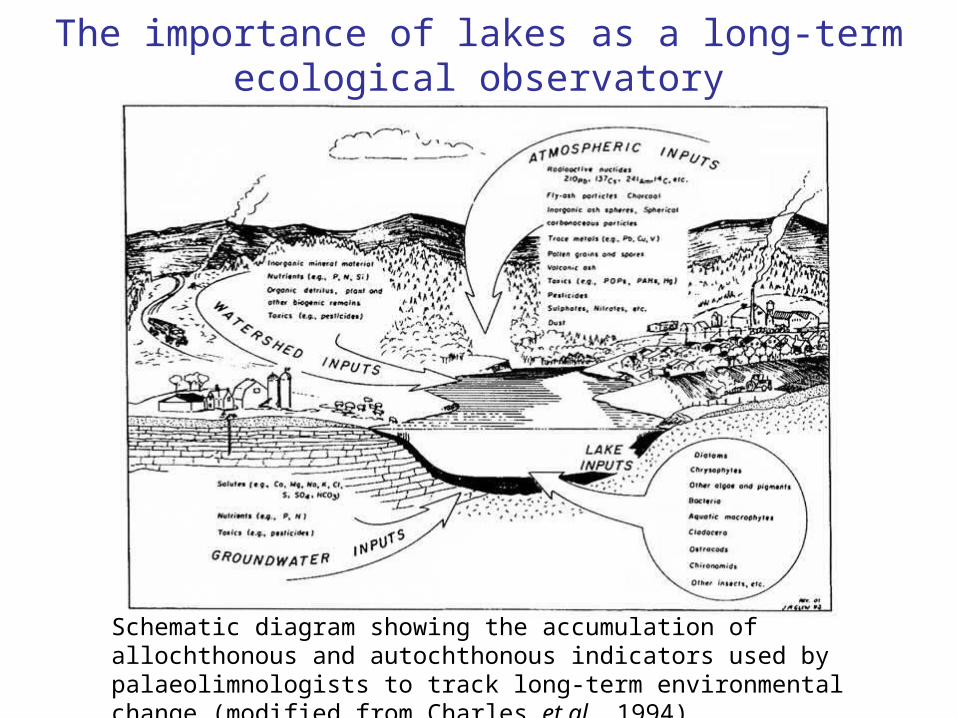
Schematic diagram showing the accumulation of allochthonous and autochthonous indicators used by palaeolimnologists to track long-term environmental change (modified from Charles et al. 1994).
The importance of lakes as a long-term ecological observatory