introduction to matlab 2d 3d plots - numfactory.upc.edu · © numerical factory 2 plotting with...
TRANSCRIPT
© Numerical Factory
Numerical Methods in Engineering
Dept. Matemàtiques ETSEIB - UPC BarcelonaTech
Introduction to Matlab2D – 3D Plots
Prof. Toni Susín
© Numerical Factory 2
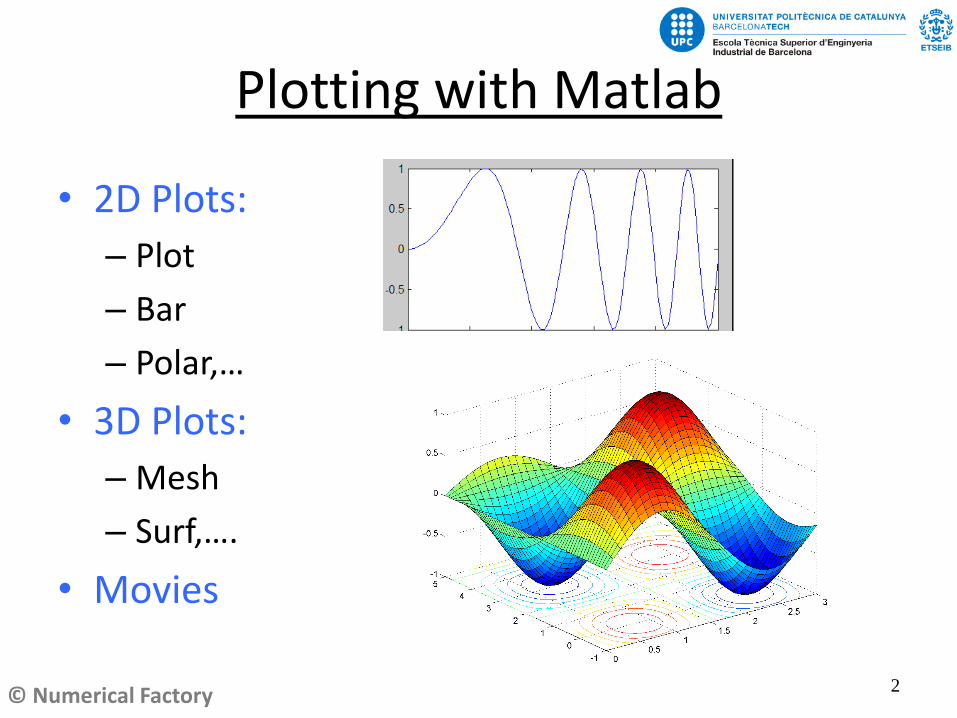
Plotting with Matlab
• 2D Plots:
– Plot
– Bar
– Polar,…
• 3D Plots:
– Mesh
– Surf,….
• Movies

© Numerical Factory 3
2D Plots
h=pi/25;
x=0:h:2*pi;
y=sin(x);
plot (x, y);

© Numerical Factory 4
2D Plots
h=pi/25;
x=0:h:2*pi;
y=sin(x);
plot (x, y);

© Numerical Factory 5
2D Plots

© Numerical Factory 6
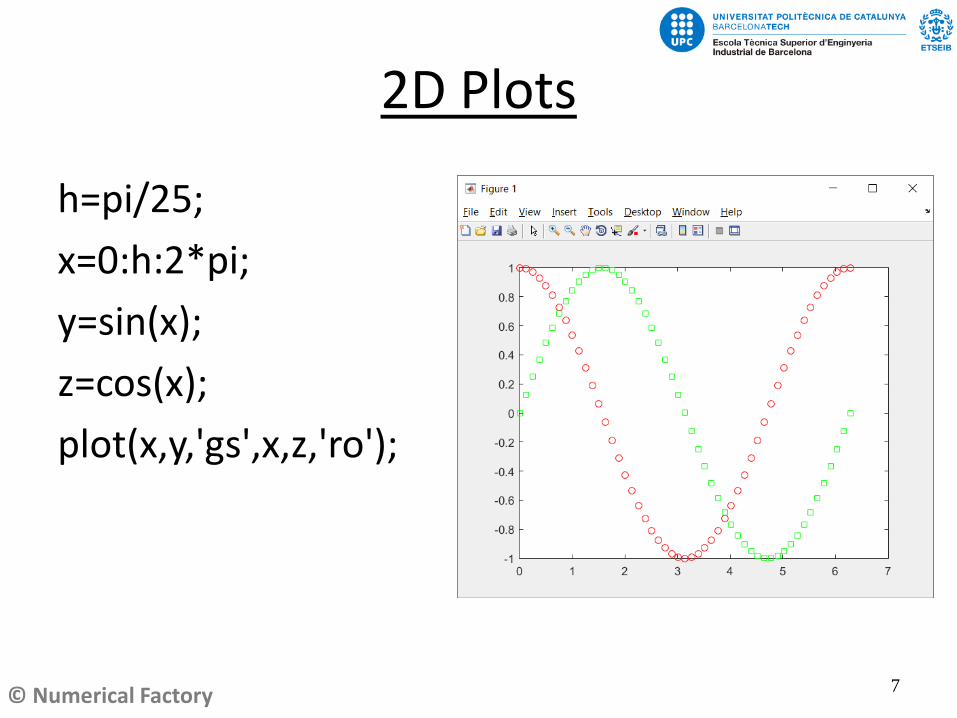
2D Plots
h=pi/25;
x=0:h:2*pi;
y=sin(x);
z=cos(x);
plot(x,y,'gs',x,z,'ro');
© Numerical Factory 7
2D Plots
h=pi/25;
x=0:h:2*pi;
y=sin(x);
z=cos(x);
plot(x,y,'gs',x,z,'ro');

© Numerical Factory 8
2D Plots
• Plotting on a previous plot
hold on
line([0 2*pi],[0 0],'Color','m','LineWidth',2)

© Numerical Factory 9
2D Plots
• Plotting on a previous plot
hold on
line([0 2*pi],[0 0],'Color','m','LineWidth',2)

© Numerical Factory 10
2D Plotsx=0:pi/25:2*pi;y=sin(x); z=cos(x);plot(x,y, 'g',x,z, 'r');legend('sin','cos');grid;title('Functions' );xlabel( ' x value ' );ylabel( ' y value ' );

© Numerical Factory 11
2D Plotsx=0:pi/25:2*pi;y=sin(x); z=cos(x);plot(x,y, 'g',x,z, 'r');legend('sin','cos');grid;title('Functions' );xlabel( ' x value ' );ylabel( ' y value ' );

© Numerical Factory 12
2D Plotsx=0:pi/25:2*pi;y=sin(x); z=cos(x);plot(x,y,'g',x,z,'r');legend('sin','cos');grid;title('Functions' );xlabel( ' x value ' );ylabel( ' y value ' );
Axis values:axis([xmin,xmax,ymin,ymax])

© Numerical Factory 13
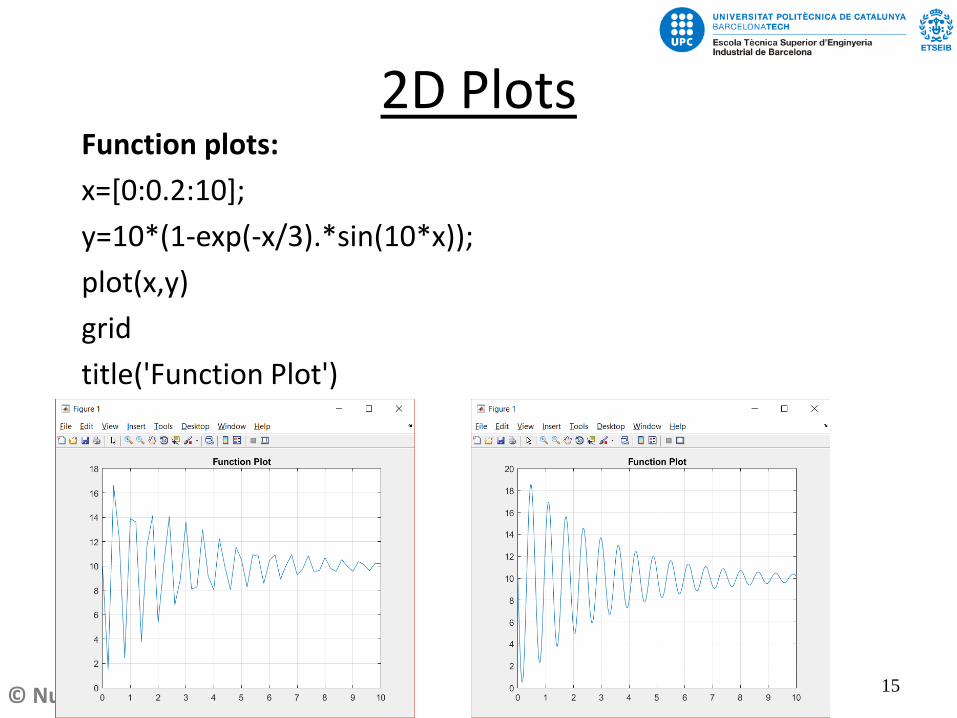
2D PlotsFunction plots:
x=[0:0.2:10];
y=10*(1-exp(-x/3).*sin(10*x));
plot(x,y)
grid
title('Function Plot')

© Numerical Factory 14
2D PlotsFunction plots:
x=[0:0.2:10];
y=10*(1-exp(-x/3).*sin(10*x));
plot(x,y)
grid
title('Function Plot')
© Numerical Factory 15
2D PlotsFunction plots:
x=[0:0.2:10];
y=10*(1-exp(-x/3).*sin(10*x));
plot(x,y)
grid
title('Function Plot')

© Numerical Factory 16
2D PlotsInline Function:
x=[0:0.01:10];
f=@(x) 10*(1-exp(-x/3).*sin(10*x)); %inline function
y=f(x);
plot(x,y)
grid
title('Function Plot')

© Numerical Factory 17
2D PlotsInline Function:
x=[0:0.01:10];
f=@(x) 10*(1-exp(-x/3).*sin(10*x)); %inline function
myTitle= 'expSin Function';
myPlot(x,f,myTitle)
In an independent file named myPlot (as the function)
function myPlot(x,f,myTitle) y=f(x);
plot(x,y)
grid
title(myTitle)

© Numerical Factory 18
2D Plots• Subwindows:
subplot(2,1,1), plot(x,y)
subplot(2,1,2), plot(x,z)

© Numerical Factory 19
2D Plots• Subwindows:
subplot(2,1,1), plot(x,y)
subplot(2,1,2), plot(x,z)
© Numerical Factory 20
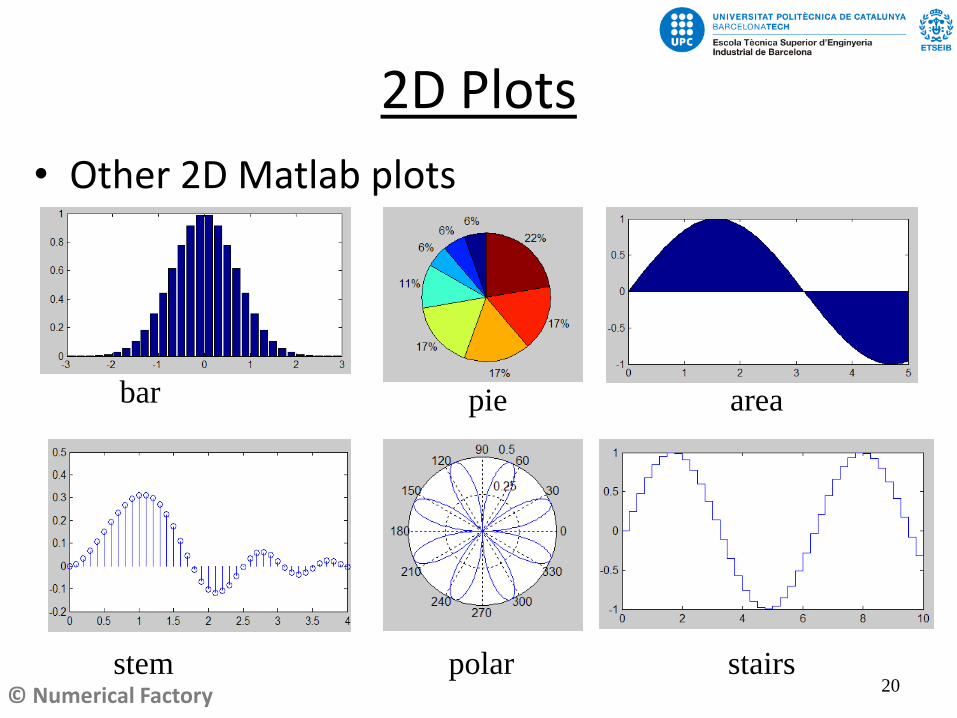
2D Plots
• Other 2D Matlab plots
bar pie area
stem polar stairs

© Numerical Factory 21
2D Plots
• Getting mouse points:
[x y]=ginput(4);
plot(x,y,’g’);
fill(x,y,’r’);

© Numerical Factory 22
2D Animation
• Animation
– Repeat a computation changing some parameter.
• Example:
sinusoide

© Numerical Factory 23
% Sinusoid Animation: sin(x+P)% P phase value
%Assign values to the graphic windowfigNumber=figure('Name','Sinusoid Animation', 'NumberTitle','off', 'Visible','on');
endP=2*pi; %max variation angle for PincP=0.05; %increment de la Fasex=[-2*pi:0.2:2*pi]; %rang of x valuesfor P=-endP:incP:endP
y=sin(x+P);plot(x,y,'r')axis([-2*pi 2*pi -1.2 1.2])gridline([-2*pi 2*pi],[0 0],'Color','k','LineWidth',2)line([0 0],[-1.2 1.2],'Color','k','LineWidth',2)text(1.15,1.1,['Phase = ' num2str(P,'%.4f')])drawnow%pause(0.01)
end

© Numerical Factory 24
% Sinusoide Animation: sin(x+P)% P phase value
%Assign values to the graphic windowfigNumber=figure('Name','Sinusoid Animation', 'NumberTitle','off', 'Visible','on');
endP=2*pi; %max variation angle for PincP=0.05; %increment de la Fasex=[-2*pi:0.2:2*pi]; %rang of x values
for P=-endP:incP:endPy=sin(x+P);plot(x,y,'r')axis([-2*pi 2*pi -1.2 1.2])gridline([-2*pi 2*pi],[0 0],'Color','k','LineWidth',2)line([0 0],[-1.2 1.2],'Color','k','LineWidth',2)text(1.15,1.1,['Phase = ' num2str(P,'%.4f')])drawnow%pause(0.01)
end
myVideo = VideoWriter('sinusoide.avi'); open(myVideo ); %open our video file
frame = getframe; writeVideo(myVideo,frame); %save to the video
close(myVideo);
Video Generation

© Numerical Factory 25
3D Plots
• 3D- curves: Plot3 Function
fi=[0:pi/20:6*pi];
plot3(cos(fi),sin(fi),fi,’g’) %Helix curve

© Numerical Factory 26
Helix Animation
% Helix Animationfi=[0:pi/20:6*pi];
for k=1:size(fi,2)plot3(cos(fi),sin(fi),fi,'g')hold on;plot3(cos(fi(k)), sin(fi(k)), fi(k),'marker','o',...
'markersize',8,'markerfacecolor', 'green');hold off;pause(0.1)
end

© Numerical Factory 27
3D Plots
• 3D Surfaces: mesh, surf
x=[-8:0.4:8]; y=x;
[X,Y]=meshgrid(x,y);
R=sqrt(X.^2+Y.^2)+0.001;
W=sin(R)./R;
mesh(W)
surf(W)

© Numerical Factory 28
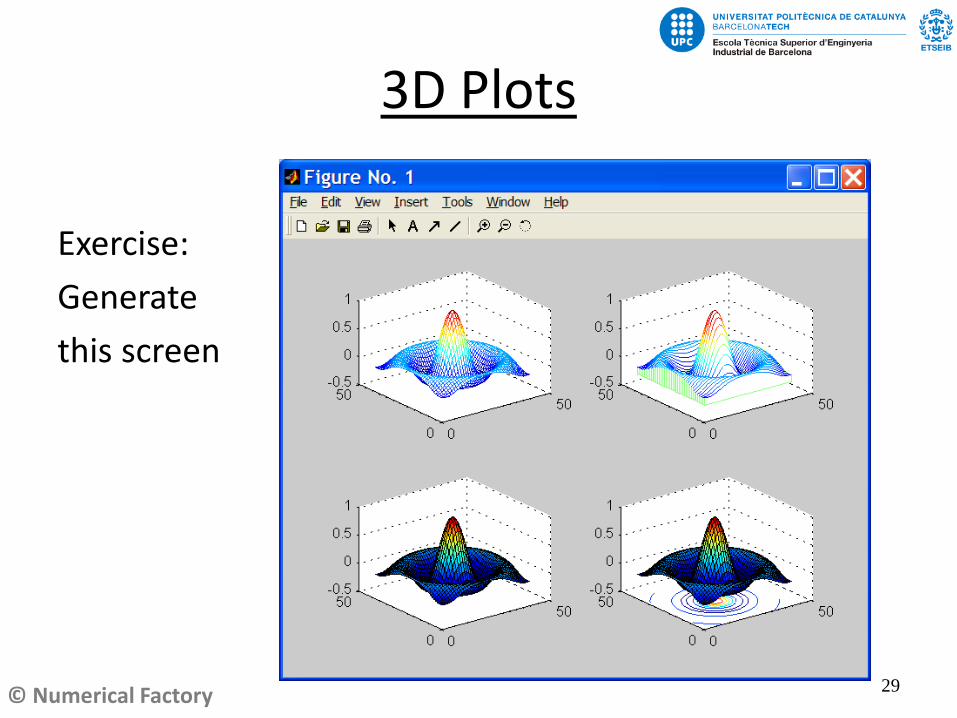
3D Plots
>>contour(W)
>>waterfall(W)
>> meshc(W);
© Numerical Factory 29
3D Plots
Exercise:
Generate
this screen

© Numerical Factory
Sphere and Cylinder
[x,y,z]=sphere(20)
surf(x,y,z)
30

© Numerical Factory
Sphere and Cylinder
[x,y,z]=cylinder([1,1], 20)
surf(x,y,z)
Cone?
31