introduction - puc - pennsylvania puc · web viewtable 333: geothermal heat pump– values and...
TRANSCRIPT
TECHNICAL REFERENCE MANUAL
State of PennsylvaniaAct 129 Energy Efficiency and Conservation Program
& Act 213 Alternative Energy Portfolio Standards
June 2016Errata Update February 2017

This Page Intentionally Left Blank
State of Pennsylvania – Technical Reference Manual – Rev Date: Feb 2017
TABLE OF CONTENTS
1 INTRODUCTION.......................................................................11.1 Purpose............................................................................................................................... 11.2 Using the TRM.................................................................................................................... 1
1.2.1 Measure Categories.......................................................................................................................21.2.2 Customer and Program Specific Data............................................................................................21.2.3 End-use Categories & Thresholds for Using Default Values..........................................................31.2.4 Applicability of the TRM for estimating Ex Ante (Claimed) savings................................................5
1.3 Definitions........................................................................................................................... 51.4 General Framework............................................................................................................71.5 Algorithms.......................................................................................................................... 71.6 Data and Input Values........................................................................................................81.7 Baseline Estimates.............................................................................................................81.8 Resource Savings in Current and Future Program Years..............................................91.9 Prospective Application of the TRM...............................................................................101.10 Electric Resource Savings............................................................................................101.11 Post-Implementation Review.........................................................................................101.12 Adjustments to Energy and Resource Savings...........................................................11
1.12.1 Coincidence with Electric System Peak.....................................................................................111.12.2 Measure Retention and Persistence of Savings.........................................................................111.12.3 Interactive Measure Energy Savings..........................................................................................111.12.4 Verified Gross Adjustments........................................................................................................11
1.13 Calculation of the Value of Resource Savings.............................................................121.14 Transmission and Distribution System Losses...........................................................121.15 Measure Lives................................................................................................................. 131.16 Custom Measures...........................................................................................................131.17 Impact of Weather..........................................................................................................141.18 Measure Applicability Based on Sector.......................................................................141.19 Algorithms for Energy Efficient Measures...................................................................15
2 RESIDENTIAL MEASURES..........................................................172.1 Lighting............................................................................................................................. 17
2.1.1 ENERGY STAR Lighting..............................................................................................................172.1.2 Residential Occupancy Sensors...................................................................................................252.1.3 Electroluminescent Nightlight.......................................................................................................272.1.4 LED Nightlight...............................................................................................................................292.1.5 Holiday Lights...............................................................................................................................31
2.2 HVAC................................................................................................................................. 342.2.1 Electric HVAC...............................................................................................................................342.2.2 Fuel Switching: Electric Heat to Gas/Propane/Oil Heat................................................................452.2.3 Ductless Mini-Split Heat Pumps...................................................................................................512.2.4 ENERGY STAR Room Air Conditioners.......................................................................................572.2.5 Room AC (RAC) Retirement........................................................................................................612.2.6 Duct Sealing.................................................................................................................................67
ContentsPage i
State of Pennsylvania – Technical Reference Manual – Rev Date: Feb 2017
2.2.7 Furnace Whistle............................................................................................................................732.2.8 Programmable Thermostat...........................................................................................................782.2.9 Residential Whole House Fans....................................................................................................812.2.10 Packaged Terminal Systems......................................................................................................83
2.3 Domestic Hot Water.........................................................................................................872.3.1 Heat Pump Water Heaters...........................................................................................................872.3.2 Solar Water Heaters.....................................................................................................................932.3.3 Fuel Switching: Electric Resistance to Fossil Fuel Water Heater.................................................962.3.4 Fuel Switching: Heat Pump Water Heater to Fossil Fuel Water Heater.....................................1002.3.5 Water Heater Tank Wrap............................................................................................................1062.3.6 Water Heater Temperature Setback...........................................................................................1092.3.7 Water Heater Pipe Insulation......................................................................................................1122.3.8 Low Flow Faucet Aerators..........................................................................................................1142.3.9 Low Flow Showerheads.............................................................................................................1202.3.10 Thermostatic Shower Restriction Valve....................................................................................125
2.4 Appliances......................................................................................................................1292.4.1 ENERGY STAR Refrigerators....................................................................................................1292.4.2 ENERGY STAR Freezers...........................................................................................................1372.4.3 Refrigerator / Freezer Recycling with and without Replacement...............................................1412.4.4 ENERGY STAR Clothes Washers.............................................................................................1472.4.5 ENERGY STAR Dryers..............................................................................................................1522.4.6 Fuel Switching: Electric Clothes Dryer to Gas Clothes Dryer.....................................................1552.4.7 ENERGY STAR Dishwashers....................................................................................................1582.4.8 ENERGY STAR Dehumidifiers...................................................................................................1612.4.9 ENERGY STAR Water Coolers..................................................................................................1642.4.10 ENERGY STAR Ceiling Fans...................................................................................................166
2.5 Consumer Electronics...................................................................................................1692.5.1 ENERGY STAR Televisions.......................................................................................................1692.5.2 ENERGY STAR Office Equipment.............................................................................................1732.5.3 Smart Strip Plug Outlets.............................................................................................................176
2.6 Building Shell..................................................................................................................1802.6.1 Ceiling / Attic and Wall Insulation...............................................................................................1802.6.2 ENERGY STAR Windows..........................................................................................................1872.6.3 Residential New Construction....................................................................................................1902.6.4 Home Performance with ENERGY STAR..................................................................................1962.6.5 ENERGY STAR Manufactured Homes......................................................................................1982.6.6 Residential Air Sealing...............................................................................................................2042.6.7 Crawl Space Wall Insulation.......................................................................................................2072.6.8 Rim Joist Insulation....................................................................................................................212
2.7 Miscellaneous.................................................................................................................2172.7.1 Pool Pump Load Shifting............................................................................................................2172.7.2 Variable Speed Pool Pumps (with Load Shifting Option)...........................................................220
3 COMMERCIAL AND INDUSTRIAL MEASURES..................................2253.1 Lighting........................................................................................................................... 225
ContentsPage ii
State of Pennsylvania – Technical Reference Manual – Rev Date: Feb 2017
3.1.1 Lighting Improvements...............................................................................................................2253.1.2 New Construction Lighting..........................................................................................................2353.1.3 Lighting Controls.........................................................................................................................2453.1.4 Traffic Lights...............................................................................................................................2483.1.5 LED Exit Signs............................................................................................................................2513.1.6 LED Channel Signage................................................................................................................2543.1.7 LED Refrigeration Display Case Lighting...................................................................................257
3.2 HVAC............................................................................................................................... 2603.2.1 HVAC Systems...........................................................................................................................2603.2.2 Electric Chillers...........................................................................................................................2703.2.3 Water Source and Geothermal Heat Pumps..............................................................................2753.2.4 Ductless Mini-Split Heat Pumps – Commercial < 5.4 tons.........................................................2843.2.5 Fuel Switching: Small Commercial Electric Heat to Natural gas / Propane / Oil Heat...............2893.2.6 Small C/I HVAC Refrigerant Charge Correction.........................................................................2943.2.7 ENERGY STAR Room Air Conditioner......................................................................................3003.2.8 Controls: Guest Room Occupancy Sensor.................................................................................3043.2.9 Controls: Economizer.................................................................................................................308
3.3 Motors and VFDs............................................................................................................3133.3.1 Premium Efficiency Motors.........................................................................................................3133.3.2 Variable Frequency Drive (VFD) Improvements.........................................................................3253.3.3 ECM Circulating Fan..................................................................................................................3283.3.4 VSD on Kitchen Exhaust Fan.....................................................................................................332
3.4 Domestic Hot Water.......................................................................................................3353.4.1 Heat Pump Water Heaters.........................................................................................................3353.4.2 Low Flow Pre-Rinse Sprayers for Retrofit Programs..................................................................3443.4.3 Low Flow Pre-Rinse Sprayers for Time of Sale / Retail Programs.............................................3493.4.4 Fuel Switching: Electric Resistance Water Heaters to Gas / Oil / Propane................................3543.4.5 Fuel Switching: Heat Pump Water Heaters to Gas / Oil / Propane............................................360
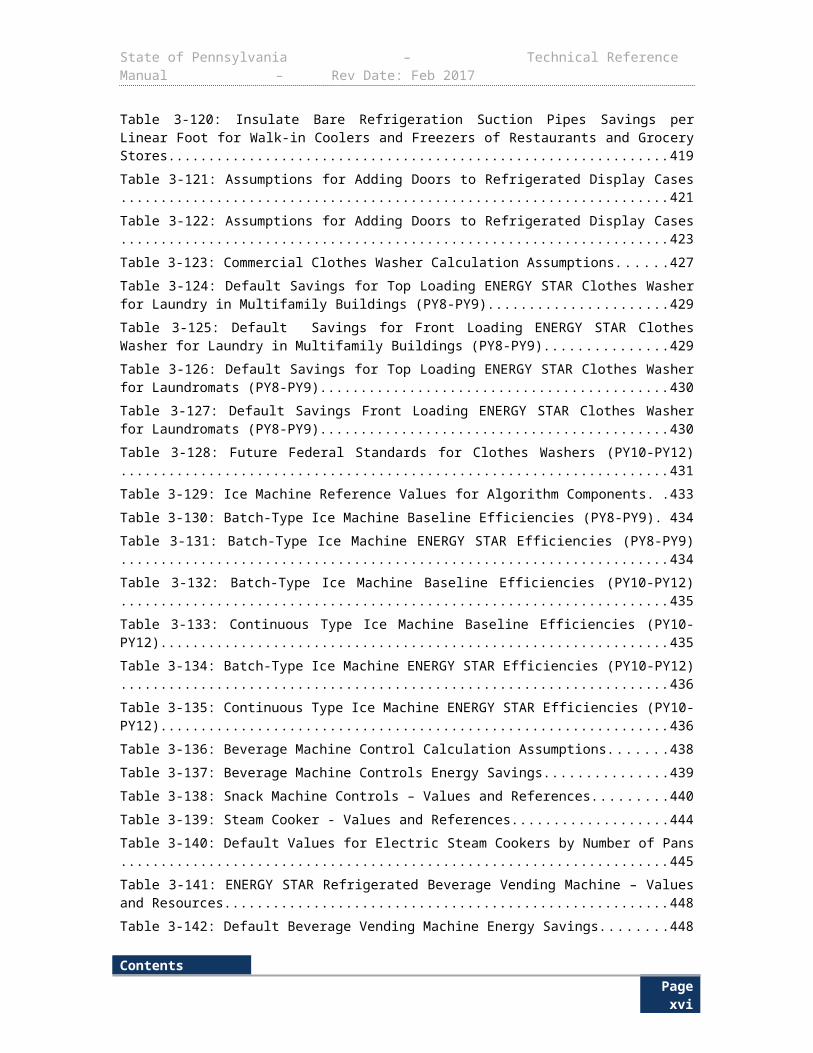
3.5 Refrigeration...................................................................................................................3693.5.1 High-Efficiency Refrigeration/Freezer Cases.............................................................................3693.5.2 High-Efficiency Evaporator Fan Motors for Reach-In Refrigerated Cases.................................3733.5.3 High-Efficiency Evaporator Fan Motors for Walk-in Refrigerated Cases...................................3773.5.4 Controls: Evaporator Fan Controllers.........................................................................................3823.5.5 Controls: Floating Head Pressure Controls................................................................................3853.5.6 Controls: Anti-Sweat Heater Controls.........................................................................................3893.5.7 Controls: Evaporator Coil Defrost Control..................................................................................3933.5.8 Variable Speed Refrigeration Compressor.................................................................................3963.5.9 Strip Curtains for Walk-In Freezers and Coolers........................................................................3983.5.10 Night Covers for Display Cases................................................................................................4073.5.11 Auto Closers.............................................................................................................................4103.5.12 Door Gaskets for Walk-in and Reach-in Coolers and Freezers...............................................4133.5.13 Special Doors with Low or No Anti-Sweat Heat for Low Temp Case.......................................4153.5.14 Suction Pipe Insulation for Walk-In Coolers and Freezers.......................................................4183.5.15 Refrigerated Display Cases with Doors Replacing Open Cases..............................................4203.5.16 Adding Doors to Existing Refrigerated Display Cases.............................................................422
ContentsPage iii
State of Pennsylvania – Technical Reference Manual – Rev Date: Feb 2017
3.6 Appliances......................................................................................................................4243.6.1 ENERGY STAR Clothes Washer...............................................................................................424
3.7 Food Service Equipment...............................................................................................4323.7.1 High-Efficiency Ice Machines.....................................................................................................4323.7.2 Controls: Beverage Machine Controls........................................................................................4373.7.3 Controls: Snack Machine Controls.............................................................................................4403.7.4 ENERGY STAR Electric Steam Cooker.....................................................................................4423.7.5 ENERGY STAR Refrigerated Beverage Machine......................................................................447
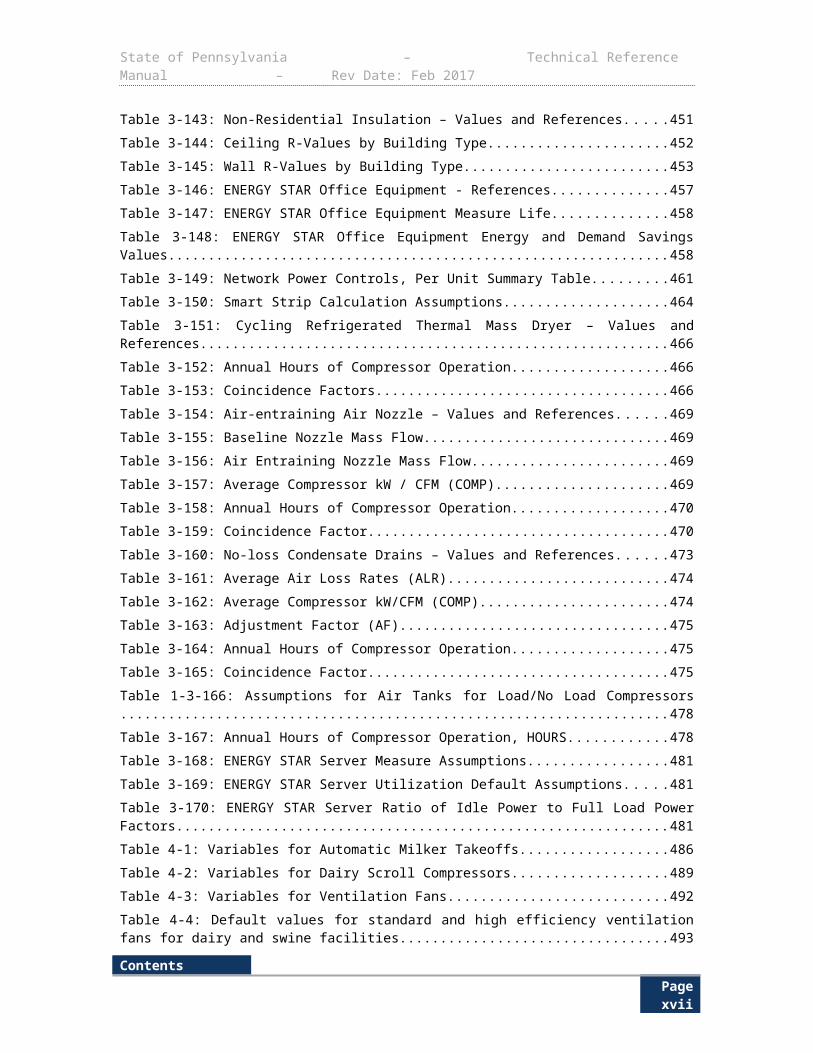
3.8 Building Shell..................................................................................................................4503.8.1 Wall and Ceiling Insulation.........................................................................................................450
3.9 Consumer Electronics...................................................................................................4553.9.1 ENERGY STAR Office Equipment.............................................................................................4553.9.2 Office Equipment – Network Power Management Enabling......................................................4603.9.3 Smart Strip Plug Outlets.............................................................................................................463
3.10 Compressed Air............................................................................................................4653.10.1 Cycling Refrigerated Thermal Mass Dryer...............................................................................4653.10.2 Air-Entraining Air Nozzle..........................................................................................................4683.10.3 No-Loss Condensate Drains....................................................................................................4723.10.4 Air Tanks for Load/No Load Compressors...............................................................................477
3.11 Miscellaneous...............................................................................................................4803.11.1 ENERGY STAR Servers..........................................................................................................480
4 AGRICULTURAL MEASURES.....................................................4854.1 Agricultural.....................................................................................................................485
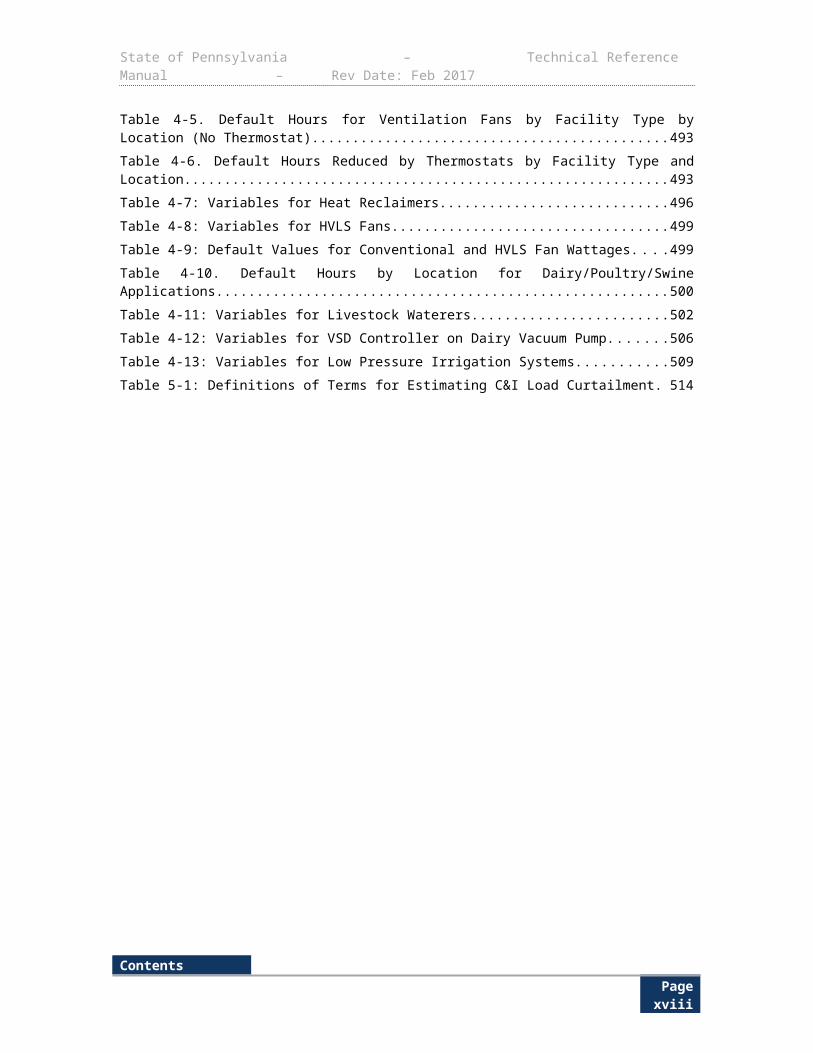
4.1.1 Automatic Milker Takeoffs..........................................................................................................4854.1.2 Dairy Scroll Compressors...........................................................................................................4884.1.3 High Efficiency Ventilation Fans with and without Thermostats.................................................4914.1.4 Heat Reclaimers.........................................................................................................................4954.1.5 High Volume Low Speed Fans...................................................................................................4984.1.6 Livestock Waterer.......................................................................................................................5014.1.7 Variable Speed Drive (VSD) Controller on Dairy Vacuum Pumps.............................................5044.1.8 Low Pressure Irrigation System..................................................................................................508
5 DEMAND RESPONSE.............................................................5125.1 Load Curtailment for Commercial and Industrial Programs.......................................5125.2 Direct Load Control and Behavior-Based Demand Response Programs..................516
6 APPENDICES.......................................................................5206.1 Appendix A: Measure Lives...........................................................................................5206.2 Appendix B: Relationship between Program Savings and Evaluation Savings.......5266.3 Appendix C: Lighting Audit and Design Tool..............................................................5276.4 Appendix D: Motor & VFD Audit and Design Tool.......................................................5286.5 Appendix E: Eligibility Requirements for Solid State Lighting Products in
Commercial and Industrial Applications................................................................5296.5.1 Solid State Lighting.....................................................................................................................529
6.6 Appendix F: Zip Code Mapping.....................................................................................531
ContentsPage iv
State of Pennsylvania – Technical Reference Manual – Rev Date: Feb 2017
ContentsPage v
State of Pennsylvania – Technical Reference Manual – Rev Date: Feb 2017
LIST OF FIGURESFigure 2-1: Daily Load Shapes for Hot Water Measurers...........................................................115Figure 2-2: Daily Load Shapes for Hot Water Measures.............................................................121Figure 2-3: Daily Load Shapes for Hot Water Measures.............................................................126Figure 2-4: Uo Baseline Requirements.......................................................................................201Figure 3-1: Load shapes for hot water in four commercial building types...................................337Figure 3-2: Energy to demand factors for four commercial building types..................................337Figure 3-3: Dependence of COP on Outdoor Wetbulb Temperature..........................................339Figure 3-4: Load shapes for hot water in four commercial building types...................................345Figure 3-5: Energy to demand factors for four commercial building types..................................346Figure 3-6: Load shapes for hot water in four commercial building types...................................350Figure 3-7: Energy to demand factors for four commercial building types..................................351Figure 3-8: Load Shapes for Hot Water in Four Commercial Building Types..............................356Figure 3-9: Energy to Demand Factors for Four Commercial Building Types.............................356Figure 3-10: Load Shapes for Hot Water in Four Commercial Building Types............................362Figure 3-11: Energy to Demand Factors for Four Commercial Building Types...........................362Figure 3-12: Dependence of COP on Outdoor Wetbulb Temperature........................................364Figure 3-13: Utilization factor for a sample week in July.............................................................426Figure 4-1: Typical Dairy Vacuum Pump Coincident Peak Demand Reduction..........................505
ContentsPage vi
State of Pennsylvania – Technical Reference Manual – Rev Date: Feb 2017
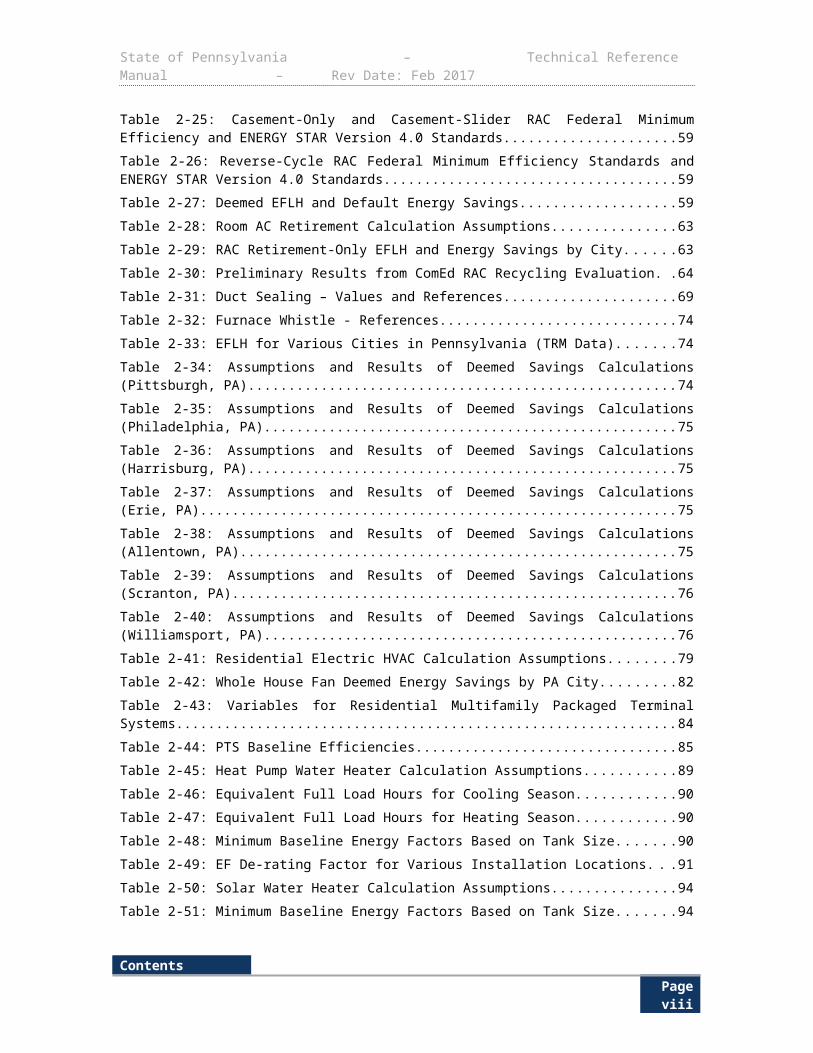
LIST OF TABLES Table 1-1: End-Use Categories and Measures in the TRM............................................................3Table 1-2: kWh Savings Thresholds...............................................................................................4Table 1-3: Periods for Energy Savings and Coincident Peak Demand Savings...........................10Table 1-4: Line Loss Factors Used in the EE and DR Potential Studies As Provided by the EDCs...................................................................................................................................................... 13Table 2-1: ENERGY STAR Lighting - References........................................................................19Table 2-2: Baseline Wattage by Lumen Output for General Service Lamps (GSL)......................20Table 2-3: Baseline Wattage by Lumen Output for Specialty Lamps............................................21Table 2-4. Default Baseline Wattage for Reflector Bulbs..............................................................22Table 2-5: Bulb and Fixture Hours of Use and Peak Coincidence Factor Values, by Room.........22Table 2-6: CFL and LED Energy and Demand HVAC Interactive Effects by EDC........................23Table 2-7: Residential Occupancy Sensors Calculations Assumptions........................................25Table 2-8: Electroluminescent Nightlight - References.................................................................27Table 2-9: LED Nightlight - References........................................................................................29Table 2-10: Holiday Lights Assumptions.......................................................................................32Table 2-11: Residential Electric HVAC Measure Baseline Conditions..........................................34Table 2-12: Residential Electric HVAC - References....................................................................38Table 2-13: Alternate Cooling EFLH.............................................................................................42Table 2-14: Alternate Heating EFLH.............................................................................................42Table 2-15: Default values for algorithm terms, Fuel Switching, Electric Heat to Gas Heat..........47Table 2-16: Alternate Heating EFLH for Air Source Heat Pumps.................................................49Table 2-17: Alternate Heating EFLH for Electric Furnaces...........................................................49Table 2-18: Alternate Heating EFLH for Electric Baseboard Heating...........................................49Table 2-19: Alternate Heating EFLH for Fossil Fuel Furnaces......................................................49Table 2-20: Alternate Heating EFLH for Fossil Fuel Boilers..........................................................50Table 2-21: DHP – Values and References..................................................................................53Table 2-22: DHP – Heating Zones................................................................................................55Table 2-23: ENERGY STAR Room AC - References...................................................................58Table 2-24: RAC (without reverse cycle) Federal Minimum Efficiency and ENERGY STAR Version 4.0 Standards.................................................................................................................. 58Table 2-25: Casement-Only and Casement-Slider RAC Federal Minimum Efficiency and ENERGY STAR Version 4.0 Standards........................................................................................59Table 2-26: Reverse-Cycle RAC Federal Minimum Efficiency Standards and ENERGY STAR Version 4.0 Standards.................................................................................................................. 59Table 2-27: Deemed EFLH and Default Energy Savings..............................................................59Table 2-28: Room AC Retirement Calculation Assumptions.........................................................63Table 2-29: RAC Retirement-Only EFLH and Energy Savings by City.........................................63Table 2-30: Preliminary Results from ComEd RAC Recycling Evaluation....................................64Table 2-31: Duct Sealing – Values and References.....................................................................69Table 2-32: Furnace Whistle - References...................................................................................74Table 2-33: EFLH for Various Cities in Pennsylvania (TRM Data)................................................74
ContentsPage vii
State of Pennsylvania – Technical Reference Manual – Rev Date: Feb 2017
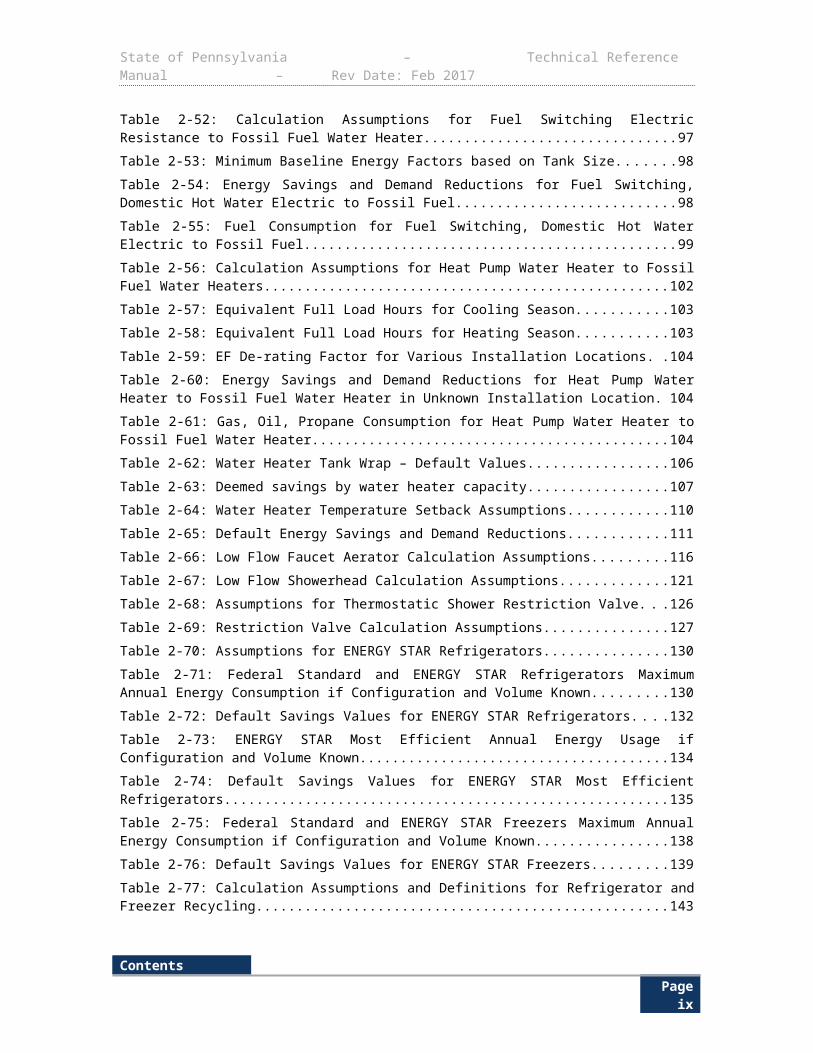
Table 2-34: Assumptions and Results of Deemed Savings Calculations (Pittsburgh, PA)............74Table 2-35: Assumptions and Results of Deemed Savings Calculations (Philadelphia, PA)........75Table 2-36: Assumptions and Results of Deemed Savings Calculations (Harrisburg, PA)...........75Table 2-37: Assumptions and Results of Deemed Savings Calculations (Erie, PA).....................75Table 2-38: Assumptions and Results of Deemed Savings Calculations (Allentown, PA)............75Table 2-39: Assumptions and Results of Deemed Savings Calculations (Scranton, PA).............76Table 2-40: Assumptions and Results of Deemed Savings Calculations (Williamsport, PA)........76Table 2-41: Residential Electric HVAC Calculation Assumptions.................................................79Table 2-42: Whole House Fan Deemed Energy Savings by PA City............................................82Table 2-43: Variables for Residential Multifamily Packaged Terminal Systems............................84Table 2-44: PTS Baseline Efficiencies..........................................................................................85Table 2-45: Heat Pump Water Heater Calculation Assumptions..................................................89Table 2-46: Equivalent Full Load Hours for Cooling Season........................................................90Table 2-47: Equivalent Full Load Hours for Heating Season........................................................90Table 2-48: Minimum Baseline Energy Factors Based on Tank Size...........................................90Table 2-49: EF De-rating Factor for Various Installation Locations...............................................91Table 2-50: Solar Water Heater Calculation Assumptions............................................................94Table 2-51: Minimum Baseline Energy Factors Based on Tank Size...........................................94Table 2-52: Calculation Assumptions for Fuel Switching Electric Resistance to Fossil Fuel Water Heater........................................................................................................................................... 97Table 2-53: Minimum Baseline Energy Factors based on Tank Size............................................98Table 2-54: Energy Savings and Demand Reductions for Fuel Switching, Domestic Hot Water Electric to Fossil Fuel.................................................................................................................... 98Table 2-55: Fuel Consumption for Fuel Switching, Domestic Hot Water Electric to Fossil Fuel. . .99Table 2-56: Calculation Assumptions for Heat Pump Water Heater to Fossil Fuel Water Heaters.................................................................................................................................................... 102Table 2-57: Equivalent Full Load Hours for Cooling Season......................................................103Table 2-58: Equivalent Full Load Hours for Heating Season......................................................103Table 2-59: EF De-rating Factor for Various Installation Locations.............................................104Table 2-60: Energy Savings and Demand Reductions for Heat Pump Water Heater to Fossil Fuel Water Heater in Unknown Installation Location..........................................................................104Table 2-61: Gas, Oil, Propane Consumption for Heat Pump Water Heater to Fossil Fuel Water Heater......................................................................................................................................... 104Table 2-62: Water Heater Tank Wrap – Default Values..............................................................106Table 2-63: Deemed savings by water heater capacity..............................................................107Table 2-64: Water Heater Temperature Setback Assumptions...................................................110Table 2-65: Default Energy Savings and Demand Reductions...................................................111Table 2-66: Low Flow Faucet Aerator Calculation Assumptions.................................................116Table 2-67: Low Flow Showerhead Calculation Assumptions....................................................121Table 2-68: Assumptions for Thermostatic Shower Restriction Valve........................................126Table 2-69: Restriction Valve Calculation Assumptions..............................................................127Table 2-70: Assumptions for ENERGY STAR Refrigerators.......................................................130
ContentsPage viii
State of Pennsylvania – Technical Reference Manual – Rev Date: Feb 2017
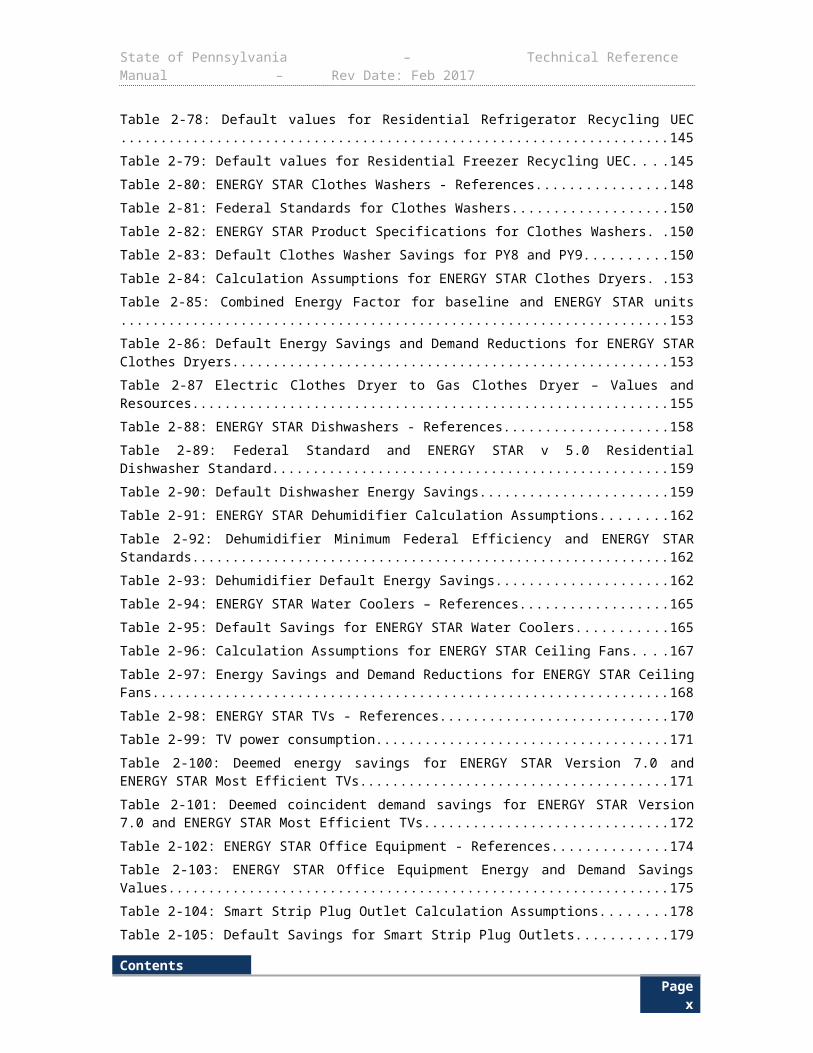
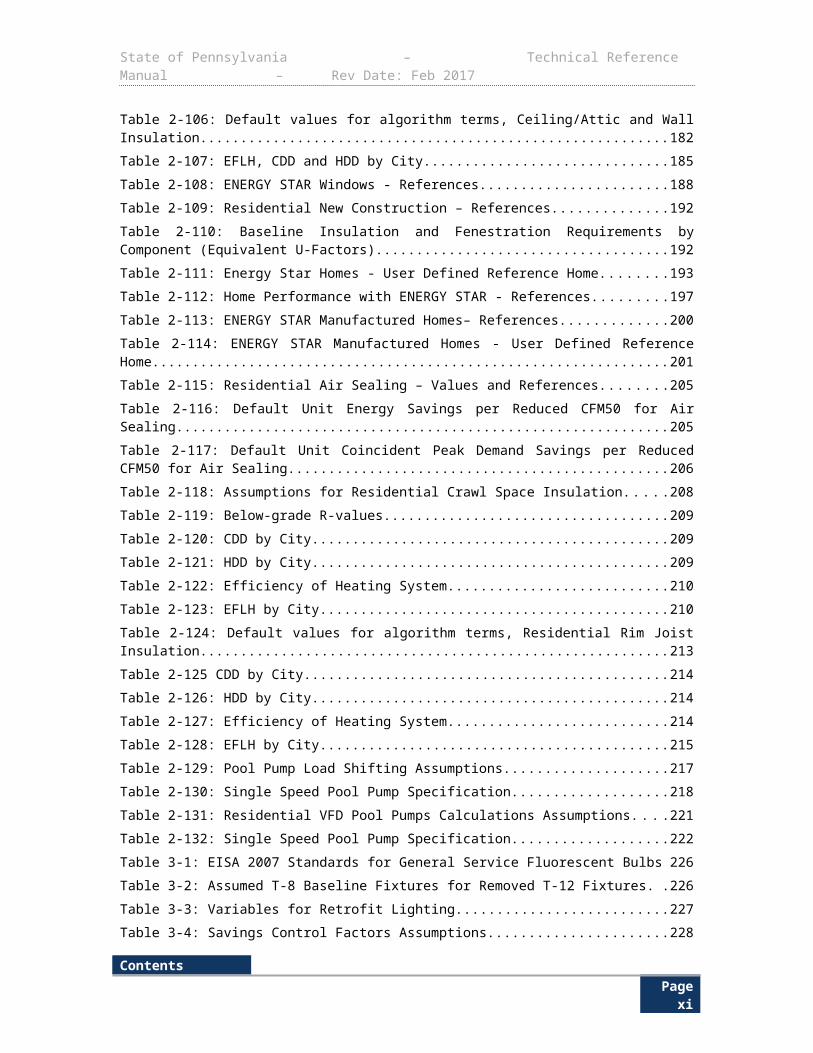
Table 2-71: Federal Standard and ENERGY STAR Refrigerators Maximum Annual Energy Consumption if Configuration and Volume Known......................................................................130Table 2-72: Default Savings Values for ENERGY STAR Refrigerators......................................132Table 2-73: ENERGY STAR Most Efficient Annual Energy Usage if Configuration and Volume Known......................................................................................................................................... 134Table 2-74: Default Savings Values for ENERGY STAR Most Efficient Refrigerators................135Table 2-75: Federal Standard and ENERGY STAR Freezers Maximum Annual Energy Consumption if Configuration and Volume Known......................................................................138Table 2-76: Default Savings Values for ENERGY STAR Freezers.............................................139Table 2-77: Calculation Assumptions and Definitions for Refrigerator and Freezer Recycling.. .143Table 2-78: Default values for Residential Refrigerator Recycling UEC.....................................145Table 2-79: Default values for Residential Freezer Recycling UEC............................................145Table 2-80: ENERGY STAR Clothes Washers - References.....................................................148Table 2-81: Federal Standards for Clothes Washers..................................................................150Table 2-82: ENERGY STAR Product Specifications for Clothes Washers.................................150Table 2-83: Default Clothes Washer Savings for PY8 and PY9..................................................150Table 2-84: Calculation Assumptions for ENERGY STAR Clothes Dryers.................................153Table 2-85: Combined Energy Factor for baseline and ENERGY STAR units...........................153Table 2-86: Default Energy Savings and Demand Reductions for ENERGY STAR Clothes Dryers.................................................................................................................................................... 153Table 2-87 Electric Clothes Dryer to Gas Clothes Dryer – Values and Resources.....................155Table 2-88: ENERGY STAR Dishwashers - References............................................................158Table 2-89: Federal Standard and ENERGY STAR v 5.0 Residential Dishwasher Standard.....159Table 2-90: Default Dishwasher Energy Savings........................................................................159Table 2-91: ENERGY STAR Dehumidifier Calculation Assumptions..........................................162Table 2-92: Dehumidifier Minimum Federal Efficiency and ENERGY STAR Standards.............162Table 2-93: Dehumidifier Default Energy Savings......................................................................162Table 2-94: ENERGY STAR Water Coolers – References.........................................................165Table 2-95: Default Savings for ENERGY STAR Water Coolers................................................165Table 2-96: Calculation Assumptions for ENERGY STAR Ceiling Fans.....................................167Table 2-97: Energy Savings and Demand Reductions for ENERGY STAR Ceiling Fans...........168Table 2-98: ENERGY STAR TVs - References..........................................................................170Table 2-99: TV power consumption............................................................................................171Table 2-100: Deemed energy savings for ENERGY STAR Version 7.0 and ENERGY STAR Most Efficient TVs................................................................................................................................ 171Table 2-101: Deemed coincident demand savings for ENERGY STAR Version 7.0 and ENERGY STAR Most Efficient TVs............................................................................................................172Table 2-102: ENERGY STAR Office Equipment - References...................................................174Table 2-103: ENERGY STAR Office Equipment Energy and Demand Savings Values.............175Table 2-104: Smart Strip Plug Outlet Calculation Assumptions..................................................178Table 2-105: Default Savings for Smart Strip Plug Outlets.........................................................179Table 2-106: Default values for algorithm terms, Ceiling/Attic and Wall Insulation.....................182Table 2-107: EFLH, CDD and HDD by City................................................................................185
ContentsPage ix
State of Pennsylvania – Technical Reference Manual – Rev Date: Feb 2017
Table 2-108: ENERGY STAR Windows - References................................................................188Table 2-109: Residential New Construction – References..........................................................192Table 2-110: Baseline Insulation and Fenestration Requirements by Component (Equivalent U-Factors)....................................................................................................................................... 192Table 2-111: Energy Star Homes - User Defined Reference Home...........................................193Table 2-112: Home Performance with ENERGY STAR - References........................................197Table 2-113: ENERGY STAR Manufactured Homes– References.............................................200Table 2-114: ENERGY STAR Manufactured Homes - User Defined Reference Home..............201Table 2-115: Residential Air Sealing – Values and References..................................................205Table 2-116: Default Unit Energy Savings per Reduced CFM50 for Air Sealing........................205Table 2-117: Default Unit Coincident Peak Demand Savings per Reduced CFM50 for Air Sealing.................................................................................................................................................... 206Table 2-118: Assumptions for Residential Crawl Space Insulation.............................................208Table 2-119: Below-grade R-values...........................................................................................209Table 2-120: CDD by City...........................................................................................................209Table 2-121: HDD by City...........................................................................................................209Table 2-122: Efficiency of Heating System.................................................................................210Table 2-123: EFLH by City..........................................................................................................210Table 2-124: Default values for algorithm terms, Residential Rim Joist Insulation......................213Table 2-125 CDD by City............................................................................................................214Table 2-126: HDD by City...........................................................................................................214Table 2-127: Efficiency of Heating System.................................................................................214Table 2-128: EFLH by City..........................................................................................................215Table 2-129: Pool Pump Load Shifting Assumptions..................................................................217Table 2-130: Single Speed Pool Pump Specification..................................................................218Table 2-131: Residential VFD Pool Pumps Calculations Assumptions.......................................221Table 2-132: Single Speed Pool Pump Specification..................................................................222Table 3-1: EISA 2007 Standards for General Service Fluorescent Bulbs...................................226Table 3-2: Assumed T-8 Baseline Fixtures for Removed T-12 Fixtures......................................226Table 3-3: Variables for Retrofit Lighting.....................................................................................227Table 3-4: Savings Control Factors Assumptions.......................................................................228Table 3-5: Lighting HOU and CF by Building Type for Screw-Based Bulbs................................229Table 3-6: Lighting HOU and CF by Building Type for Other General Service Lighting..............229Table 3-7: Street lighting HOU by EDC.......................................................................................230Table 3-8: Interactive Factors for All Bulb Types........................................................................230Table 3-9: Interactive Factors for Comfort Cooled Spaces for All Building Types.......................231Table 3-10: Variables for New Construction Lighting..................................................................236Table 3-11: Lighting Power Densities from ASHRAE 90.1-2007 Building Area Method.............237Table 3-12: Lighting Power Densities from ASHRAE 90.1-2007 Space-by-Space Method........238Table 3-13: Baseline Exterior Lighting Power Densities.............................................................240Table 3-14: Default Baseline Savings Control Factors Assumptions for New Construction Only241Table 3-15: Lighting Controls Assumptions................................................................................246
ContentsPage x
State of Pennsylvania – Technical Reference Manual – Rev Date: Feb 2017
Table 3-16: Assumptions for LED Traffic Signals.......................................................................248Table 3-17: Default Values for Traffic Signal and Pedestrian Signage Upgrades.......................249Table 3-18: LED Exit Signs Calculation Assumptions.................................................................251Table 3-19: LED Exit Signs Calculation Assumptions.................................................................252Table 3-20: LED Channel Signage Calculation Assumptions.....................................................255Table 3-21: Power demand of baseline (neon and argon-mercury) and energy-efficient (LED) signs........................................................................................................................................... 256Table 3-22: LED: Refrigeration Case Lighting – Values and References...................................258Table 3-23: Variables for HVAC Systems...................................................................................261Table 3-24: HVAC Baseline Efficiencies.....................................................................................264Table 3-25: Air Conditioning EFLHs for Pennsylvania Cities......................................................266Table 3-26: Air Conditioning Demand CFs for Pennsylvania Cities............................................267Table 3-27: Heat Pump EFLHs for Pennsylvania Cities..............................................................268Table 3-28: Electric Chiller Variables..........................................................................................271Table 3-29: Electric Chiller Baseline Efficiencies (IECC 2009)...................................................272Table 3-30: Chiller EFLHs for Pennsylvania Cities.....................................................................273Table 3-31: Chiller Demand CFs for Pennsylvania Cities...........................................................273Table 3-32: Water Source or Geothermal Heat Pump Baseline Assumptions............................276Table 3-33: Geothermal Heat Pump– Values and Assumptions.................................................279Table 3-34: Federal Baseline Motor Efficiencies for NEMA Design A and NEMA Design B Motors.................................................................................................................................................... 281Table 3-35: Ground/Water Loop Pump and Circulating Pump Efficiency....................................282Table 3-36: Default Baseline Equipment Efficiencies.................................................................283Table 3-37: DHP – Values and References................................................................................286Table 3-38: Act 129 Sunset Dates for ENERGY STAR Furnaces..............................................289Table 3-39: ENERGY STAR Requirements for Furnaces and Boilers........................................290Table 3-40: Variables for HVAC Systems...................................................................................291Table 3-41: HVAC Baseline Efficiency Values............................................................................292Table 3-42: Refrigerant Charge Correction Calculations Assumptions.......................................296Table 3-43: Refrigerant charge correction COP degradation factor (RCF) for various relative charge adjustments for both TXV metered and non-TXV units...................................................298Table 3-44: Variables for HVAC Systems...................................................................................301Table 3-45: RAC Federal Minimum Efficiency and ENERGY STAR Version 4.0 Standards......302Table 3-46: Casement-Only and Casement-Slider RAC Federal Minimum Efficiency and ENERGY STAR Version 4.0 Standards......................................................................................302Table 3-47: Reverse-Cycle RAC Federal Minimum Efficiency Standards and ENERGY STAR Version 4.0 Standards................................................................................................................303Table 3-48: Guest Room Occupancy Sensor – Values and References....................................305Table 3-49: Energy Savings for Guest Room Occupancy Sensors – Motels..............................305Table 3-50: Energy Savings for Guest Room Occupancy Sensors – Hotels..............................305Table 3-51: Peak Demand Savings for Guest Room Occupancy Sensors – Motels...................306Table 3-52: Peak Demand Savings for Guest Room Occupancy Sensors – Hotels...................306Table 3-53: Economizer – Values and References.....................................................................309
ContentsPage xi
State of Pennsylvania – Technical Reference Manual – Rev Date: Feb 2017
Table 3-54: FCHr for PA Climate Zones and Various Operating Conditions...............................309Table 3-55: Default HVAC Efficiencies for Non-Residential Buildings........................................309Table 3-56: Building Mechanical System Variables for Premium Efficiency Motor Calculations.315Table 3-57: Baseline Efficiencies for NEMA Design A and NEMA Design B Motors..................316Table 3-58: Baseline Motor Efficiencies for NEMA Design C Motors..........................................317Table 3-59: Default RHRS and CFs for Supply Fan Motors in Commercial Buildings................318Table 3-60: Default RHRS and CFs for Chilled Water Pump (CHWP) Motors in Commercial Buildings..................................................................................................................................... 320Table 3-61: Default RHRS and CFs for Cooling Tower Fan (CTF) Motors in Commercial Buildings.................................................................................................................................................... 321Table 3-62: Default RHRS and CFs for Heating Hot Water Pump (HHWP) Motors in Commercial Buildings..................................................................................................................................... 322Table 3-63: Default RHRS and CFs for Condenser Water Pump Motors in Commercial Buildings.................................................................................................................................................... 323Table 3-64: Variables for VFD Calculations................................................................................325Table 3-65: ESF and DSF for Typical Commercial VFD Installations.........................................326Table 3-66: ECM Circulating Fan – Values and References.......................................................330Table 3-67: Default Motor Wattage (WATTSbase and WATTSee) for Circulating Fan....................331Table 3-68: VSD on Kitchen Exhaust Fan – Variables and References.....................................333Table 3-69: Typical water heating loads.....................................................................................336Table 3-70: COP Adjustment Factors.........................................................................................338Table 3-71: Heat Pump Water Heater Calculation Assumptions................................................340Table 3-72: Minimum Baseline Energy Factor Based on Tank Size...........................................341Table 3-73: Energy Savings Algorithms......................................................................................341Table 3-74: Low Flow Pre-Rinse Sprayer Calculations Assumptions.........................................347Table 3-75: Low Flow Pre-Rinse Sprayer Calculations Assumptions.........................................351Table 3-76: Low Flow Pre-Rinse Sprayer Default Savings.........................................................352Table 3-77: Commercial Water Heater Fuel Switch Calculation Assumptions............................357Table 3-78: Minimum Baseline Energy Factor Based on Tank Size...........................................358Table 3-79: Water Heating Fuel Switch Energy Savings Algorithms..........................................358Table 3-80: COP Adjustment Factors.........................................................................................363Table 3-81: Heat Pump Water Heater Fuel Switch Calculation Assumptions.............................365Table 3-82: Minimum Baseline Energy Factors Based on Tank Size.........................................366Table 3-83: Energy Savings Algorithms......................................................................................366Table 3-84: Refrigeration Cases - References............................................................................370Table 3-85: Refrigeration & Freezer Case Efficiencies (PY8).....................................................370Table 3-86: Refrigeration Case Savings (PY8)...........................................................................371Table 3-87: Freezer Case Savings (PY8)...................................................................................371Table 3-88: Refrigerator and Freezer Case Baseline Efficiencies (PY9-PY12)..........................371Table 3-89: Variables for High-Efficiency Evaporator Fan Motor................................................374Table 3-90: Variables for HE Evaporator Fan Motor...................................................................375Table 3-91: PSC to ECM Deemed Savings................................................................................375Table 3-92: Shaded Pole to ECM Deemed Savings...................................................................376
ContentsPage xii
State of Pennsylvania – Technical Reference Manual – Rev Date: Feb 2017
Table 3-93: Variables for High-Efficiency Evaporator Fan Motor................................................378Table 3-94: Variables for HE Evaporator Fan Motor...................................................................379Table 3-95: PSC to ECM Deemed Savings................................................................................379Table 3-96: Shaded Pole to ECM Deemed Savings...................................................................380Table 3-97: Evaporator Fan Controller Calculations Assumptions..............................................383Table 3-98: Floating Head Pressure Controls – Values and References....................................386Table 3-99: Annual Savings kWh/HP by Location......................................................................387Table 3-100: Default Condenser Type Annual Savings kWh/HP by Location.............................387Table 3-101 Anti-Sweat Heater Controls – Values and References...........................................390Table 3-102: Recommended Fully Deemed Impact Estimates...................................................391Table 3-103: Evaporator Coil Defrost Control – Values and References....................................394Table 3-104: Savings Factor for Reduced Cooling Load............................................................394Table 3-105: VSD Compressor – Values and References..........................................................397Table 3-106: Strip Curtain Calculation Assumptions...................................................................400Table 3-107: Default Energy Savings and Demand Reductions for Strip Curtains.....................401Table 3-108: Strip Curtain Calculation Assumptions for Supermarkets......................................402Table 3-109: Strip Curtain Calculation Assumptions for Convenience Stores............................403Table 3-110: Strip Curtain Calculation Assumptions for Restaurants.........................................404Table 3-111: Strip Curtain Calculation Assumptions for Refrigerated Warehouses....................405Table 3-112: Night Covers Calculations Assumptions................................................................408Table 3-113: Savings Factors.....................................................................................................408Table 3-114: Auto Closers Calculation Assumptions..................................................................411Table 3-115: Refrigeration Auto Closers Deemed Savings.........................................................411Table 3-116: Door Gasket Assumptions.....................................................................................414Table 3-117: Door Gasket Savings Per Linear Foot for Walk-in and Reach-in Coolers and Freezers...................................................................................................................................... 414Table 3-118: Special Doors with Low or No Anti-Sweat Heat for Low Temp Case Calculations Assumptions............................................................................................................................... 416Table 3-119: Insulate Bare Refrigeration Suction Pipes Calculations Assumptions...................419Table 3-120: Insulate Bare Refrigeration Suction Pipes Savings per Linear Foot for Walk-in Coolers and Freezers of Restaurants and Grocery Stores.........................................................419Table 3-121: Assumptions for Adding Doors to Refrigerated Display Cases..............................421Table 3-122: Assumptions for Adding Doors to Refrigerated Display Cases..............................423Table 3-123: Commercial Clothes Washer Calculation Assumptions.........................................427Table 3-124: Default Savings for Top Loading ENERGY STAR Clothes Washer for Laundry in Multifamily Buildings (PY8-PY9).................................................................................................429Table 3-125: Default Savings for Front Loading ENERGY STAR Clothes Washer for Laundry in Multifamily Buildings (PY8-PY9).................................................................................................429Table 3-126: Default Savings for Top Loading ENERGY STAR Clothes Washer for Laundromats (PY8-PY9)................................................................................................................................... 430Table 3-127: Default Savings Front Loading ENERGY STAR Clothes Washer for Laundromats (PY8-PY9)................................................................................................................................... 430Table 3-128: Future Federal Standards for Clothes Washers (PY10-PY12)...............................431
ContentsPage xiii
State of Pennsylvania – Technical Reference Manual – Rev Date: Feb 2017
Table 3-129: Ice Machine Reference Values for Algorithm Components....................................433Table 3-130: Batch-Type Ice Machine Baseline Efficiencies (PY8-PY9)....................................434Table 3-131: Batch-Type Ice Machine ENERGY STAR Efficiencies (PY8-PY9)........................434Table 3-132: Batch-Type Ice Machine Baseline Efficiencies (PY10-PY12)................................435Table 3-133: Continuous Type Ice Machine Baseline Efficiencies (PY10-PY12)........................435Table 3-134: Batch-Type Ice Machine ENERGY STAR Efficiencies (PY10-PY12)....................436Table 3-135: Continuous Type Ice Machine ENERGY STAR Efficiencies (PY10-PY12)............436Table 3-136: Beverage Machine Control Calculation Assumptions............................................438Table 3-137: Beverage Machine Controls Energy Savings.........................................................439Table 3-138: Snack Machine Controls – Values and References...............................................440Table 3-139: Steam Cooker - Values and References...............................................................444Table 3-140: Default Values for Electric Steam Cookers by Number of Pans............................445Table 3-141: ENERGY STAR Refrigerated Beverage Vending Machine – Values and Resources.................................................................................................................................................... 448Table 3-142: Default Beverage Vending Machine Energy Savings............................................448Table 3-143: Non-Residential Insulation – Values and References............................................451Table 3-144: Ceiling R-Values by Building Type.........................................................................452Table 3-145: Wall R-Values by Building Type.............................................................................453Table 3-146: ENERGY STAR Office Equipment - References...................................................457Table 3-147: ENERGY STAR Office Equipment Measure Life...................................................458Table 3-148: ENERGY STAR Office Equipment Energy and Demand Savings Values.............458Table 3-149: Network Power Controls, Per Unit Summary Table...............................................461Table 3-150: Smart Strip Calculation Assumptions.....................................................................464Table 3-151: Cycling Refrigerated Thermal Mass Dryer – Values and References....................466Table 3-152: Annual Hours of Compressor Operation................................................................466Table 3-153: Coincidence Factors..............................................................................................466Table 3-154: Air-entraining Air Nozzle – Values and References...............................................469Table 3-155: Baseline Nozzle Mass Flow...................................................................................469Table 3-156: Air Entraining Nozzle Mass Flow...........................................................................469Table 3-157: Average Compressor kW / CFM (COMP)..............................................................469Table 3-158: Annual Hours of Compressor Operation................................................................470Table 3-159: Coincidence Factor................................................................................................470Table 3-160: No-loss Condensate Drains – Values and References..........................................473Table 3-161: Average Air Loss Rates (ALR)...............................................................................474Table 3-162: Average Compressor kW/CFM (COMP)................................................................474Table 3-163: Adjustment Factor (AF)..........................................................................................475Table 3-164: Annual Hours of Compressor Operation................................................................475Table 3-165: Coincidence Factor................................................................................................475Table 1-3-166: Assumptions for Air Tanks for Load/No Load Compressors...............................478Table 3-167: Annual Hours of Compressor Operation, HOURS.................................................478Table 3-168: ENERGY STAR Server Measure Assumptions.....................................................481Table 3-169: ENERGY STAR Server Utilization Default Assumptions.......................................481
ContentsPage xiv
State of Pennsylvania – Technical Reference Manual – Rev Date: Feb 2017
Table 3-170: ENERGY STAR Server Ratio of Idle Power to Full Load Power Factors...............481Table 4-1: Variables for Automatic Milker Takeoffs....................................................................486Table 4-2: Variables for Dairy Scroll Compressors.....................................................................489Table 4-3: Variables for Ventilation Fans....................................................................................492Table 4-4: Default values for standard and high efficiency ventilation fans for dairy and swine facilities....................................................................................................................................... 493Table 4-5. Default Hours for Ventilation Fans by Facility Type by Location (No Thermostat).....493Table 4-6. Default Hours Reduced by Thermostats by Facility Type and Location.....................493Table 4-7: Variables for Heat Reclaimers...................................................................................496Table 4-8: Variables for HVLS Fans...........................................................................................499Table 4-9: Default Values for Conventional and HVLS Fan Wattages........................................499Table 4-10. Default Hours by Location for Dairy/Poultry/Swine Applications..............................500Table 4-11: Variables for Livestock Waterers.............................................................................502Table 4-12: Variables for VSD Controller on Dairy Vacuum Pump.............................................506Table 4-13: Variables for Low Pressure Irrigation Systems........................................................509Table 5-1: Definitions of Terms for Estimating C&I Load Curtailment............................................................514
ContentsPage xv
State of Pennsylvania – Technical Reference Manual – Rev Date: Feb 2017
This Page Intentionally Left Blank
2016 TECHNICAL REFERENCE MANUAL
Page xvi
State of Pennsylvania – Technical Reference Manual – Rev Date: Feb 2017
1 INTRODUCTIONThe Technical Reference Manual (TRM) was developed to measure the resource savings from standard energy efficiency measures. The savings’ algorithms use measured and customer data as input values in industry-accepted algorithms. The data and input values for the algorithms come from Alternative Energy Portfolio Standards (AEPS) application forms1, EDC program application forms, industry accepted standard values (e.g. ENERGY STAR standards), or data gathered by Electric Distribution Companies (EDCs). The standard input values are based on the best available measured or industry data.
Some electric input values were derived from a review of literature from various industry organizations, equipment manufacturers, and suppliers. These input values are updated to reflect changes in code, federal standards and recent program evaluations.
1.1 PURPOSEThe TRM was developed for the purpose of estimating annual electric energy savings and coincident peak demand savings for a selection of energy efficient technologies and measures. The TRM provides guidance to the Administrator responsible for awarding Alternative Energy Credits (AECs). The revised TRM serves a dual purpose of being used to determine compliance with the AEPS Act, 73 P.S. §§ 1648.1-1648.8, and the energy efficiency and conservation requirements of Act 129 of 2008, 66 Pa.C.S. § 2806.1. The TRM will continue to be updated as needed to reflect new and updated technologies, measures, and Federal and State standards and codes.
Resource savings to be measured include electric energy (kWh) and electric capacity (kW) savings. The algorithms in this document focus on the determination of the per unit annualized energy savings and peak demand savings for the energy efficiency measures. The algorithms and methodologies set forth in this document must be used to determine EDC reported gross savings and evaluation measurement and verification (EM&V) verified savings.
For an Act 129 program, EDCs may, as an alternative to using the energy and demand savings values for standard measures contained in the TRM, use alternative methods to calculate ex ante savings and/or ask their evaluation contractor to use a custom method to verify ex post savings. The EDCs, however, must track savings estimated from the TRM protocols and alternative methods and report both sets of values in the quarterly and/or annual EDC reports. The EDCs must justify the deviation from the TRM ex ante and ex post protocols in the quarterly and/or annual reports in which they report the deviations. EDCs should be aware that use of a custom method as an alternative to the approved TRM protocol increases the risk that the PA PUC may challenge their reported savings. The alternative measurement methods are subject to review and approval by the Commission to ensure their accuracy after the reports are filed to the Commission.
1.2 USING THE TRM This section provides a consistent framework for EDC Implementation Conservation Service Providers (ICSPs) to estimate ex ante (claimed) savings and for EDC evaluation contractors to estimate ex post (verified) savings for Act 129 Energy Efficiency & Conservation (EE&C) programs.
1 Note: Information in the TRM specifically relating to the AEPS Act is shaded in gray.
SECTION 1: IntroductionAlgorithms for Energy Efficient Measures Page 1
State of Pennsylvania – Technical Reference Manual – Rev Date: Feb 2017
1.2.1 MEASURE CATEGORIES The TRM categorizes all non-custom measures into two categories: deemed measures and partially deemed measures. Methods used to estimate ex ante and/or ex post savings differ for deemed measures and partially deemed measures.
Deemed measure protocols have specified “deemed energy and demand savings values”,2
no additional measurement or calculation is required to determine deemed savings. These protocols also may contain an algorithm with “stipulated variables”3 to provide transparency into deemed savings values and to facilitate the updating of deemed savings values in future TRMs. Stipulated variables should not be adjusted using customer-specific or program-specific information for calculating ex ante and/or ex post savings.
Partially deemed measure protocols have algorithms with stipulated4 and “open variables”,5 that require customer-specific input of certain parameters to calculate the energy and demand savings. Customer-specific or program-specific information is used for each open variable, resulting in multiple savings values for the same measure. Some open variables may have a default value to use when the open variable cannot be collected. Only variables specifically identified as open variables may be adjusted using customer-specific or program-specific information.
Note: Custom measures6 are considered too complex or unique to be included in the list of standard measures provided in the TRM and so are outside the scope of this TRM. Custom measures are determined through a custom-measure-specific process, which is described in Section 1.16 in this TRM.
1.2.2 CUSTOMER AND PROGRAM SPECIFIC DATA The EDCs and their contractors (ICSPs and ECs) are encouraged to collect and apply customer-specific or program-specific data in the ex ante and/or ex post savings calculations for as many open variables as possible to reflect most accurate savings values. Site-specific data or information should be used for measures with important variations in one or more input values (e.g. delta watts, efficiency level, equipment capacity, operating hours). Customer-specific data comes directly from the measure application form or application process and/or EDC data gathering, such as, facility staff interviews, posted schedules, building monitoring systems (BMS), panel data, or metered data. In addition, standard input values for stipulated variables and default values for some open variables provided in this TRM are to be based on evaluations completed in Pennsylvania or best available measured or industry data, available from other jurisdictions or industry associations. The EDCs may use default values for open variables in the TRM if customer-specific or program-specific information is unreliable or the EDCs cannot obtain the information.
Values for exact variables that should be determined using customer-specific information are clearly described in the measure protocols in this TRM. This methodology will provide the EDCs with more flexibility to use customer-specific data, when available obtained from their application process and evaluations to improve the accuracy and reliability of savings.
2 A stipulated value for a variable refers to a single input value to an algorithm, while a deemed savings estimate is the result of calculating the end result of all of the stipulated values in the savings algorithm. 3 A stipulated value for a variable refers to a single input value to an algorithm. 4 Ibid 5 Open variables are listed with a “default value” and an option for “EDC Data Gathering” in the TRM. When a measure indicates that an input to a prescriptive saving algorithm may take on a range of values, an average value is also provided in many cases. This value is considered the default input to the algorithm, and should be used when customer-specific information is not available. 6 This TRM does not provide calculations or algorithms for custom measures since the category covers a wide range of equipment, approaches, and measures. Where custom measures are discussed, the TRM requires site specific equipment, operating schedules, baseline and installed efficiencies, and calculation methodologies to estimate energy and demand savings.
SECTION 1: IntroductionAlgorithms for Energy Efficient Measures Page 2

State of Pennsylvania – Technical Reference Manual – Rev Date: Feb 2017
1.2.3 END-USE CATEGORIES & THRESHOLDS FOR USING DEFAULT VALUES The determination of when to use default values for open variables provided in the TRM in the ex ante and/or ex post savings calculations is a function of the savings impact and uncertainty associated with the measure.7 The default values are appropriate for low-impact and low-uncertainty measures such as lighting retrofits in a small business facility. In contrast, customer-specific values are appropriate for high-impact and high-uncertainty measures, such as HVAC or lighting retrofits in universities or hospitals that have diverse facilities, and where those types of projects represent a significant share of program savings for a year.
The TRM organizes all measures8 into various end-use categories9 (e.g. lighting, HVAC, motors & VFDs). kWh savings thresholds are established at the end-use category level and should be used to determine whether customer-specific information is required for estimating ex ante and/or ex post savings. If a project involves multiple measures/technology10 types that fall under the same end-use category, the savings for all those measures/technology types should be grouped together to determine if the project falls below or above a particular threshold. 11 Table 1-1 lists all the end-use categories and the sections for measures within a particular end-use category.
Table 1-1: End-Use Categories and Measures in the TRM12
End-Use Categories List of Measures (Sections)
Residential Market Sector
Lighting - 2.1 2.1.1 – 2.1.5
HVAC - 2.2 2.2.1 – 2.2.10
Domestic Hot Water - 2.3 2.3.1 – 2.3.10
Appliances – 2.4 2.4.1 – 2.4.10
Consumer Electronics – 2.5 2.5.1 – 2.5.3
Building Shell – 2.6 2.6.1 – 2.6.8
Miscellaneous – 2.7 2.7.1 – 2.7.2
Commercial & Industrial Market Sector
Lighting – 3.1 3.1.1 – 3.1.7
7 While the EDCs are required to collect and apply customer specific or program specific data for projects with savings at or above the established kWh thresholds in the TRM, they are allowed to use either default values or customer specific or program specific data for projects with savings below the thresholds. 8 A measure is defined as a new installation, the replacement of an existing installation, or the retrofitting/modification of an existing installation of a building, of a system or process component, or of an energy using device in order to reduce energy consumption. e.g., the installation of a 14W CFL is one measure, and the installation of a 21W CFL is a separate measure; the installation of wall insulation, or the modification of an existing building to reduce air infiltration are two other measures.. 9 An end-use is defined as the grouping of related technology types all associated with a similar application or primary function. E.g., CFLs, LEDs, fluorescent lamps, and lighting controls are all within the lighting end-use category; efficient water heaters, water heater blankets, water heater setback, and faucet aerators are all within the domestic hot water end-use category. 10 A technology is defined as the grouping of related measures in order to differentiate one type of measure from another. Each technology type may consist of multiple measures. e.g., CFLs, LEDs, and VFDs are all different technology types. A 14W CFL and a 21W CFL are different measures within the CFL technology type. 11 For example, linear fluorescent lighting, CFL lighting and LED lighting are individual measures within the Lighting end-use category. 12 Please note that this is not an exhaustive list of end-uses and that others may be included in future TRM updates.
SECTION 1: IntroductionAlgorithms for Energy Efficient Measures Page 3

State of Pennsylvania – Technical Reference Manual – Rev Date: Feb 2017
End-Use Categories List of Measures (Sections)
HVAC – 3.2 3.2.1 – 3.2.9
Motors & VFDs – 3.3 3.3.1 – 3.3.4
Domestic Hot Water – 3.4 3.4.1 – 3.4.5
Refrigeration – 3.5 3.5.1 – 3.5.16
Appliances – 3.6 3.6.1
Food Service Equipment – 3.7 3.7.1 – 3.7.5
Building Shell – 3.8 3.8.1
Consumer Electronics – 3.9 3.9.1 – 3.9.3
Compressed Air – 3.10 3.10.1 – 3.10.4
Miscellaneous – 3.11 3.11.1
Agricultural Sector
Agricultural Equipment4.1.1 – 4.1.8
Table 1-2 shows the kWh thresholds13 for various end-use categories. For projects with savings of established kWh thresholds or higher, the EDCs are required to collect site-specific information for open variables used in the calculation of energy and demand savings. If savings for individual end-use categories within projects fall below the threshold, the EDCs may gather customer-specific data, or may use the default stipulated value for each open variable. The thresholds below are subject to review and adjustment by the EDC ECs in coordination with SWE to minimize the uncertainty of estimates. End-use metering is the preferred method of data collection for projects above the threshold, but trend data from BMS or panel data and billing analysis14 are acceptable substitutes. The EDCs are encouraged to meter projects with savings below the thresholds that have high uncertainty but are not required where data is unknown, variable, or difficult to verify. Exact conditions of “high uncertainty” are to be determined by the EDCs to appropriately manage variance. Metering completed by the ICSP may be leveraged by the evaluation contractor, subject to a reasonableness review.15 This approach is intended to determine values for key variables and verify savings at a high level of rigor for projects that account for majority of the programs expected savings.
13 These end-use specific thresholds were developed by the SWE based on review of methods used by other jurisdictions. In addition, the SWE also performed a sensitivity analyses using different thresholds based on all the energy efficiency projects (partially deemed/non-custom) implemented in Phase I (PY1 through PY4) of Act 129 Programs among all the EDCs. 14 Billing analysis should be conducted using at least 12 months of billing data (pre- and post-retrofit). 15 EDC evaluation contractors must verify the project-specific M&V data (including pre and post metering results) obtained by the CSPs, as practicable, for projects in the evaluation sample. If the evaluation contractor determines that data collected by the CSPs are not reasonably valid, then the evaluator must perform measurements consistent with IPMVP options to collect post-retrofit information for projects that have estimated end-use savings above a threshold kWh/year level. The SWE reserves the right to audit and review claimed and verified impacts of any project selected in the evaluation sample.
SECTION 1: IntroductionAlgorithms for Energy Efficient Measures Page 4
State of Pennsylvania – Technical Reference Manual – Rev Date: Feb 2017
Table 1-2: kWh Savings Thresholds
End-Use Category Expected kWh/yr Savings Threshold1617
C&I Lighting >= 750,000
C&I HVAC >= 250,000
C&I Motors & VFDs >= 250,000
C&I Building Shell >= 250,000
Agricultural Equipment >= 250,000
1.2.4 APPLICABILITY OF THE TRM FOR ESTIMATING EX ANTE (CLAIMED) SAVINGS For replacements, retrofits, and new construction appliances,18 the applicable date for determining which TRM version to use to estimate EDC claimed savings is the “in-service date” (ISD) or “commercial date of operation” (CDO) – the date at which the measure is “installed and commercially operable,”19 and when savings actually start to occur. This is analogous to when a commercial customer’s meter “sees” the savings under expected and designed-for operation. For most projects, this is obvious. For projects with commissioning, the CDO occurs after the commissioning is completed. For incented measures that have been installed, but are not being used because there is no occupant, or will not be used until another, unrelated installation/project is completed; the equipment is not “commercially operable.” For these projects, the CDO is the date at which the customer begins using the incented equipment, not the date at which the equipment is energized. For new construction, the appropriate TRM must be based on the date when the building/construction permit was issued (or the date construction starts if no permit is required) because that aligns with codes and standards that define the baseline. Savings begin to accrue at the project’s ISD.
1.3 DEFINITIONSThe TRM is designed for use with both the AEPS Act and Act 129; however, it contains words and terms that apply only to the AEPS or only to Act 129. The following definitions are provided to identify words and terms that are specific for implementation of the AEPS:
Administrator/Program Administrator (PA) – The Credit Administrator of the AEPS program that receives and processes, and approves AEPS Credit applications.
AEPS application forms – application forms submitted to qualify and register alternative energy facilities for alternative energy credits.
Application worksheets – part of the AEPS application forms.
Alternative Energy Credits (AECs) – A tradable instrument used to establish, verify, and measure compliance with the AEPS. One credit is earned for each 1000kWh of electricity generated (or saved from energy efficiency or conservation measures) at a qualified alternative energy facility.
16 In situations where an ICSP meters a project because the expected kWh savings are above the established threshold and then realizes that the actual savings are below the threshold, metered results should be used for reporting claimed and verified savings. 17 The Commission allows the EDCs to use alternative methods for obtaining customer-sepcific data where customer processes do not support metering. The EDCs are required to provide supporting documentation to the SWE for review if there are any such exceptions.18 Appliances include: dishwashers, clothes washers, dryers, ovens/ranges, refrigerators, and freezers.19 Pennsylvania Public Utility Commission Act 129 Phase II Order, Docket Number: M-2012-2289411 and M-2008-2069887, Adopted August 2, 2012, language in Section K.1.b.
SECTION 1: IntroductionAlgorithms for Energy Efficient Measures Page 5
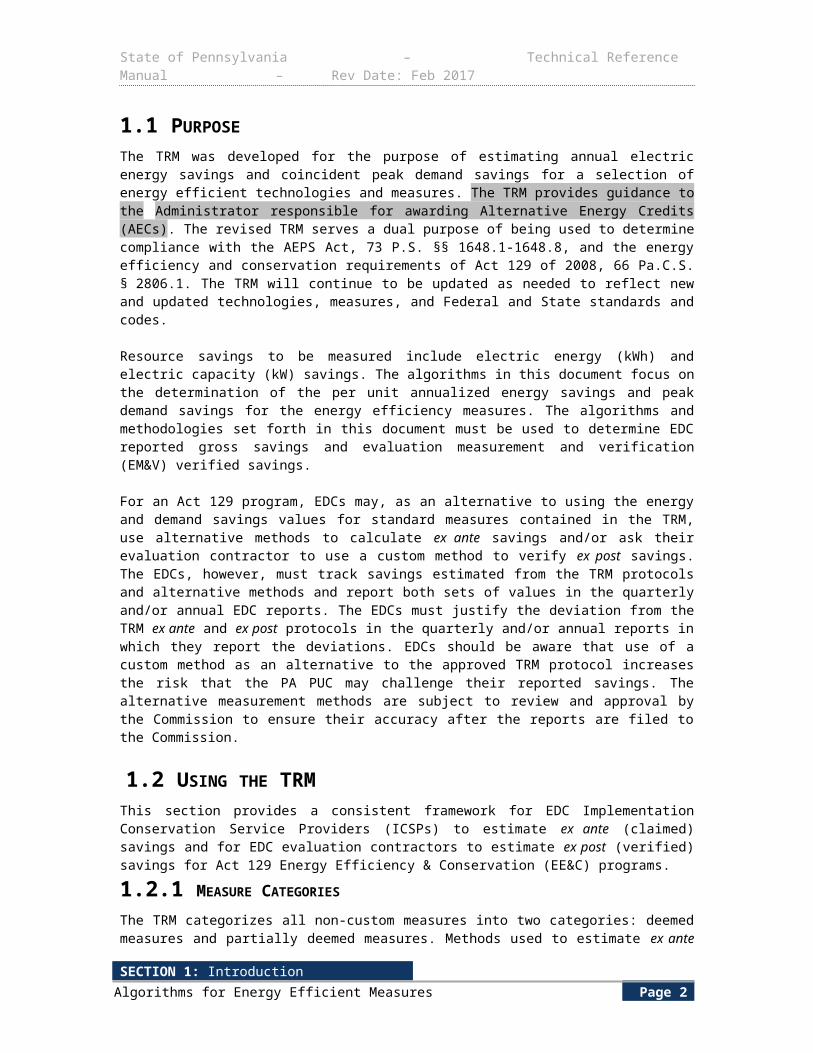
State of Pennsylvania – Technical Reference Manual – Rev Date: Feb 2017
Coincidence Factor (CF) – The ratio of the (1) sum of every unit’s average kW load during the PJM peak load period (June through August, non-holiday weekdays, 2 pm to 6 pm) to the (2) sum of the non-coincident maximum kW connected load for every unit. This value is expressed in decimal format throughout the TRM unless designated otherwise.
Direct Install (DI) Measure – A prescriptive measure implemented on site during an energy audit or other initial visit without the requirement of a diagnostic testing component. Examples of these DI measures that can be installed directly include the changing of an incandescent bulb to a CFL or LED or the installation of faucet aerators.
Early Retirement (ERET) Measure – The removal of equipment from service that is not scheduled to be replaced by either a more efficient option or a less efficient option and is deemed to be eligible for savings due to the nature of reduction in energy use by taking the equipment out of service.
EDC Reported Gross Savings – Also known as “EDC Claimed Savings” or “Ex Ante Savings”. EDC estimated savings for projects and programs of projects which are completed and/or M&Ved. The estimates follow a TRM method or Site Specific M&V Protocols (SSMVP). The savings calculations/estimates follow algorithms prescribed by the TRM or Site Specific M&V Protocols (SSMVP) and are based non-verified, estimated, stipulated, EDC gathered or measured values of key variables.
Efficiency Kits (KIT) – A collection of energy efficient upgrade measure materials that can be delivered to and installed by the end-user. Examples of these items are CFL light bulbs, LED nightlights, or faucet aerators.
Replace on Burnout (ROB) Measure – The replacement of equipment that has failed or is at the end of its service life with a model that is more efficient than required by the codes and standards in effect at the time of replacement, or is more efficient than standard practice if there are no applicable codes or standards. The baseline used for calculating energy savings for replace on burnout measures is the applicable code, standard or industry standard practice in the absence of applicable code or standards. The incremental cost for replacement on burnout measures is the difference between the cost of baseline and more efficient equipment. Examples of projects which fit in this category include replacement due to existing equipment failure, or imminent failure, as judged by a competent service specialist, as well as replacement of equipment which may still be in functional condition, but which is operationally obsolete due to industry advances and is no longer cost effective to keep.
New Construction Measure (Substantial Renovation Measure) – The substitution of efficient equipment for standard baseline equipment which the customer does not yet own or during the course of a major renovation project which removes existing, but operationally functional equipment. The baseline used for calculating energy savings is the construction of a new building or installation of new equipment that complies with applicable code, standard or industry standard practice in the absence of applicable code or standards in place at the time of construction/installation/substantial renovation. The incremental cost for a new construction or substantial renovation measure is the difference between the cost of the baseline and more efficient equipment. Examples of projects which fit in this category include installation of a new production line, construction of a new building, an addition to an existing facility, renovation of a plant which replaces an existing production line with a production line for a different product, substantial renovation of an existing building interior, replacement of an existing standard HVAC system with a ground source heat pump system.
Realization Rate – The ratio of “Verified Savings” to “EDC Reported Gross Savings”.
Retrofit Measure (RET) – Measures which modify or add on to existing equipment with technology to make the system more energy efficient. Retrofit measures have a dual baseline: for the estimated remaining useful life of the existing equipment the baseline is the existing equipment; afterwards the baseline is the applicable code, standard, or industry standard practice expected to be in place at the time the unit would have been naturally replaced or retrofit. If there are no known or expected changes to the baseline standards, the
SECTION 1: IntroductionAlgorithms for Energy Efficient Measures Page 6
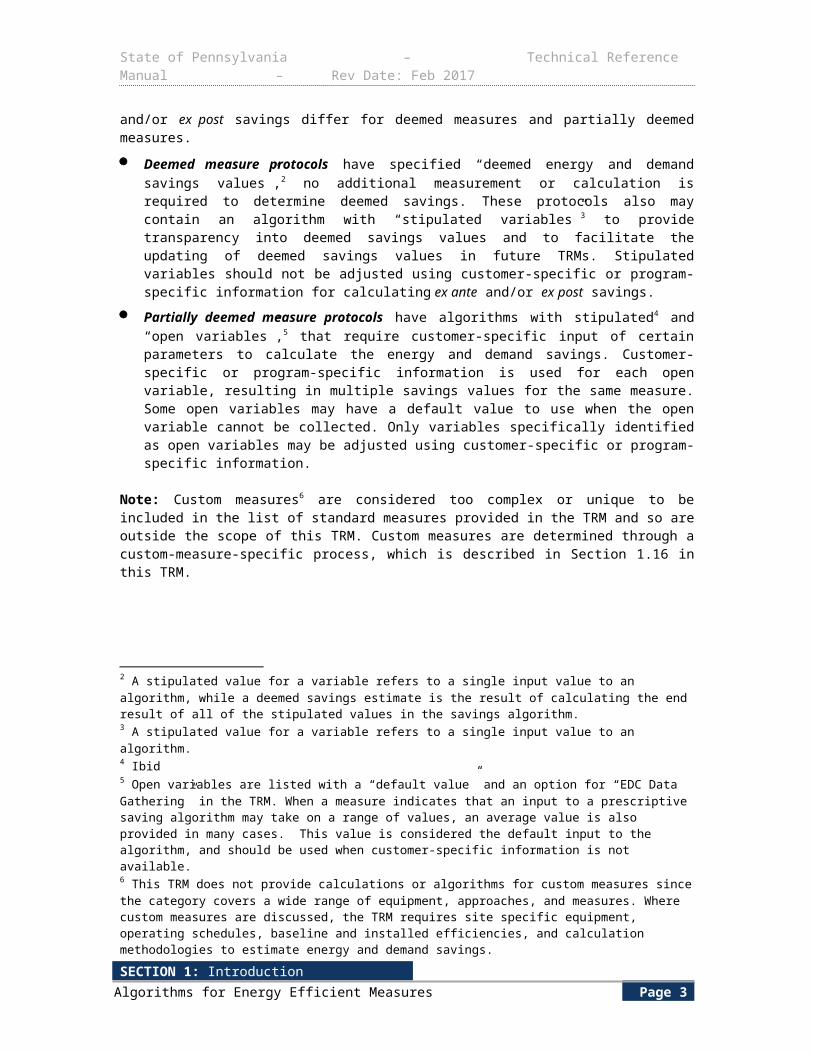
State of Pennsylvania – Technical Reference Manual – Rev Date: Feb 2017
standard in effect at the time of the retrofit is to be used. Incremental cost is the full cost of equipment retrofit. In practice, in order to avoid the uncertainty surrounding the determination of "remaining useful life" retrofit measure savings and costs sometimes follow replace on burnout baseline and incremental cost definitions. Examples of projects which fit this category include installation of a VFD on an existing HVAC system, or installation of wall or ceiling insulation.
Early Replacement Measure (EREP) – The replacement of existing equipment, which is functioning as intended and is not operationally obsolete, with a more efficient model primarily for purposes of increased efficiency. Early replacement measures have a dual baseline: for the estimated remaining useful life of the existing equipment the baseline is the existing equipment; afterwards the baseline is the applicable code, standard, or industry standard practice expected to be in place at the time the unit would have been naturally replaced. If there are no known or expected changes to the baseline standards, the standard in effect at the time of the early replacement is to be used. Incremental cost is the full cost of equipment replacement. In practice, in order to avoid the uncertainty surrounding the determination of "remaining useful life" early replacement measure savings and costs sometimes follow replace on burnout baseline and incremental cost definitions. Examples of projects which fit this category include upgrade of an existing production line to gain efficiency, upgrade an existing, but functional, lighting or HVAC system that is not part of a renovation/remodeling project, or replacement of an operational chiller with a more efficient unit.
Time of Sale (TOS) Measure – A measure implemented, usually incentivized at the retail level, that provides a financial incentive to the buyer or end user in order to promote the higher efficiency of the measure product over a standard efficiency product. Examples include the low-flow pre-rinse sprayers available to commercial kitchens and their applicable incentives to be purchased over standard flow sprayers.
Verified Gross Savings – Evaluator estimated savings for projects and programs of projects which are completed and for which the impact evaluation and EM&V activities are completed. The estimates follow a TRM method or Site Specific M&V Protocols (SSMVP). The savings calculations/estimates follow algorithms prescribed by the TRM or Site Specific M&V Protocols (SSMVP) and are based on verified values of stipulated variables, EDC or evaluator gathered data, or measured key variables.
Lifetime – The number of years (or hours) that the new high efficiency equipment is expected to function. These are generally based on engineering lives, but sometimes adjusted based on expectations about frequency of removal, remodeling or demolition. Two important distinctions fall under this definition; Effective Useful Life and Remaining Useful Life.
Effective Useful Life (EUL) – EUL is based on the manufacturers rating of the effective useful life; how long the equipment will last. For example, a CFL that operates x hours per year will typically have an EUL of y. A house boiler may have a lifetime of 20 years but the EUL is only 15 years since after that time it may be operating at a non-efficient point. It is an estimate of the median number of years that the measures installed under a program are still in place and operable.
Remaining Useful Life (RUL) – It applies to retrofit or early replacement measures. For example, if an existing working refrigerator is replaced with a high efficiency unit, the RUL is an assumption of how many more years the existing unit would have lasted.
1.4 GENERAL FRAMEWORKIn general, energy and demand savings will be estimated using TRM stipulated values, measured values, customer data and information from the AEPS application forms, worksheets and field tools.
Three systems will work together to ensure accurate data on a given measure:
SECTION 1: IntroductionAlgorithms for Energy Efficient Measures Page 7
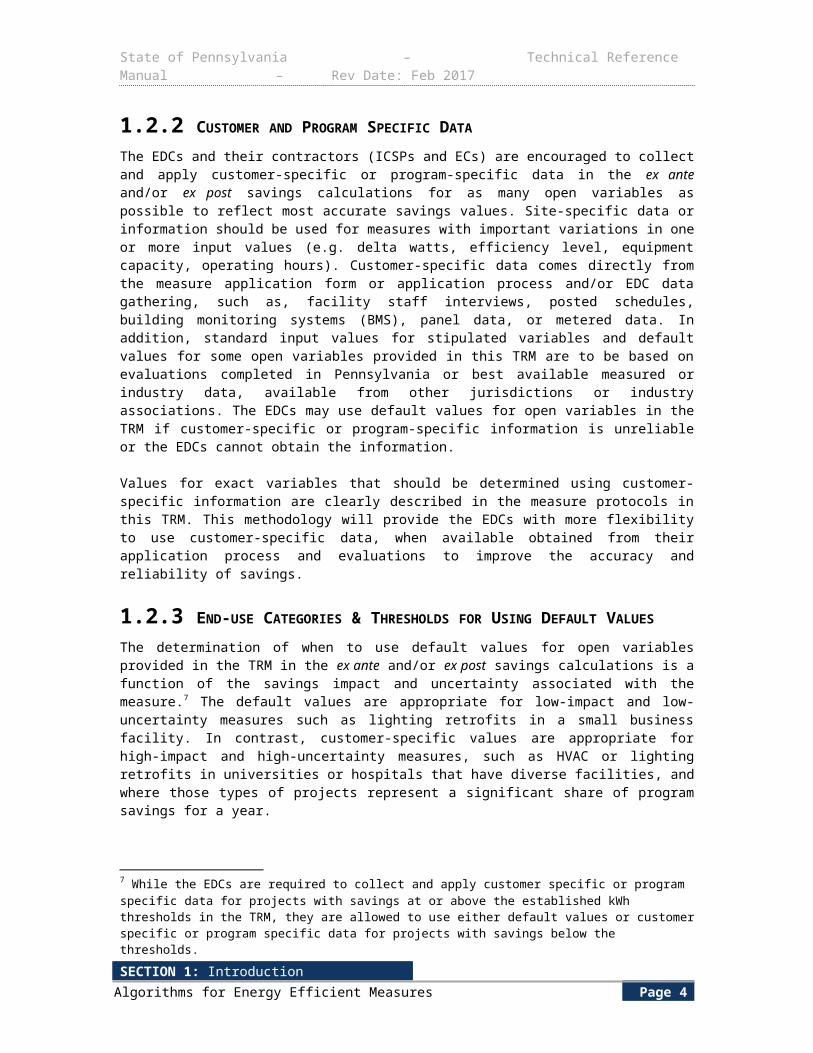
State of Pennsylvania – Technical Reference Manual – Rev Date: Feb 2017
1) The application form that the customer or customer’s agent submits with basic information.
2) Application worksheets and field tools with more detailed, site-specific data, input values and calculations.
3) Algorithms that rely on standard or site-specific input values based on measured data. Parts or all of the algorithms may ultimately be implemented within the tracking system, application forms and worksheets and field tools.
1.5 ALGORITHMSThe algorithms that have been developed to calculate the energy and or demand savings are typically driven by a change in efficiency level between the energy efficient measure and the baseline level of efficiency. The following are the basic algorithms.
kW = kWbase - kWee
kWpeak = kW × CFkWh/yr = kW × EFLH
Where:kW = Demand SavingskWpeak = Coincident Peak Demand SavingskWh/yr = Annual Energy Savings kWbase = Connected load kW of baseline case.kWee = Connected load kW of energy efficient case.EFLH = Equivalent Full Load Hours of operation for the installed measure.CF = Demand Coincidence Factors represent the fraction of connected load
expected to be coincident with the PJM peak demand period as defined in Section 1.10.
Other resource savings will be calculated as appropriate.
Specific algorithms for each of the measures may incorporate additional factors to reflect specific conditions associated with a measure. This may include factors to account for coincidence of multiple installations or interaction between different measures.
1.6 DATA AND INPUT VALUESThe input values and algorithms are based on the best available and applicable data. The input values for the algorithms come from the AEPS application forms, EDC data gathering, or from standard values based on measured or industry data.
Many input values, including site-specific data, come directly from the AEPS application forms, EDC data gathering, worksheets and field tools. Site-specific data on the AEPS application forms and EDC data gathering are used for measures with important variations in one or more input values (e.g., delta watts, efficiency level, capacity, etc.).
Standard input values are based on the best available measured or industry data, including metered data, measured data from other state evaluations (applied prospectively), field data, and standards from industry associations. The standard values for most commercial and industrial measures are supported by end-use metering for key parameters for a sample of facilities and circuits.
For the standard input assumptions for which metered or measured data were not available, the input values (e.g., delta watts, delta efficiency, equipment capacity, operating hours, coincidence factors) were assumed based on best available industry data or standards. These input values
SECTION 1: IntroductionAlgorithms for Energy Efficient Measures Page 8
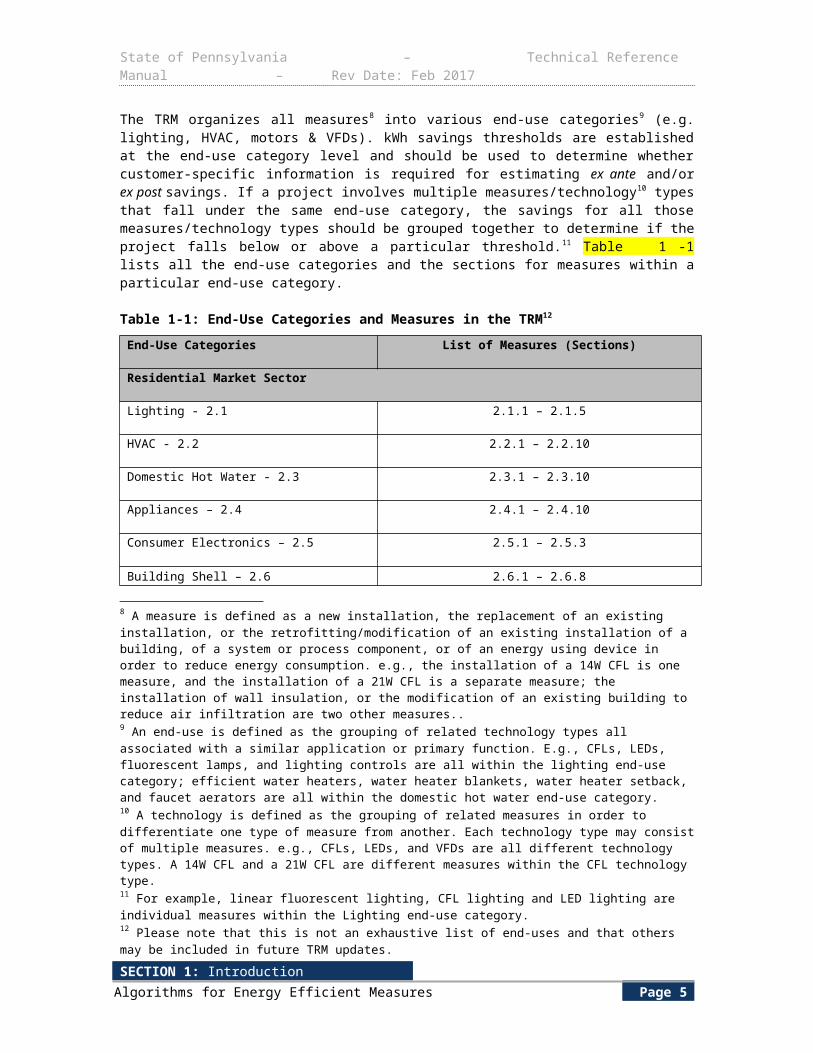
State of Pennsylvania – Technical Reference Manual – Rev Date: Feb 2017
were based on a review of literature from various industry organizations, equipment manufacturers and suppliers.
1.7 BASELINE ESTIMATESThe savings methods and assumptions can differ substantially based on the program delivery mechanism for each measure type. Within each of the measure protocols in the TRM, there is a definition for the measure’s baseline efficiency, a critical input into the savings calculations. Most measures will fall into one of two categories, each with a baseline that is most commonly used:
One for market-driven choices -- often called “lost opportunity” and either replacing equipment that has failed (replace on burnout) or new installations (new construction)
One for discretionary installations – either early replacement or retrofit
For all new construction (NC) and replace on burnout (ROB) scenarios, the baseline is typically a jurisdictional code or a national standard; however there may be cases where a market baseline is appropriate. In these scenarios the Commission has a preference for codes and standards as it is too expensive and time consuming to conduct annual market baseline and characterization research. Additionally, the TRM provides estimates for gross energy savings only, whereas net savings “…include the effects of free ridership, spillover, and induced market effects”.20 Calculating savings against a market baseline produces an estimate of the net savings rather than gross savings. Since Act 129 compliance goals are established on a gross basis, the TRM facilitates calculation of progress towards those goals. The kW and kWh savings calculations are based on standard efficiency equipment versus new high-efficiency equipment. For discretionary installation scenarios, the baseline is typically the existing equipment efficiency, but in the case of early replacement (EREP), at some point the kW and kWh savings calculations must incorporate changes to the baseline for new installations, e.g. code or market changes. This approach encourages residential and business consumers to replace working inefficient equipment and appliances with new high-efficiency products rather than taking no action to upgrade or only replacing them with new standard-efficiency products.
All baselines are designed to reflect current market practices that are updated periodically to reflect upgrades in code or information from evaluation results. Specifically for commercial and industrial measures, Pennsylvania has adopted the 2009 International Energy Conservation Code (IECC) per 34 Pa. Code Section 403.21, effective 12/31/09 by reference to the International Building code and the ICC electrical code. Per Section 501.1 of IECC 2009, “[t]he requirements contained in [chapter 5 of IECC 2009] are applicable to commercial buildings, or portions of commercial buildings. These commercial buildings shall meet either the requirements of ANSI/ASHRAE/IESNA Standard 90.1, Energy Standard for Buildings Except for Low-Rise Residential Buildings, or the requirements contain in [chapter 5 of IECC 2009]”. As noted in Section 501.2, as an alternative to complying with Sections 502, 503, 504, and 505 of IECC 2009, commercial building projects “shall comply with the requirements of ANSI/ASHRAE/IESNA 90.1 in its entirety.”
In accordance with IECC 2009, commercial protocols relying on code standards as the baseline condition may refer to either IECC 2009 or ASHRAE 90.1-2007 per the program design.
The baseline estimates used in the TRM are based on applicable federal standards, or are documented in baseline studies or other market information. This TRM reflects the most up-to-date codes, practices and market transformation effects. The measures herein include, where appropriate, schedules for the implementation of Federal standards to coincide with the beginning of a program year. These implementation schedules apply to measures where the Federal standard is considered the baseline as described herein or otherwise required by law. In cases where the ENERGY STAR criterion is considered the eligibility requirement and the existing
20 “Estimating Net Savings: Common Practices.” The Uniform Methods Project. December 2014, pg. 3.
SECTION 1: IntroductionAlgorithms for Energy Efficient Measures Page 9
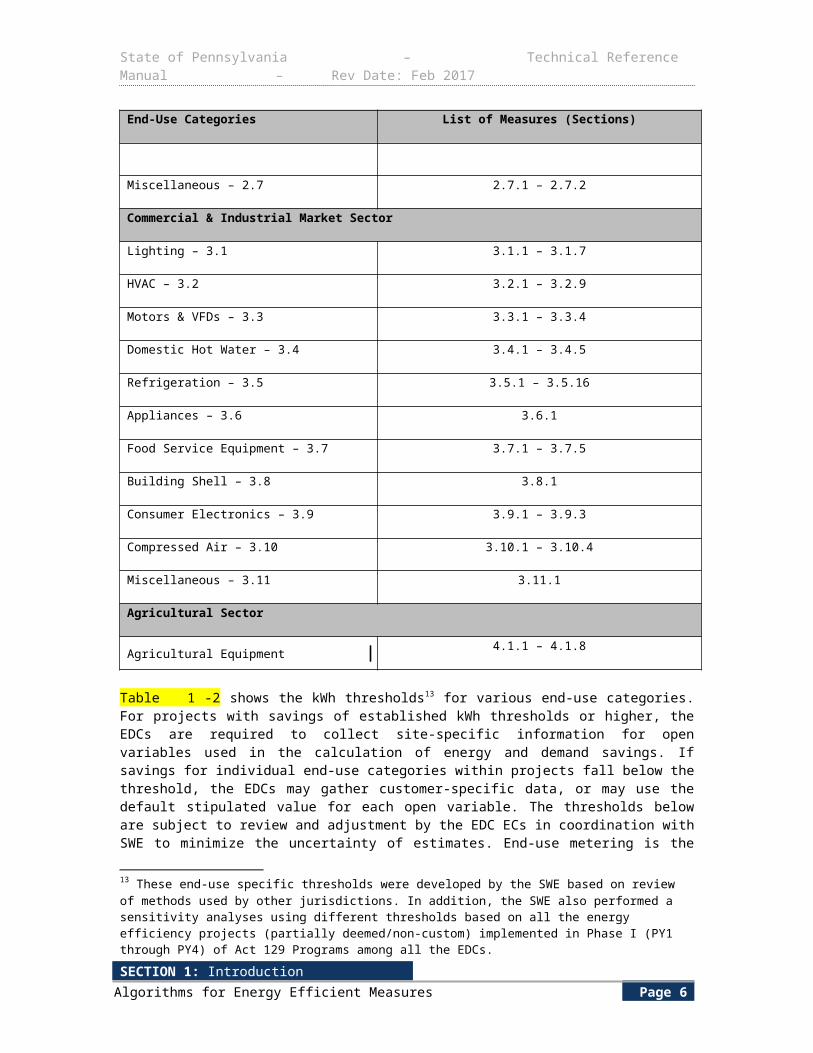
State of Pennsylvania – Technical Reference Manual – Rev Date: Feb 2017
ENERGY STAR Product Specification Version expires in a given year, the new ENERGY STAR Product Specification Version will become the eligibility requirement at the start of the next consecutive program year.
1.8 RESOURCE SAVINGS IN CURRENT AND FUTURE PROGRAM YEARS
AECs and energy efficiency and demand response reduction savings will apply in equal annual amounts corresponding to either PJM planning years or calendar years beginning with the year deemed appropriate by the Administrator, and lasting for the approved life of the measure for AEPS Credits. Energy efficiency and demand response savings associated with Act 129 can claim savings for up to fifteen years.
1.9 PROSPECTIVE APPLICATION OF THE TRMThe TRM will be applied prospectively. The input values are from the AEPS application forms, EDC program application forms, EDC data gathering and standard input values (based on measured data including metered data and evaluation results). The TRM will be updated on an as-needed basis, as determined by the Commission, based on new information and available data and then applied prospectively for future program years. Updates will not alter the number of AEPS Credits, once awarded, by the Administrator, nor will it alter any energy savings or demand reductions already in service and within measure life. If any errors are discovered in the TRM or clarifications are required, those corrections or clarifications should be applied to the associated measure calculations for the current program year, if applicable.
1.10 ELECTRIC RESOURCE SAVINGSAlgorithms have been developed to determine the annual electric energy and electric coincident peak demand savings from energy efficiency. Annual electric energy savings are calculated and then allocated separately by season (summer and winter) and time of day (on-peak and off-peak). Summer coincident peak demand savings from energy efficiency are calculated using a demand savings algorithm for each measure that includes a coincidence factor.
Table 1-3: Periods for Energy Savings and Coincident Peak Demand Savings
Period Energy Savings Coincident Peak Demand Savings
Summer May through September June through August (excluding weekends and holidays)
Winter October through April N/A
Peak 8:00 a.m. to 8:00 p.m. Mon.-Fri. 2:00 p.m. to 6:00 p.m.
Off-Peak 8:00 p.m. to 8:00 a.m. Mon.-Fri.,12 a.m. to 12 a.m. Sat/Sun & holidays N/A
The time periods for energy savings and coincident peak demand savings were chosen to best fit the Act 129 requirement, which reflects the seasonal avoided cost patterns for electric energy and capacity that were used for the energy efficiency program cost effectiveness purposes. For energy, the summer period May through September was selected based on the pattern of avoided costs for energy at the PJM level. In order to keep the complexity of the process for calculating energy savings’ benefits to a reasonable level by using two time periods, the knee periods for spring and fall were split approximately evenly between the summer and winter periods.
SECTION 1: IntroductionAlgorithms for Energy Efficient Measures Page 10
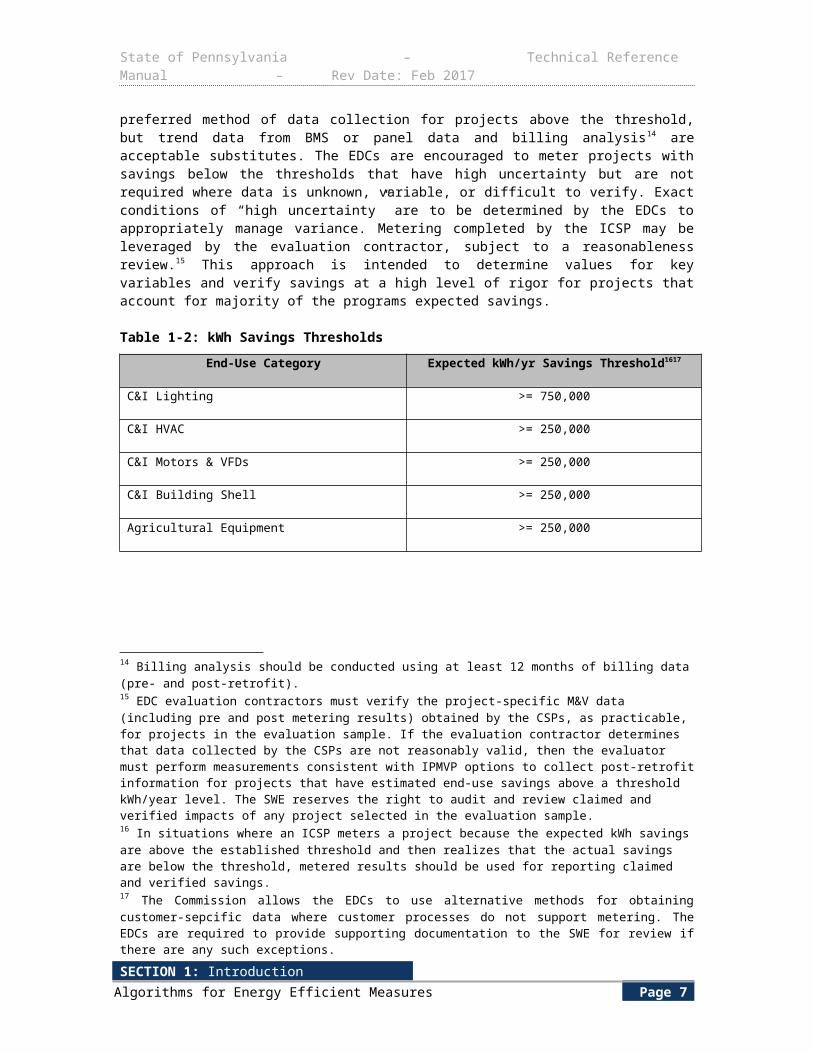
State of Pennsylvania – Technical Reference Manual – Rev Date: Feb 2017
For capacity, the definition of summer peak is adopted from PJM which is applied statewide in this TRM. Only the summer peak period is defined for the purpose of this TRM. The coincident summer peak period is defined as the period between the hour ending 15:00 Eastern Prevailing Time21 (EPT) and the hour ending 18:00 EPT during all days from June 1 through August 31, inclusive, that is not a weekend or federal holiday.22
1.11 POST-IMPLEMENTATION REVIEWThe Administrator will review AEPS application forms and tracking systems for all measures and conduct field inspections on a sample of installations. For some programs and projects (e.g., custom, large process, large and complex comprehensive design), post-installation review and on-site verification of a sample of AEPS application forms and installations will be used to ensure the reliability of site-specific savings’ estimates.
1.12 ADJUSTMENTS TO ENERGY AND RESOURCE SAVINGS1.12.1 COINCIDENCE WITH ELECTRIC SYSTEM PEAK
Coincidence factors are used to reflect the portion of the connected load savings or generation that is coincident with the system peak period.
1.12.2 MEASURE RETENTION AND PERSISTENCE OF SAVINGS The combined effect of measure retention and persistence is the ability of installed measures to maintain the initial level of energy savings or generation over the measure life. If the measure is subject to a reduction in savings or generation over time, the reduction in retention or persistence is accounted for using factors in the calculation of resource savings (e.g., in-service rates for residential lighting measures).
It is also important to note that the 2008 Pennsylvania Act 129 legislation states that the Total Resource Cost test shall be used to determine program cost effectiveness, and defines the TRC test as:
“A STANDARD TEST THAT IS MET IF,OVER THE EFFECTIVE LIFE OF EACH PLAN NOT TO EXCEED 15 YEARS, THE NET PRESENT VALUE OF THE AVOIDED MONETARY COST OF SUPPLYING ELECTRICITY IS GREATER THAN THE NET PRESENT VALUE OF THE MONETARY COST OF ENERGY EFFICIENCY CONSERVATION MEASURES.”
Thus when TRC ratios are calculated for Act 129 programs, the life for any measure cannot be longer than 15 years.
1.12.3 INTERACTIVE MEASURE ENERGY SAVINGS
Throughout the TRM, the interactive effect of thermostatically sensitive building components is accounted for in specific measure protocols as appropriate. In instances where there is a measurable amount of interaction between two energy consuming sources, the energy or peak demand savings are accounted for in either the algorithms or in the modeling software used to determine energy savings.
For example, in a residential protocol where the lighting load has a direct effect on the energy used to condition the space, the TRM provides an interactive effect value to be used in the savings algorithm for certain measures. Other measures rely on the characteristics of the modeling software that account for the effect within a building, such as a new construction
21 This is same as the Daylight Savings Time (DST) 22 PJM Manual 18B for Energy Efficiency Measurement & Verification
SECTION 1: IntroductionAlgorithms for Energy Efficient Measures Page 11
State of Pennsylvania – Technical Reference Manual – Rev Date: Feb 2017
protocol software that will apply the effects for a measureable difference in the baseline and efficient buildings.
Likewise in Commercial and Industrial applications, the TRM accounts for the internal gains affected by implementing certain measures, also by using deemed values within the measure algorithms or by site-specific analysis where warranted, such as in the case of custom C&I measures. For example, the use of electronically commutated motors and the reduced heat output that affects the space cooling energy shall be specified by the measure protocol and where no interaction is present then the energy savings is zero.
1.12.4 VERIFIED GROSS ADJUSTMENTS
Evaluation activities at a basic level consist of verification of the installation and operation of measures. In many cases, the number of widgets found on-site may differ from the number stated on the application, which represents the number of widgets paid for by the program. When the number of widgets found on-site is less than what is stated on the application, the savings will be adjusted by a realization rate. For example, if an application states 100 widgets but an on-site inspection only finds 85, the realization rate applied is 85% (assuming no other discrepancies). On-site widget counts within 5% of the application numbers can be considered to be within reasonable error without requiring realization rate adjustment.
On the other hand, if the number of widgets found on-site is more than what is stated on the application, the savings will be capped at the application findings. For example, if an application states 100 widgets but an on-site inspection finds 120, the realization rate applied is 100% (assuming no other discrepancies).
1.13 CALCULATION OF THE VALUE OF RESOURCE SAVINGSThe calculation of the value of the resources saved is not part of the TRM. The TRM is limited to the determination of the per unit resource savings in physical terms at the customer meter.
In order to calculate the value of the energy and demand savings for reporting cost-benefit analyses and other purposes, the energy savings are determined at the customer level and then increased by the amount of the transmission and distribution losses to reflect the energy savings at the system level. The energy savings at the system level are then multiplied by the appropriate avoided costs to calculate the value of the benefits.
System Savings = (Savings at Customer) X (T&D Loss Factor)Value of Resource Savings = (System Savings) X (System Avoided Costs ) + (Value of
Other Resource Savings)
Please refer to the 2016 TRC Order23 for a more detailed discussion of other resource savings.
1.14 TRANSMISSION AND DISTRIBUTION SYSTEM LOSSESThe TRM calculates the electric energy and peak demand savings at the customer meter level. The electric energy consumption reduction compliance targets for Phase III of Act 129 are established at the retail level. The energy savings must be reported to the Commission at the customer meter level without application of any line loss factor. These savings are used to determine if EDCs have met their statutory electric energy targets for Phase III.
These savings need to be increased by the amount of transmission and distribution system losses in order to determine the energy savings at the system level. The electric line loss factors multiplied by the savings calculated from the algorithms will result in savings at the system level.
23 http://www.puc.pa.gov/filing_resources/issues_laws_regulations/act_129_information/total_resource_cost_test.aspx
SECTION 1: IntroductionAlgorithms for Energy Efficient Measures Page 12
State of Pennsylvania – Technical Reference Manual – Rev Date: Feb 2017
Demand savings goals or compliance towards demand response targets are to be calculated at the system level. The EDC shall apply the proper line loss factor to the peak load reductions to assess progress towards Phase III demand reduction goals.
When performing benefit-cost savings calculations, it is important to value the savings at the system level and apply the line loss factors to both energy consumption and demand savings, at that level, when running the Total Resource Cost test.
The EDCs should use the same line loss factors (LLFs) as they provided to the SWE for the Energy Efficiency and Demand Response Potential Studies. These LLFs shown below in Table 1-4.
Table 1-4: Line Loss Factors Used in the EE and DR Potential Studies As Provided by the EDCs
EDC Residential LLFCommercial
LLFIndustrial
LLFDuquesne 1.0741 1.0741 1.0081Met-Ed 1.0945 1.0720 1.0720PECO 1.0799 1.0799 1.0799Penelec 1.0945 1.0720 1.0720Penn Power 1.0949 1.0545 1.0545PPL 1.0875 1.0875 1.0420West Penn Power 1.0943 1.0790 1.0790
1.15 MEASURE LIVESMeasure lives are provided at the beginning of each measure protocol, as well as in Appendix A:Measure Lives, for informational purposes and for use in other applications such as reporting lifetime savings or in benefit cost studies that span more than one year. For the purpose of calculating the Total Resource Cost (TRC) Test for Act 129, measures cannot claim savings for more than 15 years.
In general, avoided cost savings for programs where measures replace units before the end of their useful life are measured from the efficient unit versus the replaced unit for the remaining life of the existing unit, then from the efficient unit versus a new standard unit for the remaining efficient measure’s life. Specific guidance is proposed in the 2016 TRC Tentative Order.
1.16 CUSTOM MEASURES Custom measures are considered too complex or unique to be included in the list of standard measures provided in the TRM. Also included are measures that may involve metered data, but require additional assumptions to arrive at a ‘typical’ level of savings as opposed to an exact measurement.
While TRM measures are reviewed and approved by the PA PUC through the TRM update process, custom measures do not undergo the same approval process. The EDCs are not required to submit savings protocols for C&I custom measures to the Commission or the SWE for each measure/technology type prior to implementing the custom measure, however, the Commission recommends that site-specific custom measure protocols be established in general conformity to the International Performance Measurement and Verification Protocol (IPMVP)24 or Federal Energy Management Program25 M&V Guidelines. All evaluation sampled custom projects require a Site-Specific Measurement and Verification Plan (SSMVP) developed or approved for
24 http://www.evo-world.org/index.php?option=com_content&task=view&id=272&Itemid=279 25 www1.eere.energy.gov/femp/pdfs/mv_guidelines.pdf
SECTION 1: IntroductionAlgorithms for Energy Efficient Measures Page 13
State of Pennsylvania – Technical Reference Manual – Rev Date: Feb 2017
use by the EDC evaluator which must be available for SWE review. The qualification for and availability of AEPS Credits and energy efficiency and demand response savings are determined on a case-by-case basis.
In addition, certain mass market programs in the residential sector are a subset of custom measures. These programs offer measures, or groups of measures, which are not included in the TRM. As with the C&I CMPs, during Phase I of Act 129, the TWG developed mass market protocols (“MMPs”) for calculating the energy and demand savings associated with residential behavioral modification and low-income weatherization programs. MMPs approved during Phase I are considered available for use in Phase III by the EDCs.
An AEPS application must be submitted, containing adequate documentation fully describing the energy efficiency measures installed or proposed and an explanation of how the installed facilities qualify for AECs. The AEPS application must include a proposed evaluation plan by which the Administrator may evaluate the effectiveness of the energy efficiency measures provided by the installed facilities. All assumptions should be identified, explained and supported by documentation, where possible. The applicant may propose incorporating tracking and evaluation measures using existing data streams currently in use provided that they permit the Administrator to evaluate the program using the reported data.
To the extent possible, the energy efficiency measures identified in the AEPS application should be verified by the meter readings submitted to the Administrator.
1.17 IMPACT OF WEATHERTo account for weather differences within Pennsylvania, the Equivalent Full Load Hours (ELFH) for C&I HVAC measures are calculated based on the degree day scaling methodology. The EFLH values reported in the 2012 Connecticut Program Savings Documentation were adjusted using full load hours (FLH) from the US Department of Energy’s ENERGY STAR Calculator26. Degree day scaling ratios were calculated using heating degree day and cooling degree day values for seven Pennsylvania cities: Allentown, Erie, Harrisburg, Philadelphia, Pittsburgh, Scranton, and Williamsport. These reference cities provide a representative sample of the various climate and utility regions in Pennsylvania.
In addition, several protocols in this TRM rely on the work and analysis completed in California, where savings values are adjusted for climate. These measures include Refrigeration – Auto Closers (Section 3.5.11) and Refrigeration – Suction Pipes Insulation (Section 3.5.14). While there are sixteen California climate zones and seven Pennsylvania cities, all protocols relying on California work paper data will use a single climate zone. Very low risk is associated with this assumption due to the small contribution of savings from these measures to the overall portfolios (<0.1%) and the inherent differences in climate when comparing California weather to Pennsylvania weather. Based on comparable average dry bulb, wet bulb, and relative humidity as well as comparable cooling degree hours, the TRM uses California climate zone 4 to best estimate the savings of refrigeration measures.
Furthermore, all the Pennsylvania zip codes are mapped to a reference city as shown inAppendixF: Zip Code Mapping. In general, zip codes were mapped to the closest reference city because the majority of the state resides in ASHRAE climate zone 5. However, Philadelphia and a small area southwest of Harrisburg are assigned to ASHRAE climate zone 4. Therefore, any zip code in ASHRAE climate zone 4 were manually assigned to Philadelphia, regardless of distance.
26 http://www.energystar.gov/ia/business/bulk_purchasing/bpsavings_calc/ASHP_Sav_Calc.xls
SECTION 1: IntroductionAlgorithms for Energy Efficient Measures Page 14
State of Pennsylvania – Technical Reference Manual – Rev Date: Feb 2017
1.18 MEASURE APPLICABILITY BASED ON SECTORProtocols for the residential sector quantify savings for measures typically found in residential areas under residential meters. Likewise, protocols for the C&I or Agriculture sectors quantify savings for measures typically found in C&I areas under C&I meters. However, there is some overlap where measure type, usage and the sector do not match.
Protocols in the residential and C&I sections describe measure savings based on the application or usage characteristics of the measure rather than how the measure is metered. For example, if a measure is found in a residential environment but is metered under a commercial meter, the residential sector protocol is used. On the other hand, if a measure is found in a commercial or agricultural environment but is metered under a residential meter, the commercial or agricultural sector protocol is used. This is particularly relevant for residential appliances that frequently appear in small commercial spaces (commercial protocol) and residential appliances that are used in residential settings but are under commercial meters (multi-family residences). In addition, air sealing, duct sealing and ceiling/attic and wall insulation protocols and standards for residential measures should be used to estimate savings in two to four units multifamily complexes whereas air sealing and insulation protocols and standards for C&I measures should be applied in multifamily complexes with more than four units. Depending on the scale, an agricultural facility could be metered under a range of meters, but the agricultural measure protocol will supersede the meter type in the same fashion as listed for the other sectors. 1.19 ALGORITHMS FOR ENERGY EFFICIENT MEASURESThe following sections present measure-specific algorithms. Section 2 addresses residential sector measures and Section 3 addresses commercial and industrial sector measures. Section 4 addresses agricultural measures for residential, commercial, and industrial market sectors. Section 5 addresses demand response measures for residential, commercial and industrial market sectors.
SECTION 1: IntroductionAlgorithms for Energy Efficient Measures Page 15
State of Pennsylvania – Technical Reference Manual – Rev Date: Feb 2017
This Page Intentionally Left Blank
2016 TECHNICAL REFERENCE MANUALPage 16
State of Pennsylvania – Technical Reference Manual – Rev Date: Feb 2017
2 RESIDENTIAL MEASURESThe following section of the TRM contains savings protocols for residential measures. This TRM does include an updated energy-to-demand factor for residential energy efficiency measures affecting the electric water heating end use. Due to time constraints, energy-to-demand factors for all other residential energy efficiency measures will be reviewed and updated in future TRMs.
2.1 LIGHTING2.1.1 ENERGY STAR LIGHTING
Measure Name ENERGY STAR Lighting
Target Sector Residential Establishments
Measure Unit Light Bulb or Fixture
Unit Energy Savings Varies
Unit Peak Demand Reduction Varies
Measure LifeCFL: 7.8 years27,28
LED: 15 years29
Vintage Replace on Burnout (Upstream)Early Replacement (Direct Install)
Savings for residential energy efficient lighting products are based on a straightforward algorithm that calculates the difference between baseline and new wattage and the average daily hours of usage for the lighting unit being replaced. An “in-service” rate is used to reflect the fact that not all lighting products purchased are actually installed. Lifetime savings is adjusted for the Energy Independence and Securities Act of 2007 (EISA) which includes a provision where bulbs sold after 2020 will need to meet a 45 lumens per watt standard (a “backstop” provision).30
The parameter estimates in this section are for residential use only. If the split between residential and non-residential installations is unknown (e.g., an upstream program), EDCs can conduct data gathering to determine the percentage of bulbs sold and installed in various types of non-residential applications. EDCs should use the CF and hours of use by business type present in 3.1 Lighting for non-residential bulb savings estimates.
27 EUL = Rated life in hours (10,000 hours life) / Average daily hours of use (3.0) * Days per year (365.25 days/year) * degradation factor. Hours of use based on Statewide Evaluation Team “2014 Commercial & Residential Light Metering Study”, January 13, 2014. Degradation factor comes from ENERGY STAR CFL THIRD PARTY TESTING AND VERIFICATION Off-the-Shelf CFL Performance: Batch 3. Figure 27, p. 47., published in 2013, indicates that 15% of CFL bulbs failed the rapid-cycle stress test, therefore degradation factor is 0.85. See http://www.energystar.gov/ia/partners/downloads/ENERGY_STAR_CFLs_Batch_3_Report_Public_Feb_2013.pdf.28 EISA 2007 legislation mandates that general service bulbs must meet a minimum of efficacy standard of 45 lumens per watt starting in 2020 (approximately equivalent to a CFL). At this point, the baseline is expected to shift to this new standard with limited savings as reported below in the post-2020 adjusted baseline tables. Due to reduced baseline wattages, this shift is assumed to not impact measure life.29 All LED bulbs listed on the qualified ENERGY STAR product list have a lifetime of at least 25,000 hours. Assuming 3.0 hours per day usage, this equates to 22.8 years. Note that while calculated measure life is estimated as 22.8 years,; as discussed in TRM Section 1.12.2 Measure Retention and Persistence of Savings, the 2008 Act 129 Legislation caps measure life at 15 years.30 If the backstop provision is not enacted as planned, baseline wattage post-2020 should be re-evaluated and savings post-2020 should be modified accordingly.
SECTION 2: Residential MeasuresLighting Page 17
State of Pennsylvania – Technical Reference Manual – Rev Date: Feb 2017
E L I G I B I L I T Y
Definition of Efficient EquipmentIn order for this measure protocol to apply, the high-efficiency equipment must be a screw-in ENERGY STAR CFL (general service or specialty bulb), screw-in ENERGY STAR LED bulb (general service or specialty bulb), LED fixture, ENERGY STAR fluorescent torchiere, ENERGY STAR indoor fluorescent fixture, ENERGY STAR outdoor fluorescent fixture, or an ENERGY STAR ceiling fan with a fluorescent light fixture.31
Definition of Baseline EquipmentThe baseline equipment is assumed to be a socket, fixture, torchiere, or ceiling fan with a standard or specialty incandescent light bulb(s).
An adjustment to the baseline wattage for general service and specialty screw-in CFLs and LEDs is made to account for the Energy Independence and Security Act of 2007 (EISA 2007), which requires that all general service lamps and some specialty lamps between 40W and 100W meet minimum efficiency standards in terms of amount of light delivered per unit of energy consumed. The standard was phased in between January 1, 2012 and January 1, 2014. This adjustment affects any efficient lighting where the baseline condition is assumed to be a general service, standard screw-in incandescent light bulb, or specialty, screw-in incandescent lamp.
For upstream buy-down, retail (time of sale), or efficiency kit programs, baseline wattages can be determined using the tables included in this protocol below. For direct install programs where wattage of the existing bulb is known, and the existing bulb was in working condition, wattage of the existing lamp removed by the program may be used in lieu of the tables below.
A L G O R I T H M S
The general form of the equation for the ENERGY STAR or other high-efficiency lighting energy savings algorithm is:
Total Savings = Number of Units×Savings perUnit
ENERGY STAR Lighting:
∆ kWh/ yr=Wattsbase−WattsEE
1000 WkW
×HOU × (1+ IEkWh )×365.25 daysyr
× ISR
∆ kW peak=Wattsbase−WattsEE
1000 WkW
×CF× (1+ IEkW )×ISR
31 The protocol also applies to products that are pending ENERGY STAR qualification.
SECTION 2: Residential MeasuresLighting Page 18
State of Pennsylvania – Technical Reference Manual – Rev Date: Feb 2017
D E F I N I T I O N O F T E R M S
Table 2-5: ENERGY STAR Lighting - References
Component Unit Value Sources
Wattsbase , Wattage of baseline case lamp/fixture
Watts EDC Data Gathering32 or Table2-6,
, & Table 2-8
1
WattsEE , Wattage of efficient case lamp/fixture
Watts EDC Data Gathering Data Gathering
HOU, Average hours of use per day per unit
hoursday
Table 2-9 2
IEkWh , HVAC Interactive Effect for CFL or LED energy
None EDC Data GatheringDefault= Table 2-10Exterior Fixtures: 0%
3
IEkW , HVAC Interactive Effect for CFL or LED demand
None EDC Data GatheringDefault=
Exterior Fixtures: 0%
3
ISR, In-service rate per incented product
% EDC Data Gathering33, Default= 92%34
4
CF , Demand Coincidence Factor
Decimal Table 2-9 2
V A R I A B L E I N P U T V A L U E S
Baseline Wattage Values – General Service LampsBaseline wattage is dependent on lumens, shape of bulb, and EISA qualifications. Commonly used EISA exempt bulbs include 3-way bulbs, globes with ≥5” diameter or ≤749 lumens, and candelabra base bulbs with ≤1049 lumens. See EISA legislation for the full list of exemptions.
For direct installation programs where the removed bulb is known, and the bulb is in working condition, EDCs may use the wattage of the replaced bulb in lieu of the tables below.35 For bulbs with lumens outside of the lumen bins provided, EDCs should use the manufacturer rated comparable wattage as the WattsBase. For EISA exempt bulbs, EDCs also have the option of using manufacturer rated comparable wattage as the WattsBase, rather than the tables below.
To determine the WattsBase for General Service Lamps36 , follow these steps:
1) Identify the rated lumen output of the energy efficient lighting product
32 EDCs may use the wattage of the replaced bulb for directly installed program bulbs33 For EDC Data Gathering, EDCs must use the method established in the DOE Uniform Methods Project, February, 2015. (http://energy.gov/sites/prod/files/2015/02/f19/UMPChapter21-residential-lighting-evaluation-protocol.pdf34 For direct install, giveaway, and energy kit program bulbs, EDCs have the option to use an evaluated ISR when verified through PA program primary research.35 Bulbs that are not installed during the home visit do not qualify for this exemption. This includes bulbs that are left for homeowners to install. In these instances, baseline wattages should be estimated using Table 2-6, , & Table 2-8. 36 General Service Lamps (GSLs) are omnidirectional bulbs that are A, BT, P, PS, S, or T shape bulbs (as defined by the ANSI Standard Lamp Shapes). GSLs are not globe, bullet, candle, flood, reflector, or decorative shaped (B, BA, C, CA, DC, F, G, R, BR, ER, MR, MRX or PAR shapes). These bulbs do encompass both twist/spiral and a-lamp shaped bulbs.
SECTION 2: Residential MeasuresLighting Page 19
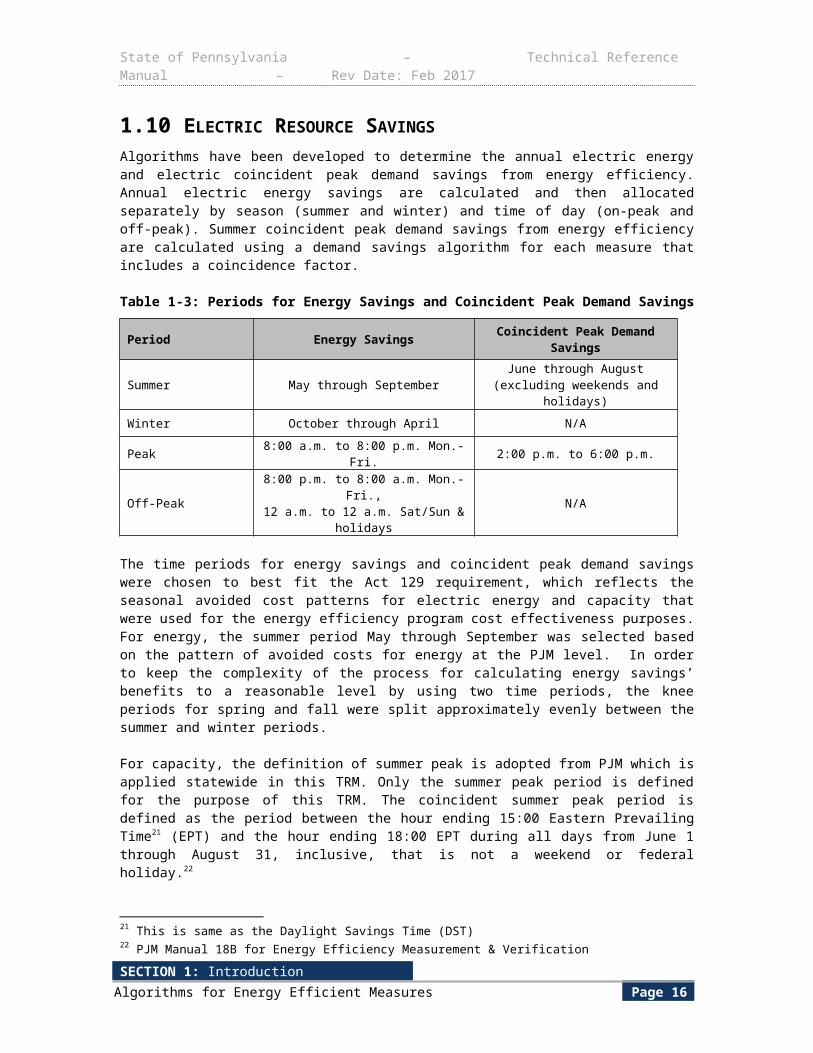
State of Pennsylvania – Technical Reference Manual – Rev Date: Feb 2017
2) Identify if the bulb is EISA exempt37
3) In Table 2-6, find the lumen range into which the lamp falls (see columns (a) and (b).
4) Find the baseline wattage (WattsBase) in column (c) or column (d). If the bulb is exempt from EISA legislation, use column (c), else, use column (d).
Table 2-6: Baseline Wattage by Lumen Output for General Service Lamps (GSL)38
Minimum Lumens(a)
Maximum Lumens
(b)
Incandescent EquivalentWattsBase
(Exempt Bulbs)(c)
WattsBase (Post-EISA 2007)
(d)
Wattsbase post 202039, 40
(e)
2000 2600 150 72 23
1600 1999 100 72 23
1100 1599 75 53 18
800 1099 60 43 15
450 799 40 29 9
310 449 25 25 9
Baseline values in Table 2-6 column (e), Wattsbase post 2020, should only be used in cost-effectiveness calculations for bulbs expected to be installed or remain in use past 2020. For these bulbs, Wattsbase column (d) should be used for the savings calculations until 2020, followed by the values in column (e) for the remainder of the measure life. For bulbs installed in 2020 and beyond, baseline values in column (e) should be used for the entirety of the measure life.
For bulbs that do not fall within EISA regulations, such as exempt bulbs and bulbs with lumens greater than 2,600, the manufacturer rated equivalent wattage should be used as the baseline. The manufacturer rated wattage can vary by bulb type, but is usually clearly labeled on the bulb package. Note the EISA 2007 standards apply to general service incandescent lamps. A complete list of the 22 incandescent lamps exempt from EISA 2007 is listed in the United States Energy Independence and Securities Act.
Baseline Wattage Values – Specialty BulbsENERGY STAR provides separate equivalent incandescent wattages for specialty and decorative bulb shapes. These shapes include candle, globe, bullet, and shapes other than A-lamp bulbs. 41 For these bulbs, use the WattsBase from Table 2-7.
37 The EISA 2007 standards apply to general service incandescent lamps. A complete list of the 22 incandescent lamps exempt from EISA 2007 can be found here: http://www.lightingfacts.com/Library/Content/EISA. 38 Lumen bins and incandescent equivalent wattages from ENERGY STAR labeling requirements, Version 1.1 https://www.energystar.gov/sites/default/files/ENERGY%20STAR%20Lamps%20V1%201_Specification.pdf EISA Standards from: United States Department of Energy. Impact of EISA 2007 on General Service Incandescent Lamps: FACT SHEET. http://www1.eere.energy.gov/buildings/appliance_standards/residential/pdfs/general_service_incandescent_factsheet.pdf 39 Example approach to cost-effectiveness calculation using column (e): If the LED life is 15 years, cost-effectiveness models for 2016 would model the first four years using column (d) as the Wattsbase, and the remaining 11 years using the Wattsbase,in column (e).40 These post-2020 baseline should be re-evaluated if the 2020-backstop requirement is altered, delayed, or not implemented as planned. 41 ANSI Shapes for decorative bulbs: B, BA, C, CA, DC, and F. Globe shapes are labeled as ANSI shape G.
SECTION 2: Residential MeasuresLighting Page 20
State of Pennsylvania – Technical Reference Manual – Rev Date: Feb 2017
For EISA exempt specialty bulbs, use the Wattsbase value in column (c) in . Commonly used EISA exempt bulbs include 3-way bulbs, globes with ≥5” diameter or ≤749 lumens, and candelabra base bulbs with ≤1049 lumens. See the EISA legislation for the full list of exemptions.
To determine the WattsBase for specialty/decorative lamps , follow these steps:
1) Identify the rated lumen output of the energy efficient lighting product.
2) Identify if the bulb is EISA exempt.
In , find the lamp shape of the bulb (see columns (a) or (b)).3) , find the lumen range into which the lamp falls (see columns (a) or (b)).
4) Find the baseline wattage (WattsBase) in column (c) or column (d). If the bulb is exempt from EISA legislation, use column (c), else, use column (d).
Table 2-7: Baseline Wattage by Lumen Output for Specialty Lamps42
Lumen Bins(decorative)(a)
Lumen Bins(globe)
(b)
Incandescent EquivalentWattsBase
(Exempt Bulbs)(c)
WattsBase (Post-EISA 2007)
(d)
1100-1300 150 72
650-1099 100 72
575-649 75 53
500-699 500-574 60 43
300-499 350-499 40 29
150-299 250-349 25 25
90-149 15 15
70-89 10 10
Baseline Wattage Values – Reflector or Flood LampsReflector (directional) bulbs fall under legislation different from GSL and other specialty bulbs. For these bulbs, EDCs should use the default WattsBase (column (b)) in Table 2-8 below.
42 Lumen bins and incadescent equivalent wattages from ENERGY STAR labeling requirements, Version 1.0 http://www.energystar.gov/products/specs/sites/products/files/ENERGY%20STAR%20Lamps%20V1.0%20Final%20Draft%20Specification.pdf EISA Standards from: United States Department of Energy. Impact of EISA 2007 on General Service Incandescent Lamps: FACT SHEET.
SECTION 2: Residential MeasuresLighting Page 21
State of Pennsylvania – Technical Reference Manual – Rev Date: Feb 2017
Table 2-8. Default Baseline Wattage for Reflector Bulbs43
Bulb Type Lumen Range WattsBase Notes
(a) Lower End
Upper End (b)
ER30, BR30, BR40, or ER40
200 299 30 Exempt Bulb
300 449 40 Exempt Bulb
450 499 45 Exempt Bulb
500 1419 65
R20
200 299 30 Exempt Bulb
300 449 40 Exempt Bulb
400 449 40 Exempt Bulb
450 719 45 Exempt Bulb
All other R, PAR, ER, BR, BPAR, or similar bulb shapes, with diameter >2.5", other than those listed above
200 299 30
300 599 40
600 849 50
850 999 55
1000 1300 65
Hours of Use and Peak Coincidence Factor ValuesIn the absence of more current EDC data gathering and analysis, the default values for daily hours of use (HOU) and coincidence factors (CF) are below in Table 2-9. The “all bulbs” HOU should be used for programs where it is known that the majority (> 90% or entirety) of the home’s sockets are retrofited with efficient lighting (e.g., a direct installation program that replaces most of the bulbs in a home). All other programs, including upstream programs, should default to the efficient HOU and CF. Specific room-based HOU and CF may be used for programs where the room-type of installation is known and recorded, otherwise the whole house or unknown room value should serve as the estimate. These HOU and CF estimates should be used for both CFL and LED technologies.
Table 2-9: Bulb and Fixture Hours of Use and Peak Coincidence Factor Values, by Room
Room Efficient HOU Efficient CF All Bulbs HOU All bulbs CF
Basement 1.4 0.035 1.7 0.066
Bathroom 2.8 0.105 2.3 0.096
Bedroom 2.3 0.073 1.8 0.064
Closet 1.2 0.038 0.6 0.029
Dining Room 3.2 0.118 2.7 0.108
Exterior 4.4 0.274 3.9 0.265
Hallway 2.4 0.085 1.9 0.076
Kitchen 4.4 0.150 3.9 0.142
Living Room 4.1 0.106 3.7 0.098
Other 2.1 0.070 1.7 0.061
Overall Household or 3.0 0.106 2.5 0.101
43 Based EISA legislative requirements and web search of available reflector/flood lamps. Effective date of legislation is July 14, 2012
SECTION 2: Residential MeasuresLighting Page 22
State of Pennsylvania – Technical Reference Manual – Rev Date: Feb 2017
Room Efficient HOU Efficient CF All Bulbs HOU All bulbs CFunknown room
Interactive Effects ValuesIn the absence of EDC data gathering and analysis, the default values for Energy and Demand HVAC Interactive Effects are below. These IE values should be used for both CFL and LED technologies.44 Exterior Fixtures should apply a 0% IE value.
Table 2-10: CFL and LED Energy and Demand HVAC Interactive Effects by EDC45
EDC IEkWh IEkW
Duquesne 8% 13%
FE (Met-Ed) -8% 13%
FE (Penelec) 1% 10%
FE (Penn Power) 0% 20%
FE (WPP) -2% 30%
PPL -6% 12%
PECO 1% 23%
E V A L U A T I O N P R O T O C O L S
For most projects, the appropriate evaluation protocol is to verify installation and proper selection of default values. For projects using customer specific data for open variables, the appropriate evaluation protocol is to verify installation and proper application of TRM protocol along with verification of open variables. The Pennsylvania Evaluation Framework46 provides specific guidelines and requirements for evaluation procedures.
S O U R C E S
1) Lumen bins and Pre-EISA baselines are consistent with ENERGY STAR lamp labeling requirements, Version 1.0. Post-EISA baselines are the maximum EISA complaint equivalent incandescent wattages based on EISA lumen bins. Reflector baselines are based on a triangulation of legislative requirements and a websearch of available bulbs.
2) Statewide Evaluation Team (GDS Associates, Inc, Nexant, Research into Action, Apex Analytics LLC), “2014 Commercial & Residential Light Metering Study”, January 13, 2014. Based on data derived from Tables 1-2 & 1-3 but exclusive of inefficient bulbs
3) GDS Simulation Modeling, September-November 2013. PECO values are based on an analysis of PY4 as performed by Navigant.
4) The ISR is based on an installation rate “trajectory” and includes savings for all program bulbs that are believed to be installed within three years of purchase as established in the DOE Uniform Methods Project (UMP), Chapter 21: Residential Lighting Evaluation Protocol. February, 2015. This protocol estimates the three-year ISR based on a researched first year ISR. For the purposes of this TRM, a 79% first year ISR was used based on intercept surveys conducted in the PECO service territory (Navigant Consulting, Inc. “Final Annual Report to the Pennsylvania Public Utility Commission. Prepared for PECO. Program Year 5”.
44 Any differences in IE caused by technological differences are likely minimal and within the error bounds of CFL estimates. Difference caused by the reduced LED wattage are already accounted for in the delta watts input and multiplied by this IE value.45 HVAC Interactive Effects modeled through REM/Rate models, using EDC specific inputs. Values were weighted to the saturation of HVAC equipment and housing types present in each EDC service territory as reported in the Pennsylvania Statewide Residential End-Use and Saturation Study, 2012. PECO values are based on an analysis of PY4 as performed by Navigant.46 http://www.puc.pa.gov/filing_resources/issues_laws_regulations/act_129_information/act_129_statewide_evaluator_swe_.aspx
SECTION 2: Residential MeasuresLighting Page 23
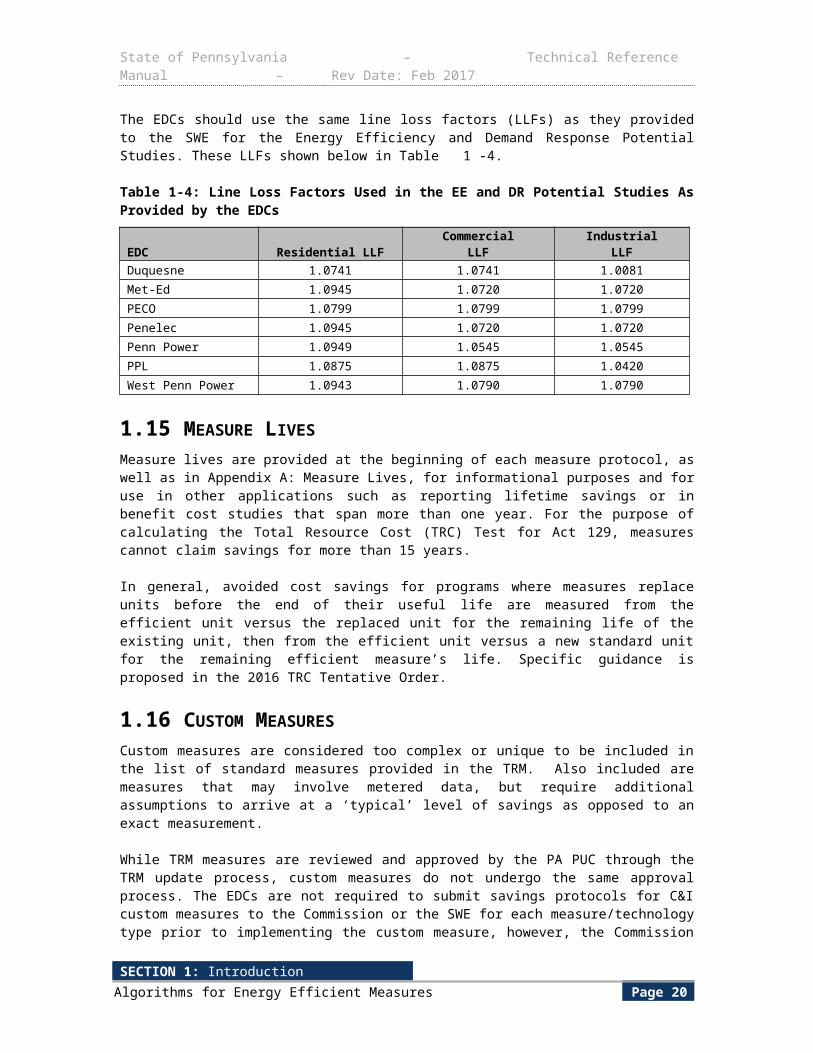
State of Pennsylvania – Technical Reference Manual – Rev Date: Feb 2017
November, 2014.) Using the UMP trajectory, a total of 93% of all bulbs are installed within three years of purchase. Discounting the future savings back to the current program year reduces the ISR to 92%. Discount rate used was a weighted average nominal discount rate for all EDCs, 7.5%.The TRM algorithm does not adjust for lighting products sold to to customers outside the service territory (“leakage”), instead assuming that most leakage in Pennsylvania would occur back and forth between EDC service territories, and that leakage in and leakage out are offsetting.47
Additionally, the following studies were reviewed and analyzed to support the “Residential Lighting Markdown Impact Evaluation”:
1) Nexus Market Research, “Impact Evaluation of the Massachusetts, Rhode Island and Vermont 2003 Residential Lighting Programs”, Final Report, October 1, 2004. Table 9-7.
2) CFL Metering Study, Final Report. Prepared for PG&E, SDG&E, and SCE by KEMA, Inc. February 25, 2005. Table 4-1.
3) Nexus Market Research, ""Process and Impact Evaluation of the Efficiency Maine Lighting Program"", April 2007. Table 1-7."
4) Nexus Market Research, "Residential Lighting Markdown Impact Evaluation", Final Report, January 20, 2009. Table 6-1.
5) KEMA, Inc., "Final Evaluation Report: Upstream Lighting Program." Prepared from the California Public Utilities Commission, February 8, 2010. Table 18.
6) Itron, Inc. "Verification of Reported Energy and Peak Savings from the EmPOWER Maryland Energy Efficiency Programs." Prepared for the Maryland Public Service Commission, April 21, 2011. Table 3-6.
7) TecMarket Works, "Duke Energy Residential Smart Saver CFL Program in North Carolina and South Carolina", February 2011. Table 29.
8) Glacier Consulting Group, LLC. “Adjustments to CFL Operating Hours-Residential.” Memo to Oscar Bloch, Wisconsin DOA. June 27, 2005.
9) New Jersey’s Clean Energy Program Residential CFL Impact Evaluation and Protocol Review. KEMA, Inc. September 28, 2008. pg. 21.
2.1.2 RESIDENTIAL OCCUPANCY SENSORS
Measure Name ENERGY STAR Occupancy Sensors
Target Sector Residential Establishments
Measure Unit Occupancy Sensor
Unit Energy Savings Varies
Unit Peak Demand Reduction Varies
Measure Life 10 years48
Vintage Retrofit
E L I G I B I L I T Y
47 Consistent with the Evaluation Framework for Pennsylvania At 129 Phase II Energy Efficiency and Conservation Programs, June 1, 2014, pp. C-6.48 GDS Associates, Inc. (2007). Measure Life Report: Residential and Commercial/Industrial Lighting and HVAC Measures. Prepared for The New England State Program Working Group.
SECTION 2: Residential MeasuresLighting Page 24
State of Pennsylvania – Technical Reference Manual – Rev Date: Feb 2017
This protocol is for the installation of occupancy sensors inside residential homes or common areas.
A L G O R I T H M S
∆ kWh/ yr=Wattscontrolled
1000 WkW
× (RH old−RH new)×365 daysyr
kWpeak = 0
D E F I N I T I O N O F T E R M S
Table 2-11: Residential Occupancy Sensors Calculations Assumptions
Component Unit Value Source
Wattscontrolled , Wattage of the fixture being controlled by the occupancy sensor kW EDC’s Data
Gathering
AEPS Application; EDC’s Data Gathering
RHold , Daily run49 hours before installation Hours 2.5 1
RHnew , Daily run hours after installation Hours 1.75 (70% of RHold) 2
E V A L U A T I O N P R O T O C O L S
For most projects, the appropriate evaluation protocol is to verify installation and proper selection of default values. For projects using customer specific data for open variables, the appropriate evaluation protocol is to verify installation and proper application of TRM protocol along with verification of open variables. The Pennsylvania Evaluation Framework provides specific guidelines and requirements for evaluation procedures.
S O U R C E S
1) Statewide Evaluation Team (GDS Associates, Inc, Nexant, Research into Action, Apex Analytics LLC), “2014 Commercial & Residential Light Metering Study”, January 13, 2014.
2) Lighting control savings fractions consistent with current programs offered by National Grid, Northeast Utilities, Long Island Power Authority, NYSERDA, and Energy Efficient Vermont
49
SECTION 2: Residential MeasuresLighting Page 25
State of Pennsylvania – Technical Reference Manual – Rev Date: Feb 2017
2.1.3 ELECTROLUMINESCENT NIGHTLIGHT
Measure Name Electroluminescent Nightlight
Target Sector Residential Establishments
Measure Unit Nightlight
Unit Energy Savings 29.49 kWh
Unit Peak Demand Reduction 0 kW
Measure Life 8 years50
Vintage Replace on Burnout
Savings from installation of plug-in electroluminescent nightlights are based on a straightforward algorithm that calculates the difference between existing and new wattage and the average daily hours of usage for the lighting unit being replaced. An “installation” rate is used to modify the savings based upon the outcome of participant surveys, which will inform the calculation. Demand savings is assumed to be zero for this measure.
E L I G I B I L I T Y
This measure documents the energy savings resulting from the installation of an electroluminescent night light instead of a standard night light. The target sector is primarily residential.
A L G O R I T H M S
The general form of the equation for the electroluminescent nightlight energy savings algorithm is:
∆ kWh/ yr=((W base×HOU base) – (W ee×HOU ee))×365 days
yr× ISRNL
1000 WkW
kWpeak = 0 (assumed)
D E F I N I T I O N O F T E R M S
Table 2-12: Electroluminescent Nightlight - References
Component Unit Value Sources
W e e , Watts per electroluminescent nightlight Watts EDC Data GatheringDefault = 0.03
1
W b ase , Watts per baseline nightlight Watts EDC Data GatheringDefault = 7
2
HOU ee, Hours-of-Use per day of electroluminescent nightlight
hoursday
24 3
HOU base, Hours per baseline nightlighthoursday
12 2
ISRNL, In-Service Rate per electroluminescent nightlight None EDC Data Gathering
Default = 0.97PA CFL ISR
value
50 Southern California Edison Company, “LED, Electroluminescent & Fluorescent Night Lights”, Work Paper WPSCRELG0029 Rev. 1, February 2009, p. 2 & p. 3.
SECTION 2: Residential MeasuresLighting Page 26
State of Pennsylvania – Technical Reference Manual – Rev Date: Feb 2017
D E E M E D E N E R G Y S A V I N G S
kWh/yr ¿ ( (7×12 )– (.03×24 ) )×365 days
yr
1000 WkW
×0.97=29.49 kWh
E V A L U A T I O N P R O T O C O L S
For most projects, the appropriate evaluation protocol is to verify installation and proper selection of default values. For projects using customer specific data for open variables, the appropriate evaluation protocol is to verify installation and proper application of TRM protocol along with verification of open variables. The Pennsylvania Evaluation Framework provides specific guidelines and requirements for evaluation procedures.
S O U R C E S
1) Limelite Equipment Specification. Personal Communication, Ralph Ruffin, EI Products, 512-357-2776/ [email protected].
2) Southern California Edison Company, “LED, Electroluminescent & Fluorescent Night Lights”, Work Paper WPSCRELG0029 Rev. 1, February 2009, p. 2 & p. 3.
3) As these nightlights are plugged in without a switch, the assumption is they will operate 24 hours per day.
SECTION 2: Residential MeasuresLighting Page 27

State of Pennsylvania – Technical Reference Manual – Rev Date: Feb 2017
2.1.4 LED NIGHTLIGHT
Measure Name LED Nightlight
Target Sector Residential Establishments
Measure Unit LED Nightlight
Unit Energy Savings 25.49 kWh
Unit Peak Demand Reduction 0 kW
Measure Life 8 years51
Vintage Replace on Burnout
Savings from installation of LED nightlights are based on a straightforward algorithm that calculates the difference between existing and new wattage and the average daily hours of usage for the lighting unit being replaced. An “installation” rate is used to modify the savings based upon the outcome of participant surveys, which will inform the calculation. Demand savings is assumed to be zero for this measure.
E L I G I B I L I T Y This measure documents the energy savings resulting from the installation of an LED night light instead of a standard night light. The target sector is primarily residential.
A L G O R I T H M S
Assumes a 1 Watt LED nightlight replaces a 7 Watt incandescent nightlight. The nightlight is assumed to operate 12 hours per day, 365 days per year; estimated useful life is 8 years (manufacturer cites 11 years 100,000 hours). Savings are calculated using the following algorithm:
∆ kWh/ yr=[(W base –W NL)×( HOU ×365 daysyr
1000 WkW
)]×ISRkWpeak = 0 (assumed)
D E F I N I T I O N O F T E R M S
Table 2-13: LED Nightlight - References
Component Unit Value Sources
Wbase , Watts per baseline Watts EDC Data GatheringDefault = 7
EDC Data Gathering
WNL ,Watts per LED Nightlight Watts EDC Data GatheringDefault = 1
EDC Data Gathering
HOU , Hours-of-Usehoursday
12 1
ISRNL , In-Service Rate per LED nightlight % EDC Data Gathering
Default = 97% PA CFL ISR value
51 Southern California Edison Company, “LED, Electroluminescent & Fluorescent Night Lights”, Work Paper WPSCRELG0029 Rev. 1, February 2009, p. 2. and p.3.
SECTION 2: Residential MeasuresLighting Page 28
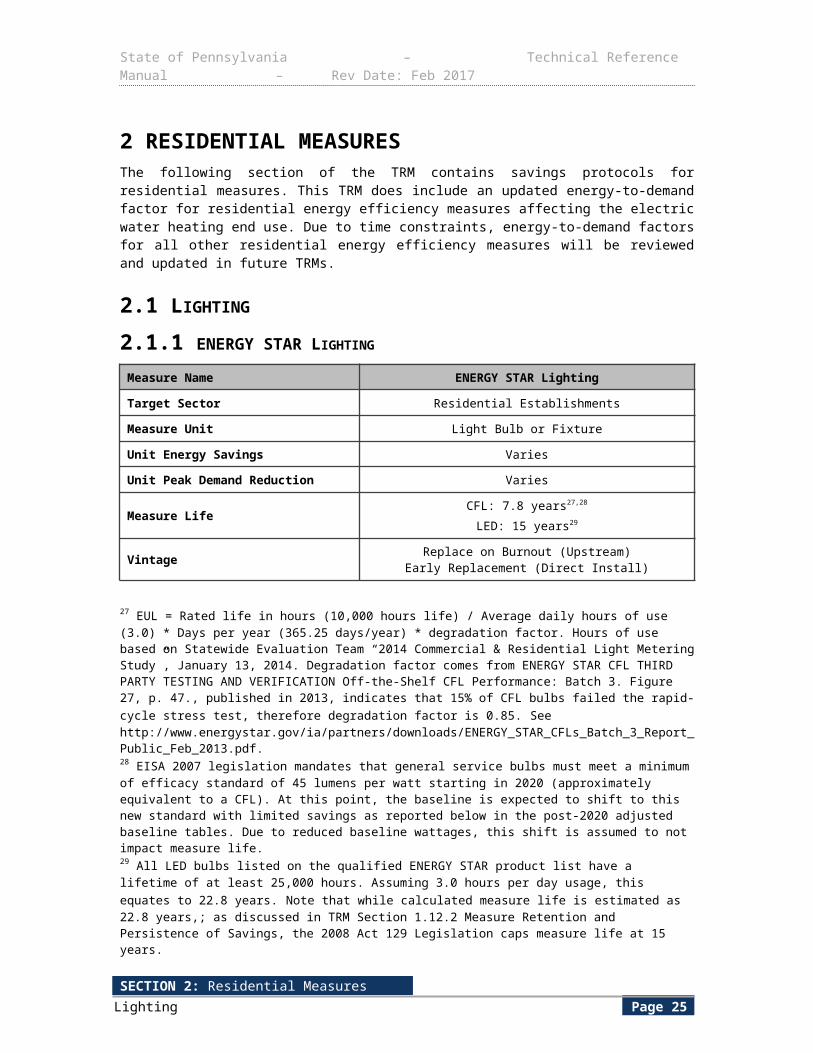
State of Pennsylvania – Technical Reference Manual – Rev Date: Feb 2017
D E E M E D S A V I N G S
The default energy savings is based on a delta watts assumption (Wbase – WNL) of 6 watts.
kWh ¿ [(6 )×( 12×365 daysyr
1000 WkW
)]× .97=25.49 kWh
E V A L U A T I O N P R O T O C O L S
For most projects, the appropriate evaluation protocol is to verify installation and proper selection of default values. For projects using customer specific data for open variables, the appropriate evaluation protocol is to verify installation and proper application of TRM protocol along with verification of open variables. The Pennsylvania Evaluation Framework provides specific guidelines and requirements for evaluation procedures.
S O U R C E S
1) Southern California Edison Company, “LED, Electroluminescent & Fluorescent Night Lights”, Work Paper WPSCRELG0029 Rev. 1, February 2009, p. 2 & p. 3.
SECTION 2: Residential MeasuresLighting Page 29
State of Pennsylvania – Technical Reference Manual – Rev Date: Feb 2017
2.1.5 HOLIDAY LIGHTS
Measure Name Holiday Lights
Target Sector Residential Applications
Measure Unit One 25-bulb Strand of Holiday lights
Unit Energy Savings 21.2 kWh per strand
Unit Peak Demand Reduction 0 kW
Measure Life 10 years52,53
Vintage Replace on Burnout
LED holiday lights reduce light strand energy consumption by up to 90%. Up to 25 strands can be connected end-to-end in terms of residential grade lights. Commercial grade lights require different power adapters and as a result, more strands can be connected end-to-end.
E L I G I B I L I T Y This protocol documents the energy savings attributed to the installation of LED holiday lights indoors and outdoors. LED lights must replace traditional incandescent holiday lights.
A L G O R I T H M S
Algorithms yield kWh savings results per package (kWh/yr per package of LED holiday lights).
∆ kWh/ yrC 9=[ ( INCC 9−LEDC 9 )׿Bulbs׿Strands× HR ]
1000 WkW
∆ kWh/ yrC 7=[ ( INCC 7−LEDC 7 )׿Bulbs׿Strands× HR ]
1000 WkW
∆ kWh/ yrmini=[ ( INCmini−LEDmini )׿Bulbs ׿Strands×HR ]
1000 WkW
Key assumptions1) All estimated values reflect the use of residential (50ct. per strand) LED bulb holiday lighting.
2) Secondary impacts for heating and cooling were not evaluated.
3) It is assumed that 50% of rebated lamps are of the “mini” variety, 25% are of the C7 variety, and 25% are of the C9 variety. If the lamp type is known or fixed by program design, then the savings can be calculated as described by the algorithms above. Otherwise, the savings for the mini, C7, and C9 varieties should be weighted by 0.5, 0.25 and 0.25, respectively, as in the algorithm below.
∆ kWh/ yrDefault=[%C 9×∆kWh / yrC 9 ]+ [%C 7×∆kWh / yrC 7 ]+ [ %mini×∆kWh / yrmini ]52 http://www.energyideas.org/documents/factsheets/HolidayLighting.pdf53 The DSMore Michigan Database of Energy Efficiency Measures: Based on spreadsheet calculations using collected data: Franklin Energy Services; "FES-L19 – LED Holiday Lighting Calc Sheet"
SECTION 2: Residential MeasuresLighting Page 30
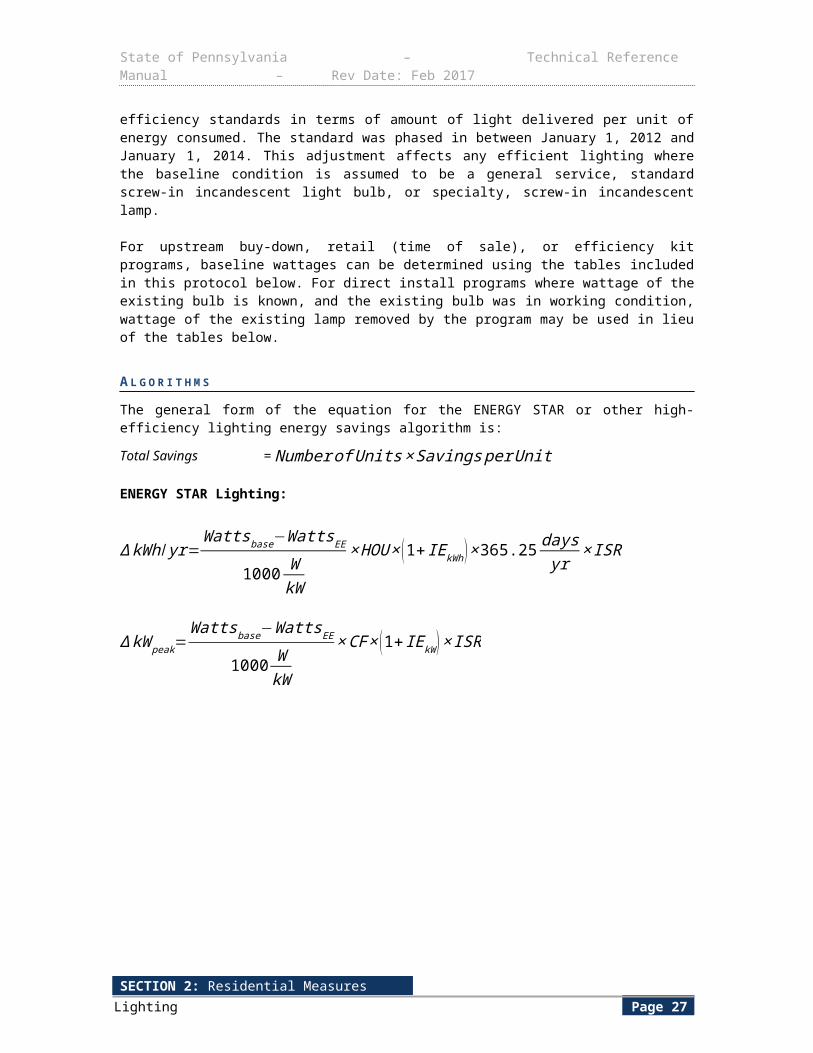
State of Pennsylvania – Technical Reference Manual – Rev Date: Feb 2017
D E F I N I T I O N O F T E R M S
Table 2-14: Holiday Lights Assumptions
Parameter Unit Value Source
LEDmini , Wattage of LED mini bulbs Watts/Bulb 0.08 1
INCmini , Wattage of incandescent mini bulbs Watts/Bulb 0.48 1
LEDC7 , Wattage of LED C7 bulbs Watts/Bulb 0.48 1
INCC7 , Wattage of incandescent C7bulbs Watts/Bulb 6.0 1
LEDC9 , Wattage of LED C9 bulbs Watts/Bulb 2.0 1
INCC9 , Wattage of incandescent C9 bulbs Watts/Bulb 7.0 1
%Mini , Percentage of holiday lights that are “mini” % 50% 1
%C7 , Percentage of holiday lights that are “C7” % 25% 1
%C9 , Percentage of holiday lights that are “C9” % 25% 1
#Bulbs , Number of bulbs per strand Bulbs/strand EDC Data GatheringDefault: 50 per strand 3
#Strands , Number of strands of lights per package
strands/package
EDC Data GatheringDefault: 1 strand 3
Hr , Annual hours of operation Hours/yr 150 1
D E E M E D S A V I N G S
The deemed savings for installation of LED C9, C7, and mini lights is 37.5 kWh, 41.4 kWh, and 3 kWh, respectively. The weighted average savings are 21.2 kWh per strand. There are no demand savings as holiday lights only operate at night. Since the lights do not operate in the summer, the coincidence factor for this measure is 0.0.
E V A L U A T I O N P R O T O C O L
The most appropriate evaluation protocol for this measure is verification of installation coupled with assignment of stipulated energy savings. As these lights are used on a seasonal basis, verification must occur in the winter holiday season. Given the relatively small amount of impact evaluation risk that this measure represents, and given that the savings hinge as heavily on the
SECTION 2: Residential MeasuresLighting Page 31
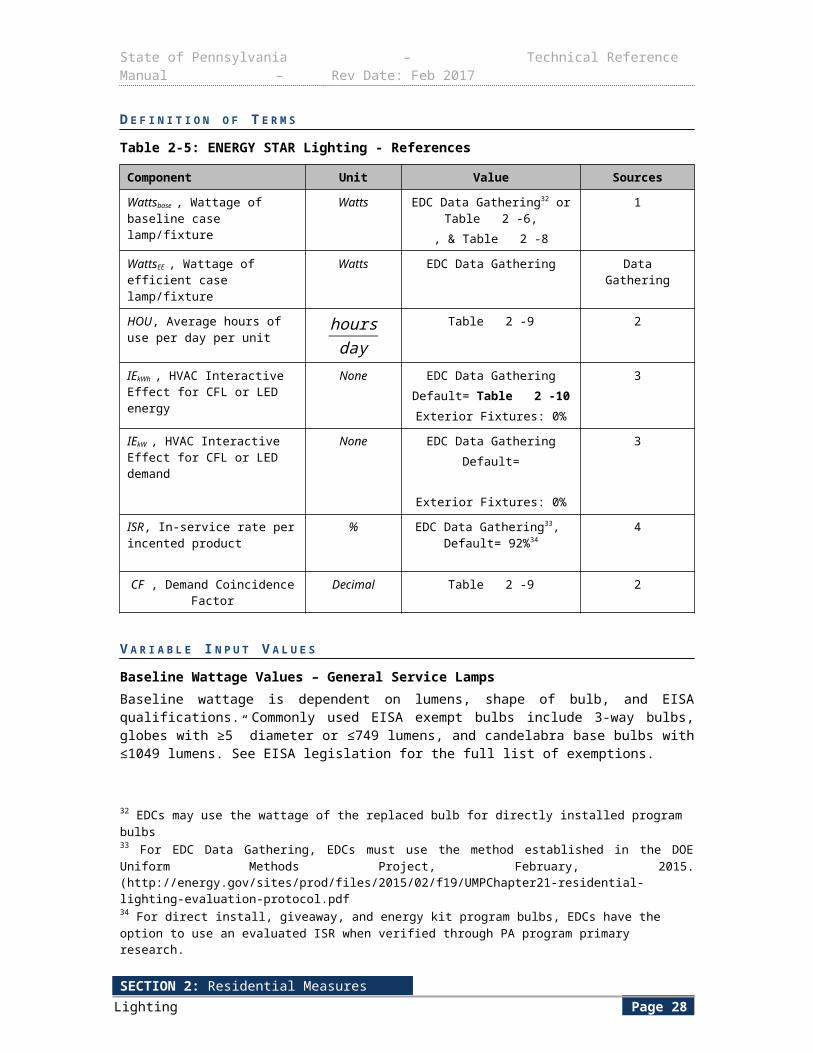
State of Pennsylvania – Technical Reference Manual – Rev Date: Feb 2017
actual wattage of the supplanted lights than the usage of the efficient LED lights, customer interviews should be considered as an appropriate channel for verification.
S O U R C E S
1) The DSMore Michigan Database of Energy Efficiency Measures: Based on spreadsheet calculations using collected data
2) http://www.energyideas.org/documents/factsheets/HolidayLighting.pdf
3) Typical values of lights per strand and strands per package at home depot and other stores.
SECTION 2: Residential MeasuresLighting Page 32
State of Pennsylvania – Technical Reference Manual – Rev Date: Feb 2017
2.2 HVAC2.2.1 ELECTRIC HVAC
Measure Name Electric HVAC
Target Sector Residential Establishments
Measure Unit AC Unit, ASHP Unit, or GSHP Unit
Unit Energy Savings Varies
Unit Peak Demand Reduction Varies
Measure Life Varies (See Appendix A: Measure Lives)
Vintage Replace on Burnout, Retrofit (Maintenance and Proper Sizing), Early Replacement
The method for determining residential high-efficiency cooling and heating equipment energy impact savings is based on algorithms that determine a central air conditioner or heat pump’s cooling/heating energy use and peak demand contribution. Input data is based both on fixed assumptions and data supplied from the high-efficiency equipment AEPS application form or EDC data gathering.
The algorithms applicable for this program measure the energy savings directly related to the more efficient hardware installation.
Larger commercial air conditioning and heat pump applications are dealt with in Section 3.2.
E L I G I B I L I T Y
This measure requires either:
1) The purchase of an ENERGY STAR Air Conditioner, Air Source Heat Pump, Ground Source Heat Pump,
2) Proper sizing of a central air conditioner,
3) Central air conditioner or air source heat pump maintenance,
4) Installation of a desuperheater on an existing Ground Source Heat Pump, or
5) Installation of a new high efficiency fan on an existing furnace, or replacement of the air handler assembly with a new air handler containing a high efficiency fan.
Table 2-15 shows the baseline conditions for each residential electric HVAC measure listed above.
Table 2-15: Residential Electric HVAC Measure Baseline Conditions
Measure Baseline ConditionENERGY STAR Air Conditioner Early Retirement: Existing efficiency electric A/C
Replace on Burnout: Standard efficiency electric A/C
New Construction or no existing cooling: Standard efficiency electric A/C
High Efficiency Air Source Heat Pump Heating Baseline:Early Retirement: Existing efficiency electric
heating system
SECTION 2: Residential MeasuresHVAC Page 33
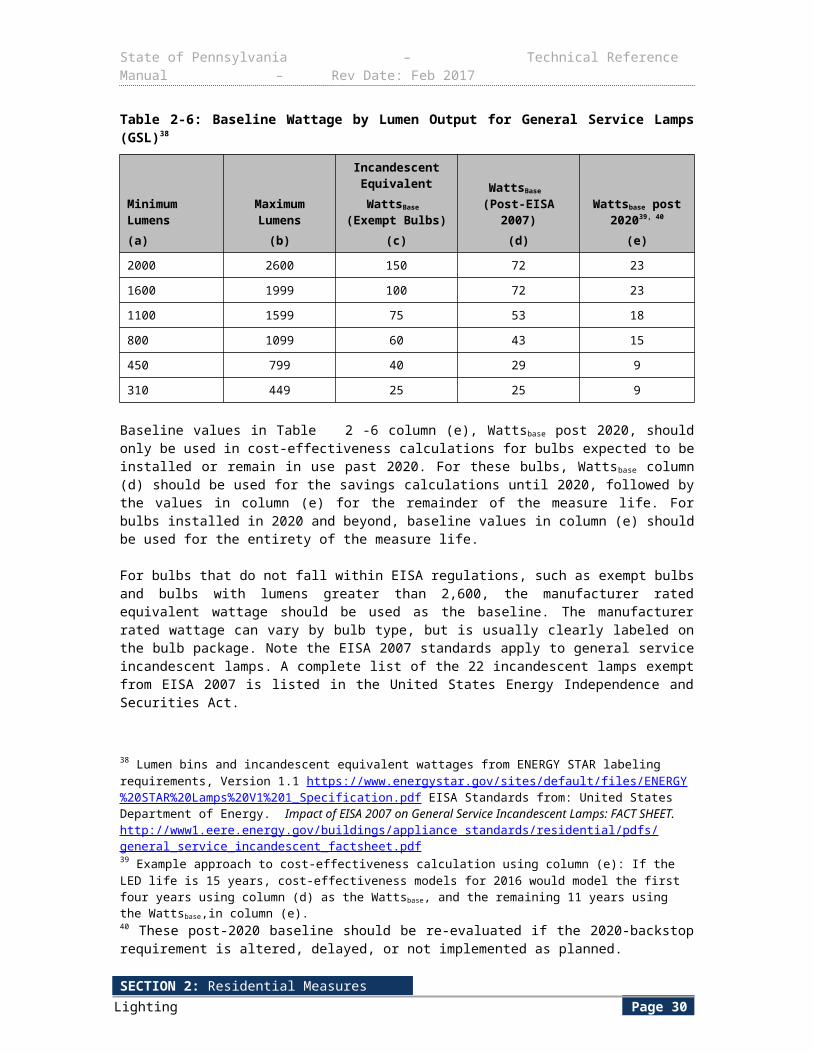
State of Pennsylvania – Technical Reference Manual – Rev Date: Feb 2017
Measure Baseline Condition
Replace on Burnout or New Construction: Standard efficiency electric heating system
De Facto Space Heating: Electric space heaters used as the primary heating source when an oil
furnace or boiler has failed beyond repair54 55
Cooling Baseline:Early Retirement: Existing efficiency central A/C,
ASHP, or room A/C
Replace on Burnout: Standard efficiency central A/C, ASHP, or room A/C
New Construction or no existing cooling: Standard efficiency central A/C
Ground Source Heat Pump Heating Baseline:Early Retirement: Existing efficiency electric
heating system
Replace on Burnout or New Construction: Standard efficiency electric heating system
Cooling Baseline:Early Retirement: Existing efficiency central A/C,
ASHP, or room A/C
Replace on Burnout: Standard efficiency central A/C, ASHP, or room A/C
New Construction or no existing cooling: Standard efficiency central A/C
Proper sizing of a central air conditioner Oversized new central air conditioner
Central air conditioner or air source heat pump maintenance Existing cooling system
Installation of a desuperheater on an existing Ground Source Heat Pump
Ground source heat pump without a desuperheater
Installation of a new high efficiency fan on an existing furnace, or air handler replacement including a high effiency fan
Gas or electric furnace with a standard efficiency furnace fan
The high efficiency ASHP includes a baseline scenario for customers who are relying on space heaters as their primary heating source after their oil furnace or boiler failed and is beyond repair (referred to as de facto heating), and they do not have access to natural gas.
A L G O R I T H M S
Central A/C and Air Source Heat Pump (ASHP) (High Efficiency Equipment Only)
54 This baseline is for participants with broken-beyond-repair oil heating systems who are heating their homes with portable electric space heaters. 55 When calculating Net savings, EDCs should review the approach laid out in the Phase III Pennsylvania Evaluation Framework when it becomes available.
SECTION 2: Residential MeasuresHVAC Page 34
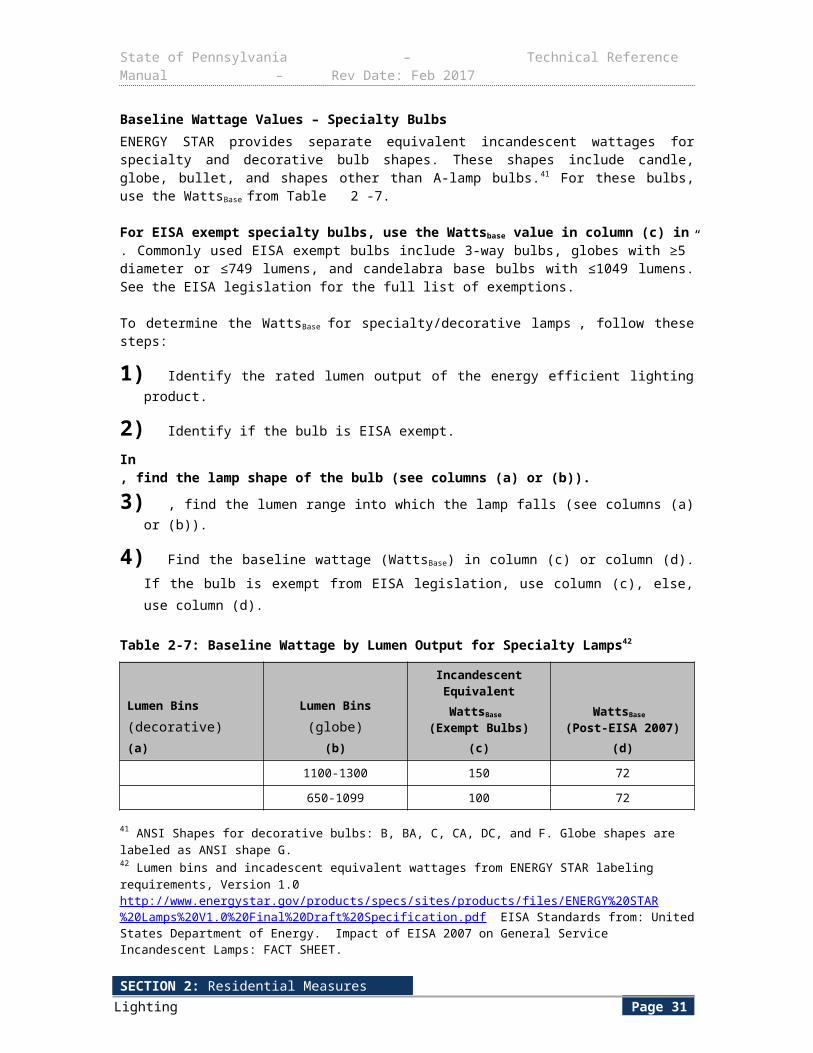
State of Pennsylvania – Technical Reference Manual – Rev Date: Feb 2017
This algorithm is used for the installation of new high efficiency A/C and ASHP equipment.ΔkWh/yr ¿ Δ kWhcool+Δ kWhheatΔkWhcool ¿ CAPY cool
1000 WkW
×( 1SEERb
− 1SEERe )×EFLH cool
ΔkWhcool (Room AC baseline only) ¿ CAPY cool
1000 WkW
×( OF RAC
SEERb− 1SEERe )×EFLH cool
ΔkWhheat(ASHP Only) ¿ CAPY heat
1000 WkW
×( 1HSPFb
− 1HSPFe )×EFLH heat
ΔkWhheat (ASHP with de facto space heating baseline only)¿CAPY heat
1000 WkW
×(OF spaceheat
HSPFb− 1HSPFe
)× EFLHheat
ΔkWpeak ¿ CAPY cool
1000 WkW
×( 1EERb
− 1EERe )×CF
ΔkWpeak (Room AC baseline only) ¿ CAPY cool
1000 WkW
×(OFRAC
EERb− 1EERe
)×CF
To determine the oversize factor for space heater baseline (OFspaceheat), EDCs may collect information about the capacity of the existing space heaters. Capacity is determined using the total wattage of portable electric space heaters in use in the home. Capacity is calculated as follows:
CAPY spaceheat=W spaceheat×3.412BtuW∙h
The OFspaceheat will equal the capacity of the existing portable space heaters divided by the capacity of the new equipment.
OF spaceheat=CAPY spaceheat
CAPY heat
To determine the oversize factor for room AC baseline (OFRAC), EDCs may collect information about the capacity of the existing room ACs. Capacity is determined using the total wattage of room ACs in use in the home. Capacity is calculated as follows:
CAPY RAC=W RAC×3.412 BtuW∙h
The OFRAC will equal the capacity of the existing room ACs divided by the capacity of the new equipment.
SECTION 2: Residential MeasuresHVAC Page 35
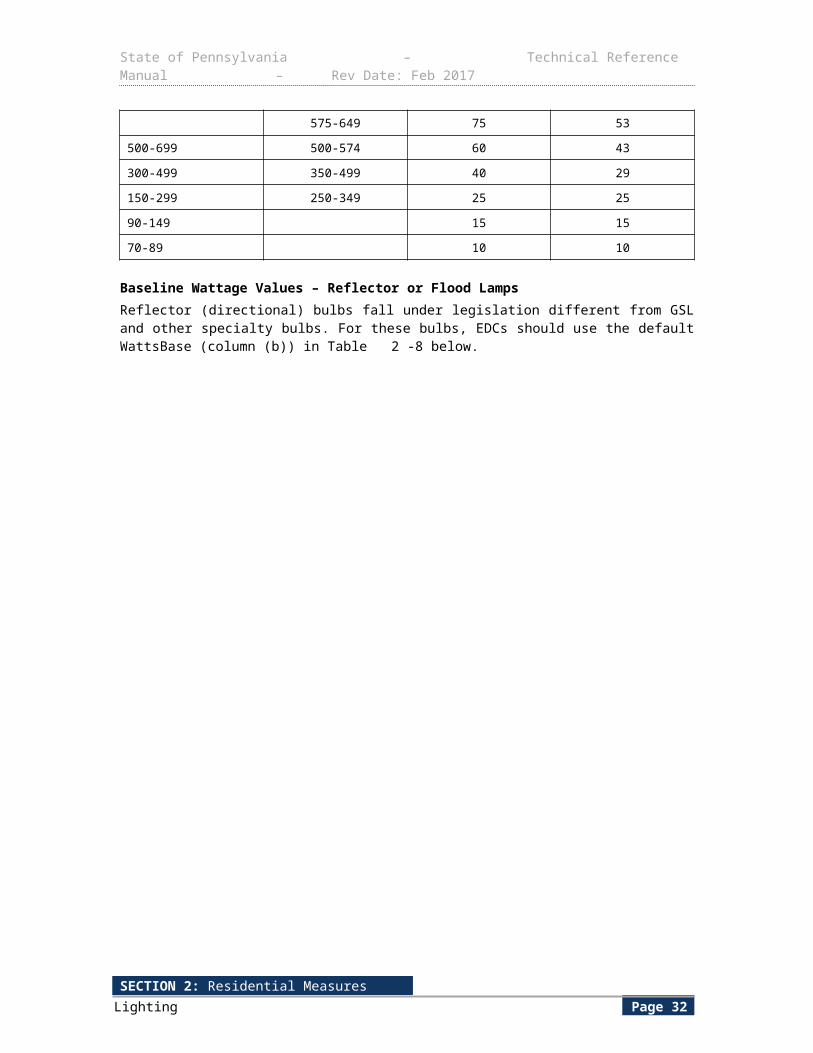
State of Pennsylvania – Technical Reference Manual – Rev Date: Feb 2017
OF RAC=CAPY RAC
CAPY cool
Central A/C (Proper Sizing)56
This algorithm is specifically intended for new units (Quality installation).
ΔkWh/yr = CAPY cool
(SEERq×1000 WkW
)×EFLH cool× PSF
ΔkWpeak = CAPY cool
(EERq×1000 WkW
)×CF×PSF
Central A/C and ASHP (Maintenance)This algorithm is used for measures providing services to maintain, service or tune-up central A/C and ASHP units. The tune-up must include the following at a minimum:
Check refrigerant charge level and correct as necessary
Clean filters as needed
Inspect and lubricate bearings
Inspect and clean condenser and, if accessible, evaporator coil
kWh/yr ¿kWhcool+kWhheat
ΔkWhcool ¿ CAPY cool
(1000 WkW
×SEERm)×EFLH cool×MFcool
ΔkWhheat(ASHP Only) ¿ CAPY heat
(1000 WkW
×HSPFm)× EFLHheat×MF heat
ΔkWpeak ¿ CAPY cool
(1000 WkW
× EERm)×CF×MFcool
Ground Source Heat Pumps (GSHP)This algorithm is used for the installation of new GSHP units. For GSHP systems over 65,000 Btuhr , see commercial algorithm stated in Section 3.2.3.
kWh/yr ¿kWhcool+kWhheatCOPsys ¿COPg×GSHPDFEERsys ¿ EERg×GSHPDF
kWhcool ¿CAPY cool
1000 WkW
×( 1SEERb
− 1EERsys×GSER )× EFLHcool
56 Proper sizing requires Manual J calculations, following of ENERGY STAR QI procedures, or similar calculations.
SECTION 2: Residential MeasuresHVAC Page 36
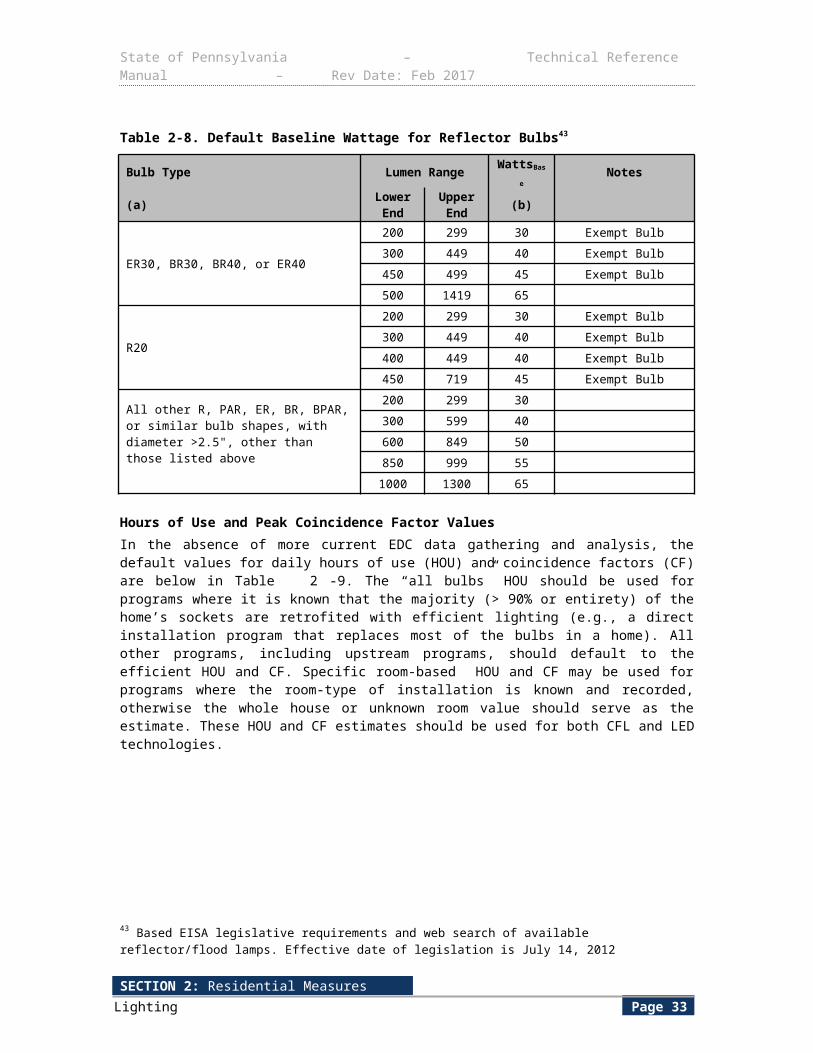
State of Pennsylvania – Technical Reference Manual – Rev Date: Feb 2017
kWhcool (RAC baseline only) ¿CAPY cool
1000 WkW
×(OF RAC
SEERb− 1EERsys×GSER )× EFLHcool
kWhheat ¿CAPY heat
1000 WkW
×( 1HSPFb
− 1COPsys×GSOP )×EFLH heat
kWhheat (space heater baseline only)
¿CAPY heat
1000 WkW
×(OF spaceheat
HSPFb− 1COP sys×GSOP )× EFLHheat
kWpeak =CAPY cool
1000 WkW
×( 1EERb
− 1EER sys×GSPK )×CF
kWpeak (RAC baseline only) =CAPY cool
1000 WkW
×(OF RAC
EERb− 1EERsys×GSPK )×CF
GSHP DesuperheaterThis algorithm is used for the installation of a desuperheater for a GSHP unit.
kWh/yr = EFDSH ×1
EFBase×HW ×365 days
yr×8.3 lb
gal×1 Btu
lb∙℉ ×(Thot−Tcold)
3412 BtukWh
= 511 kWh
kWpeak ¿EDSH ×ETDF
Furnace High Efficiency FanThis algorithm is used for the installation of new high efficiency furnace fans, or air handler replacement that includes a high efficiency fan.kWh/yrheat = HFSkWh/yrcool = CFSkWpeak = PDFS
D E F I N I T I O N O F T E R M S
Table 2-16: Residential Electric HVAC - References
Component Unit Value SourcesCAPYcool , The cooling capacity of the central air conditioner or heat pump being installed57
Btu/hr EDC Data Gathering AEPS Application; EDC Data Gathering
57 This data is obtained from the AEPS Application Form or EDC’s data gathering based on the model number.
SECTION 2: Residential MeasuresHVAC Page 37
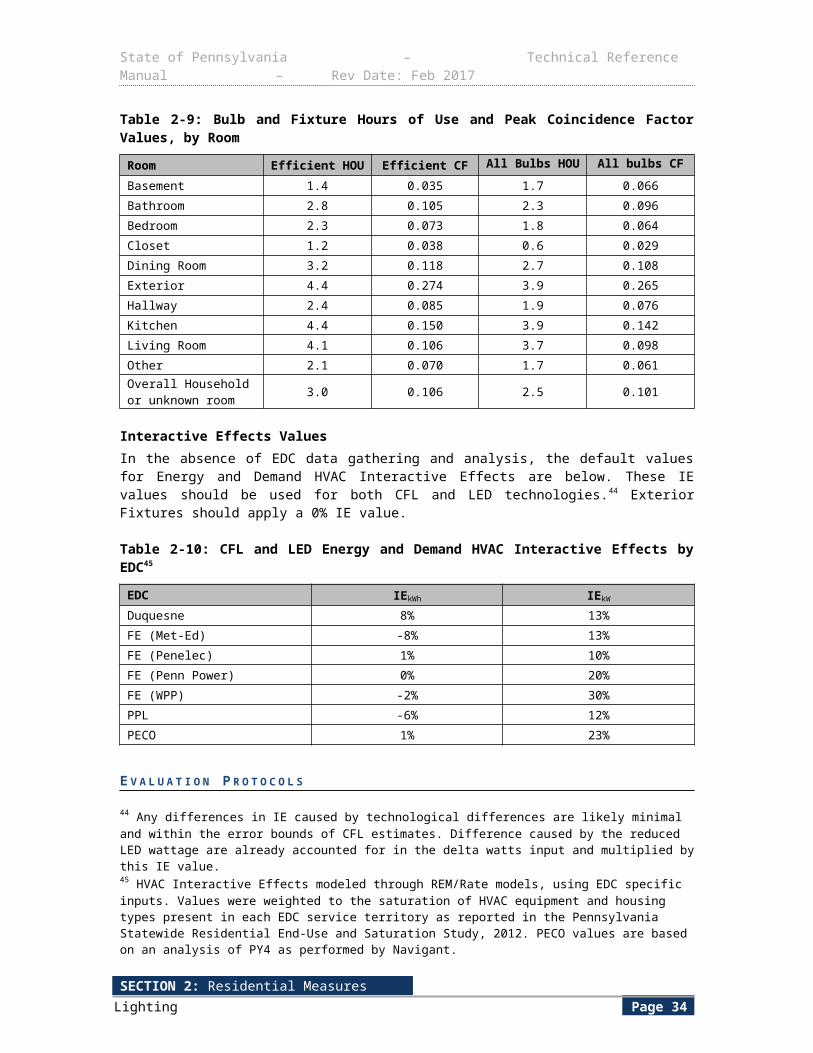
State of Pennsylvania – Technical Reference Manual – Rev Date: Feb 2017
Component Unit Value Sources
CAPYheat , The heating capacity of the heat pump being installed58 Btu/hr EDC Data Gathering AEPS Application;
EDC Data Gathering
CAPYspaceheat , The heating capacity of the space heaters when using the de facto heating baseline
Btu/hr EDC Data Gathering EDC Data Gathering
CAPYRAC , The cooling capacity of the room AC units. Used only for the RAC cooling baseline
Btu/hr EDC Data Gathering EDC Data Gathering
Wspaceheat , The heating capacity of the space heaters in watts. Used only for the de facto heating baseline
Watts EDC Data Gathering EDC Data Gathering
WRAC , The cooling capacity of the room AC in watts. Used only for the RAC cooling baseline
Watts EDC Data Gathering EDC Data Gathering
SEERb , Seasonal Energy Efficiency Ratio of the Baseline Unit (split or package units)
BtuW ∙h
Replace on Burnout: 13 SEER (Central A/C)
or 14 SEER (ASHP)1
BtuW ∙h
Early Retirement
EDC Data Gathering
Default = 11 (Central A/C) or
12 (ASHP) or 11.3 (Room A/C),or 13 (no
existing cooling)
13; EDC Data Gathering
SEERe , Seasonal Energy Efficiency Ratio of the qualifying unit being installed59
BtuW ∙h
EDC Data GatheringAEPS Application;
EDC Data Gathering
SEERm , Seasonal Energy Efficiency Ratio of the Unit receiving maintenance
BtuW ∙h
EDC Data GatheringDefault= 11 (Central A/C) or 12 (ASHP)
13; EDC Data Gathering
EERb , Energy Efficiency Ratio of the Baseline Unit
BtuW ∙h
Replace on Burnout: 11.3 (Central AC) or
12 (ASHP)2
BtuW ∙h
Early Retirement:EDC Data GatheringDefault= 8.69 or 9.8
(Room AC) or 11.3 (no existing cooling)
14; EDC Data Gathering
EERe , Energy Efficiency Ratio of the unit being installed60
BtuW ∙h
For Central A/C:
11.313
×SEER
Or for ASHP:
1214×SEER
2; EDC Data Gathering
58 Ibid.59 Ibid.60 Ibid.
SECTION 2: Residential MeasuresHVAC Page 38
State of Pennsylvania – Technical Reference Manual – Rev Date: Feb 2017
Component Unit Value SourcesEERg , EER of the ground source heat pump being installed. Note that EERs of GSHPs are measured differently than EERs of air source heat pumps (focusing on entering water temperatures rather than ambient air temperatures). The equivalent SEER of a GSHP can be estimated by multiplying EERg by 1.02
BtuW ∙h
EDC Data GatheringAEPS Application;
EDC’s Data Gathering
EERsys , Ground Source Heat Pump effective system EER
BtuW ∙h
Calculated Calculated
EERm , Energy Efficiency Ratio of the Unit receiving maintenance
BtuW ∙h
EDC Data GatheringDefault= 8.69
14; EDC Data Gathering
GSER , Factor used to determine the SEER of a GSHP based on its EERg
BtuW ∙h
1.02 3
EFLHcool , Equivalent Full Load Hours of operation during the cooling season for the average unit
hoursyr
Allentown Cooling = 487 Hours
Erie Cooling = 389 Hours
Harrisburg Cooling = 551 Hours
Philadelphia Cooling = 591 Hours
Pittsburgh Cooling = 432 Hours
Scranton Cooling = 417 Hours
Williamsport Cooling = 422 Hours
4
Optional
An EDC can either use the Alternate EFLH Table or estimate its own EFLH based on customer billing data
analysis.
Alternate EFLH Table (See Table2-17); EDC Data
Gathering
EFLHheat , Equivalent Full Load Hours of operation during the heating season for the average unit
hoursyr
Allentown Heating = 1,193 Hours
Erie Heating = 1,349 Hours
Harrisburg Heating = 1,103 Hours
Philadelphia Heating = 1,060 Hours
Pittsburgh Heating = 1,209 Hours
Scranton Heating = 1,296 Hours
Williamsport Heating = 1,251 Hours
4
Optional An EDC can either use the Alternate EFLH Table or estimate its own EFLH based on customer billing data
analysis.
Alternate EFLH Table (See Table2-18); EDC Data
Gathering
SECTION 2: Residential MeasuresHVAC Page 39
State of Pennsylvania – Technical Reference Manual – Rev Date: Feb 2017
Component Unit Value SourcesOFSpaceheat , Oversize factor applicable only for the de facto heating baseline where space heaters are used after a fossil fuel heating system has failed
NoneEDC Data Gathering
Default = 0.6 21
OFRAC , Oversize factor applicable only for the room AC baseline None
EDC Data GatheringDefault = 1.0
4
PSF , Proper Sizing Factor or the assumed savings due to proper sizing and proper installation
None 0.05 5
MFcool , Maintenance Factor or assumed savings due to completing recommended maintenance on installed cooling equipment
None 0.05 15
MFheat , Maintenance Factor or assumed savings due to completing recommended maintenance on installed heating equipment
None 0.05 15
HSPFm , Heating Seasonal Performance Factor of the unit receiving maintenance
BtuW ∙h
6.9 20
COPg , Coefficient of Performance. This is a measure of the efficiency of a heat pump None EDC Data Gathering
AEPS Application; EDC’s Data Gathering
GSHPDF , Ground Source Heat Pump De-rate Factor None 0.885
19(Engineering
Estimate - See System
Performance of Ground Source Heat Pumps)
COPsys , Ground Source Heat Pump effective system COP Variable Calculated Calculated
GSOP , Factor to determine the HSPF of a GSHP based on its COPg None 3.412 8
GSPK , Factor to convert EERg to the equivalent EER of an air conditioner to enable comparisons to the baseline unit
None 0.8416 9
EFDSH , Energy Factor per desuperheater None 0.17 10, 11
EDSH61 , Fixed savings per desuperheater kWh/yr567
Calculated
CF , Demand Coincidence Factor (See Section 1.5) Decimal 0.647 6
HSPFb , Heating Seasonal Performance Factor of the Baseline Unit
BtuW ∙h
Replace on Burnout: 8.2
7
61 GSHP desuperheaters are generally small, auxiliary heat exchangers that uses superheated gases from the GSHP’s compressor to heat water. This hot water then circulates through a pipe to the home’s storage water heater tank.
SECTION 2: Residential MeasuresHVAC Page 40
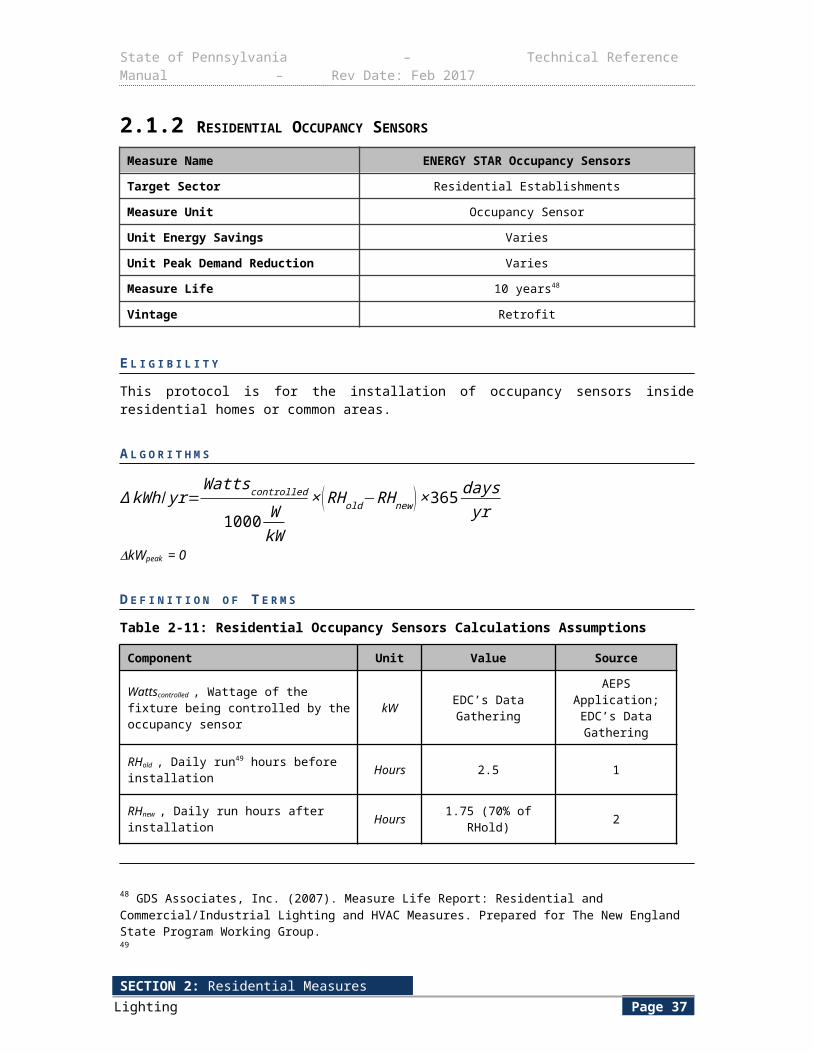
State of Pennsylvania – Technical Reference Manual – Rev Date: Feb 2017
Component Unit Value Sources
BtuW ∙h
Early Replacement:EDC Data Gathering
Default = 6.9Electric resistance or de facto space heater
default = 3.412
20
HSPFe , Heating Seasonal Performance Factor of the unit being installed62
BtuW ∙h
EDC Data GatheringAEPS Application;
EDC’s Data Gathering
EFbase , Energy Factor of Electric Water Heater None 0.945 Table 2-52
HW , Daily Hot Water Use Gallons/day 50 Table 2-49
T hot, , Hot Water Temperature °F 119 Table 2-49
T cold,, Cold Water Temperature °F 55 Table 2-49
ETDF , Fixed “Energy to Demand Factor per desuperheater None 0.00008047 Table 2-49
PDSH , Assumed peak-demand savings per desuperheater kW 0.05 Calculated
HFS , Assumed heating season savings per furnace high efficiency fan kWh 311 16
CFS , Assumed cooling season savings per furnace high efficiency fan kWh 135 17
PDFS , Assumed peak-demand savings per furnace high efficiency fan kW 0.105 18
A L T E R N A T E E Q U I V A L E N T F U L L L O A D H O U R ( E F L H ) T A B L E S
Table 2-17 and Table 2-18 below show cooling EFLH and heating EFLH, respectively, by city and for each EDC’s housing demographics. EFLH values are only shown for cities that are close to customers in each EDC’s service territory. In order to determine the most appropriate EFLH value to use for a project, first select the appropriate EDC, then, from that column, pick the closest city to the project location. The value shown in that cell will be the EFLH value to use for the project. For more information on the following two tables, see Source 4.
Table 2-17: Alternate Cooling EFLH
PPL Penelec Met Ed West Penn
Duquesne Penn Power
PECO
Allentown 431 528 453 N/A N/A N/A 523Erie N/A 418 N/A 413 N/A 397 N/AHarrisburg 487 N/A 506 580 N/A N/A N/APhiladelphia N/A N/A 536 N/A N/A N/A 651Pittsburgh N/A 468 N/A 458 417 448 N/A
62 This data is obtained from the AEPS Application Form or EDC’s data gathering.
SECTION 2: Residential MeasuresHVAC Page 41
State of Pennsylvania – Technical Reference Manual – Rev Date: Feb 2017
Scranton 376 454 N/A N/A N/A N/A N/AWilliamsport N/A N/A N/A 447 N/A N/A N/A
Table 2-18: Alternate Heating EFLH
PPL Penelec Met Ed West Penn
Duquesne Penn Power
PECO
Allentown 1112 1057 1122 N/A N/A N/A 1320Erie N/A 1204 N/A 1317 N/A 1376 N/AHarrisburg 1028 N/A 1035 1077 N/A N/A N/APhiladelphia N/A N/A 1001 N/A N/A N/A 1165Pittsburgh N/A 1068 N/A 1175 1274 1234 N/AScranton 1023 1151 N/A N/A N/A N/A N/AWilliamsport N/A N/A N/A 1218 N/A N/A N/A
S Y S T E M P E R F O R M A N C E O F G R O U N D S O U R C E H E A T P U M P S
Ground Source heat pump nameplate AHRI ratings do not include auxiliary pumping energy for ground loop water distribution. Based on McQuay heat pump design guidelines (Ref. #19), it is estimated that approximately a 1/3 HP pump would be required to be paired with a 2.5 ton Ground Source Heat Pump (assuming 3 GPM//ton design flow and 200 ft./ton of 1-inch tubing). At 7.5 GPM, a 1/3 HP pump would consume approximately 0.23 kW (7.5 GPM @ 30 ft. head). Assuming a 2 kW load for the heat pump itself, this would amount to a roughly 11.5% increase in system energy. The system COP de-rate factor would then be 0.885.
E V A L U A T I O N P R O T O C O L S
For most projects, the appropriate evaluation protocol is to verify installation and proper selection of default values. For projects using customer specific data for open variables, the appropriate evaluation protocol is to verify installation and proper application of TRM protocol along with verification of open variables. The Pennsylvania Evaluation Framework provides specific guidelines and requirements for evaluation procedures.
S O U R C E S
1) Federal Code of Regulations 10 CFR 430. http://www1.eere.energy.gov/buildings/appliance_standards/product.aspx/productid/75
2) Average EER for SEER 13 units as calculated by EER = -0.02 × SEER² + 1.12 × SEER based on U.S. DOE Building America House Simulation Protocol, Revised 2010.
3) VEIC estimate. Extrapolation of manufacturer data.
4) Based on REM/Rate modeling using models from the PA 2012 Potential Study. EFLH calculated from kWh consumption for cooling and heating. Models assume 50% over-sizing of air conditioners63 and 40% oversizing of heat pumps.64
5) Northeast Energy Efficiency Partnerships, Inc., “Strategies to Increase Residential HVAC Efficiency in the Northeast”, (February 2006): Appendix C Benefits of HVAC Contractor Training: Field Research Results 03-STAC-01, page 46.
63 Neme, Proctor, Nadal, “National Energy Savings Potential From Addressing Residential HVAC Installation Problems. ACEEE, February 1, 1999. Confirmed also by Central Air Conditioning in Wisconsin, a compilation of recent field research. Energy Center of Wisconsin. May 2008, emended December 15, 2010, http://ecw.org/sites/default/files/241-1_0.pdf 64 ACCA, “Verifying ACCA Manual S Procedures,” http://www.acca.org/wp-content/uploads/2014/01/Manual-S-Brochure-Final.pdf
SECTION 2: Residential MeasuresHVAC Page 42
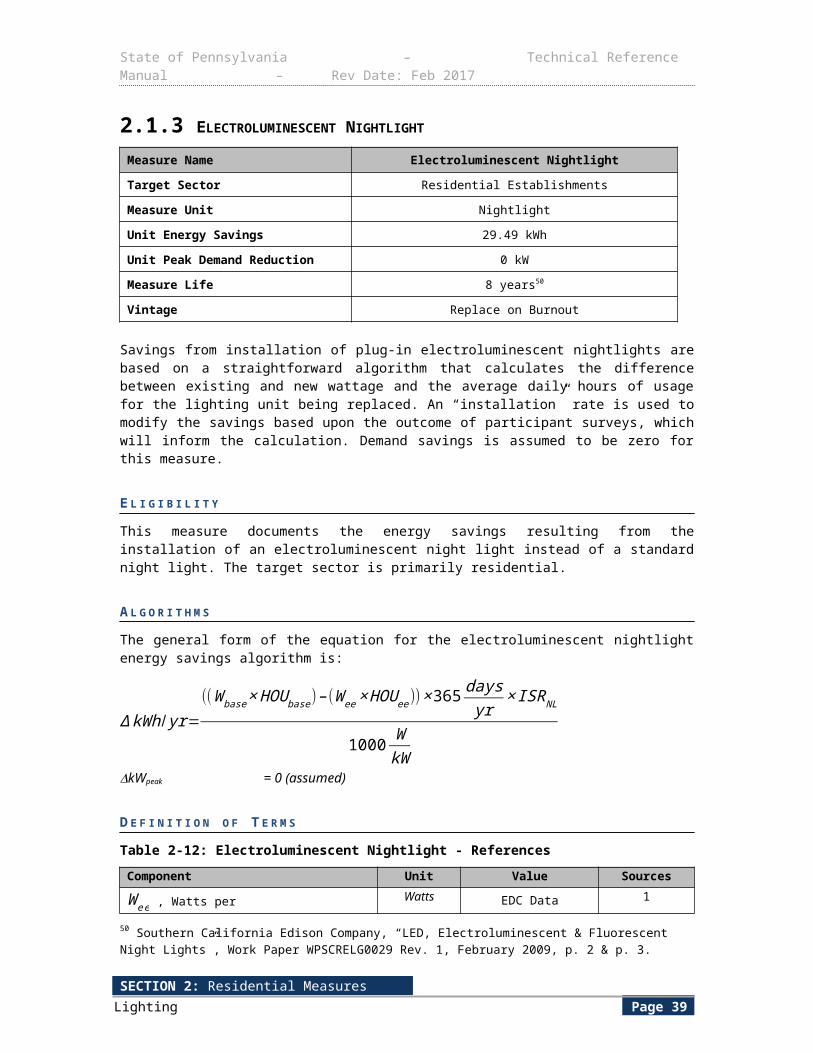
State of Pennsylvania – Technical Reference Manual – Rev Date: Feb 2017
6) Straub, Mary and Switzer, Sheldon."Using Available Information for Efficient Evaluation of Demand Side Management Programs". Study by BG&E. The Electricity Journal. Aug/Sept. 2011. Found at http://www.sciencedirect.com/science/article/pii/S1040619011001941
7) Federal Code of Regulations 10 CFR 430. http://www1.eere.energy.gov/buildings/appliance_standards/product.aspx/productid/75
8) Engineering calculation, HSPF/COP=3.412.
9) VEIC Estimate. Extrapolation of manufacturer data.
10) ”Residential Ground Source Heat Pumps with Integrated Domestic Hot Water Generation: Performance Results from Long-Term Monitoring”, U.S. Department of Energy, November 2012.
11) Desuperheater Study, New England Electric System, 1998 42 U.S.C.A 6295(i) (West Supp. 2011) and 10 C.F.R. 430.32 (x) (2011).
12) Northeast Energy Efficiency Partnerships, Inc., “Benefits of HVAC Contractor Training”, (February 2006): Appendix C Benefits of HVAC Contractor Training: Field Research Results 03-STAC-01.
13) 2014 Pennsylvania Residential Baseline Study. The Act 129 2014 Residential Baseline Study may be found at http://www.puc.pa.gov/Electric/pdf/Act129/SWE-2014_PA_Statewide_Act129_Residential_Baseline_Study.pdf
14) The same EER to SEER ratio used for SEER 13 units applied to SEER 10 units. EERm = (11.3/13) * 10.
15) 2013 Illinois Statewide TRM (Central Air Conditioning in Wisconsin, Energy Center of Wisconsin, May 2008)
16) Scott Pigg (Energy Center of Wisconsin), “Electricity Use by New Furnaces: A Wisconsin Field Study”, Technical Report 230-1, October 2003, page 20. The average heating-mode savings of 400 kWh multiplied by the ratio of average heating degree days in PA compared to Madison, WI (5568/7172).
17) Ibid, page 34. The average cooling-mode savings of 88 kWh multiplied by the ratio of average EFLH in PA compared to Madison, WI (749/487).
18) Ibid, page 34. The average kW savings of 0.1625 multiplied by the coincidence factor from Table 2-15.
19) McQuay Application Guide 31-008, Geothermal Heat Pump Design Manual, 2002.
20) Based on building energy model simulations and residential baseline characteristics determined from the 2014 Residential End-use Study and applied to an HSPF listing for 12 SEER Air Source Heat Pumps at https://www.ahridirectory.org on July 28th, 2014.
21) Assumptions used to calculate a default value for OFSpaceheat , the oversize factor for de facto space heaters: Four (4) 1500 W portable electric space heaters in use in the home with capacity of 1500 × 3.412 × 4 = 20,472 BTU, replaced by ASHP with heating capacity of 36,000 BTU. OF = 20,472 / 36,000 = 0.6.
SECTION 2: Residential MeasuresHVAC Page 43
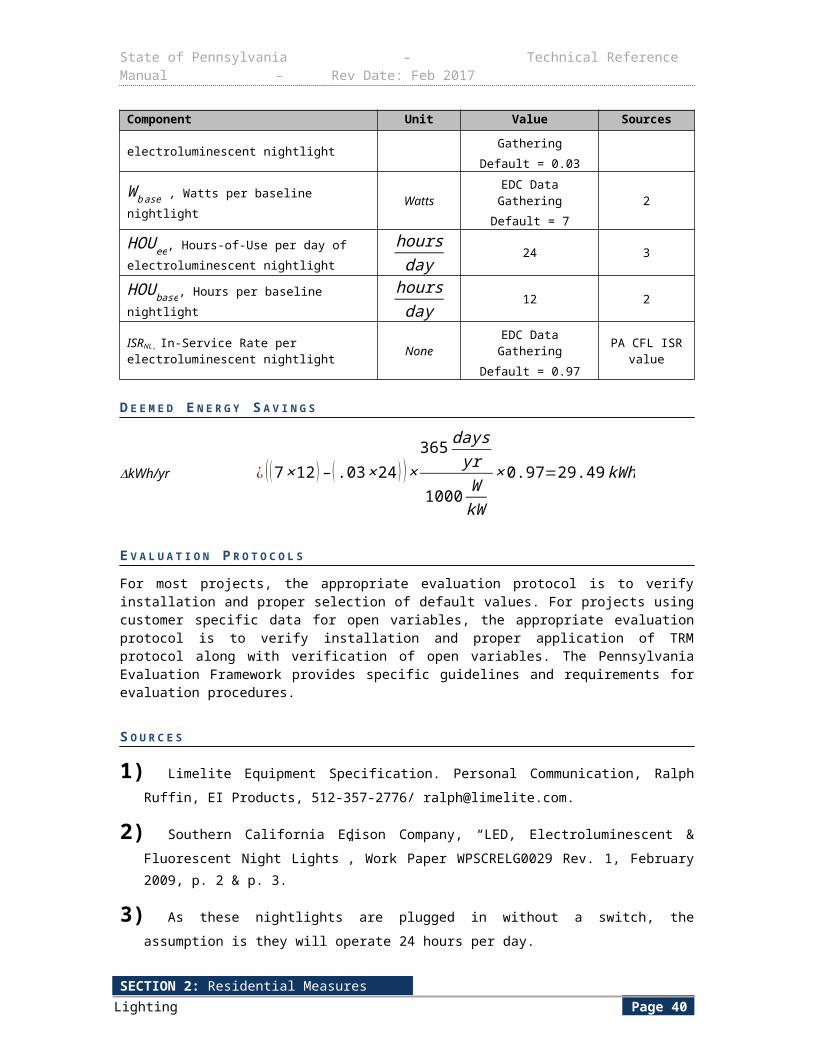
State of Pennsylvania – Technical Reference Manual – Rev Date: Feb 2017
2.2.2 FUEL SWITCHING: ELECTRIC HEAT TO GAS/PROPANE/OIL HEAT Measure Name Fuel Switching: Electric Heat to Gas/Propane/Oil Heat
Target Sector Residential Establishments
Measure Unit Gas, Propane, or Oil Heater
Unit Energy Savings Variable based on system and location
Unit Peak Demand Reduction Variable based on system and location
Measure Life 20 years65
Vintage Replace on Burnout
This protocol documents the energy savings attributed to converting from an existing electric heating system to a new natural gas, propane, or oil furnace or boiler in a residential home.
The baseline for this measure is an existing residential home with an electric primary heating source. The heating source can be electric baseboards, electric furnace, or electric air source heat pump.
E L I G I B I L I T Y The target sector primarily consists of single-family residences.
The retrofit condition for this measure is the installation of a new standard efficiency natural gas, propane, or oil furnace or boiler. To encourage adoption of the highest efficiency units, older units which meet outdated ENERGY STAR standards may be incented up through the given sunset dates (see table below).
ENERGY STAR Product Criteria Version
ENERGY STAR Effective Manufacture Date Act 129 Sunset Datea
ENERGY STAR Furnaces Version 4.0 February 1, 2013 N/A
ENERGY STAR Furnaces Version 3.0 February 1, 2012 May 31, 2014
ENERGY STAR Furnaces Version 2.0, Tier II units
October 1, 2008 May 31, 2013
a Date after which Act 129 programs may no longer offer incentives for products meeting the criteria for the listed ENERGY STAR version.”
EDCs may provide incentives for equipment with efficiencies greater than or equal to the applicable ENERGY STAR requirement per the following table.
Equipment Energy Star Requirements66
Gas Furnace AFUE rating of 95% or greater
Less than or equal to 2.0% furnace fan efficiency Less than or equal to 2.0% air leakage
Oil Furnace AFUE rating of 85% or greater
Less than or equal to 2.0% furnace fan efficiency Less than or equal to 2.0% air leakage
Boiler AFUE rating of 85% or greater
65 PA 2010 TRM Appendix A: Measure Lives. Note that PA Act 129 savings can be claimed for no more than 15 years.66 Residential Furnace and Boiler Energy Star product criteria. http://www.energystar.gov/index.cfm?c=furnaces.pr_crit_furnaces and http://www.energystar.gov/index.cfm?fuseaction=find_a_product.showProductGroup&pgw_code=BO
SECTION 2: Residential MeasuresHVAC Page 44

State of Pennsylvania – Technical Reference Manual – Rev Date: Feb 2017
A L G O R I T H M S
The energy savings are the full energy consumption of the electric heating source minus the energy consumption of the fossil fuel furnace blower motor. EDC’s may use billing analysis using program participant data to claim measure savings, in lieu of the defaults provided in this measure protocol. The energy savings are obtained through the following formulas:
Heating savings with electric furnace (assumes 100% efficiency):Energy Impact:
∆ kWh/ y relec furnace=CAPY elec heat×EFLH elec furnace
3412 BtukWh
Heating savings with electric baseboards (assumes 100% efficiency):Energy Impact:
∆ kWh/ y relec bb heat=CAPY elec heat×EFLH elec bb
3412 BtukWh
−HPmotor×(746 W
hp )×EFLH fuel furnace
ηmotor×1000 WkW
Heating savings with electric air source heat pump:Energy Impact:
Δ kWh /yrASHP heat =CAPYASHP heat ×EFLH ASHP
HSPFASHP×1000 WkW
− HPmotor ×(746 W
HP )× EFLH fuel furnace
ηmotor ×1000 WkW
For boilers, the annual pump energy consumption is negligible (<50 kWh per year) and not included in this calculation.67
There are no peak demand savings as it is a heating only measure.
Although there is a significant electric savings, there is also an associated increase in natural gas energy consumption. While this gas consumption does not count against PA Act 129 energy savings, it is expected to be used in the program TRC test. The increased fossil fuel energy is obtained through the following formulas:
Gas consumption with fossil fuel furnace:
Gas Consumption (MMBtu) =CAPYfuel heat × EFLH fuel furnace
AFUE fuel heat × 1,000,000 BtuMMBtu
D E F I N I T I O N O F T E R M S
The default values for each term are shown in the table below.
67 Pump motors are typically 1/25 HP. With 1,000 hour runtime and 80% assumed efficiency, this translates to 37 kWh.
SECTION 2: Residential MeasuresHVAC Page 45
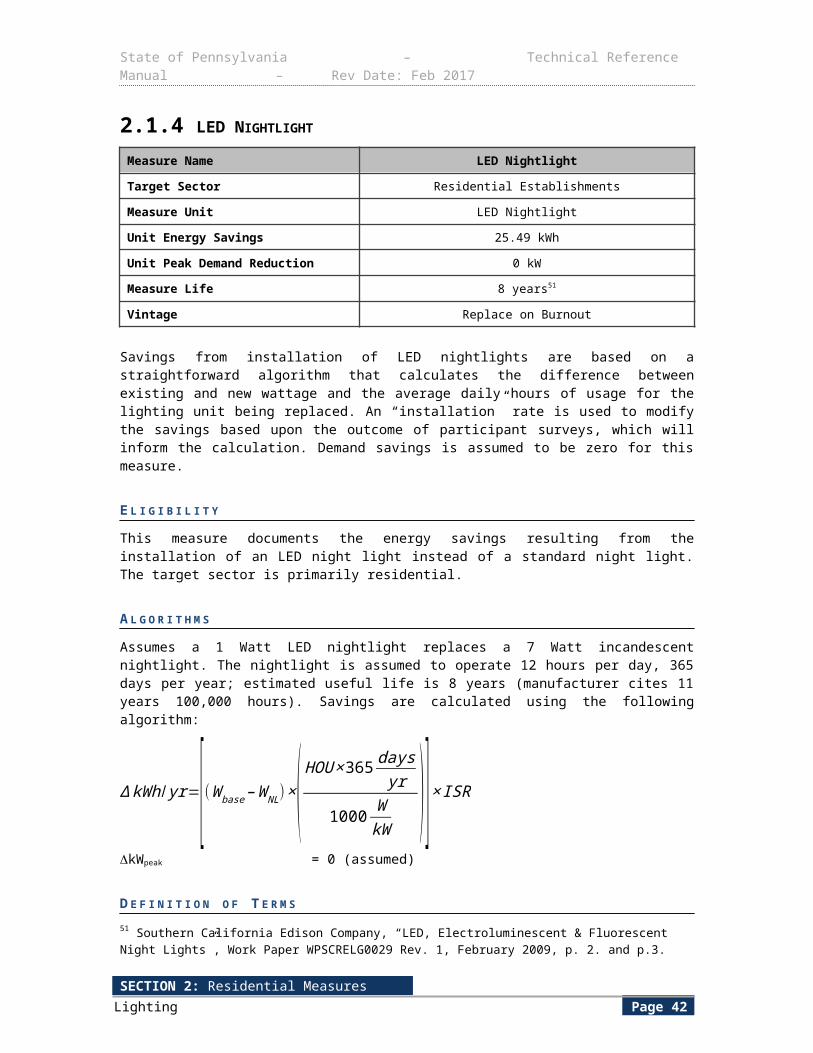
State of Pennsylvania – Technical Reference Manual – Rev Date: Feb 2017
Table 2-19: Default values for algorithm terms, Fuel Switching, Electric Heat to Gas Heat
Term Units Value SourceCAPYelec heat , Total heating capacity of existing electric baseboards or electric furnace
Btuhr
Nameplate EDC Data Gathering
CAPYASHP heat , Total heating capacity of existing electric ASHP
Btuhr
Nameplate EDC Data Gathering
CAPYfuel heat , Total heating capacity of new natural gas furnace
Btuhr
Nameplate EDC Data Gathering
EFLHASHP , Equivalent Full Load Heating hours for Air Source Heat Pumps
hoursyr
Allentown = 1,193Erie = 1,349
Harrisburg = 1,103Philadelphia = 1,060Pittsburgh = 1,209Scranton = 1,296
Williamsport = 1,251
2014 PA TRM Table 2-16, in Electric HVAC
section
Optional
An EDC can either use the Alternate EFLH Table or
estimate its own EFLH based on
customer billing data analysis.
Alternate EFLH Table (See Table
2-20) or EDC Data Gathering
EFLHelec furnace , Equivalent Full Load Heating hours for Electric Forced Air Furnaces
hoursyr
Allentown = 1,000Erie = 1,075
Harrisburg = 947Philadelphia = 934Pittsburgh = 964Scranton = 1,034
Williamsport = 1,011
1
Optional
An EDC can either use the Alternate EFLH Table or
estimate it’s own EFLH based on
customer billing data analysis.
Alternate EFLH Table (See Table
2-21) or EDC Data Gathering
EFLHelec bb , Equivalent Full Load Heating hours for Electric Baseboard systems
hoursyr
Allentown = 1,321Erie = 1,396
Harrisburg = 1,265Philadelphia = 1,236Pittsburgh = 1,273Scranton = 1,357
Williamsport = 1,354
1
Optional
An EDC can either use the Alternate EFLH Table or
estimate it’s own EFLH based on
customer billing data analysis.
Alternate EFLH Table (See Table
2-22) or EDC Data Gathering
SECTION 2: Residential MeasuresHVAC Page 46
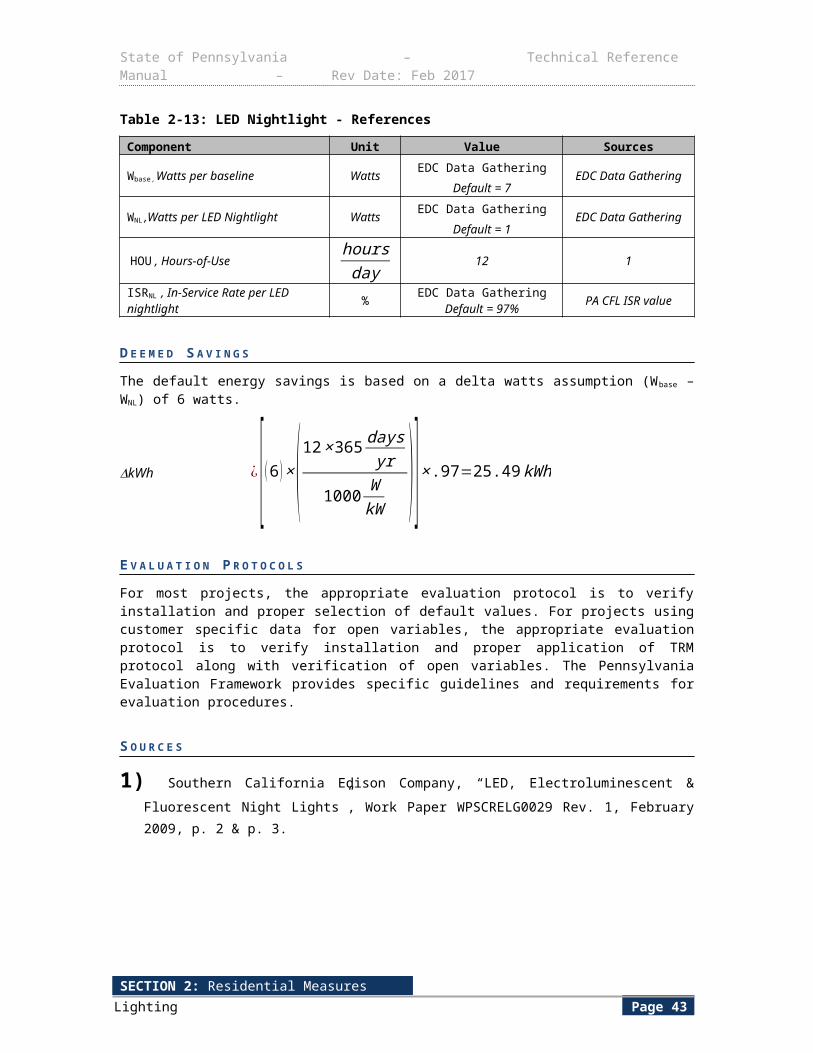
State of Pennsylvania – Technical Reference Manual – Rev Date: Feb 2017
Term Units Value Source
EFLHfuel furnace , Equivalent Full Load Heating hours for Fossil Fuel Furnace systems
hoursyr
Allentown = 1,022Erie = 1,098
Harrisburg = 969Philadelphia = 955Pittsburgh = 985Scranton = 1,056
Williamsport = 1,033
1
Optional
An EDC can either use the Alternate EFLH Table or
estimate it’s own EFLH based on
customer billing data analysis.
Alternate EFLH Table (See Table
2-23) or EDC Data Gathering
EFLHfuel boiler , Equivalent Full Load Heating hours for Fuel Boilers
hoursyr
Allentown = 1,334Erie = 1,411
Harrisburg = 1,279Philadelphia = 1,249Pittsburgh = 1,283Scranton = 1,371
Williamsport = 1,354
1
Optional
An EDC can either use the Alternate EFLH Table or
estimate it’s own EFLH based on
customer billing data analysis.
Alternate EFLH Table (See Table
2-24) or EDC Data Gathering
HSPFASHP , Heating Seasonal Performance Factor for existing heat pump
BtuW ∙hr
EDC Data GatheringDefault = 7.7
2010 PA TRM Table 2-10
Nameplate EDC Data Gathering
AFUEfuel heat , Annual Fuel Utilization Efficiency for the new gas furnace %
EDC Data GatheringDefault = 95%
(natural gas/propane furnace)
95% (natural gas/propane steam
boiler)95% (natural
gas/propane hot water boiler)
85% (oil furnace)85% (oil steam boiler)
85% (oil hot water boiler)
ENERGY STAR requirement
Nameplate EDC Data Gathering
HPmotor , Gas furnace blower motor horsepower hp
EDC Data GatheringDefault = ½
Average blower motor capacity for
gas furnace (typical range = ¼
hp to ¾ hp)
Nameplate EDC Data Gathering
ηmotor , Efficiency of furnace blower motor %EDC Data Gathering
Default = 50%Typical efficiency of ½ hp blower
SECTION 2: Residential MeasuresHVAC Page 47
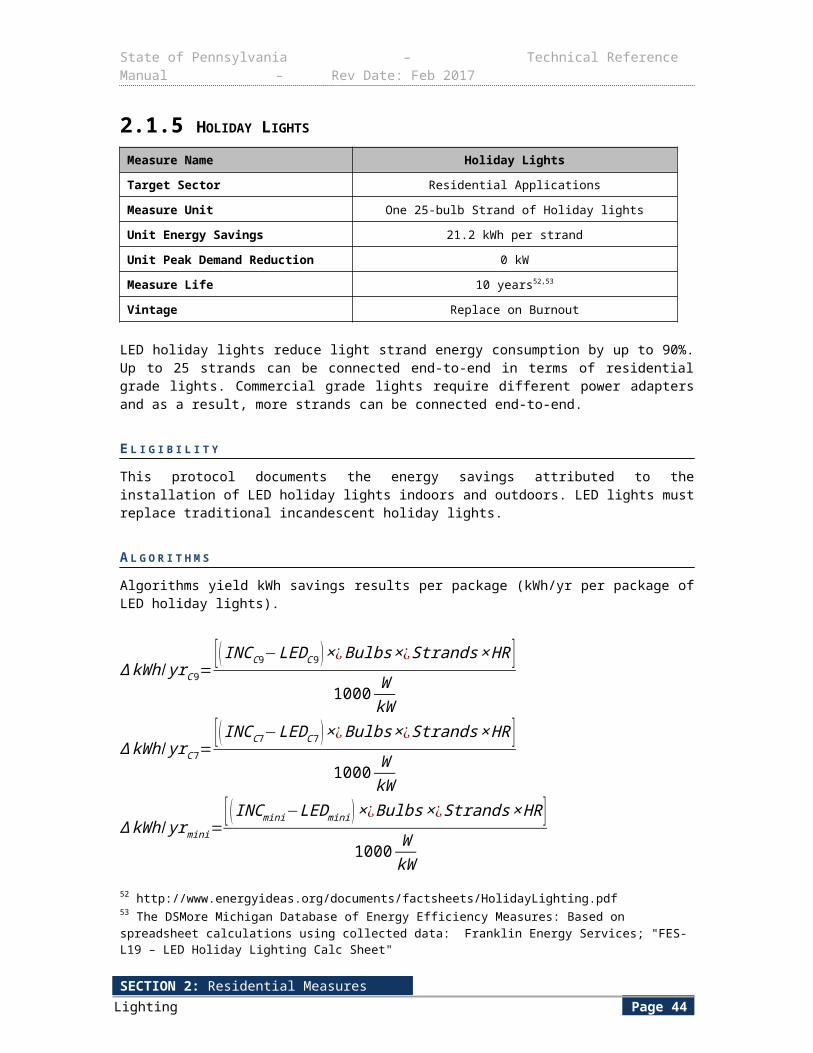
State of Pennsylvania – Technical Reference Manual – Rev Date: Feb 2017
Term Units Value Sourcemotor
Alternate Equivalent Full Load Hour (EFLH) TablesTable 2-20 through Table 2-24 below, show heating EFLH by city and for each EDC’s housing demographics. In order to determine the most appropriate EFLH value to use for a project, first select the type of electric heating equipment being replaced, then the appropriate EDC. Next, from the column, pick the closest city to the project location. The value shown in that cell will be the EFLH value to use for the project.
Table 2-20: Alternate Heating EFLH for Air Source Heat Pumps
PPL Penelec Met EdWest Penn Duquesne
Penn Power PECO
Allentown 1112 1057 1122 1165 1265 1226 1320Erie 1255 1204 1273 1317 1420 1376 1494Harrisburg 1028 974 1035 1077 1174 1138 1219Philadelphia 986 940 1001 1039 1134 1098 1165Pittsburgh 1124 1068 1133 1175 1274 1234 1347Scranton 1203 1151 1218 1261 1365 1321 1445Williamsport 1161 1110 1175 1218 1320 1278 1392
Table 2-21: Alternate Heating EFLH for Electric Furnaces
PPL Penelec Met EdWest Penn Duquesne
Penn Power PECO
Allentown 914 890 952 991 1079 1037 1100Erie 986 964 1027 1064 1150 1108 1183Harrisburg 866 837 900 940 1027 986 1041Philadelphia 854 827 893 931 1018 976 1021Pittsburgh 882 854 914 950 1033 994 1068Scranton 945 922 983 1020 1107 1064 1144Williamsport 924 902 961 998 1085 1043 1118
Table 2-22: Alternate Heating EFLH for Electric Baseboard Heating
PPL Penelec Met EdWest Penn Duquesne
Penn Power PECO
Allentown 1355 1204 1280 1334 1351 1355 1326Erie 1432 1287 1360 1408 1426 1430 1395Harrisburg 1300 1144 1224 1280 1298 1299 1271Philadelphia 1272 1115 1194 1247 1268 1269 1242Pittsburgh 1301 1158 1230 1281 1297 1431 1277Scranton 1389 1245 1317 1369 1385 1385 1366Williamsport 1373 1230 1303 1351 1371 1371 1394
Table 2-23: Alternate Heating EFLH for Fossil Fuel Furnaces
PPL Penelec Met EdWest Penn Duquesne
Penn Power PECO
Allentown 934 919 985 1023 1116 1071 1106Erie 1007 995 1060 1098 1188 1144 1190Harrisburg 887 865 931 973 1064 1018 1048Philadelphia 873 855 922 962 1055 1007 1027Pittsburgh 900 882 945 982 1067 1024 1075Scranton 965 951 1016 1053 1144 1099 1149Williamsport 944 931 993 1031 1121 1078 1124
SECTION 2: Residential MeasuresHVAC Page 48
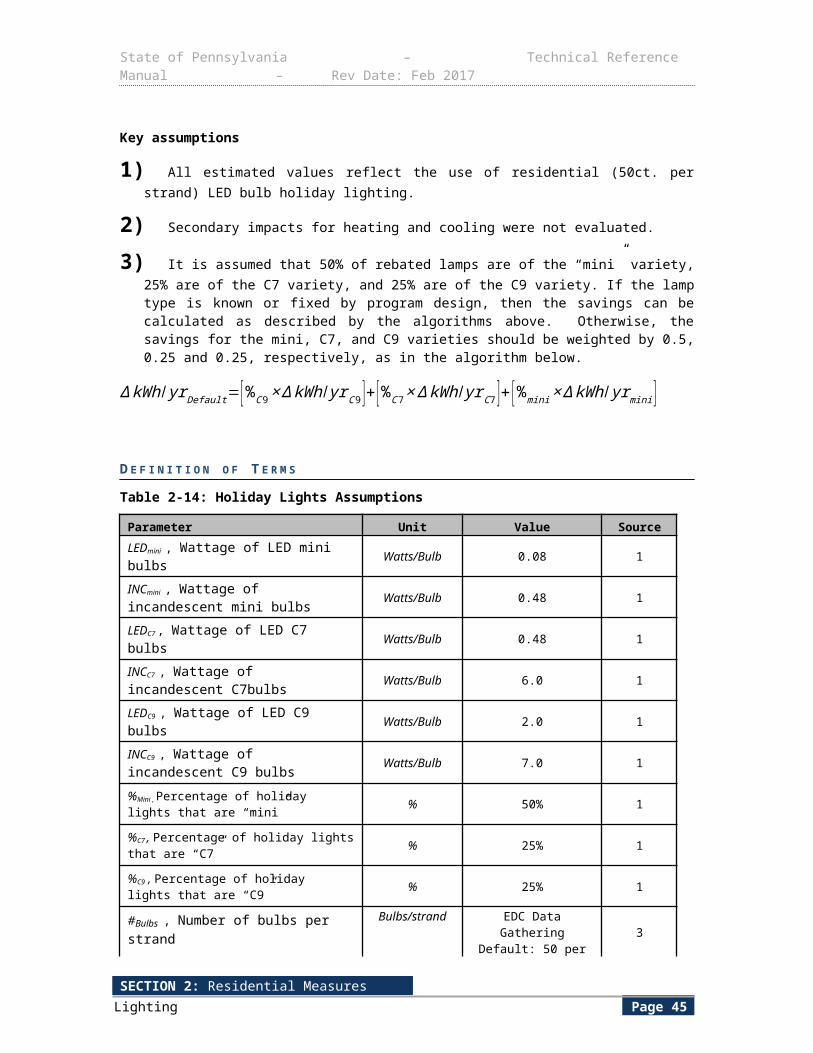
State of Pennsylvania – Technical Reference Manual – Rev Date: Feb 2017
Table 2-24: Alternate Heating EFLH for Fossil Fuel Boilers
PPL Penelec Met EdWest Penn Duquesne
Penn Power PECO
Allentown 1366 1214 1289 1346 1363 1364 1347Erie 1445 1299 1370 1422 1440 1440 1417Harrisburg 1312 1155 1234 1290 1308 1309 1291Philadelphia 1281 1125 1205 1261 1278 1280 1260Pittsburgh 1315 1169 1240 1294 1311 1311 1292Scranton 1400 1256 1330 1378 1399 1397 1386Williamsport 1384 1238 1313 1365 1382 1383 1364
E V A L U A T I O N P R O T O C O L S
For most projects, the appropriate evaluation protocol is to verify installation and proper selection of default values. For projects using customer specific data for open variables, the appropriate evaluation protocol is to verify installation and proper application of TRM protocol along with verification of open variables. The Pennsylvania Evaluation Framework provides specific guidelines and requirements for evaluation procedures.
S O U R C E S
1) Based on REM/Rate modeling using models from the PA 2012 Potential Study. EFLH calculated from kWh consumption for cooling and heating. Models 40% oversizing of heat systems.
SECTION 2: Residential MeasuresHVAC Page 49
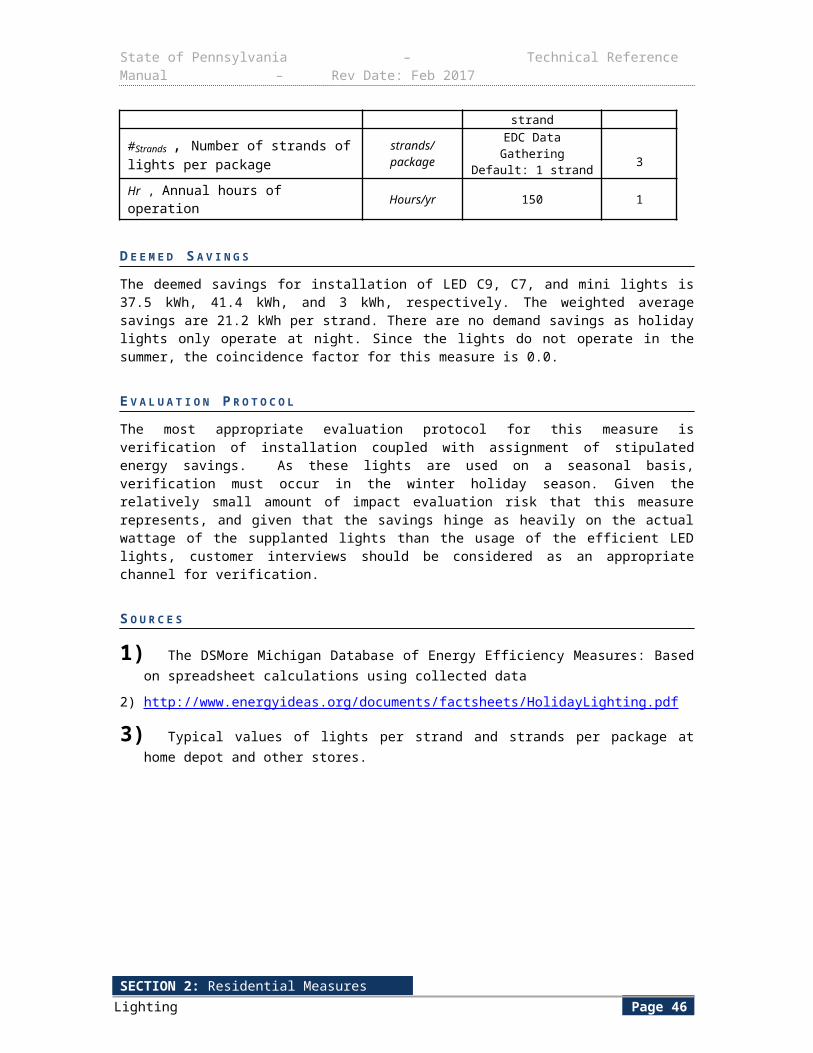
State of Pennsylvania – Technical Reference Manual – Rev Date: Feb 2017
2.2.3 DUCTLESS MINI-SPLIT HEAT PUMPS
Measure Name Ductless Heat Pumps
Target Sector Residential Establishments
Measure Unit Ductless Heat Pumps
Unit Energy Savings Variable based on efficiency of systems
Unit Peak Demand Reduction Variable based on efficiency of systems
Measure Life 15 years68
Vintage Replace on Burnout
ENERGY STAR Version 5.0 ductless “mini-split” heat pumps utilize high efficiency SEER/EER and HSPF energy performance factors of 15/12.5 and 8.5, respectively, or greater. This technology typically converts an electric resistance heated home into an efficient single or multi-zonal ductless heat pump system. Homeowners have the choice to install an ENERGY STAR qualified model or a standard efficiency model.
E L I G I B I L I T Y
This protocol documents the energy savings attributed to ductless mini-split heat pumps with energy efficiency performance of 15/12.5 SEER/EER and 8.5 HSPF or greater with inverter technology.69 The baseline heating system could be:
1) Existing electric resistance heating
2) Electric space heaters used as the primary heating source when fossil fuel (other than natural gas) heating systems failed (referred to as de facto heating) 70 71
3) A lower-efficiency ductless heat pump system
4) A ducted heat pump
5) Electric furnace
6) A non-electric fuel-based system.
The baseline cooling system can be:
7) A standard efficiency heat pump system
8) A central air conditioning system
9) A room air conditioner
In addition, this could be installed in new construction or an addition. For new construction or addition applications, the baseline assumption is a standard-efficiency ductless unit. The DHP systems could be installed as the primary heating or cooling system for the house or as a secondary heating or cooling system for a single room.
68 DEER Effective Useful Life values, updated2/5/2014. Various sources range from 12 to 20 years, DEER represented a reasonable mid-range. http://www.deeresources.com/files/DEER2013codeUpdate/download/DEER2014-EUL-table-update_2014-02-05.xlsx69 The measure energy efficiency performance is based on ENERGY STAR Version 5.0 minimum specification requirements for Air Source Heat Pumps. Ductless heat pumps fit these criteria and can easily exceed SEER levels of 16 or greater. 70 This baseline is for participants with broken-beyond-repair oil heating systems who are heating their homes with portable electric space heaters. 71 When calculating Net savings, EDCs should review the approach laid out in the Phase III Pennsylvania Evaluation Framework when it becomes available.
SECTION 2: Residential MeasuresHVAC Page 50
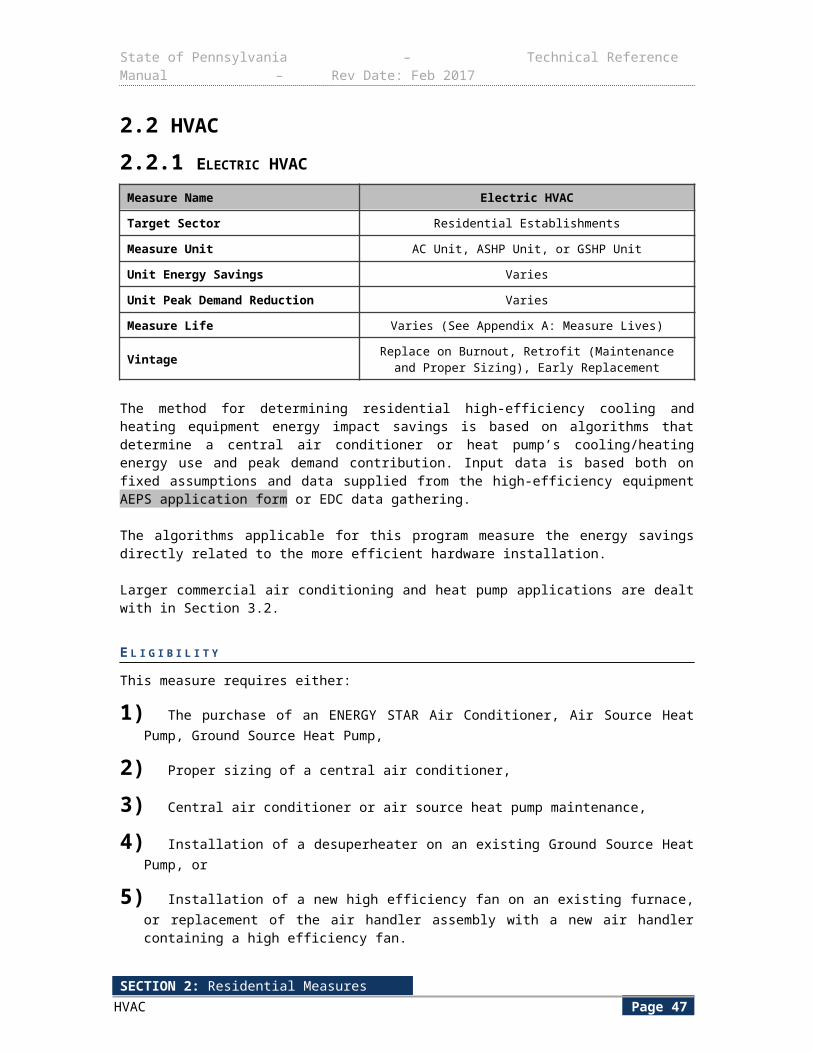
State of Pennsylvania – Technical Reference Manual – Rev Date: Feb 2017
A L G O R I T H M S
The savings depend on three main factors: baseline condition, usage (primary or secondary heating system), and the capacity of the indoor unit. The algorithm is separated into two calculations: single zone and multi-zone ductless heat pumps. The savings algorithm is as follows:
S I N G L E Z O N E
∆ kWh/ yr=∆kWh / yrcool+∆kWh / yrheat
∆ kWh/ yrheat=CAPY heat
1000 WkW
×(OF×DLFHSPFbase− 1HSPFee )× EFLHheat
∆ kWh/ yrcool=CAPY cool
1000 WkW
×(OF×DLFSEERbase− 1SEERee )× EFLHcool
∆ kW peak=CAPY cool
1000 WkW
×(OF×DLFEERbase− 1EERee )×CF
M U L T I - Z O N E
∆ kWh/ yr=∆kWh / yrcool+∆kWh / yrheat
∆ kWh/ yrheat=[CAPY heat
1000 WkW
×(OF×DLFHSPFbase 1− 1HSPFee )×EFLH heat ]
zone1
+[CAPY heat
1000 WkW
×(OF×DLFHSPFbase 2− 1HSPFee )×EFLH heat ]
zone2
+…+[ CAPY heat
1000 WkW
×(OF×DLFHSPFbasen− 1HSPFee )× EFLHheat ]
zonen
∆ kWh/ yrcool=[ CAPY cool
1000 WkW
×(OF×DLFSEERbase 1− 1SEERee )×EFLH cool]
zone 1
+[ CAPY cool
1000 WkW
×(OF×DLFSEERbase2− 1SEERee )×EFLH cool ]
zone 2
+…+[ CAPY cool
1000 WkW
×(OF×DLFSEERb asen− 1SEERee )×EFLHcool ]
zonen
∆ kW peak=[ CAPY cool
1000 WkW
×(OF×DLFEERbase 1− 1EERee )×CF ]
zone 1
+[ CAPY cool
1000 WkW
×(OF×DLFEERbase2− 1EERee )×CF ]
zone 2
+…+[ CAPY cool
1000 WkW
×(OF×DLFEERbasen− 1EERee )×CF ]
zonen
D E F I N I T I O N O F T E R M S
SECTION 2: Residential MeasuresHVAC Page 51
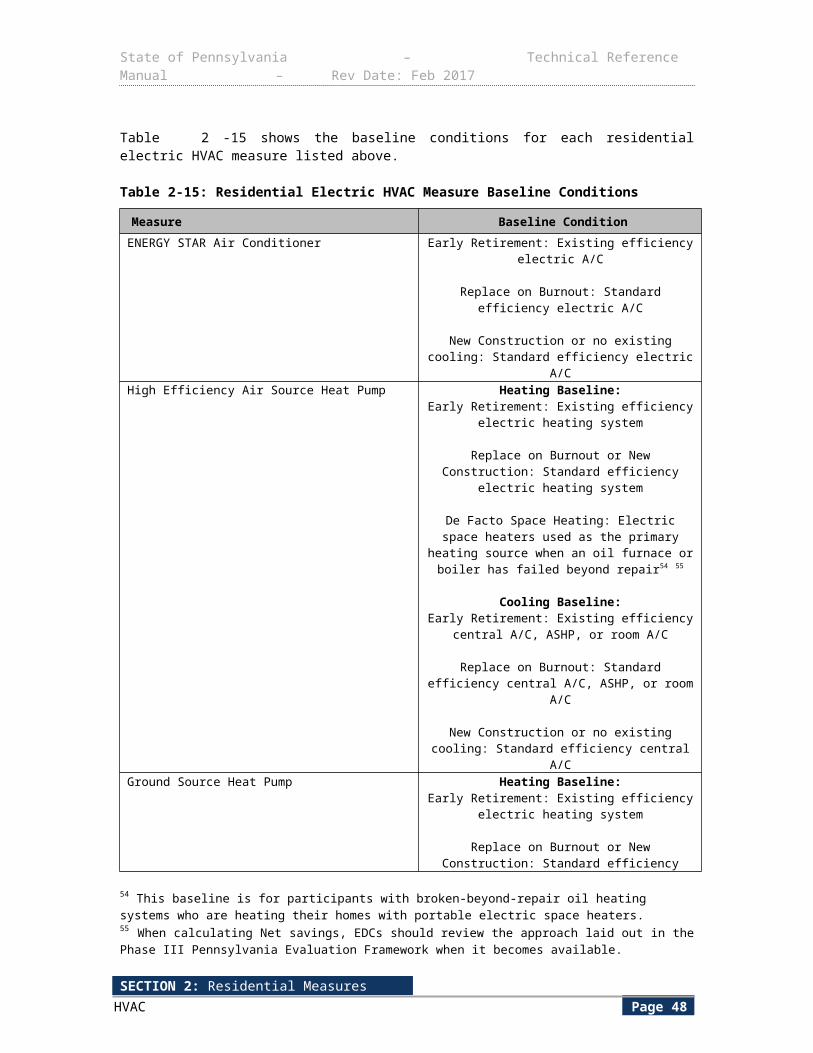
State of Pennsylvania – Technical Reference Manual – Rev Date: Feb 2017
Table 2-25: DHP – Values and References
Term Unit Values Sources
CAPYcool, The cooling (at 47° F) capacity of the Ductless Heat Pump unit
Btuhour
EDC Data Gathering AEPS Application; EDC Data Gathering
CAPYheat, The heating (at 47° F) capacity of the Ductless Heat Pump unit
Btuhour
EDC Data Gathering AEPS Application; EDC Data Gathering
EFLH primary , Equivalent Full Load Hours of the primary system – If the unit is installed as the primary heating or cooling system, as defined in Table 2-26
hoursyear
Allentown Cooling = 487 HoursAllentown Heating = 1,193 Hours
Erie Cooling = 389 HoursErie Heating = 1,349 Hours
Harrisburg Cooling = 551 HoursHarrisburg Heating = 1,103 HoursPhiladelphia Cooling = 591 Hours
Philadelphia Heating = 1,060 HoursPittsburgh Cooling = 432 Hours
Pittsburgh Heating = 1,209 HoursScranton Cooling = 417 Hours
Scranton Heating = 1,296 HoursWilliamsport Cooling = 422 Hours
Williamsport Heating = 1,251 Hours
1
hoursyear
An EDC can either use the Alternate EFLH Table 2-18 or
estimate its own EFLH based on customer billing data analysis
EDC Data Gathering
EFLH secondary, Equivalent Full Load Hours of the secondary system – If the unit is installed as the secondary heating or cooling system, as defined in Table 2-26
hoursyear
Allentown Cooling = 243 HoursAllentown Heating = 800 Hours
Erie Cooling = 149 HoursErie Heating = 994 Hours
Harrisburg Cooling = 288 HoursHarrisburg Heating = 782 Hours
Philadelphia Cooling = 320 HoursPhiladelphia Heating = 712 HoursPittsburgh Cooling = 228 HoursPittsburgh Heating = 848 HoursScranton Cooling = 193 HoursScranton Heating = 925 Hours
Williamsport Cooling = 204 HoursWilliamsport Heating = 875 hours
2, 3
SECTION 2: Residential MeasuresHVAC Page 52
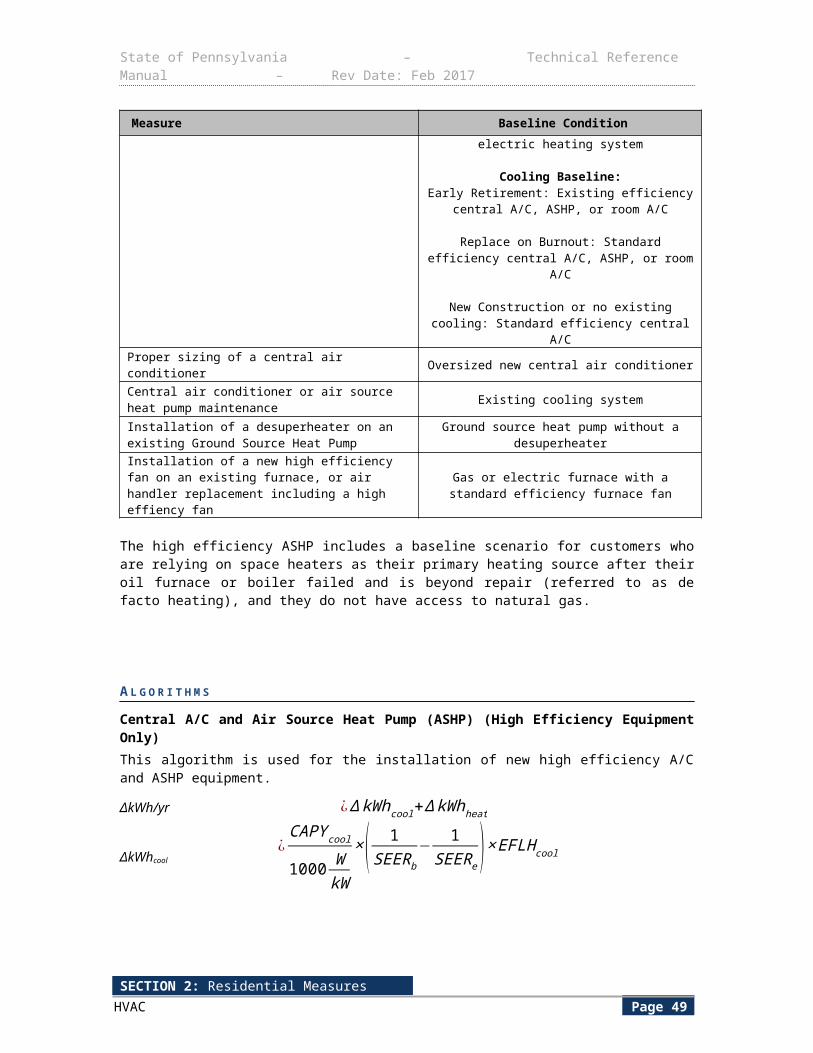
State of Pennsylvania – Technical Reference Manual – Rev Date: Feb 2017
Term Unit Values Sources
HSPFbase, “Heating Seasonal Performance Factor”- heating efficiency of baseline unit
BtuW ∙h
Standard DHP: 8.2Electric resistance or de facto
space heaters: 3.412ASHP: 8.2
Electric furnace: 3.242No existing or non-electric heating:
use standard DHP: 8.2
4, 6
SEERbase, “Seasonal Energy Efficiency Ratio” - Cooling efficiency of baseline unit
BtuW ∙h
DHP or ASHP: 14Central AC: 13Room AC: 11.3
No existing cooling for primary space: use Central AC: 13
No existing cooling for secondary space: use Room AC: 11.3
5, 6, 7
HSPFee, “Heating Seasonal Performance Factor”- heating efficiency of installed DHP
BtuW ∙h
Based on nameplate information. Should be at least ENERGY STAR.
AEPS Application; EDC Data Gathering
SEERee, “Seasonal Energy Efficiency Ratio” - Cooling efficiency of installed DHP
BtuW ∙h
Based on nameplate information. Should be at least ENERGY STAR.
AEPS Application; EDC Data Gathering
OF, “Oversize factor” factor to account for the fact that the baseline unit is typically 40%-50% oversized. In the case of de facto space heaters, the baseline capacity is typically undersized.
None EDC Data Gathering, where
OF=CAPY base
CAPY ee
Default Depends on baseline condition:
Central AC=1.5Central ASHP=1.4
Electric Furnace=1.4Electric Baseboard=1.4
De facto Space Heaters=0.6Room AC: 1.0
Ductless Heat Pump: 1.0
1, 11 (de facto space
heaters)
DLF, “Duct Leakage Factor” accounts for the fact that a % of the energy is lost to duct leakage and conduction for ducted systems, but not ductless ones
None Depends on baseline condition:Central AC=1.15
Central ASHP=1.15Electric Furnace=1.15
Electric Baseboard=1.00De facto Space Heaters= 1.00
Room AC: 1.00Ductless Heat Pump: 1.0
10
CF, Coincidence Factor Decimal 0.647 8
EERbase, The Energy Efficiency Ratio of the baseline unit*
BtuW ∙h
= (11.3/13) X SEERbase for central AC or no existing cooling
=(12/14) X SEERbase for DHP= 9.8 room AC
5,9
SECTION 2: Residential MeasuresHVAC Page 53
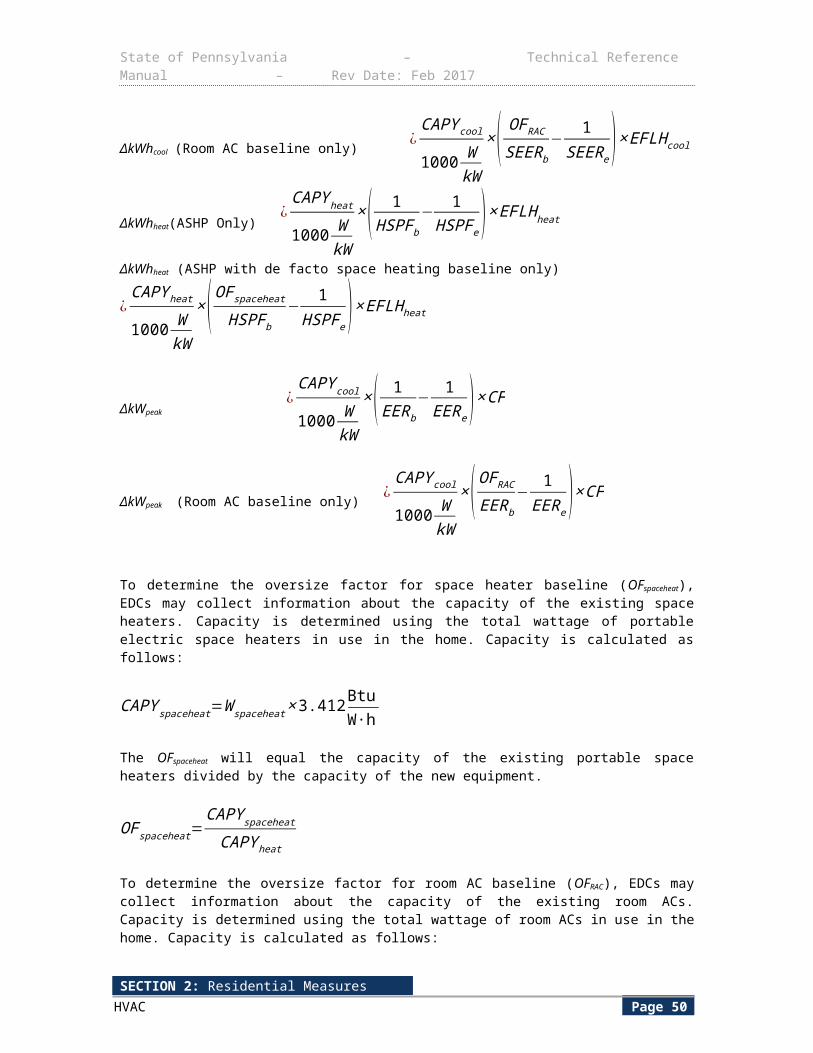
State of Pennsylvania – Technical Reference Manual – Rev Date: Feb 2017
Term Unit Values Sources
EERee, The Energy Efficiency Ratio of the installed DHP
BtuW ∙h
= (12/14) X SEERee
Based on nameplate information. Should be at least ENERGY STAR.
AEPS Application; EDC Data Gathering
*The existing EERbase value for ductless heat pumps applies to air source heat pumps (i.e., the EERbase value for ASHPs equals (12/14) x SEERbase).
D E F I N I T I O N O F H E A T I N G Z O N E
Definition of primary and secondary heating systems depends primarily on the location where the source heat is provided in the household, and shown in Table 2-26.
Table 2-26: DHP – Heating Zones
Component Definition
Primary Heating Zone Living roomDining room
House hallwayKitchen areasFamily Room
Recreation RoomSecondary Heating Zone Bedroom
Bathroom Basement
Storage RoomOffice/Study
Laundry/MudroomSunroom/Seasonal Room
E V A L U A T I O N P R O T O C O L S
The most appropriate evaluation protocol for this measure is verification of installation coupled with assignment of stipulated energy savings. A sample of pre- and post-metering is recommended to verify heating and cooling savings but billing analysis will be accepted as a proper form of savings verification and evaluation.
S O U R C E S
1) Based on REM/Rate modeling using models from the PA 2012 Potential Study. EFLH calculated from kWh consumption for cooling and heating. Models assume 50% over-sizing of air conditioners72 and 40% oversizing of heat pumps.73
2) Secondary cooling load hours based on room air conditioner “corrected” EFLH work paper that adjusted the central cooling hours to room AC cooling hours; see Section 2.2.5 Room AC Retirement measure.
3) Secondary heating hours based on a ratio of HDD base 68 and base 60 degrees F. The ratio is used to reflect the heating requirement for secondary spaces is less than primary space as the thermostat set point in these spaces is generally lowered during unoccupied time periods.
72 Neme, Proctor, Nadal, “National Energy Savings Potential From Addressing Residential HVAC Installation Problems. ACEEE, February 1, 1999. Confirmed also by Central Air Conditioning in Wisconsin, a compilation of recent field research. Energy Center of Wisconsin. May 2008, emended December 15, 201073 ACCA, “Verifying ACCA Manual S Procedures,” http://www.acca.org/wp-content/uploads/2014/01/Manual_S_verification.pdf.
SECTION 2: Residential MeasuresHVAC Page 54
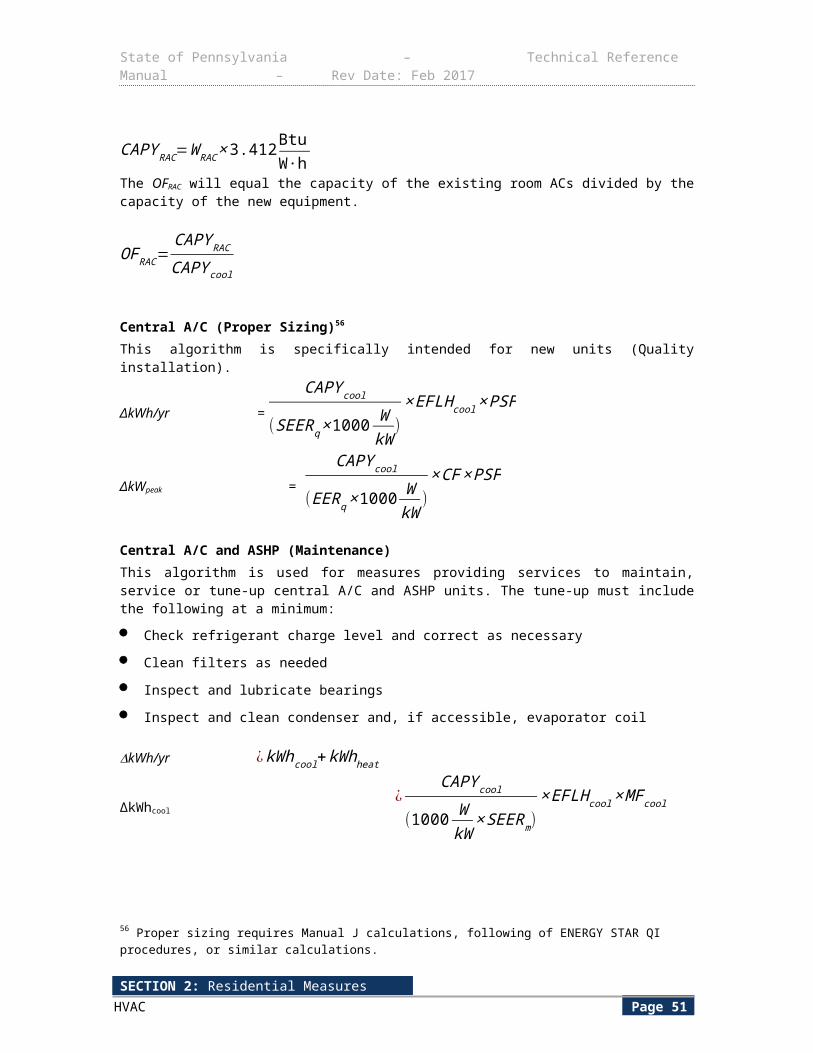
State of Pennsylvania – Technical Reference Manual – Rev Date: Feb 2017
4) Using the relation HSPF=COP*3.412, HSPF = 3.412 for electric resistance heating. Electric furnace efficiency typically varies from 0.95 to 1.00, so similarly a COP of 0.95 equates to an HSPF of 3.241.
5) U.S. Federal Standards for Residential Air Conditioners and Heat Pumps. Effective 1/1/2015. http://www1.eere.energy.gov/buildings/appliance_standards/product.aspx/productid/75
6) Air-Conditioning, Heating, and Refrigeration Institute (AHRI); the directory of the available ductless mini-split heat pumps and corresponding efficiencies (lowest efficiency currently available). Accessed 8/16/2010.
7) SEER based on average EER of 9.8 for room AC unit. From Pennsylvania’s Technical Reference Manual.
8) Straub, Mary and Switzer, Sheldon. "Using Available Information for Efficient Evaluation of Demand Side Management Programs". Study by BG&E. The Electricity Journal. Aug/Sept. 2011. Found at http://www.sciencedirect.com/science/article/pii/S1040619011001941
9) Average EER for SEER 13 unit. From Pennsylvania’s Technical Reference Manual.
10) Assumption used in Illinois 2014 TRM, Ductless Heat Pumps Measure, pg. 531, footnote 877. Reasonable assumption when compared to http://www.energystar.gov/index.cfm?c=home_improvement.hm_improvement_ducts and Residential HVAC and Distribution Research Implementation,. Berkeley Labs. May, 2002, pg 6. http://epb.lbl.gov/publications/pdf/lbnl-47214.pdf
11) Assumptions used to calculate a default value for de facto heating system OF: Four (4) 1500 W portable electric space heaters in use in the home with capacity of 1500 × 3.412 × 4 = 20,472 BTU, replaced by DHP with combined heating capacity of 36,000 BTU. OF = 20,472 / 36,000 = 0.6.
SECTION 2: Residential MeasuresHVAC Page 55
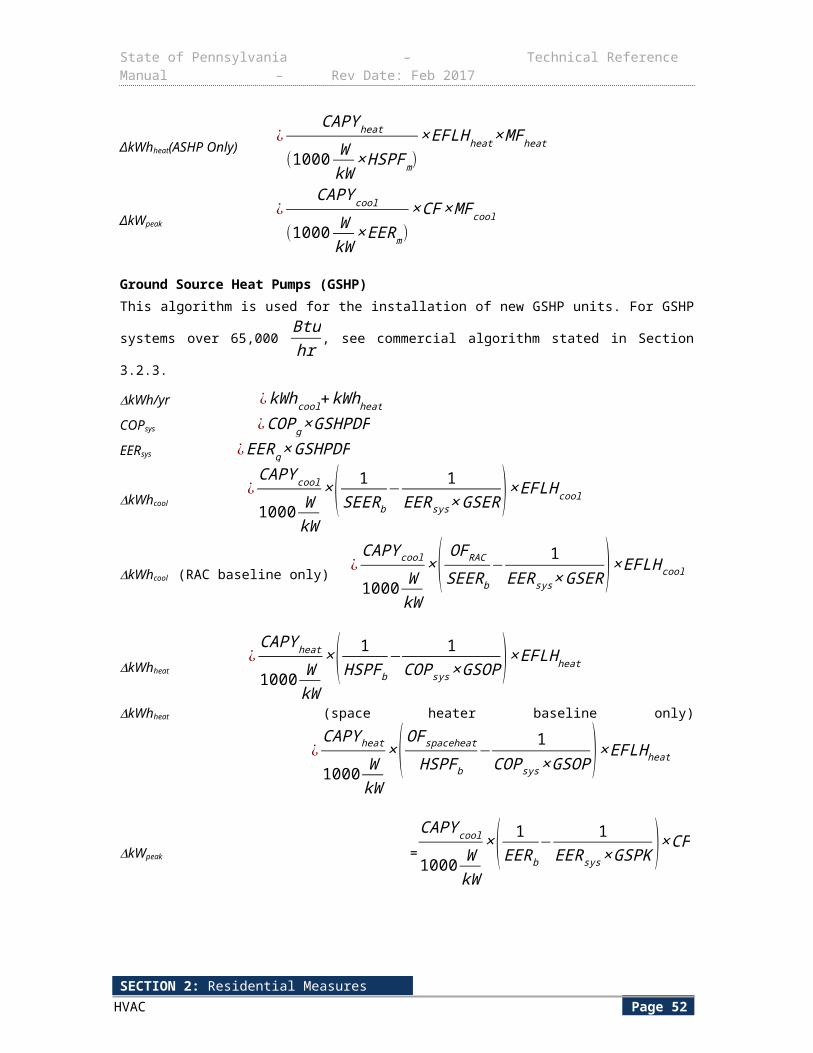
State of Pennsylvania – Technical Reference Manual – Rev Date: Feb 2017
2.2.4 ENERGY STAR ROOM AIR CONDITIONERS
Measure Name Room Air Conditioners
Target Sector Residential Establishments
Measure Unit Room Air Conditioner
Unit Energy Savings Varies
Unit Peak Demand Reduction Varies
Measure Life 9 years74
Vintage Replace on Burnout
E L I G I B I L I T Y This measure relates to the purchase and installation of a room air conditioner meeting ENERGY STAR Version 4.0 criteria.
A L G O R I T H M S
The general form of the equation for the ENERGY STAR Room Air Conditioners (RAC) measure savings algorithm is:
Total Savings ¿Number of RoomAir Conditioners×Savings per Room Air Conditioner
To determine resource savings, the per-unit estimates in the algorithms will be multiplied by the number of room air conditioners. The number of room air conditioners will be determined using market assessments and market tracking.
As of June 1, 2014 RAC units will have a “CEER” rating as well as an “EER”. CEER is the “Combined Energy Efficiency Ratio”, which incorporates standby power into the calculation. This will be the value used in the ∆ kWh/ yr calculation.
∆ kWh/ yr= CAPY
1000 WkW
×( 1CEERbase
−1
CEERee )×EFLH RAC
∆ kW peak=CAPY
1000 WkW
×( 1CEERbase
−1
C EERee )×CF
74 Appliance Magazine, 2008.
SECTION 2: Residential MeasuresHVAC Page 56
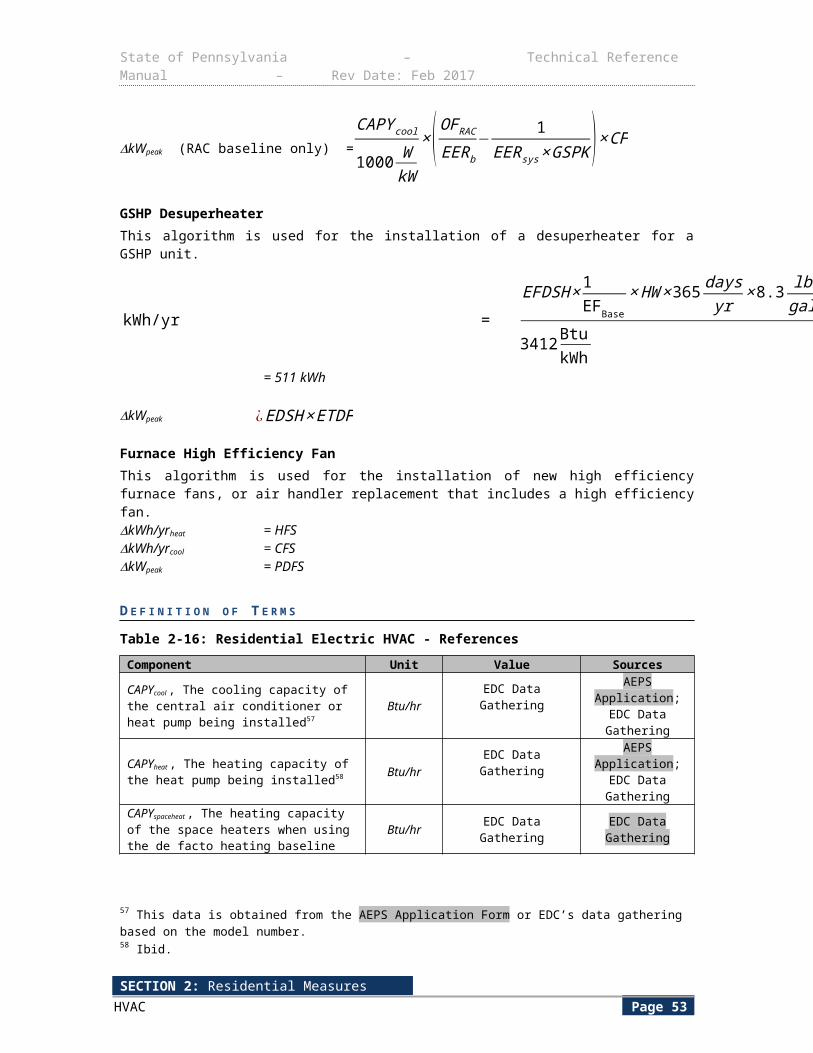
State of Pennsylvania – Technical Reference Manual – Rev Date: Feb 2017
D E F I N I T I O N O F T E R M S
Table 2-27: ENERGY STAR Room AC - References
Component Unit Value Sources
CAPY , The cooling capacity of the room air conditioner (RAC) being installed
Btuhr
EDC Data Gathering
CEERbase , Combined Energy Efficiency ratio of the baseline unit Btu
W ∙h
Federal Standard Values in:Table 2-28Table 2-29Table 2-30
1
CEERee , Combined Energy efficiency ratio of the RAC being installed
BtuW ∙h
EDC Data Gathering
Default = ENERGY STAR values in:Table 2-28Table 2-29Table 2-30
2
EFLHRAC , Equivalent full load hours of the RAC being installed
hoursyear
or alternate EFLHcool
values × an Adjustment Factor in Section 2.2.5
3
CF , Demand coincidence factor FractionDefault: 0.30Or EDC data gathering
4
Table 2-28 lists the minimum federal efficiency standards as of June 2014 and minimum ENERGY STAR efficiency standards for RAC units of various capacity ranges and with and without louvered sides. Units without louvered sides are also referred to as “through the wall” units or “built-in” units. Note that the new federal standards are based on the Combined Energy Efficiency Ratio metric (CEER), which is a metric that incorporates energy use in all modes, including standby and off modes.
Table 2-28: RAC (without reverse cycle) Federal Minimum Efficiency and ENERGY STAR Version 4.0 Standards
Capacity (Btu/h)
Federal Standard CEER,
with louvered sides
ENERGY STAR CEER, with
louvered sides
Federal Standard CEER, without louvered sides
ENERGY STAR CEER, without louvered sides
< 6,00011.0 12.1 10.0 11.0
6,000 to 7,9998,000 to 10,999
10.9 12.09.6 10.6
11,000 to 13,999 9.5 10.5
14,000 to 19,999 10.7 11.8 9.3 10.2
20,000 to 24,999 9.4
10.3 9.410.3
25,000 to 9.0 10.3
SECTION 2: Residential MeasuresHVAC Page 57
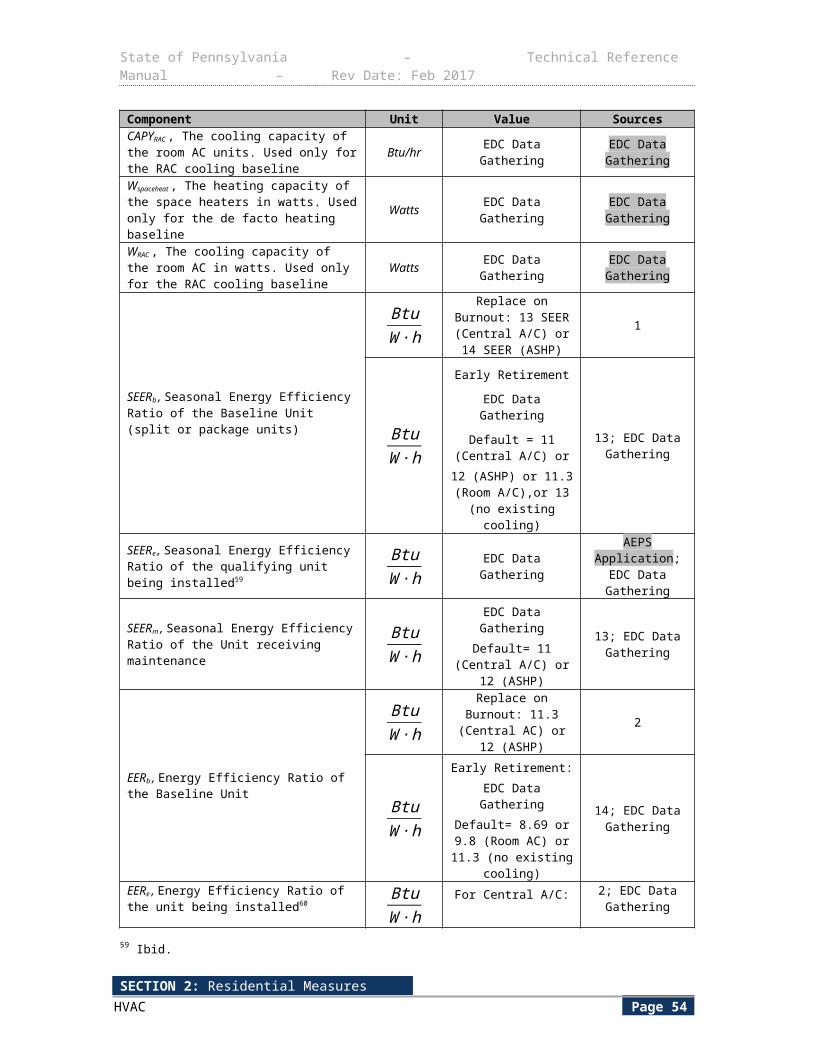
State of Pennsylvania – Technical Reference Manual – Rev Date: Feb 2017
Capacity (Btu/h)
Federal Standard CEER,
with louvered sides
ENERGY STAR CEER, with
louvered sides
Federal Standard CEER, without louvered sides
ENERGY STAR CEER, without louvered sides
27,999≥28,000 9.0 9.9 9.4 10.3
Table 2-29 lists the minimum federal efficiency standards and minimum ENERGY STAR efficiency standards for casement-only and casement-slider RAC units. Casement-only refers to a RAC designed for mounting in a casement window with an encased assembly with a width of 14.8 inches or less and a height of 11.2 inches or less. Casement-slider refers to a RAC with an encased assembly designed for mounting in a sliding or casement window with a width of 15.5 inches or less.
Table 2-29: Casement-Only and Casement-Slider RAC Federal Minimum Efficiency and ENERGY STAR Version 4.0 Standards
Casement Federal Standard CEER ENERGY STAR CEER
Casement-only 9.5 10.5
Casement-slider 10.4 11.4
Table 2-30 lists the minimum federal efficiency standards and minimum ENERGY STAR efficiency standards for reverse-cycle RAC units.
Table 2-30: Reverse-Cycle RAC Federal Minimum Efficiency Standards and ENERGY STAR Version 4.0 Standards
Capacity (Btu/h)
Federal Standard CEER, with
louvered sides
ENERGY STAR CEER, with
louvered sides
Federal Standard CEER, without louvered sides
ENERGY STAR CEER, without louvered sides
< 14,000 n/a n/a 9.3 10.2≥ 14,000 8.7 9.6< 20,000 9.8 10.8 n/a n/a≥ 20,000 9.3 10.2
D E F A U L T S A V I N G S
Table 2-31 provides deemed EFLH by city and default energy savings values (assuming CAPY=8,000 Btu/hr75, louvered sides, no reverse cycle) if efficiency and capacity information is unknown. Alternate EFLH cool values from Table 2-17 in Section 2.2.1 may be used in conjunction with the Adjustment Factor (AF) in Section 2.2.5 to find EFLH RAC if desired.
Table 2-31: Deemed EFLH and Default Energy Savings
City EFLHRAC ΔkWh/yr ΔkWpeak
Allentown 151 10.2 0.0202Erie 121 8.1 0.0202Harrisburg 171 11.5 0.0202Philadelphia 183 12.3 0.0202Pittsburgh 134 9.0 0.0202Scranton 129 8.7 0.0202Williamsport 131 8.8 0.0202
75 Pennsylvania Residential Baseline Study, April 2014.
SECTION 2: Residential MeasuresHVAC Page 58
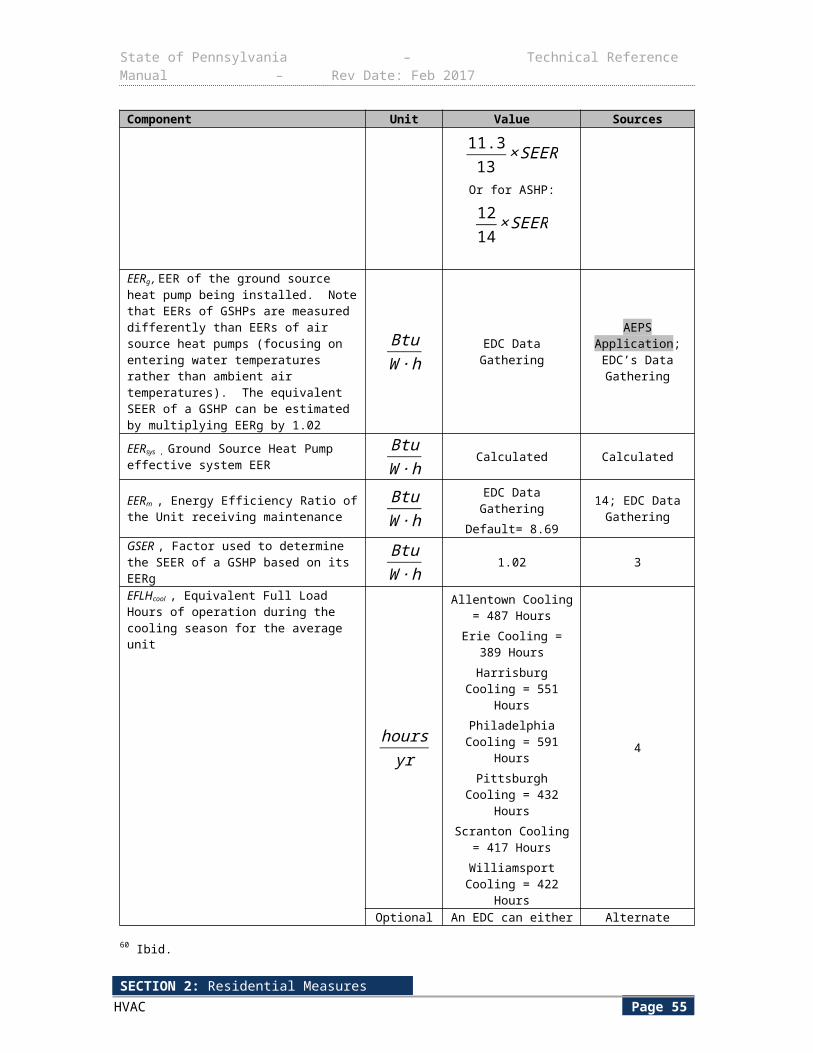
State of Pennsylvania – Technical Reference Manual – Rev Date: Feb 2017
E V A L U A T I O N P R O T O C O L S
For most projects, the appropriate evaluation protocol is to verify installation and proper selection of default values. For projects using customer specific data for open variables, the appropriate evaluation protocol is to verify installation and proper application of TRM protocol along with verification of open variables. The Pennsylvania Evaluation Framework provides specific guidelines and requirements for evaluation procedures.
S O U R C E S
1) Federal standards: U.S. Department of Energy. Code of Federal Regulations. 10 CFR, part 430.32(b). Effective June 1, 2014. http://www1.eere.energy.gov/buildings/appliance_standards/product.aspx/productid/41
2) ENERGY STAR Program Requirements Product Specification for Room Air Conditioners, Eligibility Criteria Version 4.0. October 26, 2015. http://www.energystar.gov/sites/default/files/ENERGY%20STAR%20Final%20Version%204.0%20Room%20Air%20Conditioners%20Specification.pdf
3) Based on REM/Rate modeling using models from the PA 2012 Potential Study. EFLH calculated from kWh consumption for cooling and heating. Models assume 50% over-sizing of air conditioners and 40% oversizing of heat pumps. 76
4) Consistent with CFs found in RLW Report: Final Report Coincidence Factor Study Residential Room Air Conditioners, June 23, 2008.77
76 ACCA, “Verifying ACCA Manual S Procedures,” http://www.acca.org/wp-content/uploads/2014/01/Manual-S-Brochure-Final.pdf.77 In the absence of better, Pennsylvania-specific data, this is the same source and value as the Mid-Atlantic and Illinois TRMs.
SECTION 2: Residential MeasuresHVAC Page 59
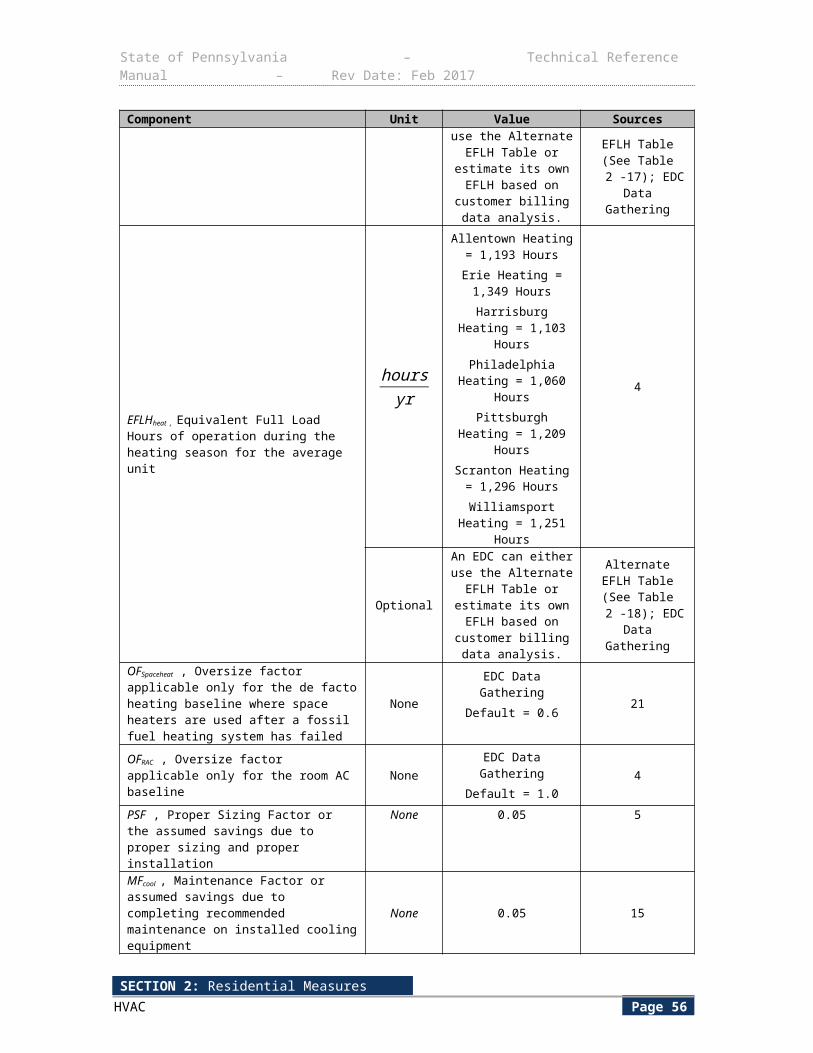
State of Pennsylvania – Technical Reference Manual – Rev Date: Feb 2017
2.2.5 ROOM AC (RAC) RETIREMENT
Measure Name Room A/C Retirement
Target Sector Residential Establishments
Measure Unit Room A/C
Unit Energy Savings Varies
Unit Peak Demand Reduction Varies
Measure Life 4 years78
Vintage Early Retirement, Early Replacement
This measure is defined as retirement and recycling without replacement of an operable but older and inefficient room AC (RAC) unit that would not have otherwise been recycled. The assumption is that these units will be permanently removed from the grid rather than handed down or sold for use in another location by another EDC customer, and furthermore that they would not have been recycled without this program. This measure is quite different from other energy-efficiency measures in that the energy/demand savings is not the difference between a pre- and post- configuration, but is instead the result of complete elimination of the existing RAC.
E L I G I B I L I T Y
The savings are not attributable to the customer that owned the RAC, but instead are attributed to a hypothetical user of the equipment had it not been recycled. Energy and demand savings is the estimated energy consumption of the retired unit over its remaining useful life (RUL).
A L G O R I T H M S
Although this is a fully deemed approach, any of these values can and should be evaluated and used to improve the savings estimates for this measure in subsequent TRM revisions.
Retirement-Only All EDC programs are currently operated under this scenario. For this approach, impacts are based only on the existing unit, and savings apply only for the remaining useful life (RUL) of the unit.
∆ kWh/ yr=( CAPY
1000 WkW
×EERRetRAC )×EFLH RAC
∆ kW peak=( CAPY
1000 WkW
×EERRet RAC )×CFRAC
Replacement and Recycling It is not apparent that any EDCs are currently implementing the program in this manner, but the algorithms are included here for completeness. For this approach, the ENERGY STAR upgrade measure would have to be combined with recycling via a turn-in event at a retail appliance store, where the old RAC is turned in at the same time that a new one is purchased. Unlike the retirement-only measure, the savings here are attributed to the customer that owns the retired RAC, and are based on the old unit and original unit being of the same size and configuration. In 78 See Measure Life section of this measure.
SECTION 2: Residential MeasuresHVAC Page 60
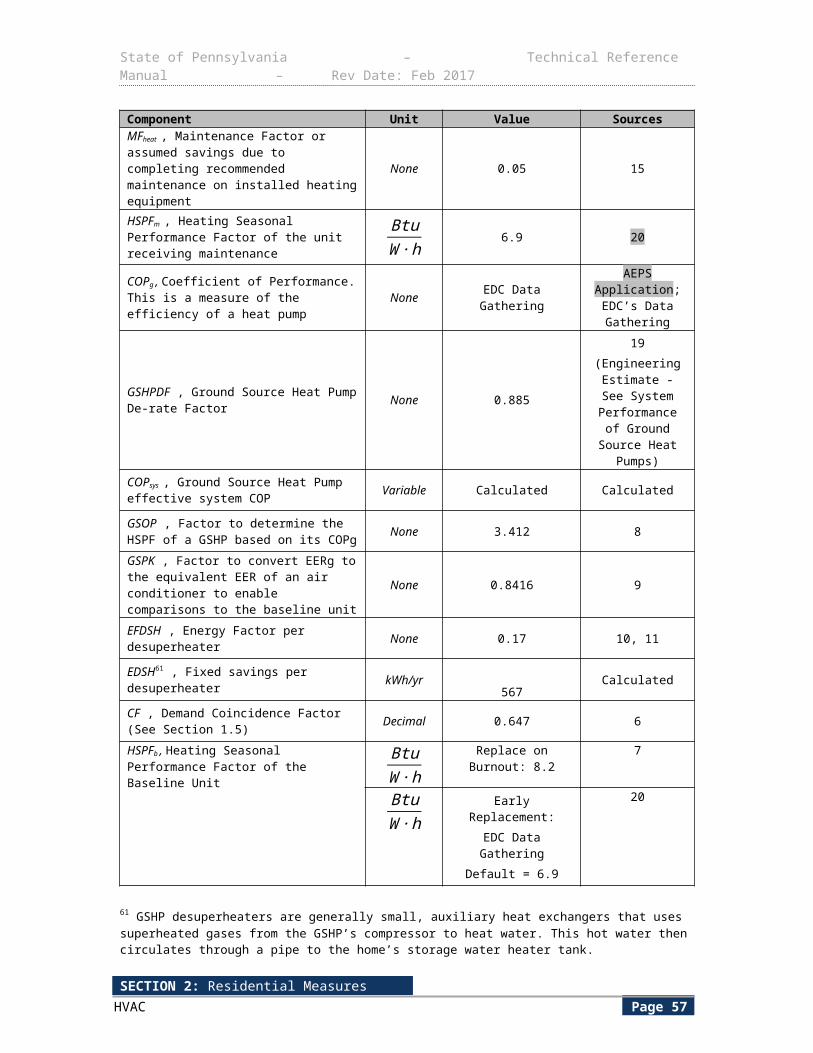
State of Pennsylvania – Technical Reference Manual – Rev Date: Feb 2017
this case, two savings calculations would be needed. One would be applied over the remaining life of the recycled unit, and another would be used for the rest of the effective useful life, as explained below.
For the remaining useful life (RUL) of the existing RAC: The baseline value is the EER of the retired unit.
∆ kWh/ yr= CAPY
1000 WkW
×( 1EERRetRAC
−1
EERee )× EFLH RAC
∆ kW peak=CAPY
1000 WkW
×( 1EERRetRAC
−1
EERee )×CFRAC
After the RUL for (EUL-RUL) years: The baseline EER would revert to the minimum Federal appliance standard CEER. As of June 1, 2014 RAC units will have a “CEER” rating in addition to an “EER”. CEER is the “Combined Energy Efficiency Ratio”, which incorporates standby power into the calculation. This will be the value used in the ∆ kWh/ yr calculation. (CEER was not used in the previous equations, however, since older units were not qualified with this metric).
∆ kWh/ yr= CAPY
1000 WkW
×( 1CEERbase
−1
CEERee )×EFLH RAC
∆ kW peak=CAPY
1000 WkW
×( 1CEERbase
−1
CEERee )×CFRAC
D E F I N I T I O N O F T E R M S
Correction of ES RAC EFLH Values:An additional step is required to determine EFLHRAC values. Normally, the EFLH values from the ENERGY STAR Room AC Calculator would be used directly, however, the current (July 2010) ES Room AC calculator EFLHs appear unreasonably high and are in the range of those typically used for the Central AC calculator. In reality, RAC full load hours should be much lower than for a CAC system and, as such, the EFLHRAC values were calculated from CAC EFLH values as follows:
EFLHRAC = EFLH cool × AF
Where:Note that when the ENERGY STAR RAC calculator values are eventually corrected in the ES calculator, the corrected EFLHES-RAC values can be used directly and this adjustment step can be ignored and/or deleted.
SECTION 2: Residential MeasuresHVAC Page 61
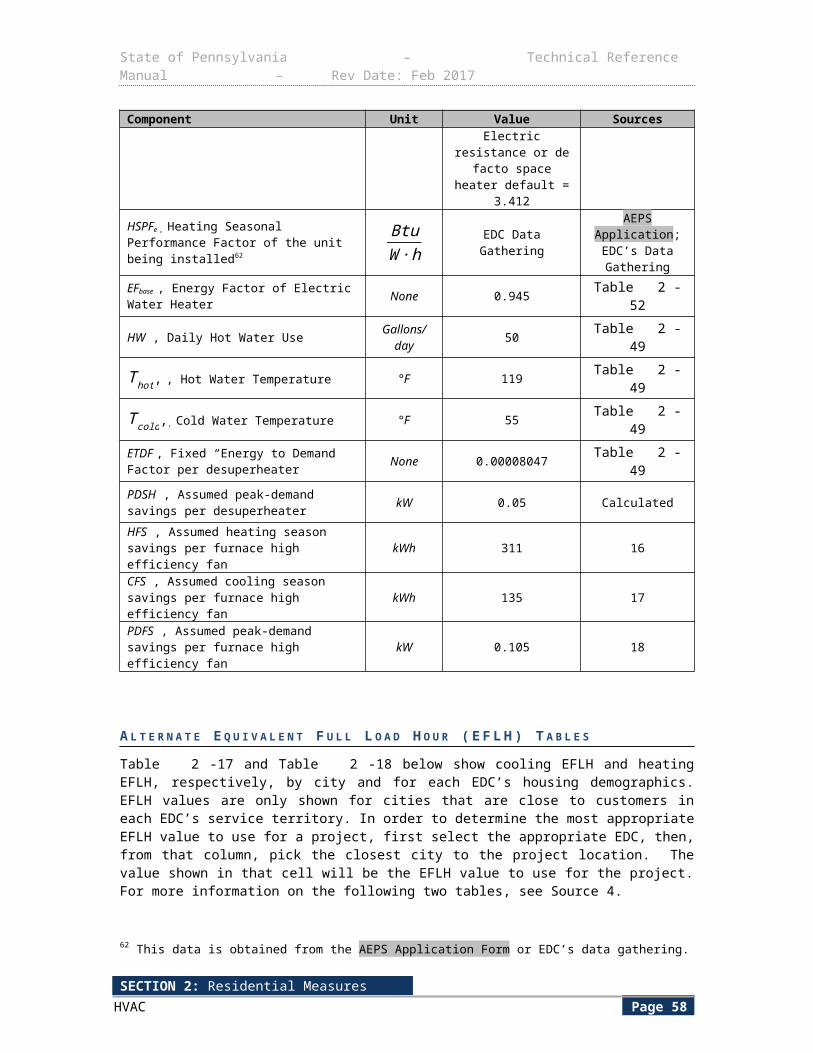
State of Pennsylvania – Technical Reference Manual – Rev Date: Feb 2017
Table 2-32: Room AC Retirement Calculation Assumptions
Component Unit Value Sources
EFLHRAC , Equivalent Full Load Hours of operation for the installed measure. In actuality, the number of hours and time of operation can vary drastically depending on the RAC location (living room, bedroom, home office, etc.).
hoursyr Error: Reference
source not found
1
EFLH cool , Full load hours from REM/Rate modelinghoursyr Error: Reference
source not found
1
hoursyr
The Alternate EFLHCOOL values in Table 2-17 may
be used
AF , Adjustment factor for correcting current ES Room AC calculator EFLHs.
None 0.31 2
CAPY , Rated cooling capacity (size) of the RAC unit. Btuhr
EDC Data Gathering
Default : 7,870
3
EERRetRAC , The Energy Efficiency Ratio of the unit being retired-recycled.
BtuW ∙h
Default: 9.07; or EDC Data Gathering
4
EERee , The Energy Efficiency Ratio for an ENERGY STAR RAC
BtuW ∙h
12.1 5
CEERbase , (for a 8,000 Btu/h unit), The Combined Energy Efficiency Ratio of a RAC that just meets the minimum federal appliance standard efficiency.
BtuW ∙h
10.9 5
CEERee , (for a 8,000 Btu/h unit), The Combined Energy Efficiency Ratio for an ENERGY STAR RAC.
BtuW ∙h
EDC Data Gathering
Default=12.0
5
CFrac , Demand Coincidence FactorFraction EDC Data
GatheringDefault= 0.30
7
RAC Time Period Allocation Factors % 65.1%, 34.9%, 0.0%, 0.0%
6
SECTION 2: Residential MeasuresHVAC Page 62
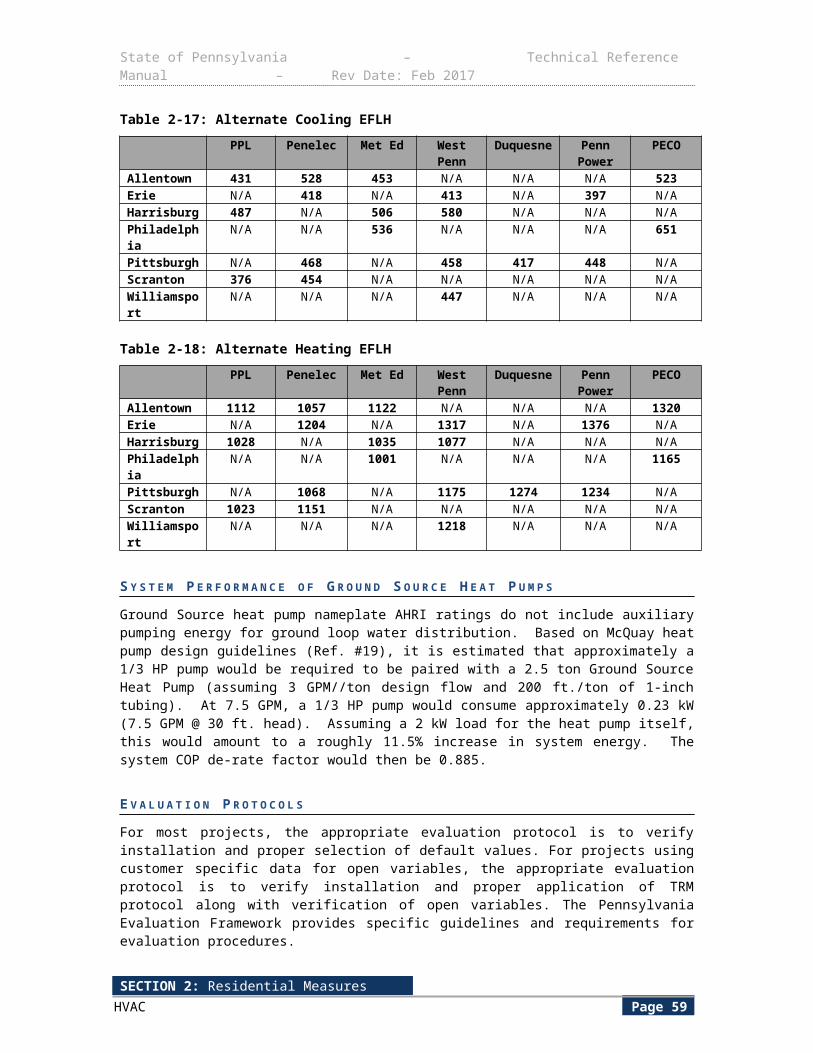
State of Pennsylvania – Technical Reference Manual – Rev Date: Feb 2017
Table 2-33: RAC Retirement-Only EFLH and Energy Savings by City79
City
OriginalHours
(EFLH cool )
CorrectedHours
(EFLHRAC)
EnergyImpact (kWh)
Demand Impact (kW)
Allentown 487 151 131 0.2603
Erie 389 121 105
Harrisburg 551 171 148
Philadelphia 591 183 159
Pittsburgh 432 134 116
Scranton 417 129 112
Williamsport 422 131 114
M E A S U R E L I F E
Room Air Conditioner Retirement = 4 yearsFrom the PA TRM, the EUL for an ENERGY STAR Room Air Conditioner is 10 years, but the TRM does not provide an RUL for RACs. However, as shown in Table 2-34, the results from a recent evaluation of ComEd’s appliance recycling program80 found a median age of 21 to 25 years for recycled ACs. For a unit this old, the expected life of the savings is likely to be short, so 4 years was chosen as a reasonable assumption based on these references:
1) DEER database, presents several values for EUL/RUL for room AC recycling: http://www.deeresources.com/deer2008exante/downloads/EUL_Summary_10-1-08.xls
a. DEER 0607 recommendation: EUL=9, RUL=1/3 of EUL = 3 years. The 1/3 was defined as a “reasonable estimate”, but no basis given.
b. 2005 DEER: EUL=15, did not have recycling RUL
c. Appliance Magazine and ENERGY STAR calculator: EUL=9 years
d. CA IOUs: EUL=15, RUL=5 to 7
2) “Out With the Old, in With the New: Why Refrigerator and Room Air Conditioner Programs Should Target Replacement to Maximize Energy Savings,” National Resources Defense Council, November 2001, page 21, 5 years stated as a credible estimate.
3) From the PA TRM June 2010, if the ratio of refrigerator recycling measure life to ENERGY STAR measure life is applied: (8/13) * 10 years (for RAC) = 6 years for RAC recycling.
79 Error: Reference source not found should be used with a master “mapping table”” that maps the zip codes for all PA cities to one of the representative cities above. This mapping table would also be used for the TRM ENERGY STAR Room Air Conditioning measure. This table will be developed in the context of the TWG.80 Residential Appliance Recycling Program Year 1 Evaluation Report – Final Report, prepared for Commonwealth Edison by Itron (under contract to Navigant Consulting), November 2009.
SECTION 2: Residential MeasuresHVAC Page 63
State of Pennsylvania – Technical Reference Manual – Rev Date: Feb 2017
Table 2-34: Preliminary Results from ComEd RAC Recycling Evaluation81
Appliance Type
Age in Years
N
0 to
5
6 to
10
11 to
15
16 to
20
21 to
25
26 to
30
31 to
35
36 to
40
Ove
r 40
Room Air Conditioners 0% 5% 7% 18% 37% 18% 5% 6% 5% —
E V A L U A T I O N P R O T O C O L S
For most projects, the appropriate evaluation protocol is to verify installation and proper selection of default values. For projects using customer specific data for open variables, the appropriate evaluation protocol is to verify installation and proper application of TRM protocol along with verification of open variables. The Pennsylvania Evaluation Framework provides specific guidelines and requirements for evaluation procedures.
S O U R C E S
1) Based on REM/Rate modeling using models from the PA 2012 Potential Study. EFLH calculated from kWh consumption for cooling and heating. Models assume 50% over-sizing of air conditioners82 and 40% oversizing of heat pumps.83
2) Mid Atlantic TRM Version 1.0. April 28, 2010 Draft. Prepared by Vermont Energy Investment Corporation. An adjustment to the ES RAC EFLHs of 31% was used for the “Window A/C” measure. The average ratio of EFLH for Room AC provided in RLW Report: Final Report Coincidence Factor Study Residential Room Air Conditioners, June 23, 200884 to FLH for Central Cooling for the same location (provided by AHRI: <http://www.energystar.gov/ia/business/bulk_purchasing/bpsavings_calc/Calc_CAC.xls> is 31%. This factor was applied to the EFLH for Central Cooling provided for PA cities and averaged to come up with the assumption for EFLH for Room AC.”
3) Statewide average capacity of RAC units, 2014 Pennsylvania Residential Baseline Study.
4) Massachusetts TRM, Version 1.0, October 23, 2009, “Room AC Retirement” measure, Page 52-54. Assumes an existing/recycled unit EER=9.07, reference is to weighted 1999 AHAM shipment data. This value should be evaluated and based on the actual distribution of recycled units in PA and revised in later TRMs if necessary. Other references include:
a. ENERGY STAR website materials on Turn-In programs, if reverse-engineered indicate an EER of 9.16 is used for savings calculations for a 10 year old RAC. Another statement indicates that units that are at least 10 years old use 20% more energy than a new ES unit which equates to: 10.8 EER/1.2 = 9 EER http://www.energystar.gov/ia/products/recycle/documents/RoomAirConditionerTurn-InAndRecyclingPrograms.pdf
81 Navigant Consulting evaluation of ComEd appliance recycling program.82 Neme, Proctor, Nadal, “National Energy Savings Potential From Addressing Residential HVAC Installation Problems. ACEEE, February 1, 1999. Confirmed also by Central Air Conditioning in Wisconsin, a compilation of recent field research. Energy Center of Wisconsin. May 2008, emended December 15, 2010.83 ACCA, “Verifying ACCA Manual S Procedures,” http://www.acca.org/wp-content/uploads/2014/01/Manual_S_verification.pdf.84Accesed:<h ttp://www.puc.nh.gov/Electric/Monitoring%20and%20Evaluation%20Reports/ National%20Grid/117_RLW_CF %20Res%20RAC.pdf>
SECTION 2: Residential MeasuresHVAC Page 64
State of Pennsylvania – Technical Reference Manual – Rev Date: Feb 2017
b. “Out With the Old, in With the New: Why Refrigerator and Room Air Conditioner Programs Should Target Replacement to Maximize Energy Savings.” National Resources Defense Council, November 2001. Page 3, Cites a 7.5 EER as typical for a room air conditioner in use in 1990s. However, page 21 indicates an 8.0 EER was typical for a NYSERDA program.
5) ENERGY STAR Version 4.0 and Federal Appliance Standard minimum CEER and EER for a 8000 Btu/hr unit with louvered sides. ENERGY STAR EER derived using version 4.0 CEER requirement and ratio of EER to CEER from Version 3.1. Version 3.1 has both EER and CEER requirements for each RAC size and type. Version 4.0 does not. Therefore, the ratio of EER requirement to CEER requirement for an 8000 Btu/h unit with louvered sides (11.3/11.2) was applied to the CEER requirement (12.0) in Version 4.0 to get an equivalent EER of 12.1. http://www.energystar.gov/sites/default/files/ENERGY%20STAR%20Final%20Version%204.0%20Room%20Air%20Conditioners%20Specification.pdf
6) PA TRM June 2010, coincident demand factor and Time Period Allocation Factors for ENERGY STAR Room AC.
7) Consistent with CFs found in RLW Report: Final Report Coincidence Factor Study Residential Room Air Conditioners, June 23, 2008.85
85 In the absence of better, Pennsylvania-specific data, this is the same source and value as the Mid-Atlantic and Illinois TRMs.
SECTION 2: Residential MeasuresHVAC Page 65
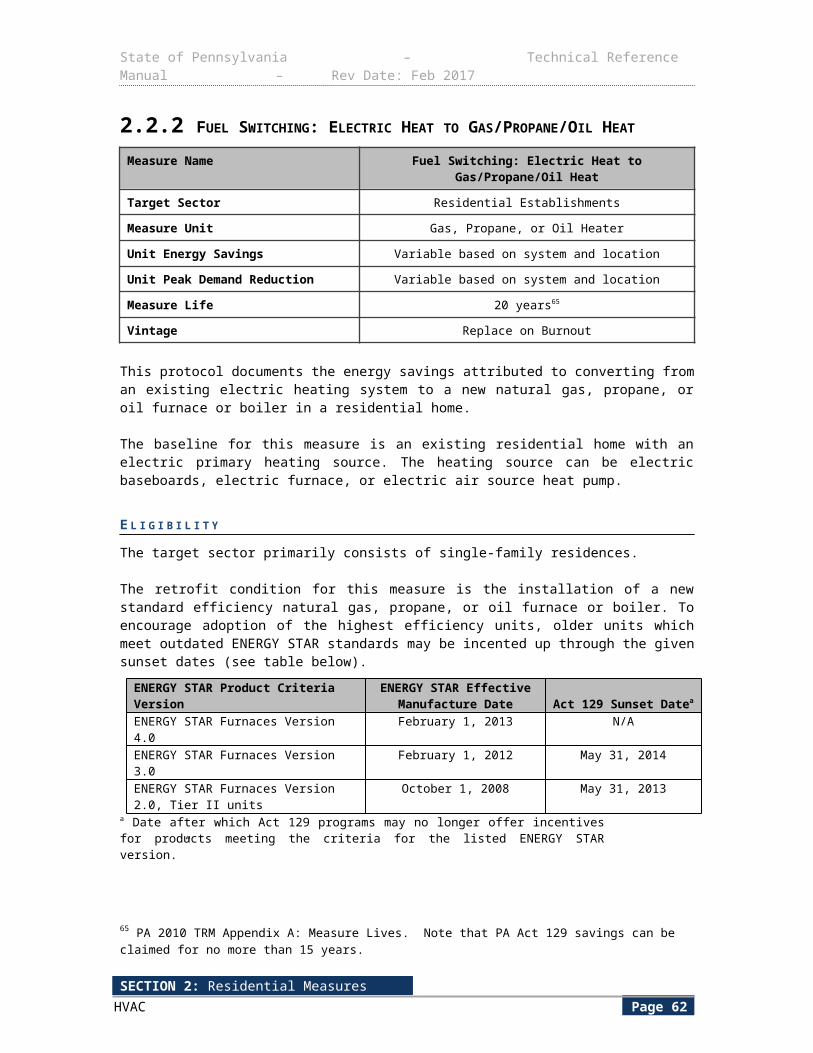
State of Pennsylvania – Technical Reference Manual – Rev Date: Feb 2017
2.2.6 DUCT SEALING
Measure Name Duct Sealing
Target Sector Residential Establishments
Measure Unit Office Equipment Device
Unit Energy Savings Varies
Unit Peak Demand Reduction Varies
Measure Life (15max, 20 actual for TRC) years86
Vintage Retrofit
This measure describes evaluating the savings associated with performing duct sealing using mastic sealant or metal tape to the distribution system of homes with either central air conditioning or a ducted heating system.
Three methodologies for estimating the savings associated with sealing ducts are provided. The first two require the use of a blower door and the third requires careful inspection of the duct work.
1) Modified Blower Door Subtraction – this method involves performing a whole house depressurization test, an envelope depressurization test that excludes duct leakage, and finally a duct leakage pressurization test under envelope depressurization. The subtraction of the envelope leakage in the second test from the whole house leakage in the first test, multiplied by a correction factor determined by the third test will provide an accurate measurement of the duct leakage to the outside. This technique is described in detail on p.44 of the Energy Conservatory Blower Door Manual; http://www.energyconservatory.com/sites/default/files/documents/mod_3-4_dg700_-_new_flow_rings_-_cr_-_tpt_-_no_fr_switch_manual_ce_0.pdf
2) RESNET Test 803.7 – this method involves the pressurization of the house to 25 Pascals with reference to outside and a simultaneous pressurization of the duct system to reach equilibrium with the envelope or inside pressure of zero Pascals. A blower door is used to pressurize the building to 25 Pascals with reference to outside, when that is achieved the duct blaster is used to equalize the pressure difference between the duct system and the house. The amount of air required to bring the duct system to zero Pascals with reference to the building is the amount of air leaking through the ductwork to the outside. This technique is described in detail in section 803.7 of the RESNET Standards: http://www.resnet.us/professional/standards
3) Evaluation of Distribution Efficiency – this methodology requires the evaluation of three duct characteristics below, and use of the Building Performance Institutes ‘Distribution Efficiency Look-Up Table; http://www.bpi.org/files/pdf/DistributionEfficiencyTable-BlueSheet.pdf
a. Percentage of duct work found within the conditioned space
b. Duct leakage evaluation
c. Duct insulation evaluation
86 Measure Life Report, Residential and Commercial/Industrial Lighting and HVAC Measures, GDS Associates, June 2007. http://library.cee1.org/content/measure-life-report-residential-and-commercialindustrial-lighting-and-hvac-measures
SECTION 2: Residential MeasuresHVAC Page 66
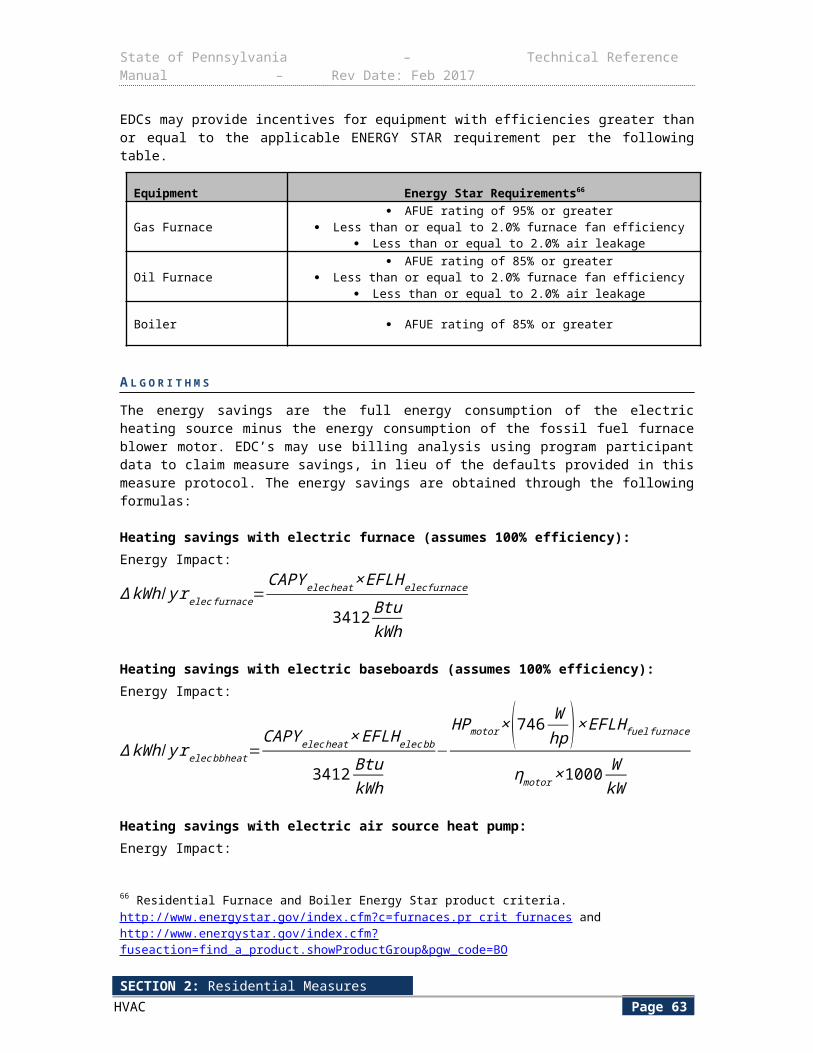
State of Pennsylvania – Technical Reference Manual – Rev Date: Feb 2017
E L I G I B I L I T Y
The efficient condition is sealed duct work throughout the unconditioned space in the home. The existing baseline condition is leaky duct work within the unconditioned space in the home.
A L G O R I T H M S
Methodology 1: Modified Blower Door Subtraction a) Determine Duct Leakage rate before and after performing duct sealing
CFM50DL =(CFM 50whole house –CFM 50envelope only )×SCF
b) Calculate duct leakage reduction, convert to CFM25DL and factor in Supply and Return Loss Factors
ΔCFM25DL = (CFM 50DL(pre)−CFM 50DL( post))×CONV ×(SLF+RLF )
c) Calculate Energy Savings
∆ kWh/ yrcooling=
(∆CFM 25DL
( Capcool
12,000 Btuhton )×TCFM
×EFLH cool×Capcool)(SEER×1000 W
kW )
∆ kWh/ yrheating=
(∆CFM 25DL
( Cap heat
12,000 Btuhton )×TCFM
×EFLH heat×Capheat)(COP×3412 Btu
kWh )Methodology 2: RESNET Test 803.7 a) Determine Duct Leakage rate before and after performing duct sealing
ΔCFM25DB =CFM25BASE−CFM 25EE
b) Calculate Energy Savings
SECTION 2: Residential MeasuresHVAC Page 67
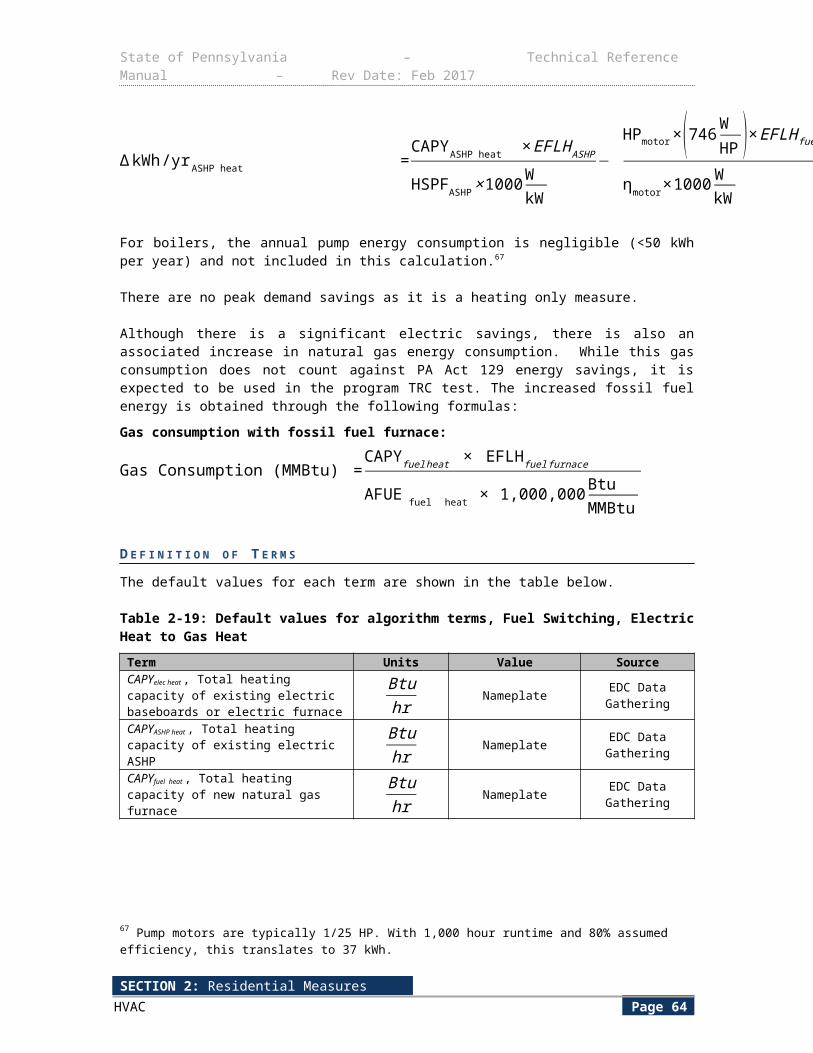
State of Pennsylvania – Technical Reference Manual – Rev Date: Feb 2017
∆ kWh/ yrcooling=
(∆CFM25DB
( Capcool
12,000 Btuhton )×TCFM
×EFLH cool×Capcool)(SEER×1000 W
kW )
∆ kWh/ yrheating=
(∆CFM25DB
( Cap heat
12,000 Btuhton )×TCFM
×EFLH heat×Capheat)(COP×3412 Btu
kWh )Methodology 3: Evaluation of Distribution EfficiencyDetermine Distribution Efficiency by evaluating duct system before and after duct sealing using Building Performance Institute “Distribution Efficiency Look-Up Table”
∆ kWh/ yrcooling={( (DEafter−DEbefore )DEafter )×EFLH cool×Capcool
SEER×1000 WkW
}∆ kWh/ yrheating={( (DEafter−DEbefore )
DEafter )×EFLH heat×Capheat
COP×3412 BtukWh
}Summer Coincident Peak Demand Savings
∆ kW peak=ΔkWhcoolingEFLHcool
×CF
D E F I N I T I O N O F T E R M S
Table 2-35: Duct Sealing – Values and References
Term Unit Value Source
CF , Demand Coincidence Factor (See Section 1.5) for central AC systems
Decimal Default = 0.647 11
CFM50whole house , Duct leakage at 50 Pascal pressure differential
ft3
minEDC Data Gathering EDC Data
Gathering
SECTION 2: Residential MeasuresHVAC Page 68
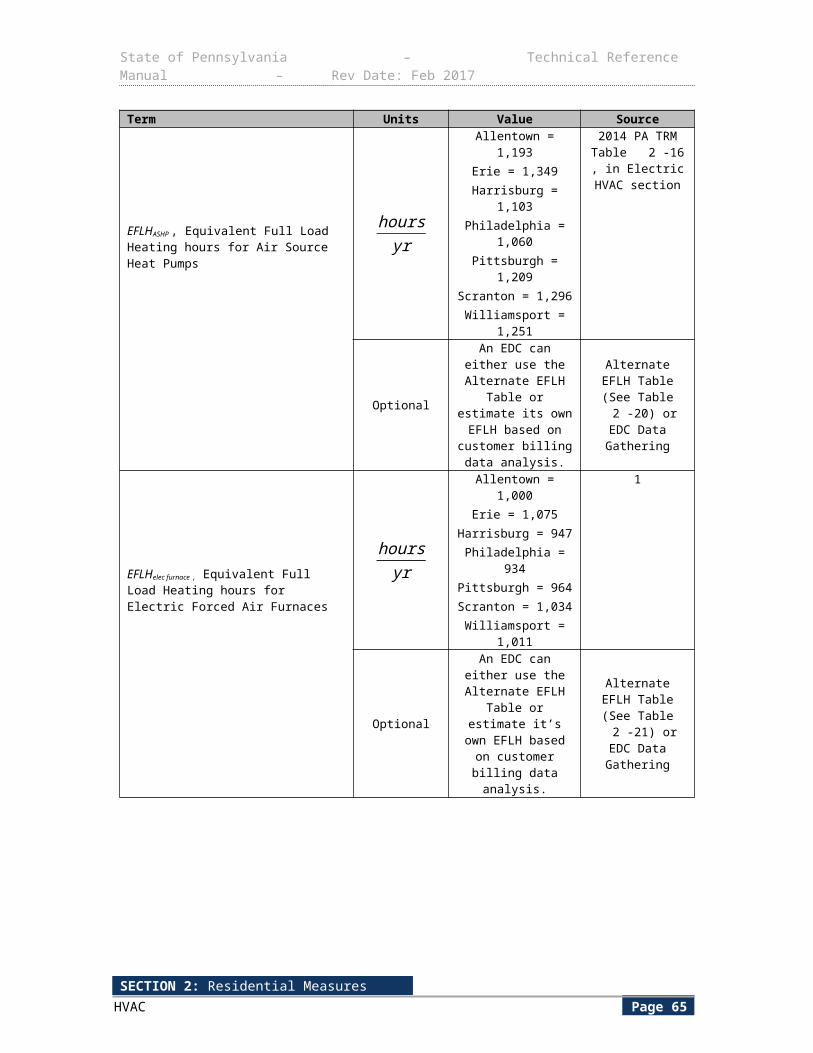
State of Pennsylvania – Technical Reference Manual – Rev Date: Feb 2017
Term Unit Value Source
CFM25DB , Cubic feet per minute of air leaving the duct system at 25 Pascals
ft3
minEDC Data Gathering 12
CFM25BASE , Standard Duct Leakage test result at 25 Pascal pressure differential of the duct system prior to sealing, calculated from the duct blaster fan flow chart
ft3
minEDC Data Gathering 12
CFM25EE , Standard Duct Leakage test result at 25 Pascal pressure differential of the duct system after sealing, calculated from the duct blaster fan flow chart
ft3
minEDC Data Gathering 12
CFM50envelope only , Standard Blower Door test result finding Cubic Feet per Minute at 50 Pascal pressure differential
ft3
minEDC Data Gathering
EDC Data Gathering
SCF , Subtraction Correction Factor to account for underestimation of duct leakage due to connections between the duct system and the home. Determined by measuring pressure in duct system with registers sealed, and using look up table provided by Energy Conservatory
None Table 4, on pg 45 of Minneapolis Blower Door™ Operation
Manual for Model 3 and Model 4 Systems
(Source 10)
7, 10
Conv , Conversion factor from CFM50 to CFM25
None 0.64 2
SLF , Supply Loss Factor (% leaks sealed located in Supply ducts x 1)
None EDC Data Gathering
Default =0.5
4, EDC Data Gathering
RLF , Return Loss Factor (Portion of % leaks sealed located in Return ducts x 0.5)
None EDC Data Gathering
Default = 0.256, EDC Data
Gathering
Capcool , Capacity of Air Cooling System Btu/hr EDC Data Gathering EDC Data Gathering
Capheat , Capacity of Air Heating System Btu/hr EDC Data Gathering EDC Data Gathering
TCFM , Conversion from tons of cooling to CFM
CFMton
4007
SEER , Efficiency of cooling equipment BtuW ∙h
EDC Data Gathering
Default = 10
8, EDC Data Gathering
COP , Efficiency of Heating Equipment None EDC Data Gathering
Default = 2.0
8, EDC Data Gathering
EFLHcool , Cooling equivalent full load hours
hoursyear
Allentown Cooling = 487 Hours
Erie Cooling = 389 Hours
Harrisburg Cooling = 551 Hours
Philadelphia Cooling = 591 Hours
Pittsburgh Cooling = 432 Hours
Table 2-16
SECTION 2: Residential MeasuresHVAC Page 69
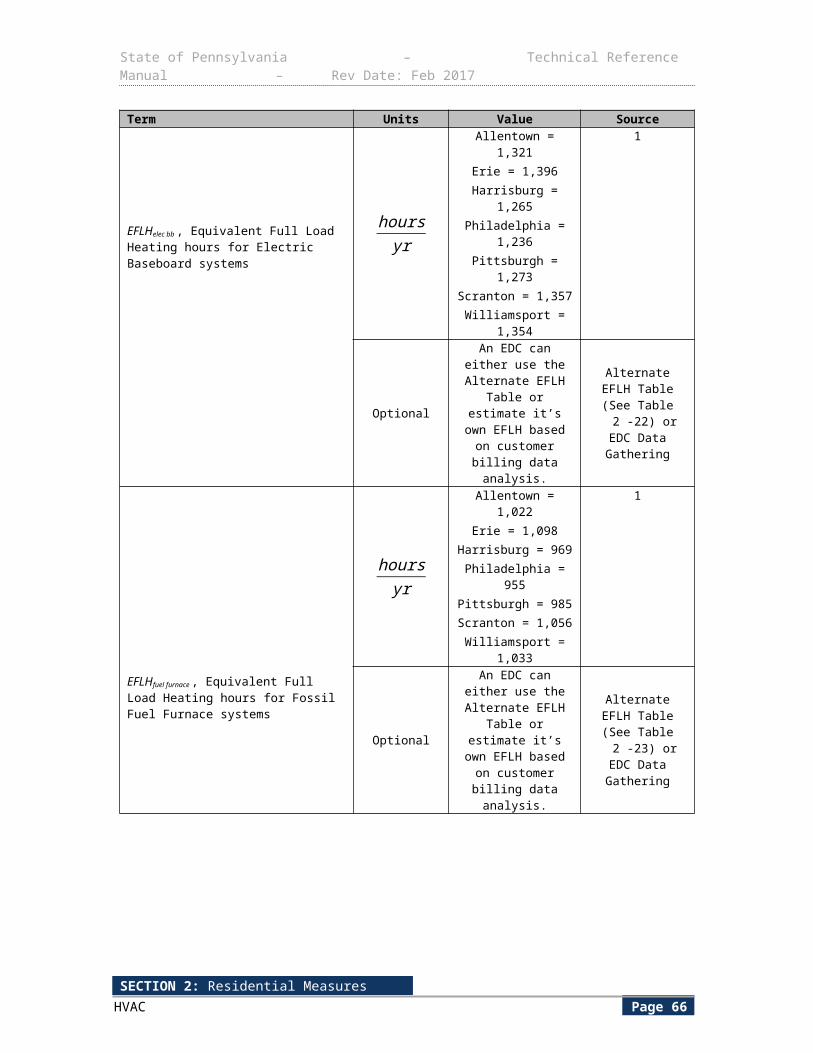
State of Pennsylvania – Technical Reference Manual – Rev Date: Feb 2017
Term Unit Value Source
Scranton Cooling = 417 Hours
Williamsport Cooling = 422 Hours
Optional
An EDC can either use the Alternate EFLH
Table or estimate its own EFLH based on
customer billing data analysis.
Alternate EFLH Table (See Section 2.2.1); EDC
Data Gathering
EFLHheat , Heating equivalent full load hours
hoursyear
Allentown Heating = 1,193 Hours
Erie Heating = 1,349 Hours
Harrisburg Heating = 1,103 Hours
Philadelphia Heating = 1,060 Hours
Pittsburgh Heating = 1,209 Hours
Scranton Heating = 1,296 Hours
Williamsport Heating = 1,251 Hours
Table 2-16
Optional
An EDC can either use the Alternate EFLH
Table or estimate its own EFLH based on
customer billing data analysis.
Alternate EFLH Table (See Section 2.2.1); EDC
Data Gathering
DEafter , Distribution efficiency after duct sealing None Variable 7, 9
DEbefore , Distribution efficiency before duct sealing None Variable 7, 9
E V A L U A T I O N P R O T O C O L S
For most projects, the appropriate evaluation protocol is to verify installation and proper selection of default values. For projects using customer specific data for open variables, the appropriate evaluation protocol is to verify installation and proper application of TRM protocol along with verification of open variables. The Pennsylvania Evaluation Framework provides specific guidelines and requirements for evaluation procedures.
S O U R C E S 1) Measure Life Report, Residential and Commercial/Industrial Lighting and HVAC Measures,
GDS Associates, June 2007. http://library.cee1.org/content/measure-life-report-residential-and-commercialindustrial-lighting-and-hvac-measures
2) 25 Pascals is the standard assumption for typical pressures experienced in the duct system under normal operating conditions. To convert CFM50 to CFM25 you multiply by 0.64 (inverse of the “Can’t Reach Fifty” factor for CFM25; see Energy Conservatory Blower Door Manual).
SECTION 2: Residential MeasuresHVAC Page 70
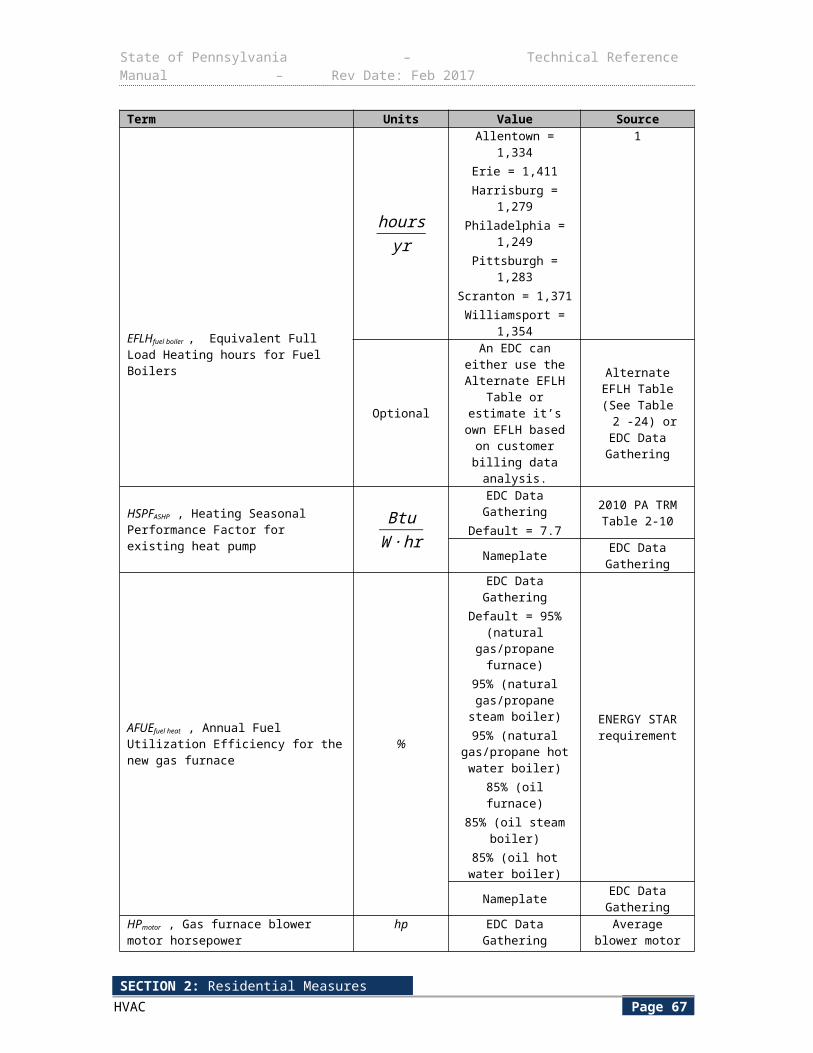
State of Pennsylvania – Technical Reference Manual – Rev Date: Feb 2017
3) Assumes that for each percent of supply air loss there is one percent annual energy penalty. This assumes supply side leaks are direct losses to the outside and are not recaptured back to the house. This could be adjusted downward to reflect regain of usable energy to the house from duct leaks. For example, during the winter some of the energy lost from supply leaks in a crawlspace will probably be regained back to the house (sometimes 1/2 or more may be regained). More information provided in “Appendix E Estimating HVAC System Loss From Duct Airtightness Measurements” from http://www.energyconservatory.com/download/dbmanual.pdf
4) Assumes 50% of leaks are in supply ducts (Illinois Statewide TRM 2013).
5) Assumes that for each percent of return air loss there is a half percent annual energy penalty. Note that this assumes that return leaks contribute less to energy losses than do supply leaks. This value could be adjusted upward if there was reason to suspect that the return leaks contribute significantly more energy loss than “average” (e.g. pulling return air from a super-heated attic), or can be adjusted downward to represent significantly less energy loss (e.g. pulling return air from a moderate temperature crawl space) . More information provided in “Appendix E Estimating HVAC System Loss from Duct Airtightness Measurements” from http://www.energyconservatory.com/sites/default/files/documents/duct_blaster_manual_series_b_-_dg700.pdf
6) Assumes 50% of leaks are in return ducts (Illinois Statewide TRM 2013).
7) Illinois Statewide TRM, 2013, Section 5.3.4.
8) Minimum Federal Standards for new Central Air Conditioners and Air Source Heat Pumps between 1990 and 2006 based on VEIC estimates.
9) Building Performance Institute, Distribution Efficiency Table, http://www.bpi.org/files/pdf/DistributionEfficiencyTable-BlueSheet.pdf
10) Minneapolis Blower Door™ Operation Manual for Model 3 and Model 4 Systems. http://www.energyconservatory.com/sites/default/files/documents/mod_3-4_dg700_-_new_flow_rings_-_cr_-_tpt_-_no_fr_switch_manual_ce_0.pdf
11) Straub, Mary and Switzer, Sheldon."Using Available Information for Efficient Evaluation of Demand Side Management Programs". Study by BG&E. The Electricity Journal. Aug/Sept. 2011. http://www.sciencedirect.com/science/article/pii/S1040619011001941
12) Resnet Energy Services Network, Standards for Performance Testing. http://www.resnet.us/standards/DRAFT_Chapter_8_July_22.pdf
SECTION 2: Residential MeasuresHVAC Page 71
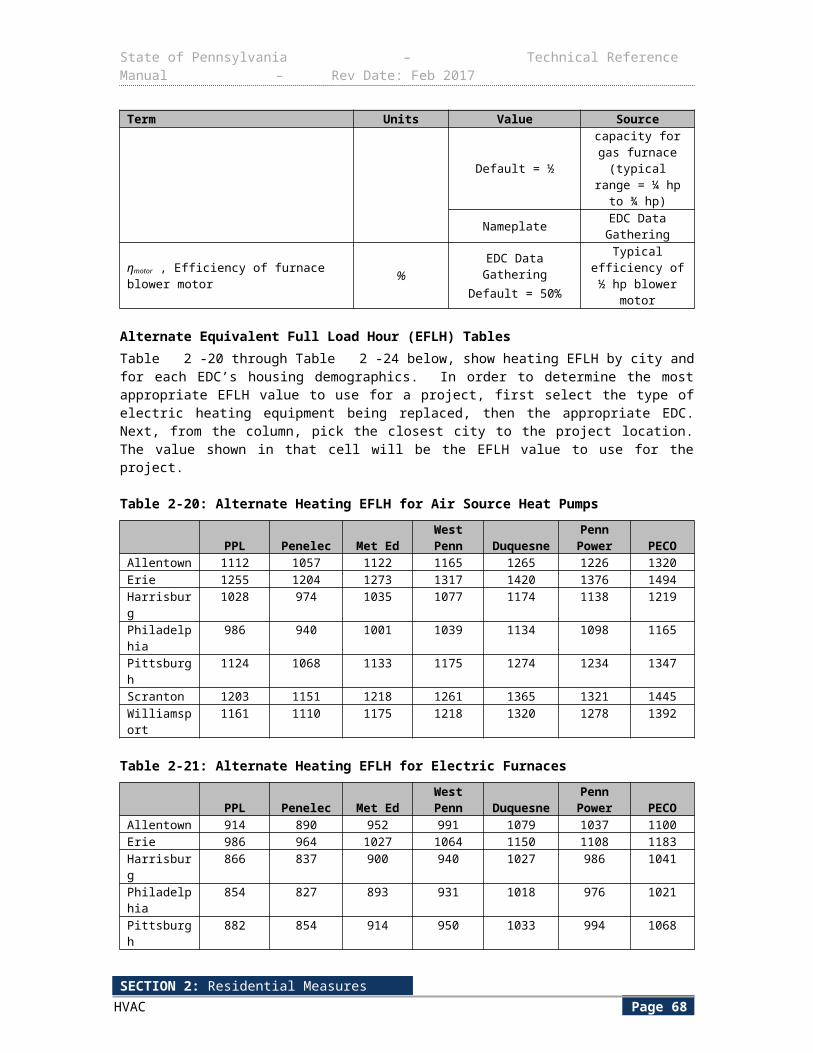
State of Pennsylvania – Technical Reference Manual – Rev Date: Feb 2017
2.2.7 FURNACE WHISTLE
Measure Name Furnace Whistle
Target Sector Residential Establishments
Measure Unit Furnace whistle (to promote regular filter change-out)
Unit Energy Savings Varies
Unit Peak Demand Reduction Varies
Measure Life 14 years87
Vintage Retrofit
E L I G I B I L I T Y
Savings estimates are based on reduced furnace blower fan motor power requirements for winter and summer use of the blower fan motor. This furnace whistle measure applies to central forced-air furnaces, central AC and heat pump systems. Each table in this protocol (33 through 39) presents the annual kWh savings for each major urban center in Pennsylvania based on their respective estimated full load hours (EFLH). Where homes do not have A/C or heat pump systems for cooling, only the annual heating savings will apply.
A L G O R I T H M S
kWh/yr ¿kWh / yrheat+kWh/ yrcoolkWh/yrheat ¿kW motor×EFLH heat× EI × ISRkWh/yrcool ¿kW motor×EFLH cool×EI ×ISR
∆ kW peak=∆kWh / yrcoolEFLHcool
×CF
D E F I N I T I O N O F T E R M S
87 See Appendix A, assumed to be the life of the HVAC unit.
SECTION 2: Residential MeasuresHVAC Page 72
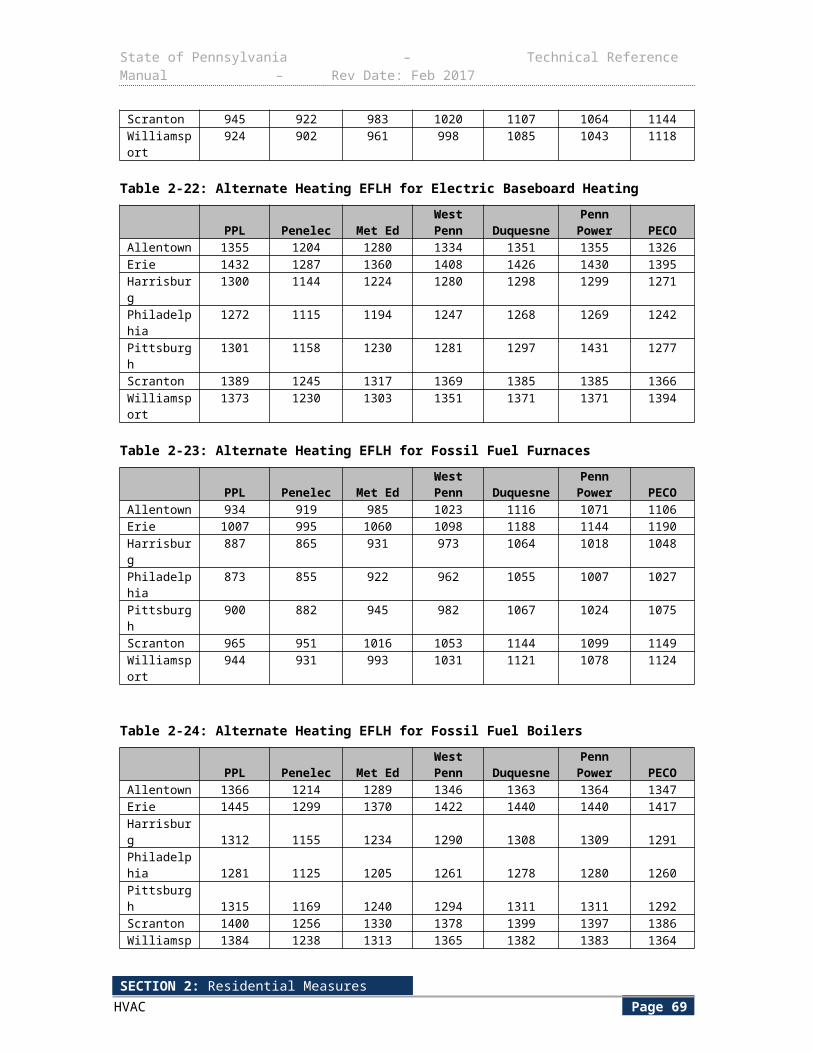
State of Pennsylvania – Technical Reference Manual – Rev Date: Feb 2017
Table 2-36: Furnace Whistle - References
Component Unit Value Sources
kW motor , Average motor full load electric demand (kW)
kW 0.5 1, 2
EFLHHeat , Estimated Full Load Hours (Heating ) for the EDC region
hoursyr
Variable. See Table 2-37
Table 2-16
EFLHCool , Estimated Full Load Hours (Cooling) for the EDC region.
hoursyr
Variable. See Table 2-37
Table 2-16
EI , Efficiency Improvement % 15% 3, 6
ISR , In-service Rate % EDC Data GatheringDefault= 47.4%
4
CF , Coincidence Factor Fraction 0.647 5
Table 2-37: EFLH for Various Cities in Pennsylvania (TRM Data)
City Cooling load hours Heating load hours Total load hours
Allentown 487 1,193 1,681
Erie 389 1,349 1,739
Harrisburg 551 1,103 1,654
Philadelphia 591 1,060 1,651
Pittsburgh 432 1,209 1,641
Scranton 417 1,296 1,713
Williamsport 422 1,251 1,673
D E F A U L T S A V I N G S
The following table presents the assumptions and the results of the deemed savings calculations for each EDC.
Table 2-38: Assumptions and Results of Deemed Savings Calculations (Pittsburgh, PA)
Blower Motor kW
Pittsburgh EFLH
Clean Annual
kWh
Dirty Annual
kWh
Furnace Whistle Savings (kWh) ISR
Estimated Savings (kWh)
Heating 0.5 1,209 604 695 91 0.474 43
Cooling 0.5 432 216 248 32 0.474 15
Total 1,641 820 944 123 58
kWpeak = 0.0229 kW (Pittsburgh)
SECTION 2: Residential MeasuresHVAC Page 73
State of Pennsylvania – Technical Reference Manual – Rev Date: Feb 2017
Table 2-39: Assumptions and Results of Deemed Savings Calculations (Philadelphia, PA)
Blower Motor kW
Philadelphia EFLH
Clean Annual
kWh
Dirty Annual
kWh
Furnace Whistle Savings (kWh) ISR
Estimated Savings (kWh)
Heating 0.5 1,060 530 609 79 0.474 38
Cooling 0.5 591 296 340 44 0.474 21
Total 1,651 826 949 124 59
kWpeak = 0.0231 (Philadelphia)
Table 2-40: Assumptions and Results of Deemed Savings Calculations (Harrisburg, PA)
Blower Motor kW
Harrisburg EFLH
Clean Annual
kWh
Dirty Annual
kWh
Furnace Whistle Savings (kWh) ISR
Estimated Savings (kWh)
Heating 0.5 1,103 552 634 83 0.474 39
Cooling 0.5 551 276 317 41 0.474 20
Total 1,654 827 951 124 59
kWpeak = 0.0231 kW (Harrisburg)
Table 2-41: Assumptions and Results of Deemed Savings Calculations (Erie, PA)
Blower Motor kW Erie EFLH
Clean Annual
kWh
Dirty Annual
kWh
Furnace Whistle Savings (kWh) ISR
Estimated Savings (kWh)
Heating 0.5 1,349 675 776 101 0.474 48
Cooling 0.5 389 195 224 29 0.474 14
Total 1,739 869 1,000 130 62
kWpeak = 0.0231 kW (Erie)
Table 2-42: Assumptions and Results of Deemed Savings Calculations (Allentown, PA)
Blower Motor kW
Allentown EFLH
Clean Annual
kWh
Dirty Annual
kWh
Furnace Whistle Savings (kWh) ISR
Estimated Savings (kWh)
Heating 0.5 1,193 597 686 89 0.474 42
Cooling 0.5 487 244 280 37 0.474 17
Total 1,681 840 966 126 60
kWpeak = 0.0231 kW (Allentown)
SECTION 2: Residential MeasuresHVAC Page 74
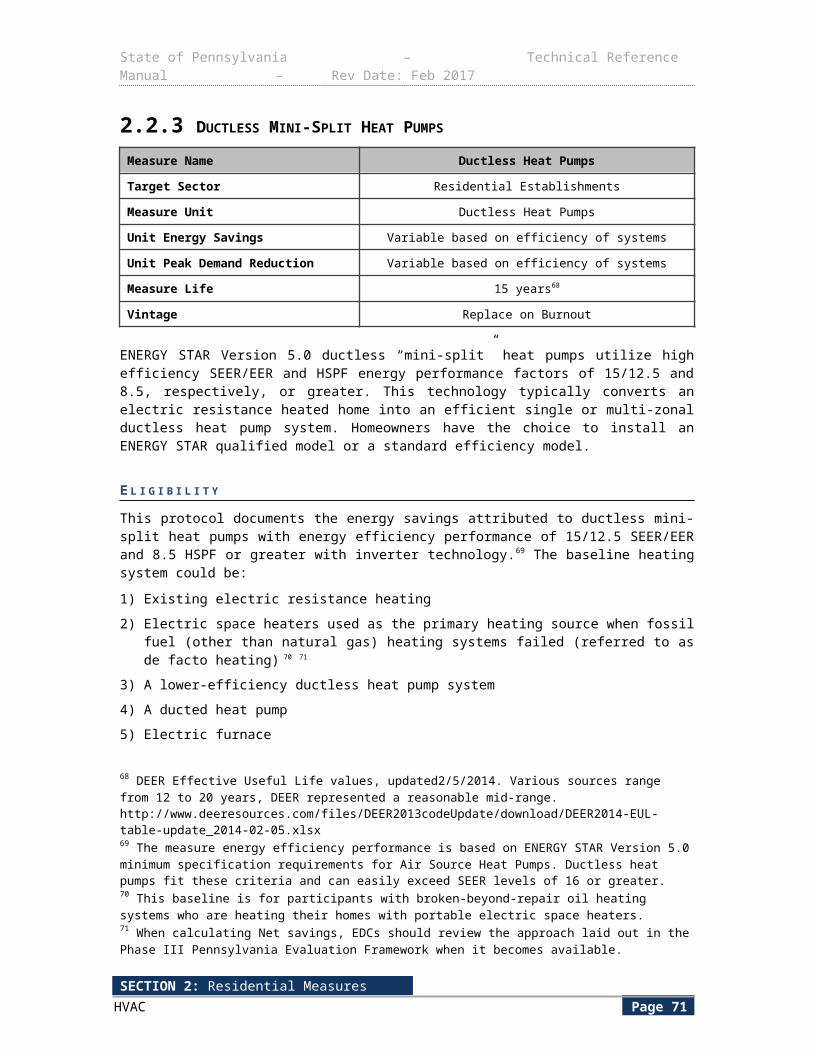
State of Pennsylvania – Technical Reference Manual – Rev Date: Feb 2017
Table 2-43: Assumptions and Results of Deemed Savings Calculations (Scranton, PA)
Blower Motor kW
Scranton EFLH
Clean Annual
kWh
Dirty Annual
kWh
Furnace Whistle Savings (kWh) ISR
Estimated Savings (kWh)
Heating 0.5 1,296 648 745 97 0.474 46
Cooling 0.5 417 208 240 31 0.474 15
Total 1,713 857 985 129 61
kWpeak = 0.0230 kW (Scranton)
Table 2-44: Assumptions and Results of Deemed Savings Calculations (Williamsport, PA)
Blower Motor kW
Williamsport EFLH
Clean Annual
kWh
Dirty Annual
kWh
Furnace Whistle Savings (kWh) ISR
Estimated Savings (kWh)
Heating 0.5 1,251 625 719 94 0.474 44
Cooling 0.5 422 211 243 32 0.474 15
Total 1,673 836 962 125 59
kWpeak = 0.0228 kW (Williamsport)
E V A L U A T I O N P R O T O C O L S
For most projects, the appropriate evaluation protocol is to verify installation and proper selection of default values. For projects using customer specific data for open variables, the appropriate evaluation protocol is to verify installation and proper application of TRM protocol along with verification of open variables. The Pennsylvania Evaluation Framework provides specific guidelines and requirements for evaluation procedures.
S O U R C E S
1) The Sheltair Group HIGH EFFICIENCY FURNACE BLOWER MOTORS MARKET BASELINE ASSESSMENT provided BC Hydro cites Wisconsin Department of Energy [2003] analysis of electricity use from furnaces (see Blower Motor Furnace Study). The Blower Motor Study Table 17 (page 38) shows 505 Watts for PSC motors in space heat mode; last sentence of the second paragraph on page 38 states: " . . . multi-speed and single speed furnaces motors drew between 400 and 800 Watts, with 500 being the average value."Submitted to: Fred Liebich BC Hydro Tel. 604 453-6558 Email: [email protected], March 31, 2004.
2) FSEC, “Furnace Blower Electricity: National and Regional Savings Potential”, page 98 - Figure 1 (assumptions provided in Table 2, page 97) for a blower motor applied in prototypical 3-Ton HVAC for both PSC and BPM motors, at external static pressure of 0.8 in. w.g., blower motor Watt requirement is 452 Watts.
3) US DOE Office of Energy Efficiency and Renewable Energy - "Energy Savers" publication - "Clogged air filters will reduce system efficiency by 30% or more.” Savings estimates assume the 30% quoted is the worst case and typical households will be at the median or 15% that is assumed to be the efficiency improvement when furnace filters are kept clean.
SECTION 2: Residential MeasuresHVAC Page 75
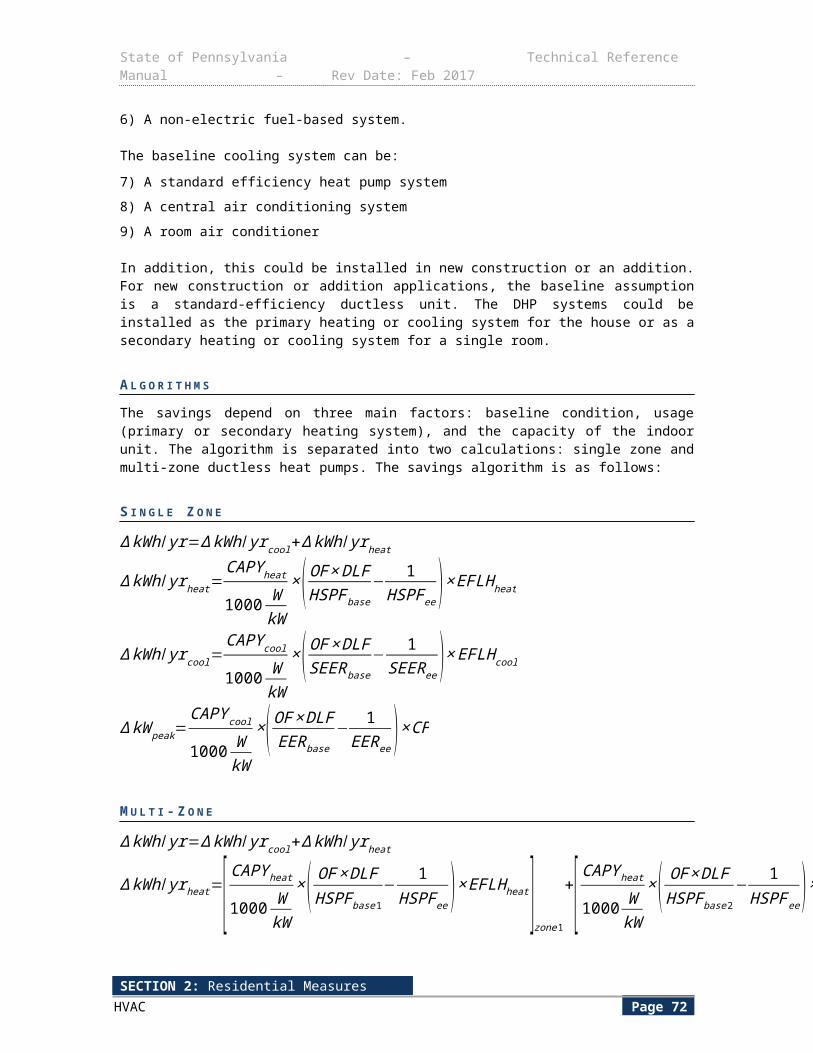
State of Pennsylvania – Technical Reference Manual – Rev Date: Feb 2017
4) The In Service Rate is taken from an SCE Evaluation of 2000-2001 Schools Programs, by Ridge & Associates 8-31-2001, Table 5-19 Installation rates, Air Filter Alarm 47.4%.
5) Straub, Mary and Switzer, Sheldon."Using Available Information for Efficient Evaluation of Demand Side Management Programs". Study by BG&E. The Electricity Journal. Aug/Sept. 2011. http://www.sciencedirect.com/science/article/pii/S1040619011001941
6) Energy.gov. “Maintaining Your Air Conditioner”. Accessed 7/16/2014. Says that replacing a dirty air filter with a clean one can lower total air conditioner energy consumption by 5-15%. Since the algorithms in this measure only take into account the blower fan energy use, a 15% savings seems reasonable.
SECTION 2: Residential MeasuresHVAC Page 76
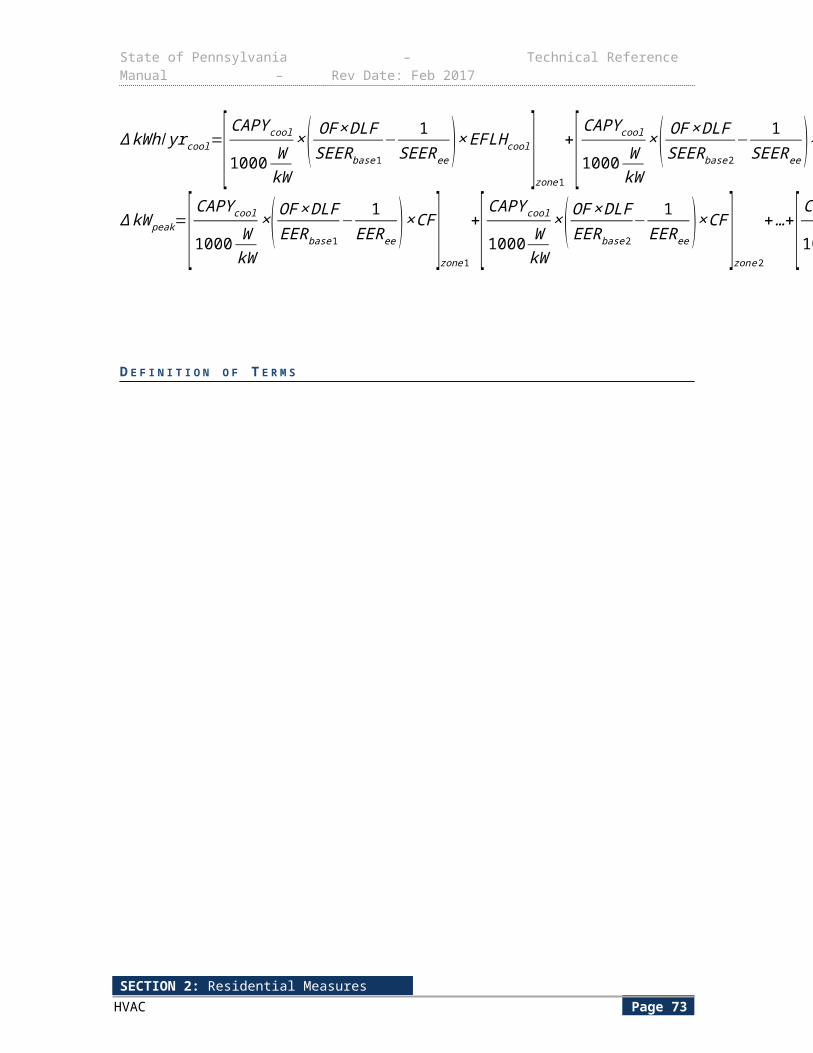
State of Pennsylvania – Technical Reference Manual – Rev Date: Feb 2017
2.2.8 PROGRAMMABLE THERMOSTAT Measure Name Programmable Thermostat
Target Sector Residential Establishments
Measure Unit Programmable Thermostat
Unit Energy Savings Varies
Unit Peak Demand Reduction Varies
Measure Life 11years88
Vintage Retrofit
Programmable thermostats are used to control heating and/or cooling loads in residential buildings by modifying the temperature set-points during specified unoccupied and nighttime hours. These units are expected to replace a manual thermostat and the savings assume an existing ducted HVAC system with electric resistance heating and DX cooling. A standard programmable thermostat installed on a heat pump can have negative energy consequences. However, the option exists to input higher efficiency levels if coupled with a newer unit. The EDCs will strive to educate the customers to use manufacturer default setback and setup settings.
E L I G I B I L I T Y
This measure documents the energy savings resulting from the installation of a programmable thermostat instead to replace an existing standard thermostat. The target sector is primarily residential.
A L G O R I T H M S
kWh/yr ¿∆ kWhcool+∆ kWhheat
∆ kWhcool=CAPY cool
1000 WkW
× 1SEER×Eff duct
×EFLH cool×ESF cool
∆ kWhheat=CAPY heat
1000 WkW
× 1HSPF ×Eff duct
×EFLH heat× ESFheat
kWpeak = 0
D E F I N I T I O N O F T E R M S
88 DEER Effective Useful Life values, updated2/5/2014. http://www.deeresources.com/files/DEER2013codeUpdate/download/DEER2014-EUL-table-update_2014-02-05.xlsx
SECTION 2: Residential MeasuresHVAC Page 77
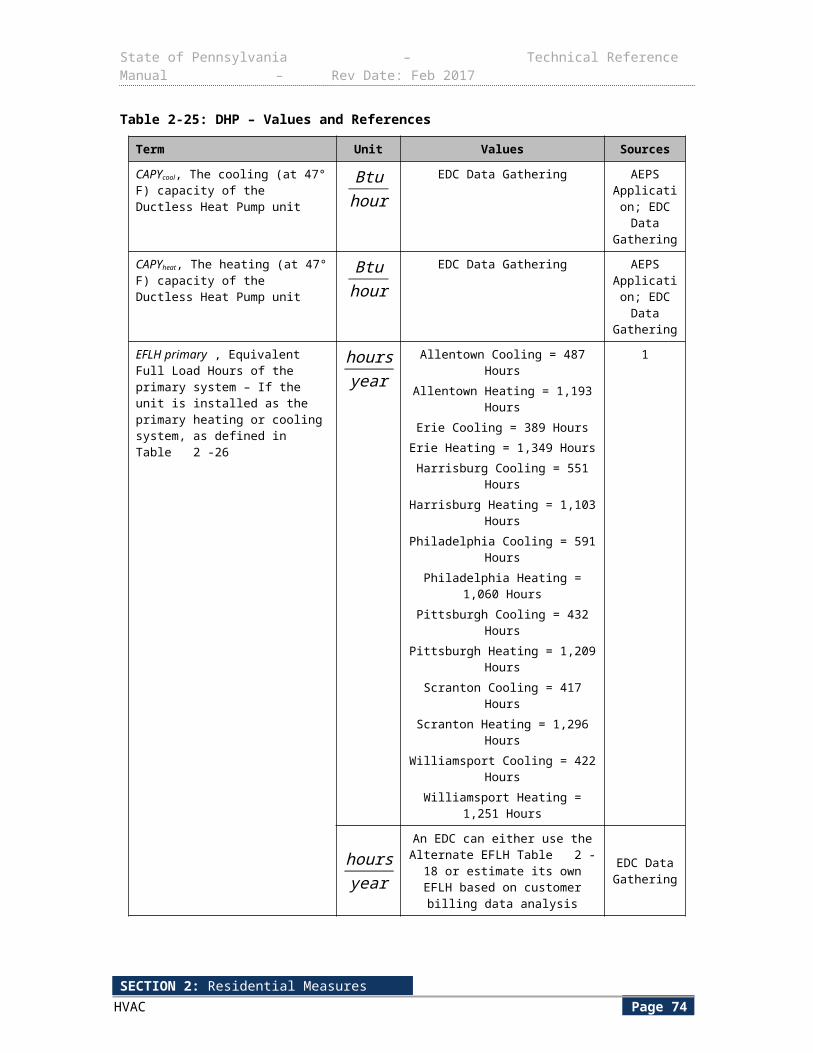
State of Pennsylvania – Technical Reference Manual – Rev Date: Feb 2017
Table 2-45: Residential Electric HVAC Calculation Assumptions
Component Unit Value Sources
CAPYCOOL, Capacity of air conditioning unit
Btuhr
EDC Data Gathering ofNameplate data
EDC Data Gathering
Default= 32,000 1
CAPYHEAT, Normal heat capacity of Electric Furnace
Btuhr
EDC Data Gathering ofNameplate Data
EDC Data Gathering
Default= 32,000 1
SEER , Seasonal Energy Efficiency Ratio Btu
W ∙h
EDC Data Gathering ofNameplate data
EDC Data Gathering
Default= 11.9 1
HSPF , Heating Seasonal Performance Factor of heat pump
BtuW ∙h
EDC Data Gathering ofNameplate data
EDC Data Gathering
Default= 3.412 (equivalent to electric furnace COP of 1)
2
Effduct , Duct System Efficiency None 0.8 3
ESFCOOL , Energy Saving Factor for Cooling
None 0.02 4
ESFHEAT , Energy Saving Factor for Heating
None 0.036 5
EFLHCOOL , Equivalent Full Load hour for Cooling
hoursday
Allentown Cooling = 487 HoursErie Cooling = 389 Hours
Harrisburg Cooling = 551 HoursPhiladelphia Cooling = 591 HoursPittsburgh Cooling = 432 HoursScranton Cooling = 417 Hours
Williamsport Cooling = 422 Hours
6
Optional Can use the more EDC-specific values in Table 2-17
Alternate EFLH Table 2-17
OptionalAn EDC can estimate it’s own
EFLH based on customer billing data analysis.
EDC Data Gathering
EFLHHEAT , Full Load Hours for Heating
hoursday
Allentown Heating = 1,193 HoursErie Heating = 1,349 Hours
Harrisburg Heating = 1,103 HoursPhiladelphia Heating = 1,060
HoursPittsburgh Heating = 1,209 HoursScranton Heating = 1,296 Hours
Williamsport Heating = 1,251 Hours
6
Optional An EDC can use the Alternate EFLH values in Table 2-18
Alternate EFLH Table 2-18
OptionalAn EDC can estimate its own
EFLH based on customer billing data analysis.
EDC Data Gathering
SECTION 2: Residential MeasuresHVAC Page 78
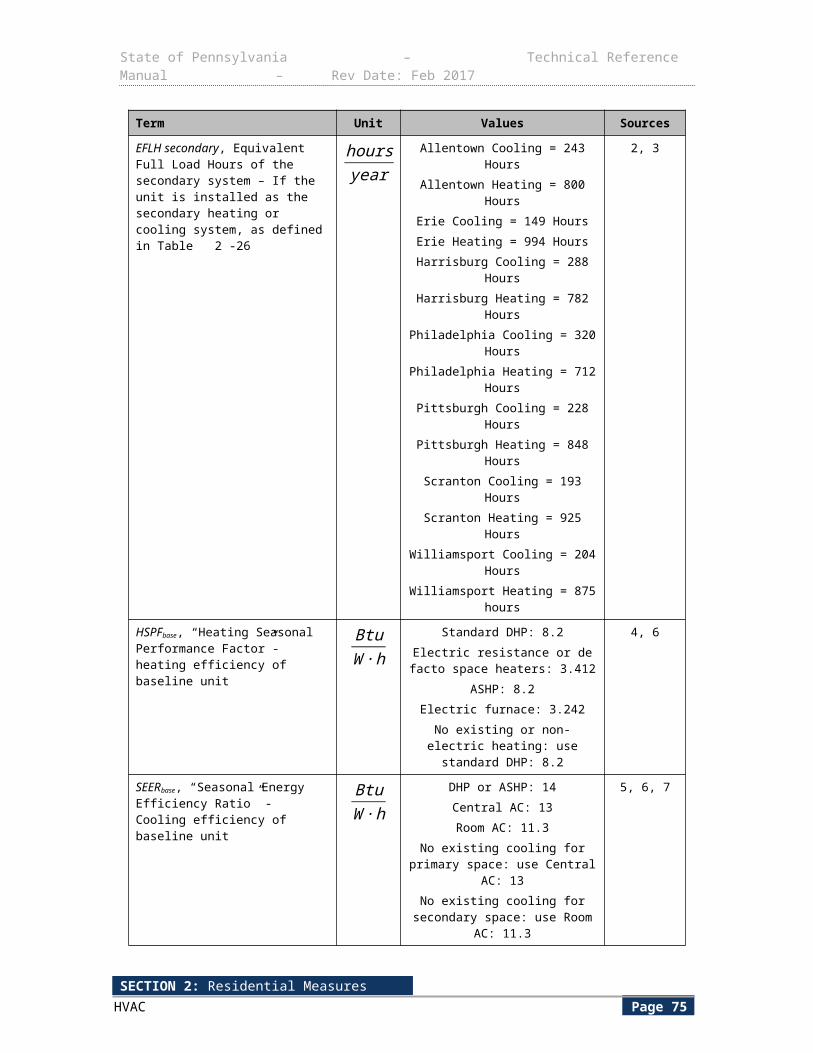
State of Pennsylvania – Technical Reference Manual – Rev Date: Feb 2017
E V A L U A T I O N P R O T O C O L S
For most projects, the appropriate evaluation protocol is to verify installation and proper selection of default values. For projects using customer specific data for open variables, the appropriate evaluation protocol is to verify installation and proper application of TRM protocol along with verification of open variables. The Pennsylvania Evaluation Framework provides specific guidelines and requirements for evaluation procedures.
S O U R C E S
1) Data set from the 2012 Pennsylvania Residential End-Use and Saturation Study submitted to Pennsylvania PUC by GDS Associates, Nexant, and Mondre: http://www.puc.pa.gov/electric/pdf/Act129/PA_Residential_Baseline_Report2012.pdf
2) Minimum Federal Standard for new Central Air Conditioners/Heat Pumps between 1990 and 2006.
3) New York Standard Approach for Estimating Energy Savings from Energy Efficiency Measures in Commercial and Industrial Programs, September 1, 2009.
4) DEER 2005 cooling savings for climate zone 16, assumes a variety of thermostat usage patterns.
5) “Programmable Thermostats. Report to KeySpan Energy Delivery on Energy Savings and Cost Effectiveness”, GDS Associates, Marietta, GA. 2002. 3.6% factor includes 56% realization rate.
6) Based on REM/Rate modeling using models from the PA 2012 Potential Study. EFLH calculated from kWh consumption for cooling and heating. Models assume 50% over-sizing of air conditioners89 and 40% oversizing of heat pumps.90
89 Neme, Proctor, Nadal, “National Energy Savings Potential From Addressing Residential HVAC Installation Problems. ACEEE, February 1, 1999. Confirmed also by Central Air Conditioning in Wisconsin, a compilation of recent field research. Energy Center of Wisconsin. May 2008, emended December 15, 2010, http://ecw.org/sites/default/files/241-1_0.pdf90 ACCA, “Verifying ACCA Manual S Procedures,”http://www.acca.org/wp-content/uploads/2014/01/Manual_S_verification.pdf.
SECTION 2: Residential MeasuresHVAC Page 79
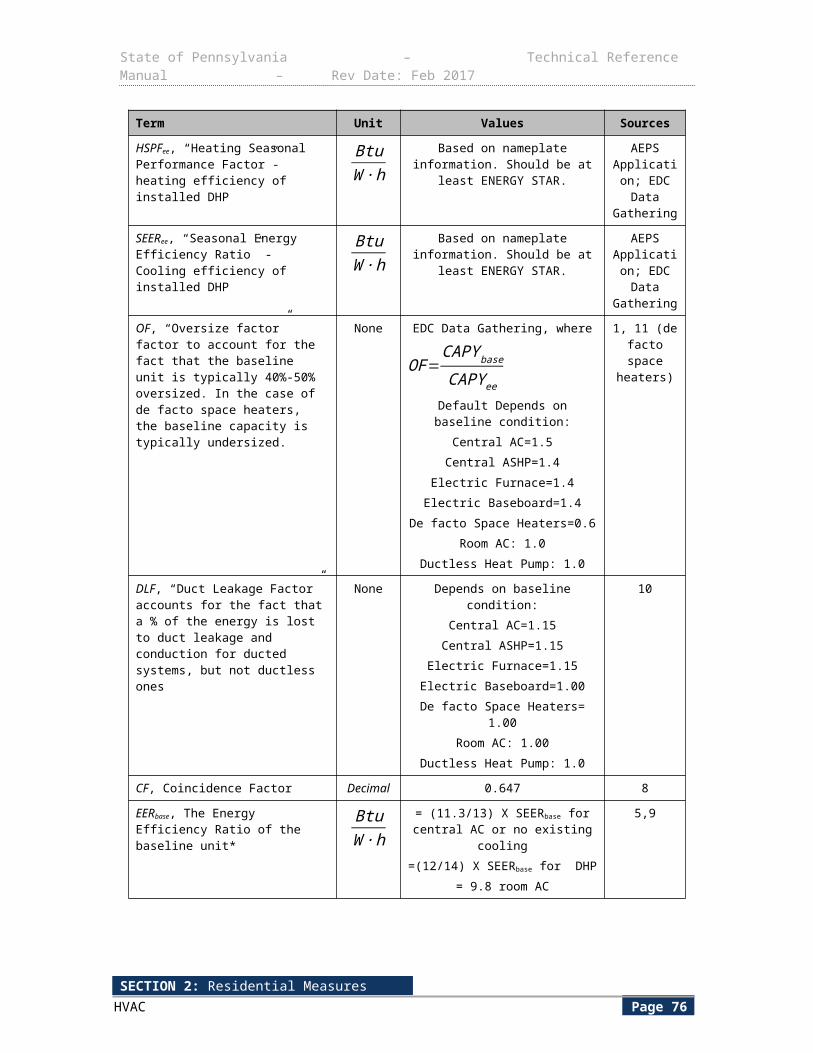
State of Pennsylvania – Technical Reference Manual – Rev Date: Feb 2017
2.2.9 RESIDENTIAL WHOLE HOUSE FANS
Measure Name Whole House Fans
Target Sector Residential Establishments
Measure Unit Whole House Fan
Unit Energy Savings Varies by location (187 kWh/yr to 232 kWh/yr)
Unit Peak Demand Reduction 0 kW
Measure Life 15 years91
Vintage Retrofit
This measure applies to the installation of a whole house fan. The use of a whole house fan will offset existing central air conditioning loads. Whole house fans operate when the outside temperature is less than the inside temperature, and serve to cool the house by drawing cool air in through open windows and expelling warmer air through attic vents.
The baseline is taken to be an existing home with central air conditioning (CAC) and without a whole house fan.
The retrofit condition for this measure is the installation of a new whole house fan.
E L I G I B I L I T Y
This protocol documents the energy savings for the installation of a whole house fan to be used as a compliment to an existing central HVAC system. The target sector is primarily residential.
A L G O R I T H M S
The energy savings for this measure result from reduced air conditioning operation. While running, whole house fans can consume up to 90% less power than typical residential central air conditioning units.92 Energy savings for this measure are based on whole house fan energy savings values reported by the energy modeling software, REM/Rate.93
M O D E L A S S U M P T I O N S
The savings are reported on a “per house” basis with a modeled baseline cooling provided by a SEER 10 Split A/C unit.
Savings derived from a comparison between a naturally ventilated home and a home with a whole-house fan.
2181 square-foot single-family detached home built over unconditioned basement.94
91 DEER EUL Summary, Database for Energy Efficient Resources, updated 2/5/2014, http://www.deeresources.com/files/DEER2013codeUpdate/download/DEER2014-EUL-table-update_2014-02-05.xlsx92 Whole House Fan, Technology Fact Sheet, (March 1999), Department of Energy Building Technologies Program, DOE/GO-10099-745, accessed October 2010 http://www.energysavers.gov/your_home/space_heating_cooling/related.cfm/mytopic=1235793 Architectural Energy Corporation, REM/Rate v12.85.94 EIA (2005), Table HC1.1.3: “Housing Unit Characteristics by Average Floorspace”, http://www.eia.doe.gov/emeu/recs/recs2005/hc2005_tables/hcfloorspace/pdf/tablehc1.1.3.pdf Used Single Family Detached “Heated” value for Mid-Atlantic region as representative of the living space cooled by a 10 SEER Split A/C unit. The floorspace recorded for “Cooling” is likely to be affected by Room A/C use.
SECTION 2: Residential MeasuresHVAC Page 80
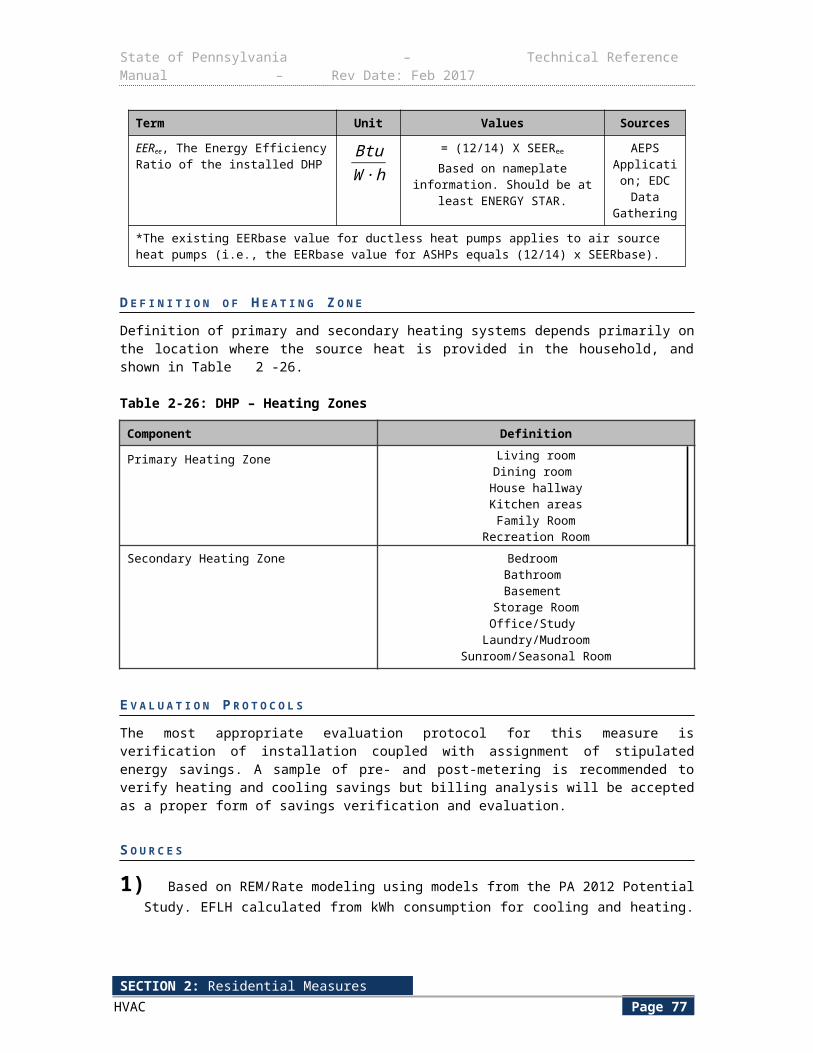
State of Pennsylvania – Technical Reference Manual – Rev Date: Feb 2017
Table 2-46: Whole House Fan Deemed Energy Savings by PA City
City Annual Energy Savings (kWh/house)
Allentown 204
Erie 200
Harrisburg 232
Philadelphia 229
Pittsburgh 199
Scranton 187
Williamsport 191
This measure assumes no demand savings as whole house fans are generally only used during milder weather (spring/fall and overnight).
E V A L U A T I O N P R O T O C O L S
For most projects, the appropriate evaluation protocol is to verify installation and proper selection of default values. For projects using customer specific data for open variables, the appropriate evaluation protocol is to verify installation and proper application of TRM protocol along with verification of open variables. The Pennsylvania Evaluation Framework provides specific guidelines and requirements for evaluation procedures.
SECTION 2: Residential MeasuresHVAC Page 81
State of Pennsylvania – Technical Reference Manual – Rev Date: Feb 2017
2.2.10 PACKAGED TERMINAL SYSTEMS
Measure Name Packaged Terminal Systems
Target Sector Residential Multifamily Buildings
Measure Unit PTHP, PTAC
Unit Energy Savings Variable
Unit Peak Demand Reduction Variable
Measure Life 15 years 95
Measure Vintage Replace on Burnout, New Construction, or Early Replacement
The method for determining residential multifamily high-efficiency cooling and heating equipment energy impact savings is based on algorithms that determine a PTAC or PTHP energy use and peak demand contribution. Input data is based both on fixed assumptions and data supplied from the high-efficiency equipment AEPS application form or EDC data gathering.
The algorithms applicable for this program measure the energy savings directly related to the more efficient hardware installation.
Commercial PTHP and PTAC applications are dealt with in Section 3.2.1.
E L I G I B I L I T Y
This measure requires the purchase of high-efficiency packaged terminal heat pumps or packaged terminal air conditioners and installation in a multifamily building. The baseline unit is a standard efficiency PTAC or PTHP.
The following sections detail how this measure’s energy and demand savings are determined.
A L G O R I T H M S
Packaged Terminal AC (PTAC)
kWh / yr¿CAPY cool
1000 WkW
×( 1EERbase
− 1EERee )×EFLH cool
∆ kW peak ¿CAPY cool
1000 WkW
×( 1EERbase
− 1EERee )×CF
Packaged Terminal Heat Pump (PTHP)
95 Measure Life Report: Residential and Commercial/Industrial Lighting and HVAC Measures, GDS Associates, Inc.,June 2007http://neep.org/Assets/uploads/files/emv/emv-library/measure_life_GDS%5B1%5D.pdf
SECTION 2: Residential MeasuresHVAC Page 82
State of Pennsylvania – Technical Reference Manual – Rev Date: Feb 2017
kWh / yr ¿∆ kWh/ yrcool+∆kWh/ yr heat
kWh / yrcool¿CAPY cool
1000 WkW
×( 1EERbase
− 1EERee )×EFLH cool
kWh / yrheat¿CAPY heat
1000 WkW
× 13.412
×( 1COPbase
− 1COPee )×EFLH heat
∆ kW peak ¿CAPY cool
1000 WkW
×( 1EERbase
− 1EERee )×CF
D E F I N I T I O N O F T E R M S
Table 2-47: Variables for Residential Multifamily Packaged Terminal Systems
Term Unit Values Source
CAPY cool, Rated cooling capacity of the energy efficient unit
Btuhr
Nameplate data (AHRI or AHAM) EDC Data Gathering
CAPY heat , Rated heating capacity of the energy efficient unit
Btuhr
Nameplate data (AHRI or AHAM) EDC Data Gathering
EERbase , Energy Efficiency Ratio of the Baseline Unit
BtuW ∙h
New Construction or Replace on Burnout:
Default values from Table 2-48See Table 2-48
BtuW ∙h
Early replacement:Nameplate data (AHRI or AHAM) EDC Data
Gathering
EERee , Energy Efficiency Ratio of the unit being installed
BtuW ∙h
Nameplate data (AHRI or AHAM) EDC Data Gathering
EFLHcool , Equivalent Full Load Hours of operation during the cooling season for the average unit
hoursyr
Allentown Cooling = 487 HoursErie Cooling = 389 Hours
Harrisburg Cooling = 551 HoursPhiladelphia Cooling = 591 HoursPittsburgh Cooling = 432 HoursScranton Cooling = 417 Hours
Williamsport Cooling = 422 Hours
1
hoursyr
An EDC can either use the Alternate EFLH Table or estimate its own EFLH based on customer
billing data analysis.
Alternate EFLH Table (See Table 2-17); EDC Data Gathering
SECTION 2: Residential MeasuresHVAC Page 83
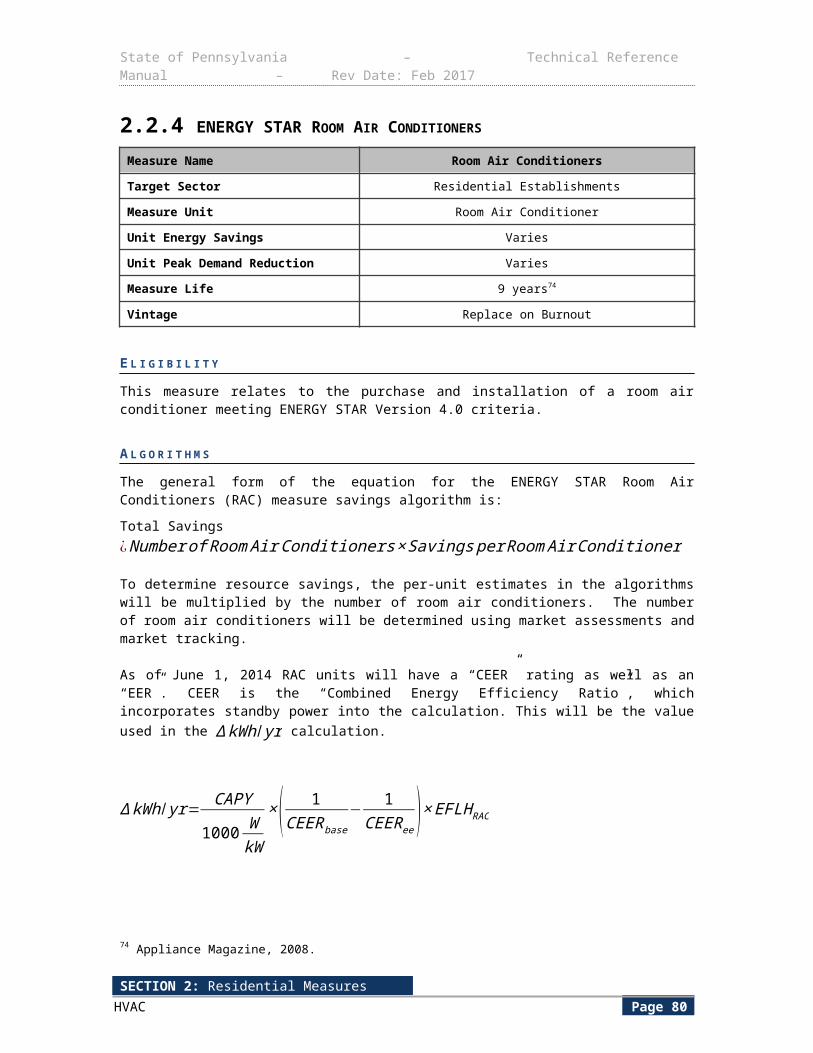
State of Pennsylvania – Technical Reference Manual – Rev Date: Feb 2017
Term Unit Values Source
EFLHheat , Equivalent Full Load Hours of operation during the heating season for the average unit
hoursyr
Allentown Heating = 1,193 HoursErie Heating = 1,349 Hours
Harrisburg Heating = 1,103 HoursPhiladelphia Heating = 1,060
HoursPittsburgh Heating = 1,209 HoursScranton Heating = 1,296 Hours
Williamsport Heating = 1,251 Hours
1
hoursyr
An EDC can either use the Alternate EFLH Table or estimate its own EFLH based on customer
billing data analysis.
Alternate EFLH Table (See Table 2-18); EDC Data Gathering
CF , Demand Coincidence Factor Fraction 0.647 2
COPee , Coefficient of Performance of the energy efficient unit. None EDC Data Gathering
AEPS Application; EDC’s Data Gathering
COPbase, Coefficient of Performance of the baseline unit
NoneNew Construction or Replace on
Burnout:Default values from Table 2-48
See Table 2-48
NoneEarly Replacement: EDC Data
GatheringAEPS
Application; EDC’s Data Gathering
Table 2-48: PTS Baseline Efficiencies
Equipment Type Cooling Baseline (EERbase) Heating Baseline (COPbase)
Packaged Terminal Systems (Nonstandard Size) - Replacement 96, 97
PTAC (cooling) 10.9 - (0.213 x CAPY cool / 1000) N/A
PTHP 10.8 - (0.213 x CAPY cool / 1000) 2.9 - (0.026 x CAPY cool / 1000)
Packaged Terminal Systems (Standard Size) – New Construction 98, 99
PTAC (cooling) 12.5 - (0.213 x CAPY cool / 1000) N/A
PTHP 12.3 - (0.213 x CAPY cool / 1000) 3.2 - (0.026 x CAPY cool / 1000)
96 Nonstandard size packaged terminal air conditioners and heat pumps with existing sleeves having an external wall opening of less than 16 in. high or less than 42 in. wide and having a cross-sectional area less than 670 in. Shall be factory labeled as follows: Manufactured for nonstandard size applications only: not to be installed in new construction projects.97 CAPYcool represents the rated cooling capacity of the product in Btu/hr. If the unit’s capacity is less than 7,000 Btu/hr, 7,000 Btu/hr is used in the calculation. If the unit’s capacity is greater than 15,000 Btu/hr, 15,000 Btu/hr is used in the calculation.98 This is intended for applications with standard size exterior wall openings. 99 CAPYcool represents the rated cooling capacity of the product in Btu/hr. If the unit’s capacity is less than 7,000 Btu/hr, 7,000 Btu/hr is used in the calculation. If the unit’s capacity is greater than 15,000 Btu/h, 15,000 Btu/hr is used in the calculation.
SECTION 2: Residential MeasuresHVAC Page 84
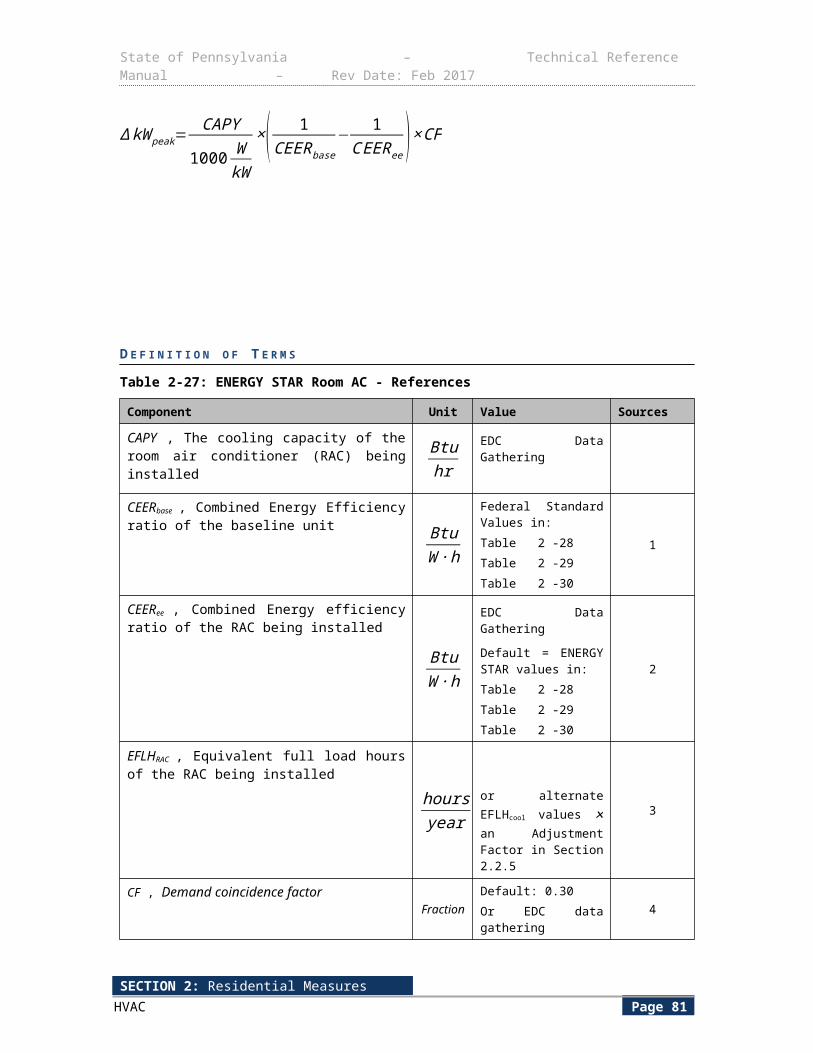
State of Pennsylvania – Technical Reference Manual – Rev Date: Feb 2017
D E F A U L T S A V I N G S
There are no default savings for this measure.
E V A L U A T I O N P R O T O C O L S
For most projects, the appropriate evaluation protocol is to verify installation and proper selection of default values. For projects using customer specific data for open variables, the appropriate evaluation protocol is to verify installation and proper application of TRM protocol along with verification of open variables. The Pennsylvania Evaluation Framework provides specific guidelines and requirements for evaluation procedures.
S O U R C E S
1) Based on REM/Rate modeling using models from the PA 2012 Potential Study. EFLH calculated from kWh consumption for cooling and heating. Models assume 50% over-sizing of air conditioners100 and 40% oversizing of heat pumps.101
2) Straub, Mary and Switzer, Sheldon."Using Available Information for Efficient Evaluation of Demand Side Management Programs". Study by BG&E. The Electricity Journal. Aug/Sept. 2011. Found at http://www.sciencedirect.com/science/article/pii/S1040619011001941
100 Neme, Proctor, Nadal, “National Energy Savings Potential From Addressing Residential HVAC Installation Problems. ACEEE, February 1, 1999. Confirmed also by Central Air Conditioning in Wisconsin, a compilation of recent field research. Energy Center of Wisconsin. May 2008, emended December 15, 2010, http://ecw.org/sites/default/files/241-1_0.pdf101 ACCA, “Verifying ACCA Manual S Procedures,” http://www.acca.org/wp-content/uploads/2014/01/Manual_S_verification.pdf.
SECTION 2: Residential MeasuresHVAC Page 85
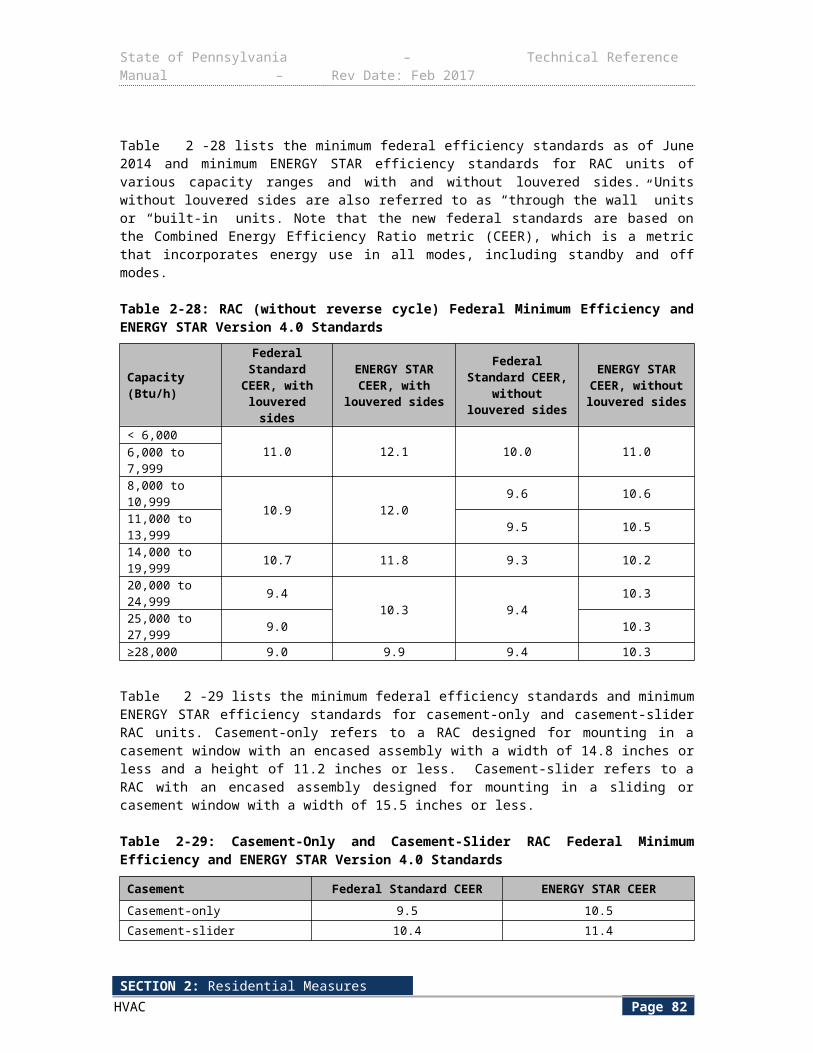
State of Pennsylvania – Technical Reference Manual – Rev Date: Feb 2017
2.3 DOMESTIC HOT WATER2.3.1 HEAT PUMP WATER HEATERS
Measure Name Heat Pump Water Heaters
Target Sector Residential Establishments
Measure Unit Water Heater
Unit Energy Savings Variable based on energy factors
Unit Peak Demand Reduction Variable based on energy factors
Measure Life 10 years102
Vintage Replace on Burnout
Heat Pump Water Heaters take heat from the surrounding air and transfer it to the water in the tank, unlike conventional water heaters, which use either gas (or sometimes other fuel) burners or electric resistance heating coils to heat the water.
E L I G I B I L I T Y
This protocol documents the energy savings attributed to heat pump water heaters with Energy Factors meeting Energy Star Criteria Version 3.0103. The target sector primarily consists of single-family residences.
A L G O R I T H M S
The energy savings calculation utilizes average performance data for available residential heat pump and standard electric resistance water heaters and typical water usage for residential homes. The algorithms take into account interactive effects between the water heater and HVAC system when installed inside conditioned space. The energy savings are obtained through the following formula:
∆ kWh/ yr=( 1EF base
−1
( EFee×Fderate) )×HW×365 daysyr ×8.3 lbsgal ×1 Btulbs ∙℉ × (T hot−T cold )
3412 BtukWh
+∆kWh / yr ie , cool+∆kWh / yr ie ,heat
Include below interactive effects calculations only when water heater is installed inside conditioned space with electric heating and cooling.
If either electric heating or electric cooling is absent, then the respective interactive effect will equal zero.
When installed outside of conditioned space, both interactive effects will equal zero, and the appropriate Fderate in Table 2-53 will account for reduced performance due to cooler annual temperatures.
If installation location is unknown, use the ‘Default’ value for Fderate in Table 2-53 and both interactive effects will equal zero.
102 DEER Effective Useful Life values, updated 2/5/2014. http://www.deeresources.com/files/DEER2013codeUpdate/download/DEER2014-EUL-table-update_2014-02-05.xlsx103 EF≥2.0 for tanks ≤55 gallons and EF≥2.2 for tanks >55 gallons
SECTION 2: Residential MeasuresDomestic Hot Water Page 86
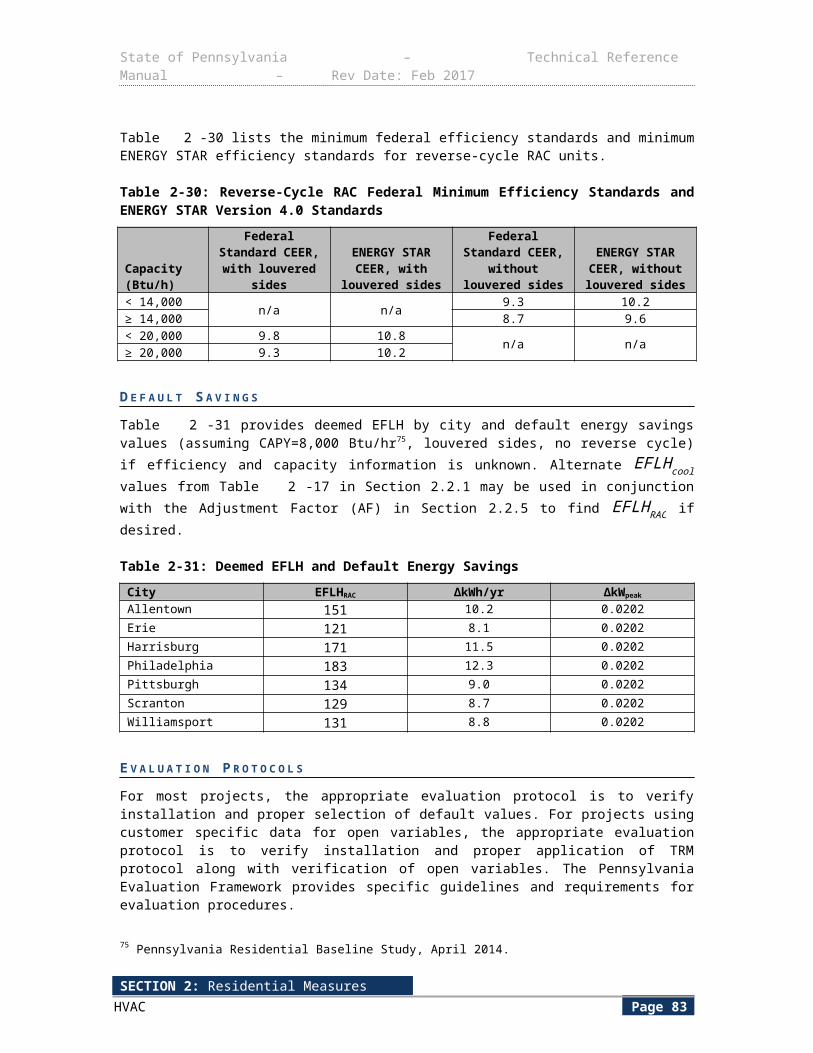
State of Pennsylvania – Technical Reference Manual – Rev Date: Feb 2017
∆ kWh/ yr ie ,cool=HW×8.3 lbs
gal×1 Btu
lbs ∙℉ × (T hot−T cold )×EFLH cool
24 hrsday
×SEER×1000 WkW
∆ kWh/ yr ie ,heat=−[HW ×8.3 lbsgal
×1 Btulbs ∙℉ × (T hot−T cold )×EFLHheat
24 hrsday
×HSPF ×1000 WkW ]
For heat pump water heaters, demand savings result primarily from a reduced connected load. However, since the interactive effects during the heating season have no effect on the peak demand, the heating season interactive effects are subtracted from the total kWh savings before the ETDF is applied. The demand reduction is taken as the annual energy savings multiplied by the ratio of the average demand between 2 PM and 6 PM on summer weekdays to the total annual energy usage.
kWpeak = ETDF × (kWh / yr−∆ kWh/ yr ie , heat )
ETDF (Energy to Demand Factor) is defined below:
ETDF = Average DemandSummer WD 2-6 PM
Annual Energy Usage
The ratio of the average demand between 2 PM and 6 PM on summer weekdays to the total annual energy usage is taken from an electric water heater metering study performed by BG&E (pg 95 of Source 6).
D E F I N I T I O N O F T E R M S
The parameters in the above equation are listed in Table 2-49.
SECTION 2: Residential MeasuresDomestic Hot Water Page 87
State of Pennsylvania – Technical Reference Manual – Rev Date: Feb 2017
Table 2-49: Heat Pump Water Heater Calculation Assumptions
Component Unit Values Source
EF base, Energy Factor of baseline water heater
None See
Default= 0.945 (EF for 50 gallon)
1, 7
EFee, Energy Factor of proposed efficient water heater
gallons EDC Data Gathering
Default :≤55 Gallons: 2.0>55 Gallons: 2.2
9
HW , Hot water used per day in gallons gallonsday
50 2
T hot, Temperature of hot water °F 119 3
T cold, Temperature of cold water supply °F 55 4
Fderate, COP De-rating factor Fraction 5, and discussion
below
EFLH cool , Equivalent Full Load Hours for cooling
hoursyr
Table 2-50 6
EFLH heat , Equivalent Full Load Hours for heating
hoursyr
Table 2-51 6
HSPF , Heating Seasonal Performance Factor
BtuW ∙h
EDC Data GatheringDefault= 6.9
7
SEER , Seasonal Energy Efficiency Ratio BtuW ∙h
EDC Data GatheringDefault= 11
7
ETDF , Energy to Demand Factor (defined above)
kWkWh / yr
0.00008047 8
Table 2-50: Equivalent Full Load Hours for Cooling Season
City EFLH cool
Allentown 487
Erie 389
Harrisburg 551
Philadelphia 591
Pittsburgh 432
Scranton 417
Williamsport 422
SECTION 2: Residential MeasuresDomestic Hot Water Page 88
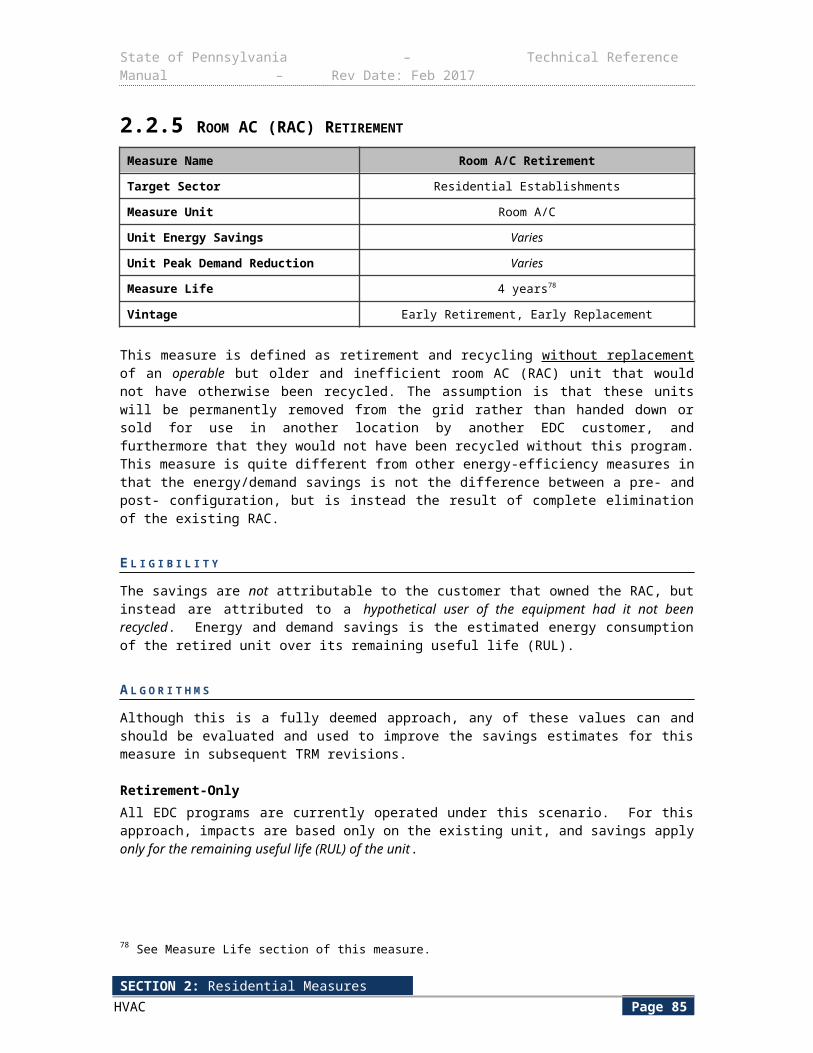
State of Pennsylvania – Technical Reference Manual – Rev Date: Feb 2017
Table 2-51: Equivalent Full Load Hours for Heating Season
City EFLH heat
Allentown 1,193
Erie 1,349
Harrisburg 1,103
Philadelphia 1,060
Pittsburgh 1,209
Scranton 1,296
Williamsport 1,251
E N E R G Y F A C T O R S B A S E D O N T A N K S I Z E
As of 4/16/2015, Federal Standards for electric water heater Energy Factors are equal to 0.96 - 0.0003*(Rated Storage in Gallons) for tanks equal to or smaller than 55 gallons. For tanks larger than 55 gallons, the minimum Energy Factor is 2.057 – 0.00113*(Rated Storage in Gallons). The following table shows the Energy Factors for various tank sizes.
Table 2-52: Minimum Baseline Energy Factors Based on Tank Size
Tank Size (gallons) Minimum Energy Factor (EFBase)
40 0.948
50 0.945
65 1.984
80 1.967
120 1.921
H E A T P U M P W A T E R H E A T E R E N E R G Y F A C T O R
The Energy Factors are determined from a DOE testing procedure that is carried out at 67.5 ˚F dry bulb and 56 °F wet bulb temperatures. However, the average dry and wet bulb temperatures in PA are in the range of 50-56˚F DB and 45-50 °F WB104. The heat pump performance is temperature and humidity dependent, therefor the location and type of installation is significant. To account for this, an EF de-rating factor (Fderate) has been adapted from a 2013 NEEA HPWH field study (Source 5). The results used are for “Heating Zone 1”, which is comprised of Olympia, WA and Portland, OR and have average dry and wet bulb temperatures (51˚F DB, 47˚F WB and 55˚F DB, 49˚F WB, respectively) 105comparable to Pennsylvania.
104 Based on average weather data from weatherbase.com for the 7 Pennsylvania cities referenced elsewhere in this TRM (Allentown, Erie, Harrisburg, Philadelphia, Pittsburgh, Scranton, Williamsport). 105 Ibid
SECTION 2: Residential MeasuresDomestic Hot Water Page 89

State of Pennsylvania – Technical Reference Manual – Rev Date: Feb 2017
Table 2-53: EF De-rating Factor for Various Installation Locations
Installation Location Fderate
Inside Conditioned Space 0.98
Unconditioned Garage 0.85
Unconditioned Basement 0.72
Default106 0.87
D E F A U L T S A V I N G S
Default savings for the installation of heat pump water heaters not located inside conditioned space are calculated using the formulas below.
∆ kWh /yr = (1EFbase−
1(EF ee×Fderate ) )× (2841.27 kWh / yr )
∆ kW peak=( 1EF base
−1
(EF ee× Fderate ) )× (0.22864 kW )
E V A L U A T I O N P R O T O C O L S
The most appropriate evaluation protocol for this measure is verification of installation coupled with calculation of energy and demand savings using above algorithms.
S O U R C E S
1) U.S. Federal Standards for Residential Water Heaters. Effective April 16, 2015. http://www1.eere.energy.gov/buildings/appliance_standards/product.aspx/productid/27
2) Residential Energy Consumption Survey, EIA, 2009.
3) Pennsylvania Statewide Residential End-Use and Saturation Study, 2014.
4) Mid-Atlantic TRM Version 3.0, March 2013, footnote #314
5) NEEA Heat Pump Water Heater Field Study Report. Prepared by Fluid Market Strategies, 2013. http://neea.org/docs/default-source/reports/heat-pump-water-heater-field-study-report.pdf?sfvrsn=5 (Note: when this source discusses “ducted” vs “non-ducted” systems it refers to the water heater’s heat pump exhaust, not to the HVAC ducts.)
6) Based on REM/Rate modeling using models from the PA 2012 Potential Study. EFLH calculated from kWh consumption for cooling and heating. Models assume 50% over-sizing of air conditioners107 and 40% oversizing of heat pumps.108
106 Calculated by dividing the COP in each location from Figure 15 by the rated Energy Factor (2.35) of the unit tested in the study (AirGenerate ATI66 ).107 Weighted average of values in Table 107 for water heater locations for all space heating fuel types. Northwest Energy Efficiency Alliance 2011 Residential Building Stock Assessment: Single-Family Characteristics and Energy Use. Published September 18, 2012. Online at http://neea.org/docs/reports/residential-building-stock-assessment-single-family-characteristics-and-energy-use.pdf?sfvrsn=8108 Neme, Proctor, Nadal, “National Energy Savings Potential From Addressing Residential HVAC Installation Problems. ACEEE, February 1, 1999. Confirmed also by Central Air Conditioning in Wisconsin, a compilation of recent field research. Energy Center of Wisconsin. May 2008, emended December 15, 2010
SECTION 2: Residential MeasuresDomestic Hot Water Page 90
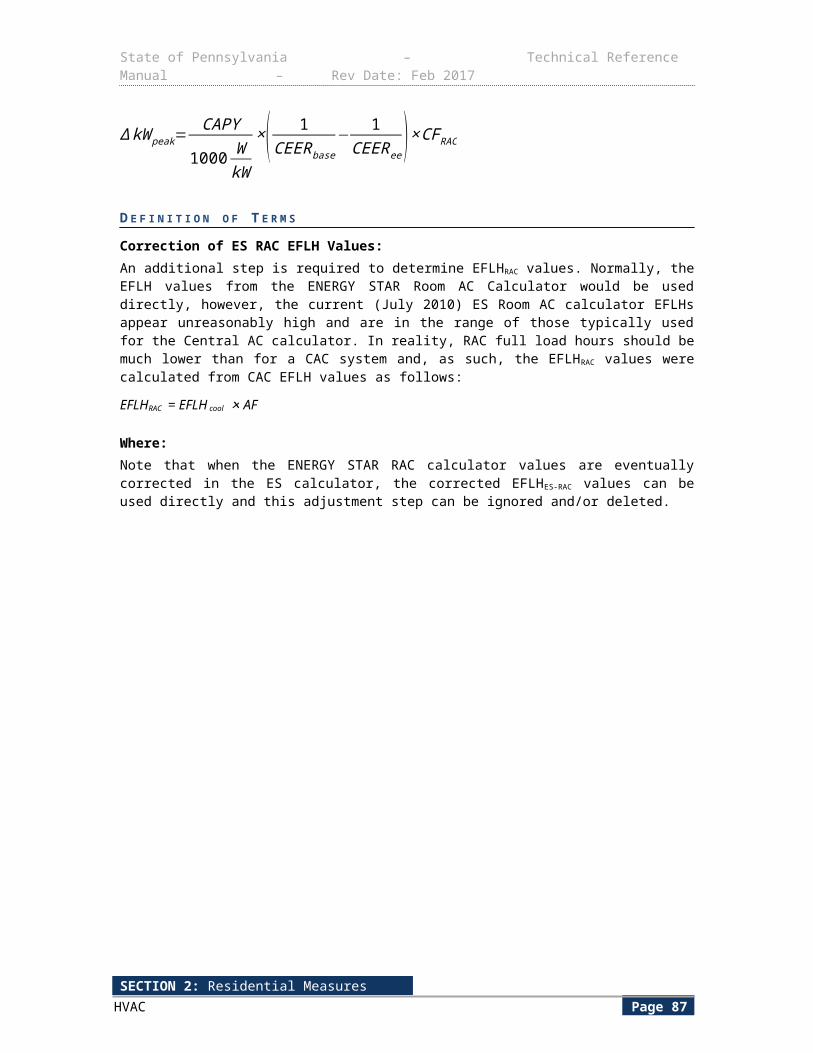
State of Pennsylvania – Technical Reference Manual – Rev Date: Feb 2017
7) 2014 Pennsylvania Residential Baseline Study. Presented to the PUC by GDS Associates.Consistent with Sections 2.2.1 Electric HVAC.
8) Straub, Mary and Switzer, Sheldon. "Using Available Information for Efficient Evaluation of Demand Side Management Programs". Study by BG&E. The Electricity Journal, Aug/Sept. 2011. http://www.sciencedirect.com/science/article/pii/S1040619011001941
9) ENERGY STAR Product Specifications for Residential Water Heaters Version 3.0. Effective April 15, 2016. http://www.energystar.gov/sites/default/files/ENERGY%20STAR%20Water%20Heaters%20Version%203%200%20Program%20Requirements_0.pdf
SECTION 2: Residential MeasuresDomestic Hot Water Page 91
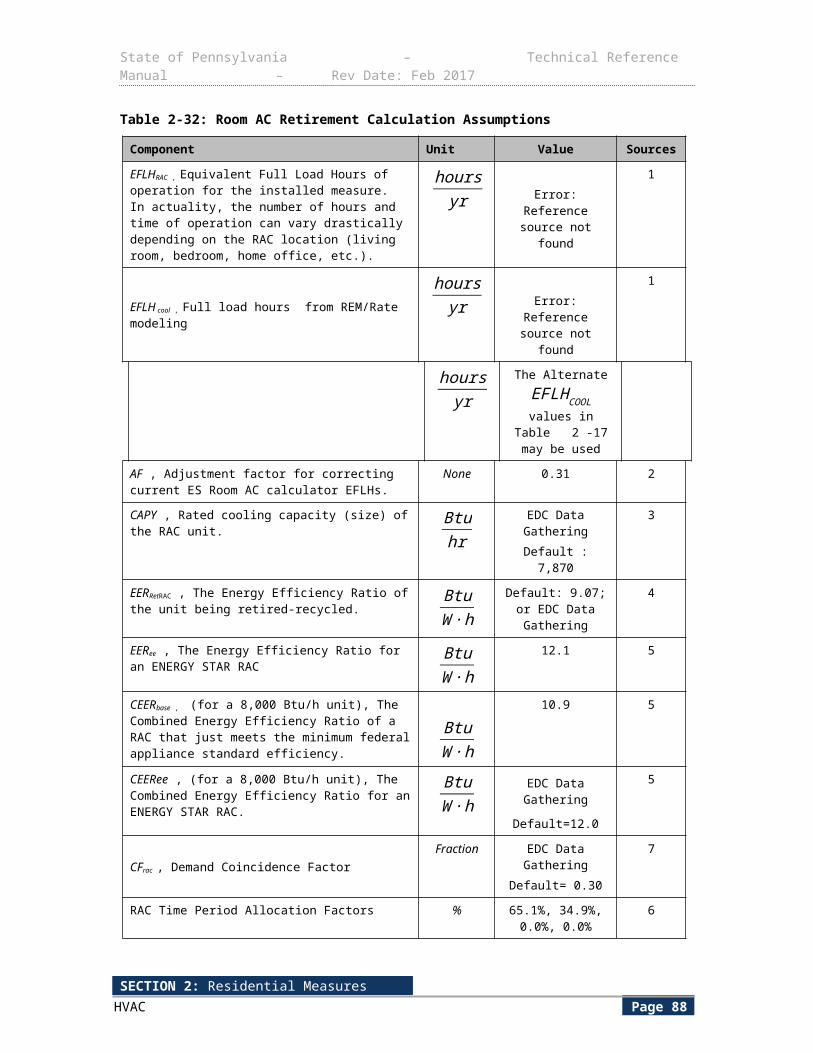
State of Pennsylvania – Technical Reference Manual – Rev Date: Feb 2017
2.3.2 SOLAR WATER HEATERS
Measure Name Solar Water Heaters
Target Sector Residential Establishments
Measure Unit Water Heater
Default Unit Energy Savings 1,462.5 kWh
Default Unit Peak Demand Reduction 0.2419 kW
Measure Life 15 years109
Vintage Retrofit
Solar water heaters utilize solar energy to heat water, which reduces electricity required to heat water.
E L I G I B I L I T Y
This protocol documents the energy savings attributed to solar water in PA. The target sector primarily consists of single-family residences.
A L G O R I T H M S
The energy savings calculation utilizes average performance data for available residential solar and standard water heaters and typical water usage for residential homes. The energy savings are obtained through the following formula:
∆ kWh/ yr=( 1EF base
−1
EF ee )×HW×365 daysyr ×8.3 lbsgal ×1 Btulbs ∙℉ × (T hot−T cold )
3412 BtukWh
The energy factor used in the above equation represents an average energy factor of market available solar water heaters110.
The demand reduction is taken as the annual energy usage of the baseline water heater multiplied by the ratio of the average demand between 2PM and 6PM on summer weekdays to the total annual energy usage. Note that this is a different formulation than the demand savings calculations for other water heaters. This modification of the formula reflects the fact that a solar water heater’s capacity is subject to seasonal variation, and that during the peak summer season, the water heater is expected to fully supply all domestic hot water needs.
kWpeak = ETDF × kWh / yrbase
Where :kWh / yrbase=( 1EF base )×HW×365 daysyr ×8.3 lbsgal ×1 Btu
lbs ∙℉ × (T hot−T cold )
3412 BtukWh
109 ACCA, “Verifying ACCA Manual S Procedures,” http://www.acca.org/wp-content/uploads/2014/11/Manual-S-Brochure-Final-1.pdf.110 ENERGY STAR Solar Water Heater Benefits and Savings. Accessed 8/8/2014. http://www.energystar.gov/index.cfm?c=solar_wheat.pr_savings_benefits
SECTION 2: Residential MeasuresDomestic Hot Water Page 92
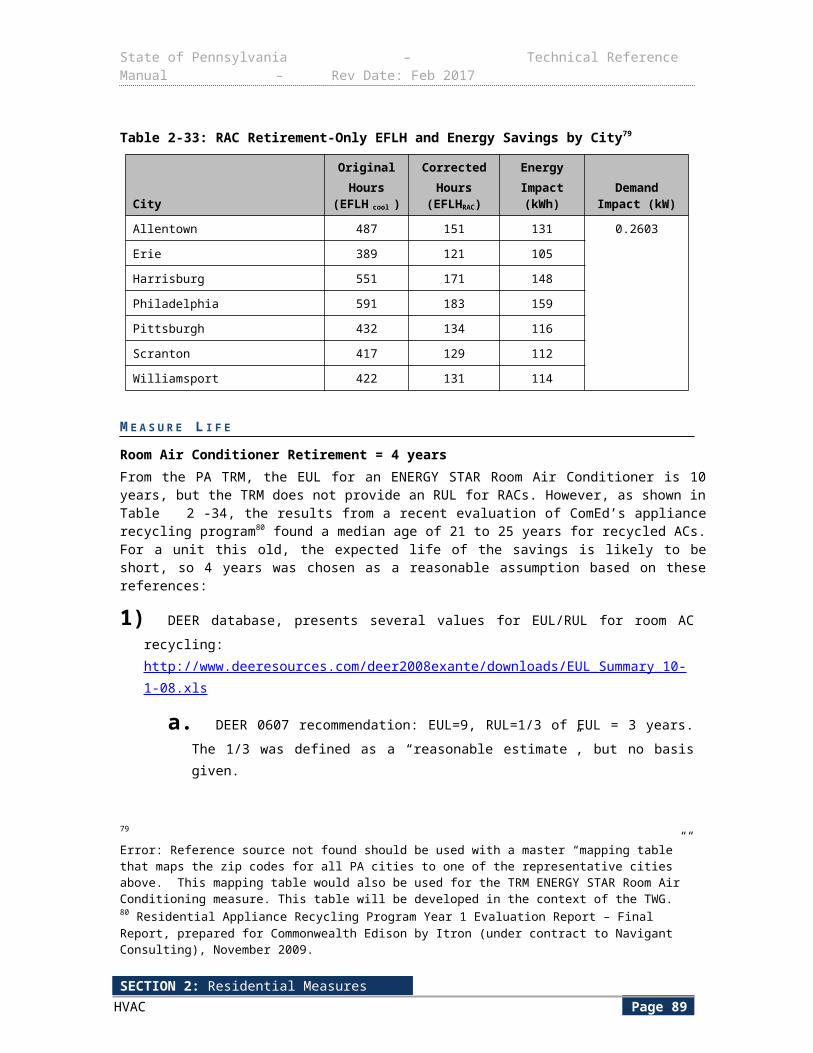
State of Pennsylvania – Technical Reference Manual – Rev Date: Feb 2017
ETDF (Energy to Demand Factor) is defined below:
ETDF = Average DemandSummer WD 2 PM- 6 PM
Annual Energy Usage
The ratio of the average demand between 2 PM and 6 PM on summer weekdays to the total annual energy usage is taken from an electric water heater metering study performed by BG&E (pg 95 of Source 2).
D E F I N I T I O N O F T E R M S
The parameters in the above equation are listed in Table 2-54.
Table 2-54: Solar Water Heater Calculation Assumptions
Component Unit Values Source
EFbase , Energy Factor of baseline electric water heater
Fraction See Table 2-55 3
Default= 0.945(50 gallon)
3
EFee , Year-round average Energy Factor of proposed solar water heater
Fraction EDC Data Gathering EDC Data Gathering
Default=1.84 (for tanks ≤55 gallons)
1
HW , Hot water used per day in gallons gallonsday
50 4
Thot , Temperature of hot water ° F 119 5
Tcold , Temperature of cold water supply ° F 55 6
ETDF , Energy to Demand Factor (defined above)
kWkWh / yr
0.00008047 2
E N E R G Y F A C T O R S B A S E D O N T A N K S I Z E
As of 4/16/2015, Federal standards for electric water heater Energy Factors are equal to 0.96-(0.0003*Rated Storage in Gallons ) for tanks equal to or smaller than 55 gallons. For tanks larger than 55 gallons, the minimum Energy Factor is 2.057 – (0.00113*Rated Storage). The following table shows the baseline Energy Factors for various tank sizes:
SECTION 2: Residential MeasuresDomestic Hot Water Page 93
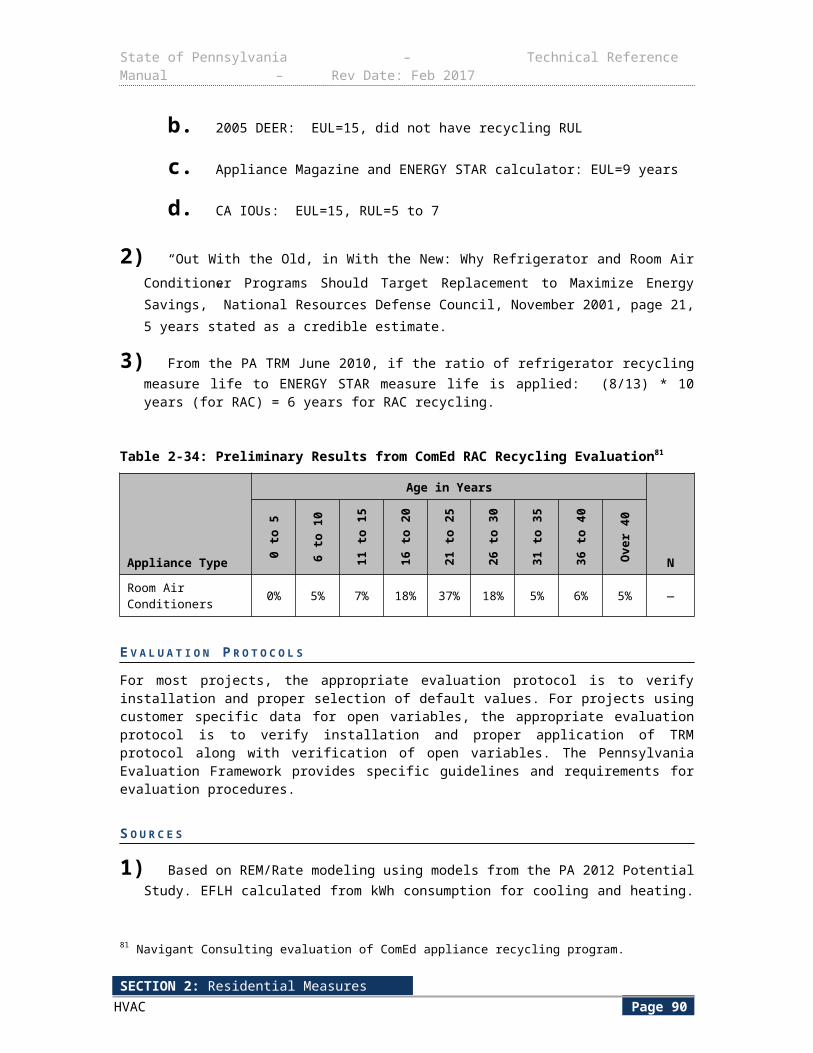
State of Pennsylvania – Technical Reference Manual – Rev Date: Feb 2017
Table 2-55: Minimum Baseline Energy Factors Based on Tank Size
Tank Size (gallons) Minimum Energy Factors
40 0.948
50 0.945
65 1.984
80 1.967
120 1.921
D E F A U L T S A V I N G S
The partially-deemed algorithm for savings attributable to the installation of a solar water heater is given below.
∆ kWh/ yr=( 1EFbase
−1
EFee )×(2841.27 kWhyr )∆ kW peak=( 1
EF base )× (0.22864 kW )
E V A L U A T I O N P R O T O C O L S
For most projects, the appropriate evaluation protocol is to verify installation and proper selection of default values. For projects using customer specific data for open variables, the appropriate evaluation protocol is to verify installation and proper application of TRM protocol along with verification of open variables. The Pennsylvania Evaluation Framework provides specific guidelines and requirements for evaluation procedures.
S O U R C E S
1) The average energy factor for all solar water heaters with collector areas of 50 ft2 or smaller is from https://secure.solar-rating.org/Certification/Ratings/RatingsSummaryPage.aspx. As a cross check, we have calculated that the total available solar energy in PA for the same set of solar collectors is about twice as much as the savings claimed herein – that is, there is sufficient solar capacity to actualize an average energy factor of 1.84.
2) Straub, Mary and Switzer, Sheldon. "Using Available Information for Efficient Evaluation of Demand Side Management Programs". Study by BG&E. The Electricity Journal, Aug/Sept. 2011. http://www.sciencedirect.com/science/article/pii/S1040619011001941
3) U.S. Federal Standards for Residential Water Heaters. Effective April 16, 2015. http://www1.eere.energy.gov/buildings/appliance_standards/product.aspx/productid/27
4) Residential Energy Consumption Survey, EIA, 2009.
5) Pennsylvania Statewide Residential End-Use and Saturation Study, 2014.
6) Mid-Atlantic TRM Version 3.0, March 2013, footnote #314
SECTION 2: Residential MeasuresDomestic Hot Water Page 94

State of Pennsylvania – Technical Reference Manual – Rev Date: Feb 2017
2.3.3 FUEL SWITCHING: ELECTRIC RESISTANCE TO FOSSIL FUEL WATER HEATER
Measure Name Fuel Switching: Electric Resistance to Fossil Fuel Water Heater
Target Sector Residential
Measure Unit Water Heater
Unit Energy Savings 3,006.6 kWh/yr
Unit Peak Demand Reduction 0.2419 kW
Gas, Fossil Fuel Consumption Increase
Gas: 14.47 MMBtu/yrPropane: 14.47 MMBtu/yr
Oil: 16.57 MMBtu/yr
Measure LifeGas:11 years111
Propane: 11 years112
Oil: 8 years113
Vintage Replace on Burnout
Natural gas, propane and oil water heaters generally offer the customer lower costs compared to standard electric water heaters. Additionally, they typically see an overall energy savings when looking at the source energy of the electric unit versus the fossil fuel-fired unit.
E L I G I B I L I T Y
This protocol documents the energy savings attributed to converting from a standard electric resistance water heater to an ENERGY STAR Version 3.0 natural gas or propane water heater or an oil water heater with an Energy Factor of 0.585. If a customer submits a rebate for a product that has applied for ENERGY STAR Certification but has not yet been certified, the savings will be counted for that product contingent upon its eventual certification as an ENERGY STAR measure. If at any point the product is rejected by ENERGY STAR, the product is then ineligible for the program and savings will not be counted.
The target sector primarily consists of single-family residences.
A L G O R I T H M S
The energy savings calculation utilizes average performance data for available residential standard electric and fossil fuel-fired water heaters and typical water usage for residential homes. Because there is little electric energy associated with a fossil fuel-fired water heater, the energy savings are the full energy utilization of the electric water heater. The energy savings are obtained through the following formula:
111 We have taken the average energy factor for all solar water heaters with collector areas of 50 ft2 or smaller from https://secure.solar-rating.org/Certification/Ratings/RatingsSummaryPage.aspx. As a cross check, we have calculated that the total available solar energy in PA for the same set of solar collectors is about twice as much as the savings claimed herein – that is, there is sufficient solar capacity to actualize an average energy factor of 1.84.112 DEER Effective Useful Life values, updated 2/5/2014. http://www.deeresources.com/files/DEER2013codeUpdate/download/DEER2014-EUL-table-update_2014-02-05.xlsx113 Ibid..
SECTION 2: Residential MeasuresDomestic Hot Water Page 95
State of Pennsylvania – Technical Reference Manual – Rev Date: Feb 2017
kWh /yr = {(1
EFElec,bl )×(HW ×365 daysyr
×1 BTUlb ∙° F
× 8.3 lbgal
× ( Thot - Tcold ))}3412 Btu
kWh
Although there is a significant electric savings, there is an associated increase in fossil fuel energy consumption. While this fossil fuel consumption does not count against PA Act 129 energy savings, it is expected to be used in the program TRC test. The increased fossil fuel usage is obtained through the following formula:
Fuel Consumption (MMBtu /yr ) = {(1EFinstalled )×(HW ×365 days
yr×1 BTU
lb∙ ° F×8.3 lb
gal× ( Thot - Tcold ))}
1,000,000 BtuMMBtu
Demand savings result from the removal of the connected load of the electric water heater. The demand reduction is taken as the annual energy savings multiplied by the ratio of the average energy usage between2 PM and 6 PM on summer weekdays to the total annual energy usage.
kWpeak = ETDF × ∆ kWh/ yr
ETDF (Energy to Demand Factor) is defined below:
ETDF = Average DemandSummer WD 2PM- 6 PM
Annual Energy Usage
The ratio of the average energy usage between 2 PM and 6 PM on summer weekdays to the total annual energy usage is taken from an electric water heater metering study performed by BG&E (pg 95 of Source 7).
D E F I N I T I O N O F T E R M S
The parameters in the above equation are listed in Table 2-56 below.
Table 2-56: Calculation Assumptions for Fuel Switching Electric Resistance to Fossil Fuel Water Heater
Component Unit Values Source
EFelec,bl , Energy Factor of baseline water heater Fraction EDC Data GatheringDefault: Table 2-57
1
EFinstalled, NG , Energy Factor of installed natural gas water heater
Fraction EDC Data GatheringDefault:
≤55 Gallons= 0.67>55 Gallons= 0.77
2
EFinstalled,Propane , Energy Factor of installed propane water heater
Fraction EDC Data GatheringDefault:
≤55 Gallons= 0.67>55 Gallons= 0.77
2
EFinstalled,Tankless Water Heater , Energy Factor of installed tankless water heater
Fraction EDC Data GatheringDefault: ≥0.90
2
SECTION 2: Residential MeasuresDomestic Hot Water Page 96
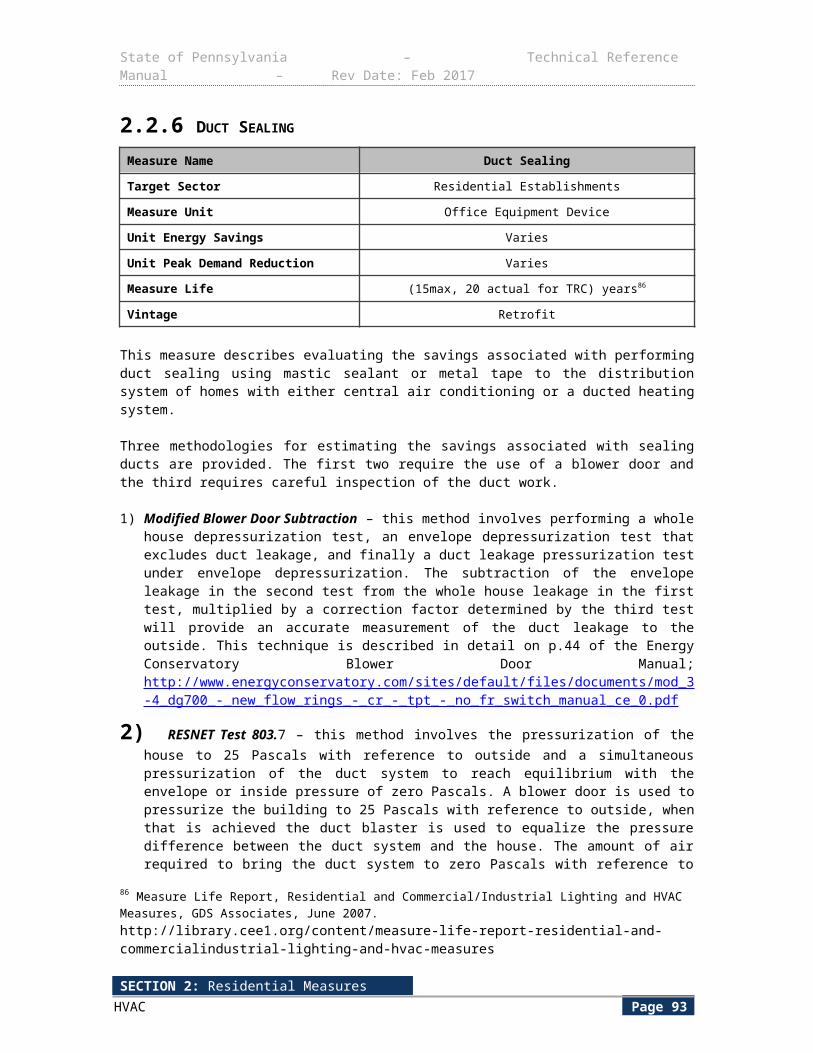
State of Pennsylvania – Technical Reference Manual – Rev Date: Feb 2017
Component Unit Values Source
EFinstalled,Oil , Energy Factor of installed oil water heater*
Fraction EDC Data GatheringDefault: ≥0.585
3
HW , Hot water used per day in gallons gallonsday
50 4
Thot , Temperature of hot water °F 119 5
Tcold , Temperature of cold water supply °F 55 6
ETDF , Energy to Demand Factor (defined above) kWkWh / yr
0.00008047 7
E N E R G Y F A C T O R S B A S E D O N T A N K S I Z E
As of 4/16/2015, Federal Standards for Energy Factors are equal to 0.96-(0.0003*Rated Storage in Gallons) for tanks equal to or smaller than 55 gallons. For tanks larger than 55 gallons, the minimum Energy Factor is 2.057 – (0.00113*Rated Storage). The following table shows the Energy Factors for various tank sizes.
Table 2-57: Minimum Baseline Energy Factors based on Tank Size
Tank Size (gallons) Minimum Energy Factors (EF elec, bl)
40 0.948
50 0.945
65 1.984
80 1.967
120 1.921
D E F A U L T S A V I N G S
The electric savings for the installation of a fossil fuel water heater should be calculated using the partially deemed algorithm below.
∆ kWh/ yr=( 1EFelec , bl )×(2841.27 kWhyr )
∆ kW peak=( 1EF elec ,bl )× (0.22864 kW )
The default savings for the installation of a 50 gallon natural gas/ propane/oil water heater in place of a standard electric water heater are listed in Table 2-58 below.
Table 2-58: Energy Savings and Demand Reductions for Fuel Switching, Domestic Hot Water Electric to Fossil Fuel
Electric unit Energy Factor Energy Savings (kWh/yr) Demand Reduction (kW)
0.945 3006.6 0.2419
SECTION 2: Residential MeasuresDomestic Hot Water Page 97
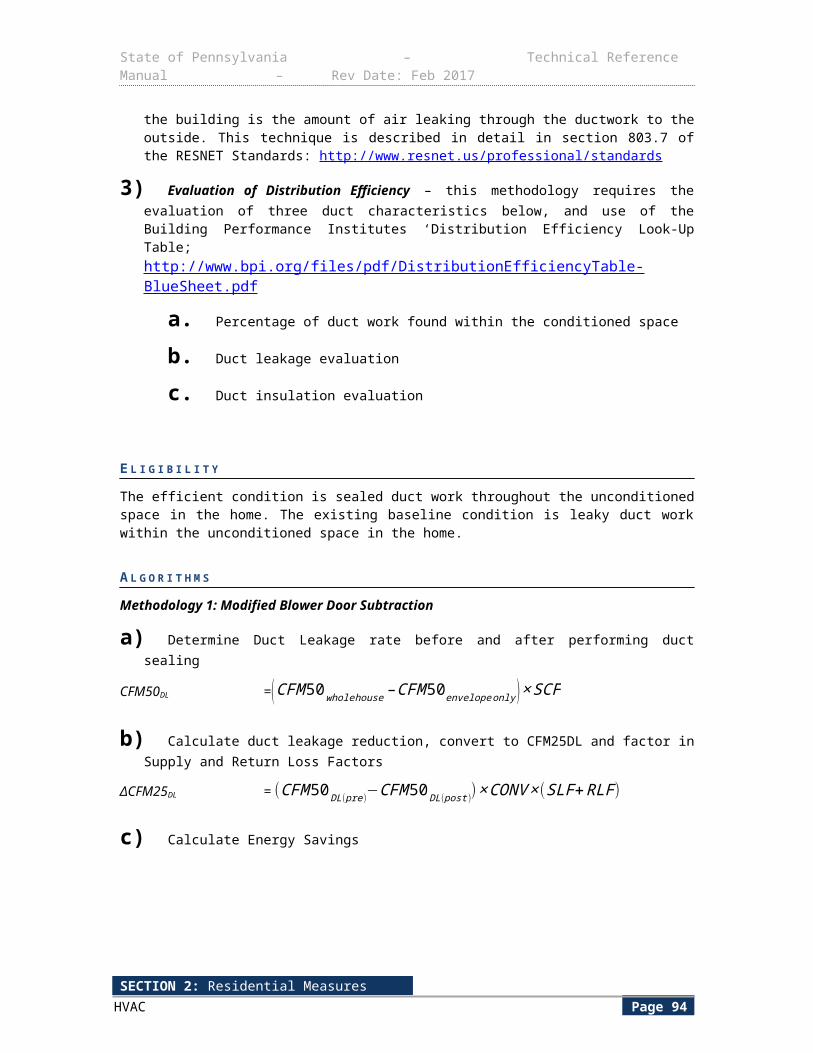
State of Pennsylvania – Technical Reference Manual – Rev Date: Feb 2017
The default fossil fuel consumption for the installation of a standard efficiency natural gas/ propane/oil water heater in place of a standard electric water heater is listed in Table 2-59 below.Table 2-59: Fuel Consumption for Fuel Switching, Domestic Hot Water Electric to Fossil Fuel
Fuel Type Energy Factor Fossil Fuel Consumption (MMBtu/yr)
Gas 0.67 14.47
Propane 0.67 14.47
Oil 0.585 16.57
Note: 1 MMBtu of propane is equivalent to 10.87 gals of propane, and 1 MMBtu of oil is equivalent to 7.19 gals of oil114.
E V A L U A T I O N P R O T O C O L S
The most appropriate evaluation protocol for this measure is verification of installation coupled with assignment of stipulated energy savings.
S O U R C E S
1) U.S. Federal Standards for Residential Water Heaters. Effective April 16, 2015. http://www1.eere.energy.gov/buildings/appliance_standards/product.aspx/productid/27
2) Commission Order115 requires fuel switching to ENERGY STAR measures, not standard efficiency measures. The Energy Factor has therefore been updated to reflect the EnergyStar standard for Gas Storage Water Heaters beginning September 1, 2010. From Residential Water Heaters Key Product Criteria. http://www.energystar.gov/index.cfm?c=water_heat.pr_crit_water_heaters Accessed June 2013
3) Federal Standards are 0.68 -0.0019 x Rated Storage in Gallons for oil-fired storage water heater. For a 50-gallon tank this 0.585. http://www1.eere.energy.gov/buildings/appliance_standards/product.aspx/productid/27
4) “Energy Conservation Program for Consumer Products: Test Procedure for Water Heaters”, Federal Register / Vol. 63, No. 90, p. 26005-26006.
5) Pennsylvania Statewide Residential End-Use and Saturation Study, 2014.
6) Mid-Atlantic TRM Version 3.0, March 2013, footnote #314
7) Straub, Mary and Switzer, Sheldon. "Using Available Information for Efficient Evaluation of Demand Side Management Programs". Study by BG&E. The Electricity Journal. Aug/Sept, 2011. http://www.sciencedirect.com/science/article/pii/S1040619011001941
114 DEER Effective Useful Life values, updated October 10, 2008.115 http://www.energystar.gov/ia/business/industry/industry_challenge/QuickConverter.xls
SECTION 2: Residential MeasuresDomestic Hot Water Page 98
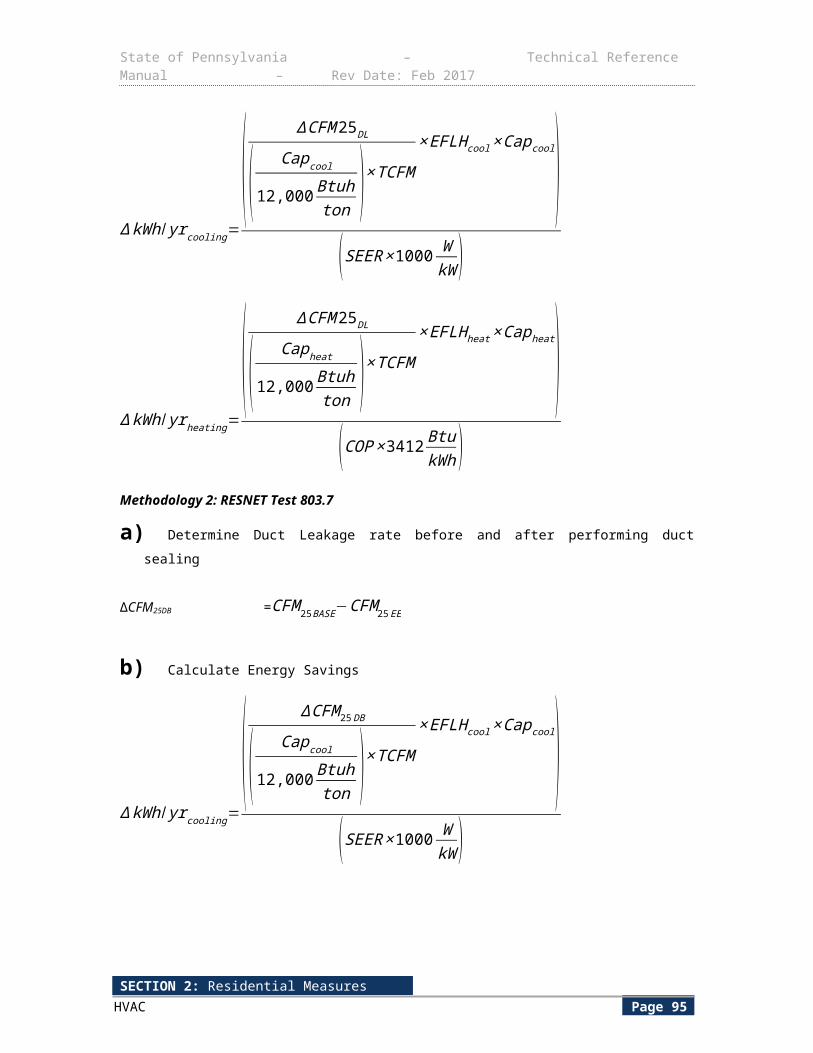
State of Pennsylvania – Technical Reference Manual – Rev Date: Feb 2017
2.3.4 FUEL SWITCHING: HEAT PUMP WATER HEATER TO FOSSIL FUEL WATER HEATER
Measure Name Fuel Switching: Heat Pump Water Heater to Fossil Fuel Heater
Target Sector Residential
Measure Unit Water Heater
Unit Energy Savings 1,632.9 kWh/yr (for EF = 2.0)
Unit Peak Demand Reduction 0.1314kW
Gas, Fossil Fuel Consumption Increase Gas: 14.47 MMBtu/yrPropane: 14.47 MMBtu/yr
Oil: 16.57 MMBtu/yr
Measure Life Gas:11 years116
Propane: 11 years117
Oil: 8 years118
Vintage Replace on Burnout
Switching to a natural gas, propane or oil water heater from a heat pump water heater reduces electric energy usage and peak demand.
E L I G I B I L I T Y
This protocol documents the energy savings attributed to converting from a standard heat pump water heater to an ENERGY STAR Version 3.0 natural gas or propane water heater and 0.585 for an oil water heater. If a customer submits a rebate for a product that has applied for ENERGY STAR Certification but has not yet been certified, the savings will be counted for that product contingent upon its eventual certification as an ENERGY STAR measure. If at any point the product is rejected by ENERGY STAR, the product is then ineligible for the program and savings will not be counted.
The target sector primarily consists of single-family residences.
A L G O R I T H M S
The energy savings calculation utilizes average performance data for available residential standard heat pump water heaters and fossil fuel-fired water heaters and typical water usage for residential homes. Because there is little electric energy associated with a fossil fuel-fired water heater, the energy savings are the full energy utilization of the heat pump water heater. The energy savings are obtained through the following formula:
kWh / yr={( 1EFHP,bl×FDerate )×(HW×365 days
yr×1 BTU
lb ∙° F×8.3 lb
gal× (T hot−T cold ))}
3412 BtukWh
+∆kWh / yrie , cool+∆kWh / yrie , heat
116 See page 42 of the 2013 TRC Test Final Order 117 DEER Effective Useful Life values, updated 2/5/2014. http://www.deeresources.com/files/DEER2013codeUpdate/download/DEER2014-EUL-table-update_2014-02-05.xlsx118 ibid.
SECTION 2: Residential MeasuresDomestic Hot Water Page 99
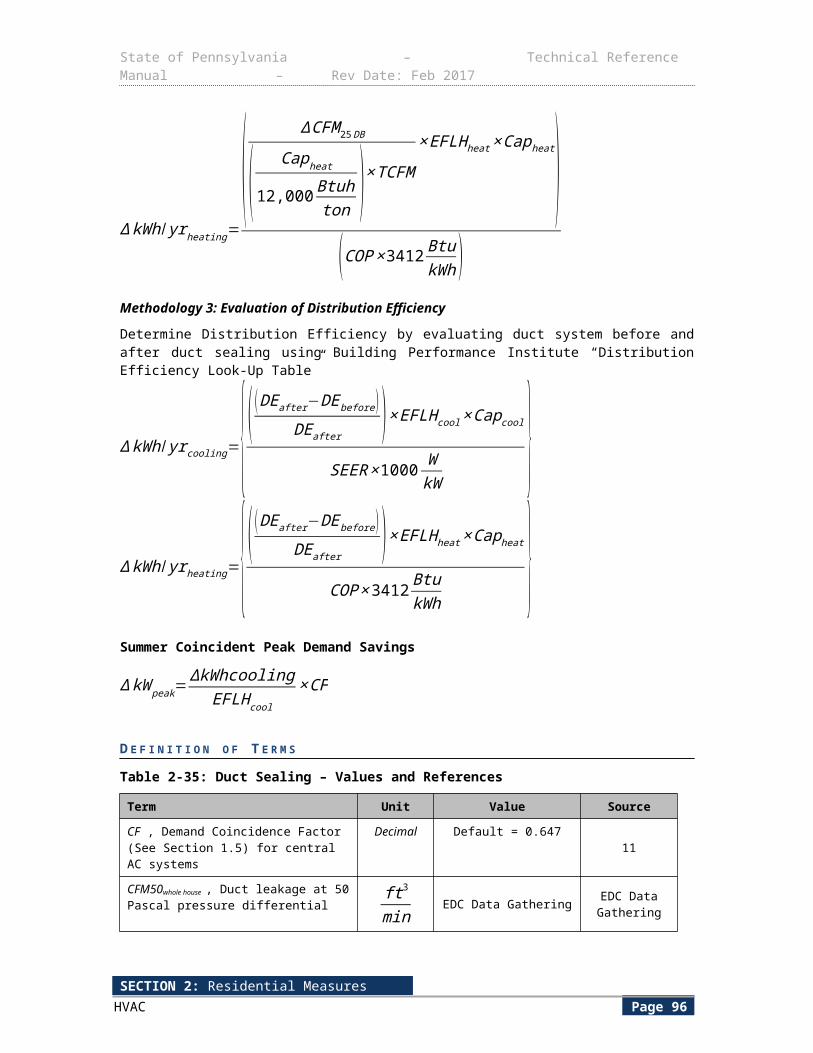
State of Pennsylvania – Technical Reference Manual – Rev Date: Feb 2017
Include below interactive effects calculations only when water heater is installed inside conditioned space with electric heating and cooling.
If either electric heating or cooling is absent, then the respective interactive effect will equal zero.
When installed outside of conditioned space, both interactive effects will equal zero and the appropriate Fderatein Table 2-63 will account for reduced performance due to cooler annual temperatures.
If installation location is unknown, use the ‘Default’ value for Fderate in Table 2-63 and both interactive effects will equal zero.
∆ kWh/ yr ie ,cool=HW×8.3 lbs
gal×1 Btu
lbs ∙℉ × (T hot−T cold )×EFLH cool
24 hrsday
×SEER×1000 WkW
∆ kWh/ yr ie ,heat=−[HW ×8.3 lbsgal
×1 Btulbs ∙℉ × (T hot−T cold )×EFLHheat
24 hrsday
×HSPF ×1000 WkW ]
Although there is a significant electric savings, there is an associated increase in fossil fuel energy consumption. While this fossil fuel consumption does not count against PA Act 129 energy savings, it is expected to be used in the program TRC test. The increased fossil fuel energy is obtained through the following formula:
Fuel Consumption (MMBtu /yr ) = {(1EFinstalled ) × (H W × 365 days
yr × 1 BTU
lb∙ ° F × 8.3 lb
gal × ( Thot -T cold ))}
1,000,000BtuMMBtu
Demand savings result from the removal of the connected load of the heat pump water heater. However, since the interactive effects during the heating season have no effect on the peak demand, the heating season interactive effects are subtracted from the total kWh savings before the ETDF is applied. The demand reduction is taken as the annual energy savings multiplied by the ratio of the average demand between 2 PM and 6 PM on summer weekdays to the total annual energy usage.
∆ kW peak =ETDF × (kWh / yr−∆ kWh/ yrie ,heat )
ETDF (Energy to Demand Factor) is defined below:
ETDF = Average DemandSummer WD 2PM- 6 PM
Annual Energy Usage
SECTION 2: Residential MeasuresDomestic Hot Water Page 100
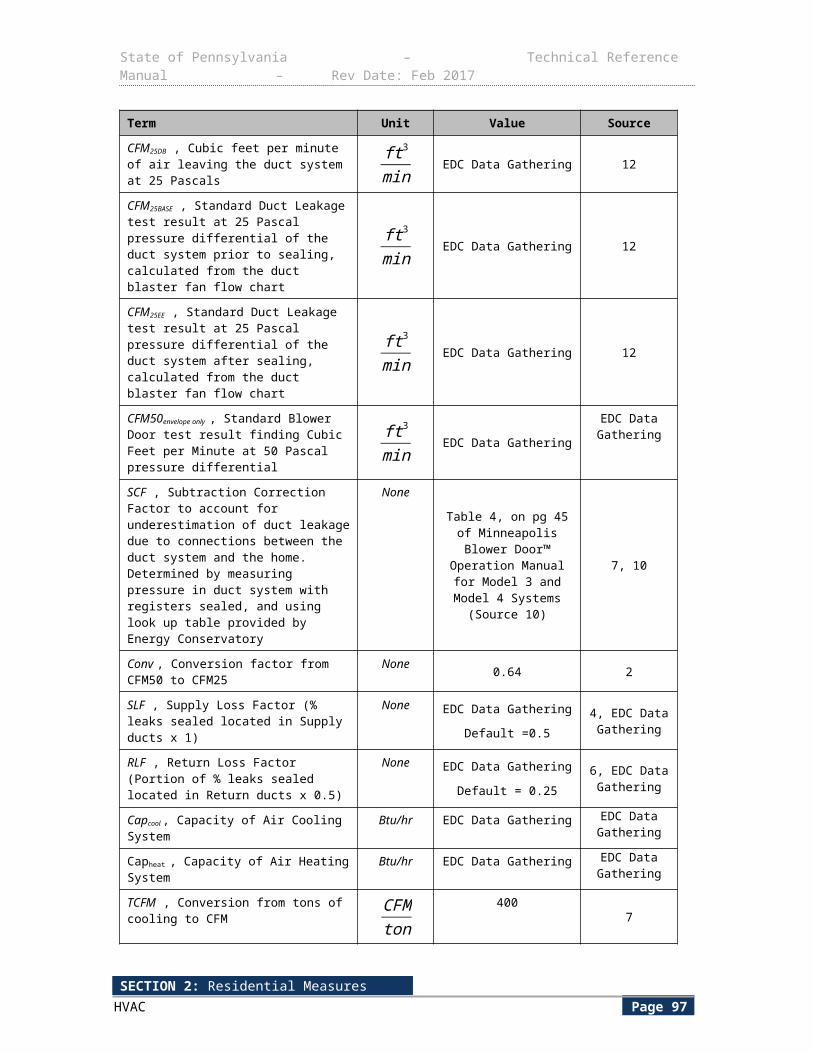
State of Pennsylvania – Technical Reference Manual – Rev Date: Feb 2017
The ratio of the average energy usage between 2 PM and 6 PM on summer weekdays to the total annual energy usage is taken from an electric water heater metering study performed by BG&E (pg 95 of Source 8).
D E F I N I T I O N O F T E R M S
The parameters in the above equation are listed in Table 2-60.
SECTION 2: Residential MeasuresDomestic Hot Water Page 101
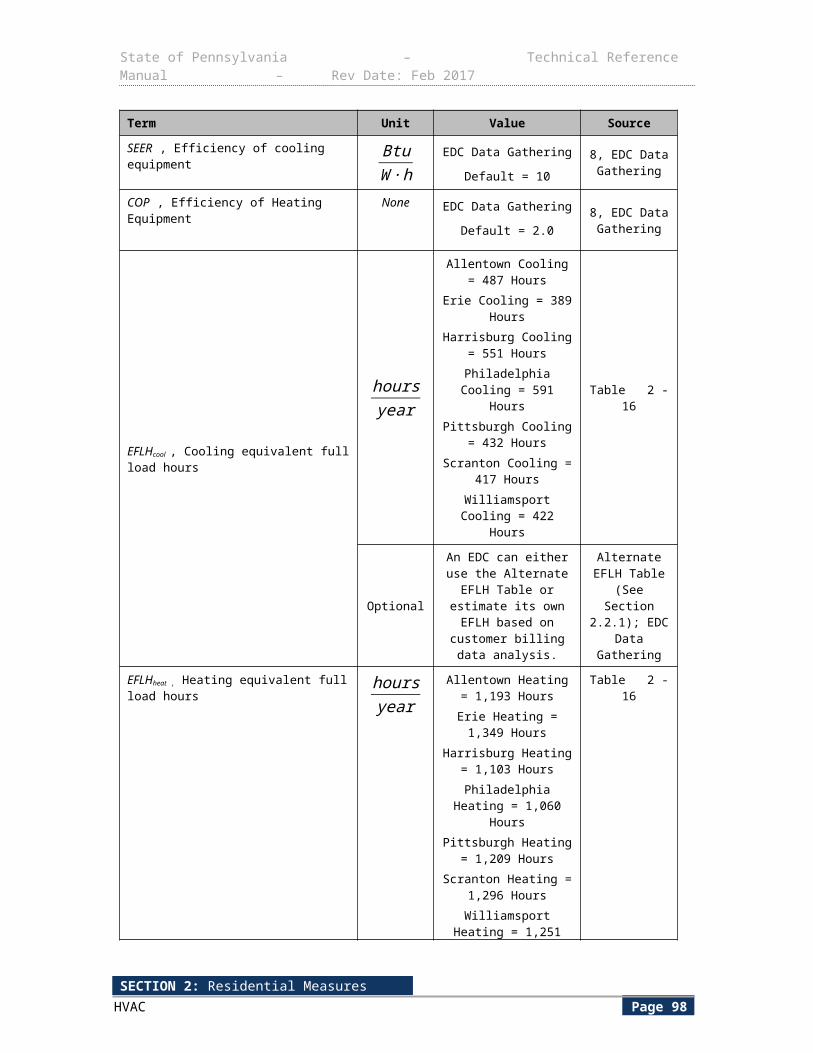
State of Pennsylvania – Technical Reference Manual – Rev Date: Feb 2017
Table 2-60: Calculation Assumptions for Heat Pump Water Heater to Fossil Fuel Water Heaters
Component Unit Values Source
EFHP,bl , Energy Factor of baseline heat pump water heater
Fraction Default = 2.0 or EDC Data Gathering
1
EFinstalled, NG . Energy Factor of installed natural gas water heater
Fraction EDC Data GatheringDefault:
≤55 Gallons= 0.67>55 Gallons= 0.77
2
EFinstalled, Propane , Energy Factor of installed propane water heater
Fraction EDC Data GatheringDefault:
≤55 Gallons= 0.67>55 Gallons= 0.77
2
EFinstalled,Tankless Water Heater , Energy Factor of installed tankless water heater
Fraction EDC Data gatheringDefault= 0.90
2
EFinstalled,Oil , Energy Factor of installed oil water heater
Fraction >=0.585 or EDC Data Gathering
3
HW , Hot water used per day in gallons gallonsday
50 4
Thot , Temperature of hot water °F 119 5
Tcold , Temperature of cold water supply °F 55 6
FDerate , COP De-rating factor Fraction Table 2-63 7, and discussion
below
EFLH cool , Equivalent Full Load Hours for cooling
hoursyr
Table 2-61 8
EFLH heat , Equivalent Full Load Hours for heating
hoursyr
Table 2-62 8
HSPF , Heating Seasonal Performance Factor BtuW ∙h
EDC Data GatheringDefault= 6.9
9
SEER , Seasonal Energy Efficiency Ratio BtuW ∙h
EDC Data GatheringDefault= 11
9
ETDF, Average Usage per Average Energy Usage
kWkWh / yr
0.00008047 10
SECTION 2: Residential MeasuresDomestic Hot Water Page 102
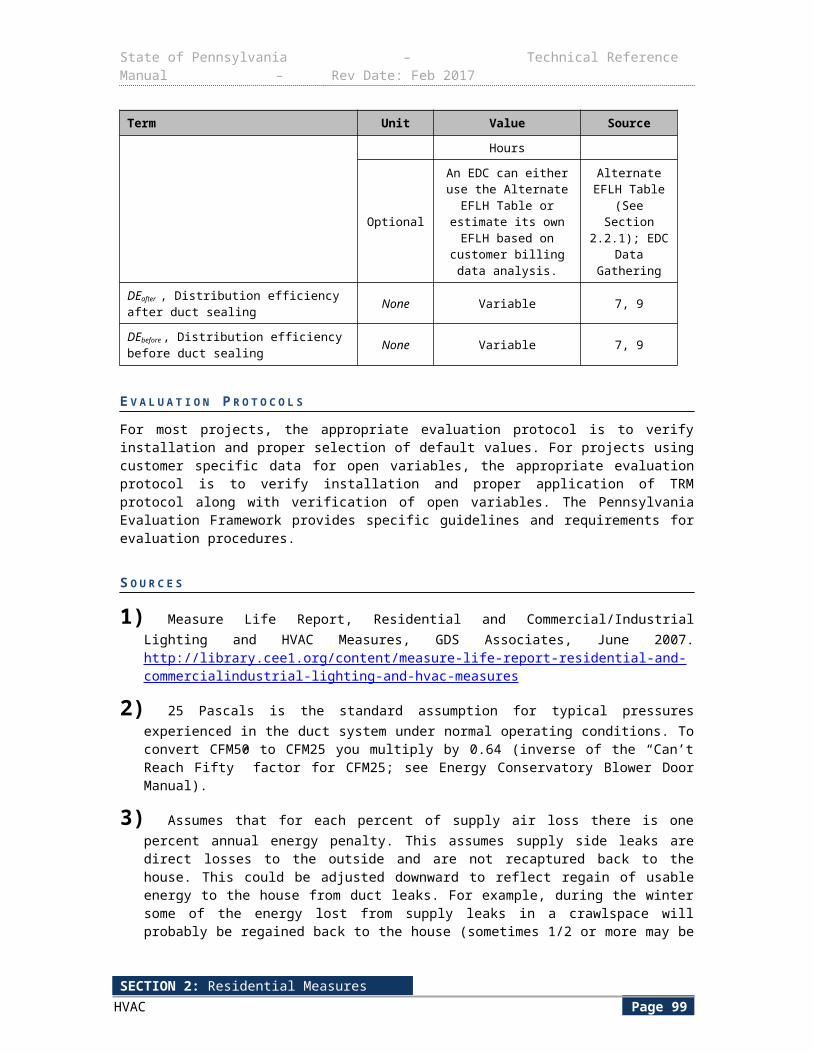
State of Pennsylvania – Technical Reference Manual – Rev Date: Feb 2017
Table 2-61: Equivalent Full Load Hours for Cooling Season
City EFLH cool
Allentown 487
Erie 389
Harrisburg 551
Philadelphia 591
Pittsburgh 432
Scranton 417
Williamsport 422
Table 2-62: Equivalent Full Load Hours for Heating Season
City EFLH heat
Allentown 1,193
Erie 1,349
Harrisburg 1,103
Philadelphia 1,060
Pittsburgh 1,209
Scranton 1,296
Williamsport 1,251
H E A T P U M P W A T E R H E A T E R E N E R G Y F A C T O R
The Energy Factors are determined from a DOE testing procedure that is carried out at 67.5 ˚F dry bulb and 56 °F wet bulb temperatures. However, the average dry and wet bulb temperatures in PA are in the range of 50-56˚F DB and 45-50 °F WB119. The heat pump performance is temperature and humidity dependent, therefore the location and type of installation is significant. To account for this, an EF de-rating factor (Fderate) has been adapted from a 2013 NEEA HPWH field study (Source 7). The results used are for “Heating Zone 1”, which is comprised of Olympia, WA and Portland, OR and have average dry and wet bulb temperatures (51˚F DB, 47˚F WB and 55˚F DB, 49˚F WB, respectively) 120 which is comparable to Pennsylvania.
Table 2-63: EF De-rating Factor for Various Installation Locations
Installation Location Fderate
Inside Conditioned Space 0.98
Unconditioned Garage 0.85
Unconditioned Basement 0.72
Default121 0.87
119 DEER Effective Useful Life values, updated October 10, 2008.120 Based on average weather data from weatherbase.com for the 7 Pennsylvania cities referenced elsewhere in this TRM (Allentown, Erie, Harrisburg, Philadelphia, Pittsburgh, Scranton, Williamsport). 121 Ibid
SECTION 2: Residential MeasuresDomestic Hot Water Page 103
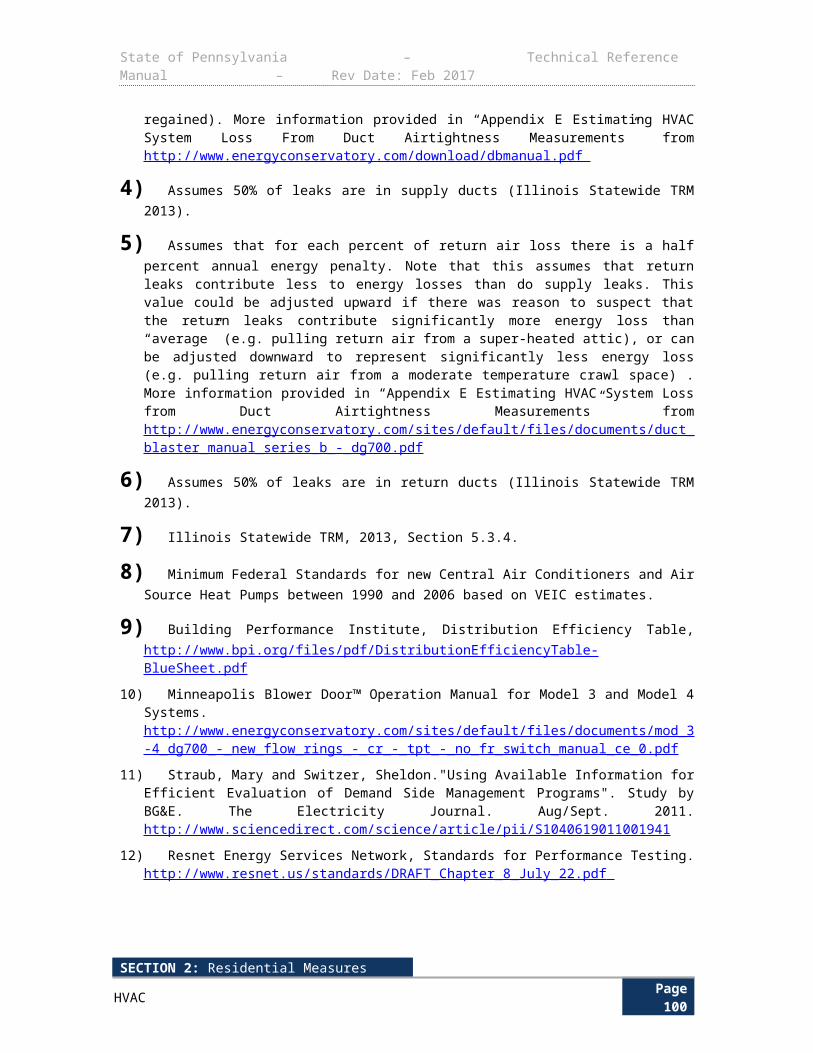
State of Pennsylvania – Technical Reference Manual – Rev Date: Feb 2017
D E F A U L T S A V I N G S
The savings for the installation of a fossil fuel water heater in place of a heat pump water heater not located inside conditioned space should be calculated using the partially deemed algorithm below.
∆ kWh/ yr=( 1EFHP,bl×FDerate )×(2841.27 kWhyr )
∆ kW peak=( 1EFHP , bl×F Derate )× (0.22864 kW )
The fossil fuel consumption should be calculated using the partially deemed algorithm below.
Fossil Fuel Consumption (MMBtu/yr) = ( 1EFNG, inst )×(9.694 MMBtuyr )
The default savings for the installation of a 50 gallon fossil fuel-fired water heater in place of a standard heat pump water heater in an unknown, default location are listed in Table 2-64 below.
Table 2-64: Energy Savings and Demand Reductions for Heat Pump Water Heater to Fossil Fuel Water Heater in Unknown Installation Location
Heat Pump unit Energy Factor Energy Savings (kWh) Demand Reduction (kW)
2.0 1632.9 0.1314
The default gas consumption for the installation of an ENERGY STAR natural gas, propane or oil water heater in place of a standard heat pump water heater is listed in Table 2-65 below.
Table 2-65: Gas, Oil, Propane Consumption for Heat Pump Water Heater to Fossil Fuel Water Heater
Fuel Type Energy Factor Gas Consumption (MMBtu/yr)
Gas 0.67 14.47
Propane 0.67 14.47
Oil 0.585 16.57
E V A L U A T I O N P R O T O C O L S
The most appropriate evaluation protocol for this measure is verification of installation coupled with assignment of stipulated energy savings.
S O U R C E S
1) Heat pump water heater efficiencies have not been set in a Federal Standard. However, the Federal Standard for water heaters does refer to a baseline efficiency for heat pump water heaters as EF = 2.0 “Energy Conservation Program: Energy Conservation Standards for Residential Water Heaters, Direct Heating Equipment, and Pool Heaters” US Dept of Energy Docket Number: EE–2006–BT-STD–0129.
2) Commission Order122 requires fuel switching to ENERGY STAR measures, not standard efficiency measures. The Energy Factor has therefore been updated to reflect the EnergyStar
122 Calculated by dividing the COP in each location from Figure 15 by the rated Energy Factor (2.35) of the unit tested in the study (AirGenerate ATI66 ).
SECTION 2: Residential MeasuresDomestic Hot Water Page 104

State of Pennsylvania – Technical Reference Manual – Rev Date: Feb 2017
standard for Gas Storage Water Heaters beginning September 1, 2010. From Residential Water Heaters Key Product Criteria. http://www.energystar.gov/index.cfm?c=water_heat.pr_crit_water_heaters Accessed June 2013 Federal Standards are 0.67 -0.0019 x Rated Storage in Gallons. Federal Standards are 0.67 -0.0019 x Rated Storage in Gallons. For a 40-gallon tank this is 0.594. “Energy Conservation Program: Energy Conservation Standards for Residential Water Heaters, Direct Heating Equipment, and Pool Heaters” US Dept of Energy Docket Number: EE–2006–BT-STD–0129, p. 30
3) Federal Standards are 0.68 -0.0019 x Rated Storage in Gallons for oil-fired storage water heater. For a 50-gallon tank this 0.585. http://www1.eere.energy.gov/buildings/appliance_standards/product.aspx/productid/27
4) “Energy Conservation Program for Consumer Products: Test Procedure for Water Heaters”, Federal Register / Vol. 63, No. 90, p. 26005-26006.
5) Pennsylvania Statewide Residential End-Use and Saturation Study, 2014.
6) Mid-Atlantic TRM Version 3.0, March 2013, footnote #314
7) NEEA Heat Pump Water Heater Field Study Report. Prepared by Fluid Market Strategies, 2013. http://neea.org/docs/default-source/reports/heat-pump-water-heater-field-study-report.pdf?sfvrsn=5 (Note: when this source discusses “ducted” vs “non-ducted” systems it refers to the water heater’s heat pump exhaust, not to the HVAC ducts.)
8) Based on REM/Rate modeling using models from the PA 2012 Potential Study. EFLH calculated from kWh consumption for cooling and heating. Models assume 50% over-sizing of air conditioners123 and 40% oversizing of heat pumps.124
9) 2014 Pennsylvania Residential Baseline Study. Presented to the PUC by GDS Associates. Consistent with Sections 2.2.1 Electric HVAC.
10) Straub, Mary and Switzer, Sheldon. "Using Available Information for Efficient Evaluation of Demand Side Management Programs". Study by BG&E. The Electricity Journal, Aug/Sept. 2011. http://www.sciencedirect.com/science/article/pii/S1040619011001941
123 Weighted average of values in Table 107 for water heater locations for all space heating fuel types. Northwest Energy Efficiency Alliance 2011 Residential Building Stock Assessment: Single-Family Characteristics and Energy Use. Published September 18, 2012. Online at http://neea.org/docs/reports/residential-building-stock-assessment-single-family-characteristics-and-energy-use.pdf?sfvrsn=8124
SECTION 2: Residential MeasuresDomestic Hot Water Page 105
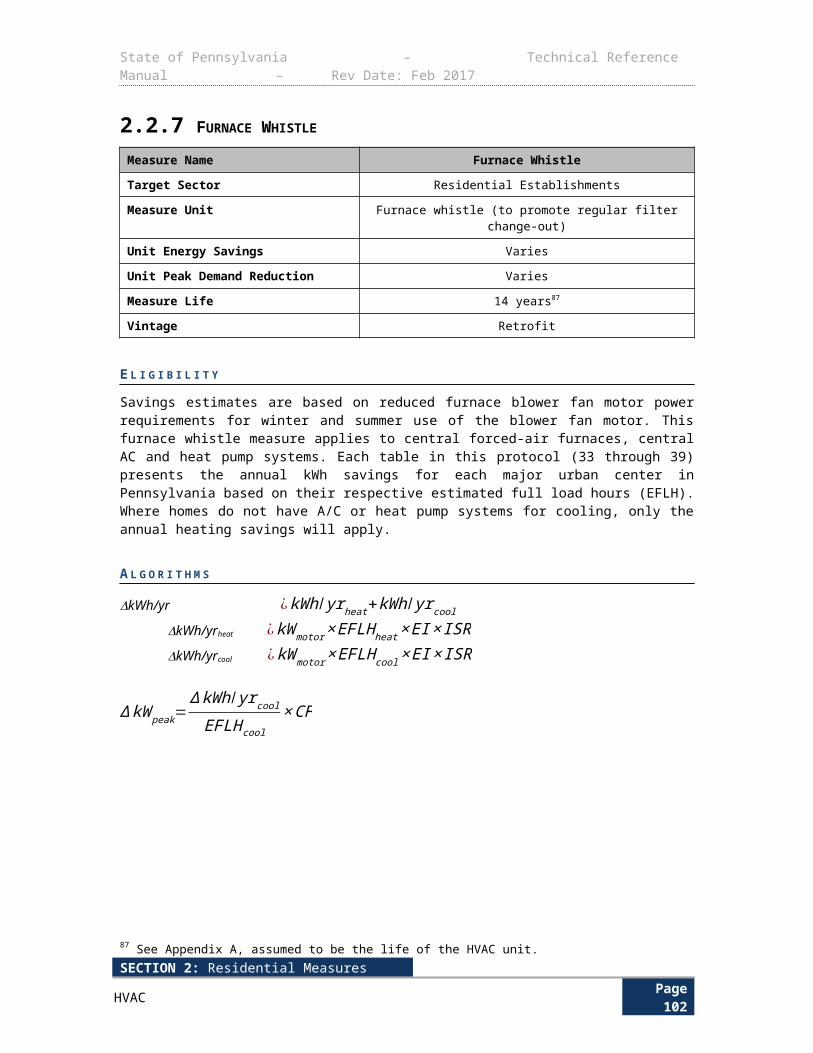
State of Pennsylvania – Technical Reference Manual – Rev Date: Feb 2017
2.3.5 WATER HEATER TANK WRAP Measure Name Water Heater Tank Wrap
Target Sector Residential
Measure Unit Tank
Unit Energy Savings Varies
Unit Peak Demand Reduction Varies
Measure Life 7 years125
Vintage Retrofit
This measure applies to the installation of an insulated tank wrap or “blanket” to existing residential electric hot water heaters.
The base case for this measure is a standard residential, tank-style, electric water heater with no external insulation wrap.
E L I G I B I L I T Y This measure documents the energy savings attributed to installing an insulating tank wrap on an existing electric resistance water heater. The target sector is residential.
A L G O R I T H M S
The annual energy savings for this measure are assumed to be dependent upon decreases in the overall heat transfer coefficient that are achieved by increasing the total R-value of the tank insulation.
∆ kWh/ yr ¿(Ubase× Abase−U insul× A insul )×(T setpoint−T ambient)
3412×ηElec×HOU
ΔkWpeak ¿ ∆kWhHOU
×CF
D E F I N I T I O N O F T E R M S The U.S. Department of Energy recommends adding a water heater wrap of at least R-8 to any water heater with an existing R-value less than R-24.126 The default inputs for the savings algorithms are given in Table 2-66. Actual tank and blanket U-values can be used in the above algorithms as long as make/model numbers of the tank and blanket are recorded and tracked by the EDC.
125 Neme, Proctor, Nadal, “National Energy Savings Potential From Addressing Residential HVAC Installation Problems. ACEEE, February 1, 1999. Confirmed also by Central Air Conditioning in Wisconsin, a compilation of recent field research. Energy Center of Wisconsin. May 2008, emended December 15, 2010126 ACCA, “Verifying ACCA Manual S Procedures,” http://www.acca.org/wp-content/uploads/2014/11/Manual-S-Brochure-Final-1.pdf
SECTION 2: Residential MeasuresDomestic Hot Water Page 106
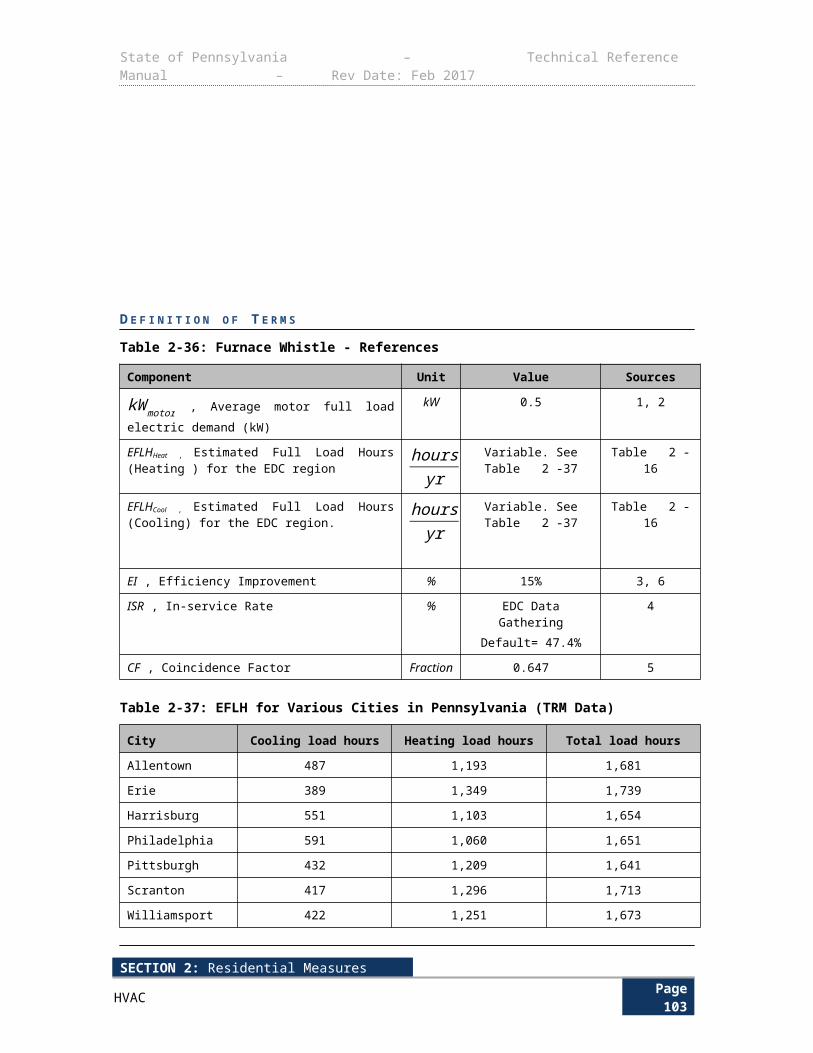
State of Pennsylvania – Technical Reference Manual – Rev Date: Feb 2017
Table 2-66: Water Heater Tank Wrap – Default Values
Component Unit Value Source
Rbase , R-value is a measure of resistance to heat flow and is equal to 1/Ubase
Hr ∙F ∙ ft2
BtuDefault: 8.3 or EDC
Data Gathering 1
Rinsul , R-value is a measure of resistance to heat flow and is equal to 1/Uinsul
Hr ∙℉ ∙ ft2
BtuDefault: 20 or EDC
Data Gathering 2
Ubase , Overall heat transfer coefficient of water heater prior to adding tank wrap
BtuHr ∙℉ ∙ ft2 =1/Rbase
Uinsul , Overall heat transfer coefficient of water heater after addition of tank wrap
BtuHr ∙℉ ∙ ft2 =1/Rinsul
Abase , Surface area of storage tank prior to adding tank wrap
ft2See Table 2-67
Ainsul , Surface area of storage tank after addition of tank wrap ft2 See Table 2-67
ηElec , Thermal efficiency of electric heater element None 0.98 3
Tsetpoint , Temperature of hot water in tank ˚F 119 5
Tambient , Temperature of ambient air ˚F 70 5
HOU , Annual hours of use for water heater tank Hours 8760 4
CF , Demand Coincidence Factor Decimal 1.0 4
Table 2-67: Deemed savings by water heater capacity
Capacity (gal) Rbase Rinsul Abase (ft2)127 Ainsul (ft2)128 ΔkWh ΔkW
30 8 16 19.16 20.94 139.4 0.0159
30 10 18 19.16 20.94 96.6 0.0110
30 12 20 19.16 20.94 70.6 0.0081
30 8 18 19.16 20.94 158.1 0.0180
30 10 20 19.16 20.94 111.6 0.0127
30 12 22 19.16 20.94 82.8 0.0094
40 8 16 23.18 25.31 168.9 0.0193
40 10 18 23.18 25.31 117.1 0.0134
40 12 20 23.18 25.31 85.5 0.0098
40 8 18 23.18 25.31 191.5 0.0219
40 10 20 23.18 25.31 135.1 0.0154
40 12 22 23.18 25.31 100.3 0.0114
127 DEER measure lives, updated 2/5/2014. http://www.deeresources.com/files/DEER2013codeUpdate/download/DEER2014-EUL-table-update_2014-02-05.xlsx128 “Energy Savers”, U.S. Department of Energy, accessed November, 2010 http://www.energysavers.gov/your_home/water_heating/index.cfm/mytopic=13070
SECTION 2: Residential MeasuresDomestic Hot Water Page 107
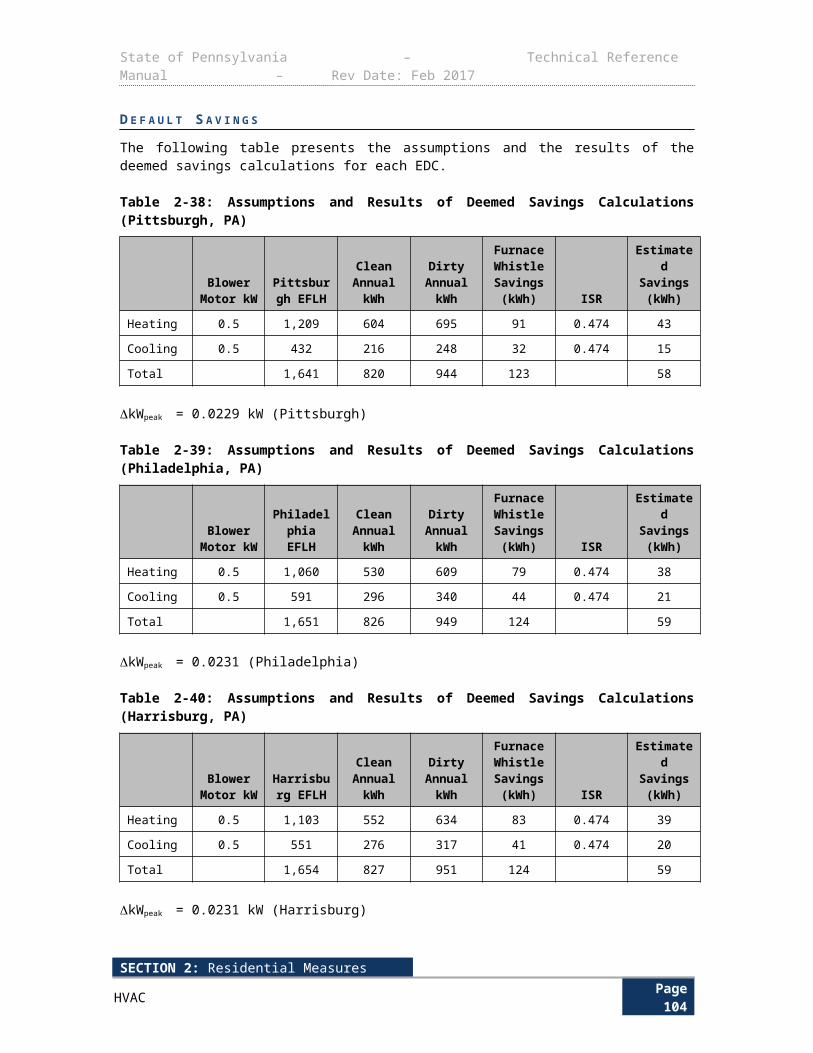
State of Pennsylvania – Technical Reference Manual – Rev Date: Feb 2017
Capacity (gal) Rbase Rinsul Abase (ft2) Ainsul (ft2) ΔkWh ΔkW
50 8 16 24.99 27.06 183.9 0.0210
50 10 18 24.99 27.06 127.8 0.0146
50 12 20 24.99 27.06 93.6 0.0107
50 8 18 24.99 27.06 208.0 0.0237
50 10 20 24.99 27.06 147.1 0.0168
50 12 22 24.99 27.06 109.4 0.0125
80 8 16 31.84 34.14 237.0 0.0271
80 10 18 31.84 34.14 165.3 0.0189
80 12 20 31.84 34.14 121.5 0.0139
80 8 18 31.84 34.14 267.4 0.0305
80 10 20 31.84 34.14 189.6 0.0216
80 12 22 31.84 34.14 141.4 0.0161
E V A L U A T I O N P R O T O C O L S
For most projects, the appropriate evaluation protocol is to verify installation and proper selection of default values. For projects using customer specific data for open variables, the appropriate evaluation protocol is to verify installation and proper application of TRM protocol along with verification of open variables. The Pennsylvania Evaluation Framework provides specific guidelines and requirements for evaluation procedures.
S O U R C E S
1) Results and Methodology of the Engineering Analysis for Residential Water Heater Efficiency Standards, PNNL, 1998.
2) The water heater wrap is assumed to be a fiberglass blanket with R-8, increasing the total to R-20.
3) AHRI Directory. All electric storage water heaters have a recovery efficiency of .98. https://www.ahridirectory.org/ahridirectory/pages/rwh/defaultSearch.aspx
4) It is assumed that the tank wrap will insulate the tank during all hours of the year.
5) 2014 Residential SWE Baseline Study. GDS Associates.
SECTION 2: Residential MeasuresDomestic Hot Water Page 108
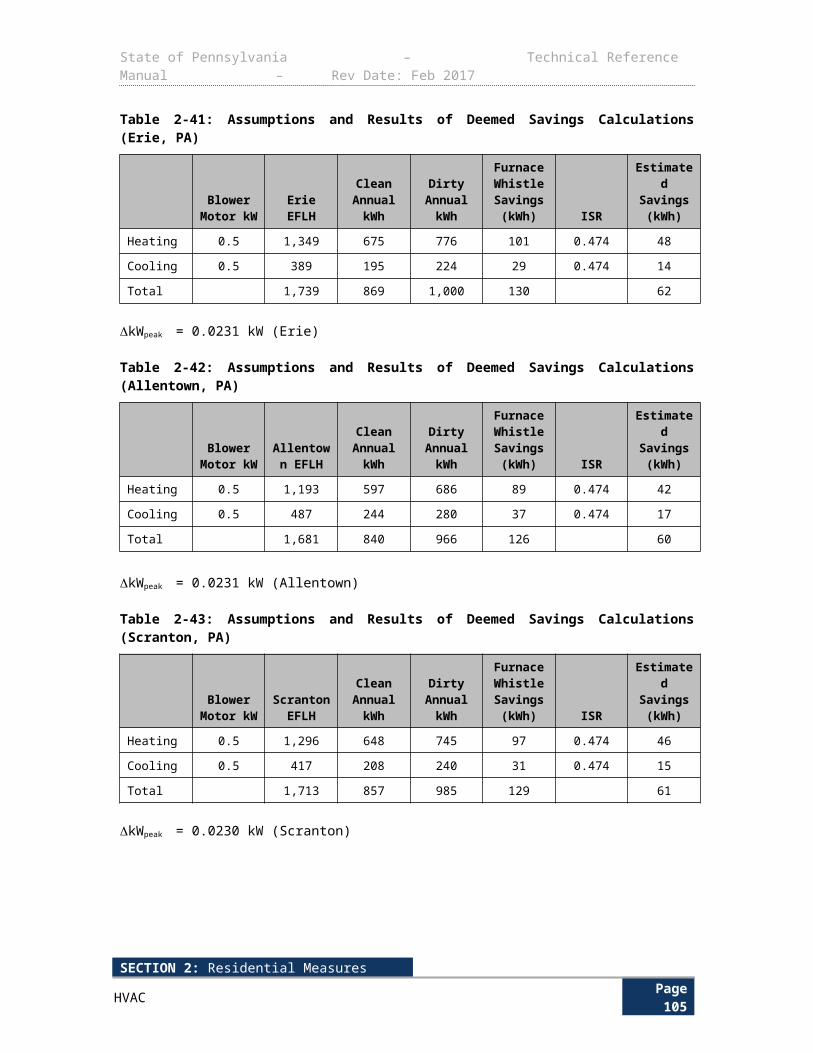
State of Pennsylvania – Technical Reference Manual – Rev Date: Feb 2017
2.3.6 WATER HEATER TEMPERATURE SETBACK
Measure Name Water Heater Temperature Setback
Target Sector Residential Establishments
Measure Unit Water Heater Temperature
Unit Energy Savings Varies
Unit Peak Demand Reduction Varies
Measure Life 4 years129
Vintage Retrofit
In homes where the water heater setpoint temperature is set high, savings can be achieved by lowering the setpoint temperature. The recommended lower setpoint is 120˚F, but EDCs may substitute another if needed. Savings occur only when the lower temperature of the hot water does not require the use of more hot water. Savings do not occur in applications such as a shower or faucet where the user adjusts the hot water flow to make up for the lower temperature. Clothes washer hot water use and water heater tank losses are included in the savings calculation, but shower, faucet, and dishwasher use are not included due to expected behavioral and automatic (dishwasher) adjustments in response to lower water temperature. It is expected that the net energy use for the dish washer hot water will remain the same after a temperature reduction because dishwashers will adjust hot water temperature to necessary levels using internal heating elements.
E L I G I B I L I T Y
This protocol documents the energy savings attributed to reducing the electric or heat pump water heater temperature setpoint. The target sector primarily consists of single-family residences.
A L G O R I T H M S
The annual energy savings calculation utilizes average performance data for available residential water heaters and typical water usage for residential homes. The energy savings are obtained through the following formula, where the first term corresponds to tank loss savings and the second to clothes washer savings:
∆ kWh/ yr=A tank× (T hoti−Thot f )×8760 hrs
yr
Rtank×ηelec×3412 BtukWh
+V HW×(8.3 lb
gal )×(365 daysyr )×(1 Btu
˚ F ∙lb )× (T hot i−T hot f )
(3412 BtukWh)×EFWH
Demand savings result from reduced hours of operation of the heating element, rather than a reduced connected load. The demand reduction is taken as the annual energy savings multiplied by the ratio of the average demand between2 PM and 6 PM on summer weekdays to the total annual energy usage.
kWpeak = ETDF×∆kWh / yr
ETDF (Energy to Demand Factor) is defined below:
129 Area values were calculated from average dimensions of several commercially available units, with radius values measured to the center of the insulation. Area includes tank sides and top to account for typical wrap coverage.
SECTION 2: Residential MeasuresDomestic Hot Water Page 109
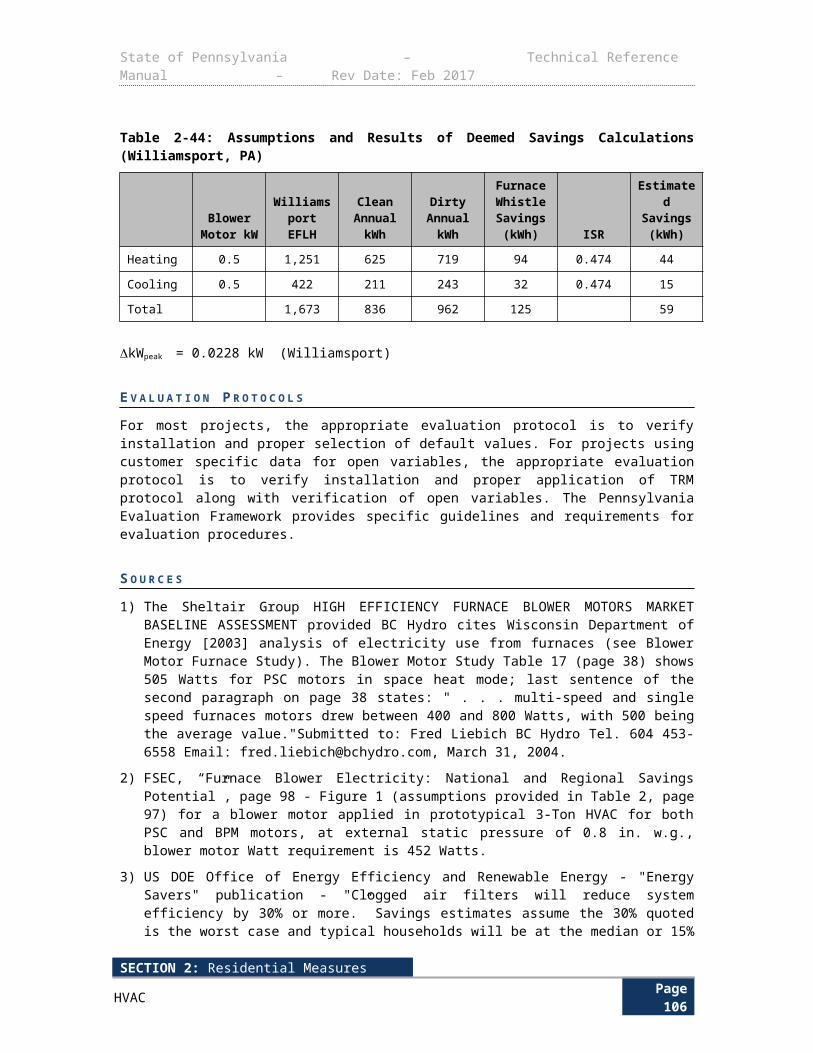
State of Pennsylvania – Technical Reference Manual – Rev Date: Feb 2017
ETDF = Average DemandSummer WD 2PM- 6 PM
Annual Energy Usage
The ratio of the average demand between 2 PM and 6 PM on summer weekdays to the total annual energy usage is taken from an electric water heater metering study performed by BG&E (pg 95 of Source 2).
D E F I N I T I O N O F T E R M S
The parameters in the above equation are listed in Table 2-68 below.
Table 2-68: Water Heater Temperature Setback Assumptions
Component Unit Values Source
EFWH , Energy Factor of water heater Fraction EDC data collectionDefault:
Electric Storage= 0.904HPWH= 2.0
1
Rtank , R value of water heater tank, hr ∙℉ ∙ ft2
BtuEDC Data Gathering
Default: 8.3130
Atank , Surface Area of water heater tank,ft2 EDC Data Gathering
Default: 24.99
50 gal. value in
Table 2-69
ηelec , Thermal efficiency of electric heater element (equiv. to COP for HPWH)
Decimal Electric Storage: 0.98HPWH: 2.1
2, 3
V HW , Volume of hot water used per day by clothes washer, in gallons
gallons/day 7.32 4, 5, 6, 7
Thot_i , Temperature setpoint of water heater initially
°F EDC Data Gathering
Default: 130
8
Thot_f , Temperature setpoint water heater after setback
°F EDC data collectionDefault: 119
9
ETDF , Energy To Demand Factor (defined above)
kWkWh / yr
0.00008047 10
D E F A U L T S A V I N G S
The energy savings and demand reductions are prescriptive according to the above formulae. However, some values for common configurations are provided in below.
130 Ainsul was calculated by assuming that the water heater wrap is a 2” thick fiberglass material.
SECTION 2: Residential MeasuresDomestic Hot Water Page 110
State of Pennsylvania – Technical Reference Manual – Rev Date: Feb 2017
Table 2-69: Default Energy Savings and Demand Reductions
TypeTank Size (gallons) Rtank Atank
T hot i−T hot f (˚F) ηelec EFWH
Energy Savings (∆ kWh/ yr )
Demand Reductio
n (∆ KW peak ¿
Electric Storage 50 8.3 24.99 130-119 0.98 0.904 165.9 0.0133
HPWH 50 8.3 24.99 130-119 2.1 2.0 76.2 0.0061
E V A L U A T I O N P R O T O C O L S
The most appropriate evaluation protocol for this measure is verification of water heater temperature setpoint coupled with assignment of stipulated energy savings.
S O U R C E S
1) Previous Federal Standards from 2004-2015 are 0.97 -0.00132 x Rated Storage in Gallons. For a 50-gallon tank this is 0.904. “Energy Conservation Program: Energy Conservation Standards for Residential Water Heaters, Direct Heating Equipment, and Pool Heaters” US Dept of Energy Docket Number: EE–2006–BT-STD–0129, p. 30. The previous, long-standing requirements are used since this is a Retrofit measure applied to existing equipment, not new equipment.
2) AHRI Directory. All electric storage water heaters have a recovery efficiency of .98. https://www.ahridirectory.org/ahridirectory/pages/rwh/defaultSearch.aspx
3) NEEA Heat Pump Water Heater Field Study Report. Prepared by Fluid Market Strategies. October 22, 2013. http://neea.org/docs/default-source/reports/heat-pump-water-heater-field-study-report.pdf?sfvrsn=5
4) Daily Usage based on AWWA Research Foundation, 1998, Residential End Uses of Water, found in EPA's Water Sense guide: http://www.epa.gov/WaterSense/docs/home_suppstat508.pdf Clothes washer hot water use per capita per day adjusted for current water use per load and using PA Census Data. Hot water comprises 28% of total water in clothes washer load.Federal minimum Water Factor standards (9.5) and Energy Star minimum Water Factor standards (6.0) for clothes washers, Section 2.26, “Energy Star Clothes Washers”.
5) Average capacity of base (3.19 cu. ft.) and energy efficient (3.64 cu. ft.) clothes washers, Table 2-115, Section 2.26.
6) Households with Energy Star Clothes Washers 2009 (36%), “Energy Star Product Retrospective: Clothes Washers”, 2012. Used to determine current weighted average gallons per load (27.3 gal)
7) 2007-2011 U.S. Census Data for Pennsylvania (2.47 persons per household average).
8) Engineering assumption
9) Pennsylvania Statewide Residential End-Use and Saturation Study, 2014.
10) Straub, Mary and Switzer, Sheldon. "Using Available Information for Efficient Evaluation of Demand Side Management Programs". Study by BG&E. The Electricity Journal, Aug/Sept. 2011.
SECTION 2: Residential MeasuresDomestic Hot Water Page 111
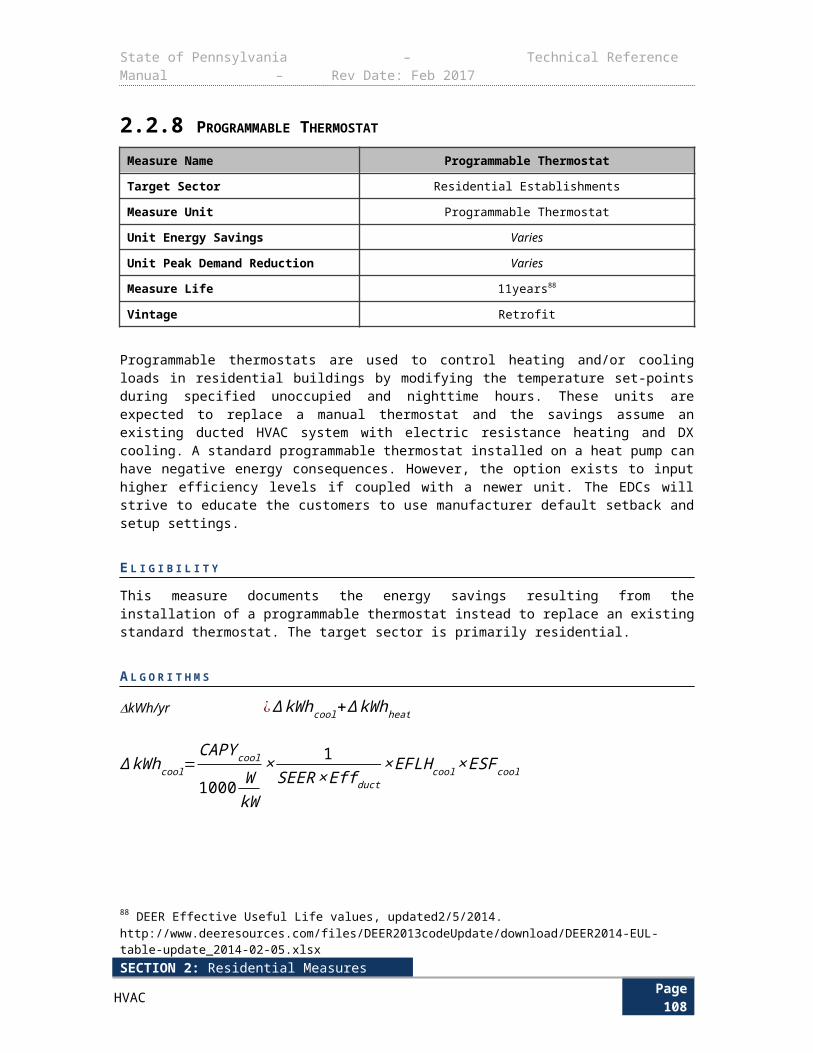
State of Pennsylvania – Technical Reference Manual – Rev Date: Feb 2017
2.3.7 WATER HEATER PIPE INSULATION
Measure Name Electric Water Heater Pipe Insulation
Target Sector Residential Establishments
Measure Unit Water Heater
Unit Energy Savings 9.43 kWh per foot of installed insulation
Unit Peak Demand Reduction 0.000759 kW per foot of installed insulation
Measure Life 13 years131
Vintage Retrofit
This measure relates to the installation of foam insulation on exposed pipe in unconditioned space, ¾” thick. The baseline for this measure is a standard efficiency 50 gallon electric water heater (EF=0.904) with an annual energy usage of 3143 kWh. 132
E L I G I B I L I T Y
This protocol documents the energy savings for an electric water heater attributable to insulating exposed pipe in unconditioned space, ¾” thick. The target sector primarily consists of residential establishments.
A L G O R I T H M S
The annual energy savings are assumed to be 3% of the annual energy use of an electric water heater (3143kWh), or 94.29 kWh based on 10 feet of insulation. This estimate is based on a recent report prepared by the ACEEE for the State of Pennsylvania (Source 1). On a per foot basis, this is equivalent to 9.43 kWh.
ΔkWh/yr = 9.43 kWh/yr per foot of installed insulation
The summer coincident peak kW savings are calculated as follows:
ΔkWpeak = ΔkWh×ETDF
D E F I N I T I O N O F T E R M S
Term Unit Value Source
ΔkWh/yr , annual energy savings per foot of installed pipe insulation
kWh / yrft
9.43 1
ETDF, Energy to Demand Factor kWkWh / yr
0.00008047 2
131 GDS Associates, Inc., Measure Life Report Prepared for The New England State program Working Group (SPWG), June 2007, http://library.cee1.org/content/measure-life-report-residential-and-commercialindustrial-lighting-and-hvac-measures132 Results and Methodology of the Engineering Analysis for Residential Water Heater Efficiency Standards, PNNL, 1998
SECTION 2: Residential MeasuresDomestic Hot Water Page 112
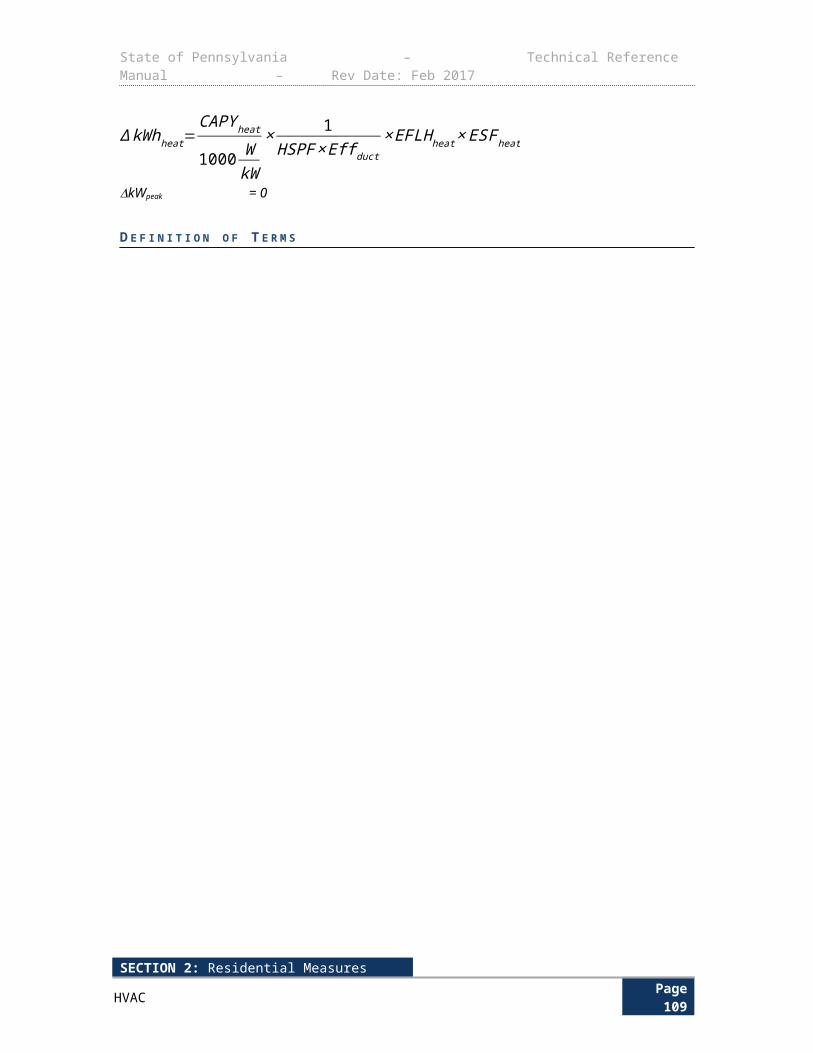
State of Pennsylvania – Technical Reference Manual – Rev Date: Feb 2017
Term Unit Value Source
ΔkWpeak , Summer peak kW savings per foot of installed pipe insulation
kWft
0.000759
The demand reduction is taken as the annual energy savings multiplied by the ratio of the average energy usage during 2 PM to 6 PM on summer weekdays to the total annual energy usage. The Energy to Demand Factor is defined as:
ETDF = Average DemandSummer WD 2PM-6PM
Annual Energy Usage
The ratio of the average energy usage between 2 PM to 6 PM on summer weekdays to the total annual energy usage is taken from an electric water heater metering study performed by BG&E (pg 95 of Source 2).
E V A L U A T I O N P R O T O C O L S
The most appropriate evaluation protocol for this measure is verification of installation coupled with assignment of stipulated energy savings.
S O U R C E S
1) American Council for an Energy-Efficient Economy, Summit Blue Consulting, Vermont Energy Investment Corporation, ICF International, and Synapse Energy Economics, Potential for Energy Efficiency, Demand Response, and Onsite Solar Energy in Pennsylvania, Report Number E093, April 2009, p. 117.
2) Straub, Mary and Switzer, Sheldon. "Using Available Information for Efficient Evaluation of Demand Side Management Programs". Study by BG&E. The Electricity Journal. Aug/Sept. 2011.
SECTION 2: Residential MeasuresDomestic Hot Water Page 113

State of Pennsylvania – Technical Reference Manual – Rev Date: Feb 2017
2.3.8 LOW FLOW FAUCET AERATORS
Measure Name Low Flow Faucet Aerators
Target Sector Residential Establishments
Measure Unit Aerator
Unit Energy Savings Varies by installation location
Unit Peak Demand Reduction Varies by installation location
Measure Life 10 years133
Vintage Retrofit
Installation of low-flow faucet aerators is an inexpensive and lasting approach for water conservation. These efficient aerators reduce water consumption and consequently reduce hot water usage and save energy associated with heating the water. This protocol presents the assumptions, analysis and savings from replacing standard flow aerators with low-flow aerators in kitchens and bathrooms.
The low-flow kitchen and bathroom aerators will save on the electric energy usage due to the reduced demand of hot water. The maximum flow rate of qualifying kitchen and bathroom aerators is 1.5 gallons per minute.
E L I G I B I L I T Y
This protocol documents the energy savings attributable to efficient low flow aerators in residential applications. The savings claimed for this measure are attainable in homes with standard resistive water heaters. Homes with non-electric water heaters do not qualify for this measure.
A L G O R I T H M S
The energy savings and demand reduction are obtained through the following calculations:
∆ kWh/ yr
¿ ISR×ELEC ×[ (GPM base−GPM low )×T person /day×N persons×365 daysyr
×DF× (T out−T ¿)×8.3 Btugal ∙℉
¿faucets×3412 BtukWh
×ℜ ]∆ kW peak=∆kWh/ yr ×ETDFWhere:
ETDF= CFHOU
CF=%faucet use , peak×T person /day×N persons
¿ faucets×240 minutesdaily peak
133 Efficiency Vermont, Technical Reference User Manual: Measure Savings Algorithms and Cost Assumptions, TRM User Manual No. 2008-53, 07/18/08, http://www.veic.org/docs/ResourceLibrary/TRM-User-Manual-Excerpts.pdf.
SECTION 2: Residential MeasuresDomestic Hot Water Page 114
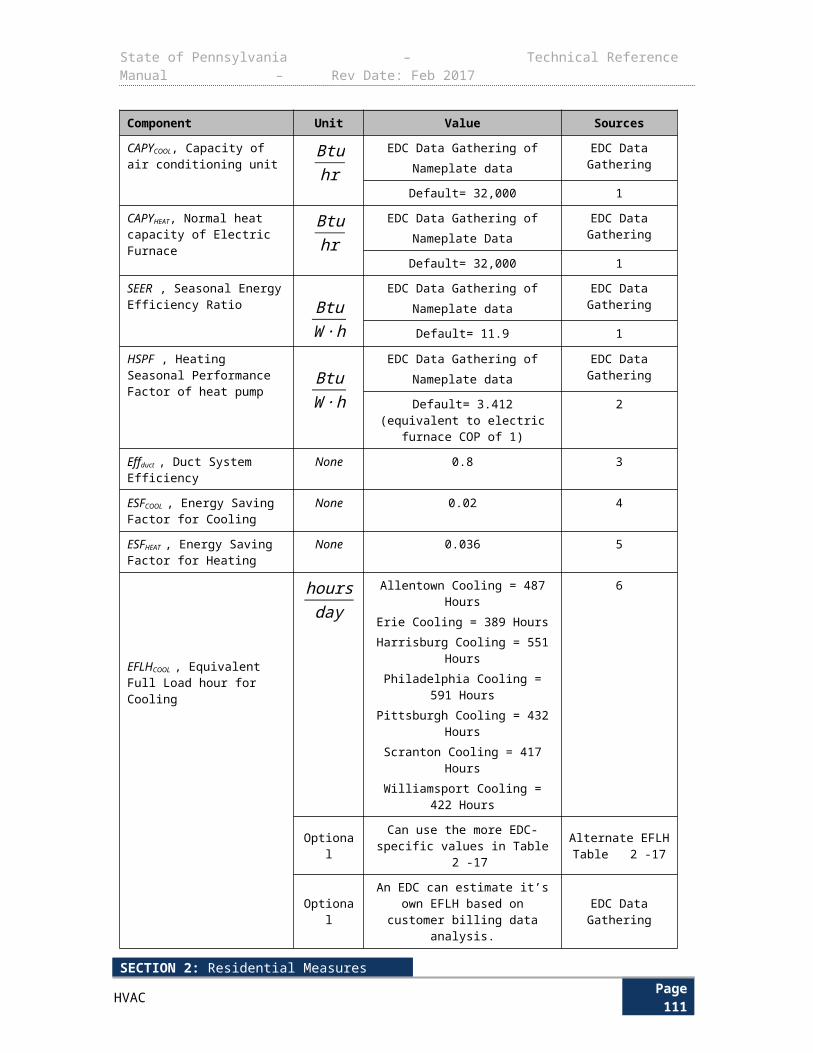
State of Pennsylvania – Technical Reference Manual – Rev Date: Feb 2017
HOU=T person /day× N persons×365 days
yr
¿faucets×60minuteshour
The ratio of the average energy usage during 2 PM and 6 PM on summer weekdays to the total annual energy usage is taken from average daily load shape data collected for faucets from an Aquacraft, Inc study.134 The average daily load shapes (percentages of daily energy usage that occur within each hour) are plotted in Figure 2-1 below (symbol FAU represents faucets).
Figure 2-1: Daily Load Shapes for Hot Water Measurers
D E F I N I T I O N O F T E R M S
The parameters in the above equation are defined in Table 2-70.
134 See “Efficient Electric Water Heater” section from 2015 Pennsylvania TRM for assumptions used to calculate annual energy usage.
SECTION 2: Residential MeasuresDomestic Hot Water Page 115
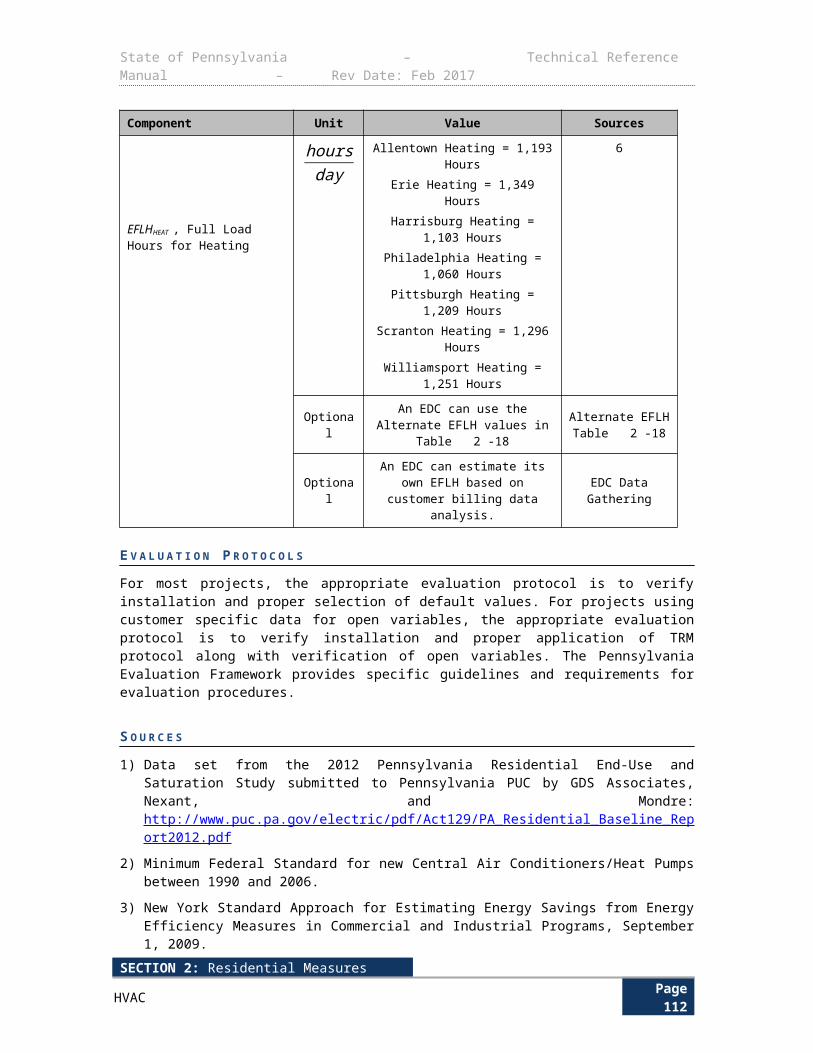
State of Pennsylvania – Technical Reference Manual – Rev Date: Feb 2017
Table 2-70: Low Flow Faucet Aerator Calculation Assumptions
SECTION 2: Residential MeasuresDomestic Hot Water Page 116

State of Pennsylvania – Technical Reference Manual – Rev Date: Feb 2017
Term Unit Value Source
GPMbase , Average baseline flow rate of aerator (GPM) gallons
minute
Default =2.2Or EDC Data Gathering
1
GPMlow , Average post measure flow rate of aerator (GPM) gallons
minute
Default = 1.5Or EDC Data Gathering
1
TPerson-Day , Average time of hot water usage per person per day (minutes) minutes
day
Kitchen=4.5Bathroom=1.6Unknown=6.1
2
NPersons , Average number of persons per household persons
house
Default SF=2.4Default MF=1.9
Default Unknown=2.4Or EDC Data Gathering
3
Tout , Average mixed water temperature flowing from the faucet (ºF)
˚F Kitchen=93Bathroom=86
Unknown= 87.8
4
Tin , Average temperature of water entering the house (ºF)
˚F 55 5, 6
RE , Recovery efficiency of electric water heater Decimal Default: 0.98HPWH: 2.1
7, 12
ETDF, Energy To Demand Factor
kWkWh / yr
0.000134 8
¿ faucets , Average number of faucets in the home faucetshouse
SF:Kitchen=1.0
Bathroom=3.0Unknown=4.0
MF:Kitchen=1.0
Bathroom=1.7Unknown=2.7
Unknown Home Type:Kitchen=1.0
Bathroom=2.8Unknown=3.8
Or EDC Data Gathering
9
DF , Percentage of water flowing down drain % Kitchen=75%Bathroom=90%
Unknown=79.5%
10
ISR , In Service Rate % Variable EDC Data Gathering
ELEC , Percentage of homes with electric water % Default: Unknown=43% 11
SECTION 2: Residential MeasuresDomestic Hot Water Page 117
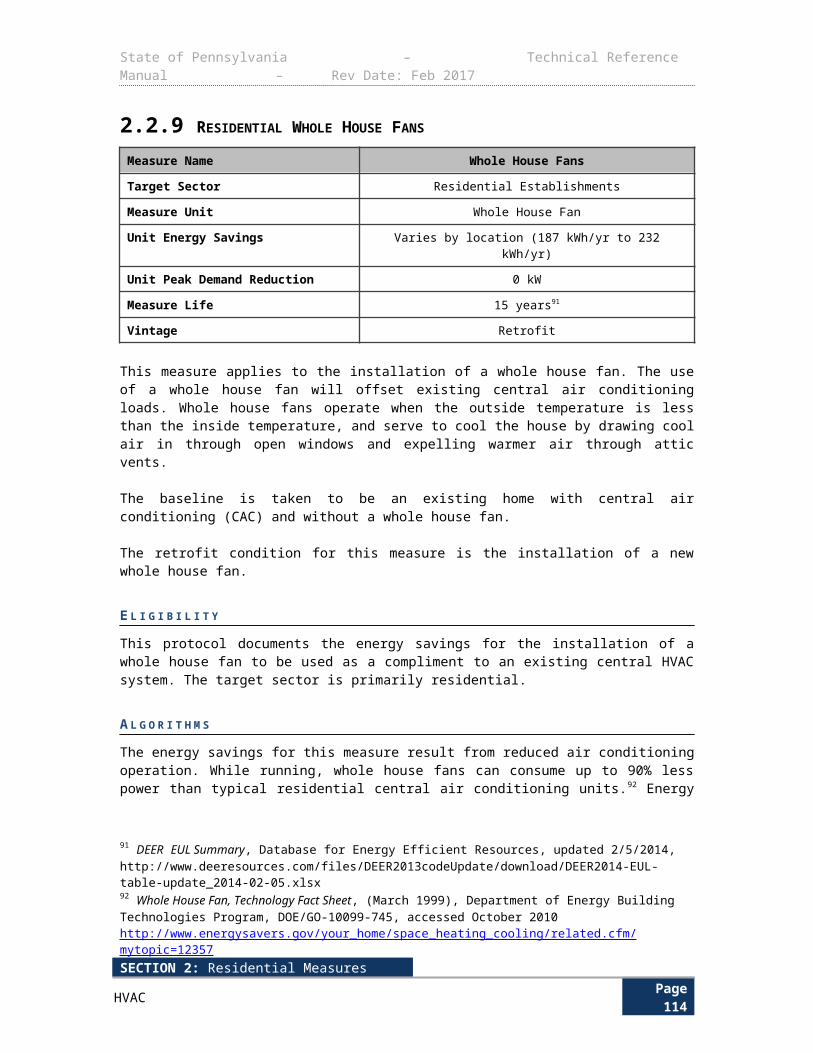
State of Pennsylvania – Technical Reference Manual – Rev Date: Feb 2017
Term Unit Value Source
heat Or EDC Data Gathering:Electric = 100%
Fossil Fuel = 0.0%
%faucet use , peak , percentage of daily faucet use during PJM peak period
% 19.5% 8
For example, a direct installed (ISR=100%) kitchen low flow faucet aerator in a single family electric DHW (ELEC=100%) home:
ΔkWh = 1.0 * 1.0 * (((2.2 – 1.5) * 4.5 * 2.4 * 365 * (93 – 55) * 8.3 * (1/3412) * 0.75 / 0.98) / 1)= 195.2 kWh
For example, a direct installed (ISR=100%) low flow faucet aerator in unknown faucet in an unknown family type electric DHW (ELEC=100%) home:
ΔkWh = 1.0 * 1.0 * (((2.2 – 1.5) * 6.1 * 2.6 * 365 * (87.8 – 55) * 8.3 * (1/3412) * 0.795 / 0.98) / 4.0)
= 63.7 kWh per faucet
D E F A U L T S A V I N G S
Housing Type
Faucet Location
ELEC(water heater fuel)
Unit Energy Savings (kWh)
Unit Demand Savings (kW)
Single Family
Kitchen Unknown (43%) 83.9 0.0112Bathroom Unknown (43%) 9.7 0.0013Unknown Unknown (43%) 26.0 0.0035
MultifamilyKitchen Unknown (43%) 66.5 0.0089
Bathroom Unknown (43%) 13.6 0.0018Unknown Unknown (43%) 30.5 0.0041
Statewide (Unknown Housing Type)
Kitchen Unknown (43%) 83.9 0.0112Bathroom Unknown (43%) 10.4 0.0014Unknown Unknown (43%) 27.4 0.0037
Single Family
Kitchen Electric (100%) 195.2 0.0262Bathroom Electric (100%) 22.6 0.0030Unknown Electric (100%) 60.5 0.0081
MultifamilyKitchen Electric (100%) 154.5 0.0207
Bathroom Electric (100%) 31.6 0.0042Unknown Electric (100%) 71.0 0.0095
Statewide (Unknown Housing Type)
Kitchen Electric (100%) 195.2 0.0262Bathroom Electric (100%) 24.3 0.0033Unknown Electric (100%) 63.7 0.0085
E V A L U A T I O N P R O T O C O L S
The most appropriate evaluation protocol for this measure is verification of installation coupled with EDC Data Gathering.
SECTION 2: Residential MeasuresDomestic Hot Water Page 118
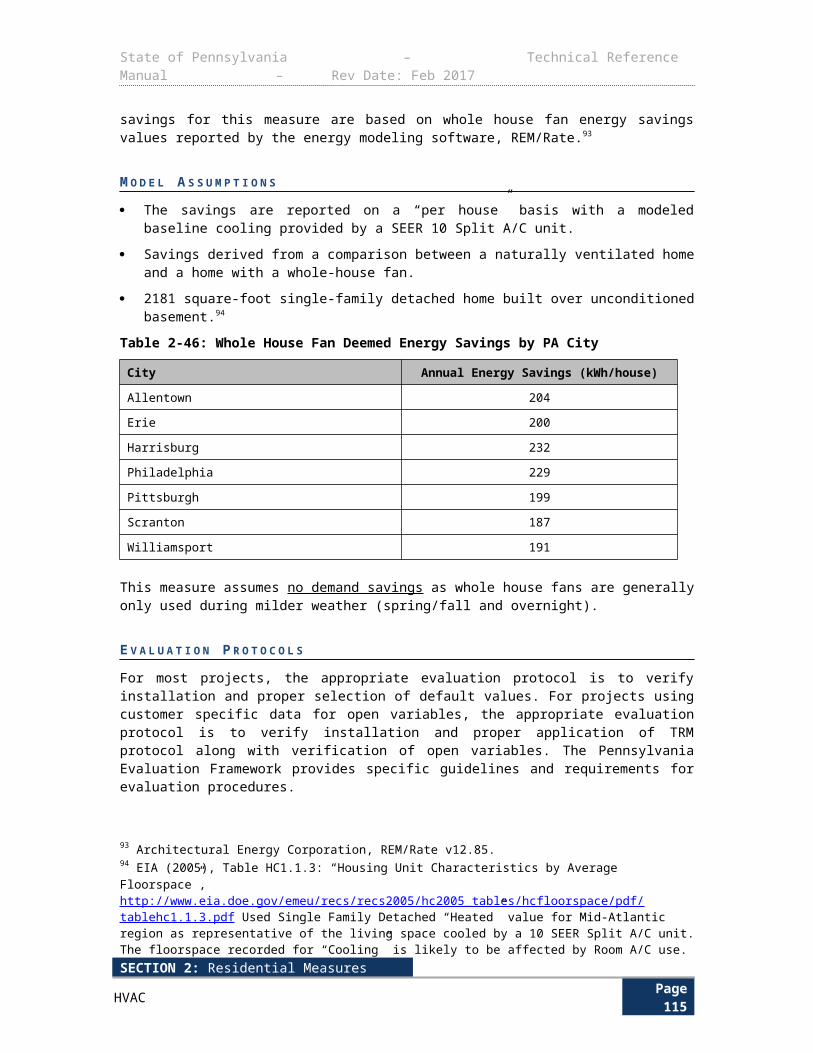
State of Pennsylvania – Technical Reference Manual – Rev Date: Feb 2017
S O U R C E S
1) Cadmus and Opinion Dynamics Evaluation Team. Showerhead and Faucet Aerator Meter Study. For Michigan Evaluation Working Group. June 2013. Baseline GPM of replaced aerators is set to the federal minimum GPM of 2.2. The GPM of new aerators is set to the typical rated GPM value of 1.5 GPM. Discounted GPM flow rates were not applied because the “throttle factor” adjustment was found to have been already accounted for in the mixed water temperature variable. Additionally, the GPMBase was set to a default value of 2.2 due to the inability to verify what the GPM flow rate was of the replaced faucet.
2) Cadmus and Opinion Dynamics Evaluation Team. Showerhead and Faucet Aerator Meter Study. For Michigan Evaluation Working Group. June 2013. If aerator location is known, use the corresponding kitchen/bathroom value. If unknown, use 6.1 min/person/day as the average length of use value, which is the total for the household: kitchen (4.5 min/person/day) + bathroom (1.6 min/person/day) = 6.1 min/person/day.
3) Table 4-7, section 4.2.4. GDS Associates, Inc. Pennsylvania Statewide Residential End-Use Saturation Study, 2014. For The Pennsylvania Public Utility Commission .
4) Table 7. Cadmus and Opinion Dynamics Evaluation Team. Showerhead and Faucet Aerator Meter Study. For Michigan Evaluation Working Group. June 2013. The study finds that the average mixed water temperature flowing from the kitchen and bathroom faucets is 93ºF and 86ºF, respectively. If the faucet location is unknown, 87.8ºF is the corresponding value to be used, which was calculated by taking a weighted average of faucet type (using the statewide values): ((1*93)+(3*86))/(1+3) = 87.8.
5) Table 9. Cadmus and Opinion Dynamics Evaluation Team. Showerhead and Faucet Aerator Meter Study. For Michigan Evaluation Working Group. June 2013. Inlet water temperatures were measured and a weighted average based upon city populations was used to calculate the value of 55ºF.
6) A good approximation of annual average water main temperature is the average annual ambient air temperature. Average water main temperature = 55° F based on: http://lwf.ncdc.noaa.gov/img/documentlibrary/clim81supp3/tempnormal_hires.jpg
7) AHRI Directory. All electric storage water heaters have a recovery efficiency of .98. https://www.ahridirectory.org/ahridirectory/pages/rwh/defaultSearch.aspx
8) Aquacraft, Inc., Water Engineering and Management. The end use of hot water in single family homes from flow trace analysis. 2001. http://s3.amazonaws.com/zanran_storage/www.aquacraft.com/ContentPages/47768067.pdf. The statewide values were used for inputs in the FED algorithm components. The CF for faucets is found to be 0.00339: [% faucet use during peak × (TPerson-Day× NPerson) /(F/home)] / 240 (minutes in peak period) = [19.5% × (6.1 x 2.6 / 3.8)] / 240 =0.00339. The Hours for faucets is found to be 25.4: (TPerson-Day× NPersons× 365) /(F/home) / 60 = (6.1 x 2.6 x 365) / 3.8 / 60 = 25.4. The resulting FED is calculated to be0.000134: CF / Hours = 0.00328 / 25.4 =0.000134.
9) Table 4-68, section 4.6.3. GDS Associates, Inc. Pennsylvania Statewide Residential End-Use Saturation Study, 2012. For The Pennsylvania Public Utility Commission.
10) Illinois TRM Effective June 1, 2013. Faucet usages are at times dictated by volume, only “directly down the drain” usage will provide savings. Due to the lack of a metering study that has determined this specific factor, the Illinois Technical Advisory Group has deemed these values to be 75% for the kitchen and 90% for the bathroom. If the aerator location is unknown an average of 79.5% should be used which is based on the assumption that 70% of household water runs through the kitchen faucet and 30% through the bathroom (0.7*0.75)+(0.3*0.9)=0.795.
11) Figure 4-17, Section 4.6.1 of the 2014 Pennsylvania Statewide Residential End-Use and Saturation Study. This study finds that only 43% of households statewide have an electric
SECTION 2: Residential MeasuresDomestic Hot Water Page 119
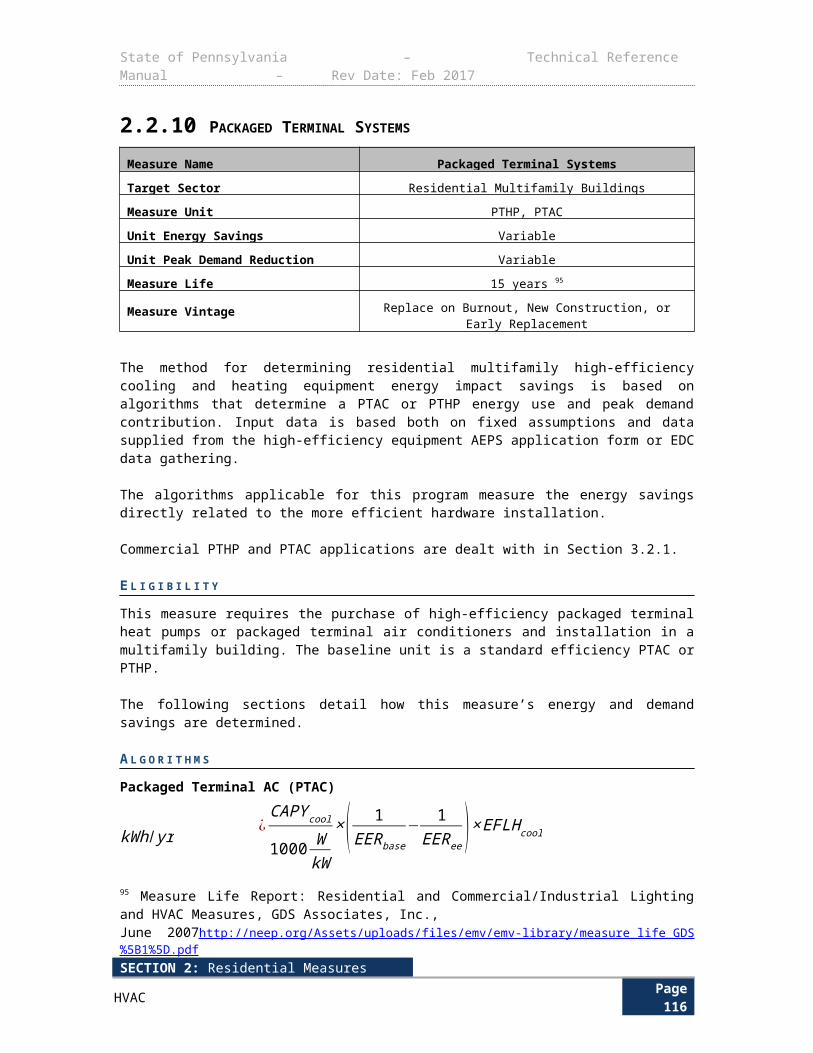
State of Pennsylvania – Technical Reference Manual – Rev Date: Feb 2017
water heater. As such, if the proportion of households with electric water heaters is unknown, deemed savings should only be applied to 43% of the study group.
12) NEEA Heat Pump Water Heater Field Study Report. Prepared by Fluid Market Strategies. October 22, 2013. http://neea.org/docs/default-source/reports/heat-pump-water-heater-field-study-report.pdf?sfvrsn=5
SECTION 2: Residential MeasuresDomestic Hot Water Page 120
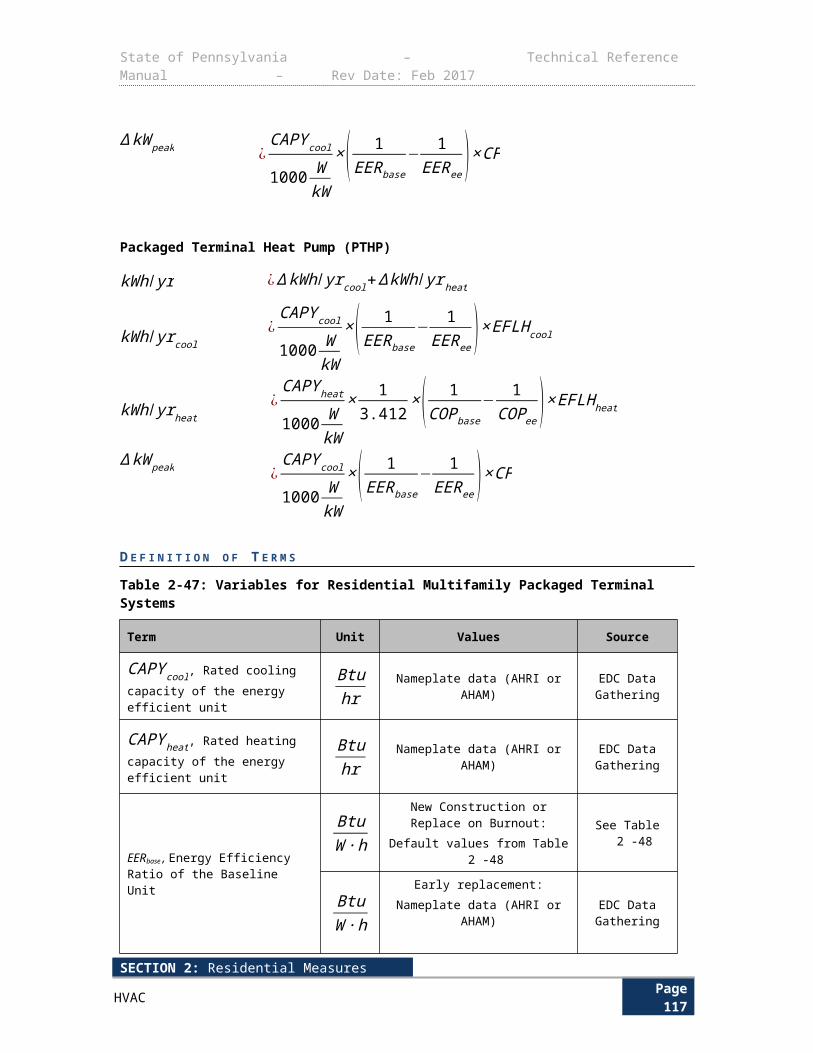
State of Pennsylvania – Technical Reference Manual – Rev Date: Feb 2017
2.3.9 LOW FLOW SHOWERHEADS
Measure Name Low Flow Showerheads
Target Sector Residential Establishments
Measure Unit Water Heater
Unit Energy Savings Partially Deemed
Unit Peak Demand Reduction Partially Deemed
Measure Life 9 years135
Vintage Retrofit
This measure relates to the installation of a low flow (generally 1.5 GPM) showerhead in bathrooms in homes with electric water heater. The baseline is a standard showerhead using 2.5 GPM.
E L I G I B I L I T Y
This protocol documents the energy savings attributable to replacing a standard showerhead with an energy efficient low flow showerhead for electric water heaters. The target sector primarily consists of residences establishments.
A L G O R I T H M S
The annual energy savings are obtained through the following formula:
∆ kWh/ yr
¿ ISR×ELEC×[ (GPMbase−GPM low )×T person /day×N persons× N showers /day×365 daysyr
× (T out−T ¿)×8.3 Btugal ∙℉
¿showers×3412 BtukWh
×ℜ ]∆ kW peak=∆kWh/ yr ×ETDF
Where:
ETDF= CFHOU
CF=%shower use , peak×T person
day
×N persons×N showersday
¿showers×240 minutesdaily peak
HOU=T person /day× N persons×N showers/day×365 days
yr
¿showers×60minuteshour
135 California’s Database of Energy Efficiency Resources (DEER), updated 2/5/2014. http://www.deeresources.com/files/DEER2013codeUpdate/download/DEER2014-EUL-table-update_2014-02-05.xlsx
SECTION 2: Residential MeasuresDomestic Hot Water Page 121
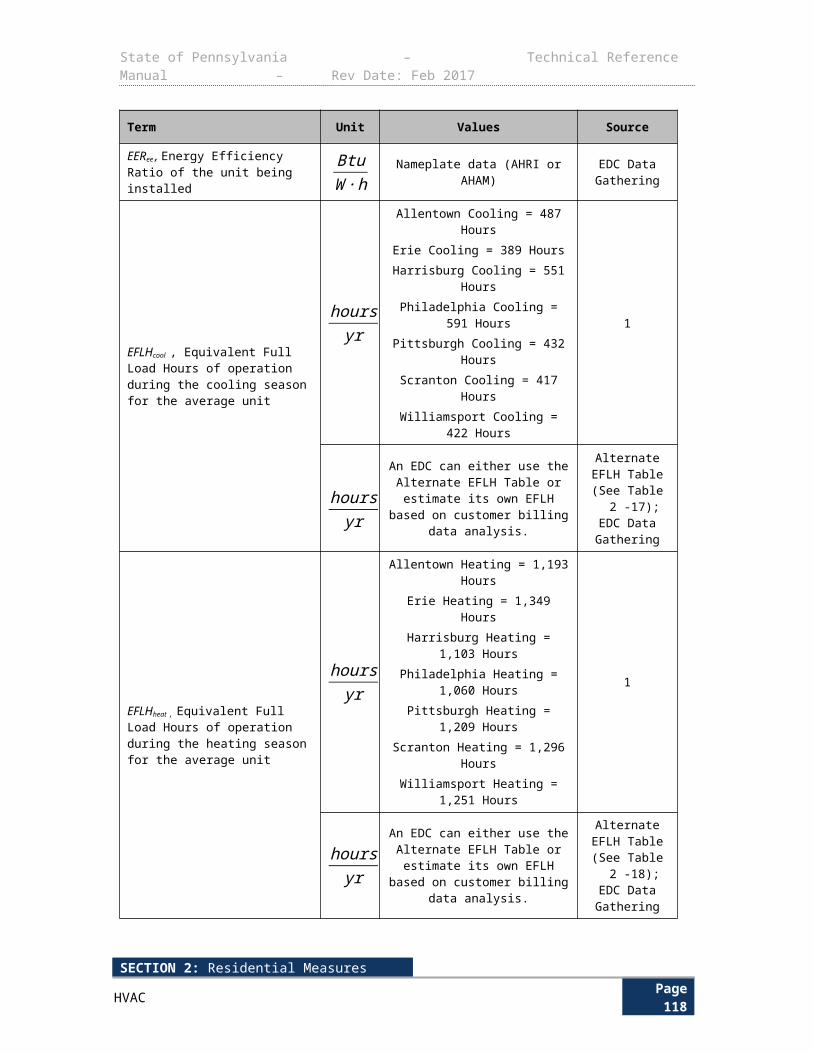
State of Pennsylvania – Technical Reference Manual – Rev Date: Feb 2017
The ratio of the average energy usage during 2 PM and 6 PM on summer weekdays to the total annual energy usage is taken from average daily load shape data collected for showerheads from an Aquacraft, Inc study.136 The average daily load shapes (percentages of daily energy usage that occur within each hour) during are plotted in Figure 2-2 below (symbol SHOW represents showerheads).
Figure 2-2: Daily Load Shapes for Hot Water Measures
D E F I N I T I O N O F T E R M S
Table 2-71: Low Flow Showerhead Calculation Assumptions
Term Unit Value Source
GPMbase , Gallons per minute of baseline showerhead
gallonsminute
Default value = 2.5 1
GPMlow , Gallons per minute of low flow showerhead
gallonsminute
Default value = 1.5 or EDC Data Gathering
2
T person /day , Average time of shower usage per person (minutes)
minutesday
7.8 3
Npersons , Average number of persons per household
personshouse
Default SF=2.4Default MF=1.9
Default unknown=2.4Or EDC Data Gathering
4
136 Aquacraft, Inc., Water Engineering and Management. The end use of hot water in single family homes from flow trace analysis. 2001. http://s3.amazonaws.com/zanran_storage/www.aquacraft.com/ContentPages/47768067.pdf
SECTION 2: Residential MeasuresDomestic Hot Water Page 122
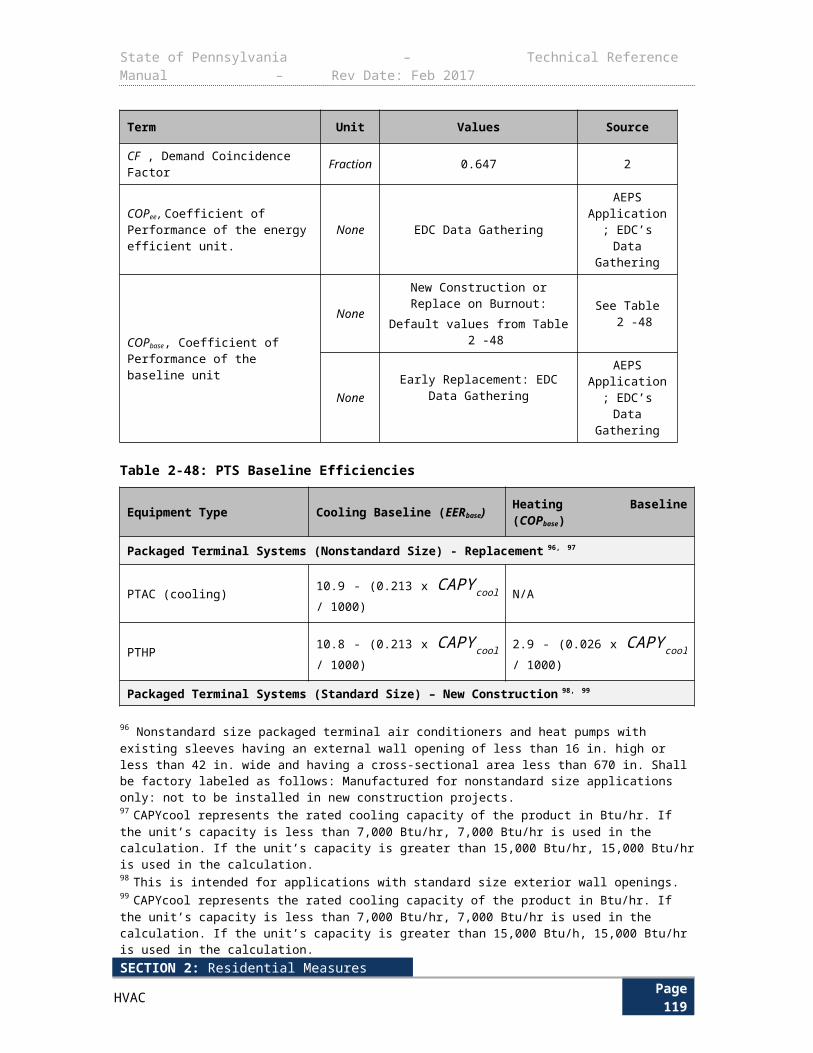
State of Pennsylvania – Technical Reference Manual – Rev Date: Feb 2017
Term Unit Value Source
N showers /day , Average number of showers per person per day showers / person
day
0.6 5
¿showers , Average number of showers in the home
showershouse
Or EDC Data GatheringDefault SF=1.3Default MF=1.1
Default unknown = 1.2
6
Tout , Assumed temperature of water used by showerhead
° F 101 7
Tin , Assumed temperature of water entering house
° F 55 7,8
RE , Recovery efficiency of electric water heater
Decimal Default: 0.98HPWH: 2.1
9, 12
ETDF , Energy To Demand Factor kWkWh / yr
0.00008013 10
ISR , In Service Rate % Variable EDC Data Gathering
ELEC , Percentage of homes with electric water heat
% Default: Unknown=43%Or EDC Data
Gathering:Electric = 100%
Fossil Fuel = 0.0%
11
%showeruse , peak , percentage of daily shower use during PJM peak period
% 11.7% 10
For example, a direct-installed (ISR=100%) 1.5 GPM low flow showerhead in a single family electric DHW (ELEC=100%) home:
ΔkWh = 1.0 * 1.0 * [(2.5 – 1.5) * 7.8 * 0.6 * 2.4 * 365 * (101 - 55) * 8.3 * (1/3412) / 0.98] / 1.3360.1 = kWh
For example, a direct-installed (ISR=100%) 1.5 GPM low flow showerhead in an unknown family type home with electric DHW (ELEC=100%) where the number of showers is not known:
ΔkWh = 1.0 * 1.0* [(2.5 – 1.5) * 7.8* 0.6 * 2.4 * 365 * (101 - 55) * 8.3 * (1/3412) / 0.98] / 1.2390.1 = kWh
D E F A U L T S A V I N G S
SECTION 2: Residential MeasuresDomestic Hot Water Page 123
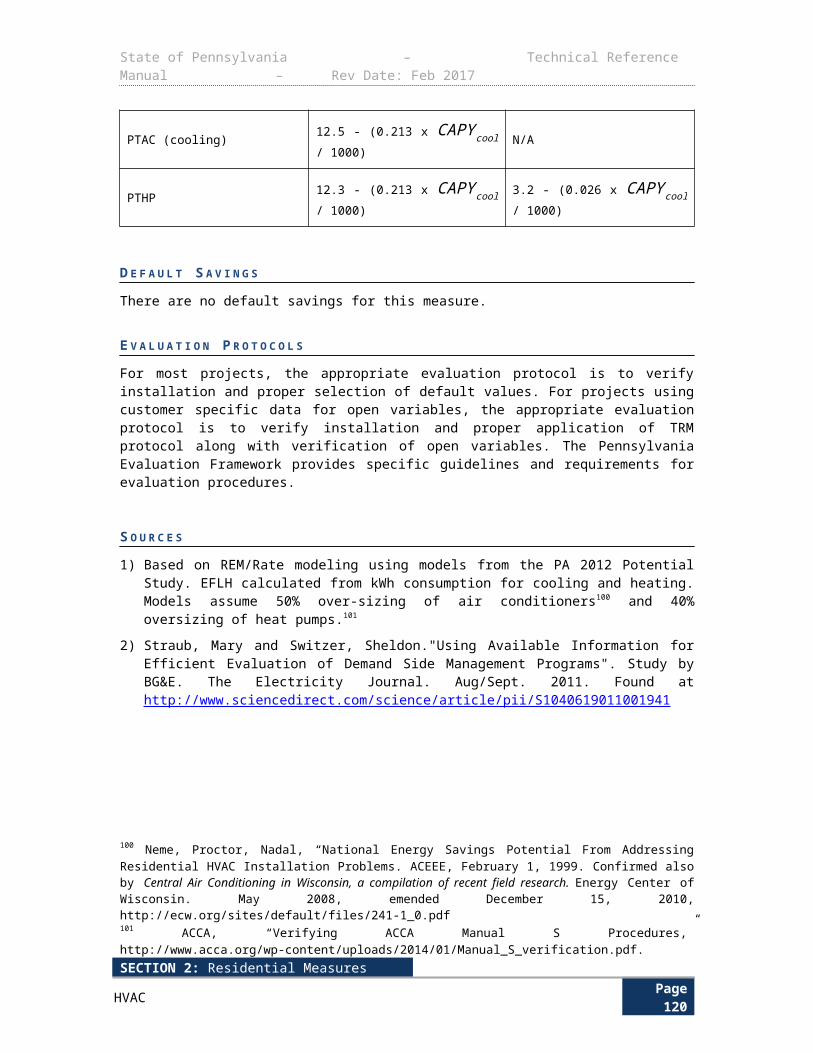
State of Pennsylvania – Technical Reference Manual – Rev Date: Feb 2017
Housing Type
Low Flow Rate (gpm)
ELEC (water heater fuel)
Unit Energy Savings (kWh)
Unit Demand Savings (kW)
Single Family2.0 Unknown (43%) 77.4 0.0062
1.75 Unknown (43%) 116.1 0.00931.5 Unknown (43%) 154.8 0.0124
Multifamily2.0 Unknown (43%) 72.4 0.0058
1.75 Unknown (43%) 108.7 0.00871.5 Unknown (43%) 144.9 0.0116
Statewide (Unknown Housing Type)
2.0 Unknown (43%) 83.9 0.00671.75 Unknown (43%) 125.8 0.01011.5 Unknown (43%) 167.7 0.0134
Single Family2.0 Electric (100%) 180.0 0.0144
1.75 Electric (100%) 270.1 0.02161.5 Electric (100%) 360.1 0.0289
Multifamily2.0 Electric (100%) 168.4 0.0135
1.75 Electric (100%) 252.7 0.02021.5 Electric (100%) 336.9 0.0270
Statewide (Unknown Housing Type)
2.0 Electric (100%) 195.0 0.0156
1.75 Electric (100%) 292.6 0.0234
1.5 Electric (100%) 390.1 0.0313
E V A L U A T I O N P R O T O C O L S
The most appropriate evaluation protocol for this measure is verification of installation coupled with EDC Data Gathering.
S O U R C E S
1) Cadmus and Opinion Dynamics Evaluation Team. Showerhead and Faucet Aerator Meter Study. For Michigan Evaluation Working Group. June 2013. Uses the federal minimum GPM allowed as the baseline for the replaced showerheads, corresponding to 2.5 GPM.
2) Illinois TRM Effective June 1, 2013. Allows for varying flow rate of the low-flow showerhead, most notably values of 2.0 GPM, 1.75 GPM and 1.5 GPM. Custom or actual values are also allowed for.
3) Table 6. Cadmus and Opinion Dynamics Evaluation Team. Showerhead and Faucet Aerator Meter Study. For Michigan Evaluation Working Group. June 2013. The study compared shower length by single-family and multifamily populations, finding no statistical difference in showering times. For the energy-saving analysis, the study used the combined single-family and multifamily average shower length of 7.8 minutes.
4) Table 4-7, section 4.2.4. GDS Associates, Inc. Pennsylvania Statewide Residential End-Use Saturation Study, 2014. For The Pennsylvania Public Utility Commission .
5) Table 8. Cadmus and Opinion Dynamics Evaluation Team. Showerhead and Faucet Aerator Meter Study. For Michigan Evaluation Working Group. June 2013. For each shower fixture metered, the evaluation team knew the total number of showers taken, duration of time meters remained in each home, and total occupants reported to live in the home. From these values average showers taken per day, per person was calculated. The study compared showers per day, per person by single-family and multifamily populations, finding no
SECTION 2: Residential MeasuresDomestic Hot Water Page 124
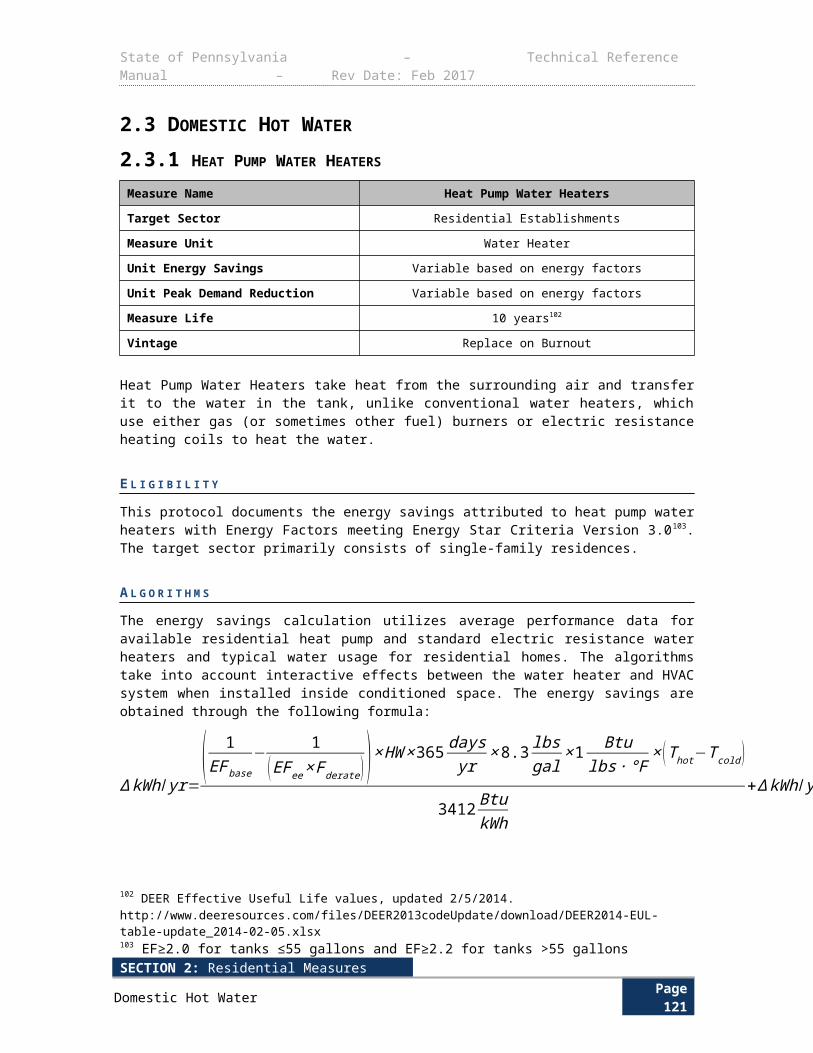
State of Pennsylvania – Technical Reference Manual – Rev Date: Feb 2017
statistical difference in the values. For the energy-saving analysis, the study used the combined single-family and multifamily average showers per day, per person of 0.6.
6) Table 4-67, section 4.6.3. GDS Associates, Inc. Pennsylvania Statewide Residential End-Use Saturation Study, 2014. For The Pennsylvania Public Utility Commission.
7) Cadmus and Opinion Dynamics Evaluation Team. Showerhead and Faucet Aerator Meter Study. For Michigan Evaluation Working Group. June 2013. Temperature sensors provided the mixed water temperature readings resulting in an average of 101ºF. Inlet water temperatures were measured and a weighted average based upon city populations was used to calculate the value of 55ºF.
8) A good approximation of annual average water main temperature is the average annual ambient air temperature. Average water main temperature = 55° F based on: http://lwf.ncdc.noaa.gov/img/documentlibrary/clim81supp3/tempnormal_hires.jpg
9) AHRI Directory. All electric storage water heaters have a recovery efficiency of .98. https://www.ahridirectory.org/ahridirectory/pages/rwh/defaultSearch.aspx
10) Aquacraft, Inc., Water Engineering and Management. The end use of hot water in single family homes from flow trace analysis. 2001. http://s3.amazonaws.com/zanran_storage/www.aquacraft.com/ContentPages/47768067.pdf. The statewide values were used for inputs in the FED algorithm components. The CF for showerheads is found to be 0.00371: [% showerhead use during peak × (TPerson-Day× NPerson) /(S/home)] / 240 (minutes in peak period) = [11.7% × (7.8 x 2.6 x 0.6 / 1.6)] / 240 = 0.00371. The Hours for showerheads is found to be 46.3: (TPerson-Day× NPersons× 365) /(S/home) / 60 = (7.8 x 2.6 x 0.6 x 365) / 1.6 / 60 = 46.3. The resulting FED is calculated to be 0.00008013: CF / Hours = 0.00371 / 46.3 = 0.00008013.
11) Figure 4-17, Section 4.6.1 of the 2014 Pennsylvania Statewide Residential End-Use and Saturation Study. This study finds that only 43% of households statewide have an electric water heater. As such, if the proportion of households with electric water heaters is unknown, deemed savings should only be applied to 43% of the study group.
12) NEEA Heat Pump Water Heater Field Study Report. Prepared by Fluid Market Strategies. October 22, 2013. http://neea.org/docs/default-source/reports/heat-pump-water-heater-field-study-report.pdf?sfvrsn=5
SECTION 2: Residential MeasuresDomestic Hot Water Page 125
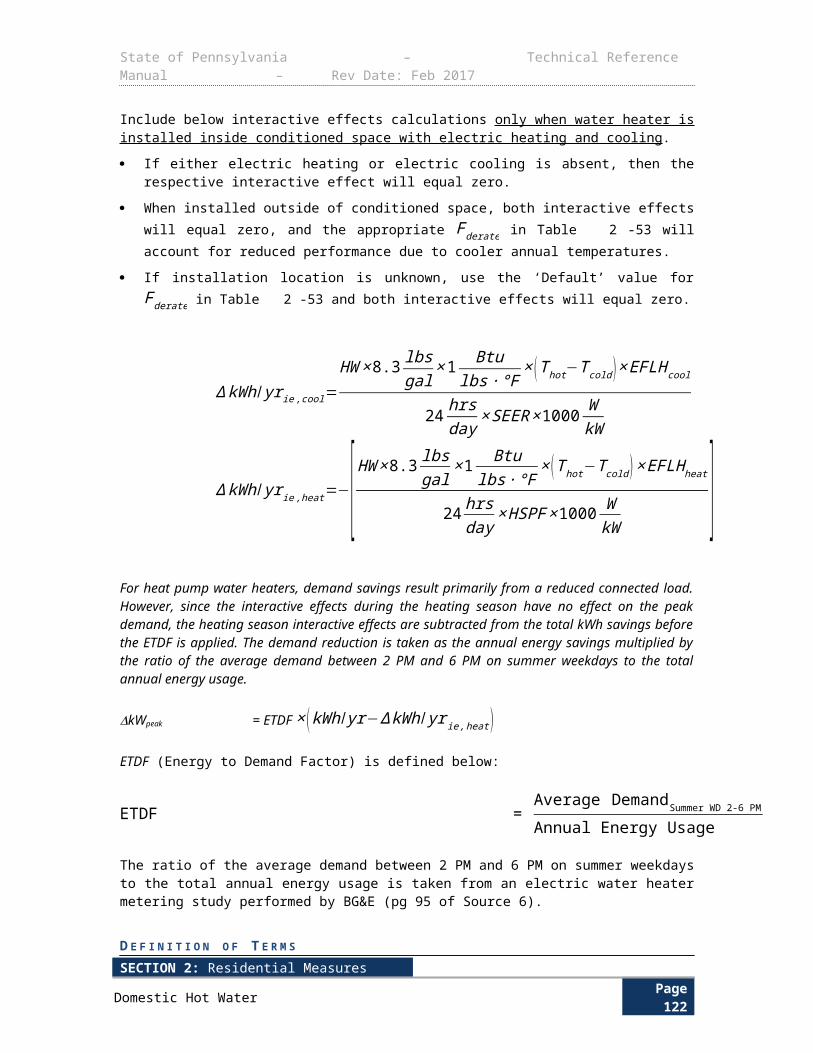
State of Pennsylvania – Technical Reference Manual – Rev Date: Feb 2017
2.3.10 THERMOSTATIC SHOWER RESTRICTION VALVE
Measure Name Thermostatic Shower Restriction Valve
Target Sector Residential Establishments
Measure Unit Water Heater
Unit Energy Savings Partially Deemed
Unit Peak Demand Reduction Partially Deemed
Measure Life 10 years137
Vintage Retrofit
This measure relates to the installation of a device that reduces hot water usage during shower warm-up by way of a thermostatic shower restriction valve, reducing hot water waste during shower warm-up.
E L I G I B I L I T Y
This protocol documents the energy savings attributable to installing a thermostatic restriction valve, device, or equivalent product on an existing showerhead. Only homes with electric water heaters are eligible, and the savings associated with this measure may be combined with a low flow showerhead as the sum of the savings of the two measures. The target sector primarily consists of residences.
A L G O R I T H M S
The annual energy savings are obtained through the following formula:
∆ kWh/ yr=ISR× ELEC×GPM base
60 secmin
×UH×UE× (Tout−T¿ )×(N persons×N showers−day )
Shome
× BehavioralWasteSecondsℜ ×365 daysyr
ΔkWpeak =ΔkWh×ETDF
The ratio of the average energy usage during 2 PM and 6 PM on summer weekdays to the total annual energy usage is taken from average daily load shape data collected for showerheads from an Aquacraft, Inc study.138 The average daily load shapes (percentages of daily energy usage that occur within each hour) during are plotted in Figure 2-3 below (symbol SHOW represents showerheads).
137 Efficiency Vermont, Technical Reference User Manual: Measure Savings Algorithms and Cost Assumptions, TRM User Manual No. 2008-53, 07/18/08, http://www.veic.org/docs/ResourceLibrary/TRM-User-Manual-Excerpts.pdf.138 Aquacraft, Inc., Water Engineering and Management. The end use of hot water in single family homes from flow trace analysis. 2001. http://s3.amazonaws.com/zanran_storage/www.aquacraft.com/ContentPages/47768067.pdf.
SECTION 2: Residential MeasuresDomestic Hot Water Page 126
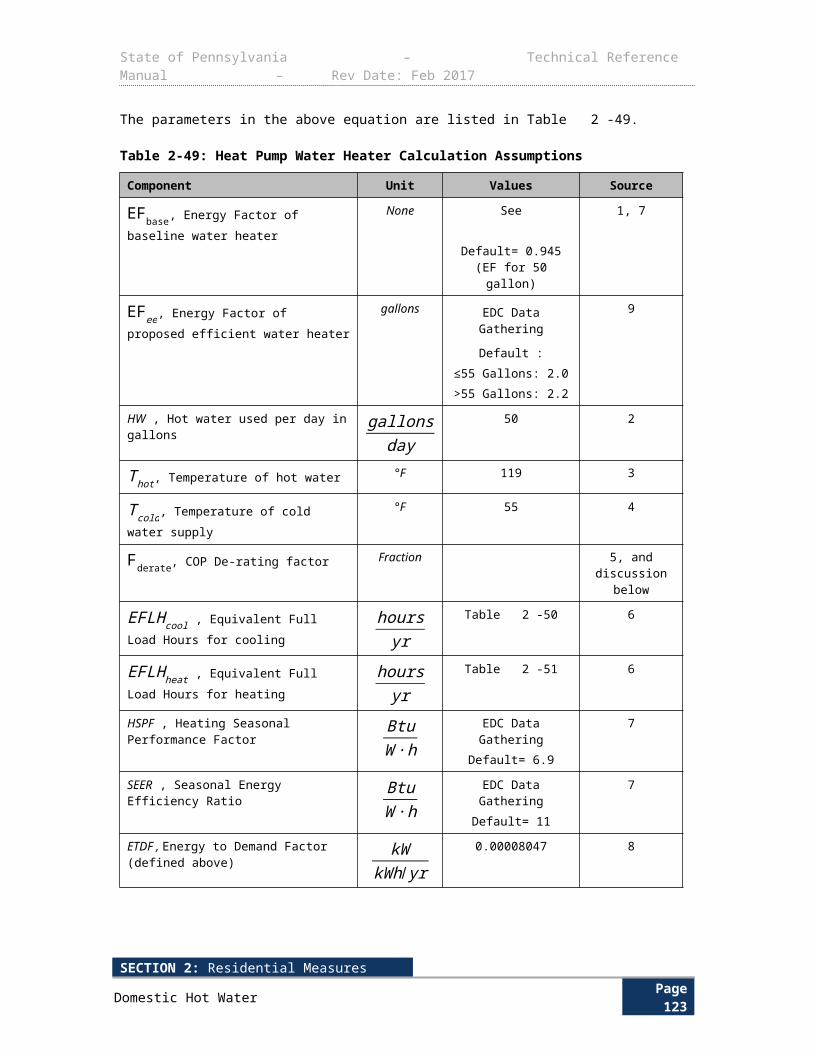
State of Pennsylvania – Technical Reference Manual – Rev Date: Feb 2017
Figure 2-3: Daily Load Shapes for Hot Water Measures
D E F I N I T I O N O F T E R M S
Table 2-72: Assumptions for Thermostatic Shower Restriction Valve
Parameter Unit Value SourceGPMBase, Gallons per minute of baseline showerhead gallons
min
EDC Data GatheringDefault:
Standard shower head=2.5Low Flow Shower Head=1.5
1
Npersons, Average number of persons per household persons
household
Default SF=2.4Default MF=1.9
Default unknown=2.4Or EDC Data Gathering
2
NShowers-Day, Average number of showers per person per day
showersday
0.6 3
days/year daysyr
365
S/home, Average number of showerhead fixtures in the home
None
Default SF=1.3Default MF=1.1
Default unknown = 1.2Or EDC Data Gathering
4
Tout, Assumed temperature of water used by showerhead ° F 104
Or EDC Data Gathering5
Tin, Assumed temperature of water entering house ° F 55 6,7
UH, Unit Conversion BtuGal×°F
8.3 Convention
SECTION 2: Residential MeasuresDomestic Hot Water Page 127
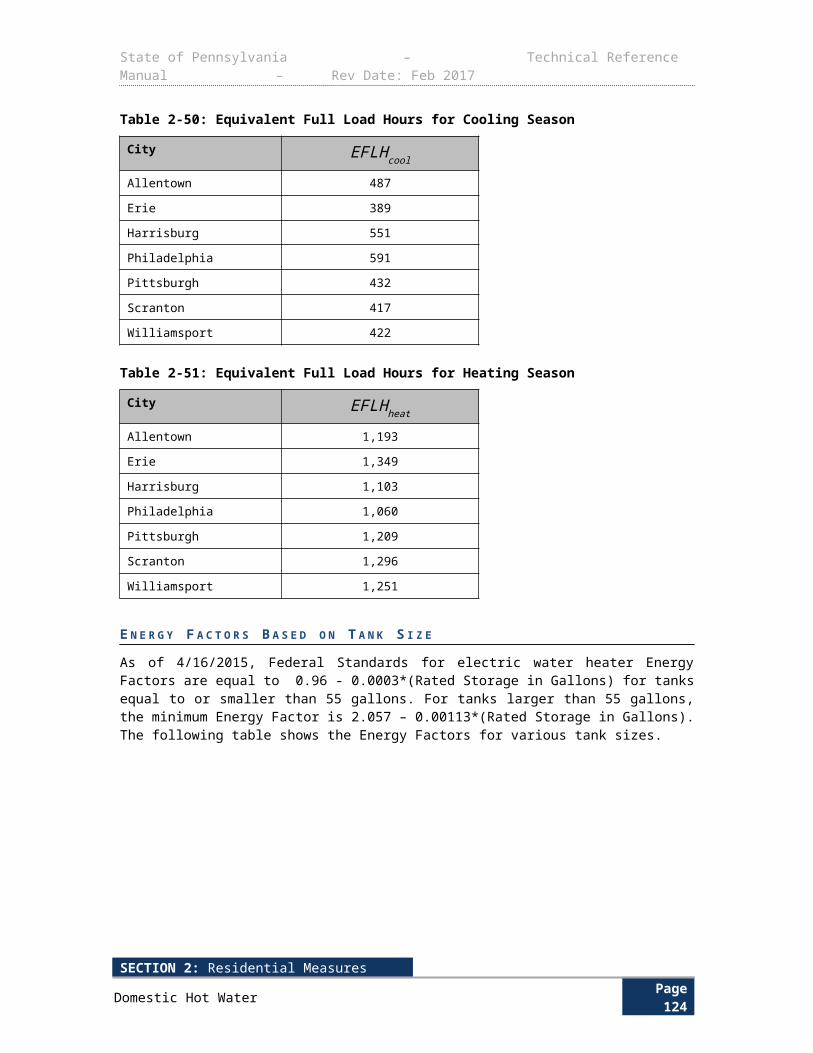
State of Pennsylvania – Technical Reference Manual – Rev Date: Feb 2017
Parameter Unit Value SourceUE, Unit Conversion kWh
Btu1/3412 Convention
RE, Recovery efficiency of electric water heater Decimal Default: 0.98
HPWH: 2.17, 10
ETDF, Energy To Demand Factor kWkWh / yr
0.00008013 8
ISR, In Service Rate % Variable EDC Data Gathering
ELEC, Percentage of homes with electric water heat %
Default: Unknown=43%Or EDC Data Gathering:
Electric = 100%Fossil Fuel = 0.0%
9
BehavioralWasteSeconds, Time sec Default = 59 or EDC Data Gathering
5
D E F A U L T S A V I N G S
Table 2-73: Restriction Valve Calculation Assumptions
Application
Baseline Flowrate
(GPM)ELEC (water heater
fuel)
Energy Savings (kWh/yr)
Peak Demand Reduction
(kW)Therm
Savings
Single Family
2.5 Unknown (43%) 52.0 0.0042 5.3
2 Unknown (43%) 41.6 0.0033 4.3
1.5 Unknown (43%) 31.2 0.0025 3.2
Multifamily
2.5 Unknown (43%) 48.6 0.0039 5
2 Unknown (43%) 38.9 0.0031 4
1.5 Unknown (43%) 29.2 0.0023 3
Unknown / Default Housing Type
2.5 Unknown (43%) 56.3 0.0045 5.8
2 Unknown (43%) 45.1 0.0036 4.6
1.5 Unknown (43%) 33.8 0.0027 3.5
Single Family
2.5 Electric (100%) 120.9 0.0097 5.3
2 Electric (100%) 96.7 0.0077 4.3
1.5 Electric (100%) 72.5 0.0058 3.2
Multifamily
2.5 Electric (100%) 113.1 0.0091 5
2 Electric (100%) 90.5 0.0073 4
1.5 Electric (100%) 67.9 0.0054 3
Unknown / Default Housing Type
2.5 Electric (100%) 131.0 0.0105 5.8
2 Electric (100%) 104.8 0.0084 4.6
1.5 Electric (100%) 78.6 0.0063 3.5
E V A L U A T I O N P R O T O C O L S
The most appropriate evaluation protocol for this measure is verification of installation coupled with EDC Data Gathering.
SECTION 2: Residential MeasuresDomestic Hot Water Page 128
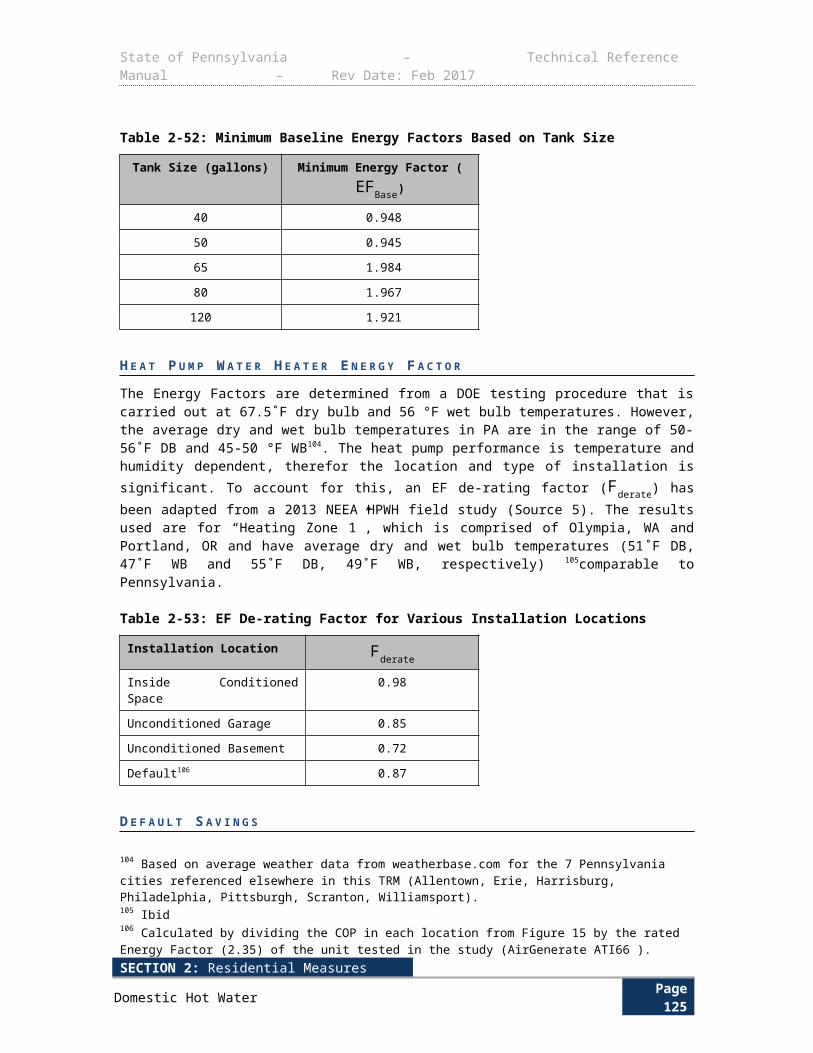
State of Pennsylvania – Technical Reference Manual – Rev Date: Feb 2017
S O U R C E S
1) Cadmus and Opinion Dynamics Evaluation Team. Showerhead and Faucet Aerator Meter Study. For Michigan Evaluation Working Group. June 2013. Uses the federal minimum GPM allowed as the baseline for the replaced showerheads, corresponding to 2.5 GPM.
2) Table 4-7, section 4.2.4. GDS Associates, Inc. Pennsylvania Statewide Residential End-Use Saturation Study, 2014. For The Pennsylvania Public Utility Commission.
3) Table 8. Cadmus and Opinion Dynamics Evaluation Team. Showerhead and Faucet Aerator Meter Study. For Michigan Evaluation Working Group. June 2013. For each shower fixture metered, the evaluation team knew the total number of showers taken, duration of time meters remained in each home, and total occupants reported to live in the home. From these values average showers taken per day, per person was calculated. The study compared showers per day, per person by single-family and multifamily populations, finding no statistical difference in the values. For the energy-saving analysis, the study used the combined single-family and multifamily average showers per day, per person of 0.6.
4) Table 4-67, section 4.6.3. GDS Associates, Inc. Pennsylvania Statewide Residential End-Use Saturation Study, 2014. For The Pennsylvania Public Utility Commission.
5) PPL Electric 2014 ShowerStart Pilot Study. Cadmus memo to PPL Electric in November 2014. The previous Tout value was based on the average water temperature of the entire shower, whereas this pilot study Tout value is based on the average water temperature of the period after the user resumed the water flow by pulling the ShowerStart cord. This pilot study Tout value is more accurate than the previous value because it excludes the warmup phase of the shower and thus reflects the temperature of the water saved by the ShowerStart device during the behavioral waste period more accurately. The BehavioralWasteSeconds value represents the average time the ShowerStart device is engaged during a shower. The BehavioralWasteSeconds value includes instances when the user did not engage the ShowerStart device (instances when BehavioralWasteSeconds = 0s).
6) A good approximation of annual average water main temperature is the average annual ambient air temperature. Average water main temperature = 55° F based on: http://lwf.ncdc.noaa.gov/img/documentlibrary/clim81supp3/tempnormal_hires.jpg
7) AHRI Directory. All electric storage water heaters have a recovery efficiency of .98. https://www.ahridirectory.org/ahridirectory/pages/rwh/defaultSearch.aspx
8) Aquacraft, Inc., Water Engineering and Management. The end use of hot water in single family homes from flow trace analysis. 2001. http://s3.amazonaws.com/zanran_storage/www.aquacraft.com/ContentPages/47768067.pdf. The statewide values were used for inputs in the FED algorithm components. The CF for showerheads is found to be 0.00371: [% showerhead use during peak × (TPerson-Day× NPerson) /(S/home)] / 240 (minutes in peak period) = [11.7% × (7.8 x 2.6 x 0.6 / 1.6)] / 240 = 0.00371. The Hours for showerheads is found to be 46.3: (TPerson-Day× NPersons× 365) /(S/home) / 60 = (7.8 x 2.6 x 0.6 x 365) / 1.6 / 60 = 46.3. The resulting FED is calculated to be 0.00008013: CF / Hours = 0.00371 / 46.3 = 0.00008013.
9) Figure 4-17, Section 4.6.1 of the 2014 Pennsylvania Statewide Residential End-Use and Saturation Study. This study finds that only 43% of households statewide have an electric water heater. As such, if the proportion of households with electric water heaters is unknown, deemed savings should only be applied to 43% of the study group.
10) NEEA Heat Pump Water Heater Field Study Report. Prepared by Fluid Market Strategies. October 22, 2013. http://neea.org/docs/default-source/reports/heat-pump-water-heater-field-study-report.pdf?sfvrsn=5
SECTION 2: Residential MeasuresDomestic Hot Water Page 129
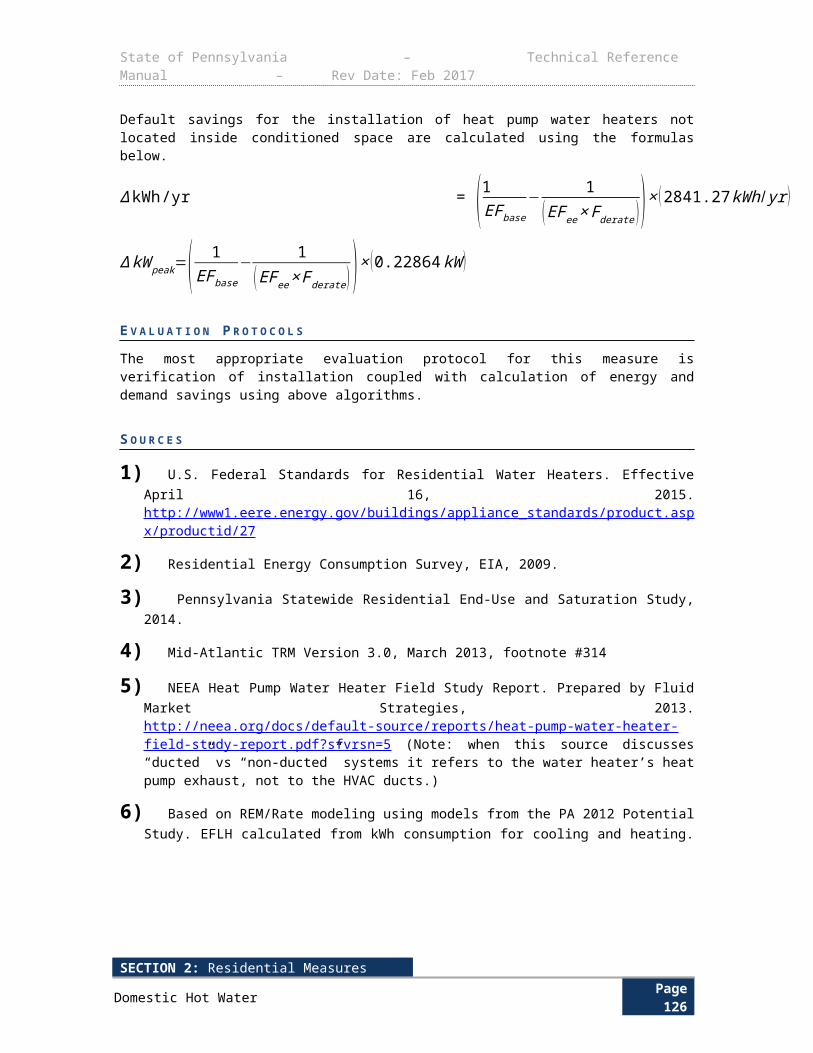
State of Pennsylvania – Technical Reference Manual – Rev Date: Feb 2017
2.4 APPLIANCES2.4.1 ENERGY STAR REFRIGERATORS
Measure Name Refrigerators
Target Sector Residential Establishments
Measure Unit Refrigerator
Unit Energy Savings Varies by Configuration
Unit Peak Demand Reduction Varies by Configuration
Measure Life 12 years139
Vintage Replace on Burnout
E L I G I B I L I T Y This measure is for the purchase and installation of a new refrigerator meeting ENERGY STAR or ENERGY STAR Most Efficient criteria. An ENERGY STAR refrigerator is about 10 percent more efficient than the minimum federal government standard. The ENERGY STAR Most Efficient is a new certification that identifies the most efficient products among those that qualify for ENERGY STAR. ENERGY STAR Most Efficient refrigerators must be at least 15 percent more efficient than the minimum federal standard.
A L G O R I T H M S
The general form of the equation for the ENERGY STAR Refrigerator measure savings algorithm is:
Total Savings ¿Number of Refrigerators×Savings per Refrigerator
To determine resource savings, the per-unit estimates in the algorithms will be multiplied by the number of refrigerators. The number of refrigerators will be determined using market assessments and market tracking.
If the volume and configuration of the refrigerator is known, the baseline model’s annual energy consumption (kWhbase ) may be determined using Table 2-75.
The efficient model’s annual energy consumption (kWhee or kWhme ) may be determined using manufacturers’ test data for the given model. Where test data is not available the algorithms in Table 2-75 and Table 2-77 for “ENERGY STAR and ENERGY STAR Most Efficient maximum energy usage in kWh/year” may be used to determine the efficient energy consumption for a conservative savings estimate.
ENERGY STAR Refrigerator
ΔkWh/yr ¿kWhbase – kWhee
ΔkWpeak ¿(kWhbase – kWhee)× ETDF
ENERGY STAR Most Efficient Refrigerator
ΔkWh/yr ¿kWhbase – kWhme
139 Alignment with New York and Michigan TRM.
SECTION 2: Residential MeasuresAppliances Page 130
State of Pennsylvania – Technical Reference Manual – Rev Date: Feb 2017
ΔkWpeak ¿ (kWhbase – kWhme)×ETDF
D E F I N I T I O N O F T E R M S
Table 2-74: Assumptions for ENERGY STAR Refrigerators
Term Unit Value Source
kWhbase , Annual energy consumption of baseline unit kWh/yr 1
kWhee , Annual energy consumption of ENERGY STAR qualified unit kWh/yr
EDC Data GatheringDefault= 2
kWhme , Annual energy consumption of ENERGY STAR Most Efficient qualified unit kWh/yr
EDC Data Gathering
Default = 3
ETDF , Energy to Demand FactorkW
kWh / yr0.0001119 4
Refrigerator energy use is characterized by configuration (top freezer, bottom freezer, etc.), volume, whether defrost is manual or automatic and whether there is through-the-door ice. If this information is known, annual energy consumption (kWhbase) of the federal standard model may be determined using Table 2-75. The efficient model’s annual energy consumption (kWhee or kWhme) may be determined using manufacturer’s test data for the given model. Where test data is not available, the algorithms in Table 2-75 and Table 2-77 for “ENERGY STAR and ENERGY STAR Most Efficient maximum energy usage in kWh/year” may be used to determine efficient energy consumption for a conservative savings estimate. The term “AV” in the equations refers to “Adjusted Volume” in ft3, where AV = (Fresh Volume) + 1.63 x (Freezer Volume).
Table 2-75: Federal Standard and ENERGY STAR Refrigerators Maximum Annual Energy Consumption if Configuration and Volume Known140
Refrigerator Category
Federal Standard Maximum Usage in
kWh/yr
ENERGY STAR Maximum Energy Usage in kWh/yr
Standard Size Models: 7.75 cubic feet or greater
1. Refrigerator-freezers and refrigerators other than all-refrigerators with manual defrost. 7.99AV + 225.0 7.19 * AV + 202.5
1A. All-refrigerators—manual defrost. 6.79AV + 193.6 6.11 * AV + 174.2
2. Refrigerator-freezers—partial automatic defrost 7.99AV + 225.0 7.19 * AV + 202.5
3. Refrigerator-freezers—automatic defrost with top-mounted freezer without an automatic icemaker. 8.07AV + 233.7 7.26 * AV + 210.3
3-BI. Built-in refrigerator-freezer—automatic defrost with top-mounted freezer without an automatic
9.15AV + 264.9 8.24 * AV + 238.4
140 Aquacraft, Inc., Water Engineering and Management. The end use of hot water in single family homes from flow trace analysis. 2001. http://s3.amazonaws.com/zanran_storage/www.aquacraft.com/ContentPages/47768067.pdf.
SECTION 2: Residential MeasuresAppliances Page 131
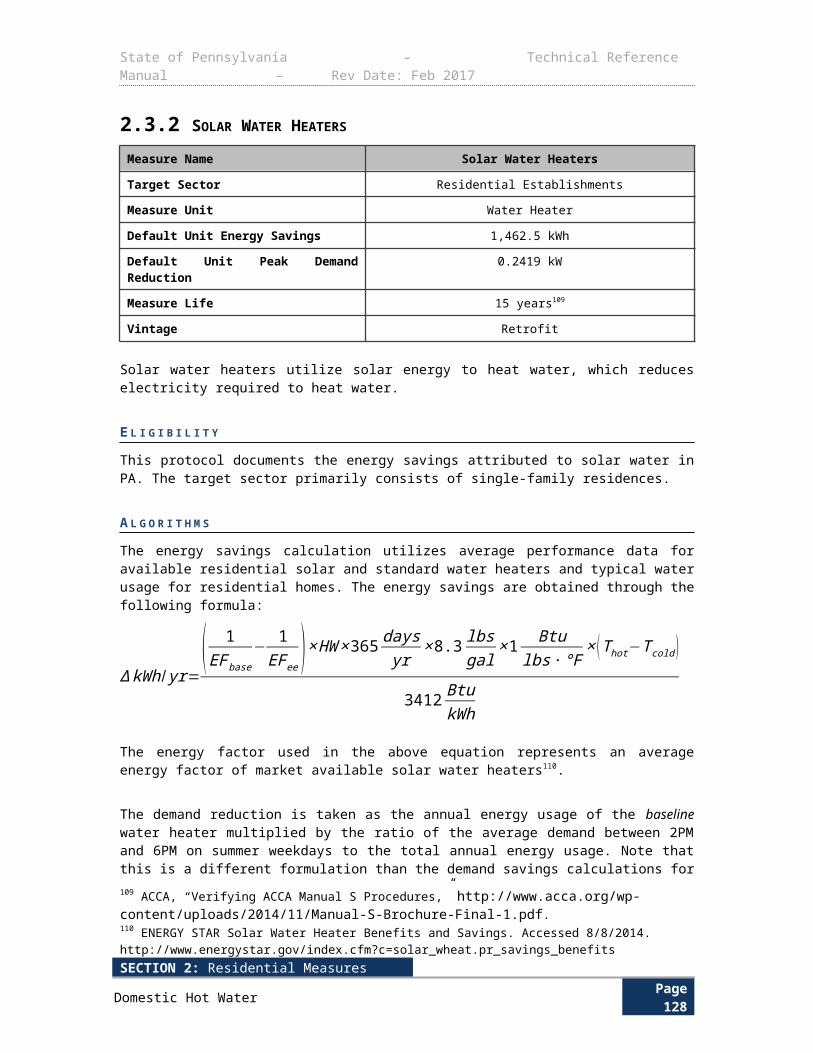
State of Pennsylvania – Technical Reference Manual – Rev Date: Feb 2017
Refrigerator Category
Federal Standard Maximum Usage in
kWh/yr
ENERGY STAR Maximum Energy Usage in kWh/yr
icemaker.
3I. Refrigerator-freezers—automatic defrost with top-mounted freezer with an automatic icemaker without through-the-door ice service.
8.07AV + 317.7 7.26 * AV + 294.3
3I-BI. Built-in refrigerator-freezers—automatic defrost with top-mounted freezer with an automatic icemaker without through-the-door ice service.
9.15AV + 348.9 8.24 * AV + 322.4
3A. All-refrigerators—automatic defrost. 7.07AV + 201.6 6.36 * AV + 181.4
3A-BI. Built-in All-refrigerators—automatic defrost. 8.02AV + 228.5 7.22 * AV + 205.7
4. Refrigerator-freezers—automatic defrost with side-mounted freezer without an automatic icemaker. 8.51AV + 297.8 7.66 * AV + 268.0
4-BI. Built-In Refrigerator-freezers—automatic defrost with side-mounted freezer without an automatic icemaker.
10.22AV + 357.4 9.20 * AV + 321.7
4I. Refrigerator-freezers—automatic defrost with side-mounted freezer with an automatic icemaker without through-the-door ice service.
8.51AV + 381.8 7.66 * AV + 352.0
4I-BI. Built-In Refrigerator-freezers—automatic defrost with side-mounted freezer with an automatic icemaker without through-the-door ice service.
10.22AV + 441.4 9.20 * AV + 405.7
5. Refrigerator-freezers—automatic defrost with bottom-mounted freezer without an automatic icemaker.
8.85AV + 317.0 7.97 * AV + 285.3
5-BI. Built-In Refrigerator-freezers—automatic defrost with bottom-mounted freezer without an automatic icemaker.
9.40AV + 336.9 8.46 * AV + 303.2
5I. Refrigerator-freezers—automatic defrost with bottom-mounted freezer with an automatic icemaker without through-the-door ice service.
8.85AV + 401.0 7.97 * AV + 369.3
5I-BI. Built-In Refrigerator-freezers—automatic defrost with bottom-mounted freezer with an automatic icemaker without through-the-door ice service.
9.40AV + 420.9 8.46 * AV + 387.2
5A. Refrigerator-freezer—automatic defrost with bottom-mounted freezer with through-the-door ice service.
9.25AV + 475.4 8.33 * AV + 436.3
5A-BI. Built-in refrigerator-freezer—automatic defrost with bottom-mounted freezer with through-the-door ice service.
9.83AV + 499.9 8.85 * AV + 458.3
6. Refrigerator-freezers—automatic defrost with top-mounted freezer with through-the-door ice service. 8.40AV + 385.4 7.56 * AV + 355.3
7. Refrigerator-freezers—automatic defrost with side-mounted freezer with through-the-door ice service. 8.54AV + 432.8 7.69 * AV + 397.9
7-BI. Built-In Refrigerator-freezers—automatic defrost with side-mounted freezer with through-the-door ice
10.25AV + 502.6 9.23 * AV + 460.7
SECTION 2: Residential MeasuresAppliances Page 132
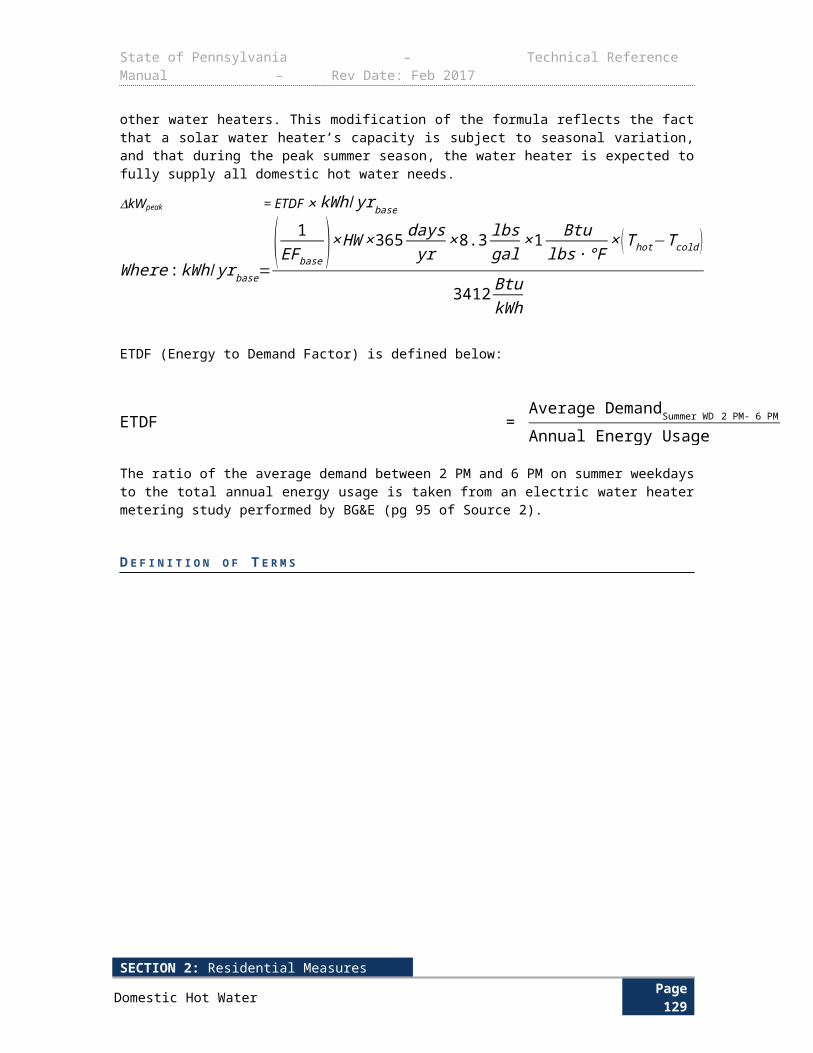
State of Pennsylvania – Technical Reference Manual – Rev Date: Feb 2017
Refrigerator Category
Federal Standard Maximum Usage in
kWh/yr
ENERGY STAR Maximum Energy Usage in kWh/yr
service.
Compact Size Models: Less than 7.75 cubic feet and 36 inches or less in height
11. Compact refrigerator-freezers and refrigerators other than all-refrigerators with manual defrost. 9.03AV + 252.3 8.13 * AV + 227.1
11A.Compact all-refrigerators—manual defrost. 7.84AV + 219.1 7.06 * AV + 197.2
12. Compact refrigerator-freezers—partial automatic defrost 5.91AV + 335.8 5.32 * AV + 302.2
13. Compact refrigerator-freezers—automatic defrost with top-mounted freezer. 11.80AV + 339.2 10.62 * AV + 305.3
13I. Compact refrigerator-freezers—automatic defrost with top-mounted freezer with an automatic icemaker. 11.80AV + 423.2 10.62 * AV + 389.3
13A. Compact all-refrigerators—automatic defrost. 9.17AV + 259.3 8.25 * AV + 233.4
14. Compact refrigerator-freezers—automatic defrost with side-mounted freezer. 6.82AV + 456.9 6.14 * AV + 411.2
14I. Compact refrigerator-freezers—automatic defrost with side-mounted freezer with an automatic icemaker. 6.82AV + 540.9 6.14 * AV + 495.2
15. Compact refrigerator-freezers—automatic defrost with bottom-mounted freezer. 11.80AV + 339.2 10.62 * AV + 305.3
15I. Compact refrigerator-freezers—automatic defrost with bottom-mounted freezer with an automatic icemaker.
11.80AV + 423.2 10.62 * AV + 389.3
The default values for each configuration are given in Table 2-76.
Table 2-76: Default Savings Values for ENERGY STAR Refrigerators141
Refrigerator Category
Assumed Volume of
Unit (cubic feet)142
Conventional Unit Energy
Usage in kWh/yr
ENERGY STAR
Energy Usage in kWh/yr ΔkWh/yr ΔkWpeak
1A. All-refrigerators—manual defrost.
12.2 276 249 28 0.0031
2. Refrigerator-freezers—partial automatic defrost
12.2 322 290 32 0.0036
3I. Refrigerator-freezers—automatic defrost with top-mounted freezer with an automatic icemaker without
17.9 462 424 38 0.0042
141 ENERGY STAR Appliances.November 2013. U.S. Environmental Protection Agency and U.S. Department of Enegy. ENERGY STAR. http://www.energystar.gov/.142 Lettering convention (1, 1A, etc) of Federal standard and ENERGY STAR specifications included for clear reference to the standards as well as for correspondence to entries in the default savings table.
SECTION 2: Residential MeasuresAppliances Page 133
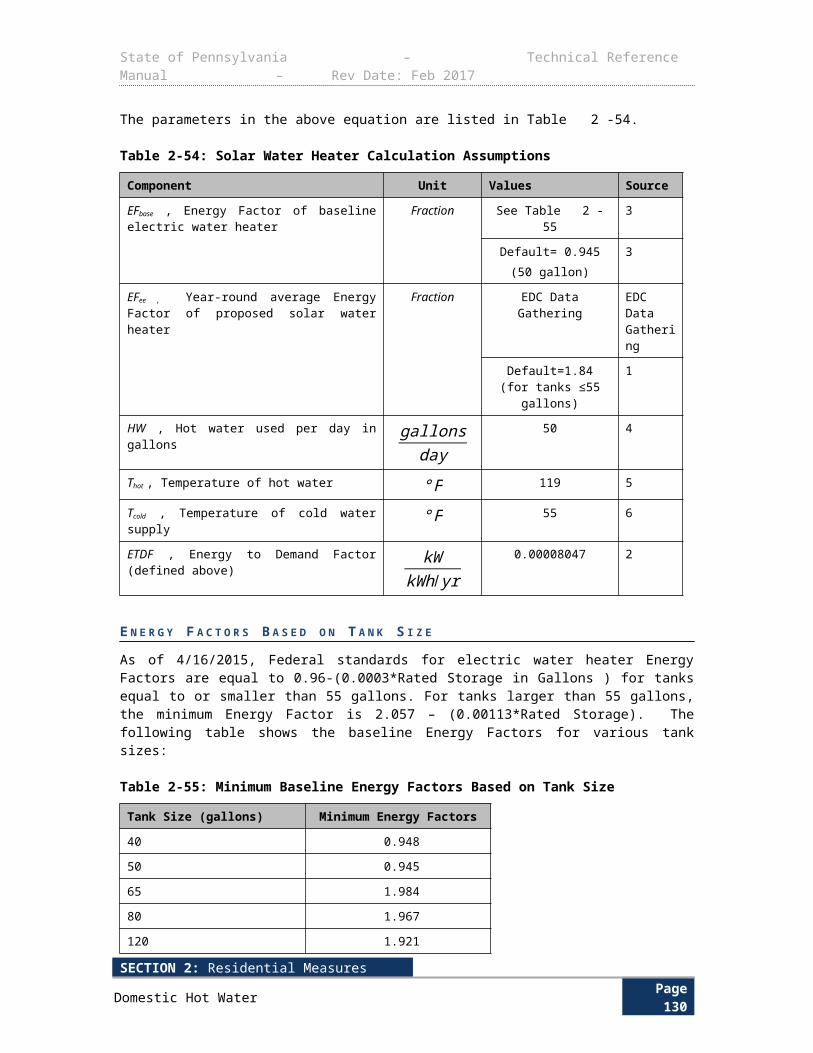
State of Pennsylvania – Technical Reference Manual – Rev Date: Feb 2017
Refrigerator Category
Assumed Volume of
Unit (cubic feet)
Conventional Unit Energy
Usage in kWh/yr
ENERGY STAR
Energy Usage in kWh/yr ΔkWh/yr ΔkWpeak
through-the-door ice service.
4I. Refrigerator-freezers—automatic defrost with side-mounted freezer with an automatic icemaker without through-the-door ice service.
22.7 575 526 49 0.0055
5I. Refrigerator-freezers—automatic defrost with bottom-mounted freezer with an automatic icemaker without through-the-door ice service.
20.0 578 529 49 0.0055
7. Refrigerator-freezers—automatic defrost with side-mounted freezer with through-the-door ice service.
24.6 643 587 56 0.0062
5A. Refrigerator-freezer—automatic defrost with bottom-mounted freezer with through-the-door ice service.
25.4 710 648 62 0.0070
3A. All-refrigerators—automatic defrost.
12.2 288 259 29 0.0032
Compact Size Models: Less than 7.75 cubic feet and 36 inches or less in height
11A.Compact all-refrigerators—manual defrost.
3.3 245 220 24 0.0027
12. Compact refrigerator-freezers—partial automatic defrost
3.3 355 320 36 0.0040
13. Compact refrigerator-freezers—automatic defrost with top-mounted freezer.
4.5 392 353 39 0.0044
15. Compact refrigerator-freezers—automatic defrost with bottom-mounted freezer.
5.1 399 359 40 0.0045
ENERGY STAR Most Efficient annual energy consumption (kWhme) may be determined using manufacturer’s test data for the given model. Where test data is not available, the algorithms in Table 2-77 for “ENERGY STAR Most Efficient maximum energy usage in kWh/year” may be used to determine efficient energy consumption for a conservative savings estimate. Baseline annual energy usage consumption (kWhbase) of the federal standard model may be determined using Table 2-75. “Eann” stands for Maximum Annual Energy Usage.
Table 2-77: ENERGY STAR Most Efficient Annual Energy Usage if Configuration and Volume Known
Refrigerator CategoryENERGY STAR Most Efficient Maximum Annual
Energy Usage in kWh/yr
1. Refrigerator-freezers and refrigerators other than AV ≤ 65.6, Eann ≤ 6.79*AV + 191.3
SECTION 2: Residential MeasuresAppliances Page 134
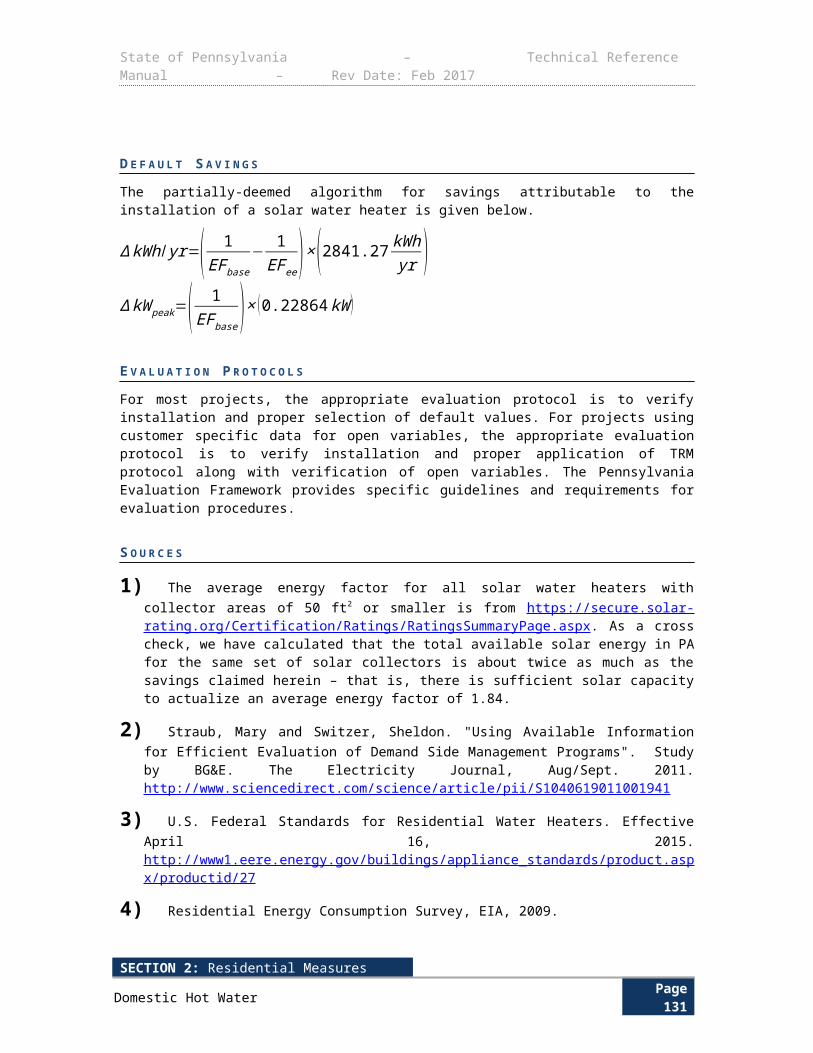
State of Pennsylvania – Technical Reference Manual – Rev Date: Feb 2017
Refrigerator CategoryENERGY STAR Most Efficient Maximum Annual
Energy Usage in kWh/yr
all-refrigerators with manual defrost. AV > 65.6, Eann ≤ 637
2. Refrigerator-freezers—partial automatic defrostAV ≤ 65.6, Eann ≤ 6.79*AV + 191.3
AV > 65.6, Eann ≤ 637
3. Refrigerator-freezers—automatic defrost with top-mounted freezer without an automatic icemaker.
AV ≤ 63.9, Eann ≤ 6.86*AV + 198.6AV > 63.9, Eann ≤ 637
3-BI. Built-in refrigerator-freezer—automatic defrost with top-mounted freezer without an automatic icemaker.
AV ≤ 63.9, Eann ≤ 6.86*AV + 198.6AV > 63.9, Eann ≤ 637
3I. Refrigerator-freezers—automatic defrost with top-mounted freezer with an automatic icemaker without through-the-door ice service.
AV ≤ 51.6, Eann ≤ 6.86*AV + 282.6AV > 51.6, Eann ≤ 637
3I-BI. Built-in refrigerator-freezers—automatic defrost with top-mounted freezer with an automatic icemaker without through-the-door ice service.
AV ≤ 51.6, Eann ≤ 6.86*AV + 282.6AV > 51.6, Eann ≤ 637
4. Refrigerator-freezers—automatic defrost with side-mounted freezer without an automatic icemaker.
AV ≤ 53.0, Eann ≤ 7.23*AV + 253.1AV > 53.0, Eann ≤ 637
4-BI. Built-In Refrigerator-freezers—automatic defrost with side-mounted freezer without an automatic icemaker.
AV ≤ 53.0, Eann ≤ 7.23*AV + 253.1AV > 53.0, Eann ≤ 637
4I. Refrigerator-freezers—automatic defrost with side-mounted freezer with an automatic icemaker without through-the-door ice service.
AV ≤ 41.4, Eann ≤ 7.23*AV + 337.1AV > 41.4, Eann ≤ 637
4I-BI. Built-In Refrigerator-freezers—automatic defrost with side-mounted freezer with an automatic icemaker without through-the-door ice service.
AV ≤ 41.4, Eann ≤ 7.23*AV + 337.1AV > 41.4, Eann ≤ 637
5. Refrigerator-freezers—automatic defrost with bottom-mounted freezer without an automatic icemaker.
AV ≤ 48.8, Eann ≤ 7.52*AV + 269.5AV > 48.8, Eann ≤ 637
5-BI. Built-In Refrigerator-freezers—automatic defrost with bottom-mounted freezer without an automatic icemaker.
AV ≤ 48.8, Eann ≤ 7.52*AV + 269.5AV > 48.8, Eann ≤ 637
5I. Refrigerator-freezers—automatic defrost with bottom-mounted freezer with an automatic icemaker without through-the-door ice service.
AV ≤ 37.7, Eann ≤ 7.52*AV + 353.5AV > 37.7, Eann ≤ 637
5I-BI. Built-In Refrigerator-freezers—automatic defrost with bottom-mounted freezer with an automatic icemaker without through-the-door ice service.
AV ≤ 37.7, Eann ≤ 7.52*AV + 353.5AV > 37.7, Eann ≤ 637
5A. Refrigerator-freezer—automatic defrost with bottom-mounted freezer with through-the-door ice service.
AV ≤ 28.0, Eann ≤ 7.86*AV + 416.7AV > 28.0, Eann ≤ 637
5A-BI. Built-in refrigerator-freezer—automatic defrost with bottom-mounted freezer with through-
AV ≤ 28.0, Eann ≤ 7.86*AV + 416.7
SECTION 2: Residential MeasuresAppliances Page 135
State of Pennsylvania – Technical Reference Manual – Rev Date: Feb 2017
Refrigerator CategoryENERGY STAR Most Efficient Maximum Annual
Energy Usage in kWh/yr
the-door ice service. AV > 28.0, Eann ≤ 637
6. Refrigerator-freezers—automatic defrost with top-mounted freezer with through-the-door ice service.
AV < 41.5, Eann ≤ 7.14*AV + 340.2AV > 41.5, Eann ≤ 637
7. Refrigerator-freezers—automatic defrost with side-mounted freezer with through-the-door ice service.
AV ≤ 35.3, Eann ≤ 7.26*AV + 380.5AV > 35.3, Eann ≤ 637
7-BI. Built-In Refrigerator-freezers—automatic defrost with side-mounted freezer with through-the-door ice service.
AV ≤ 35.3, Eann ≤ 7.26*AV + 380.5AV > 35.3, Eann ≤ 637
D E F A U L T S A V I N G S
The default values for each ENERGY STAR Most Efficient configuration are given in Table 2-78.
Table 2-78: Default Savings Values for ENERGY STAR Most Efficient Refrigerators143
Refrigerator Category
Assumed Volume of Unit (cubic feet)144
Conventional Unit Energy
Usage in kWh/yr145
ENERGY STAR Most
Efficient Consumption in kWh/yr146 ΔkWh/yr ΔkWpeak
5. Refrigerator-freezers—automatic defrost with bottom-mounted freezer without an automatic icemaker.
14.3 449 358 91 0.0102
5I. Refrigerator-freezers—automatic defrost with bottom-mounted freezer with an automatic icemaker without through-the-door ice service.
26.2 633 538 95 0.0106
5A. Refrigerator-freezer—automatic defrost with bottom-mounted freezer with through-the-door ice service.
32.1 772 631 141 0.0158
E V A L U A T I O N P R O T O C O L S
For most projects, the appropriate evaluation protocol is to verify installation and proper selection of default values. For projects using customer specific data for open variables, the appropriate evaluation protocol is to verify installation and proper application of TRM protocol along with verification of open variables. The Pennsylvania Evaluation Framework provides specific guidelines and requirements for evaluation procedures.
143 Lettering convention (1A, 2, etc) of Federal standard and ENERGY STAR specifications included for clear reference to the standards as well as for correspondence to entries in the default savings table.144 ENERGY STAR Appliances Calculator. Accessed November 2013.145 Configurations of qualified models as of June 2, 2015.146 Average Adjusted Volume of qualified models within the category. As of June 2, 2015.
SECTION 2: Residential MeasuresAppliances Page 136
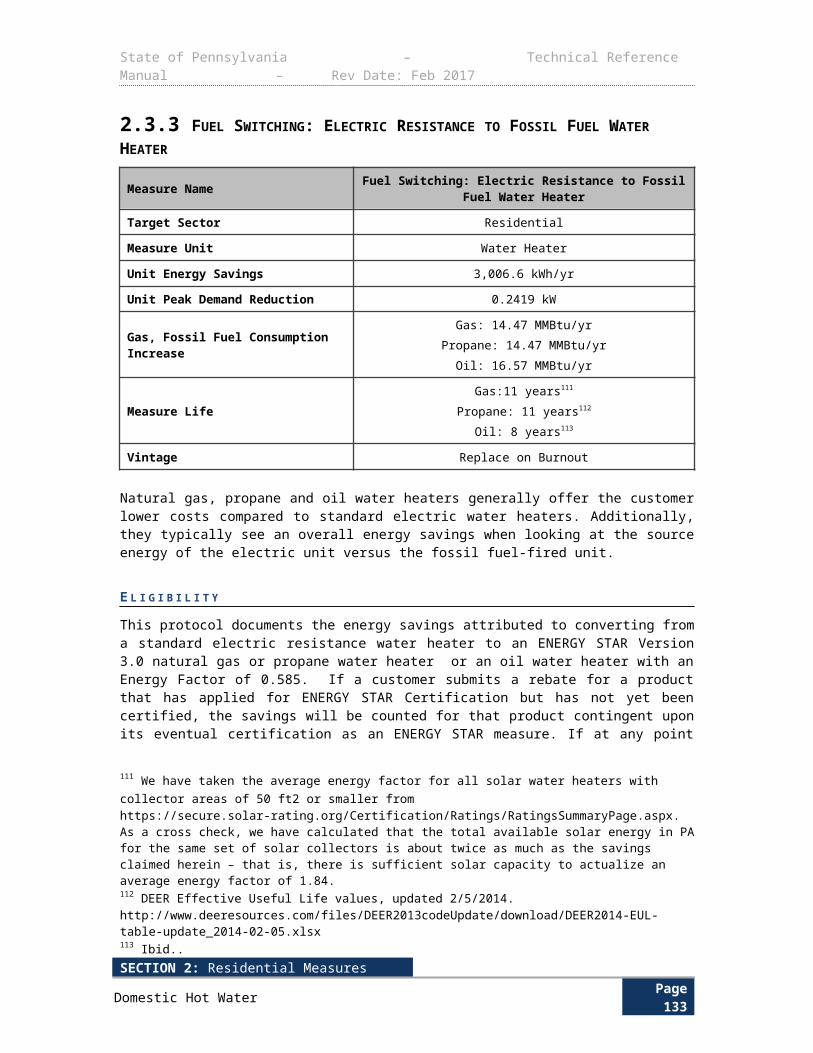
State of Pennsylvania – Technical Reference Manual – Rev Date: Feb 2017
S O U R C E S
1) Federal Standards for Residential Refrigerators and Freezers, Effective 9/14/2014. http://www1.eere.energy.gov/buildings/appliance_standards/product.aspx/productid/43
2) ENERGY STAR Program Requirements Product Specifications for Residential Refrigerators and Freezers Version 5.0. Effective 9/15/2014. http://www.energystar.gov/products/specs/system/files/ENERGY%20STAR%20Final%20Version%205.0%20Residential%20Refrigerators%20and%20Freezers%20Program%20Requirements.pdf
3) ENERGY STAR Recognition Criteria for Most Efficient Refrigerator-Freezers. Table 2. http://www.energystar.gov/ia/partners/downloads/most_efficient/final_criteria/Refrigerator-Freezers.pdf?6a37-2bde
4) Assessment of Energy and Capacity Savings Potential In Iowa. Quantec in collaboration with Summit Blue Consulting, Nexant, Inc., A-TEC Energy Corporation, and Britt/Makela Group, prepared for the Iowa utility Association, February 2008. http://plainsjustice.org/files/EEP-08-1/Quantec/QuantecReportVol1.pdf
SECTION 2: Residential MeasuresAppliances Page 137
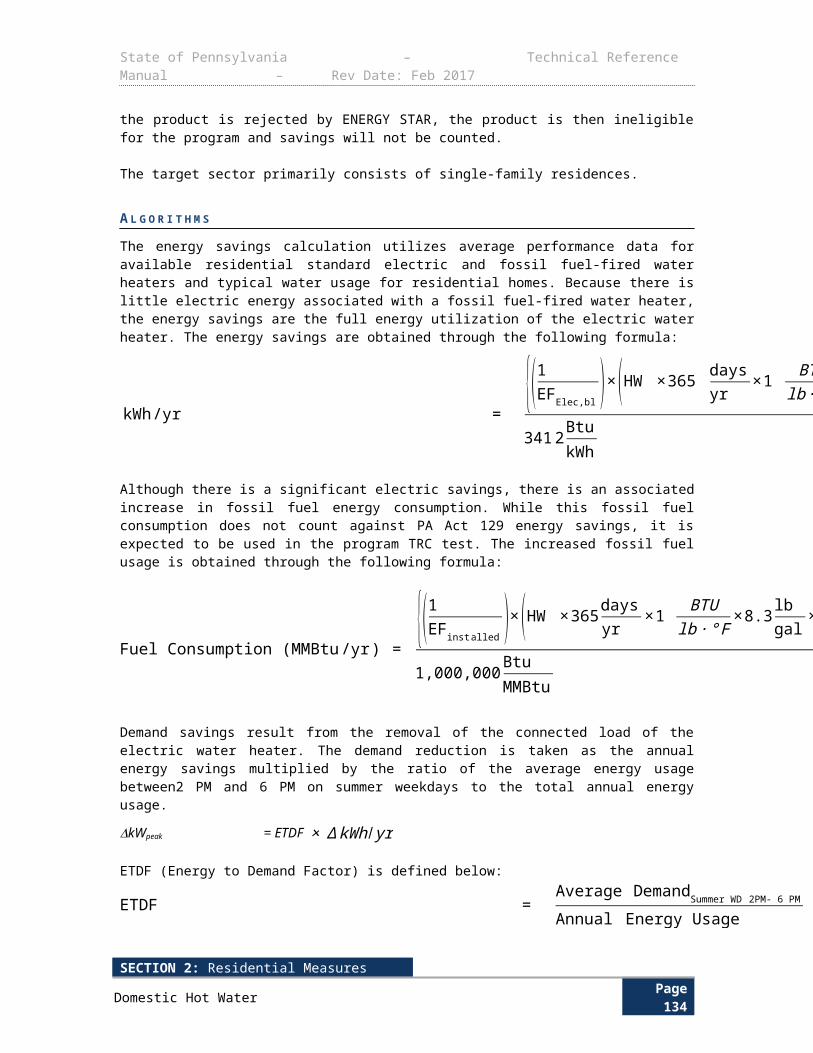
State of Pennsylvania – Technical Reference Manual – Rev Date: Feb 2017
2.4.2 ENERGY STAR FREEZERS
Measure Name Freezers
Target Sector Residential Establishments
Measure Unit Freezer
Unit Energy Savings Varies by Configuration
Unit Peak Demand Reduction Varies by Configuration
Measure Life 12 years147
Vintage Replace on Burnout
E L I G I B I L I T Y This measure is for the purchase and installation of a new freezer meeting ENERGY STAR criteria. An ENERGY STAR freezer must be at least 10 percent more efficient than the minimum federal government standard.
A L G O R I T H M S
The general form of the equation for the ENERGY STAR Freezer measure savings algorithm is:
Total Savings ¿Number of Freezers×Savings per Freezer
To determine resource savings, the per-unit estimates in the algorithms will be multiplied by the number of freezers. The number of freezers will be determined using market assessments and market tracking.
If the volume and configuration of the freezer is known, the baseline model’s annual energy consumption (kWhbase) may be are determined using Table 2-79. The efficient model’s annual energy consumption (kWhee) may be determined using manufacturer’s test data for the given model. Where test data is not available the algorithms in Table 2-80 for “ENERGY STAR Maximum Energy Usage in kWh/year” may be used to determine the efficient energy consumption for a conservative savings estimate
ENERGY STAR Freezer
ΔkWh/yr ¿kWhbase−kWhee
ΔkWpeak ¿(kWhbase−kWhee)×ETDF
D E F I N I T I O N O F T E R M S
147 ENERGY STAR Residential Refrigerators Qualified Products List. June 2, 2015. Average federal standard consumption of all qualifying models by configuration.
SECTION 2: Residential MeasuresAppliances Page 138
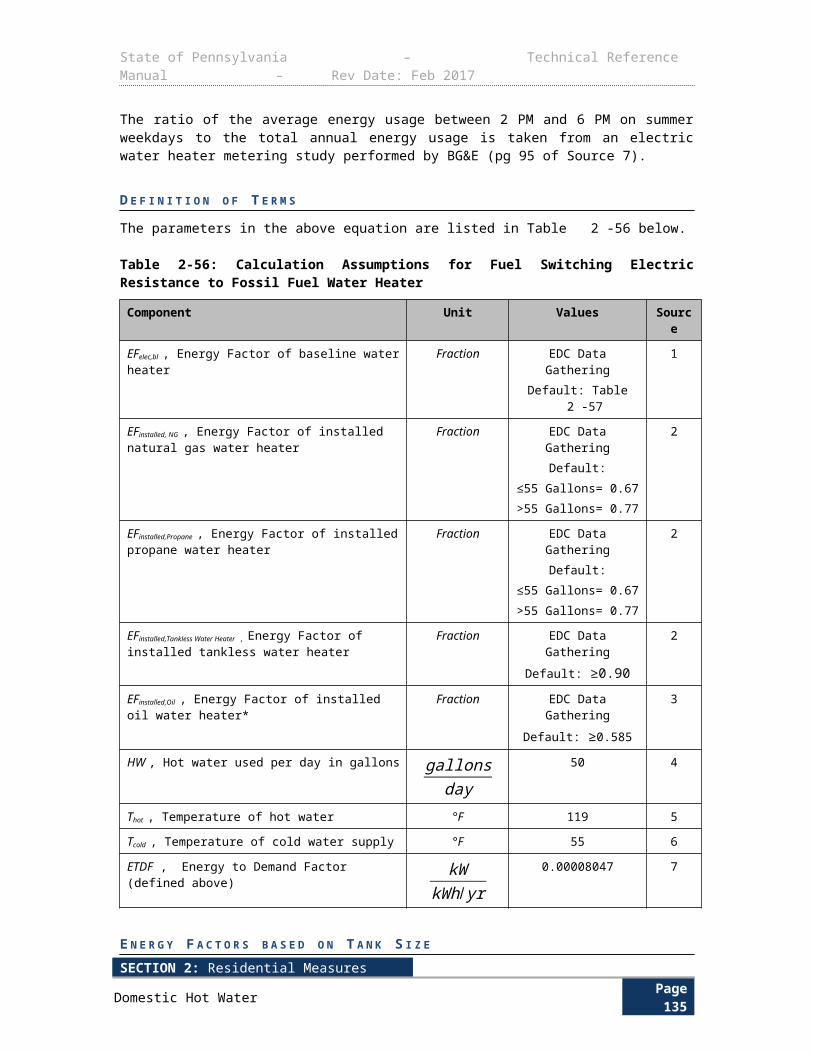
State of Pennsylvania – Technical Reference Manual – Rev Date: Feb 2017
Term Unit Value Source
kWhbase , Annual energy consumption of baseline unit kWh/yr 1
kWhee , Annual energy consumption of ENERGY STAR qualified unit kWh/yr
EDC Data Gathering
Default= 2
ETDF , Energy to Demand FactorkW
kWh / yr0.0001119 3
Freezer energy use is characterized by configuration (upright, chest or compact), volume and whether defrost is manual or automatic. If this information is known, annual energy consumption of the federal minimum efficiency standard model may be determined using Table 2-79. The efficient model’s annual energy consumption (kWhee) may be determined using manufacturers’ test data for the given model. Where test data is not available, the algorithms in Table 2-80 for “ENERGY STAR maximum energy usage in kWh/year” may be used to determine efficient energy consumption for a conservative savings estimate. The term “AV” in the equations refers to “Adjusted Volume,” which is AV = 1.73 x Total Volume.
Table 2-79: Federal Standard and ENERGY STAR Freezers Maximum Annual Energy Consumption if Configuration and Volume Known148
Freezer Category
Federal Standard Maximum Usage in
kWh/year
ENERGY STAR Maximum Energy Usage
in kWh/year8. Upright freezers with manual defrost. 5.57AV + 193.7 5.01 * AV + 174.39. Upright freezers with automatic defrost without an automatic icemaker. 8.62AV + 228.3 7.76 * AV + 205.5
9I. Upright freezers with automatic defrost with an automatic icemaker. 8.62AV + 312.3 7.76 * AV + 289.5
9-BI. Built-In Upright freezers with automatic defrost without an automatic icemaker. 9.86AV + 260.9 8.87 * AV + 234.8
9I-BI. Built-in upright freezers with automatic defrost with an automatic icemaker. 9.86AV + 344.9 8.87 * AV + 318.8
10. Chest freezers and all other freezers except compact freezers. 7.29AV + 107.8 6.56 * AV + 97.0
10A. Chest freezers with automatic defrost. 10.24AV + 148.1 9.22 * AV + 133.316. Compact upright freezers with manual defrost. 8.65AV + 225.7 7.79 * AV + 203.1
17. Compact upright freezers with automatic defrost. 10.17AV + 351.9 9.15 * AV + 316.7
18. Compact chest freezers. 9.25AV + 136.8 8.33 * AV + 123.1
The default values for each configuration are given in Table 2-80. Note that a compact freezer is defined as a freezer that has a volume less than 7.75 cubic feet and is 36 inches or less in height.
D E F A U L T S A V I N G S
148 Average consumption of all qualified units as of June 2, 2015. Qualified units list from https://data.energystar.gov/Active-Specifications/ENERGY-STAR-Most-Efficient-Residential-Refrigerato/hgxv-ux9b
SECTION 2: Residential MeasuresAppliances Page 139
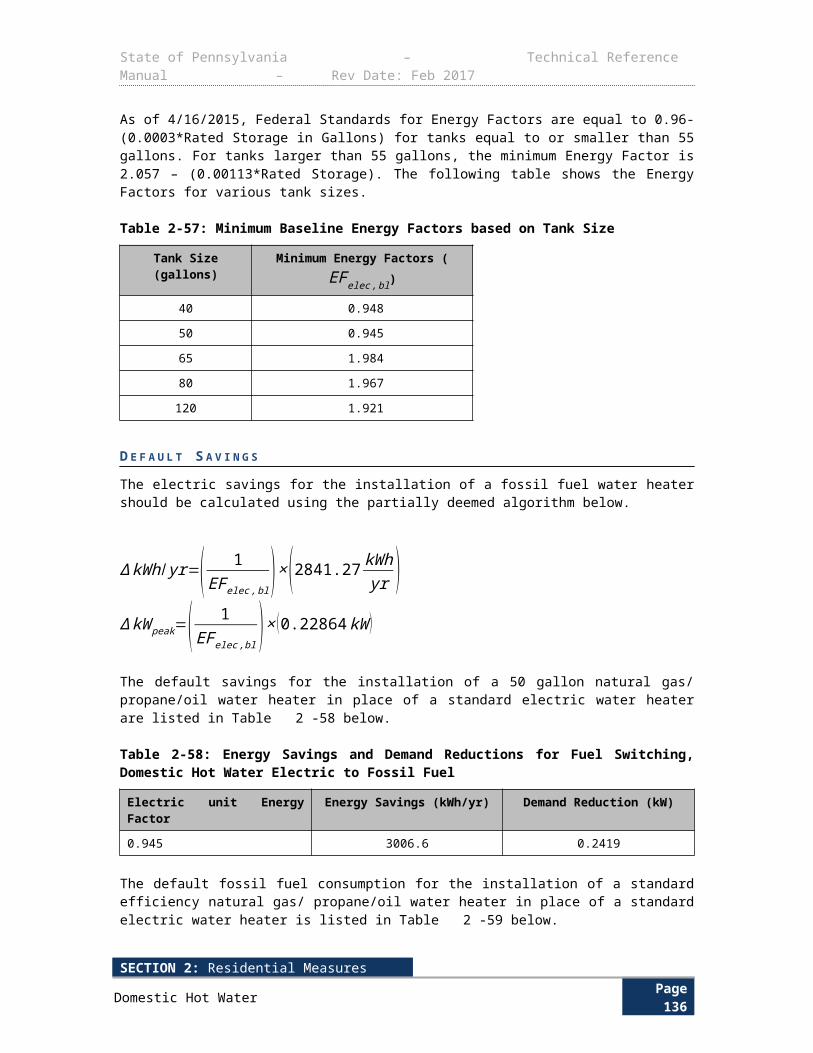
State of Pennsylvania – Technical Reference Manual – Rev Date: Feb 2017
Table 2-80: Default Savings Values for ENERGY STAR Freezers
Freezer Category
Average Adjusted
Volume of Qualified
Units in ft3
Conventional Unit
Energy Usage in
kWh/yrConventional Unit
Energy Usage in kWh/yr149
ENERGY STAR
Energy Usage in
kWh/yrENERGY STAR Energy
Usage in kWh/yr150 ΔkWh/yr ΔkWpeak
8. Upright freezers with manual defrost.
Currently no qualified
units9. Upright freezers with automatic defrost without an automatic icemaker.
24.7 441 419 22 0.0025
10. Chest freezers and all other freezers except compact freezers.
18.5 243 215 28 0.0031
16. Compact upright freezers with manual defrost. 3.7 258 232 26 0.0029
17. Compact upright freezers with automatic defrost. 7.7 430 367 63 0.0071
18. Compact chest freezers. 8.9 219 177 42 0.0047
E V A L U A T I O N P R O T O C O L S
For most projects, the appropriate evaluation protocol is to verify installation and proper selection of default values. For projects using customer specific data for open variables, the appropriate evaluation protocol is to verify installation and proper application of TRM protocol along with verification of open variables. The Pennsylvania Evaluation Framework provides specific guidelines and requirements for evaluation procedures.
S O U R C E S
1) Federal Standards for Residential Refrigerators and Freezers, Effective 9/14/2014. http://www1.eere.energy.gov/buildings/appliance_standards/product.aspx/productid/43
2) ENERGY STAR Program Requirements Product Specifications for Residential Refrigerators and Freezers Version 5.0. Effective 9/15/2014. http://www.energystar.gov/products/specs/system/files/ENERGY%20STAR%20Final%20Version%205.0%20Residential%20Refrigerators%20and%20Freezers%20Program%20Requirements.pdf
3) Assessment of Energy and Capacity Savings Potential In Iowa. Quantec in collaboration with Summit Blue Consulting, Nexant, Inc., A-TEC Energy Corporation, and Britt/Makela Group,
Conventional Unit Energy Usage in kWh/yr ENERGY STAR Appliances Savings Calculator. Accessed July 10, 2013.149 Lettering convention (8, 9, 9l, etc) of Federal standard and ENERGY STAR specifications included for clear reference to the standards as well as for correspondence to entries in the default savings table.ENERGY STAR Energy Usage in kWh/yr
150 ENERGY STAR Residential Freezers Qualified Products List. August 5, 2015. Average federal standard consumption of all qualifying models by configuration, https://data.energystar.gov/Active-Specifications/ENERGY-STAR-Certified-Residential-Freezers/2wah-sjxr?
SECTION 2: Residential MeasuresAppliances Page 140
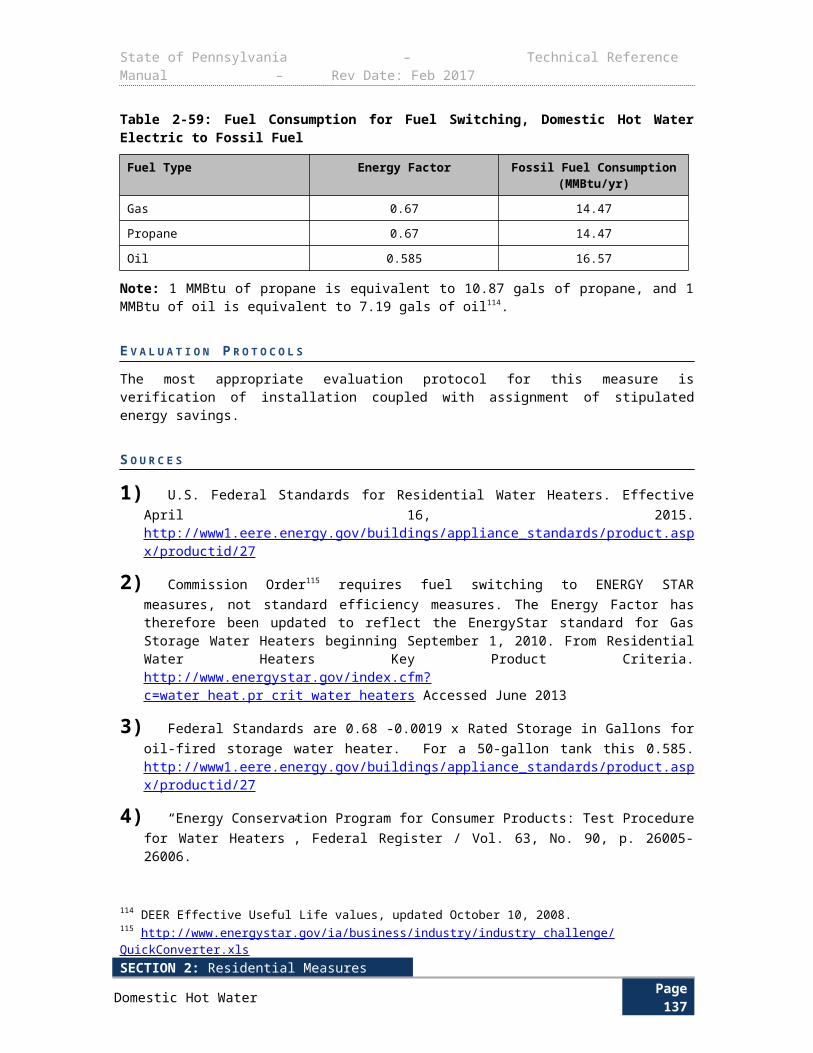
State of Pennsylvania – Technical Reference Manual – Rev Date: Feb 2017
prepared for the Iowa utility Association, February 2008. http://plainsjustice.org/files/EEP-08-1/Quantec/QuantecReportVol1.pdf
SECTION 2: Residential MeasuresAppliances Page 141
State of Pennsylvania – Technical Reference Manual – Rev Date: Feb 2017
2.4.3 REFRIGERATOR / FREEZER RECYCLING WITH AND WITHOUT REPLACEMENT
Measure Name Refrigerator/Freezer Recycling and Replacement
Target Sector Residential Establishments
Measure Unit Refrigerator or Freezer
Default Unit Annual Energy Savings- Refrigerators
Varies by EDC
Default Unit Peak Demand Reduction- Refrigerators
Varies by EDC
Default Unit Annual Energy Savings- Freezers
Varies by EDC
Default Unit Peak Demand Reduction- Freezers
Varies by EDC
Measure Life (no replacement) 8 years151
Vintage Early Retirement, Early Replacement
E L I G I B I L I T Y
Refrigerator recycling programs are designed to save energy through the removal of old-but operable refrigerators from service. By offering free pickup, providing incentives, and disseminating information about the operating cost of old refrigerators, these programs are designed to encourage consumers to:
Discontinue the use of secondary refrigerators
Relinquish refrigerators previously used as primary units when they are replaced (rather than keeping the old refrigerator as a secondary unit)
Prevent the continued use of old refrigerators in another household through a direct transfer (giving it away or selling it) or indirect transfer (resale on the used appliance market).
Commonly implemented by third-party contractors (who collect and decommission participating appliances), these programs generate energy savings through the retirement of inefficient appliances. The decommissioning process captures environmentally harmful refrigerants and foam and enables the recycling of the plastic, metal, and wiring components.
This protocol applies to both residential and non-residential sectors, as refrigerator and freezer usage and energy usage are assumed to be independent of customer rate class152. The savings algorithms are based on regression analysis of metered data on kWh consumption from other States. The savings algorithms for this measure can be applied to refrigerator and freezer retirements or early replacements meeting the following criteria:
1) Existing, working refrigerator or freezer 10-30 cubic feet in size (savings do not apply if unit is not working)
2) Unit is a primary or secondary unit
151
152 Ibid. Average ENERGY STAR consumption of all qualifying models by configuration.
SECTION 2: Residential MeasuresAppliances Page 142
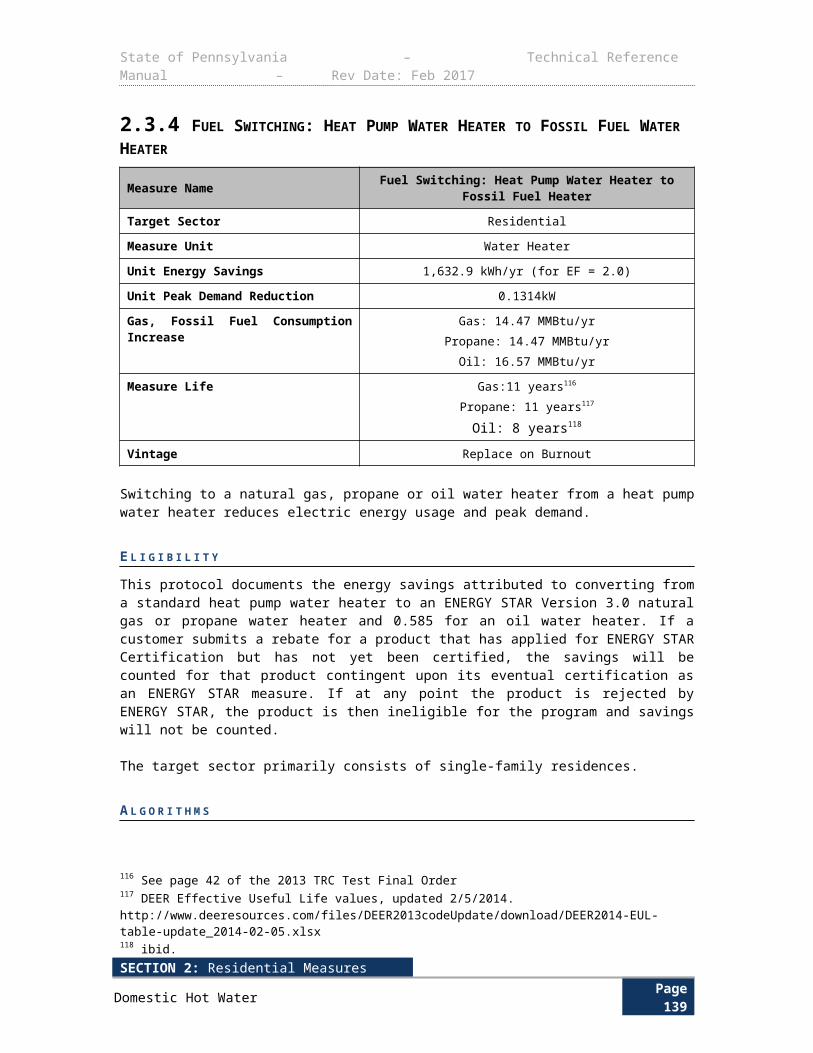
State of Pennsylvania – Technical Reference Manual – Rev Date: Feb 2017
EDCs can use the default values listed for each EDC in Table 2-82 and Table 2-83 or an EDC can calculate program savings using the savings algorithms, the Existing UEC regression equation coefficients, and actual program year recycled refrigerator/freezer data. An EDC’s use of actual program year data can provide a more accurate annual ex ante savings estimate due to the changing mix of recycled appliance models from year-to-year.
A L G O R I T H M S
The total energy savings (kWh/yr) achieved from recycling old-but-operable refrigerators is calculated using the following general algorithm:
ΔkWh/yr = N * EXISTING_UEC * PART_USE
When calculating net savings (kWh/yr) EDCs should review the SWE team Appliance Retirement NTG protocols in the Pennsylvania Evaluation Framework, which – like the gross savings protocols presented here – follow the recommendations of the U.S. DOE Uniform Method Project, Savings Protocol for Refrigerator Retirement, April 2013.153
Peak Demand SavingsUse the below algorithm to calculate the peak demand savings. Multiply the annual kWh savings by an Energy to Demand Factor (ETDF), which is supplied in Table 2-81 below.
ΔkWpeak ¿∆ kWh/ yr ×ETDF
D E F I N I T I O N O F T E R M S
Table 2-81: Calculation Assumptions and Definitions for Refrigerator and Freezer Recycling
Component Unit Values Source
EXISTING_UEC , The average annual unit energy consumption of participating refrigerators and freezers for Program year 5. Table 2-82 and Table 2-83 below provide the equation inputs needed to calculate the UEC for removed refrigerators and freezers respectively as well as the calculation of the default Unit Energy Consumption value for refrigerators or freezers for each EDC.
kWh/yr EDC Data GatheringOr Default = Table 2-82 and
Table 2-83
1, 2
PART_USE , The portion of the year the average refrigerator or freezer would likely have operated if not recycled through the program
% EDC Data Gathering According to Section 4.3 of
UMP ProtocolDefault:
Refrigerator= 96.9%Freezer= 98.5%
7
N , The number of refrigerators recycled through the program
None EDC Data Gathering
ETDF , Energy to Demand Factor kWkWh / yr
0.0001119 8
153 Vermont Energy Investment Corporation (VEIC) for NEEP, Mid Atlantic TRM Version 2.0. July 2011. Pg.36.
SECTION 2: Residential MeasuresAppliances Page 143
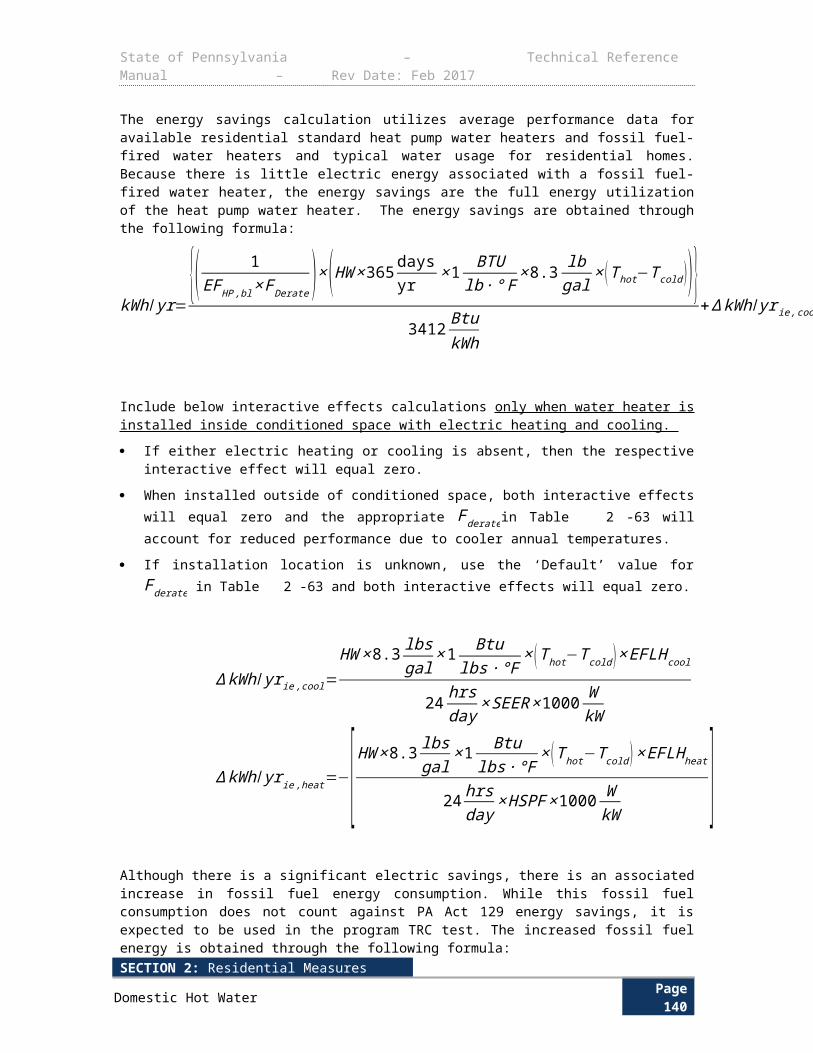
State of Pennsylvania – Technical Reference Manual – Rev Date: Feb 2017
U E C E Q U A T I O N S A N D D E F A U L T V A L U E S
For removed refrigerators, the annual Unit Energy Consumption (UEC) is based upon regression analyses of data from refrigerators metered and recycled through five utilities. The UEC for removed refrigerators was calculated specifically for each utility using data collected from each utility’s Program Year Five (PY5) Appliance Removal programs. Therefore, each UEC represents the average ages, sizes, etc of the fleet of refrigerators removed in Program Year Five.
ExistingUEC Refrigerator=365.25∗(0.582+0.027∗(average age of appliance)+1.055∗(%of appliances manufacturedbefore 1990)+0.067∗(number of cubic feet )– 1.977∗(% of singledoor units)+1.071∗(% of side−by−side)+0.605∗(%of primaryusage )+0.02∗(unconditioned spaceCDDs)−0.045∗(unconditioned HDDs))=kWh
Source for refrigerator UEC equation: US DOE Uniform Method Project, Savings Protocol for Refrigerator Retirement, April 2013.
Refrigerator UEC (Unit Energy Consumption) Equation
Equation Intercept and Independent Variables Estimate Coefficient (Daily kWh)Intercept 0.582
Appliance Age (years) 0.027
Dummy: Manufactured Pre-1990 1.055
Appliance Size (cubic feet) 0.067
Dummy: Single-Door Configuration -1.977
Dummy: Side-bu-Side Configuration 1.071
Dummy: Percent of Primary Usage (in absence of program) 0.6054
Interaction: Located in Unconditioned space x CDDs 0.02
Interaction: Located in Unconditioned space x HDDs -0.045
ExistingUEC Freezer=365.25days∗(−0.955+0.0454∗[averageage of appliance ]+0.543∗[%of appliances manufactured pre−1990 ]+0.120∗[average number of cubic feet ]+0.298∗[ %of appliance s that are chest freezers ]−0.031∗[HDDs]+0.082∗[CDDs ] )=kWh
Source for freezer UEC equation: Rocky Mountain Power Utah See ya later, refrigerator®: Program Evaluation Report 2011-2012. The Cadmus Group. 2013. (Used on recommendation of Doug Bruchs, author of UMP Refrigerator Recycling Protocol).
Freezer UEC (Unit Energy Consumption) EquationEquation Intercept and Independent Variables Estimate Coefficient (Daily kWh)
Intercept -0.955
Appliance Age (years) 0.0454
Dummy: Manufactured Pre-1990 0.543
Appliance Size (cubic feet) 0.120
% of appliances that are chest freezers 0.298
Interaction: Located in Unconditioned space x HDDs -0.031
Interaction: Located in Unconditioned space x CDDs 0.082
The Commission has computed the EDC-specific values that are needed for input to the regression equations for determining the Unit Energy Consumption based on Act 129 PY5 data provided by each EDC for refrigerators and freezers removed in PY5.
SECTION 2: Residential MeasuresAppliances Page 144

State of Pennsylvania – Technical Reference Manual – Rev Date: Feb 2017
Table 2-82 and Table 2-83 below provide the equation inputs needed to calculate the UEC for removed refrigerators and freezers, respectively. Note, however, that the percent of program units that were manufacturered prior to 1990 is expected to decline over time as more of these older units either fail or are already recycled through the program. Because these input values will be dropping each year, EDC data gathering – rather than default values – are required for this one input.154
Table 2-82: Default values for Residential Refrigerator Recycling UEC
Variable Name Duquesne PECO PPL Met Ed Penelec Penn Power
West Penn
PowerAppliance Age (years) 16.987 20.674 29.414 23.383 26.603 26.988 23.966
Manufactured Pre-1990 EDC Data Gathering
Appliance Size (cubic feet) 17.580 19.018 18.340 18.725 17.901 18.512 18.096
Single-Door Configuration 0.051 0.046 0.052 0.038 0.049 0.044 0.050
Side-by-Side Configuration 0.151 0.245 0.192 0.226 0.172 0.227 0.197
Percent of Primary Usage 0.449 0.202 0.652 0.195 0.574 0.496 0.489
Unconditioned space x CDDs 0.641 1.945 0.356 1.750 0.553 0.806 0.801
Unconditioned space x HDDs 5.069 8.150 2.078 9.723 5.957 6.376 6.340
Table 2-83: Default values for Residential Freezer Recycling UEC
Variable Name Duquesne PECO PPL Met Ed Penelec Penn
PowerWest Penn
PowerAppliance Age (years) 31.973 27.586 37.487 28.964 31.062 30.991 31.316
Dummy: Manufactured Pre-1990
EDC Data Gathering
Appliance Size (cubic feet) 15.525 15.157 15.742 15.471 15.841 15.953 15.892
% of appliances that are chest freezers
0.251 0.198 0.279 0.359 0.292 0.327 0.276
Interaction: Located in Unconditioned space x HDDs
10.148 9.241 4.927 10.950 11.402 10.495 10.800
Interaction: Located in Unconditioned space x CDDs
1.283 2.205 0.843 1.971 1.058 1.327 1.365
154 For example, non-residential rate class usage cases include residential dwellings that are master-metered, usage in offices or any other applications that involve typical refrigerator usage.
SECTION 2: Residential MeasuresAppliances Page 145
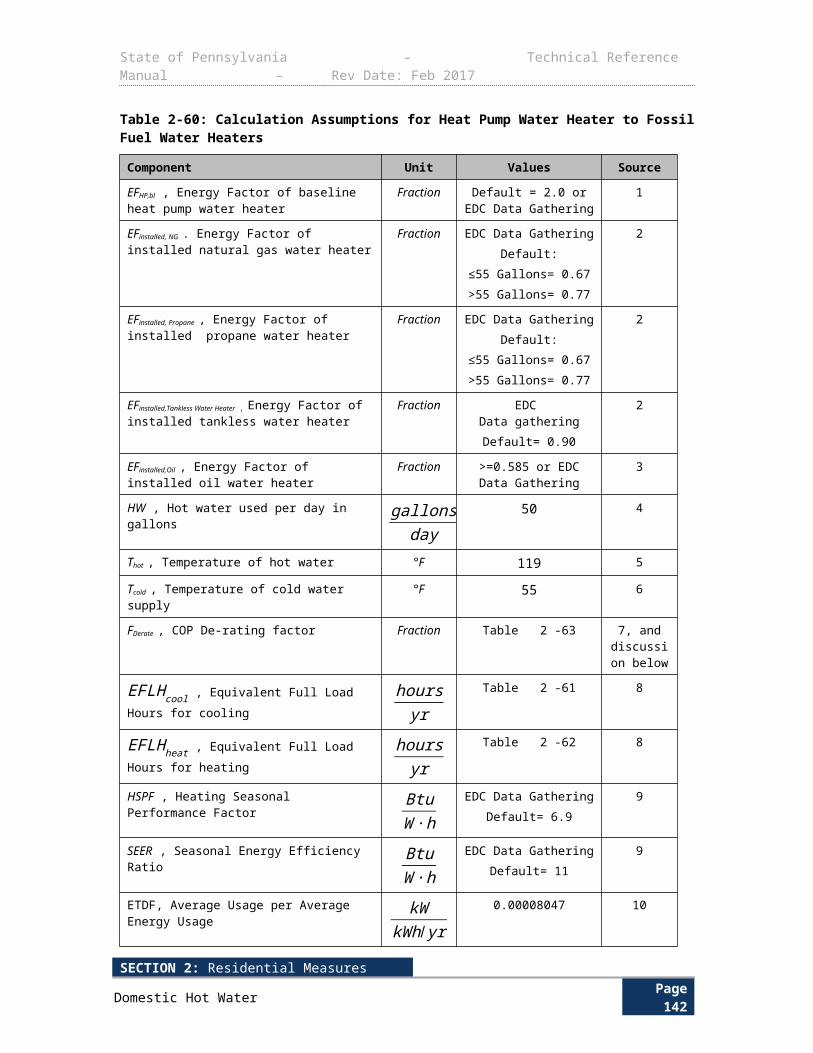
State of Pennsylvania – Technical Reference Manual – Rev Date: Feb 2017
P A R T - U S E F A C T O R
When calculating default per unit kWh savings for a removed refrigerator or freezer, it is necessary to calculate and apply a “Part-Use” factor. “Part-use” is an appliance recycling-specific adjustment factor used to convert the UEC (determined through the methods detailed above) into an average per-unit deemed savings value. The UEC itself is not equal to the default savings value, because: (1) the UEC model yields an estimate of annual consumption, and (2) not all recycled refrigerators and freezers would have operated year-round had they not been decommissioned through the program.
In Program Year 3, the Commission determined that the average removed refrigerator was plugged in and used 96.9% of the year and the average freezer was plugged in and used 98.5% of the year. Thus, the default value for the part-use factor is 96.9% (and 98.5%) based on program year 3 data for all EDCs. EDCs may elect to calculate an EDC specific part-use factor for a specific program year. In the event an EDC desires to calculate an EDC specific part-use factor, EDCs should use the methodology described in section 4.3 of the DOE, Uniform Methods Project protocol “Refrigerator Recycling Evaluation Protocol”, April 2013.
E V A L U A T I O N P R O T O C O L S
For most projects, the appropriate evaluation protocol is to verify installation and proper selection of default values. For projects using customer specific data for open variables, the appropriate evaluation protocol is to verify installation and proper application of TRM protocol along with verification of open variables. The Pennsylvania Evaluation Framework provides specific guidelines and requirements for evaluation procedures.
S O U R C E S
1) U.S. Department of Energy, Uniform Methods Project protocol titled “Refrigerator Recycling Evaluation Protocol”, prepared by Doug Bruchs and Josh Keeling of the Cadmus Group, April 2013.
2) Rocky Mountain Power Utah See ya later, refrigerator®: Program Evaluation Report 2011-2012. The Cadmus Group. 2013.
3) 2009-2010 Pacific Power/Rocky Mountain Power Impact Evaluations - PacifiCorp has impact evaluations for CA, ID, UT, WA, and WY that contain an earlier version of the multi-state Appliance Recycling Program regression models for both refrigerators and freezers. The Statewide Evaluator reviewed the report for the State of Washington, but all states include the same models and are publicly available online. The model coefficients can be found on pages 16 and 17 of the Washington document. http://www.pacificorp.com/content/dam/pacificorp/doc/Energy_Sources/Demand_Side_Management/WA_2011_SYLR_Final_Report.pdf
4) 2010 Ontario Power Authority Impact Evaluation - This evaluation report contains a regression equation for annual consumption for refrigerators only (the freezer sample was too small). That equation can be found on page 10 of the OPA evaluation report. See http://www.powerauthority.on.ca/sites/default/files/new_files/2010/2010%20Residential%20Great%20Refrigerator%20Roundup%20Program%20Evaluation.pdf
5) Efficiency Vermont; Technical Reference User Manual (TRM). 2008. TRM User Manual No. 2008-53. Burlington, VT 05401. July 18, 2008.
6) Mid Atlantic TRM Version 2.0. July 2011. Prepared by Vermont Energy Investment Corporation. Facilitated and managed by Northeast Energy Efficiency Partnerships.
7) Based on program year 3 data for all EDCs.
SECTION 2: Residential MeasuresAppliances Page 146
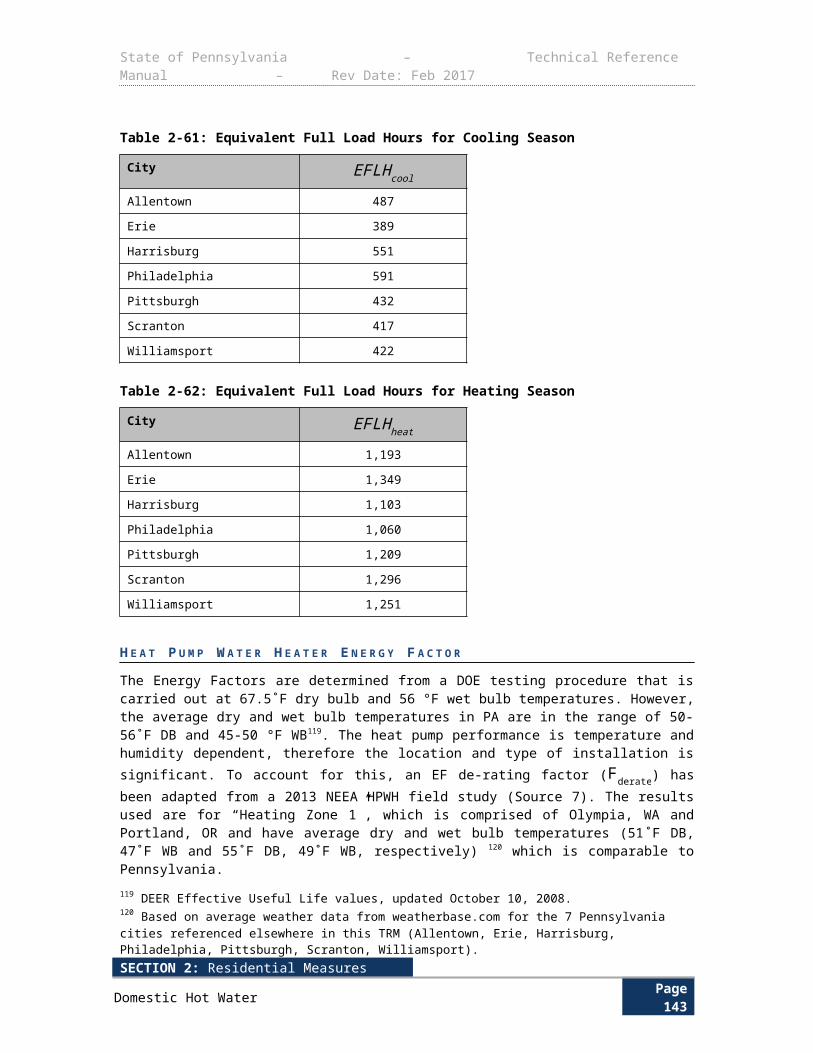
State of Pennsylvania – Technical Reference Manual – Rev Date: Feb 2017
8) Assessment of Energy and Capacity Savings Potential In Iowa. Quantec in collaboration with Summit Blue Consulting, Nexant, Inc., A-TEC Energy Corporation, and Britt/Makela Group, prepared for the Iowa utility Association, February 2008. http://plainsjustice.org/files/EEP-08-1/Quantec/QuantecReportVol1.pdf
SECTION 2: Residential MeasuresAppliances Page 147
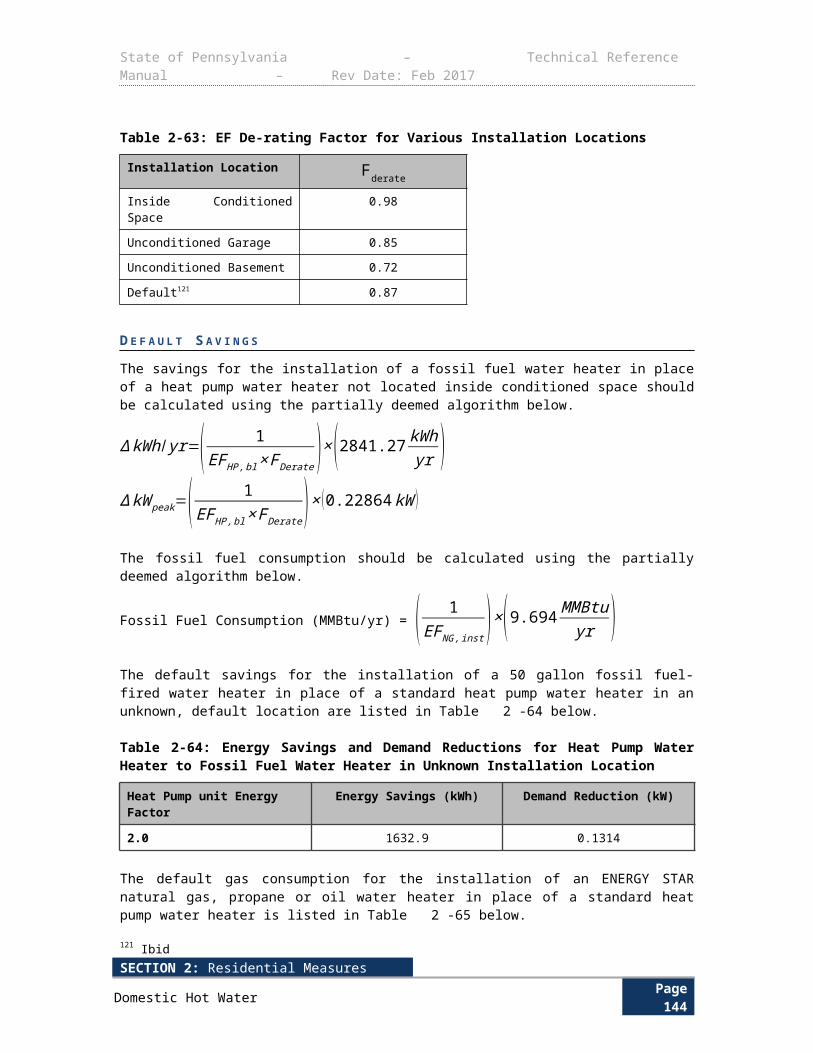
State of Pennsylvania – Technical Reference Manual – Rev Date: Feb 2017
2.4.4 ENERGY STAR CLOTHES WASHERS
Measure Name Clothes Washers
Target Sector Residential Establishments
Measure Unit Clothes Washer
Unit Energy Savings Varies by Fuel Mix
Unit Peak Demand Reduction Varies by Fuel Mix
Measure Life 11 years155
Vintage Replace on Burnout
This measure is for the purchase and installation of a clothes washer meeting ENERGY STAR eligibility criteria. ENERGY STAR clothes washers use less energy and hot water than non-qualified models.
E L I G I B I L I T Y This protocol documents the energy savings attributed to purchasing an ENERGY STAR clothes washer instead of a standard one. If a customer submits a rebate for a product that has applied for ENERGY STAR Certification but has not yet been certified, the savings will be counted for that product contingent upon its eventual certification as an ENERGY STAR measure. If at any point the product is rejected by ENERGY STAR, the product is then ineligible for the program and savings will not be counted. The target sector is residential.
A L G O R I T H M S
The general form of the equation for the ENERGY STAR Clothes Washer measure savings algorithm is:
Total Savings ¿Number of ClothesWashers×Savings per ClothesWasher
To determine resource savings, the per-unit estimates in the algorithms will be multiplied by the number of clothes washers. The number of clothes washers will be determined using market assessments and market tracking.
Per unit energy and demand savings are given by the following algorithms:
kWh / yr=¿
Cycles×([CAPY base
IMEFbase× (CW base+(DHW base×%ElectricDWH )+(Dryerbase×%ElectricDryer×%dry /wash ))]−[ CAPY ee
IMEFee× (CW ee+ (DHW ee×%ElectricDWH )+ (Dryeree×%ElectricDryer×%dry /wash )) ])
∆ kW peak=kWh/ yr
Cycles× timecycle×CF
Where IMEF is the Integrated Modified Energy Factor, which is the energy performance metric for clothes washers. IMEF is defined as:
IMEF is the quotient of the cubic foot capacity of the clothes container, C, divided by the total clothes washer energy consumption per cycle, with such energy consumption expressed as the sum of the machine electrical energy consumption (M), the hot water
155 Common Approach for Measuring Net Savings for Appliance Retirement Programs, GM-026, March 14, 2014.
SECTION 2: Residential MeasuresAppliances Page 148
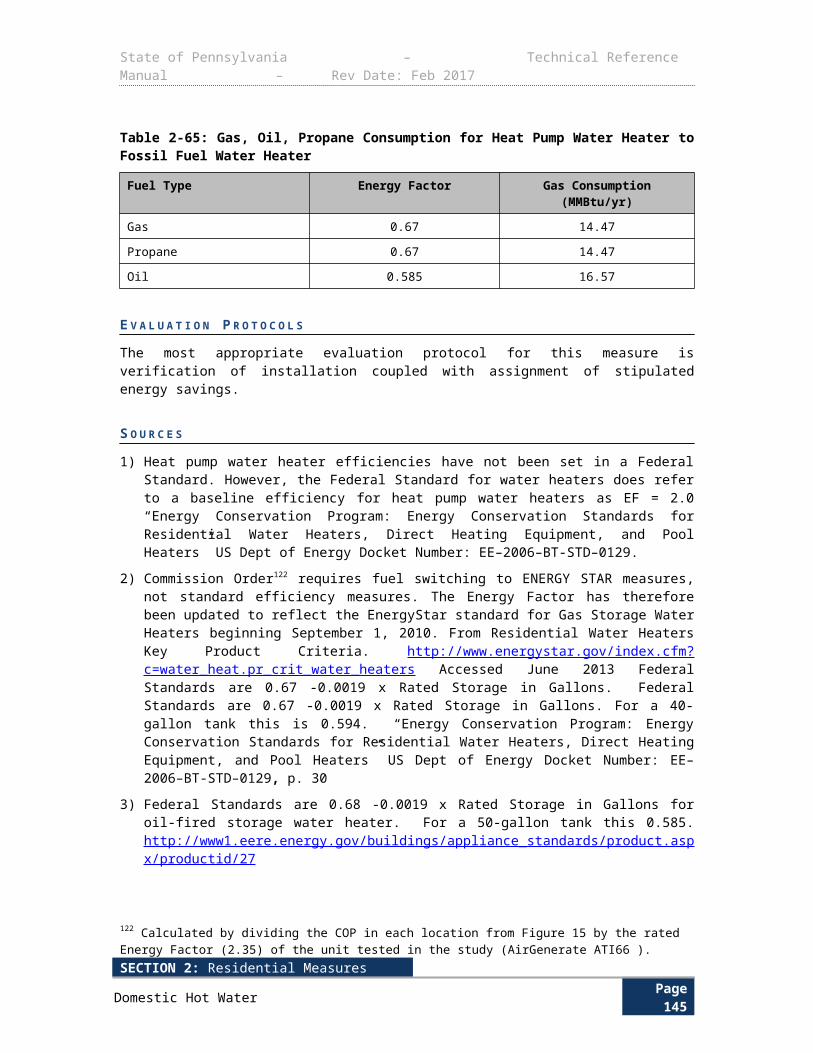
State of Pennsylvania – Technical Reference Manual – Rev Date: Feb 2017
energy consumption (E), the energy required for removal of the remaining moisture in the wash load (D), and the combined low-power mode energy consumption (L). The higher the value, the more efficient the clothes washer is.156
IMEF= C(M+E+D+L)
D E F I N I T I O N O F T E R M S
The default values for the terms in the algorithms are listed in Table 2-84. If unit information is known (such as capacity, IMEF, fuel mix) then actual values should be used.
Table 2-84: ENERGY STAR Clothes Washers - References
Term Unit Value Source
CAPYbase , Capacity of baseline clothes washer ft3
3.10 1
CAPYEE , Capacity of ENERGY STAR clothes washer ft3
EDC Data Gathering
EDC Data Gathering
Default: 3.10 2
IMEFbase , Integrated Modified Energy Factor of baseline clothes washer ft3
(kWh /cycle )Table 2-85 1
IMEFEE , Integrated Modified Energy Factor of ENERGY STAR clothes washer (can also use IMEF, which has same units)
ft3
(kWh /cycle )
EDC Data Gathering
EDC Data Gathering
Default: Table 2-86 2
Cycles , Number of clothes washer cycles per year
cyclesyr
260 3
CWbase , % of total energy consumption for baseline clothes washer mechanical operation % 9% 4
CWEE , % of total energy consumption for ENERGY STAR clothes washer mechanical operation % 9% 4
DHWbase , % of total energy consumption attributed to baseline clothes washer water heating % 37% 4
156 The percent of units manufactured prior to 1990 can be calculated through the use of the “age” field in the data tracking systems for each program year. Where data are missing average values can be used.
SECTION 2: Residential MeasuresAppliances Page 149
State of Pennsylvania – Technical Reference Manual – Rev Date: Feb 2017
Term Unit Value Source
DHWEE , % of total energy consumption attributed to ENERGY STAR clothes washer water heating % 22% 4
%ElectricDWH , % of total energy consumption attributed to ENERGY STAR clothes washer water heating
%EDC Data Gathering
Appliance Saturation
Studies
Default: 43% 3
Dryerbase , % of total energy consumption for baseline clothes washer dryer operation % 54% 4
DryerEE , % of total energy consumption for ENERGY STAR clothes washer dryer operation % 69% 4
%ElectricDryer , Percentage of dryers that are electric
%EDC Data Gathering
Appliance Saturation
Studies
Default: 76% 3
%dry /wash , Percentage of homes with a dryer that use the dryer every time clothes are washed
% Default= 95%
Or EDC data gathering
5
timecycle , average duration of a clothes washer cycle
hours 1.04 6
CF , Demand Coincidence Factor. The coincidence of average clothes washer demand to summer system peak
Fraction 0.029 7
F U T U R E S T A N D A R D S C H A N G E S
As of March 7, 2015 new federal minimum efficiency standards for clothes washers will take effect. Further efficiency standards for top-loading clothes washers go into effect beginning January 1, 2018. The 2015 efficiency standards for front-loading clothes washers will continue to be effective in 2018. The efficiency standards and the effective TRM in which these standards become the baseline are detailed in Table 2-85 and Table 2-86.
Note that the current standards are based on the MEF and WF, but beginning 3/7/2015 the standards will be based on the Integrated Modified Energy Factor (IMEF) and Integrated Water Factor (IWF). The IMEF incorporates energy use in standby and off modes and includes updates to the provisions of per-cycle measurements. The IWF more accurately represents consumer usage patterns as compared to the current metric.157
The corresponding ENERGY STAR updates do not include Compact washers, so these will not be included in the measure.
157 ENERGY STAR Calculator. Accessed July 10, 2013.
SECTION 2: Residential MeasuresAppliances Page 150
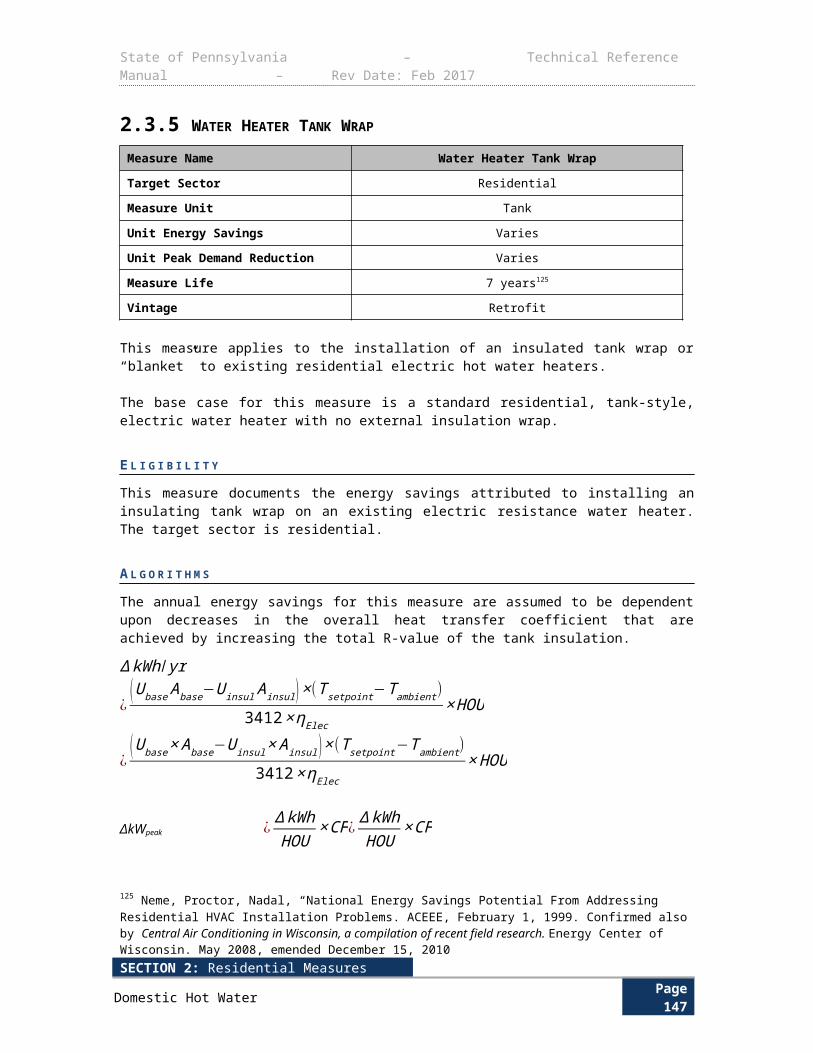
State of Pennsylvania – Technical Reference Manual – Rev Date: Feb 2017
Table 2-85: Federal Standards for Clothes Washers158
PY8 and PY9 PY10+
Minimum IMEF Minimum IMEF
Top-loading, Standard 1.29 1.57
Front-loading, Standard 1.84 1.84
Table 2-86: ENERGY STAR Product Specifications for Clothes Washers
PY8 and PY9 PY10+ENERGY STARMinimum IMEF
ENERGY STARMinimum IMEF
Top-loading, Standard 2.06 Pending
Front-loading, Standard 2.38 Pending
D E F A U L T S A V I N G S
The default values for various fuel mixes are given in Table 2-87. These are valid for PY8 and PY9 only.
Table 2-87: Default Clothes Washer Savings for PY8 and PY9
Fuel Mix Washer Type kWh / yr ∆ kW peak
Electric DHW/Electric DryerTop-Loading 230.2 0.0247
Front-Loading 99.2 0.0106
Electric DHW/Gas DryerTop-Loading 166.1 0.0178
Front-Loading 96.5 0.0104
Gas DHW/Electric DryerTop-Loading 85.1 0.0091
Front-Loading 11.7 0.0013
Gas DHW/Gas DryerTop-Loading 21.0 0.0023
Front-Loading 8.9 0.0010
Default (43% Electric DHW, 76% Electric Dryer)
Top-Loading 132.1 0.0142
Front-Loading 48.7 0.0052
E V A L U A T I O N P R O T O C O L S
For most projects, the appropriate evaluation protocol is to verify installation and proper selection of default values. For projects using customer specific data for open variables, the appropriate evaluation protocol is to verify installation and proper application of TRM protocol along with verification of open variables. The Pennsylvania Evaluation Framework provides specific guidelines and requirements for evaluation procedures.
158 Definition provided in ENERGY STAR Clothes Washers Product Specification Version 7.0. http://www.energystar.gov/sites/default/files/specs//private/ENERGY%20STAR%20Final%20Version%207.0%20Clothes%20Washer%20Program%20Requirements.pdf
SECTION 2: Residential MeasuresAppliances Page 151
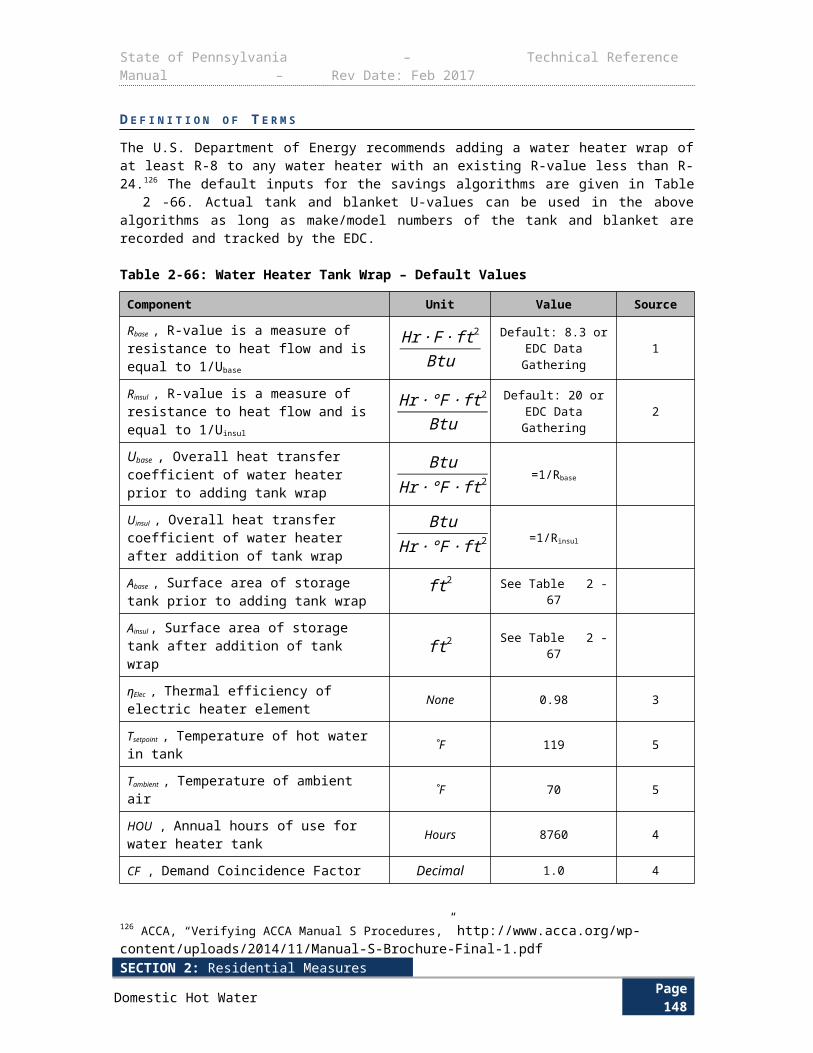
State of Pennsylvania – Technical Reference Manual – Rev Date: Feb 2017
S O U R C E S
1) Energy Star Calculator, EPA research on available models. Accessed June 2013
2) Energy Star Calculator, Average MEF and capacity of all ENERGY STAR qualified clothes washers. Accessed June 2013
3) Statewide average for all housing types from Pennsylvania Statewide Residential Baseline Study, 2014.
4) The percentage of total consumption that is used for the machine, water heating and dryer varies with efficiency. Percentages were developed using the above parameters and using the U.S. Department of Energy’s Life-Cycle Cost and Payback Period tool, available at: http://www1.eere.energy.gov/buildings/appliance_standards/residential/clothes_washers_support_stakeholder_negotiations.html
5) 2011-04 Technical Support Document: Energy Efficiency Program for Consumer Products and Commercial and Industrial Equipment. Residential Clothes Dryers and Room Air Conditioners, Chapter 7. Clothes Dryer Frequency from Table 7.3.3 for Electric Standard. http://www.regulations.gov/contentStreamer?objectId=0900006480c8ee11&disposition=attachment&contentType=pdf
6) Metered data from Navigant Consulting “EmPOWER Maryland Draft Final Evaluation Report Evaluation Year 4 (June 1, 2012 – May 31, 2013) Appliance Rebate Program.” March 21, 2014, page 36. Same value as used in and 2015 Mid Atlantic TRM. 1.04 hours/cycle derived from 254 cycles/yr and 265 hours/yr run time.
7) Value from Clothes Washer Measure, Mid Atlantic TRM 2014. Metered data from Navigant Consulting “EmPOWER Maryland Draft Final Evaluation Report Evaluation Year 4 (June 1, 2012 – May 31, 2013) Appliance Rebate Program.” March 21, 2014, page 36.
SECTION 2: Residential MeasuresAppliances Page 152
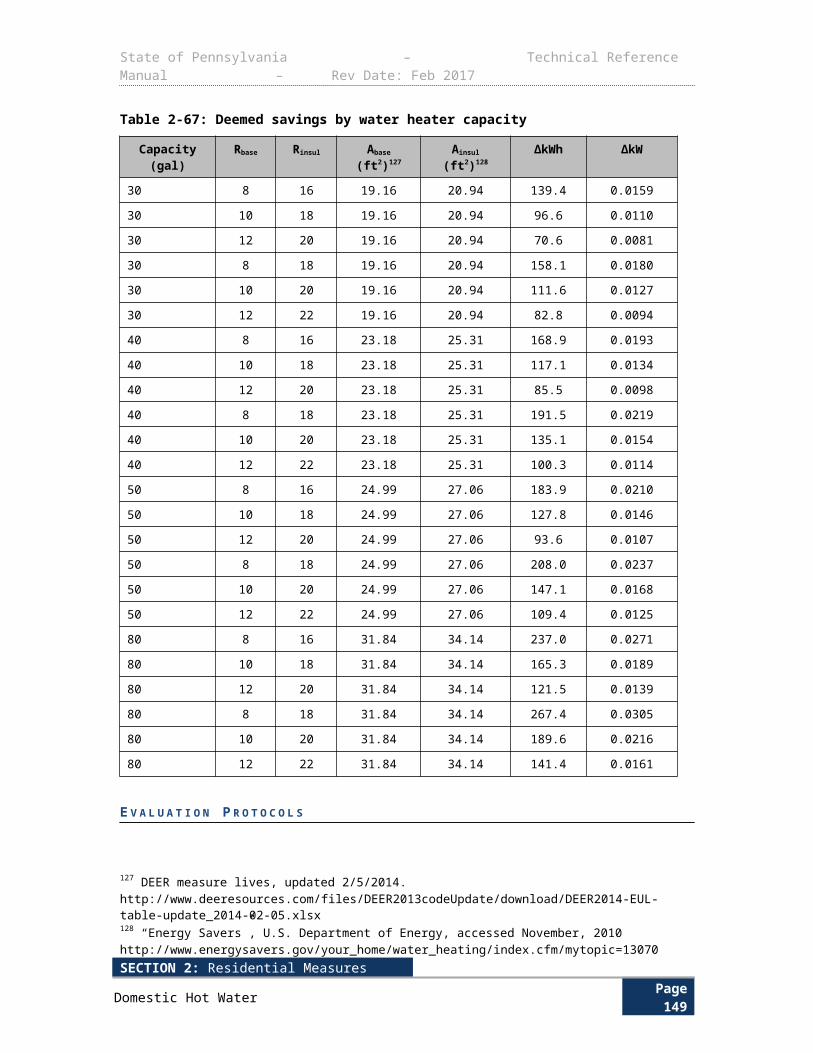
State of Pennsylvania – Technical Reference Manual – Rev Date: Feb 2017
2.4.5 ENERGY STAR DRYERS
Measure Name ENERGY STAR Clothes Dryers
Target Sector Residential
Measure Unit Clothes Dryer
Unit Energy Savings Varies by Dryer type
Unit Peak Demand Reduction Varies by Dryer type
Measure Life 13 years159
Vintage Replace on Burnout
ENERGY STAR Clothes Dryers are more efficient than standard ones, and thus save energy. They have a higher CEF (Combined Energy Factor) and may incorporate a moisture sensor to reduce excessive drying of clothes and prolonged drying cycles.
E L I G I B I L I T Y
This protocol documents the energy savings attributed to purchasing an electric ENERGY STAR Dryer that meets or exceeds the CEFee requirement in Table 2-88 instead of a standard dryer. If a customer submits a rebate for a product that has applied for ENERGY STAR Certification but has not yet been certified, the savings will be counted for that product contingent upon its eventual certification as an ENERGY STAR measure. If at any point the product is rejected by ENERGY STAR, the product is then ineligible for the program and savings will not be counted.160 The target sector is residential.
A L G O R I T H M S
The energy savings are obtained through the following formulas:
kWh / yr=Cycleswash×%dry /wash× Loadavg×( 1CEFbase
−1
CEFee )
∆ kW peak=( 1CEFbase
−1
CEFee )× Loadavgtimecycle
×CF
D E F I N I T I O N O F T E R M S
The parameters in the above equation are listed in Table 2-88.
159 Ibid.160 U.S. Department of Energy. 10 CFR Parts 429 and 430. Energy Conservation Program: Energy Conservation Standards for Residential Clothes Washers. Direct Final Rule.
SECTION 2: Residential MeasuresAppliances Page 153
State of Pennsylvania – Technical Reference Manual – Rev Date: Feb 2017
Table 2-88: Calculation Assumptions for ENERGY STAR Clothes Dryers
Component Unit Values Source
Cycleswash , Number of washing machine cycles per year
cycles/yr
250 cycles/year161 1
Loadavg , Weight of average dryer load, in pounds per load
lbs/load Standard Dryer: 8.45 lbs/load162
Compact Dryer: 3.0 lbs/load163
2, 3
%dry /wash , Percentage of homes with a dryer that use the dryer every time clothes are washed
% 95%Or EDC data gathering
3
CEFbase , Combined Energy Factor of baseline dryer, in lbs/kWh
lbs/kWh Table 2-89 4
CEFee , Combined Energy Factor of ENERGY STAR dryer, in lbs/kWh
lbs/kWh Table 2-89or EDC Data Gathering
5
timecycle , Duration of average drying cycle in hours
hours Default: 1 hour164
or EDC Data GatheringAssumption
CF , Coincidence Factor Fraction 0.042 6
Table 2-89: Combined Energy Factor for baseline and ENERGY STAR units
Product Type CEFbase (lbs/kWh) CEFee (lbs/kWh)
Vented Electric, Standard(4.4 ft³ or greater capacity)
3.73 3.93
Vented Electric, Compact (120V)(less than 4.4 ft³ capacity)
3.61 3.80
Vented Electric, Compact (240V)(less than 4.4 ft³ capacity)
3.27 3.45
D E F A U L T S A V I N G S
Table 2-90: Default Energy Savings and Demand Reductions for ENERGY STAR Clothes Dryers
Product Type Energy Savings (kWh/yr) Demand Reduction (kW)
161 From National Association of Home Builders Study Table 1, 2007. http://www.nahb.org/fileUpload_details.aspx?contentID=99359162 The Pennsylvania SWE and PUC TUS staff added this condition relating to certification that has been applied for but not yet received at the request of several of the Pennsylvania EDCs. EDCs will be responsible for tracking whether certification is granted.163 Note: this matches the number of cycles for ENERGY STAR clothes washers164 This figure is from the updated DOE Appendix D2 test procedure and is used in absence of a source of real world behavioral data.
SECTION 2: Residential MeasuresAppliances Page 154
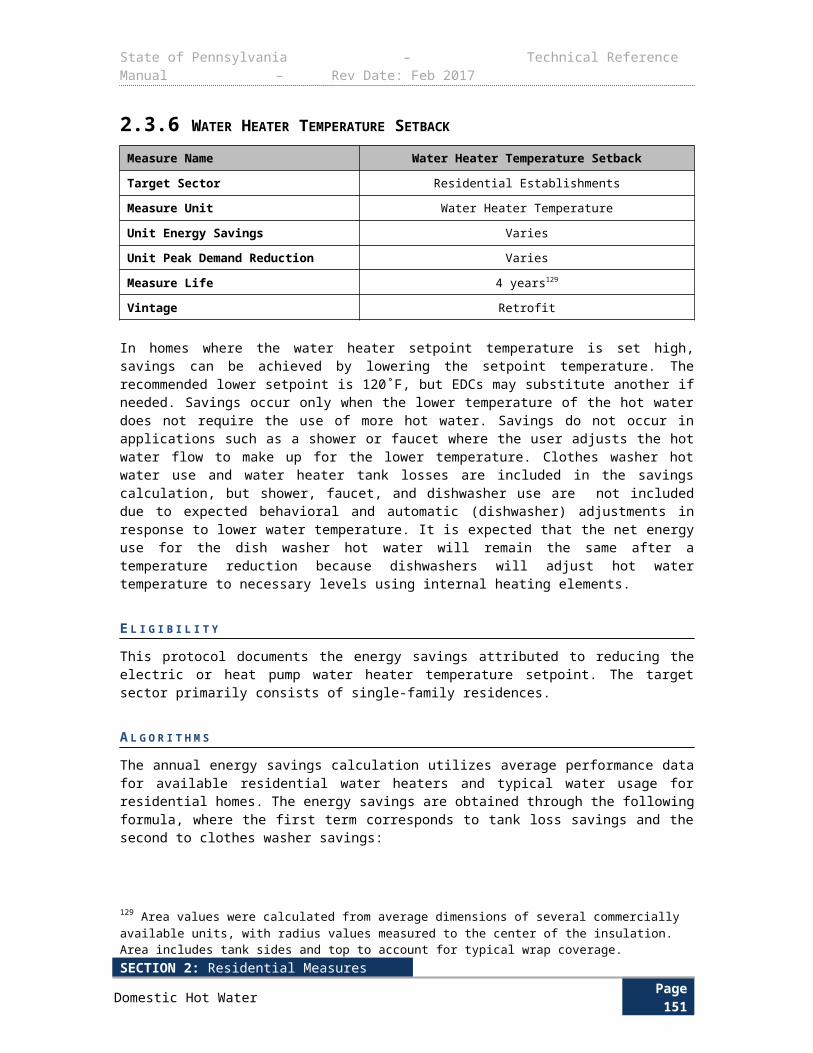
State of Pennsylvania – Technical Reference Manual – Rev Date: Feb 2017
Vented Electric, Standard(4.4 ft³ or greater capacity)
25.05 0.0048
Vented Electric, Compact (120V)(less than 4.4 ft³ capacity)
9.03 0.0017
Vented Electric, Compact (240V)(less than 4.4 ft³ capacity)
10.4 0.0020
E V A L U A T I O N P R O T O C O L S
The most appropriate evaluation protocol for this measure is verification of installation coupled with calculation of energy and demand savings using above algorithms.
S O U R C E S
1) Statewide average for all housing types from Pennsylvania Statewide Residential Baseline, 2014.
2) Test Loads for Compact and Standard Dryer in Appendix D2 to Subpart B of Part 430—Uniform Test Method for Measuring the Energy Consumption of Clothes Dryers. http://www.ecfr.gov/cgi-bin/text-idx?SID=9d051184ada3b0d0b5b553f624e0ab05&node=10:3.0.1.4.18.2.9.6.14&rgn=div9
3) 2011-04 Technical Support Document: Energy Efficiency Program for Consumer Products and Commercial and Industrial Equipment. Residential Clothes Dryers and Room Air Conditioners, Chapter 7. Clothes Dryer Frequency from Table 7.3.3 for Electric Standard. http://www.regulations.gov/contentStreamer?objectId=0900006480c8ee11&disposition=attachment&contentType=pdf
4) Federal Standard for Clothes Dryers, Effective January 1, 2015. http://www1.eere.energy.gov/buildings/appliance_standards/product.aspx/productid/36
5) ENERGY STAR Specification for Clothes Dryers Version 1.0, Effective January 1, 2015. http://www.energystar.gov/products/specs/sites/products/files/ENERGY%20STAR%20Final%20Draft%20Version%201.0%20Clothes%20Dryers%20Specification_0.pdf
6) Central Maine Power Company. “Residential End-Use Metering Project”. 1988. Using 8760 data for electric clothes dryers, calculating the CF according to the PJM peak definition.
SECTION 2: Residential MeasuresAppliances Page 155
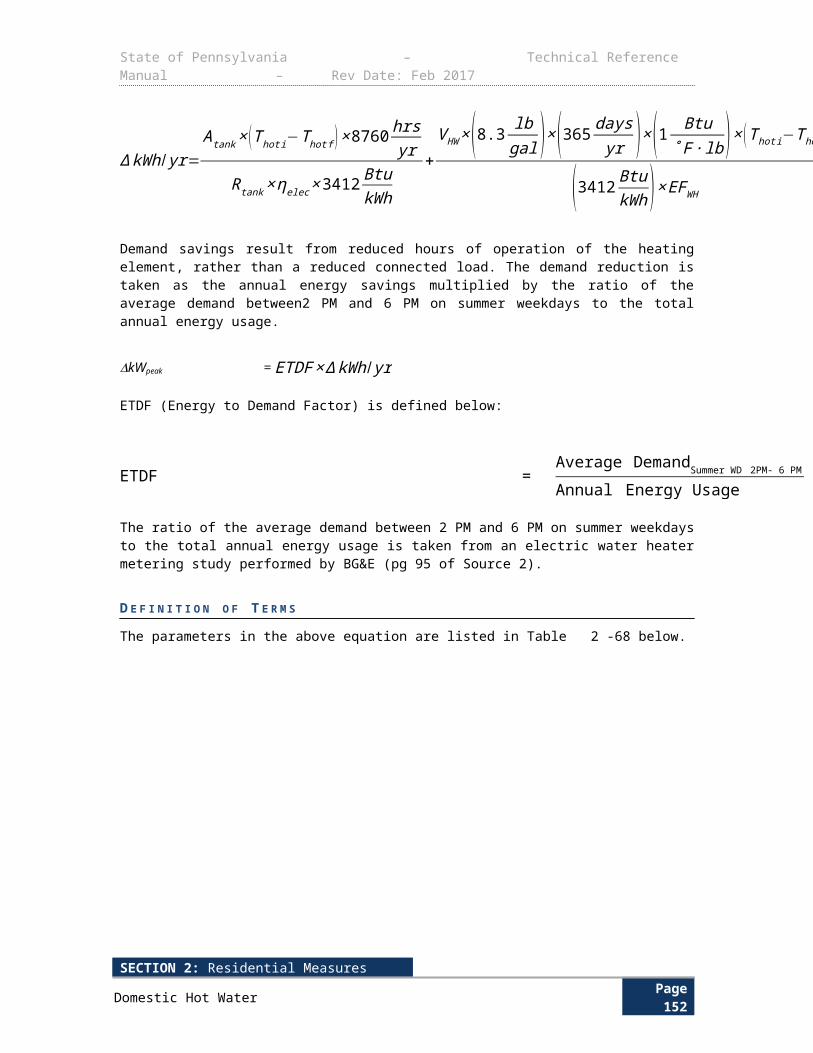
State of Pennsylvania – Technical Reference Manual – Rev Date: Feb 2017
2.4.6 FUEL SWITCHING: ELECTRIC CLOTHES DRYER TO GAS CLOTHES DRYER
Measure Name Fuel Switch: Electric Clothes Dryer to Gas Clothes Dryer
Target Sector Residential Establishments
Measure Unit Fuel Switch: Electric Clothes Dryer to Gas Clothes Dryer
Unit Energy Savings 567 kWh
-2.04 MMBtu (increase in gas consumption)
Unit Peak Demand Reduction 0.096 kW
Measure Life 14 years165
Vintage Replace on Burnout
This protocol outlines the savings associated to purchasing an ENERGY STAR gas clothes dryers to replace an electric dryer. The measure characterization and savings estimates are based on average usage per person and average number of people per household. Therefore, this is a deemed measure with identical savings applied to all installation instances, applicable across all housing types.
E L I G I B I L I T Y
This measure is targeted to residential customers that purchase an ENERGY STAR gas clothes dryer rather than an electric dryer.
A L G O R I T H M S
kWh / yr ¿kWhbase−kWhgas=597−30=567
MMBtu = −2.04
kW peak¿ ∆kWh / yrCycleswash×%wash /dry×timecycle
×CF=0.096 kW
D E F I N I T I O N O F T E R M S Table 2-91 Electric Clothes Dryer to Gas Clothes Dryer – Values and Resources
Term Unit Values Source
kWh, Annual electricity savings, deemedkWhyr
EDC Data Gathering
Default = 567Calculated
kWhbase, Baseline annual electricity consumption of electric dryer, deemed
kWhyr
EDC Data Gathering
Default = 5971
kWhgas , Annual electricity consumption of gas dryer, deemed
kWhyr
EDC Data Gathering
Default = 302
MMBtu, Weighted average gas fuel increase
MMBtu EDC Data Gathering
Default = -2.043
165 Ibid
SECTION 2: Residential MeasuresAppliances Page 156
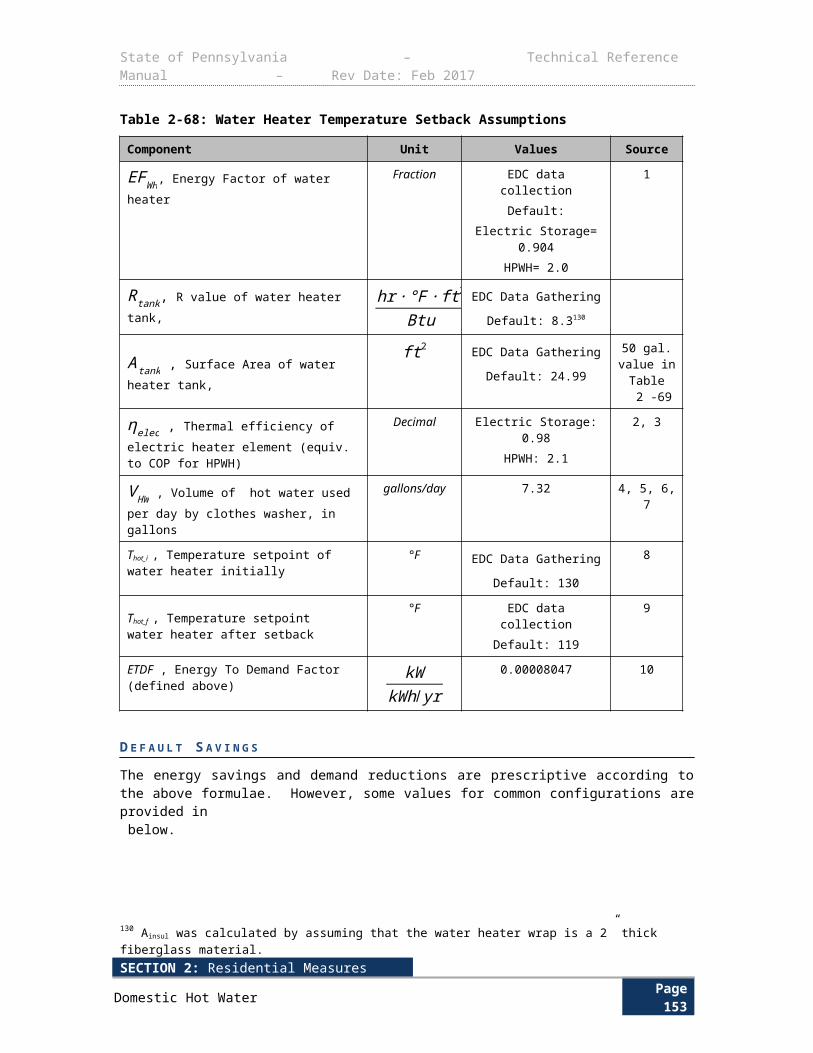
State of Pennsylvania – Technical Reference Manual – Rev Date: Feb 2017
Term Unit Values Source
0.003412, Conversion factorMMBtukWh
EDC Data Gathering
Default = 0.003412None
Cycleswash , Number of washing machine cycles per year
cycles/yr 260 4
%dry /wash , Percentage of homes with a dryer that use the dryer every time clothes are washed
% 95% 5
timecycle , Duration of average drying cycle in hours
hours EDC Data Gathering
Default= 1Assumption
CF, Coincidence Factor Fraction EDC Data Gathering
Default = 0.0426
D E F A U L T S A V I N G S
Savings estimates for this measure are fully deemed and may be claimed using the algorithms above and the deemed variable inputs.
E V A L U A T I O N P R O T O C O L S
The appropriate evaluation protocol is to verify installation and proper selection of deemed values.
S O U R C E S
1) ENERGY STAR Market and Industry Scoping Report. Residential Clothes Dryers. November, 2011. Pg. 7. Using Average Annual Energy Use in kWh for Vented Electric, Standard and scaling to Pennsylvania cycles/yr from 283 cycles/yr. i.e.: 684 kWh * (260 * 95%)/283 = 567 kWh. https://www.energystar.gov/ia/products/downloads/ENERGY_STAR_Scoping_Report_Residential_Clothes_Dryers.pdf
2) 2011-04 Technical Support Document: Energy Efficiency Program for Consumer Products and Commercial and Industrial Equipment. Residential Clothes Dryers and Room Air Conditioners, Chapter 7. Median annual electricity consumption of gas dryers from Table 7.3.4: Electric Standard and Gas Clothes Dryer: Average Annual Energy Consumption Levels by Efficiency http://www.regulations.gov/#!documentDetail;D=EERE-2007-BT-STD-0010-0053
3) Negative gas fuel savings indicate increase in fuel consumption. Average annual consumption for ENERGY STAR qualified gas units as of 6/22/2015: 685.3kWh/yr. Scaling from 283 cycles/yr to Pennsylvalia cycles/yr (260*95%): 598.1 kWh/yr. Converting to MMBtu: 598.1*0.003412 = 2.04 MMBtu/yr.
4) Statewide average for all housing types from Pennsylvania Statewide Residential End-Use and Saturation Study, 2014.
5) 2011-04 Technical Support Document: Energy Efficiency Program for Consumer Products and Commercial and Industrial Equipment. Residential Clothes Dryers and Room Air Conditioners, Chapter 7. Clothes Dryer Frequency from Table 7.3.3 for Electric Standard. http://www.regulations.gov/contentStreamer?objectId=0900006480c8ee11&disposition=attachment&contentType=pdf
SECTION 2: Residential MeasuresAppliances Page 157
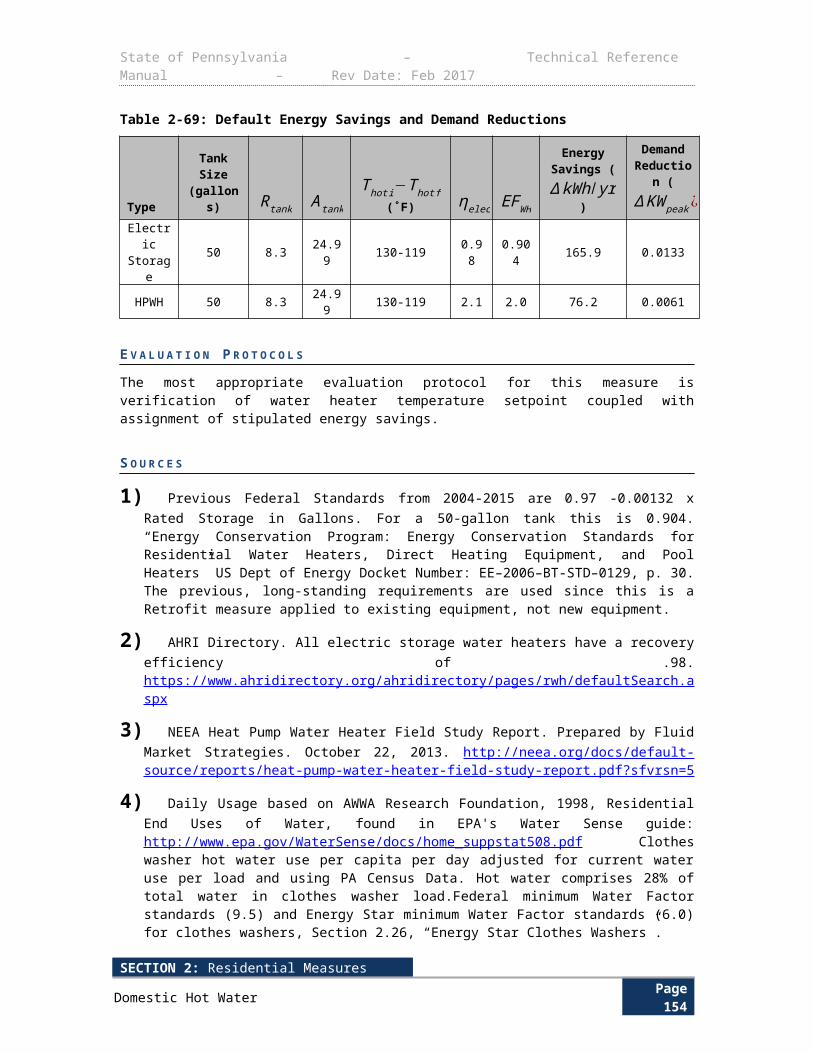
State of Pennsylvania – Technical Reference Manual – Rev Date: Feb 2017
6) Central Maine Power Company. “Residential End-Use Metering Project”. 1988. Using 8760 data for electric clothes dryers, calculating the CF according to the PJM peak definition.
SECTION 2: Residential MeasuresAppliances Page 158
State of Pennsylvania – Technical Reference Manual – Rev Date: Feb 2017
2.4.7 ENERGY STAR DISHWASHERS
Measure Name Dishwashers
Target Sector Residential Establishments
Measure Unit Dishwasher
Unit Energy Savings Varies by Water Heating Fuel Mix
Unit Peak Demand Reduction Varies by Water Heating Fuel Mix
Measure Life 10 years166
Vintage Replace on Burnout
E L I G I B I L I T Y This measure is for the purchase and installation of a dishwasher meeting ENERGY STAR eligibility criteria. ENERGY STAR dishwashers use less energy and hot water than non-qualified models.
A L G O R I T H M S
The general form of the equation for the ENERGY STAR Dishwasher measure savings algorithm is:
Total Savings ¿Number of Dishwashers×Savings per Dishwasher
To determine resource savings, the per-unit estimates in the algorithms will be multiplied by the number of dishwashers. The number of dishwashers will be determined using market assessments and market tracking.
Per unit energy and demand savings algorithms for dishwashers utilizing electrically heated hot water:
∆ kWh/ yr=(kWhbase−kWhee )× [%kWhOP+(%kWhheat×%ElectricDHW ) ]
∆ kW peak=∆kWh / yrHOU
×CF
D E F I N I T I O N O F T E R M S
Table 2-92: ENERGY STAR Dishwashers - References
Component Unit Value Source
kWhbase , Annual energy consumption of baseline dishwasher kWh/yr 355 1
kWhee , Annual energy consumption of ENERGY STAR qualified unit kWh/yr 295 1
%kWhop , Percentage of unit dishwasher energy consumption used for operation % 44% 1
%kWhheat , Percentage of dishwasher unit energy consumption used for water heating % 56% 1
166 This figure is used in absence of real world behavioral data.
SECTION 2: Residential MeasuresAppliances Page 159
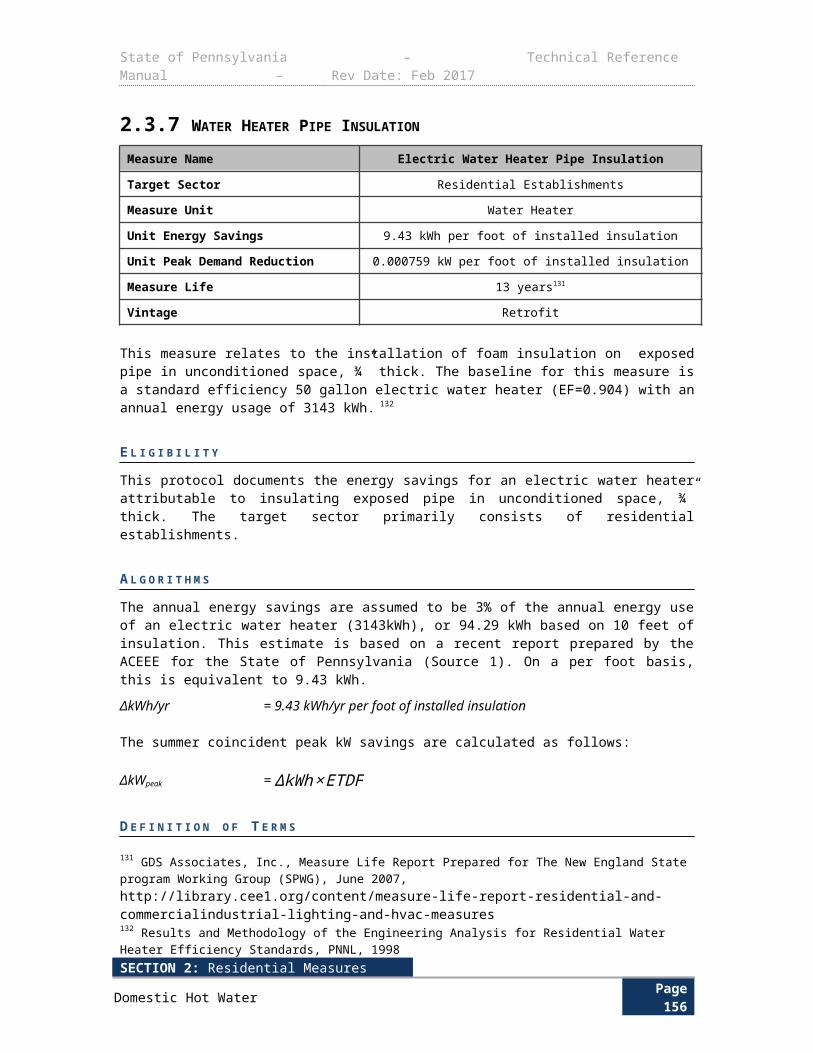
State of Pennsylvania – Technical Reference Manual – Rev Date: Feb 2017
Component Unit Value Source
%ElectricDW , Percentage of dishwashers assumed to utilize electrically heated hot water %
EDC Data Gathering
Default = 43%2
HOU , Hours of use per year hours/yr 234 3167
CF, Demand Coincidence Factor. The coincidence of average dishwasher demand to summer system peak Fraction 0.026 4
ENERGY STAR qualified dishwashers must use less than or equal to the water and energy consumption values given in Table 2-93. Note, as of May 30, 2013, ENERGY STAR compact dishwashers have the same maximum water and energy consumption requirements as the federal standard and therefore are not included in the TRM since there is not energy savings to be calculated for installation of an ENERGY STAR compact dishwasher. A standard sized dishwasher is defined as any dishwasher that can hold 8 or more place settings and at least six serving pieces.168
Table 2-93: Federal Standard and ENERGY STAR v 5.0 Residential Dishwasher Standard
Product TypeFederal Standard169 ENERGY STAR v 5.0170
Water(gallons per
cycle)Energy
(kWh per year)Water
(gallons per cycle)
Energy(kWh per year)
Standard ≤ 6.50 ≤ 355 ≤ 4.25 ≤ 295
The default values for electric and non-electric water heating and the default fuel mix from Table2-92 are given in Table 2-94.
Table 2-94: Default Dishwasher Energy Savings
Water Heating ∆ kWh/ yr ∆ kW peak
Electric (%ElectricDHW = 100%) 60.0 0.00667Non-Electric (%ElectricDHW = 0%) 26.4 0.00293Default Fuel Mix (%ElectricDHW = 43%) 40.8 0.00453
E V A L U A T I O N P R O T O C O L S
For most projects, the appropriate evaluation protocol is to verify installation and proper selection of default values. For projects using customer specific data for open variables, the appropriate evaluation protocol is to verify installation and proper application of TRM protocol along with verification of open variables. The Pennsylvania Evaluation Framework provides specific guidelines and requirements for evaluation procedures.167 DOE life-cycle cost and payback period Excel-based calculator. http://www1.eere.energy.gov/buildings/appliance_standards/residential/docs/rcw_dfr_lcc_standard.xlsm168 EnergyStar Calculator. Accessed July 2013.169 HOU=(3 loads/week)*(52 weeks/yr)*(1.5 hours/load). 3 load/week comes from 2014 Baseline study. 1.5 hours/load is assumption used by Efficiency Vermont and Illinois Statewide TRMs170 Dishwashers Key Product Criteria. http://www.energystar.gov/index.cfm?c=dishwash.pr_crit_dishwashers
SECTION 2: Residential MeasuresAppliances Page 160
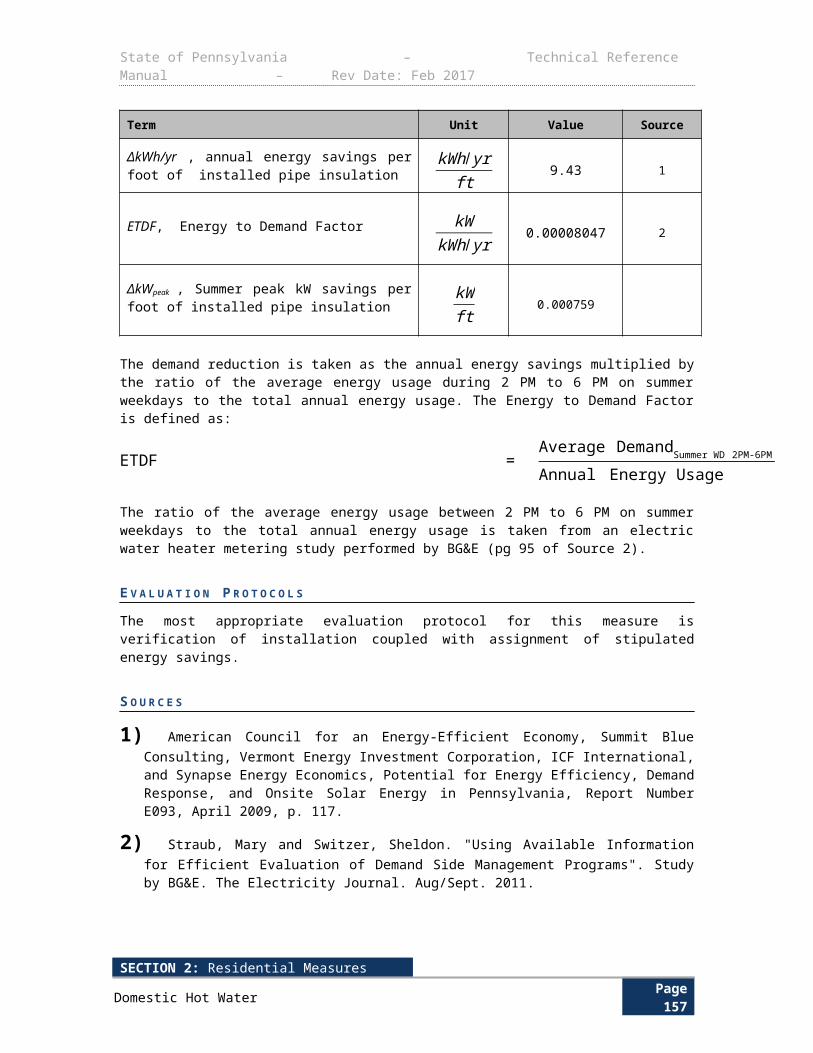
State of Pennsylvania – Technical Reference Manual – Rev Date: Feb 2017
S O U R C E S
1) ENERGY STAR Appliances Calculator. Accessed July 2013.
2) Statewide average for all housing types from Pennsylvania Statewide Residential Baseline Study, 2014.
3) 2014 Pennsylvania Residential Baseline Study. Submitted by GDS Associates, April 2014.
4) Calculated from Itron eShapes, 8760 hourly data by end use for Missouri, as provided by Ameren. This is the CF value for ENERGY STAR Dishwashers from Illinois Statewide TRM Version 3.0, June 2014.
SECTION 2: Residential MeasuresAppliances Page 161
State of Pennsylvania – Technical Reference Manual – Rev Date: Feb 2017
2.4.8 ENERGY STAR DEHUMIDIFIERS
Measure Name Dehumidifiers
Target Sector Residential Establishments
Measure Unit Dehumidifier
Unit Energy Savings Varies based on capacity
Unit Peak Demand Reduction Varies based on capacity
Measure Life 12 years171
Vintage Replace on Burnout
ENERGY STAR qualified dehumidifiers are 15 percent more efficient than non-qualified models due to more efficient refrigeration coils, compressors and fans.
E L I G I B I L I T Y This protocol documents the energy and demand savings attributed to purchasing an ENERGY STAR dehumidifier instead of a standard one. Dehumidifiers must meet ENERGY STAR Version 3.0 Product Specifications to qualify. The target sector is residential.
A L G O R I T H M S
The general form of the equation for the ENERGY STAR Dehumidifier measure savings algorithm is:
Total Savings ¿Number of Dehumidifiers×Savings per Dehumidifier
To determine resource savings, the per-unit estimates in the algorithms will be multiplied by the number of dehumidifiers. The number of dehumidifiers will be determined using market assessments and market tracking.
Per unit energy and demand savings algorithms:
∆ kWh/ yr=(CAPY ×0.473 literspint
24 hoursday
)×HOU ×( 1L/kWhbase
− 1L/kWhee )
∆ kW peak=∆kWh / yrHOU
×CF
171 Ibid.
SECTION 2: Residential MeasuresAppliances Page 162
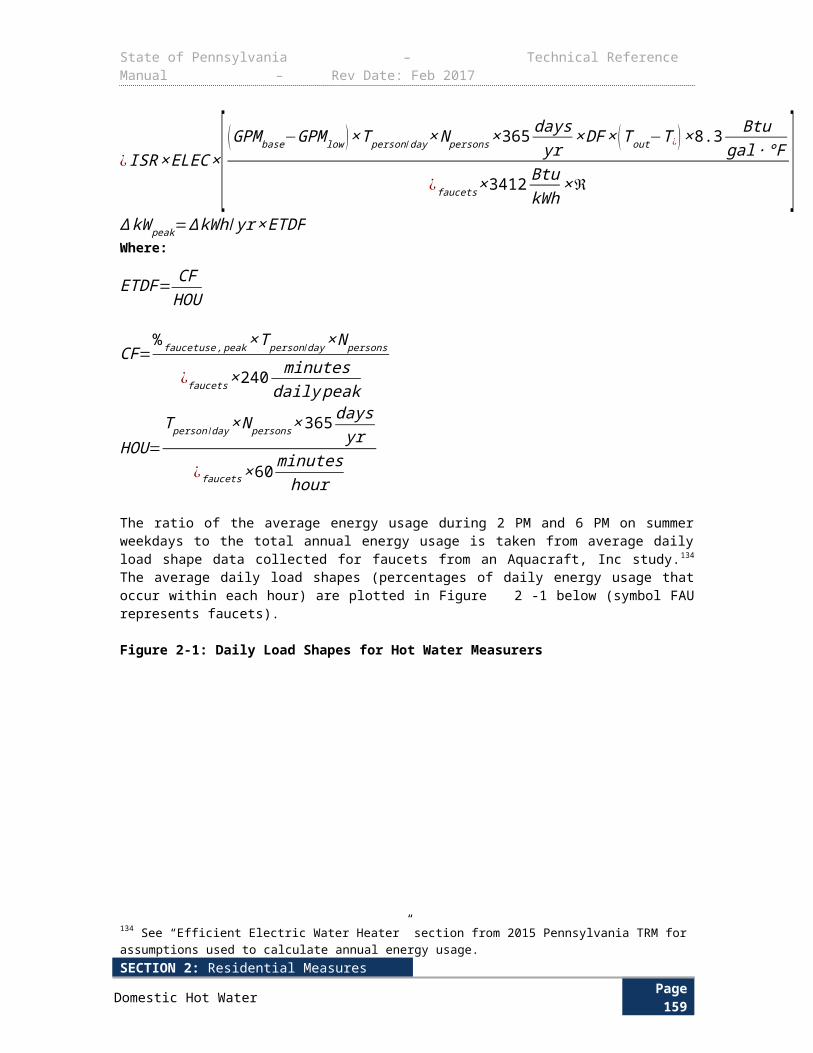
State of Pennsylvania – Technical Reference Manual – Rev Date: Feb 2017
D E F I N I T I O N O F T E R M S
Table 2-95: ENERGY STAR Dehumidifier Calculation Assumptions
Component Unit Value Sources
CAPY , Average capacity of the unitpintsday
EDC Data Gathering
HOU , Annual hours of operationhoursyr
16321
L/kWhbase , Baseline unit liters of water per kWh consumed
literskWh , Federal Standard
Column2
L/kWhee , ENERGY STAR qualified unit liters of water per kWh consumed
literskWh
EDC Data Gathering
Default :, ENERGY STAR
Column
3
CF , Demand Coincidence Factor Fraction 0.405 4
shows the federal standard minimum efficiency and ENERGY STAR standards, effective October 1, 2012. Federal standards do not limit residential dehumidifier capacity, but since ENERGY STAR standards do limit the capacity to 185 pints per day, Table 2-96 only presents standards for the range of dehumidifier capacities that savings can be claimed.
Table 2-96: Dehumidifier Minimum Federal Efficiency and ENERGY STAR Standards
Capacity(pints/day)
Federal Standard(L/kWhbase)
ENERGY STAR(L/kWhee)
≤ 35 1.35
≥ 1.85> 35 ≤ 45 1.50>45 ≤ 54 1.60>54 < 75 1.7075 ≤ 185 2.5 ≥ 2.80
D E F A U L T S A V I N G S
The annual energy usage and savings of an ENERGY STAR unit over the federal minimum standard are presented in Table 2-97 for each capacity range.
Table 2-97: Dehumidifier Default Energy Savings172
Capacity Range(pints/day)
Default Capacity
(pints/day)
Federal Standard(kWh/yr)
ENERGY STAR(kWh/yr)
ΔkWh/yr ΔkWpeak
≤ 35 35 834 609 225 0.05584
> 35 ≤ 45 45 965 782 183 0.04541
>45 ≤ 54 54 1086 939 147 0.03648
>54 < 75 74 1,400 1,287 113 0.02804
172 ENERGY STAR Program Requirements Product Specification for Residential Dishwashers. http://www.energystar.gov/ia/partners/prod_development/revisions/downloads/res_dishwashers/ES_V5_Dishwashers_Specification.pdf
SECTION 2: Residential MeasuresAppliances Page 163
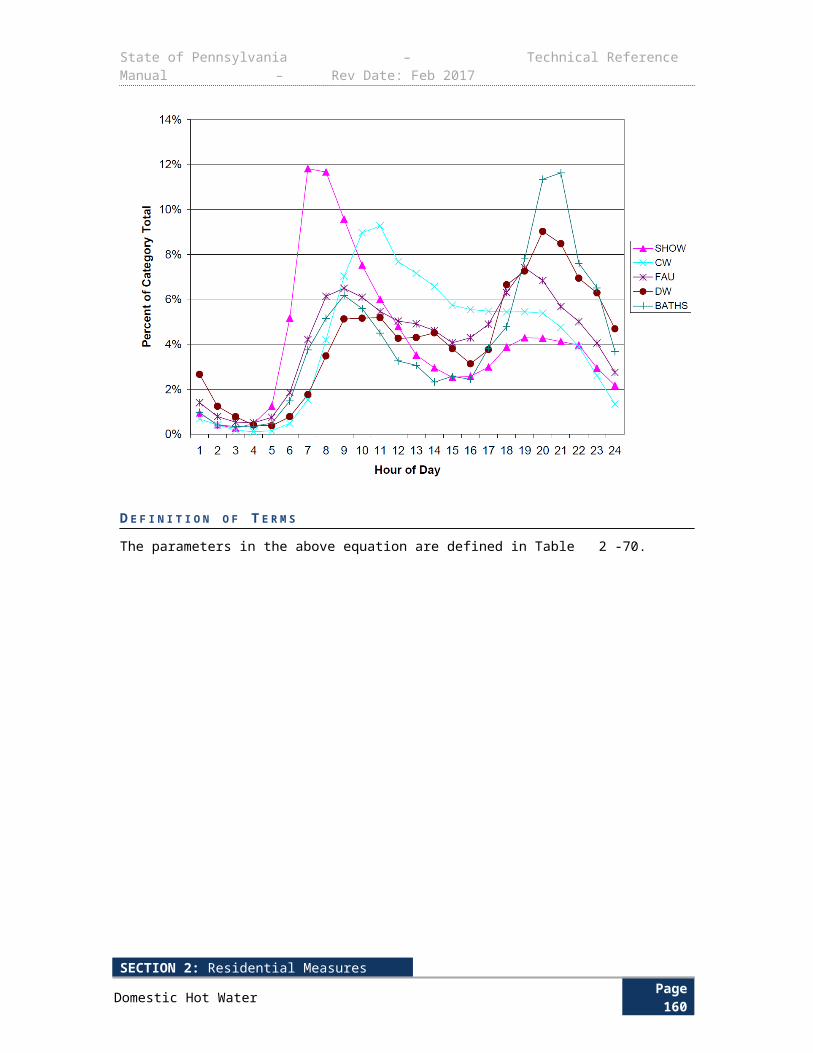
State of Pennsylvania – Technical Reference Manual – Rev Date: Feb 2017
Capacity Range(pints/day)
Default Capacity
(pints/day)
Federal Standard(kWh/yr)
ENERGY STAR(kWh/yr)
ΔkWh/yr ΔkWpeak
75 ≤ 185 130 1,673 1,493 180 0.04467
E V A L U A T I O N P R O T O C O L S
For most projects, the appropriate evaluation protocol is to verify installation and proper selection of default values. For projects using customer specific data for open variables, the appropriate evaluation protocol is to verify installation and proper application of TRM protocol along with verification of open variables. The Pennsylvania Evaluation Framework provides specific guidelines and requirements for evaluation procedures.
S O U R C E S
1) ENERGY STAR Appliance Savings Calculator. Updated August, 2013.
2) US Department of ENERGY Website. Appliance and Equipment Standards. Accessed June 2014. http://www1.eere.energy.gov/buildings/appliance_standards/product.aspx/productid/55
3) ENERGY STAR Program Requirements Product Specification for Dehumidifiers, Eligibility Criteria Version 3.0. http://www.energystar.gov/ia/partners/prod_development/revisions/downloads/dehumid/ES_Dehumidifiers_Final_V3.0_Eligibility_Criteria.pdf?3cbf-7a48
4) Dehumidifier Metering in PA and Ohio by ADM from 7/17/2013 to 9/22/2013. 31 Units metered. Assumes all non-coincident peaks occur within window and that the average load during this window is representative of the June PJM days as well.
SECTION 2: Residential MeasuresAppliances Page 164
State of Pennsylvania – Technical Reference Manual – Rev Date: Feb 2017
2.4.9 ENERGY STAR WATER COOLERS Measure Name ENERGY STAR Water Coolers
Target Sector Residential Establishments
Measure Unit Water Cooler
Unit Energy SavingsCold Water Only: 47.5 kWh
Hot & Cold Storage: 481.8 kWhHot & Cold On-Demand: 733.7 kWh
Unit Peak Demand ReductionCold Water Only: 0.00532 kW
Hot & Cold Storage: 0.0539 kWHot & Cold On-Demand: 0.0821 kW
Measure Life 10 years173
Vintage Replace on Burnout
This protocol estimates savings for installing ENERGY STAR Water Coolers compared to standard efficiency equipment in residential applications. The measurement of energy and demand savings is based on a deemed savings value multiplied by the quantity of the measure.
E L I G I B I L I T Y
In order for this measure protocol to apply, the high-efficiency equipment must meet the ENERGY STAR 2.0 efficiency criteria: Cold Only or Cook & Cold Units ≤0.16 kWh /day, Hot & Cold Storage Units ≤0.87 kWh/day, and Hot & Cold On-Demand ≤0.18 kWh/day.
A L G O R I T H M S
The general form of the equation for the ENERGY STAR Water Coolers measure savings algorithms is:
Total Savings =Number of Water Coolers×Savings perWaterCooler
To determine resource savings, the per unit estimates in the algorithms will be multiplied by the number of water coolers. Per unit savings are primarily derived from the May 2012 release of the ENERGY STAR calculator for water coolers.
Per unit energy and demand savings algorithms:
∆ kWh= (kWhbase−kWhee )×365 daysyear
∆ kW peak=∆kWh×ETDF
173 EnergyS tar Calculator Accessed July 2013 using ENERGY STAR Appliances. February 2008. U.S. Environmental Protection Agency and U.S. Department of Enegy. ENERGY STAR. http://www.energystar.gov/.
SECTION 2: Residential MeasuresAppliances Page 165
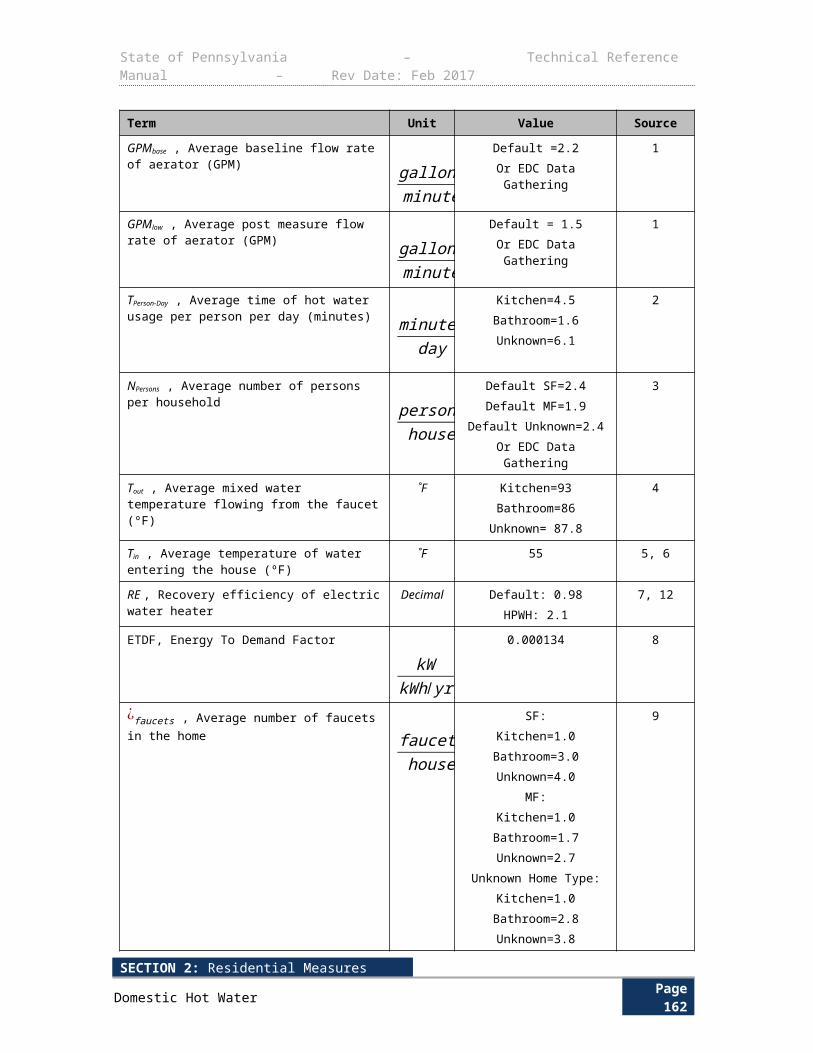
State of Pennsylvania – Technical Reference Manual – Rev Date: Feb 2017
D E F I N I T I O N O F T E R M S
Table 2-98: ENERGY STAR Water Coolers – References
Component Unit Value Sources
kWhbase , Energy use of baseline water cooler
kWh/dayCold Only: 0.29Hot & Cold: 2.19 1
kWhee , Energy use of ENERGY STAR water cooler
kWh/day
Cold Only: 0.16Hot & Cold Storage: 0.87
Hot & Cold On-Demand: 0.18or EDC Data Gathering
2
HOU , Annual hours of use Hours/year 8760 3
ETDF , Energy to Demand FactorkW
kWh / yr0.0001119 3
D E F A U L T S A V I N G S
Table 2-99: Default Savings for ENERGY STAR Water Coolers
Cooler Type ∆ kWh ∆ kW peak
Cold Only 47.5 kWh 0.00532 kW
Hot & Cold Storage 481.8 kWh 0.0539 kW
Hot & Cold On-Demand 733.7 kWh 0.0821 kW
S O U R C E S
1) ENERGY STAR Water Coolers Savings Calculator (Calculator updated: May 2013). Default values were used.
2) ENERGY STAR Product Specifications for Water Coolers Version 2.0. http://www.energystar.gov/products/specs/system/files/WC%20V2%200%20Final%20Program%20Requirements.pdf
3) Assumed to have similar behavior as a refrigerator, and thus uses same ETDF as used in refrigerator measures: Assessment of Energy and Capacity Savings Potential In Iowa. Quantec in collaboration with Summit Blue Consulting, Nexant, Inc., A-TEC Energy Corporation, and Britt/Makela Group, prepared for the Iowa utility Association, February 2008. http://plainsjustice.org/files/EEP-08-1/Quantec/QuantecReportVol1.pdf
SECTION 2: Residential MeasuresAppliances Page 166
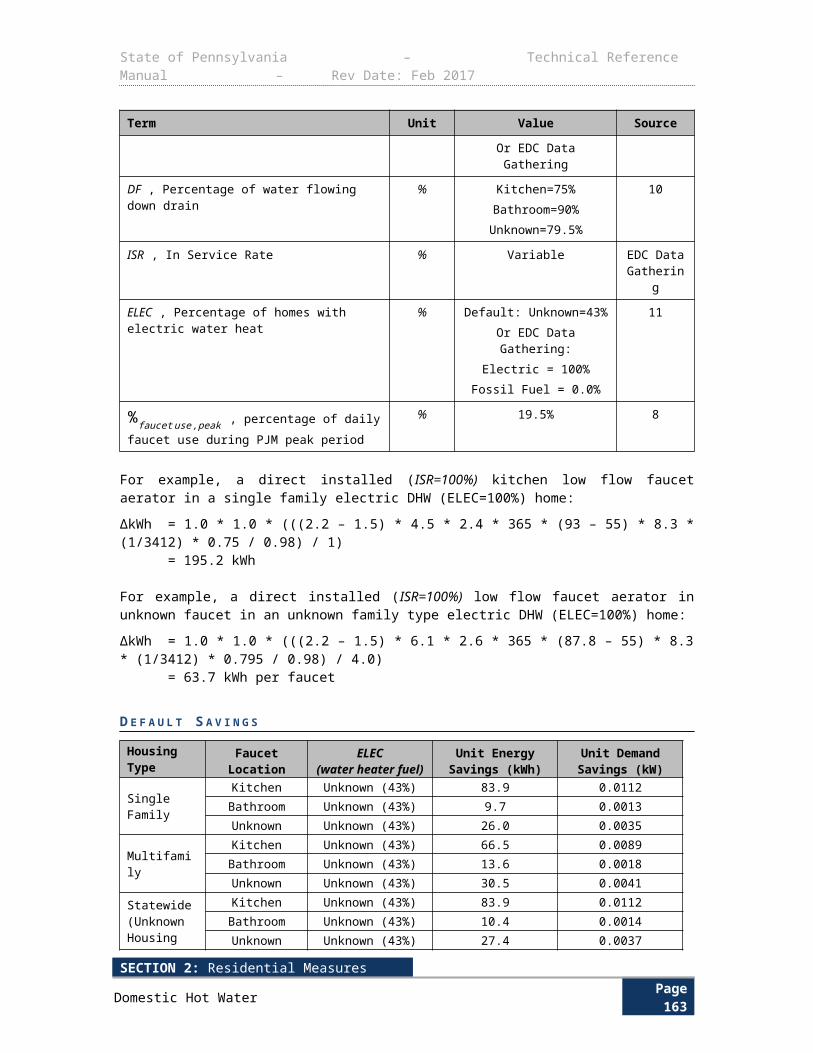
State of Pennsylvania – Technical Reference Manual – Rev Date: Feb 2017
2.4.10 ENERGY STAR CEILING FANS
Measure Name ENERGY STAR Ceiling Fans
Target Sector Residential Establishments
Measure Unit Ceiling Fan Unit
Unit Energy Savings Varies by Ceiling Fan Type
Unit Peak Demand Reduction Varies by Ceiling Fan Type
Measure Life 20 years for fan174, See Section 2.1.1 for lighting
Vintage Replace on Burnout
ENERGY STAR ceiling fans require a more efficient CFM/Watt rating at the low, medium, and high settings than standard ceiling fans as well ENERGY STAR qualified lighting for those with light kits included. Both of these features save energy compared to standard ceiling fans.
E L I G I B I L I T Y
This protocol documents the energy savings attributed to installing an ENERGY STAR Version 3.0 ceiling fan (with or without a lighting kit) in lieu of a standard efficiency ceiling fan. If a customer submits a rebate for a product that has applied for ENERGY STAR Certification but has not yet been certified, the savings will be counted for that product contingent upon its eventual certification as an ENERGY STAR measure. If at any point the product is rejected by ENERGY STAR, the product is then ineligible for the program and savings will not be counted. 175 The target sector primarily consists of single-family residences.
A L G O R I T H M S
The total energy savings is equal to the savings contribution of the fan plus the savings contribution of the lighting, if applicable. If the ENERGY STAR fan does not include a lighting kit, thenkWhlighting=0. These algorithms do not seek to estimate the behavioral change attributable to the use of a ceiling fan vs. a lower AC setting.
The energy savings are obtained through the following formula:
kWh / yrtotal=kWhfan+kWhlightingkWhfan=[(%low× (Lowbase−Low ee) )+(%med× (Medbase−Med ee) )+(%high× (Highbase−Highee )) ]× 1kW
1000W×HOU fan×365 days
yrkWhlighting=kWh from Section 2.1.1: ENERGY STAR Lighting
Demand savings result from the lower connected load of the ENERGY STAR fan and ENERGY STAR lighting. Peak demand savings are estimated using a Coincidence Factor (CF).
∆ kW peak ,total=∆kW peak, fan+∆kW peak ,lighting
174 Derived from equations in section 2.4.8, matching values generated by Energy Star Appliance Savings Calculator: http://www.energystar.gov/ia/business/bulk_purchasing/bpsavings_calc/appliance_calculator.xlsx175 ENERGY STAR Water Coolers Savings Calculator (Calculator updated: May 2012)
SECTION 2: Residential MeasuresAppliances Page 167
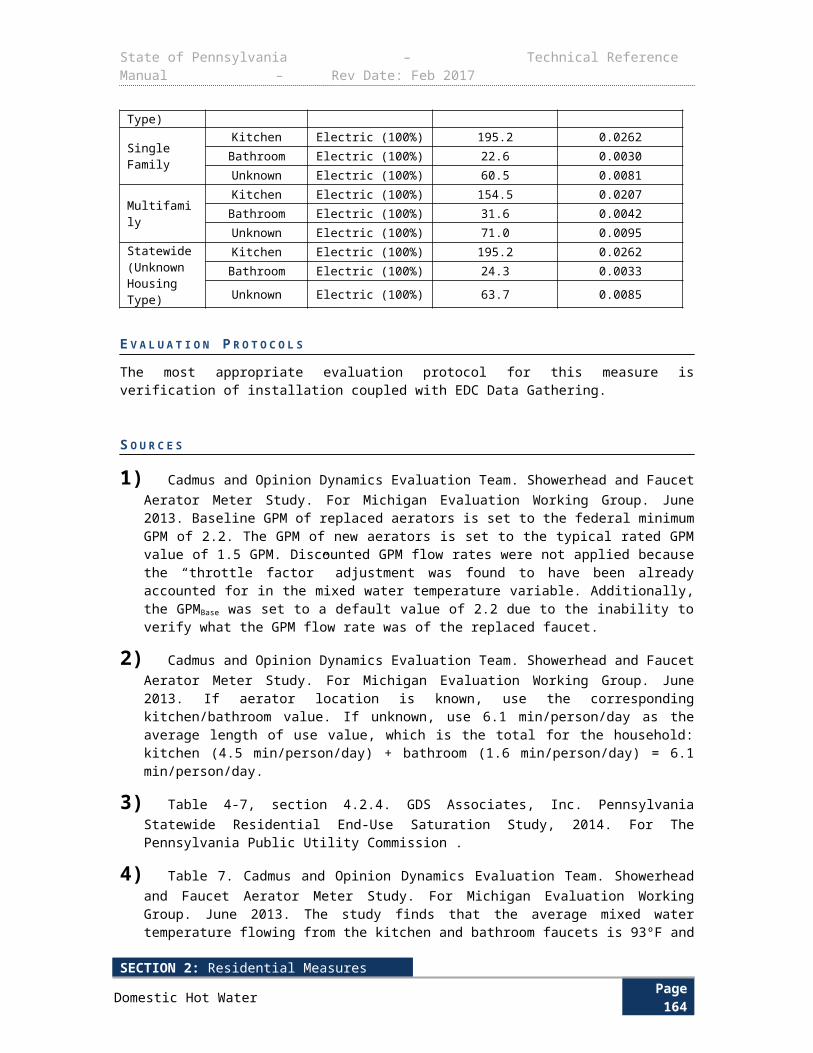
State of Pennsylvania – Technical Reference Manual – Rev Date: Feb 2017
kW peak ,fan=[(%low× (Lowbase−Low ee ))+(%med× (Medbase−Med ee ))+(%high× (Highbase−Highee )) ]× 1kW1000W
×CF fan
∆ kW peak ,lighting=∆kW peak from Section 2.1.1: ENERGY STAR Lighting
D E F I N I T I O N O F T E R M S
The parameters in the above equations are listed in Table 2-100.
Table 2-100: Calculation Assumptions for ENERGY STAR Ceiling Fans
Component Unit Values Source
%low , percentage of low setting use % 40% 1
%med , percentage of medium setting use % 40% 1
%high , percentage of high setting use % 20% 1
Lowbase , Wattage of low setting, baseline Watts 15 Watts 1
Medbase , Wattage of medium setting, baseline Watts 34 Watts 1
Highbase , Wattage of high setting, baseline Watts 67 Watts 1
Lowee , Wattage of low setting, ENERGY STAR Watts EDC Data GatheringDefault: 4.8 Watts176
2, 3
Medee , Wattage of medium setting, ENERGY STAR
Watts EDC Data GatheringDefault: 18.2 Watts177
2, 3
Highee , Wattage of high setting, ENERGY STAR
Watts EDC Data GatheringDefault: 45.9 Watts178
2, 3
HOU fan , fan daily hours of use hoursday
EDC Data GatheringDefault: 3.0 hours/day179
1
CF fan , Demand Coincidence Factor Fraction EDC Data GatheringDefault: 0.091180
4
CFlighting , Demand Coincidence Factor Fraction See Section 2.1 4
D E F A U L T S A V I N G S
176 Residential and C&I Lighting and HVAC Report Prepared for SPWG, 2007. Pg C-2.177 The Pennsylvania SWE and PUC TUS staff added this condition relating to certification that has been applied for but not yet received at the request of several of the Pennsylvania EDCs. EDCs will be responsible for tracking whether certification is granted.178 Equals the minimum ‘Low’ CFM required by ENERGY STAR divided by the average CFM/Watt on ‘Low’ for all fans on ES qualified products list179 Equals the minimum ‘Medium’ CFM required by ENERGY STAR divided by the average CFM/Watt on ‘Medium’ for all fans on ES qualified products list180 Equals the minimum ‘High’ CFM required by ENERGY STAR divided by the average CFM/Watt on ‘High’ for all fans on ES qualified products list
SECTION 2: Residential MeasuresAppliances Page 168
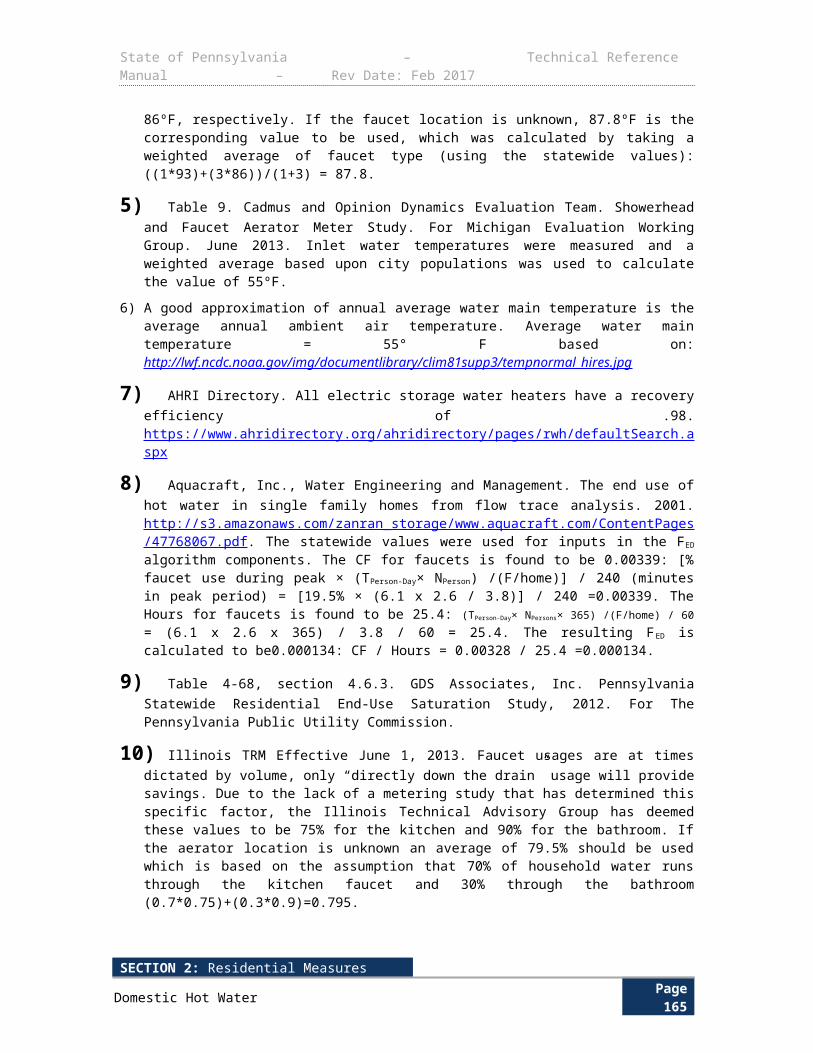
State of Pennsylvania – Technical Reference Manual – Rev Date: Feb 2017
Table 2-101: Energy Savings and Demand Reductions for ENERGY STAR Ceiling Fans
Product Type Energy Savings (kWh) Demand Reduction (kW)
Fan Only 16.0 0.00132
E V A L U A T I O N P R O T O C O L S
The most appropriate evaluation protocol for this measure is verification of installation coupled with calculation of energy and demand savings using above algorithms.
S O U R C E S
1) ENERGY STAR Lighting Fixture and Ceiling Fan Calculator. Updated September, 2013.
2) ENERGY STAR Ceiling Requirements Version 3.0
3) ENERGY STAR Certified Ceiling Fan List, Accessed April 3, 2014.
4) EmPOWER Maryland 2012 Final Evaluation Report: Residential Lighting Program, Prepared by Navigant Consulting and the Cadmus Group, Inc., March 2013, Table 50.
SECTION 2: Residential MeasuresAppliances Page 169
State of Pennsylvania – Technical Reference Manual – Rev Date: Feb 2017
2.5 CONSUMER ELECTRONICS2.5.1 ENERGY STAR TELEVISIONS
Measure Name ENERGY STAR Televisions
Target Sector Residential Establishments
Measure Unit Television Unit
Unit Energy Savings Varies
Unit Peak Demand Reduction Varies
Measure Life 6 years181
Vintage Replace on Burnout
ENERGY STAR certified televisions are on average over 25 percent more energy efficient than conventional models, saving energy in all usage modes: sleep, idle, and on.
E L I G I B I L I T Y
This measure applies to the purchase of an ENERGY STAR TV meeting Version 7.0 standards. Version 7.0 standards are effective as of October 30, 2015. Additionally, in 2012 ENERGY STAR introduced the ENERGY STAR Most Efficient designation, which recognizes the most efficient of the ENERGY STAR qualified televisions.
The baseline equipment is a TV meeting ENERGY STAR Version 6.1 requirements.
A L G O R I T H M S
Energy Savings (per TV):
∆kWh /yr =( W base, active- Wee , active )
1000 WkW
×HOUactive × 365 daysyr
Coincident Demand Savings (per TV):
∆ kW peak =( Wbase,active - Wee , active)
1000 WkW
× CF
Savings calculations are based on power consumption while the TV is in active mode only, as requirements for standby power are the same for both baseline and new units.
181 The 3 hour/day for a ceiling fan is assumed here to be the same hours of use as a typical residential lightbulb, in absence of better data.. EDCs are allowed to do research on hours of use for ceiling fans in lieu of using the 3 hours/day figure. It is likely that the hours of use for ceiling fans is different than that of residential lighting.
SECTION 2: Residential MeasuresConsumer Electronics Page 170
State of Pennsylvania – Technical Reference Manual – Rev Date: Feb 2017
D E F I N I T I O N O F T E R M S
Table 2-102: ENERGY STAR TVs - References
Component Unit Value Source
HOURSactive , number of hours per day that a typical TV is on (active mode turned on and in use
hoursday
5 1
Wbase,active, power use (in Watts) of baseline TV while in on mode (i.e. active mode turned on and operating).
Watts See Table 2-103 2
Wee, active,, Power use of ENERGY STAR Version 6.0 or ENERGY STAR Most Efficient TV while in on mode (i.e. active mode turned on and operating)
Watts See Table 2-103 3
CF, Demand Coincidence Factor Fraction 0.17 4
O N M O D E P O W E R C O N S U M P T I O N R E Q U I R E M E N T S
Ponmax=78.5× tanh [0.0005 ( A−140 )+0.038 ]+14
Where: Pon_max is the maximum allowable On Mode Power consumption in Watts. All ENERGY STAR
Televisions must use 0.5 watts or less while in Sleep Mode (i.e. standby-passive mode).182
A is the viewable screen area of the product in sq. inches, calculated by multiplying the viewable image width by the viewable image heighttanh is the hyperbolic tangent function
ENERGY STAR Most Efficient Televisions must meet all of the program requirements of ENERGY STAR Version 7.0 as well as the following additional requirement:183
Ponmax=65.5× tanh [0.00046 (A−140 )+0.01 ]+14.5
Where: Pon_max is the maximum allowable On Mode Power consumption in Watts.
A is the viewable screen area of the product in sq. inches, calculated by multiplying the viewable image width by the viewable image height
tanh is the hyperbolic tangent function.
182 Assumed same usage characteristics as lighting, same assumption as Minnesota TRM. EDCs are allowed to do research on Coincidence Factor for ceiling fans in lieu of using the 3 hours/day figure. It is likely that the hours of use for ceiling fans is different than that of residential lighting.183 ENERGY STAR Program Requirements for Televisions, Partner Commitments Versions 6.0, accessed June 2013, http://www.energystar.gov/products/specs/system/files/Final%20Version%206%200%20TV%20Program%20Requirements.pdf.
SECTION 2: Residential MeasuresConsumer Electronics Page 171
State of Pennsylvania – Technical Reference Manual – Rev Date: Feb 2017
Table 2-103: TV power consumption
Diagonal Screen Size (inches)184
Baseline Active Power Consumption [Wbase,active]185
ENERGY STAR V. 7.0 Active Power
Consumption [Wee,active]186
ENERGY STAR Most Efficient Power Consumption187
[Wee,active]
< 20 16 15 14
20 < 30 30 22 19
30 < 40 50 32 27
40 < 50 72 44 36
50 < 60 92 57 47
≥ 60 99 63 52
D E E M E D S A V I N G S
Deemed annual energy savings for ENERGY STAR 7.0 and ENERGY STAR Most Efficient TVs are given in Table 2-104.
Table 2-104: Deemed energy savings for ENERGY STAR Version 7.0 and ENERGY STAR Most Efficient TVs.
Diagonal Screen Size (inches)188
Energy SavingsENERGY STAR V. 7.0 TVs
(kWh/year)
Energy Savings ENERGY STAR Most Efficient TVs
(kWh/yr)
< 20 1 3
20 < 30 15 20
30 < 40 34 43
40 < 50 52 66
50 < 60 63 82
≥ 60 65 85
Coincident demand savings are given in Table 2-105.
184 ENERGY STAR Program Requirements for Televisions, Partner Commitments Versions 7.0, accessed Feb 2015, http://www.energystar.gov/sites/default/files/FINAL%20Version%207.0%20Television%20Program%20Requirements%20%28Dec-2014%29_0.pdf185 ENERGY STAR Most Efficient Eligibility Criteria for Recognition Televisions, accessed Feb 2015. http://www.energystar.gov//ia/partners/downloads/most_efficient/2015/Final_ENERGY_STAR_Most_Efficient_2015_Recognition_Criteria_Televisions.pdf?60be-105c186 Calculations are based on TV dimensions at the midpoint of the specified range. For example, a diagonal of 25” was used to compute values for the range of 20”-30”. 15” was used to compute the value for sizes < 20”.187 Based on ENERGY STAR Version 6.1 requirements, from ENERGY STAR Program Requirements for Televisions, http://www.energystar.gov/sites/default/files/FINAL%20Version%206.1%20Television%20Program%20Requirements%20%28Rev%20Oct-2014%29_0.pdf188 Based on ENERGY STAR Version 7.0 requirements, from ENERGY STAR Program Requirements for Televisions, http://www.energystar.gov/sites/default/files/FINAL%20Version%207.0%20Television%20Program%20Requirements%20%28Dec-2014%29_0.pdf
SECTION 2: Residential MeasuresConsumer Electronics Page 172
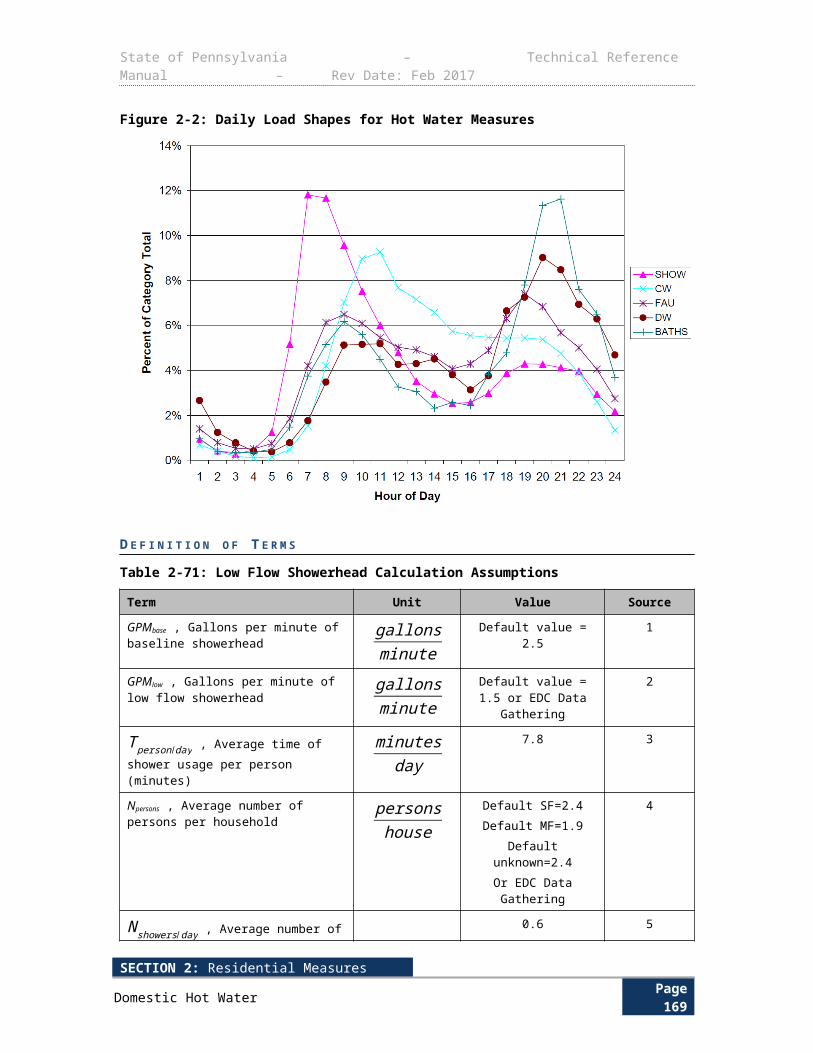
State of Pennsylvania – Technical Reference Manual – Rev Date: Feb 2017
Table 2-105: Deemed coincident demand savings for ENERGY STAR Version 7.0 and ENERGY STAR Most Efficient TVs
Diagonal Screen Size (inches)189
Coincident Demand Savings ENERGY STAR V. 7.0 (kW)
Coincident Demand Savings ENERGY STAR Most Efficient
(kW)
< 20 0.00005 0.0003
20 < 30 0.0014 0.0019
30 < 40 0.0031 0.0040
40 < 50 0.0049 0.0062
50 < 60 0.0059 0.0076
≥ 60 0.0060 0.0079
E V A L U A T I O N P R O T O C O L S
For most projects, the appropriate evaluation protocol is to verify installation and proper selection of default values. For projects using customer specific data for open variables, the appropriate evaluation protocol is to verify installation and proper application of TRM protocol along with verification of open variables. The Pennsylvania Evaluation Framework provides specific guidelines and requirements for evaluation procedures.
S O U R C E S
1) Calculations assume TV is in on mode (or turned on) for 5 hours per day and sleep/standby mode for 19 hours per day. Based on assumptions from ENERGY STAR Calculator, ’EPA Research on Available Models, 2012, accessed June 2013, http://www.energystar.gov/ia/business/bulk_purchasing/bpsavings_calc/Calc_Televisions_Bulk.xls http://www.google.com/url?sa=t&rct=j&q=&esrc=s&source=web&cd=1&cad=rja&ved=0CDAQFjAA&url=http%3A%2F%2Fwww.energystar.gov%2Fia%2Fbusiness%2Fbulk_purchasing%2Fbpsavings_calc%2FConsumer_Electronics_Calculator.xlsx&ei=bzWyUbb0H4Xx0wHw4oBw&usg=AFQjCNGPH4-NaXM_-1IM4J29-of6Plpx5g&sig2=Xau5mB6YjLf3r81hOgmWAQ&bvm=bv.47534661,d.dmQ
2) Based on ENERGY STAR Version 5.3 requirements, from ENERGY STAR Program Requirements for Televisions, Partner Commitments, accessed November 2013, http://www.energystar.gov/ia/partners/prod_development/revisions/downloads/television/V5.3_Program_Requirements.pdf?db43-0cc6
3) Based on ENERGY STAR Version 6.0 requirements, from ENERGY STAR Program Requirements for Televisions, Partner Commitments, accessed November 2013, http://www.energystar.gov/ia/partners/prod_development/revisions/downloads/television/Fina_lDraft_Version_6_TVs_Specification.pdf?94ce-893a
4) CF Value for Efficient Televisions in Efficiency Vermont TRM, 2013. The Efficiency Vermont Peak definition is June-August, 1-5PM non-holiday weekdays, close to the PJM peak definition.
189 Based on ENERGY STAR Most Efficient 2015 Recognition Criteria. http://www.energystar.gov//ia/partners/downloads/most_efficient/2015/Final_ENERGY_STAR_Most_Efficient_2015_Recognition_Criteria_Televisions.pdf?60be-105c
SECTION 2: Residential MeasuresConsumer Electronics Page 173
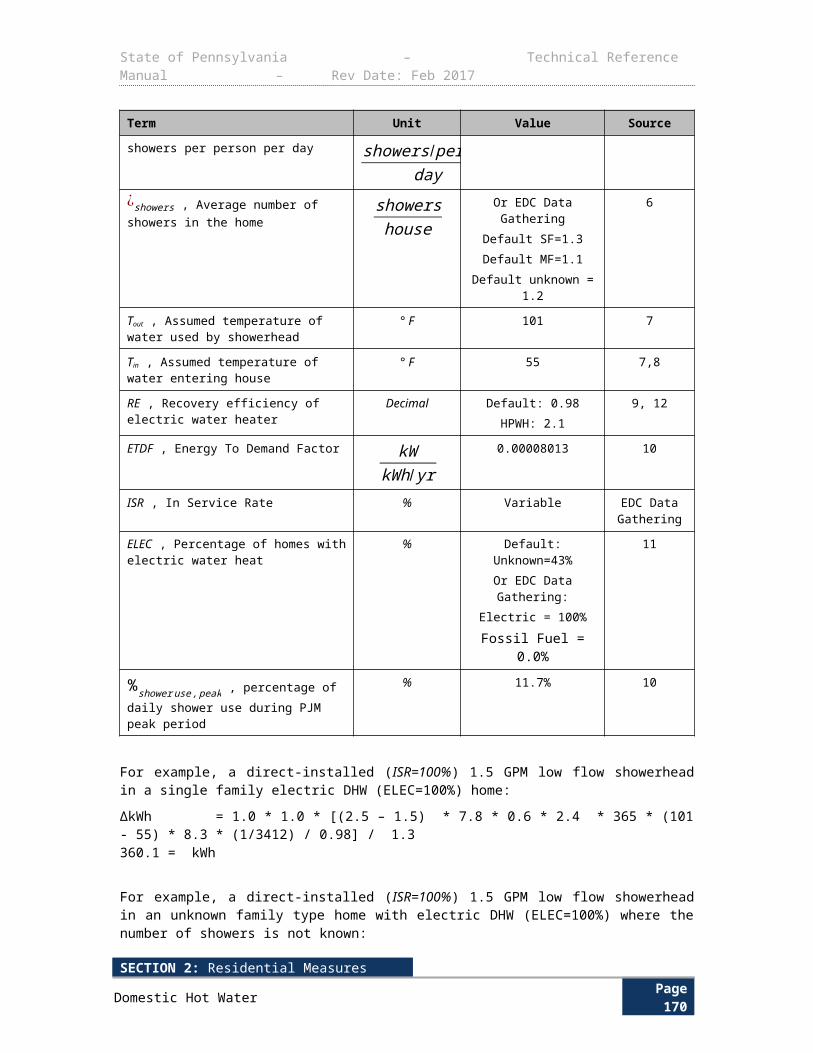
State of Pennsylvania – Technical Reference Manual – Rev Date: Feb 2017
2.5.2 ENERGY STAR OFFICE EQUIPMENT
Measure Name ENERGY STAR Office Equipment
Target Sector Residential Establishments
Measure Unit Office Equipment Device
Unit Energy Savings Error: Reference source not found
Unit Peak Demand Reduction Error: Reference source not found
Measure Life
Computer: 4 yearsMonitor: 4 years
Fax: 4 yearsPrinter: 5 yearsCopier: 6 years
Multifunction Device: 6 years
Vintage Replace on Burnout
E L I G I B I L I T Y This protocol estimates savings for installing ENERGY STAR office equipment compared to standard efficiency equipment in residential applications. The measurement of energy and demand savings is based on a deemed savings value multiplied by the quantity of the measure. The target sector is primarily residential.
A L G O R I T H M S
The general form of the equation for the ENERGY STAR Office Equipment measure savings is:
Total Savings ¿Number of Units×Savings per Unit
To determine resource savings, the per-unit estimates in the algorithms will be multiplied by the number of units. Per unit savings are primarily derived from the ENERGY STAR calculator for office equipment.
ENERGY STAR ComputerkWh/yr = ESavCOM kWpeak = DSavCOM
ENERGY STAR Fax MachinekWh/yr = ESavFAX kWpeak = DSavFAX
ENERGY STAR CopierkWh/yr = ESavCOP kWpeak = DSavCOP
ENERGY STAR Printer
SECTION 2: Residential MeasuresConsumer Electronics Page 174
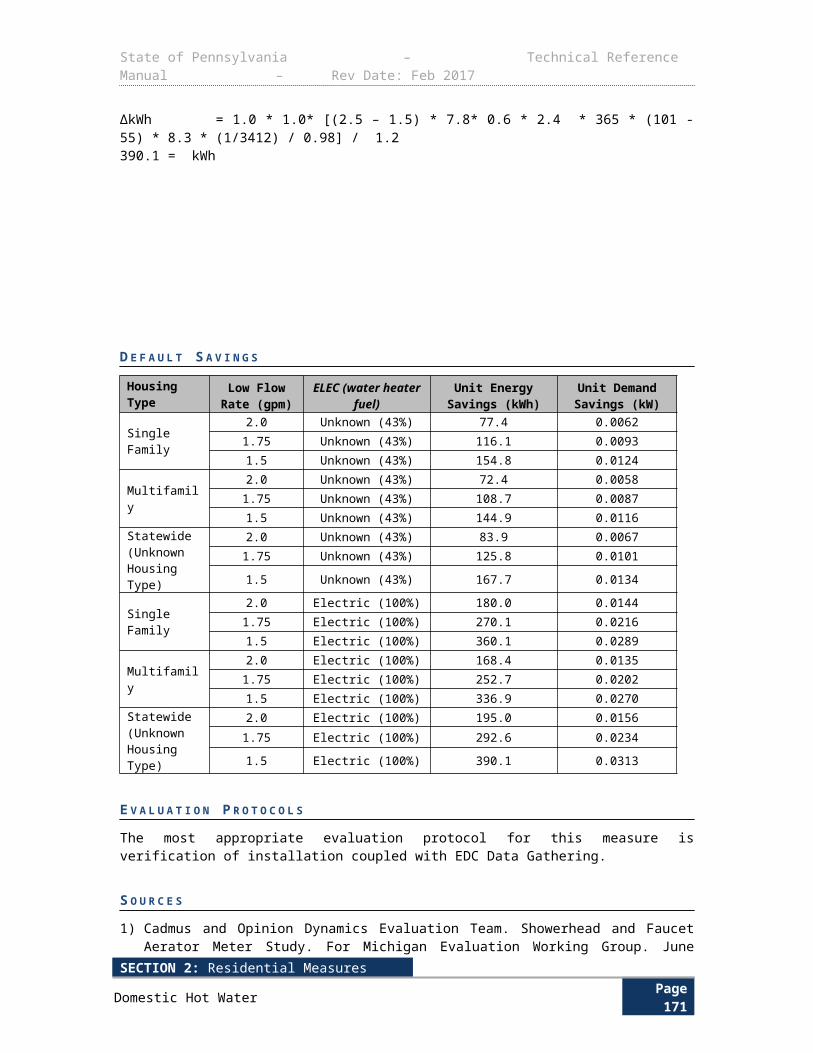
State of Pennsylvania – Technical Reference Manual – Rev Date: Feb 2017
kWh/yr = ESavPRI kWpeak = DSavPRI
ENERGY STAR MultifunctionkWh/yr = ESavMUL kWpeak = DSavMUL
ENERGY STAR MonitorkWh/yr = ESavMON kWpeak = DSavMON
D E F I N I T I O N O F T E R M S
Table 2-106: ENERGY STAR Office Equipment - References
Component Unit Value Sources
ESavCOM , Electricity savings per purchased ENERGY STAR computer.ESavFAX , Electricity savings per purchased ENERGY STAR Fax MachineESavCOP , Electricity savings per purchased ENERGY STAR CopierESavPRI , Electricity savings per purchased ENERGY STAR PrinterESavMUL , Electricity savings per purchased ENERGY STAR Multifunction MachineESavMON , Electricity savings per purchased ENERGY STAR Monitor
kWh/yr See Error: Referencesource not found
1
DSavCOM , Summer demand savings per purchased ENERGY STAR computer.DSavFAX , Summer demand savings per purchased ENERGY STAR Fax MachineDSavCOP , Summer demand savings per purchased ENERGY STAR CopierDSavPRI , Summer demand savings per purchased ENERGY STAR PrinterDSavMUL , Summer demand savings per purchased ENERGY STAR Multifunction MachineDSavMON , Monitor
kW/yr See Error: Referencesource not found
2
D E F A U L T S A V I N G S
SECTION 2: Residential MeasuresConsumer Electronics Page 175
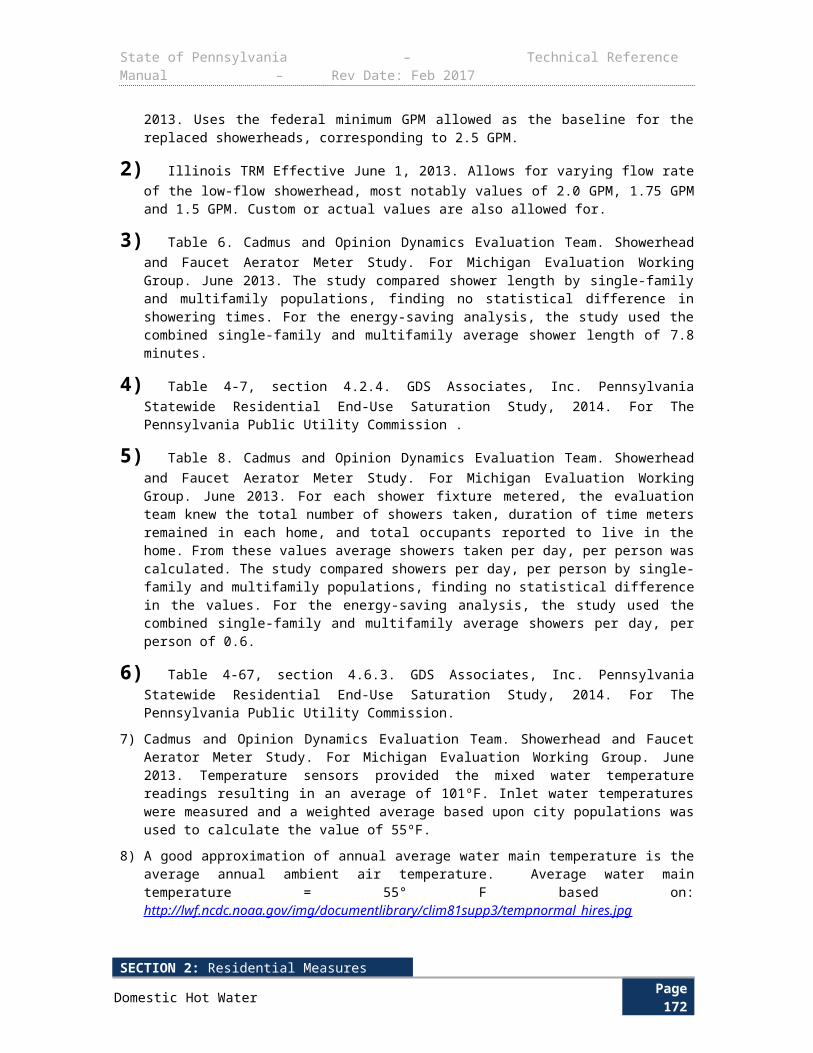
State of Pennsylvania – Technical Reference Manual – Rev Date: Feb 2017
Table 2-107: ENERGY STAR Office Equipment Energy and Demand Savings Values
MeasureEnergy Savings
(ESav)Summer Peak Demand
Savings (DSav) SourceComputer (Desktop) 119 kWh/yr 0.0161 kW 1Computer (Laptop) 22 kWh/yr 0.0030 kW 1Fax Machine (laser) 16 kWh/yr 0.0022 kW 1Copier (monochrome) 1 images/min ≤ 5 37 kWh/yr 0.0050 kW 5 < images/min ≤ 15 26 kWh/yr 0.0035 kW 15 < images/min ≤ 20 9 kWh/yr 0.0012 kW 20 < images/min ≤ 30 42 kWh/yr 0.0057 kW 30 < images/min ≤ 40 50 kWh/yr 0.0068 kW 40 < images/min ≤ 65 186 kWh/yr 0.0251 kW 65 < images/min ≤ 82 372 kWh/yr 0.0502 kW 82 < images/min ≤ 90 469 kWh/yr 0.0633 kW images/min > 90 686 kWh/yr 0.0926 kWPrinter (laser, monochrome) 1 images/min ≤ 5 37 kWh/yr 0.0050 kW 5 < images/min ≤ 15 26 kWh/yr 0.0035 kW 15 < images/min ≤ 20 23 kWh/yr 0.0031 kW 20 < images/min ≤ 30 42 kWh/yr 0.0057 kW 30 < images/min ≤ 40 50 kWh/yr 0.0068 kW 40 < images/min ≤ 65 181 kWh/yr 0.0244 kW 65 < images/min ≤ 82 372 kWh/yr 0.0502 kW 82 < images/min ≤ 90 542 kWh/yr 0.0732 kW images/min > 90 686 kWh/yr 0.0926 kWPrinter (Ink Jet) 6 kWh/yr 0.0008 kW 1Multifunction (laser, monochrome) 1 s ≤ 5 57 kWh/yr 0.0077 kW 5 < s ≤ 10 48 kWh/yr 0.0065 kW 10 < s ≤ 26 52 kWh/yr 0.0070 kW 26 < s ≤ 30 93 kWh/yr 0.0126 kW 30 < s ≤ 50 248 kWh/yr 0.0335 kW 50 < s ≤ 68 420 kWh/yr 0.0567 kW 68 < s ≤ 80 597 kWh/yr 0.0806 kW s > 80 764 kWh/yr 0.1031 kWMultifunction (Ink Jet) 6 kWh/yr 0.0008 kW 1Monitor 24 kWh/yr 0.0032 kW 1
E V A L U A T I O N P R O T O C O L S
For most projects, the appropriate evaluation protocol is to verify installation and proper selection of default values. For projects using customer specific data for open variables, the appropriate evaluation protocol is to verify installation and proper application of TRM protocol along with verification of open variables. The Pennsylvania Evaluation Framework provides specific guidelines and requirements for evaluation procedures.
S O U R C E S 1) ENERGY STAR Office Equipment Calculator (Referenced latest version released in
December 2014). Default values were used. Using a commercial office equipment load shape, the percentage of total savings that occur during the PJM peak demand period was calculated and multiplied by the energy savings.
SECTION 2: Residential MeasuresConsumer Electronics Page 176
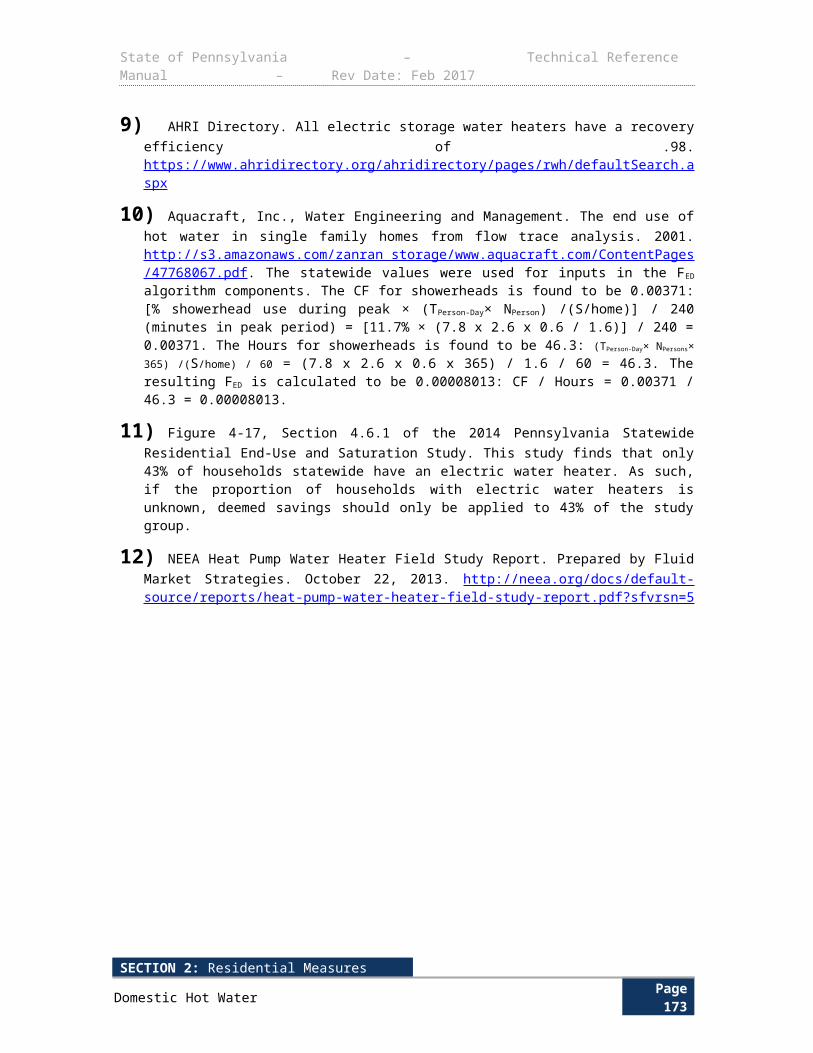
State of Pennsylvania – Technical Reference Manual – Rev Date: Feb 2017
2.5.3 SMART STRIP PLUG OUTLETS
Measure Name Smart Strip Plug Outlets
Target Sector Residential Establishments
Measure Unit Per Smart Strip
Unit Energy Savings
Tier 1:48.9 kWh (5-plug, unspecified use or multiple purchased)58.7 kWh (7-plug, unspecified use or multiple purchased)
62.1 kWh (5-plug, Entertainment Center)74.5 kWh (7-plug, Entertainment Center)
Tier 2:204.18 kWh (unspecified use or multiple purchased)
307.42 kWh (Entertainment Center)
Unit Peak Demand Reduction
Tier 1:0.0056 kW (5-plug, unspecified use or multiple purchased)0.0067 kW (7-plug, unspecified use or multiple purchased)
0.0077 kW (5-plug, Entertainment Center)0.0092 kW (7-plug, Entertainment Center)
Tier 2:0.0194 (unspecified use or multiple purchased)
0.0316 kW (Entertainment Center)
Measure Life 5 years190
Vintage Retrofit
Smart Strips are power strips that contain a number of power-saver sockets. There are two types of smart power strips: Tier 1 and Tier 2.
Tier 1 smart strips have a master control socket arrangement and will shut off the items plugged into the controlled power-saver sockets when they sense that the appliance plugged into the master socket has been turned off. Conversely, the appliance plugged into the master control socket has to be turned on and left on for the devices plugged into the power-saver sockets to function.
Tier 2 smart strips deliver additional functionality beyond that of a Tier 1 unit, as Tier 2 units manage both standby and active power consumption. The Tier 2 smart strips manage standby power consumption by turning off devices from a control event; this could be a TV or other item powering off, which then powers off the controlled outlets to save energy. Active power consumption is managed by the Tier 2 unit by monitoring a user’s engagement or presence in a room by either or both infrared remote signals sensing or motion sensing. If after a period of user absence or inactivity, The Tier 2 unit will shut off all items plugged into the controlled outlets, thus saving energy.
E L I G I B I L I T Y
This protocol documents the energy savings attributed to the installation of smart strip plugs. The most likely area of application is in residential spaces, i.e. single-family and multifamily homes. However, commercial applications are also appropriate for smart strips (see Section 3.9.3 Smart
190 Calculations are based on TV dimensions at the midpoint of the specified range. For example, a diagonal of 25” was used to compute values for the range of 20”-30”. 15” was used to compute the value for sizes < 20”. 60” was used to compute the value for sizes ≥ 60”
SECTION 2: Residential MeasuresConsumer Electronics Page 177
State of Pennsylvania – Technical Reference Manual – Rev Date: Feb 2017
Strip Plug Outlets). The protocol considers usage of smart strips with home office systems and home entertainment systems.
The saving algorithm for Tier 1 smart strips uses the number of plugs on each strip as a factor in the calculations. It is expected that approximately three to five items will be plugged into each 5-plug power strip, and that five to six items will be plugged into a 7-plug power strip.
The saving algorithm for Tier 2 smart strips uses an average entertainment center or home office energy consumption, as documented in secondary data sources, and a field-trial-tested estimated saving factor as the basis for the saving calculations.
A L G O R I T H M S
The energy savings and demand reduction for Tier 1 smart strip plug outlets are obtained using standard standby or low power wattages for typical entertainment center and home office components. The energy savings and demand reduction for Tier 2 smart strip plug outlets are obtained using the average household entertainment center and home office component usages multiplied by an energy savings factor.
If the intended use of the power strip is not specified, or if multiple power strips are purchased, the algorithm for “unspecified use” should be applied. If it is known that the power strip is intended to be used for an entertainment center, the “entertainment center” algorithm should be applied.
Tier 1 Smart Strip:
kWh /yr unspecified use = ( kWcomp idle × H OUcomp idle )+( kWTVidle × H OUT V idle )2
× 365 daysyr
× ISR = 48.9 kWh
(5-plug); 58.7 kWh (7-plug)
kWh /yr entertainment center = kW TV idle×HOU TV idle× 365 daysyr
× ISR = 62.1 kWh
(5-plug); 74.5 kWh (7-plug)
kW peak unspecified use = CF × (kWcomp idle + kW TV idle )2
× ISR =0.0056 kW
(5-plug); 0.0067 kW (7-plug)kW peak entertainment center = CF × kWTV idle × ISR =0.0077 kW (5-plug);
0.0092 kW (7-plug)
Tier 2 Smart Strip:
kWh entertainment center = kWhTV ×ESF×ISR = 307.42 kWh
kWh unspecified use = (kWhcomp + kWhTV )2
×ESF×ISR = 204.18 kWh
kW peak entertainment center= CF× ∆kWh entertainment center
8760 hoursyr
× ISR = 0.0316 kW
SECTION 2: Residential MeasuresConsumer Electronics Page 178
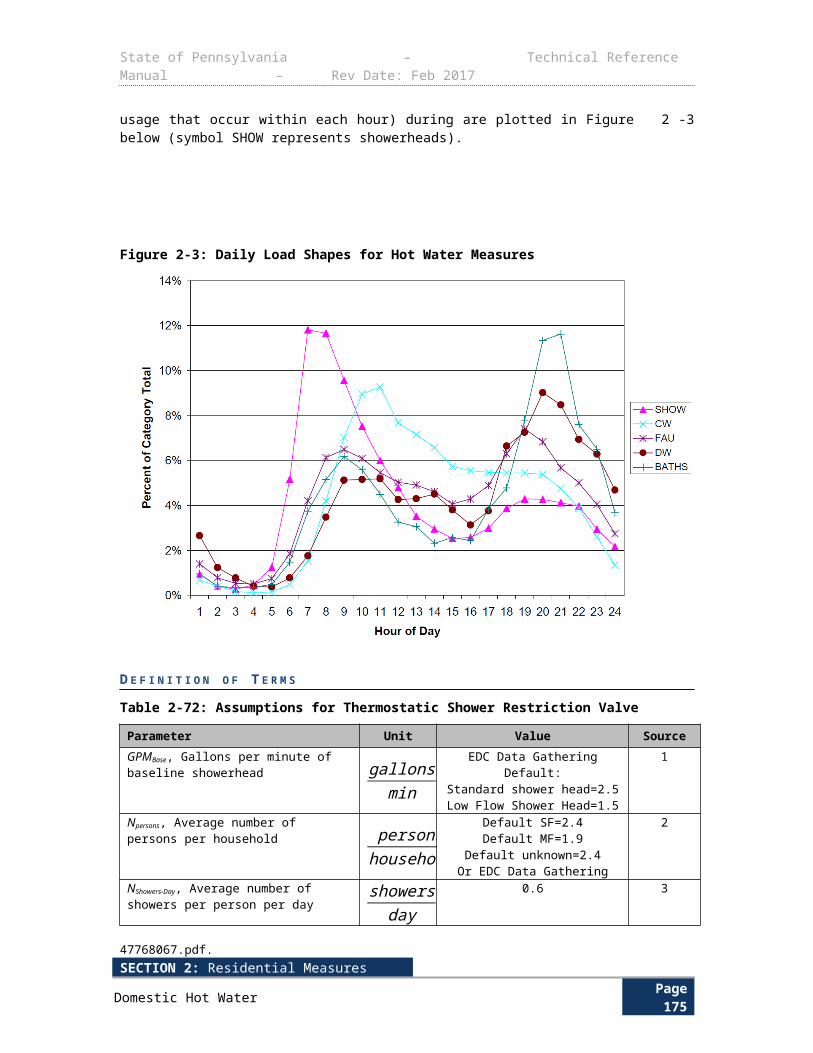
State of Pennsylvania – Technical Reference Manual – Rev Date: Feb 2017
kW peak unspecified use = CF× ( ∆kWh comp + ∆kWh entertainment center )
2 × 8760 hoursyr
× ISR =0.0194 kW
D E F I N I T I O N O F T E R M S
The parameters in the above equation are listed in Table 2-106..
Table 2-108: Smart Strip Plug Outlet Calculation Assumptions
Parameter Unit Value Source
kWcomp idle , Idle kW of computer system kW 0.0049 (5-plug)0.00588 (7-plug)
1,2,4
HOUcomp idle , Daily hours of Computer idle time
hoursday
20 1
kWTV idle , Idle kW of TV system kW 0.0085 (5-plug)0.0102 (7-plug)
1,4
HOUTV idle , Daily hours of TV idle time hoursday
20 1
kWhTV , Annual kWh of TV system kWh EDC Data GatheringDefault= 602.8
4
kWhCpmp , Annual kWh of computer system kWh EDC Data GatheringDefault= 197.9
4
ISR , In-Service Rate Fraction EDC Data GatheringDefault = 1.0
CF , Coincidence Factor Fraction Entertainment Center= 0.90Computer System= 0.763Unspecified Use191= 0.832
3
ESF , Energy Savings Factor. Percent of baseline energy consumption saved by installing the measure
Fraction Entertainment Center: 0.51 5192
D E E M E D S A V I N G S
The default savings calculated based on the parameters identified above are provided in Table 2-109.
191 Calculations are based on TV dimensions at the midpoint of the specified range. For example, a diagonal of 25” was used to compute values for the range of 20”-30”. 15” was used to compute the value for sizes < 20”. 60” was used to compute the value for sizes ≥ 60”192 DSMore Michigan Database. http://michigan.gov/mpsc/0,4639,7-159-52495_55129---,00.html
SECTION 2: Residential MeasuresConsumer Electronics Page 179
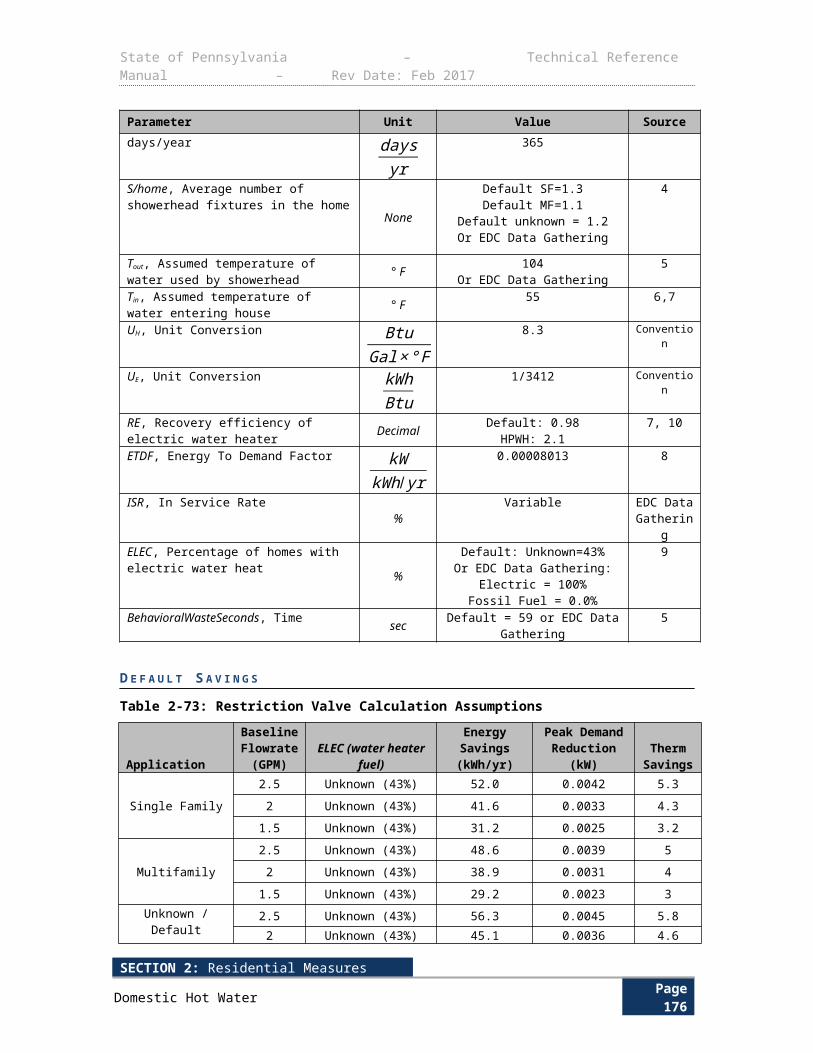
State of Pennsylvania – Technical Reference Manual – Rev Date: Feb 2017
Table 2-109: Default Savings for Smart Strip Plug Outlets
Energy Savings (kWh) Peak Demand Reduction (kW) Usage
Tier 1 Smart Strip
48.9 (5-plug) 0.0056 Unspecified use or multiple purchased
58.7 (7-plug) 0.0067 Unspecified use or multiple purchased
62.1 (5-plug) 0.0077 Entertainment Center
74.5 (7-plug) 0.0092 Entertainment Center
Tier 2 Smart Strip
307.42 0.0316 Entertainment Center
204.18 0.0194 Unspecified use or multiple purchased
E V A L U A T I O N P R O T O C O L S
The most appropriate evaluation protocol for this measure is verification of installation coupled with assignment of stipulated energy savings.
S O U R C E S
1) “Electricity Savings Opportunities for Home Electronics and Other Plug-In Devices in Minnesota Homes”, Energy Center of Wisconsin, May 2010.
2) “Smart Plug Strips”, ECOS, July 2009.
3) CF Values of Standby Losses for Entertainment Center and Home Office in Efficiency Vermont TRM, 2013, pg 16. Developed through negotiations between Efficiency Vermont and the Vermont Department of Public Service.
4) “Advanced Power Strip Research Report”, NYSERDA, August 2011.
5) “Tier 2 Advanced Power Strip Evaluation for Energy Saving Incentive,” California Plug Load Research Center, 2014. http://www.efi.org/docs/studies/calplug_tier2.pdf
SECTION 2: Residential MeasuresConsumer Electronics Page 180
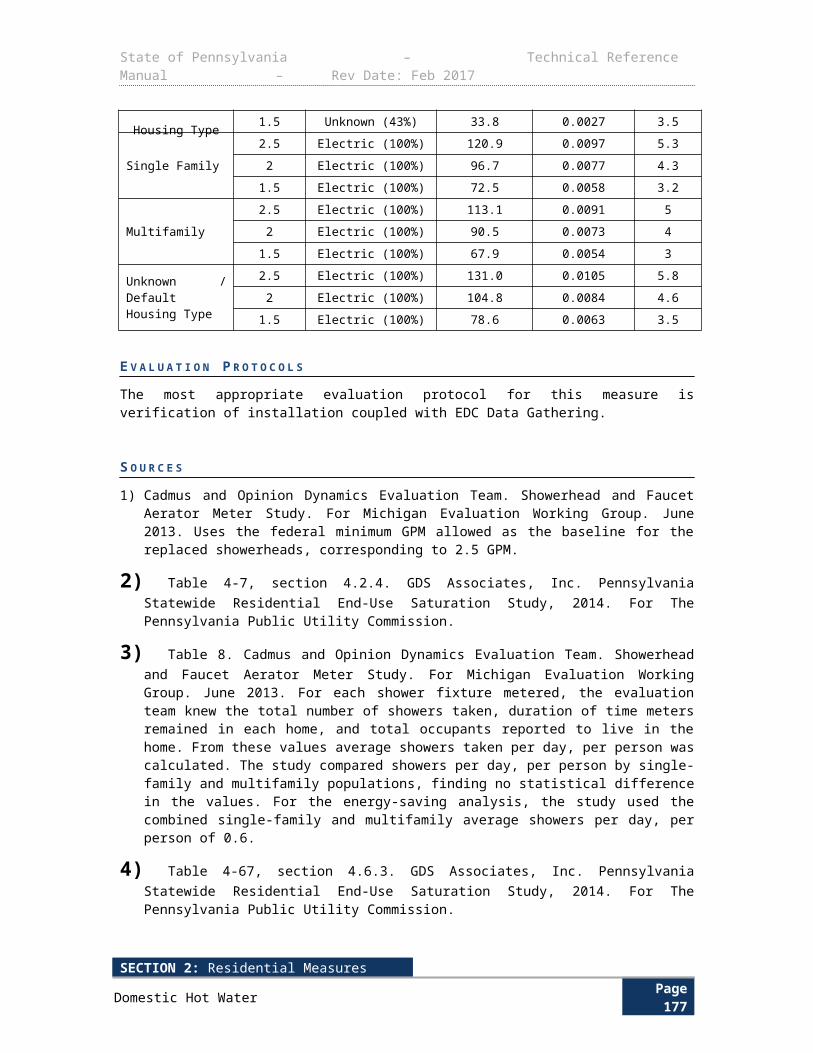
State of Pennsylvania – Technical Reference Manual – Rev Date: Feb 2017
2.6 BUILDING SHELL2.6.1 CEILING / ATTIC AND WALL INSULATION
Measure Name Ceiling/Attic and Wall Insulation
Target Sector Residential Establishments
Measure Unit Insulation Addition
Unit Energy Savings Varies
Unit Peak Demand Reduction Varies
Measure Life 15 years193
Vintage Retrofit
E L I G I B I L I T Y This measure applies to installation/retrofit of new or additional insulation in a ceiling/attic, or walls of existing residential homes or apartment units in multifamily complexes with a primary electric heating and/or cooling source. The installation must achieve a finished ceiling/attic insulation rating of R-38 or higher, and/or must add wall insulation of at least an R-6 or greater rating.
The baseline for this measure is an existing residential home with a ceiling/attic insulation R-value less than or equal to R-30, and wall insulation R-value less than or equal to R-11, with an electric primary heating source and/or cooling source.
A L G O R I T H M S
The savings values are based on the following algorithms.
Cooling savings with central A/C:
ΔkWh /yrCAC=CDD × 24 hr
day × DUA
SEERCAC × 1000 WkW
× [AHF × Aroof (1R roof,bl-1R roof,ee )+ Awall(1Rwall,bl
-1Rwall,ee )]
∆kWpeak- CAC =∆kWhCAC
EFLHcool × CFCAC
Cooling savings with room A/C:
ΔkWh /yrRAC =CDD × 24 hr
day × DUA × FRoom AC
EERRAC × 1000 WkW
× [ AHF×A roof (1R roof,bl
-1R roof,ee )+ Awall(1
Rwall,bl -1
Rwall,ee )]
193 CF for “unspecified use” is the average of the standby losses CF for Entertainment Center (90.0%) and Home Office (76.3%) from pg 16 Efficiency Vermont TRM, 2013. Developed through negotiations between Efficiency Vermont and the Vermont Department of Public Service.
SECTION 2: Residential MeasuresBuilding Shell Page 181
State of Pennsylvania – Technical Reference Manual – Rev Date: Feb 2017
∆kWpeak- RAC = ∆kWhRAC
EFLHcool RAC × CFRAC
Cooling savings with electric air-to-air heat pump:
ΔkWh /yrASHP cool =CDD × 24 hr
day × DUA
SEERASHP × 1000 WkW
× [AHF×Aroof (1R roof,b l -1
Rroof,ee )+ Awall(1Rwall,bl-1Rwall,ee )]
ΔkW peak-ASHP cool =ΔkWhASHP cool
EFLHcool × CFASHP
Cooling savings with electric ground source heat pump:
ΔkWh /yrGSHP cool =CDD×24 hr
day×DUA
EERGSHP ×GSHPDF×GSER×1000 WkW
×[AHF×A roof (1R roof,bl
-1R roof,ee )+ Awall(1Rwall,bl
-1Rwall,ee )]
ΔkW peak-GSHP cool =ΔkWhGSHP cool
EFLHcool× CFGSHP
Heating savings with electric ground source heat pump:
ΔkWh /yrGSHP heat =HDD×24 hr
day
COPGSHP ×GSHPDF× GSOP ×1000 WkW
×[A roof (1R roof,bl
-1R roof,ee )+ Awall(1Rwall,bl
-1Rwall,ee )]
ΔkW peak-GSHP heat = 0
Heating savings with electric air-to-air heat pump:
ΔkWh /yrASHP heat =HDD × 24hr
day
HSPFASHP × 1000 WkW
× [A roof (1R roof,bl
-1R roof,ee )+ Awall(1Rwall,bl
-1Rwall,ee )]
ΔkW peak-ASHP heat = 0
Heating savings with electric baseboard or electric furnace heat (assumes 100% efficiency):
SECTION 2: Residential MeasuresBuilding Shell Page 182

State of Pennsylvania – Technical Reference Manual – Rev Date: Feb 2017
ΔkWh /yr elec heat =HDD × 24 hr
day
3412 BtukWh
× [A roof (1R roof,bl-1R roof,ee )+ Awall(1
Rwall,bl- 1Rwall,ee )]
∆kWpeak- elec heat = 0
D E F I N I T I O N O F T E R M S
The default values for each term are shown in Table 2-110. The default values for heating and cooling days and hours are given in Table 2-110.
Table 2-110: Default values for algorithm terms, Ceiling/Attic and Wall Insulation
Term Unit Value Source
Aroof , Area of the ceiling/attic with upgraded insulation
ft2 Varies EDC Data Gathering
Awall , Area of the wall with upgraded insulation
ft2 Varies EDC Data Gathering
DUA , Discretionary Use Adjustment to account for the fact that people do not always operate their air conditioning system when the outside temperature is greater than 65F.
None 0.75 1
AHF , Attic Heating Factor increases cooling load to home due to attic temperatures being warmer than ambient outdoor air temperature on sunny days.
None 1.056 2, 3
Rroof,bl194
, Assembly R-value of ceiling/attic before retrofit
° F ∙ ft 2 ∙ hrBtu
5 Un-insulated attic
16 4.5” (R-13) of existing attic insulation
22 6” (R-19) of existing attic insulation
30 10” (R-30) of existing attic insulation
Existing Assembly R-value
EDC Data Gathering
Rroof,ee195
, Assembly R-value of ceiling/attic after retrofit
° F ∙ ft 2 ∙ hrBtu
38 Retrofit to R-38 total attic insulation
49 Retrofit to R-49 total
194 The California Plug Load Research Center study does not provide an energy saving factor for Tier 2 smart strips used with computer equipment. However, the algorithm provided for Tier 2 Smart Strips here, assumes savings percentage for home office equipment is the same as that documented for entertainment center by the California Plug Load Research Center.195 Massachusetts Statewide Technical Reference Manual for Estimating Savings from Energy Efficiency Measures, Version 1.0, accessed August 2010 at http://www.ma-eeac.org/docs/091023-MA-TRMdraft.pdf. Note that measure life is defined as 25 years; however, PA Act 129 savings can be claimed for no more than 15 years.
SECTION 2: Residential MeasuresBuilding Shell Page 183
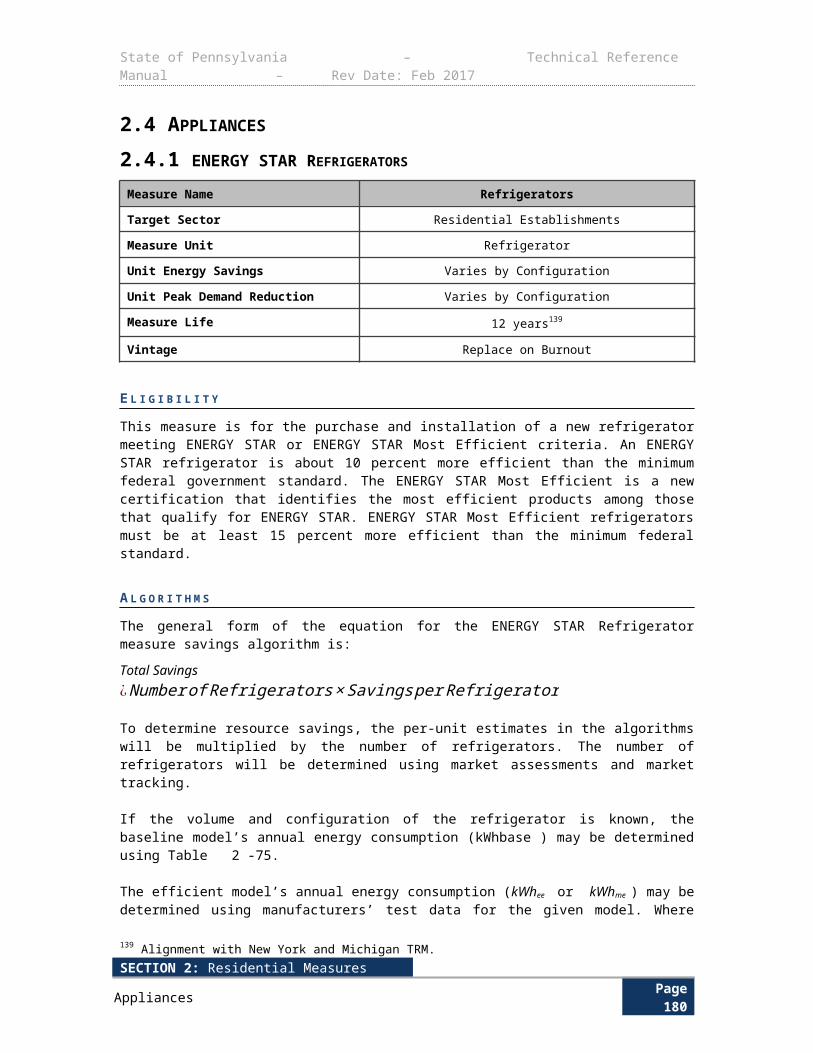
State of Pennsylvania – Technical Reference Manual – Rev Date: Feb 2017
Term Unit Value Source
attic insulation
Retrofit Assembly R-value
EDC Data Gathering
Rwall,bl196
, Assembly R-value of wall before retrofit
° F ∙ ft 2 ∙ hrBtu
Default = 5.0 15 Assumes existing, un-insulated wall with 2x4 studs @ 16” o.c., w/ wood/vinyl siding
Existing Assembly R-value
EDC Data Gathering
Rwall,ee197
, Assembly R-value of wall after retrofit
° F ∙ ft 2 ∙ hrBtu
Default = 11.0 Assumes adding R-6 per DOE
recommendations198
Retrofit Assembly R-value
EDC Data Gathering
SEERCAC , Seasonal Energy Efficiency Ratio of existing home central air conditioner
BtuW ∙hr
Default for equipment installed before 1/23/2006 = 10
Default for equipment installed after
1/23/2006 = 13
4
Nameplate EDC Data Gathering
EERRAC , Average Energy Efficiency Ratio of existing room air conditioner
BtuW ∙hr
Default = 9.8 DOE Federal Test Procedure 10 CFR 430, Appendix F
(Used in ES Calculator for
baseline)
Nameplate EDC Data Gathering
SEERASHP , Seasonal Energy Efficiency Ratio of existing home air source heat pump
BtuW ∙hr
Default for equipment installed before 1/23/2006 = 10
Default for equipment installed after
1/23/2006 = 13Default for equipment
installed after 6/1/2015 = 14
4
Nameplate EDC Data Gathering
HSPFASHP , Heating Seasonal Performance Factor for existing home heat pump
BtuW ∙hr
Default for equipment installed before 1/23/2006 = 6.8
Default for equipment installed after
44
196 Used eQuest 3.64 to derive roof assembly R-values. When insulation is added between the joists as in most insulation up to R-30 (10”), the assembly R-value is based on a parallel heat transfer calculation of the insulation and joists, rather than a series heat transfer.197 Generally as insulation is added beyond R-30 (10”), the insulation has cleared the joists and the R-value of the insulation above the joists can be added as a series heat transfer rather than a parallel heat transfer condition. Therefore, above R-30 insulation levels, the additional R-value can be added directly to the assembly value of R-30 insulation.198 Used eQuest 6.64 to derive wall assembly R-values.
SECTION 2: Residential MeasuresBuilding Shell Page 184
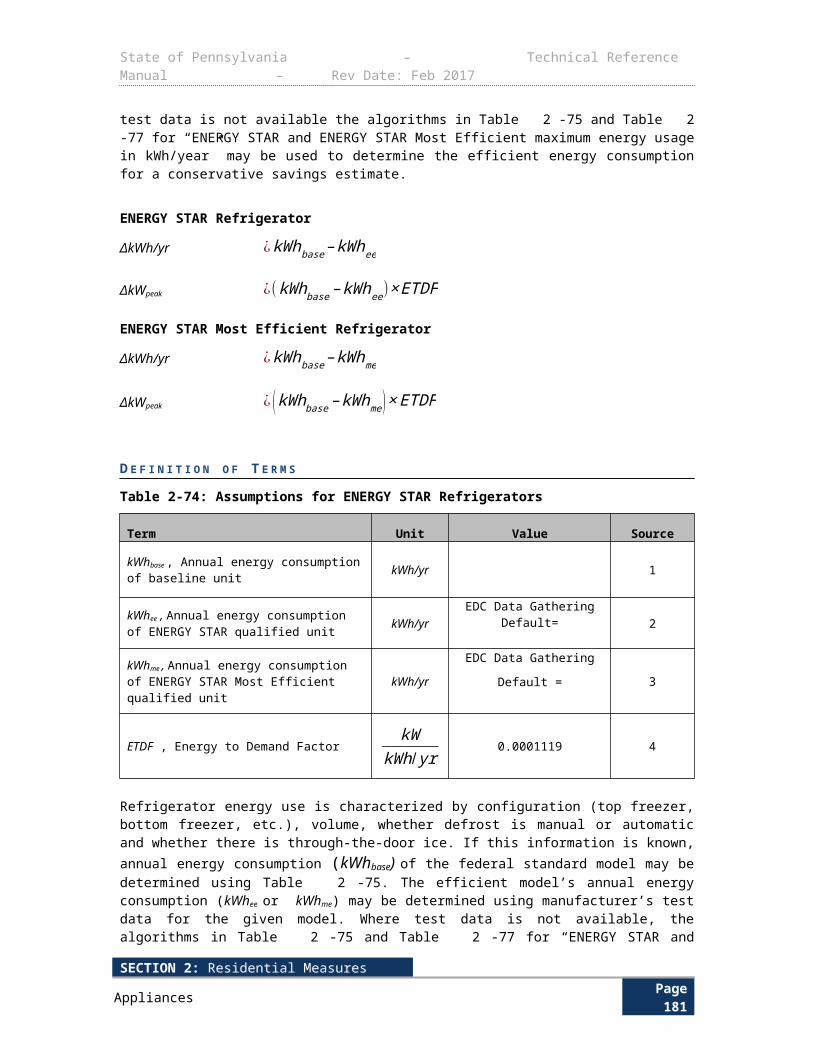
State of Pennsylvania – Technical Reference Manual – Rev Date: Feb 2017
Term Unit Value Source
1/23/2006 = 7.7Default for equipment
installed after 6/1/2015 = 8.2
Nameplate EDC Data Gathering
EERGSHP , Energy Efficiency Ratio of existing home ground source heat pump
BtuW ∙hr
Default for Ground Source Heat Pump =
13.4Default for
Groundwater Source Heat Pump = 16.2
5
Nameplate EDC Gathering
GSER , Factor to determine the SEER of a GSHP based on its EER
None 1.02 6
COPGSHP , Coefficient of Performance for existing home ground source heat pump
None Default for Ground Source Heat Pump =
3.1Default for
Groundwater Source Heat Pump = 3.6
5
Nameplate EDC Gathering
GSOP , Factor to determine the HSPF of a GSHP based on its COP
BtuW ∙hr
3.412 7
GSHPDF , Ground Source Heat Pump De-rate Factor
None 0.885 (Engineering Estimate - See 2.2.1)
CFCAC , Demand Coincidence Factor for central AC systems
Fraction 0.647 8
CFRAC , Demand Coincidence Factor for Room AC systems
Fraction 0.647 9
CFASHP , Demand Coincidence Factor for ASHP systems
Fraction 0.647 8
CFGSHP , Demand Coincidence Factor for GSHP systems
Fraction 0.647 8
FRoom,AC , Adjustment factor to relate insulated area to area served by Room AC units
None 0.38 Calculated199
CDD , Cooling Degree Days ° F ∙Days Table 2-111 10
HDD , Heating Degree Days ° F ∙Days Table 2-111 10
EFLHcool , Equivalent Full Load Cooling hours for Room AC
hoursyear
Table 2-111 11
199 Used eQuest 6.64 to derive wall assembly R-values. It is coincidence that adding R-6 to a 2x4 stud wall essentially yields R-9 assembly value even though this was done using a parallel heat transfer calculation. This was due to rounding. The defaults are based on conservative assumptions of wall construction.
SECTION 2: Residential MeasuresBuilding Shell Page 185
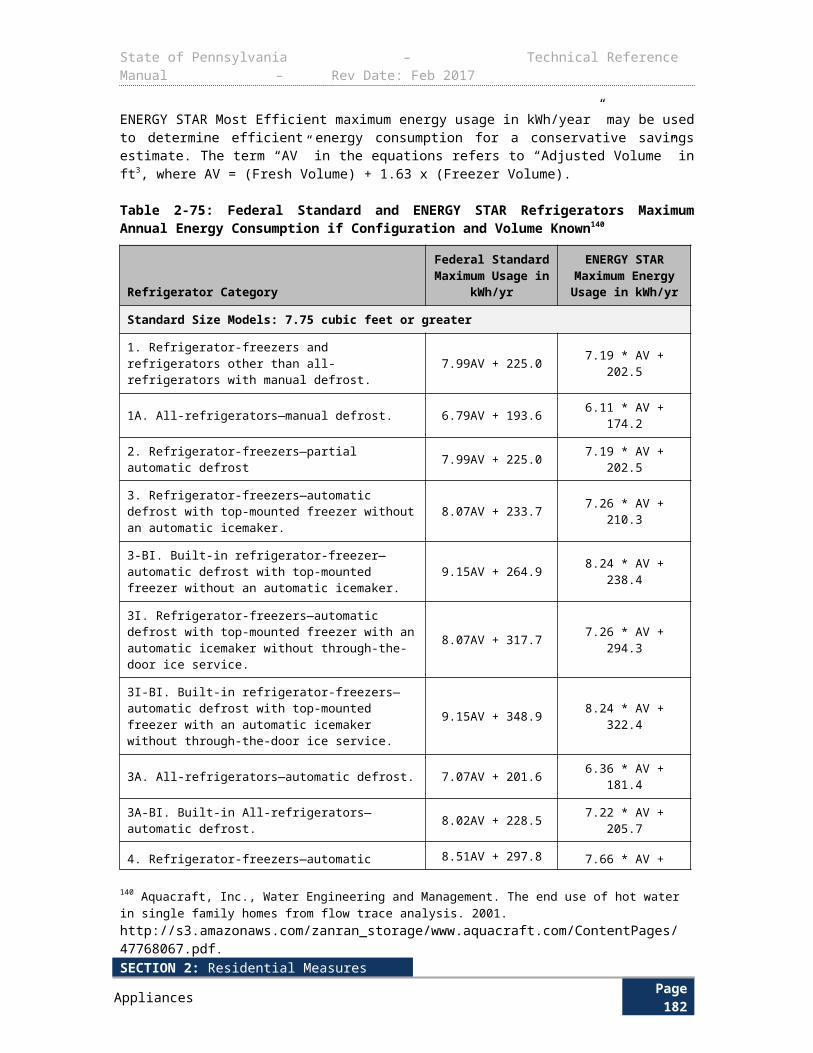
State of Pennsylvania – Technical Reference Manual – Rev Date: Feb 2017
Term Unit Value Source
EFLHcool RAC, Equivalent Full Load Cooling hours for Central AC and ASHP
hoursyear
Table 2-11112
Table 2-111: EFLH, CDD and HDD by City
CityEFLHcool
(Hours)EFLHcool RAC
(Hours)CDD (Base 65) HDD (Base 65)
Allentown 487 243 787 5830
Erie 389 149 620 6243
Harrisburg 551 288 955 5201
Philadelphia 591 320 1235 4759
Pittsburgh 432 228 726 5829
Scranton 417 193 611 6234
Williamsport 422 204 709 6063
Alternate EFLH values from Table 2-17 and Table 2-18 in Section 2.1 may also be used for central air conditioners and air source heat pumps. The tables show cooling EFLH and heating EFLH, respectively, by city and for each EDC’s housing demographics. EFLH values are only shown for cities that are close to customers in each EDC’s service territory. In order to determine the most appropriate EFLH value to use for a project, first select the appropriate EDC, then, from that column, pick the closest city to the project location. The value shown in that cell will be the EFLH value to use for the project.
A T T I C H E A T I N G E F F E C T O N C O O L I N G L O A D S
On sunny days, attic temperatures can be 20%-35% higher than ambient outdoor air temperatures during the 7 hours between 9 AM and 4 PM and 6%-8% higher for the 4 hours from 7 AM to 9 AM and 4 PM to 6 PM.13 The remaining 13 hours of the day there was no significant difference seen between attic temperature and outdoor air temperature; this results in an average hourly temperature difference between the attic and outdoor air of approximately +9% over the course of a 24 hour period, but only on sunny days. According to NOAA climatic data for Pennsylvania cities (Allentown, Erie, Harrisburg, Philadelphia, and Pittsburgh) for June through August, it is sunny or partly cloudy an average of 62% of the days.14 It is assumed that there is an attic heating effect on both sunny and partly cloudy days, but not on cloudy days; therefore, an appropriate attic heating factor would be 1.056 based on the fact that the average hourly difference between attic temperature and outdoor air temperature is approximately +5.6% (9% x 62%).
E V A L U A T I O N P R O T O C O L S
For most projects, the appropriate evaluation protocol is to verify installation and proper selection of default values. For projects using customer specific data for open variables, the appropriate evaluation protocol is to verify installation and proper application of TRM protocol along with verification of open variables. The Pennsylvania Evaluation Framework provides specific guidelines and requirements for evaluation procedures.
S O U R C E S
1) “State of Ohio Energy Efficiency Technical Reference Manual,” prepared for the Public Utilities Commission of Ohio by Vermont Energy Investment Corporation. August 6, 2010.
SECTION 2: Residential MeasuresBuilding Shell Page 186
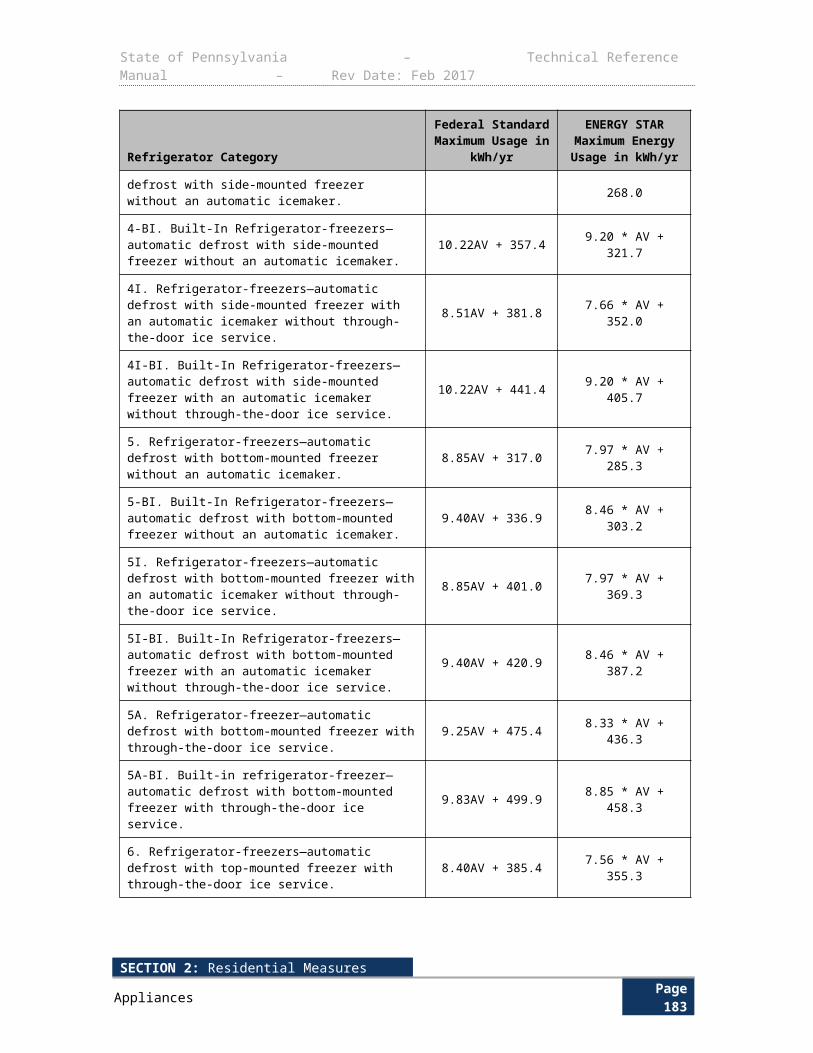
State of Pennsylvania – Technical Reference Manual – Rev Date: Feb 2017
2) ”Improving Attic Thermal Performance”, Home Energy, November 2004.
3) NOAA Climatic Data for Pennsylvania cities- Cloudiness (mean number of days Sunny, Partly Cloudy, and Cloudy), http://ols.nndc.noaa.gov/plolstore/plsql/olstore.prodspecific?prodnum=C00095-PUB-A0001.
4) US DOE Federal Standards for Central Air Conditioners and Heat Pumps. http://www1.eere.energy.gov/buildings/appliance_standards/product.aspx/productid/75
5) Minimum efficiency standards for Ground and Groundwater Source Heat Pumps. IECC 2009.
6) VEIC estimate. Extrapolation of manufacturer data.
7) Engineering calculation, HSPF/COP=3.412
8) Straub, Mary and Switzer, Sheldon. "Using Available Information for Efficient Evaluation of Demand Side Management Programs". Study by BG&E. The Electricity Journal. Aug/Sept. 2011. http://www.sciencedirect.com/science/article/pii/S1040619011001941
9) Consistent with CFs found in RLW Report: Final Report Coincidence Factor Study Residential Room Air Conditioners, June 23, 2008.200
10) Climatography of the United States No. 81. Monthly Station Normals of Temperature, Precipitation, and Heating and Cooling Degree Days 1971-2000, 36 Pennsylvania. NOAA. http://cdo.ncdc.noaa.gov/climatenormals/clim81/PAnorm.pdf
11) Based on REM/Rate modeling using models from the PA 2012 Potential Study. EFLH calculated from kWh consumption for cooling and heating. Models assume 50% over-sizing of air conditioners and 40% oversizing of heat pumps.201
12) 2014 PA TRM Section 2.2.4 Room AC Retirement.
200 DOE recommendation on ENERGY STAR website for adding wall insulation to existing homes in Zones 5-8. Insulation may be loose fill in stud cavities or board insulation beneath siding. http://www.energystar.gov/index.cfm?c=home_sealing.hm_improvement_insulation_table 201 From PECO baseline study, average home size = 2323 ft2, average number of room AC units per home = 2.1. Average Room AC capacity = 10,000 Btu/hr per ENERGY STAR Room AC Calculator, which serves 425 ft2 (average between 400 and 450 ft2 for 10,000 Btu/hr unit per ENERGY STAR Room AC sizing chart). FRoom,AC = (425 ft2 * 2.1)/(2323 ft2) = 0.38
SECTION 2: Residential MeasuresBuilding Shell Page 187
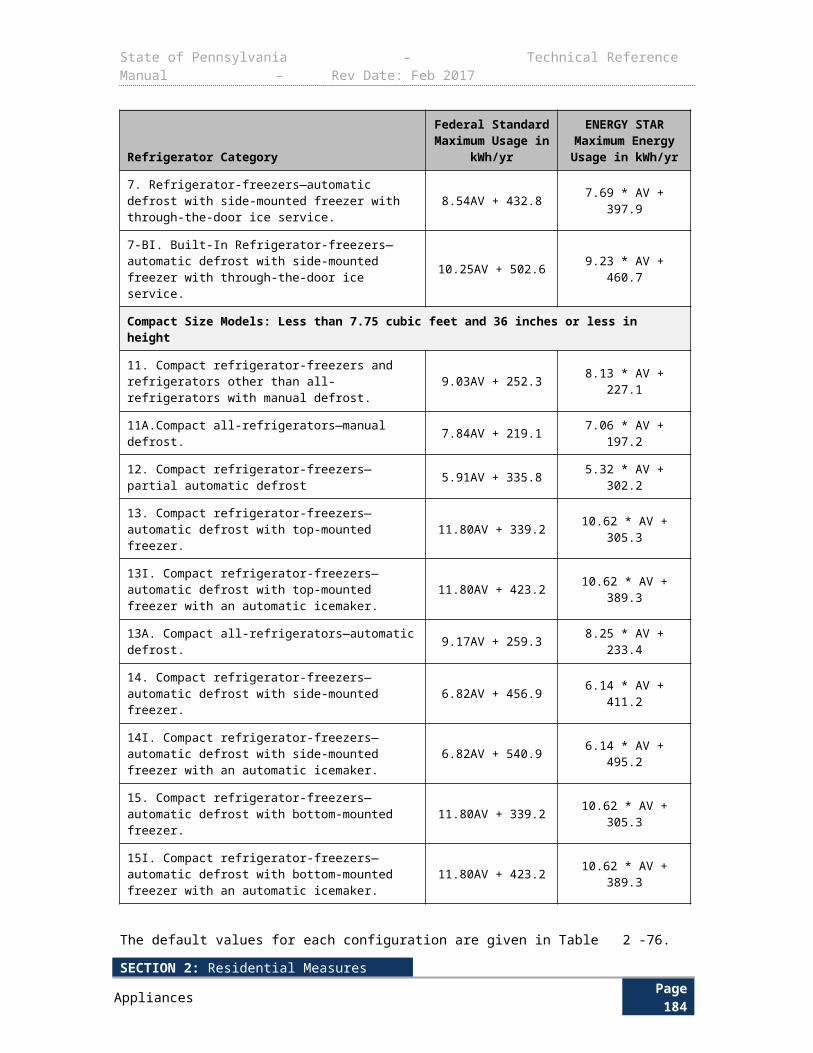
State of Pennsylvania – Technical Reference Manual – Rev Date: Feb 2017
2.6.2 ENERGY STAR WINDOWS Measure Name ENERGY STAR Windows
Target Sector Residential Establishments
Measure Unit Window Area
Unit Energy Savings Varies
Unit Peak Demand Reduction Varies
Measure Life (15 max, but 20 for TRC) years202
Vintage Replace on Burnout
E L I G I B I L I T Y This protocol documents the energy savings for replacing existing windows in a residence with ENERGY STAR certified windows. The target sector is primarily residential.
A L G O R I T H M S
The general form of the equation for the ENERGY STAR or other high-efficiency windows energy savings’ algorithms is:
Total Savings ¿ Areaof Window ft2× Savingsft2
To determine resource savings, the per-square-foot estimates in the algorithms will be multiplied by the number of square feet of window area. The number of square feet of window area will be determined using market assessments and market tracking. Some of these market tracking mechanisms are under development. The per-unit energy and demand savings estimates are based on prior building simulations of windows.
Savings’ estimates for ENERGY STAR Windows are based on modeling a typical 2,500 square foot home using REM Rate, the home energy rating tool.203 Savings are per square foot of qualifying window area. Savings will vary based on heating and cooling system type and fuel.
These fuel and HVAC system market shares will need to be estimated from prior market research efforts or from future program evaluation results.
Heat Pump HVAC System:kWh/yr = ESavHP kWpeak ¿DSavHP×CF
Electric Heat/Central Air Conditioning:
kWh/yr = ESav RESCAC
kWpeak ¿DSavCAC×CF
202 In the absence of better, Pennsylvania-specific data, this is the same source and value as the Mid-Atlantic and Illinois TRMs.203 ACCA, “Verifying ACCA Manual S Procedures,” http://www.acca.org/wp-content/uploads/2014/11/Manual-S-Brochure-Final-1.pdf.
SECTION 2: Residential MeasuresBuilding Shell Page 188
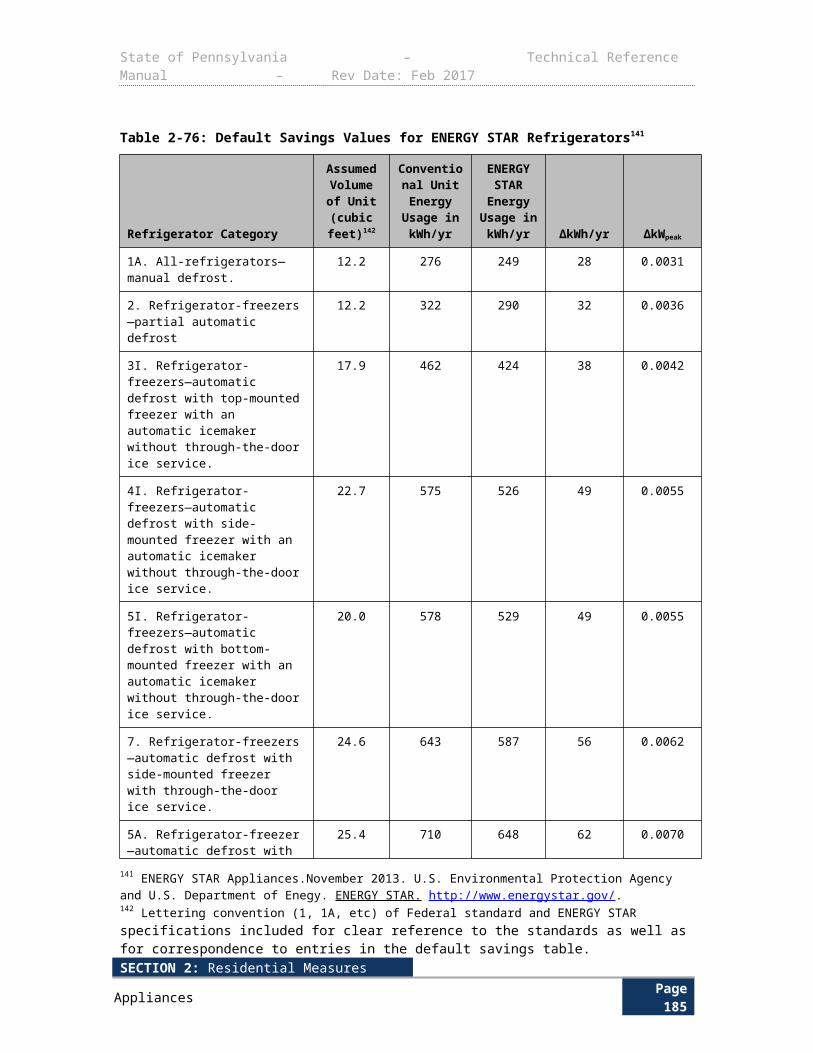
State of Pennsylvania – Technical Reference Manual – Rev Date: Feb 2017
Electric Heat/No Central Air Conditioning:
kWh/yr =ESavResNoCACkWpeak ¿DSavNOCAC×CF
D E F I N I T I O N O F T E R M S
Table 2-112: ENERGY STAR Windows - References
Component Unit Value Sources
ESavHP , Electricity savings (heating and cooling) with heat pump installed
kWhft2 2.2395 1
HP Time Period Allocation Factors None
Summer/On-Peak 10%Summer/Off-Peak 7%Winter/On-Peak 40%Winter/Off-Peak 44%
2
ESavRES/CAC , Electricity savings with electric resistance heating and central AC installed.
kWhft2 4.0 1
Res/CAC Time Period Allocation Factors None
Summer/On-Peak 10%Summer/Off-Peak 7%Winter/On-Peak 40%Winter/Off-Peak 44%
2
ESavRES/NOCAC , Electricity savings with electric resistance heating and no central AC installed
kWhft2 3.97 1
Res/No CAC Time Period Allocation Factors None
Summer/On-Peak 3%Summer/Off-Peak 3%Winter/On-Peak 45%Winter/Off-Peak 49%
2
DSavHP , Summer demand savings with heat pump installed.
kWft2 0.000602 1
DSavCAC , Summer demand savings with central AC installed.
kWft2 0.000602 1
DSavNOCAC , Summer demand savings with no central AC installed.
kWft2 0.00 1
CF , Demand Coincidence Factor Decimal 0.647 3
E V A L U A T I O N P R O T O C O L S
For most projects, the appropriate evaluation protocol is to verify installation and proper selection of default values. For projects using customer specific data for open variables, the appropriate evaluation protocol is to verify installation and proper application of TRM protocol along with verification of open variables. The Pennsylvania Evaluation Framework provides specific guidelines and requirements for evaluation procedures.
SECTION 2: Residential MeasuresBuilding Shell Page 189
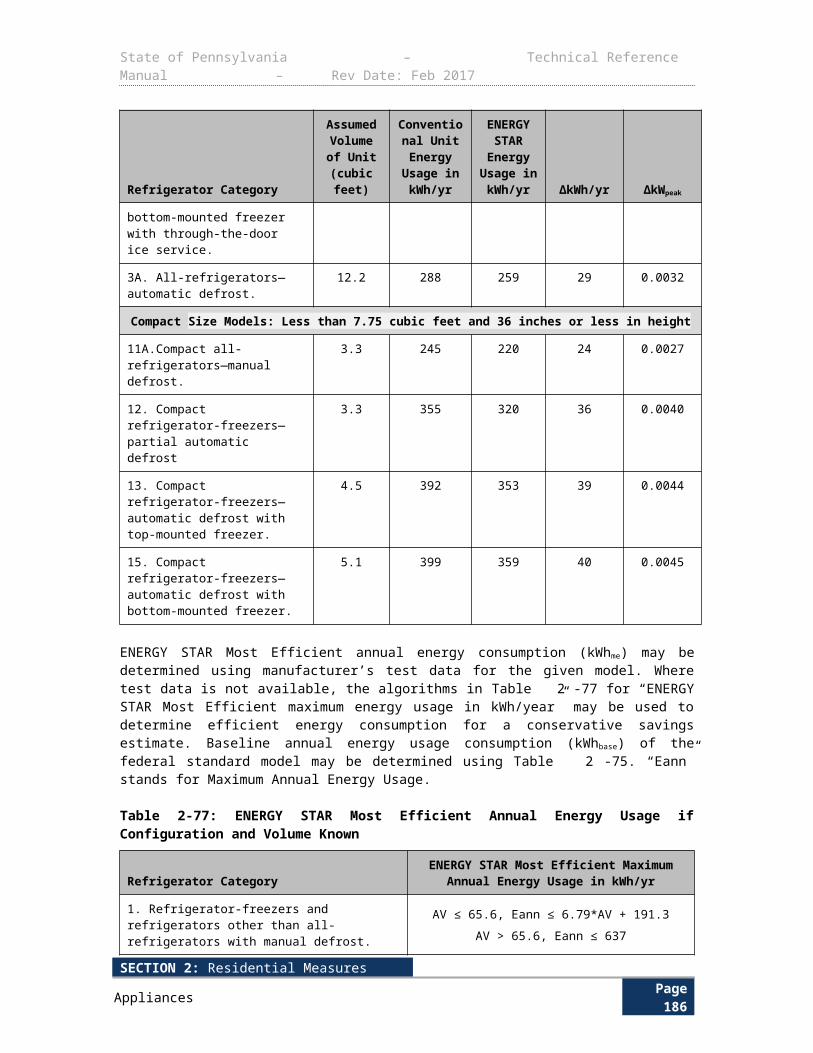
State of Pennsylvania – Technical Reference Manual – Rev Date: Feb 2017
S O U R C E S
1) From REMRATE Modeling of a typical 2,500 sq. ft. NJ home. Savings expressed on a per-square-foot of window area basis. New Brunswick climate data.
2) Time period allocation factors used in cost-effectiveness analysis.
3) Based on reduction in peak cooling load. Straub, Mary and Switzer, Sheldon."Using Available Information for Efficient Evaluation of Demand Side Management Programs". Study by BG&E. The Electricity Journal. Aug/Sept. 2011. http://www.sciencedirect.com/science/article/pii/S1040619011001941
4) Prorated based on 12% of the annual degree days falling in the summer period and 88% of the annual degree days falling in the winter period.
SECTION 2: Residential MeasuresBuilding Shell Page 190
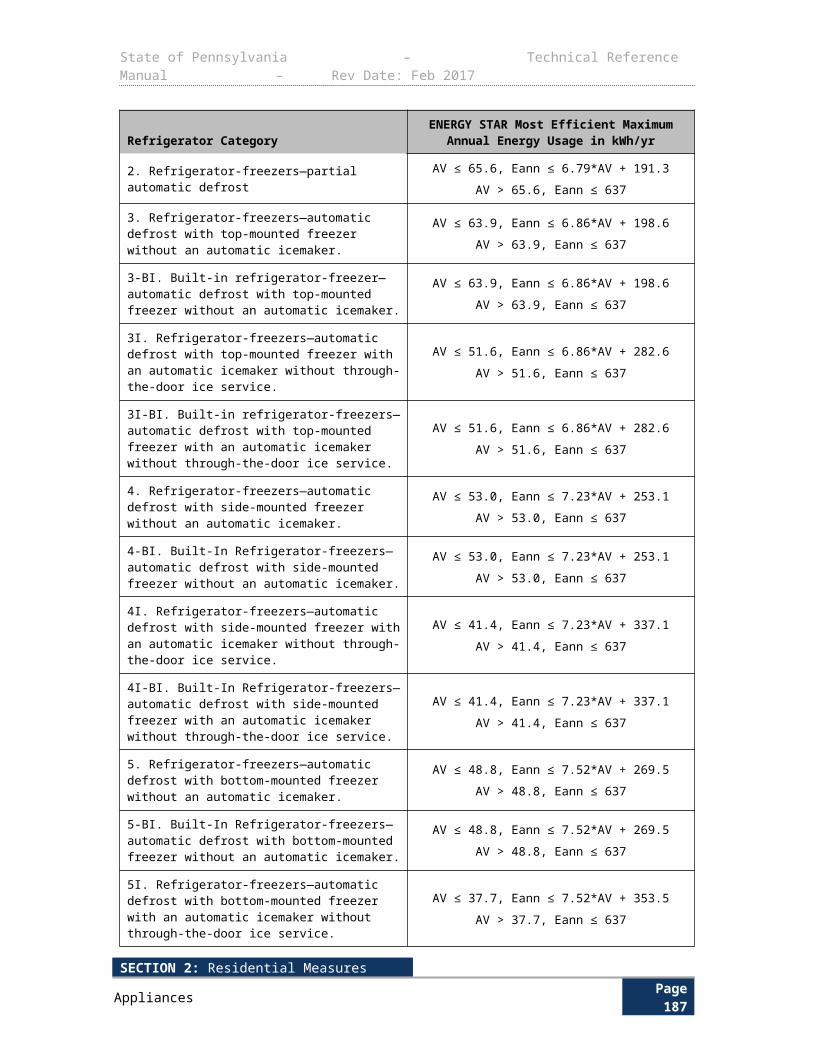
State of Pennsylvania – Technical Reference Manual – Rev Date: Feb 2017
2.6.3 RESIDENTIAL NEW CONSTRUCTION
Measure Name Residential New Construction
Target Sector Residential Establishments
Measure Unit Multiple
Unit Energy Savings Varies
Unit Peak Demand Reduction Varies
Measure Life Varies
Vintage New Construction
E L I G I B I L I T Y
This protocol documents the energy savings attributed to improvements to the construction of residential homes above the baseline home as calculated by the appropriate energy modeling software or as determined by deemed savings values.
A L G O R I T H M S
Insulation Up-Grades, Efficient Windows, Air Sealing, Efficient HVAC Equipment and Duct Sealing (Weather-Sensitive Measures):Energy and peak demand savings due to improvements in the above mentioned measures in Residential New Construction programs will be a direct output of accredited Home Energy Ratings (HERS) software that meets the applicable Mortgage Industry National Home Energy Rating System Standards. REM/Rate204 is cited here as an example of an accredited software which can be used to estimate savings for this program. REM/Rate has a module that compares the energy characteristics of the energy efficient home to the baseline/reference home and calculates savings. For residential new construction, the baseline building thermal envelope and/or system characteristics shall be based on the current state adopted 2009 International Residential Code (IRC 2009).
The energy savings for weather-sensitive measures will be calculated from the software output using the following algorithm:
Energy savings of the qualified home (kWh)¿(Heating kWhbase−Heating kWhq)+(Cooling kWhbase – CoolingkWhq)
The system peak electric demand savings for weather-sensitive measures will be calculated from the software output with the following algorithm, which is based on compliance and certification of the energy efficient home to the EPA’s ENERGY STAR for New Homes’ program standard:
Peak demand of the baseline home PLbaseEERbase
=
Peak demand of the qualifying home
¿PLqEERq
204 Capped based on the requirements of the Pennsylvania Technical Reference Manual (June 2010)
SECTION 2: Residential MeasuresBuilding Shell Page 191
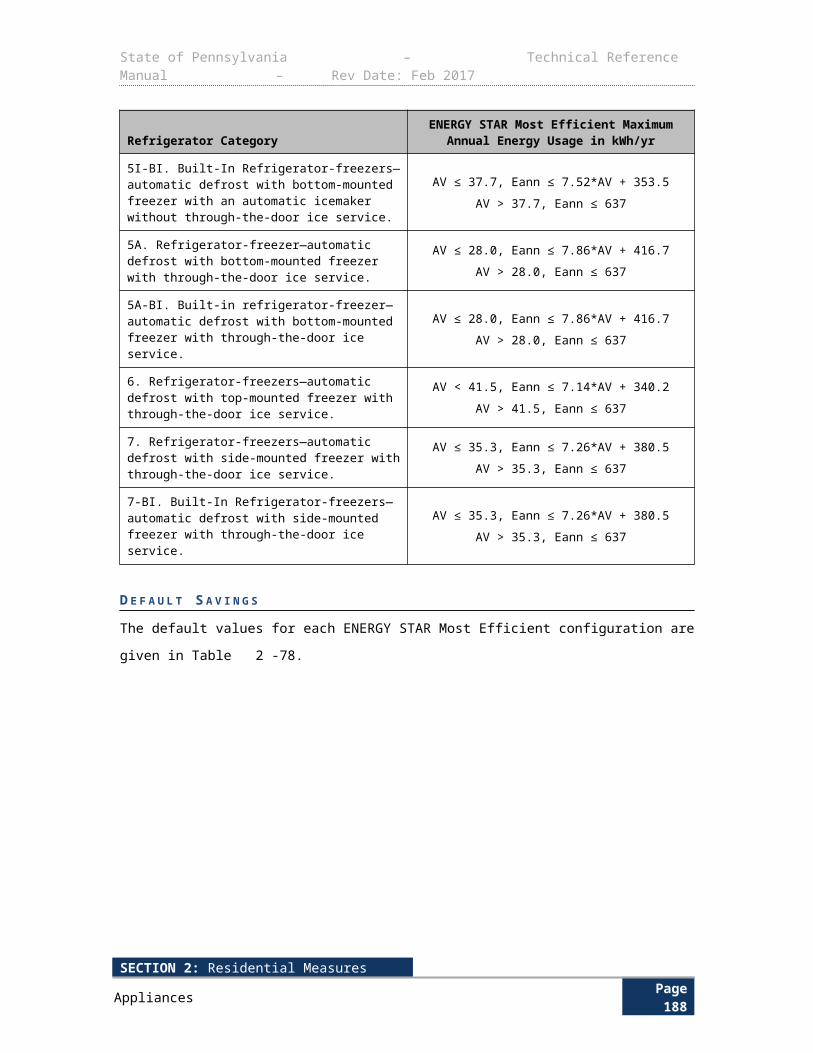
State of Pennsylvania – Technical Reference Manual – Rev Date: Feb 2017
Coincident system peak electric demand savings ¿(Peak demand of the baselinehome – Peak demandof the qualifying home)×CF
Hot Water, Lighting, and Appliances (Non-Weather-Sensitive Measures):Quantification of additional energy and peak demand savings due to the installation of high-efficiency electric water heaters, lighting and other appliances will be based on the algorithms presented for these measures in Section 2 (Residential Measures) of this Manual. Where the TRM algorithms involve deemed savings, e.g. lighting, the savings in the baseline and qualifying homes should be compared to determine the actual savings of the qualifying home above the baseline.
In instances where REM/Rate calculated parameters or model inputs do not match TRM algorithm inputs, additional data collection is necessary to use the TRM algorithms. One such example is lighting. REM/Rate requires an input of percent of lighting fixtures that are energy efficient whereas the TRM requires an exact fixture count. Another example is refrigerators, where REM/Rate requires projected kWh consumed and the TRM deems savings based on the type of refrigerator.
It is also possible to have increases in consumption or coincident peak demand instead of savings for some non-weather sensitive measures. For example, if the amount of efficient lighting in a new home is less than the amount assumed in the baseline (IRC 2009), the home will have higher energy consumption and coincident peak demand for lighting, even though it still qualifies for the program.
According to Architectural Energy Corporation, the developer of the REM/Rate model, this model does account for the interaction of energy savings due to the installation of high efficiency lighting or appliances with the energy used in a home for space conditioning. Architectural Energy Corporation staff explained to the Statewide Evaluator that lighting and appliance energy usage is accounted for in the REM/Rate model, and the model does adjust energy use due to the installation of high efficiency lighting and appliances.205
D E F I N I T I O N O F T E R M S
A summary of the input values and their data sources follows:
205 Energy Information Administration. Residential Energy Consumption Survey. 2005. http://www.eia.doe.gov/emeu/recs/recs2005/hc2005_tables/detailed_tables2005.html
SECTION 2: Residential MeasuresBuilding Shell Page 192
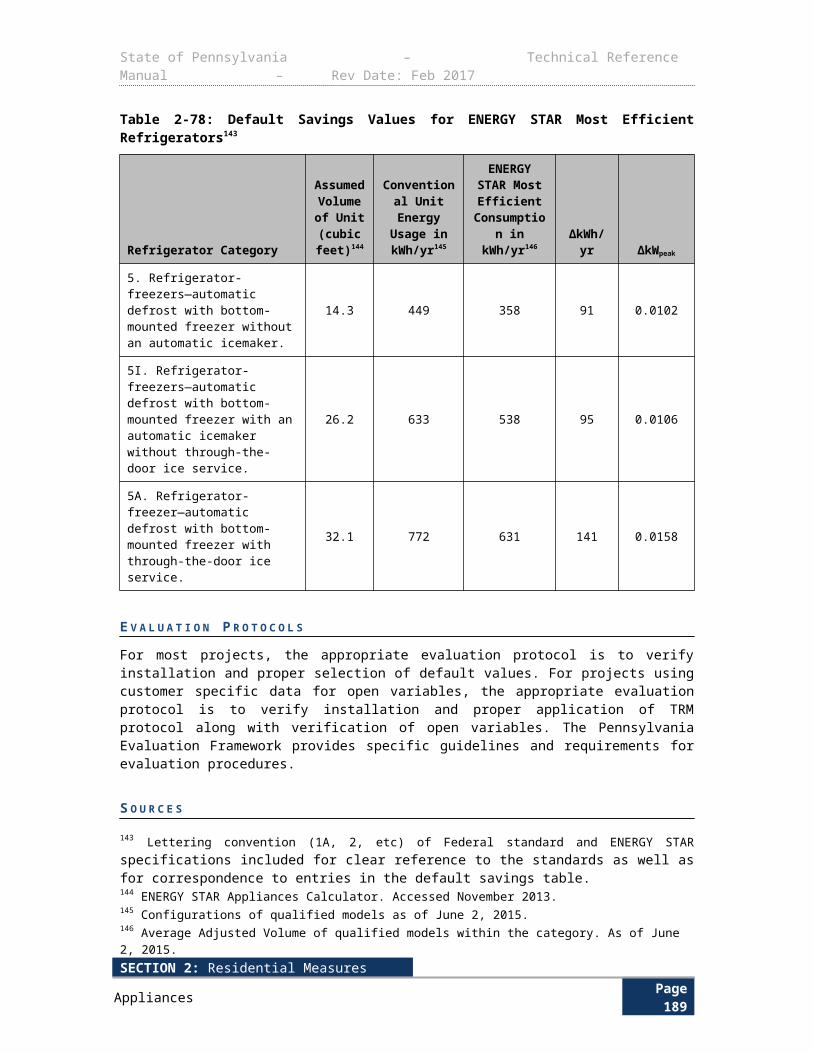
State of Pennsylvania – Technical Reference Manual – Rev Date: Feb 2017
Table 2-113: Residential New Construction – References
Component Unit Value Sources
Heating kWhbase, Annual heating energy consumption of the baseline home, from software. kWh Software Calculated 1
Heating kWhq, Annual heating energy consumption of the qualifying home, from software. kWh Software Calculated 2
Cooling kWhbase, Annual cooling energy consumption of the baseline home, from software. kWh Software Calculated 1
Cooling kWhq, Annual cooling energy consumption of the qualifying home, from software. kWh Software Calculated 2
PLbase, Estimated peak cooling load of the baseline home, from software. kBtu/hr Software Calculated 3
EERbase. Energy Efficiency Ratio of the baseline unit.
BtuW ∙h
EDC Data Gathering or SEERb * BLEER 4
EERq, Energy Efficiency Ratio of the qualifying unit.BtuW ∙h
EDC Data Gathering or SEERq * BLEER 4
SEERbase, Seasonal Energy Efficiency Ratio of the baseline unit.
BtuW ∙h
1314 (ASHP)
5
BLEER, Factor to convert baseline SEERb to EERb.BtuW ∙h
0.87 6
PLq, Estimated peak cooling load for the qualifying home constructed, from software. kBtu/hr Software Calculated 7
SEERq, SEER associated with the HVAC system in the qualifying home.
BtuW ∙h
EDC Data Gathering 8
CF , Demand Coincidence Factor (See Section 1.5) Decimal 0.647 9
The following table lists the building envelope characteristics of the baseline reference home based on IRC 2009 for the three climate zones in Pennsylvania.
Table 2-114: Baseline Insulation and Fenestration Requirements by Component (Equivalent U-Factors)
Climate Zone
Fenestration U-Factor
Skylight U-Factor
Ceiling U-Factor
Frame Wall U-Factor
Mass Wall U-Factor
FloorU-Factor
Basement Wall
U-Factor
SlabR-Value &Depth
Crawl Space Wall U-Factor
4A 0.35 0.60 0.030 0.082 0.141 0.047 0.059 10, 2 ft 0.0655A 0.35 0.60 0.030 0.060 0.082 0.033 0.059 10, 2 ft 0.0656A 0.35 0.60 0.026 0.060 0.060 0.033 0.059 10, 4 ft 0.065
SECTION 2: Residential MeasuresBuilding Shell Page 193
State of Pennsylvania – Technical Reference Manual – Rev Date: Feb 2017
Table 2-115: Energy Star Homes - User Defined Reference Home
Data Point Value206 Source
Air Infiltration Rate 7 ACH50 for the whole house 13
Duct Leakage 12 cfm25 (12 cubic feet per minute per 100 square feet of conditioned space when tested at 25 pascals)
13
Duct Insulation Supply ducts in attics shall be insulated to a minimum of R-8. All other ducts insulated to a minimum of R-6.
10
Duct Location 50% in conditioned space, 50% unconditioned space Program Design
Mechanical Ventilation None 10
Appliances Use Default
Thermostat Setback Maintain zone temperature down to 55 oF (13 oC) or up to 85 oF (29 oC)
10
Temperature Set Points Heating: 70°FCooling: 78°F
10
Heating Efficiency
Furnace 80% AFUE 11
Gas Fired Steam Boiler 80% AFUE 11
Oil Fired Steam or Gas Fired Hot Water Boiler 82% AFUE 11
Oil Fired Hot Water Boiler 84% AFUE 11
Combo Water Heater 76% AFUE (recovery efficiency) 11
Air Source Heat Pump 8.2 HSPF 10
Geothermal Heat Pump 7.7 HSPF 10
PTAC / PTHP Not differentiated from air source HP 10
Cooling Efficiency
Central Air Conditioning 13.0 SEER 10
Air Source Heat Pump 14.0 SEER 10
Geothermal Heat Pump 13 SEER (11.2 EER) 10
PTAC / PTHP Not differentiated from central AC 10
Window Air Conditioners Not differentiated from central AC 10
Domestic WH Efficiency
Electric≥20 gal and ≤55 gal: EF = 0.96 - 0.0003*(Vs)
>55 gal and ≤120 gal: EF = 2.057 - 0.00113*(Vs)
12
206 DoE’s Building Energy Software Tools Directory (http://apps1.eere.energy.gov/buildings/tools_directory/).
SECTION 2: Residential MeasuresBuilding Shell Page 194
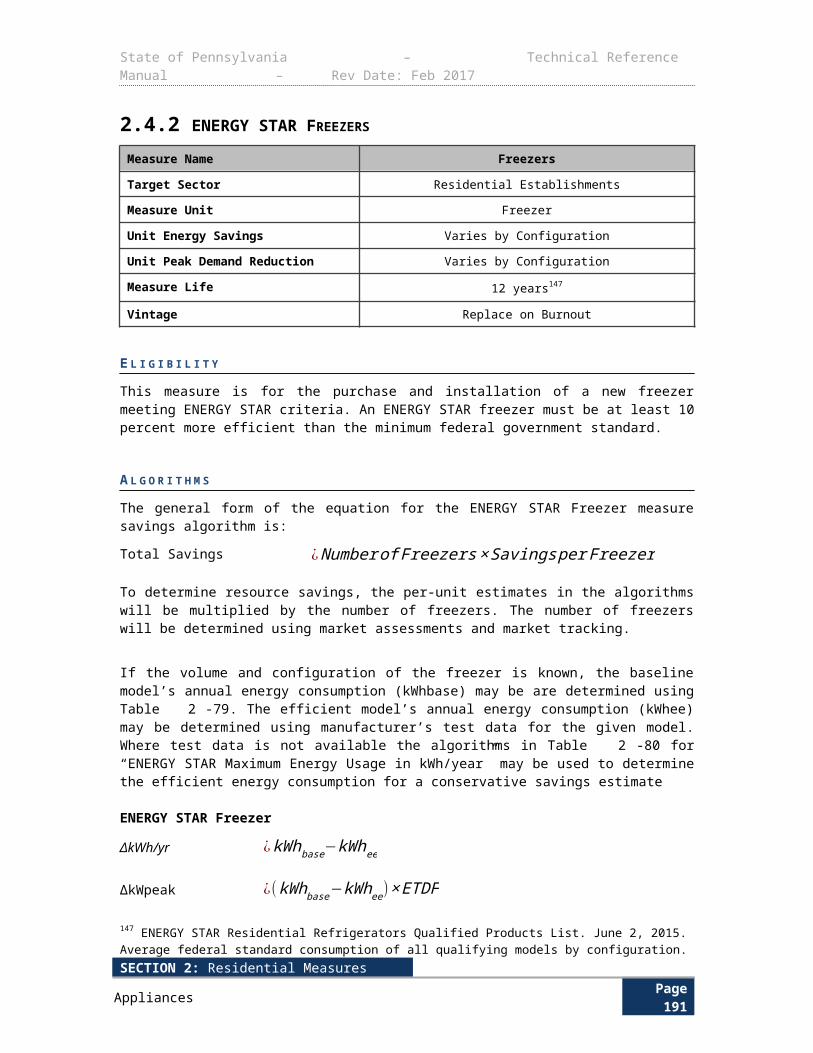
State of Pennsylvania – Technical Reference Manual – Rev Date: Feb 2017
Data Point Value Source
Natural Gas ≥20 gal and ≤55 gal: EF = 0.675 – (0.0015*Vs)
>55 gal and ≤100 gal: EF = 0.8012 – (0.00078* Vs)
Vs: Rated Storage Volume – the water storage capacity of a water heater (in gallons)
12
Additional Water Heater Tank Insulation None
E V A L U A T I O N P R O T O C O L S
For most projects, the appropriate evaluation protocol is to verify installation and proper selection of default values. For projects using customer specific data for open variables, the appropriate evaluation protocol is to verify installation and proper application of TRM protocol along with verification of open variables. The Pennsylvania Evaluation Framework provides specific guidelines and requirements for evaluation procedures.
S O U R C E S
1) Calculation of annual energy consumption of a baseline home from the home energy rating tool based on the reference home energy characteristics.
2) Calculation of annual energy consumption of an energy efficient home from the home energy rating tool based on the qualifying home energy characteristics
3) Calculation of peak load of baseline home from the home energy rating tool based on the reference home energy characteristics.
4) If the EER of the unit is know, use the EER. If only the SEER is known, then use SEER * BLEER to estimate the EER.
5) Federal Register, Vol. 66, No. 14, Monday, January 22, 2001/Rules and Regulations, p. 7170-7200.
6) Ratio to calculate EER from SEER based average EER for SEER 13 units.
7) Calculation of peak load of energy efficient home from the home energy rating tool based on the qualifying home energy characteristics.
8) SEER of HVAC unit in energy efficient qualifying home.
9) Straub, Mary and Switzer, Sheldon. "Using Available Information for Efficient Evaluation of Demand Side Management Programs". Study by BG&E. The Electricity Journal. Aug/Sept. 2011. Found at http://www.sciencedirect.com/science/article/pii/S1040619011001941 .
10) 2009 International Residential Code (IRC 2009, Sections N1102 – N1104)
11) Federal Register / Vol. 73, No. 145 / Monday, July 28, 2008 / Rules and Regulations, p. 43611-43613, 10 CFR Part 430, “Energy Conservation Program for Consumer Products: Energy Conservation Standards for Residential Furnaces and Boilers.”
12) US Federal Standards for Residential Water Heaters. Effective April 16, 2015. http://www1.eere.energy.gov/buildings/appliance_standards/product.aspx/productid/27
13) 2009 International Residential Code Table N1102.1.2. Table N1102.1.2 Equivalent U-Factors presents the R-Value requirements of Table N1102.1.1 in an equivalent U-Factor format. Users may choose to follow Table N1102.1.1 instead. IRC 2009 supersedes this table in
SECTION 2: Residential MeasuresBuilding Shell Page 195
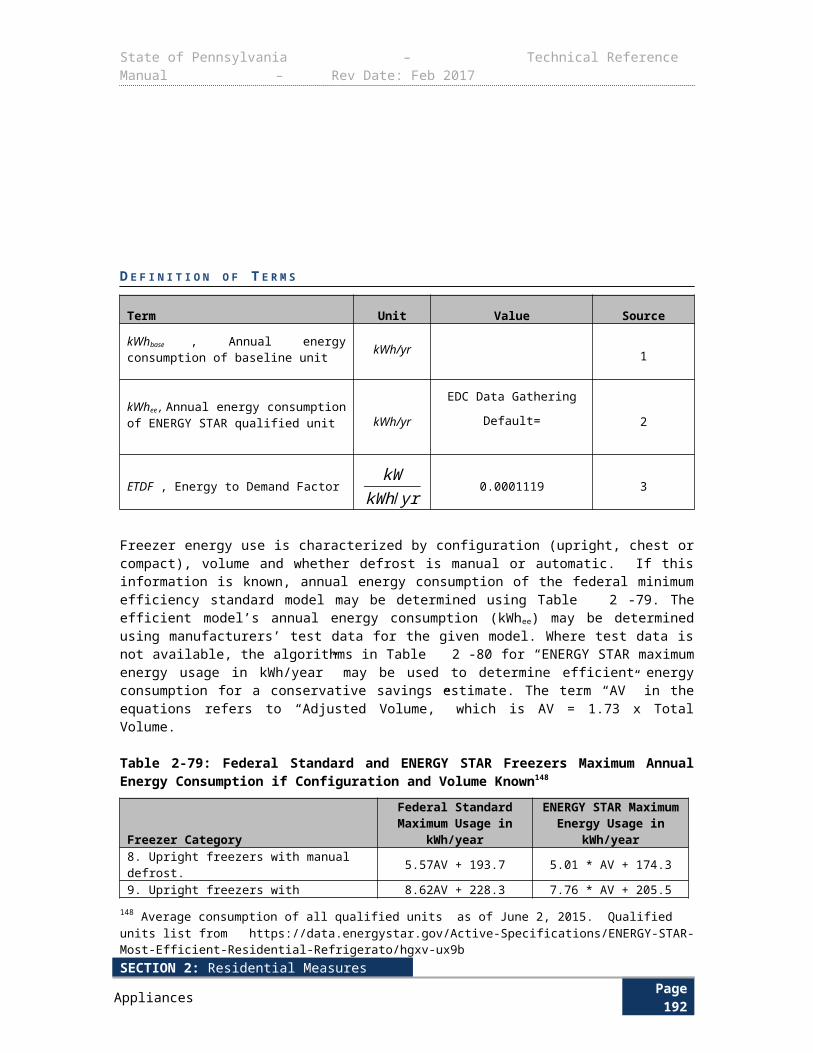
State of Pennsylvania – Technical Reference Manual – Rev Date: Feb 2017
case of discrepancy. Additional requirements per Section N1102 of IRC 2009 must be followed even if not listed here.
SECTION 2: Residential MeasuresBuilding Shell Page 196
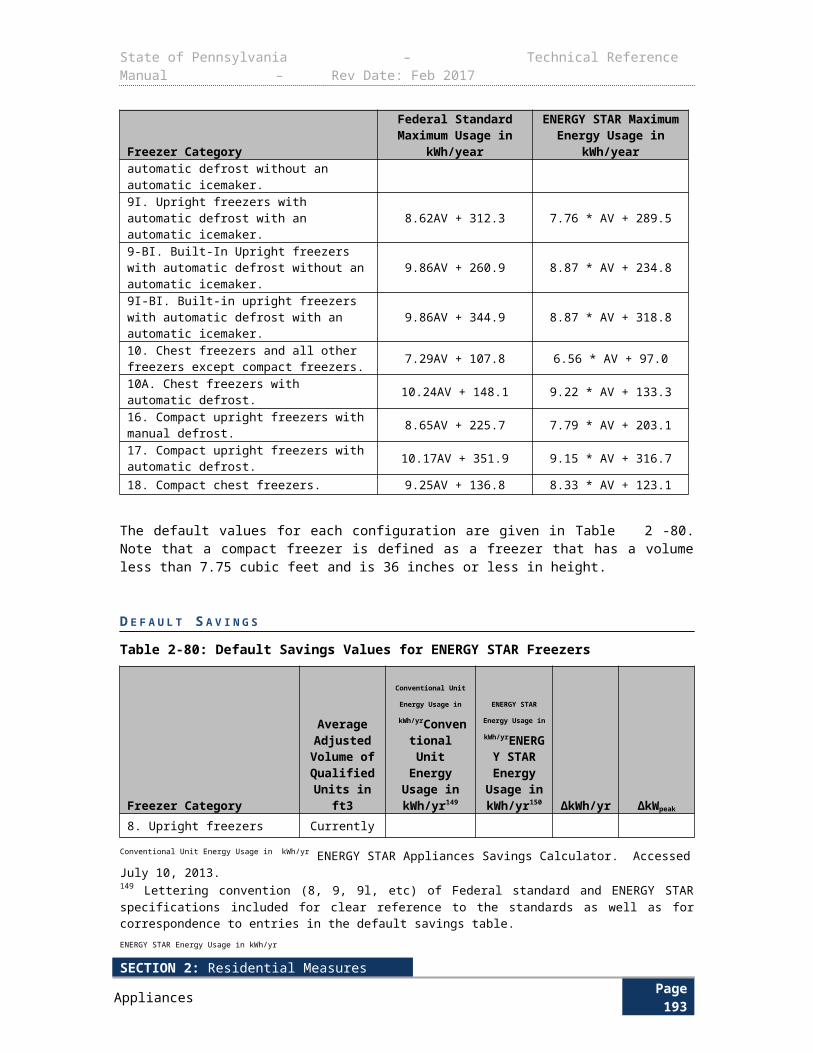
State of Pennsylvania – Technical Reference Manual – Rev Date: Feb 2017
2.6.4 HOME PERFORMANCE WITH ENERGY STAR Measure Name Home Performance with ENERGY STAR
Target Sector Residential Establishments
Measure Unit Multiple
Unit Energy Savings Varies
Unit Peak Demand Reduction Varies
Measure Life Years
Vintage Retrofit
In order to implement Home Performance with ENERGY STAR, there are various standards a program implementer must adhere to in order to deliver the program. These standards, along with operational guidelines on how to navigate through the HPwES program can be found on the ENERGY STAR website. Minimum requirements, Sponsor requirements, reporting requirements, and descriptions of the performance and prescriptive based options can be found in the v. 1.5 Reference Manual.207 The program implementer must use software that meets a national standard for savings calculations from whole-house approaches such as home performance. The software program implementer must adhere to at least one of the following standards:
A software tool whose performance has passed testing according to the National Renewable Energy Laboratory’s HERS BESTEST software energy simulation testing protocol.208
Software approved by the US Department of Energy’s Weatherization Assistance Program.209
RESNET approved rating software.210
There are numerous software packages that comply with these standards. Some examples of the software packages are REM/Rate, EnergyGauge, TREAT, and HomeCheck. These examples are not meant to be an exhaustive list of software approved by the bodies mentioned above.
E L I G I B I L I T Y
The efficient condition is the performance of the residential home as modeled in the approved software after home performance improvements have been made. The baseline condition is the same home modeled prior to any energy efficiency improvements.
A L G O R I T H M S
There are no algorithms associated with this measure as the energy savings are shown through modeling software. For modeling software that provides 8760 energy consumption data, the following algorithm may be used as guidance to determine demand savings:
∆ kW peak=( Average kW PJM PEAK )base−( Average kW PJM PEAK )ee
207 Email from V. Robert Salcido, P.E., LEED AP, Director of Products at Architectural Energy Corporation to Josh Duckwall, Project Manager at GDS Associates, November 21, 2013.
208 Single and multiple family as noted.209 The HPwES Reference Manual may be found at https://www.energystar.gov/ia/home_improvement/downloads/HPwES_Sponsor_Guide_v1-5.pdf?07e7-3320 210 A new standard for BESTEST-EX for existing homes is currently being developed - status is found at http://www.nrel.gov/buildings/bestest_Ex.html. The existing 1995 standard can be found at http://www.nrel.gov/docs/legosti/fy96/7332a.pdf.
SECTION 2: Residential MeasuresBuilding Shell Page 197
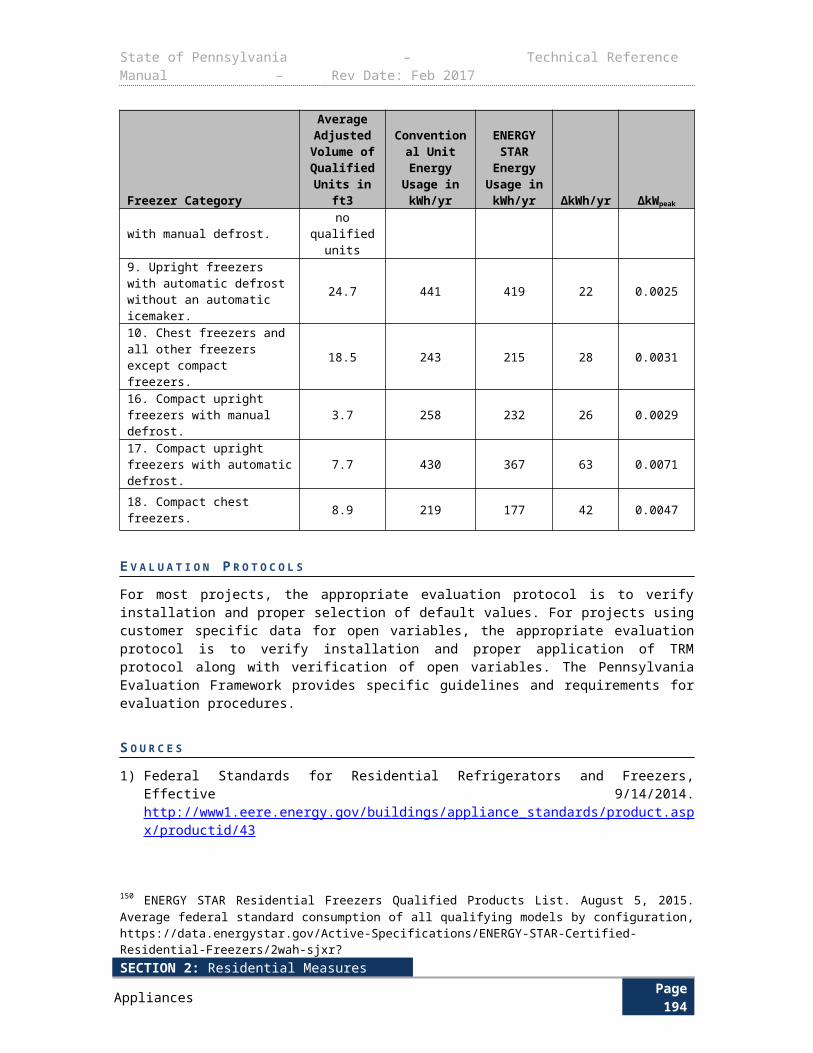
State of Pennsylvania – Technical Reference Manual – Rev Date: Feb 2017
D E F I N I T I O N O F T E R M S
Table 2-116: Home Performance with ENERGY STAR - References
Component Unit Values Source
AveragekW PJM PEAK , Average demand during the PJM Peak Period
kW EDC Data Gathering 1
E V A L U A T I O N P R O T O C O L S
For most projects, the appropriate evaluation protocol is to verify installation and proper selection of default values. For projects using customer specific data for open variables, the appropriate evaluation protocol is to verify installation and proper application of TRM protocol along with verification of open variables. The Pennsylvania Evaluation Framework provides specific guidelines and requirements for evaluation procedures.
S O U R C E S
1) The coincident summer peak period is defined as the period between the hour ending 15:00 Eastern Prevailing Time211 (EPT) and the hour ending 18:00 EPT during all days from June 1 through August 31, inclusive, that is not a weekend or federal holiday212.
211 A listing of the approved software available at http://www.waptac.org .212 A listing of the approved software available at http://resnet.us .
SECTION 2: Residential MeasuresBuilding Shell Page 198
State of Pennsylvania – Technical Reference Manual – Rev Date: Feb 2017
2.6.5 ENERGY STAR MANUFACTURED HOMES
Measure Name ENERGY STAR® Manufactured Homes
Target Sector Residential Establishments
Measure Unit Variable
Unit Energy Savings Variable
Unit Peak Demand Reduction Variable
Measure Life 15 Years213
Vintage New Construction
E L I G I B I L I T Y
This measure applies to ENERGY STAR Manufactured Homes.
A L G O R I T H M S
Insulation Upgrades, Efficient Windows, Air Sealing, Efficient HVAC Equipment and Duct Sealing (Weather-Sensitive Measures):Energy and peak demand savings due to improvements in the above measures in ENERGY STAR Manufactured Homes programs will be a direct output of accredited Home Energy Ratings (HERS) software that meets the applicable Mortgage Industry National Home Energy Rating System Standards. REM/Rate214 is cited here as an example of an accredited software which can be used to estimate savings for this program. REM/Rate has a module that compares the energy characteristics of the energy efficient home to the baseline/reference home and calculates savings. For ENERGY STAR Manufactured Homes, the baseline building thermal envelope and/or system characteristics shall be based on the current Manufactured Homes Construction and Safety Standards (HUD Code). For this measure a manufactured home “means a structure, transportable in one or more sections, which in the traveling mode, is eight body feet or more in width or forty body feet or more in length, or, when erected on site, is three hundred twenty or more square feet, and which is built on a permanent chassis and designed to be used as a dwelling with or without a permanent foundation when connected to the required utilities, and includes the plumbing, heating, air conditioning, and electrical systems contained therein.”215
The energy savings for weather-sensitive measures will be calculated from the software output using the following algorithm:
Energy savings of the qualified home (kWh/yr)kWh = (Heating kWhbase –Heating kWhee)+(Cooling kWhbase–Cooling kWhee)
The system peak electric demand savings for weather-sensitive measures will be calculated from the software output with the following algorithm, which is based on compliance and certification of the energy efficient home to the EPA’s ENERGY STAR Manufactured Home’ program standard:
Peak demand of the baseline home
=PLbEERb
213 This is same as the Daylight Savings Time (DST) 214 PJM Manual 18B for Energy Efficiency Measurement & Verification215 NREL, Northwest Energy Efficient Manufactured Housing Program Specification Development, T.Huges, B. Peeks February 2013 (http://www.nrel.gov/docs/fy13osti/56761.pdf)
SECTION 2: Residential MeasuresBuilding Shell Page 199
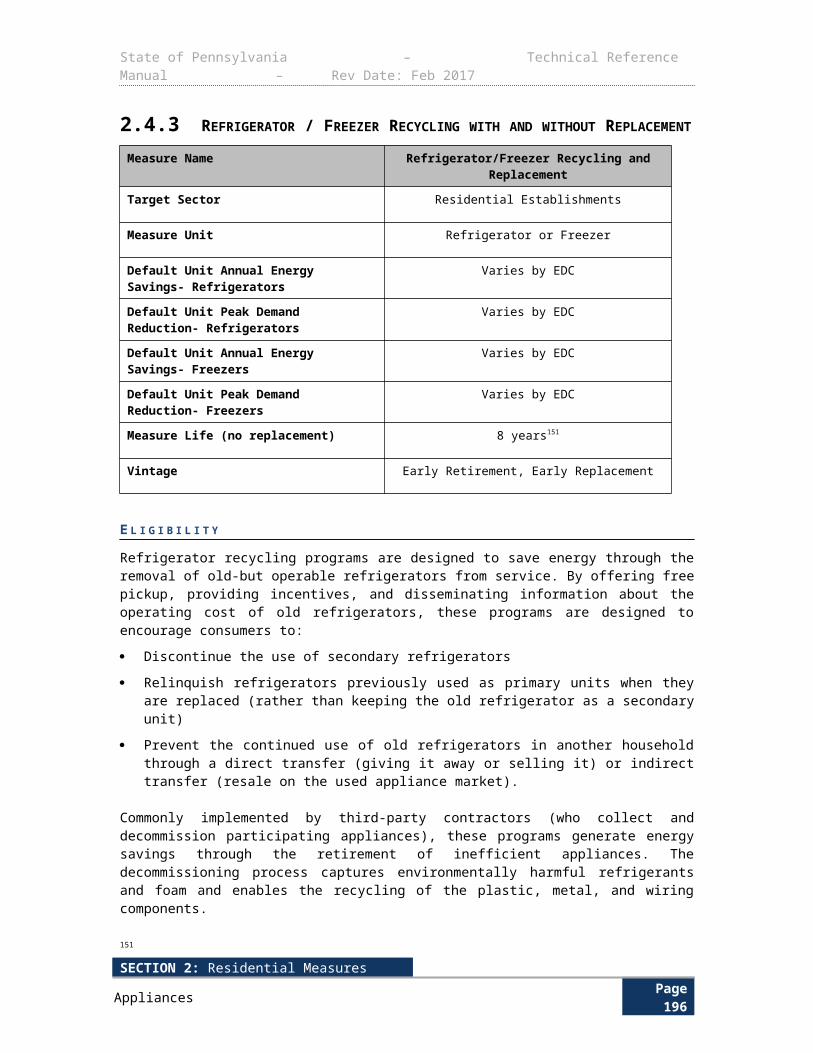
State of Pennsylvania – Technical Reference Manual – Rev Date: Feb 2017
Peak demand of the qualifying home
=PLqEERq
Coincident system peak electric demand savings (kW)kWpeak =
(Peak demand of the baselinehome – Peak demand of the qualifying home)×CF
Hot Water, Lighting, and Appliances (Non-Weather-Sensitive Measures):Quantification of additional energy and peak demand savings due to the installation of high-efficiency electric water heaters, lighting and other appliances will be based on the algorithms presented for these measures in Section 2 (Residential Measures) of this Manual. Where the TRM algorithms involve deemed savings, e.g. lighting, the savings in the baseline and qualifying homes should be compared to determine the actual savings of the qualifying home above the baseline.
In instances where REM/Rate calculated parameters or model inputs do not match TRM algorithm inputs, additional data collection is necessary to use the TRM algorithms. One such example is lighting. REM/Rate requires an input of percent of lighting fixtures that are energy efficient whereas the TRM requires an exact fixture count. Another example is refrigerators, where REM/Rate requires projected kWh consumed and the TRM deems savings based on the type of refrigerator.
According to Architectural Energy Corporation, the developer of the REM/Rate model, this model does account for the interaction of energy savings due to the installation of high efficiency lighting or appliances with the energy used in a home for space conditioning. Architectural Energy Corporation staff explained to the Statewide Evaluator that lighting and appliance energy usage is accounted for in the REM/Rate model, and the model does adjust energy use due to the installation of high efficiency lighting and appliances.216 It was verified in the RESNET® Standard that lighting and appliances are account for as internal gains and will represnet an interaction with the HVAC systems.217
D E F I N I T I O N O F T E R M S
A summary of the input values and their data sources follows:
216 DoE’s Building Energy Software Tools Directory (http://apps1.eere.energy.gov/buildings/tools_directory/software) .217 24 CFR Part 3280-MANUFACTURED HOMES CONSTRUCTION AND SAFETY STANDARD(http://www.gpo.gov/fdsys/pkg/CFR-2013-title24-vol5/pdf/CFR-2013-title24-vol5-part3280.pdf)
SECTION 2: Residential MeasuresBuilding Shell Page 200
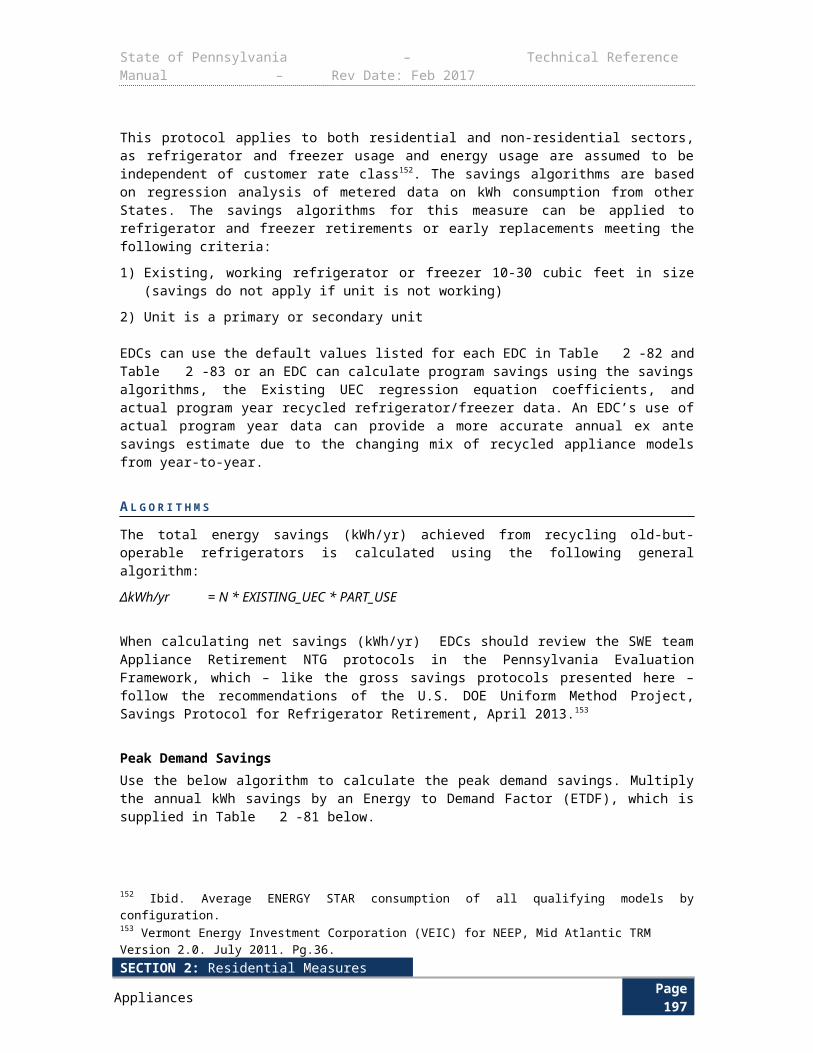
State of Pennsylvania – Technical Reference Manual – Rev Date: Feb 2017
Table 2-117: ENERGY STAR Manufactured Homes– References
Component Unit Value Sources
Heating kWhbase, Annual heating energy consumption of the baseline home kWh Software Calculated 1
Heating kWhee, Annual heating energy consumption of the qualifying home kWh Software Calculated 1
Cooling kWhbase, Annual cooling energy consumption of the baseline home kWh Software Calculated 1
Cooling kWhee, Annual cooling energy consumption of the qualifying home kWh Software Calculated 1
PLb, Estimated peak cooling load of the baseline home kBtu/h Software Calculated 1
EERb, Energy Efficiency Ratio of the baseline unit.BtuW ∙h
EDC Data Gathering or SEERb * BLEER 2
EERq, Energy Efficiency Ratio of the qualifying unit.BtuW ∙h
EDC Data Gathering or SEERq * BLEER 2
SEERb, Seasonal Energy Efficiency Ratio of the baseline unit.
BtuW ∙h
1314 (ASHP)
4
BLEER, Factor to convert baseline SEERb to EERb.BtuW ∙h
EDC Data Gathering
Default = 11.313
ASHP Default = 1214
3
PLq, Estimated peak cooling load for the qualifying home constructed, in kBtu/hr, from software. kBtu/h Software Calculated 1
SEERq, SEER associated with the HVAC system in the qualifying home.
BtuW ∙h
EDC Data Gathering 5
CF, Demand Coincidence Factor (See Section 1.5) DecimalEDC Data Gathering
Default = 0.6476
The HUD Code defines required insulation levels as an average envelope Uo value per zone. In Pennsylvania zone 3 requirements apply with a required Uo value of 0.079. This value cannot be directly used to define a baseline envelope R-values because the Uo value is dependent on both the size of the manufactured homes and insulating levels together. However because manufactured homes are typically built to standard dimensions baseline U-values can be estimated with reasonable accuracy.
SECTION 2: Residential MeasuresBuilding Shell Page 201
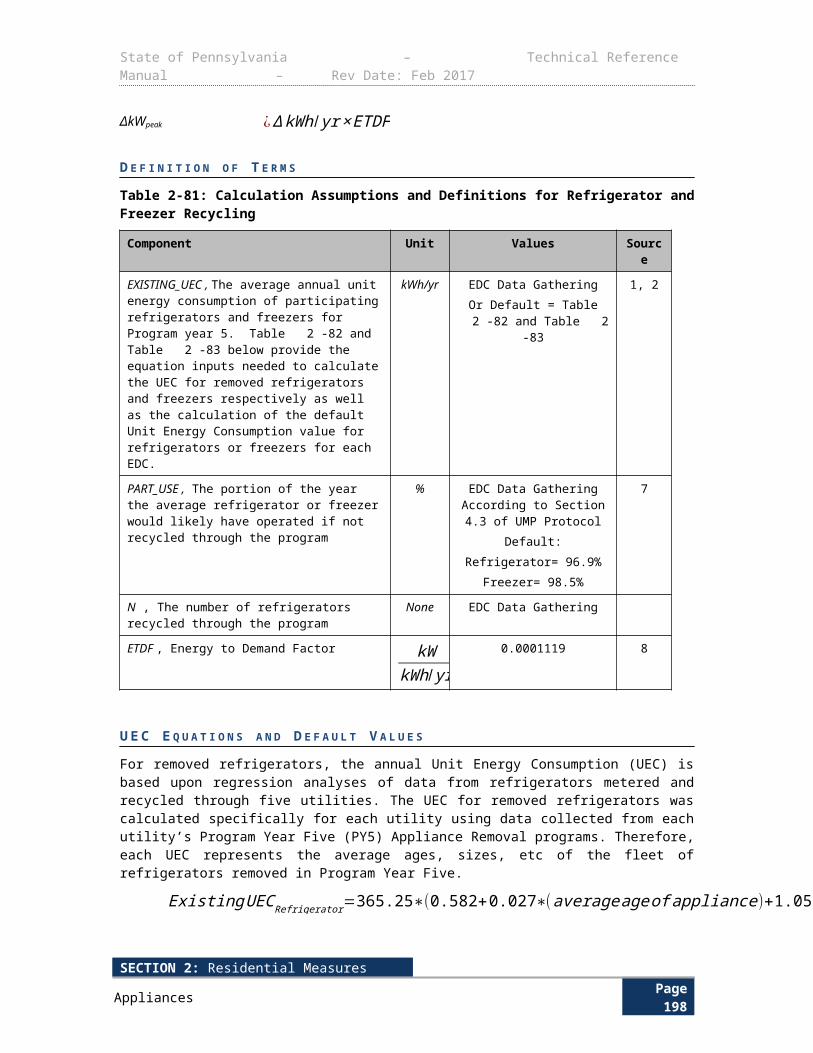
State of Pennsylvania – Technical Reference Manual – Rev Date: Feb 2017
Figure 2-4: Uo Baseline Requirements218
The HUD Code required insulation levels can be expressed as a set of estimated envelope parameters to be used in REM/Rate’s user defined reference home function. Using typical manufactured home sizes these values are expressed below along with federal standard baseline parameters below in Table 2-118.
Table 2-118: ENERGY STAR Manufactured Homes - User Defined Reference Home
Data Point Value219 Source
Walls U-value 0.090 7, 8
Ceilings U-value 0.045 7, 8
Floor U-value 0.045 7, 8
Windows U-value 0.59 7, 8
Doors U-Value 0.33 7, 8
Air Infiltration Rate 10 ACH50 7
Duct Leakage RESNET/HERS default 7
Duct Insulation RESNET/HERS default 7
Duct Location Supply 100% manufactured home belly, Return 100% conditioned space
9
Mechanical Ventilation 0.035 CFM/sqft Exhaust 8
Lighting Systems 0% CFL 10% pin based (Default assumption) 10
Appliances Use Default 7
Setback Thermostat Non-Programmable thermostat 7
218 Email from V. Robert Salcido, P.E., LEED AP, Director of Products at Architectural Energy Corporation to Josh Duckwall, Project Manager at GDS Associates, November 21, 2013.
219 http://www.resnet.us/standards/PropStdsRevision-01-11_Revised_FINAL.pdf
SECTION 2: Residential MeasuresBuilding Shell Page 202
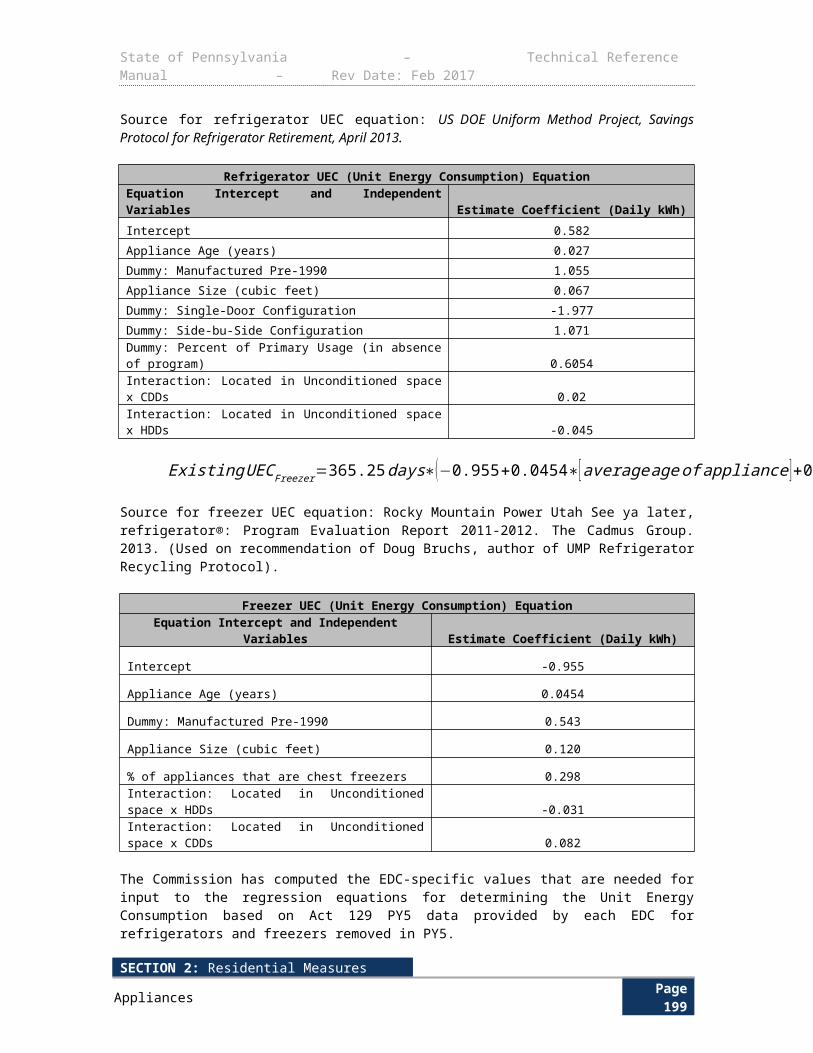
State of Pennsylvania – Technical Reference Manual – Rev Date: Feb 2017
Data Point Value Source
Temperature Set Points Heating: 70°FCooling: 78°F
11
Heating Efficiency
Furnace 80% AFUE 12
Gas Fired Steam Boiler 80% AFUE 12
Oil Fired Steam or Gas Fired Hot Water Boiler
82% AFUE 12
Oil Fired Hot Water Boiler
84% AFUE 12
Combo Water Heater 76% AFUE (recovery efficiency) 12
Electric Resistance 3.412 HSPF 8
Cooling Efficiency
Central Air Conditioning 13.0 SEER 4
Air Source Heat Pump 14.0 SEER 4
Geothermal Heat Pump 13.0 SEER (11.2 EER) 4
PTAC / PTHP Not differentiated from central AC 4
Window Air Conditioners Not differentiated from central AC 4
Domestic WH Efficiency
Electric≥20 gal and ≤55 gal: EF = 0.96 - 0.0003*(Vs)
>55 gal and ≤120 gal: EF = 2.057 - 0.00113*(Vs)Default = 0.948
13
Natural Gas
≥20 gal and ≤55 gal: EF = 0.675 – (0.0015*Vs)
>55 gal and ≤100 gal: EF = 0.8012 – (0.00078* Vs)Default = 0.615
Vs: Rated Storage Volume – the water storage capacity of a water heater (in gallons)
14
Additional Water Heater Tank Insulation None 15
E V A L U A T I O N P R O T O C O L S
The most appropriate evaluation protocol for this measure is verification of installation coupled with EDC data gathering.
S O U R C E S
1) Calculation of annual energy and peak load consumption of a baseline home from the home energy rating tool based on the reference home energy characteristics.
2) If the EER of the unit is known, use the EER. If only the SEER is known, then use SEER * BLEER to estimate the EER.
3) Ratio to calculate EER from SEER based average EER for SEER 13 units.
SECTION 2: Residential MeasuresBuilding Shell Page 203
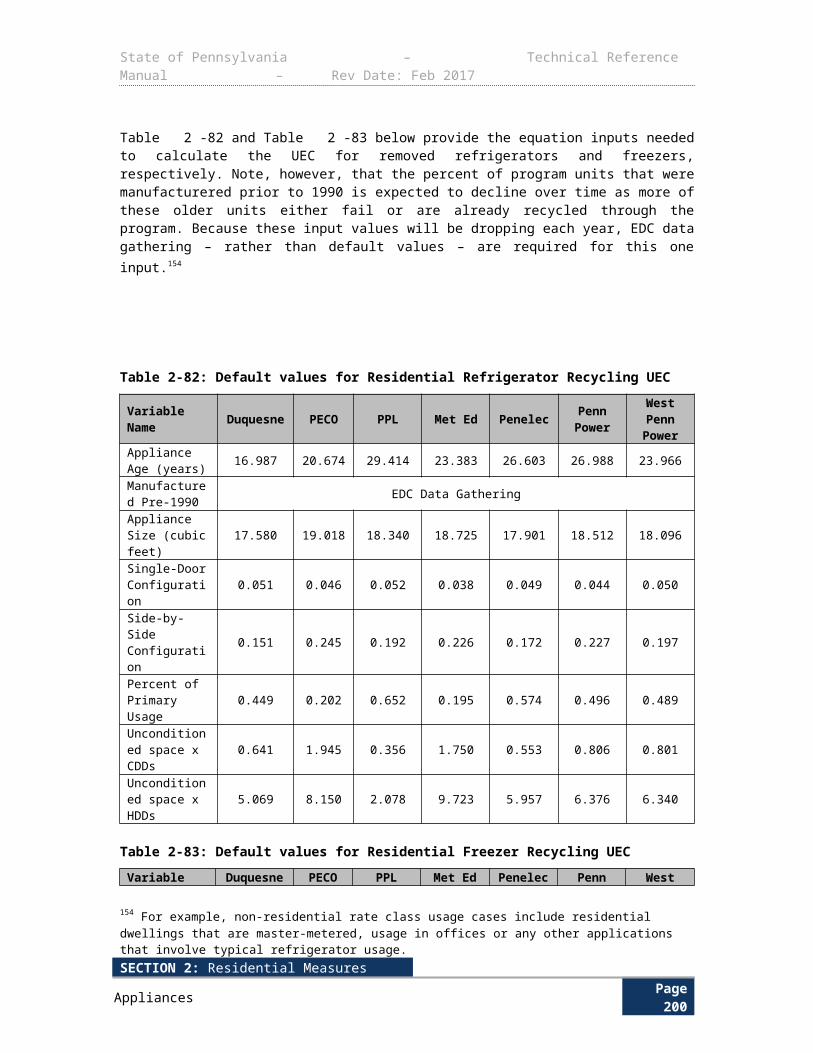
State of Pennsylvania – Technical Reference Manual – Rev Date: Feb 2017
4) Federal Register / October 31, 2011 / Rules and Regulations , 10 CFR Part 430, “2011-10-31 Energy Conservation Program: Energy Conservation Standards for Residential Furnaces and Residential Central Air Conditioners and Heat Pumps; Notice of effective date and compliance dates for direct final rule.” http://www.regulations.gov/#!documentDetail;D=EERE-2011-BT-STD-0011-0058
5) SEER of HVAC unit in energy efficient qualifying home.
6) Straub, Mary and Switzer, Sheldon."Using Available Information for Efficient Evaluation of Demand Side Management Programs". Study by BG&E. The Electricity Journal. Aug/Sept. 2011.
7) ENERGY STAR QUALIFIED MANUFACTURED HOMES-Guide for Retailers with instructions for installers and HVAC contractors / June 2007 / (http://www.research-alliance.org/pages/es_retail.htm )
8) 24 CFR Part 3280-MANUFACTURED HOMES CONSTRUCTION AND SAFETY STANDARD(http://www.gpo.gov/fdsys/pkg/CFR-2013-title24-vol5/pdf/CFR-2013-title24-vol5-part3280.pdf)
9) Standard manufactured home construction
10) Not a requirement of the HUD Code.
11) 2009 International Residential Code (IRC2009, Sections N1102-N1104)
12) Federal Register / Vol. 73, No. 145 / Monday, July 28, 2008 / Rules and Regulations, p. 43611-43613, 10 CFR Part 430, “Energy Conservation Program for Consumer Products: Energy Conservation Standards for Residential Furnaces and Boilers.”
13) US Federal Standards for Residential Water Heaters. Effective April 16, 2015. For a 40-gallon tank this is 0.948. http://www1.eere.energy.gov/buildings/appliance_standards/product.aspx/productid/27.
14) US Federal Standards for Residential Water Heaters. Effective April 16, 2015. For a 40-gallon tank this is 0.615 http://www1.eere.energy.gov/buildings/appliance_standards/product.aspx/productid/27
15) No requirement in code or federal regulation.
SECTION 2: Residential MeasuresBuilding Shell Page 204
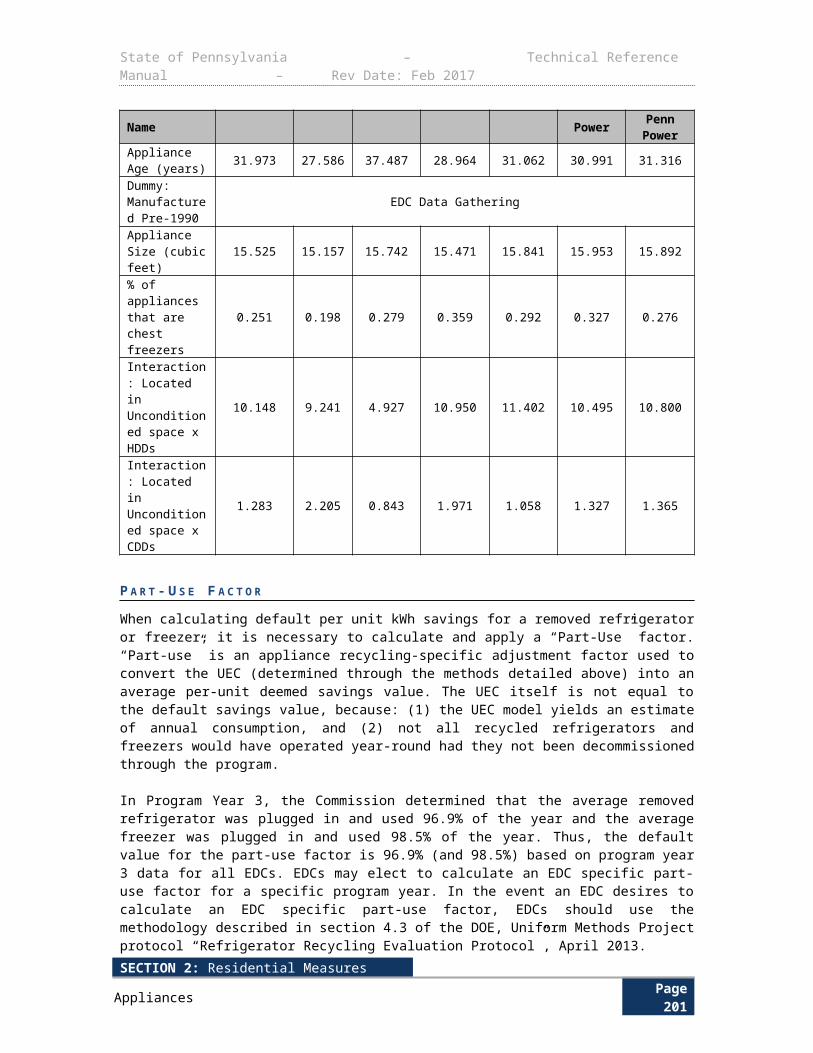
State of Pennsylvania – Technical Reference Manual – Rev Date: Feb 2017
2.6.6 RESIDENTIAL AIR SEALING
Measure Name Residential Air Sealing
Target Sector Residential Establishments, limited to single family detached houses
Measure Unit Residential Air Sealing
Unit Energy Savings Variable
Unit Peak Demand Reduction Variable
Measure Life 15 years220
Vintage Retrofit
Thermal shell air leaks are sealed through strategic use and installation of air-tight materials. Leaks are detected and leakage rates measured with the assistance of a blower-door test. This measure applies to the sealing of thermal shell air leaks in existing residential homes or apartment units in multifamily complexes with a primary electric heating and/or cooling source.
E L I G I B I L I T Y
The baseline for this measure is the existing air leakage as determined through approved and appropriate test methods using a blower door. The baseline condition of a building upon first inspection significantly impacts the opportunity for cost-effective energy savings through air-sealing.
Air sealing materials and diagnostic testing should meet all qualification criteria for program eligibility. The initial and final tested leakage rates should be performed in such a manner that the identified reductions can be properly discerned, particularly in situations where multiple building envelope measures may be implemented simultaneously.
For example, if air sealing, duct sealing and insulation are all installed as a whole home retrofit, efforts should be made to isolate the CFM reductions from each measure individually. This may require performance of a blower door test between each measure installation. Alternatively, the baseline blower door test may be performed after the duct sealing is completed, then air sealing measures installed and the retrofit blower door test completed prior to installation of the new insulation.
This measure is applicable to single family detached houses only.
A L G O R I T H M S
To calculate kWh / yr, add together the appropriate cooling and heating UES terms from Table 2-120 for use in the algorithm below. If a residence has gas heat with Central AC, use only the “Central AC Cooling” UES. If a residence has Electric Resistance heating (either baseboard or electric furnace) and no AC, use only the “Resistance Heating” UES.
∆ kWh/ yr=(CFM 50base−CFM 50ee )×UE Scity , system
220 24 CFR Part 3280-MANUFACTURED HOMES CONSTRUCTION AND SAFETY STANDARD(http://www.gpo.gov/fdsys/pkg/CFR-2013-title24-vol5/pdf/CFR-2013-title24-vol5-part3280.pdf )
SECTION 2: Residential MeasuresBuilding Shell Page 205
State of Pennsylvania – Technical Reference Manual – Rev Date: Feb 2017
To calculate kW peak, select the appropriate cooling UDS term from Table 2-121 for use in the algorithm below. If a residence has no Air Conditioning, UDS will equal 0.
∆ kW peak=(CFM 50base−CFM50ee )×UDScity ,system
D E F I N I T I O N O F T E R M S
Table 2-119: Residential Air Sealing – Values and References
Term Unit Values Source
CFM 50base , Baseline infiltration at 50 Pa CFM50Measured, EDC Data
Gathering
CFM 50ee, Infiltration at 50 Pa post air sealing
CFM50Measured, EDC Data
Gathering
UEScity , system, Unit Energy Savings per CFM50 of air leakage reduction
kWh / yrCFM 50
See Table 2-120 1
UD Scity , system, Unit Demand Savings per CFM50 of air leakage reduction, coincident with PJM peak
kWCFM 50
See Table 2-121 2
D E F A U L T U N I T E N E R G Y A N D D E M A N D S A V I N G S T A B L E S
Savings may be claimed using the algorithms above and the algorithm’s input default values below, in conjunction with customer-specific blower door test data. Site specific data from blower door testing is required to be used in conjunction with these default energy savings values, as outlined in the algorithms.
Table 2-120: Default Unit Energy Savings per Reduced CFM50 for Air Sealing
City
UEScity , systemAir Source Heat Pump Electric Resistance Ground Source Heat PumpASHP
CoolingASHP
HeatingCentral AC
CoolingResistance
HeatingGSHP
CoolingGSHP
HeatingAllentown 0.0230 1.2340 0.0277 2.2568 0.0054 0.8389
Erie 0.0114 1.5913 0.0163 2.6453 0.0 0.9851
Harrisburg 0.0322 1.0529 0.0377 2.0176 0.0098 0.7432
Philadelphia 0.0548 0.9090 0.0621 1.8348 0.0221 0.6644
Pittsburgh 0.0200 1.3483 0.0244 2.2112 0.0023 0.8190
Scranton 0.0125 1.3074 0.0163 2.2380 0.0 0.8341
Williamsport 0.0155 1.2712 0.0199 2.1716 0.0 0.8052
SECTION 2: Residential MeasuresBuilding Shell Page 206
State of Pennsylvania – Technical Reference Manual – Rev Date: Feb 2017
Table 2-121: Default Unit Coincident Peak Demand Savings per Reduced CFM50 for Air Sealing
City
UD Scity , systemASHP Cooling Central AC Cooling GSHP Cooling
Allentown 0.000042 0.000045 0.000018
Erie 0.000025 0.000026 0.000004
Harrisburg 0.000054 0.000058 0.000025Philadelphia 0.000061 0.000066 0.000030
Pittsburgh 0.000040 0.000043 0.000015
Scranton 0.000031 0.000034 0.000007Williamsport 0.000036 0.000039 0.000014
E V A L U A T I O N P R O T O C O L S
The appropriate evaluation protocol for this measure is desk audit verification that the pre and post blower door tests were performed in accordance with industry standards. Verification through desk audits require confirmation of the proper application of the TRM protocol using default unit energy and demand savings values in coordination with blower door test results. Field verification of each test or re-test is not required.
S O U R C E S
1) Based on BEopt Modeling with EnergyPlus performed by GDS Associates. UES values were calculated by modeling a prototypical Pennsylvania single family detached house with statewide average characteristics determined through the 2014 Pennsylvania Residential Baseline Study. Three different heating/cooling combinations (ASHP, Central AC with resistance heating, and GSHP) were separately modeled and a simulation of each combination was performed at four levels of air leakage (3, 7, 11, and 15 ACH50). The heating and cooling results at the four air leakage levels for each heating/cooling combination were then fitted with linear regressions, the slopes of which are the UES values (units of kWh / yrCFM 50
). This procedure was performed for each city using the statewide prototypical
Pennsylvania house and the appropriate TMY3 weather file for that city.
2) Based on BEopt Modeling with EnergyPlus performed by GDS Associates. UDS values were calculated by modeling a prototypical Pennsylvania single family detached house with statewide average characteristics determined through the 2014 Pennsylvania Residential Baseline Study. Three different heating/cooling combinations (ASHP, Central AC with resistance heating, and GSHP) were separately modeled and a simulation of each combination was performed at four levels of air leakage (3, 7, 11, and 15 ACH50). The coincident peak cooling demand results at the four air leakage levels for each heating/cooling combination were then fitted with linear regressions, the slopes of which are the UDS values
(units of kW
CFM 50 ). This procedure was performed for each city using the statewide
prototypical Pennsylvania house and the appropriate TMY3 weather file for that city. UDS represent coincident peak demand savings, thus the coincidence factor is already incorporated into the values.
SECTION 2: Residential MeasuresBuilding Shell Page 207
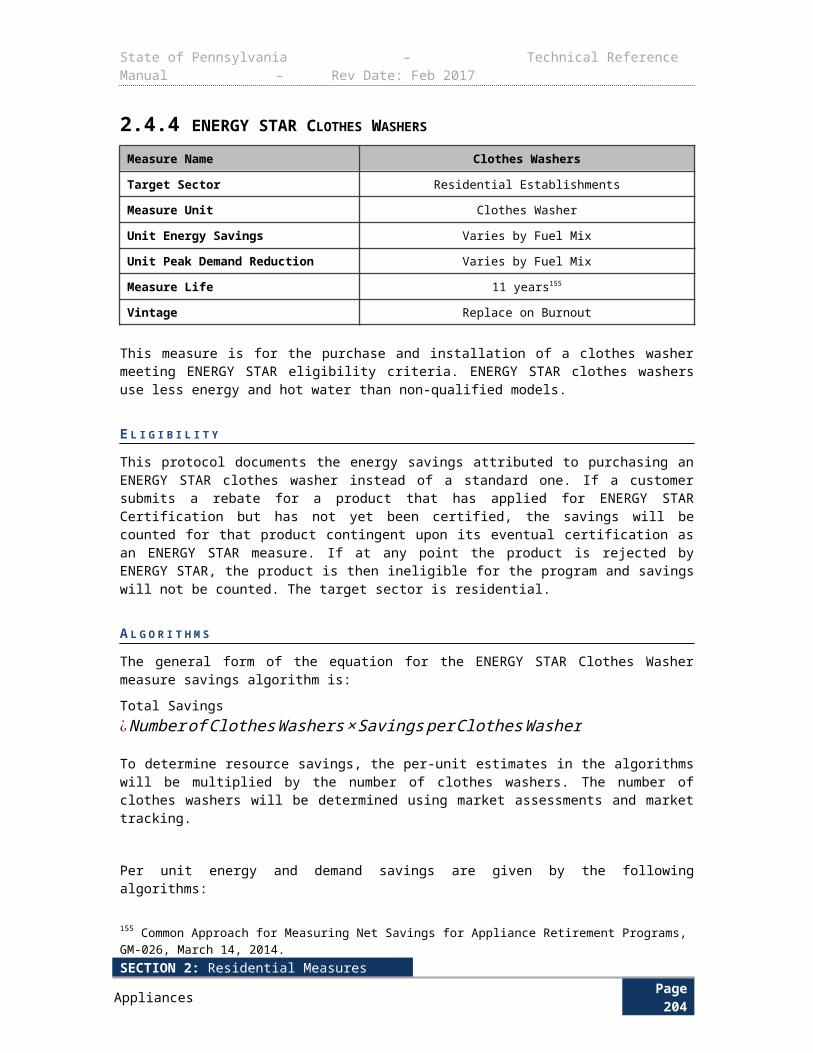
State of Pennsylvania – Technical Reference Manual – Rev Date: Feb 2017
SECTION 2: Residential MeasuresBuilding Shell Page 208
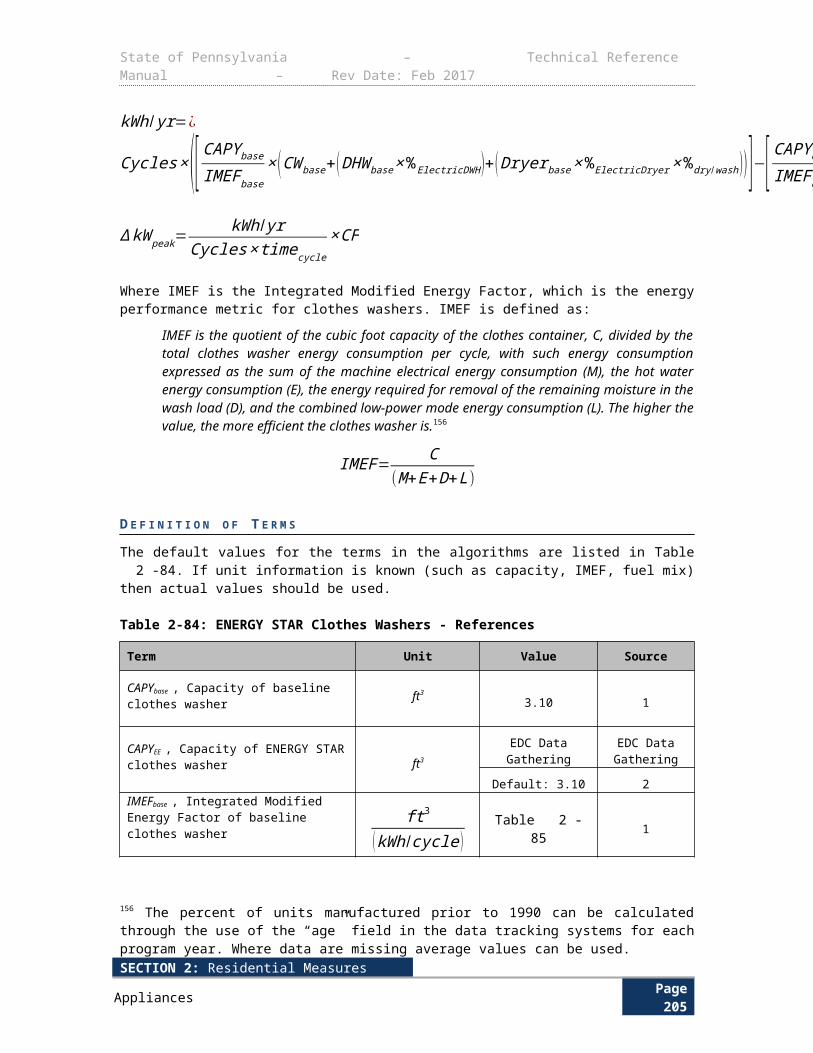
State of Pennsylvania – Technical Reference Manual – Rev Date: Feb 2017
2.6.7 CRAWL SPACE WALL INSULATION
Measure Name Crawl Space Insulation
Target Sector Residential Establishments
Measure Unit Insulation Addition
Unit Energy Savings Variable
Unit Peak Demand Reduction Variable
Measure Life 15 years221
Vintage Retrofit
A residential crawl space is a structural foundation that is tall enough for a person to crawl within the space to perform any necessary maintenance. This measure protocol applies to the installation of insulation in the crawl space walls of residential homes. The baseline is a crawl space that has no insulation.
E L I G I B I L I T Y
This measure protocol applies to the installation of insulation in the unvented crawl space walls of residential homes. Research has shown that vented crawlspaces that are sealed and insulated operate similarly to basements in providing benefits such as energy savings, comfort, moisture control, long-term durability, and healthier air quality.222 Sealing the crawl space must follow the required PA building codes,223 including covering the Earth with a Class I vapor retarder and providing ventilation of at least 1cfm per 50 ft2 of crawlspace. In addition, sealing of the crawlspace must not block access to the space. 224 The insulation should have either a minimum R-10 continuous insulated sheathing on the interior or exterior of the home, or R-13 cavity insulation at the interior of the crawl space wall.225
A L G O R I T H M S
Savings are due to a reduction in cooling and heating requirements due to insulation.
kWh / yr ¿kWhcool+kWhheat
kWhcool ¿( 1Rbase
− 1Rbase+Ree )×
L× Hag× (1−FF )×CDD×24×DUA1000×SEER
kWhheat¿ {[( 1
Rbase− 1Rbase+Ree )×Hag ]+[( 1
Rbase+REarth− 1Rbase+REarth+Ree )×Hbg ]}× L× (1−FF )×HDD×24
3412×❑heat× AF
221 Single and multiple family as noted.222 Measure Life Report, Residential and Commercial/Industrial Lighting and HVAC Measures, GDS Associates, 2007223 Measure Life Report, Residential and Commercial/Industrial Lighting and HVAC Measures Prepared for The New England State Program Working Group, http://library.cee1.org/content/measure-life-report-residential-and-commercialindustrial-lighting-and-hvac-measures Measure life for insulation is 25 years. Note that PA Act 129 savings can be claimed for no more than 15 years, thus the 15 year measure life.224 USDOE, Guide to Closing and Conditioning Ventilated Crawlspaces, http://www.nrel.gov/docs/fy13osti/54859.pdf225 The PA Uniform Construction Code Administration and Enforcement regulation has adopted the ICC International Residential Code 2009 (including Appendix G) for use throughout the Commonwealth of Pennsylvania, effective 12/31/2012. http://www.portal.state.pa.us/portal/server.pt/community/uniform_construction_code/10524/ucc_codes/553803
SECTION 2: Residential MeasuresBuilding Shell Page 209
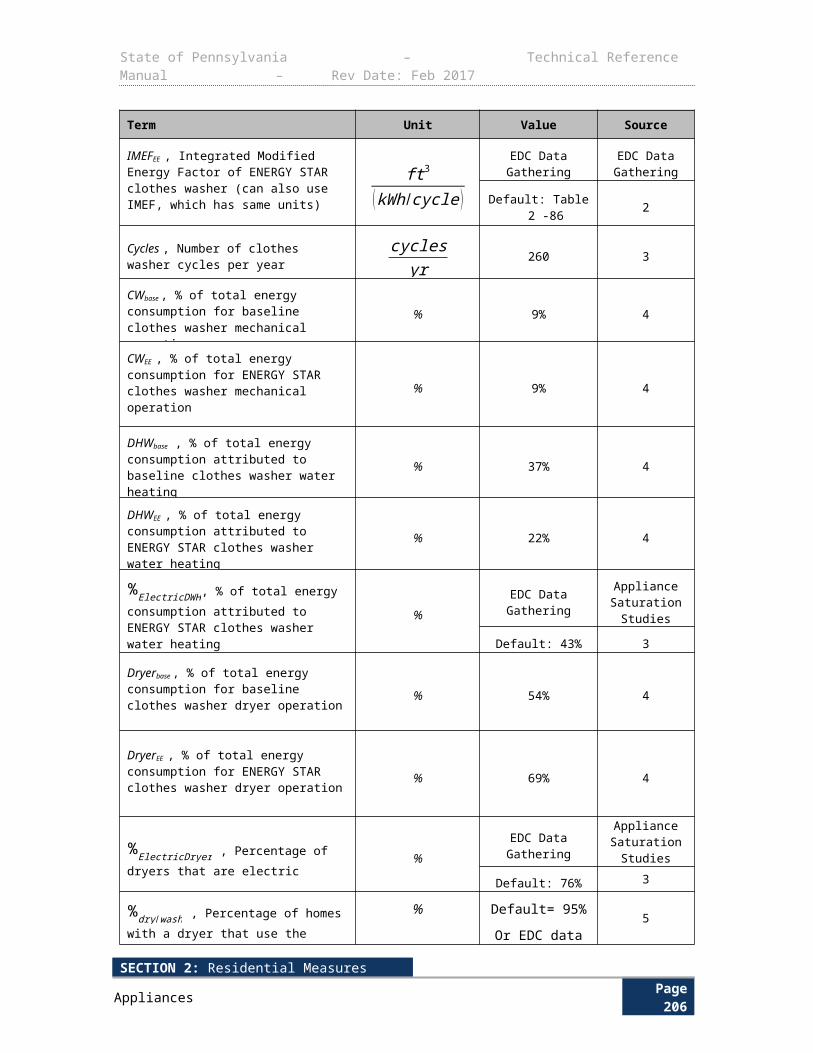
State of Pennsylvania – Technical Reference Manual – Rev Date: Feb 2017
∆ kW peak ¿( kWhcoolEFLH cool
)×CFD E F I N I T I O N O F T E R M S
Table 2-122: Assumptions for Residential Crawl Space Insulation
Term Unit Values SourceRbase, baseline R-value of foundation wall
°F-ft2-h/Btu EDC Data GatheringDefault = 1.73 1
REarth, average R-value for the thermal resistance of the Earth at the height of insulated crawlspace wall below grade (Hbg)
°F-ft2-h/Btu Table 2-123 2
Ree, R-value of installed spray foam, rigid foam, or cavity insulation applied to crawlspace wall
°F-ft2-h/Btu EDC Data Gathering EDC Data Gathering
L, length of crawlspace wall around the entire insulated perimeter ft EDC Data Gathering EDC Data
GatheringH ag, height of insulated crawlspace wall above grade
ft EDC Data Gathering EDC Data Gathering
Hbg, height of insulated crawlspace wall below grade
ft EDC Data Gathering EDC Data Gathering
FF, framing factor, adjustment to account for area of framing when cavity insulation is used
Fraction
Spray foam : 0.0External rigid foam: 0.0
Studs and cavity insulation: 0.25
3
24, conversion factor hours/day 24CDD, cooling degree days °F-day Table 2-124 4HDD, heating degree days °F-day Table 2-124 4DUA, Discretionary Use Adjustment, adjustment for times when AC is not operating even though conditions may call for it
Fraction 0.75 5
1000, conversion factor Btu/kBtu 1000
SEER, Seasonal Energy Efficiency Ratio of cooling system
BtuW ∙h
EDC Data GatheringDefault = 11 (Central
A/C) or12 (ASHP)
6
❑heat, efficiency of heating system Fraction EDC Data GatheringTable 2-126 6
AF, adjustment factor, accounts for prescriptive engineering algorithms overestimating savings
Fraction 0.88 7
EFLH cool, equivalent full-load hours of air conditioning
hours EDC Data GatheringTable 2-124 8
CF, coincidence factor Fraction
Central AC: 0.647Room AC: 0.30ASHP: 0.647GSHP: 0.647
9, 10
D E F A U L T S A V I N G S
SECTION 2: Residential MeasuresBuilding Shell Page 210
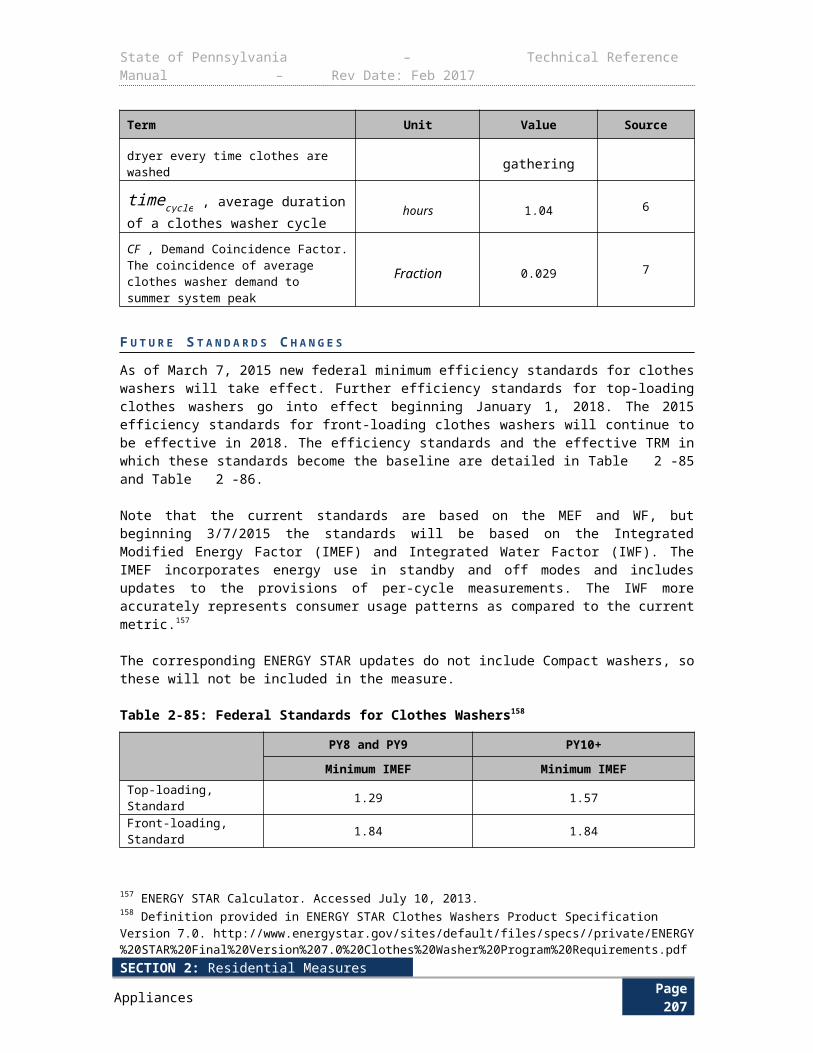
State of Pennsylvania – Technical Reference Manual – Rev Date: Feb 2017
Table 2-123 should be used to determine the average thermal resistance of the Earth (REarth) at the height of crawlspace wall below grade (Hbg). Use a crawlspace wall that is 5ft in height as an example of proper use of the table. If the crawlspace wall is 5 ft in height and 1ft is above grade (Hag = 1ft), then the remaining 4ft are below grade (Hbg = 4ft). To determine the REarth for that below-grade wall height, look for the column for Hbg = 4ft in Table 2-123. REarth in this example is therefore 6.42 °F-ft2-h/Btu.
Table 2-123: Below-grade R-values
Hbg (ft) 0 1 2 3 4 5 6 7 8
REarth (°F-ft2-h/Btu) 2.44 3.47 4.41 5.41 6.42 7.46 8.46 9.53 10.69
Insulation in unconditioned spaces (standard crawlspace) is modeled by reducing the degree days to reflect the smaller but non-zero contribution to heating and cooling load.
Table 2-124: CDD by City
CityConditioned Space
CDD (Base 65°F)Unconditioned Space
CDD (Base 75°F)
Allentown 787 317
Erie 620 173
Harrisburg 955 337
Philadelphia 1235 292
Pittsburgh 726 249
Scranton 611 222
Williamsport 709 256
Table 2-125: HDD by City
CityConditioned Space
HDD (Base 65°F)Unconditioned Space
HDD (Base 50°F)
Allentown 5830 2439
Erie 6243 2883
Harrisburg 5201 2250
Philadelphia 4759 2406
Pittsburgh 5829 2552
Scranton 6234 2806
Williamsport 6063 2684
Table 2-126: Efficiency of Heating System
System Type HSPF Estimate
heat
Effective COP Estimate(HSPF/3.412)*0.85
SECTION 2: Residential MeasuresBuilding Shell Page 211
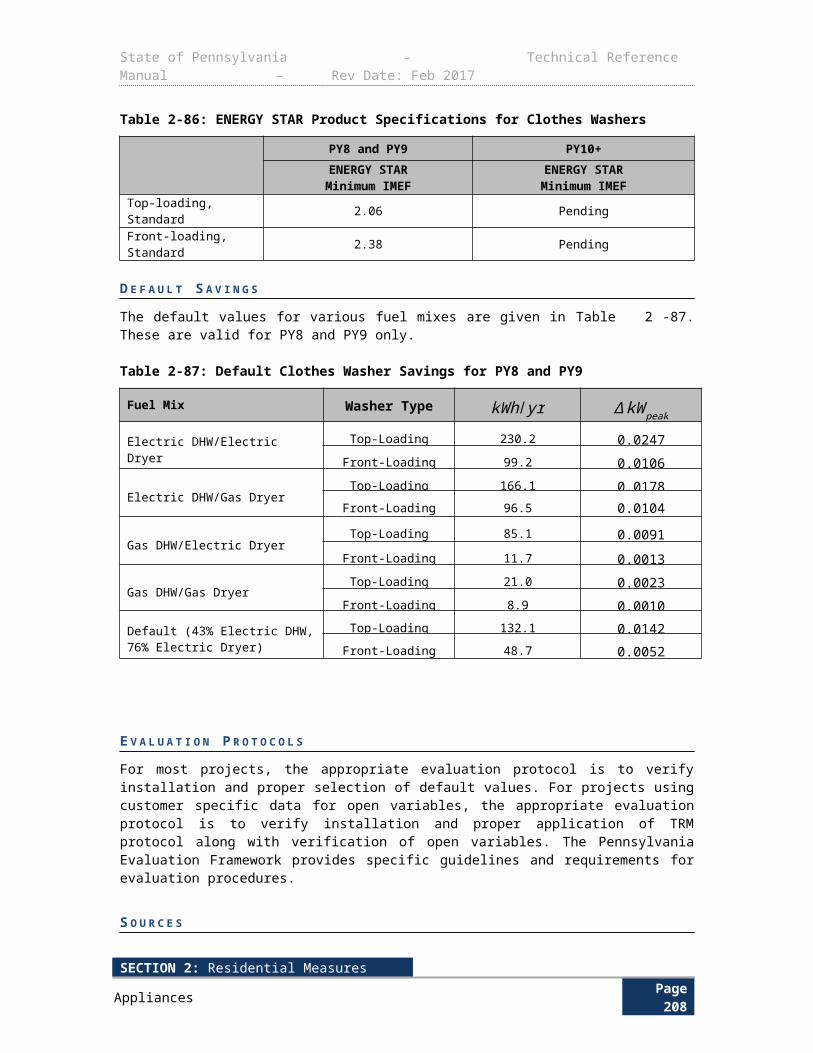
State of Pennsylvania – Technical Reference Manual – Rev Date: Feb 2017
Heat Pump 6.9 1.7
Resistance N/A 1
Table 2-127: EFLH by City
CityEFLHcool
(Hours)
Allentown 487
Erie 389
Harrisburg 551
Philadelphia 591
Pittsburgh 432
Scranton 417
Williamsport 422
E V A L U A T I O N P R O T O C O L S
For most projects, the appropriate evaluation protocol is to verify installation and proper selection of default values. For projects using customer specific data for open variables, the appropriate evaluation protocol is to verify installation and proper application of TRM protocol along with verification of open variables. The Pennsylvania Evaluation Framework provides specific guidelines and requirements for evaluation procedures.
S O U R C E S
1) 2009 ASHRAE Fundamentals, Chapter 25 and 26. Method from “Total Thermal Resistance of a Flat Building Assembly” in Chapter 25. Values from Chapter 26: interior air film = 0.68, 7" concrete or CMU wall = 0.88, exterior air film = 0.17. Total= 1.73 °F-ft2-h/Btu
2) ASHRAE Fundamentals Handbook, 1977. Adapted from Table 1, page 24.4
3) ASHRAE Fundamentals Handbook, 2009. Adapted from Chapter 27, page 27.4
4) Climatography of the United States No. 81. Monthly Station Normals of Temperature, Precipitation, and Heating and Cooling Degree Days, 1971-2000, 36 Pennsylvania. NOAA. http://cdo.ncdc.noaa.gov/climatenormals/clim81/PAnorm.pdf
5) Energy Center of Wisconsin, May 2008 metering study; “Central Air Conditioning in Wisconsin, A Compilation of Recent Field Research”, p31. http://cleanefficientenergy.org/resource/central-air-conditioning-wisconsin-compilation-recent-field-research
6) 2014 Pennsylvania Residential Baseline Study. http://www.puc.pa.gov/Electric/pdf/Act129/SWE-2014_PA_Statewide_Act129_Residential_Baseline_Study.pdf An 85% distribution efficiency is then applied to account for duct losses for heat pumps.
7) “Home Energy Services Impact Evaluation”, August 2012. Based on comparing algorithm derived savings estimate and evaluated bill analysis estimate. http://ma-eeac.org/wordpress/wp-content/uploads/Home-Energy-Services-Impact-Evaluation-Report_Part-of-the-Massachusetts-2011-Residential-Retrofit-and-Low-Income-Program-Area-Evaluation.pdf
8) ACCA, “Verifying ACCA Manual S Procedures,” http://www.acca.org/wp-content/uploads/2014/01/Manual_S_verification.pdf Based on
SECTION 2: Residential MeasuresBuilding Shell Page 212
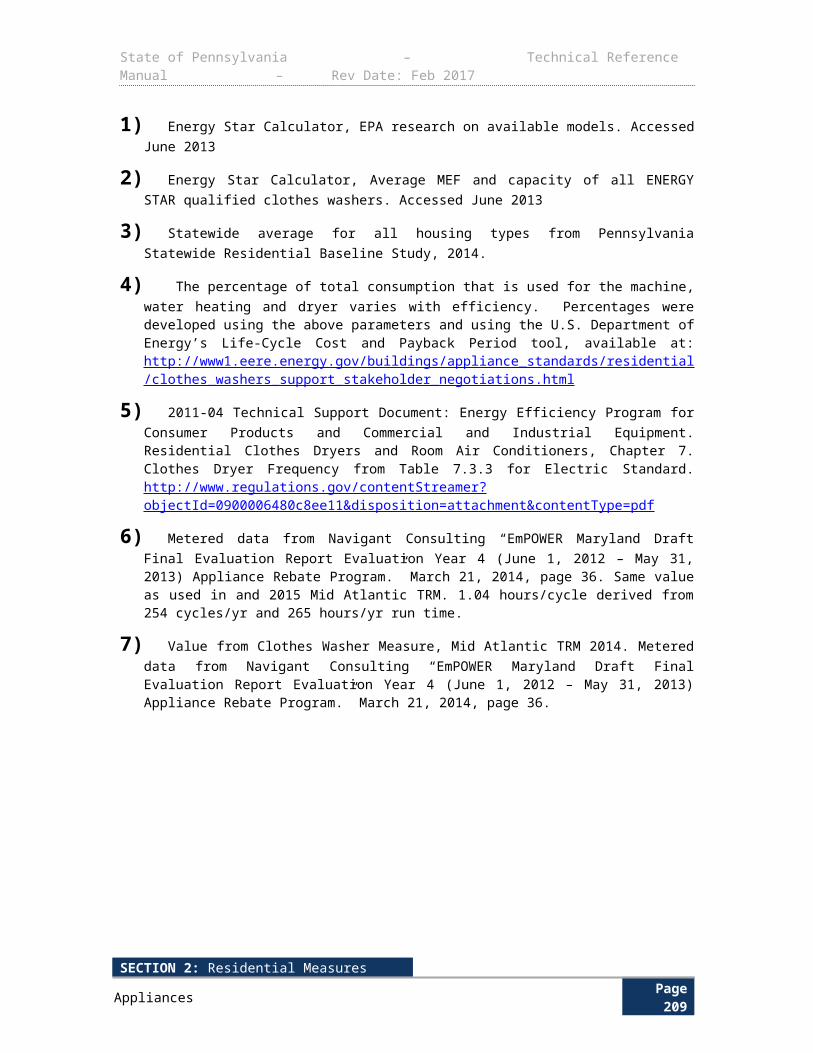
State of Pennsylvania – Technical Reference Manual – Rev Date: Feb 2017
REM/Rate modeling using models from the PA 2012 Potential Study. EFLH calculated from kWh consumption for cooling and heating. Models assume 50% over-sizing of air conditioners.
9) Straub, Mary and Switzer, Sheldon. "Using Available Information for Efficient Evaluation of Demand Side Management Programs". Study by BG&E. The Electricity Journal. Aug/Sept. 2011. http://www.sciencedirect.com/science/article/pii/S1040619011001941
10) RLW Report: Final Report Coincidence Factor Study Residential Room Air Conditioners, June 23, 2008. http://www.puc.nh.gov/Electric/Monitoring%20and%20Evaluation%20Reports/National%20Grid/117_RLW_CF%20Res%20RAC.pdf
SECTION 2: Residential MeasuresBuilding Shell Page 213
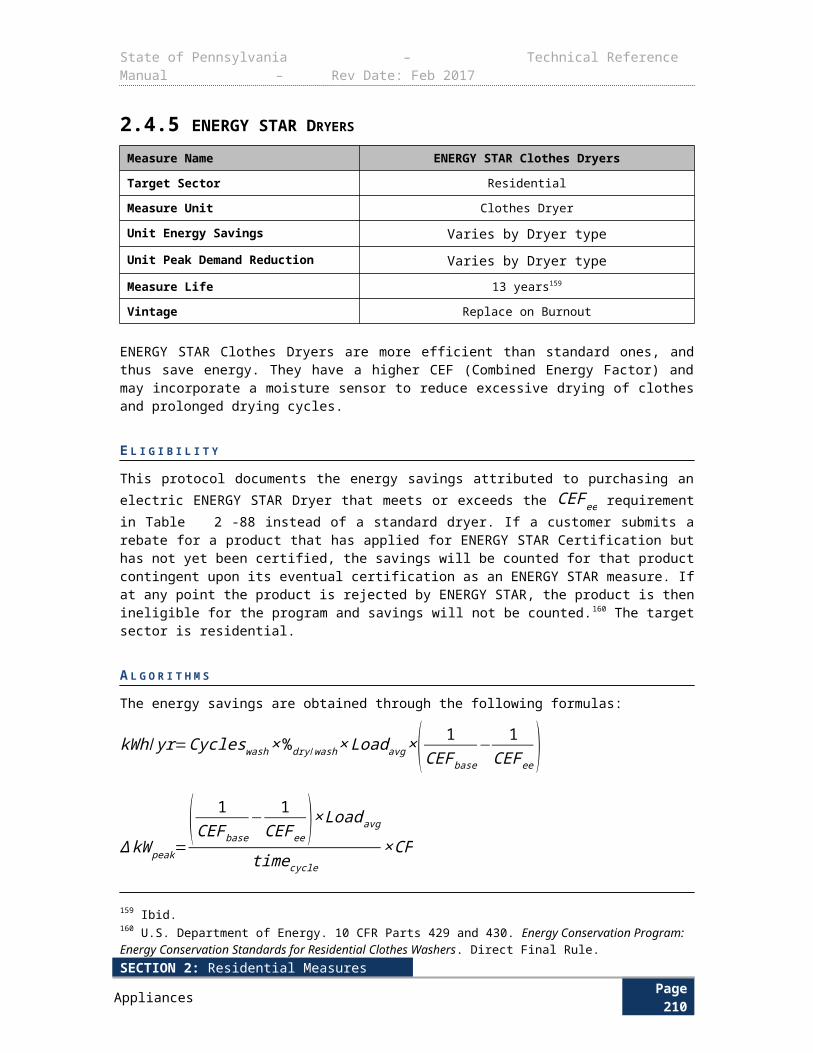
State of Pennsylvania – Technical Reference Manual – Rev Date: Feb 2017
2.6.8 RIM JOIST INSULATION
Measure Name Rim Joist Insulation
Target Sector Residential Establishments
Measure Unit Insulation Addition
Unit Energy Savings Variable
Unit Peak Demand Reduction Variable
Measure Life 15 years226
Vintage Retrofit
Residential rim joists are often left uninsulated, leading to inefficiencies in cooling and heating. This measure protocol applies to the installation of insulation in the rim joists of residential homes. The baseline is a rim joist that has no insulation.
E L I G I B I L I T Y
This measure protocol applies to the installation of insulation in the rim joists of residential homes. This includes the rim joists of unvented crawlspaces and the rim joists between the first and second floor of a residence. The insulation should have either a minimum R-10 continuous insulated sheathing on the interior or exterior of the home, or R-13 cavity insulation at the interior of the rim joist.227,228 Because of the difficulty of a proper air-sealed installation, using fiberglass batts between the joists is not usually recommended. The insulation should be sprayed foam or rigid foam.229
A L G O R I T H M S
Savings are due to a reduction in cooling and heating requirements resulting from insulation addition.
kWh / yr ¿kWhcool+kWhheat
kWhcool ¿( 1Rbase
−1
Rbase+Ree )× L×H×CDD×24×DUA1000×SEER
kWhheat ¿( 1Rbase
−1
Rbase+Ree )× L×H×HDD×243412×❑heat
× AF
∆ kW peak¿( kWhcoolEFLH cool
)×CF
226 ICC, International Residential Code for One- and Two-Family Dwellings, Chapter 4. http://publicecodes.cyberregs.com/icod/irc/2009/icod_irc_2009_4_sec008.htm227 IECC 2009, Table 402.1.1 Insulation and Fenestration Requirements by Component, Climate Zones 4-8, http://publicecodes.cyberregs.com/icod/iecc/2009/icod_iecc_2009_4_par004.htm228 Measure Life Report, Residential and Commercial/Industrial Lighting and HVAC Measures Prepared for The New England State Program Working Group, http://library.cee1.org/content/measure-life-report-residential-and-commercialindustrial-lighting-and-hvac-measures Measure life for insulation is 25 years. Note that PA Act 129 savings can be claimed for no more than 15 years, thus the 15 year measure life.229 USDOE, Guide to Closing and Conditioning Ventilated Crawlspaces, http://www.nrel.gov/docs/fy13osti/54859.pdf
SECTION 2: Residential MeasuresBuilding Shell Page 214
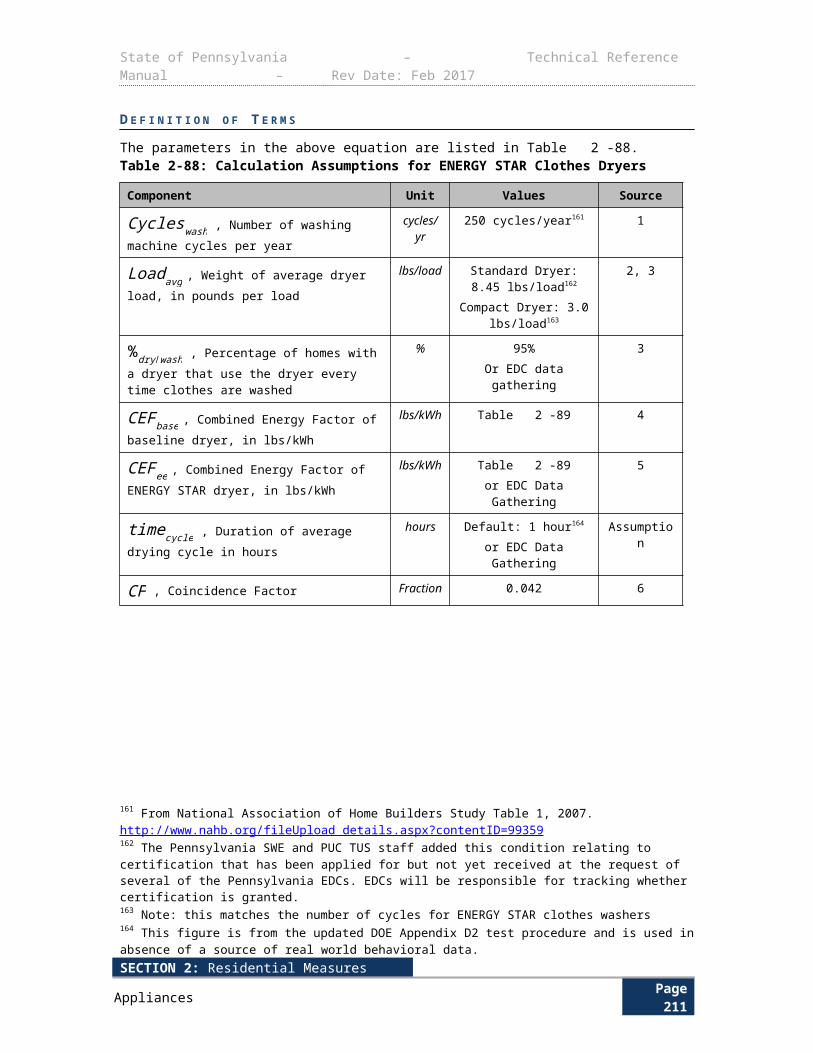
State of Pennsylvania – Technical Reference Manual – Rev Date: Feb 2017
D E F I N I T I O N O F T E R M S
Table 2-128: Default values for algorithm terms, Residential Rim Joist Insulation
Term Unit Values Source
Rbase, baseline R-value of rim joist °F-ft2-h/Btu EDC Data GatheringDefault = 2.50 1
Ree, R-value of installed spray foam or rigid foam insulation applied to rim joist
°F-ft2-h/Btu EDC Data Gathering EDC Data Gathering
L, length of rim joist around the entire insulated perimeter ft EDC Data Gathering EDC Data
Gathering
H, height of insulated rim joist ft EDC Data Gathering EDC Data Gathering
24, conversion factor hours/day 24
CDD, cooling degree days °F-day Table 2-129 2
HDD, heating degree days °F-day Table 2-130 2
DUA, Discretionary Use Adjustment, adjustment for times when AC is not operating even though conditions may call for it
None 0.75 3
1000, conversion factor Btu/kBtu 1000
SEER, Seasonal Energy Efficiency Ratio of cooling system
BtuW ∙h
EDC Data GatheringDefault = 11 (Central
A/C) or12 (ASHP)
4
❑heat, efficiency of heating system None EDC Data GatheringTable 2-131 4
AF, adjustment factor, accounts for prescriptive engineering algorithms overestimating savings
None 0.88 5
EFLH cool, equivalent full-load hours of air conditioning
hours EDC Data GatheringTable 2-132 6
CF, coincidence factor Decimal
Central AC: 0.647Room AC: 0.30ASHP: 0.647GSHP: 0.647
7, 8
D E F A U L T S A V I N G S
Insulation in unconditioned spaces (standard crawlspace) is modeled by reducing the degree days to reflect the smaller but non-zero contribution to heating and cooling load.
SECTION 2: Residential MeasuresBuilding Shell Page 215
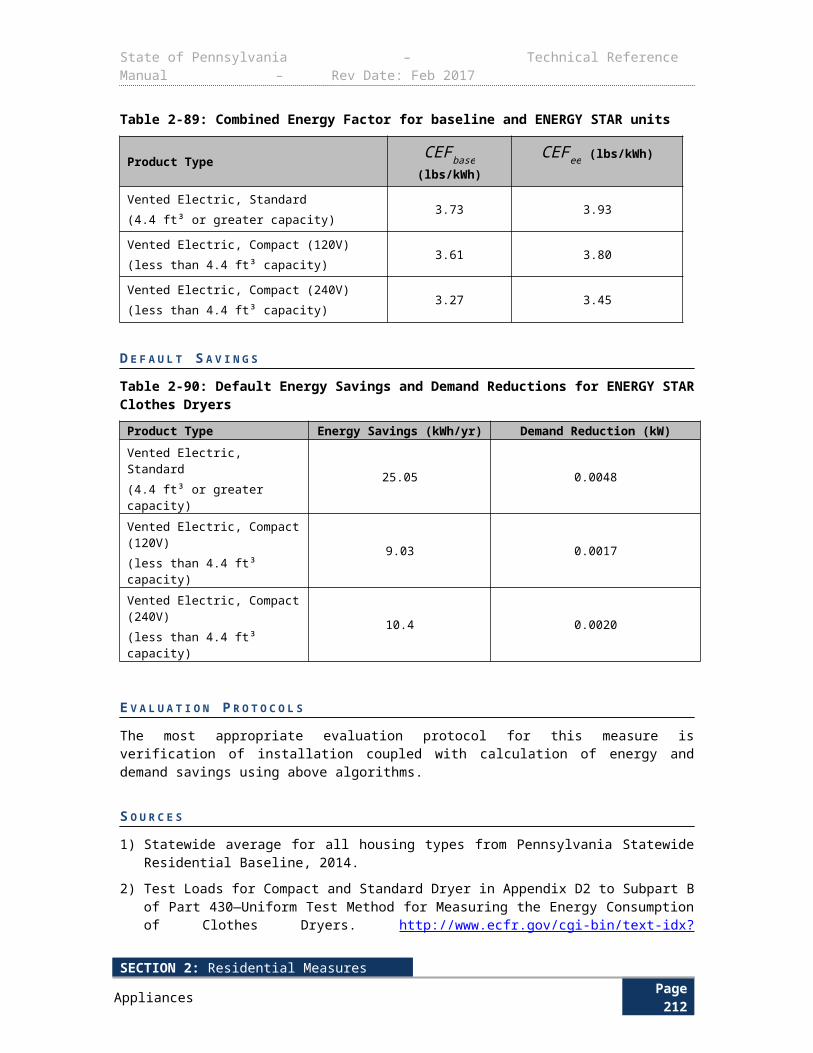
State of Pennsylvania – Technical Reference Manual – Rev Date: Feb 2017
Table 2-129 CDD by City
CityConditioned Space
CDD (Base 65°F)Unconditioned Space
CDD (Base 75°F)
Allentown 787 317
Erie 620 173
Harrisburg 955 337
Philadelphia 1235 292
Pittsburgh 726 249
Scranton 611 222
Williamsport 709 256
Table 2-130: HDD by City
CityConditioned Space
HDD (Base 65°F)Unconditioned Space
HDD (Base 50°F)
Allentown 5830 2439
Erie 6243 2883
Harrisburg 5201 2250
Philadelphia 4759 2406
Pittsburgh 5829 2552
Scranton 6234 2806
Williamsport 6063 2684
Table 2-131: Efficiency of Heating System
System Type HSPF Estimate
heat
Effective COP Estimate(HSPF/3.412)*0.85
Heat Pump 6.9 1.7
Resistance N/A 1
SECTION 2: Residential MeasuresBuilding Shell Page 216

State of Pennsylvania – Technical Reference Manual – Rev Date: Feb 2017
Table 2-132: EFLH by City
CityEFLHcool
(Hours)
Allentown 487
Erie 389
Harrisburg 551
Philadelphia 591
Pittsburgh 432
Scranton 417
Williamsport 422
E V A L U A T I O N P R O T O C O L S
For most projects, the appropriate evaluation protocol is to verify installation and proper selection of default values. For projects using customer specific data for open variables, the appropriate evaluation protocol is to verify installation and proper application of TRM protocol along with verification of open variables. The Pennsylvania Evaluation Framework provides specific guidelines and requirements for evaluation procedures.
S O U R C E S
1) 2009 ASHRAE Fundamentals, Chapter 25 and 26. Method from “Total Thermal Resistance of a Flat Building Assembly” in Chapter 25. Values from Chapter 26: interior air film = 0.68, 1.5" wooden rim joist = 1.65, exterior air film = 0.17. Total= 2.50 °F-ft2-h/Btu
2) Climatography of the United States No. 81. Monthly Station Normals of Temperature, Precipitation, and Heating and Cooling Degree Days 1971-2000, 36 Pennsylvania. NOAA. http://cdo.ncdc.noaa.gov/climatenormals/clim81/PAnorm.pdf
3) Energy Center of Wisconsin, May 2008 metering study; “Central Air Conditioning in Wisconsin, A Compilation of Recent Field Research”, p31. http://cleanefficientenergy.org/resource/central-air-conditioning-wisconsin-compilation-recent-field-research
4) 2014 Pennsylvania Residential Baseline Study. http://www.puc.pa.gov/Electric/pdf/Act129/SWE-2014_PA_Statewide_Act129_Residential_Baseline_Study.pdf An 85% distribution efficiency is then applied to account for duct losses for heat pumps.
5) “Home Energy Services Impact Evaluation”, August 2012. Based on comparing algorithm derived savings estimate and evaluated bill analysis estimate. http://ma-eeac.org/wordpress/wp-content/uploads/Home-Energy-Services-Impact-Evaluation-Report_Part-of-the-Massachusetts-2011-Residential-Retrofit-and-Low-Income-Program-Area-Evaluation.pdf
6) ACCA, “Verifying ACCA Manual S Procedures,” http://www.acca.org/wp-content/uploads/2014/01/Manual_S_verification.pdf Based on REM/Rate modeling using models from the PA 2012 Potential Study. EFLH calculated from kWh consumption for cooling and heating. Models assume 50% over-sizing of air conditioners.
7) Straub, Mary and Switzer, Sheldon. "Using Available Information for Efficient Evaluation of Demand Side Management Programs". Study by BG&E. The Electricity Journal. Aug/Sept. 2011. http://www.sciencedirect.com/science/article/pii/S1040619011001941
SECTION 2: Residential MeasuresBuilding Shell Page 217
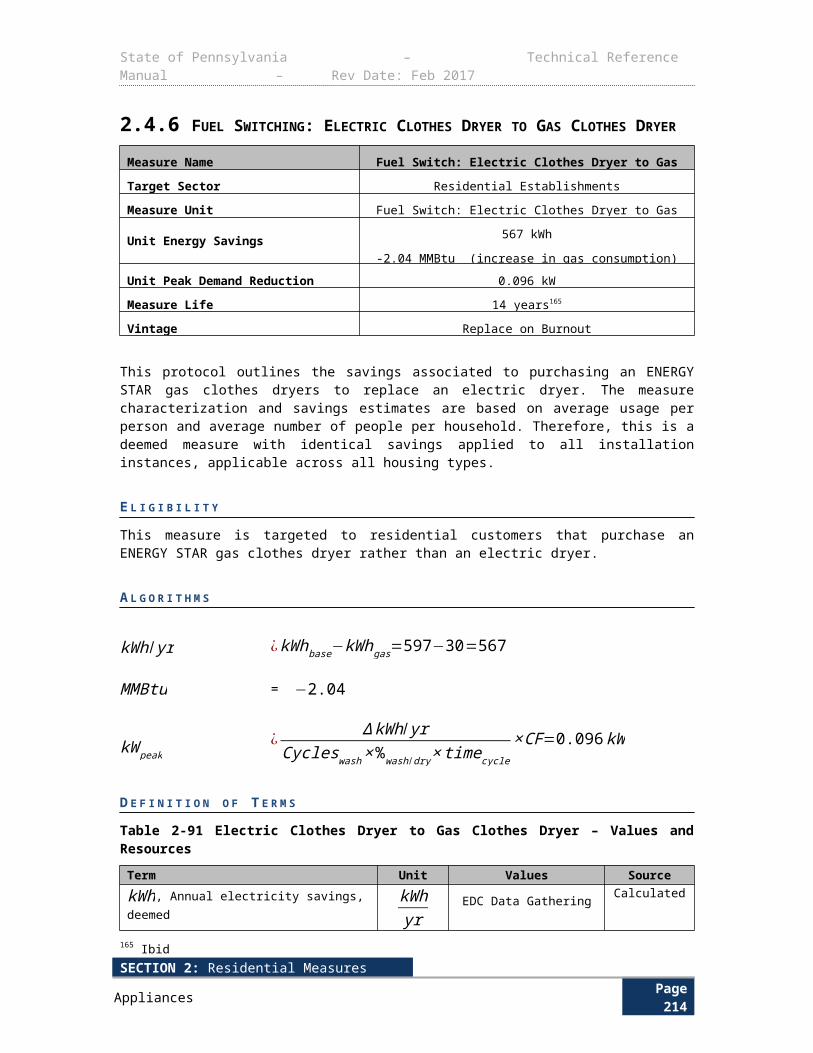
State of Pennsylvania – Technical Reference Manual – Rev Date: Feb 2017
8) RLW Report: Final Report Coincidence Factor Study Residential Room Air Conditioners, June 23, 2008. http://www.puc.nh.gov/Electric/Monitoring%20and%20Evaluation%20Reports/National%20Grid/117_RLW_CF%20Res%20RAC.pdf
SECTION 2: Residential MeasuresBuilding Shell Page 218
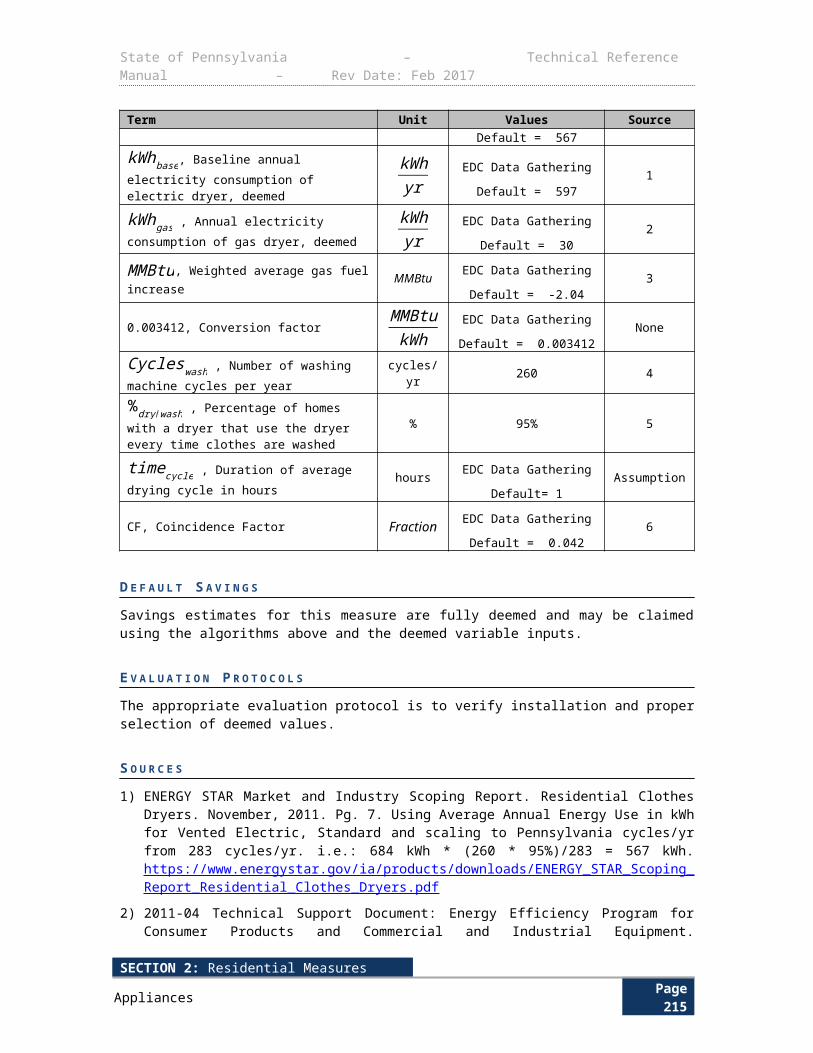
State of Pennsylvania – Technical Reference Manual – Rev Date: Feb 2017
2.7 MISCELLANEOUS2.7.1 POOL PUMP LOAD SHIFTING
Measure Name Pool Pump Load Shifting
Target Sector Residential Establishments
Measure Unit Pool Pump Load Shifting
Unit Energy Savings Variable
Unit Peak Demand Reduction Variable
Measure Life 1 year230
Vintage Retrofit
Residential pool pumps can be scheduled to avoid the 2 PM to 6 PM peak period.
E L I G I B I L I T Y
This protocol documents the energy savings attributed to schedule residential single speed pool pumps to avoid run during the peak hours from 2 PM to 6 PM. The target sector primarily consists of single-family residences. This measure is intended to be implemented by trade allies that participate in in-home audits, or by pool maintenance professionals.
A L G O R I T H M S
The residential pool pump reschedule measure is intended to produce demand savings, but if the final daily hours of operation are different than the initial daily hours of operation, an energy savings (or increase) may result. The demand savings result from not running pool pumps during the peak hours of 2 PM to 6 PM.
kWh/yr ¿∆hours /day ×Daysoperating×kW pump
kWpeak = (CF pre−CF post)×kW pump
The peak coincident factor, CF, is defined as the average coincident factor during 2 PM to 6 PM on summer weekdays. Ideally, the demand coincidence factor for the supplanted single-speed pump can be obtained from the pump’s time clock. The coincidence factor is equal to the number of hours that the pump was set to run between 2 PM and 6 PM, divided by 4.
D E F I N I T I O N O F T E R M S
Table 2-133: Pool Pump Load Shifting Assumptions
Component Unit Value Source
hours/day , The change in daily operating hours.hoursday
0 2
kWpump , Electric demand of single speed pump at a given flow rate. This quantity should be measured or taken from Table 2-133
kW
1.364 kW or See
Table 2-134
Table 2-134
230 IECC 2009, Table 402.1.1 Insulation and Fenestration Requirements by Component, Climate Zones 4-8, http://publicecodes.cyberregs.com/icod/iecc/2009/icod_iecc_2009_4_par004.htm
SECTION 2: Residential MeasuresMiscellaneous Page 219
State of Pennsylvania – Technical Reference Manual – Rev Date: Feb 2017
Component Unit Value Source
CFpre , Peak coincident factor of single speed pump from 2 PM to 6 PM in summer weekday prior to pump rescheduling. This quantity should be inferred from the timer settings
Decimal 0.306 3
CFpost , Peak coincident factor of single speed pump from 2 PM to 6 PM in summer weekday after pump rescheduling. This quantity should be inferred from the new timer settings.
Decimal 0.0 2
Daysoperating , Days per year pump is in operation. This quantity should be recorded by applicant.
daysyr
122 1
Average Single Speed Pump Electric Demand Since this measure involves functional pool pumps, actual measurements of pump demand are encouraged. If this is not possible, then the pool pump power can be inferred from the nameplate horsepower. Table 2-134 shows the average service factor (over-sizing factor), motor efficiency, and electrical power demand per pump size based on California Energy Commission (CEC) appliance database for single speed pool pump231. Note that the power to horsepower ratios appear high because many pumps, in particular those under 2 HP, have high ‘service factors’. The true motor capacity is the product of the nameplate horsepower and the service factor.
Table 2-134: Single Speed Pool Pump Specification232
Pump Horse Power (HP)
Average Pump Service Factor
Average Pump Motor Efficiency
Average Pump Power (kW)
0.50 1.62 0.66 0.946
0.75 1.29 0.65 1.081
1.00 1.28 0.70 1.306
1.50 1.19 0.75 1.512
2.00 1.20 0.78 2.040
2.50 1.11 0.77 2.182
3.00 1.21 0.79 2.666
E V A L U A T I O N P R O T O C O L
The most appropriate evaluation protocol for this measure is verification of pool pump run time as well as verification of hours of operation coincident with peak demand.
S O U R C E S
1) ENERGY STAR Pool Pump Calculator. Updated December 2013. Days of operation are for Pennsylvania (4 months/yr).
2) Program is designed to shift load to off-peak hours, not necessarily to reduce load.
231 Minnesota Department of Commerce, Home Envelope, An Energy Guide to Help You Keep the Outside Out and the Inside In. http://mn.gov/commerce/energy/topics/resources/Consumer-Guides/home-envelope/basement.jsp232 The measure life is initially assumed to be one year. If there is significant uptake of this measure then a retention study may be warranted.
SECTION 2: Residential MeasuresMiscellaneous Page 220
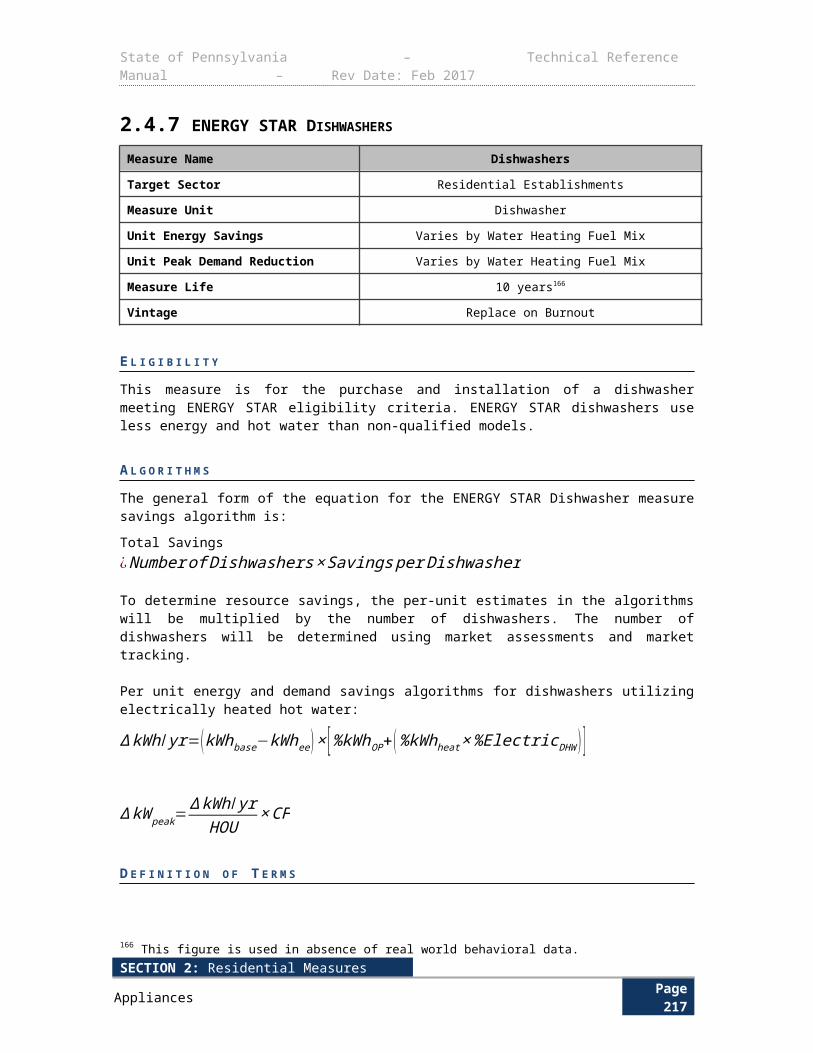
State of Pennsylvania – Technical Reference Manual – Rev Date: Feb 2017
3) Derived from Pool Pump and Demand Response Potential, DR 07.01 Report, SCE Design and Engineering, Table 16. Calculated using the average of the 3 regions. The pool pump operating schedule is not weather dependent, but operator dependent. This is noted on page 22, paragraph 2 of the source. http://www.etcc-ca.com/sites/default/files/OLD/images/stories/pdf/ETCC_Report_473.pdf
SECTION 2: Residential MeasuresMiscellaneous Page 221
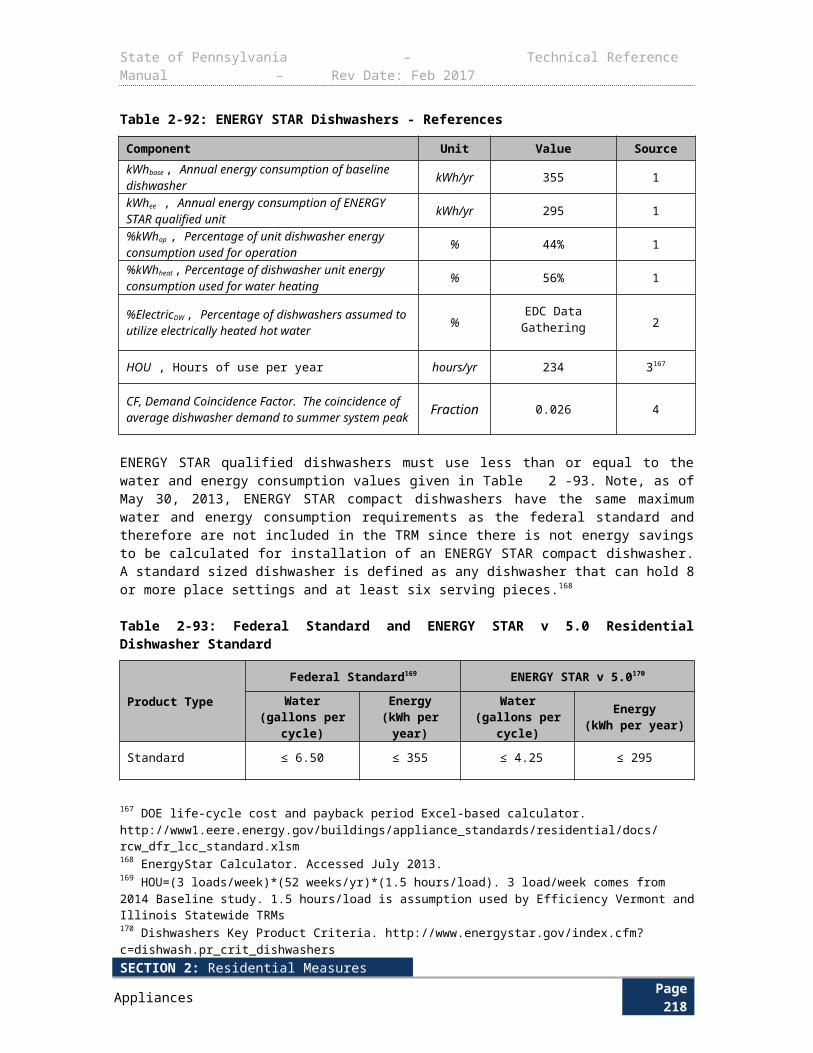
State of Pennsylvania – Technical Reference Manual – Rev Date: Feb 2017
2.7.2 VARIABLE SPEED POOL PUMPS (WITH LOAD SHIFTING OPTION)Measure Name Residential VSD Pool Pumps
Target Sector Residential Establishments
Measure Unit VFD Pool Pumps
Unit Energy Savings Variable
Unit Peak Demand Reduction Variable
Measure Life 10 years233
Vintage Replace on Burnout
This measure has two potential components. First, a variable speed pool pump must be purchased and installed on a residential pool to replace an existing constant speed pool pump. Second, the variable speed pool pump may be commissioned such that it does not operate in the 2 PM to 6 PM period (on weekdays). This second, optional step is referred to as load shifting. Residential variable frequency drive pool pumps can be adjusted so that the minimal required flow is achieved for each application. Reducing the flow rate results in significant energy savings because pump power and pump energy usage scale with the cubic and quadratic powers of the flow rate respectively. Additional savings are achieved because the VSD pool pumps typically employ premium efficiency motors. Since the only difference between the VSD pool pump without load shifting and VSD pool pump with load shifting measures pertains to the pool pump operation schedule, this protocol is written in such that it may support both measures at once.
E L I G I B I L I T Y
To qualify for the load shifting rebate, the pumps are required to be off during the hours of 2 PM to 6 PM weekdays. This practice results in additional demand reductions.
A L G O R I T H M S
This protocol documents the energy savings attributed to variable frequency drive pool pumps in various pool sizes. The target sector primarily consists of single-family residences.
kWh/yr ¿kWh / yrbase−kWh/ yrVFDkWh/yrbase ¿HOU ss×kW ss×DayskWh/yrVFD ¿ [ (HOU VFD ,clean×kW VFD ,clean )+(HOUVFD , filter×kWVFD , filter ) ]×Days
The demand reductions are obtained through the following formula:
kWpeak = kWbasepeak - kWVFDpeak
kWbasepeak = (CFSS × kWSS)
kW VFDpeak=[ (HOU peak, clean×kWVFD , clean )+(HOU peak , filter×kW VFD ,filter ) ]
4hours×CFVFD
The peak coincidence factor, CF, is defined as the average coincidence factor during 2 PM to 6 PM on summer weekdays. Ideally, the demand coincidence factor for the supplanted single-speed pump can be obtained from the pump’s time clock. The coincidence factor is equal to the number of hours that the pump was set to run between 2 PM to 6 PM, divided by 4. If this information is not available, the recommended daily hours of operation to use are 5.18 and the
233 “CEC Appliances Database – Pool Pumps.” California Energy Commission. Updated Feb 2008. Accessed March 2008.
SECTION 2: Residential MeasuresMiscellaneous Page 222
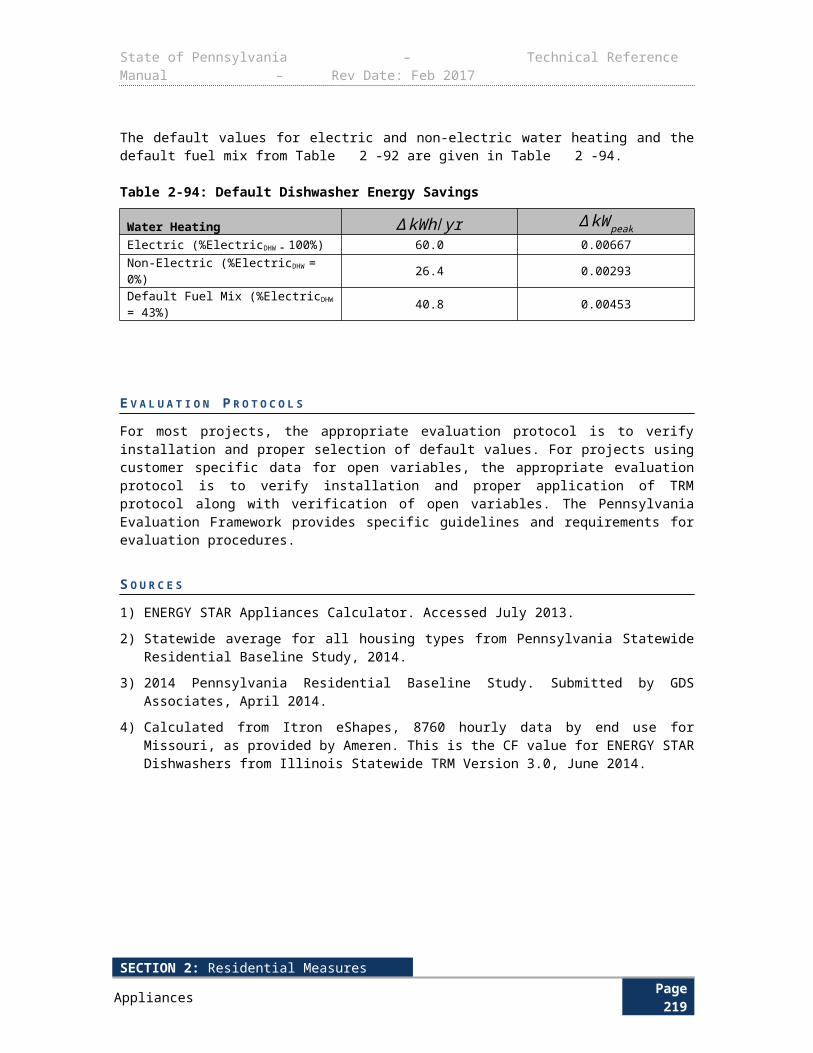
State of Pennsylvania – Technical Reference Manual – Rev Date: Feb 2017
demand coincidence factor is 30.6%. These operation parameters are derived from the 2011 Mid Atlantic TRM.
D E F I N I T I O N O F T E R M S
The parameters in the above equation are listed below.
Table 2-135: Residential VFD Pool Pumps Calculations Assumptions
Component Unit Values Source
HOUSS , Hours of operation per day for Single Speed Pump. This quantity should be recorded by the applicant.
hoursday
EDC Data Gathering
Default = 11.4
2
HOUVFD,filter , Hours of operation per day for Variable Frequency Drive Pump on filtration mode. This quantity should be recorded by the applicant.
hoursday
EDC Data Gathering
Default = 10.0
2
HOUVFD,clean , Hours of operation per day for Variable Frequency Drive Pump on cleaning mode. This quantity should be recorded by the applicant.
hoursday
EDC Data Gathering
Default = 2
2
Days , Pool pump days of operation per year. daysyr
122 2
kWSS , Electric demand of single speed pump at a given flow rate. This quantity should be recorded by the applicant or looked up through the horsepower in Table 2-136.
Kilowatts EDC Data Gathering
Default =1.364 kW or See Table 2-136
1 and Table 2-134 or
Table 2-136
kWVFD, filter , Electric demand of variable frequency drive pump during filtration mode. This quantity should be measured and recorded by the applicant.
Kilowatts EDC Data Gathering
Default = 0.25
2
kWVFD, clean , Electric demand of variable frequency drive pump during cleaning mode. This quantity should be measured and recorded by the applicant.
Kilowatts EDC Data Gathering
Default = 0.75
2
HOUpeak,filter , Average daily hours of operation during peak period (between 2pm and 6pm) for Variable Frequency Drive Pump on filtration mode. This quantity should be recorded by the applicant.
hoursday
EDC Data Gathering
Default = 4
4
HOUpeak,clean , Average daily hours of operation during peak period (between 2pm and 6pm) for Variable Frequency Drive Pump on cleaning mode. This quantity should be recorded by the applicant.
hoursday
EDC Data Gathering
Default = 0
4
CFSS , Peak coincident factor of single speed pump from 2 PM to 6 PM in summer weekday. This quantity can be deduced from the pool pump timer settings for the old pump.
Fraction EDC Data Gathering
Default= 0.306
5
CFVFD , Peak coincident factor of VFD pump from 2 PM to 6 PM in summer weekday. This quantity should be inferred from the new timer settings.
Fraction EDC Data Gathering
Average Single Speed Pump Electric Demand
SECTION 2: Residential MeasuresMiscellaneous Page 223
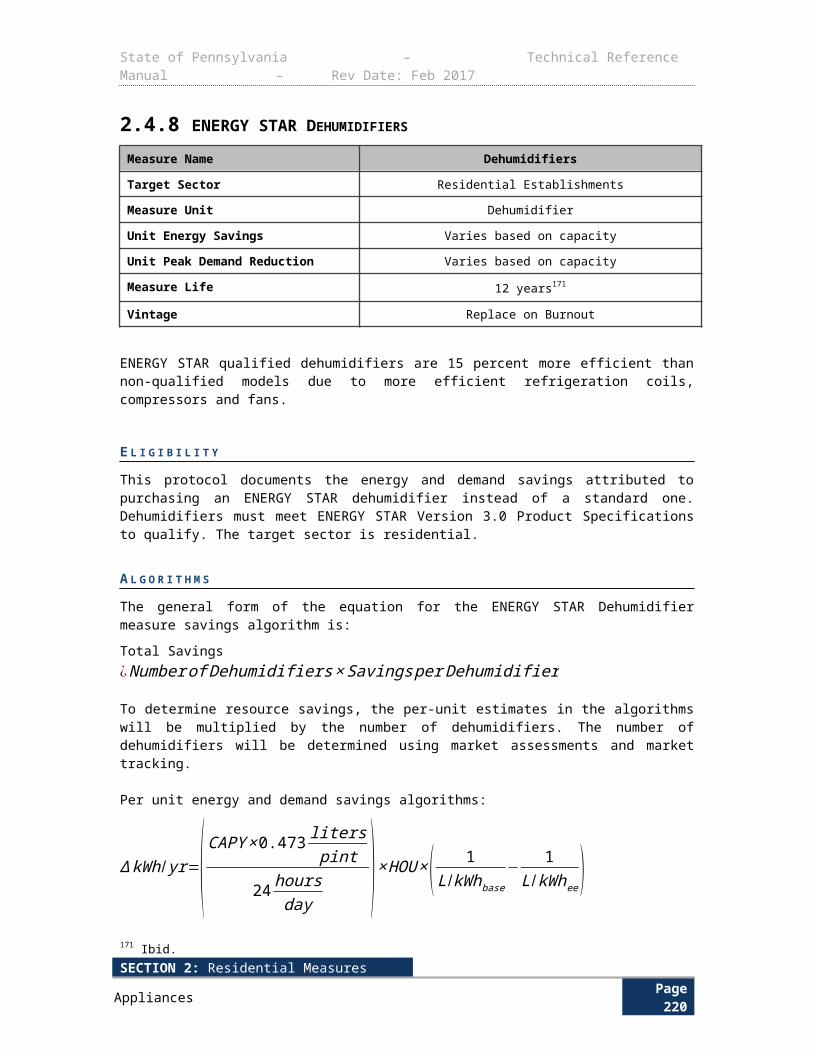
State of Pennsylvania – Technical Reference Manual – Rev Date: Feb 2017
Since this measure involves functional pool pumps, actual measurements of pump demand are encouraged. If this is not possible, then the pool pump power can be inferred from the nameplate horsepower. Table 2-136 shows the average service factor (over-sizing factor), motor efficiency, and electrical power demand per pump size based on California Energy Commission (CEC) appliance database for single speed pool pump234. Note that the power to horsepower ratios appear high because many pumps, in particular those under 2 HP, have high ‘service factors’. The true motor capacity is the product of the nameplate horsepower and the service factor.
Table 2-136: Single Speed Pool Pump Specification235
Pump Horse Power (HP)
Average Pump Service Factor
Average Pump Motor Efficiency
Average Pump Power (kW)
0.50 1.62 0.66 0.946
0.75 1.29 0.65 1.081
1.00 1.28 0.70 1.306
1.50 1.19 0.75 1.512
2.00 1.20 0.78 2.040
2.50 1.11 0.77 2.182
3.00 1.21 0.79 2.666
Electric Demand and Pump Flow RateThe electric demand on a pump is related to pump flow rate, pool hydraulic properties, and the pump motor efficiency. For VFD pumps that have premium efficiency (92%) motors, a regression is used to relate electric demand and pump flow rates using the data from Southern California Edison’s Innovative Designs for Energy Efficiency (InDEE) Program. This regression reflects the hydraulic properties of pools that are retrofitted with VSD pool pumps. The regression is:
Demand (W) = ¿0.0978 f 2+10.989 f +10.281Where f is the pump flow rate in gallons per minute.
This regression can be used if the flow rate is known but the wattage is unknown. However, most VFD pool pumps can display instantaneous flow and power. Power measurements or readings in the final flow configuration are encouraged.
D E F A U L T S A V I N G S
The energy savings and demand reductions are prescriptive according to the above formulae. All other factors held constant, the sole difference between quantifying demand reductions for the VSD Pool Pump and the VSD Pool Pump with Load Shifting measures resides in the value of the parameter CFVFD.
234 Averaged for all listed single-speed pumps in the last available version of the CEC appliance efficiency database. The powers are for 'CEC Curve A' which represents hydraulic properties of 2" PVC pipes rather than older, 1.5" copper pipes.235 DEER Effective Useful Life values, updated 2/5/2014. http://www.deeresources.com/files/DEER2013codeUpdate/download/DEER2014-EUL-table-update_2014-02-05.xlsx
SECTION 2: Residential MeasuresMiscellaneous Page 224
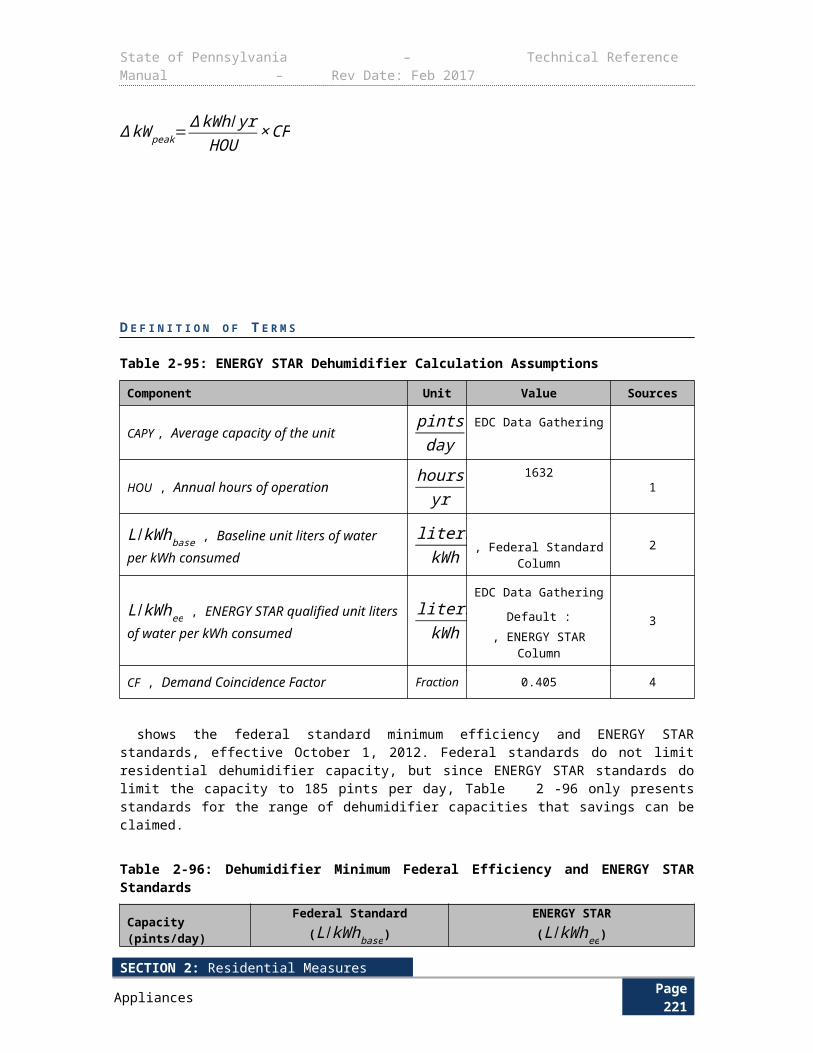
State of Pennsylvania – Technical Reference Manual – Rev Date: Feb 2017
E V A L U A T I O N P R O T O C O L
The most appropriate evaluation protocol for this measure is verification of installation coupled with survey on run time and speed settings. It may be helpful to work with pool service professionals in addition to surveying customers to obtain pump settings, as some customers may not be comfortable operating their pump controls. Working with a pool service professional may enable the evaluator to obtain more data points and more accurate data.
S O U R C E S
1) “CEC Appliances Database – Pool Pumps.” California Energy Commission. Updated Feb 2008. Accessed March 2008. http://www.energy.ca.gov/appliances/database/historical_excel_files/2009-03-01_excel_based_files/Pool_Products/Pool_Pumps.zip
2) ENERGY STAR Pool Pump Calculator. Updated December 2013. kW values are derived from gallons/minute and Energy Factor (gallons/Wh) for each speed. Days of operation are for Pennsylvania (4 months/yr).
3) The default value for HOUVFD,clean is set to zero so that in the absence of multiple VFD mode data the algorithms reduce to those found in the 2014 Pennsylvania TRM (which only have one variable for HOUVFD and kWVFD).
4) The Default values for HOUpeak,filter and HOUpeak,clean are given as 4 and 0, respectively, to collapse the formula to [ kWVFDpeak = kWVFDfilter x CFVFD ] in the absence of the additional necessary data.
5) Derived from Pool Pump and Demand Response Potential, DR 07.01 Report, SCE Design and Engineering, Table 16. Calculated using the average of the 3 regions. The pool pump operating schedule is not weather dependent, but operator dependent. This is noted on page 22, paragraph 2 of the source. http://www.etcc-ca.com/sites/default/files/OLD/images/stories/pdf/ETCC_Report_473.pdf
SECTION 2: Residential MeasuresMiscellaneous Page 225
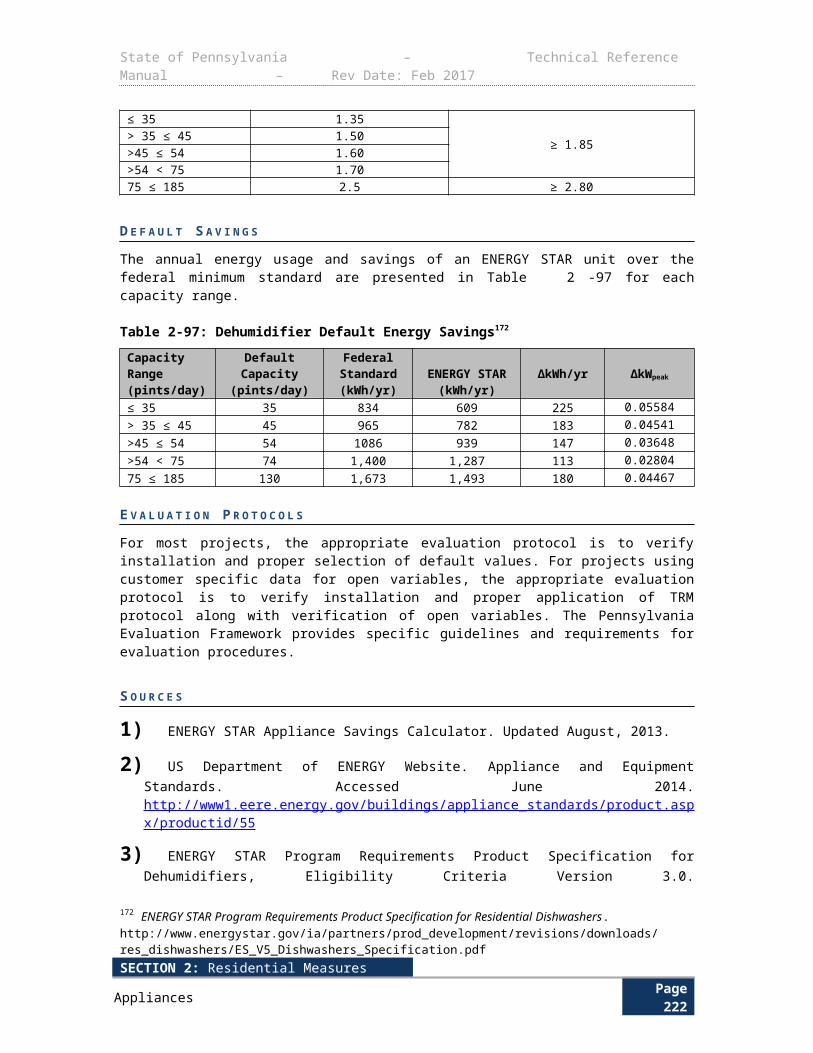
State of Pennsylvania – Technical Reference Manual – Rev Date: Feb 2017
This Page Intentionally Left Blank
2016 TECHNICAL REFERENCE MANUALPage 226
State of Pennsylvania – Technical Reference Manual – Rev Date: Feb 2017
3 COMMERCIAL AND INDUSTRIAL MEASURESThe following section of the TRM contains savings protocols for commercial and industrial measures.
3.1 LIGHTING3.1.1 LIGHTING IMPROVEMENTS
Measure Name Lighting Fixture Improvements
Target Sector Commercial and Industrial Establishments
Measure Unit Lighting Equipment
Unit Energy Savings Variable
Unit Peak Demand Reduction Variable
Measure Life Variable236
Measure Vintage Early Replacement
E L I G I B I L I T Y Lighting improvements include fixture or lamp and ballast replacement in existing commercial and industrial customers’ facilities. Installed and removed lamps and fixtures are broken down into two distinct types based on common load shapes: Screw-based and Other General Service. Screw-based bulbs consist of self-ballasted incandescent, halogen, CFL, and LED bulbs; Other General Service Lighting consists of all other fixture and lamp types, including but not limited to linear fluorescents, metal halides, high intensity discharge lamps, and hardwired CFLs and LEDs.
Note that the Energy Policy Act of 2005 (“EPACT 2005”) and Energy Independence and Security Act (“EISA”) 2007 standards introduced new efficacy standards for linear fluorescent bulbs and ballasts, effectively phasing out magnetic ballasts (effective October 1, 2010) and most T-12 bulbs (effective July 14, 2012). This induces a shift in what a participant would have purchased in the absence of the program because T-12 bulbs on magnetic ballasts are no longer viable options and, therefore, adjusts the baseline assumption. With this understanding, standard T-8s will become the baseline for all T-12 linear fluorescent retrofits beginning June 1, 2016 (PY8). The EISA 2007 standards for general service fluorescent bulbs are provided in Table 3-137. The comparable baseline for any removed standard T-12 fixture will be the T-8 fixture of the same length and lamp count. The comparable baseline for any removed high-output T-12 fixture will be the T-8 fixture of the same length and lamp count with a ballast factor equal to 0.98. The assumed T-8 baseline fixtures and wattages associated with the most common T-12 fixture configurations are presented in
Error: Reference source not found.
236 “CEC Appliances Database – Pool Pumps.” California Energy Commission. Updated Feb 2008. Accessed March 2008. < >
SECTION 2: Residential MeasuresMiscellaneous Page 227
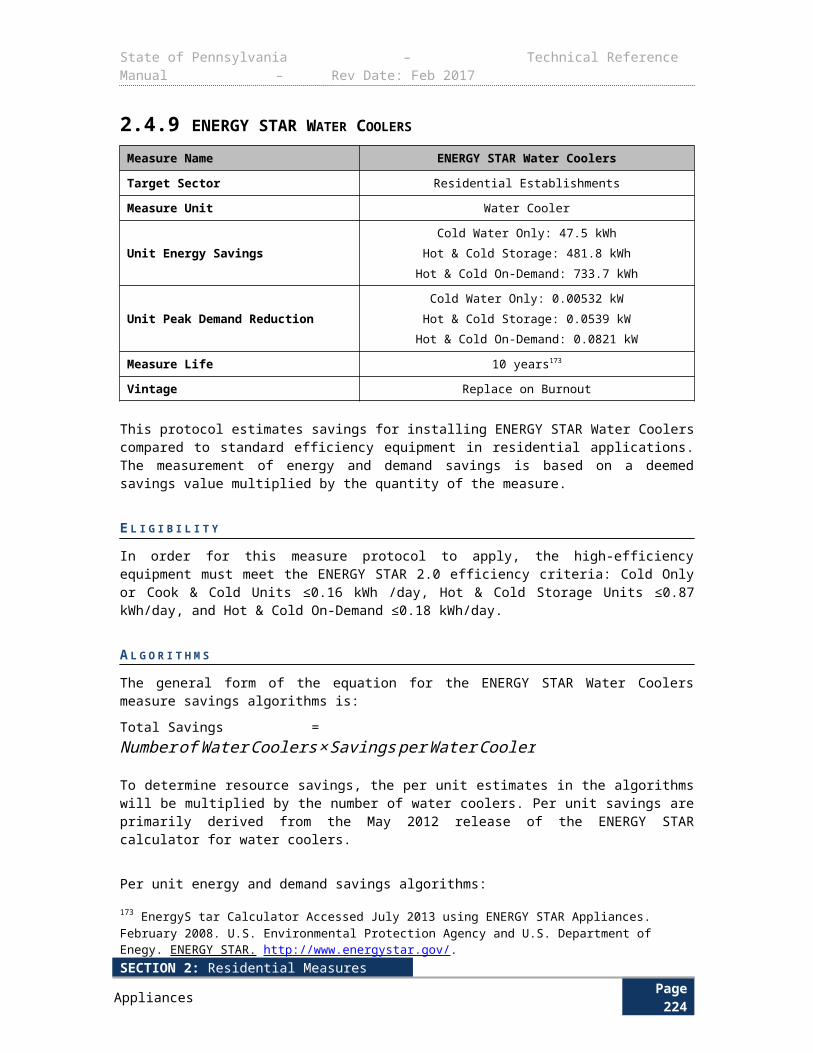
State of Pennsylvania – Technical Reference Manual – Rev Date: Feb 2017
Table 3-137: EISA 2007 Standards for General Service Fluorescent Bulbs237
Lamp Type Nominal Lamp Wattage
Minimum (Color Rendering Index) CRI
Minimum Average Lamp Efficacy
(LPW)
4-foot medium bi-pin>35 W 69 75.0
≤35 W 45 75.0
2-foot U-shaped>35 W 69 68.0
≤35 W 45 64.0
8-foot slimline65 W 69 80.0
≤65 W 45 80.0
8-foot high output>100 W 69 80.0
≤100 W 45 80.0
Table 3-138: Assumed T-8 Baseline Fixtures for Removed T-12 Fixtures
T-12 Lamp Length T-12 Lamp Type T-12 Lamp Count
Assumed T-8 Baseline Fixture
CodeAssumed T-8
Baseline Wattage
24” Standard 1 F21ILL 20
24” Standard 2 F22ILL 33
24” Standard 3 F23ILL 47
24” Standard 4 F24ILL 61
36” Standard 1 F31ILL 26
36” Standard 2 F32ILL 46
36” Standard 3 F33ILL 67
36” Standard 4 F34ILL 87
48” Standard 1 F41ILL 31
48” Standard 2 F42ILL 59
48” Standard 3 F43ILL 89
48” Standard 4 F44ILL 112
48” Standard 6 F46ILL 175
48” Standard 8 F48ILL 224
60” Standard 1 F51ILL 36
60” Standard 2 F52ILL 72
72” Standard 1 F61ILL 55
72” Standard 2 F62ILL 111
96” Standard 1 F81ILL 58
237 Averaged for all listed single-speed pumps in the last available version of the CEC appliance efficiency database. The powers are for 'CEC Curve A' which represents hydraulic properties of 2" PVC pipes rather than older, 1.5" copper pipes.
SECTION 2: Residential MeasuresMiscellaneous Page 228
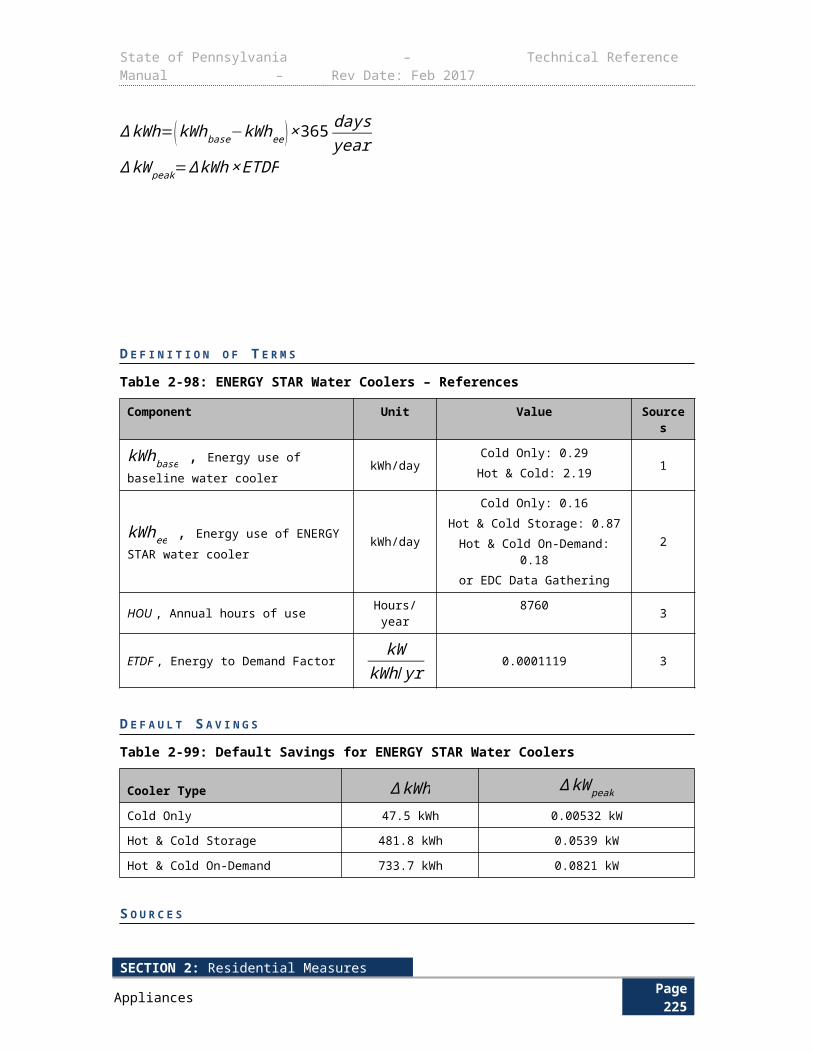
State of Pennsylvania – Technical Reference Manual – Rev Date: Feb 2017
T-12 Lamp Length T-12 Lamp Type T-12 Lamp Count
Assumed T-8 Baseline Fixture
CodeAssumed T-8
Baseline Wattage
96” Standard 2 F82ILL 109
96” Standard 3 F83ILL 167
96” Standard 4 F84ILL 219
96” Standard 6 F86ILL 328
96” High-Output 1 F81LHL 85
96” High-Output 2 F82LHL 160
96” High-Output 3 F83LHL 253
96” High-Output 4 F84LHL 320
96” High-Output 6 F86LHL 506
A L G O R I T H M S
For all lighting fixture improvements (without control improvements), the following algorithms apply:
kWh ¿ (kW base−kW ee )× [HOU × ( 1−SVGbase )× (1+ IFenergy ) ]∆ kW peak ¿ (kW base−kW ee )× [CF× (1−SVGbase )× ( 1+ IF demand) ]
D E F I N I T I O N O F T E R M S
Table 3-139: Variables for Retrofit Lighting
Term Unit Values SourcekW base,Connected load of the baseline lighting as defined by project classification
kWSee Fixture Identities in
Appendix C: Lighting Audit andDesign Tool
Appendix C: LightingAudit and Design Tool
kW ee, Connected load of the post-retrofit or energy–efficient lighting system
kWSee Fixture Identities in
Appendix C: Lighting Audit andDesign Tool
Appendix C: LightingAudit and Design Tool
SVGbase, Savings factor for existing lighting control (percent of time the lights are off)
NoneEDC Data Gathering EDC Data Gathering
Default: See Table 3-140 See Table 3-140
CF , Demand Coincidence Factor Decimal
EDC Data Gathering EDC Data GatheringDefault Screw-based Bulbs:
See Table 3-141Default Other General Service:
See Table 3-142Error: Reference source notfound
See Table 3-141 and Table 3-142
Error: Referencesource not found
HOU , Hours of Use – the average annual operating hours of the baseline lighting equipment, which if applied to full connected load will yield annual energy use.
HoursYear
EDC Data Gathering EDC Data GatheringDefault Screw-based Bulbs:
Table 3-141Default Other General Service:
See Table 3-142Error: Reference source not
See Table 3-141 and Table 3-142
Error: Referencesource not found
SECTION 2: Residential MeasuresMiscellaneous Page 229
State of Pennsylvania – Technical Reference Manual – Rev Date: Feb 2017
Term Unit Values Source
IFenergy, Interactive Energy Factor – applies to C&I interior lighting in space that has air conditioning or refrigeration only. This represents the secondary energy savings in cooling required which results from decreased indoor lighting wattage.
NoneDefault:
See Table 3-144 and Table 3-145
3,8
IFdemand, Interactive Demand Factor – applies to C&I interior lighting in space that has air conditioning or refrigeration only. This represents the secondary demand savings in cooling required which results from decreased indoor lighting wattage.
NoneDefault:
See Table 3-144 and Table 3-145
3,8
Other factors required to calculate savings are shown in Table 3-140, Table 3-141, Table 3-142, Table 3-143, Table 3-144, and Table 3-145. Note that if HOU is stated and verified by logging lighting hours of use groupings, actual hours should be applied. In addition, the site-specific CF must be used to calculate savings if actual hours are used. The IF factors shown in Table 3-144 and Table 3-145 are to be used only when the facilities are air conditioned and only for fixtures in conditioned or refrigerated space. The HOU for refrigerated spaces are to be estimated or logged separately.
Table 3-140: Savings Control Factors Assumptions238
Strategy Definition Technology Savings % SourcesSwitch Manual On/Off Switch Light Switch 0%
1,2,3
Occupancy Adjusting light levels according to the presence of occupants
Occupancy Sensors 24%
Time Clocks 24%Energy Management
System 24%
DaylightingAdjusting light levels
automatically in response to the presence of natural light
Photosensors 28%
Time Clocks 28%
Personal Tuning
Adjusting individual light levels by occupants according to their personal preferences; applies, for example, to private offices, workstation-specific lighting in
open-plan offices, and classrooms
Dimmers 31%
Wireless on-off switches 31%
Bi-level switches 31%Computer based
controls 31%
Pre-set scene selection 31%
Institutional Adjustment of light levels Dimmable ballasts 36%
238 See Appendix A.
SECTION 2: Residential MeasuresMiscellaneous Page 230
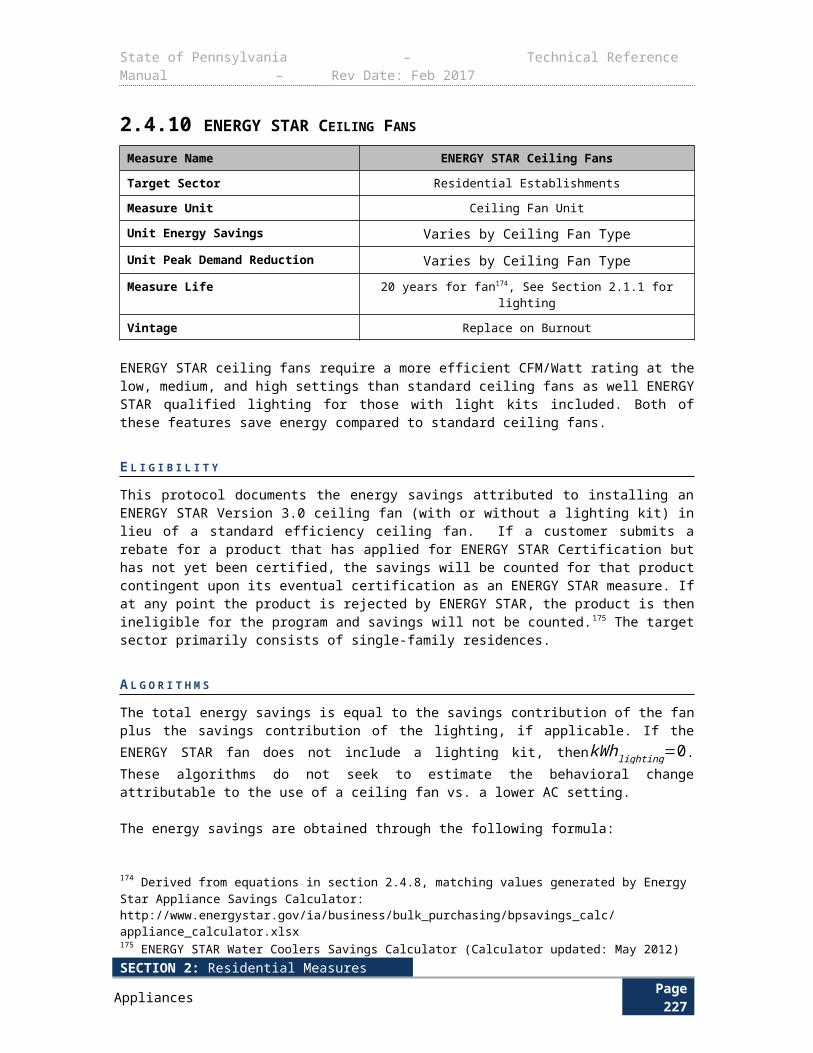
State of Pennsylvania – Technical Reference Manual – Rev Date: Feb 2017
Strategy Definition Technology Savings % Sources
Tuning
through commissioning and technology to meet location specific needs or building
policies; or provision of switches or controls for areas or groups of
occupants; examples of the former include high-end trim
dimming (also known as ballast tuning or reduction of ballast
factor), task tuning and lumen maintenance
On-off or dimmer switches for non-personal tuning
36%
Multiple Types
Includes combination of any of the types described above.
Occupancy and personal tuning, daylighting and occupancy are
most common.
Occupancy and personal tuning/ daylighting and
occupancy
38%
Table 3-141: Lighting HOU and CF by Building Type for Screw-Based Bulbs
Building Type HOU CF Source
Education 2,944 0.39 8
Exterior 3,833 0.00 5
Grocery 7,798 0.99 8
Health 2,476 0.47 8
Industrial Manufacturing – 1 Shift 2,857 0.57 4,6
Industrial Manufacturing – 2 Shift 4,730 0.57 4,6
Industrial Manufacturing – 3 Shift 6,631 0.57 4,6
Institutional/Public Service 1,456 0.23 8
Lodging 2,925 0.38 8
Miscellaneous/Other 2,001 0.33 8
Multi-Family Common Areas 5,950 0.62 16
Office 1,420 0.26 8
Parking Garages 6,552 0.62* 4,7
Restaurant 3,054 0.55 8
Retail 2,383 0.56 8
Street Lighting See Table 3-143 0.00 See Table 3-143
Warehouse 2,815 0.50 8* 0.62 represents the simple average of all coincidence factors listed in the 2012 Mid-Atlantic TRM
Table 3-142: Lighting HOU and CF by Building Type for Other General Service Lighting
Building Type HOU CF Source
Education 2,371 0.45 8
Exterior 3,833 0.00 5
Grocery 6,471 0.93 8
SECTION 2: Residential MeasuresMiscellaneous Page 231
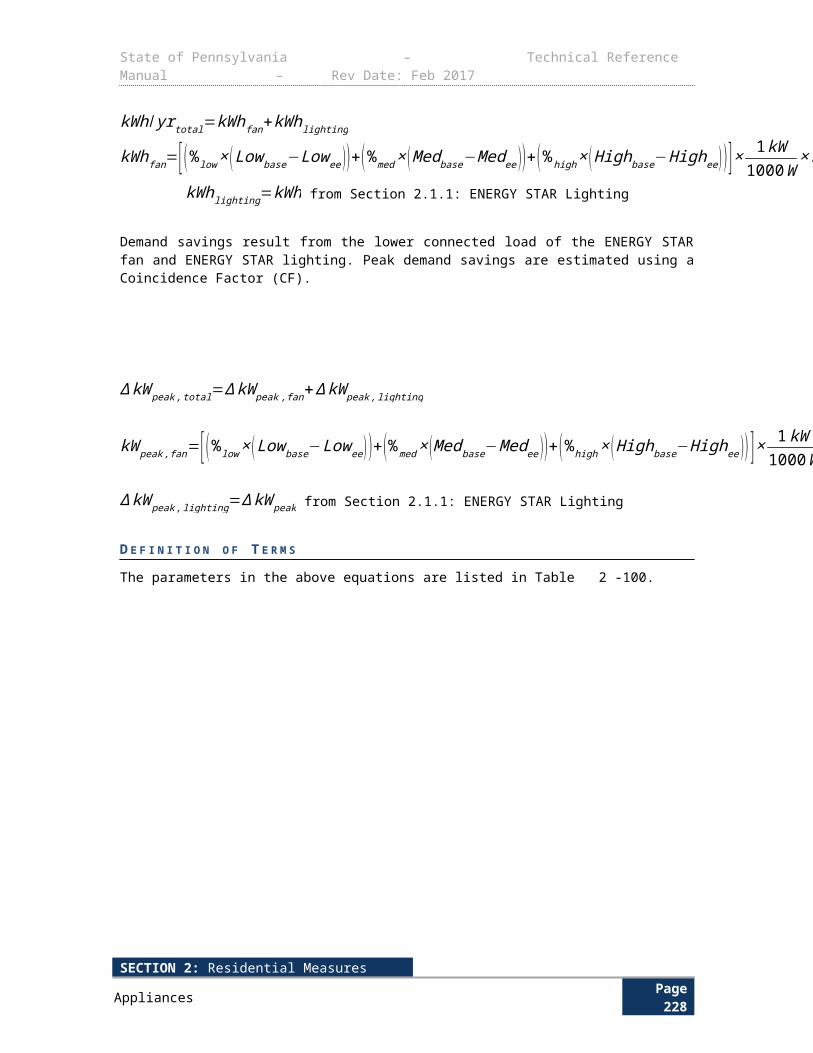
State of Pennsylvania – Technical Reference Manual – Rev Date: Feb 2017
Building Type HOU CF Source
Health 2,943 0.52 8
Industrial/Manufacturing - 1 Shift 2,857 0.57 6
Industrial/Manufacturing - 2 Shift 4,730 0.57 6
Industrial/Manufacturing - 3 Shift 6,631 0.57 6
Institutional/Public Service 1,419 0.23 8
Lodging 3,579 0.45 8
Miscellaneous/Other 2,830 0.58 8
Multi-Family Common Areas 5,950 0.62 16
Office 2,294 0.48 8
Parking Garage 6,552 0.62* 7
Restaurant 4,747 0.77 8
Retail 2,915 0.66 8
Street Lighting See Table 3-143 0.00 See Table 3-143
Warehouse 2,545 0.48 8
* 0.62 represents the simple average of all coincidence factors listed in the 2012 Mid-Atlantic TRM
Table 3-143: Street lighting HOU by EDC
EDC HOU Source
Duquesne 4,200 9
PECO 4,100 10
PPL 4,300 11
Met-Ed 4,200 12
Penelec 4,200 13
Penn Power 4,070 14
West Penn Power 4,200 15
Table 3-144: Interactive Factors for All Bulb Types
Term Unit Values Source
IFdemand None
Comfort Cooled = See Table 3-145 8
Freezer spaces (-35 °F – 20 °F) = 0.50
3
Medium-temperature refrigerated spaces (20 °F – 40 °F) = 0.29
High-temperature refrigerated spaces (40 °F – 60 °F) = 0.18
Un-cooled space = 0
IFenergy NoneComfort Cooled = See Table 3-145 8
Freezer spaces (-35 °F – 20 °F) = 0.50 3
SECTION 2: Residential MeasuresMiscellaneous Page 232

State of Pennsylvania – Technical Reference Manual – Rev Date: Feb 2017
Term Unit Values SourceMedium-temperature refrigerated spaces (20 °F – 40
°F) = 0.29High-temperature refrigerated spaces (40 °F – 60 °F)
= 0.18
Un-cooled space = 0
Table 3-145: Interactive Factors for Comfort Cooled Spaces for All Building Types
Heating Fuel IFenergy IFdemand
Non-Electric Heat 0.031 0.192
Electric Heat -0.142 0.192
Unknown 0.000 0.192
D E F A U L T S A V I N G S
There are no default savings associated with this measure.
E V A L U A T I O N P R O T O C O L S
Methods for Determining Baseline ConditionsThe following are acceptable methods for determining baseline conditions when verification by direct inspection is not possible as may occur in a rebate program where customers submit an application and equipment receipts only after installing efficient lighting equipment, or for a retroactive project as allowed by Act 129. In order of preference:
Examination of replaced lighting equipment that is still on site waiting to be recycled or otherwise disposed of
Examination of replacement lamp and ballast inventories where the customer has replacement equipment for the retrofitted fixtures in stock. The inventory must be under the control of the customer or customer’s agent
Interviews with and written statements from customers, facility managers, building engineers or others with firsthand knowledge about purchasing and operating practices at the affected site(s) identifying the lamp and ballast configuration(s) of the baseline condition
Interviews with and written statements from the project’s lighting contractor or the customer’s project coordinator identifying the lamp and ballast configuration(s) of the baseline equipment
Detailed Inventory FormA detailed lighting inventory is required for all lighting improvement projects. The lighting inventory form will use the algorithms presented above to derive the total ΔkW and ΔkWh savings for each installed measure. Within a single project, to the extent there are multiple combinations of control strategies (SVG), hours of use (HOU), coincidence factors (CF) or interactive factors (IF), the ∆ kW will be broken out to account for these different factors. This will be accomplished using Appendix C: Lighting Audit and Design Tool, a Microsoft Excel inventory form that specifies the lamp and ballast configuration using the “Fixture Identities” sheet and SVG, HOU, CF and IF values for each line entry. The inventory form will also specify the location and number of fixtures for reference and validation.
Appendix C: Lighting Audit and Design Tool was developed to automate the calculation of energy and demand impacts for retrofit lighting projects, based on a series of entries by the user defining
SECTION 2: Residential MeasuresMiscellaneous Page 233
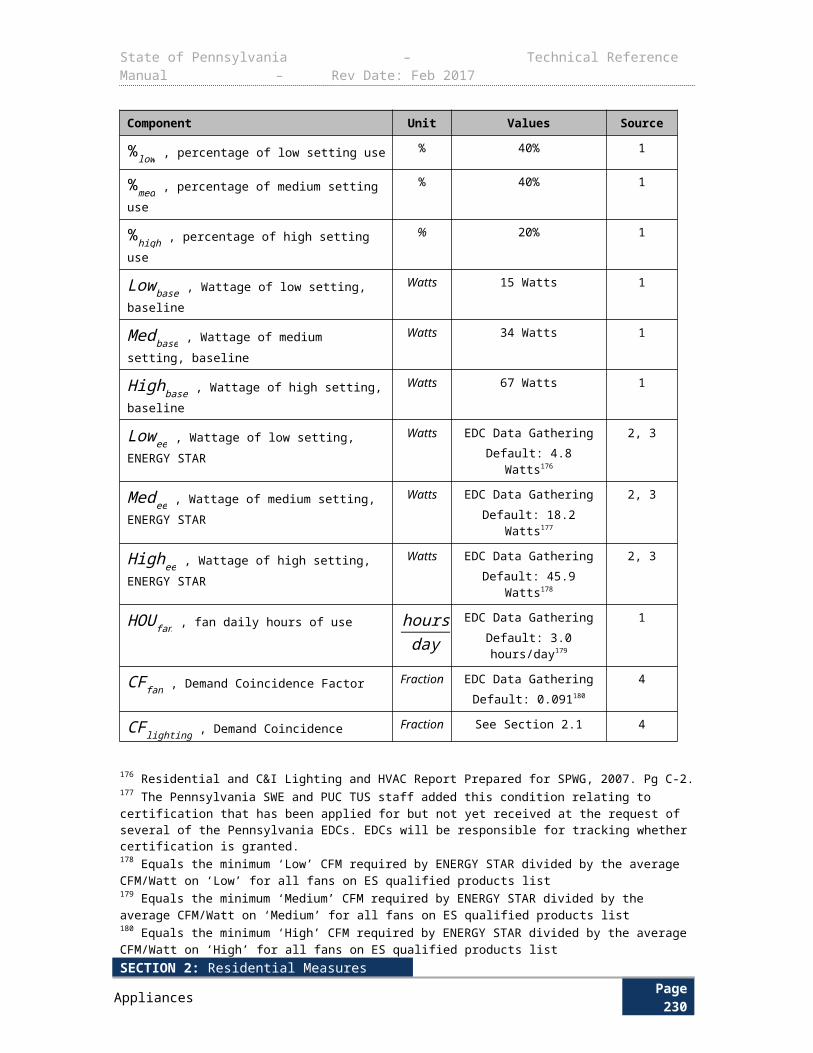
State of Pennsylvania – Technical Reference Manual – Rev Date: Feb 2017
key characteristics of the retrofit project. The "General Information" sheet is provided for the user to identify facility-specific details of the project that have an effect on the calculation of gross savings. Facility-specific details include contact information, electric utility, building area information, and operating schedule. The "Lighting Inventory" sheet is the main worksheet that calculates energy savings and peak demand reduction for the user-specified lighting fixture and controls improvements. This form follows the algorithms presented above and facilitates the calculation of gross savings for implementation and evaluation purposes. Each line item on this tab represents a specific area with common baseline fixtures, retrofit fixtures, controls strategy, space cooling, and space usage.
Baseline and retrofit fixture wattages are determined by selecting the appropriate fixture code from the “Fixture Identities” sheet. The sheet can also be used to find the appropriate code for a particular lamp-ballast combination by using the enabled auto-filter options. Actual wattages of fixtures determined by manufacturer’s equipment specification sheets or other independent sources may not be used unless (1) the manufacturer's cut sheet indicates that the difference in delta-watts of fixture wattages (i.e. difference in delta watts of baseline and “actual” installed efficient fixture wattage and delta watts of baseline and nearest matching efficient fixture in the “Fixture Identities” of Appendix C: Lighting Audit and Design Tool is more than 10%239 or (2) the corresponding fixture code is not listed in the “Fixture Identities” list. In these cases, alternate wattages for lamp-ballast combinations can be inputted using the appropriate cells within the “Fixture Identities” tab. Rows 9 through 18 provide a guided custom LED fixture generator to be used with non-self-ballasted LEDs. All other custom cut sheets should be inputted into rows 922 through 971. Documentation supporting the alternate wattages must be provided in the form of manufacturer-provided specification sheets or other industry accepted sources (e.g. ENERGY STAR listing, Design Lights Consortium listing, etc). Submitted specification sheets must cite test data performed under standard ANSI procedures. These exceptions will be used as the basis for periodically updating the “Fixture Identities” to better reflect market conditions and more accurately represent savings.
Some lighting contractors may have developed in-house lighting inventory forms that are used to determine preliminary estimates of projects. In order to ensure standardization of all lighting projects, Appendix C: Lighting Audit and Design Tool must still be used. However, if a third-party lighting inventory form is provided, entries to Appendix C: Lighting Audit and Design Tool may be condensed into groups sharing common baseline fixtures, retrofit fixtures, space type, building type, and controls. Whereas Appendix C: Lighting Audit and Design Tool separates fixtures by location to facilitate evaluation and audit activities, third-party forms can serve that specific function if provided.
Appendix C: Lighting Audit and Design Tool will be updated periodically to include new fixtures and technologies available as may be appropriate. Additional guidance can be found in the “Manual” sheet of Appendix C: Lighting Audit and Design Tool.
Custom Hours of Use and Coincidence FactorsIf the project cannot be described by the building type categories listed in Table 3-141 and Table3-142, or if the facility’s actual lighting hours deviate by more than 10% from the tables, or if the project retrofitted only a portion of a facility’s lighting system for which whole building hours of use would not be appropriate, the deemed HOU and CF assumptions can be overridden by inputting custom operating schedules into the Lighting Operation Schedule portion of the “General Information” tab of Appendix C: Lighting Audit and Design Tool. The custom schedule inputs must be corroborated by an acceptable source such as posted hours, customer interviews, building monitoring system (BMS), or metered data.
For all projects, annual hours are subject to adjustment by EDC evaluators or SWE.
239 EISA 2007. http://www.gpo.gov/fdsys/pkg/BILLS-110hr6enr/pdf/BILLS-110hr6enr.pdf
SECTION 2: Residential MeasuresMiscellaneous Page 234
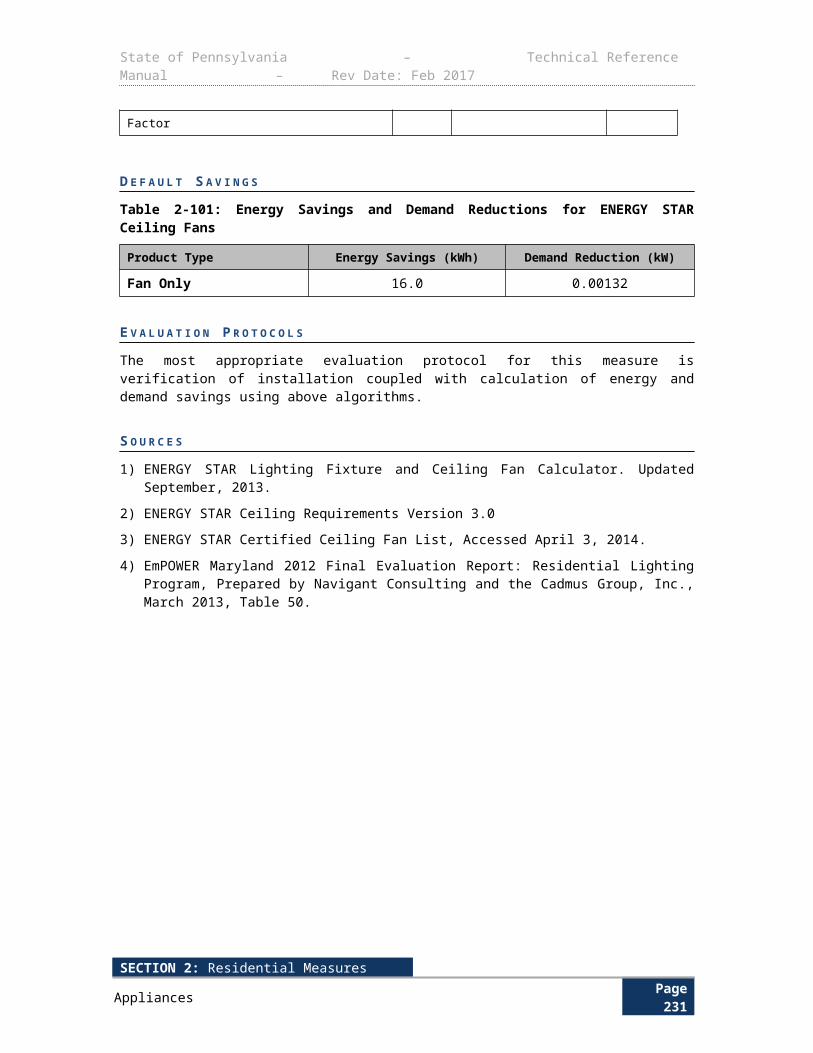
State of Pennsylvania – Technical Reference Manual – Rev Date: Feb 2017
Metering240
Projects with savings below 750,000 kWh Metering is encouraged for projects with expected savings below 750,000 kWh but have high uncertainty, i.e. where hours are unknown, variable, or difficult to verify. Exact conditions of “high uncertainty” are to be determined by the EDC evaluation contractors to appropriately manage variance. Metering completed by the implementation contractor maybe leveraged by the evaluation contractor, subject to a reasonableness review. Sampling methodologies within a site are to be either discerned by the EDC evaluation contractor based on the characteristics of the facility in question or performed consistent with guidance the EDC EM&V contractor provides.
Projects with savings of 750,000 kWh or higher For projects with expected savings of 750,000 kWh or higher, metering is required241. Installation of light loggers is the accepted method of metering, but trend data from BMS is an acceptable substitute. Metering completed by the implementation contractor may be leveraged by the evaluation contractor, subject to a reasonableness review. Sampling methodologies within a site are to be either discerned by the EDC evaluation contractor or communicated to implementation contractors based on the characteristics of the facility in question or performed consistent with guidance the EDC EM&V contractor provides.
When BMS data is used as a method of obtaining customer-specific data in lieu of metering, the following guidelines should be followed:
Care should be taken with respect to BMS data, since the programmed schedule may not reflect regular hours of long unscheduled overrides of the lighting system, such as nightly cleaning in office buildings, and may not reflect how the lights were actually used, but only the times of day the common area lighting is commanded on and off by the BMS.
The BMS trends should represent the actual status of the lights (not just the command sent to the lights), and the ICSP and EC are required to demonstrate that the BMS system is functioning as expected, prior to relying on the data for evaluation purposes.
The BMS data utilized should be specific to the lighting systems, and should be required to be representative of the building areas included in the lighting project.
S O U R C E S 1) Williams, A., Atkinson, B., Garbesi, K., Rubinstein, F., “A Meta-Analysis of Energy Savings
from Lighting Controls in Commercial Buildings”, Lawrence Berkeley National Laboratory, September 2011. http://eetd.lbl.gov/sites/all/files/a_meta-analysis_of_energy_savings_from_lighting_controls_in_commercial_buildings_lbnl-5095e.pdf
2) Goldberg et al, State of Wisconsin Public Service Commission of Wisconsin, Focus on Energy Evaluation, Business Programs, Incremental Cost Study, KEMA, October 28, 2009. https://focusonenergy.com/sites/default/files/bpincrementalcoststudyfinal_evaluationreport.pdf
3) 2011 Efficiency Vermont TRM
4) The Mid-Atlantic TRM – Northeast Energy Efficiency Partnerships, Mid-Atlantic Technical Reference Manual, Version 2.0, submitted by Vermont Energy Investment Corporation, July, 2011.
a. Development of Interior Lighting Hours of Use and Coincidence Factor Values for EmPOWER Maryland Commercial Lighting Program Evaluations, Itron, 2010.
b. California Public Utility Commission. Database for Energy Efficiency Resources, 2008
240 Subject to verification by EDC Evaluation or SWE241 This value was agreed upon by the Technical Working Group convened to discuss updates to the TRM. This value is subject to adjustment based on implementation feedback during Phase III.
SECTION 2: Residential MeasuresMiscellaneous Page 235
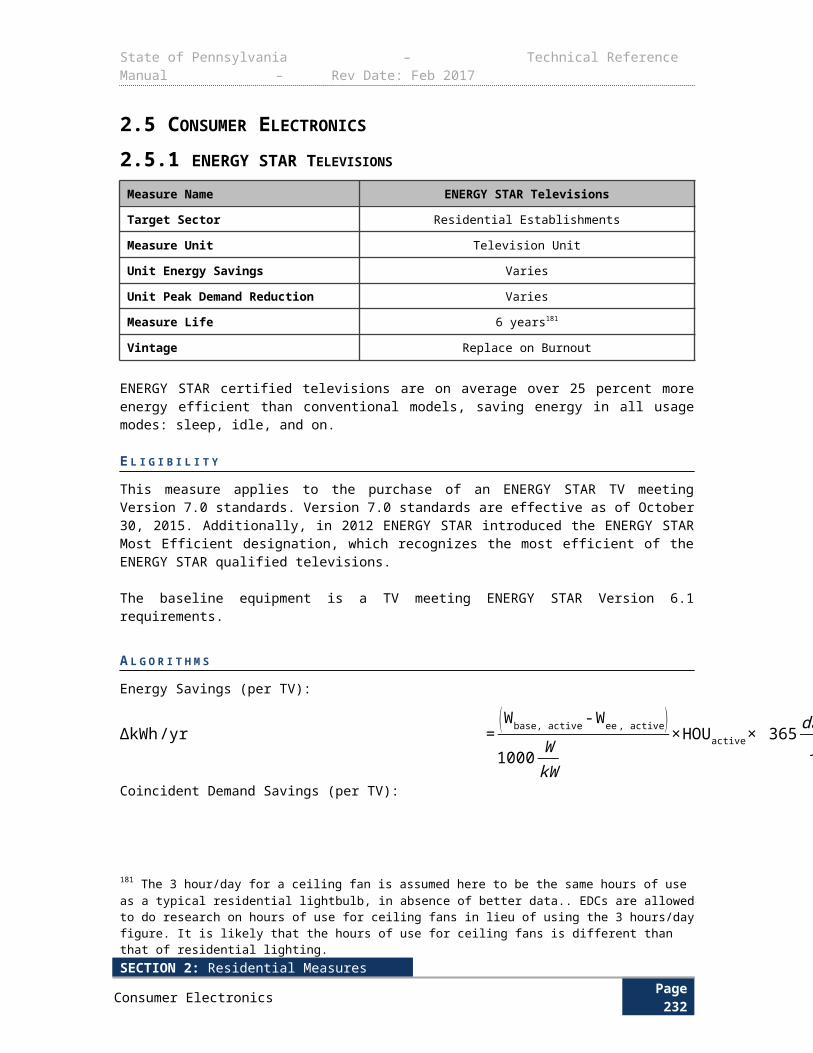
State of Pennsylvania – Technical Reference Manual – Rev Date: Feb 2017
c. Small Commercial Contract Group Direct Impact Evaluation Report prepared by Itron for the California Public Utilities Commission Energy Division, February 9, 2010
5) State of Ohio Energy Efficiency Technical Reference Manual, Vermont Energy Investment Corporation, August 6, 2010.
6) UI and CL&P Program Savings Documentation for 2013 Program Year, United Illuminating Company, September 2012.
7) CL&P and UI 2008 program documentation (referenced above) cites an estimated 4,368 hours, only 68 hours greater than dusk to down operating hours. ESNA RP-20-98; Lighting for Parking Facilities acknowledges "Garages usually require supplemental daytime luminance in above-ground facilities, and full day and night lighting for underground facilities." Emphasis added. The adopted assumption of 6,552 increases the CL&P and UI value by 50% (suggest data logging to document greater hours i.e., 8760 hours per year).
8) Pennsylvania Statewide Act 129 2014 Commercial & Residential Lighting Metering Study. Prepared for Pennsylvania Public Utilities Commission. January 13, 2015. http://www.puc.pa.gov/pcdocs/1340978.pdf
9) Duquesne Light Schedule of Rates, Page 74, Released November 20, 2014.https://www.duquesnelight.com/DLdocs/shared/ManageMyAccount/understandingMyBill-Rates/tariffHistory/Tariff24_104.pdf
10) PECO Energy Company Electric Service Tariff, Page 70, Released December 19, 2014.https://www.peco.com/CustomerService/RatesandPricing/RateInformation/Documents/PDF/New%20Electric%20Tariff/Current%20Electric%20Tariff/Current%20Electric%20Tariff%20-%20January%201,%202015.pdf
11) PPL Electric Utilities General Tariff, Page 153, Released December 22, 2014.https://www.pplelectric.com/~/media/pplelectric/at%20your%20service/docs/current-electric-tariff/master.pdf
12) Metropolitan Edison Company Electric Service Tariff, Page 121, Released December 19, 2014.https://firstenergycorp.com/content/dam/customer/Customer%20Choice/Files/PA/tariffs/Met-Ed-Tariff-51-with-Supp-70.pdf
13) Pennsylvania Electric Company Electric Service Tariff, Page 128, Released December 19, 2014.https://firstenergycorp.com/content/dam/customer/Customer%20Choice/Files/PA/tariffs/Penelec-Tariff-80-with-Supp-71.pdf
14) Pennsylvania Power Company Schedule of Rates, Rules and Regulations for Electric Service, Page 82, Released December 19, 2014.https://firstenergycorp.com/content/dam/customer/Customer%20Choice/Files/PA/tariffs/PP-Tariff-with-Supp-123.pdf
15) West Penn Power Company Tariff, Page 144, Released December 19, 2014.https://firstenergycorp.com/content/dam/customer/Customer%20Choice/Files/PA/tariffs/WPP-Tariff-39-with-Supp-247.pdf
16) Illinois Energy Efficiency Technical Reference Manual, Vermont Energy Investment Corporation, 2012. Multi-family common area value based on Focus on Energy Evaluation, ACES Deemed Savings Desk Review, November 2010.
17)
SECTION 2: Residential MeasuresMiscellaneous Page 236
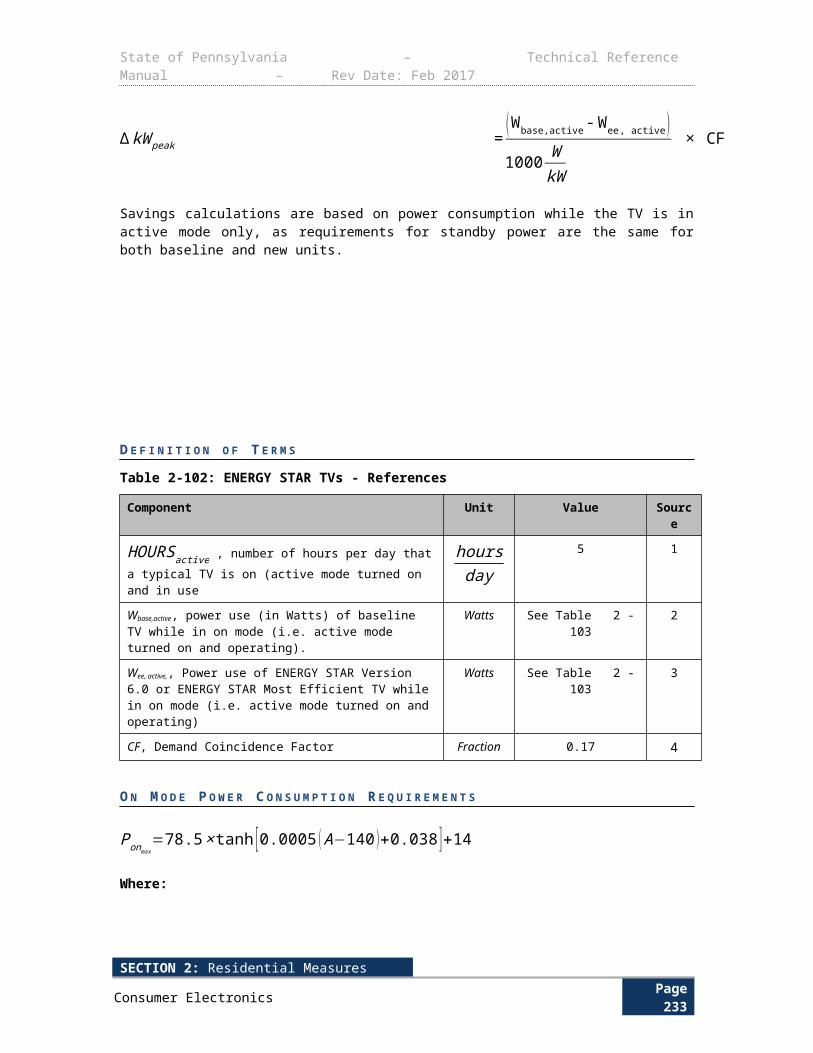
State of Pennsylvania – Technical Reference Manual – Rev Date: Feb 2017
3.1.2 NEW CONSTRUCTION LIGHTING
Measure Name New Construction Lighting
Target Sector Commercial and Industrial Establishments
Measure Unit Lighting Equipment
Unit Energy Savings Variable
Unit Peak Demand Reduction Variable
Measure Life 15 years242
Measure Vintage New Construction
New Construction incentives are intended to encourage decision-makers in new construction projects to incorporate greater energy efficiency into their building design and construction practices that will result in a permanent reduction in electrical (kWh) usage above baseline practices.
E L I G I B I L I T Y R E Q U I R E M E N T S
New construction applies to new building projects wherein no structure or site footprint presently exists, addition or expansion of an existing building or site footprint, or major tenant improvements that change the use of the space. Eligible lighting equipment and fixture/lamp types include fluorescent fixtures (lamps and ballasts), compact fluorescent lamps, high intensity discharge (HID) lamps, interior and exterior LED lamps and fixtures, cold-cathode fluorescent lamps (CCFL), induction lamps, and lighting controls.
The baseline demand (kW base ) for calculating savings is determined using one of the two methods detailed in ASHRAE 90.1-2007. The interior lighting baseline is calculated using the more conservative of the Building Area Method243 as shown in Table 3-147 or the Space-by-Space Method244 as shown in Table 3-148. For exterior lighting, the baseline is calculated using the Baseline Exterior Lighting Power Densities245 as shown in Table 3-149. The post-installation demand is calculated based on the installed fixtures using the “Fixture Identities” sheet in Appendix C: Lighting Audit and Design Tool.
A L G O R I T H M S
For all new construction projects analyzed using the ASHRAE 90.1-2007 Building Area Method, the following algorithms apply:
kWh ¿ (kW base−kW ee )× [HOU ×(1−SVGbase)× (1+ IFenergy ) ]∆ kW peak ¿ (kW base−kW ee )× [CF× (1−SVGbase )× ( 1+ IF demand) ]
242 The exact variables that should be determined using metering are shown in Table 3-151 of the 2015 TRM. 243 The Commission allows the EDCs to use alternative methods for obtaining customer-sepcific data where customer processes do not support metering. The EDCs are required to provide supporting documentation to the SWE for review if there are any such exceptions. 244 Measure Life Study, prepared for the Massachusetts Joint Utilities by ERS. October, 10, 2005. http://rtf.nwcouncil.org/subcommittees/nonreslighting/Measure%20Life%20Study_MA%20Joint%20Utilities_2005_ERS-1.pdf 245 ASHRAE 90.1-2007, Table 9.5.1 – Building Area Method. https://law.resource.org/pub/us/code/ibr/ashrae.90.1.2007.pdf
SECTION 2: Residential MeasuresMiscellaneous Page 237
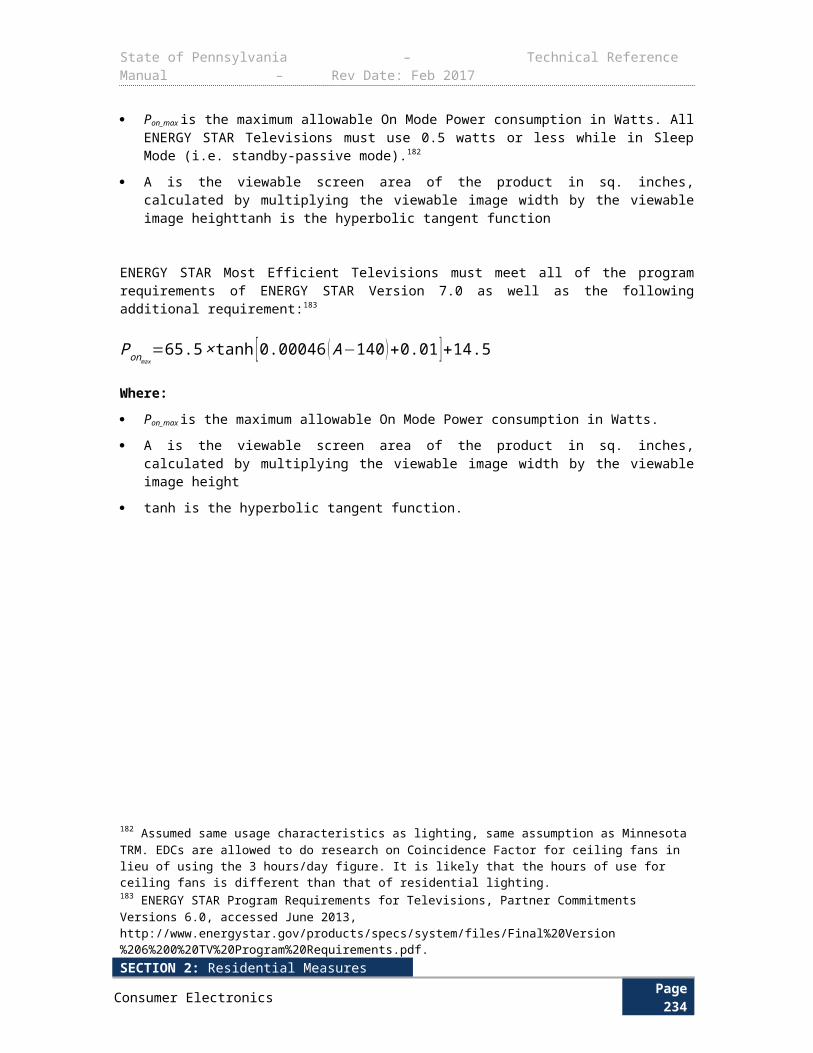
State of Pennsylvania – Technical Reference Manual – Rev Date: Feb 2017
For all new construction projects analyzed using the AHRAE 90.1-2007 Space-by-Space Method, the following algorithms apply:
kWh ¿∑i=1
n
∆kWh1+∆ kWh2+…∆ kWhn
∆ kW peak ¿∑i=1
n
∆kW p1+∆kW p2+…∆kW pn
Where n is the number of spaces and:
∆ kWh1 ¿ (kW base ,1−kW ee , 1)× [HOU 1×(1−SVGbase1)× (1+ IFenergy , 1 ) ]∆ kW p1 ¿ (kW base ,1−kW ee , 1)× [CF1× (1−SVGbase1 )× ( 1+ IF demand, 1 ) ]
D E F I N I T I O N O F T E R M S
Table 3-146: Variables for New Construction Lighting
Term Unit Values Source
kW base, The baseline space or building connected load as calculated by multiplying the space or building area by the appropriate Lighting Power Density (LPD) values specified in either Table 3-147 or Table 3-148
kW Calculated based on space or building type and size. Calculated Value
kW ee, The calculated connected load of the energy efficient lighting
kW
Calculated based on specifications of installed
equipment using Appendix C:Lighting Audit and Design Tool
Calculated Value
SVGbase, Baseline savings factor in accordance with code-required lighting controls (percent of time the lights are off)
NoneBased on Code EDC Data
Gathering
Default: See Table 3-150 1
CF , Demand Coincidence Factor Decimal
Based on Metering246 EDC Data Gathering
Default Screw-based Bulbs: See Table 3-141
Default Other General Service:See Table 3-142
See Table 3-141 and Table 3-142
HOU , Hours of Use – the average annual operating hours of the facility
Based on Metering247 EDC Data Gathering
246 ASHRAE 90.1-2007, Table 9.6.1 – Space-by-Space Method. https://law.resource.org/pub/us/code/ibr/ashrae.90.1.2007.pdf 247 ASHRAE 90.1-2007, Table 9.4.5 – Baseline Exterior Lighting Power Densities. https://law.resource.org/pub/us/code/ibr/ashrae.90.1.2007.pdf
SECTION 2: Residential MeasuresMiscellaneous Page 238
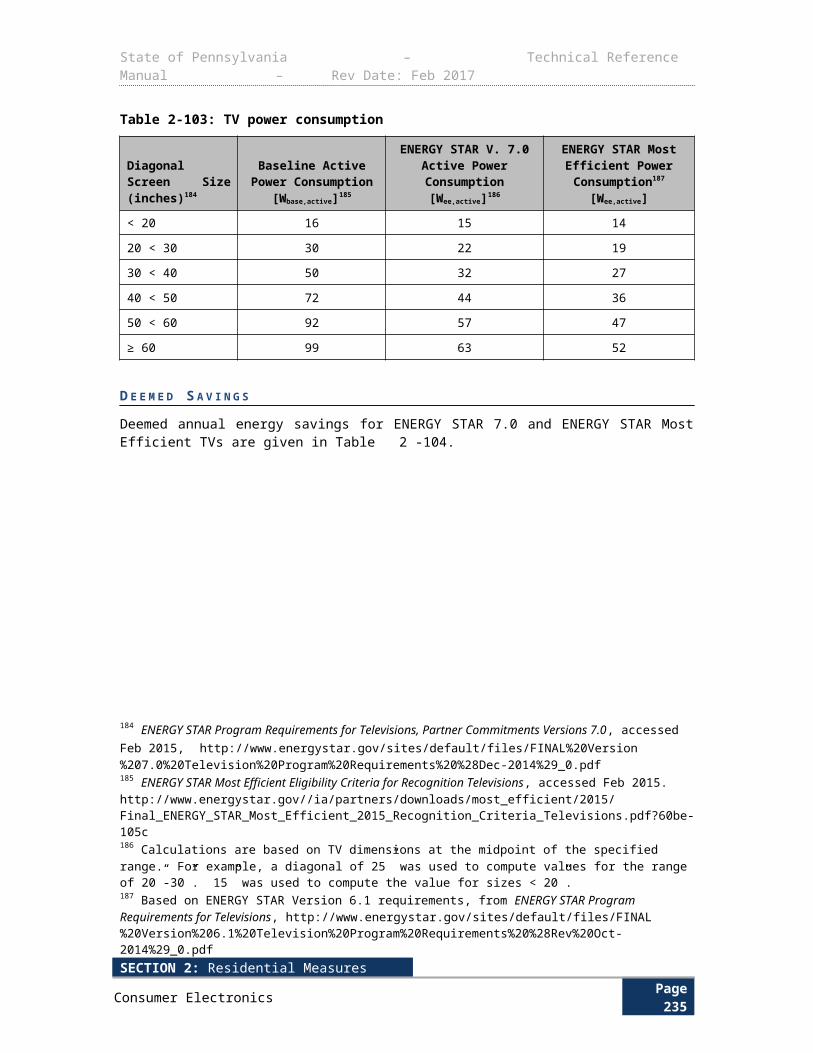
State of Pennsylvania – Technical Reference Manual – Rev Date: Feb 2017
Term Unit Values Source
HoursYear
Default Screw-based Bulbs: See Table 3-141
Default Other General Service:See Table 3-142
See Table 3-141 and Table 3-142
IF, Interactive Factor None Vary based on building type and space cooling details.
See Table 3-144 and Table 3-145
Table 3-147: Lighting Power Densities from ASHRAE 90.1-2007 Building Area Method248
Building Area Type249LPD
(W/ft2) Building Area TypeLPD
(W/ft2)
Automotive facility 0.9 Multifamily 0.7
Convention center 1.2 Museum 1.1
Courthouse 1.2 Office 1.0
Dining: bar lounge/leisure 1.3 Parking garage 0.3
Dining: cafeteria/fast food 1.4 Penitentiary 1.0
Dining: family 1.6 Performing arts theater 1.6
Dormitory 1.0 Police/fire station 1.0
Exercise center 1.0 Post office 1.1
Gymnasium 1.1 Religious building 1.3
Health-care clinic 1.0 Retail 1.5
Hospital 1.2 School/university 1.2
Hotel 1.0 Sports arena 1.1
Library 1.3 Town hall 1.1
Manufacturing facility 1.3 Transportation 1.0
Motel 1.0 Warehouse 0.8
Motion picture theater 1.2 Workshop 1.4
248 It is noted that if site-specific data is used to determine HOU, then the same data must be used to determine the site-specific CF. Similarly, if the default TRM HOU is used, then the default TRM CF must also be used in the savings calculations.249 Ibid.
SECTION 2: Residential MeasuresMiscellaneous Page 239
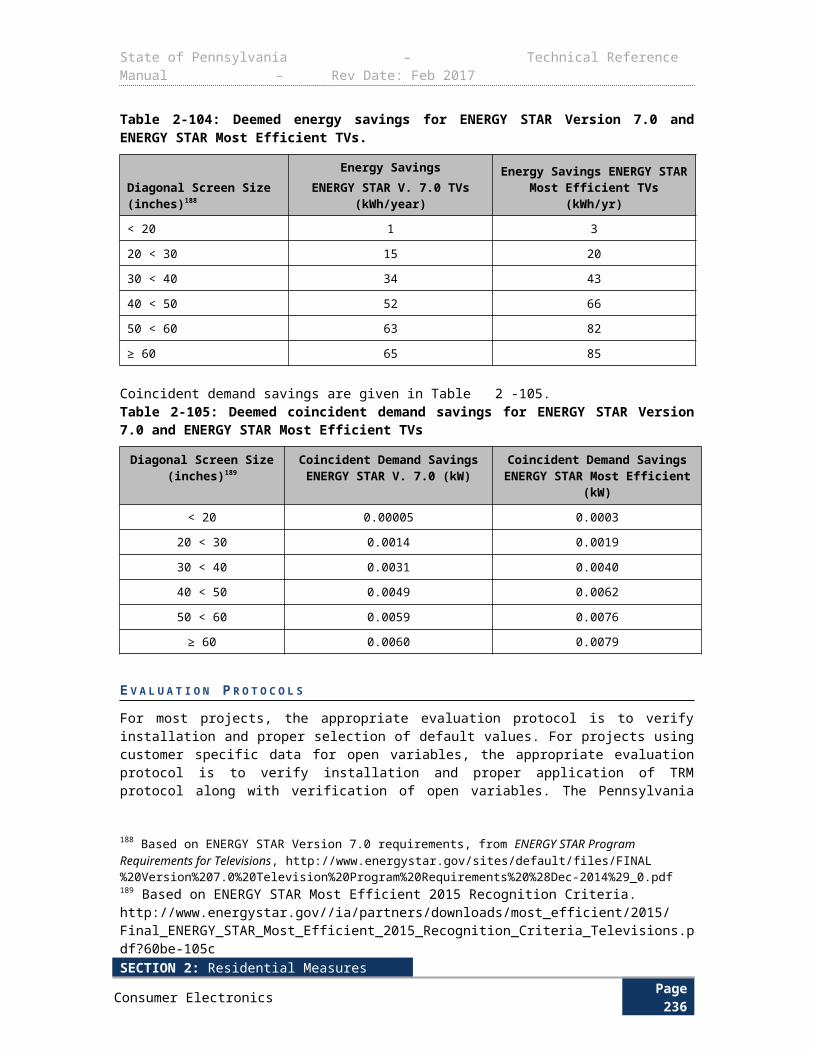
State of Pennsylvania – Technical Reference Manual – Rev Date: Feb 2017
Table 3-148: Lighting Power Densities from ASHRAE 90.1-2007 Space-by-Space Method250
250 ASHRAE 90.1-2007, “Table 9.5.1 Lighting Power Densities Using the Building Area Method.” https://law.resource.org/pub/us/code/ibr/ashrae.90.1.2007.pdf
SECTION 2: Residential MeasuresMiscellaneous Page 240
State of Pennsylvania – Technical Reference Manual – Rev Date: Feb 2017
Common Space Type251 LPD (W/ft2) Building Specific Space Types LPD (W/ft2)
Office-Enclosed 1.1 Gymnasium/Exercise Center
Office-Open Plan 1.1 Playing Area 1.4
Conference/Meeting/Multipurpose
1.3 Exercise Area 0.9
Classroom/Lecture/Training 1.4 Courthouse/Police Station/Penitentiary
For Penitentiary 1.3 Courtroom 1.9
Lobby 1.3 Confinement Cells 0.9
For Hotel 1.1 Judges Chambers 1.3
For Performing Arts Theater
3.3 Fire Stations
For Motion Picture Theater 1.1
Fire Station Engine Room 0.8
Audience/Seating Area 0.9 Sleeping Quarters 0.3
For Gymnasium 0.4 Post Office-Sorting Area 1.2
For Exercise Center 0.3 Convention Center-Exhibit Space 1.3
For Convention Center 0.7 Library
For Penitentiary 0.7 Card File and Cataloging 1.1
For Religious Buildings 1.7 Stacks 1.7
For Sports Arena 0.4 Reading Area 1.2
For Performing Arts Theater
2.6 Hospital
For Motion Picture Theater 1.2 Emergency 2.7
For Transportation 0.5 Recovery 0.8
Atrium—First Three Floors 0.6 Nurse Station 1.0
Atrium—Each Additional Floor 0.2 Exam/Treatment 1.5
Lounge/Recreation 1.2 Pharmacy 1.2
For Hospital 0.8 Patient Room 0.7
Dining Area 0.9 Operating Room 2.2
For Penitentiary 1.3 Nursery 0.6
For Hotel 1.3 Medical Supply 1.4
For Motel 1.2 Physical Therapy 0.9
For Bar Lounge/Leisure Dining
1.4 Radiology 0.4
For Family Dining 2.1 Laundry—Washing 0.6
Food Preparation 1.2 Automotive—Service/Repair 0.7
Laboratory 1.4 Manufacturing
SECTION 2: Residential MeasuresMiscellaneous Page 241
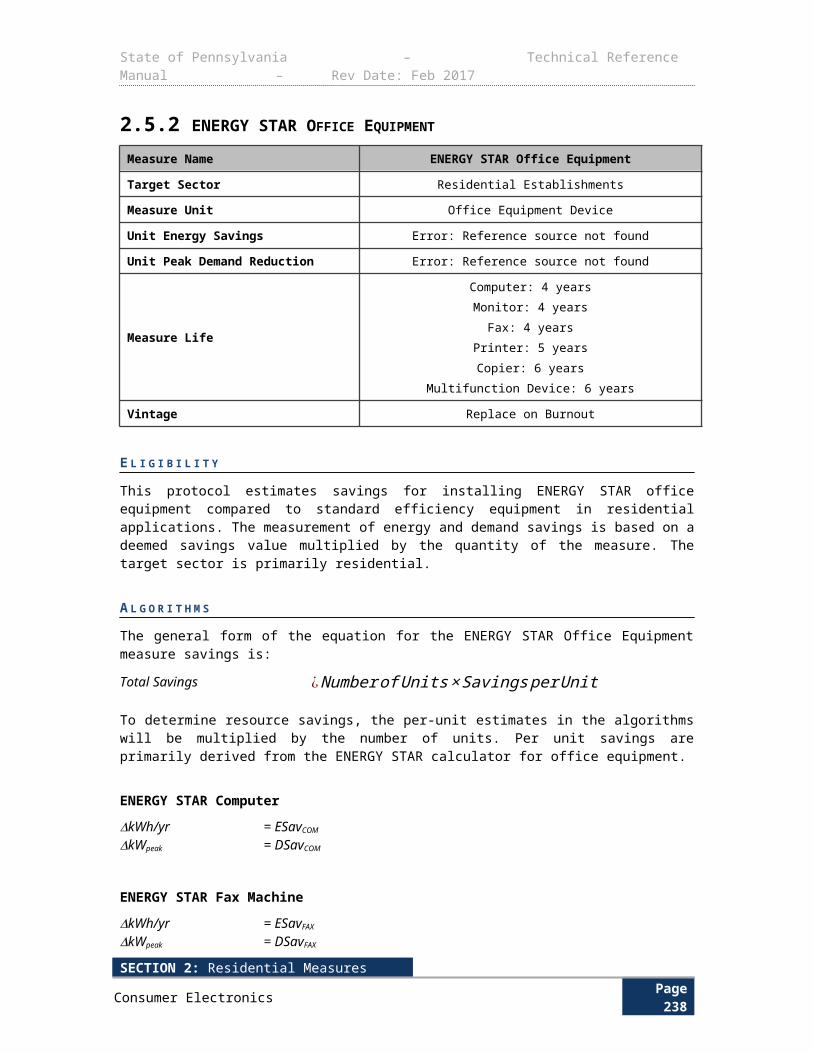
State of Pennsylvania – Technical Reference Manual – Rev Date: Feb 2017
Common Space Type LPD (W/ft2) Building Specific Space Types LPD (W/ft2)
Restrooms 0.9 Low (<25 ft. Floor to Ceiling Height)
1.2
Dressing/Locker/Fitting Room 0.6 High (>25 ft. Floor to Ceiling Height)
1.7
Corridor/Transition 0.5 Detailed Manufacturing 2.1
For Hospital 1.0 Equipment Room 1.2
For Manufacturing Facility 0.5 Control Room 0.5
Stairs—Active 0.6 Hotel/Motel Guest Rooms 1.1
Active Storage 0.8 Dormitory—Living Quarters 1.1
For Hospital 0.9 Museum
Inactive Storage 0.3 General Exhibition 1.0
For Museum 0.8 Restoration 1.7
Electrical/Mechanical 1.5 Bank/Office—Banking Activity Area
1.5
Workshop 1.9 Religious Buildings
Sales Area 1.7 Worship Pulpit, Choir 2.4
Fellowship Hall 0.9
Retail
Sales Area [For accent lighting, see 9.3.1.2.1(c)]
1.7
Mall Concourse 1.7
Sports Arena
Ring Sports Area 2.7
Court Sports Area 2.3
Indoor Playing Field Area 1.4
Warehouse
Fine Material Storage 1.4
Medium/Bulky Material Storage
0.9
Parking Garage—Garage Area 0.2
Transportation
Airport—Concourse 0.6
Air/Train/Bus—Baggage Area
1.0
Terminal—Ticket Counter
1.5
SECTION 2: Residential MeasuresMiscellaneous Page 242
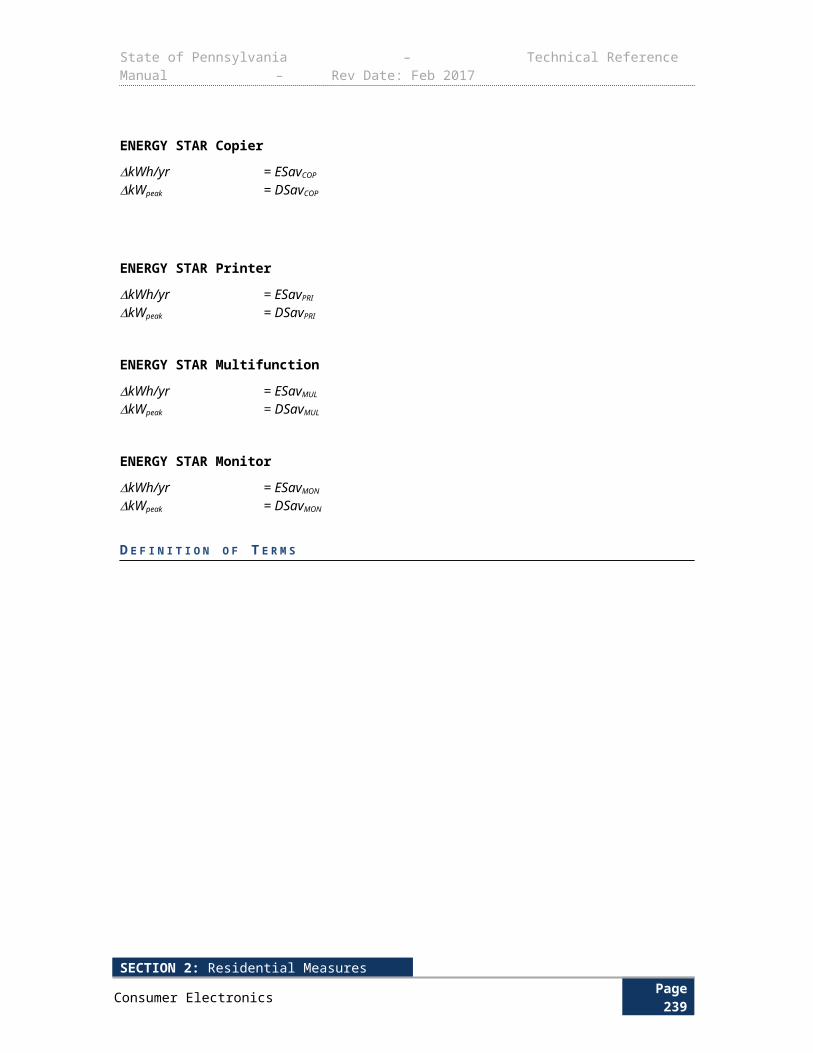
State of Pennsylvania – Technical Reference Manual – Rev Date: Feb 2017
Table 3-149: Baseline Exterior Lighting Power Densities252
Building Exterior Space Description LPD
Uncovered Parking Area Parking Lots and Drives 0.15 W/ft2
Building Grounds Walkways less than 10 ft. wide 1.0 W/linear foot
Walkways 10 ft. wide or greater 0.2 W/ft2
Plaza areas
Special feature areas
Stairways 1.0 W/ft2
Building Entrances and Exits Main entries 30 W/linear foot of door width
Other doors 20 W/linear foot of door width
Canopies and Overhangs Free standing and attached and overhangs
1.25 W/ft2
Outdoor sales Open areas (including vehicle sales lots)
0.5 W/ft2
Street frontage for vehicle sales lots in addition to “open area”
allowance
20 W/linear foot
Building facades 0.2 W/ft2 for each illuminated wall or surface
or 5.0 W/linear foot for each illuminated wall or
surface length
Automated teller machines and night depositories
270 W per location plus 90 W per additional ATM
per location
Entrances and gatehouse inspection stations at guarded facilities
1.25 W/ft2 of uncovered area
Loading areas for law enforcement, fire, ambulance, and other emergency service vehicles
0.5 W/ft2 of uncovered area
Drive-through windows at fast food restaurants
400 W per drive-through
Parking near 24-hour retail entrances
800 W per main entry
252 ASHRAE 90.1-2007, “Table 9.6.1 Lighting Power Densities Using the Space-by-Space Method.” https://law.resource.org/pub/us/code/ibr/ashrae.90.1.2007.pdf
SECTION 2: Residential MeasuresMiscellaneous Page 243
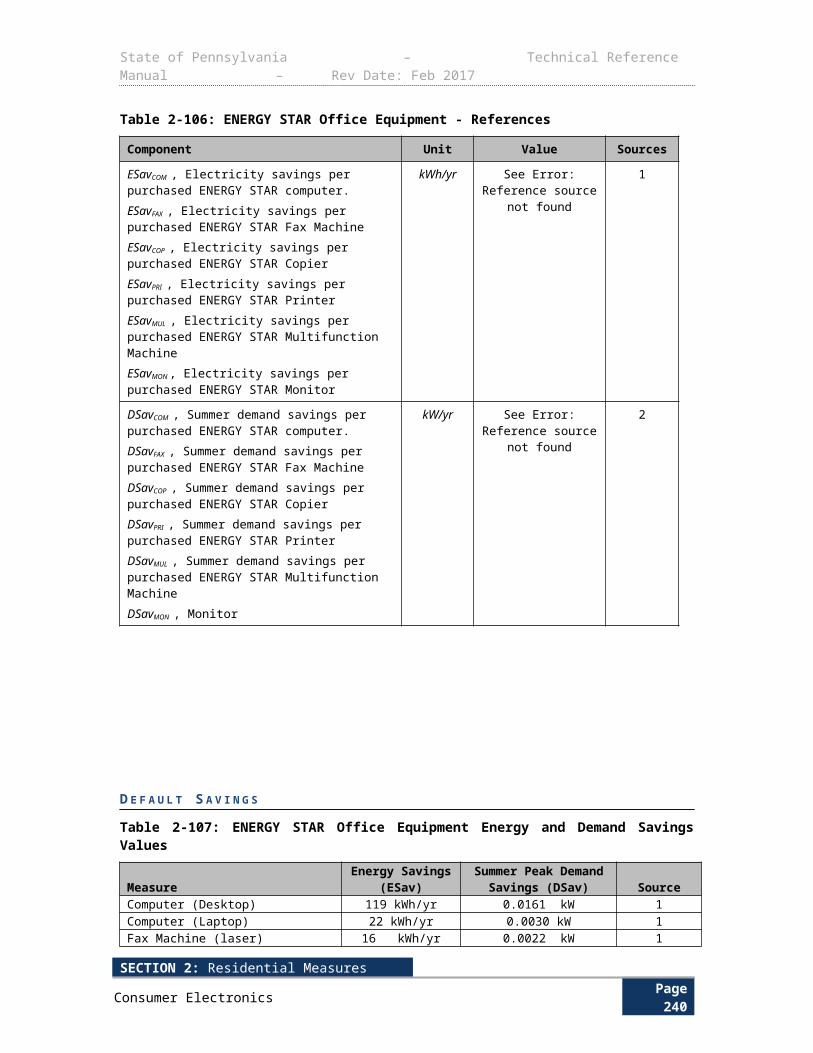
State of Pennsylvania – Technical Reference Manual – Rev Date: Feb 2017
Table 3-150: Default Baseline Savings Control Factors Assumptions for New Construction Only
Building Type SVGbase
Education 13%Exterior 0%Grocery 0%Health 2%Industrial/Manufacturing – 1 Shift 0%Industrial/Manufacturing – 2 Shift 0%Industrial/Manufacturing – 3 Shift 0%Institutional/Public Service 7%Lodging 1%Miscellaneous/Other 2%Office 2%Parking Garage 0%Restaurant 0%Retail 0%Warehouse 1%Custom Based on Code
D E F A U L T S A V I N G S
There are no default savings associated with this measure.
E V A L U A T I O N P R O T O C O L S
Detailed Inventory FormA detailed inventory of all installed fixtures contributing to general light requirements is mandatory for participation in this measure. Lighting that need not be included in the inventory is as follows:
1) Display or accent lighting in galleries, museums, and monuments
2) Lighting that is integral to:
a. Equipment or instrumentation and installed by its manufacturer,
b. Refrigerator and freezer cases (both open and glass-enclosed),
c. Equipment used for food warming and food preparation,
d. Medical equipment, or
e. Advertising or directional signage
3) Lighting specifically designed only for use during medical procedures
4) Lighting used for plant growth or maintenance
5) Lighting used in spaces designed specifically for occupants with special lighting needs
6) Lighting in retail display windows that are enclosed by ceiling height partitions.
The lighting inventory form will use the algorithms presented above to derive the total ΔkW and ΔkWh savings for each installed measure. Within a single project, to the extent there are multiple combinations of control strategies (SVG), hours of use (HOU), coincidence factors (CF) or interactive factors (IF), the ∆ kW will be broken out to account for these different factors. This will
SECTION 2: Residential MeasuresMiscellaneous Page 244
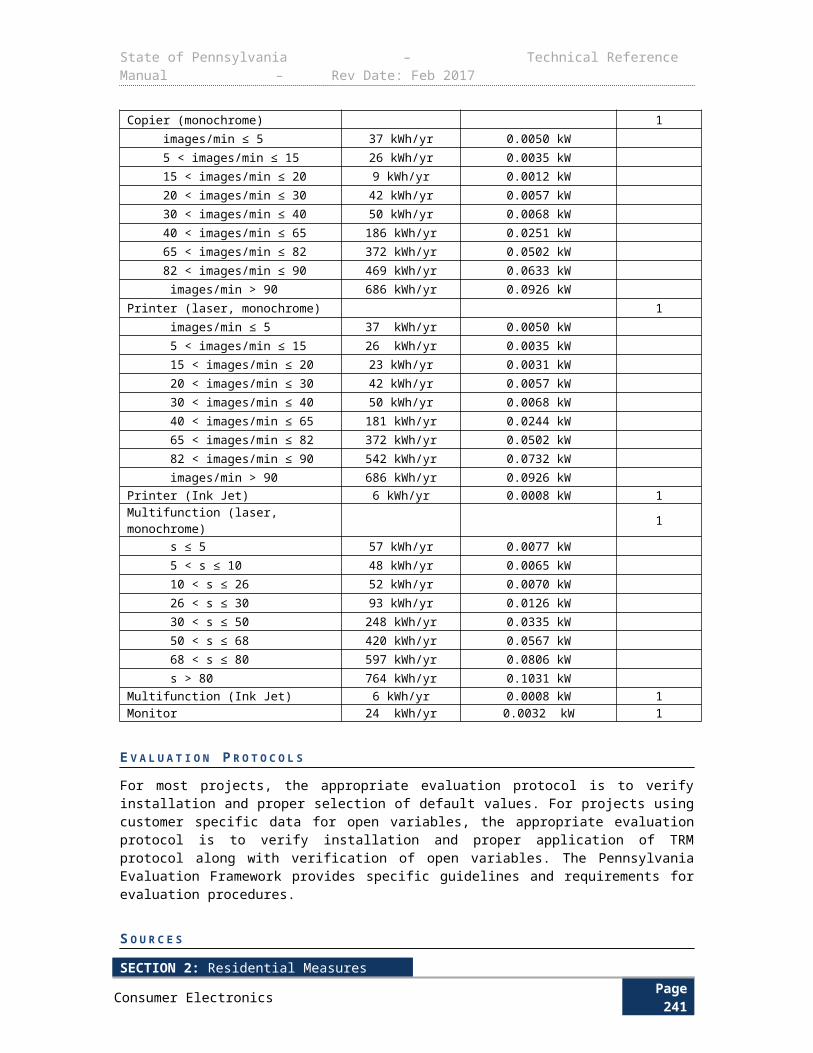
State of Pennsylvania – Technical Reference Manual – Rev Date: Feb 2017
be accomplished using Appendix C: Lighting Audit and Design Tool, a Microsoft Excel inventory form that specifies the lamp and ballast configuration using the Standard Wattage Table and SVG, HOU, CF and IF values for each line entry. The inventory form will also specify the location and number of fixtures for reference and validation.
Appendix C: Lighting Audit and Design Tool was developed to automate the calculation of energy and demand impacts for new construction lighting projects, based on a series of entries by the user defining key characteristics of the new construction project. The "General Information" sheet is provided for the user to identify facility-specific details of the project that have an effect on the calculation of gross savings. Facility-specific details include contact information, electric utility, building area information, and operating schedule. The "Lighting Inventory" sheet is the main worksheet that calculates energy savings and peak demand reduction for the user-specified lighting fixture and controls installed. This form follows the algorithms presented above and facilitates the calculation of gross savings for implementation and evaluation purposes. Each line item on this tab represents a specific area with common baseline fixtures, retrofit fixtures, controls strategy, space cooling, and space usage.
Installed fixture wattages are determined by selecting the appropriate fixture code from the “Fixture Identities” sheet. The sheet can also be used to find the appropriate code for a particular lamp-ballast combination253 by using the enabled auto-filter options. Actual wattages of fixtures determined by manufacturer’s equipment specification sheets or other independent sources may not be used unless (1) the manufacturer's cut sheet indicates that the difference in delta-watts of fixture wattages (i.e. difference in delta watts of baseline and “actual” installed efficient fixture wattage and delta watts of baseline and nearest matching efficient fixture in the “Fixture Identities” of Appendix C: Lighting Audit and Design Tool is more than 10%254 or (2) the corresponding fixture code is not listed in the “Fixture Identities” list. In these cases, alternate wattages for lamp-ballast combinations can be inputted using the appropriate cells within the “Fixture Identities” tab. Rows 9 through 18 provide a guided custom LED fixture generator to be used with non-self-ballasted LEDs. All other custom cut sheets should be inputted into rows 922 through 971. Documentation supporting the alternate wattages must be provided in the form of manufacturer-provided specification sheets or other industry accepted sources (e.g. ENERGY STAR listing, Design Lights Consortium listing). Submitted specification sheets must cite test data performed under standard ANSI procedures. These exceptions will be used as the basis for periodically updating the “Fixture Identities” to better reflect market conditions and more accurately represent savings.
Some lighting contractors may have developed in-house lighting inventory forms that are used to determine preliminary estimates of projects. In order to ensure standardization of all lighting projects, Appendix C: Lighting Audit and Design Tool must still be used. However, if a third-party lighting inventory form is provided, entries to Appendix C: Lighting Audit and Design Tool may be condensed into groups sharing common baseline fixtures, retrofit fixtures, space type, building type, and controls. Whereas Appendix C: Lighting Audit and Design Tool separates fixtures by location to facilitate evaluation and audit activities, third-party forms can serve that specific function if provided.
Appendix C: Lighting Audit and Design Tool will be updated periodically to include new fixtures and technologies available as may be appropriate. Additional guidance can be found in the “Manual” sheet of Appendix C: Lighting Audit and Design Tool.
Custom Hours of Use and Coincidence FactorsIf the project cannot be described by the building type categories listed in Table 3-141 and Table3-142 or if the facility’s actual lighting hours deviate by more than 10% from the tables, or if the project retrofitted only a portion of a facility’s lighting system for which whole building hours of use
253 In cases where both a common space type and a building specific type are listed, the building specific space type shall apply.254 ASHRAE 90.1-2007 Table 9.4.5. https://law.resource.org/pub/us/code/ibr/ashrae.90.1.2007.pdf
SECTION 2: Residential MeasuresMiscellaneous Page 245
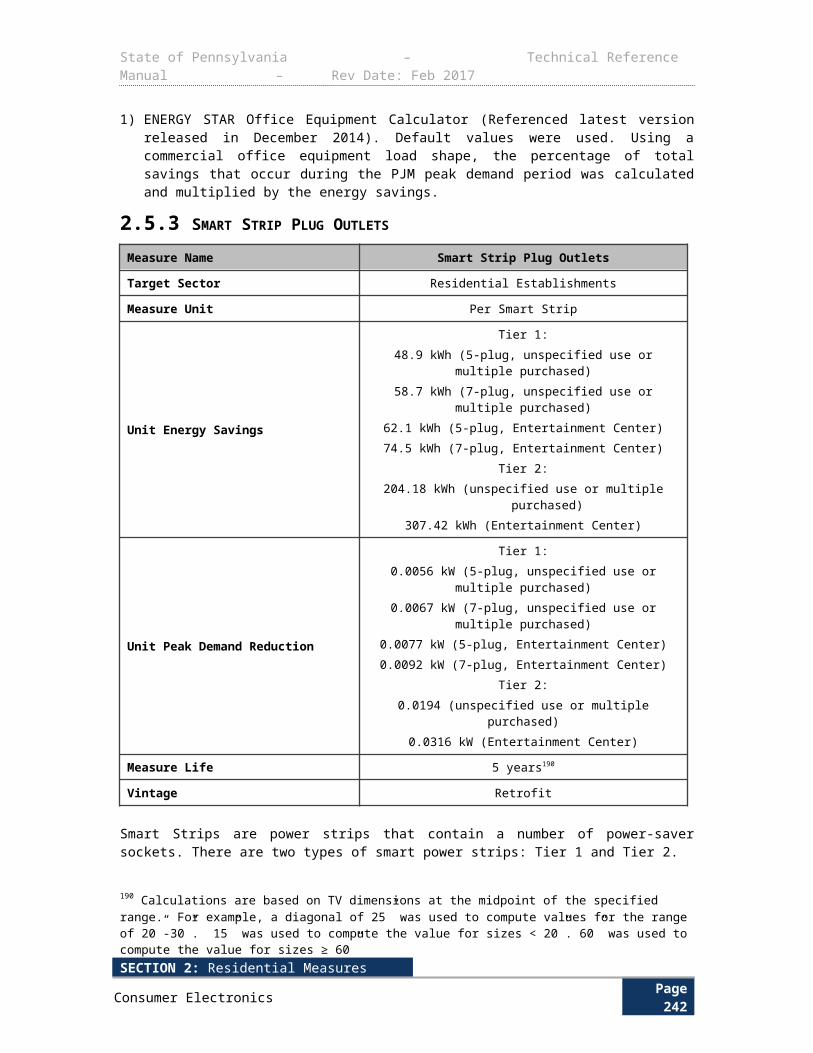
State of Pennsylvania – Technical Reference Manual – Rev Date: Feb 2017
would not be appropriate, the deemed HOU and CF assumptions can be overridden by inputting custom operating schedules into the Lighting Operation Schedule portion of the “General Information” tab of Appendix C: Lighting Audit and Design Tool. The custom schedule inputs must be corroborated by an acceptable source such as posted hours, customer interviews, building monitoring system (BMS), or metered data.
For all projects, annual hours are subject to adjustment by EDC evaluators or SWE.
MeteringProjects with savings below 750,000 kWh Metering is encouraged for projects with expected savings below 750,000 kWh but have high uncertainty, i.e. where hours are unknown, variable, or difficult to verify. Exact conditions of “high uncertainty” are to be determined by the EDC evaluation contractors to appropriately manage variance. Metering completed by the implementation contractor maybe leveraged by the evaluation contractor, subject to a reasonableness review. Sampling methodologies within a site are to be either discerned by the EDC evaluation contractor based on the characteristics of the facility in question or performed consistent with guidance the EDC EM&V contractor provides.
Projects with savings of 750,000 kWh or higher For projects with expected savings of 750,000 kWh or higher, metering is required255. Exceptions may be made and EDC data gathering may be substituted if necessary at the evaluation contractor’s discretion in cases involving early occupancy. Otherwise, installation of light loggers is the accepted method of metering, but trend data from BMS is an acceptable substitute. Metering completed by the implementation contractor maybe leveraged by the evaluation contractor, subject to a reasonableness review. Sampling methodologies within a site are to be either discerned by the EDC evaluation contractor or communicated to implementation contractors based on the characteristics of the facility in question or performed consistent with guidance the EDC EM&V contractor provides.
When BMS data is used as a method of obtaining customer-specific data in lieu of metering, the following guidelines should be followed:
Care should be taken with respect to BMS data, since the programmed schedule may not reflect regular hours of long unscheduled overrides of the lighting system, such as nightly cleaning in office buildings, and may not reflect how the lights were actually used, but only the times of day the common area lighting is commanded on and off by the BMS.
The BMS trends should represent the actual status of the lights (not just the command sent to the lights), and the ICSP and EC are required to demonstrate that the BMS system is functioning as expected, prior to relying on the data for evaluation purposes.
The BMS data utilized should be specific to the lighting systems, and should be required to be representative of the building areas included in the lighting project.
S O U R C E S
255 The Locator is intended to assist users locate codes in the Standard Wattage Table. It does not generate new codes or wattages. In a few cases, the fixture code noted in the Standard Wattage Table may not use standard notation. Therefore, these fixtures may not be able to be found using the Locator and a manual search may be necessary to locate the code.
SECTION 2: Residential MeasuresMiscellaneous Page 246
State of Pennsylvania – Technical Reference Manual – Rev Date: Feb 2017
1) Pennsylvania Statewide Act 129 2014 Commercial & Residential Lighting Metering Study. Prepared for Pennsylvania Public Utilities Commission. January 13, 2015. http://www.puc.pa.gov/pcdocs/1340978.pdf
SECTION 2: Residential MeasuresMiscellaneous Page 247
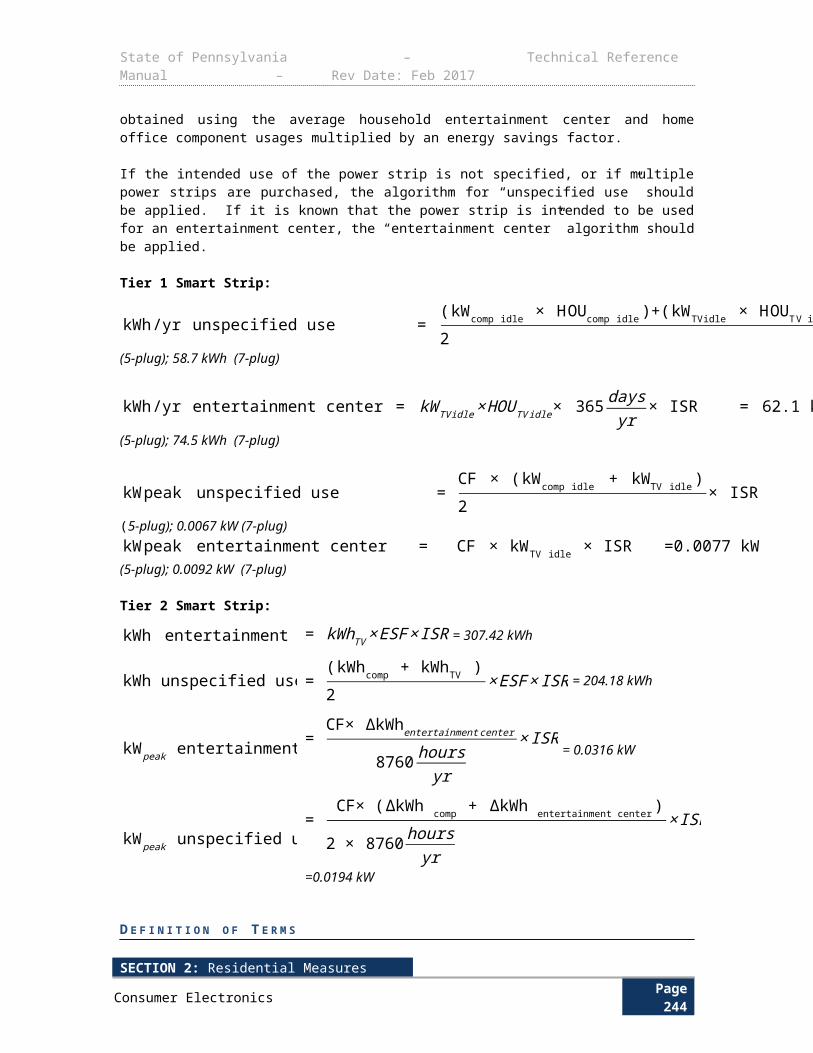
State of Pennsylvania – Technical Reference Manual – Rev Date: Feb 2017
3.1.3 LIGHTING CONTROLS
Measure Name Lighting Controls
Target Sector Commercial and Industrial Establishments
Measure Unit Wattage Controlled
Unit Energy Savings Variable
Unit Peak Demand Reduction Variable
Measure Life 8 years256
Measure Vintage Retrofit and New Construction
E L I G I B I L I T Y
Lighting controls turn lights on and off automatically, which are activated by time, light, motion, or sound. The measurement of energy savings is based on algorithms with key variables (e.g. coincidence factor (CF), hours of use (HOU) provided through existing end-use metering of a sample of facilities or from other utility programs with experience with these measures (i.e., % of annual lighting energy saved by lighting control). These key variables are listed in Table 3-151.
If a lighting improvement consists of solely lighting controls, the lighting fixture baseline is the existing fixtures with the existing lamps and ballasts or, if retrofitted, new fixtures with new lamps and ballasts as defined in Lighting Audit and Design Tool shown in Appendix C: Lighting Auditand Design Tool. In either case, the kWee for the purpose of the algorithm is set to kW base.
A L G O R I T H M S
kWh ¿kW controlled×HOU × (SVGee−SVGbase )× (1+ IFenergy )
∆ kW peak ¿kW controlled× (SVGee−SVGbase)× (1+ IFdemand )×CF
D E F I N I T I O N O F T E R M S
256 This value was agreed upon by the Technical Working Group convened to discuss updates to the TRM. This value is subject to adjustment based on implementation feedback during PY3 and PY4.
SECTION 2: Residential MeasuresMiscellaneous Page 248
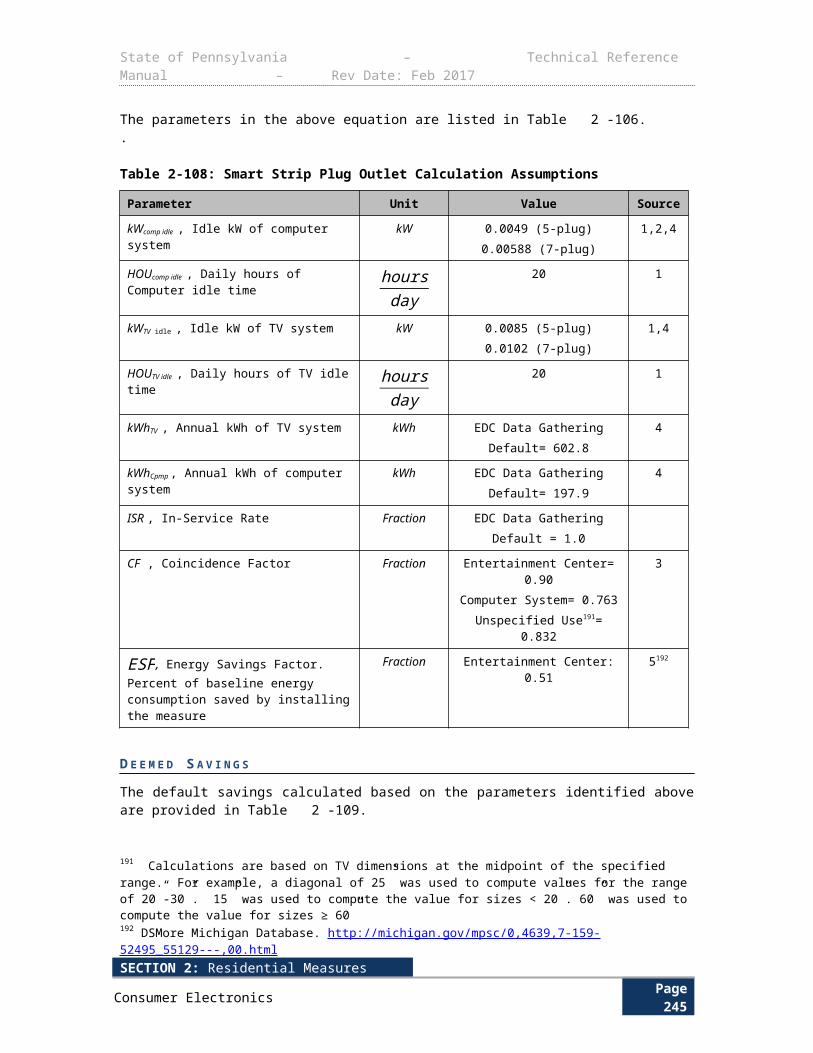
State of Pennsylvania – Technical Reference Manual – Rev Date: Feb 2017
Table 3-151: Lighting Controls Assumptions
Term Unit Values Source
kW controlled, Total lighting load connected to the new control in kilowatts. Savings are per control. The total connected load per control should be collected from the customer
kW
Lighting Audit and Design Tool in Appendix
C: Lighting Audit andDesign Tool
EDC Data Gathering
SVGee, Savings factor for installed lighting control (percent of time the lights are off)
NoneBased on metering EDC Data Gathering
Default: See Table 3-140 1
SVGbase, Baseline savings factor (percent of time the lights are off)
None
Retrofit Default: See Table 3-140 1
New Construction Default: See Table 3-
1502572
CF, Demand Coincidence Factor Decimal
Based on metering258 EDC Data Gathering
By building type and size See Table 3-141 and Table 3-142
HOU , Hours of Use – the average annual operating hours of the baseline lighting equipment (before the lighting controls are in place), which if applied to full connected load will yield annual energy use.
HoursYear
Based on metering259 EDC Data Gathering
By building type and size See Table 3-141 and Table 3-142
IF, Interactive Factor None By building type and size See Table 3-144 and Table 3-145
D E F A U L T S A V I N G S
There are no default savings for this measure.
257 The Commission allows the EDCs to use alternative methods for obtaining customer-sepcific data where customer processes do not support metering. The EDCs are required to provide supporting documentation to the SWE for review if there are any such exceptions. 258 DEER 2014 Effective Useful Life.. 259 The baseline savings control factor assumptions were determined per building type by scaling the SVG of 24% associated with ASHRAE mandated occupancy sensors in three new construction space types by the percentage of load contribution found in the 2014 Residential & Commercial Lighting Metering Study to occur within those three space types. For example, education facilities presented 54% of the load within the three space types requiring occupancy sensors. As such, the baseline SVG becomes 0.54 * 0.24, or 0.13.
SECTION 2: Residential MeasuresMiscellaneous Page 249
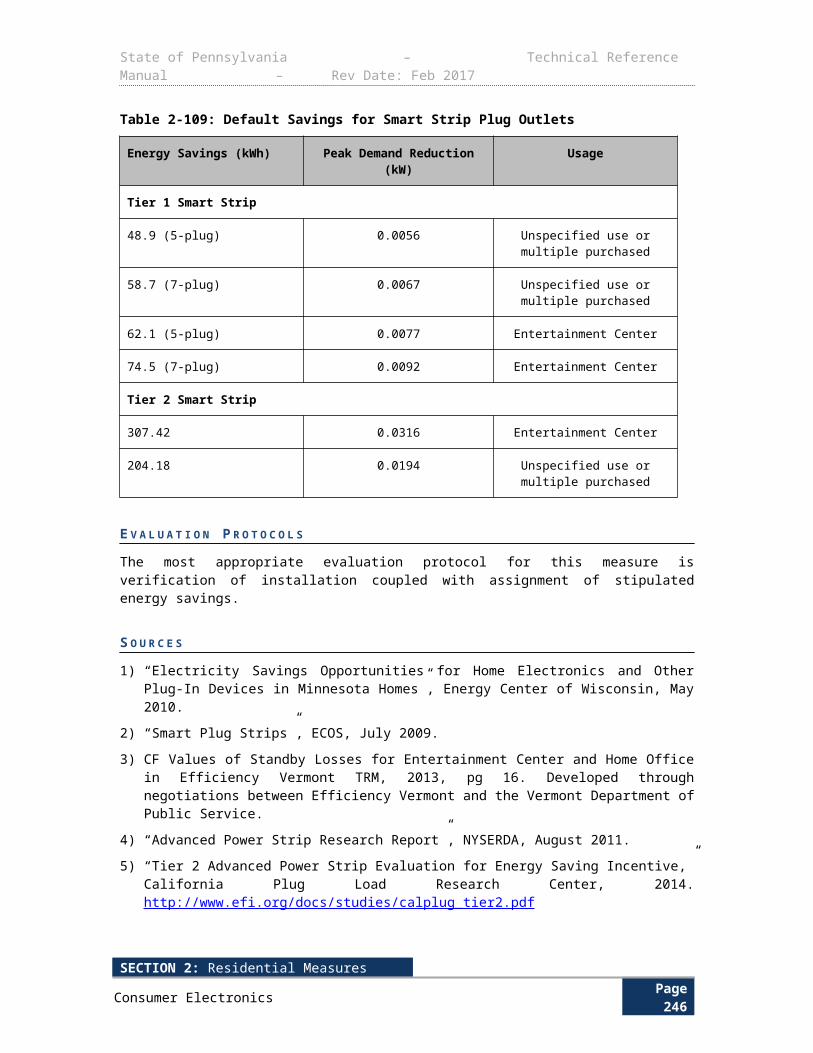
State of Pennsylvania – Technical Reference Manual – Rev Date: Feb 2017
E V A L U A T I O N P R O T O C O L S
For most projects, the appropriate evaluation protocol is to verify installation and proper selection of default values. For projects using customer specific data for open variables, the appropriate evaluation protocol is to verify installation and proper application of TRM protocol along with verification of open variables.
It is noted that if site-specific data is used to determine HOU, then the same data must be used to determine the site-specific CF. Similarly, if the default TRM HOU is used, then the default TRM CF must also be used in the savings calculations. The Pennsylvania Evaluation Framework provides specific guidelines and requirements for evaluation procedures.
S O U R C E S
1) Williams, A., Atkinson, B., Garbesi, K., Rubinstein, F., “A Meta-Analysis of Energy Savings from Lighting Controls in Commercial Buildings”, Lawrence Berkeley National Laboratory, September 2011. http://eetd.lbl.gov/sites/all/files/a_meta-analysis_of_energy_savings_from_lighting_controls_in_commercial_buildings_lbnl-5095e.pdf
2) Pennsylvania Statewide Act 129 2014 Commercial & Residential Lighting Metering Study. Prepared for Pennsylvania Public Utilities Commission. January 13, 2015. http://www.puc.pa.gov/pcdocs/1340978.pdf
SECTION 2: Residential MeasuresMiscellaneous Page 250

State of Pennsylvania – Technical Reference Manual – Rev Date: Feb 2017
3.1.4 TRAFFIC LIGHTS
Measure Name Traffic Lights
Target Sector Government, Non-Profit and Institutional
Measure Unit Traffic Light
Unit Energy Savings Variable
Unit Peak Demand Reduction Variable
Measure Life 10 years260
Measure Vintage Early Replacement
E L I G I B I L I T Y
This protocol applies to the early replacement of existing incandescent traffic lights and pedestrian signals with LEDs. New LED traffic signals must comply with ENERGY STAR requirements.261
A L G O R I T H M S
kWh ¿ (kW base−kW ee )×HOU
∆ kW peak ¿ (kW base−kW ee )×CF
D E F I N I T I O N O F T E R M S
Table 3-152: Assumptions for LED Traffic Signals
Term Unit Values Source
kWbase, The connected load of the baseline lighting as defined by project classification.
kW Vary based on fixture details, See Table 3-153 2, 3, 4, 5
kWee, The connected load of the post-retrofit or energy-efficient lighting system.
kW Vary based on fixture details, See Table 3-153 2, 3, 4, 5
CF, Demand Coincidence Factor
Decimal Default:Red Round: 0.55
Yellow Round: 0.02Round Green: 0.43
Red Arrow: 0.86Yellow Arrow: 0.08
1
260 It is noted that if site-specific data is used to determine HOU, then the same data must be used to determine the site-specific CF. Similarly, if the default TRM HOU is used, then the default TRM CF must also be used in the savings calculations. 261 Ibid.
SECTION 2: Residential MeasuresMiscellaneous Page 251
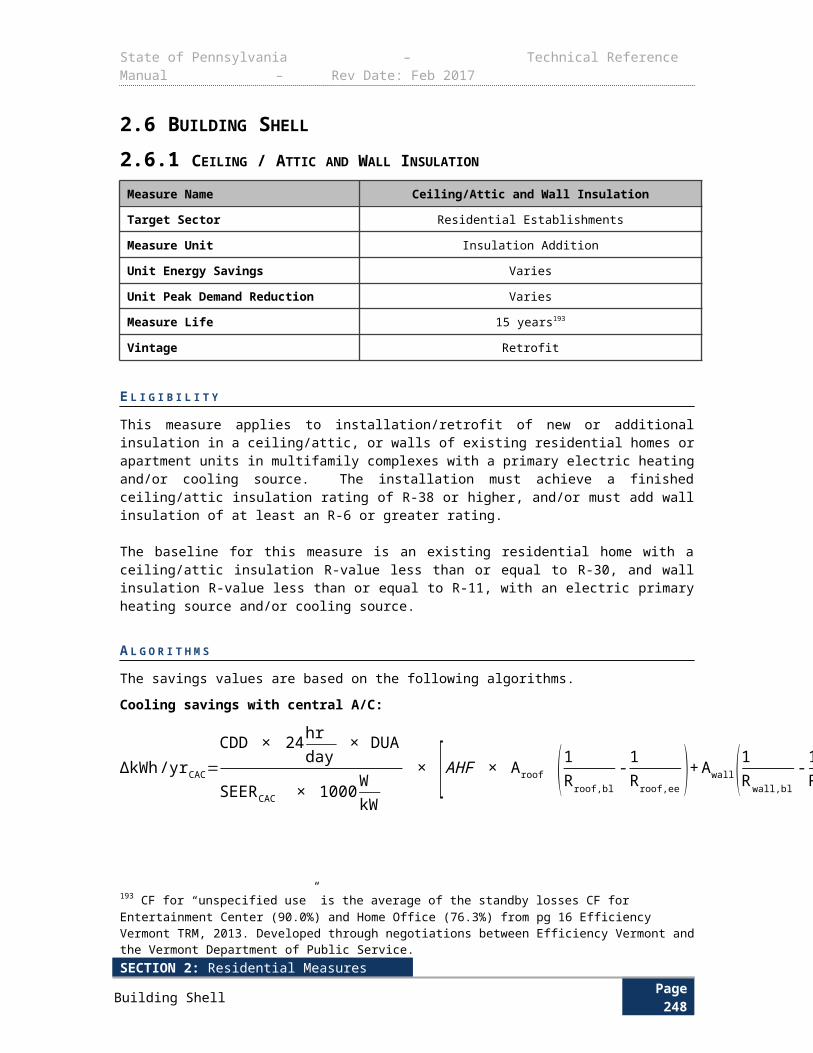
State of Pennsylvania – Technical Reference Manual – Rev Date: Feb 2017
Term Unit Values Source
Green Arrow: 0.08Pedestrian: 1.00
HOU, Annual hours of use
HoursYear
Default:Round Red: 4,818Round Yellow: 175
Round Green: 3,767Red Arrow: 7,358Yellow Arrow: 701Green Arrow: 701Pedestrian: 8,760
1
D E F A U L T S A V I N G S
Table 3-153: Default Values for Traffic Signal and Pedestrian Signage Upgrades
Fixture Type % Burn kW base kW ee ∆ kW peak ∆ kWh Sources
Round Traffic Signals8" Red 55% 0.069 0.006 0.035 304
5, 28" Yellow 2% 0.069 0.007 0.001 118" Green 43% 0.069 0.008 0.026 23012" Red 55% 0.150 0.006 0.079 694
5, 212" Yellow 2% 0.150 0.012 0.003 2412" Green 43% 0.150 0.007 0.061 539Turn Arrows8" Red 84% 0.116 0.005 0.093 817
5, 38" Yellow 8% 0.116 0.014 0.008 718" Green 8% 0.116 0.006 0.009 7712" Red 84% 0.116 0.006 0.092 809
5, 212" Yellow 8% 0.116 0.006 0.009 7712" Green 8% 0.116 0.006 0.009 77Pedestrian Signs (All Burn 100%)9" Hand Only 0.116 0.008 0.108 946
5, 2
9" Pedestrian Only 0.116 0.006 0.110 96412" Hand Only 0.116 0.008 0.108 94612" Pedestrian Only 0.116 0.007 0.109 95512" Countdown Only 0.116 0.005 0.111 97212" Pedestrian and Hand Overlay 0.116 0.007 0.109 95516" Pedestrian and Hand Side by Side 0.116 0.008 0.108 94616" Pedestrian and Hand Overlay 0.116 0.007 0.109 95516" Hand with Countdown Side-by-side 0.116 0.010 0.106 929
16" Pedestrian and Hand with Countdown Overlay 0.116 0.008 0.108 946 5, 4
Notes:1) Energy Savings (kWh) are annual per lamp.2) Demand Savings (kWpeak) listed are per lamp.
SECTION 2: Residential MeasuresMiscellaneous Page 252
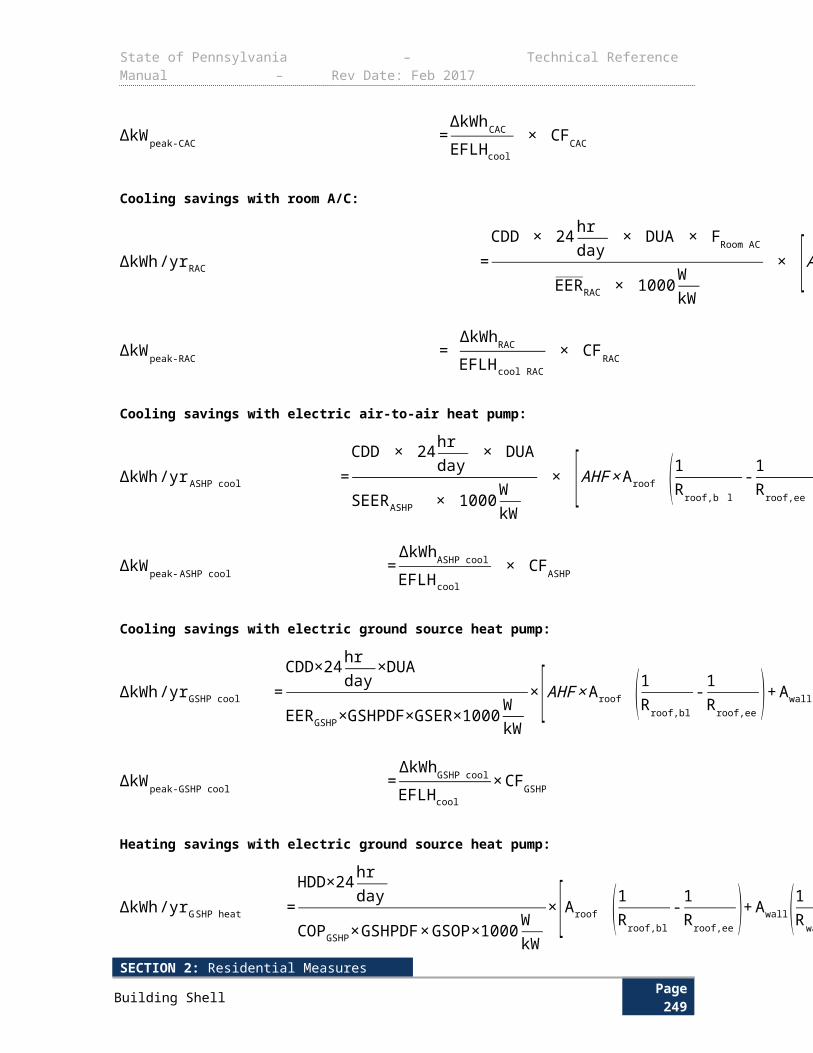
State of Pennsylvania – Technical Reference Manual – Rev Date: Feb 2017
E V A L U A T I O N P R O T O C O L S
For most projects, the appropriate evaluation protocol is to verify installation and proper selection of default values. For projects using customer specific data for open variables, the appropriate evaluation protocol is to verify installation and proper application of TRM protocol along with verification of open variables. The Pennsylvania Evaluation Framework provides specific guidelines and requirements for evaluation procedures.
S O U R C E S
1) PECO Comments on the PA TRM, received March 30, 2009.
2) ITE Compliant LED Signal Modules Catalog by Dialight. http://www.dialight.com
3) RX11 LED Signal Modules Spec Sheet by GE Lighting Solutions, http://www.gelighting.com
4) LED Countdown Pedestrian Signals Spec Sheet by GE Lighting Solutions, http://www.gelighting.com
5) GE Lighting Product Catalog by GE Lighting Solutions. http://genet.gelighting.com
SECTION 2: Residential MeasuresMiscellaneous Page 253
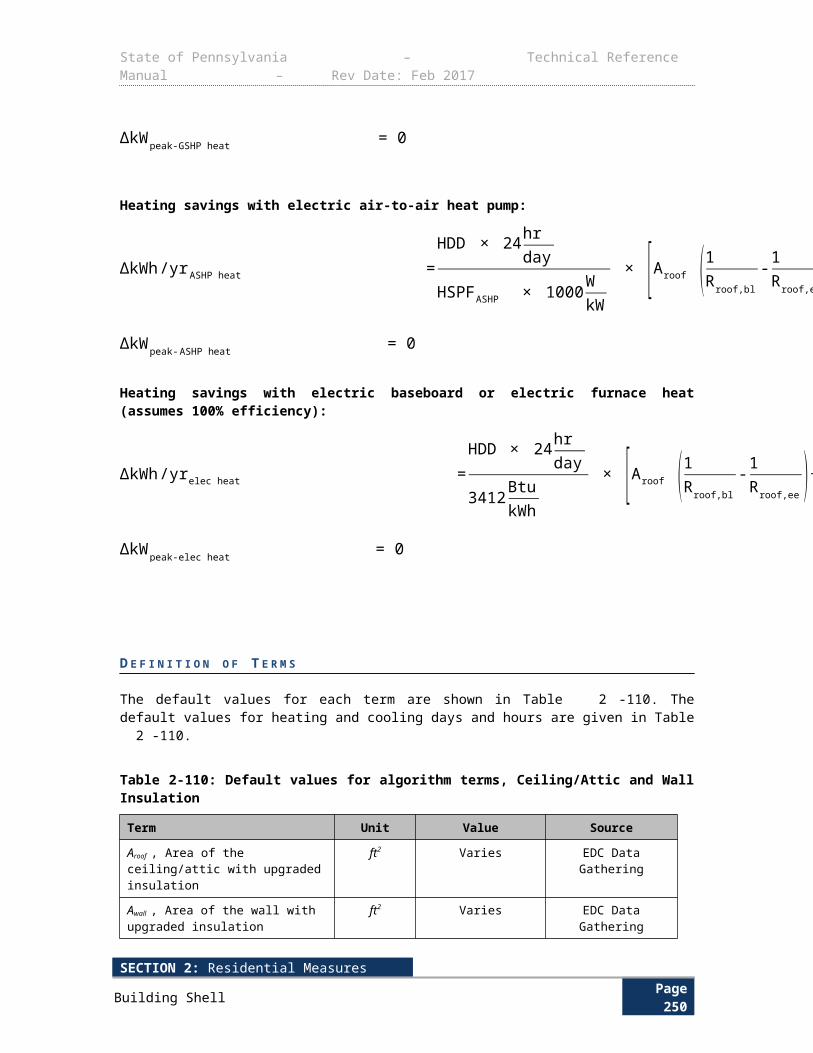
State of Pennsylvania – Technical Reference Manual – Rev Date: Feb 2017
3.1.5 LED EXIT SIGNS
Measure Name LED Exit Signs
Target Sector Commercial and Industrial Establishments
Measure Unit LED Exit Sign
Unit Energy Savings Variable
Unit Peak Demand Reduction Variable
Measure Life 16 years262
Measure Vintage Early Replacement
E L I G I B I L I T Y
This measure includes the early replacement of existing incandescent or fluorescent exit signs with a new LED exit sign. If the exit signs match those listed in Table 3-155, the default savings value for LED exit signs installed cooled spaces can be used without completing Appendix C:Lighting Audit and Design Tool.
A L G O R I T H M S
kWh ¿ (kW base−kW ee )× [HOU × ( 1+ IFenergy ) ]∆ kW peak ¿ (kW base−kW ee )× [CF× (1+ IF demand ) ]
D E F I N I T I O N O F T E R M S
Table 3-154: LED Exit Signs Calculation Assumptions
Term Unit Values Source
kW base, Connected load of baseline lighting as defined by project classification
kW
Actual Wattage EDC Data GatheringSingle-Sided Incandescent: 0.020Dual-Sided Incandescent: 0.040Single-Sided Fluorescent: 0.009Dual-Sided Fluorescent:
0.020
Appendix C: LightingAudit and Design Tool
kW ee, Connected load of the post-retrofit or energy-efficient lighting
kWActual Wattage EDC Data Gathering
Single-Sided: 0.002Dual-Sided: 0.004
Appendix C: LightingAudit and Design Tool
262 The Measure Life Report for Residential and Commercial/Industrial Lighting and HVAC Measures, GDS Associates, Inc., June 2007. http://library.cee1.org/sites/default/files/library/8842/CEE_Eval_MeasureLifeStudyLights%26HVACGDS_1Jun2007.pdf
SECTION 2: Residential MeasuresMiscellaneous Page 254
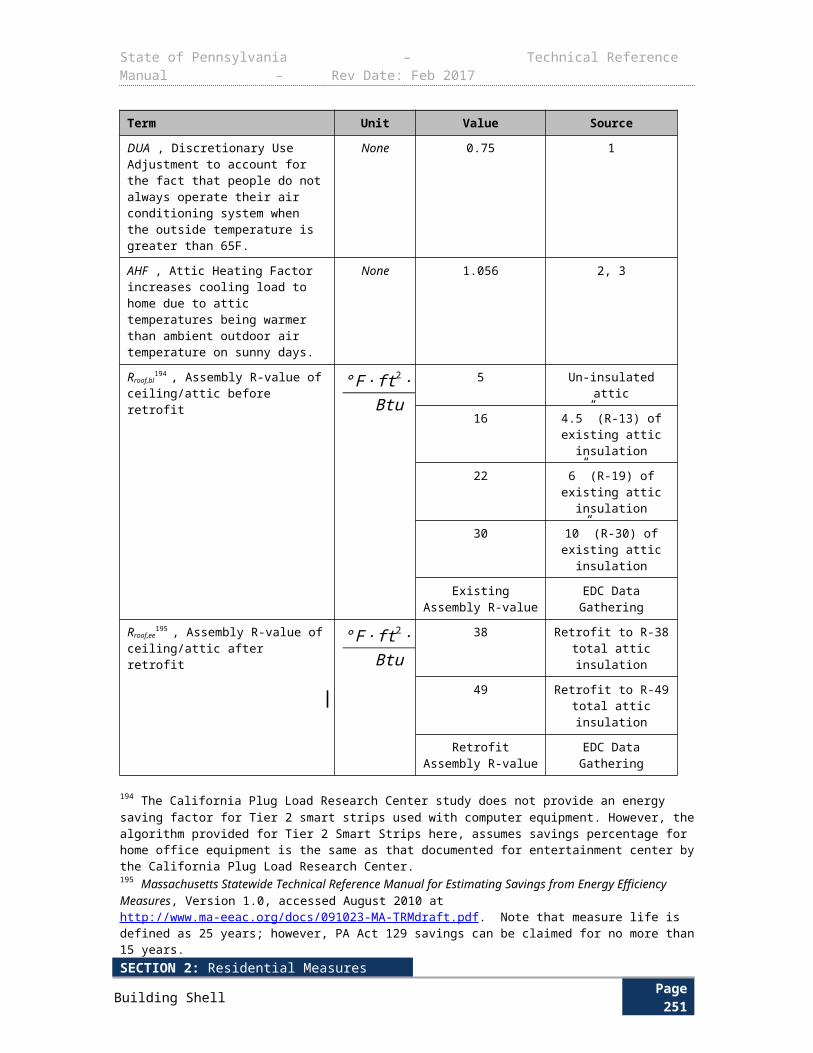
State of Pennsylvania – Technical Reference Manual – Rev Date: Feb 2017
Table 3-155: LED Exit Signs Calculation Assumptions
Term Unit Values Source
CF, Demand Coincidence Factor Decimal 1.0 1
HOU , Hours of Use – the average annual operating hours of the baseline lighting equipment.
HoursYear
8,760 1
IFenergy , Interactive HVAC Energy Factor – applies to C&I interior lighting in space that has air conditioning or refrigeration only. This represents the secondary energy savings in cooling required which results from decreased indoor lighting wattage.
None See: Table 3-144 Table 3-144
IFdemand , Interactive HVAC Demand Factor – applies to C&I interior lighting in space that has air conditioning or refrigeration only. This represents the secondary demand savings in cooling required which results from decreased indoor lighting wattage.
None See: Table 3-144 Table 3-144
D E F A U L T S A V I N G S
Single-Sided LED Exit Signs replacing Incandescent Exit Signs in Cooled Spaces
kWh ¿176kWh
∆ kW peak ¿0.024 kW
Dual-Sided LED Exit Signs replacing Incandescent Exit Signs in Cooled Spaces
kWh ¿353kWh
∆ kW peak ¿0.048 kW
Single-Sided LED Exit Signs replacing Fluorescent Exit Signs in Cooled Spaces
kWh ¿69kWh
∆ kW peak ¿0.009 kW
Dual-Sided LED Exit Signs replacing Fluorescent Exit Signs in Cooled Spaces
kWh ¿157kWh
∆ kW peak ¿0.021kW
E V A L U A T I O N P R O T O C O L S
SECTION 2: Residential MeasuresMiscellaneous Page 255
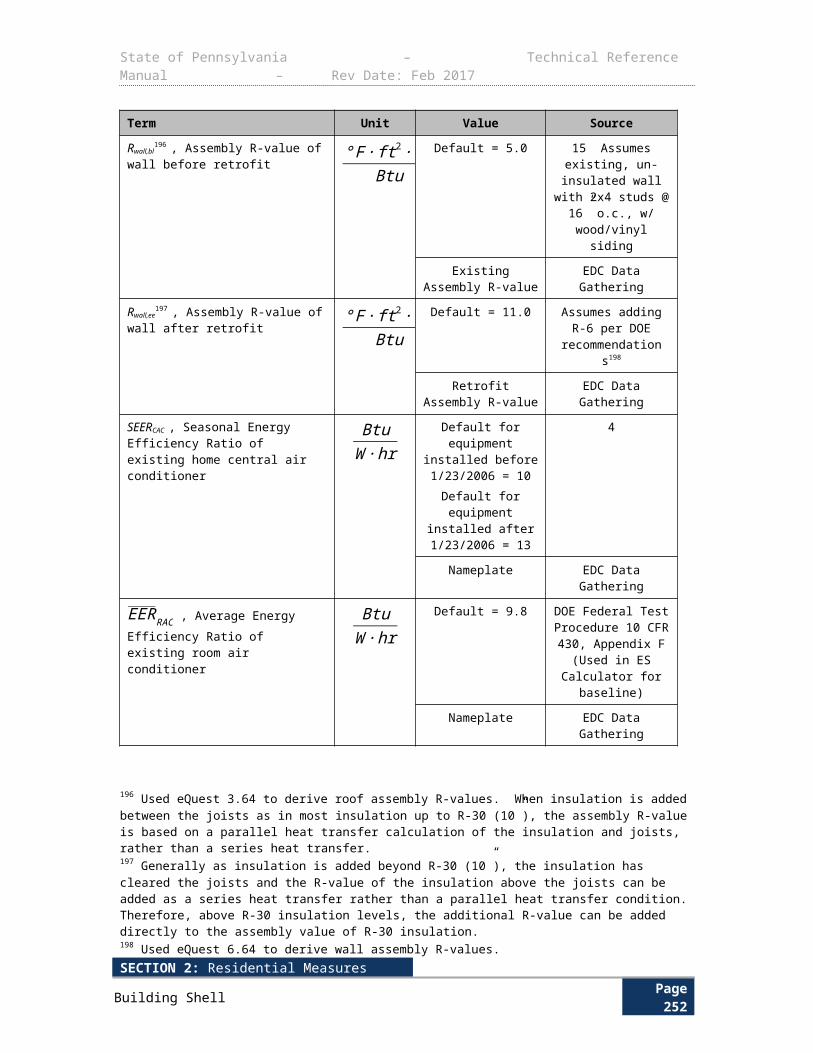
State of Pennsylvania – Technical Reference Manual – Rev Date: Feb 2017
For most projects, the appropriate evaluation protocol is to verify installation and proper selection of default values. For projects using customer specific data for open variables, the appropriate evaluation protocol is to verify installation and proper application of TRM protocol along with verification of open variables. The Pennsylvania Evaluation Framework provides specific guidelines and requirements for evaluation procedures.
S O U R C E S
1) WI Focus on Energy, “Business Programs: Deemed Savings Manual V1.0.” Update Date: March 22, 2010. LED Exit Lighting. https://focusonenergy.com/sites/default/files/bpdeemedsavingsmanuav10_evaluationreport.pdf
SECTION 2: Residential MeasuresMiscellaneous Page 256
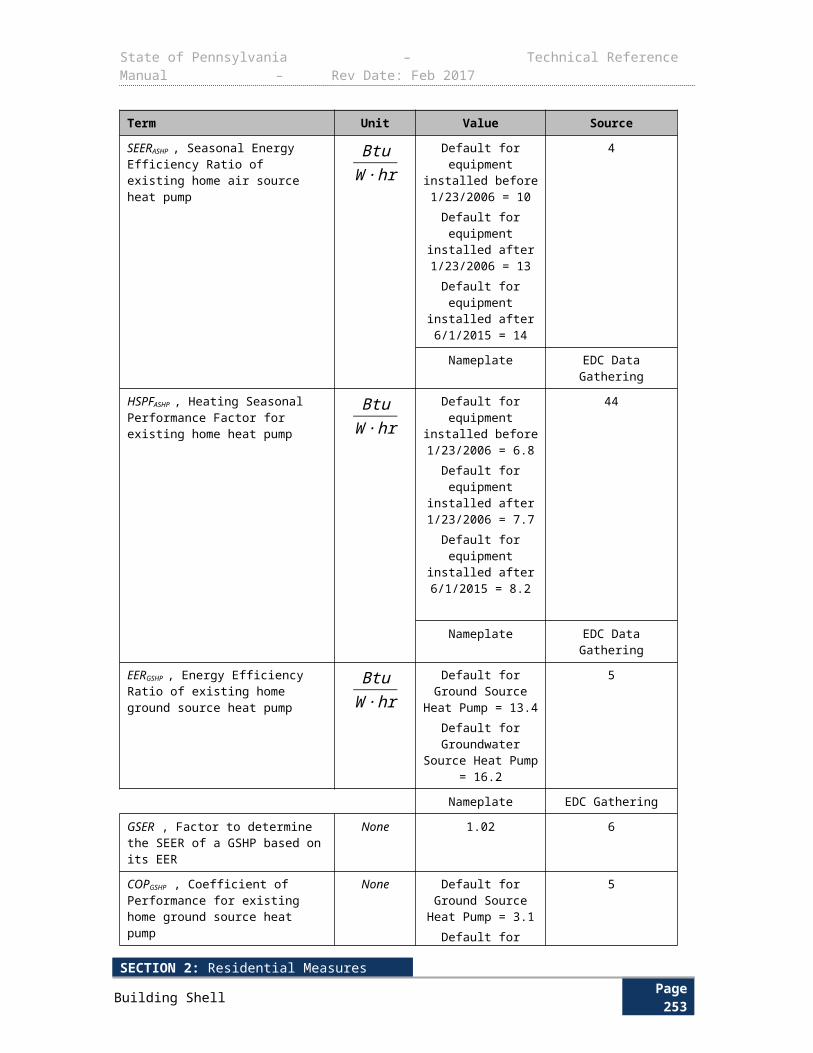
State of Pennsylvania – Technical Reference Manual – Rev Date: Feb 2017
3.1.6 LED CHANNEL SIGNAGE
Measure Name LED Channel Signage
Target Sector Commercial and Industrial Establishments
Measure Unit LED Channel Signage
Unit Energy Savings Variable
Unit Peak Demand Reduction Variable
Measure Life 15 years263
Measure Vintage Early Replacement
Channel signage refers to the illuminated signs found inside and outside shopping malls to identify store names. Typically these signs are constructed from sheet metal sides forming the shape of letters and a translucent plastic lens. Luminance is most commonly provided by single or double strip neon lamps, powered by neon sign transformers. Retrofit kits are available to upgrade existing signage from neon to LED light sources, substantially reducing the electrical power and energy required for equivalent sign luminance. Red is the most common color and the most cost-effective to retrofit, currently comprising approximately 80% of the market. Green, blue, yellow, and white LEDs are also available, but at a higher cost than red LEDs.
E L I G I B I L I T Y This measure must replace inefficient argon-mercury or neon channel letter signs with efficient LED channel letter signs. Retrofit kits or complete replacement LED signs are eligible. Replacement signs cannot use more than 20%264 of the actual input power of the sign that is replaced. Measure the length of the sign as follows:
Measure the length of each individual letter at the centerline. Do not measure the distance between letters.
Add up the measurements of each individual letter to get the length of the entire sign being replaced.
A L G O R I T H M S
The savings are calculated using the equations below and the assumptions in Table 3-156.
Indoor applications:
263 ENERGY STAR Program Requirements for Traffic Signals. https://www.energystar.gov/ia/partners/product_specs/eligibility/traffic_elig.pdf?98bf-1786 264 DEER 2014 Effective Useful Life. For the purpose of calculating the total Resource Cost Test for Act 129, measure cannot claim savings for more than 15 years.
SECTION 2: Residential MeasuresMiscellaneous Page 257
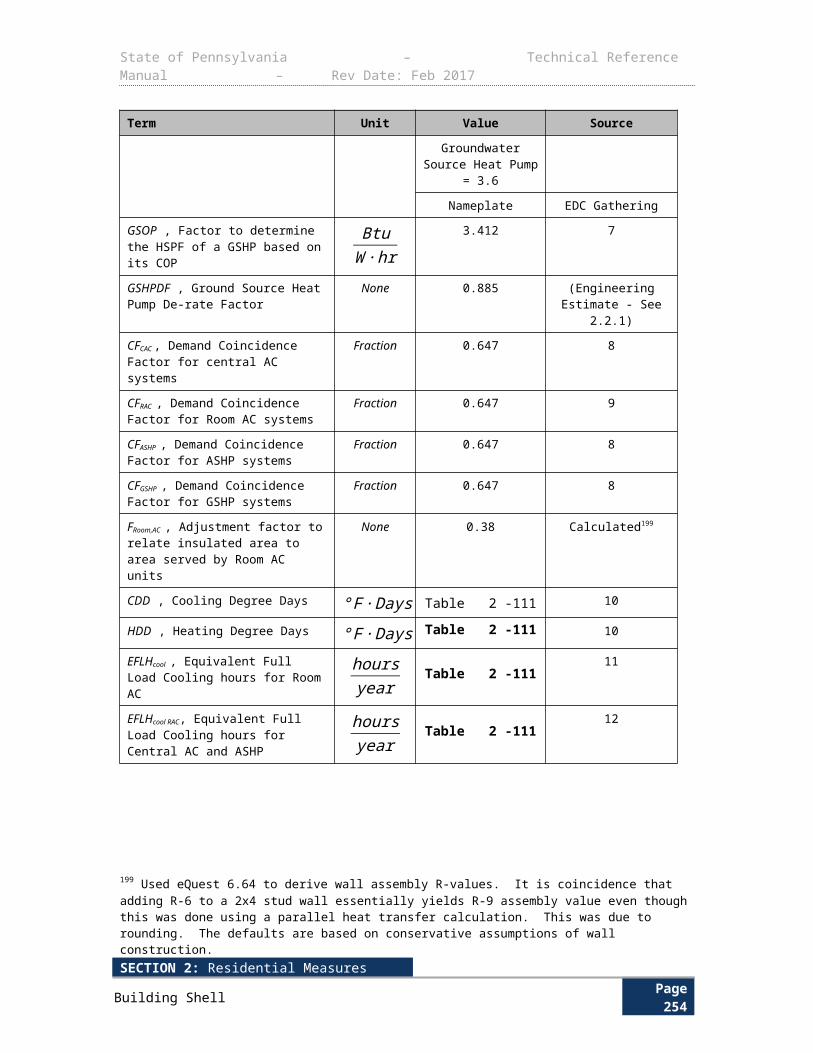
State of Pennsylvania – Technical Reference Manual – Rev Date: Feb 2017
kWh ¿ [kW base× (1+ IFenergy )×HOU × ( 1−SVGbase ) ]−[kW ee× (1+ IFenergy )×HOU × ( 1−SVGee ) ]
∆ kW peak ¿ [kW base× (1+ IFdemand )×CF× (1−SVGbase ) ]−[kW ee× (1+ IF demand )×CF× (1−SVGee ) ]
Outdoor applications:
∆ kWh ¿ [kW base×HOU × (1−SVGbase ) ]− [kW ee×HOU × ( 1−SVGee ) ]
∆ kW peak ¿ [kW base×CF× (1−SVGbase ) ]−[kW ee×CF× (1−SVGee ) ]
D E F I N I T I O N O F T E R M S
Table 3-156: LED Channel Signage Calculation Assumptions
Term Unit Values Source
kW base, kW of baseline (pre-retrofit) lighting
kW EDC Data Gathering
Default: See Table 3-157265EDC Data Gathering
kW ee, kW of post-retrofit or energy-efficient lighting system (LED) lighting per letter
kW EDC Data Gathering
Default: See Table 3-157266EDC Data Gathering
CF, Demand Coincidence Factor Decimal
EDC Data Gathering
Default for Indoor Applications: See Table 3-141
Default for Outdoor Applications: 0267
EDC Data Gathering
Table 3-141
HOU, Annual hours of UseHoursYear
EDC Data Gathering
Default: See Table 3-141
EDC Data Gathering
Table 3-141
IFdemand, Interactive HVAC Demand Factor – applies to C&I interior lighting in space that has air conditioning or refrigeration only. This represents the secondary demand savings in cooling required which results from decreased indoor lighting wattage.
None See Table 3-144 1
IFenergy, Interactive HVAC Energy Factor – applies to C&I interior lighting in space that has air conditioning or refrigeration only. This represents the secondary
None See Table 3-144 1
265 Southern California Edison Company, LED Channel Letter Signage (Red), Work Paper SCE13LG052, Revision, April 6, 2012. DEER only includes an LED Exit Sign measure which was used to estimate the effective useful life of the LED Channel Letter Signage. The Work Paper assumes 16 years for interior and exterior applications. The measure life is capped at 15 years per Act 129.266 http://www.aepohio.com/global/utilities/lib/docs/save/programs/Application_Steps_Incentive_Process.pdf 267 For exterior measures, energy interactive effects are not included in the energy savings calculations.
SECTION 2: Residential MeasuresMiscellaneous Page 258
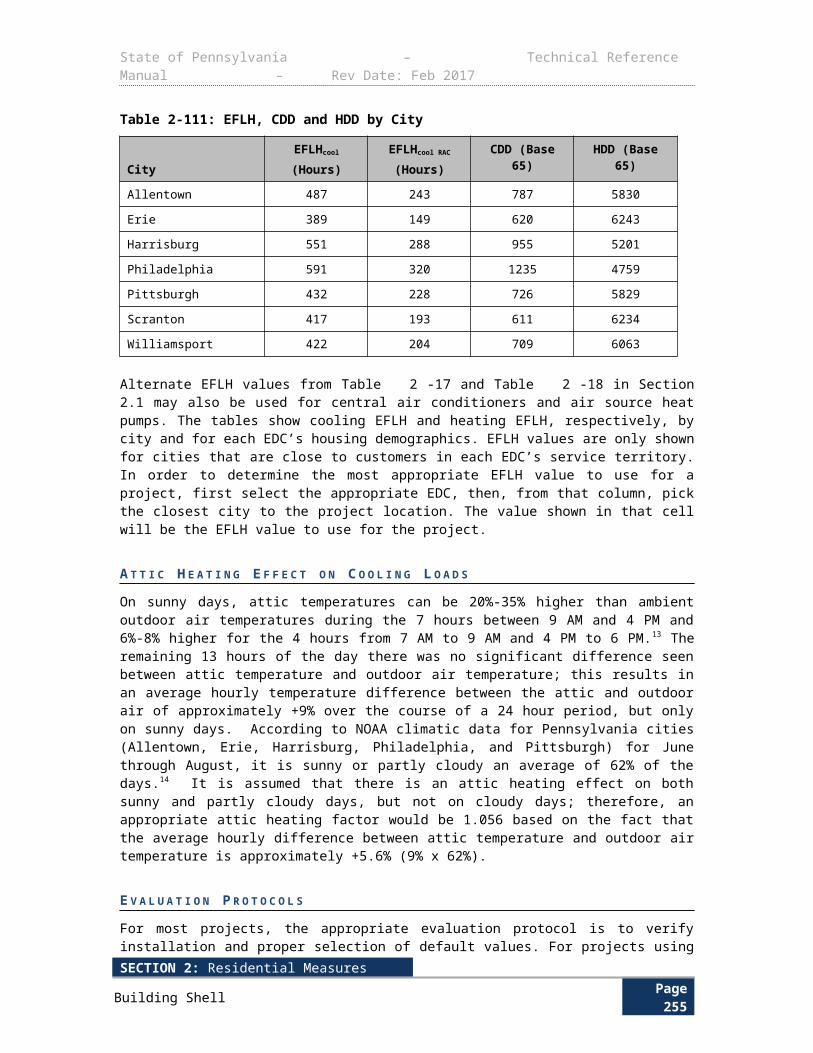
State of Pennsylvania – Technical Reference Manual – Rev Date: Feb 2017
Term Unit Values Source
energy savings in cooling required which results from decreased indoor lighting wattage.
SVGbase, Savings factor for existing lighting control (percent of time the lights are off), typically manual switch.
None Default: See Table 3-140 Table 3-140
SVGee, Savings factor for new lighting control (percent of time the lights are off).
None Default: See Table 3-140 Table 3-140
Table 3-157: Power demand of baseline (neon and argon-mercury) and energy-efficient (LED) signs
Power Demand (kW/letter) Power Demand (kW/letter)
Sign Height Neon Red LED Argon-mercury White LED
≤ 2 ft. 0.043 0.006 0.034 0.004
> 2 ft. 0.108 0.014 0.086 0.008
D E F A U L T S A V I N G S
There are no default savings for this measure.
E V A L U A T I O N P R O T O C O L For most projects, the appropriate evaluation protocol is to verify installation and proper selection of default values. For projects using customer specific data for open variables, the appropriate evaluation protocol is to verify installation and proper application of TRM protocol along with verification of open variables.
It is noted that if site-specific data is used to determine HOU, then the same data must be used to determine the site-specific CF. Similarly, if the default TRM HOU is used, then the default TRM CF must also be used in the savings calculations. The Pennsylvania Evaluation Framework provides specific guidelines and requirements for evaluation procedures.
S O U R C E S
1) Efficiency Vermont. Technical Reference User Manual: Measure Savings Algorithms and Cost Assumptions (July 2008).
SECTION 2: Residential MeasuresMiscellaneous Page 259
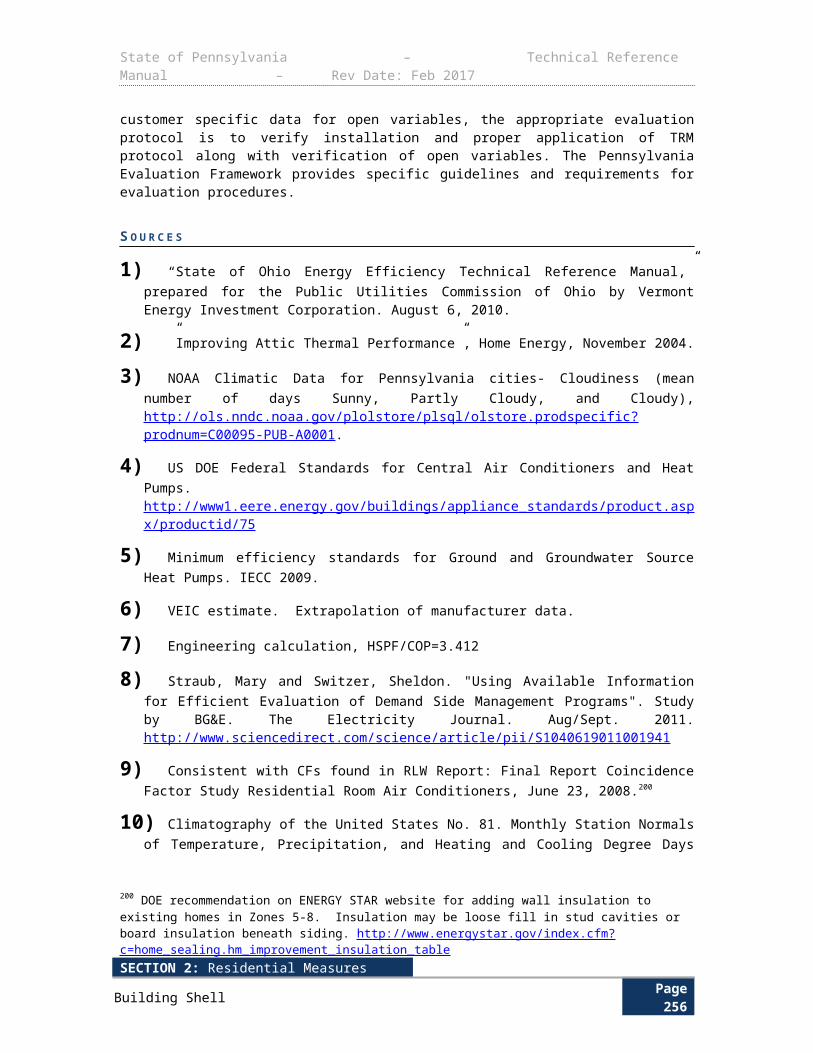
State of Pennsylvania – Technical Reference Manual – Rev Date: Feb 2017
3.1.7 LED REFRIGERATION DISPLAY CASE LIGHTING
Measure Name LED Refrigeration Display Case Lighting
Target Sector Commercial and Industrial Establishments
Measure Unit Refrigeration Display Case Lighting
Unit Energy Savings Variable
Unit Peak Demand Reduction Variable
Measure Life 8 years268
Measure Vintage Early Replacement
This protocol applies to LED lamps with and without motion sensors installed in vertical display refrigerators, coolers, and freezers replacing T8 or T12 linear fluorescent lamps. The LED lamps produce less waste heat than the fluorescent baseline lamps, decreasing the cooling load on the refrigeration system and energy needed by the refrigerator compressor. Additional savings can be achieved from the installation of motion sensors which dim the lights when the space is unoccupied.
E L I G I B I L I T Y
This measure is targeted to non-residential customers who install LED case lighting with or without motion sensors on refrigerators, coolers, and freezers - specifically on vertical displays. The baseline equipment is assumed to be cases with uncontrolled T8 or T12 linear fluorescent lamps.
A L G O R I T H M S
Savings and assumptions are based on a per door basis.
kWh ¿(WATTSbase−WATTSee )
1000× Ndoors×HOURS× (1+ IF )
∆ kW peak¿
(WATTSbase−WATTSee )1000
× Ndoors× (1+ IF )×CF
268 Average values were estimated based on wattages data obtained from major channel letter lighting product manufacturers. San Diego Gas & Electric, LED Channel Letter Signs, Work Paper WPSDGENRLG0021, Revision #1, August 25, 2010.
SECTION 2: Residential MeasuresMiscellaneous Page 260
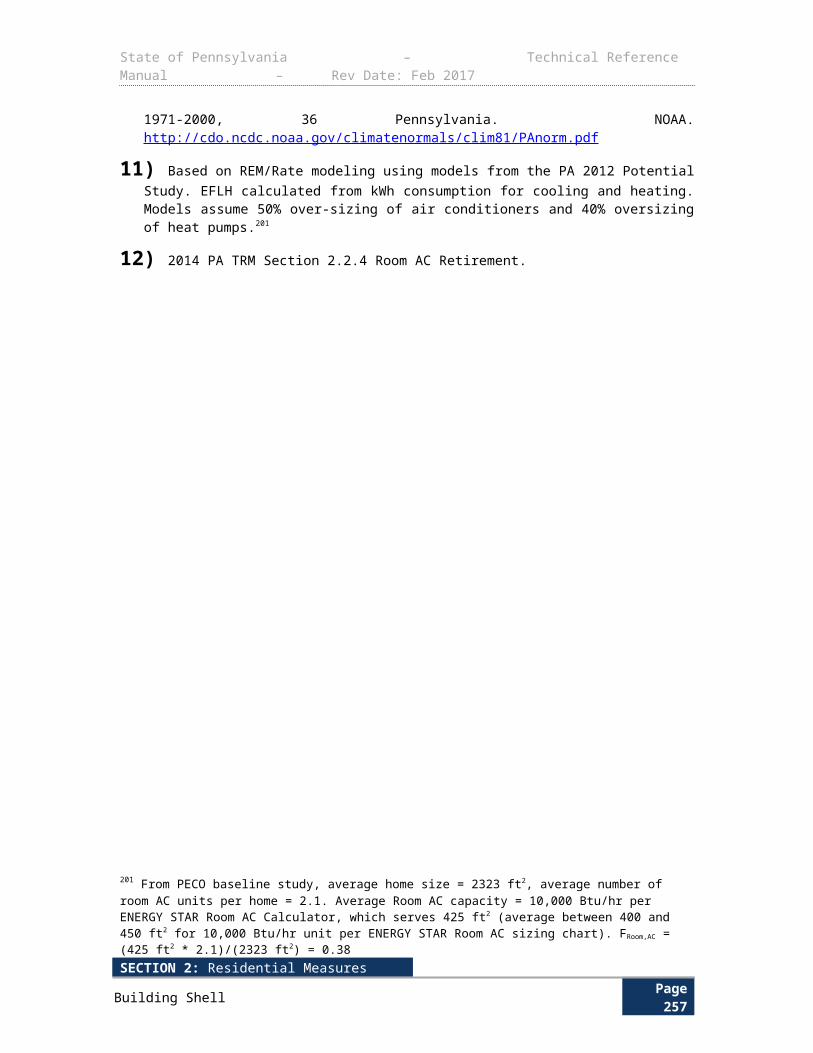
State of Pennsylvania – Technical Reference Manual – Rev Date: Feb 2017
D E F I N I T I O N O F T E R M S
Table 3-158: LED: Refrigeration Case Lighting – Values and References
Term Unit Values Source
WATTSbase, Connected wattage of baseline fixtures
W EDC Data Gathering EDC Data Gathering
WATTSee, Connected wattage of efficient fixtures W EDC Data Gathering EDC Data Gathering
N doors, Number of doors None EDC Data Gathering EDC Data Gathering
HOURS, Annual operating hoursHoursYear
EDC Data Gathering
Default: 6,2051
IF , Interactive Effects factor for energy to account for cooling savings from efficient lighting
NoneRefrigerator and
cooler: 0.29
Freezer: 0.502
CF , Coincidence factor Decimal 0.92 3
1000, Conversion factor from watts to kilowattsWkW
1000 Conversion Factor
D E F A U L T S A V I N G S
Default savings may be claimed using the algorithms above and the variable defaults. EDCs may also claim savings using customer specific data.
E V A L U A T I O N P R O T O C O L S
For most projects, the appropriate evaluation protocol is to verify installation and proper selection of default values. For projects using customer specific data for open variables, the appropriate evaluation protocol is to verify installation and proper application of TRM protocol along with verification of open variables. The Pennsylvania Evaluation Framework provides specific guidelines and requirements for evaluation procedures.
S O U R C E S
1) Theobald, M. A., Emerging Technologies Program: Application Assessment Report #0608, LED Supermarket Case Lighting Grocery Store, Northern California, Pacific Gas and Electric Company, January 2006. <http://www.etcc-ca.com/images/stories/pdf/ETCC_Report_204.pdf>. Assumes 6,205 annual operating hours and 50,000 lifetime hours. Most case lighting runs continuously (24/7) but some can be controlled. 6,205 annual hours of use can be used to represent the mix. Using grocery store hours of use (4,660 hr) is too conservative since case lighting is not tied to store lighting.
2) Values adopted from Hall, N. et al, New York Standard Approach for Estimating Energy Savings from Energy Efficiency Measures in Commercial and Industrial Programs, TecMarket Works, September 1, 2009.
SECTION 2: Residential MeasuresMiscellaneous Page 261
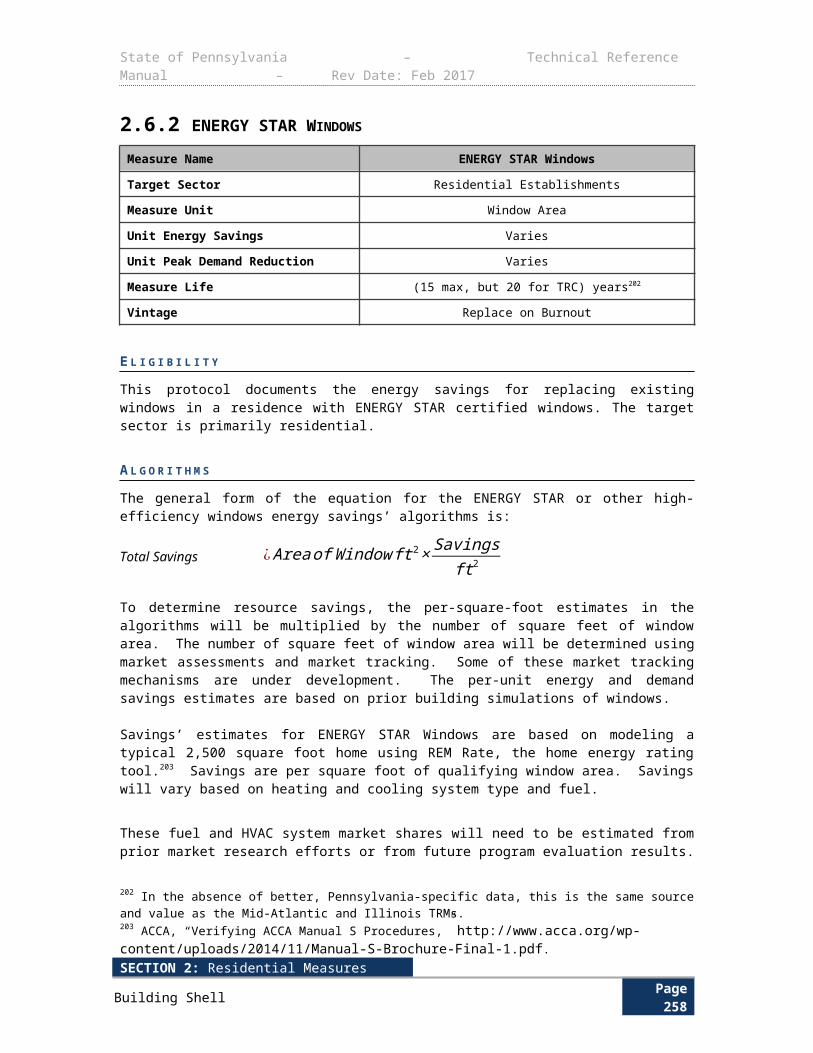
State of Pennsylvania – Technical Reference Manual – Rev Date: Feb 2017
http://www3.dps.ny.gov/W/PSCWeb.nsf/0/06f2fee55575bd8a852576e4006f9af7/$FILE/TechManualNYRevised10-15-10.pdf
3) Methodology adapted from Kuiken et al, “State of Wisconsin Public Service Commission of Wisconsin Focus on Energy Evaluation Business Programs: Deemed Savings Parameter Development”, KEMA, November 13, 2009, assuming summer coincident peak period is defined as June through August on weekdays between 3:00 p.m. and 6:00 p.m., unless otherwise noted. https://focusonenergy.com/sites/default/files/bpdeemedsavingsmanuav10_evaluationreport.pdf
SECTION 2: Residential MeasuresMiscellaneous Page 262
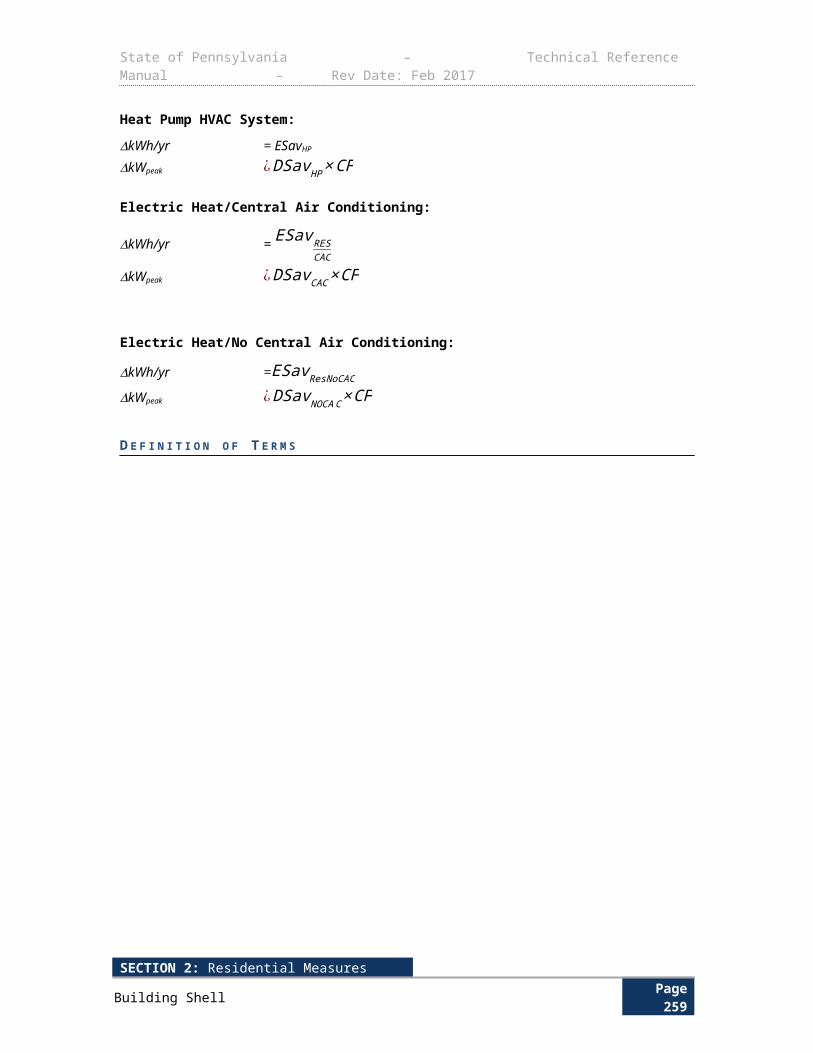
State of Pennsylvania – Technical Reference Manual – Rev Date: Feb 2017
3.2 HVAC3.2.1 HVAC SYSTEMS
Measure Name HVAC Systems
Target Sector Commercial and Industrial Establishments
Measure Unit HVAC System
Unit Energy Savings Variable
Unit Peak Demand Reduction Variable
Measure Life 15 years269
Measure Vintage Replace on Burnout, New Construction, or Early Replacement
E L I G I B I L I T Y
The energy and demand savings for Commercial and Industrial HVAC systems is determined from the algorithms listed below. This protocol excludes water source, ground source, and groundwater source heat pumps measures that are covered in Section 3.2.3. All HVAC applications other than comfort cooling and heating, such as process cooling, are defined as non-standard applications and are ineligible for this measure.
A L G O R I T H M S
Air Conditioning (includes central AC, air-cooled DX, split systems, and packaged terminal AC)
For A/C units < 65,000 Btuhr , use SEER to calculate kWh and convert SEER to EER to calculate
∆ kW peak using 11.3/13 as the conversion factor. For units rated in both EER and IEER, use IEER for energy savings calculations.
kWh ¿( Btucoolhr× 1kW
1000W )×( 1EERbase
− 1EERee )× EFLH cool
¿( Btucoolhr× 1kW
1000W )×( 1IEERbase
− 1IEERee )×EFLH cool
¿( Btucoolhr× 1kW
1000W )×( 1SEERbase
− 1S EERee )×EFLH cool
∆ kW peak¿( Btucoolhr
× 1kW1000W )×( 1
EERbase− 1EERee )×CF
269 ibid
SECTION 2: Residential MeasuresMiscellaneous Page 263
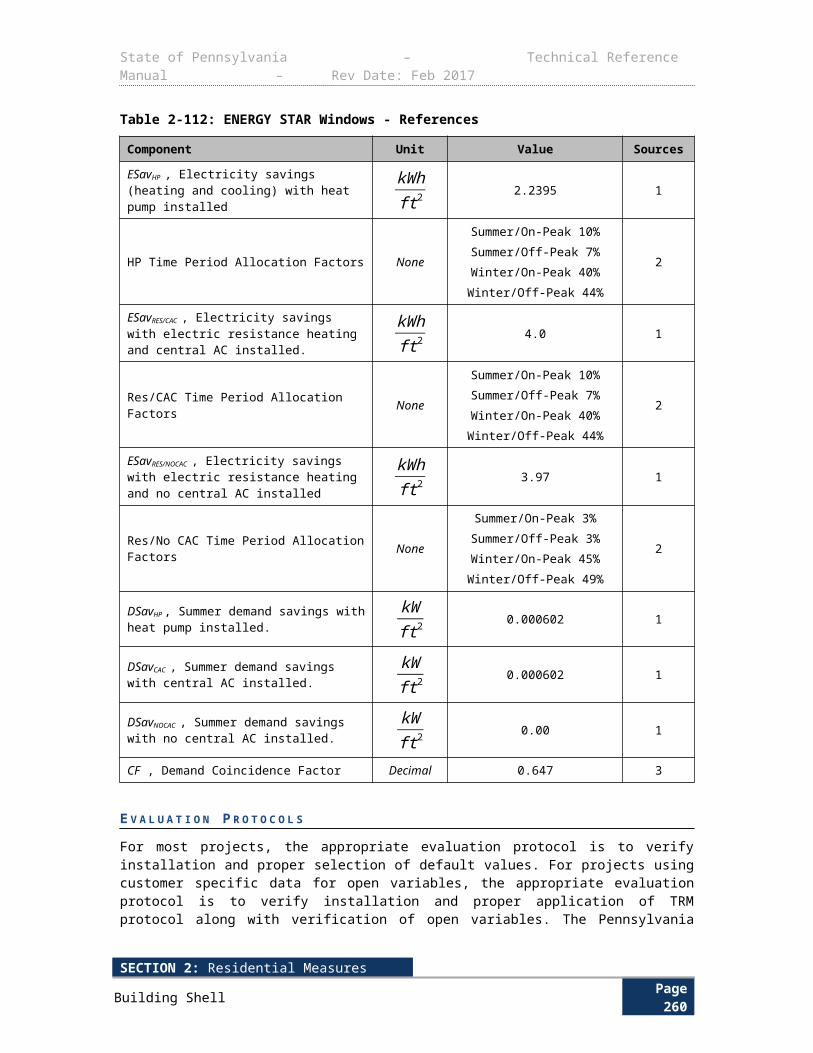
State of Pennsylvania – Technical Reference Manual – Rev Date: Feb 2017
Air Source and Packaged Terminal Heat Pump
For ASHP units < 65,000 Btuhr
, use SEER to calculate∆ kWhcool and HSPF to calculate ∆ kWhheat
. Convert SEER to EER to calculate ∆ kW peak using 11.3/13 as the conversion factor. For units rated in both EER and IEER, use IEER for energy savings calculations.
kWh ¿∆ kWhcool+∆ kWhheat
kWhcool ¿( Btucoolhr× 1kW
1000W )×( 1EERbase
− 1EERee )× EFLH cool
¿( Btucoolhr× 1kW
1000W )×( 1IEERbase
− 1IEERee )×EFLH cool
¿( Btucoolhr× 1kW
1000W )×( 1SEERbase
− 1S EERee )×EFLH cool
kWhheat¿( Btuheathr
× 1kW1000W )× 1
3.412×( 1COPbase
− 1COPee )×EFLH heat
¿( Btuheathr× 1kW
1000W )×( 1HSPFbase
− 1HSPF ee )×EFLH heat
∆ kW peak¿( Btucoolhr
× 1kW1000W )×( 1
EERbase− 1EERee )×CF
D E F I N I T I O N O F T E R M S
Table 3-159: Variables for HVAC Systems
Term Unit Values Source
Btucoolhr
, Rated cooling capacity of the
energy efficient unit
Btuhr
Nameplate data (AHRI or AHAM) EDC Data Gathering
Btuheathr
, Rated heating capacity of the
energy efficient unit
Btuhr
Nameplate data (AHRI or AHAM) EDC Data Gathering
IEERbase, Integrated energy efficiency ratio of the baseline unit.
Early Replacement: Nameplate data EDC Data Gathering
SECTION 2: Residential MeasuresMiscellaneous Page 264
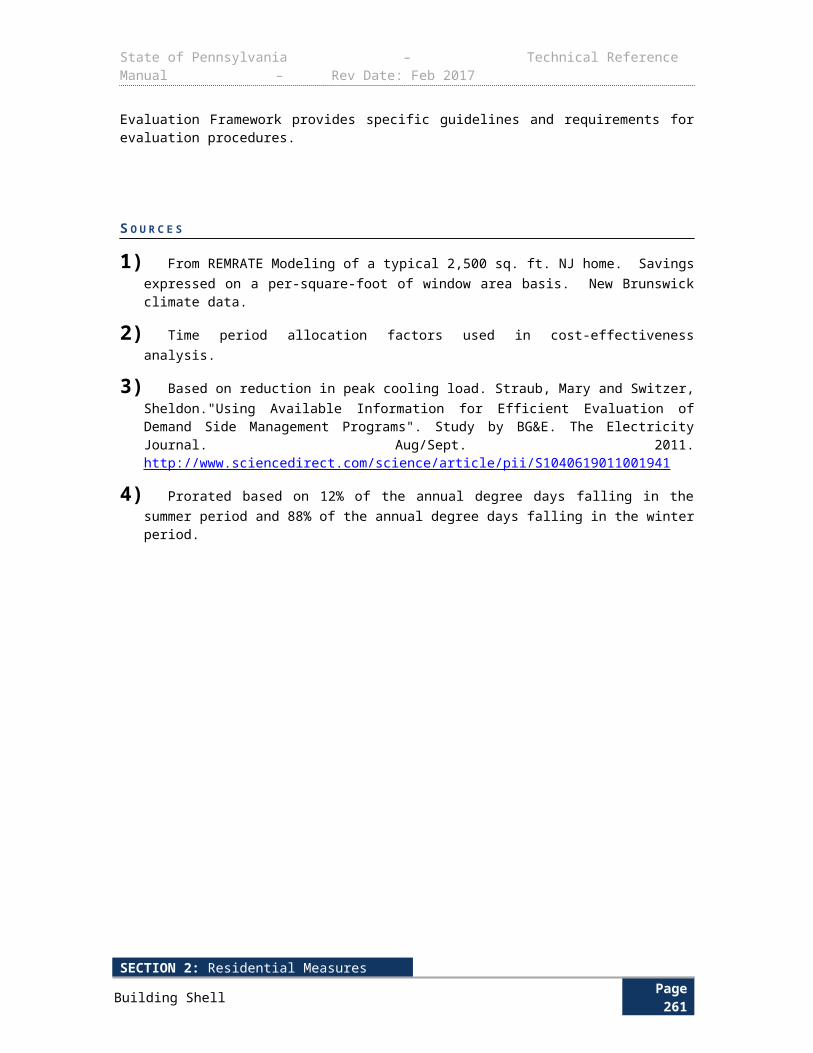
State of Pennsylvania – Technical Reference Manual – Rev Date: Feb 2017
Term Unit Values Source
BtuhrW
New Construction or Replace on Burnout: Default values from
Table 3-160
See Table 3-160
IEERee, Integrated energy efficiency ratio of the energy efficient unit.
BtuhrW
Nameplate data (AHRI or AHAM) EDC Data Gathering
EERbase, Energy efficiency ratio of the baseline unit. For air-source AC and ASHP
units < 65,000 Btuhr
, SEER should be used
for cooling savings
BtuhrW
Early Replacement: Nameplate data EDC Data Gathering
New Construction or Replace on Burnout: Default values from
Table 3-160See Table 3-160
EERee, Energy efficiency ratio of the energy efficient unit. For air-source AC and
ASHP units < 65,000 Btuhr
, SEER should
be used for cooling savings.
BtuhrW
Nameplate data (AHRI or AHAM) EDC Data Gathering
SEERbase, Seasonal energy efficiency ratio of the baseline unit. For units > 65,000 Btuhr
, EER should be used for cooling
savings.
BtuhrW
Early Replacement: Nameplate data EDC Data Gathering
New Construction or Replace on Burnout: Default values from
Table 3-160
See Table 3-160
SEERee, Seasonal energy efficiency ratio of the energy efficient unit. For units >
65,000 Btuhr
, EER should be used for
cooling savings.
BtuhrW
Nameplate data (AHRI or AHAM) EDC Data Gathering
COPbase, Coefficient of performance of the baseline unit. For ASHP units < 65,000Btuhr
, HSPF should be used for heating
savings.
None
Early Replacement: Nameplate data EDC Data Gathering
New Construction or Replace on Burnout: Default values from
Table 3-160
See Table 3-160
SECTION 2: Residential MeasuresMiscellaneous Page 265
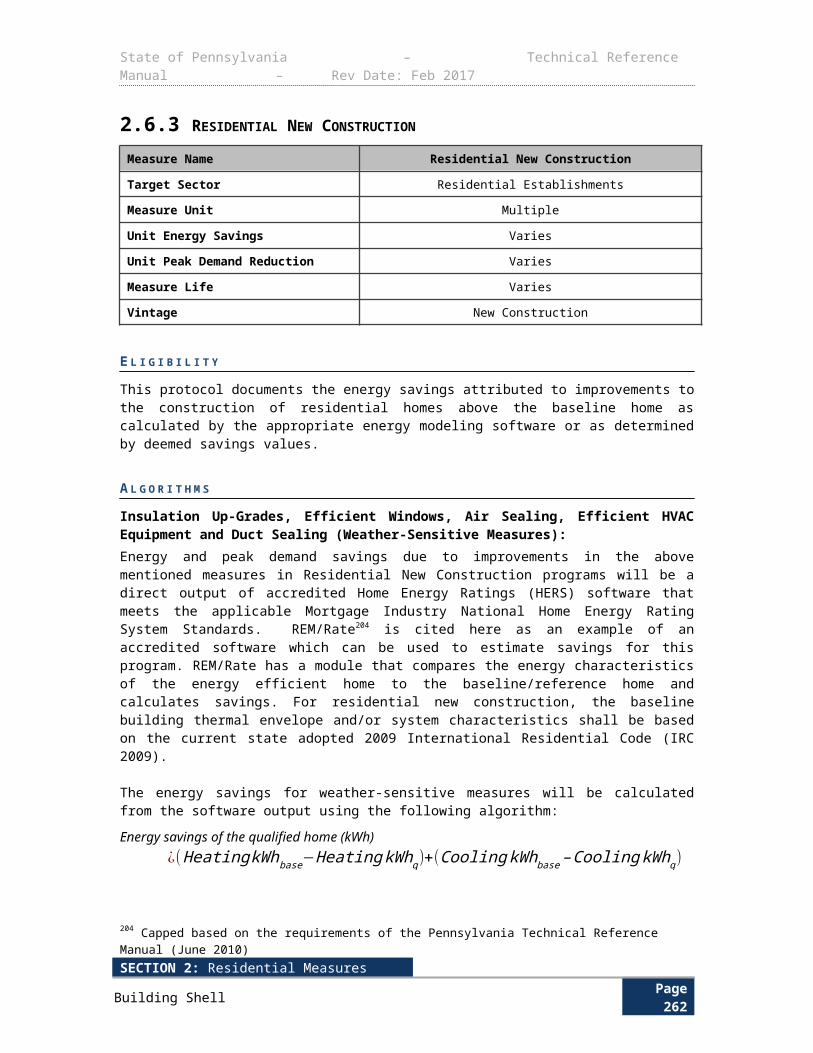
State of Pennsylvania – Technical Reference Manual – Rev Date: Feb 2017
Term Unit Values Source
COPee, Coefficient of performance of the energy efficient unit. For ASHP units <
65,000 Btuhr
HSPF should be used for
heating savings.
None Nameplate data (AHRI or AHAM) EDC Data Gathering
HSPFbase, Heating seasonal performance factor of the baseline unit. For units >
65,000 Btuhr
, COP should be used for
heating savings.
BtuhrW
Early Replacement: Nameplate data EDC Data Gathering
New Construction or Replace on Burnout: Default values from
Table 3-160
See Table 3-160
HSPFee, Heating seasonal performance factor of the energy efficiency unit. For
units > 65,000 Btuhr
, COP should be used
for heating savings.
BtuhrW
Nameplate data (AHRI or AHAM) EDC Data Gathering
SECTION 2: Residential MeasuresMiscellaneous Page 266
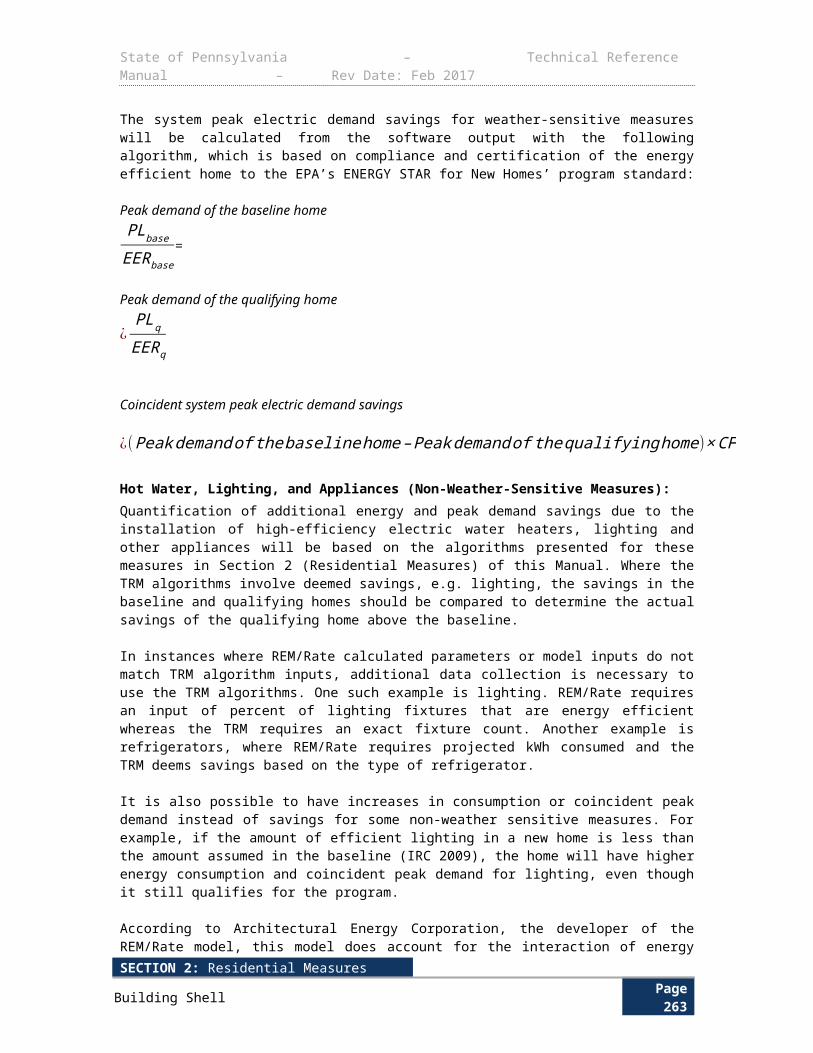
State of Pennsylvania – Technical Reference Manual – Rev Date: Feb 2017
Term Unit Values Source
CF , Demand Coincidence Factor Decimal
EDC Data Gathering EDC Data Gathering
See
Error: Referencesource not found
1
EFLH cool, Equivalent Full Load Hours for the cooling season – The kWh during the entire operating season divided by the kW at design conditions.
HoursYear
EDC Data Gathering EDC Data Gathering
Default values from Table 3-161 1
EFLH heat, Equivalent Full Load Hours for the heating season – The kWh during the entire operating season divided by the kW at design conditions.
HoursYear
EDC Data Gathering EDC Data Gathering
Default values from Table 3-163 1
SECTION 2: Residential MeasuresMiscellaneous Page 267
State of Pennsylvania – Technical Reference Manual – Rev Date: Feb 2017
Term Unit Values Source
11.3/13, Conversion factor from SEER to EER, based on average EER of a SEER 13 unit
None11.313
2
1000, conversion from watts to kilowattsWkW
1000 Conversion Factor
Note: For water-source and evaporatively-cooled air conditioners, subtract 0.2 from the required baseline efficiency rating value if unit has heating section other than electric resistance.
Table 3-160: HVAC Baseline Efficiencies270
Equipment Type and Capacity Cooling Baseline Heating Baseline
Air-Source Air Conditioners
< 65,000 Btuhr
13.0 SEER N/A
> 65,000 Btuhr
and <135,000
Btuhr
11.2 EER11.4 IEER N/A
> 135,000 Btuhr
and < 240,000
Btuhr
11.0 EER11.2 IEER N/A
> 240,000 Btuhr
and < 760,000
Btuhr
10.0 EER10.1 IEER N/A
> 760,000 Btuhr 9.7 EER
9.8 IEER N/A
Air-Source Heat Pumps
< 65,000 Btuhr
13 SEER 7.7 HSPF
270 The peak demand reduction is zero, as the exterior lighting applications are assumed to be in operation during off-peak hours and have a peak coincidence factor of 0.0.
SECTION 2: Residential MeasuresMiscellaneous Page 268
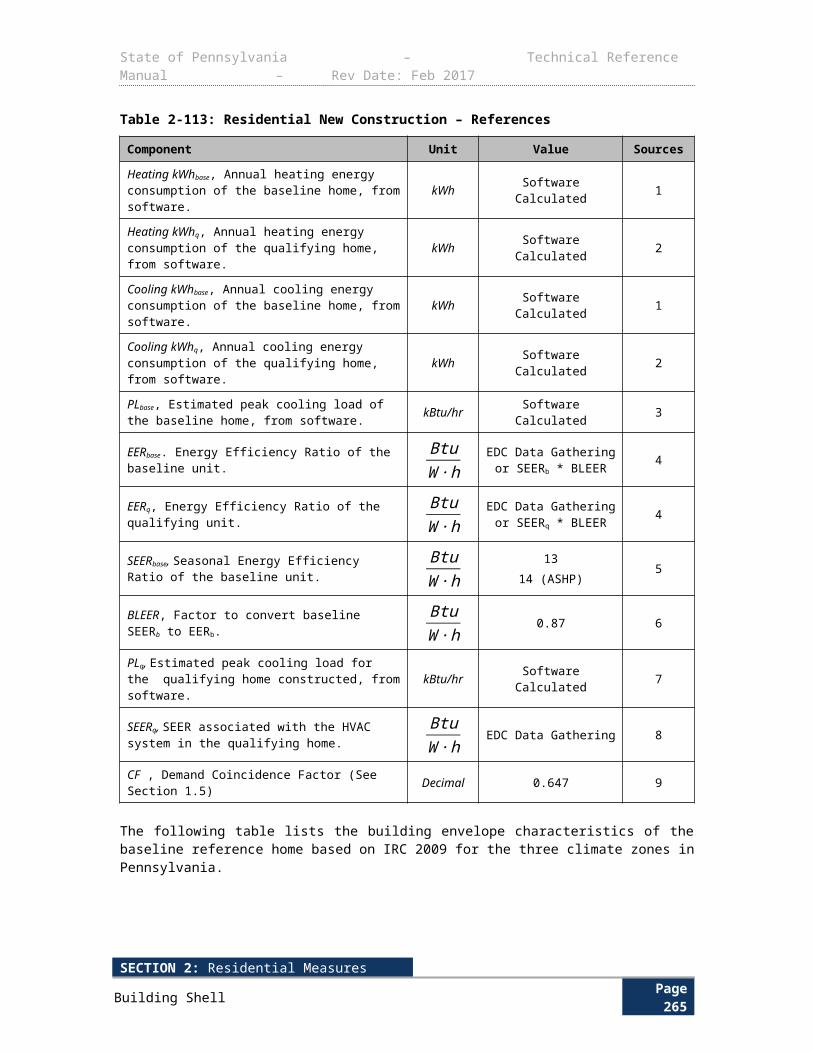
State of Pennsylvania – Technical Reference Manual – Rev Date: Feb 2017
Equipment Type and Capacity Cooling Baseline Heating Baseline
> 65,000 Btuhr
and <135,000
Btuhr
11.0 EER11.2 IEER 3.3 COP
> 135,000 Btuhr
and < 240,000
Btuhr
10.6 EER10.7 IEER 3.2 COP
> 240,000 Btuhr 9.5 EER
9.6 IEER 3.2 COP
Packaged Terminal Systems (Nonstandard Size) - Replacement 271, 272
PTAC (cooling) 10.9 - (0.213 x Cap / 1000) EER N/A
PTHP 10.8 - (0.213 x Cap / 1000) EER 2.9 - (0.026 x Cap / 1000) COP
Packaged Terminal Systems (Standard Size) – New Construction 273, 274
PTAC (cooling) 12.5 - (0.213 x Cap / 1000) EER N/A
PTHP 12.3 - (0.213 x Cap / 1000) EER 3.2 - (0.026 x Cap / 1000) COP
Water-Cooled Air Conditioners
271 Theobald, M. A., Emerging Technologies Program: Application Assessment Report #0608, LED Supermarket Case Lighting Grocery Store, Northern California, Pacific Gas and Electric Company, January 2006. <http://www.etcc-ca.com/images/stories/pdf/ETCC_Report_204.pdf>. Assumes 6,205 annual operating hours and 50,000 lifetime hours. Most case lighting runs continuously (24/7) but some can be controlled. 6,205 annual hours of use can be used to represent the mix. Using grocery store hours of use (4,660 hr) is too conservative since case lighting is not tied to store lighting.272 The Measure Life Report for Residential and Commercial/Industrial Lighting and HVAC Measures, GDS Associates, Inc., June 2007. http://library.cee1.org/sites/default/files/library/8842/CEE_Eval_MeasureLifeStudyLights%26HVACGDS_1Jun2007.pdf 273 Baseline values from IECC 2009 (https://law.resource.org/pub/us/code/ibr/icc.iecc.2009.pdf), after Jan 1, 2010 or Jan 23, 2010 as applicable. Integrated Energy Efficiency Ratio (IEER) requirements have been incorporated from ASHRAE 90.1-2007, “Energy Standard for Buildings Except Low-Rise Residential Buildings”, 2008 Supplement (Addendum S: (Tables 6.8.1A and 6.8.1B). IECC 2009 does not present IEER requirements.274Nonstandard size packaged terminal air conditioners and heat pumps with existing sleeves having an external wall opening of less than 16 in. high or less than 42 in. wide and having a cross-sectional area less than 670 in. Shall be factory labeled as follows: Manufactured for nonstandard size applications only: not to be installed in new construction projects.
SECTION 2: Residential MeasuresMiscellaneous Page 269
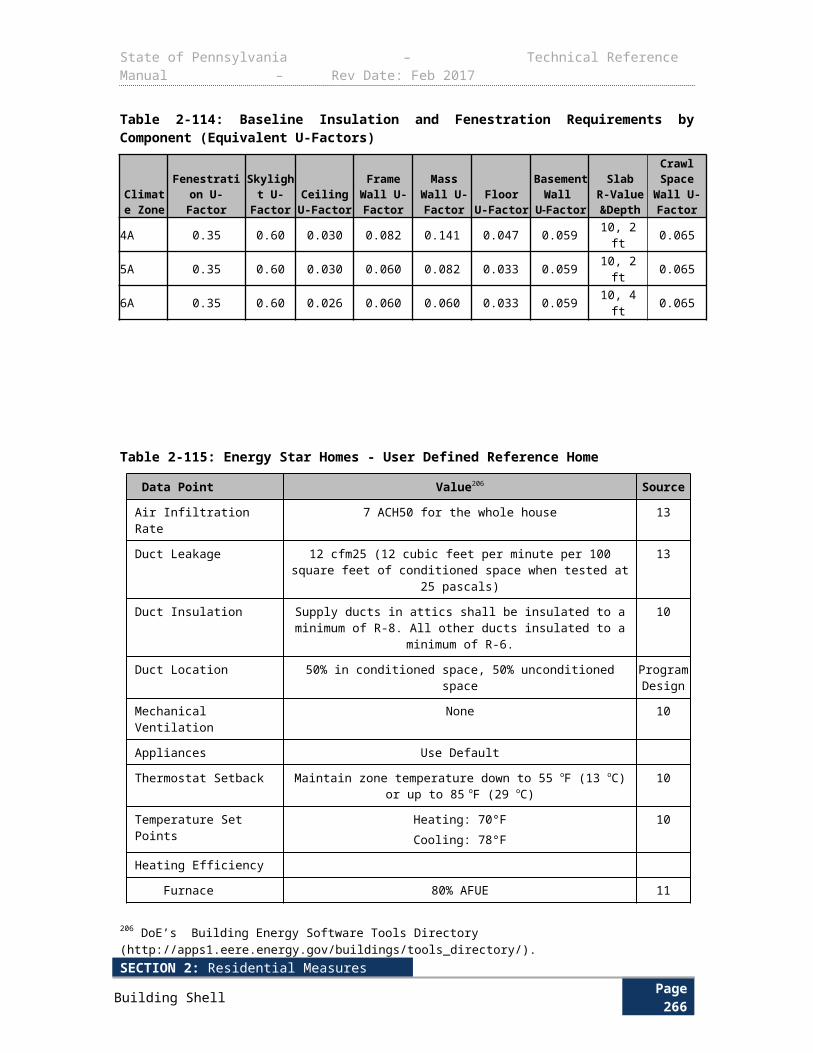
State of Pennsylvania – Technical Reference Manual – Rev Date: Feb 2017
Equipment Type and Capacity Cooling Baseline Heating Baseline
< 65,000 Btuhr
12.1 EER12.3 IEER N/A
> 65,000 Btuhr
and <135,000
Btuhr
12.1 EER12.3 IEER N/A
> 135,000 Btuhr
and < 240,000
Btuhr
12.5 EER12.7 IEER N/A
> 240,000 Btuhr
and < 760,000
Btuhr
12.4 EER12.6 IEER N/A
> 760,000 Btuhr
11.0 EER11.1 IEER N/A
Evaporatively-Cooled Air Conditioners
< 65,000 Btuhr
12.1 EER12.3 IEER N/A
> 65,000 Btuhr
and <135,000
Btuhr
12.1 EER12.3 IEER N/A
> 135,000 Btuhr
and < 240,000
Btuhr
12.0 EER12.2 IEER N/A
> 240,000 Btuhr
and < 760,000
Btuhr
11.9 EER12.1 IEER N/A
> 760,000 Btuhr
11.0 EER11.1 IEER N/A
Note: For air-source air conditioners and air-source heat pumps, subtract 0.2 from the required baseline efficiency rating value if unit has heating section other than electric resistance.
SECTION 2: Residential MeasuresMiscellaneous Page 270
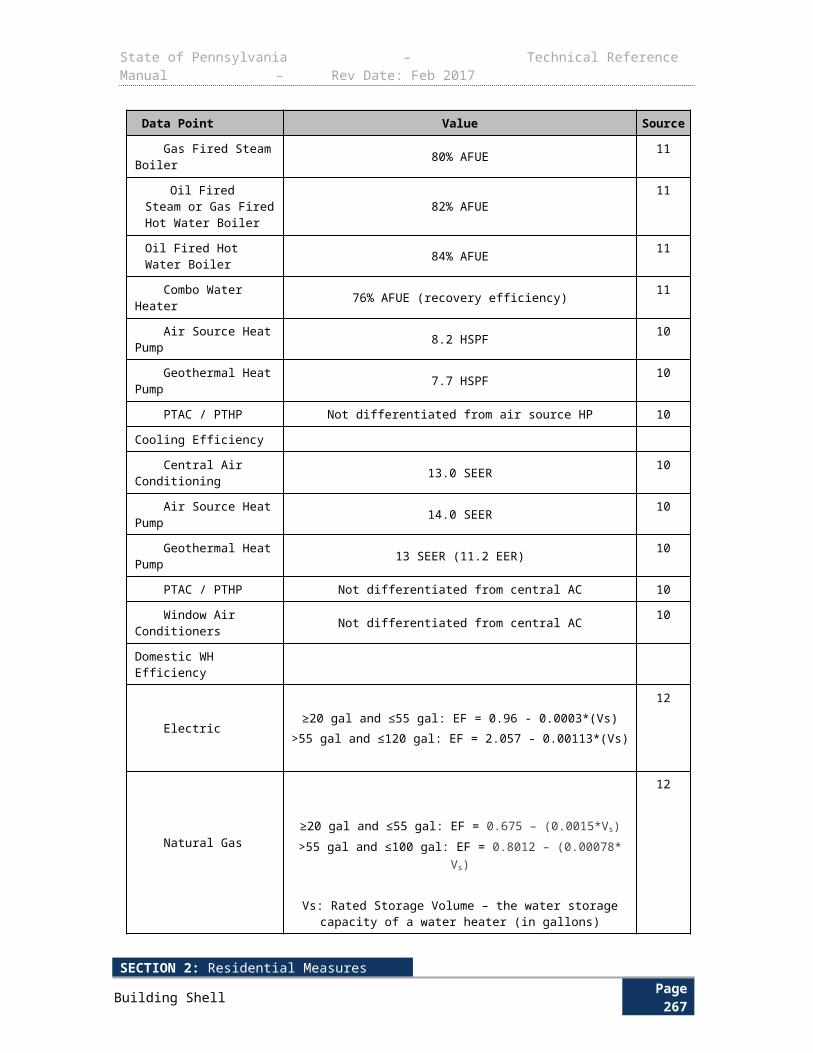
State of Pennsylvania – Technical Reference Manual – Rev Date: Feb 2017
Table 3-161: Air Conditioning EFLHs for Pennsylvania Cities
Space and/or Building Type
Alle
ntow
n
Erie
Har
risbu
rg
Phila
delp
hia
Pitts
burg
h
Scra
nton
Will
iam
spor
t
Assembly 753 607 820 1,087 706 629 685
Education - Community College 603 436 620 695 557 515 594
Education - Primary School 250 154 277 302 255 204 208
Education - Relocatable Classroom 301 198 326 359 303 229 246
Education - Secondary School 249 204 327 375 262 219 264
Education - University 677 520 693 773 630 550 595
Grocery 654 636 453 536 638 434 442
Health/Medical - Hospital 1,030 1,038 892 1,059 788 1,022 1,013
Health/Medical - Nursing Home 477 481 540 684 511 467 476
Lodging - Hotel 1,386 1,392 1,523 1,732 1,478 1,348 1,384
Manufacturing – Bio Tech/High Tech 785 548 766 858 710 594 627
Manufacturing – 1 Shift/Light Industrial 355 274 465 506 349 296 329
Multi-Family (Common Areas)275 1,395 769 1,482 1,647 1,176 991 1,052
Office - Large 480 433 601 754 749 595 490
Office - Small 435 391 529 653 692 404 442
Restaurant - Fast-Food 545 478 574 790 602 524 569
Restaurant - Sit-Down 555 548 605 791 662 519 618
Retail - Multistory Large 763 595 803 807 673 629 694
Retail - Single-Story Large 747 574 771 988 738 640 642
Retail - Small 695 692 652 938 1,036 541 608
Storage - Conditioned 174 114 235 346 192 130 178
Warehouse - Refrigerated 3,130 3,080 3,163 3,200 3,116 3,094 3,135
275 Cap represents the rated cooling capacity of the product in Btu/hr. If the unit’s capacity is less than 7,000 Btu/hr, 7,000 Btu/hr is used in the calculation. If the unit’s capacity is greater than 15,000 Btu/hr, 15,000 Btu/hr is used in the calculation.
SECTION 2: Residential MeasuresMiscellaneous Page 271
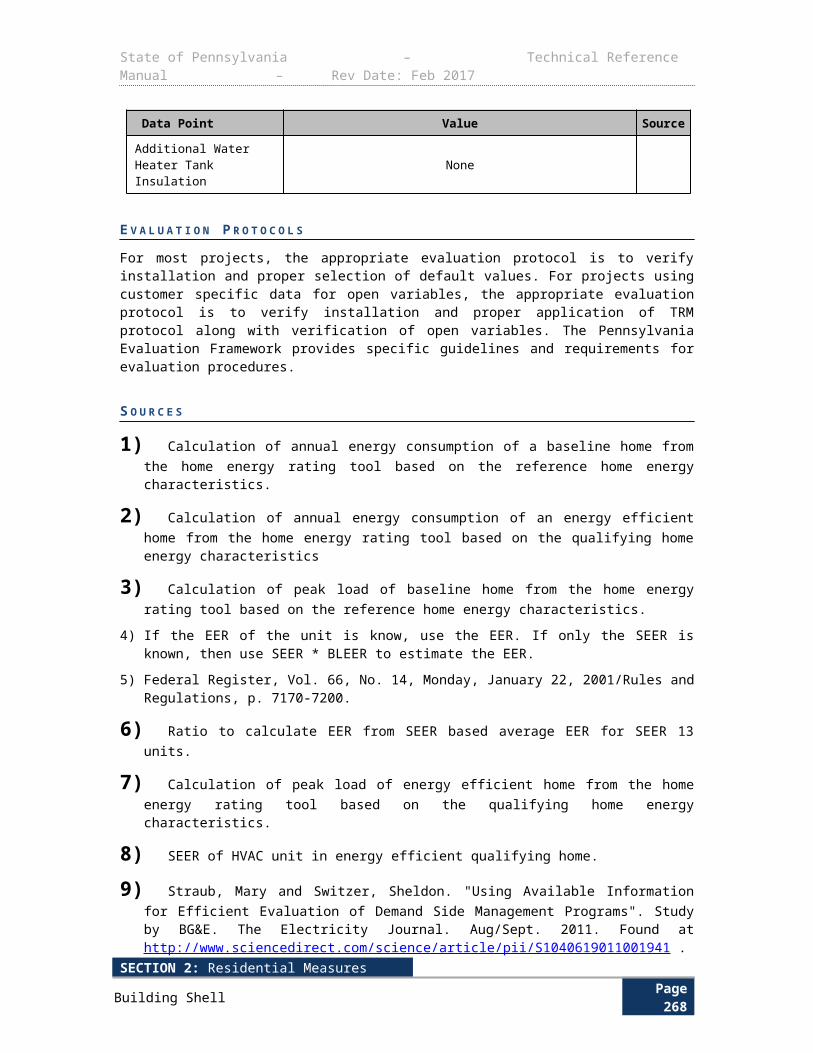
State of Pennsylvania – Technical Reference Manual – Rev Date: Feb 2017
Table 3-162: Air Conditioning Demand CFs for Pennsylvania Cities
Space and/or Building Type
Alle
ntow
n
Erie
Har
risbu
rg
Phila
delp
hia
Pitts
burg
h
Scra
nton
Will
iam
spor
t
Assembly 0.53 0.45 0.60 0.72 0.56 0.48 0.52Education - Community College 0.49 0.37 0.49 0.53 0.49 0.48 0.52Education - Primary School 0.10 0.07 0.16 0.16 0.17 0.11 0.12Education - Relocatable Classroom 0.15 0.11 0.18 0.19 0.20 0.14 0.15Education - Secondary School 0.11 0.10 0.20 0.21 0.18 0.13 0.17Education - University 0.47 0.38 0.47 0.49 0.47 0.42 0.45Grocery 0.33 0.27 0.24 0.26 0.27 0.21 0.24Health/Medical - Hospital 0.43 0.37 0.39 0.44 0.39 0.37 0.42Health/Medical - Nursing Home 0.26 0.27 0.30 0.34 0.32 0.28 0.29Lodging - Hotel 0.72 0.77 0.78 0.83 0.83 0.73 0.78Manufacturing – Bio Tech/High Tech 0.62 0.47 0.61 0.67 0.64 0.54 0.55Manufacturing – 1 Shift/Light Industrial 0.39 0.31 0.49 0.52 0.42 0.36 0.40
Multi-Family (Common Areas)276 0.55 0.55 0.55 0.55 0.55 0.55 0.55Office - Large 0.33 0.32 0.42 0.27 0.35 0.39 0.37Office - Small 0.31 0.30 0.39 0.27 0.34 0.33 0.36Restaurant - Fast-Food 0.36 0.33 0.39 0.47 0.44 0.38 0.42Restaurant - Sit-Down 0.39 0.41 0.45 0.53 0.54 0.40 0.48Retail - Multistory Large 0.52 0.42 0.56 0.53 0.51 0.48 0.51Retail - Single-Story Large 0.50 0.40 0.53 0.63 0.55 0.47 0.47Retail - Small 0.53 0.56 0.51 0.55 0.63 0.45 0.50Storage - Conditioned 0.18 0.13 0.24 0.30 0.23 0.15 0.20Warehouse - Refrigerated 0.50 0.48 0.52 0.53 0.51 0.48 0.51
276 This is intended for applications with standard size exterior wall openings.
SECTION 2: Residential MeasuresMiscellaneous Page 272
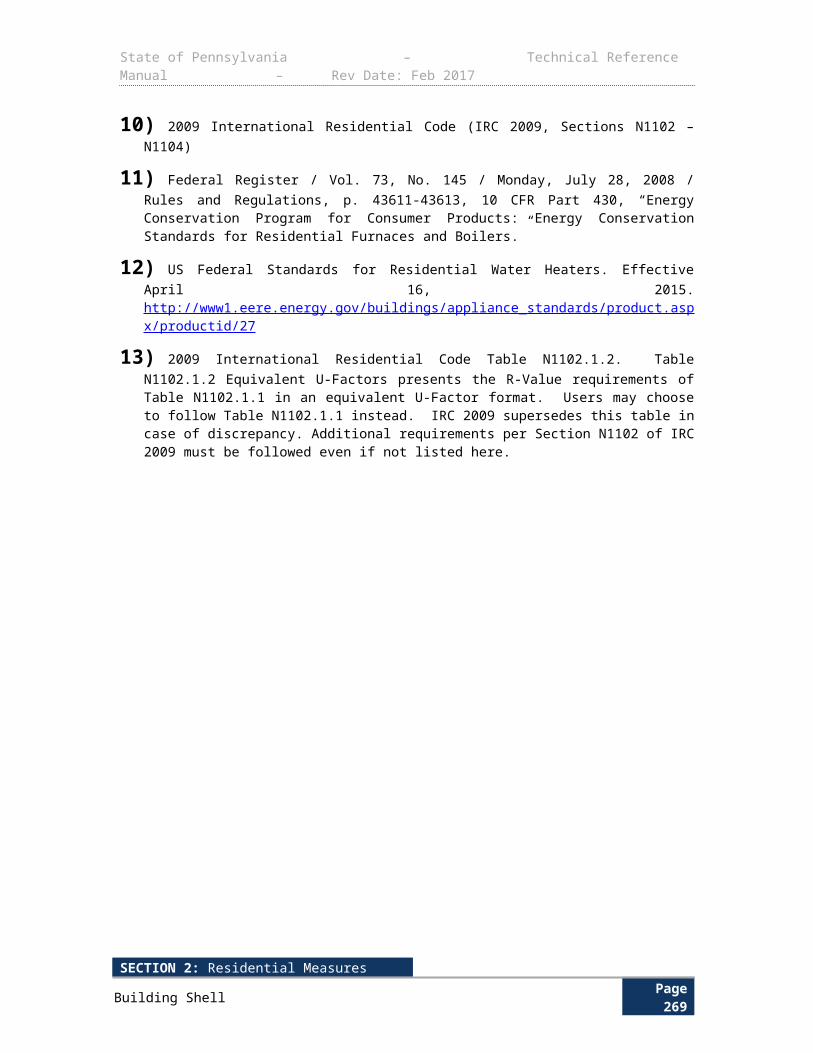
State of Pennsylvania – Technical Reference Manual – Rev Date: Feb 2017
Table 3-163: Heat Pump EFLHs for Pennsylvania Cities
Space and/or Building Type Alle
ntow
n
Erie
Har
risbu
rg
Phila
delp
hia
Pitts
burg
h
Scra
nton
Will
iam
spor
t
Assembly 1,178 1,437 1,098 1,121 1,163 1,401 1,066
Education - Community College 816 966 620 521 734 977 783
Education - Primary School 795 830 651 557 819 879 543
Education - Relocatable Classroom 360 165 863 726 1,056 1,003 745
Education - Secondary School 752 1,002 710 654 776 893 677
Education - University 621 748 483 407 567 670 527
Grocery 733 534 1,269 1,217 564 1,737 1,419
Health/Medical - Hospital 147 95 361 345 418 106 154
Health/Medical - Nursing Home 944 1,304 854 805 1,023 1,193 958
Lodging - Hotel 2,371 3,077 2,159 2,017 2,411 2,591 2,403
Manufacturing - Bio Tech/High Tech 178 193 138 111 172 176 141
Manufacturing – 1 Shift/Light Industrial 633 752 609 567 627 705 550
Multi-Family (Common Areas)277 277 322 263 259 264 281 278
Office - Large 218 292 230 185 227 176 231
Office - Small 423 551 430 376 460 481 448
Restaurant - Fast-Food 1,227 1,627 1,112 1,078 1,363 1,612 1,295
Restaurant - Sit-Down 1,074 1,747 968 908 1,316 1,390 1,187
Retail - Multistory Large 687 828 582 447 620 736 587
Retail - Single-Story Large 791 979 674 735 849 929 654
Retail - Small 949 1,133 689 714 875 900 785
Storage - Conditioned 847 1,114 843 900 978 1,008 800
Warehouse - Refrigerated 363 534 307 222 409 439 328
D E F A U L T S A V I N G S
There are no default savings for this measure.
E V A L U A T I O N P R O T O C O L S
For most projects, the appropriate evaluation protocol is to verify installation and proper selection of default values. For projects using customer specific data for open variables, the appropriate evaluation protocol is to verify installation and proper application of TRM protocol along with verification of open variables. The Pennsylvania Evaluation Framework provides specific guidelines and requirements for evaluation procedures.
277 Cap represents the rated cooling capacity of the product in Btu/hr. If the unit’s capacity is less than 7,000 Btu/hr, 7,000 Btu/hr is used in the calculation. If the unit’s capacity is greater than 15,000 Btu/h, 15,000 Btu/hr is used in the calculation.
SECTION 2: Residential MeasuresMiscellaneous Page 273
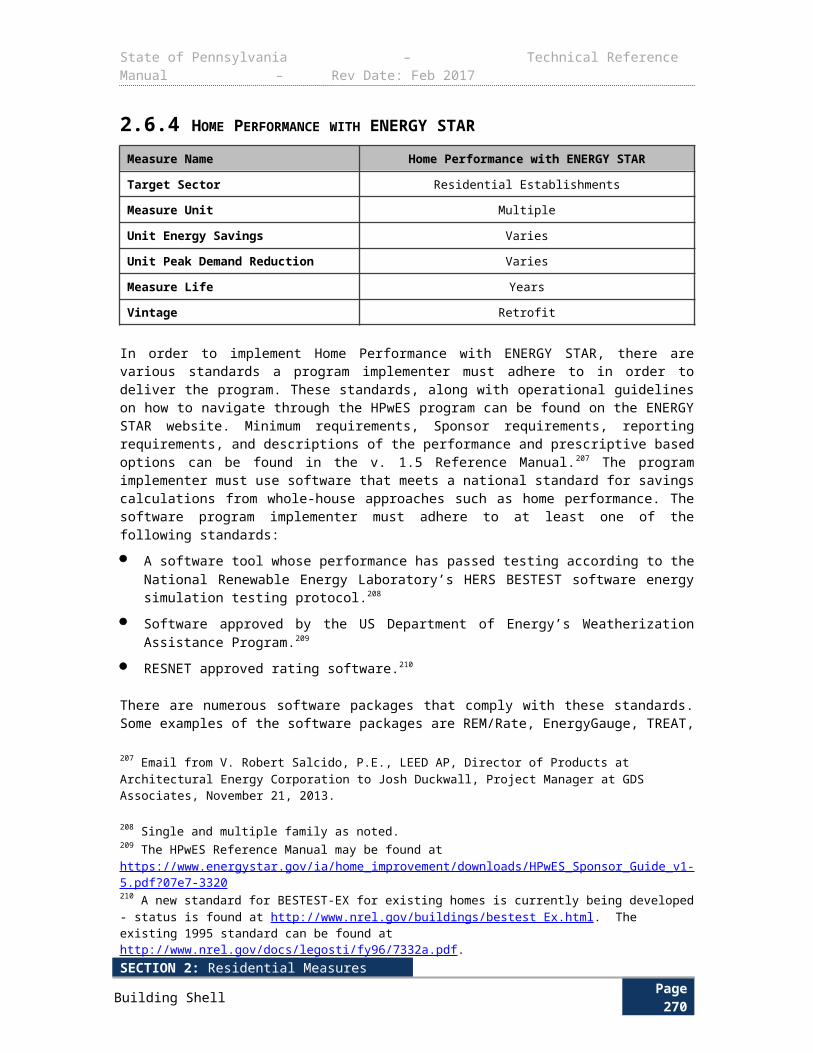
State of Pennsylvania – Technical Reference Manual – Rev Date: Feb 2017
S O U R C E S
1) EFLHs and CFs for Pennsylvania are calculated based on Nexant’s eQuest modeling analysis 2014.
2) Average EER for SEER 13 units as calculated by EER = -0.02 × SEER² + 1.12 × SEER based on U.S. DOE Building America House Simulation Protocol, Revised 2010. http://www.nrel.gov/docs/fy11osti/49246.pdf
SECTION 2: Residential MeasuresMiscellaneous Page 274
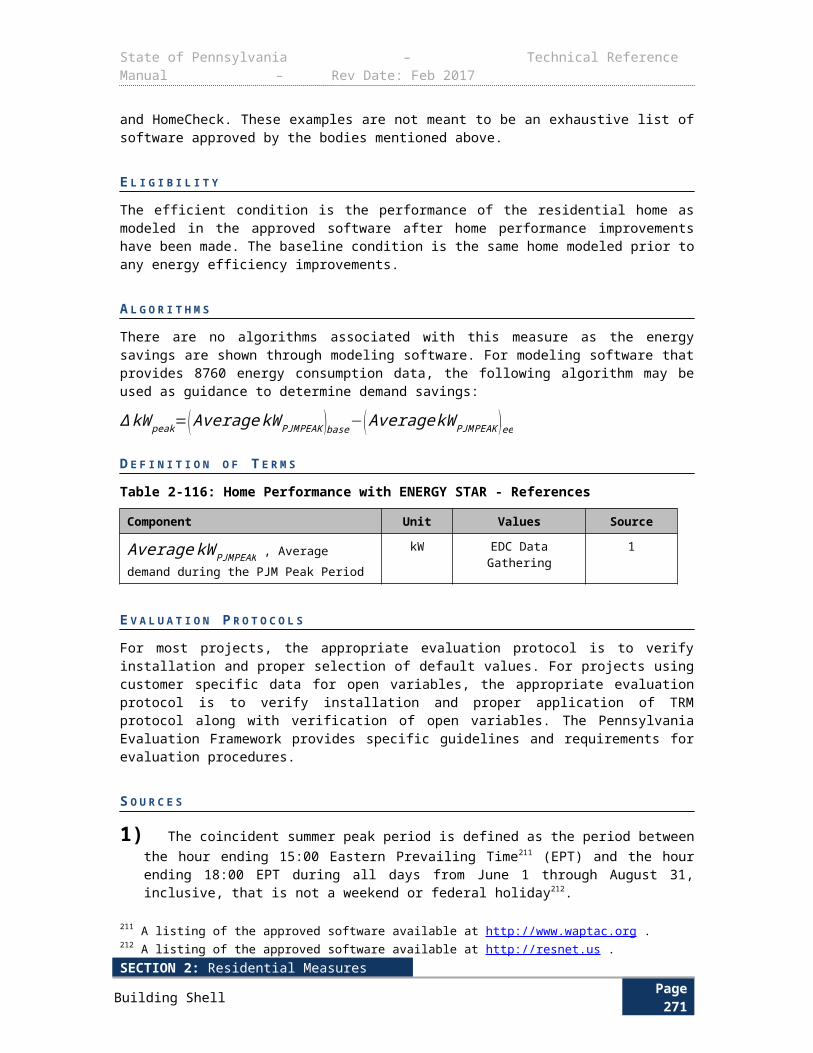
State of Pennsylvania – Technical Reference Manual – Rev Date: Feb 2017
3.2.2 ELECTRIC CHILLERS
Measure Name Electric Chillers
Target Sector Commercial and Industrial Establishments
Measure Unit Electric Chiller
Unit Energy Savings Variable
Unit Peak Demand Reduction Variable
Measure Life 20 years278
Measure Vintage Replace on Burnout, New Construction, or Early Replacement
E L I G I B I L I T Y
This protocol estimates savings for installing high efficiency electric chillers as compared to chillers that meet the minimum performance allowed by the current federal code. The measurement of energy and demand savings for chillers is based on algorithms with key variables (i.e., Efficiency, Coincidence Factor, and Equivalent Full Load Hours (EFLHs). These prescriptive algorithms and stipulated values are valid for standard commercial applications, defined as unitary electric chillers serving a single load at the system or sub-system level. The savings calculated using the prescriptive algorithms need to be supported by a certification that the chiller is appropriately sized for site design load condition.
All other chiller applications, including existing multiple chiller configurations (including redundant or ‘stand-by’ chillers), existing chillers serving multiple load groups, and chillers in industrial applications are defined as non-standard applications and must follow a site-specific custom protocol. Situations with existing non-VFD chillers upgrading to VFD chillers may use the protocol algorithm. This protocol does not apply to VFD retrofits to an existing chiller. In this scenario, the IPLV of the baseline chiller (factory tested IPLV) would be known, but the IPLV for the old chiller/new VFD would be unknown. The algorithms, assumptions, and default factors in this section may be applied to new construction applications.
A L G O R I T H M S
Efficiency ratings in EER
kWh ¿Tonsee×12×( 1IPLV base
−1
IPLV ee )×EFLH∆ kW peak ¿Tonsee×12×( 1
EERbase−
1EERee )×CF
278 US Department of Energy. Energy Star Calculator and Bin Analysis Models. The Equivalent Full Load Hours (ELFH) for Pennsylvania are calculated based on the degree day scaling methodology. The EFLH values reported in the Connecticut Program Savings Documentation were adjusted using full load hours (FLH) from the US DOE ENERGY STAR Calculator to account for differences in weather conditions.
SECTION 2: Residential MeasuresMiscellaneous Page 275

State of Pennsylvania – Technical Reference Manual – Rev Date: Feb 2017
Efficiency ratings in kW/ton
kWh ¿Tonsee× ( IPLV base−IPLV ee )×EFLH
∆ kW peak ¿Tonsee×( kWtonbase
−kWtonee )×CF
D E F I N I T I O N O F T E R M S
Table 3-164: Electric Chiller Variables
Term Unit Values Source
Tonsee , The capacity of the chiller at site design conditions accepted by the program
ton Nameplate Data EDC Data Gathering
kWtonbase
, Design Rated Efficiency of
the baseline chiller.
kWton
Early Replacement: Nameplate Data
EDC Data Gathering
New Construction or Replace on Burnout:
Default value from Table3-165
See Table 3-165
kWtonee
, Design Rated Efficiency of the
energy efficient chiller from the manufacturer data and equipment ratings in accordance with ARI Standards.
kWton
Nameplate Data (ARI Standards 550/590). At minimum, must satisfy standard listed in Table
3-165
EDC Data Gathering
EERbase, Energy Efficiency Ratio of the baseline unit.
BtuhrW
Early Replacement: Nameplate Data
EDC Data Gathering
New Construction or Replace on Burnout:
Default value from Table3-165
See Table 3-165
EERee, Energy Efficiency Ratio of the efficient unit from the manufacturer data and equipment ratings in accordance with ARI Standards.
BtuhrW
Nameplate Data (ARI Standards 550/590). At minimum, must satisfy standard listed in Table
3-165
EDC Data Gathering
IPLV base, Integrated Part Load Value of the baseline unit.
None or kWton
New Construction or Replace on Burnout: See
Table 3-165
See Table 3-165
IPLV ee, Integrated Part Load Value None or Nameplate Data (ARI EDC Data
SECTION 2: Residential MeasuresMiscellaneous Page 276
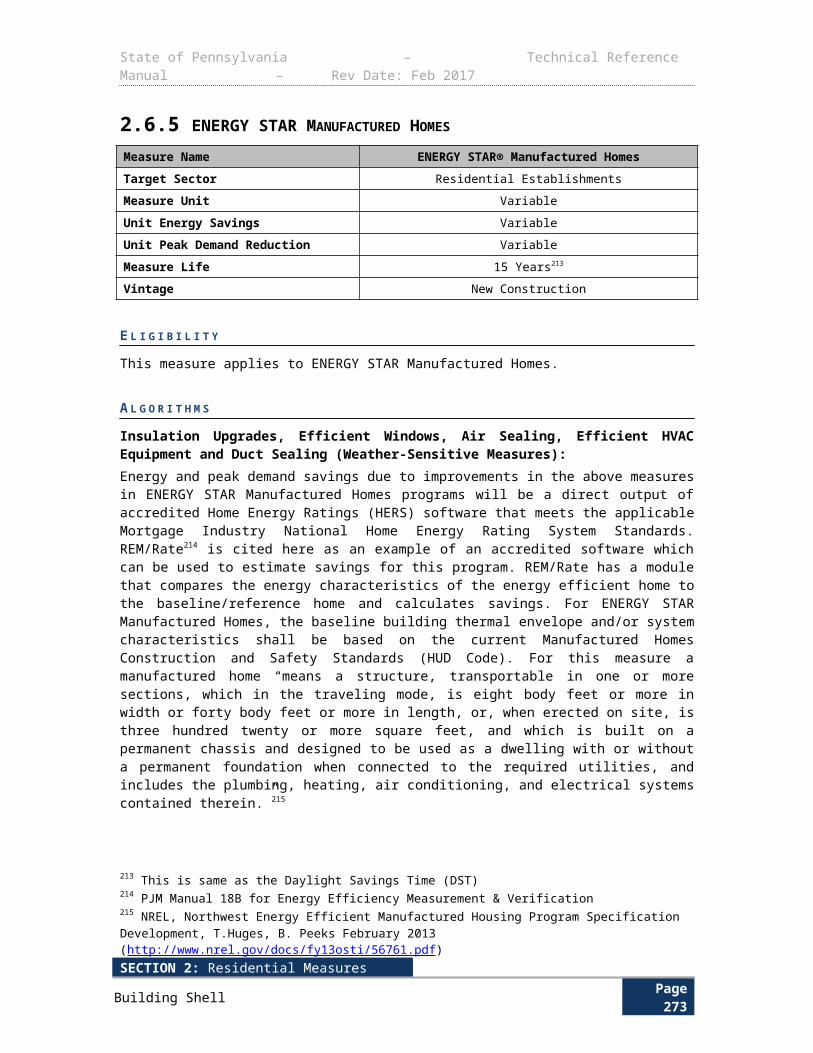
State of Pennsylvania – Technical Reference Manual – Rev Date: Feb 2017
Term Unit Values Source
of the efficient unit. kWton
Standards 550/590). At minimum, must satisfy standard listed in Table
3-165
Gathering
CF, Demand Coincidence Factor Decimal See Table 3-167 1
EFLH , Equivalent Full Load Hours – The kWh during the entire operating season divided by the kW at design conditions. The most appropriate EFLH shall be utilized in the calculation.
HoursYear
Based on Logging, BMS data or Modeling279
EDC Data Gathering
Default values from Table 3-166
1
Table 3-165: Electric Chiller Baseline Efficiencies (IECC 2009)280
Chiller Type Size Path A Path B Source
Air Cooled Chillers
< 150 tons Full load: 9.562 EER
IPLV: 12.500 EER
N/A 2
>=150 tons Full load: 9.562 EER
IPLV: 12.750 EER
N/A
Water Cooled Positive Displacement or Reciprocating Chiller
< 75 tons Full load: 0.780 kW/ton
IPLV: 0.630 kW/ton
Full load: 0.800 kW/ton
IPLV: 0.600 kW/ton
>=75 tons and < 150 tons
Full load: 0.775 kW/ton
IPLV: 0.615 kW/ton
Full load: 0.790 kW/ton
IPLV: 0.586 kW/ton
>=150 tons and < 300 tons
Full load: 0.680 kW/ton
IPLV: 0.580 kW/ton
Full load: 0.718 kW/ton
IPLV: 0.540 kW/ton
>=300 tons Full load: 0.620 kW/ton
IPLV: 0.540 kW/ton
Full load: 0.639 kW/ton
IPLV: 0.490 kW/ton
Water Cooled Centrifugal Chiller
<300 tons Full load: 0.634 kW/ton
IPLV: 0.596 kW/ton
Full load: 0.639 kW/ton
IPLV: 0.450 kW/ton
>=300 tons and < 600 tons
Full load: 0.576 kW/ton
Full load: 0.600 kW/ton
279 C&I Unitary HVAC Load Shape Project Final Report, KEMA, 2011. The study reports CF values in the range of 44% to 63% depending on the size of the unit for the Mid Atlantic PJM hours. The study, therefore, assumes an average CF value of 55% for the PJM peak demand period that is applied to all units.280 US Department of Energy. Energy Star Calculator and Bin Analysis Models. The Equivalent Full Load Hours (ELFH) for Pennsylvania are calculated based on the degree day scaling methodology. The EFLH values reported in the Connecticut Program Savings Documentation were adjusted using full load hours (FLH) from the US DOE ENERGY STAR Calculator to account for differences in weather conditions.
SECTION 2: Residential MeasuresMiscellaneous Page 277
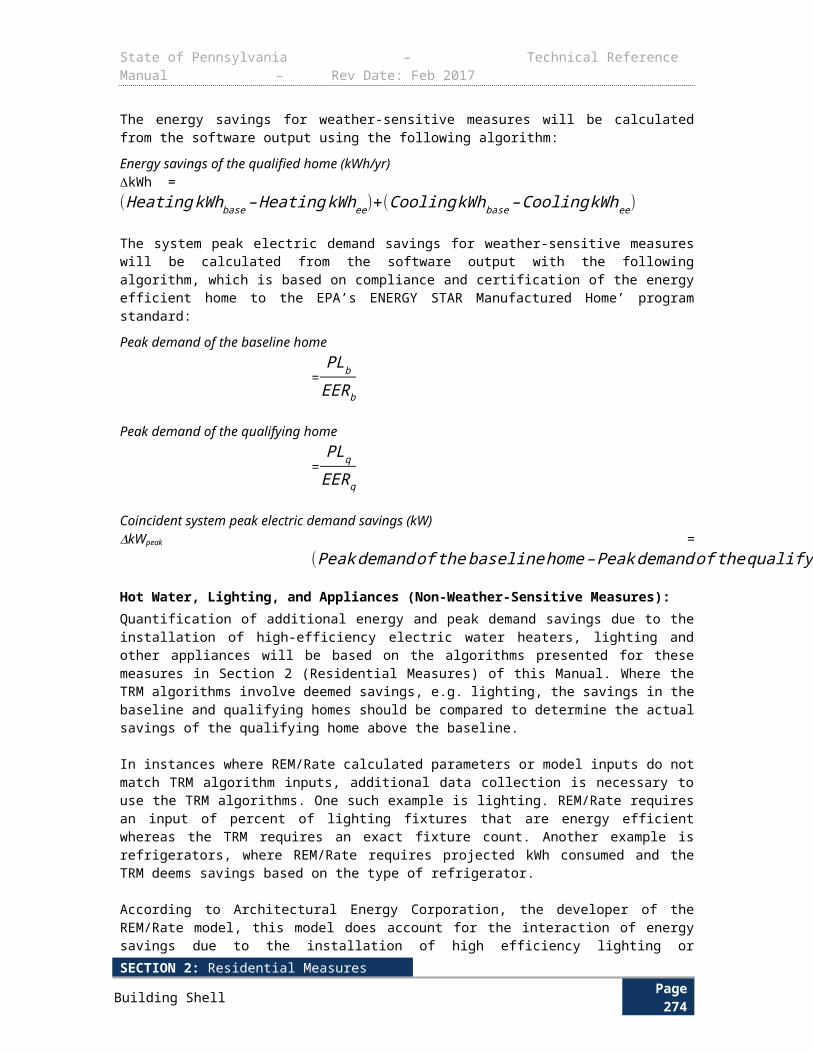
State of Pennsylvania – Technical Reference Manual – Rev Date: Feb 2017
Chiller Type Size Path A Path B Source
IPLV: 0.549 kW/ton IPLV: 0.400 kW/ton
>=600 tons Full load: 0.570 kW/ton
IPLV: 0.539 kW/ton
Full load: 0.590 kW/ton
IPLV: 0.400 kW/ton
Table 3-166: Chiller EFLHs for Pennsylvania Cities
Space and/or Building Type Alle
ntow
n
Erie
Har
risbu
rg
Phila
delp
hia
Pitts
burg
h
Scra
nton
Will
iam
spor
t
Education - Community College 634 453 661 734 564 502 608
Education - Secondary School 275 214 344 389 282 244 316
Education - University 695 526 730 805 635 545 629
Health/Medical - Hospital 1,240 1,100 1,362 1,556 1,185 1,134 1,208
Health/Medical - Nursing Home 459 408 520 622 472 418 462
Lodging - Hotel 1,397 1,317 1,511 1,654 1,432 1,352 1,415
Manufacturing – Bio Tech/High Tech 708 527 700 780 631 574 614
Office - Large 463 411 546 604 451 427 472
Office - Small 429 374 495 567 434 393 433
Retail - Multistory Large 749 609 836 897 699 659 742
Table 3-167: Chiller Demand CFs for Pennsylvania Cities
Space and/or Building Type Alle
ntow
n
Erie
Har
risbu
rg
Phila
delp
hia
Pitts
burg
h
Scra
nton
Will
iam
spor
t
Education - Community College 0.43 0.31 0.44 0.47 0.42 0.36 0.43
Education - Secondary School 0.11 0.09 0.18 0.18 0.17 0.12 0.17
Education - University 0.40 0.30 0.41 0.44 0.39 0.32 0.37
Health/Medical - Hospital 0.50 0.48 0.50 0.54 0.48 0.48 0.50
Health/Medical - Nursing Home 0.24 0.22 0.28 0.30 0.28 0.23 0.26
Lodging - Hotel 0.62 0.61 0.68 0.69 0.71 0.60 0.68
Manufacturing – Bio Tech/High Tech 0.53 0.43 0.53 0.58 0.54 0.48 0.50
Office - Large 0.30 0.28 0.36 0.25 0.33 0.30 0.33
Office - Small 0.28 0.26 0.33 0.21 0.30 0.28 0.31
Retail - Multistory Large 0.46 0.38 0.54 0.55 0.48 0.43 0.48
SECTION 2: Residential MeasuresMiscellaneous Page 278
State of Pennsylvania – Technical Reference Manual – Rev Date: Feb 2017
D E F A U L T S A V I N G S
There are no default savings for this measure.
E V A L U A T I O N P R O T O C O L S
For most projects, the appropriate evaluation protocol is to verify installation and proper selection of default values. For projects using customer specific data for open variables, the appropriate evaluation protocol is to verify installation and proper application of TRM protocol along with verification of open variables. The Pennsylvania Evaluation Framework provides specific guidelines and requirements for evaluation procedures.
S O U R C E S
1) Nexant’s eQuest modeling analysis 2014.
2) IECC 2009 Table 503.2.3 (7). https://law.resource.org/pub/us/code/ibr/icc.iecc.2009.pdf
SECTION 2: Residential MeasuresMiscellaneous Page 279
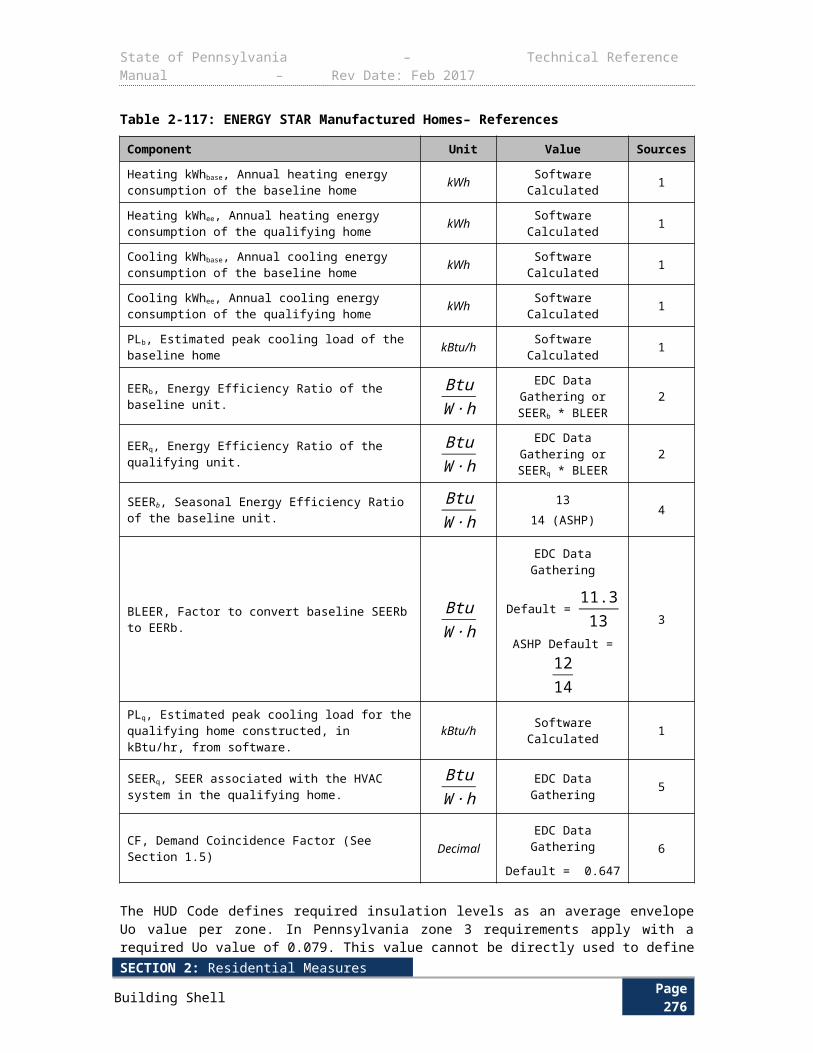
State of Pennsylvania – Technical Reference Manual – Rev Date: Feb 2017
3.2.3 WATER SOURCE AND GEOTHERMAL HEAT PUMPS
Measure Name Water Source and Geothermal Heat Pumps
Target Sector Commercial and Industrial Establishments
Measure Unit Geothermal Heat Pump
Unit Energy Savings Variable
Unit Peak Demand Reduction Variable
Measure Life 15 years281
Measure Vintage Replace on Burnout, New Construction, or Early Replacement
This protocol shall apply to ground source, groundwater source, water source heat pumps, and water source and evaporatively cooled air conditioners in commercial applications as further described below. This measure may apply to early replacement of an existing system, replacement on burnout, or installation of a new unit in a new or existing non-residential building for HVAC applications. The base case may employ a different system than the retrofit case.
E L I G I B I L I T Y
In order for this characterization to apply, the efficient equipment is a high-efficiency groundwater source, water source, or ground source heat pump system that meets or exceeds the energy efficiency requirements of the International Energy Conservation Code (IECC) 2009, Table 503.2.3(2). The following retrofit scenarios are considered:
Ground source heat pumps for existing or new non-residential HVAC applications
Groundwater source heat pumps for existing or new non-residential HVAC applications
Water source heat pumps for existing or new non-residential HVAC applications
These retrofits reduce energy consumption by the improved thermodynamic efficiency of the refrigeration cycle of new equipment, by improving the efficiency of the cooling and heating cycle, and by lowering the condensing temperature when the system is in cooling mode and raising the evaporating temperature when the equipment is in heating mode as compared to the base case heating or cooling system. It is expected that the retrofit system will use a similar conditioned-air distribution system as the base case system.
This protocol does not apply to heat pump systems coupled with non-heat pump systems such as chillers, rooftop AC units, boilers, or cooling towers. Projects that use unique, combined systems such as these should use a site-specific M&V plan (SSMVP) to describe the particulars of the project and how savings are calculated. All HVAC applications other than comfort cooling and heating, such as process cooling, are defined as non-standard applications and are ineligible for this measure.
Definition of Baseline EquipmentIn order for this protocol to apply, the baseline equipment could be a standard-efficiency air source, water source, groundwater source, or ground source heat pump system, or an electric chiller and boiler system, or other chilled/hot water loop system. To calculate savings, the
281 DEER 2014 Effective Useful Life. For the purpose of calculating the total Resource Cost Test for Act 129, measure cannot claim savings for more than fifteen years.
SECTION 2: Residential MeasuresMiscellaneous Page 280
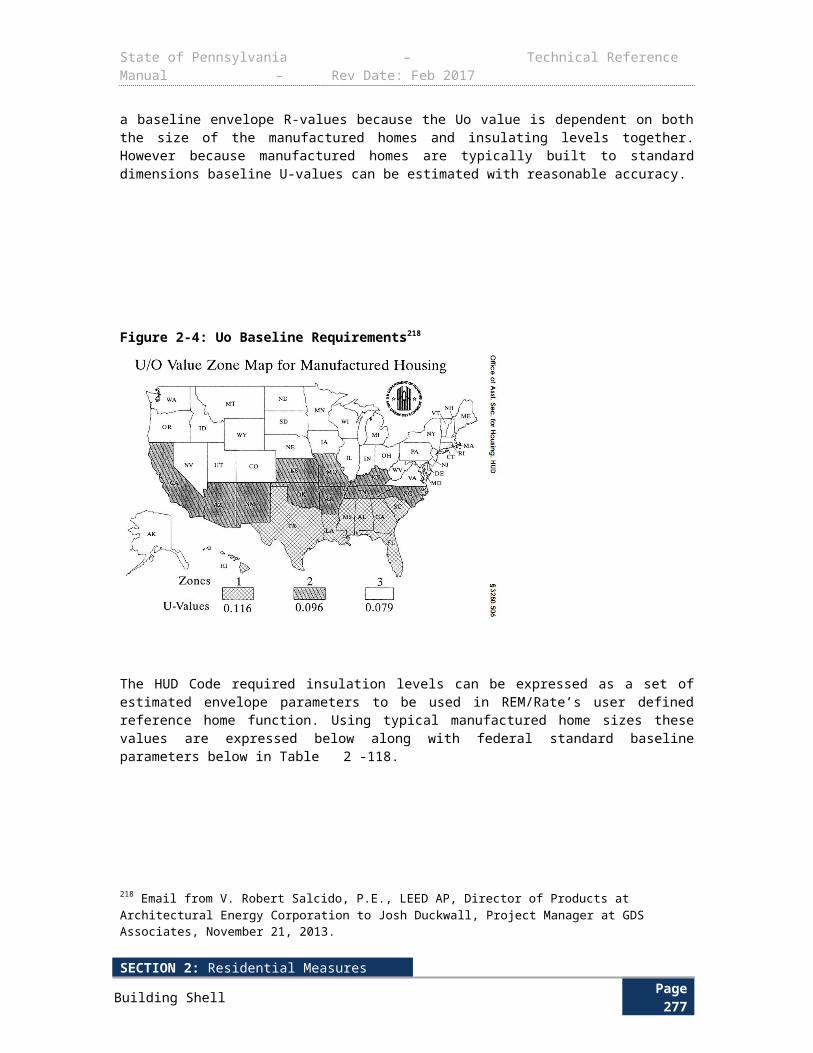
State of Pennsylvania – Technical Reference Manual – Rev Date: Feb 2017
baseline system type is assumed to be an air source heat pump of similar size except for cases where the project is replacing a ground source, groundwater source, or water source heat pump; in those cases, the baseline system type is assumed to be a similar system at code.
Table 3-168: Water Source or Geothermal Heat Pump Baseline Assumptions
Baseline Scenario Baseline Efficiency Assumptions
New Construction Standard efficiency air source heat pump system
Retrofit
Replacing any technology besides a ground source, groundwater source, or water source heat pump
Standard efficiency air source heat pump system
Replacing a ground source, groundwater source, or water source heat pump
Efficiency of the replaced geothermal system for early replacement only (if
known), else code for a similar system
A L G O R I T H M S
There are three primary components that must be accounted for in the energy and demand calculations. The first component is the heat pump unit energy and power, the second is the circulating pump in the ground/water loop system energy and power, and the third is the well pump in the ground/water loop system energy and power. For projects where the retrofit system is similar to the baseline system, such as a standard efficiency ground source system replaced with a high efficiency ground source system, the pump energy is expected to be the same for both conditions and does not need to be calculated. The kWh savings should be calculated using the basic equations below. For baseline units rated in both EER and IEER, use IEER in place of EER where listed in energy savings calculations below.
SECTION 2: Residential MeasuresMiscellaneous Page 281
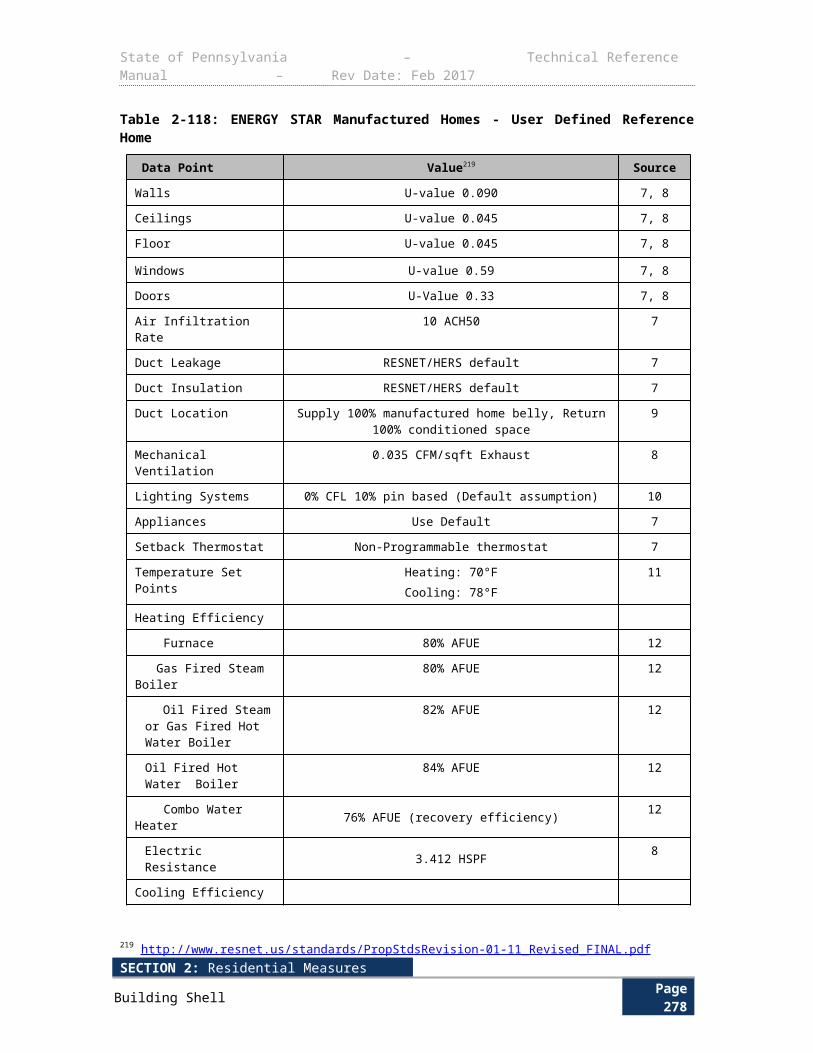
State of Pennsylvania – Technical Reference Manual – Rev Date: Feb 2017
For air-cooled base case units with cooling capacities less than 65 kBtu/h:
kWh ¿∆ kWhcool+∆ kWhheat+∆kWhpump
∆ kWhcool¿ {(Btucoolhr
× 1kW1000W )×( 1
SEERbase )× EFLHcool}−{( Btucoolhr× 1kW
1000W )×( 1EERee×GSER )×EFLH cool}
∆ kWhheat¿{(Btuheathr
× 1kW1000W )×( 1
HSPFbase )× EFLHheat}−{(Btuheathr× 1kW
1000W )×( 1COPee )×( 1
3.412 )×EFLHheat}∆ kWhpump
¿ {HPbasemotor×LF base×0.746×( 1ηbasemotor )×HOURSbasepump}−{HPeemotor×LF ee×0.746×( 1
ηeemotor )×HOURSeepump}∆ kW peak =∆ kW peak cool+∆kW peak pump
∆ kW peak cool¿ {(Btucoolhr
× 1kW1000W )×( 1
EERbase)×CF cool}−{(Btucoolhr
× 1kW1000W )×( 1
EERee)×CFcool}
∆ kW peak pump¿ {HPbasemotor×LF base×0.746×( 1
ηbasemotor )×CF pump}−{HPeemotor×LF ee×0.746×( 1ηeemotor )×CF pump}
For air-cooled base case units with cooling capacities equal to or greater than 65 kBtu/h, and all other units:
SECTION 2: Residential MeasuresMiscellaneous Page 282
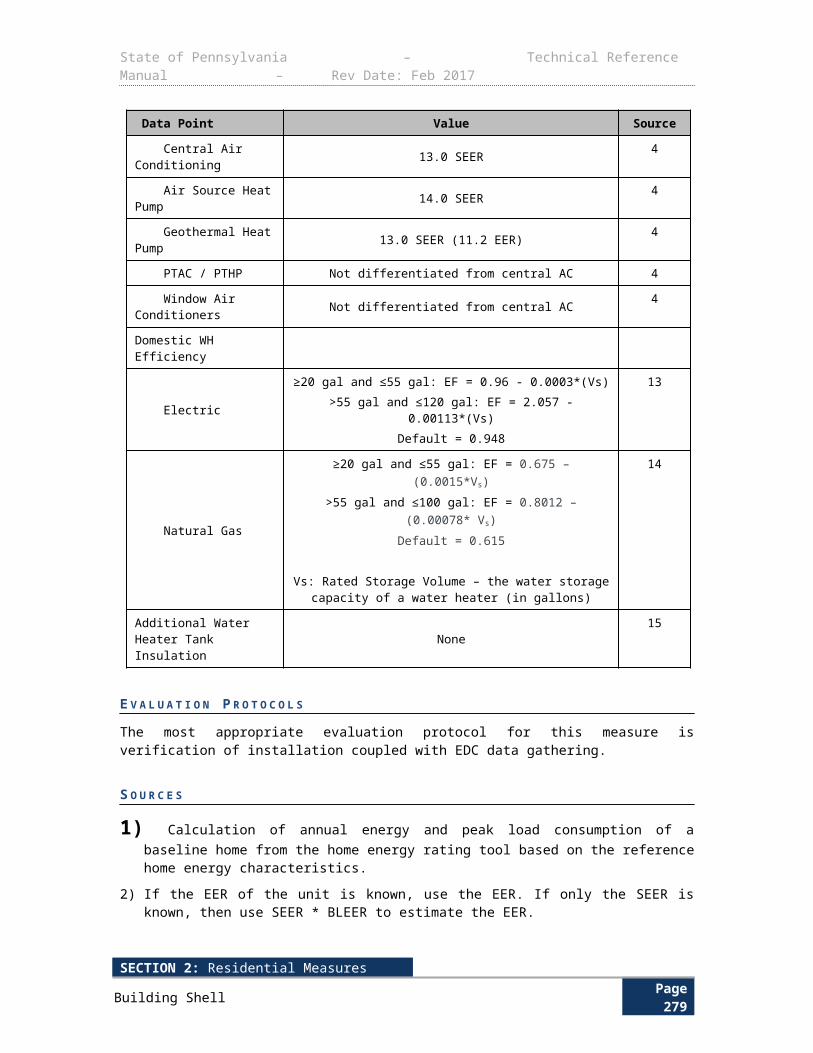
State of Pennsylvania – Technical Reference Manual – Rev Date: Feb 2017
kWh ¿∆ kWhcool+∆ kWhheat+∆kWhpump
∆ kWhcool¿ {(Btucoolhr
× 1kW1000W )×( 1
EERbase )×EFLH cool}−{(Btucoolhr× 1kW
1000W )×( 1EERee )×EFLH cool}
∆ kWhheat¿{(Btuheathr
× 1kW1000W )×( 1
COPbase )×( 13.412 )×EFLH
heat}−{( Btuheathr× 1kW
1000W )×( 1COPee )×( 1
3.412 )× EFLHheat}∆ kWhpump
¿ {HPbasemotor×LF base×0.746×( 1ηbasemotor )×HOURSbasepump}−{HPeemotor×LF ee×0.746×( 1
ηeemotor )×HOURSeepump}∆ kW peak =∆ kW peak coo l+∆kW peak pump
∆ kW peak cool¿ {(Btucoolhr
× 1kW1000W )×( 1
EERbase )×CF cool}−{(Btucoolhr× 1kW
1000W )×( 1EERee )×CFcool}
∆ kW peak pump¿ {HPbasemotor×LF base×0.746×( 1
ηbasemotor )×CF pump}−{HPeemotor×LF ee×0.746×( 1ηeemotor )×CF pump}
SECTION 2: Residential MeasuresMiscellaneous Page 283
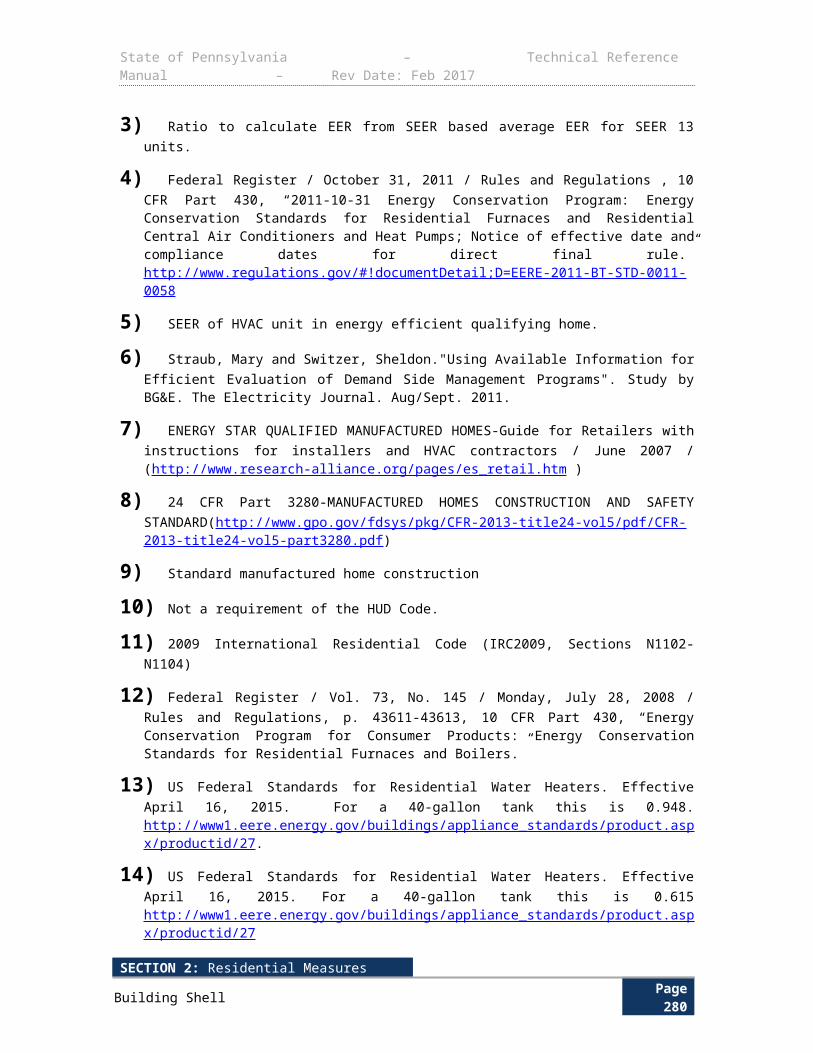
State of Pennsylvania – Technical Reference Manual – Rev Date: Feb 2017
D E F I N I T I O N O F T E R M S 2 8 2
Table 3-169: Geothermal Heat Pump– Values and Assumptions
282 Modeling is an acceptable substitute to metering and BMS data if modeling is conducted using building- and equipment-specific information at the site and the facility consumption is calibrated using 12 months of billing data (pre-retrofit).
SECTION 2: Residential MeasuresMiscellaneous Page 284
State of Pennsylvania – Technical Reference Manual – Rev Date: Feb 2017
Term Unit Value Source
Btucoolhr
, Rated cooling capacity of
the energy efficient unit
Btucoolhr
Nameplate data (ARI or AHAM)
EDC Data Gathering
Btuheathr
, Rated heating capacity
of the energy efficient unit
Btuheathr
Nameplate data (ARI or AHAM)
Use Btucoolhr
if the heating
capacity is not known
EDC Data Gathering
SEERbase , the cooling SEER of the baseline unit
BtuhrW
Early Replacement: Nameplate data
EDC Data Gathering
New Construction or Replace on Burnout: Default values
from Table 3-172
See Table3-172
IEERbase, Integrated energy efficiency ratio of the baseline unit.
BtuhrW
Early Replacement: Nameplate data
EDC Data Gathering
Default: Table 3-160 See Table3-160
EERbase, the cooling EER of the baseline unit
BtuhrW
Early Replacement: Nameplate data
= SEERbase X (11.3/13) if EER not available283
EDC Data Gathering
New Construction or Replace on Burnout: Default values
from Table 3-172
See Table3-172
HSPFbase, Heating Season Performance Factor of the baseline unit
BtuhrW
Early Replacement: Nameplate data
EDC Data Gathering
New Construction or Replace on Burnout: Default values
from Table 3-172
See Table3-172
COPbase, Coefficient of Performance of the baseline unit
None Early Replacement: Nameplate data
EDC Data Gathering
283 IECC 2009 – Table 503.2.3(7). Chillers must satisfy efficiency requirements for both full load and IPLV efficiencies for either Path A or Path B. The table shows the efficiency ratings to be used for the baseline chiller efficiency in the savings estimation algorithm, which must be consistent with the expected operating conditions of the efficient chiller. For example, if the efficient chiller satisfies Path A and generally performs at part load, the appropriate baseline chiller efficiency is the IPLV value under Path A for energy savings. If the efficient chiller satisfies Path B and generally performs at full load, the appropriate baseline chiller efficiency is the full load value under Path B for energy savings. Generally, chillers operating above 70 percent load for a majority (50% or more) of operating hours should use Path A and chillers below 70% load for a majority of operating hours should use Path B. The “full load” efficiency from the appropriate Path A or B should be used to calculate the Peak Demand Savings as it is expected that the chillers would be under full load during the peak demand periods.
SECTION 2: Residential MeasuresMiscellaneous Page 285
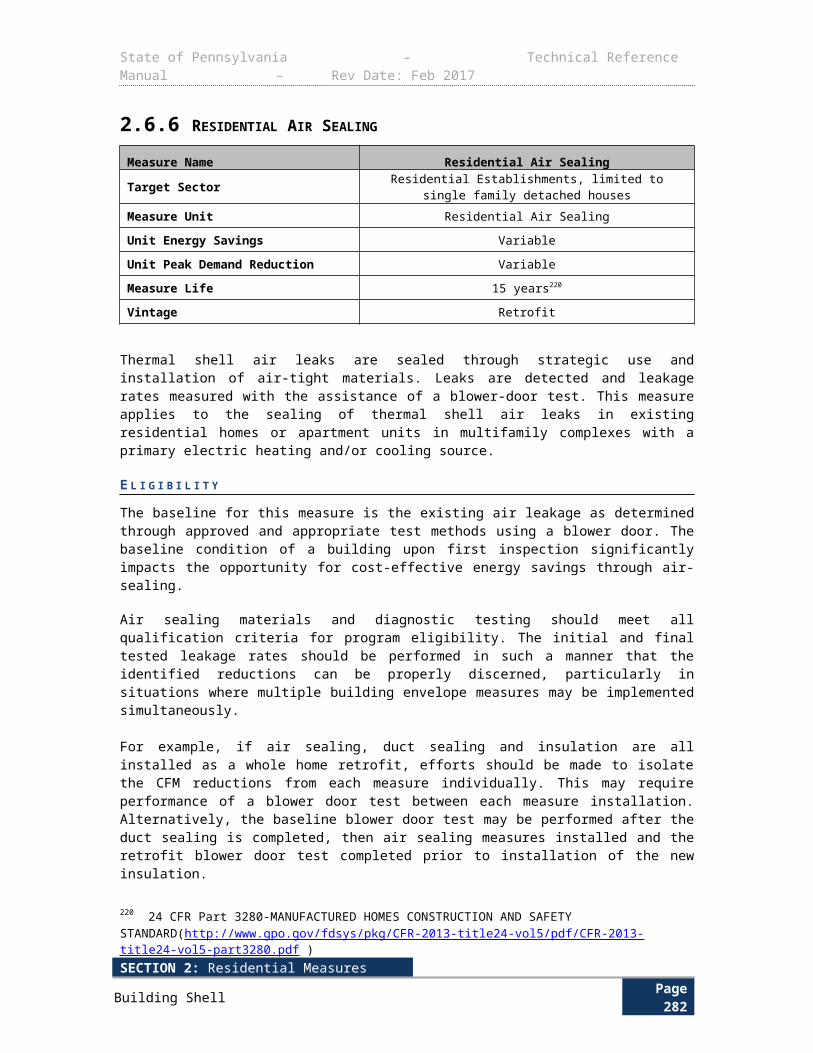
State of Pennsylvania – Technical Reference Manual – Rev Date: Feb 2017
Term Unit Value Source
New Construction or Replace on Burnout: Default values
from Table 3-172
See Table3-172
EERee, the cooling EER of the new ground source, groundwater source, or water source heat pumpground being installed
BtuhrW
Nameplate data (ARI or AHAM)
= SEERee X (11.3/13) if EER not available284
EDC Data Gathering
COPee, Coefficient of Performance of the new ground source, groundwater source, or water source heat pump being installed
None Nameplate data (ARI or AHAM)
EDC Data Gathering
EFLH cool, Cooling annual Equivalent Full Load Hours EFLH for Commercial HVAC for different occupancies
HoursYear
Based on Logging, BMS data or Modeling285
EDC Data Gathering
Default values from Table 3-161
2
EFLH heat , Heating annual Equivalent Full Load Hours EFLH for Commercial HVAC for different occupancies
HoursYear
Based on Logging, BMS data or Modeling286
EDC Data Gathering
Default values from Table 3-163
2
CF cool, Demand Coincidence Factor for Commercial HVAC
Decimal See Error: Reference sourcenot found
2
CF pump, Demand Coincidence Factor for ground source loop pump
Decimal If unit runs 24/7/365, CF=1.0;
If unit runs only with heat pump unit compressor, See Error:Reference source not found
2
HPbasemotor, Horsepower of base case ground loop pump motor
HP Nameplate EDC Data Gathering
LF base, Load factor of the base case ground loop pump motor; ratio of the peak running load to the nameplate rating of the pump motor.
None Based on spot metering and nameplate
EDC Data Gathering
Default: 75% 1
ηbasemotor , efficiency of base case ground loop pump motor
None Nameplate EDC Data Gathering
If unknown, assume the federal minimum efficiency
requirements in Table 3-170
3
284 DEER 2014 Effective Useful Life. Various sources range from 12 to 20 years, DEER represented a reasonable mid-range. 285 The cooling efficiency ratings of the baseline and efficient units should be used not including pumps where appropriate. 286 11.3/13 = Conversion factor from SEER to EER, based on average EER of a SEER 13 unit.
SECTION 2: Residential MeasuresMiscellaneous Page 286
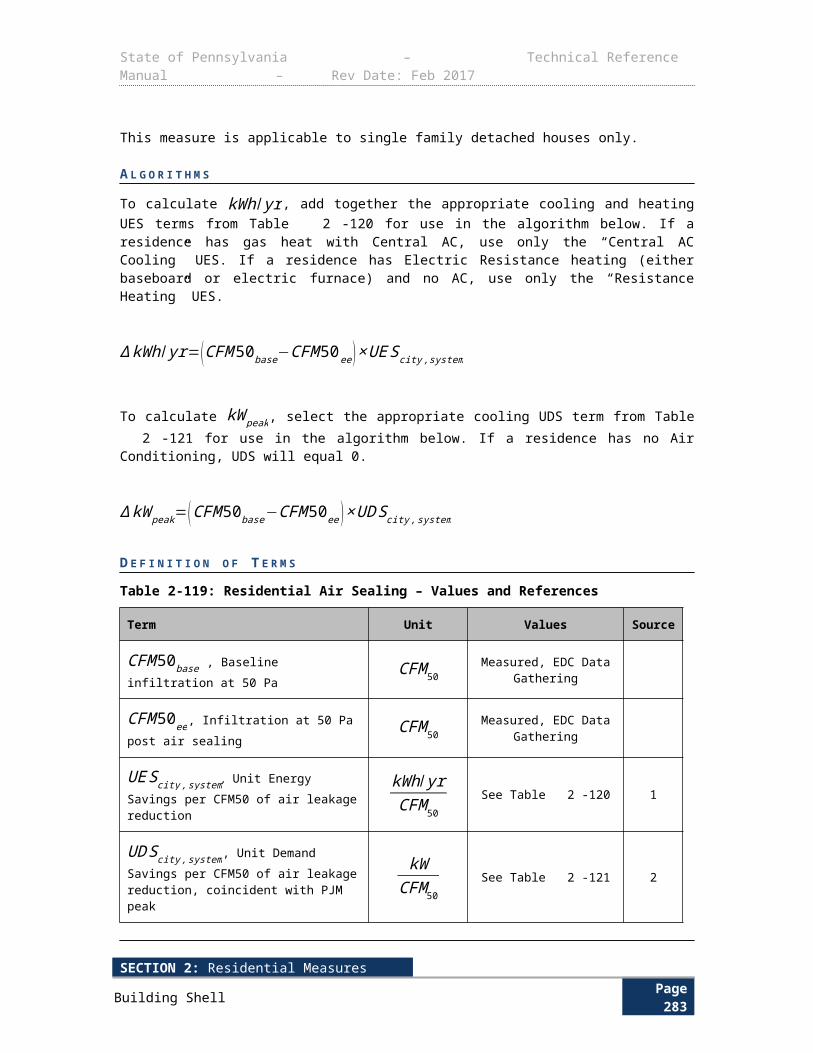
State of Pennsylvania – Technical Reference Manual – Rev Date: Feb 2017
Term Unit Value Source
HOURSbasepump, Run hours of base case ground loop pump motor
Hours Based on Logging, BMS data or Modeling287
EDC Data Gathering
EFLH cool+EFLH heat 288
Default values from Table 3-161 and Table 3-163
2
HPeemotor, Horsepower of retrofit case ground loop pump motor
HP Nameplate EDC Data Gathering
LF ee, Load factor of the retrofit case ground loop pump motor; Ratio of the peak running load to the nameplate rating of the pump motor.
None Based on spot metering and nameplate
EDC Data Gathering
Default: 75% 1
ηeemotor , efficiency of retrofit case ground loop pump motor
None Nameplate EDC Data Gathering
If unknown, assume the federal minimum efficiency
requirements in Table 3-170
Table 3-170
HOURSeepump, Run hours of retrofit case ground loop pump motor
Hours Based on Logging, BMS data or Modeling289
EDC Data Gathering
EFLH cool+EFLH heat290
Default values from Table 3-161 and Table 3-163
2
3.412, conversion factor from kWh to kBtu
kBtukWh
3.412 Conversion Factor
0.746, conversion factor from horsepower to kW
kWhp
0.746 Conversion Factor
GSER , Factor used to determine the SEER of a GSHP based on its EER
BtuW ∙h
1.02 4
287 11.3/13 = Conversion factor from SEER to EER, based on average EER of a SEER 13 unit.288 Modeling is an acceptable substitute to metering and BMS data if modeling is conducted using building- and equipment-specific information at the site and the facility consumption is calibrated using 12 months of billing data (pre-retrofit). 289 Ibid 290 Ibid
SECTION 2: Residential MeasuresMiscellaneous Page 287
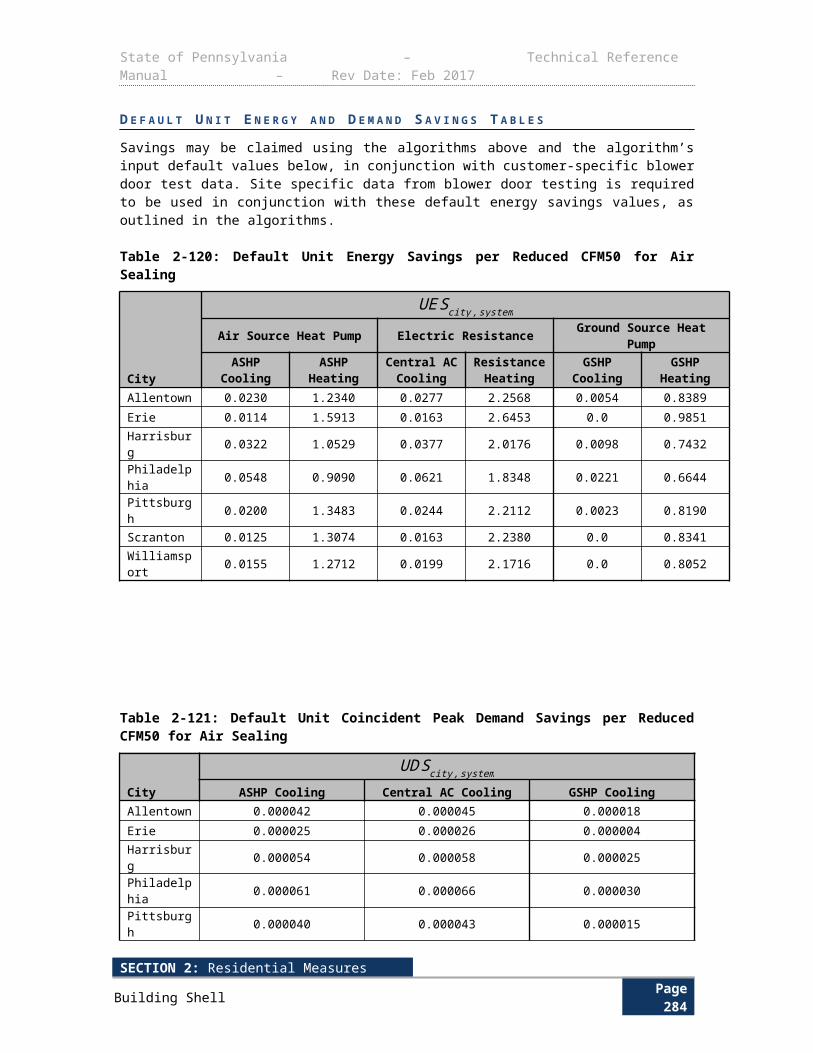
State of Pennsylvania – Technical Reference Manual – Rev Date: Feb 2017
Note: For water-source and evaporatively-cooled air conditioners, subtract 0.2 from the required baseline efficiency rating value if unit has heating section other than electric resistance.
Table 3-170: Federal Baseline Motor Efficiencies for NEMA Design A and NEMA Design B Motors
Motor HP
Motor Nominal Full-Load Efficiencies (percent)
2 Poles 4 poles 6 Poles 8 PolesEnclose
d Open Enclosed Open Enclosed Open Enclosed Open
1 77.0 77.0 85.5 85.5 82.5 82.5 75.5 75.5
1.5 84.0 84.0 86.5 86.5 87.5 86.5 78.5 77.0
2 85.5 85.5 86.5 86.5 88.5 87.5 84.0 86.5
3 86.5 85.5 89.5 89.5 89.5 88.5 85.5 87.5
5 88.5 86.5 89.5 89.5 89.5 89.5 86.5 88.5
7.5 89.5 88.5 91.7 91.0 91.0 90.2 86.5 89.5
10 90.2 89.5 91.7 91.7 91.0 91.7 89.5 90.2
15 91.0 90.2 92.4 93.0 91.7 91.7 89.5 90.2
20 91.0 91.0 93.0 93.0 91.7 92.4 90.2 91.0
Table 3-171: Ground/Water Loop Pump and Circulating Pump Efficiency291
HP Minimum Pump Efficiency at Design Point (ηpump)
1.5 65%
2 65%
3 67%
5 70%
7.5 73%
10 75%
15 77%
20 77%
291 EFLH cool+EFLH heat represent the addition of cooling and heating annual equivalent full load hours for commercial HVAC for different occupancies, respectively.
SECTION 2: Residential MeasuresMiscellaneous Page 288
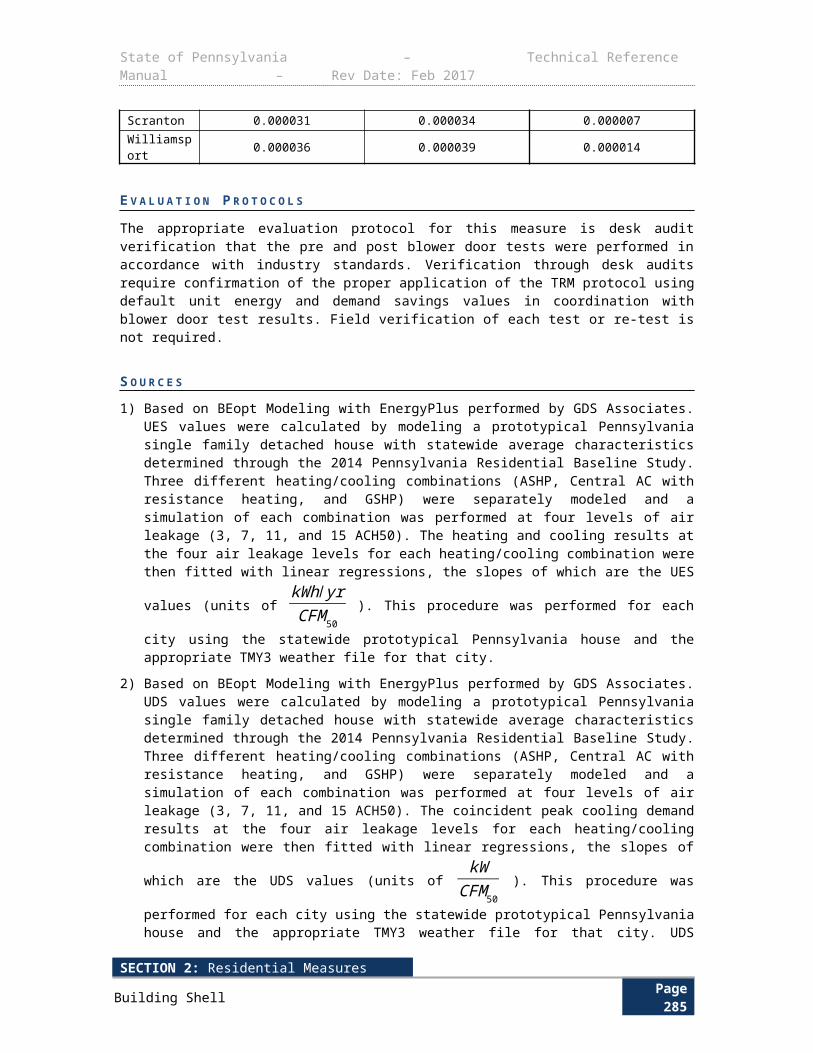
State of Pennsylvania – Technical Reference Manual – Rev Date: Feb 2017
Table 3-172: Default Baseline Equipment Efficiencies
Equipment Type and Capacity Cooling Baseline Heating Baseline
Water-Source Heat Pumps
< 17,000 Btuhr
11.2 EER 4.2 COP
> 17,000 Btuhr
and < 65,000 Btuhr
12.0 EER 4.2 COP
Ground Water Source Heat Pumps
< 135,000 Btuhr
16.2 EER 3.6 COP
Ground Source Heat Pumps
< 135,000 Btuhr
13.4 EER 3.1 COP
Note: For water-source and evaporatively-cooled air conditioners, subtract 0.2 from the required baseline efficiency rating value if unit has heating section other than electric resistance.
D E F A U L T S A V I N G S
There are no default savings for this measure.
E V A L U A T I O N P R O T O C O L S
For most projects, the appropriate evaluation protocol is to verify installation and proper selection of default values. For projects using customer specific data for open variables, the appropriate evaluation protocol is to verify installation and proper application of TRM protocol along with verification of open variables. The Pennsylvania Evaluation Framework provides specific guidelines and requirements for evaluation procedures.
S O U R C E S
1) California Public Utility Commission. Database for Energy Efficiency Resources 2005.
2) Based on Nexant’s eQuest modeling analysis 2014.
3) “Energy Conservation Program: Energy Conservation Standards for Commercial and Industrial Electric Motors; Final Rule,” 79 Federal Register 103 (29 May 2014).
4) VEIC estimate. Extrapolation of manufacturer data.
SECTION 2: Residential MeasuresMiscellaneous Page 289

State of Pennsylvania – Technical Reference Manual – Rev Date: Feb 2017
3.2.4 DUCTLESS MINI-SPLIT HEAT PUMPS – COMMERCIAL < 5.4 TONS
Measure Name Ductless Mini-Split Heat Pumps – Commercial < 5.4 Tons
Target Sector Commercial and Industrial Establishments
Measure Unit Ductless Heat Pump
Unit Energy Savings Variable based on efficiency of systems
Unit Peak Demand Reduction Variable based on efficiency of systems
Measure Life 15 years292
Measure Vintage Replace on Burnout
ENERGY STAR ductless “mini-split” heat pumps (DHP) utilize high efficiency SEER/EER and HSPF energy performance factors of 14.5/12 and 8.2, respectively, or greater. This technology typically converts an electric resistance heated space into a space heated/cooled with a single or multi-zonal ductless heat pump system.
E L I G I B I L I T Y
This protocol documents the energy savings attributed to ENERGY STAR ductless mini-split heat pumps with energy-efficiency performance of 14.5/12 SEER/EER and 8.2 HSPF or greater with inverter technology.293 The baseline heating system could be an existing electric resistance, a lower-efficiency ductless heat pump system, a ducted heat pump, packaged terminal heat pump (PTHP), electric furnace, or a non-electric fuel-based system. The baseline cooling system could be a standard efficiency heat pump system, central air conditioning system, packaged terminal air conditioner (PTAC), or room air conditioner. The DHP could be a new device in an existing space, a new device in a new space, or could replace an existing heating/cooling device. The DHP systems could be installed as a single-zone system (one indoor unit, one outdoor unit) or a multi-zone system (multiple indoor units, one outdoor unit). In addition, the old systems should be de-energized, completely uninstalled and removed in order to ensure that the full savings is realized. All HVAC applications other than comfort cooling and heating, such as process cooling, are defined as non-standard applications and are ineligible for this measure.
A L G O R I T H M S
The savings depend on three main factors: baseline condition, usage, and the capacity of the indoor unit.
The algorithm is separated into two calculations: single zone and multi-zone ductless heat pumps. The savings algorithm is as follows:
For heat pump units < 65,000 Btuhr
, use SEER to calculate ∆ kWhcool and HSPF to calculate
∆ kWhheat. Convert SEER to EER to calculate ∆ kW peak using 11.3/13 as the conversion factor.
Single Zone:
292 Ibid 293 Ibid.
SECTION 2: Residential MeasuresMiscellaneous Page 290
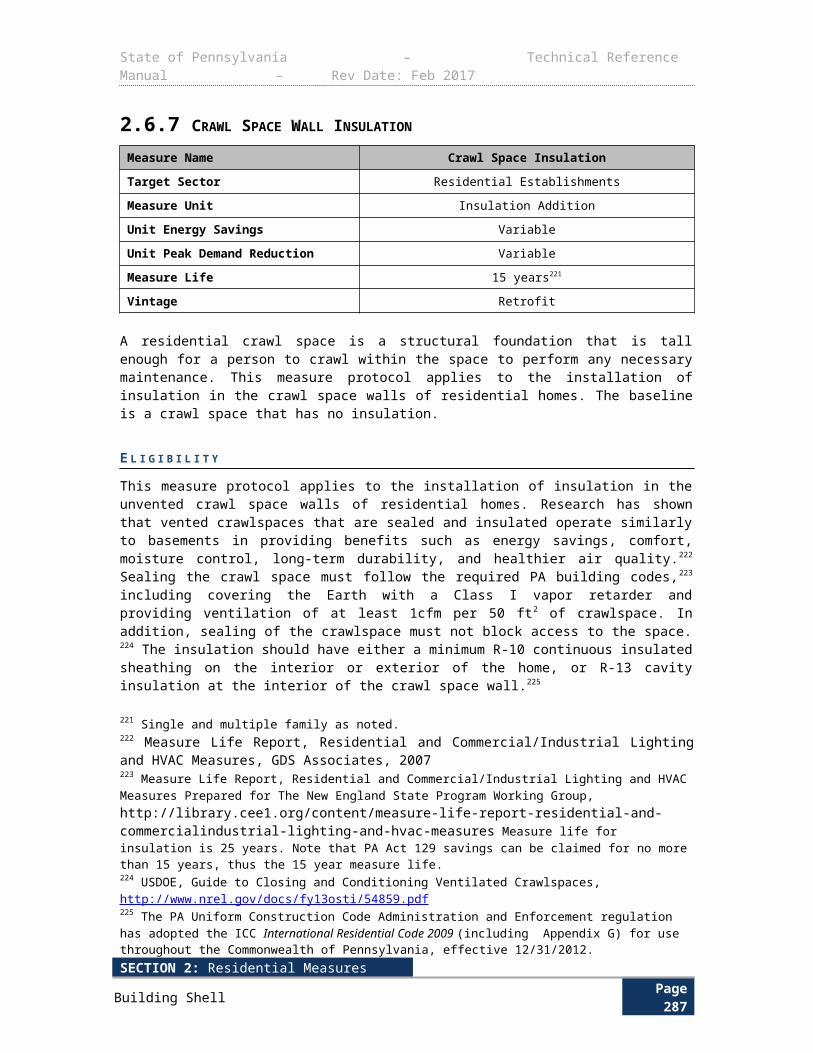
State of Pennsylvania – Technical Reference Manual – Rev Date: Feb 2017
kWh ¿∆ kWhcool+∆ kWhheat
∆ kWhheat ¿CAPY heat
1000 WkW
×( 1HSPFb
− 1HSPFe )×EFLH heat
∆ kWhcool ¿CAPY cool
1000 WkW
×( 1SEERb
− 1SEERe )×EFLH cool
∆ kW peak ¿CAPY cool
1000 WkW
×( 1EERb
− 1EERe )×CF
Multi-Zone:
kWh ¿∆ kWhcool+∆ kWhheat
∆ kWhheat¿ [CAPY heat
1000 WkW
×( 1HSPFb
− 1HSPFe )× EFLHheat ]
ZONE 1
+[ CAPY heat
1000 WkW
×( 1HSPFb
− 1HSPFe )×EFLHheat ]
ZONE 2
+[ CAPY heat
1000 WkW
×( 1HSPFb
− 1HSPFe )×EFLH heat ]
ZONEn
∆ kWhcool¿ [ CAPY cool
1000 WkW
×( 1SEERb
− 1SEERe )×EFLH cool ]
ZONE 1
+[ CAPY cool
1000 WkW
×( 1SEERb
− 1SEERe )×EFLH cool ]
ZONE 2
+[ CAPY cool
1000 WkW
×( 1SEERb
− 1SEERe )×EFLH cool ]
ZONEn
∆ kW peak¿ [ CAPY cool
1000 WkW
×( 1EERb
− 1EERe )×CF ]
ZONE 1
+[ CAPY cool
1000 WkW
×( 1EERb
− 1EERe )×CF ]
ZONE 2
+[ CAPY cool
1000 WkW
×( 1EERb
− 1EERe )×CF ]
ZONEn
D E F I N I T I O N O F T E R M S
SECTION 2: Residential MeasuresMiscellaneous Page 291
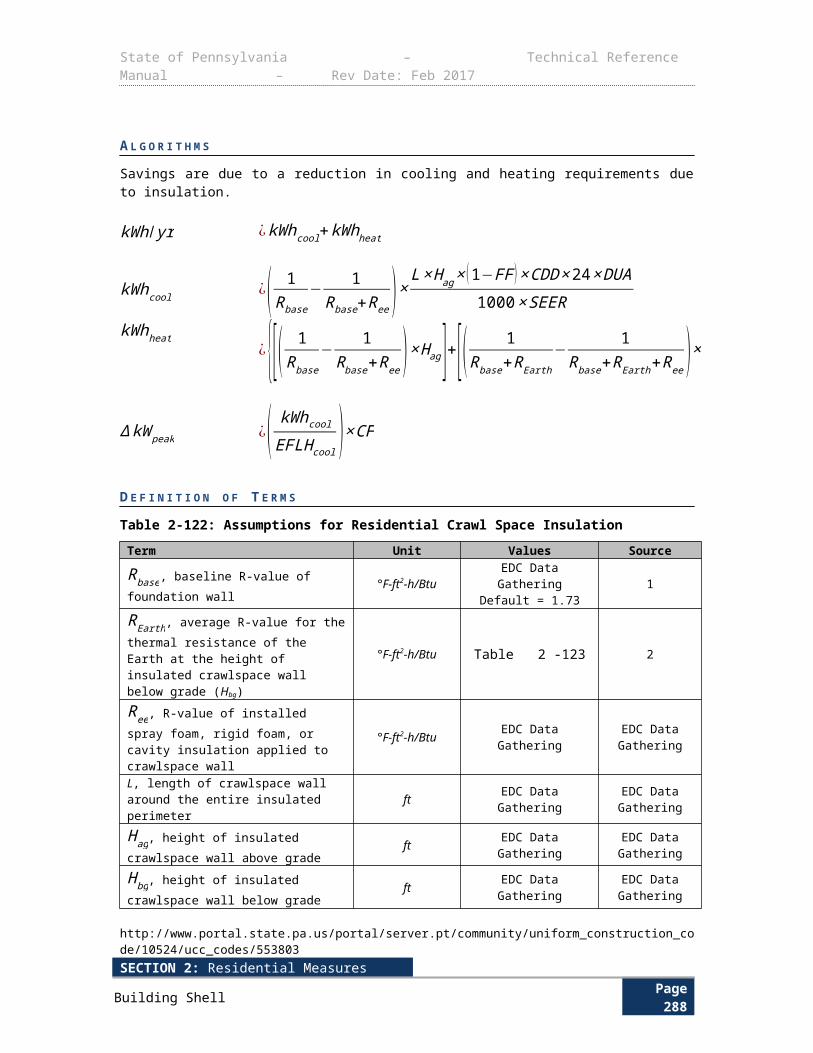
State of Pennsylvania – Technical Reference Manual – Rev Date: Feb 2017
Table 3-173: DHP – Values and References
Term Unit Values Source
CAPY cool , The cooling capacity of the
indoor unit, given in Btuhr
as
appropriate for the calculation. This protocol is limited to units < 65,000 Btuhr
(5.4 tons)
CAPY heat , The heating capacity of the
indoor unit, given in Btuhr
as
appropriate for the calculation.
Btuhr
Nameplate EDC Data Gathering
EFLH cool, Equivalent Full Load Hours for coolingEFLH heat, Equivalent Full Load Hours for heating
HoursYear
Based on Logging, BMS data or Modeling294
EDC Data Gathering1Default: See Table 3-
161 and Table 3-163
HSPFb, Heating Seasonal Performance Factor, heating efficiency of the baseline unit
Btu /hrW
Standard DHP: 7.7Electric resistance: 3.412
ASHP: 7.7PTHP295 (Replacements):
2.9 - (0.026 x Cap / 1000) COPPTHP (New
Construction): 3.2 - (0.026 x Cap / 1000)
COPElectric furnace: 3.241For new space, no heat in an existing space, or
non-electric heating in an existing space: use
electric resistance: 3.412
2, 4,7
SEERb, Seasonal Energy Efficiency Ratio cooling efficiency of baseline unit
Btu /hrW
DHP, ASHP, or central AC: 13
Room AC: 11.3PTAC296 (Replacements):
10.9 - (0.213 x Cap / 1000) EERPTAC (New
Construction): 12.5 - (0.213 x Cap / 1000)
EERPTHP (Replacements):
10.8 - (0.213 x Cap /
3,4,5,6,7
294 Based on program requirements submitted during protocol review.295 DEER 2014 Effective Useful Life. Various sources range from 12 to 20 years, DEER represented a reasonable mid-range. 296 ENERGY STAR Air Source Heat Pumps and Central Air Conditioners Key Product Criteria. http://www.energystar.gov/index.cfm?c=airsrc_heat.pr_crit_as_heat_pumps
SECTION 2: Residential MeasuresMiscellaneous Page 292
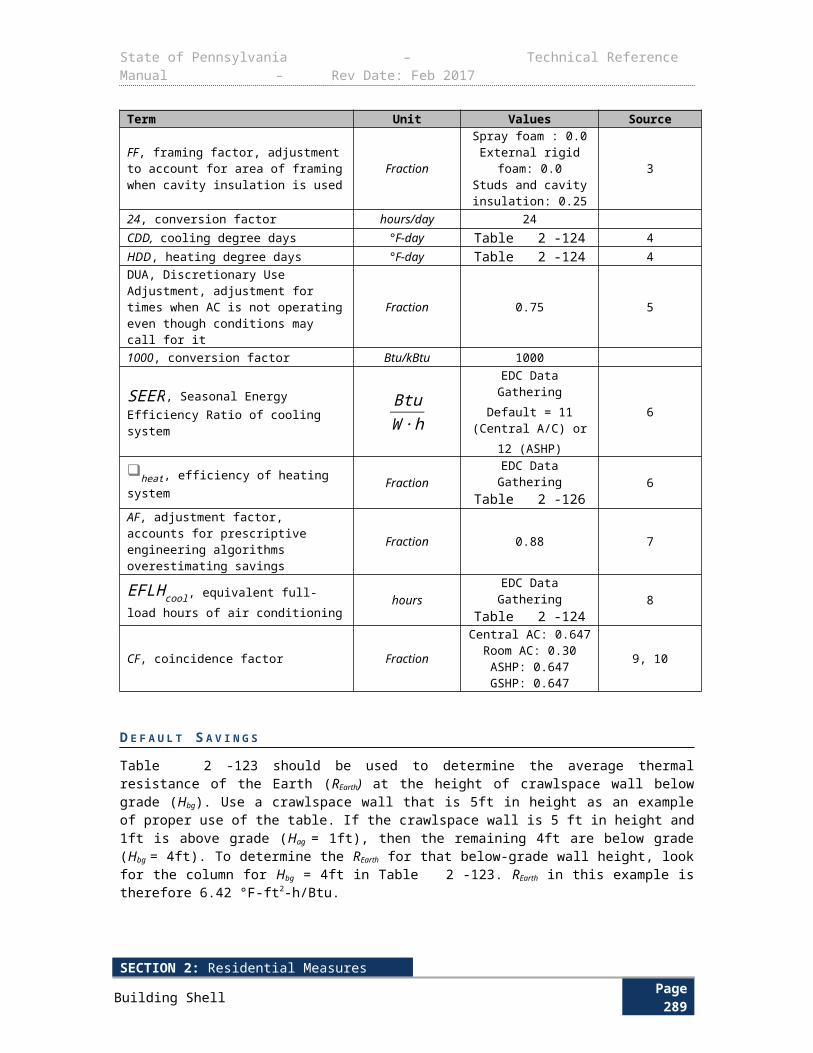
State of Pennsylvania – Technical Reference Manual – Rev Date: Feb 2017
Term Unit Values Source
1000) EERPTHP (New
Construction): 12.3 - (0.213 x Cap / 1000)
EERFor new space or no cooling in an existing space: use Room AC:
11.3
HSPFe, Heating Seasonal Performance Factor, heating efficiency of the installed DHP
Btu /hrW
Based on nameplate information. Should be at
least ENERGY STAR.EDC Data Gathering
SEERe, Seasonal Energy Efficiency Ratio cooling efficiency of the installed DHP
Btu /hrW
Based on nameplate information. Should be at
least ENERGY STAR.EDC Data Gathering
CF , Demand Coincidence Factor Decimal See Error: Referencesource not found 1
D E F A U L T S A V I N G S
There are no default savings for this measure.
E V A L U A T I O N P R O T O C O L S
For most projects, the appropriate evaluation protocol is to verify installation and proper selection of default values. For projects using customer specific data for open variables, the appropriate evaluation protocol is to verify installation and proper application of TRM protocol along with verification of open variables. The Pennsylvania Evaluation Framework provides specific guidelines and requirements for evaluation procedures.
S O U R C E S
1) Based on Nexant’s eQuest modeling analysis 2014.
2) COP = HSPF/3.412. HSPF = 3.412 for electric resistance heating, HSPF = 7.7 for standard DHP. Electric furnace COP typically varies from 0.95 to 1.00 and thereby assumed a COP 0.95 (HSPF = 3.241).
3) Federal Register, Vol. 66, No. 14, Monday, January 22, 2001/Rules and Regulations, p. 7170-7200.
4) Air-Conditioning, Heating, and Refrigeration Institute (AHRI); the directory of the available ductless mini-split heat pumps and corresponding efficiencies (lowest efficiency currently available). Accessed 8/16/2010. https://www.ahridirectory.org/ahridirectory/pages/home.aspx
5) ENERGY STAR and Federal Appliance Standard minimum EERs for a 10,000 Btu/hr unit with louvered sides. http://www.energystar.gov/index.cfm?c=roomac.pr_crit_room_ac
6) Average EER for SEER 13 units as calculated by EER = -0.02 × SEER² + 1.12 × SEER based on U.S. DOE Building America House Simulation Protocol, Revised 2010. http://www.nrel.gov/docs/fy11osti/49246.pdf
7) Package terminal air conditioners (PTAC) and package terminal heat pumps (PTHP) COP and EER minimum efficiency requirements is based on CAPY value. If the unit’s capacity is
SECTION 2: Residential MeasuresMiscellaneous Page 293
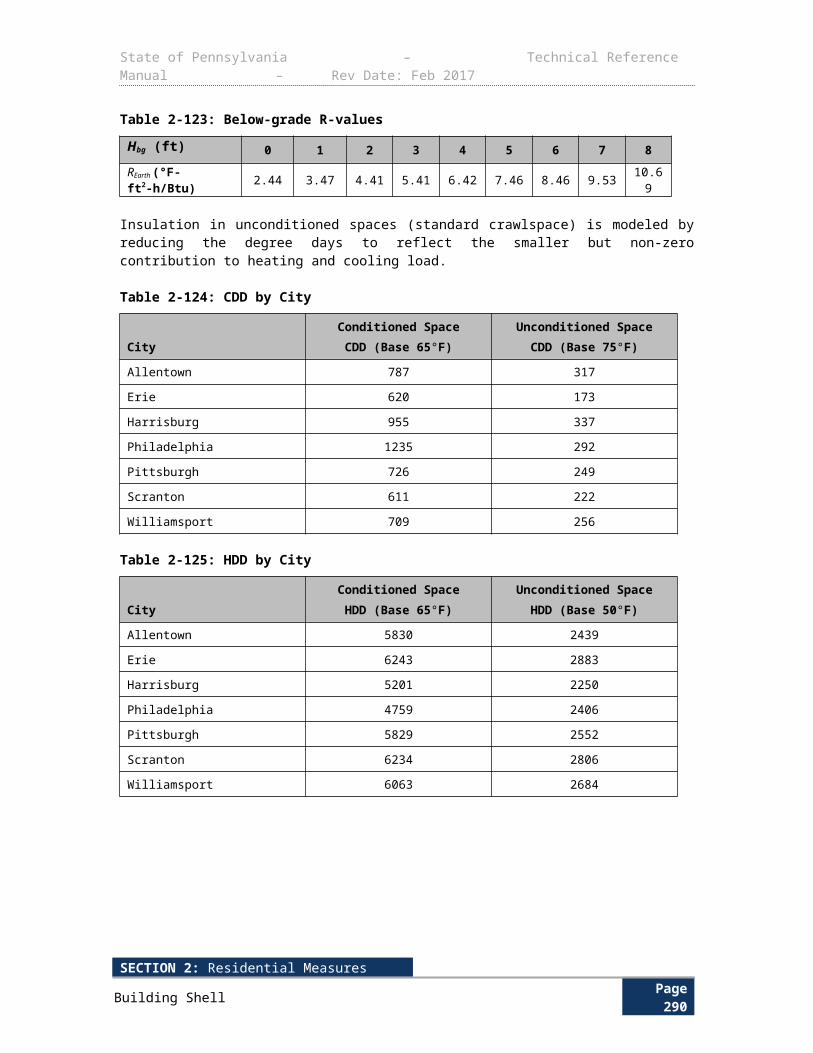
State of Pennsylvania – Technical Reference Manual – Rev Date: Feb 2017
less than 7,000 Btuhr
, use 7,000 Btuhr
in the calculation. If the unit’s capacity is greater than
15,000 Btuhr
, use 15,000 Btuhr
in the calculation.
SECTION 2: Residential MeasuresMiscellaneous Page 294
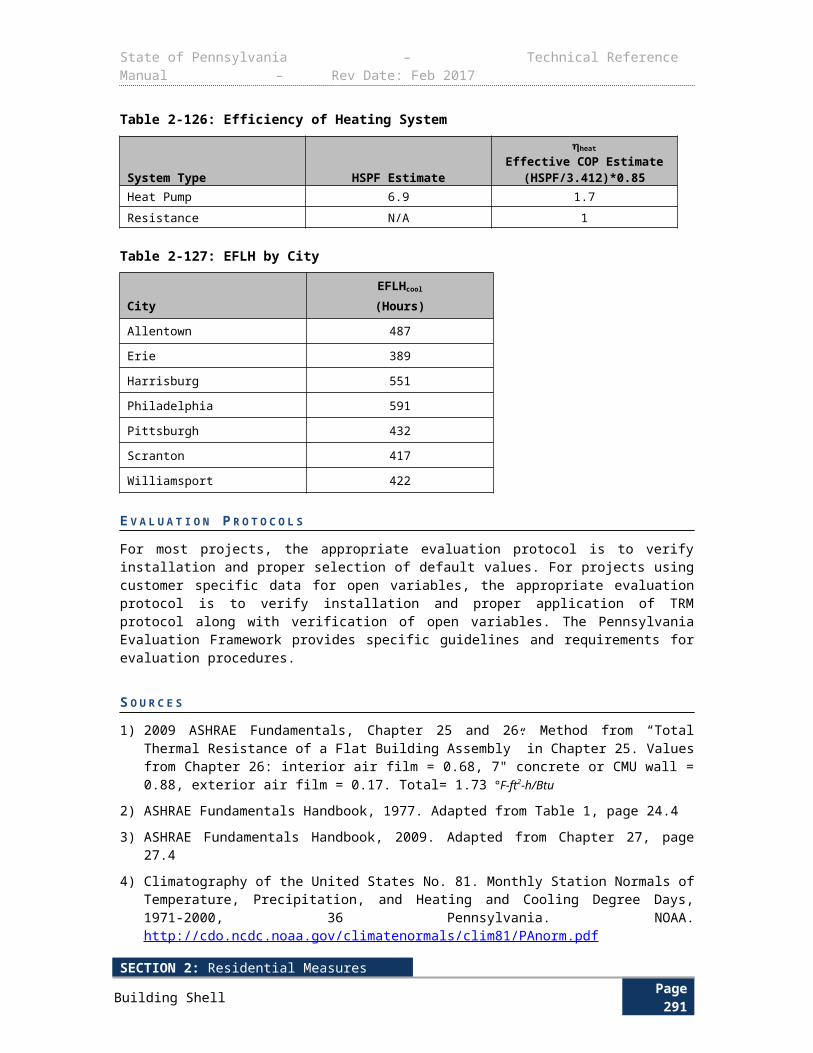
State of Pennsylvania – Technical Reference Manual – Rev Date: Feb 2017
3.2.5 FUEL SWITCHING: SMALL COMMERCIAL ELECTRIC HEAT TO NATURAL GAS / PROPANE / OIL HEAT
Measure NameFuel Switching: Small Commercial Electric Heat to
Natural Gas / Propane / Oil Heat
Target Sector Commercial and Industrial Establishments
Measure Unit Gas, Propane or Oil Heater
Unit Energy Savings Variable
Unit Peak Demand Reduction Variable
Measure Life 20 years297
Measure Vintage Replace on Burnout or Early Retirement or New Construction
E L I G I B I L I T Y
The energy and demand savings for small commercial fuel switching for heating systems is determined from the algorithms listed below. This protocol excludes water source, ground source, and groundwater source heat pumps.
The baseline for this measure is an existing commercial facility with an electric primary heating source. The heating source can be electric baseboards, packaged terminal heat pump (PTHP) units, electric furnace, or electric air source heat pump. The retrofit condition for this measure is the installation of a new standard efficiency natural gas, propane, or oil furnace or boiler. This algorithm does not apply to combination space and water heating units. This protocol applies to
measures with input rating of less than 225,000 Btuhr
.
To encourage adoption of the highest efficiency units, older units which meet outdated ENERGY STAR standards may be incented up through the given sunset dates (see table below).
Table 3-174: Act 129 Sunset Dates for ENERGY STAR Furnaces
ENERGY STAR Product Criteria Version
ENERGY STAR Effective Manufacture Date Act 129 Sunset Datea
ENERGY STAR Furnaces Version 4.0 February 1, 2013 N/A
ENERGY STAR Furnaces Version 3.0 February 1, 2012 May 31, 2014
ENERGY STAR Furnaces Version 2.0, Tier II units October 1, 2008 May 31, 2013
a Date after which Act 129 programs may no longer offer incentives for products meeting the criteria for the listed ENERGY STAR version.”
EDCs may provide incentives for equipment with efficiencies greater than or equal to the applicable ENERGY STAR requirement per the following table.
297 Ibid
SECTION 2: Residential MeasuresMiscellaneous Page 295
State of Pennsylvania – Technical Reference Manual – Rev Date: Feb 2017
Table 3-175: ENERGY STAR Requirements for Furnaces and Boilers
Equipment ENERGY STAR Requirements298
Gas FurnaceAFUE rating of 95% or greater
Less than or equal to 2.0% furnace fan efficiencyLess than or equal to 2.0% air leakage
Oil FurnaceAFUE rating of 85% or greater
Less than or equal to 2.0% furnace fan efficiencyLess than or equal to 2.0% air leakage
Boiler See AFUEfuel values in Table 3-176: Variables for HVAC Systems
A L G O R I T H M S 2 9 9
The energy savings are the full energy consumption of the electric heating source minus the energy consumption of the fossil fuel furnace blower motor. The energy savings are obtained through the following formulas:
Electric furnace or air source heat pump
For ASHP units < 65,000 Btuhr
, use HSPF instead of COP to calculate ∆ kWhheat.
kWhheat ¿( Btuheathr× 1kW
1000W )× 13.412
× 1COPbase
×EFLH heat
¿( Btuheathr× 1kW
1000W )× 1HSPFbase
× EFLHheat
Baseboard heating, packaged terminal heat pump
kWhheat ¿
Btuheathr
×EFLH heat
3412 BtukWh
×COPbase
−HPmotor×746 W
HP× EFLHheat
ηmotor×1000 WkW
The motor consumption of a gas furnace is subtracted from the savings for a baseboard or PTHP heating system, as these existing systems do not require a fan motor while the replacement furnace does (the electric furnace and air source heat pumps require fan motors with similar consumption as a gas furnace and thus there is no significant change in motor load). For boilers,
298 Cap represents the rated cooling capacity of the product in Btu/h. If the unit’s capacity is less than 7,000 Btu/h, 7,000 Btu/h is used in the calculation. If the unit’s capacity is greater than 15,000 Btu/h, 15,000 Btu/h is used in the calculation. Use HSPF = COP X 3.412.299 Cap represents the rated cooling capacity of the product in Btu/h. If the unit’s capacity is less than 7,000 Btu/h, 7,000 Btu/h is used in the calculation. If the unit’s capacity is greater than 15,000 Btu/h, 15,000 Btu/h is used in the calculation. Use SEER = EER X (13/11.3).
SECTION 2: Residential MeasuresMiscellaneous Page 296
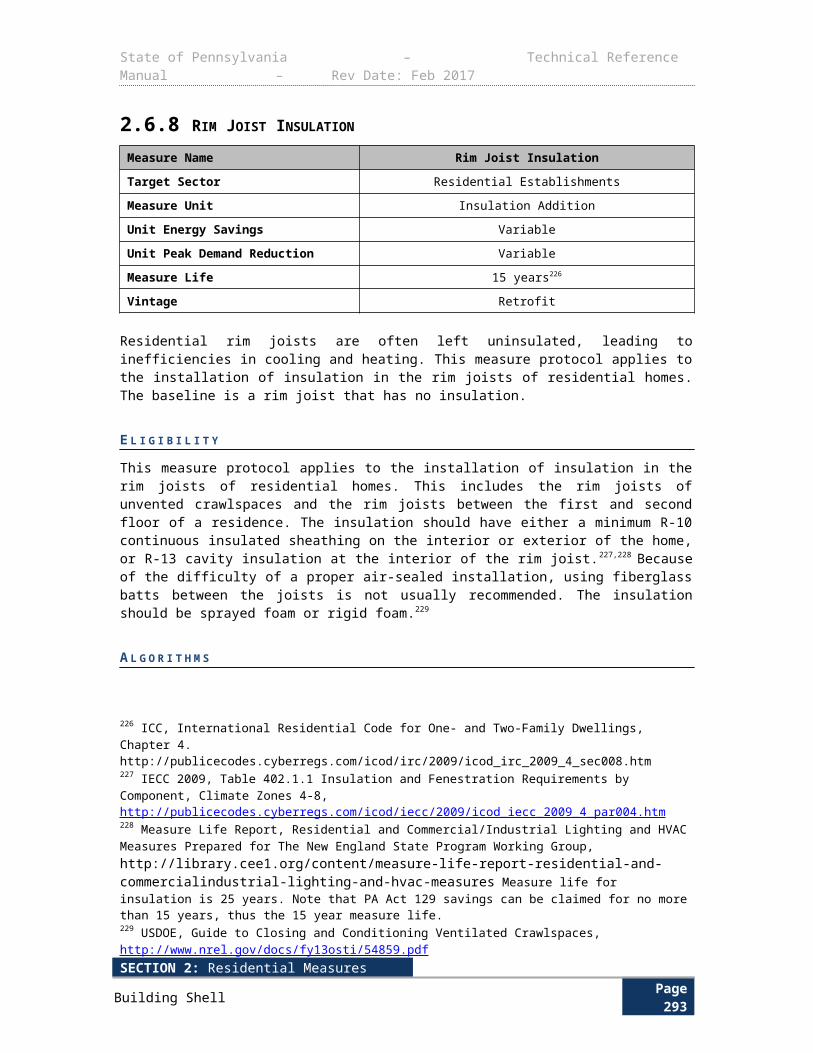
State of Pennsylvania – Technical Reference Manual – Rev Date: Feb 2017
the annual pump energy consumption is negligible (<50 kWh per year) and not included in this calculation.300
There are no peak demand savings as it is a heating only measure.
Although there are significant electric savings, there is also an associated increase in fossil fuel energy consumption. While this fuel consumption does not count against PA Act 129 energy savings, it is expected to be used in the program TRC test. The increased fossil fuel energy is obtained through the following formula:
Fuel consumption with fossil fuel furnace or boiler:
FuelConsumption
(MMBTU )¿
Btufuelhr
× EFLHheat
AFUE fuel×1,000,000 BtuMMBtu
D E F I N I T I O N O F T E R M S
Table 3-176: Variables for HVAC Systems
Term Unit Values Source
Btu fuelhr
, Rated heating capacity
of the new fossil fuel unit
Btuhr
Nameplate data (AHRI or AHAM) EDC Data Gathering
Btuheathr
, Rated heating capacity
of the existing electric unit
Btuhr
Nameplate data (AHRI or AHAM)
Default: set equal to Btu fuelhr
EDC Data Gathering
COPbase, Efficiency rating of the baseline unit. For ASHP units < 65,000 Btu/hr, HSPF should be used for heating savings
None
Early Replacement: Nameplate data EDC Data Gathering
New Construction or Replace on Burnout:
Default values from Table3-177
See Table 3-177
HSPFbase, Heating seasonal performance factor of the baseline unit. For units >65,000 Btu/hr, COP should be used for heating savings
Btu /hrW
Early Replacement: Nameplate data EDC Data Gathering
New Construction or Replace on Burnout:
Default values from Table3-177
See Table 3-177
AFUEfuel, Annual Fuel Utilization Efficiency rating of the fossil fuel unit
None Default = >= 95% (natural gas/propane furnace)
>= 90% (natural gas/propane steam boiler)
ENERGY STAR requirement301
300DEER 2014 Effective Useful Life. For the purpose of calculating the total Resource Cost Test for Act 129, measure cannot claim savings for more than fifteen years.301 Residential Furnace and Boiler Energy Star product criteria. http://www.energystar.gov/index.cfm?c=furnaces.pr_crit_furnaces and http://www.energystar.gov/index.cfm?fuseaction=find_a_product.showProductGroup&pgw_code=BO
SECTION 2: Residential MeasuresMiscellaneous Page 297
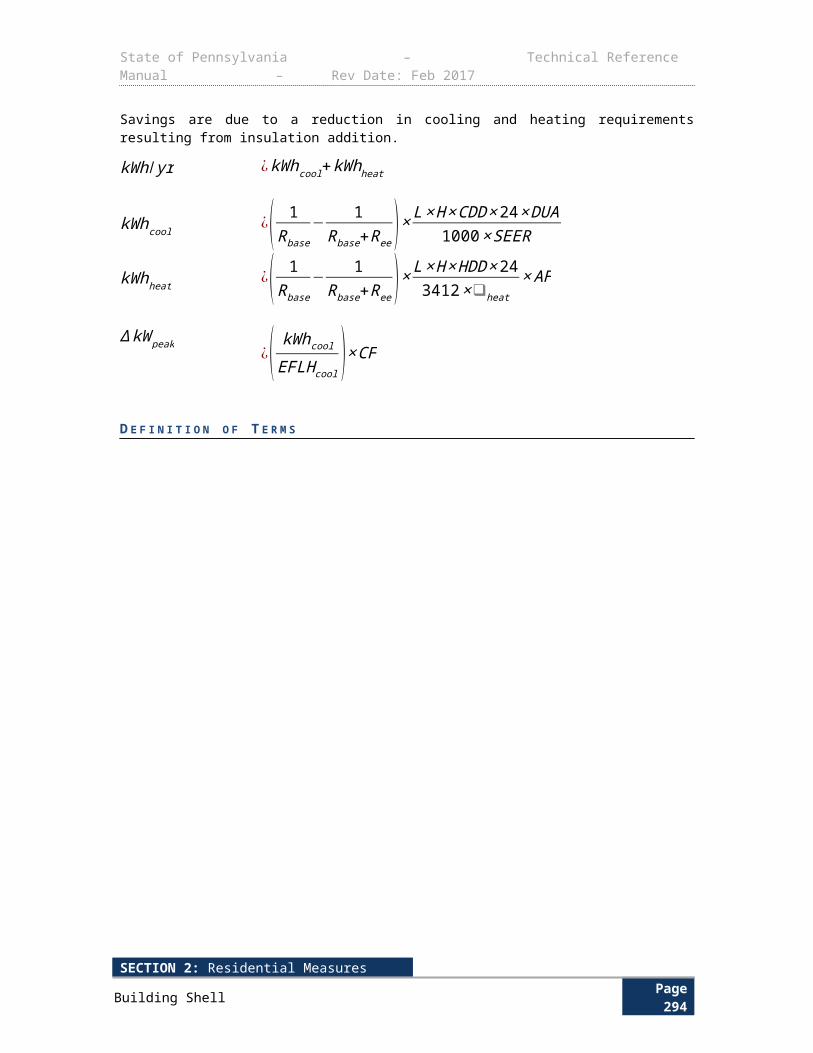
State of Pennsylvania – Technical Reference Manual – Rev Date: Feb 2017
Term Unit Values Source
>= 90% (natural gas/propane hot water
boiler)>= 85% (oil furnace)
>= 87% (oil steam boiler)>= 87% (oil hot water
boiler)
Nameplate data (AHRI or AHAM) EDC Data Gathering
EFLH heat, Equivalent Full Load Hours for the heating season – The kWh during the entire operating season divided by the kW at design conditions
HoursYear
Based on Logging, EMS data or Modeling302 EDC Data Gathering
Default values from Table3-163 1
HPMotor, Gas furnace blower motor horsepower
HPDefault: ½ HP for furnace
Average blower motor capacity for gas furnace
(typical range = ¼ HP to ¾ HP)
Nameplate EDC Data Gathering
ηmotor , Efficiency of furnace blower motor
None
From nameplate EDC Data Gathering
Default: 0.50 for furnaceTypical efficiency of ½ HP
blower motor for gas furnace
302 EDCs may use billing analysis using program participant data to claim measure savings, in lieu of using the defaults provided in this measure protocol. Billing analysis should be conducted using at least 12 months of billing data (pre- and post-retrofit).
SECTION 2: Residential MeasuresMiscellaneous Page 298
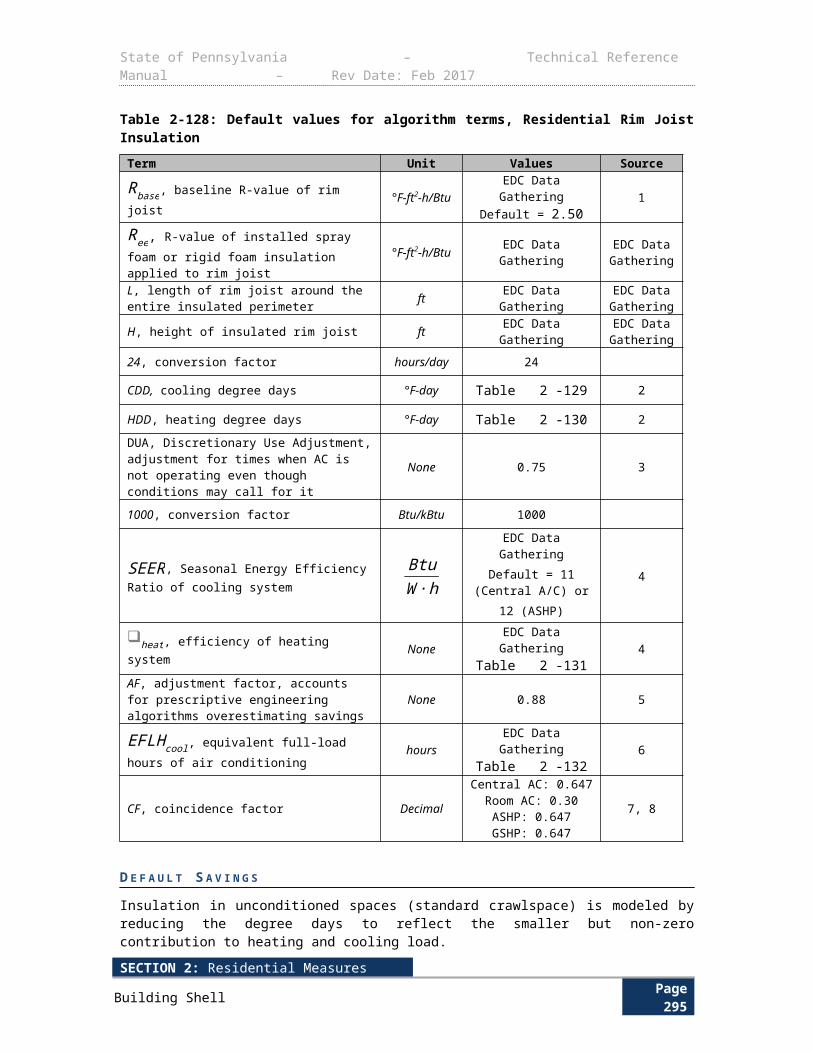
State of Pennsylvania – Technical Reference Manual – Rev Date: Feb 2017
Table 3-177: HVAC Baseline Efficiency Values303
Equipment Type and Capacity Heating Baseline
Air-Source Heat Pumps
< 65,000 Btuhr
7.7 HSPF
> 65,000 Btuhr
and <135,000 Btuhr
3.3 COP
> 135,000 Btuhr
and < 240,000 Btuhr
3.2 COP
> 240,000 Btuhr
3.2 COP
Electric Resistance Heat (Electric Furnace or Baseboard)
All sizes 1.0 COP
Packaged Terminal Systems (Replacements)304
PTHP 2.9 - (0.026 x Cap / 1000) COP
Packaged Terminal Systems (New Construction)
PTHP 3.2 - (0.026 x Cap / 1000) COP
D E F A U L T S A V I N G S
There are no default savings for this measure.
E V A L U A T I O N P R O T O C O L S
For most projects, the appropriate evaluation protocol is to verify installation and proper selection of default values. For projects using customer specific data for open variables, the appropriate evaluation protocol is to verify installation and proper application of TRM protocol along with verification of open variables. The Pennsylvania Evaluation Framework provides specific guidelines and requirements for evaluation procedures.
S O U R C E S
1) The Equivalent Full Load Hours (EFLH) for Pennsylvania are calculated based on Nexant’s eQuest modeling analysis.
303 Pump motors are typically 1/25 HP. With 1,000 hour runtime and 80% assumed efficiency, this translates to 37 kWh.304 Values are based on the Energy Star requirement in effect in 2016 – Energy Star Boiler Version 3.0 effective October 1, 2014.
SECTION 2: Residential MeasuresMiscellaneous Page 299
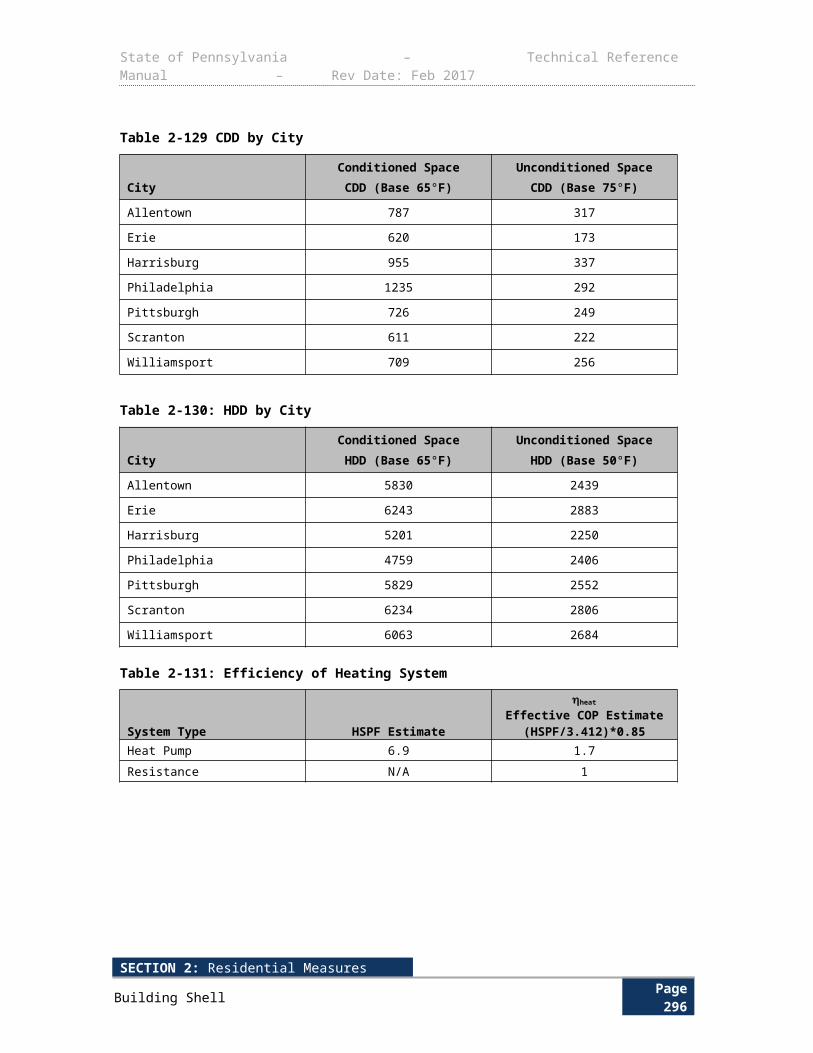
State of Pennsylvania – Technical Reference Manual – Rev Date: Feb 2017
3.2.6 SMALL C/I HVAC REFRIGERANT CHARGE CORRECTION
Measure Name Small C/I HVAC Refrigerant Charge Correction
Target Sector Commercial and Industrial Establishments
Measure Unit Tons of Refrigeration Capacity
Unit Energy Savings Variable
Unit Peak Demand Reduction Variable
Measure Life 10 years305
Measure Vintage Retrofit
This protocol describes the assumptions and algorithms used to quantify energy savings for refrigerant charging on packaged AC units and heat pumps operating in small commercial applications. The protocol herein describes a partially deemed energy savings and demand reduction estimation.
E L I G I B I L I T Y
This protocol is applicable for small commercial and industrial customers, and applies to documented tune-ups for package or split systems up to 20 tons. All HVAC applications other than comfort cooling and heating, such as process cooling, are defined as non-standard applications and are ineligible for this measure.
A L G O R I T H M S
This section describes the process of creating energy savings and demand reduction calculations.
Air Conditioning
For A/C units < 65,000 Btuhr , use SEER to calculate kWh and convert SEER to EER to calculate
kW peak using 11.3/13 as the conversion factor. For A/C units > 65,000 Btuhr
, if rated in both EER
and IEER, use IEER for energy savings calculations.
305 Modeling is an acceptable substitute to metering and BMS data if modeling is conducted using building- and equipment-specific information at the site and the facility consumption is calibrated using 12 months of billing data (pre-retrofit).
SECTION 2: Residential MeasuresMiscellaneous Page 300
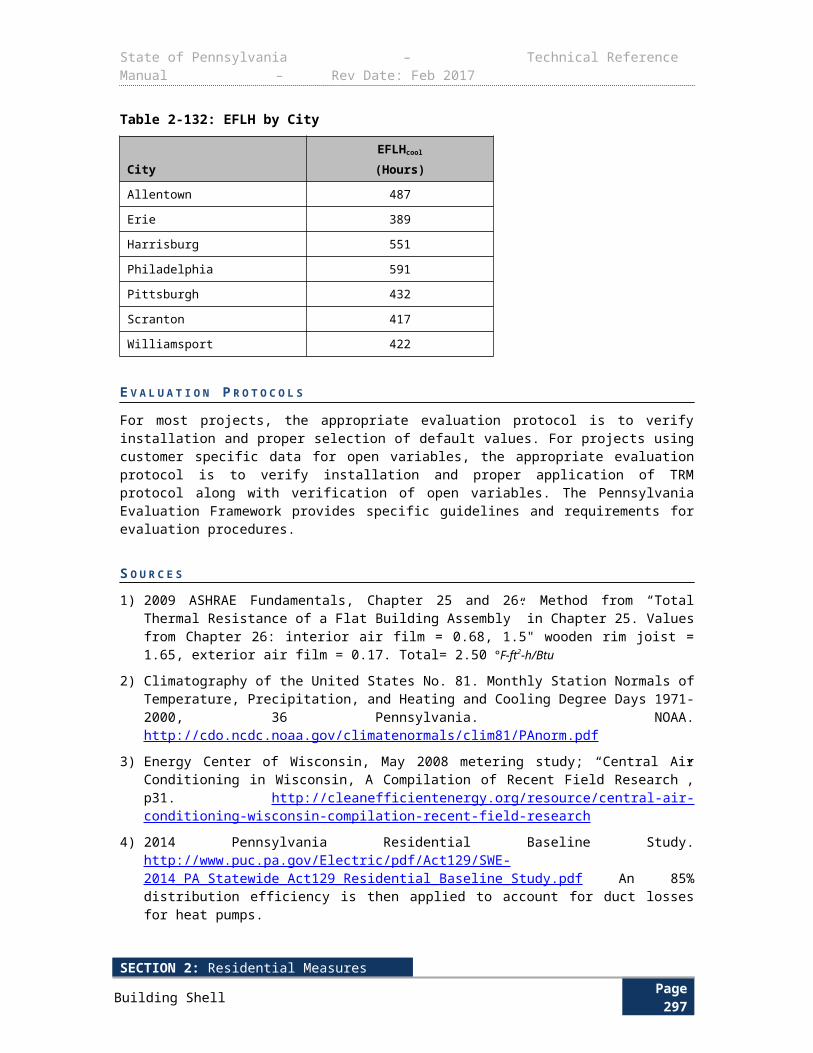
State of Pennsylvania – Technical Reference Manual – Rev Date: Feb 2017
kWh ¿(EFLH c×CAPY c
1000 WkW )×( 1
[EER× RCF ]− 1EER )
kWh¿(EFLH c×
CAPY c
1000 WkW )×( 1
[SEER×RCF ]− 1SEER )
∆ kW peak¿(CF× CAPY c
1000 WkW )×( 1
[EER×RCF ]− 1EER )
Heat Pumps
For Heat Pump units < 65,000 Btuhr
, use SEER to calculate ∆ kWhcool and HSPF instead of COP
to calculate ∆ kWhheat. Convert SEER to EER to calculate ∆ kW peak using 11.3/13 as the
conversion factor. For Heat Pump units > 65,000 Btuhr
, if rated in both EER and IEER, use IEER
to calculate:
∆ kWhcool
SECTION 2: Residential MeasuresMiscellaneous Page 301
State of Pennsylvania – Technical Reference Manual – Rev Date: Feb 2017
kWh ¿∆ kWhcool+∆ kWhheat
∆ kWhcool¿(EFLH c×
CAPY c
1000 WkW )×( 1
[ IEER×RCF ]− 1IEER )
∆ kWhcool¿(EFLH c×
CAPY c
1000 WkW )×( 1
[SEER×RCF ]− 1SEER )
∆ kWhheat¿(EFLHh×
CAPY h
1000 WkW )× 1
3.412×( 1
[COP× RCF ]− 1COP )
∆ kWhheat¿(EFLHh×
CAPY h
1000 WkW )×( 1
[HSPF ×RCF ]− 1HSPF )
∆ kW peak¿( Btucoolhr
× 1
1000 WkW )×( 1
EERbase− 1EERee )×CF
D E F I N I T I O N O F T E R M S
SECTION 2: Residential MeasuresMiscellaneous Page 302
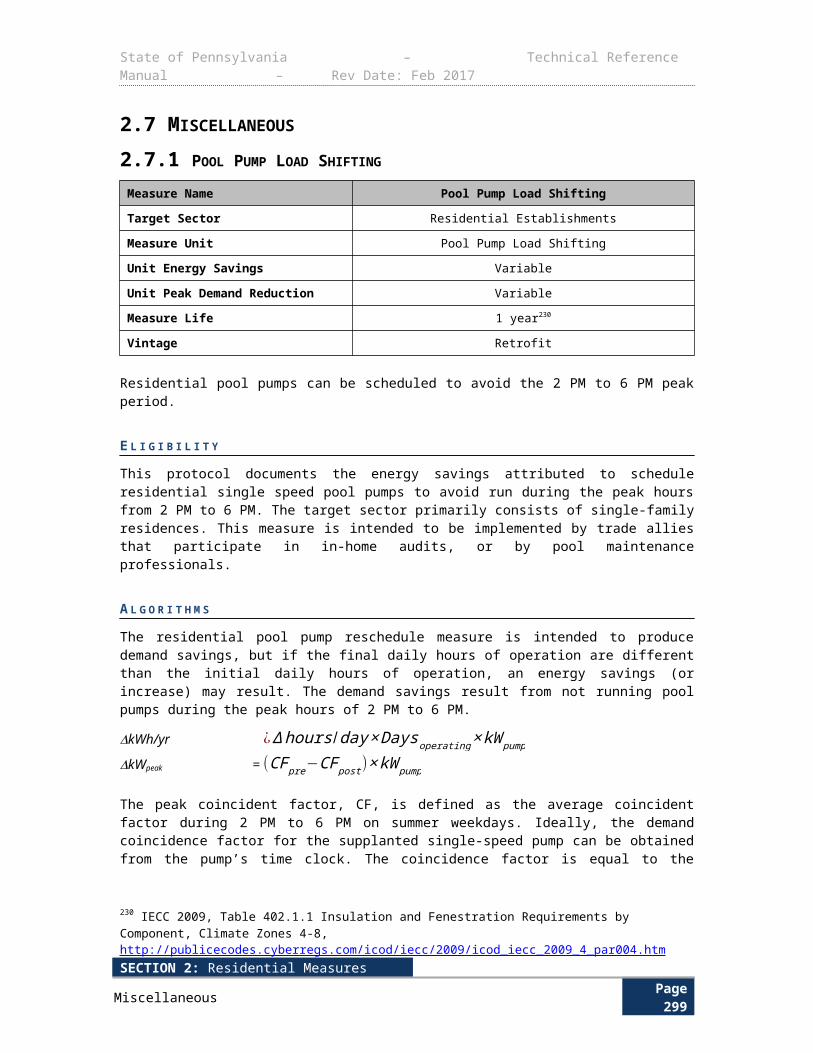
State of Pennsylvania – Technical Reference Manual – Rev Date: Feb 2017
Table 3-178: Refrigerant Charge Correction Calculations Assumptions
SECTION 2: Residential MeasuresMiscellaneous Page 303
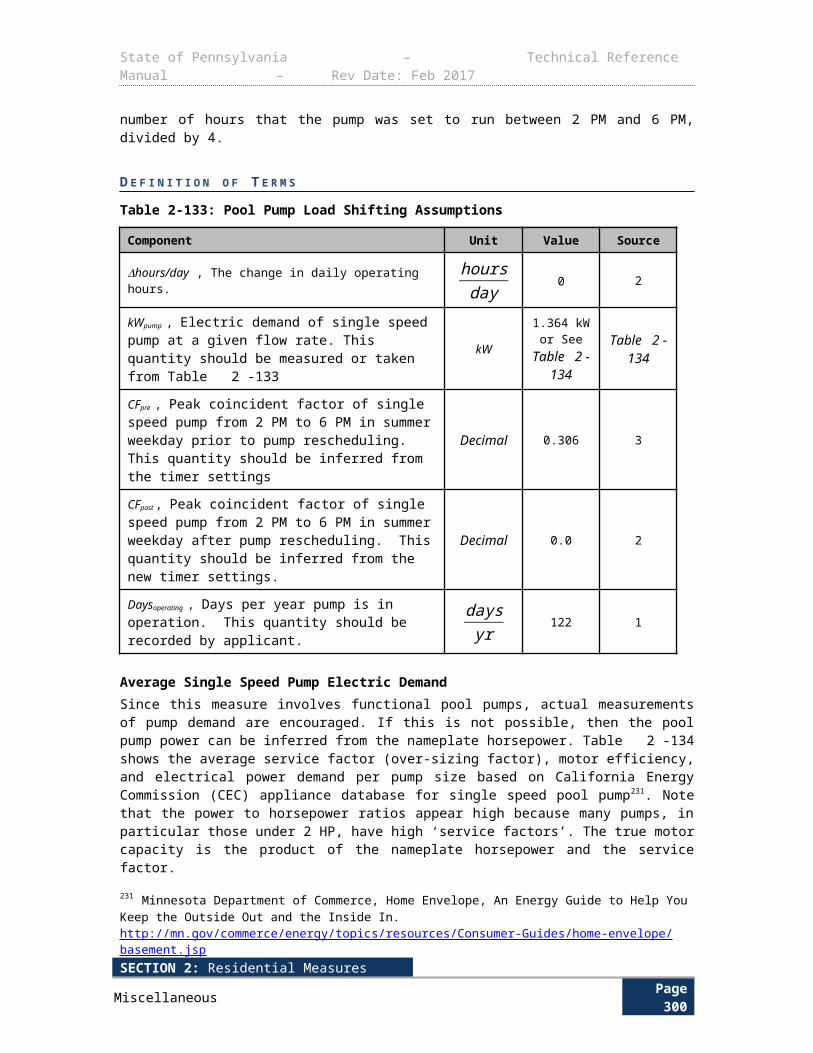
State of Pennsylvania – Technical Reference Manual – Rev Date: Feb 2017
Term Unit Values Source
CAPY c , Unit capacity for cooling Btuhr
From nameplate EDC Data Gathering
CAPY h , Unit capacity for heating Btuhr
From nameplate EDC Data Gathering
EER, Energy Efficiency Ratio. For A/C
and heat pump units < 65,000 Btuhr
,
SEER should be used for cooling savings.
Btu /hrW
From nameplate EDC Data Gathering
Default: See Table 3-160
See Table 3-160
IEER, Integrated energy efficiency ratio of the baseline unit.
Btu /hrW
From nameplate EDC Data Gathering
Default: See Table 3-160
See Table 3-160
SEER, Seasonal Energy Efficiency Ratio. For A/C and heat pump units >
65,000 Btuhr
, EER should be used for
cooling savings.
Btu /hrW
From nameplate EDC Data Gathering
Default: See Table 3-160 See Table 3-160
HSPF, Heating Seasonal Performance Factor. For heat pump units > 65,000 Btuhr
, COP should be used for heating
savings.
Btu /hrW
From nameplate EDC Data Gathering
Default: See Table 3-160
See Table 3-160
COP, Coefficient of Performance. For
heat pump units < 65,000 Btuhr
, HSPF
should be used for heating savings.
None
From nameplate EDC Data Gathering
Default: See Table 3-160
See Table 3-160
EFLH c , Equivalent Full-Load Hours for mechanical cooling
HoursYear
Default: See Table 3-161
1
Based on Logging, BMS
data or Modeling306
EDC Data Gathering
EFLH h , Equivalent Full-Load Hours for Heating
HoursYear
See Table 3-163 1
RCF, COP Degradation Factor for Cooling
None See Table 3-179 2
306 Baseline values from IECC 2009, after Jan 1, 2010 or Jan 23, 2010 as applicable.
SECTION 2: Residential MeasuresMiscellaneous Page 304
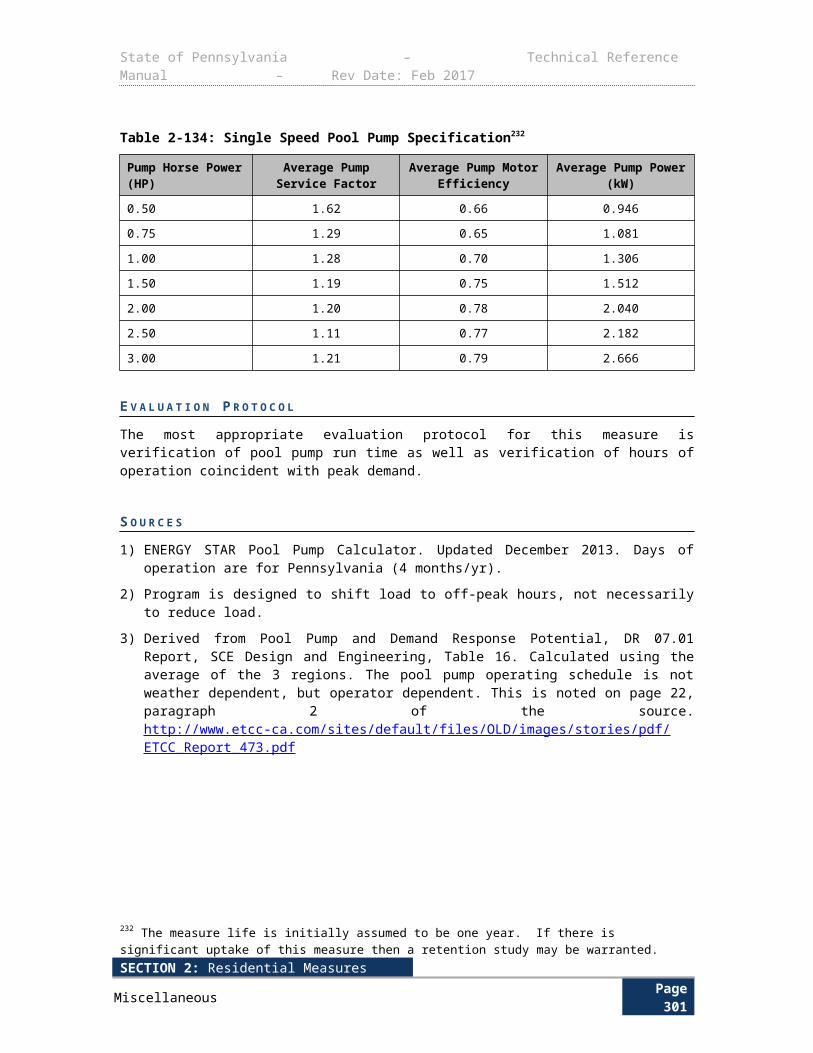
State of Pennsylvania – Technical Reference Manual – Rev Date: Feb 2017
Term Unit Values Source
CF, Demand Coincidence Factor Decimal See
Error: Referencesource not found
1
1000, convert from watts to kilowatts WkW 1000
Conversion Factor
11.3/13, Conversion factor from SEER to EER, based on average EER of a SEER 13 unit
None 11.313
3
Note: For air-source air conditioners and air-source heat pumps, subtract 0.2 from the required baseline efficiency rating value if unit has heating section other than electric resistance.
SECTION 2: Residential MeasuresMiscellaneous Page 305
State of Pennsylvania – Technical Reference Manual – Rev Date: Feb 2017
Table 3-179: Refrigerant charge correction COP degradation factor (RCF) for various relative charge adjustments for both TXV metered and non-TXV units.307
% of nameplate charge added (removed)
RCF (TXV)
RCF (Orifice)
% of nameplate
charge added
(removed)
RCF (TXV)
RCF (Orifice)
% of nameplate charge
added (removed)
RCF (TXV)
RCF (Orifice)
60% 68% 13% 28% 95% 83% (4%) 100% 100%
59% 70% 16% 27% 96% 84% (5%) 100% 99%
58% 71% 19% 26% 96% 85% (6%) 100% 99%
57% 72% 22% 25% 97% 87% (7%) 99% 99%
56% 73% 25% 24% 97% 88% (8%) 99% 99%
55% 74% 28% 23% 97% 89% (9%) 99% 98%
54% 76% 31% 22% 98% 90% (10%) 99% 98%
53% 77% 33% 21% 98% 91% (11%) 99% 97%
52% 78% 36% 20% 98% 92% (12%) 99% 97%
51% 79% 39% 19% 98% 92% (13%) 99% 96%
50% 80% 41% 18% 99% 93% (14%) 98% 96%
49% 81% 44% 17% 99% 94% (15%) 98% 95%
48% 82% 46% 16% 99% 95% (16%) 98% 95%
47% 83% 48% 15% 99% 95% (17%) 98% 94%
46% 84% 51% 14% 99% 96% (18%) 98% 93%
45% 85% 53% 13% 100% 97% (19%) 98% 93%
44% 86% 55% 12% 100% 97% (20%) 97% 92%
43% 86% 57% 11% 100% 98% (21%) 97% 91%
42% 87% 60% 10% 100% 98% (22%) 97% 90%
41% 88% 62% 9% 100% 98% (23%) 97% 90%
40% 89% 64% 8% 100% 99% (24%) 97% 89%
39% 89% 65% 7% 100% 99% (25%) 96% 88%
38% 90% 67% 6% 100% 99% (26%) 96% 87%
37% 91% 69% 5% 100% 100% (27%) 96% 86%
36% 91% 71% 4% 100% 100% (28%) 96% 85%
35% 92% 73% 3% 100% 100% (29%) 95% 84%
34% 92% 74% 2% 100% 100% (30%) 95% 83%
33% 93% 76% 1% 100% 100% (31%) 95% 82%
32% 94% 77% (0%) 100% 100% (32%) 95% 81%
31% 94% 79% (1%) 100% 100% (33%) 95% 80%
30% 95% 80% (2%) 100% 100% (34%) 94% 78%
307 Cap represents the rated cooling capacity of the product in Btu/h. If the unit’s capacity is less than 7,000 Btu/h, 7,000 Btu/h is used in the calculation. If the unit’s capacity is greater than 15,000 Btu/h, 15,000 Btu/h is used in the calculation.
SECTION 2: Residential MeasuresMiscellaneous Page 306
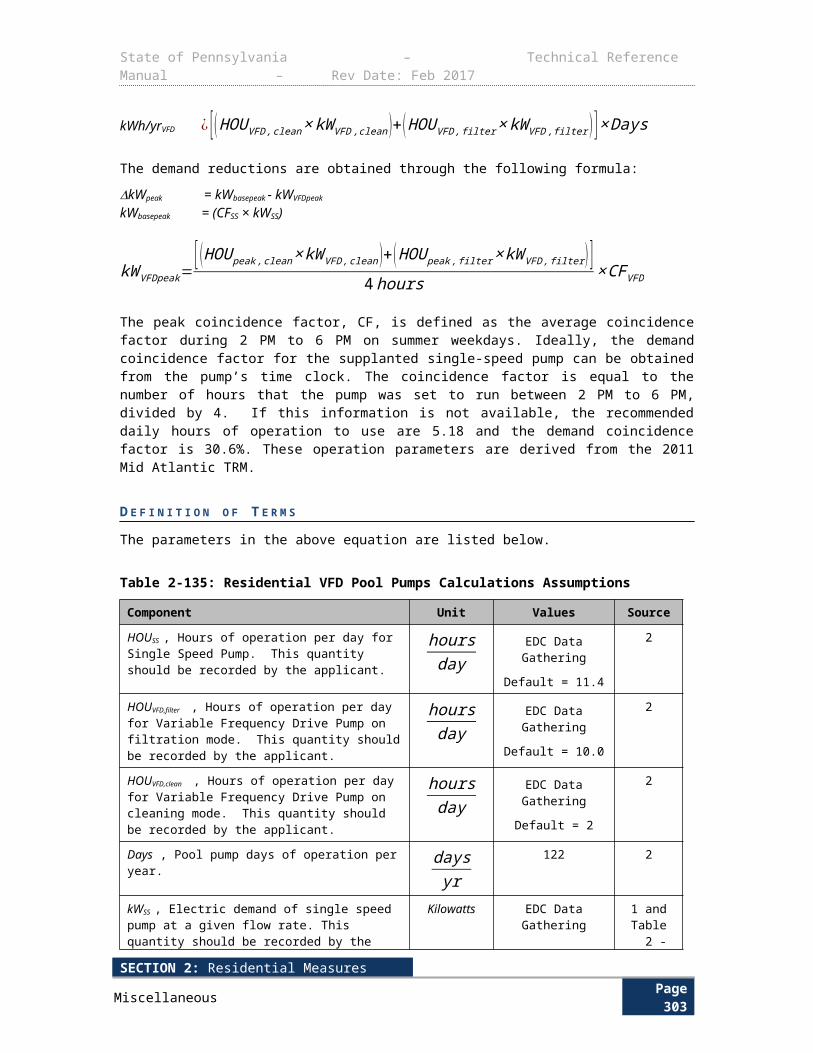
State of Pennsylvania – Technical Reference Manual – Rev Date: Feb 2017
% of nameplate charge added (removed)
RCF (TXV)
RCF (Orifice)
% of nameplate
charge added
(removed)
RCF (TXV)
RCF (Orifice)
% of nameplate charge
added (removed)
RCF (TXV)
RCF (Orifice)
29% 95% 82% (3%) 100% 100% (35%) 94% 77%
D E F A U L T S A V I N G S
There are no default savings for this measure.
E V A L U A T I O N P R O T O C O L S
For most projects, the appropriate evaluation protocol is to verify installation and proper selection of default values. For projects using customer specific data for open variables, the appropriate evaluation protocol is to verify installation and proper application of TRM protocol along with verification of open variables. The Pennsylvania Evaluation Framework provides specific guidelines and requirements for evaluation procedures.
S O U R C E S
1) Nexant’s eQuest modeling analysis.
2) Small HVAC Problems and Potential Savings Report, California Energy Commission, 2003. http://www.energy.ca.gov/2003publications/CEC-500-2003-082/CEC-500-2003-082-A-25.PDF
3) Average EER for SEER 13 units as calculated by EER = -0.02 × SEER² + 1.12 × SEER based on U.S. DOE Building America House Simulation Protocol, Revised 2010. http://www.nrel.gov/docs/fy11osti/49246.pdf
SECTION 2: Residential MeasuresMiscellaneous Page 307
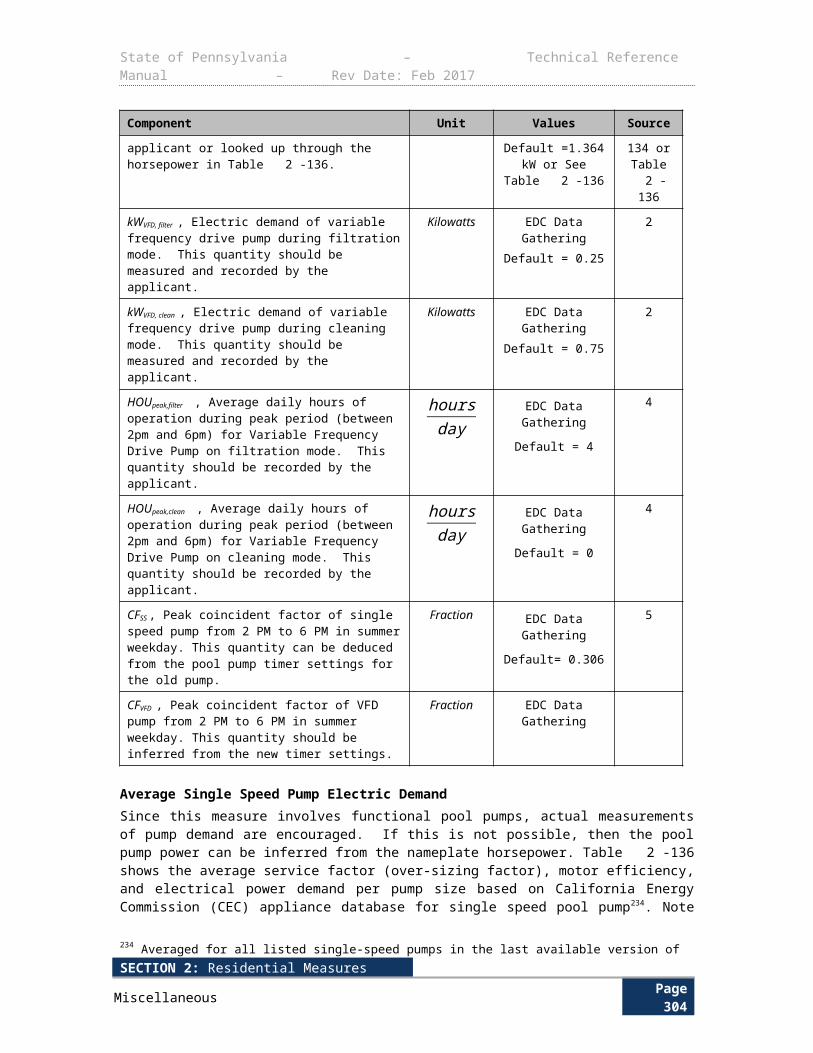
State of Pennsylvania – Technical Reference Manual – Rev Date: Feb 2017
3.2.7 ENERGY STAR ROOM AIR CONDITIONER
Measure Name ENERGY STAR Room Air Conditioner
Target Sector Commercial and Industrial Establishments
Measure Unit Room Air Conditioner
Unit Energy Savings Variable
Unit Peak Demand Reduction Variable
Measure Life 12 years308
Measure Vintage Replace on Burnout, Early Retirement, or New Construction
E L I G I B I L I T Y
This protocol is for ENERGY STAR room air conditioner units installed in small commercial spaces. All HVAC applications other than comfort cooling and heating, such as process cooling, are defined as non-standard applications and are ineligible for this measure. Only ENERGY STAR units qualify for this protocol.
A L G O R I T H M S
If CEER is not available, use EER.
kWh ¿( 11000
×Btucoolhr )×( 1
EERbase− 1EERee )×EFLHcool
¿( 11000
×Btucoolhr )×( 1
CEERbase− 1C EERee )× EFLH cool
∆ kW peak¿( 1
1000×Btucoolhr )×( 1
EERbase− 1EERee )×CF
D E F I N I T I O N O F T E R M S
308 DEER 2014 EUL Table.
SECTION 2: Residential MeasuresMiscellaneous Page 308
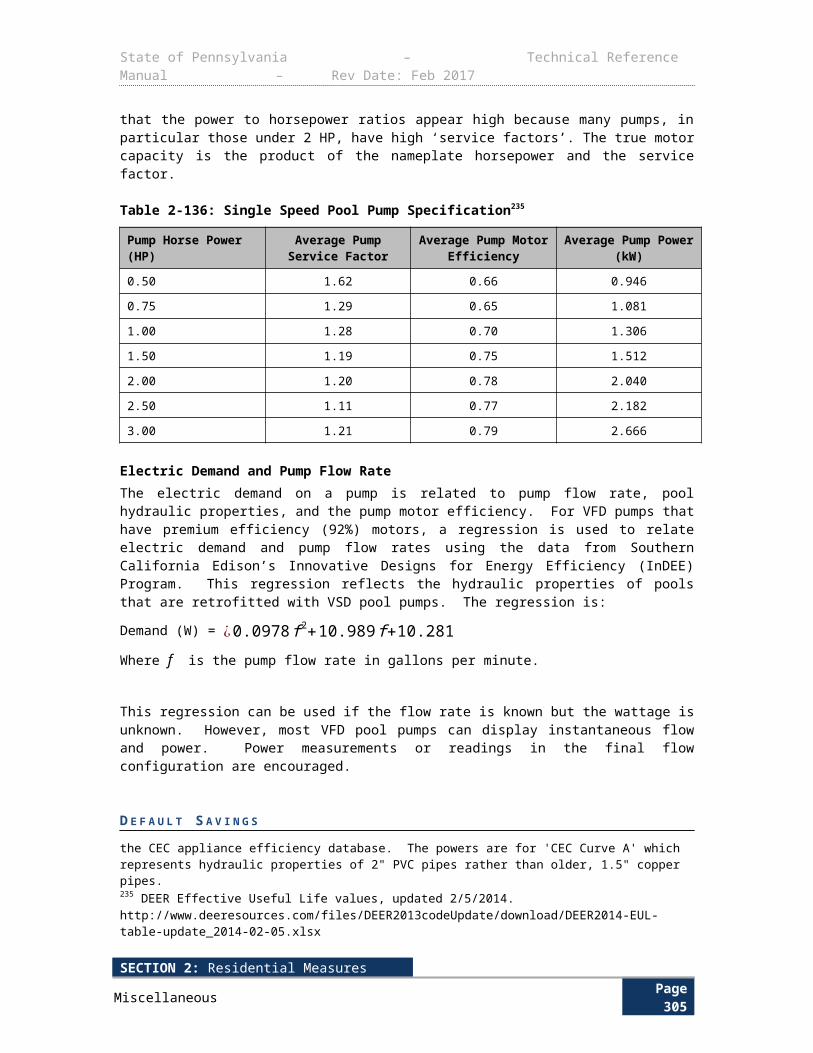
State of Pennsylvania – Technical Reference Manual – Rev Date: Feb 2017
Table 3-180: Variables for HVAC Systems
Term Unit Values Source
Btucoolhr
, Rated cooling capacity of the
energy efficient unit
Btuhr
Nameplate data (AHRI or AHAM)
EDC Data Gathering
CEERbase , EERbase , Efficiency rating of the baseline unit
None
New Construction or Replace on Burnout: Default values from
Table 3-181 to Table3-183
See Table 3-181 to Table
3-183
Early Replacement: Nameplate data
EDC Data Gathering
CEERee , EERee , Efficiency rating of the energy efficiency unit.
None Nameplate data (AHRI or AHAM)
EDC Data Gathering
CF, Demand Coincidence Factor None See Error: Referencesource not found 1
EFLH cool, Equivalent Full Load Hours for the cooling season – The kWh during the entire operating season divided by the kW at design conditions.
HoursYear
Based on Logging, BMS data or Modeling309
EDC Data Gathering
Default values from Table 3-161 1
Table 3-181 below lists the minimum federal efficiency standards for room air conditioners (effective as of June 1, 2014) and minimum ENERGY STAR efficiency standards for RAC units of various capacity ranges, with and without louvered sides. Units without louvered sides are also referred to as “through the wall” units or “built-in” units. Note that the new federal standards are based on the Combined Energy Efficiency Ratio Metric (CEER), which is a metric that incorporates energy use in all modes, including standby and off modes.310
309 Modeling is an acceptable substitute to metering and BMS data if modeling is conducted using building- and equipment-specific information at the site and the facility consumption is calibrated using 12 months of billing data (pre-retrofit).310Small HVAC Problems and Potential Savings Report, California Energy Commission, 2003. http://www.energy.ca.gov/2003publications/CEC-500-2003-082/CEC-500-2003-082-A-25.PDF
SECTION 2: Residential MeasuresMiscellaneous Page 309
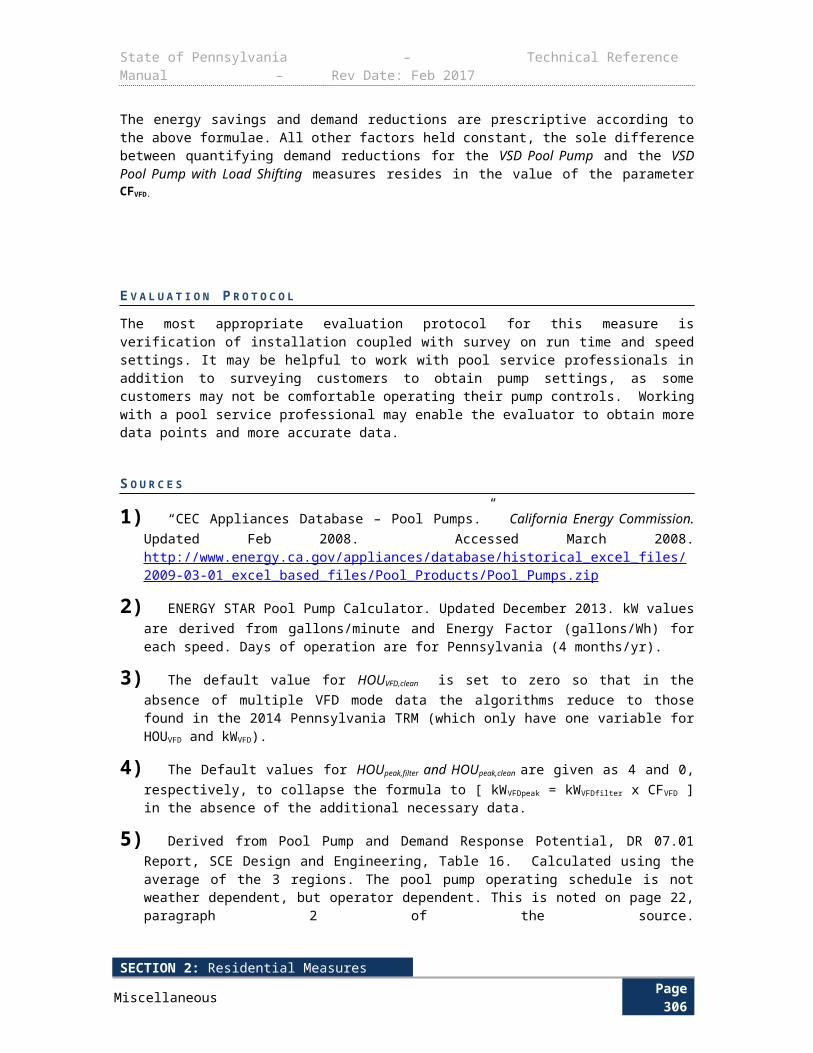
State of Pennsylvania – Technical Reference Manual – Rev Date: Feb 2017
Table 3-181: RAC Federal Minimum Efficiency and ENERGY STAR Version 4.0 Standards
Capacity (Btu/h)
Federal Standard CEER, with
louvered sides
ENERGY STAR CEER, with
louvered sides
Federal Standard CEER, without louvered sides
ENERGY STAR CEER, without louvered sides
< 6,00011.0 12.1 10.0 11.0
6,000 to 7,999
8,000 to 10,999
10.9 12.0
9.6 10.6
11,000 to 13,999 9.5 10.5
14,000 to 19,999 10.7 11.8 9.3 10.2
20,000 to 24,999 9.4
10.3 9.410.325,000 to
27,999 9.0
≥28,000 9.0 9.9 9.4
Table 3-182 lists the minimum federal efficiency standards and minimum ENERGY STAR efficiency standards for casement-only and casement-slider RAC units. Casement-only refers to a RAC designed for mounting in a casement window with an encased assembly with a width of ≤ 14.8 inches and a height of ≤ 11.2 inches. Casement-slider refers to a RAC with an encased assembly designed for mounting in a sliding or casement window with a width of ≤ 15.5 inches.
Table 3-182: Casement-Only and Casement-Slider RAC Federal Minimum Efficiency and ENERGY STAR Version 4.0 Standards
Casement Federal Standard CEER ENERGY STAR EER
Casement-only 9.5 10.5
Casement-slider 10.4 11.4
Table 3-183 lists the minimum federal efficiency standards and minimum ENERGY STAR efficiency standards for reverse-cycle RAC units.
SECTION 2: Residential MeasuresMiscellaneous Page 310

State of Pennsylvania – Technical Reference Manual – Rev Date: Feb 2017
Table 3-183: Reverse-Cycle RAC Federal Minimum Efficiency Standards and ENERGY STAR Version 4.0 Standards
Capacity (Btu/h)
Federal Standard CEER, with
louvered sides
ENERGY STAR EER, with
louvered sides
Federal Standard CEER, without louvered sides
ENERGY STAR EER, without
louvered sides
< 14,000n/a n/a
9.3 10.2
≥ 14,000 8.7 9.6
< 20,000 9.8 ≥ 10.8n/a n/a
≥ 20,000 9.3 10.2
D E F A U L T S A V I N G S
There are no default savings for this measure.
E V A L U A T I O N P R O T O C O L S For most projects, the appropriate evaluation protocol is to verify installation and proper selection of default values. For projects using customer specific data for open variables, the appropriate evaluation protocol is to verify installation and proper application of TRM protocol along with verification of open variables. The Pennsylvania Evaluation Framework provides specific guidelines and requirements for evaluation procedures.
S O U R C E S
1) Based on Nexant’s eQuest Modeling Analysis 2014.
SECTION 2: Residential MeasuresMiscellaneous Page 311

State of Pennsylvania – Technical Reference Manual – Rev Date: Feb 2017
3.2.8 CONTROLS: GUEST ROOM OCCUPANCY SENSOR
Measure Name Controls: Guest Room Occupancy Sensor
Target Sector Commercial and Industrial Establishments
Measure Unit Occupancy Sensor
Unit Energy Savings Variable
Unit Peak Demand Reduction Variable
Measure Life 15 years311
This protocol applies to the installation of a control system in hotel guest rooms to automatically adjust the temperature setback during unoccupied periods. Savings are based on the management of the guest room’s set temperatures and controlling the HVAC unit for various occupancy modes. The savings are per guestroom controlled, rather than per sensor, for multi-room suites.
E L I G I B I L I T Y
This measure is targeted to hotel customers whose guest rooms are equipped with energy management thermostats replacing manual heating/cooling temperature set-point and fan On/Off/Auto thermostat controls.
Acceptable baseline conditions are hotel guest rooms with manual heating/cooling temperature set-point and fan On/Off/Auto thermostat controls.
Efficient conditions are hotel/motel guest rooms with energy management controls of the heating/cooling temperature set-points and operation state based on occupancy modes.
A L G O R I T H M S
Energy savings estimates are deemed using the tables below. Estimates were derived using an EnergyPlus model of a motel312. Model outputs were normalized to the installed capacity and reported here as kWh/Ton and coincident peak kW/Ton. Motels and hotels show differences in shell performance, number of external walls per room and typical heating and cooling efficiencies, thus savings values are presented for hotels and motels separately. Savings also depend on the size and type of HVAC unit, and whether housekeeping staff are directed to set-back/turn-off the thermostats when rooms are unrented.
kWh ¿CAPY∗¿ ESF
∆ kW peak ¿CAPY∗DSF
311 Measure Life Report: Residential and Commercial/Industrial Lighting and HVAC Measures, GDS Associates, Inc., June 2007. http://library.cee1.org/sites/default/files/library/8842/CEE_Eval_MeasureLifeStudyLights%26HVACGDS_1Jun2007.pdf312 Modeling is an acceptable substitute to metering and BMS data if modeing is conducted using building- and equipment-specific information at the site and the facility consumption is calibrated using 12 months of billing data (pre-retrofit).
SECTION 2: Residential MeasuresMiscellaneous Page 312
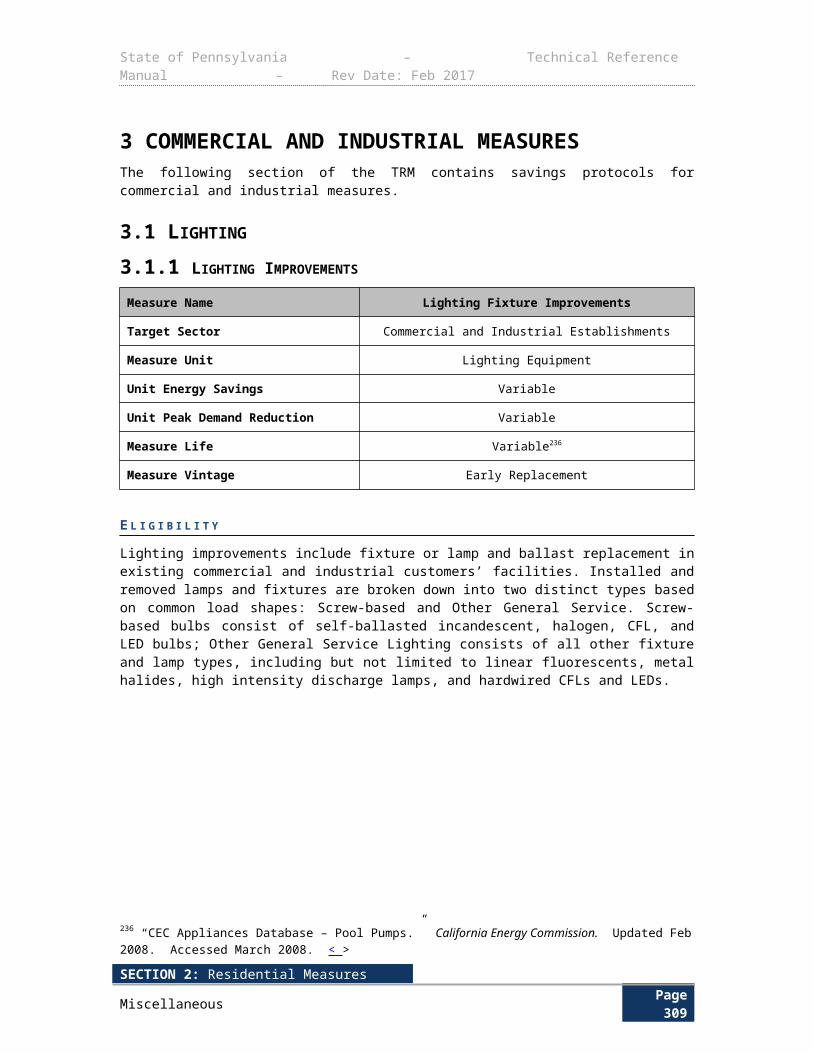
State of Pennsylvania – Technical Reference Manual – Rev Date: Feb 2017
D E F I N I T I O N O F T E R M S
Table 3-184: Guest Room Occupancy Sensor – Values and References
Term Unit Values Source
CAPY, Cooling capacity of controlled unit in tons ton EDC Data Gathering EDC Data Gathering
ESF, Energy savings factorkWhton
See Table 3-185 and Table 3-186 1
DSF, Demand savings factorkWton
See Table 3-187 and Table 3-188 1
Table 3-185: Energy Savings for Guest Room Occupancy Sensors – Motels
HVAC Type BaselineESF; Energy Savings
Factor(kWh/ton)
PTAC with Electric Resistance
HeatingHousekeeping Setback 559
No Housekeeping Setback 1,877
PTAC with Gas HeatingHousekeeping Setback 85
No Housekeeping Setback 287
PTHPHousekeeping Setback 260
No Housekeeping Setback 1,023
Table 3-186: Energy Savings for Guest Room Occupancy Sensors – Hotels
HVAC Type BaselineESF; Energy Savings
Factor(kWh/ton)
PTAC with Electric Resistance Heating
Housekeeping Setback 322
No Housekeeping Setback 1,083
PTAC with Gas HeatingHousekeeping Setback 259
No Housekeeping Setback 876
PTHPHousekeeping Setback 283
No Housekeeping Setback 1,113
Central Hot Water Fan Coil with Electric Resistance Heating
Housekeeping Setback 245
No Housekeeping Setback 822
Central Hot Water Fan Coil with Gas Heating
Housekeeping Setback 182
No Housekeeping Setback 615
SECTION 2: Residential MeasuresMiscellaneous Page 313
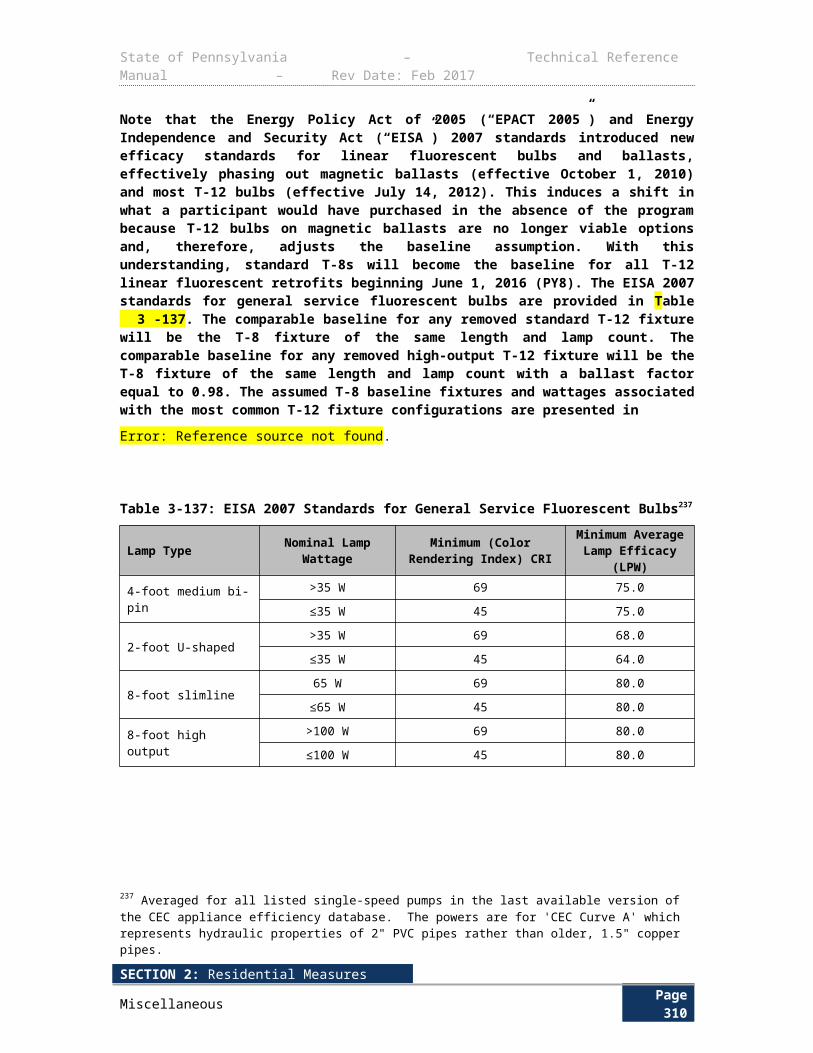
State of Pennsylvania – Technical Reference Manual – Rev Date: Feb 2017
Table 3-187: Peak Demand Savings for Guest Room Occupancy Sensors – Motels
HVAC Type BaselineDSF; Demand Savings
Factor(kW/ton)
PTAC with Electric Resistance
HeatingHousekeeping Setback 0.10
No Housekeeping Setback 0.28
PTAC with Gas HeatingHousekeeping Setback 0.10
No Housekeeping Setback 0.28
PTHPHousekeeping Setback 0.10
No Housekeeping Setback 0.28
Table 3-188: Peak Demand Savings for Guest Room Occupancy Sensors – Hotels
HVAC Type BaselineDSF; Demand Savings
Factor(kW/ton)
PTAC with Electric Resistance Heating
Housekeeping Setback 0.04
No Housekeeping Setback 0.10
PTAC with Gas HeatingHousekeeping Setback 0.03
No Housekeeping Setback 0.08
PTHPHousekeeping Setback 0.03
No Housekeeping Setback 0.09
Central Hot Water Fan Coil with Electric Resistance Heating
Housekeeping Setback 0.03
No Housekeeping Setback 0.08
Central Hot Water Fan Coil with Gas Heating
Housekeeping Setback 0.02
No Housekeeping Setback 0.06
D E F A U L T S A V I N G S
There are no default savings for this measure.
E V A L U A T I O N P R O T O C O L S
For most projects, the appropriate evaluation protocol is to verify installation and proper selection of default values. For projects using customer specific data for open variables, the appropriate evaluation protocol is to verify installation and proper application of TRM protocol along with verification of open variables. The Pennsylvania Evaluation Framework provides specific guidelines and requirements for evaluation procedures.
S O U R C E S
SECTION 2: Residential MeasuresMiscellaneous Page 314
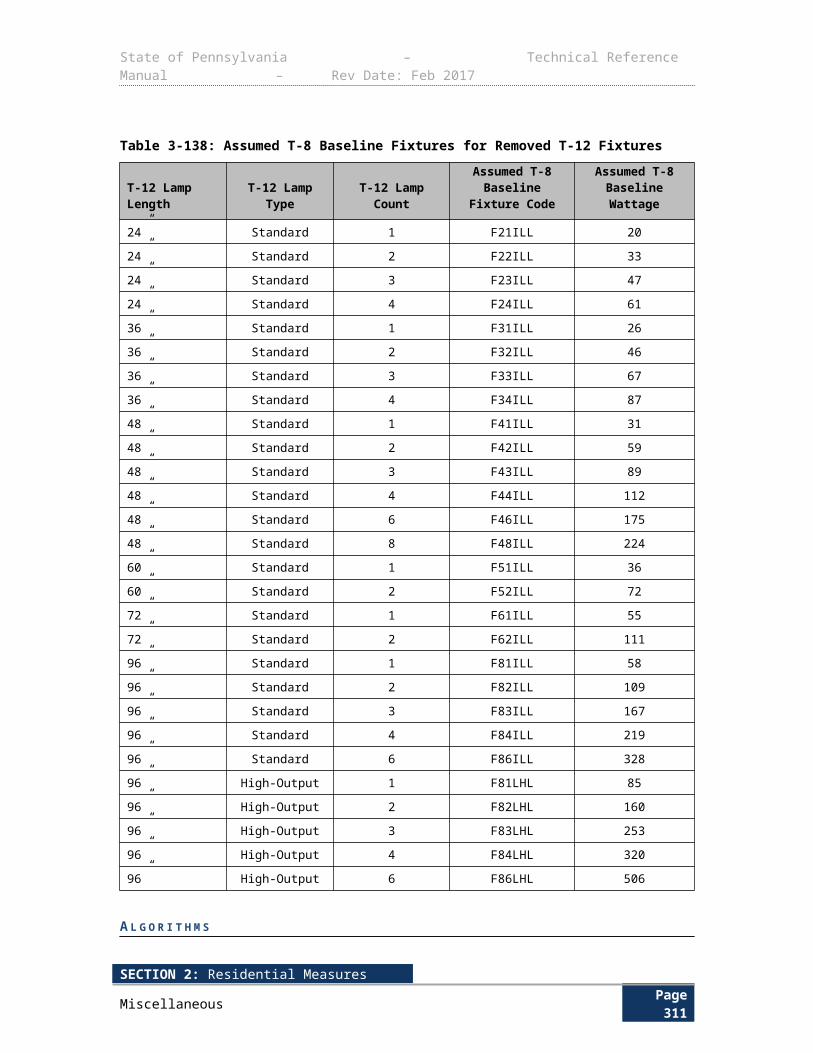
State of Pennsylvania – Technical Reference Manual – Rev Date: Feb 2017
1) S. Keates, ADM Associates Workpaper: “Suggested Revisions to Guest Room Energy Management (PTAC & PTHP)”, 11/14/2013 and spreadsheet summarizing the results: ‘GREM Savings Summary_IL TRM_1_22_14.xlsx.’ Five cities in IL were part of this study. Values in this protocol are based on the model for the city of Belleville, IL due to the similarity in the weather heating and cooling degree days with the city of Philadelphia, PA.
SECTION 2: Residential MeasuresMiscellaneous Page 315
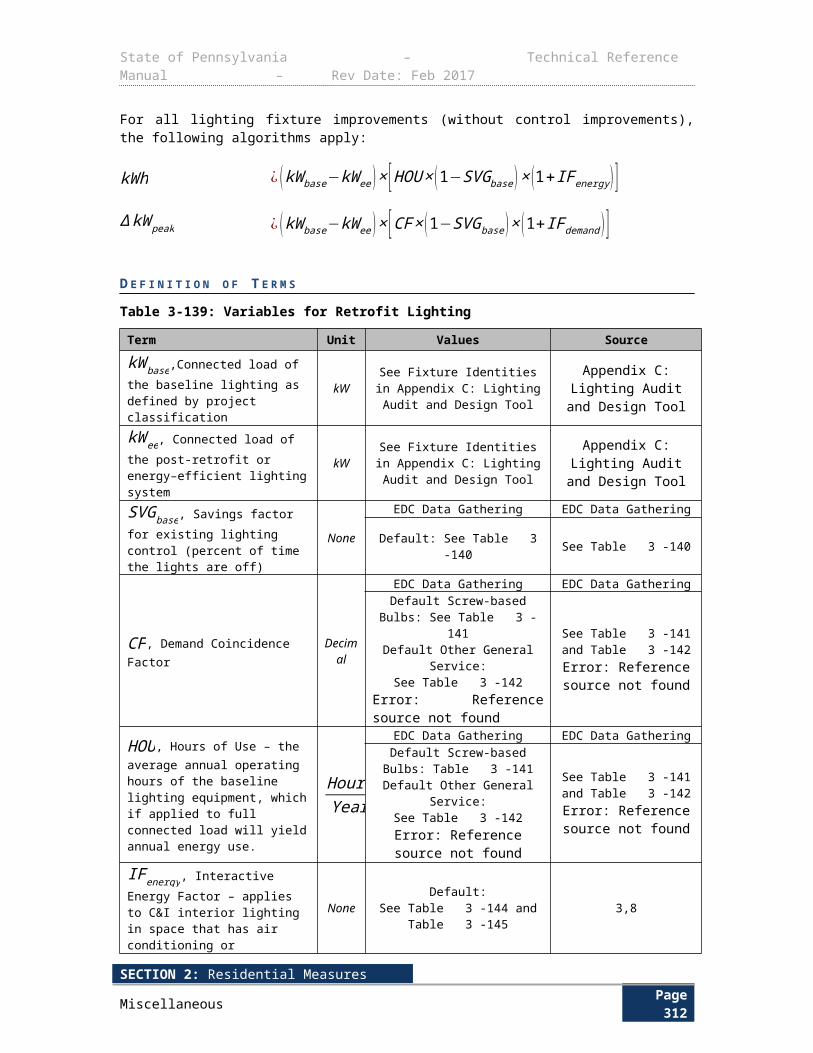
State of Pennsylvania – Technical Reference Manual – Rev Date: Feb 2017
3.2.9 CONTROLS: ECONOMIZER
Measure Name Controls: Economizer
Target Sector Commercial and Industrial Establishments
Measure Unit Economizer
Unit Energy Savings Variable
Unit Peak Demand Reduction 0 kW
Measure Life 10 years313
Measure Vintage Replace on Burnout, New Construction, or Retrofit
Dual enthalpy economizers regulate the amount of outside air introduced into the ventilation system based on the relative temperature and humidity of the outside and return air. If the enthalpy (latent and sensible heat) of the outside air is less than that of the return air when space cooling is required, then outside air is allowed in to reduce or eliminate the cooling requirement of the air conditioning equipment. Since the economizers will not be saving energy during peak hours, the demand savings are zero.
E L I G I B I L I T Y
This measure is targeted to non-residential establishments whose HVAC equipment is not equipped with a functional economizer.
Baseline condition is an HVAC unit with no economizer installed or with a non-functional/disabled economizer.
Efficient condition is an HVAC unit with an economizer and dual enthalpy (differential) control.
A L G O R I T H M S
kWh ¿SF× AREA×FCH r×12 MBh
tonEff
∆ kW peak ¿0
D E F I N I T I O N O F T E R M S
313 Federal standards: U.S. Department of Energy. Federal Register. 164th ed. Vol. 76, August 24, 2011. http://www.gpo.gov/fdsys/pkg/FR-2013-07-16/pdf/FR-2013-07-16.pdf
SECTION 2: Residential MeasuresMiscellaneous Page 316
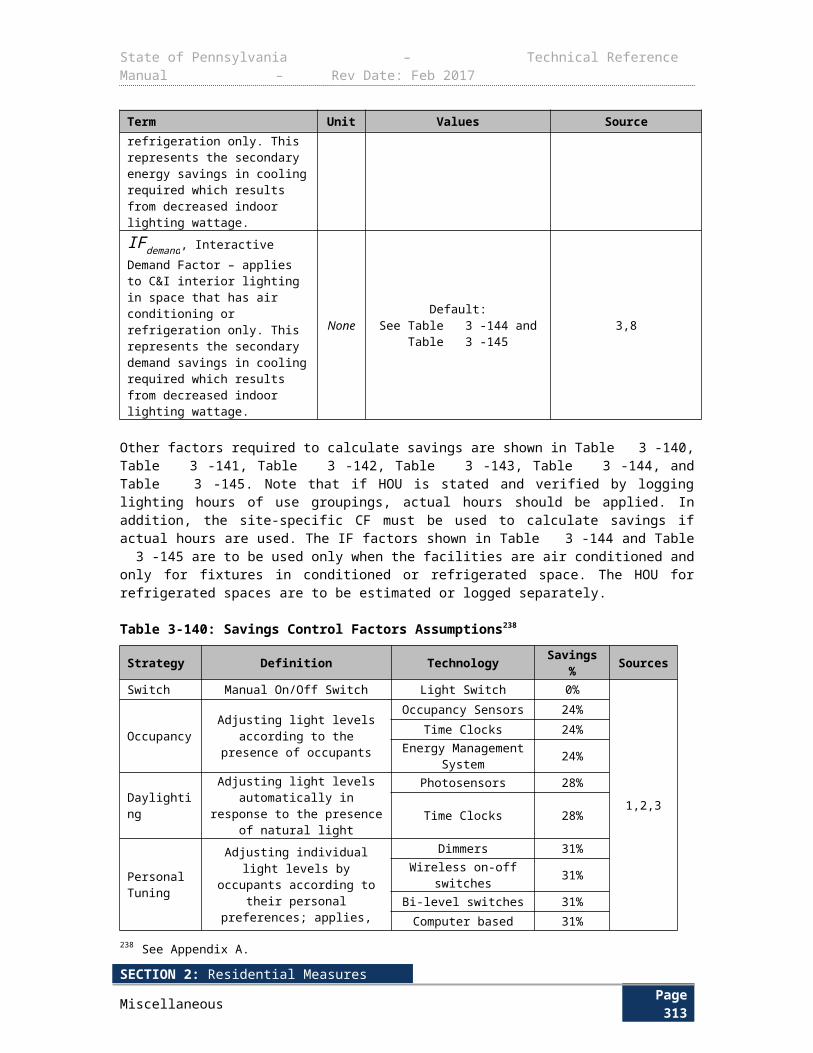
State of Pennsylvania – Technical Reference Manual – Rev Date: Feb 2017
Table 3-189: Economizer – Values and References
Term Unit Values Source
SF, Savings factor; Annual cooling load savings per unit area of conditioned space in the building when compared with a baseline HVAC system with no economizer.
tonsft2 0.002 1
AREA, Area of conditioned space served by controlled unit
ft2 EDC Data Gathering
FCH r , Free cooling hours with outdoor temperature between 60 F and 70 F. Typical operating hour conditions are defined below with standard climate zones for PA.
HoursYear
See Table 3-190 2
Eff , Efficiency of existing HVAC equipment. Depending on the size and age, this will either be the SEER, IEER, or EER (use EER only if SEER or IEER are not available)
MBhkW
EDC Data Gathering
Default: See Table3-191
3
Table 3-190: FCHr for PA Climate Zones and Various Operating Conditions
Location FCHr by Operating Schedule
Operating Schedule1 Shift, 5 days per
week
2 Shift, 5 days per
week
3 Shift, 5 days per
week24/7
Allentown 419 653 1057 1688
Erie 384 606 977 1563
Harrisburg 377 605 1000 1746
Philadelphia 413 634 1050 1694
Pittsburgh 401 603 947 1622
Scranton 465 705 1117 1787
Williamsport 383 605 1004 1682
Table 3-191: Default HVAC Efficiencies for Non-Residential Buildings314
Equipment Type and Capacity Cooling Baseline Heating Baseline
Air-Source Air Conditioners
< 65,000 Btuhr
13.0 SEER N/A
314 DEER 2014 value for energy management systems.
SECTION 2: Residential MeasuresMiscellaneous Page 317
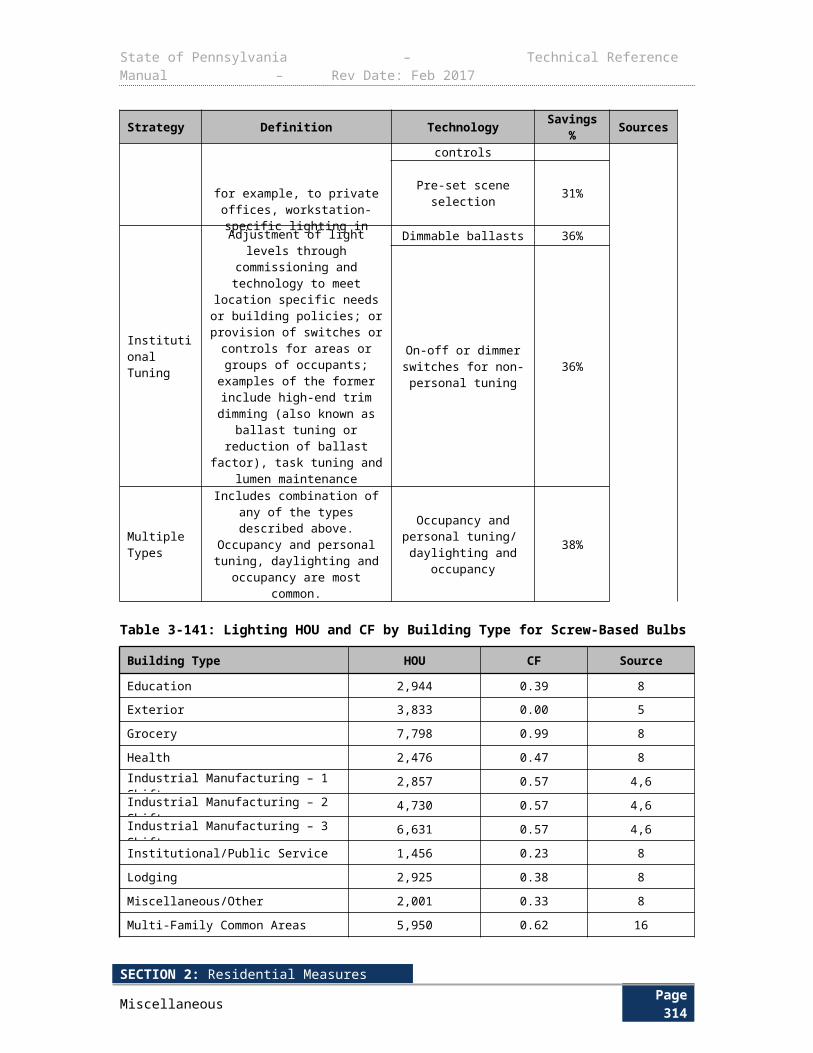
State of Pennsylvania – Technical Reference Manual – Rev Date: Feb 2017
Equipment Type and Capacity Cooling Baseline Heating Baseline
> 65,000 Btuhr
and <135,000
Btuhr
11.2 EER11.4 IEER N/A
> 135,000 Btuhr
and < 240,000
Btuhr
11.0 EER11.2 IEER N/A
> 240,000 Btuhr
and < 760,000
Btuhr
10.0 EER10.1 IEER N/A
> 760,000 Btuhr 9.7 EER
9.8 IEER N/A
Air-Source Heat Pumps
< 65,000 Btuhr
13 SEER 7.7 HSPF
> 65,000 Btuhr
and <135,000
Btuhr
11.0 EER11.2 IEER 3.3 COP
> 135,000 Btuhr
and < 240,000
Btuhr
10.6 EER10.7 IEER 3.2 COP
> 240,000 Btuhr 9.5 EER
9.6 IEER 3.2 COP
Packaged Terminal Systems (Nonstandard Size) - Replacement 315, 316
315 S. Keates, ADM Associates Workpaper: “Suggested Revisions to Guest Room Energy Management (PTAC & PTHP)”, 11/14/2013 and spreadsheet summarizing the results: ‘GREM Savings Summary_IL TRM_1_22_14.xlsx’.316 Based on ERS measure life study for Massachusetts Joint Utilities which looked at economizer life on HVAC systems in large commercial and industrial applications. http://rtf.nwcouncil.org/subcommittees/nonreslighting/Measure%20Life%20Study_MA%20Joint%20Utilities_2005_ERS-1.pdf
SECTION 2: Residential MeasuresMiscellaneous Page 318

State of Pennsylvania – Technical Reference Manual – Rev Date: Feb 2017
Equipment Type and Capacity Cooling Baseline Heating Baseline
PTAC (cooling) 10.9 - (0.213 x Cap / 1000) EER N/A
PTHP 10.8 - (0.213 x Cap / 1000) EER 2.9 - (0.026 x Cap / 1000) COP
Packaged Terminal Systems (Standard Size) – New Construction 317, 318
PTAC (cooling) 12.5 - (0.213 x Cap / 1000) EER N/A
PTHP 12.3 - (0.213 x Cap / 1000) EER 3.2 - (0.026 x Cap / 1000) COP
Water-Cooled Air Conditioners
317 Baseline values from IECC 2009 (https://law.resource.org/pub/us/code/ibr/icc.iecc.2009.pdf), after Jan 1, 2010 or Jan 23, 2010 as applicable. Integrated Energy Efficiency Ratio (IEER) requirements have been incorporated from ASHRAE 90.1-2007, “Energy Standard for Buildings Except Low-Rise Residential Buildings”, 2008 Supplement (Addendum S: (Tables 6.8.1A and 6.8.1B). IECC 2009 does not present IEER requirements.318Nonstandard size packaged terminal air conditioners and heat pumps with existing sleeves having an external wall opening of less than 16 in. high or less than 42 in. wide and having a cross-sectional area less than 670 in. Shall be factory labeled as follows: Manufactured for nonstandard size applications only: not to be installed in new construction projects.
SECTION 2: Residential MeasuresMiscellaneous Page 319
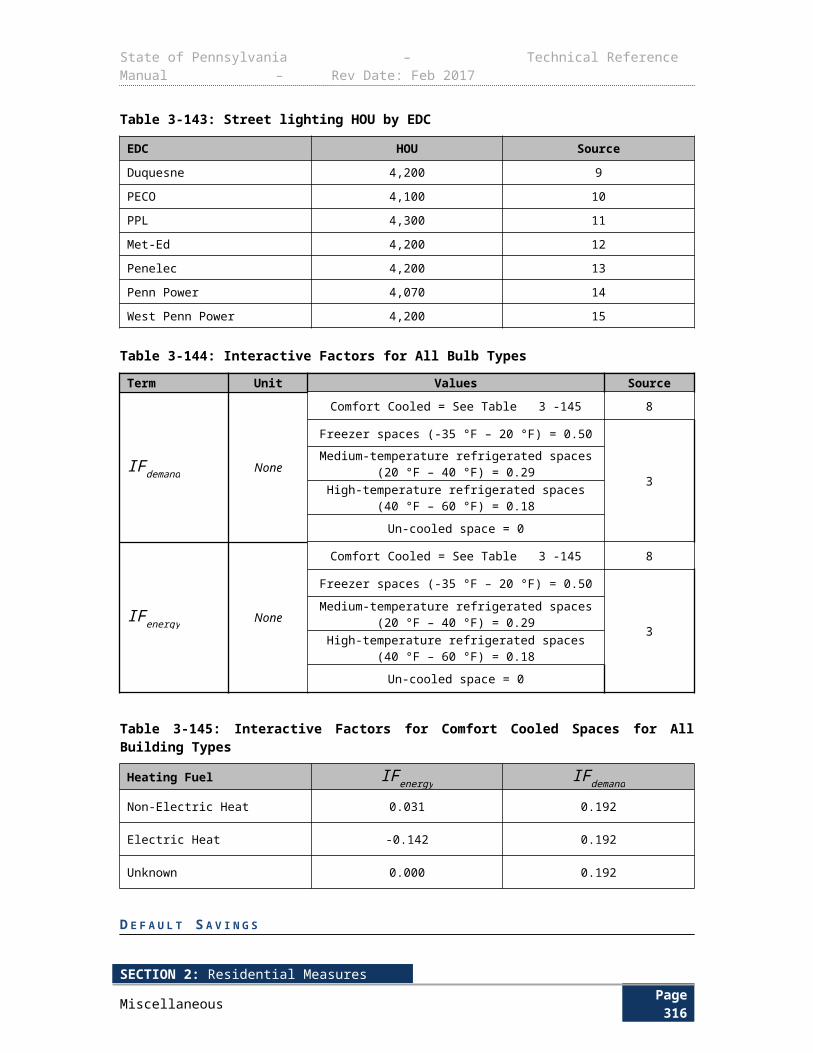
State of Pennsylvania – Technical Reference Manual – Rev Date: Feb 2017
Equipment Type and Capacity Cooling Baseline Heating Baseline
< 65,000 Btuhr
12.1 EER12.3 IEER N/A
> 65,000 Btuhr
and <135,000
Btuhr
12.1 EER12.3 IEER N/A
> 135,000 Btuhr
and < 240,000
Btuhr
12.5 EER12.7 IEER N/A
> 240,000 Btuhr
and < 760,000
Btuhr
12.4 EER12.6 IEER N/A
> 760,000 Btuhr
11.5 EER11.1 IEER N/A
Evaporatively-Cooled Air Conditioners
< 65,000 Btuhr
12.1 EER12.3 IEER N/A
> 65,000 Btuhr
and <135,000
Btuhr
12.1 EER12.3 IEER N/A
> 135,000 Btuhr
and < 240,000
Btuhr
12.0 EER12.2 IEER N/A
> 240,000 Btuhr
and < 760,000
Btuhr
11.9 EER12.1 IEER N/A
> 760,000 Btuhr
11.5 EER11.1 IEER N/A
SECTION 2: Residential MeasuresMiscellaneous Page 320
State of Pennsylvania – Technical Reference Manual – Rev Date: Feb 2017
Note: For air-source air conditioners, water-source and evaporatively-cooled air conditioners, subtract 0.2 from the required baseline efficiency rating value if unit has heating section other than electric resistance.
D E F A U L T S A V I N G S
Default savings may be claimed using the algorithms above and the variable defaults along with required EDC data gathering of customer data.
E V A L U A T I O N P R O T O C O L S
For most projects, the appropriate evaluation protocol is to verify installation and proper selection of default values. For projects using customer specific data for open variables, the appropriate evaluation protocol is to verify installation and proper application of TRM protocol along with verification of open variables. The Pennsylvania Evaluation Framework provides specific guidelines and requirements for evaluation procedures.
S O U R C E S
1) Bell Jr., Arthur A., 2007. HVAC Equations, Data, and Rules of Thumb, second edition, pages 51-52. Assuming 500 CFM/ton (total heat of 300-500 cfm/ton @20F delta) and interior supply flow of 1 CFM/Sq Ft as rule of thumb for all spaces, divide 1 by 500 to get 0.002 ton/Sq Ft savings factor used. This is the assumed cooling load per sq ft of a typical space and what the economizer will fully compensate for during free cooling temperatures.
2) Hours calculated based on local TMY weather data with outdoor temperature between 60°F and 70°F.
3) Baseline values from IECC 2009, Tables 503.2.3(1), 503.2.3(2), and 503.2.3(3). After Jan 1, 2010 or Jan 23, 2010 as applicable. Integrated Energy Efficiency Ratio (IEER) requirements have been incorporated from ASHRAE 90.1-2007, “Energy Standard for Buildings Except Low-Rise Residential Buildings”, 2008 Supplement (Addendum S: (Tables 6.8.1A and 6.8.1B). IECC 2009 does not present IEER requirements. https://law.resource.org/pub/us/code/ibr/icc.iecc.2009.pdf
SECTION 2: Residential MeasuresMiscellaneous Page 321
State of Pennsylvania – Technical Reference Manual – Rev Date: Feb 2017
3.3 MOTORS AND VFDS3.3.1 PREMIUM EFFICIENCY MOTORS
Measure Name Premium Efficiency Motors
Target Sector Commercial and Industrial Establishments
Measure Unit Motor
Unit Energy Savings Variable
Unit Peak Demand Reduction Variable
Measure Life 15 years319
Measure Vintage Replace on Burnout, New Construction, or Early Replacement
E L I G I B I L I T Y
For constant speed and uniformly loaded motors, the prescriptive measurement and verification protocols described below apply to the replacement of old motors with new energy efficient motors of the same rated horsepower and for New Construction. Replacements where the old motor and new motor have different horsepower ratings are considered custom measures. Motors with variable speeds, variable loading, or industrial-specific applications are also considered custom measures.
Note that the Coincidence Factor (CF) and Run Hours of Use (RHRS) for motors specified below do not take into account systems with multiple motors serving the same load, such as duplex motor sets with a lead-lag setup. Under these circumstances, a custom measure protocol is required.
A L G O R I T H M S
From EDC data gathering calculate kW where:
319 Cap represents the rated cooling capacity of the product in Btu/hr. If the unit’s capacity is less than 7,000 Btu/hr, 7,000 Btu/hr is used in the calculation. If the unit’s capacity is greater than 15,000 Btu/hr, 15,000 Btu/hr is used in the calculation.
SECTION 2: Residential MeasuresMiscellaneous Page 322
State of Pennsylvania – Technical Reference Manual – Rev Date: Feb 2017
kWh ¿kWhbase−kWhee
kWhbase ¿0.746×HP× LFηbase
×RHRS
kWhee ¿0.746×HP× LFηee
× RHRS
∆ kW peak ¿kW base−kW ee
kW base ¿0.746×HP× LFηbase
×CF
kW ee ¿0.746×HP× LFηee
×CF
D E F I N I T I O N O F T E R M S
Relative to the algorithms in section (3.3.1), kW values will be calculated for each motor improvement in any project (account number). For the efficiency of the baseline motor, if a new motor was purchased as an alternative to rewinding an old motor, the nameplate efficiency of the old motor may be used as the baseline.
SECTION 2: Residential MeasuresMiscellaneous Page 323
State of Pennsylvania – Technical Reference Manual – Rev Date: Feb 2017
Table 3-192: Building Mechanical System Variables for Premium Efficiency Motor Calculations
Term Unit Value Source
HP, Rated horsepower of the baseline and energy efficient motor
HP Nameplate EDC Data Gathering
RHRS, Annual run hours of the motorHoursYear
Based on logging, panel data or modeling320
EDC Data Gathering
Default: Table 3-195 to Table 3-199 1
LF , Load Factor. Ratio between the actual load and the rated load. Motor efficiency curves typically result in motors being most efficient at approximately 75% of the rated load. The default value is 0.75. Variable loaded motors should use custom measure protocols.
None
Based on spot metering 321 and
nameplate
EDC Data Gathering
Default: 75% 2
ηbase, Efficiency of the baseline motor None
Early Replacement: Nameplate
EDC Data Gathering
New Construction or Replace on Burnout: Default comparable
standard motor.
See Table 3-193 and Table 3-194
3
ηee, Efficiency of the energy-efficient motor
None Nameplate EDC Data Gathering
CF ,Demand Coincidence Factor Decimal
EDC Data Gathering EDC Data Gathering
Table 3-195 to Table3-199 1
Table 3-193: Baseline Efficiencies for NEMA Design A and NEMA Design B Motors
Motor HP
Motor Nominal Full-Load Efficiencies (percent)
2 Poles 4 poles 6 Poles 8 Poles
Enclosed Open Enclosed Open Enclosed Open Enclosed Open
1 77.0 77.0 85.5 85.5 82.5 82.5 75.5 75.5
1.5 84.0 84.0 86.5 86.5 87.5 86.5 78.5 77.0
320 This is intended for applications with standard size exterior wall openings. 321 Cap represents the rated cooling capacity of the product in Btu/hr. If the unit’s capacity is less than 7,000 Btu/hr, 7,000 Btu/hr is used in the calculation. If the unit’s capacity is greater than 15,000 Btu/h, 15,000 Btu/hr is used in the calculation.
SECTION 2: Residential MeasuresMiscellaneous Page 324
State of Pennsylvania – Technical Reference Manual – Rev Date: Feb 2017
2 85.5 85.5 86.5 86.5 88.5 87.5 84.0 86.5
3 86.5 85.5 89.5 89.5 89.5 88.5 85.5 87.5
5 88.5 86.5 89.5 89.5 89.5 89.5 86.5 88.5
7.5 89.5 88.5 91.7 91.0 91.0 90.2 86.5 89.5
10 90.2 89.5 91.7 91.7 91.0 91.7 89.5 90.2
15 91.0 90.2 92.4 93.0 91.7 91.7 89.5 90.2
20 91.0 91.0 93.0 93.0 91.7 92.4 90.2 91.0
25 91.7 91.7 93.6 93.6 93.0 93.0 90.2 91.0
30 91.7 91.7 93.6 94.1 93.0 93.6 91.7 91.7
40 92.4 92.4 94.1 94.1 94.1 94.1 91.7 91.7
50 93.0 93.0 94.5 94.5 94.1 94.1 92.4 92.4
60 93.6 93.6 95.0 95.0 94.5 94.5 92.4 93.0
75 93.6 93.6 95.4 95.0 94.5 94.5 93.6 94.1
100 94.1 93.6 95.4 95.4 95.0 95.0 93.6 94.1
125 95.0 94.1 95.4 95.4 95.0 95.0 94.1 94.1
150 95.0 94.1 95.8 95.8 95.8 95.4 94.1 94.1
200 95.4 95.0 96.2 95.8 95.8 95.4 94.5 94.1
250 95.8 95.0 96.2 95.8 95.8 95.8 95.0 95.0
300 95.8 95.4 96.2 95.8 95.8 95.8 N/A N/A
350 95.8 95.4 96.2 95.8 95.8 95.8 N/A N/A
400 95.8 95.8 96.2 95.8 N/A N/A N/A N/A
450 95.8 96.2 96.2 96.2 N/A N/A N/A N/A
500 95.8 96.2 96.2 96.2 N/A N/A N/A N/A
Table 3-194: Baseline Motor Efficiencies for NEMA Design C Motors
Motor HP
Motor Nominal Full-Load Efficiencies (percent)
4 Pole 6 Pole 8 Pole
Enclosed Open Enclosed Open Enclosed Open
1 85.50 85.50 82.50 82.50 75.50 75.50
1.5 86.50 86.50 87.50 86.50 78.50 77.00
SECTION 2: Residential MeasuresMiscellaneous Page 325
State of Pennsylvania – Technical Reference Manual – Rev Date: Feb 2017
2 86.50 86.50 88.50 87.50 84.00 86.50
3 89.50 89.50 89.50 88.50 85.50 87.50
5 89.50 89.50 89.50 89.50 86.50 88.50
7.5 91.70 91.00 91.00 90.20 86.50 89.50
10 91.70 91.70 91.00 91.70 89.50 90.20
15 92.40 93.00 91.70 91.70 89.50 90.20
20 93.00 93.00 91.70 92.40 90.20 91.00
25 93.60 93.60 93.00 93.00 90.20 91.00
30 93.60 94.10 93.00 93.60 91.70 91.70
40 94.10 94.10 94.10 94.10 91.70 91.70
50 94.50 94.50 94.10 94.10 92.40 92.40
60 95.00 95.00 94.50 94.50 92.40 93.00
75 95.40 95.00 94.50 94.50 93.60 94.10
100 95.40 95.40 95.00 95.00 93.60 94.10
125 95.40 95.40 95.00 95.00 94.10 94.10
150 95.80 95.80 95.80 95.40 94.10 94.10
200 96.20 95.80 95.80 95.40 94.50 94.10
SECTION 2: Residential MeasuresMiscellaneous Page 326
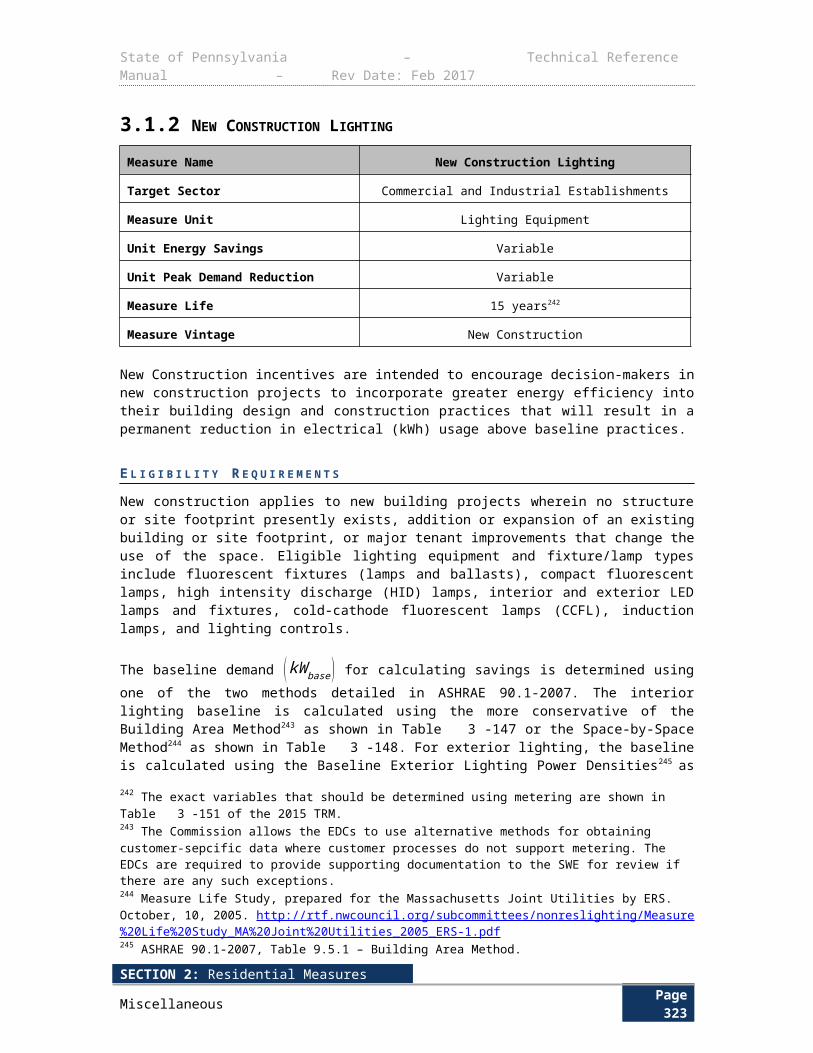
State of Pennsylvania – Technical Reference Manual – Rev Date: Feb 2017
Table 3-195: Default RHRS and CFs for Supply Fan Motors in Commercial Buildings322
322 DEER 2014 Effective Useful Life.
SECTION 2: Residential MeasuresMiscellaneous Page 327
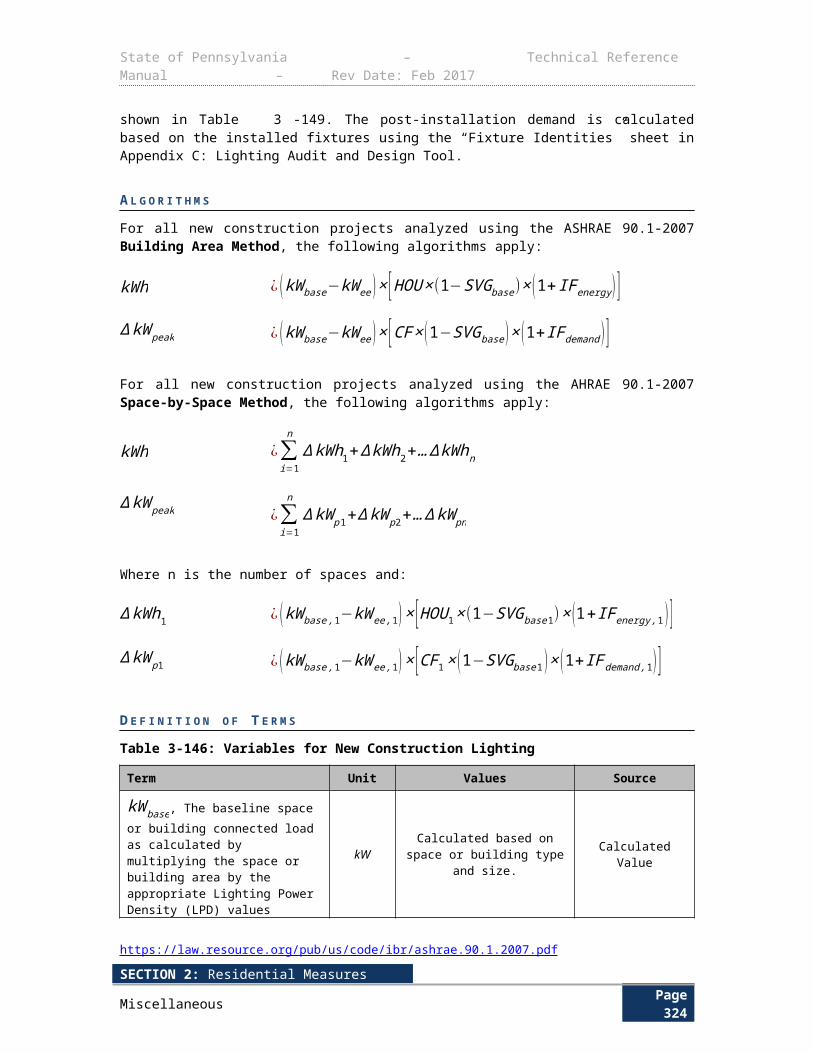
State of Pennsylvania – Technical Reference Manual – Rev Date: Feb 2017
Facility Type
Par
amet
er
Alle
ntow
n
Erie
Har
risbu
rg
Phi
lade
lphi
a
Pitt
sbur
gh
Scr
anto
n
Will
iam
sbur
g
Assembly
Run Hours 5,188 5,217 5,172 5,186 5,201 5,207 5,184
CF 0.53 0.45 0.60 0.72 0.56 0.47 0.52
Education - Community College
Run Hours 5,972 6,081 5,772 5,878 5,911 5,795 5,824
CF 0.44 0.32 0.45 0.48 0.43 0.40 0.47
Education - Primary School
Run Hours 3,753 3,961 3,699 3,894 3,790 3,881 3,763
CF 0.10 0.07 0.16 0.16 0.17 0.11 0.12
Education - Relocatable Classroom
Run Hours 5,467 5,649 5,375 5,321 5,556 5,607 5,439
CF 0.15 0.11 0.18 0.19 0.20 0.14 0.15
Education - Secondary School
Run Hours 3,920 4,106 3,866 3,937 3,900 3,983 3,928
CF 0.11 0.09 0.18 0.19 0.17 0.12 0.17
Education - University
Run Hours 6,111 6,196 5,948 6,053 6,053 5,957 5,985
CF 0.41 0.31 0.43 0.45 0.40 0.36 0.40
Grocery
Run Hours 6,708 6,738 6,692 6,669 6,718 6,725 6,710
CF 0.24 0.22 0.24 0.26 0.29 0.21 0.24
Health/Medical - Hospital
Run Hours 8,760 8,760 8,760 8,760 8,760 8,760 8,760
CF 0.43 0.39 0.45 0.51 0.45 0.40 0.41
Health/Medical - Nursing Home
Run Hours 8,760 8,760 8,760 8,760 8,760 8,760 8,760
CF 0.24 0.23 0.29 0.31 0.29 0.25 0.28
Lodging - Hotel
Run Hours 8,760 8,760 8,760 8,760 8,760 8,760 8,760
CF 0.64 0.65 0.71 0.71 0.73 0.65 0.71
Manufacturing Run 3,570 3,616 3,539 3,565 3,571 3,552 3,573
SECTION 2: Residential MeasuresMiscellaneous Page 328
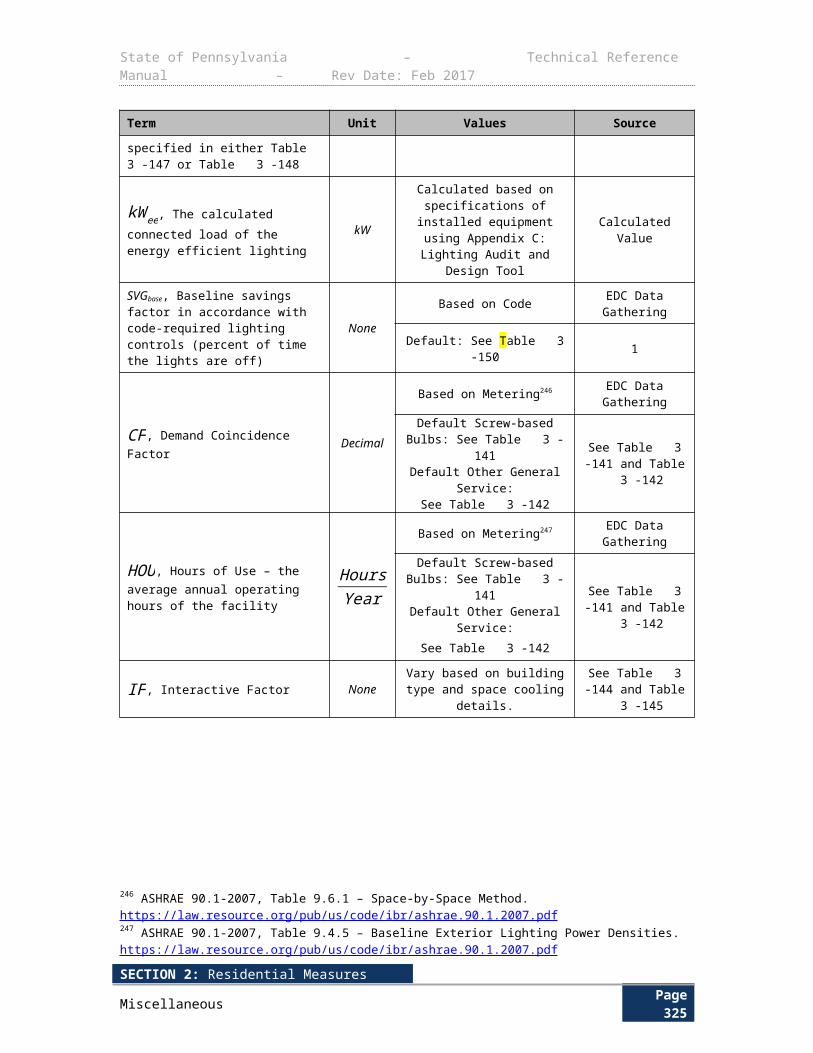
State of Pennsylvania – Technical Reference Manual – Rev Date: Feb 2017
Facility Type
Par
amet
er
Alle
ntow
n
Erie
Har
risbu
rg
Phi
lade
lphi
a
Pitt
sbur
gh
Scr
anto
n
Will
iam
sbur
g
- Bio Tech/High Tech
Hours
CF 0.56 0.44 0.57 0.61 0.57 0.50 0.52
Manufacturing - Light Industrial
Run Hours 4,092 4,338 3,998 4,111 4,167 4,251 4,084
CF 0.39 0.31 0.49 0.52 0.42 0.36 0.40
Office - Large
Run Hours 4,400 4,696 4,298 4,342 4,503 4,441 4,353
CF 0.30 0.29 0.39 0.39 0.34 0.34 0.35
Office - Small
Run Hours 3,990 4,185 3,876 3,784 3,976 4,014 3,924
CF 0.29 0.27 0.35 0.38 0.35 0.30 0.33
Restaurant - Fast-Food
Run Hours 7,328 7,398 7,300 7,238 7,313 7,342 7,332
CF 0.36 0.33 0.39 0.47 0.44 0.38 0.42
Restaurant - Sit-Down
Run Hours 5,236 5,332 5,203 5,213 5,286 5,288 5,239
CF 0.39 0.41 0.45 0.53 0.54 0.40 0.48
Retail - Multistory Large
Run Hours 4,893 4,897 4,885 4,885 4,907 4,890 4,896
CF 0.48 0.39 0.54 0.53 0.48 0.44 0.49
Retail - Single-Story Large
Run Hours 5,486 5,494 5,481 5,497 5,502 5,493 5,487
CF 0.50 0.40 0.53 0.63 0.55 0.47 0.47
Retail - Small
Run Hours 5,031 5,083 4,959 4,895 5,030 5,063 5,018
CF 0.53 0.52 0.51 0.53 0.59 0.45 0.50
Storage - Conditioned
Run Hours 5,037 5,222 4,980 5,168 5,110 5,188 5,028
CF 0.18 0.13 0.24 0.30 0.23 0.15 0.20
Warehouse - Refrigerated
Run Hours
4,041 4,041 4,041 4,041 4,041 4,041 4,041
SECTION 2: Residential MeasuresMiscellaneous Page 329
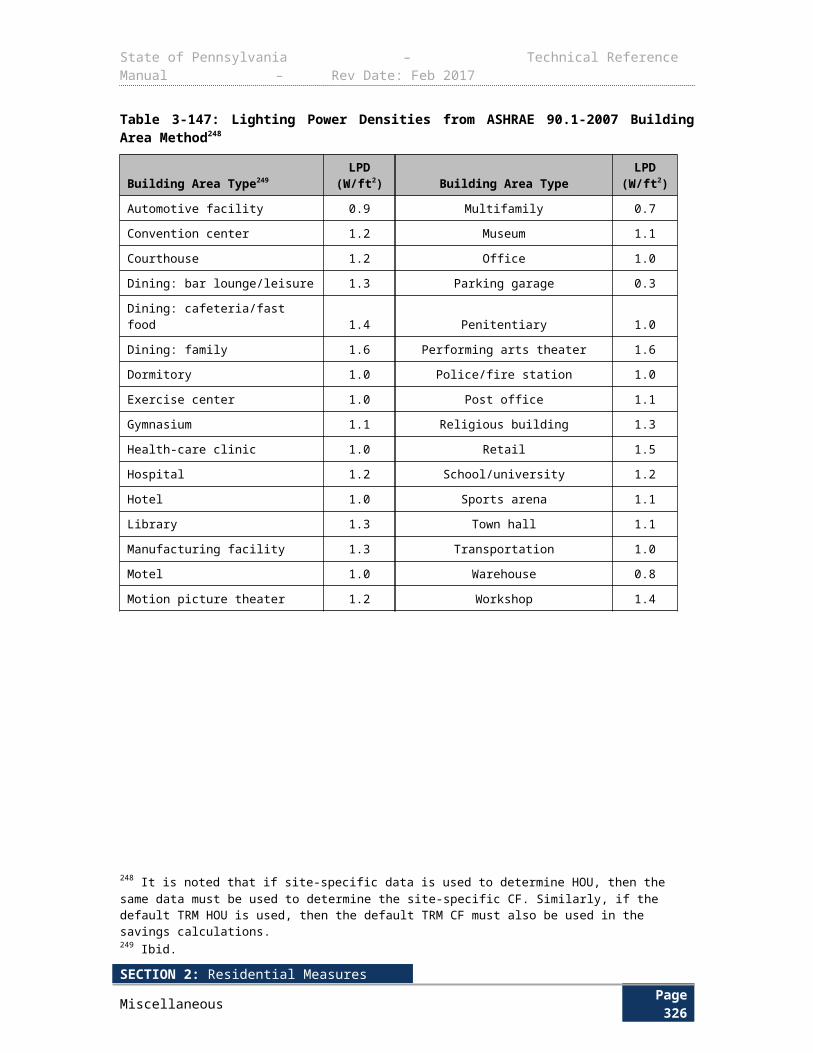
State of Pennsylvania – Technical Reference Manual – Rev Date: Feb 2017
Facility Type
Par
amet
er
Alle
ntow
n
Erie
Har
risbu
rg
Phi
lade
lphi
a
Pitt
sbur
gh
Scr
anto
n
Will
iam
sbur
g
CF 0.50 0.48 0.52 0.53 0.51 0.48 0.51
SECTION 2: Residential MeasuresMiscellaneous Page 330

State of Pennsylvania – Technical Reference Manual – Rev Date: Feb 2017
Table 3-196: Default RHRS and CFs for Chilled Water Pump (CHWP) Motors in Commercial Buildings323
323 Default value can be used by EDC but is subject to metering and adjustment by evaluators or SWE
SECTION 2: Residential MeasuresMiscellaneous Page 331
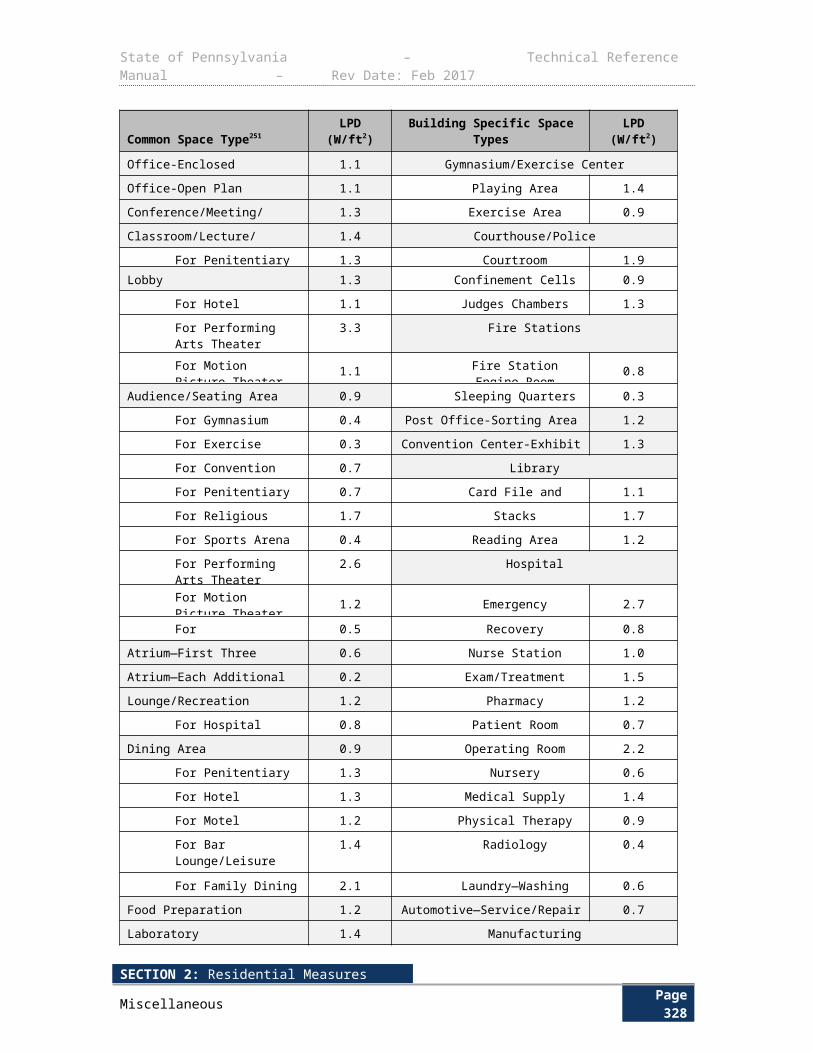
State of Pennsylvania – Technical Reference Manual – Rev Date: Feb 2017
Facility Type
Par
amet
er
Alle
ntow
n
Erie
Har
risbu
rg
Phi
lade
lphi
a
Pitt
sbur
gh
Scr
anto
n
Will
iam
sbur
g
Education - Community College
Run Hours 2,868 2,561 2,937 3,307 2,775 2,660 2,727
CF 0.42 0.30 0.43 0.46 0.41 0.35 0.43
Education - Secondary School
Run Hours 2,721 2,175 2,730 3,505 2,676 2,310 2,573
CF 0.10 0.09 0.18 0.18 0.17 0.12 0.16
Education - University
Run Hours 5,145 4,721 5,177 5,314 5,056 4,995 5,016
CF 0.39 0.29 0.40 0.43 0.38 0.31 0.36
Health/Medical - Hospital
Run Hours 5,588 5,109 5,717 6,086 5,593 5,266 5,628
CF 0.46 0.42 0.50 0.54 0.48 0.44 0.47
Health/Medical - Nursing Home
Run Hours 3,892 3,456 4,104 4,535 3,900 3,710 3,818
CF 0.24 0.22 0.28 0.30 0.28 0.23 0.26
Lodging - Hotel
Run Hours 5,845 5,198 6,045 6,161 5,686 5,655 5,776
CF 0.61 0.60 0.66 0.67 0.69 0.59 0.66
Manufacturing – Bio Tech/High Tech
Run Hours 1,735 1,448 1,742 1,891 1,606 1,558 1,633
CF 0.53 0.43 0.53 0.58 0.54 0.48 0.50
Office - Large
Run Hours 1,873 1,713 1,912 2,173 1,876 1,741 1,815
CF 0.30 0.28 0.36 0.37 0.33 0.30 0.33
Office - Small
Run Hours 1,705 1,456 1,696 1,899 1,602 1,534 1,606
CF 0.28 0.26 0.33 0.35 0.32 0.28 0.31
Retail - Multistory Large
Run Hours 2,957 2,653 3,085 3,225 2,795 2,735 2,898
CF 0.46 0.38 0.53 0.54 0.47 0.42 0.47
SECTION 2: Residential MeasuresMiscellaneous Page 332
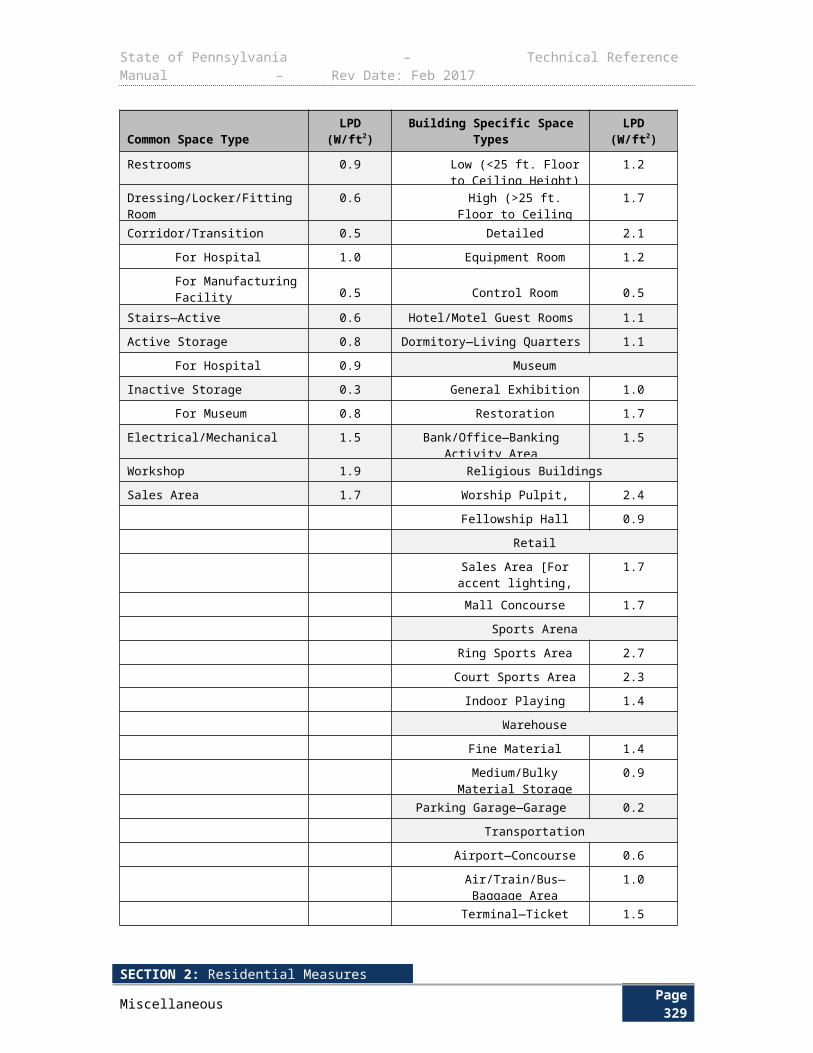
State of Pennsylvania – Technical Reference Manual – Rev Date: Feb 2017
Table 3-197: Default RHRS and CFs for Cooling Tower Fan (CTF) Motors in Commercial Buildings324
324 Modeling is an acceptable substitute to metering and panel data if modeling is conducted using building- and equipment-specific information at the site and the facility consumption is calibrated using 12 months of billing data (pre-retrofit).
SECTION 2: Residential MeasuresMiscellaneous Page 333

State of Pennsylvania – Technical Reference Manual – Rev Date: Feb 2017
Facility Type
Par
amet
er
Alle
ntow
n
Erie
Har
risbu
rg
Phi
lade
lphi
a
Pitt
sbur
gh
Scra
nton
Will
iam
sbur
g
Education - Community College
Run Hours
2,868 2,560 2,937 3,306 2,774 2,660 2,727
CF 0.42 0.30 0.43 0.46 0.41 0.35 0.42
Education - Secondary School
Run Hours
2,742 2,178 2,744 3,517 2,685 2,313 2,604
CF 0.11 0.09 0.18 0.18 0.17 0.12 0.17
Education - University
Run Hours
5,143 4,721 5,176 5,312 5,053 4,993 5,015
CF 0.39 0.29 0.40 0.43 0.38 0.31 0.36
Health/Medical - Hospital
Run Hours
5,587 5,107 5,714 6,084 5,591 5,263 5,626
CF 0.45 0.41 0.49 0.54 0.47 0.44 0.46
Health/Medical - Nursing Home
Run Hours
3,894 3,457 4,106 4,537 3,902 3,711 3,819
CF 0.24 0.22 0.28 0.30 0.28 0.23 0.26
Lodging - Hotel
Run Hours
5,844 5,197 6,043 6,159 5,683 5,652 5,773
CF 0.61 0.61 0.67 0.68 0.70 0.59 0.66
Manufacturing – Bio Tech/High Tech
Run Hours
1,735 1,448 1,742 1,891 1,606 1,558 1,633
CF 0.53 0.43 0.54 0.59 0.54 0.48 0.50
Office - Large
Run Hours
1,873 1,713 1,912 2,173 1,876 1,741 1,815
CF 0.30 0.28 0.36 0.37 0.33 0.30 0.33
Office - Small
Run Hours
1,705 1,456 1,696 1,899 1,602 1,534 1,606
CF 0.28 0.26 0.33 0.35 0.32 0.28 0.31
Retail - Multistory Large
Run Hours
2,957 2,653 3,085 3,226 2,795 2,736 2,898
CF 0.46 0.38 0.53 0.54 0.47 0.42 0.47
SECTION 2: Residential MeasuresMiscellaneous Page 334
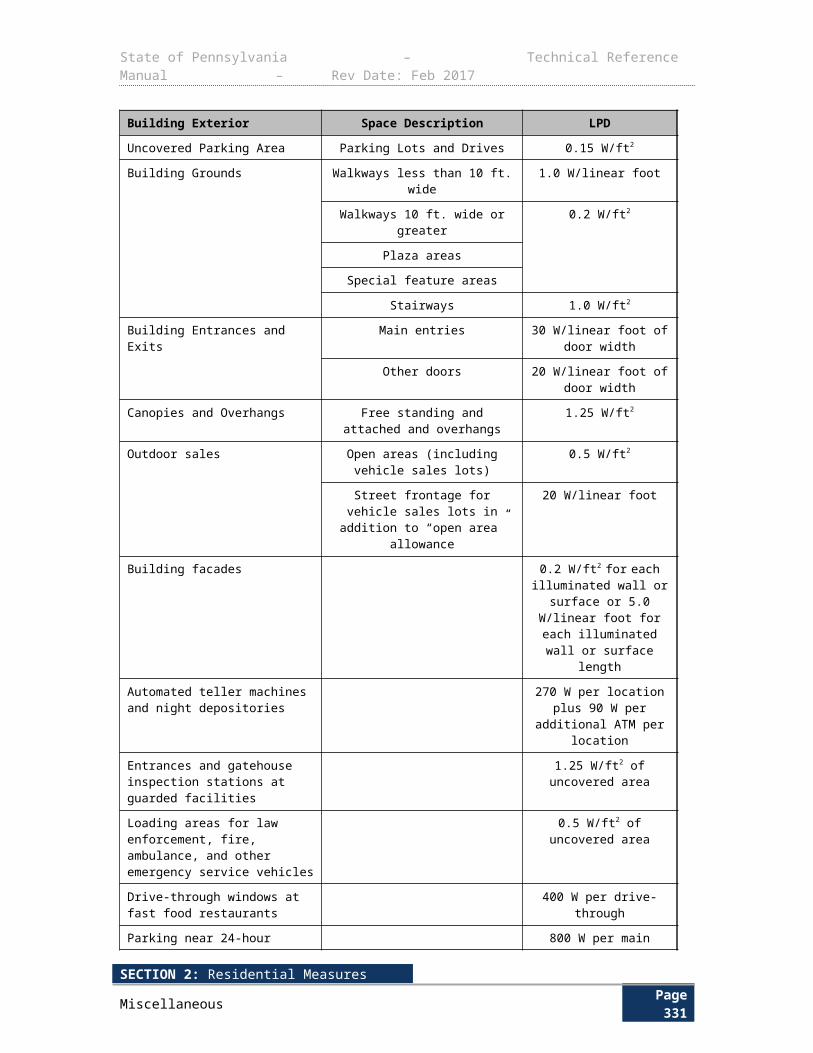
State of Pennsylvania – Technical Reference Manual – Rev Date: Feb 2017
Table 3-198: Default RHRS and CFs for Heating Hot Water Pump (HHWP) Motors in Commercial Buildings325
325 Default value can be used by EDC but is subject to metering and adjustment by evaluators or SWE
SECTION 2: Residential MeasuresMiscellaneous Page 335
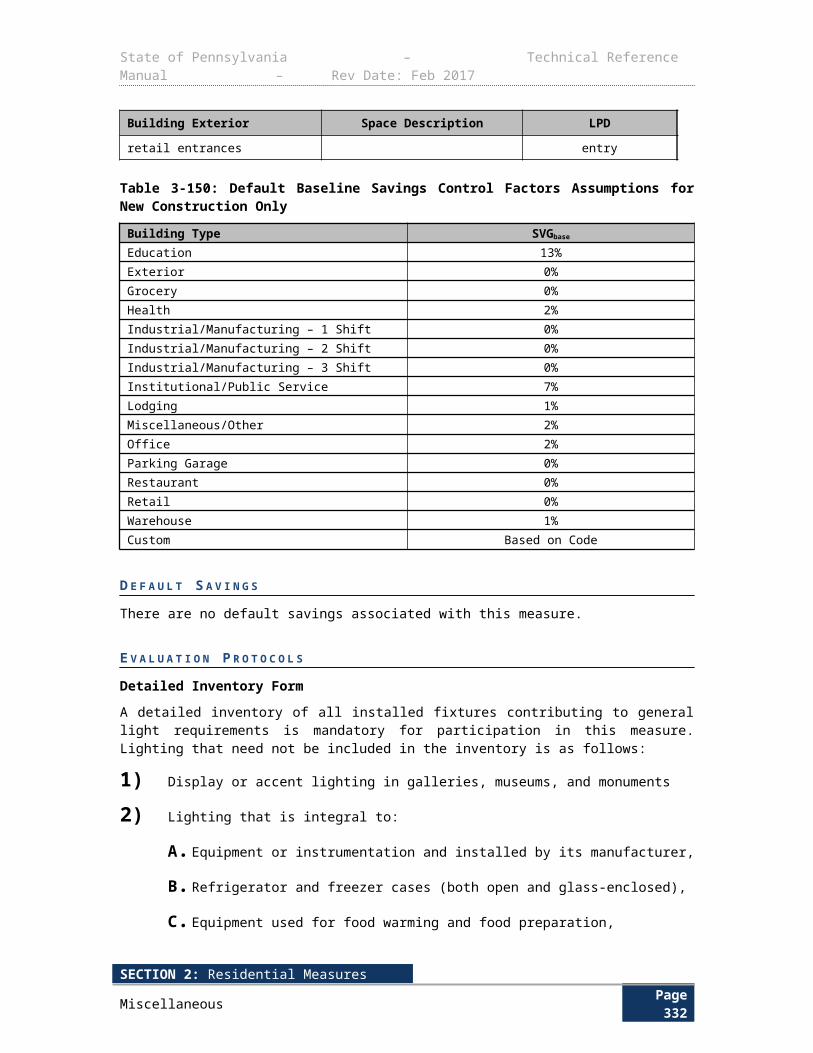
State of Pennsylvania – Technical Reference Manual – Rev Date: Feb 2017
Facility Type
Par
amet
er
Alle
ntow
n
Erie
Har
risbu
rg
Phi
lade
lphi
a
Pitt
sbur
gh
Scr
anto
n
Will
iam
sbur
g
Education - Community College
Run Hours
4,454 4,941 4,150 3,838 4,447 4,562 4,408
CF 0.01 0.01 0.00 0.00 0.01 0.01 0.01
Education - Secondary School
Run Hours
3,651 4,080 3,492 3,341 3,705 3,830 3,658
CF 0.00 0.00 0.00 0.00 0.00 0.00 0.00
Education - University
Run Hours
4,642 5,131 4,350 4,190 4,697 4,714 4,566
CF 0.00 0.00 0.00 0.00 0.00 0.00 0.00
Health/Medical - Hospital
Run Hours
8,760 8,760 8,760 8,760 8,760 8,760 8,760
CF 0.09 0.09 0.09 0.09 0.09 0.09 0.09
Health/Medical - Nursing Home
Run Hours
5,934 6,280 5,823 5,477 5,991 6,223 6,045
CF 0.00 0.00 0.00 0.00 0.00 0.00 0.00
Lodging - Hotel
Run Hours
6,469 6,829 6,155 6,077 6,574 6,628 6,387
CF 0.00 0.00 0.00 0.00 0.00 0.00 0.00
Manufacturing – Bio Tech/High Tech
Run Hours
1,258 1,555 1,184 1,028 1,287 1,393 1,277
CF 0.00 0.00 0.00 0.00 0.00 0.00 0.00
Office - Large
Run Hours
3,705 4,097 3,503 3,112 3,703 3,809 3,652
CF 0.00 0.00 0.00 0.00 0.00 0.00 0.00
Office - Small
Run Hours
2,723 3,124 2,525 2,267 2,788 2,863 2,685
CF 0.00 0.00 0.00 0.00 0.00 0.00 0.00
Retail - Multistory Large
Run Hours
2,676 2,960 2,561 2,398 2,908 2,841 2,660
CF 0.00 0.00 0.00 0.00 0.00 0.00 0.00
SECTION 2: Residential MeasuresMiscellaneous Page 336
State of Pennsylvania – Technical Reference Manual – Rev Date: Feb 2017
Table 3-199: Default RHRS and CFs for Condenser Water Pump Motors in Commercial Buildings326
326 See definition in section 3.3.1 for specific algorithm to be used when performing spot metering analysis to determine alternate load factor.
SECTION 2: Residential MeasuresMiscellaneous Page 337

State of Pennsylvania – Technical Reference Manual – Rev Date: Feb 2017
Facility Type
Par
amet
er
Alle
ntow
n
Erie
Har
risbu
rg
Phi
lade
lphi
a
Pitt
sbur
gh
Scr
anto
n
Will
iam
sbur
g
Education - Community College
Run Hours 2,611 2,344 2,733 3,000 2,668 2,429 2,530
CF 0.42 0.30 0.43 0.46 0.41 0.35 0.42
Education - Secondary School
Run Hours 2,448 2,039 2,539 3,346 2,409 2,164 2,423
CF 0.11 0.09 0.18 0.18 0.17 0.12 0.17
Education - University
Run Hours 4,443 3,782 4,471 5,059 4,830 4,571 4,448
CF 0.39 0.29 0.40 0.43 0.38 0.31 0.36
Health/Medical - Hospital
Run Hours 3,950 3,698 3,687 4,168 4,093 3,713 3,670
CF 0.45 0.41 0.49 0.54 0.47 0.44 0.46
Health/Medical - Nursing Home
Run Hours 3,675 3,394 3,725 4,304 3,571 3,687 3,722
CF 0.24 0.22 0.28 0.30 0.28 0.23 0.26
Lodging - Hotel
Run Hours 5,544 4,766 5,569 5,886 5,239 5,353 5,328
CF 0.61 0.61 0.67 0.68 0.70 0.59 0.66
Manufacturing – Bio Tech/High Tech
Run Hours 1,735 1,445 1,737 1,889 1,602 1,558 1,632
CF 0.53 0.43 0.54 0.59 0.54 0.48 0.50
Office - Large
Run Hours 1,857 1,685 1,891 2,156 1,862 1,728 1,798
CF 0.30 0.28 0.36 0.37 0.33 0.30 0.33
Office - Small
Run Hours 1,705 1,453 1,693 1,898 1,597 1,533 1,606
CF 0.28 0.26 0.33 0.35 0.32 0.28 0.31
Retail - Multistory Large
Run Hours 2,889 2,616 3,025 3,185 2,757 2,702 2,847
CF 0.46 0.38 0.53 0.54 0.47 0.42 0.47
SECTION 2: Residential MeasuresMiscellaneous Page 338
State of Pennsylvania – Technical Reference Manual – Rev Date: Feb 2017
D E F A U L T S A V I N G S
There are no default savings for this measure.
E V A L U A T I O N P R O T O C O L S
Motor projects achieving expected kWh savings of 250,000 kWh or higher must327 be metered to calculate ex ante and/or ex post savings. Metering is not mandatory where the motors in question are constant speed and hours can be easily verified through a building automation system schedule that clearly shows motor run time.
S O U R C E S
1) Results are based on Nexant eQuest modeling analysis 2014.
2) California Public Utility Commission. Database for Energy Efficiency Resources 2005.
3) “Energy Conservation Program: Energy Conservation Standards for Commercial and Industrial Electric Motors; Final Rule,” 79 Federal Register 103 (29 May 2014).
327 Operating hours subject to adjustment with data provided by EDCs and accepted by SWE.
SECTION 2: Residential MeasuresMiscellaneous Page 339
State of Pennsylvania – Technical Reference Manual – Rev Date: Feb 2017
3.3.2 VARIABLE FREQUENCY DRIVE (VFD) IMPROVEMENTS
Measure Name Variable Frequency Drive (VFD) Improvements
Target Sector Commercial and Industrial Establishments
Measure Unit Variable Frequency Drive
Unit Energy Savings Variable
Unit Peak Demand Reduction Variable
Measure Life 13 years328
Measure Vintage Replace on Burnout, New Construction, or Retrofit
E L I G I B I L I T Y
The following protocol for the measurement of energy and demand savings applies to the installation of Variable Frequency Drives (VFDs) in standard commercial building applications shown in Table 3-201. The baseline condition is a motor without a VFD control. The efficient condition is a motor with a VFD control.
A L G O R I T H M S
kWh ¿HP× LFηmotor
×RHRSbase×ESF
∆ kW peak ¿HP× LFηmotor
×CF×DSF
D E F I N I T I O N S O F T E R M S
Table 3-200: Variables for VFD Calculations
Term Unit Values SourceMotor HP, Rated horsepower of the motor
HP Nameplate EDC Data Gathering
RHRSbase329,Annual run hours of the baseline motor
HoursYear
Based on logging, panel data or modeling EDC Data Gathering
Default: See Table 3-195 to Table 3-199 1
LF330,Load Factor. Ratio between the actual load and the rated load. Motor efficiency curves typically result in motors being most efficient at approximately 75% of the rated load. The default value is 0.75.
None
Based on spot metering and nameplate EDC Data Gathering
Default: 75% 1
ESF , Energy Savings Factor. Percent None Default See Table 3- See Table 3-201
328 Ibid.329 Ibid.330 Ibid.
SECTION 2: Residential MeasuresMiscellaneous Page 340
State of Pennsylvania – Technical Reference Manual – Rev Date: Feb 2017
Term Unit Values Source
of baseline energy consumption saved by installing VFD. Based on logging and
panel data EDC Data Gathering
DSF , Demand Savings Factor. Percent of baseline demand saved by installing VFD
None
Default: See See
Based on logging and panel data EDC Data Gathering
ηmotor , Motor efficiency at the full-rated load. For VFD installations, this can be either an energy efficient motor or standard efficiency motor. Motor efficiency varies with load and decreases dramatically below 50% load; this is reflected in the ESF term of the algorithm.
None Nameplate EDC Data Gathering
CF ,Demand Coincidence Factor DecimalEDC Data Gathering EDC Data GatheringDefault See Table 3-195 to Table 3-199 2
Table 3-201: ESF and DSF for Typical Commercial VFD Installations331
HVAC Fan VFD Savings Factors
Baseline ESF DSF
Constant Volume332 0.534 0.347
Air Foil/Backward Incline 0.354 0.26
Air Foil/Backward Incline with Inlet Guide Vanes 0.227 0.13
Forward Curved 0.179 0.136
Forward Curved with Inlet Guide Vanes 0.092 0.029
HVAC Pump VFD Savings Factors
System ESF DSF
Chilled Water Pump 0.411 0.299
Hot Water Pump 0.424 0
D E F A U L T S A V I N G S
There are no default savings for this measure.
331 Ibid.332 The Commission allows the EDCs to use alternative methods for obtaining customer-specific data where customer processes do not support metering. The EDCs are required to provide supporting documentation to the SWE for review if there are any such exceptions.
SECTION 2: Residential MeasuresMiscellaneous Page 341
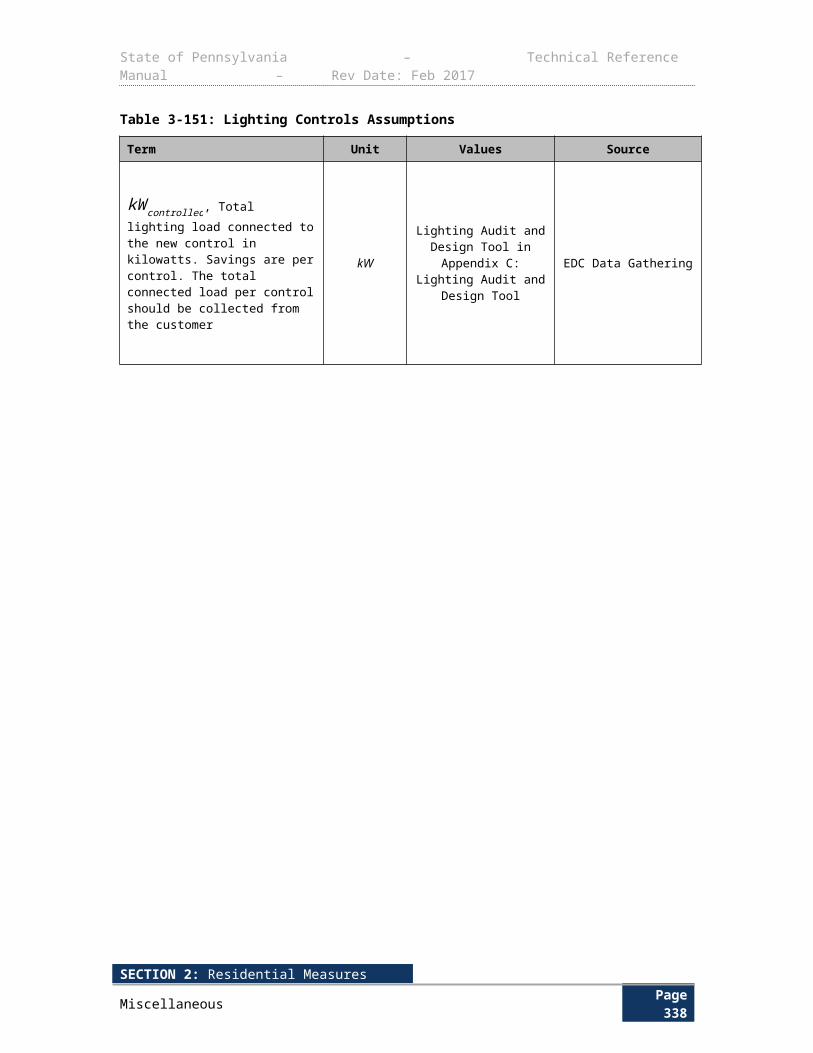
State of Pennsylvania – Technical Reference Manual – Rev Date: Feb 2017
E V A L U A T I O N P R O T O C O L
VFD projects achieving expected kWh savings of 250,000 kWh or higher must333 be metered to calculate ex ante and/or ex post savings. Metering is not mandatory where hours can be easily verified through a building automation system schedule that clearly shows motor run time.
S O U R C E S
1) California Public Utility Commission. Database for Energy Efficiency Resources 2005.
2) Results are based on Nexant’s eQuest modeling analysis 2014
333 The Measure Life Report for Residential and Commercial/Industrial Lighting and HVAC Measures, GDS Associates, Inc., June 2007. http://library.cee1.org/sites/default/files/library/8842/CEE_Eval_MeasureLifeStudyLights%26HVACGDS_1Jun2007.pdf
SECTION 2: Residential MeasuresMiscellaneous Page 342
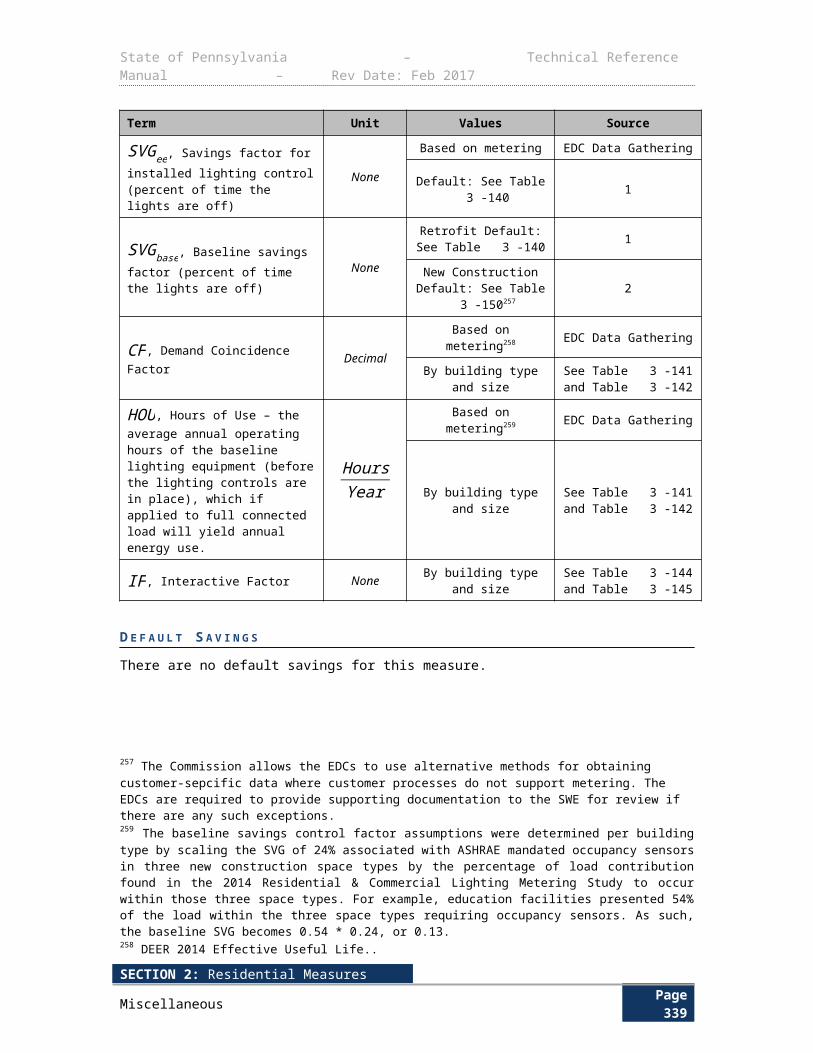
State of Pennsylvania – Technical Reference Manual – Rev Date: Feb 2017
3.3.3 ECM CIRCULATING FAN
Measure Name ECM Circulating Fan
Target Sector Commercial and Industrial Establishments
Measure Unit ECM Circulating Fan
Unit Energy Savings Variable
Unit Peak Demand Reduction Variable
Measure Life 18 years334
Measure Vintage Early Replacement
This protocol covers energy and demand savings associated with retrofit of existing shaded-pole (SP) or permanent-split capacitor (PSC) evaporator fan motors in an air handling unit with an electronically commutated motor (ECM).
E L I G I B I L I T Y
This measure is targeted to non-residential customers whose air handling equipment currently uses a SP or PSC fan motor rather than an ECM. This measure applies only to circulating fan motors of 1 HP or less. Above 1 HP motors are governed by NEMA standards and would see little to no efficiency benefit by adding an ECM.
The targeted fan can supply heating or cooling only, or both heating and cooling. A default savings option is offered if motor input wattage is not known. However, these parameters should be collected by EDCs for greatest accuracy.
Acceptable baseline conditions are an existing circulating fan with a SP or PSC fan motor 1 HP or less.
Efficient conditions are a circulating fan with an ECM.
A L G O R I T H M S
kWh ¿∆ kWhheat+∆kWhcool
∆ kW peak ¿∆ kW cool
Heating
334 Default Value can be used by EDC but is subject to metering and adjustment by evaluators or SWE
SECTION 2: Residential MeasuresMiscellaneous Page 343
State of Pennsylvania – Technical Reference Manual – Rev Date: Feb 2017
∆ kWhheat ¿(WATTSbase−WATTSee )
1000× LF×EFLH heat×(1+ I FkWh)
∆ kW heat ¿0
Cooling
∆ kWhcool ¿(WATTSbase−WATTSee )
1000× LF×EFLH cool×(1+ I FkWh)
∆ kW cool¿
(WATTSbase−WATTSee )1000
× LF×CF×(1+ I F kW)
D E F I N I T I O N O F T E R M S
SECTION 2: Residential MeasuresMiscellaneous Page 344
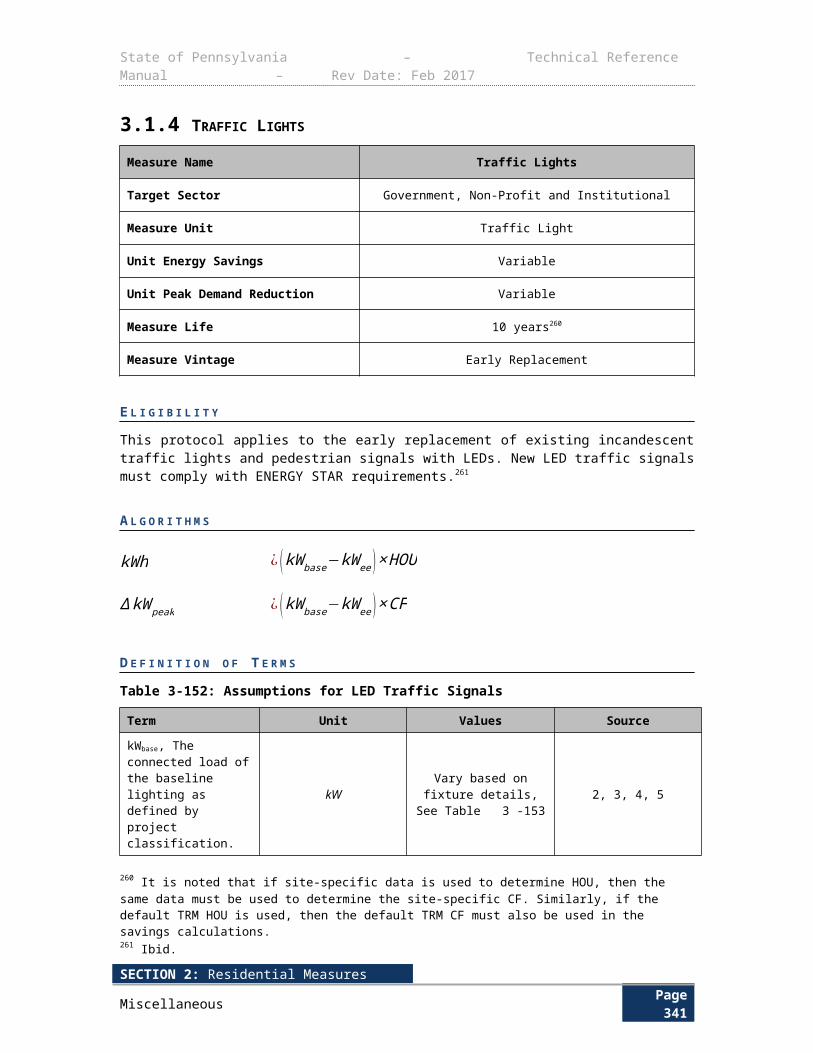
State of Pennsylvania – Technical Reference Manual – Rev Date: Feb 2017
Table 3-202: ECM Circulating Fan – Values and References
SECTION 2: Residential MeasuresMiscellaneous Page 345
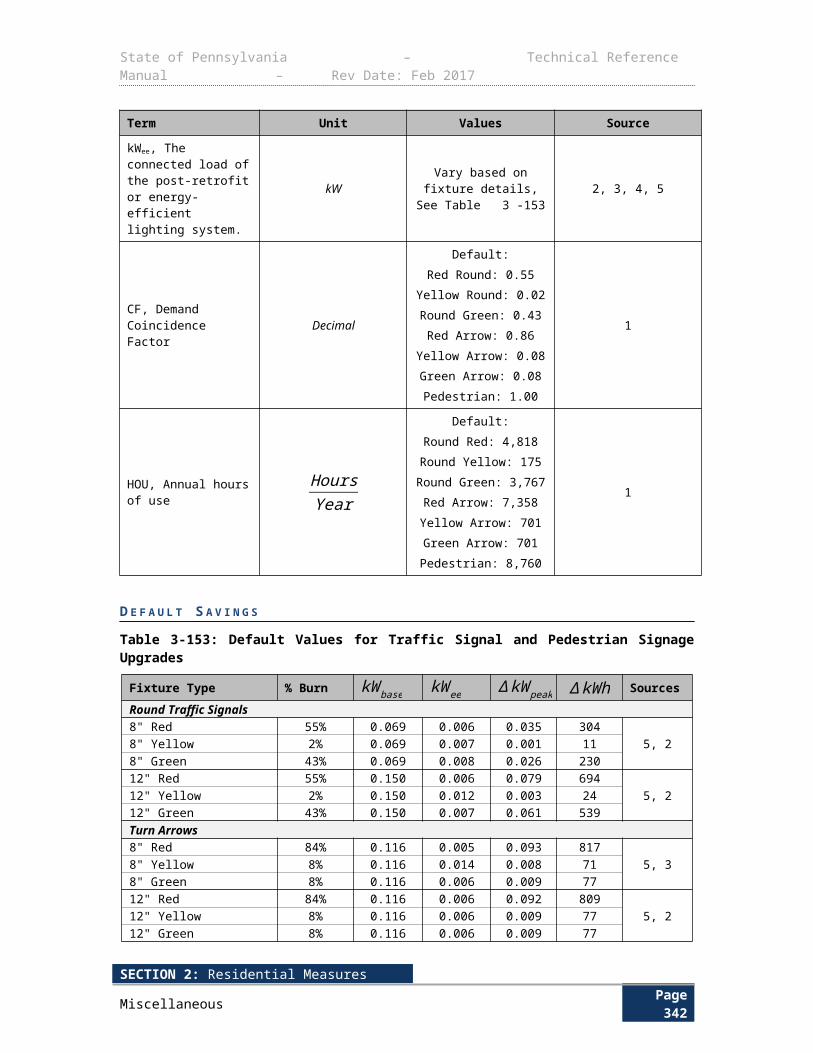
State of Pennsylvania – Technical Reference Manual – Rev Date: Feb 2017
Term Unit Values Source
WATTSbase , Baseline watts
WNameplate data
EDC Data
Gathering
Default: See Table 3-203 1, 2, 3
WATTSee , Energy efficient watts
WNameplate data
EDC Data
Gathering
Default : See Table 3-203 1, 2, 3
LF , Load factor
NoneEDC Data Gathering
EDC Data
Gathering
Default: 0.9 4
EFLH heat , Equivalent Full-Load Hours for heating only
Hoursyear
EDC Data Gathering
EDC Data
Gathering
Default : See Table 3-163 7
EFLH cool , Equivalent Full-Load Hours for cooling only
Hoursyear
EDC Data Gathering
EDC Data
Gathering
Default: See Table 3-161 7
CF, Coincidence Factor
Decimal EDC Data Gathering
EDC Data
Gathering
Default: See7
SECTION 2: Residential MeasuresMiscellaneous Page 346
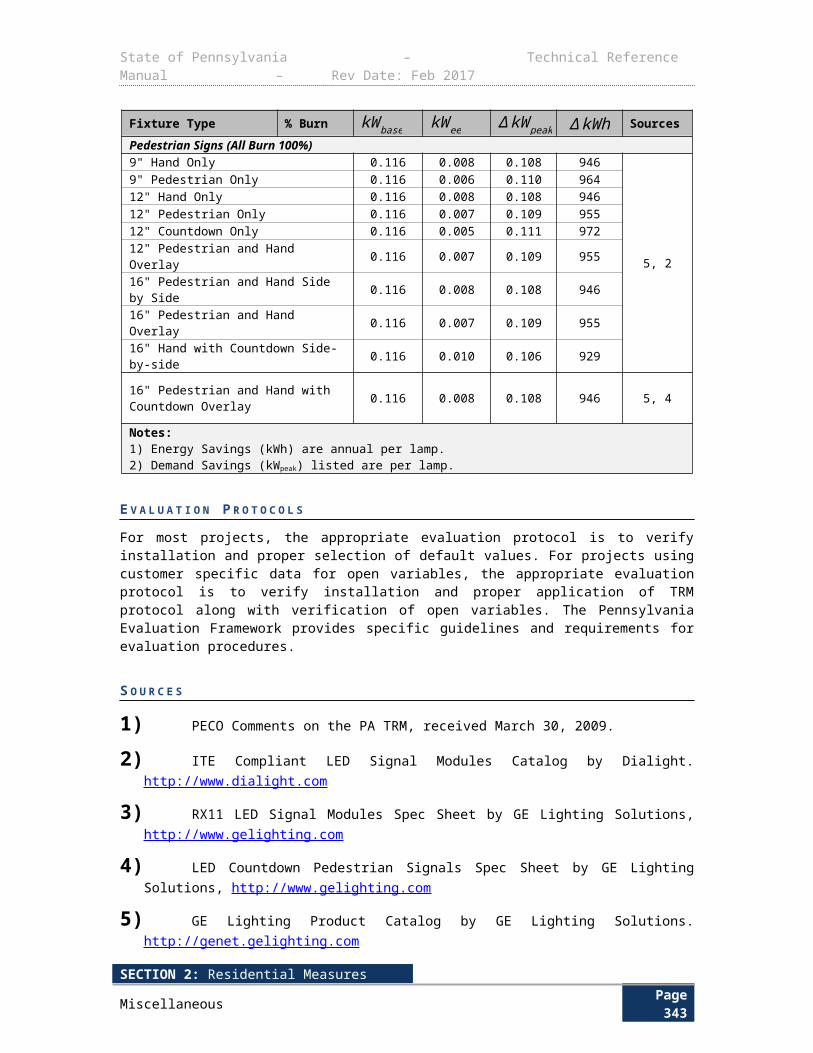
State of Pennsylvania – Technical Reference Manual – Rev Date: Feb 2017
Error: Reference source not found
IFkWh, Energy Interactive Factor
None
EDC Data Gathering
EDC Data
Gathering
IFkW×(1− EFLH heat
EFLH heat+EFLH cool)× 11.3
136
IFkW , Demand Interactive Factor
NoneEDC Data Gathering
EDC Data
Gathering
Default : 30% 5
Table 3-203: Default Motor Wattage (WATTSbase and WATTSee) for Circulating Fan
Motor TypeAssumed
Efficiency335
Motor Category
½ HP ¾ HP 1 HP
SP 0.31 1,218 1,827 2,436
PSC 0.52 720 1,081 1,441
ECM 0.85 439 658 878
D E F A U L T S A V I N G S
Default savings may be claimed using the algorithms above and the variable defaults. EDCs may also claim savings using customer specific data.
335 Ibid.
SECTION 2: Residential MeasuresMiscellaneous Page 347

State of Pennsylvania – Technical Reference Manual – Rev Date: Feb 2017
E V A L U A T I O N P R O T O C O L S
For most projects, the appropriate evaluation protocol is to verify installation and proper selection of default values. For projects using customer specific data for open variables, the appropriate evaluation protocol is to verify installation and proper application of TRM protocol along with verification of open variables. The Pennsylvania Evaluation Framework provides specific guidelines and requirements for evaluation procedures.
S O U R C E S
1) Regional Technical Forum (RTF) as part of the Northwest Power & Conservation Council, Deemed Measures List. Grocery Display Case ECM, FY2010, V2. http://rtf.nwcouncil.org/measures/measure.asp?id=107&decisionid=230
2) Regional Technical Forum (RTF) as part of the Northwest Power & Conservation Council, Deemed Measures List. Deemed MeasuresV26 _walkinevapfan.
3) AO Smith New Product Notification. I-motor 9 & 16 Watt. Stock Numbers 9207F2 and 9208F2. Web address: http://www.electricmotorwarehouse.com/PDF/Bulletin%206029B.pdf
4) PSC of Wisconsin, Focus on Energy Evaluation, Business Programs: Deemed Savings Manual V1.0, p. 4-103 to 4-106. https://focusonenergy.com/sites/default/files/bpdeemedsavingsmanuav10_evaluationreport.pdf
5) Assuming that the waste heat is within the conditioned air stream, then the energy associated with removing the waste heat during peak times is approximated as the inverse of the COP, or 3.412/EER = 0.30 if one uses 11.3 as a default value for cooling system EER.
6) This is an approximation that accounts for the coincidence between cooling and fan operation and corrects with a factor of 11.3/13 to account for seasonal cooling efficiency rather than peak cooling efficiency.
7) Nexant eQuest modeling analysis 2014.
3.3.4 VSD ON KITCHEN EXHAUST FAN
Measure Name VSD on Kitchen Exhaust Fan
Target Sector Commercial and Industrial Establishments
Measure Unit VSD on Kitchen Exhaust Fan
Unit Energy Savings Variable
Unit Peak Demand Reduction Variable
Measure Life 15 years336
Measures Vintage Retrofit
Installation of variable speed drives (VSD) on commercial kitchen exhaust fans allows the variation of ventilation based on cooking load and/or time of day.
E L I G I B I L I T Y
336 UI and CL&P Program Savings Documentation for 2012 Program Year, United Illuminating Company, September 2011. Pages 44- 45. http://www.energizect.com/sites/default/files/2012%20CT%20Program%20Savings%20Documentation%20FINAL.pdf
SECTION 2: Residential MeasuresMiscellaneous Page 348
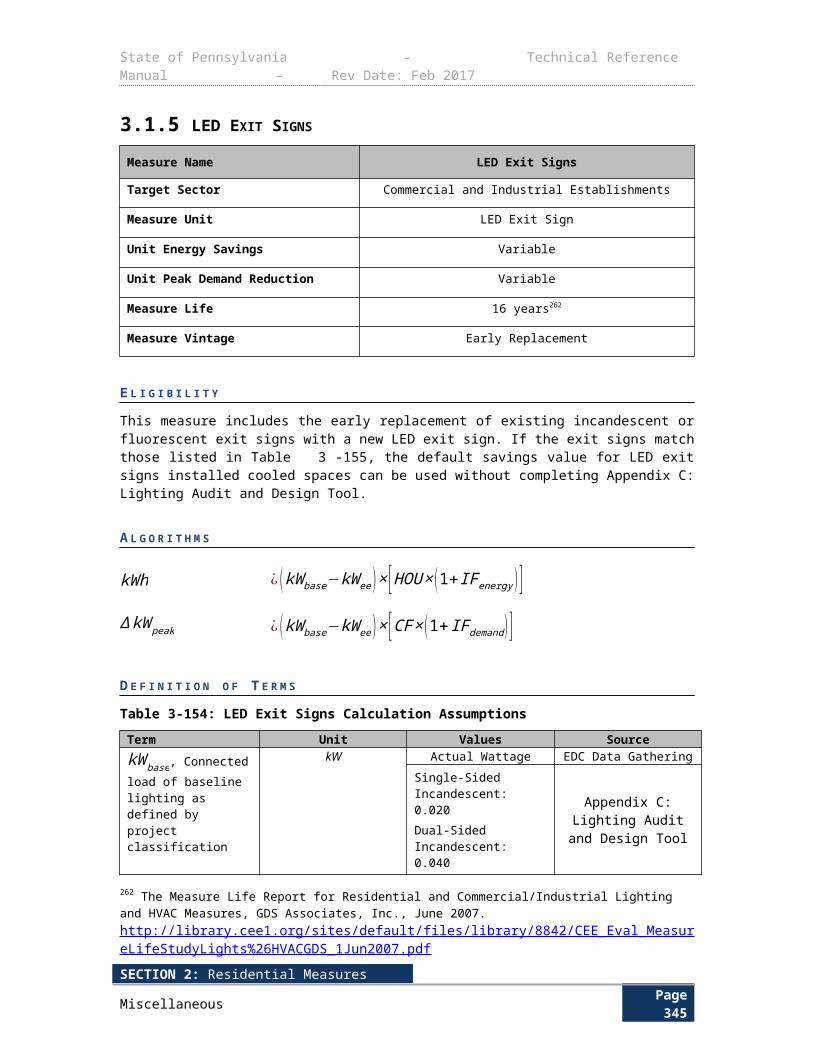
State of Pennsylvania – Technical Reference Manual – Rev Date: Feb 2017
This measure is targeted to non-residential customers whose kitchen exhaust fans are equipped with a VSD that varies the exhaust rate of kitchen ventilation based on the energy and effluent output from the cooking appliances (i.e., the more heat and smoke/vapors generated, the more ventilation needed). This involves installing a temperature sensor in the hood exhaust collar and/or an optic sensor on the end of the hood that sense cooking conditions which allows the system to automatically vary the rate of exhaust to what is needed by adjusting the fan speed.The baseline equipment is kitchen ventilation that has a constant speed ventilation motor.
The energy efficient condition is a kitchen ventilation system equipped with a VSD and demand ventilation controls and sensors.
A L G O R I T H M S
Annual energy and demand savings values are based on monitoring results from five different types of sites, as summarized in the PG&E work paper337. The sites included an institutional cafeteria, a casual dining restaurant, a hotel kitchen, a supermarket kitchen, and a university dining facility. Units are based on savings per total exhaust fan rated horsepower. Savings values are applicable to new and retrofit units.
kWh ¿HP×4,486
∆ kW peak ¿HP×0.76
D E F I N I T I O N O F T E R M S
Table 3-204: VSD on Kitchen Exhaust Fan – Variables and References
Term Unit Values Source
4,486 , Annual energy savings per total exhaust fan horsepower
kWhHP
4,486 1, 2
0.76, Coincident peak demand savings per total exhaust fan horsepower
kWHP
0.76 1, 2
HP, Horsepower rating of the exhaust fan HP Nameplate data
EDC Data
Gathering
D E F A U L T S A V I N G S
Savings for this measure are partially deemed based on motor horsepower.
337 The ESF and DSF values for the constant volume baseline condition are taken from the 2011 Connecticut TRM whereas 2012 Connecticut TRM was used to report values for all other baseline conditions. This is because the 2012 Connecticut TRM does not report values for constant volume condition. Note that the values for all baseline conditions for HVAC fans are same in both versions of the Connecticut TRM. The values were only updated for the HVAC pump baseline conditions.
SECTION 2: Residential MeasuresMiscellaneous Page 349
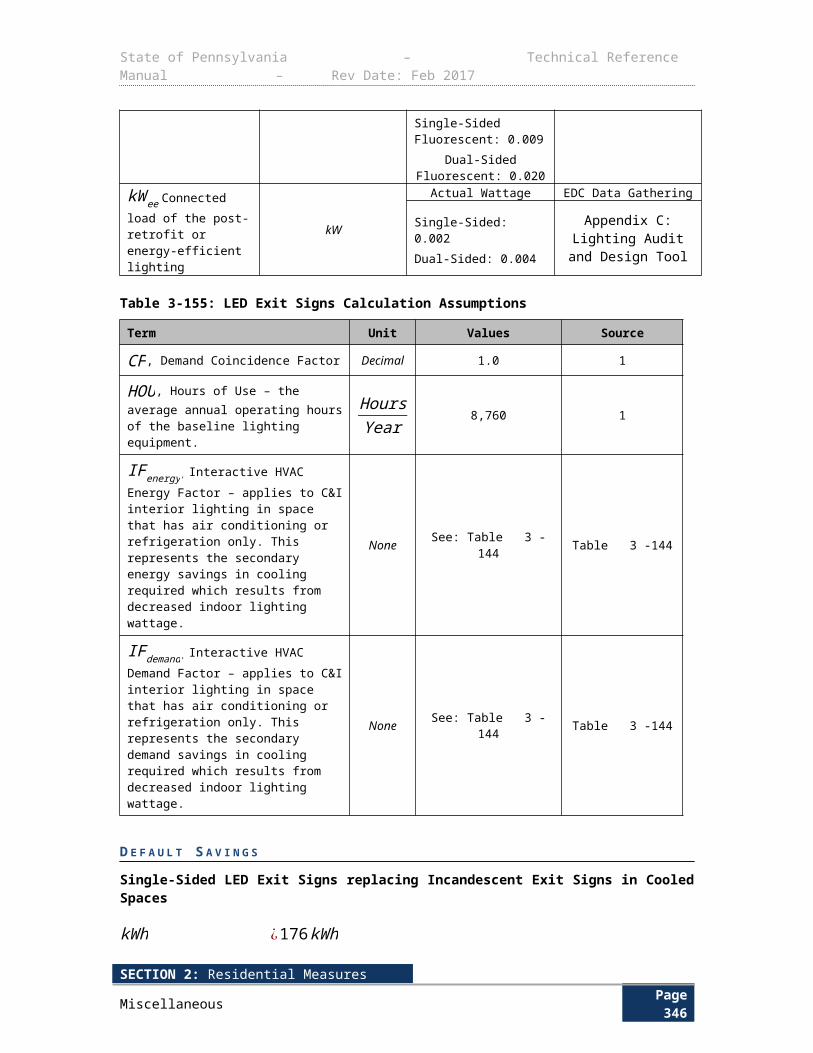
State of Pennsylvania – Technical Reference Manual – Rev Date: Feb 2017
E V A L U A T I O N P R O T O C O L S
For most projects, the appropriate evaluation protocol is to verify installation and proper selection of default values. For projects using customer specific data for open variables, the appropriate evaluation protocol is to verify installation and proper application of TRM protocol along with verification of open variables. The Pennsylvania Evaluation Framework provides specific guidelines and requirements for evaluation procedures.
S O U R C E S
1) PGE Workpaper, Commercial Kitchen Demand Ventilation Controls, PGECOFST116. June 1, 2009
2) SDGE Workpaper, Work Paper WPSDGENRCC0019, Commercial Kitchen Demand Ventilation Controls-Electric, Revision 0. June 15, 2012. https://www.google.com/url?sa=t&rct=j&q=&esrc=s&source=web&cd=1&ved=0CCsQFjAA&url=https%3A%2F%2Fwww.sdge.com%2Fsites%2Fdefault%2Ffiles%2Fregulatory%2FWPSDGENRCC0019%2520Rev%25200%2520Demand%2520Ventilation%2520Controls.doc&ei=RZuMU5vCNK-lsATEqoCoAg&usg=AFQjCNFltI0wjiCmylhK06gWIEYcX7b3lw&sig2=mwHSNhg_EnQF7eSVUyvgpA&bvm=bv.67720277,d.cWc&cad=rja
SECTION 2: Residential MeasuresMiscellaneous Page 350
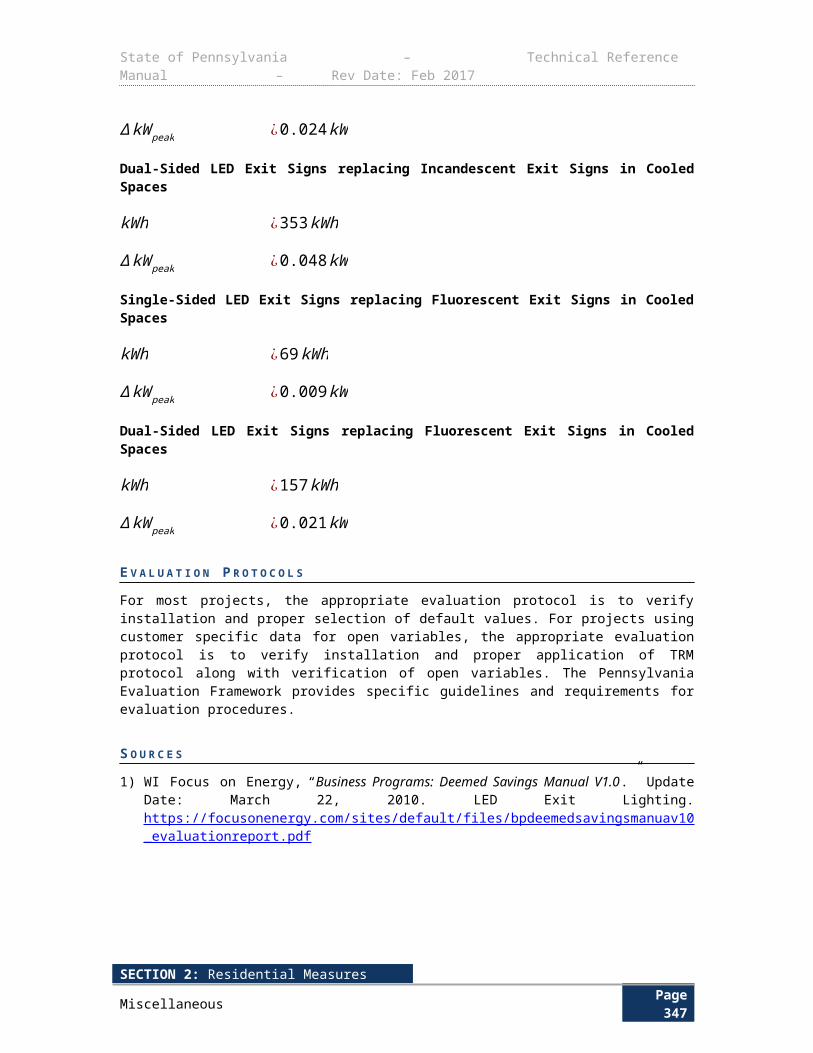
State of Pennsylvania – Technical Reference Manual – Rev Date: Feb 2017
3.4 DOMESTIC HOT WATER3.4.1 HEAT PUMP WATER HEATERS
Measure Name Heat Pump Water Heaters
Target Sector Commercial and Industrial Establishments
Measure Unit Heat Pump Water Heater
Unit Energy Savings Variable
Unit Peak Demand Reduction Variable
Measure Life 10 years338
Measure Vintage Replace on Burnout
Heat pump water heaters take heat from the surrounding air and transfer it to the water in the tank, unlike conventional electrical water heaters which use resistive heating coils to heat the water.
E L I G I B I L I T Y
This protocol documents the energy savings attributed to heat pump water heaters with energy factors meeting ENERGY STAR criteria339. However, other energy factors are accommodated with the partially deemed scheme. The measure described here involves a direct retrofit of a resistive electric water heater with a heat pump water heater. It does not cover systems where the heat pump is a pre-heater or is combined with other water heating sources. More complicated installations can be treated as custom projects.
A L G O R I T H M S
The energy savings calculation utilizes average performance data for available heat pump and standard electric resistance water heaters and typical hot water usages. The energy savings are obtained through the following formula:
kWh ¿{( 1EF base
−( 1EFproposed
× 1Fadjus t ))×HW ×8.3 lb
gal×1.0 Btu
lb∙ ° F×(T hot – T cold)}
3412 BtukWh
For heat pump water heaters, demand savings result primarily from a reduced connected load. The demand reduction is taken as the annual energy savings multiplied by the ratio of the average energy usage between 2 PM to 6 PM on summer weekdays to the total annual energy usage.
338 The Commission allows the EDCs to use alternative methods for obtaining customer-specific data where customer processes do not support metering. The EDCs are required to provide supporting documentation to the SWE for review if there are any such exceptions. 339 “Energy Savings from Efficient Furnace Fan Air Handlers in Massachusetts,” ACEEE, Sachs and Smith, 2003. For the purpose of calculating the total Resource Cost Test for Act 129, measure cannot claim savings for more than fifteen years.
SECTION 2: Residential MeasuresMiscellaneous Page 351
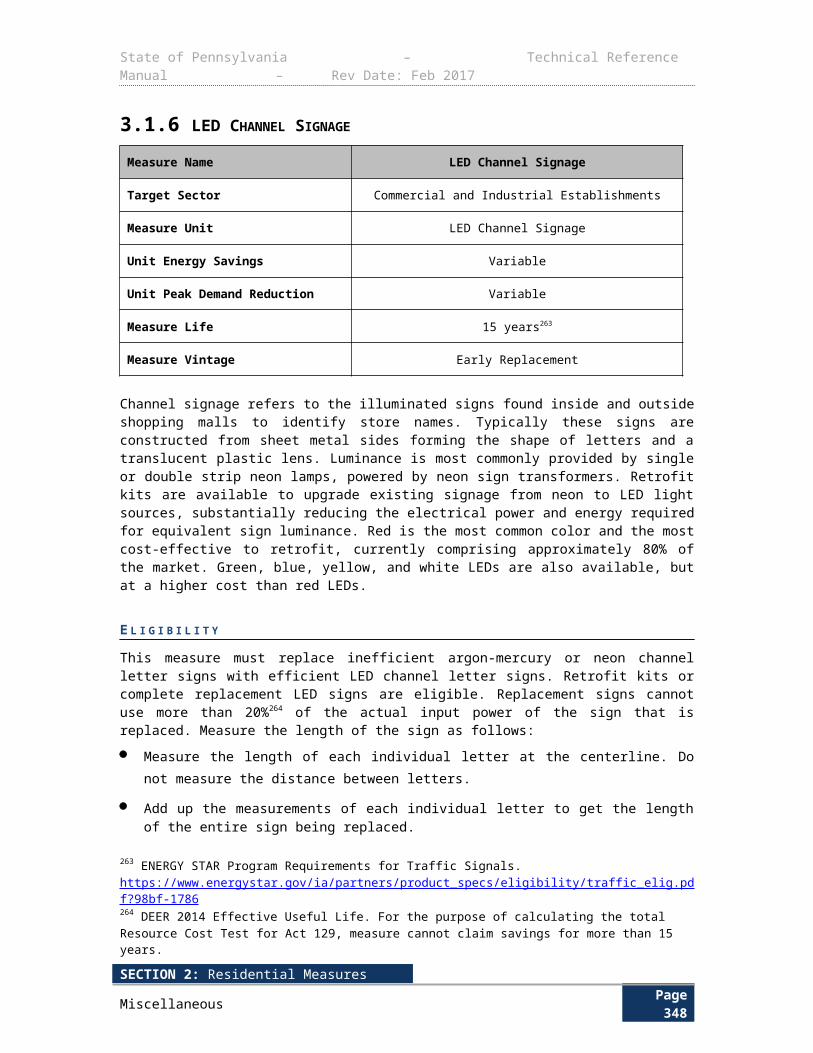
State of Pennsylvania – Technical Reference Manual – Rev Date: Feb 2017
∆ kW peak ¿ETDF× Energy Savings×RDF
The Energy to Demand Factor is defined below:
ETDF = Average UsageSummer WD 2-6 PM
Annual Energy Usage
Annual Gallons of Hot Water Use
The annual gallons of use is calculated using average annual heating load ( kBtuft2 )from the DEER
database340 and average square footage from the 2014 Statewide Non-Residential End Use & Saturation Study341. Average square footage for each building type is calculated by dividing the
Pennsylvania 2012 kWh sales by the energy use intensity ( kWhft2 ) and premise count. The DEER
database has data for gas energy usage for the domestic hot water end use for various small commercial buildings. The loads are averaged over all 16 climate zones and all six vintage types in the DEER database. Finally, the loads are converted to average annual gallons of use using the algorithm below.
HW (Gallons) = Load×EF ng ,base×1,000 Btu
kBtu×Typical SF
1.0 Btulb ∙℉ ×8.3 lb
gal× (T hot – T cold )×1,000SF
Table 3-205: Typical water heating loads
Building Type Typical Square Footage
Average Annual Load (kBTU)
Average Annual Use (Gallons)
Education 50,261 6,745 379,089
Grocery 11,120 1,660 20,642
Lodging 34,658 3,423 132,660
Office 7,186 161 1,294
Restaurant 4,542 35,557 180,593
Retail 6,226 61 425
Warehouse 25,349 386 10,941
Energy to Demand Factor
340 Average efficiency levels for ECM fans calculated using a market average for the product category. Default efficiency and wattage values for SP and PSC motors are calculated using the average ratio of ECM to SP/PSC in Table 3-230, Section 3.4.1 of the Arkansas TRM (http://www.apscservices.info/EEInfo/TRM6.pdf) , and the ‘HVAC – ECM Fan Motors’ protocol of the Massachusetts TRM (http://ma-eeac.org/wordpress/wp-content/uploads/TRM_PLAN_2013-15.pdf)341PGE Workpaper, Commercial Kitchen Demand Ventilation Controls, PGECOFST116. June 1, 2009
SECTION 2: Residential MeasuresMiscellaneous Page 352
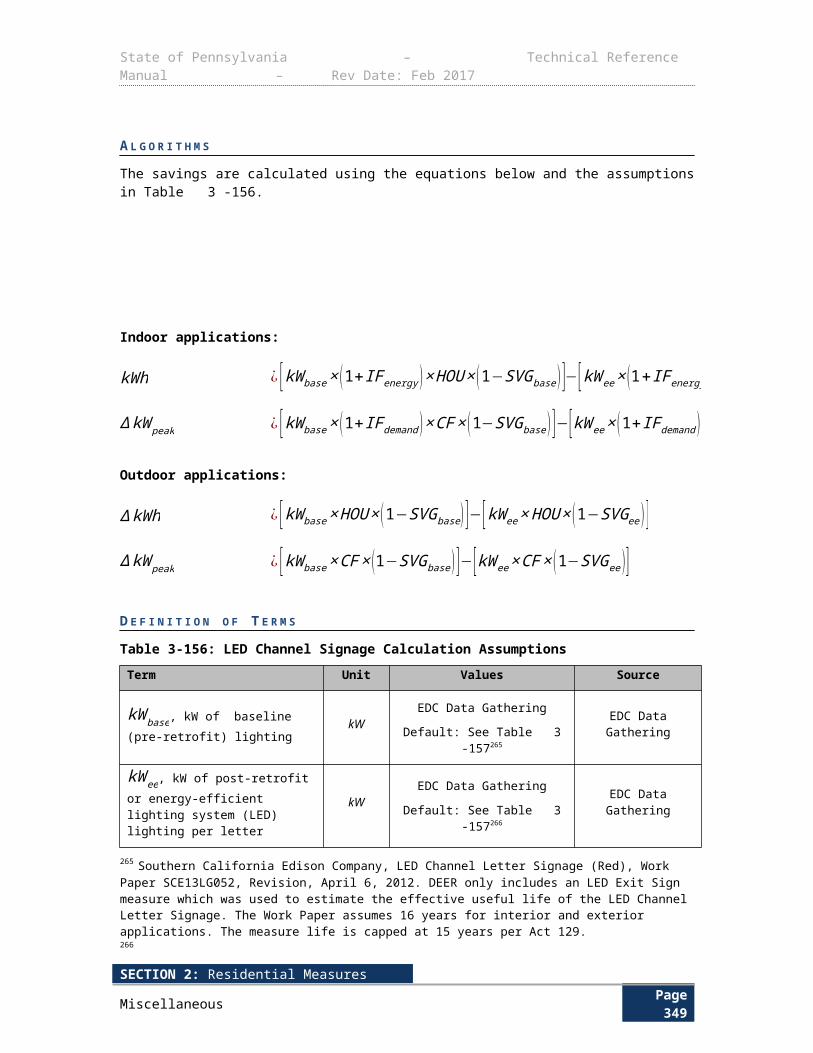
State of Pennsylvania – Technical Reference Manual – Rev Date: Feb 2017
The ratio of the average energy usage between 2 PM to 6 PM on summer weekdays to the total annual energy usage is taken from usage profile data collected for commercial water heaters in CA342. The usage profiles are shown in Figure 3-5. To ensure that the load shape data derived from observations in CA can be applied to PA, we compared the annual energy usage to peak demand factors for two disparate climate zones in CA. The results, shown in Figure 3-6, indicate that the ratio of peak demand to annual energy usage is not strongly influenced by climate. Also, though the actual usage profiles may be different, the average usage between 2 PM to 6 PM on summer weekdays is quite similar for al building types. The close level of agreement between disparate climate zones and building types suggest that the results will carry over to Pennsylvania343.
Figure 3-5: Load shapes for hot water in four commercial building types
0
0.00005
0.0001
0.00015
0.0002
0.00025
0.0003
1 3 5 7 9 11 13 15 17 19 21 23
Frac
tion
of A
nnua
l Ene
rgy
Usa
ge
Hour of Day (Summer Weekday)
Restaurants Other Office Retail
Figure 3-6: Energy to demand factors for four commercial building types
0
0.00005
0.0001
0.00015
0.0002
0.00025
Coastal Climate Zone Inland Climate Zone
Dem
and
Redu
ction
to En
ergy
Savi
ngs C
onve
rsio
n Fa
ctor
(h-1 )
Restaurants Other Office Retail
342 Ibid.343 DEER 2014 Effective Useful Life.
SECTION 2: Residential MeasuresMiscellaneous Page 353

State of Pennsylvania – Technical Reference Manual – Rev Date: Feb 2017
Resistive Heating Discount FactorThe resistive heating discount factor is an attempt to account for possible increased reliance on back-up resistive heating elements during peak usage conditions. Although a brief literature review failed to find data that may lead to a quantitative adjustment, two elements of the demand reduction calculation are worth considering.
The hot water temperature in this calculation is somewhat conservative at 119 °F.
The peak usage window is eight hours long.
In conditioned space, heat pump capacity is somewhat higher in the peak summer window.
In unconditioned space, heat pump capacity is dramatically higher in the peak summer window.
Under these operating conditions, one would expect a properly sized heat pump water heater with adequate storage capacity to require minimal reliance on resistive heating elements. A resistive heating discount factor of 0.9, corresponding to a 10% reduction in COP during peak times, is therefore taken as a conservative estimation for this adjustment.
Heat Pump COP Adjustment FactorThe energy factors are determined from a DOE testing procedure that is carried out at 56 °F wetbulb temperature. However, the average wetbulb temperature in PA is closer to 45 °F344, while the average wetbulb temperature in conditioned typically ranges from 50 °F to 80 °F. The heat pump performance is temperature dependent.
Error: Reference source not found below shows relative coefficient of performance (COP) compared to the COP at rated conditions345. According to the plotted profile, the following adjustments are recommended.
Table 3-206: COP Adjustment Factors
Heat Pump Placement Typical WB Temperature °F COP Adjustment Factor
Unconditioned Space 44 0.80
Conditioned Space 63 1.09
Kitchen 80 1.30
344 ENERGY STAR Product Specification for Residential Water Heaters. Version 3.0 http://www.energystar.gov/sites/default/files/specs//ENERGY%20STAR%20Water%20Heaters%20Version%203%200%20Program%20Requirements.pdf 345 DEER 2008. Commercial Results Review Non-Updated Measures. Assumes a 40 gal natural gas water heater with a standard efficiency of 0.594.
SECTION 2: Residential MeasuresMiscellaneous Page 354
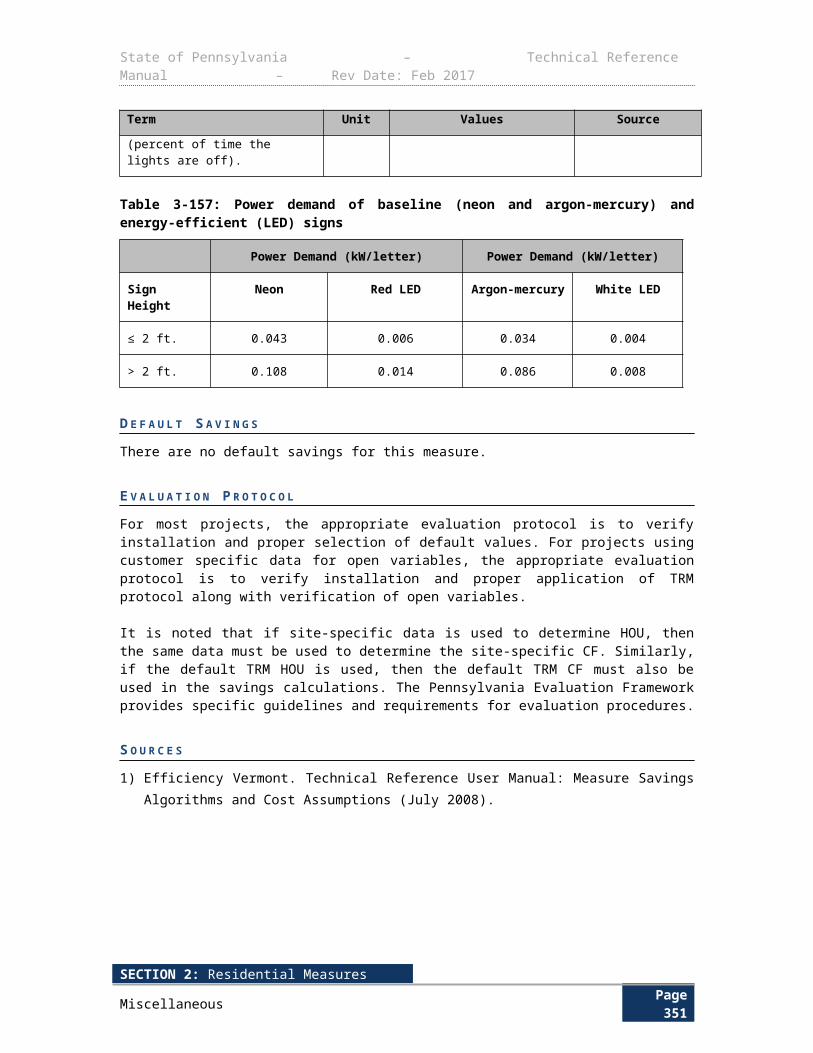
State of Pennsylvania – Technical Reference Manual – Rev Date: Feb 2017
Figure 3-7: Dependence of COP on Outdoor Wetbulb Temperature
y = -8.750E-05x2 + 2.461E-02x - 1.117E-01R² = 9.980E-01
0
0.2
0.4
0.6
0.8
1
1.2
1.4
1.6
30 40 50 60 70 80 90
COP
divi
ded
by C
OP
at 5
6 F
WB
Wetbulb Temperature (F)
COP vs Temperature
D E F I N I T I O N O F T E R M S
The parameters in the above equation are listed in Table 3-207.
SECTION 2: Residential MeasuresMiscellaneous Page 355
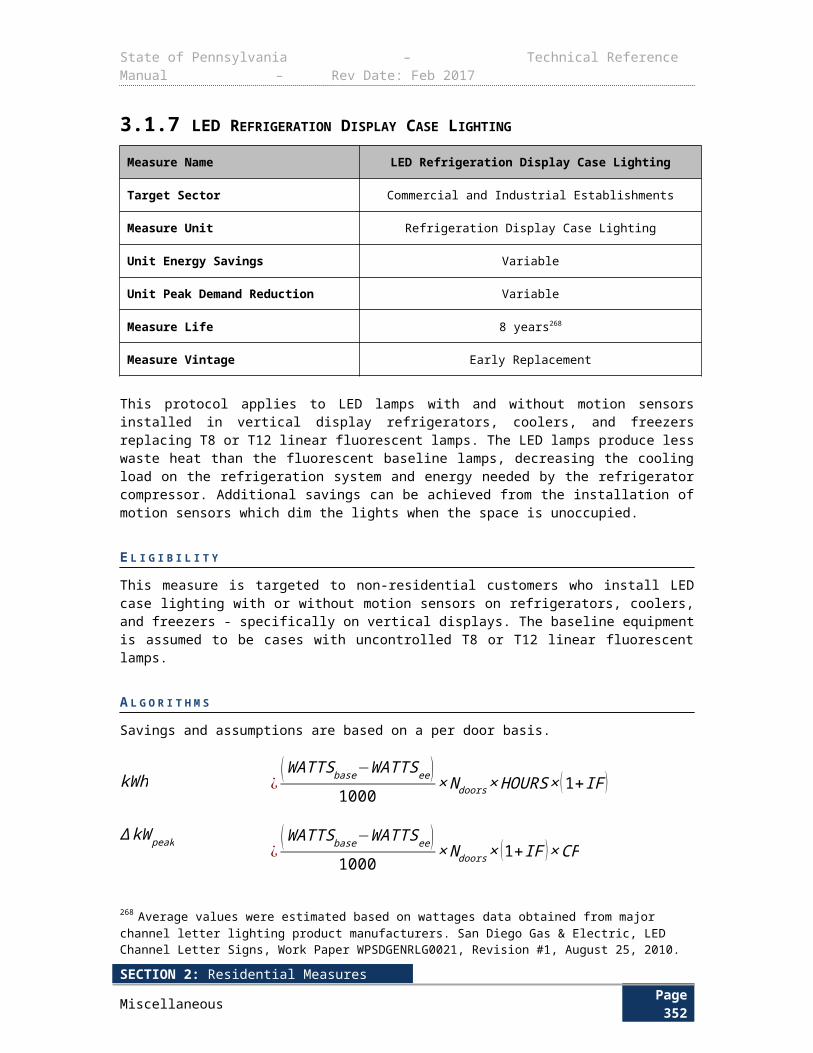
State of Pennsylvania – Technical Reference Manual – Rev Date: Feb 2017
Table 3-207: Heat Pump Water Heater Calculation Assumptions
Term Unit Values Source
EF base, Energy Factor of baseline water heater
None See Table 3-208 1
EF proposed , Energy Factor of proposed efficient water heater
None Default:≤55 Gallons: 2.0>55 Gallons: 2.2
7
Nameplate EDC Data Gathering
Load , Average annual Load kBTU Default: See Table3-205
5
EDC Data Gathering
EDC Data Gathering
T hot, Temperature of hot water °F 119 2
T cold, Temperature of cold water supply °F 55 3
ETDF, Energy to Demand Factor None 0.000178 4
Fadjust ,COP Adjustment factor None 0.80 if outdoor1.09 if indoor
1.30 if in kitchen
4
RDF, Resistive Discount Factor None 0.90 6
Typical SF , Typical square footage ft2 Default: See Table3-205
8
EDC Data Gathering
EDC Data Gathering
HW, Average annual gallons of use Gallons Default: See Table3-205
Calculation
EDC Data Gathering
EDC Data Gathering
Energy Factors based on Tank SizeAs of 4/16/2015, Federal Standards for electric water heater Energy Factors are equal to 0.96−0.0003×Rated Storage(gallons) for tanks ≥20 gallons and ≤55 gallons. For tanks >55 gallons and ≤120 gallons, the minimum Energy Factor is 2.057−0.00113×Rated Storage (gallons ). The following table shows the Energy Factors for various tank sizes.
SECTION 2: Residential MeasuresMiscellaneous Page 356

State of Pennsylvania – Technical Reference Manual – Rev Date: Feb 2017
Table 3-208: Minimum Baseline Energy Factor Based on Tank Size
Tank Size (gallons)Minimum Energy Factors (
EF base)
40 0.948
50 0.945
65 1.984
80 1.967
120 1.921
D E F A U L T S A V I N G S
The default savings for the installation of heat pump electric water heaters in various applications can be calculated using the algorithms below:
Table 3-209: Energy Savings Algorithms
Building Type Location Installed Algorithm
Education Outdoor ∆ kWh=( 59,018.78EF base
−73,773.47EF proposed
)
Education Indoor ∆ kWh=( 59,018.78EF base
−54,145.67EF proposed
)
Education Kitchen ∆ kWh=( 59,018.78EF base
−45,399.06EF proposed
)
Grocery Outdoor ∆ kWh=( 3,213.67EFbase
−4,017.08EF proposed )
Grocery Indoor ∆ kWh=( 3,213.67EFbase
−2,948.32EF proposed )
Grocery Kitchen ∆ kWh=( 3,213.67EFbase
−2,472.05EF proposed )
Lodging Outdoor ∆ kWh=( 20,653.28EF base
−25,816.60EF proposed )
Lodging Indoor ∆ kWh=( 20,653.28EF base
−18,947.96EF proposed )
Lodging Kitchen ∆ kWh=( 20,653.28EF base
−15,887.14EF proposed )
Office Outdoor ∆ kWh=( 201.46EF base
−251.82EF proposed )
SECTION 2: Residential MeasuresMiscellaneous Page 357
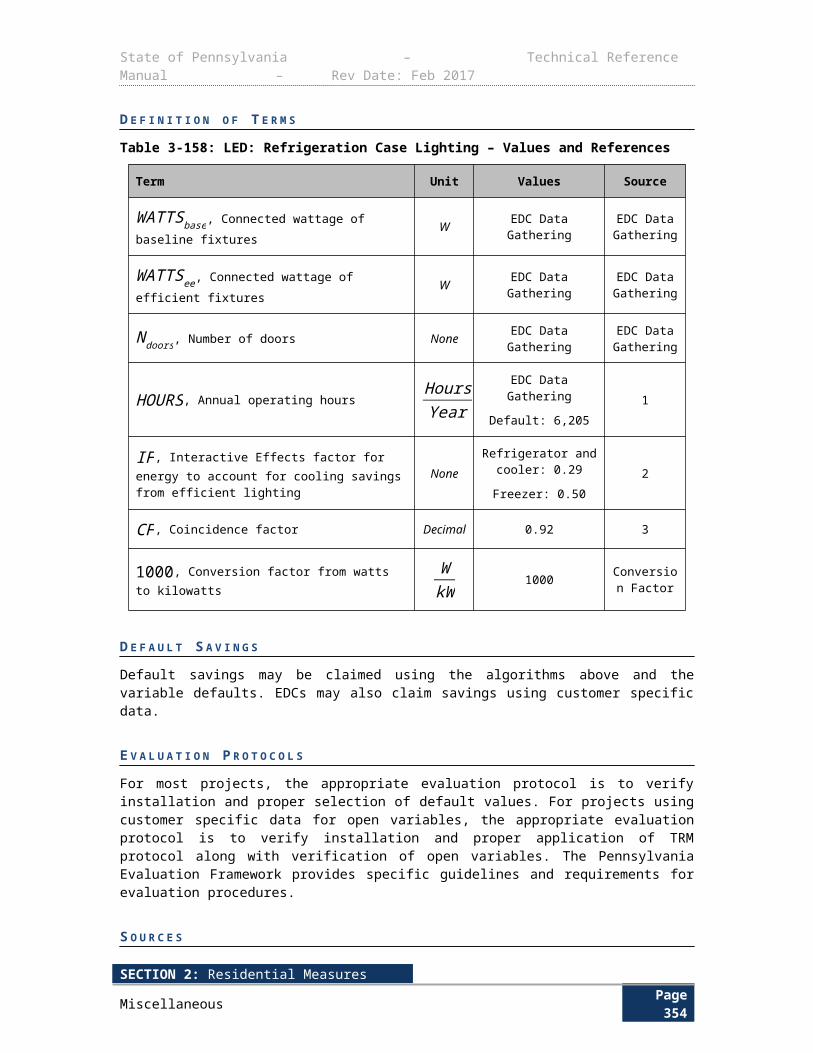
State of Pennsylvania – Technical Reference Manual – Rev Date: Feb 2017
Building Type Location Installed Algorithm
Office Indoor ∆ kWh=( 201.46EF base
−184.82EF proposed )
Office Kitchen ∆ kWh=( 201.46EF base
−154.97EF proposed )
Restaurant Outdoor ∆ kWh=( 28,115.77EFbase
−35,144.71EF proposed )
Restaurant Indoor ∆ kWh=( 28,115.77EFbase
−25,794.28EF proposed )
Restaurant Kitchen ∆ kWh=( 28,115.77EFbase
−21,627.51EF proposed )
Retail Outdoor ∆ kWh=( 66.17EFbase
−82.71
EF proposed )Retail Indoor ∆ kWh=( 66.17
EFbase−
60.70EF proposed )
Retail Kitchen ∆ kWh=( 66.17EFbase
−50.90
EF proposed )Warehouse Outdoor ∆ kWh=( 1,703.36
EF base− 2,129.20EF proposed
)
Warehouse Indoor ∆ kWh=( 1,703.36EF base
− 1,562.71EF proposed
)
Warehouse Kitchen ∆ kWh=( 1,703.36EF base
−1,310.28EF proposed
)
E V A L U A T I O N P R O T O C O L S
For most projects, the appropriate evaluation protocol is to verify installation and proper selection of default values. For projects using customer specific data for open variables, the appropriate evaluation protocol is to verify installation and proper application of TRM protocol along with verification of open variables. The Pennsylvania Evaluation Framework provides specific guidelines and requirements for evaluation procedures.
S O U R C E S
1) U.S. Federal Standards for Residential Water Heaters. Effective April 16, 2015. http://www1.eere.energy.gov/buildings/appliance_standards/product.aspx/productid/27
2) 2014 SWE Residential Baseline Study. http://www.puc.pa.gov/Electric/pdf/Act129/SWE-2014_PA_Statewide_Act129_Residential_Baseline_Study.pdf
3) Mid-Atlantic TRM, footnote #24. http://www.neep.org/Assets/uploads/files/emv/emv-products/TRM_March2013Version.pdf
SECTION 2: Residential MeasuresMiscellaneous Page 358
State of Pennsylvania – Technical Reference Manual – Rev Date: Feb 2017
4) The ETDF is estimated using the California load shapes and reflects PJM’s peak demand period. The load shapes can be accessed online: http://www.ethree.com/CPUC/PG&ENonResViewer.zip
5) DEER 2008. Commercial Results Review Non-Updated Measures.
6) Engineering Estimate
7) ENERGY STAR Product Specifications for Residential Water Heaters Version 3.0. Effective April 15, 2016. http://www.energystar.gov/sites/default/files/ENERGY%20STAR%20Water%20Heaters%20Version%203%200%20Program%20Requirements_0.pdf
8) 2014 Non-Residential End Use & Saturation Study. April 4, 2014. http://www.puc.pa.gov/Electric/pdf/Act129/SWE-2014_PA_Statewide_Act129_Non-Residential_EndUse_Saturation_Study.pdf
SECTION 2: Residential MeasuresMiscellaneous Page 359
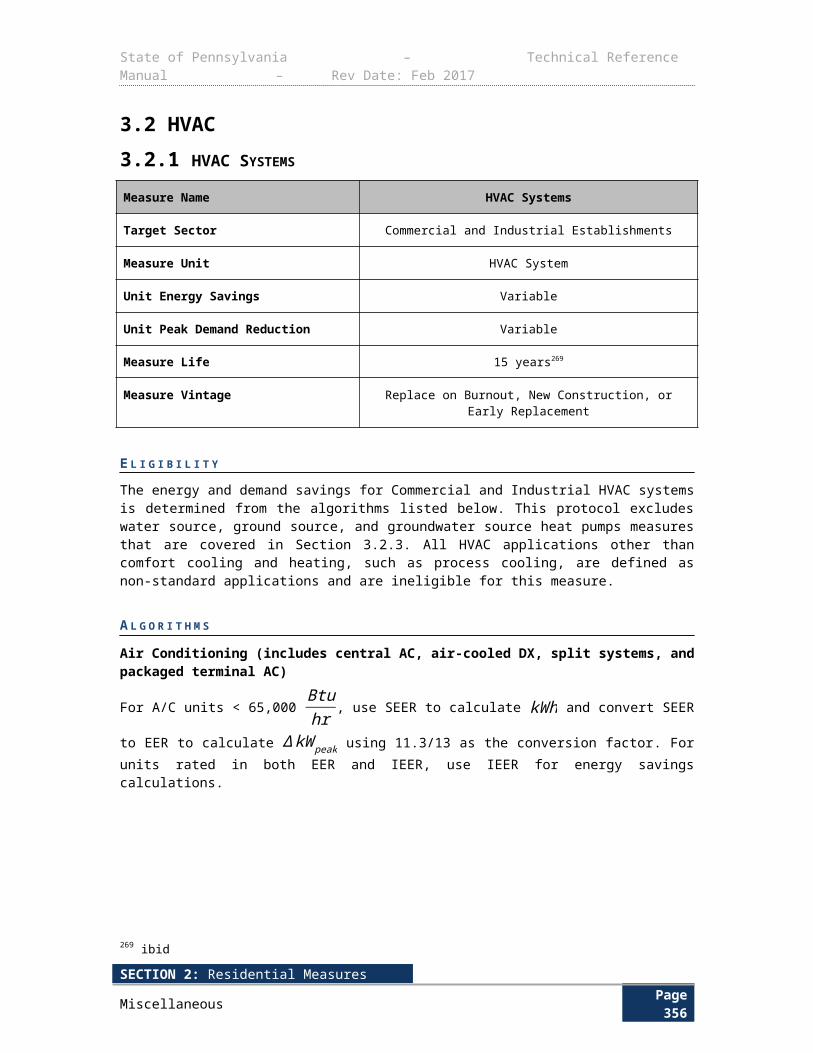
State of Pennsylvania – Technical Reference Manual – Rev Date: Feb 2017
3.4.2 LOW FLOW PRE-RINSE SPRAYERS FOR RETROFIT PROGRAMS
Measure Name Low Flow Pre-Rinse Sprayers for Retrofit Programs
Target Sector Commercial and Industrial Establishments
Measure Unit Pre Rinse Sprayer
Unit Energy Savings Groceries: 151 kWh; Food Services: 1,698 kWh
Unit Peak Demand Reduction Groceries: 0.03kW; Food Services: 0.30 kW
Measure Life 5 years346
Measure Vintage Early Replacement
E L I G I B I L I T Y
This protocol documents the energy savings and demand reductions attributed to efficient low flow pre-rinse sprayers in grocery and food service applications. The most likely areas of application are kitchens in restaurants and hotels. Only premises with electric water heating may qualify for this incentive. In addition, the replacement pre-rinse spray nozzle must use less than 1.6 gallons per minute with a cleanability performance of 26 seconds per plate or less. Low flow pre-rinse sprayers reduce hot water usage and save energy associated with water heating.
This protocol is applicable to retrofit programs only. The baseline for Retrofit Program is assumed to be a 2.25 GPM347 and 2.15 GPM348 for food service and grocery applications respectively.
A L G O R I T H M S
The energy savings and demand reduction are calculated through the protocols documented below.
kWh for Food Services ¿((Fbfs×U bfs )−(F pfs×U pfs))×365 days
yr×8.3 lbs
gal×(Thfs−T c)
EF×3412 BtukWh
kWh for Groceries ¿((Fbg×Ubg )−(F pg×U pg ))×365 days
yr×8.3 lbs
gal×(T hg−T c)
EF×3412 BtukWh
The demand reduction is taken as the annual energy savings multiplied by the ratio of the average energy usage between 2 PM to 6 PM on summer weekdays to the total annual energy usage.
346 2014 Non-Residential End Use & Saturation Study. April 4, 2014. http://www.puc.pa.gov/Electric/pdf/Act129/SWE-2014_PA_Statewide_Act129_Non-Residential_EndUse_Saturation_Study.pdf 347 DEER 2008 Commercial Results Review Non Updated Measures 348 One reason for the close agreement is that the factor is a ratio of the energy usage to peak demand for the same location. Even though the energy usages may vary significantly in different climate zones, the hot water usage patterns may be driven by underlying practices that carry over well from state to state (e.g. dishwashing after lunch or dinner in restaurants).
SECTION 2: Residential MeasuresMiscellaneous Page 360
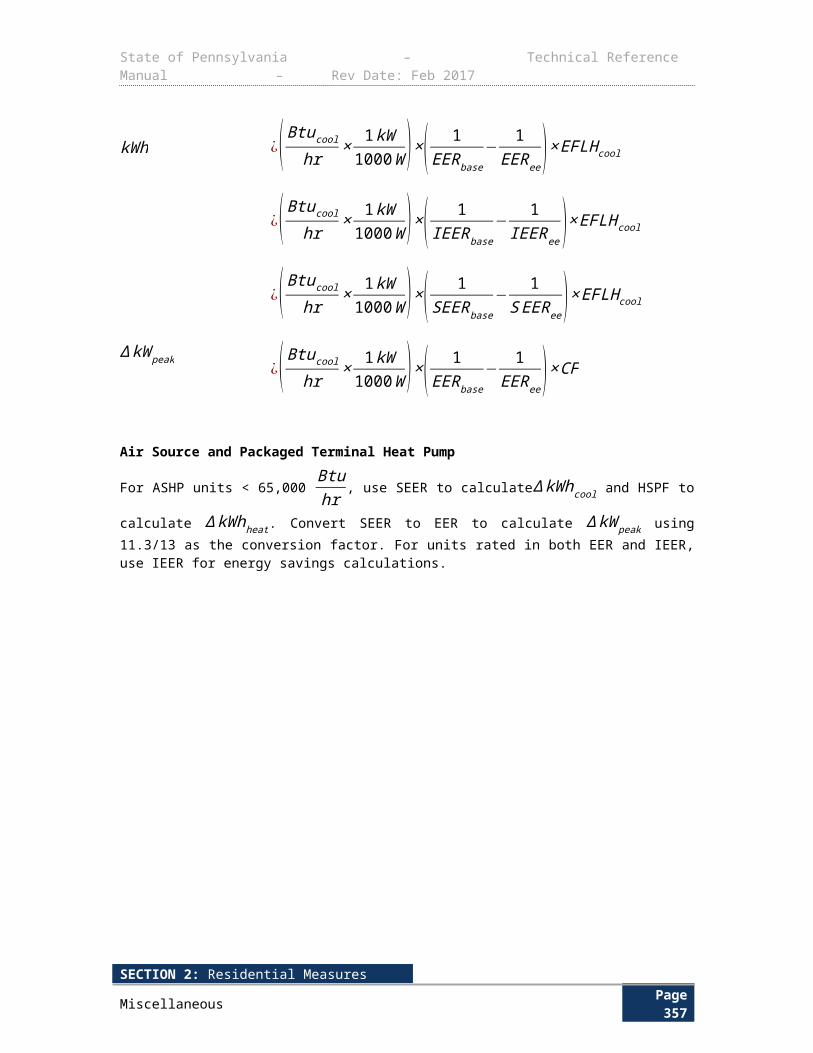
State of Pennsylvania – Technical Reference Manual – Rev Date: Feb 2017
∆ kW peak ¿ETDF× Energy Savings
The Energy to Demand Factor is defined below:
ETDF ¿AverageUsageSummerWD2−6PM
Annual EnergyUsage
The ratio of the average energy usage between 2 PM to 6 PM on summer weekdays to the total annual energy usage is taken from usage profile data collected for commercial water heaters in CA. The usage profiles are shown in Figure 3-8. To ensure that the load shape data derived from observations in CA can be applied to PA, we compared the annual energy usage to peak demand factors for two disparate climate zones in CA. The results, shown in Figure 3-9, indicate that the ratio of peak demand to annual energy usage is not strongly influenced by climate. Also, though the actual usage profiles may be different, the average usage between 2 PM to 6 PM on summer weekdays is quite similar for al building types. The close level of agreement between disparate climate zones and building types suggest that the results will carry over to Pennsylvania349.
Figure 3-8: Load shapes for hot water in four commercial building types
0
0.00005
0.0001
0.00015
0.0002
0.00025
0.0003
1 3 5 7 9 11 13 15 17 19 21 23
Frac
tion
of A
nnua
l Ene
rgy
Usa
ge
Hour of Day (Summer Weekday)
Restaurants Other Office Retail
349 Based on TMY2 weather files from DOE2.com for Erie, Harrisburg, Pittsburgh, Wilkes-Barre, And Williamsport, the average annual wetbulb temperature is 45 1.3 °F. The wetbulb temperature in garages or attics, where the heat pumps are likely to be installed, are likely to be two or three degrees higher, but for simplicity, 45 °F is assumed to be the annual average wetbulb temperature.
SECTION 2: Residential MeasuresMiscellaneous Page 361
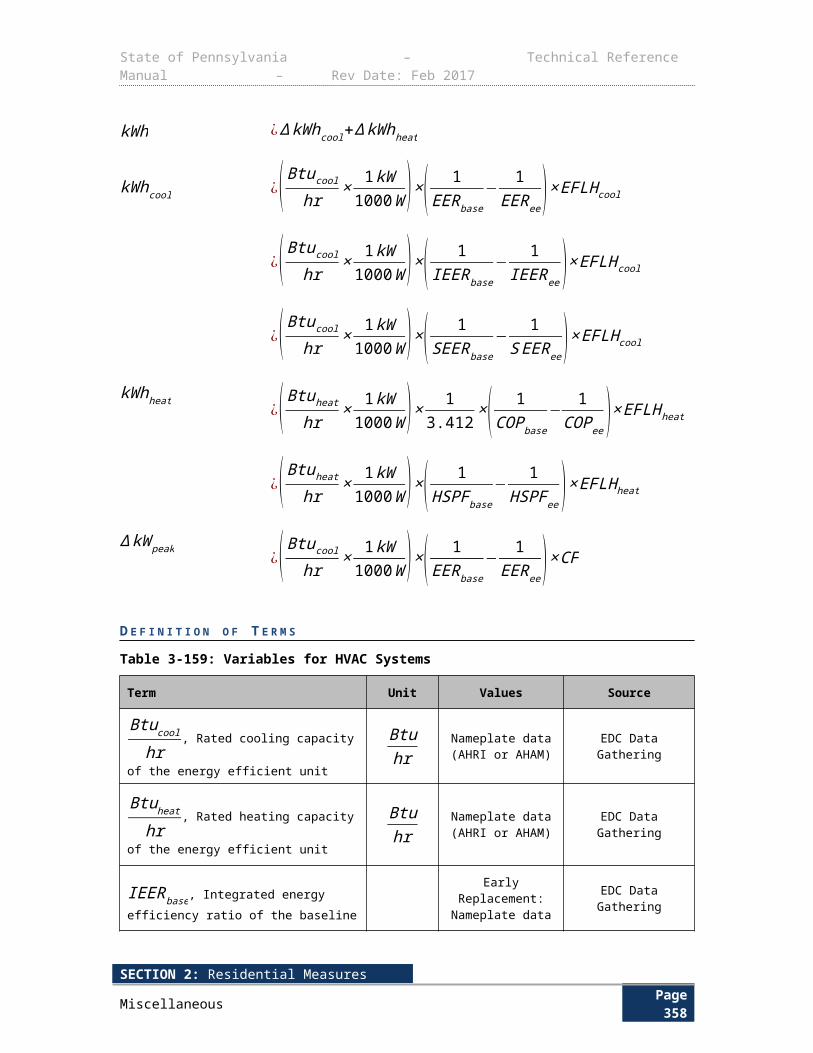
State of Pennsylvania – Technical Reference Manual – Rev Date: Feb 2017
Figure 3-9: Energy to demand factors for four commercial building types.
0
0.00005
0.0001
0.00015
0.0002
0.00025
Coastal Climate Zone Inland Climate Zone
Dem
and
Redu
ction
to En
ergy
Savi
ngs C
onve
rsio
n Fa
ctor
(h-1
)Restaurants Other Office Retail
D E F I N I T I O N O F T E R M S
The parameters in the above equation are listed in Table 3-210 below. The values for all parameters except incoming water temperature are taken from impact evaluation of the 2004-2005 California Urban Water council Pre-Rinse Spray Valve Installation Program.
SECTION 2: Residential MeasuresMiscellaneous Page 362

State of Pennsylvania – Technical Reference Manual – Rev Date: Feb 2017
Table 3-210: Low Flow Pre-Rinse Sprayer Calculations Assumptions
Term Unit Values Source
Fbfs , Baseline flow rate of sprayer for food service applications
GPM 2.25 1, 7
F pfs, Post measure flow rate of sprayer for food service applications
GPM EDC Data Gathering
EDC Data Gathering
Default: 1.12 1
Ubfs, Baseline water usage duration for food service applications
minday
32.4 2
U pfs, Post measure water usage duration for food service applications
minday
43.8 2
Fbg, Baseline flow rate of sprayer for grocery applications
GPM 2.15 1, 7
F pg, Post measure flow rate of sprayer for grocery applications
GPM EDC Data Gathering
EDC Data Gathering
Default: 1.12 1
U bg, Baseline water usage duration for grocery applications
minday
4.8 2
U pg, Post measure water usage duration for grocery applications
minday
6 2
T hfs, Temperature of hot water coming from the spray nozzle for food service application
°F 127.5 3
T c, Incoming cold water temperature for grocery and food service application
°F 55 6
T hg, Temperature of hot water coming from the spray nozzle for grocery application
°F 97.6 3
EF electric, Energy factor of existing electric water heater system
None EDC Data Gathering
EDC Data Gathering
0.904 4
ETDF, Energy to demand factor None 0.000178 5
Days per year pre-rinse spray valve is used at the site
Days 365350 1
Specific mass in pounds of one gallon of water lbgal
8.3 8
3,412 BtukWh
3,412 Conversion Factor
350 The performance curve is adapted from Table 1 in http://wescorhvac.com/HPWH%20design%20details.htm#Single-stage%20HPWHs. The performance curve depends on other factors, such as hot water set point. Our adjustment factor of 0.84 is a first order approximation based on the information available in literature.
SECTION 2: Residential MeasuresMiscellaneous Page 363
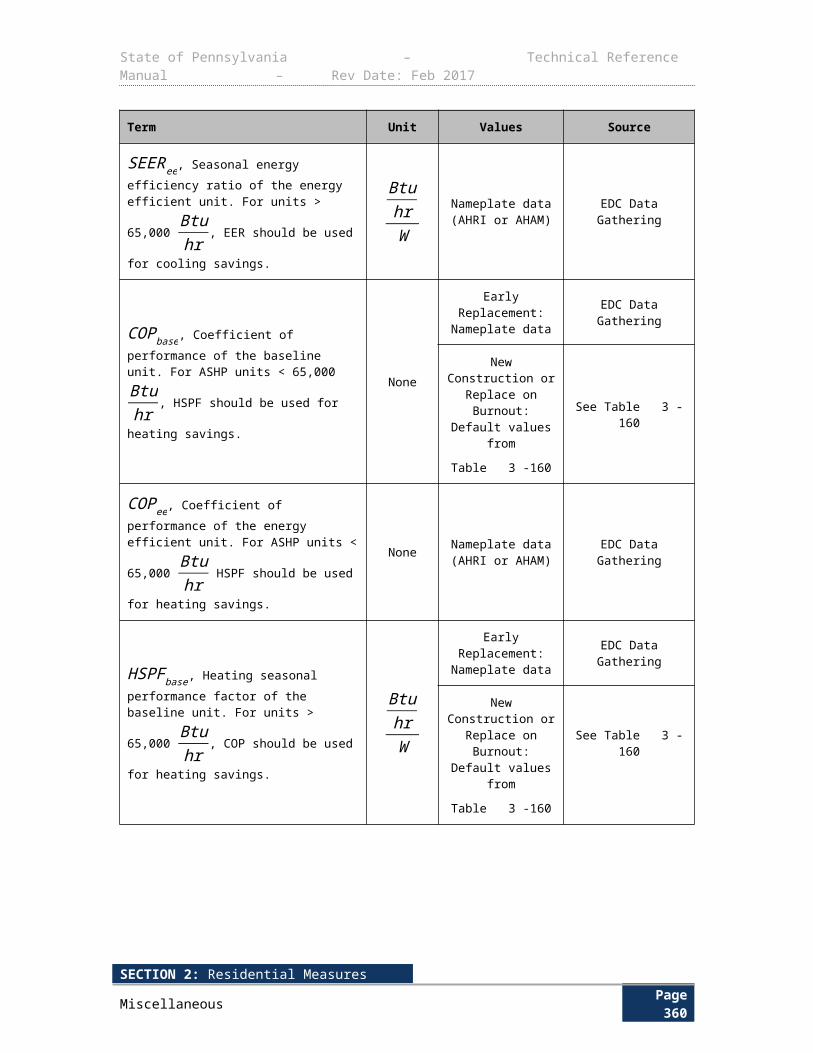
State of Pennsylvania – Technical Reference Manual – Rev Date: Feb 2017
D E F A U L T S A V I N G S The default savings for the installation of a low flow pre-rinse sprayer compared to a standard efficiency sprayer is 151 kWh/year for pre-rinse sprayers installed in grocery stores and 1,218 kWh/year for pre-rinse sprayers installed in food service building types such as restaurants. The deemed demand reductions for the installation of a low flow pre-rinse sprayer compared to a standard efficiency sprayer is 0.03 kW for pre-rinse sprayers installed in grocery stores and 0.22 kW for pre-rinse sprayers installed in food service building types such as restaurants.
E V A L U A T I O N P R O T O C O L
For most projects, the appropriate evaluation protocol is to verify installation and proper selection of default values. For projects using customer specific data for open variables, the appropriate evaluation protocol is to verify installation and proper application of TRM protocol along with verification of open variables. The Pennsylvania Evaluation Framework provides specific guidelines and requirements for evaluation procedures.
S O U R C E S
1) Impact and Process Evaluation Final Report for California Urban Water Conservation Council 2004-5 Pre-Rinse Spray Valve Installation Program (Phase 2), SBW Consulting, 2007, Table 3-4, p. 23. http://www.allianceforwaterefficiency.org/WorkArea/DownloadAsset.aspx?id=976
2) Impact and Process Evaluation Final Report for California Urban Water Conservation Council 2004-5 Pre-Rinse Spray Valve Installation Program (Phase 2), SBW Consulting, 2007, Table 3-6, p. 24. http://www.allianceforwaterefficiency.org/WorkArea/DownloadAsset.aspx?id=976
3) Impact and Process Evaluation Final Report for California Urban Water Conservation Council 2004-5 Pre-Rinse Spray Valve Installation Program (Phase 2), SBW Consulting, 2007, Table 3-5, p. 23. http://www.allianceforwaterefficiency.org/WorkArea/DownloadAsset.aspx?id=976
4) Federal Standards are 0.97 -0.00132 x Rated Storage in Gallons. For a 50-gallon tank this is approximately 0.90. “Energy Conservation Program: Energy Conservation Standards for Residential Water Heaters, Direct Heating Equipment, and Pool Heaters” US Dept. of Energy Docket Number: EE–2006–BT-STD–0129, p. 30 http://www.gpo.gov/fdsys/pkg/FR-2010-04-16/pdf/2010-7611.pdf
5) The EnergyToDemandFactor is estimated using the California load shapes and reflects PJM’s peak demand period. The load shapes can be accessed online: http://www.ethree.com/CPUC/PG&ENonResViewer.zip
6) Mid-Atlantic TRM, footnote #24.
a. http://www.neep.org/Assets/uploads/files/emv/emv-products/TRM_March2013Version.pdf
7) The Energy Policy Act (EPAct) of 2005 sets the maximum flow rate for pre-rinse spray valves at 1.6 GPM at 60 pounds per square inch of water pressure when tested in accordance with ASTM F2324-03. This performance standard went into effect January 1, 2006.
8) The Engineering ToolBox. “Water-Thermal Properties.” http://www.engineeringtoolbox.com/water-thermal-properties-d_162.html
SECTION 2: Residential MeasuresMiscellaneous Page 364
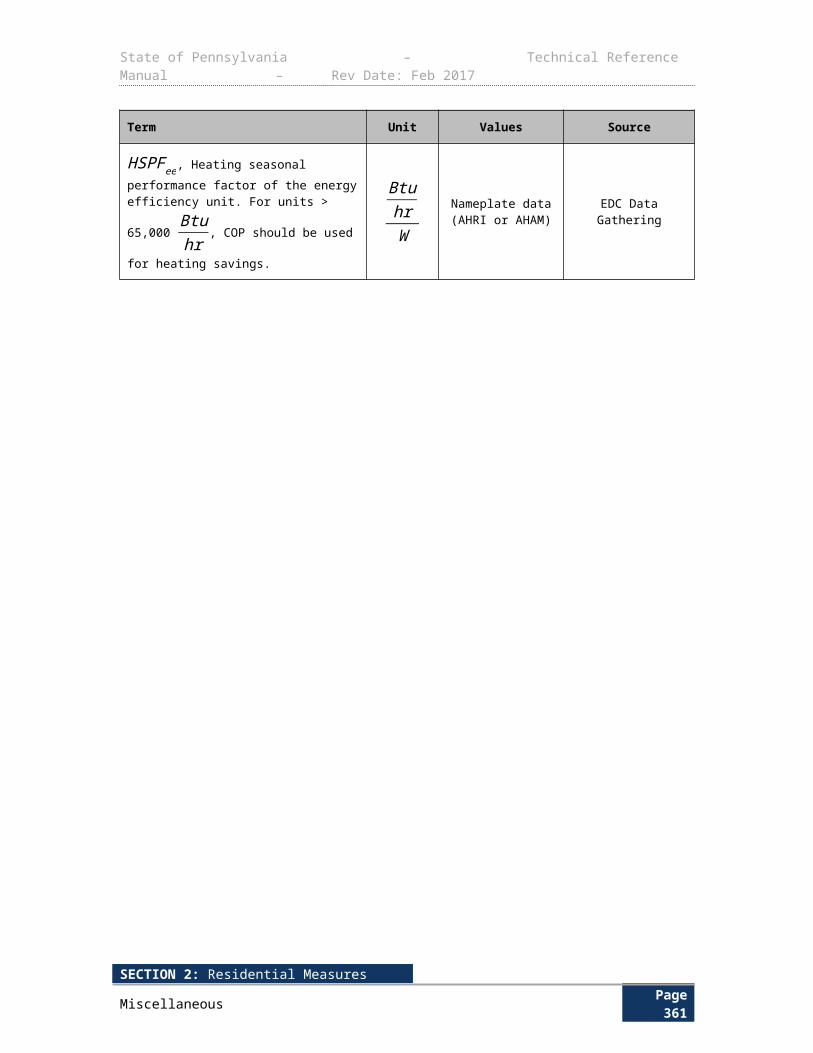
State of Pennsylvania – Technical Reference Manual – Rev Date: Feb 2017
3.4.3 LOW FLOW PRE-RINSE SPRAYERS FOR TIME OF SALE / RETAIL PROGRAMS
Measure Name Low Flow Pre-Rinse Sprayers for Time of Sale / Retail Programs
Target Sector Commercial and Industrial Establishments
Measure Unit Pre Rinse Sprayer
Unit Energy Savings See Table 3-212
Unit Peak Demand Reduction See Table 3-212
Measure Life 5 years351
Measure Vintage Replace on Burnout
E L I G I B I L I T Y
This protocol documents the energy savings and demand reductions attributed to efficient low flow pre-rinse sprayers in small quick service restaurants, medium-sized casual dining restaurants, and large institutional establishments with cafeterias. Low flow pre-rinse sprayers reduce hot water usage and save energy associated with water heating. Only premises with electric water heating may qualify for this incentive. In addition, the new pre-rinse spray nozzle must have a cleanability performance of 26 seconds per plate or less.
This protocol is applicable to Time of Sale/Retail programs only. The baseline for Time of Sale/ Retail programs is assumed to be 1.52 GPM352.
A L G O R I T H M S
The energy savings and demand reduction are calculated through the protocols documented below.
kWh ¿(Fb−Fp )×U ×60 mins
hour×365 days
yr×8.3 lbs
gal×1 Btu
lb∙℉ ×(Th−Tc )
EF×3412 BtukWh
The demand reduction is taken as the annual energy savings multiplied by the ratio of the average energy usage between noon and 8PM on summer weekdays to the total annual energy usage.
∆ kW peak ¿ETDF× Energy Savings
The ETDF is defined below:
ETDF ¿AverageUsageSummerWD2−6PM
Annual EnergyUsage351 Impact and Process Evaluation Final Report for California Urban Water Conservation Council 2004-5 Pre-Rinse Spray Valve Installation Program (Phase 2), SBW Consulting, 2007, p. 30352 ibid
SECTION 2: Residential MeasuresMiscellaneous Page 365
State of Pennsylvania – Technical Reference Manual – Rev Date: Feb 2017
The ratio of the average energy usage between 2 PM to 6 PM on summer weekdays to the total annual energy usage is taken from usage profile data collected for commercial water heaters in CA. The usage profiles are shown in Figure 3-10. To ensure that the load shape data derived from observations in CA can be applied to PA, we compared the annual energy usage to peak demand factors for two disparate climate zones in CA. The results, shown in Table 3-212 indicate that the ratio of peak demand to annual energy usage is not strongly influenced by climate. Also, though the actual usage profiles may be different, the average usage between 2 PM to 6 PM on summer weekdays is quite similar for all building types. The close level of agreement between disparate climate zones and building types suggest that the results will carry over to Pennsylvania.353
Figure 3-10: Load shapes for hot water in four commercial building types
0
0.00005
0.0001
0.00015
0.0002
0.00025
0.0003
1 3 5 7 9 11 13 15 17 19 21 23
Frac
tion
of A
nnua
l Ene
rgy
Usa
ge
Hour of Day (Summer Weekday)
Restaurants Other Office Retail
353 ibid
SECTION 2: Residential MeasuresMiscellaneous Page 366
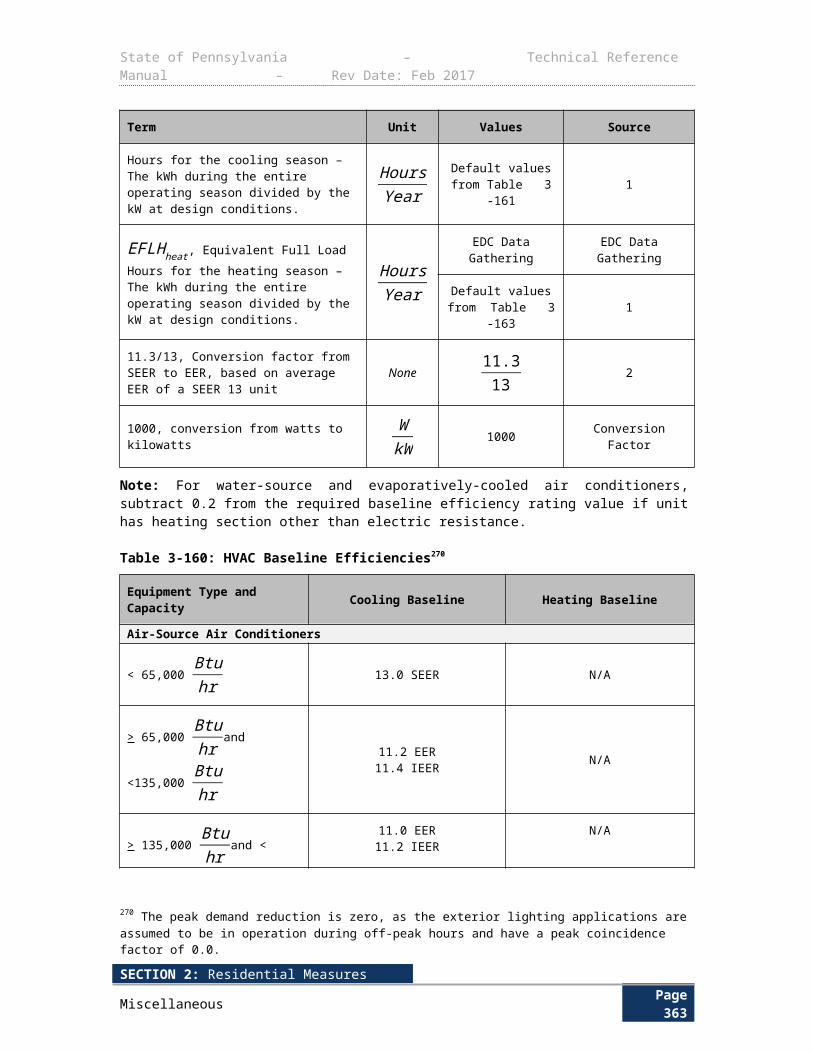
State of Pennsylvania – Technical Reference Manual – Rev Date: Feb 2017
Figure 3-11: Energy to demand factors for four commercial building types.
0
0.00005
0.0001
0.00015
0.0002
0.00025
Coastal Climate Zone Inland Climate Zone
Dem
and
Redu
ction
to En
ergy
Savi
ngs C
onve
rsio
n Fa
ctor
(h-1 )
Restaurants Other Office Retail
D E F I N I T I O N O F T E R M S
Table 3-211: Low Flow Pre-Rinse Sprayer Calculations Assumptions
Term Unit Values Source
Fb , Baseline flow rate of sprayer GPMDefault:
Time of Sale/Retail: 1.52 GPM
1, 2
F p , Post measure flow rate of sprayer GPM
EDC Data Gathering EDC Data Gathering
Default:
Time of Sale/Retail: 1.06 GPM
3
U, Baseline and post measure water usage duration based on application
Hoursday
Default:
Small, quick- service restaurants: 0.5
Medium-sized casual dining restaurants: 1.5
Large institutional establishments with
cafeteria: 3
4
T h, Temperature of hot water coming from the spray nozzle
°F 127.5 1
T c, Incoming cold water temperature °F 55 5
EF❑, Energy factor of existing electric water heater system
None EDC Data Gathering EDC Data Gathering
Default: 0.904 6ETDF, EnergyToDemandFactor None 0.000178 7
SECTION 2: Residential MeasuresMiscellaneous Page 367
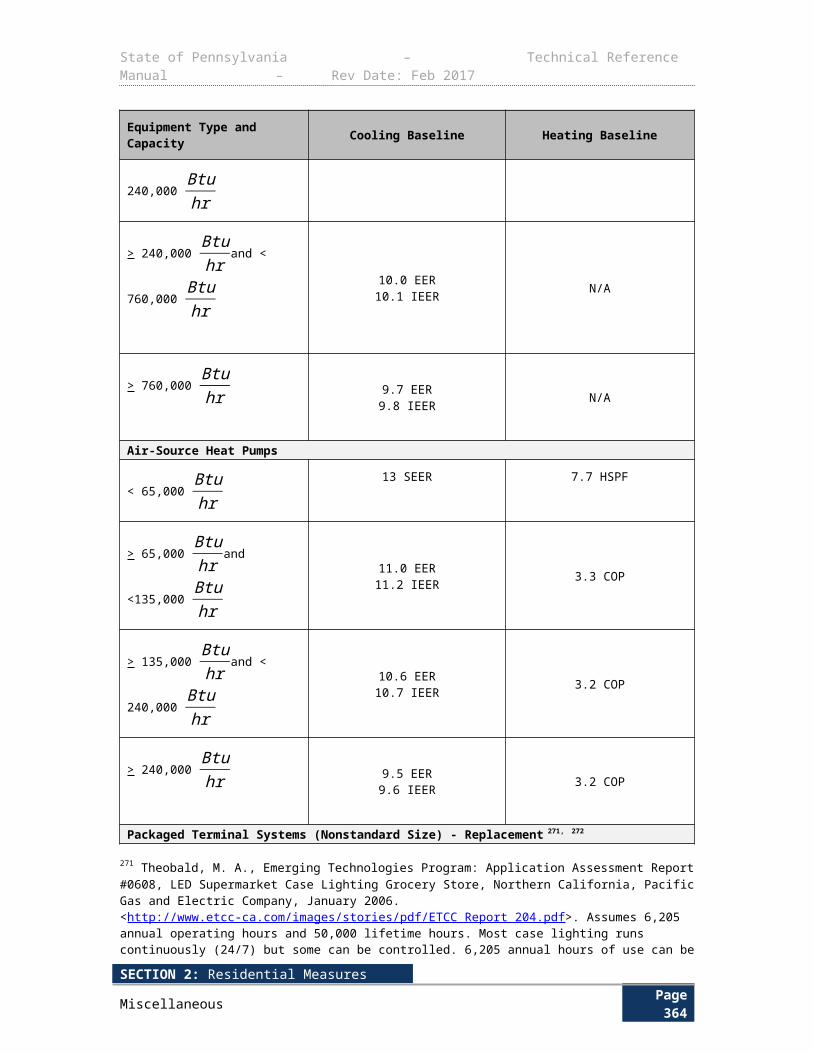
State of Pennsylvania – Technical Reference Manual – Rev Date: Feb 2017
Term Unit Values Source
Specific mass in pounds of one gallon of water
lbgal
8.3 8
Specific heat of waterBtulb∙ ° F
1.08
Days per year pre-rinse spray valve is used at the site Days 365354 1
Minutes per hour pre-rinse spray valveMinutesHour
60 Conversion Factor
3,412BtukWh
3,412 Conversion Factor
D E F A U L T S A V I N G S The default savings for the installation of a low flow pre-rinse sprayer compared to a standard efficiency sprayer for retail programs are listed in Table 3-212 below.
Table 3-212: Low Flow Pre-Rinse Sprayer Default Savings
Application
Retail
kWh kW
Small quick service restaurants 983 0.175
Medium-sized casual dining restaurants
2,948 0.525
Large institutional establishments with cafeteria
5,896 1.049
E V A L U A T I O N P R O T O C O L
For most projects, the appropriate evaluation protocol is to verify installation and proper selection of default values. For projects using customer specific data for open variables, the appropriate evaluation protocol is to verify installation and proper application of TRM protocol along with verification of open variables. The Pennsylvania Evaluation Framework provides specific guidelines and requirements for evaluation procedures.
S O U R C E S
1) Verification measurements taken at 195 installations showed average pre and post flowrates of 2.23 and 1.12 gallon per minute, respectively.” from Impact and Process Evaluation Final Report for California Urban Water Conservation Council 2004-5 Pre-Rinse Spray Valve Installation Program (Phase 2) (PG&E Program # 1198-04; SoCalGas Program 1200-04) (“CUWCC Report”, Feb 2007). http://www.allianceforwaterefficiency.org/WorkArea/DownloadAsset.aspx?id=976
2) The Energy Policy Act (EPAct) of 2005 sets the maximum flow rate for pre-rinse spray valves at 1.6 GPM at 60 pounds per square inch of water pressure when tested in accordance with
354 One reason for the close agreement is that the factor is a ratio of the energy usage to peak demand for the same location. Even though the energy usages may vary significantly in different climate zones, the hot water usage patterns may be driven by underlying practices that carry over well from state to state (e.g. dishwashing after lunch or dinner in restaurants).
SECTION 2: Residential MeasuresMiscellaneous Page 368
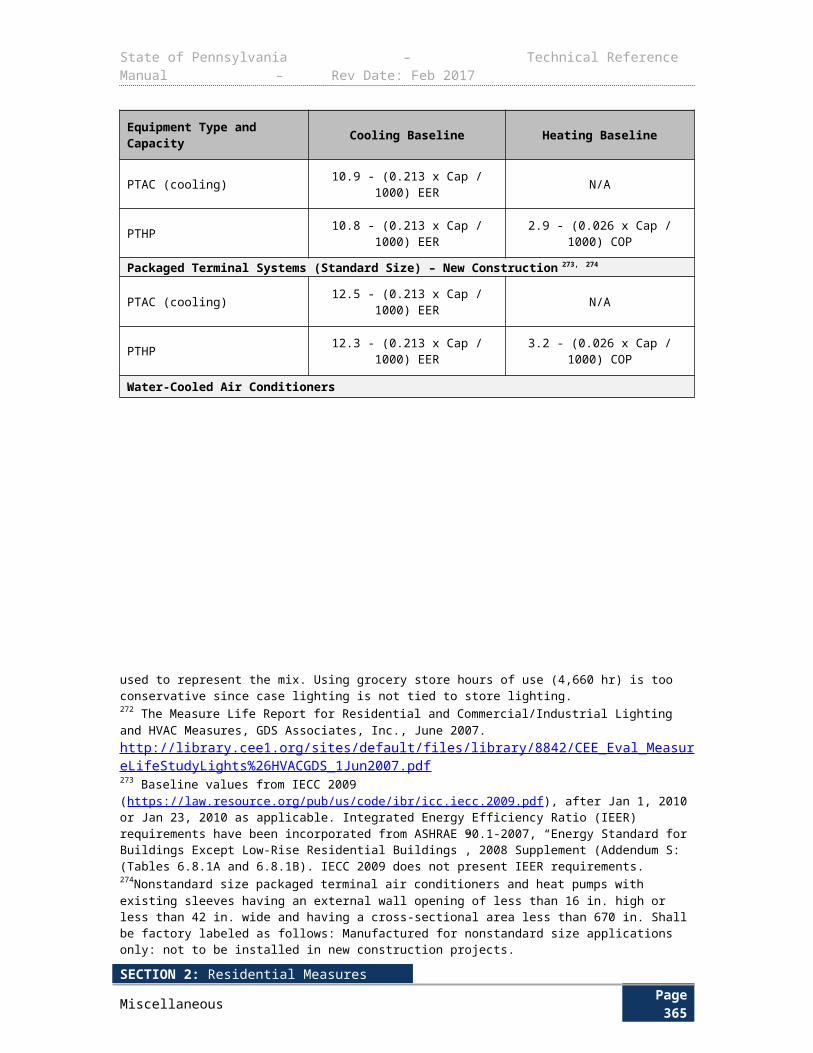
State of Pennsylvania – Technical Reference Manual – Rev Date: Feb 2017
ASTM F2324-03. This performance standard went into effect January 1, 2006. The federal baseline is adjusted using a baseline adjustment factor of 0.95. This value is derived based on the performance rating results of 29 models listed on the Food Service Technology Center Website showed that the highest rated flow was 1.51 GPM. Web address: http://www.fishnick.com/equipment/sprayvalves/, Accessed September 21, 2012. Sprayer by T&S Brass Model JetSpray B-0108 was rated at 1.48 GPM, and tested at 1.51 GPM.
3) 1.6 gallons per minute used to be the high efficiency flow, but more efficient spray valves are available ranging down to 0.64 gallons per minute per Federal Energy Management Program which references the Food Services Technology Center web site with the added note that even more efficient models may be available since publishing the data. The average of the nozzles listed on the FSTC website is 1.06. http://www.fishnick.com/equipment/sprayvalves/
4) Hours primarily based on PG&E savings estimates, algorithms, sources (2005), Food Service Pre-Rinse Spray Valves with review of 2010 Ohio Technical Reference Manual and Act on Energy Business Program Technical Resource Manual Rev05.
5) Mid-Atlantic TRM, footnote #24. http://www.neep.org/Assets/uploads/files/emv/emv-products/TRM_March2013Version.pdf
6) Federal Standards are 0.97 -0.00132 x Rated Storage in Gallons. For a 50-gallon tank this is approximately 0.90. “Energy Conservation Program: Energy Conservation Standards for Residential Water Heaters, Direct Heating Equipment, and Pool Heaters” US Dept. of Energy Docket Number: EE–2006–BT-STD–0129, p. 30 http://www.gpo.gov/fdsys/pkg/FR-2010-04-16/pdf/2010-7611.pdf
7) The ETDF is estimated using the California load shapes and reflects PJM’s peak demand period. The load shapes can be accessed online: http://www.ethree.com/CPUC/PG&ENonResViewer.zip
8) The Engineering ToolBox. “Water-Thermal Properties.” http://www.engineeringtoolbox.com/water-thermal-properties-d_162.html
SECTION 2: Residential MeasuresMiscellaneous Page 369
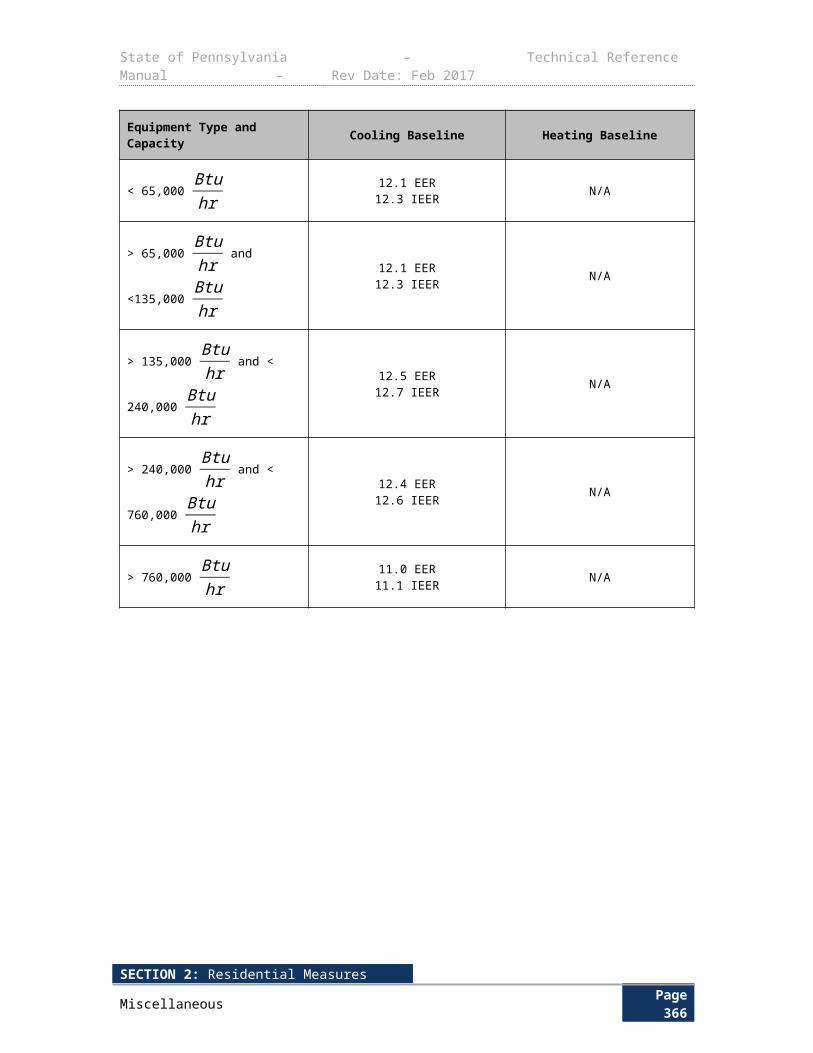
State of Pennsylvania – Technical Reference Manual – Rev Date: Feb 2017
3.4.4 FUEL SWITCHING: ELECTRIC RESISTANCE WATER HEATERS TO GAS / OIL / PROPANE
Measure NameFuel Switching: Electric Resistance Water Heaters to
Gas/Oil/Propane
Target Sector Commercial and Industrial Establishments
Measure Unit Gas, Oil or Propane Heater
Unit Energy Savings Variable
Unit Peak Demand Reduction Variable
Measure Life 11 years355 for natural gas or propane
8 years356 for oil
Measure Description Replace on Burnout
E L I G I B I L I T Y
Natural gas, propane, and oil water heaters generally offer the customer lower costs compared to standard electric water heaters. Additionally, they typically see an overall energy savings when looking at the source energy of the electric unit versus the fossil fuel unit.
This protocol documents the energy savings attributed to converting from a standard electric water heater to an ENERGY STAR natural gas/propane-fired water heater or a standard oil-fired water heater with an Energy Factor of 0.585. If a customer submits a rebate for a product that has applied for ENERGY STAR Certification but has not yet been certified, the savings will be counted for that product contingent upon its eventual certification as an ENERGY STAR measure. If at any point the product is rejected by ENERGY STAR, the product is then ineligible for the program and savings will not be counted.
A L G O R I T H M S
The energy savings calculation utilizes average performance data for available small commercial standard electric and natural gas water heaters and typical water usage. Because there is little electric energy associated with a natural gas or propane water heater, the energy savings are the full energy utilization of the electric water heater. The energy savings are obtained through the following formula:
kWh ¿{( 1EF elec ,bl )×(HW×1 Btu
lb∙ ° F×8.3 lb
gal× (T hot−T cold ))}
3412 BtukWh
Although there is a significant electric savings, there is an associated increase in fossil fuel energy consumption. While this fossil fuel consumption does not count against PA Act 129
355 Days per year pre-rinse spray valve is used at the site is assumed to be 365days/yr.356 Impact and Process Evaluation Final Report for California Urban Water Conservation Council 2004-5 Pre-Rinse Spray Valve Installation Program (Phase 2), SBW Consulting, 2007, p. 30
SECTION 2: Residential MeasuresMiscellaneous Page 370
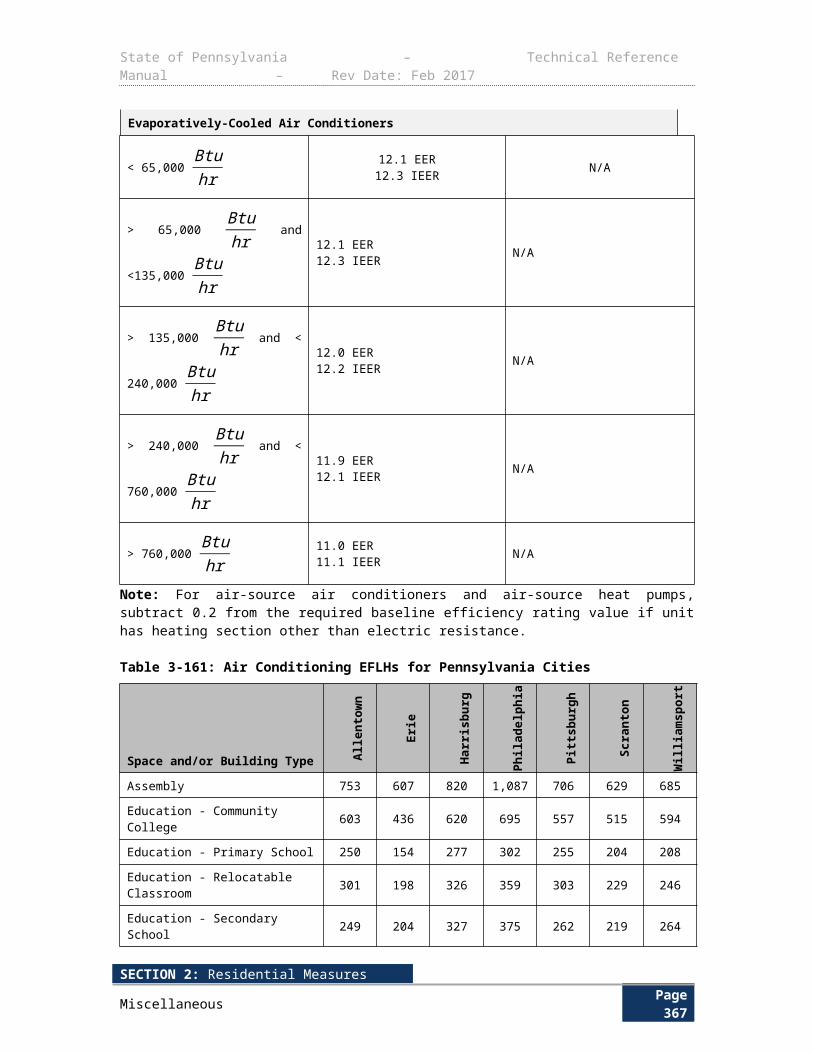
State of Pennsylvania – Technical Reference Manual – Rev Date: Feb 2017
energy savings, it is expected to be used in the program TRC test. The increased fossil fuel usage is obtained through the following formula:
FuelConsumption
(MMBtu ) ¿{( 1EF fuel ,inst
× 1DFfuel , adjust )×(HW×1 Btu
lb ∙° F×8.3 lb
gal× (T hot−T cold ))}
1,000,000 BtuMMBtu
Where EF fuel changes depending on the fossil fuel used by the water heater.
For resistive water heaters, the demand reduction is taken as the annual energy savings multiplied by the ratio of the average energy usage between 2 PM to 6 PM on summer weekdays to the total annual energy usage.
∆ kW peak ¿ETDF× Energy Savings×RDF
The Energy to Demand Factor is defined below:
ETDF ¿AverageUsagesummerWD2−6PM
Annual EnergyUsage
Loads
The annual gallons of use is calculated using average annual heating load ( kBtuft2 ) from the
DEER database357 and average square footage from the 2014 Statewide Non-Residential End Use & Saturation Study358. Average square footage for each building type is calculated by dividing
the Pennsylvania 2012 kWh sales by the energy use intensity ( kWhft2 )and premise count. The
DEER database has data for gas energy usage for the domestic hot water end use for various small commercial buildings. The loads are averaged over all 16 climate zones and all six vintage types in the DEER database. Finally, the loads are converted to average annual gallons of use using the algorithm below.
HW (Gallons ) ¿Load×EF ng ,base×1000 Btu
kBtu×Typical SF
1 Btulb∙ ° F
×8.3 lbgal
× (T hot−T cold )×1000 SF
357 The Energy Policy Act (EPAct) of 2005 sets the maximum flow rate for pre-rinse spray valves at 1.6 GPM at 60 pounds per square inch of water pressure when tested in accordance with ASTM F2324-03. This performance standard went into effect January 1, 2006. The federal baseline is adjusted using a baseline adjustment factor of 0.95 to arrive at 1.52 GPM i.e. 1.6 GPM X 0.95 = 1.52 GPM. This value is derived based on the performance rating results of 29 models listed on the Food Service Technology Center Website which showed that the highest rated flow was 1.51 GPM. Web address: http://www.fishnick.com/equipment/sprayvalves/, Accessed September 21, 2012. Sprayer by T&S Brass Model JetSpray B-0108 was rated at 1.48 GPM, and tested at 1.51 GPM.358 One reason for the close agreement is that the factor is a ratio of the energy usage to peak demand for the same location. Even though the energy usages may vary significantly in different climate zones, the hot water usage patterns may be driven by underlying practices that carry over well from state to state (e.g. dishwashing after lunch or dinner in restaurants).
SECTION 2: Residential MeasuresMiscellaneous Page 371
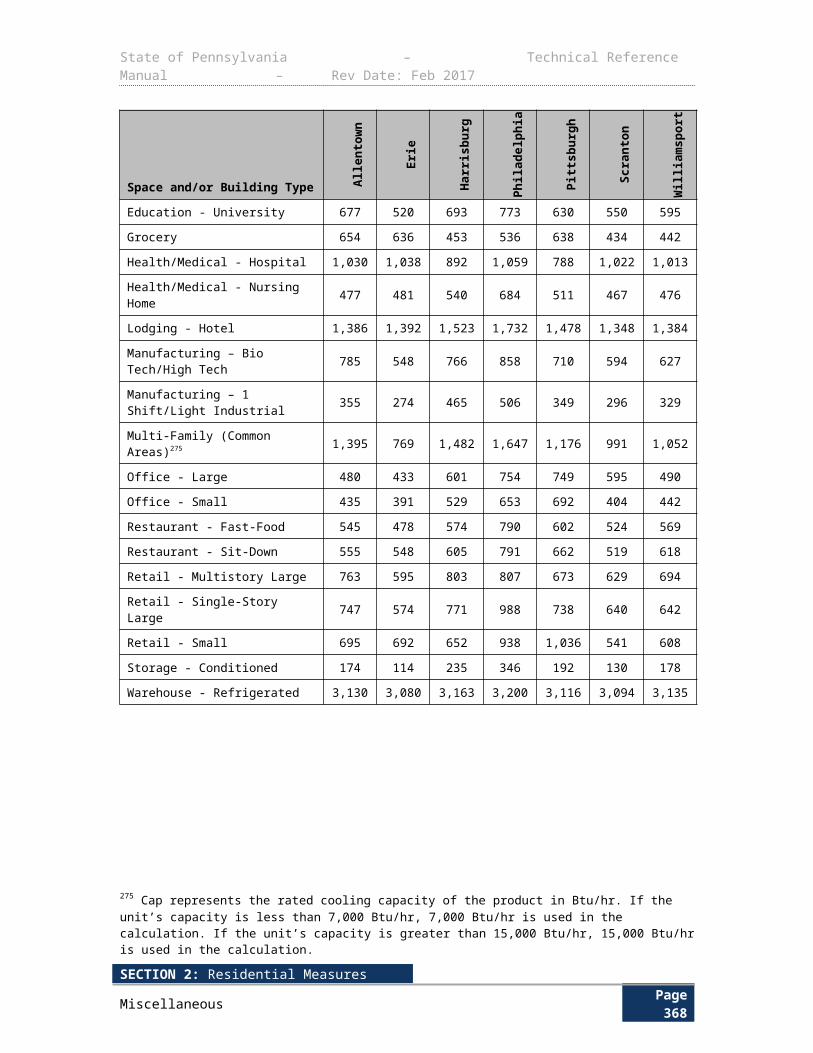
State of Pennsylvania – Technical Reference Manual – Rev Date: Feb 2017
Energy to Demand Factor The ratio of the average energy usage between 2 PM to 6 PM on summer weekdays to the total annual energy usage is taken from usage profile data collected for commercial water heaters in CA359. The usage profiles are shown in Figure 3-12. To ensure that the load shape data derived from observations in CA can be applied to PA, we compared the annual energy usage to peak demand factors for two disparate climate zones in CA. The results, shown in Figure 3-13, indicate that the ratio of peak demand to annual energy usage is not strongly influenced by climate. Also, though the actual usage profiles may be different, the average usage between 2 PM to 6 PM on summer weekdays is quite similar for all building types. The close level of agreement between disparate climate zones and building types suggest that the results will carry over to Pennsylvania360.
Figure 3-12: Load Shapes for Hot Water in Four Commercial Building Types
0
0.00005
0.0001
0.00015
0.0002
0.00025
0.0003
1 3 5 7 9 11 13 15 17 19 21 23
Frac
tion
of A
nnua
l Ene
rgy
Usa
ge
Hour of Day (Summer Weekday)
Restaurants Other Office Retail
Figure 3-13: Energy to Demand Factors for Four Commercial Building Types
0
0.00005
0.0001
0.00015
0.0002
0.00025
Coastal Climate Zone Inland Climate Zone
Dem
and
Redu
ction
to En
ergy
Savi
ngs C
onve
rsio
n Fa
ctor
(h-1 )
Restaurants Other Office Retail
D E F I N I T I O N O F T E R M S
359 Days per year pre-rinse spray valve is used at the site is assumed to be 365days/yr. 360 DEER 2014 Effective Useful Life.
SECTION 2: Residential MeasuresMiscellaneous Page 372
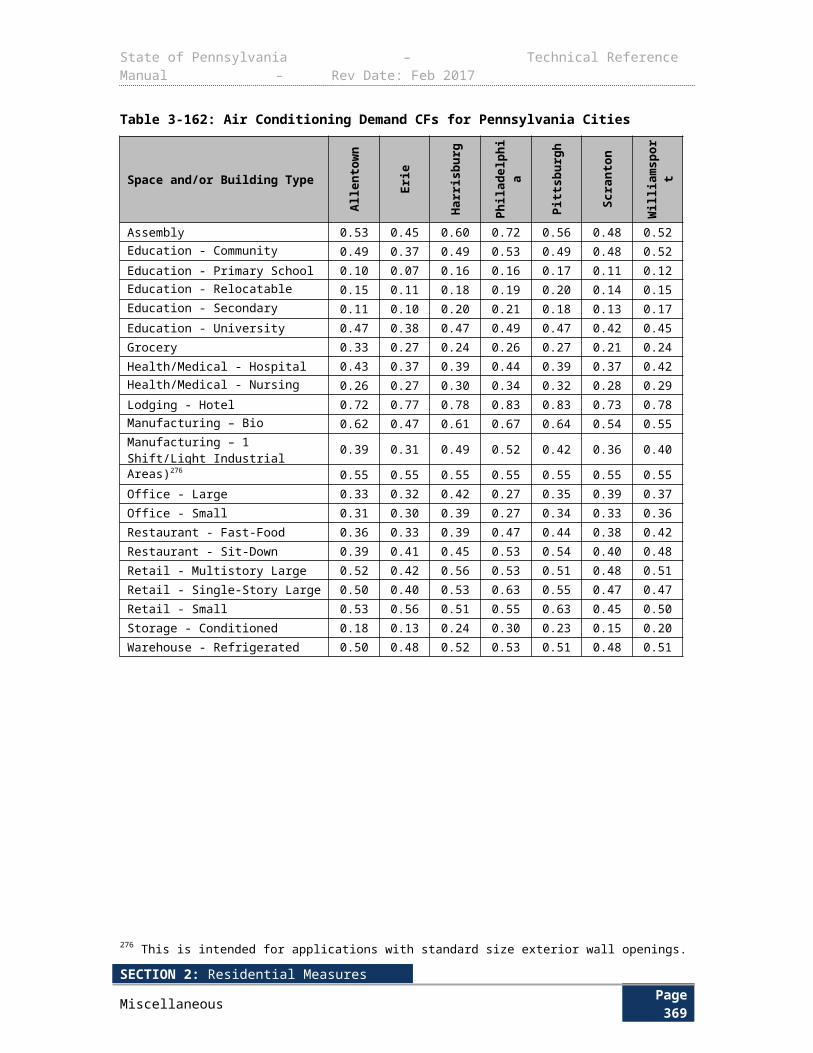
State of Pennsylvania – Technical Reference Manual – Rev Date: Feb 2017
The parameters in the above equation are listed in Table 3-213.
Table 3-213: Commercial Water Heater Fuel Switch Calculation Assumptions
Term Unit Values Source
EF base, Energy Factor of baseline water heater
None Default: See Table 3-214 1
Nameplate EDC Data Gathering
EF fuel, Energy Factor of installed fossil fuel water heater*
None Default for Natural Gas and Propane: ≤55 Gallons = 0.67,
>55 Gallons = 0.77Default for Oil: >=0.585
1, 5
Nameplate EDC Data Gathering
EFtankless water heater , Energy Factor of installed tankless water heater
None Default: >=0.90 5
Nameplate EDC Data Gathering
DF fuel, adjust, Fossil fuel water heaters derating adjustment factor
None Storage Water Heaters: 1.0
Tankless Water Heaters: 0.91
7
Typical SF , Typical square footage ft2 Default: See Table 3-205 9
EDC Data Gathering EDC Data Gathering
Load , Average annual load kBtu Default: See Table 3-205 8
EDC Data Gathering EDC Data Gathering
T hot, Temperature of hot water °F 119 2
T cold, Temperature of cold water supply
°F 55 3
HW , Average annual gallons of use Gallons Default: See Table 3-205 Calculation
EDC Data Gathering EDC Data Gathering
ETDF, Energy To Demand Factor None 0.000178 4
RDF, Resistive Discount Factor None 1.0 6
Energy Factors based on Tank SizeAs of 4/16/2015, Federal Standards for electric water heater Energy Factors are equal to 0.96−0.0003×Rated Storage(gallons) for tanks ≥20 gallons and ≤55 gallons. For tanks >55 gallons and ≤120 gallons, the minimum Energy Factor is
SECTION 2: Residential MeasuresMiscellaneous Page 373
State of Pennsylvania – Technical Reference Manual – Rev Date: Feb 2017
2.057−0.00113×Rated Storage (gallons ). The following table shows the Energy Factors for various tank sizes.
Table 3-214: Minimum Baseline Energy Factor Based on Tank Size
Tank Size (gallons) Minimum Energy Factors (EF base )
40 0.948
50 0.945
65 1.984
80 1.967
120 1.921
D E F A U L T S A V I N G S
The default savings for the replacement of an electric water heater with a fossil fuel units in various applications are listed below.
Table 3-215: Water Heating Fuel Switch Energy Savings Algorithms
Building Type ∆kWh Fuel Consumption (MMBtu)
Education59,018.78EFelec , bl
201.37( 1EF fuel ,inst
× 1DFfuel ,adjust )
Grocery3,213.67EFelec , bl
10.96( 1EF fuel ,inst
× 1DF fuel ,adjust )
Lodging20,653.28EFelec , bl
70.47( 1EF fuel ,inst
× 1DFfuel ,adjust )
Office201.46EFelec , bl
0.69( 1EF fuel ,inst
× 1DF fuel ,adjust )
Restaurant28,115.77EFelec , bl
95.93( 1EF fuel ,inst
× 1DFfuel ,adjust )
Retail66.17EFelec , bl
0.23( 1EF fuel ,inst
× 1DF fuel ,adjust )
Warehouse1,703.36EFelec , bl
5.81( 1EF fuel, inst
× 1DF fuel, adjust )
SECTION 2: Residential MeasuresMiscellaneous Page 374
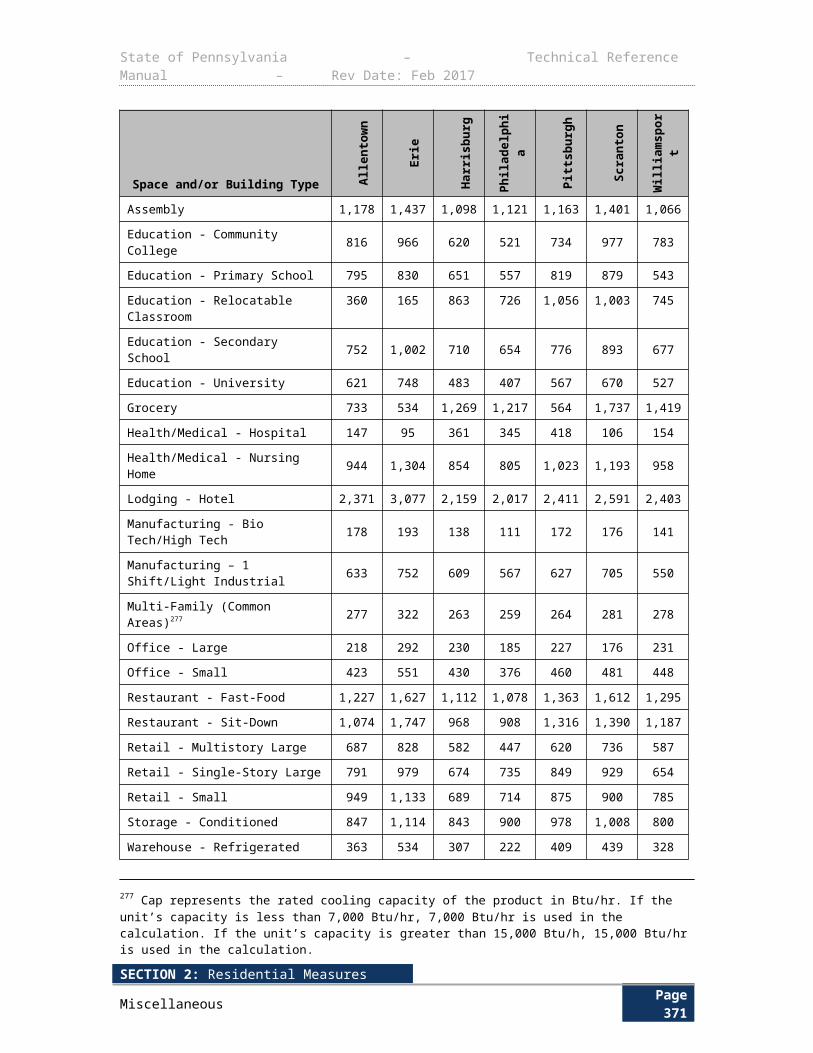
State of Pennsylvania – Technical Reference Manual – Rev Date: Feb 2017
E V A L U A T I O N P R O T O C O L S
For most projects, the appropriate evaluation protocol is to verify installation and proper selection of default values. For projects using customer specific data for open variables, the appropriate evaluation protocol is to verify installation and proper application of TRM protocol along with verification of open variables. The Pennsylvania Evaluation Framework provides specific guidelines and requirements for evaluation procedures.
S O U R C E S
1) U.S. Federal Standards for Residential Water Heaters. Effective April 16, 2015. Federal Standards are 0.68 - 0.0019 x Rated Storage in Gallons for oil. The Energy Factor for a 50-gallon oil tank is 0.585. http://www1.eere.energy.gov/buildings/appliance_standards/product.aspx/productid/27
2) 2014 SWE Residential Baseline Study. http://www.puc.pa.gov/Electric/pdf/Act129/SWE-2014_PA_Statewide_Act129_Residential_Baseline_Study.pdf
3) Mid-Atlantic TRM, footnote #24. http://www.neep.org/Assets/uploads/files/emv/emv-products/TRM_March2013Version.pdf
4) The ETDF is estimated using the California load shapes and reflects PJM’s peak demand period. The load shapes can be accessed online: http://www.ethree.com/CPUC/PG&ENonResViewer.zip
5) Commission Order361 requires fuel switching to ENERGY STAR measures, not standard efficiency measures. The Energy Factor has therefore been updated to reflect the Energy Star standard for natural gas or propane storage water heaters beginning September 1, 2010. From Residential Water Heaters Key Product Criteria Version 3.0. http://www.energystar.gov/sites/default/files/specs//ENERGY%20STAR%20Water%20Heaters%20Version%203%200%20Program%20Requirements.pdf Accessed February 2015.
6) No discount factor is needed because the baseline is already an electric resistance water heater system.
7) The disconnect between rated energy factor and in-situ energy consumption is markedly different for tankless units due to significantly higher contributions to overall household hot water usage from short draws. In tankless units the large burner and unit heat exchanger must fire and heat up for each draw. The additional energy losses incurred when the mass of the unit cools to the surrounding space in-between shorter draws was found to be 9% in a study prepared for Lawrence Berkeley National Laboratory by Davis Energy Group, 2006. “Field and Laboratory Testing of Tankless Gas Water Heater Performance” Due to the similarity (storage) between the other categories and the baseline, this derating factor is applied only to the tankless category. http://eetd.lbl.gov/sites/all/files/water_heaters_and_hot_water_distribution_systems.pdf
8) DEER 2008. Commercial Results Review Non-Updated Measures.
9) 2014 Non-Residential End Use & Saturation Study. April 4, 2014. http://www.puc.pa.gov/Electric/pdf/Act129/SWE-2014_PA_Statewide_Act129_Non-Residential_EndUse_Saturation_Study.pdf
361 http://www.aceee.org/consumer/water-heating
SECTION 2: Residential MeasuresMiscellaneous Page 375
State of Pennsylvania – Technical Reference Manual – Rev Date: Feb 2017
3.4.5 FUEL SWITCHING: HEAT PUMP WATER HEATERS TO GAS / OIL / PROPANE
Measure NameFuel Switching: Heat Pump Water Heaters to
Gas/Oil/Propane
Target Sector Commercial and Industrial Establishments
Measure Unit Gas, Oil, or Propane Heater
Unit Energy Savings Variable
Unit Peak Demand Reduction Variable
Measure Life 11 years362 for natural gas/propane
8 years363 for oil
Measure Vintage Replace on Burnout
E L I G I B I L I T Y
Natural gas, propane, and oil water heaters generally offer the customer lower costs compared to heat pump water heaters. Additionally, they typically see an overall energy savings when looking at the source energy of the electric unit versus the gas unit.
This protocol documents the energy savings attributed to converting heat pump water heaters to an ENERGY STAR natural gas/propane-fired water heater or a standard oil-fired water heater with an Energy Factor of 0.585. The measure described here involves a direct retrofit of a heat pump water heater with a fossil fuel water heater. It does not cover systems where the heat pump is a pre-heater or is combined with other water heating sources. If a customer submits a rebate for a product that has applied for ENERGY STAR Certification but has not yet been certified, the savings will be counted for that product contingent upon its eventual certification as an ENERGY STAR measure. If at any point the product is rejected by ENERGY STAR, the product is then ineligible for the program and savings will not be counted. More complicated installations can be treated as custom projects.
A L G O R I T H M S
The energy savings calculation utilizes average performance data for available heat pump water heaters and typical hot water usages. The energy savings are obtained through the following formula:
kWh ¿{(( 1EF base
× 1Fadjust
))×HW×8.3 lbgal
×1.0 Btulb∙ ° F
×(T hot – T cold)}3412 Btu
kWh
Although there is a significant electric savings, there is an associated increase in fossil fuel energy consumption. While this fossil fuel consumption does not count against PA Act 129 362 DEER 2008. Commercial Results Review Non-Updated Measures. Assumes a 40 gal natural gas water heater with a standard efficiency of 0.594.363 2014 Non-Residential End Use & Saturation Study. April 4, 2014. http://www.puc.pa.gov/Electric/pdf/Act129/SWE-2014_PA_Statewide_Act129_Non-Residential_EndUse_Saturation_Study.pdf
SECTION 2: Residential MeasuresMiscellaneous Page 376
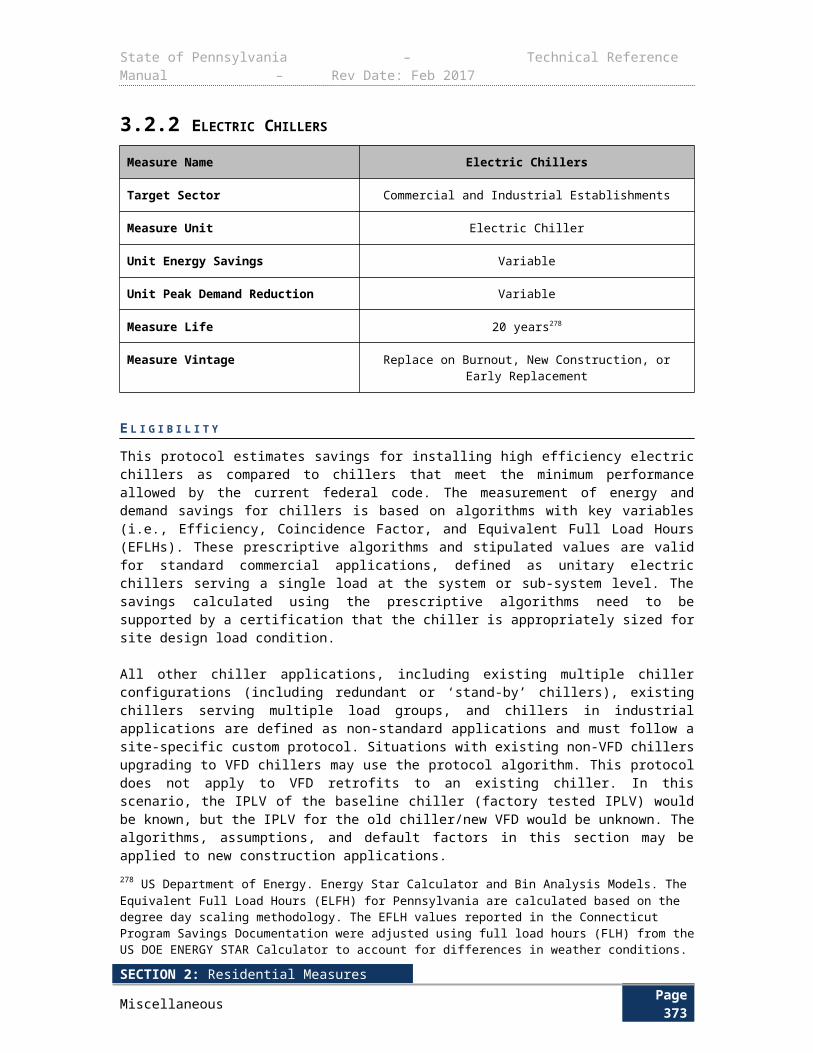
State of Pennsylvania – Technical Reference Manual – Rev Date: Feb 2017
energy savings, it is expected to be used in the program TRC test. The increased fossil fuel usage is obtained through the following formula:
Fuel Consumption
(MMBtu) ={( 1EF fuel ,inst
× 1DF fuel ,adjust )×(HW ×1.0 Btu
lb ∙° F×8.3 lb
gal× (T hot – Tcold ))}
1,000,000 BtuMMBtu
Where EF fuel changes depending on the fossil fuel used by the water heater.
For replacement of heat pump water heaters with fossil fuel units, demand savings result primarily from a reduced connected load. The demand reduction is taken as the annual energy savings multiplied by the ratio of the average energy usage between 2 PM to 6 PM on summer weekdays to the total annual energy usage.
∆ kW peak ¿ETDF× Energy Savings×RDF
The ETDF is defined below:
ETDF = Average UsageSummer WD 2-6 PM
Annual Energy Usage
Loads
The annual gallons of use is calculated using average annual heating load ( kBtuft2 ) from the
DEER database364 and average square footage from the 2014 Statewide Non-Residential End Use & Saturation Study365. Average square footage for each building type is calculated by dividing
the Pennsylvania 2012 kWh sales by the energy use intensity ( kWhft2 ) and premise count. The
DEER database has data for gas energy usage for the domestic hot water end use for various small commercial buildings. The loads are averaged over all 16 climate zones and all six vintage types in the DEER database. Finally, the loads are converted to average annual gallons of use using the algorithm below.
HW (Gallons) = Load×EF ng ,base×1,000 Btu
kBtu×Typical SF
1 Btulb∙ ° F
× 8.3 lbgal
× (Thot –T cold )×1,000 SF
Energy to Demand Factor (ETDF)The ratio of the average energy usage between 2 PM to 6 PM on summer weekdays to the total annual energy usage is taken from usage profile data collected for commercial water heaters in
364 ibid365 One reason for the close agreement is that the factor is a ratio of the energy usage to peak demand for the same location. Even though the energy usages may vary significantly in different climate zones, the hot water usage patterns may be driven by underlying practices that carry over well from state to state (e.g. dishwashing after lunch or dinner in restaurants).
SECTION 2: Residential MeasuresMiscellaneous Page 377
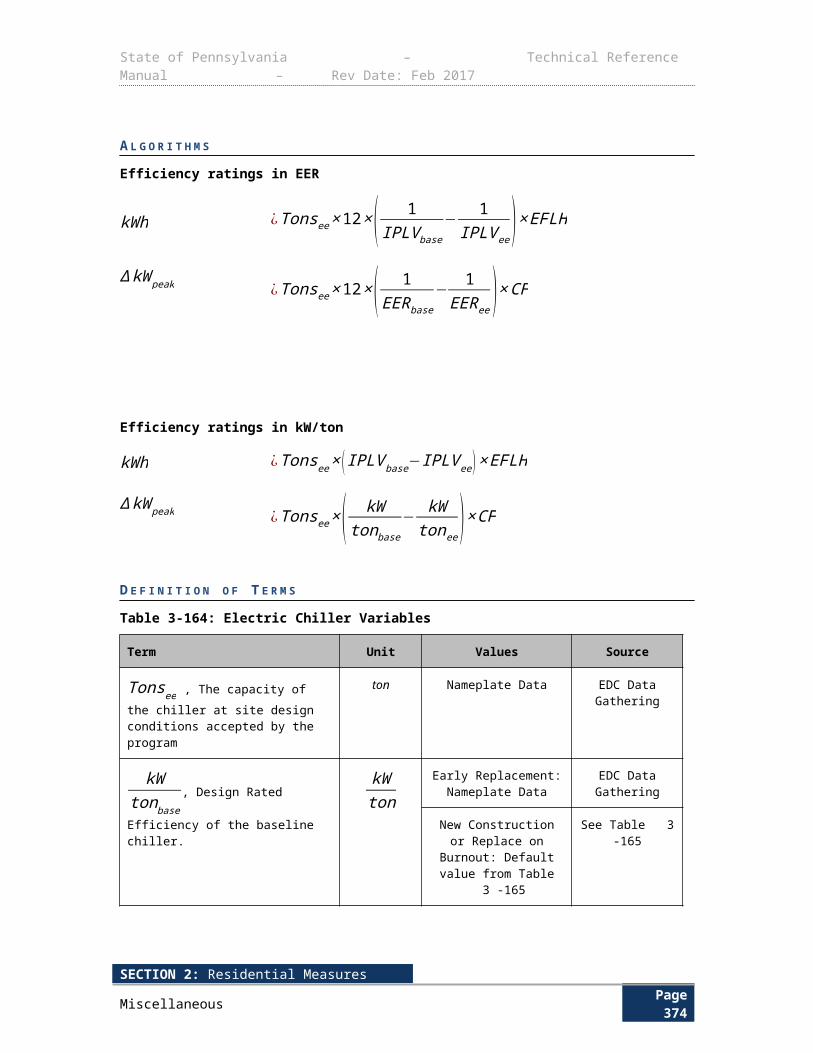
State of Pennsylvania – Technical Reference Manual – Rev Date: Feb 2017
CA366. The usage profiles are shown in Figure 3-14. To ensure that the load shape data derived from observations in CA can be applied to PA, we compared the annual energy usage to peak demand factors for two disparate climate zones in CA. The results, shown in Figure 3-15, indicate that the ratio of peak demand to annual energy usage is not strongly influenced by climate. Also, though the actual usage profiles may be different, the average usage between 2 PM to 6 PM on summer weekdays is quite similar for all building types. The close level of agreement between disparate climate zones and building types suggest that the results will carry over to Pennsylvania.367
Figure 3-14: Load Shapes for Hot Water in Four Commercial Building Types
0
0.00005
0.0001
0.00015
0.0002
0.00025
0.0003
1 3 5 7 9 11 13 15 17 19 21 23
Frac
tion
of A
nnua
l Ene
rgy
Usa
ge
Hour of Day (Summer Weekday)
Restaurants Other Office Retail
Figure 3-15: Energy to Demand Factors for Four Commercial Building Types
0
0.00005
0.0001
0.00015
0.0002
0.00025
Coastal Climate Zone Inland Climate Zone
Dem
and
Redu
ction
to En
ergy
Savi
ngs C
onve
rsio
n Fa
ctor
(h-1 )
Restaurants Other Office Retail
Resistive Heating Discount Factor
366 See page 42 of the 2013 TRC Test Final Order 367 DEER 2014 Effective Useful Life.
SECTION 2: Residential MeasuresMiscellaneous Page 378
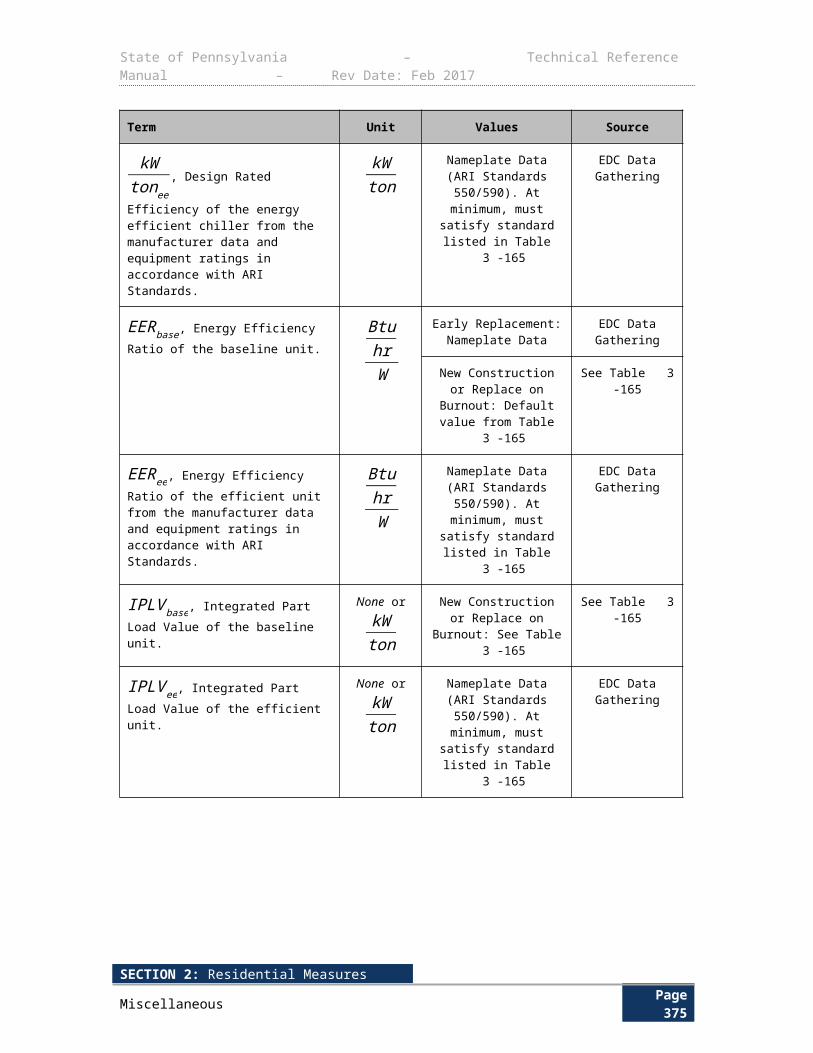
State of Pennsylvania – Technical Reference Manual – Rev Date: Feb 2017
The resistive heating discount factor is an attempt to account for possible increased reliance on back-up resistive heating elements during peak usage conditions. Although a brief literature review failed to find data that may lead to a quantitative adjustment, two elements of the demand reduction calculation are worth considering.
The hot water temperature in this calculation is somewhat conservative at 119 °F.
The peak usage window is eight hours long.
In conditioned space, heat pump capacity is somewhat higher in the peak summer window.
In unconditioned space, heat pump capacity is dramatically higher in the peak summer window.
Under these operating conditions, one would expect a properly sized heat pump water heater with adequate storage capacity to require minimal reliance on resistive heating elements. A resistive heating discount factor of 0.9, corresponding to a 10% reduction in COP during peak times, is therefore taken as a conservative estimation for this adjustment.
Heat Pump COP Adjustment FactorThe Energy Factors are determined from a DOE testing procedure that is carried out at 56 °F wetbulb temperature. However, the average wetbulb temperature in PA is closer to 45 °F368, while the average wetbulb temperature in conditioned typically ranges from 50 °F to 80 °F. The heat pump performance is temperature dependent. Figure 3-16 below shows relative coefficient of performance (COP) compared to the COP at rated conditions369. According to the plotted profile, the following adjustments are recommended.
Table 3-216: COP Adjustment Factors
Heat Pump Placement Typical WB Temperature °F COP Adjustment Factor
Unconditioned Space 44 0.80
Conditioned Space 63 1.09
Kitchen 80 1.30
368 http://www.aceee.org/consumer/water-heating 369 DEER 2008. Commercial Results Review Non-Updated Measures. Assumes a 40 gal natural gas water heater with a standard efficiency of 0.594.
SECTION 2: Residential MeasuresMiscellaneous Page 379
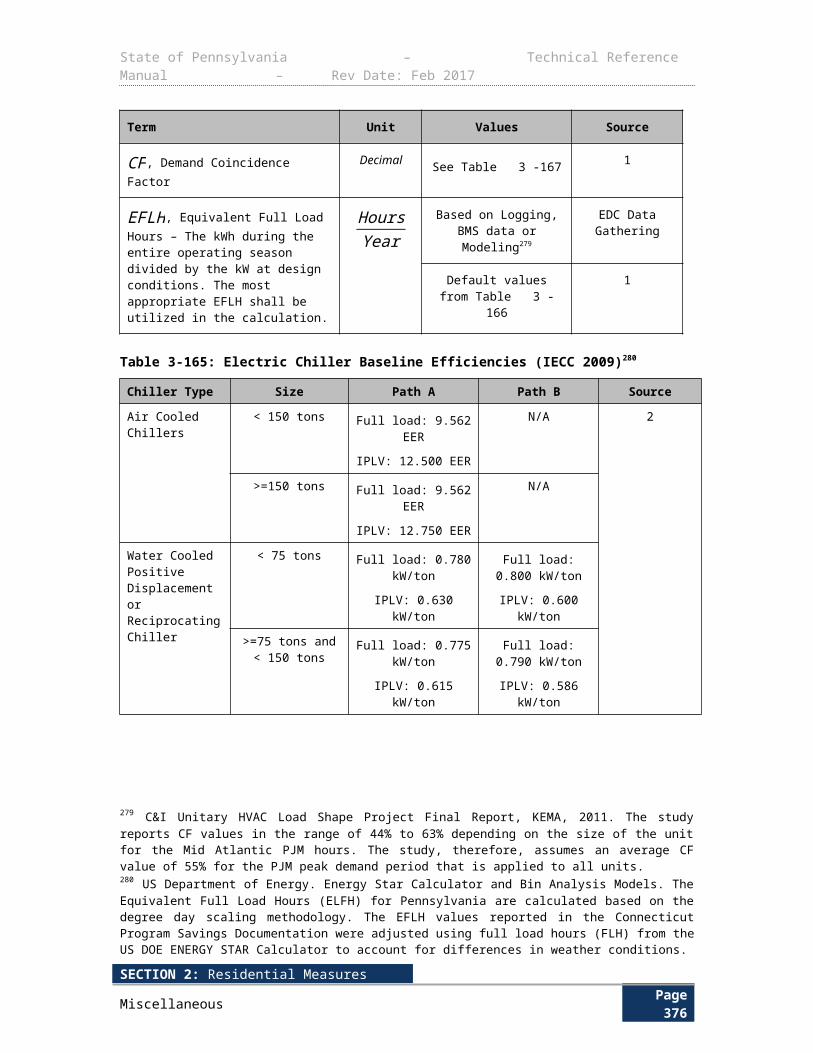
State of Pennsylvania – Technical Reference Manual – Rev Date: Feb 2017
Figure 3-16: Dependence of COP on Outdoor Wetbulb Temperature
y = -8.750E-05x2 + 2.461E-02x - 1.117E-01R² = 9.980E-01
0
0.2
0.4
0.6
0.8
1
1.2
1.4
1.6
30 40 50 60 70 80 90
COP
divi
ded
by C
OP
at 5
6 F
WB
Wetbulb Temperature (F)
COP vs Temperature
D E F I N I T I O N O F T E R M S
The parameters in the above equation are listed in Table 3-217.
SECTION 2: Residential MeasuresMiscellaneous Page 380
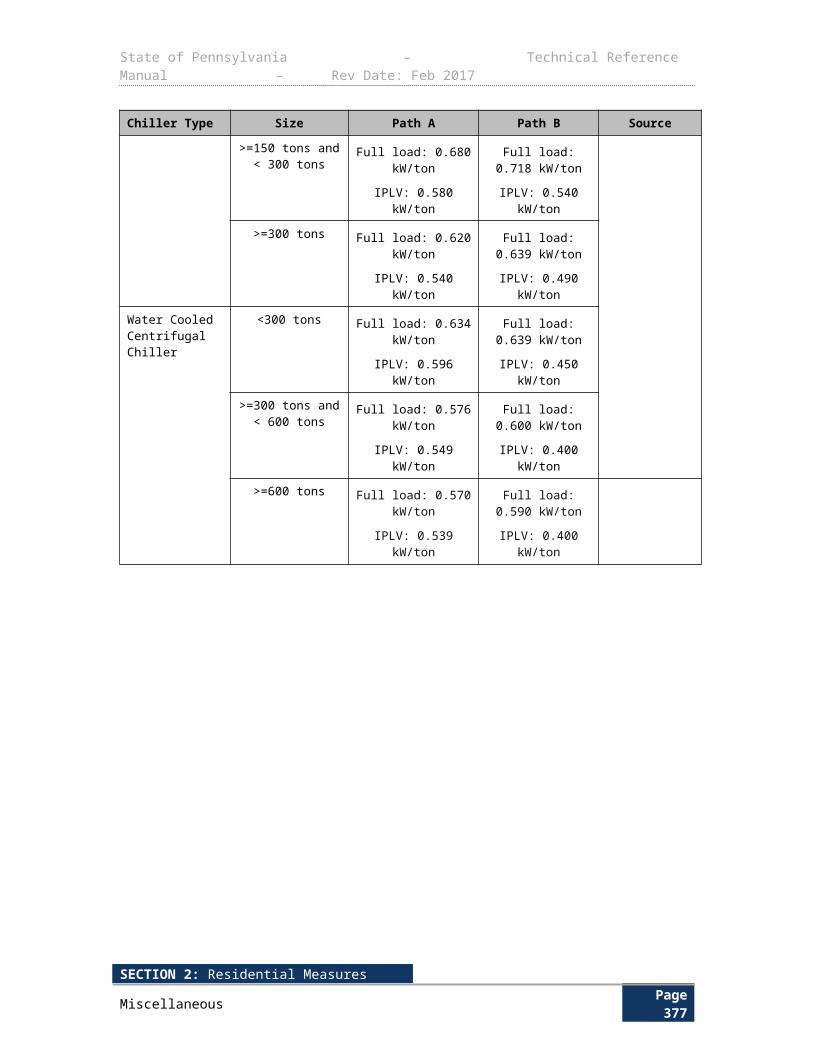
State of Pennsylvania – Technical Reference Manual – Rev Date: Feb 2017
Table 3-217: Heat Pump Water Heater Fuel Switch Calculation Assumptions
Term Unit Values Source
EF base, Energy Factor of baseline water heater
None Default: See Table 3-218 1
Nameplate EDC Data Gathering
EF fuel, Energy Factor of installed fossil fuel water heater*
None Default for Natural Gas and Propane: ≤55 Gallons = 0.67,
>55 Gallons = 0.77Default for Oil: >=0.585
1,7
Nameplate EDC Data Gathering
EFtankless water heater , Energy Factor of installed tankless water heater
None Default: >=0.90 7
Nameplate EDC Data Gathering
DF fuel, adjust, Fossil Fuel Water Heaters Derating Adjustment factor
None Storage Water Heaters: 1.0
Tankless Water Heaters: 0.91
8
Load , Average annual load
kBtu Default: See Table 3-205 5
EDC Data Gathering EDC Data Gathering
Typical SF , Typical square footage ft2 Default: See Table 3-205 8
EDC Data Gathering EDC Data Gathering
T hot, Temperature of hot water °F 119 2
T cold, Temperature of cold water supply
°F 55 3
ETDF, Energy To Demand Factor None 0.000178 4
Fadjust,COP Adjustment factor
None 0.80 if outdoor
1.09 if indoor
1.30 if in kitchen
4
HW, Average annual gallons of use
Gallons Default: See Table 3-205 Calculation
EDC Data Gathering EDC Data Gathering
RDF, Resistive Discount Factor None 0.90 6
Energy Factors based on Tank Size
SECTION 2: Residential MeasuresMiscellaneous Page 381
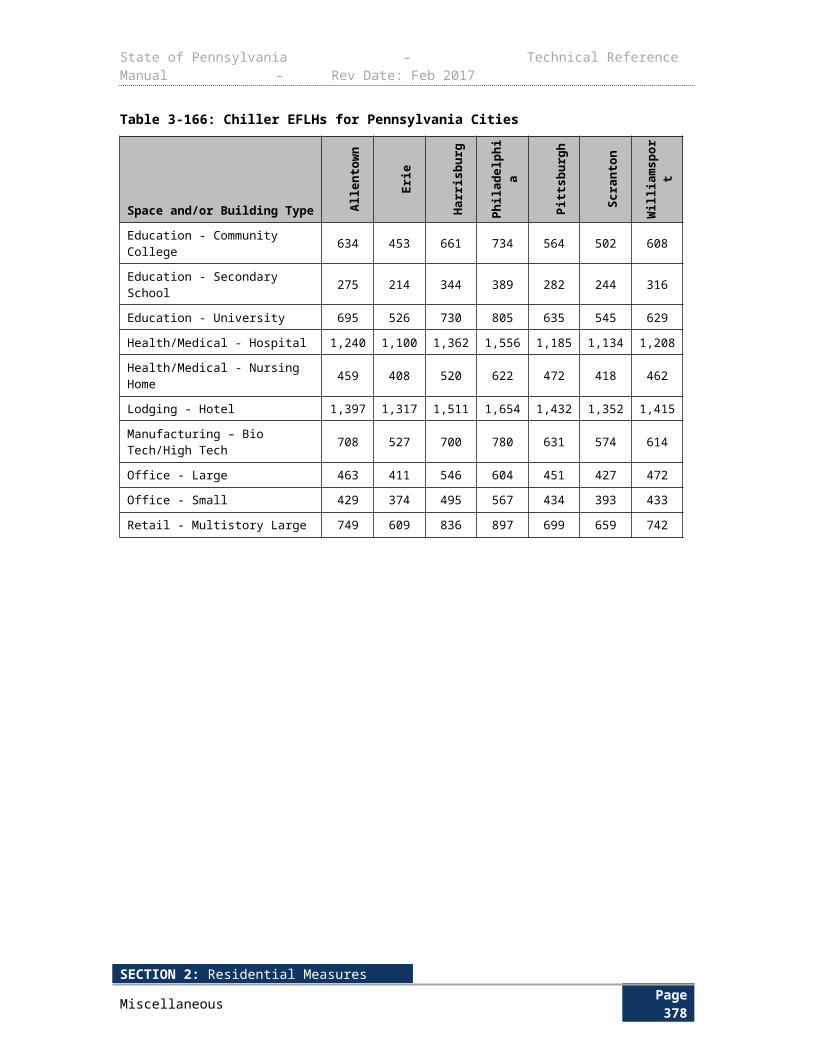
State of Pennsylvania – Technical Reference Manual – Rev Date: Feb 2017
As of 4/16/2015, Federal Standards for electric water heater Energy Factors are equal to 0.96−0.0003×Rated Storage(gallons) for tanks ≥20 gallons and ≤55 gallons. For tanks >55 gallons and ≤120 gallons, the minimum Energy Factor is 2.057−0.00113×Rated Storage (gallons ). The following table shows the Energy Factors for various tank sizes.
Table 3-218: Minimum Baseline Energy Factors Based on Tank Size
Tank Size (gallons) Minimum Energy Factors (EF base)
40 0.948
50 0.945
65 1.984
80 1.967
120 1.921
D E F A U L T S A V I N G S
The default savings for the replacement of heat pump electric water heaters with fossil fuel units in various applications are listed below.
Table 3-219: Energy Savings Algorithms
Building TypeLocation Installed ∆ kWh Fuel Consumption (MMBtu)
Education Outdoor 73,773.47EFelec , bl
201.37( 1EF fuel ,inst
× 1DFfuel ,adjust )
Education Indoor 54,145.67EFelec , bl
Education Kitchen 45,399.06EF elec ,bl
Grocery Outdoor 4,017.08EF elec ,bl
10.97( 1EF fuel ,inst
× 1DFfuel ,adjust )
Grocery Indoor 2,948.32EFelec , bl
Grocery Kitchen 2,472.05EFelec , bl
Lodging Outdoor 25,816.60EFelec , bl
SECTION 2: Residential MeasuresMiscellaneous Page 382
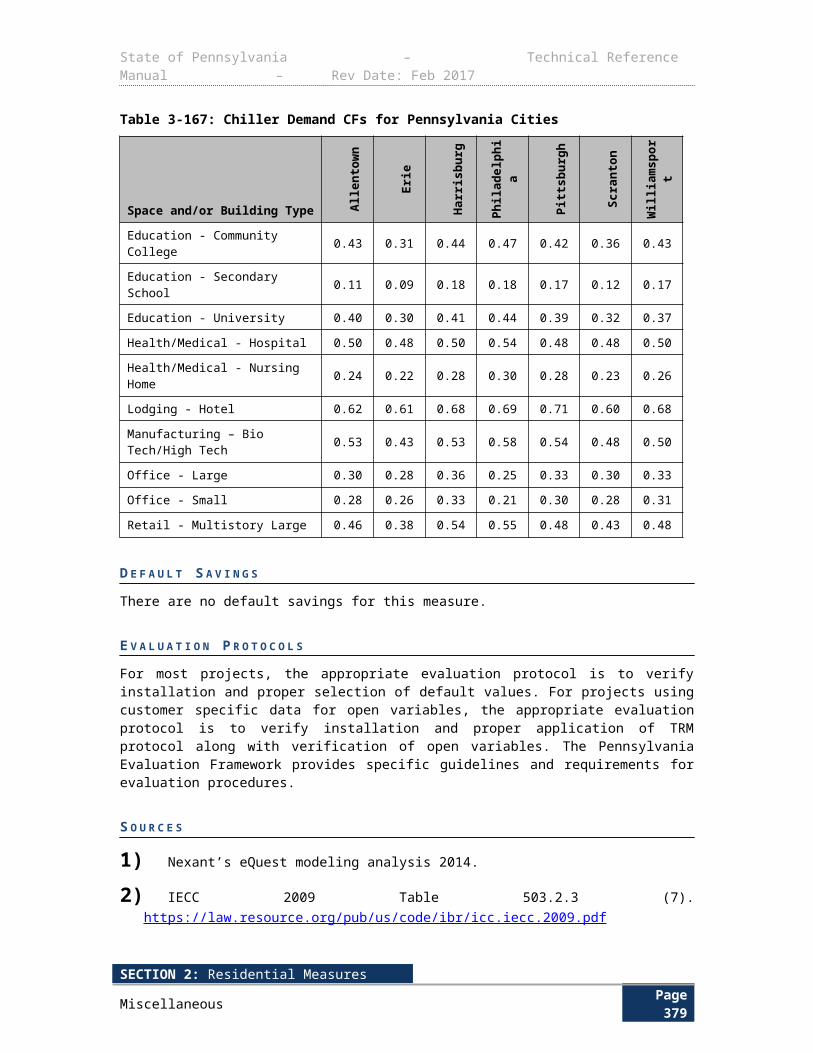
State of Pennsylvania – Technical Reference Manual – Rev Date: Feb 2017
Building TypeLocation Installed ∆ kWh Fuel Consumption (MMBtu)
70.47( 1EF fuel ,inst
× 1DFfuel ,adjust )
Lodging Indoor 18,947.96EFelec , bl
Lodging Kitchen 15,887.14EF elec, bl
Office Outdoor 251.82EFelec , bl
0.69( 1EF fuel ,inst
× 1DF fuel ,adjust )
Office Indoor 184.82EFelec , bl
Office Kitchen 154.97EFelec , bl
Restaurant Outdoor 35,144.71EFelec , bl
95.93( 1EF fuel ,inst
× 1DFfuel ,adjust )
Restaurant Indoor 25,794.28EFelec , bl
Restaurant Kitchen 21,627.51EFelec , bl
Retail Outdoor 82.71EFelec , bl
0.23( 1EF fuel ,inst
× 1DF fuel ,adjust )
Retail Indoor 60.70EFelec , bl
Retail Kitchen 50.90EFelec , bl
Warehouse Outdoor 2,129.20EFelec , bl
5.81( 1EF fuel, inst
× 1DF fuel, adjust )
Warehouse Indoor 1,562.71EFelec , bl
Warehouse Kitchen 1,310.28EFelec , bl
SECTION 2: Residential MeasuresMiscellaneous Page 383
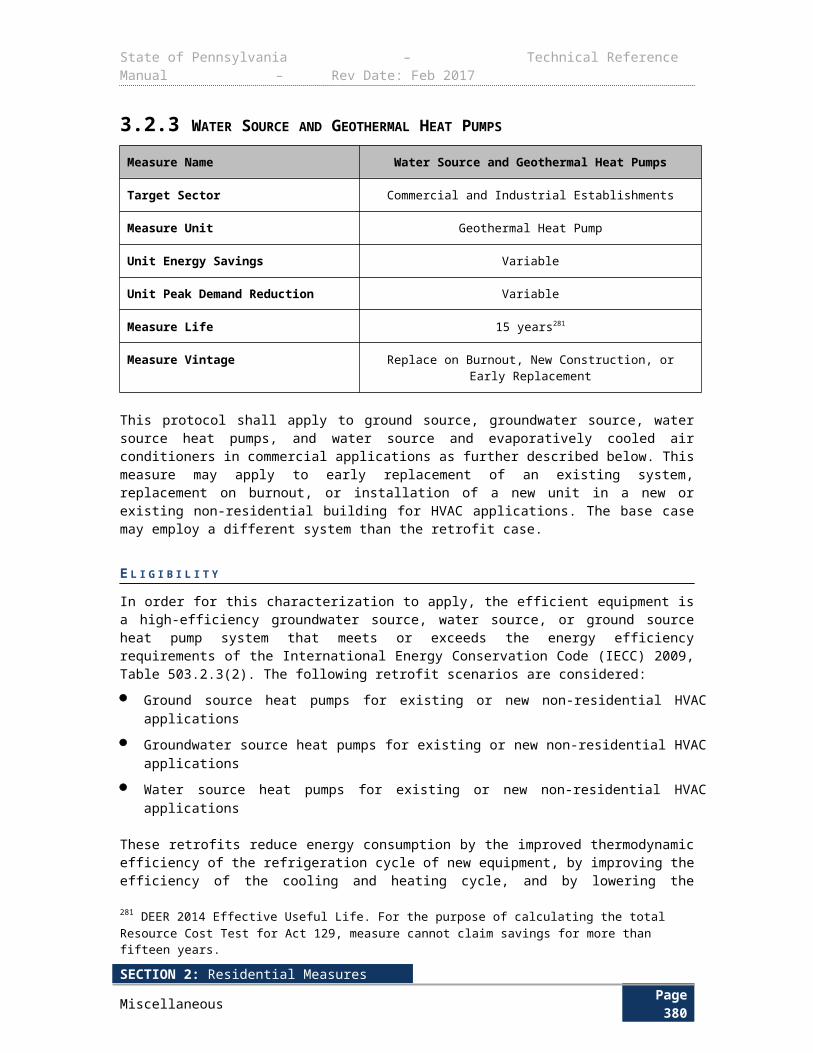
State of Pennsylvania – Technical Reference Manual – Rev Date: Feb 2017
E V A L U A T I O N P R O T O C O L S
For most projects, the appropriate evaluation protocol is to verify installation and proper selection of default values. For projects using customer specific data for open variables, the appropriate evaluation protocol is to verify installation and proper application of TRM protocol along with verification of open variables. The Pennsylvania Evaluation Framework provides specific guidelines and requirements for evaluation procedures.
S O U R C E S
1) U.S. Federal Standards for Residential Water Heaters. Effective April 16, 2015. Federal Standards are 0.68 – 0.0019 x Rated Storage in Gallons for oil. The Energy Factor for a 50-gallon oil tank is 0.585. http://www1.eere.energy.gov/buildings/appliance_standards/product.aspx/productid/27
2) 2014 SWE Residential Baseline Study http://www.puc.pa.gov/Electric/pdf/Act129/SWE-2014_PA_Statewide_Act129_Residential_Baseline_Study.pdf
3) Mid-Atlantic TRM Version 3.0, March 2013, footnote #314. http://www.neep.org/Assets/uploads/files/emv/emv-products/TRM_March2013Version.pdf
4) The ETDF is estimated using the California load shapes and reflects PJM’s peak demand period. The load shapes can be accessed online: http://www.ethree.com/CPUC/PG&ENonResViewer.zip
5) DEER 2008. Commercial Results Review Non-Updated Measures.
6) Engineering Estimate
7) Commission Order370 requires fuel switching to ENERGY STAR measures, not standard efficiency measures. The Energy Factor has therefore been updated to reflect the ENERGY STAR standard for natural gas or propane storage water heaters beginning September 1, 2010. From Residential Water Heaters Key Product Criteria Version 3.0. http://www.energystar.gov/sites/default/files/specs//ENERGY%20STAR%20Water%20Heaters%20Version%203%200%20Program%20Requirements.pdf Accessed February 2015.
8) The disconnect between rated energy factor and in-situ energy consumption is markedly different for tankless units due to significantly higher contributions to overall household hot water usage from short draws. In tankless units the large burner and unit heat exchanger must fire and heat up for each draw. The additional energy losses incurred when the mass of the unit cools to the surrounding space in-between shorter draws was found to be 9% in a study prepared for Lawrence Berkeley National Laboratory by Davis Energy Group, 2006. “Field and Laboratory Testing of Tankless Gas Water Heater Performance” Due to the similarity (storage) between the other categories and the baseline, this derating factor is applied only to the tankless category. http://eetd.lbl.gov/sites/all/files/water_heaters_and_hot_water_distribution_systems.pdf
9) 2014 Non-Residential End Use & Saturation Study. April 4, 2014. http://www.puc.pa.gov/Electric/pdf/Act129/SWE-2014_PA_Statewide_Act129_Non-Residential_EndUse_Saturation_Study.pdf
370 2014 Non-Residential End Use & Saturation Study. April 4, 2014. http://www.puc.pa.gov/Electric/pdf/Act129/SWE-2014_PA_Statewide_Act129_Non-Residential_EndUse_Saturation_Study.pdf
SECTION 2: Residential MeasuresMiscellaneous Page 384
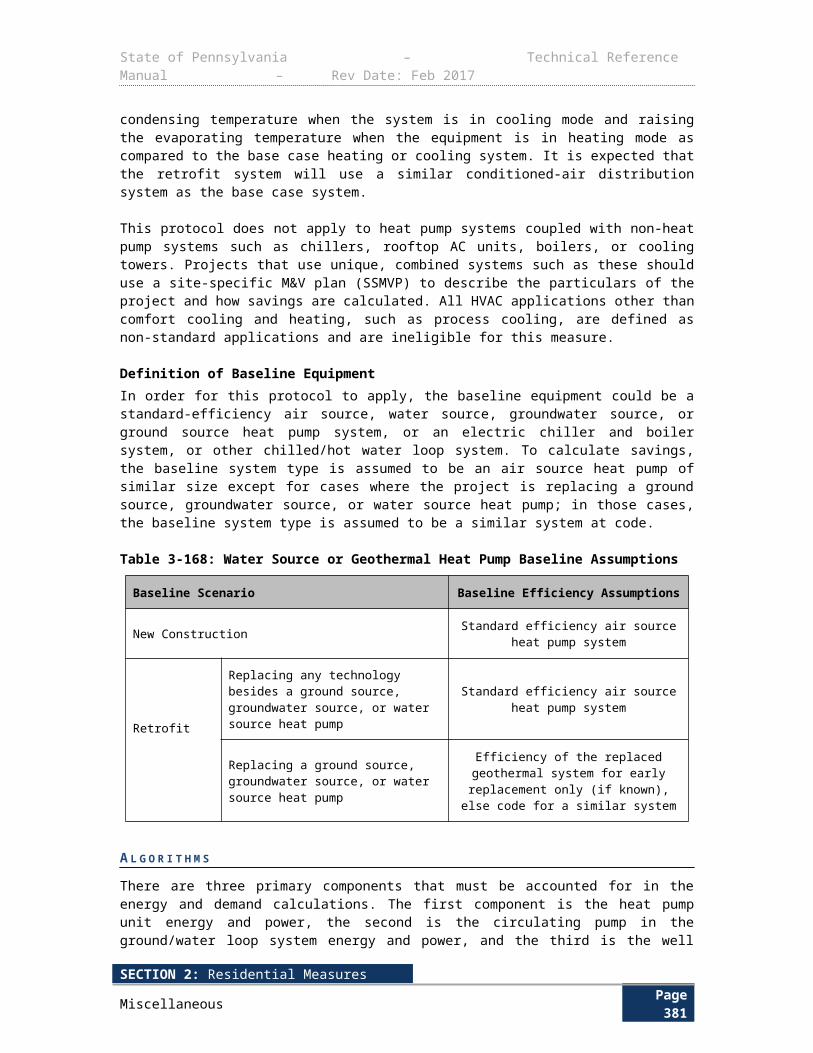
State of Pennsylvania – Technical Reference Manual – Rev Date: Feb 2017
SECTION 2: Residential MeasuresMiscellaneous Page 385
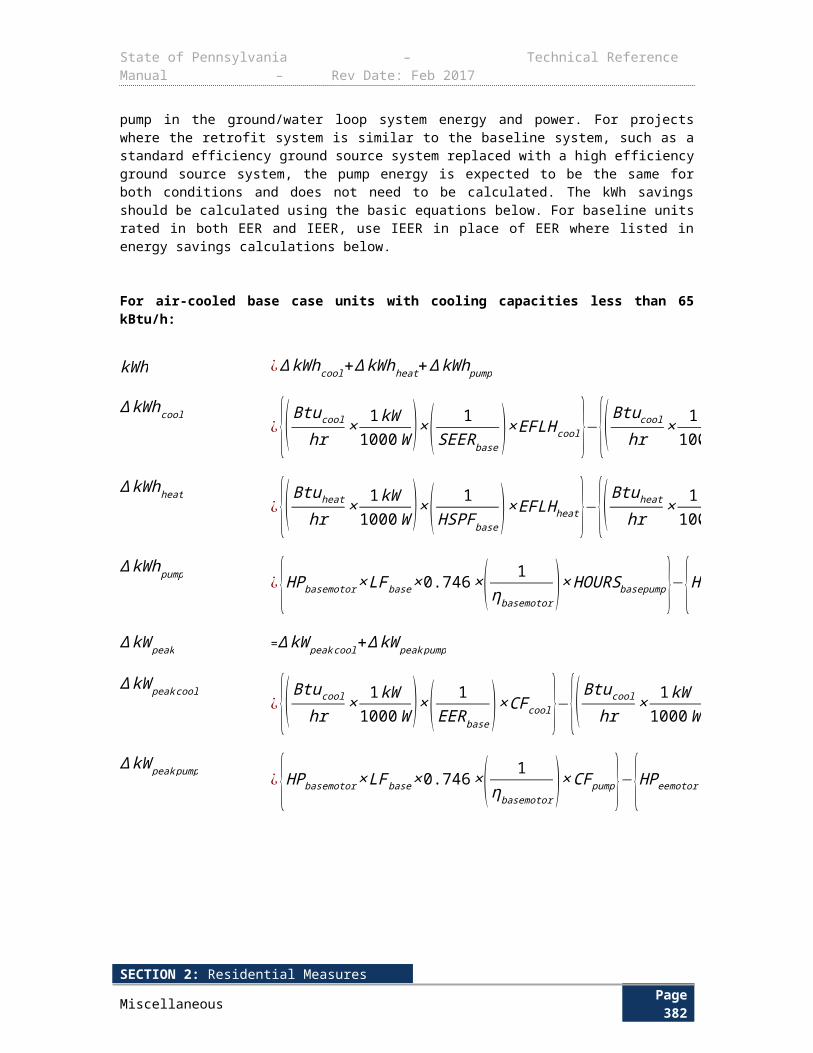
State of Pennsylvania – Technical Reference Manual – Rev Date: Feb 2017
3.5 REFRIGERATION3.5.1 HIGH-EFFICIENCY REFRIGERATION/FREEZER CASES
Measure Name High-Efficiency Refrigeration/Freezer Cases
Target Sector Commercial and Industrial Establishments
Measure Unit Refrigeration/Freezer Case
Unit Energy Savings Variable
Unit Peak Demand Reduction Variable
Measure Life 12 years371
Measure Vintage Replace on Burnout
E L I G I B I L I T Y
This protocol estimates savings for installing high efficiency refrigeration and freezer cases that exceed federal efficiency standards. Eligible refrigerators and freezers are self-contained with vertical-closed transparent or solid doors. The measurement of energy and demand savings is based on algorithms with volume as the key variable.
A L G O R I T H M S
kWh ¿ (kWhbase−kWhee )× daysyear
∆ kW peak¿
(kWhbase−kWhee )24
371 DEER 2008. Commercial Results Review Non-Updated Measures.
SECTION 2: Residential MeasuresMiscellaneous Page 386
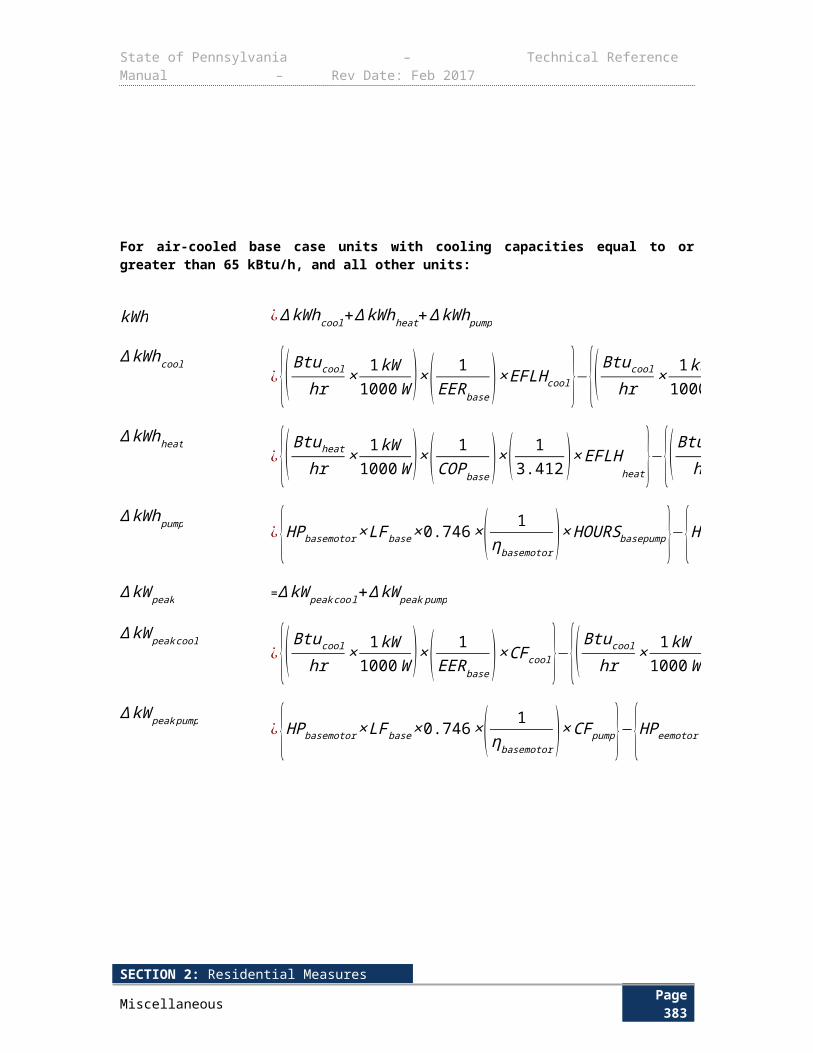
State of Pennsylvania – Technical Reference Manual – Rev Date: Feb 2017
D E F I N I T I O N O F T E R M S
Table 3-220: Refrigeration Cases - References
Term Unit Values Source
kWhbase, The unit energy consumption of a standard unit
kWhday
See Table 3-221 1
kWhee, The unit energy consumption of the ENERGY STAR-qualified unit
kWhday
See Table 3-221 2
V , Internal Volume ft3 EDC data gathering EDC data gathering
daysyear
, days per yeardaysyear
365 Conversion Factor
Table 3-221: Refrigeration & Freezer Case Efficiencies (PY8)
Refrigerators
Volume ( ft3 )
Glass Door Solid Door
kWheeday
kWhbaseday
kWheeday
kWhbaseday
V < 15 0.118*V + 1.382 0.12*V + 3.34 0.089*V + 1.411 0.10*V + 2.04
15 ≤ V < 30 0.140*V + 1.050 0.037*V + 2.200
30 ≤ V < 50 0.088*V + 2.625 0.056*V + 1.635
50 ≤ V 0.110*V + 1.50 0.060*V + 1.416
Freezers
Volume ( ft3 )
Glass Door Solid Door
kWheeday
kWhbaseday
kWheeday
kWhbaseday
V < 15 0.607*V+0.893 0.75*V + 4.10 0.250*V + 1.25 0.4*V + 1.38
15 ≤ V < 30 0.733*V - 1.00 0.40*V – 1.00
30 ≤ V < 50 0.250*V + 13.50 0.163*V + 6.125
50 ≤ V 0.450*V + 3.50 0.158*V + 6.333
SECTION 2: Residential MeasuresMiscellaneous Page 387
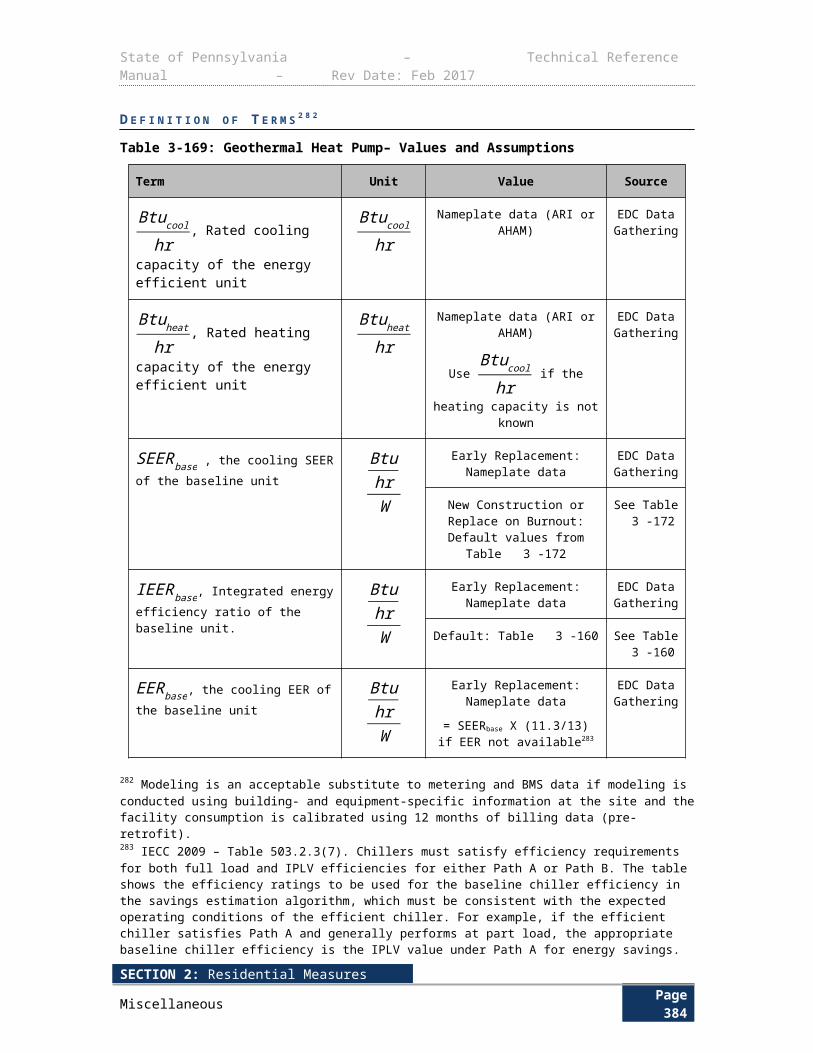
State of Pennsylvania – Technical Reference Manual – Rev Date: Feb 2017
D E F A U L T S A V I N G S
If precise case volume is unknown, default savings given in tables below can be used.
Table 3-222: Refrigeration Case Savings (PY8)
Volume ( ft3 )Annual Energy Savings (kWh) Demand Impacts (kW)
Glass Door Solid Door Glass Door Solid Door
V < 15 722 268 0.0636 0.0236
15 ≤ V < 30 683 424 0.0602 0.0374
30 ≤ V < 50 763 838 0.0672 0.0739
50 ≤ V 927 1,205 0.0817 0.1062
Table 3-223: Freezer Case Savings (PY8)
Volume (ft3)
Annual Energy Savings (kWh) Demand Impacts (kW)
Glass Door Solid Door Glass Door Solid Door
V < 15 1,901 814 0.1675 0.0717
15 ≤ V < 30 1,992 869 0.1756 0.0766
30 ≤ V < 50 4,417 1,988 0.3893 0.1752
50 ≤ V 6,680 3,405 0.5887 0.3001
F U T U R E S T A N D A R D S C H A N G E S
The Department of Energy (DOE) published a final rule on March 28, 2014 adopting more stringent energy conservation standards for commercial refrigerator and freezers. Compliance with the new standards is required on March 27, 2017. As stated in Section 1.7, if a new federal standard is effective in January, the changes will be reflected in the TRM to be released in the following program year. Therefore, the new standards will be effective from June 1, 2017 (PY9) until the end of Phase III (PY12) provided that there are no additional code changes.
Table 3-224: Refrigerator and Freezer Case Baseline Efficiencies (PY9-PY12)372
Transparent Door Solid Door
Refrigerator Freezer Refrigerator Freezer
0.1*V + 0.86 0.29*V + 2.95 0.05*V + 1.36 0.22*V + 1.38
There are no default savings for PY9-PY12 measures
372 One reason for the close agreement is that the factor is a ratio of the energy usage to peak demand for the same location. Even though the energy usages may vary significantly in different climate zones, the hot water usage patterns may be driven by underlying practices that carry over well from state to state (e.g. dishwashing after lunch or dinner in restaurants).
SECTION 2: Residential MeasuresMiscellaneous Page 388
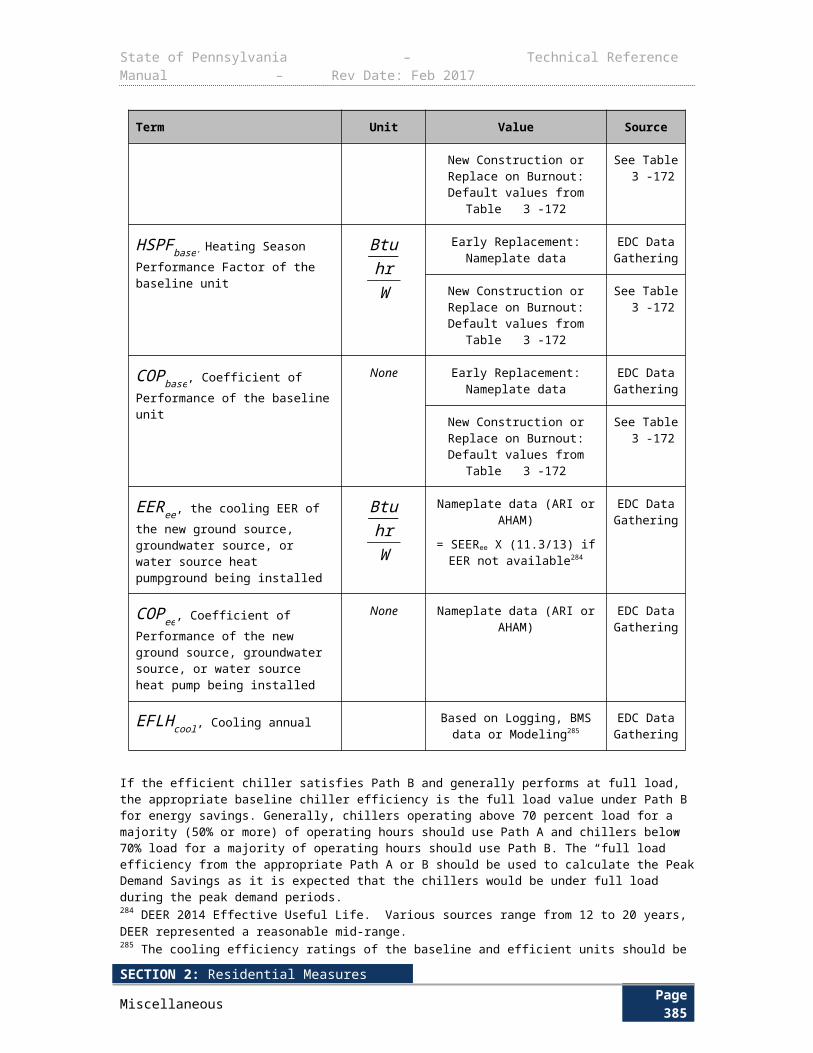
State of Pennsylvania – Technical Reference Manual – Rev Date: Feb 2017
E V A L U A T I O N P R O T O C O L S
For most projects, the appropriate evaluation protocol is to verify installation and proper selection of default values. For projects using customer specific data for open variables, the appropriate evaluation protocol is to verify installation and proper application of TRM protocol along with verification of open variables. The Pennsylvania Evaluation Framework provides specific guidelines and requirements for evaluation procedures.
S O U R C E S
1) Energy Conservation Program: Energy Conservation Standards for Commercial Refrigerators, Freezers, and Refrigerator-Freezers. Pg. 538 http://www.gpo.gov/fdsys/pkg/CFR-2012-title10-vol3/pdf/CFR-2012-title10-vol3-sec431-66.pdf
2) ENERGY STAR Program Requirements for Commercial Refrigerators and Freezers. Version 2.1 http://www.energystar.gov/sites/default/files/specs//private/Commercial_Refrigerator_and_Freezer_Program_Requirements%20v2_1.pdf
3) Northeast Energy Efficiency Partnerships, Mid Atlantic TRM Version 3.0. March 2013. Calculated from Itron eShapes, which is 8760 hourly data by end use for Update New York. http://issuu.com/neepenergy/docs/trm_march2013version/286?e=12509042/8424791
SECTION 2: Residential MeasuresMiscellaneous Page 389
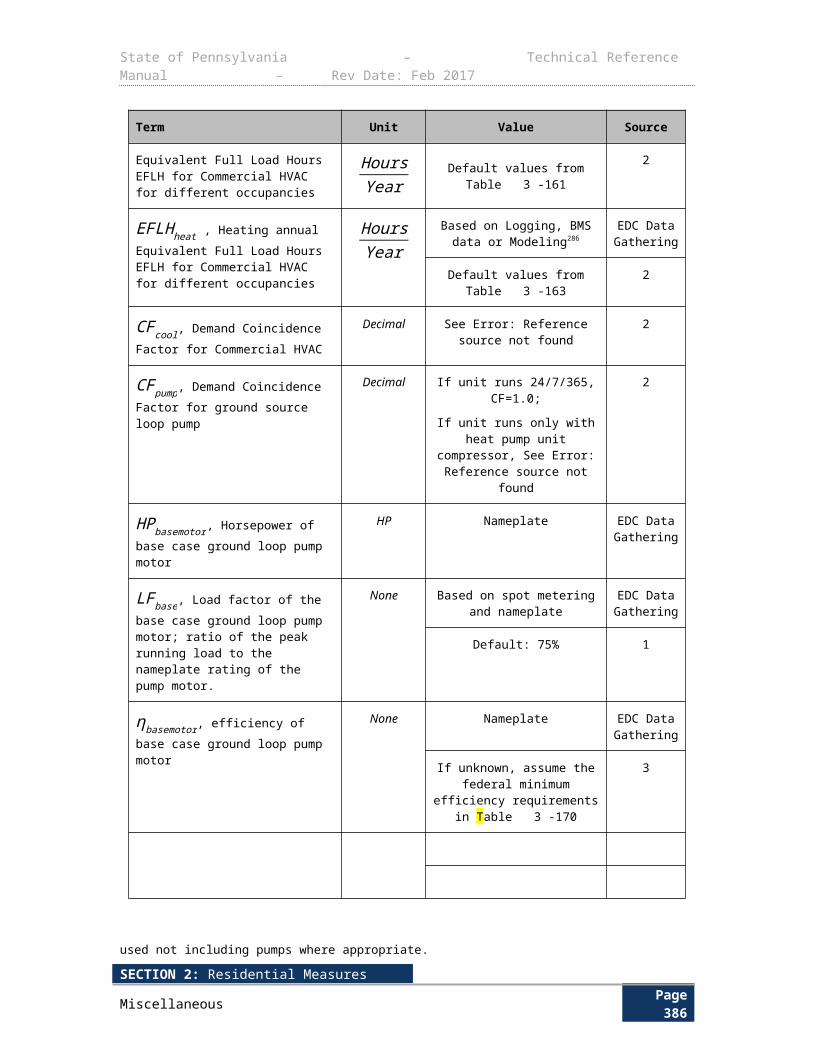
State of Pennsylvania – Technical Reference Manual – Rev Date: Feb 2017
3.5.2 HIGH-EFFICIENCY EVAPORATOR FAN MOTORS FOR REACH-IN REFRIGERATED CASES
Measure NameHigh-Efficiency Evaporator Fan Motors for Reach-In
Refrigerated Cases
Target Sector Commercial and Industrial Establishments
Measure Unit Evaporator Fan Motor
Unit Energy Savings Variable
Unit Peak Demand Reduction Variable
Measure Life 15 years373
Measure Vintage Early Replacement
E L I G I B I L I T Y
This protocol covers energy and demand savings associated with the replacement of existing shaded-pole evaporator fan motors or Permanent Split Capacitor (PSC) motors in reach-in refrigerated display cases with an Electronically Commutated (ECM). This measure is not applicable for new construction or replace on burnout projects. A default savings option is offered if case temperature and/or motor size are not known. However, these parameters should be collected by EDCs for greatest accuracy.
There are two sources of energy and demand savings through this measure:
1) The direct savings associated with replacement of an inefficient motor with a more efficient one;
2) The indirect savings of a reduced cooling load on the refrigeration unit due to less heat gain from the more efficient evaporator fan motor in the air-stream.
A L G O R I T H M S
Cooler
∆ kW peak per unit ¿W base−W ee
1,000×LF×DC evapcool×(1+ 1
DG×COPcooler )∆ kWhper unit ¿∆ kW peak perunit×8,760
∆ kW peak ¿N ×∆ kW peak perunit
kWh ¿N ×∆ kWhperunit
373 Based on TMY2 weather files from DOE2.com for Erie, Harrisburg, Pittsburgh, Wilkes-Barre, And Williamsport, the average annual wetbulb temperature is 45 1.3 °F. The wetbulb temperature in garages or attics, where the heat pumps are likely to be installed, are likely to be two or three degrees higher, but for simplicity, 45 °F is assumed to be the annual average wetbulb temperature.
SECTION 2: Residential MeasuresMiscellaneous Page 390
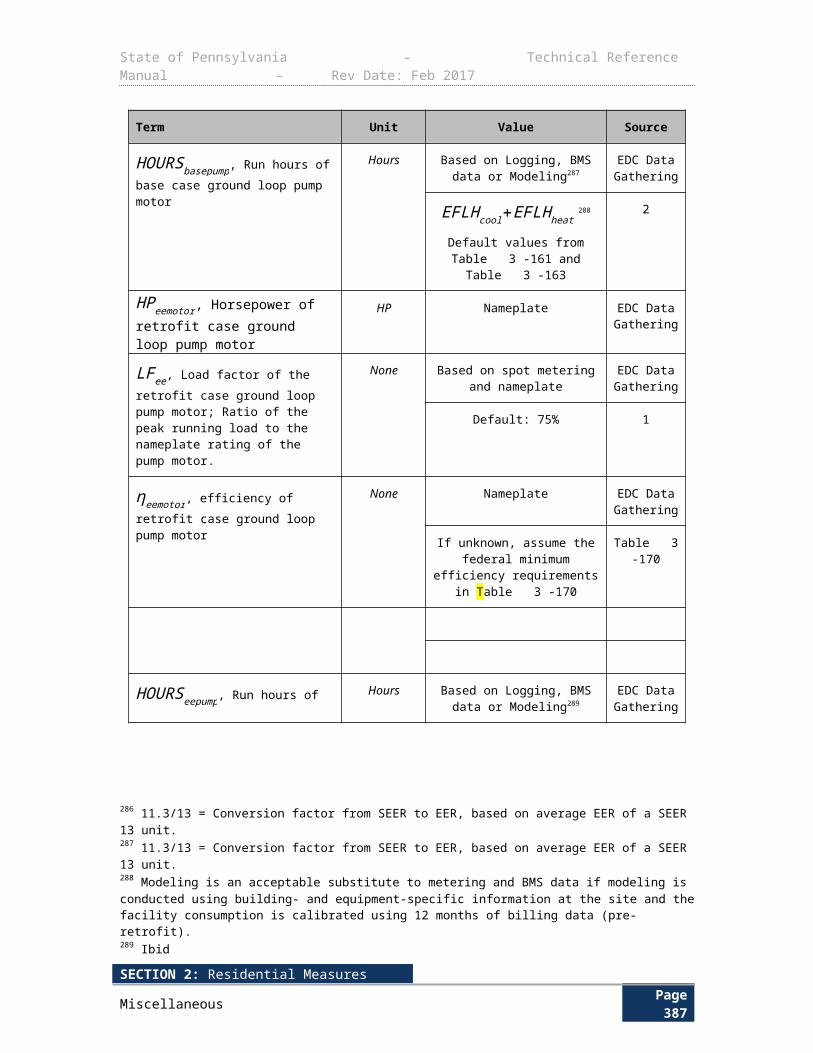
State of Pennsylvania – Technical Reference Manual – Rev Date: Feb 2017
Freezer
∆ kW peak per unit ¿W base−W ee
1,000×LF×DC evapfreeze×(1+ 1
DG×COP freezer )∆ kWhper unit ¿∆ kW peak perunit×8,760
∆ kW peak ¿N ×∆ kW peak perunit
kWh ¿N ×∆ kWhperunit
D E F I N I T I O N O F T E R M S
SECTION 2: Residential MeasuresMiscellaneous Page 391
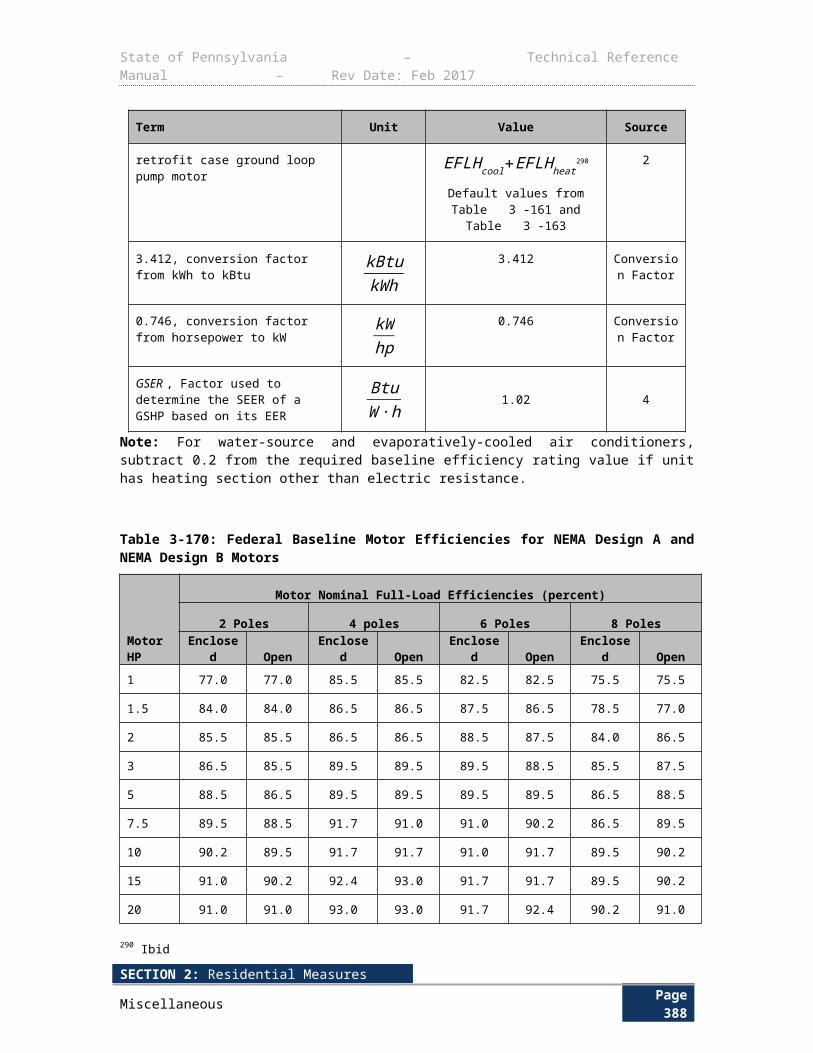
State of Pennsylvania – Technical Reference Manual – Rev Date: Feb 2017
Table 3-225: Variables for High-Efficiency Evaporator Fan Motor374
Term Unit Values Source
N , Number of motors replaced None EDC Data Gathering EDC Data Gathering
W base, Input wattage of existing/baseline evaporator fan motor
W
Nameplate Input Wattage EDC Data Gathering
Default values from Table 3-227 and
Table 3-228
Table 3-227 and Table 3-228
W ee, Input wattage of new energy efficient evaporator fan motor
W
Nameplate Input Wattage EDC Data Gathering
Default values from Table 3-226 Table 3-226
LF , Load factor of evaporator fan motor None 0.9 1
DCevapcool, Duty cycle of evaporator fan motor for cooler
None 100% 2
DCevapfreeze, Duty cycle of evaporator fan motor for freezer
None 94.4% 2
DG, Degradation factor of compressor COP
None 0.98 3
COPcooler , Coefficient of performance of compressor in the cooler
None 2.5 1
COP freezer, Coefficient of performance of compressor in the freezer
None 1.3 1
PctCooler , Percentage of coolers in stores vs. total of freezers and coolers
None 68% 3
8,760, Hours per yearHoursYear
8,760 Conversion Factor
374 The performance curve is adapted from Table 1 in http://wescorhvac.com/HPWH%20design%20details.htm#Single-stage%20HPWHs. The performance curve depends on other factors, such as hot water set point. Our adjustment factor of 0.84 is a first order approximation based on the information available in literature.
SECTION 2: Residential MeasuresMiscellaneous Page 392
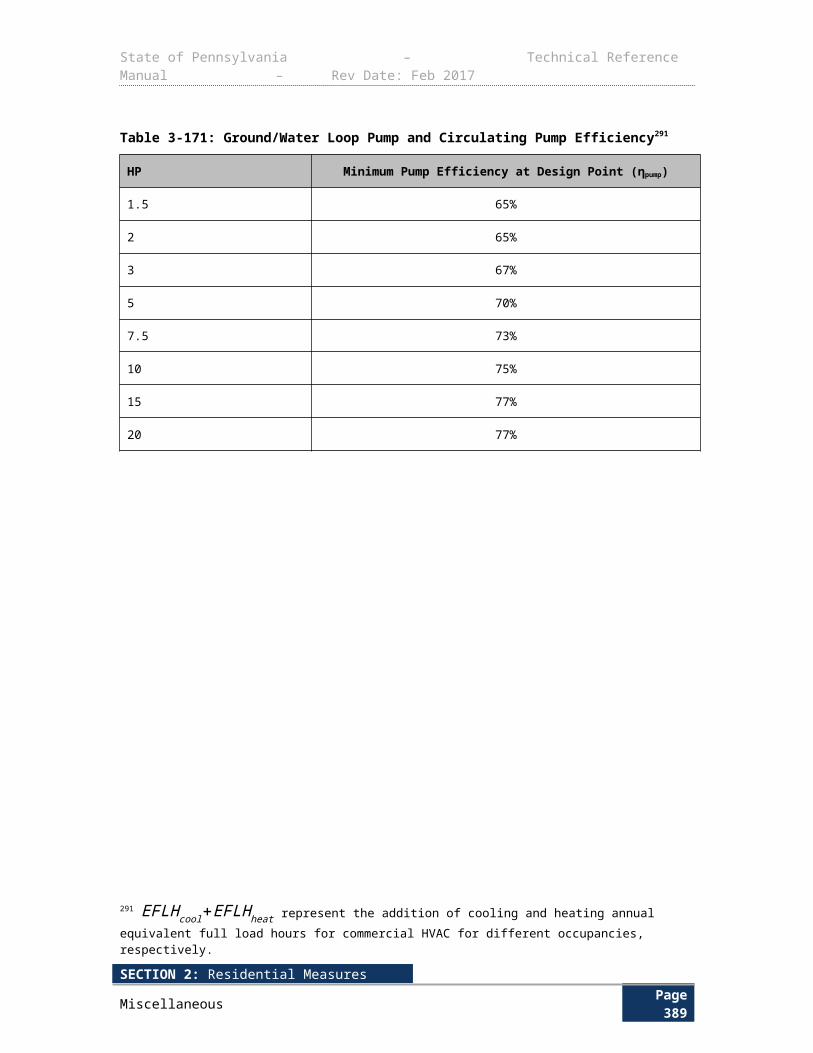
State of Pennsylvania – Technical Reference Manual – Rev Date: Feb 2017
Table 3-226: Variables for HE Evaporator Fan Motor
Motor Category
Motor Output Watts
SP Efficiency
SP Input Watts
PSC Efficiency
PSC Input Watts
ECM Efficienc
y
ECM Input Watts
1-14 watts (Using 9 watt as industry average)
9 18% 50 41% 22 66% 14
16-23 watts (Using 19.5 watt as industry average)
19.5 21% 93 41% 48 66% 30
1/20 HP (~37 watts)
37 26% 142 41% 90 66% 56
D E F A U L T S A V I N G S
Table 3-227: PSC to ECM Deemed Savings
MeasureWbase
(PSC)Wee
(ECM) LF DCEvap DG
COP per
case Temp
Demand
Impact (kW)
Energy Impact (kWh)
Cooler: PSC to ECM:1-14 Watt
22 14 0.9 100% 0.98 2.5 0.0105 92
Cooler: PSC to ECM:16-23 Watt
48 30 0.9 100% 0.98 2.5 0.0228 200
Cooler: PSC to ECM:1/20 HP (37 Watt)
90 56 0.9 100% 0.98 2.5 0.0433 380
Freezer: PSC to ECM: 1-14 Watt
22 14 0.9 94.4% 0.98 1.3 0.0126 110
Freezer: PSC to ECM: 16-23 Watt
48 30 0.9 94.4% 0.98 1.3 0.0273 239
Freezer: PSC to ECM: 1/20 HP (37 Watt)
90 56 0.9 94.4% 0.98 1.3 0.0518 454
SECTION 2: Residential MeasuresMiscellaneous Page 393
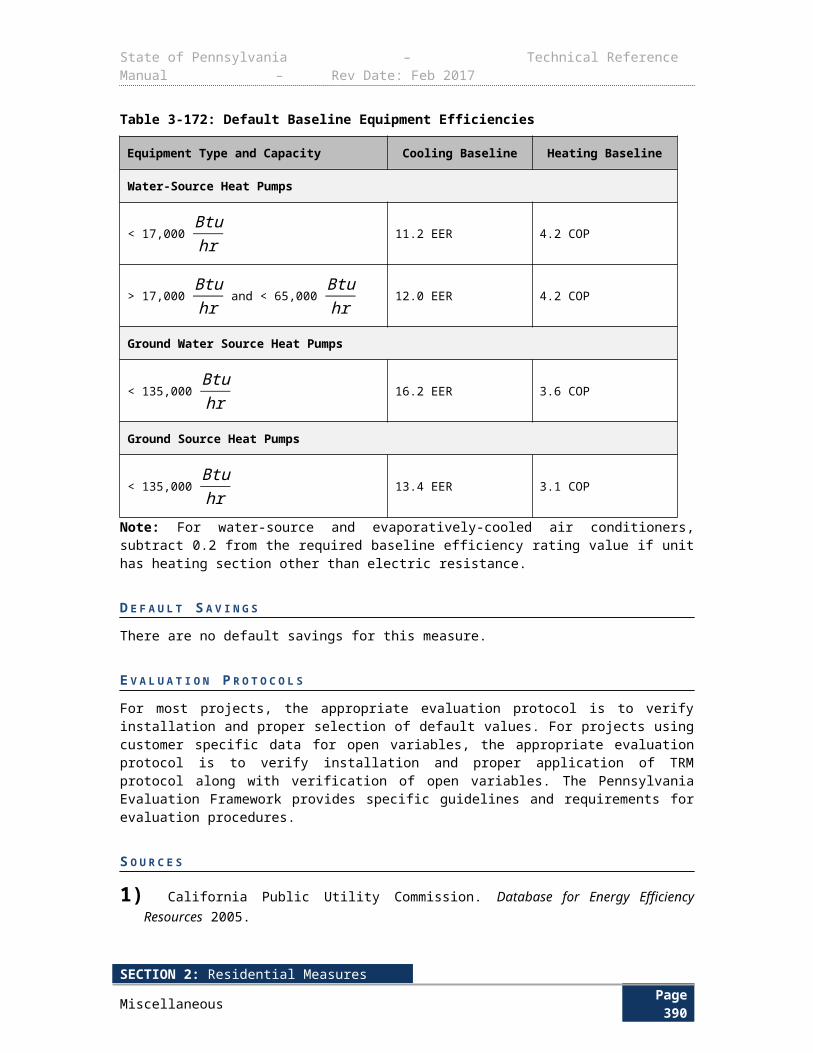
State of Pennsylvania – Technical Reference Manual – Rev Date: Feb 2017
Table 3-228: Shaded Pole to ECM Deemed Savings
Measure
Wbase
(Shaded Pole)
Wee
(ECM) LF DCEvap DG
COP per
case Temp
Demand Impact (kW)
Energy Impact (kWh)
Cooler: Shaded Pole to ECM:1-14 Watt
50 14 0.9 100% 0.98 2.5 0.0461 404
Cooler: Shaded Pole to ECM:16-23 Watt
93 30 0.9 100% 0.98 2.5 0.0802 703
Cooler: Shaded Pole to ECM:1/20 HP (37 Watt)
142 56 0.9 100% 0.98 2.5 0.1093 958
Freezer: Shaded Pole to ECM:1-14 Watt
50 14 0.9 94.4% 0.98 1.3 0.0551 483
Freezer: Shaded Pole to ECM:16-23 Watt
93 30 0.9 94.4% 0.98 1.3 0.0960 841
Freezer: Shaded Pole to ECM:1/20 HP (37 Watt)
142 56 0.9 94.4% 0.98 1.3 0.1308 1146
E V A L U A T I O N P R O T O C O L S
For most projects, the appropriate evaluation protocol is to verify installation and proper selection of default values. For projects using customer specific data for open variables, the appropriate evaluation protocol is to verify installation and proper application of TRM protocol along with verification of open variables. The Pennsylvania Evaluation Framework provides specific guidelines and requirements for evaluation procedures.
S O U R C E S
1) “ActOnEnergy; Business Program-Program Year 2, June, 2009 through May, 2010. Technical Reference Manual, No. 2009-01.” Published 12/15/2009.
2) “Efficiency Maine; Commercial Technical Reference User Manual No. 2007-1.” Published 3/5/07.
3) Regional Technical Forum (RTF) as part of the Northwest Power & Conservation Council, Deemed Measures List. Grocery Display Case ECM, FY2010, V2. Accessed from RTF website http://www.nwcouncil.org/rtf/measures/Default.asp on July 30, 2010.
SECTION 2: Residential MeasuresMiscellaneous Page 394
State of Pennsylvania – Technical Reference Manual – Rev Date: Feb 2017
3.5.3 HIGH-EFFICIENCY EVAPORATOR FAN MOTORS FOR WALK-IN REFRIGERATED CASES
Measure NameHigh-Efficiency Evaporator Fan Motors for Walk-in
Refrigerated Cases
Target Sector Commercial and Industrial Establishments
Measure Unit Fan Motor
Unit Energy Savings Variable
Unit Peak Demand Reduction Variable
Measure Life 15 years375
Measure Vintage Early Replacement
E L I G I B I L I T Y
This protocol covers energy and demand savings associated with the replacement of existing shaded-pole (SP) or permanent-split capacitor (PSC) evaporator fan motors in walk-in refrigerated display cases with an electronically commutated motor (ECM).
There are two sources of energy and demand savings through this measure:
1) The direct savings associated with replacement of an inefficient motor with a more efficient one;
2) The indirect savings of a reduced cooling load on the refrigeration unit due to less heat gain from the more efficient evaporator fan motor in the air-stream.
A L G O R I T H M S
Cooler
∆ kW peak per unit ¿(W base−W ee )
1,000×LF×DCevapcool×[1+( 1
DG×COPcooler )]∆ kWhper unit ¿∆ kW peak perunit×HR
∆ kWhpeak ¿N ×∆ kW peak perunit
∆ kWh ¿N ×∆ kWhperunit
Freezer
375 See page 42 of the 2013 TRC Test Final Order
SECTION 2: Residential MeasuresMiscellaneous Page 395
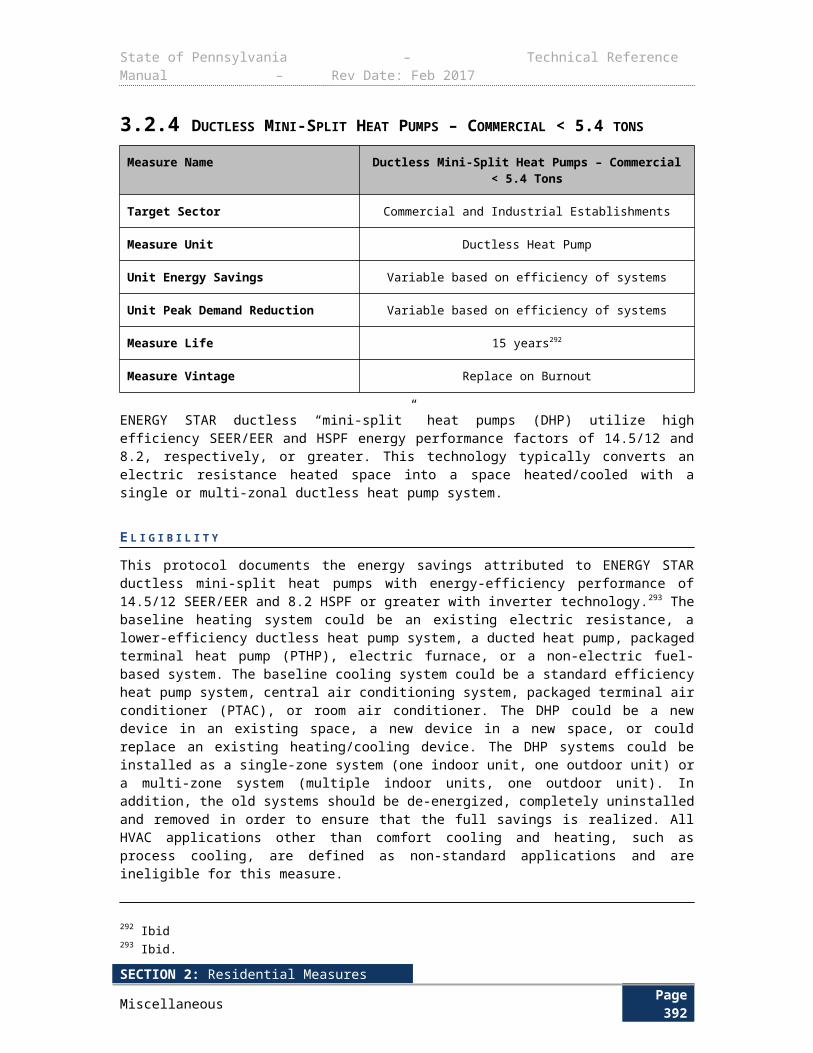
State of Pennsylvania – Technical Reference Manual – Rev Date: Feb 2017
∆ kW peak per unit ¿(W base−W ee )
1,000×LF×DCevapfreeze×[1+( 1
DG×COPfreezer )]∆ kWhper unit ¿∆ kW peak perunit×HR
∆ kWhpeak ¿N ×∆ kW peak perunit
∆ kWh ¿N ×∆ kWhperunit
D E F I N I T I O N O F T E R M S
SECTION 2: Residential MeasuresMiscellaneous Page 396
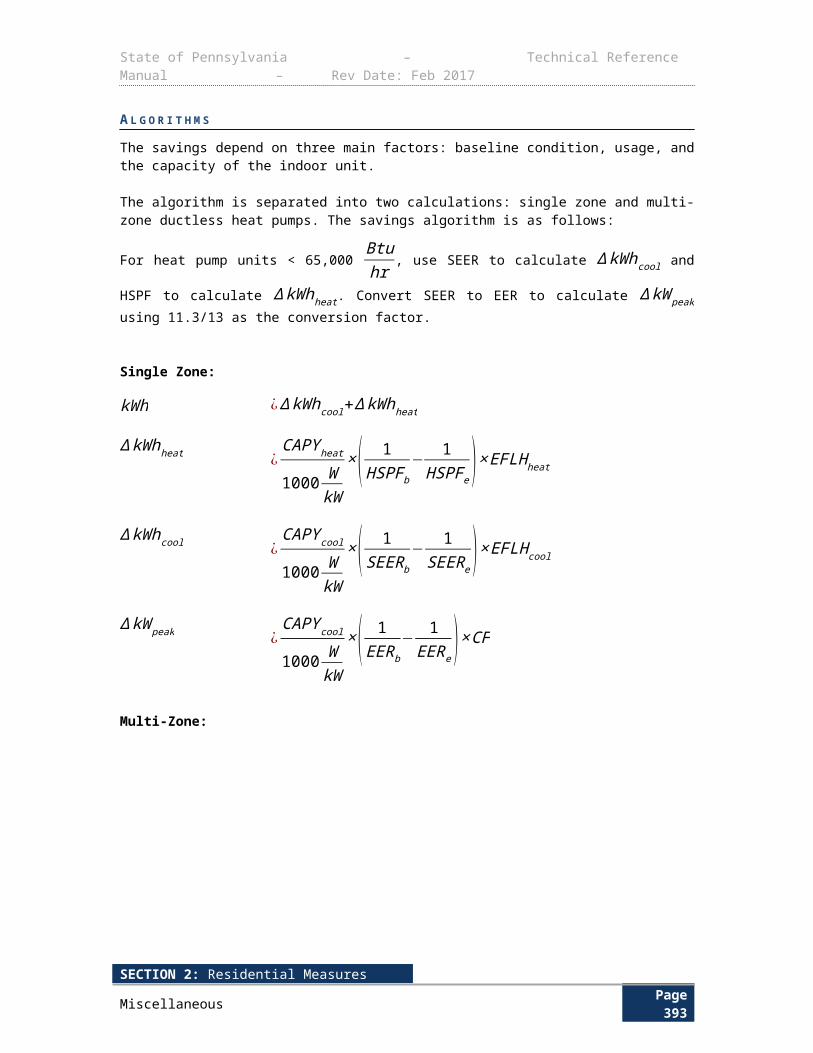
State of Pennsylvania – Technical Reference Manual – Rev Date: Feb 2017
Table 3-229: Variables for High-Efficiency Evaporator Fan Motor
Term Unit Values Source
N , Number of motors replaced None EDC Data Gathering
EDC Data Gathering
W base, Input wattage of existing/baseline evaporator fan motor
W
Nameplate Input Wattage
EDC Data Gathering
Default Table 3-231and Table 3-
232
Table 3-231 and Table 3-
232
W ee, Input wattage of new energy efficient evaporator fan motor
W
Nameplate Input Wattage
EDC Data Gathering
Default Table 3-230
Table 3-230
LF , Load factor of evaporator fan motor None 0.9 1
DCevapcool, Duty cycle of evaporator fan motor for cooler None 100% 2
DCevapfreeze, Duty cycle of evaporator fan motor for freezer
None 94.4% 2
DG, Degradation factor of compressor COP None 0.98 3
COPcooler , Coefficient of performance of compressor in the cooler
None 2.5 1
COP freezer, Coefficient of performance of compressor in the freezer
None 1.3 1
PctCooler , Percentage of walk-in coolers in stores vs. total of freezers and coolers
None 69% 3
Hr , Operating hours per yearHoursYear
8,273 2
SECTION 2: Residential MeasuresMiscellaneous Page 397
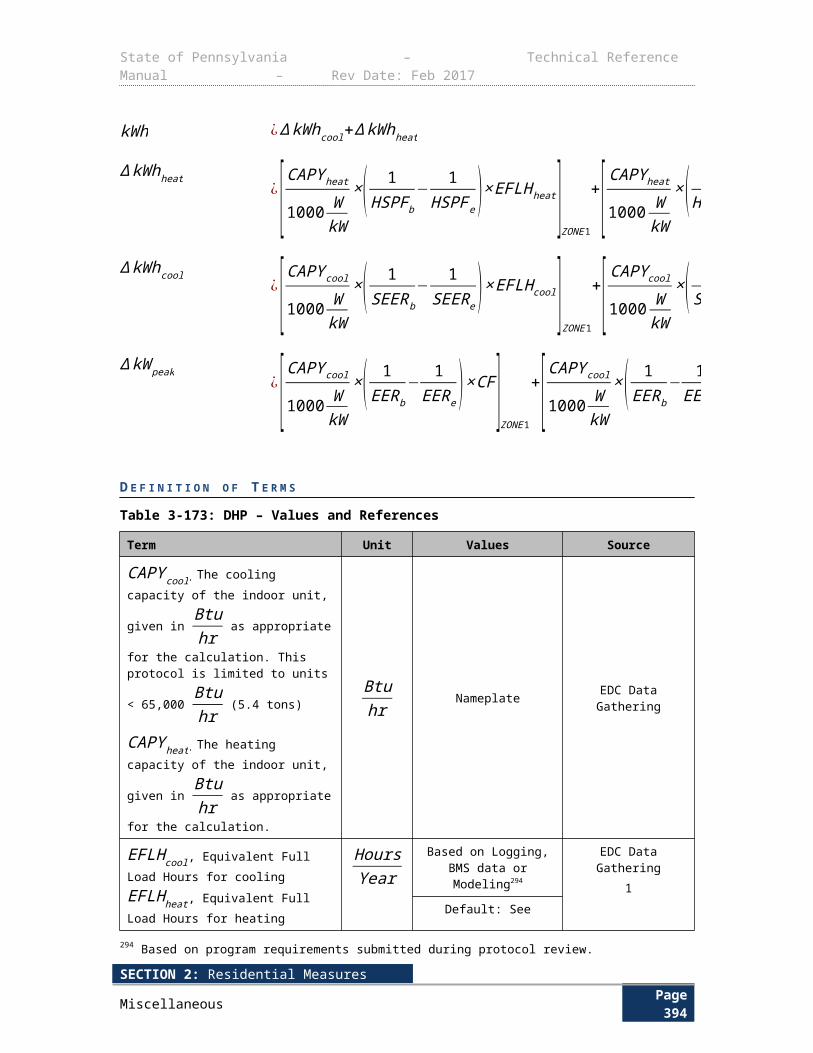
State of Pennsylvania – Technical Reference Manual – Rev Date: Feb 2017
Table 3-230: Variables for HE Evaporator Fan Motor
Motor Category
Motor Output Watts
SP Efficienc
y376,377SP Input
Watts
PSC Efficienc
y378PSC Input
WattsECM
Efficiency
ECM Input Watts
1-14 watts (Using 9 watt as industry average)
9 18% 50 41% 22 66% 14
1/40 HP (16-23 watts) (Using 19.5 watt as industry average)
19.5 21% 93 41% 48 66% 30
1/20 HP (~37 watts)
37 26% 142 41% 90 66% 56
1/15 HP (~49 watts)
49 26% 191 41% 120 66% 75
D E F A U L T S A V I N G S
Table 3-231: PSC to ECM Deemed Savings
MeasureWbase
(PSC)Wee
(ECM) LF DCEvap DG
COP per
case Temp
Demand Impact (kW)
Energy Impact (kWh)
Cooler: PSC to ECM: (1-14 Watt)
22 14 0.9 100% 0.98 2.5 0.0101 84
Cooler: PSC to ECM:1/40 HP (16-23 Watt)
48 30 0.9 100% 0.98 2.5 0.0228 189
Cooler: PSC to ECM:1/20 HP (37 Watt)
90 56 0.9 100% 0.98 2.5 0.0431 356
Cooler: PSC to ECM:1/15 HP (49 Watt)
120 75 0.9 100% 0.98 2.5 0.0570 472
Freezer: PSC to ECM: (1-14 Watt)
22 14 0.9 94.4% 0.98 1.3 0.0121 100
Freezer: PSC to ECM:1/40 HP (16-23 Watt)
48 30 0.9 94.4% 0.98 1.3 0.0273 226
Freezer: PSC to ECM:1/20 HP (37 Watt)
90 56 0.9 94.4% 0.98 1.3 0.0516 427
376 DEER 2014 Effective Useful Life. 377 Energy Conservation Program: Energy Conservation Standards for Commercial Refrigeration Equipment: Final Rule. March 28, 2014. http://www1.eere.energy.gov/buildings/appliance_standards/product.aspx/productid/52 378 DEER 2014 Effective Useful Life.
SECTION 2: Residential MeasuresMiscellaneous Page 398
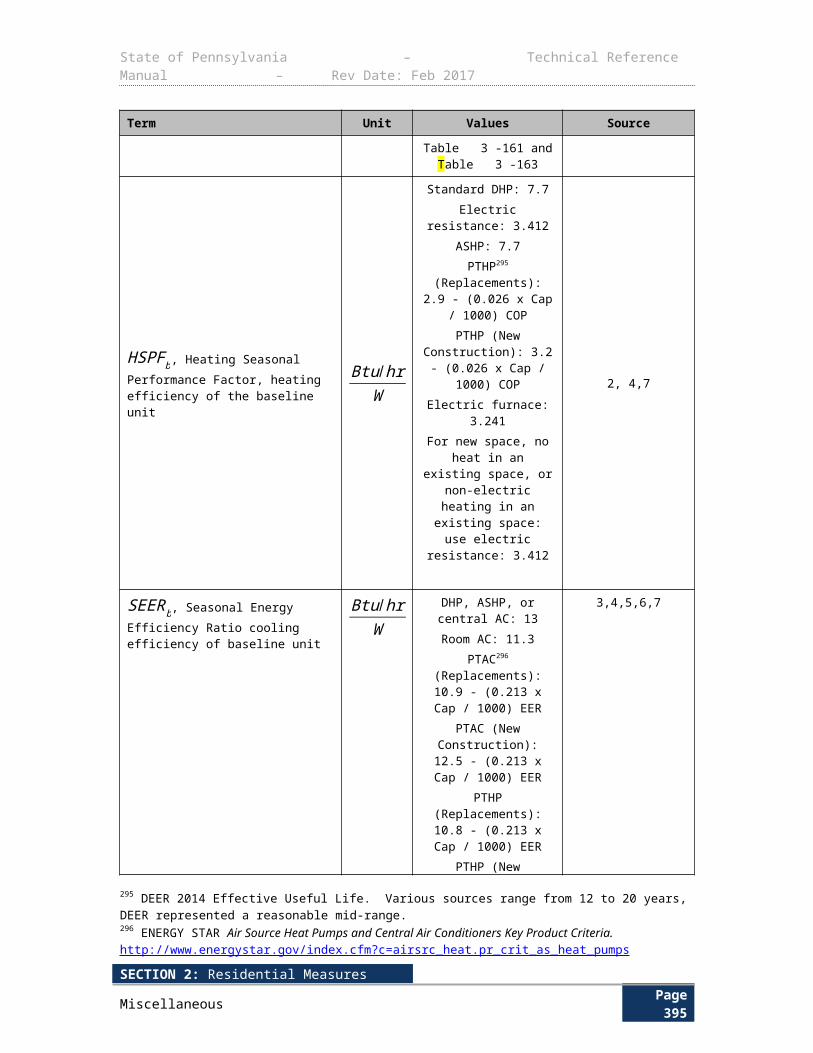
State of Pennsylvania – Technical Reference Manual – Rev Date: Feb 2017
MeasureWbase
(PSC)Wee
(ECM) LF DCEvap DG
COP per
case Temp
Demand Impact (kW)
Energy Impact (kWh)
Freezer: PSC to ECM:1/15 HP (49 Watt)
120 75 0.9 94.4% 0.98 1.3 0.0682 565
Table 3-232: Shaded Pole to ECM Deemed Savings
Measure
Wbase
(Shaded Pole)
Wee
(ECM) LF DCEvap DG
COP per
case Temp
Demand Impact (kW)
Energy Impact (kWh)
Cooler: Shaded Pole to ECM:(1-14 Watt)
50 14 0.9 100% 0.98 2.5 0.0456 377
Cooler: Shaded Pole to ECM:1/40 HP (16-23 Watt)
93 30 0.9 100% 0.98 2.5 0.0798 661
Cooler: Shaded Pole to ECM:1/20 HP (37 Watt)
142 56 0.9 100% 0.98 2.5 0.1090 902
Cooler: Shaded Pole to ECM:1/15 HP (49 Watt)
191 75 0.9 100% 0.98 2.5 0.1470 1,216
Freezer: Shaded Pole to ECM:(1-14 Watt)
50 14 0.9 94.4% 0.98 1.3 0.0546 452
Freezer: Shaded Pole to ECM:1/40 HP (16-23 Watt)
93 30 0.9 94.4% 0.98 1.3 0.0955 790
Freezer: Shaded Pole to ECM:1/20 HP (37 Watt)
142 56 0.9 94.4% 0.98 1.3 0.1304 1,079
Freezer: Shaded Pole to ECM:1/15 HP (49 Watt)
191 75 0.9 94.4% 0.98 1.3 0.1759 1,455
E V A L U A T I O N P R O T O C O L S
For most projects, the appropriate evaluation protocol is to verify installation and proper selection of default values. For projects using customer specific data for open variables, the appropriate evaluation protocol is to verify installation and proper application of TRM protocol along with verification of open variables. The Pennsylvania Evaluation Framework provides specific guidelines and requirements for evaluation procedures.
S O U R C E S
SECTION 2: Residential MeasuresMiscellaneous Page 399
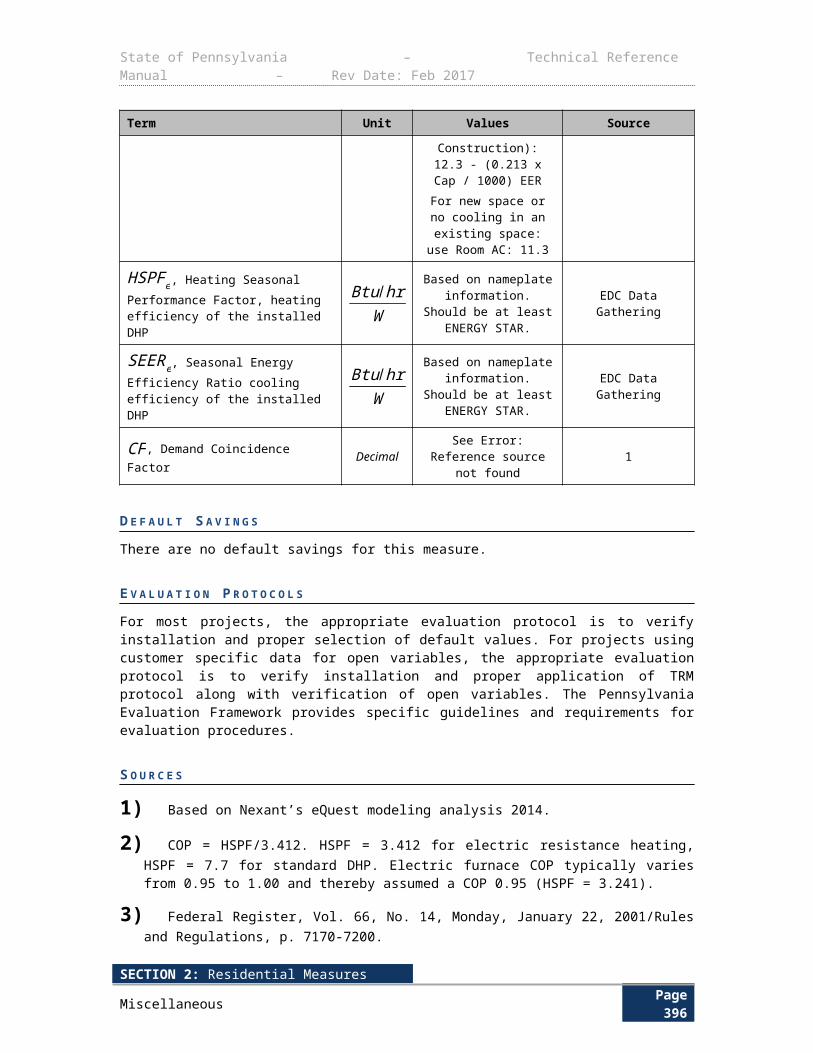
State of Pennsylvania – Technical Reference Manual – Rev Date: Feb 2017
1) PSC of Wisconsin, Focus on Energy Evaluation, Business Programs: Deemed Savings Manual V1.0, p. 4-103 to 4-106. https://focusonenergy.com/sites/default/files/bpdeemedsavingsmanuav10_evaluationreport.pdf
2) Efficiency Vermont, Technical Reference Manual 2009-54, 12/08. Hours of operation accounts for defrosting periods where motor is not operating. http://www.greenmountainpower.com/upload/photos/371TRM_User_Manual_No_2013-82-5-protected.pdf
3) PECI presentation to Regional Technical Forum (RTF) as part of the Northwest Power & Conservation Council, Energy Smart March 2009 SP to ECM – 090223.ppt. Accessed from RTF website http://rtf.nwcouncil.org/meetings/2009/03/ on September 7, 2010.
SECTION 2: Residential MeasuresMiscellaneous Page 400
State of Pennsylvania – Technical Reference Manual – Rev Date: Feb 2017
3.5.4 CONTROLS: EVAPORATOR FAN CONTROLLERS
Measure Name Controls: Evaporator Fan Controllers
Target Sector Commercial and Industrial Establishments
Measure Unit Evaporator Fan Controller
Unit Energy Savings Variable
Unit Peak Demand Reduction Variable
Measure Life 10 years379
Measure Vintage Retrofit
This measure is for the installation of evaporator fan controls380 in medium-temperature walk-in coolers with no pre-existing controls. Evaporator fans run constantly to provide cooling when the compressor is running, and to provide air circulation when the compressor is not running. The equations specified in the Algorithms section are for fans that are turned off and/or cycled. A fan controller saves energy by reducing fan usage, by reducing the refrigeration load resulting from the heat given off by the fan and by reducing compressor energy resulting from the electronic temperature control. This protocol documents the energy savings attributed to evaporator fan controls.
E L I G I B I L I T Y
This protocol documents the energy savings attributed to installation of evaporator fan controls in medium-temperature walk-in coolers and low temperature walk-in freezers.
A L G O R I T H M S 3 8 1
∆ kWh ¿∆ kWhfan+∆kWhheat+∆kWhcontrol
∆ kWhfan ¿kW fan×8,760×%Off
∆ kWhheat ¿∆ kWhfan×0.28×Eff rs
∆ kWhcontrol ¿ [kW cp×Hourscp+kW fan×8,760× (1−%Off ) ]×5%
∆ kW ¿ ∆kWh8,760
DeterminekW fanand kW cp variables using any of the following methods:
379 PSC of Wisconsin, Focus on Energy Evaluation, Business Programs: Deemed Savings Manual V1.0, p. 4-103 to 4-106. https://focusonenergy.com/sites/default/files/bpdeemedsavingsmanuav10_evaluationreport.pdf 380 Appliance Magazine. “Evaporator Fan Motor Energy Monitoring.” http://www.appliancemagazine.com/editorial.php?article=1570 381 Regional Technical Forum (RTF) as part of the Northwest Power & Conservation Council, Deemed Measures List. Grocery Display Case ECM, FY2010, V2. Accessed from RTF website: http://rtf.nwcouncil.org//measures/measure.asp?id=162 on July 30, 2010
SECTION 2: Residential MeasuresMiscellaneous Page 401
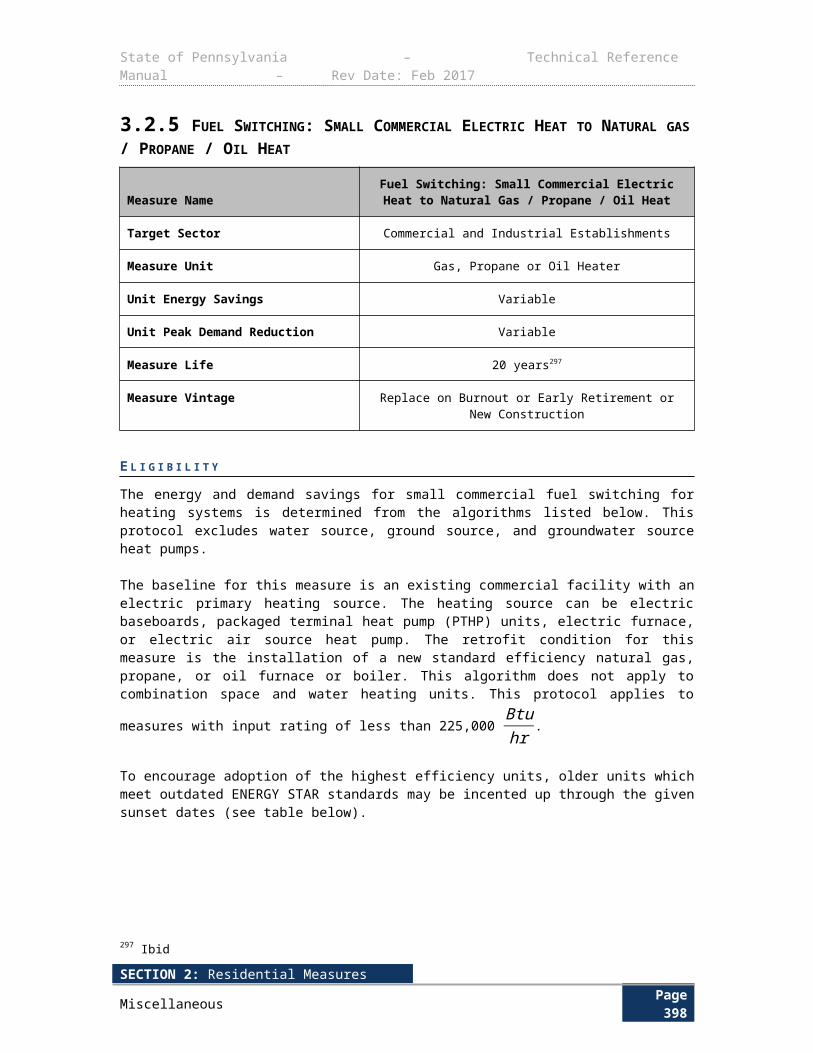
State of Pennsylvania – Technical Reference Manual – Rev Date: Feb 2017
1. Calculate using the nameplate horsepower and load factor.
kW fan∨kW cp ¿ HP×LF×0.746ηmotor
2. Calculate using the nameplate amperage and voltage and a power factor.
kW fan∨kW cp ¿V × A×PFmotor×LF
3. Measure the input kW fan using a power meter reading true RMS power.
D E F I N I T I O N O F T E R M S
Table 3-233: Evaporator Fan Controller Calculations Assumptions
Term Unit Values Source
∆ kWhfan, Energy savings due to evaporator being shut off
kWh Calculated Calculated
∆ kWhheat, Heat energy savings due to reduced heat from evaporator fans
kWh Calculated Calculated
∆ kWhcontrol, Control energy savings due to electronic controls on compressor and evaporator
kWh Calculated Calculated
kW fan, Power demand of evaporator fan calculated from any of the methods described above
kW Calculated Calculated
kW cp, Power demand of compressor motor and condenser fan calculated from any of the methods described above
kW Calculated Calculated
0.28, Conversion from kW to tons kWton
0.28 Conversion Factor
5%, Reduced run-time of compressor and evaporator due to electronic controls
None 5% 7
0.746, Conversion factor from horsepower to kW
kWhp
0.746 Conversion Factor
PF, Power Factor of the motor None Fan motor: 0.75
Compressor motor: 0.9
1, 5, 6
%Off, Percent of annual hours that the None 46% 2
SECTION 2: Residential MeasuresMiscellaneous Page 402
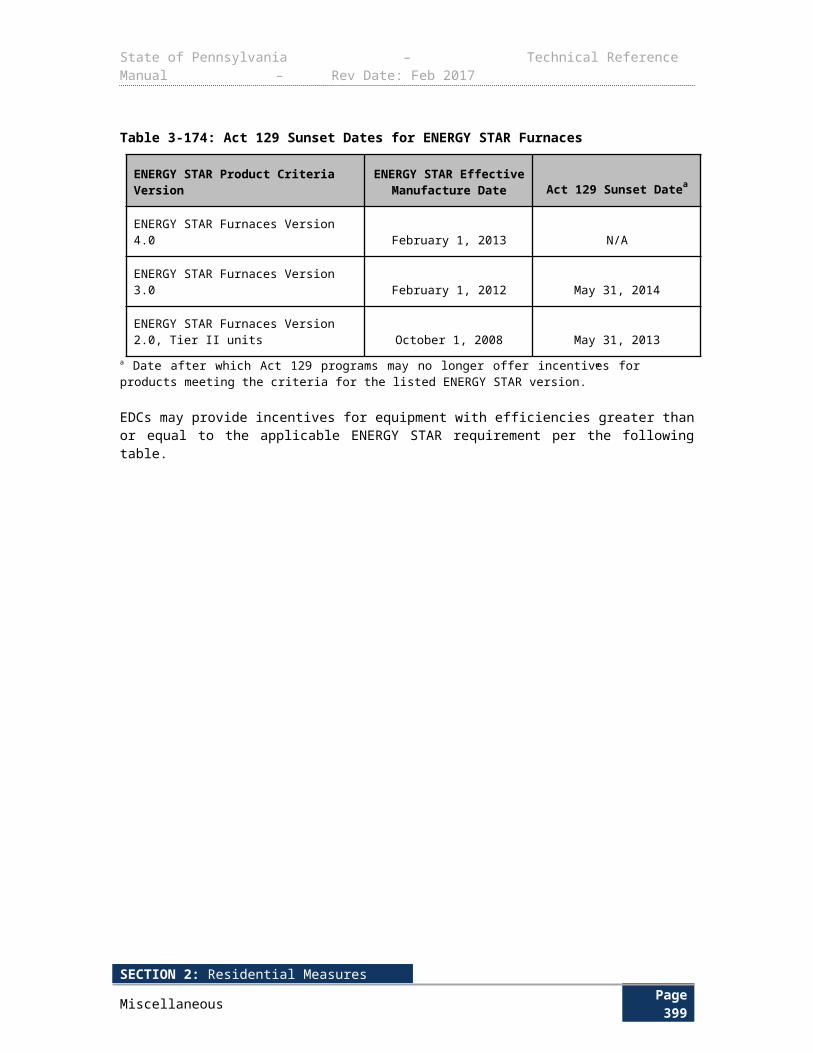
State of Pennsylvania – Technical Reference Manual – Rev Date: Feb 2017
Term Unit Values Source
evaporator is turned off
E f f rs, Efficiency of typical refrigeration system
kWton
1.6 3
H our scp, Equivalent annual full load hours of compressor operation
HoursYear
EDC Data Gathering EDC Data Gathering
4,072 1, 4
HP, Rated horsepower of the motor HP EDC Data Gathering EDC Data Gathering
ηmotor , Efficiency of the motor None EDC Data Gathering EDC Data Gathering
LF, Load factor of motor None 0.9 Section 3.5.2
Voltage, Voltage of the motor Volts EDC Data Gathering EDC Data Gathering
Amperage, Rated amperage of the motor Amperes EDC Data Gathering EDC Data Gathering
D E F A U L T S A V I N G S
There are no default savings for this measure.
E V A L U A T I O N P R O T O C O L S
For most projects, the appropriate evaluation protocol is to verify installation and proper selection of default values. For projects using customer specific data for open variables, the appropriate evaluation protocol is to verify installation and proper application of TRM protocol along with verification of open variables. The Pennsylvania Evaluation Framework provides specific guidelines and requirements for evaluation procedures.
S O U R C E S
1) Conservative value based on 15 years of NRM field observations and experience
2) Select Energy (2004). Analysis of Cooler Control Energy Conservation Measures. Prepared for NSTAR.
3) Estimated average refrigeration efficiency for small business customers, Massachusetts Technical Reference Manual for Estimating Savings from Energy Efficiency Measures. October 2012. Pg. 191
4) 2012 Program Year Rhode Island Technical Reference Manual for Estimating Savings from Energy Efficiency Measures
5) ESource Customer Direct to Touchstone Energy for Evaporator Fan Controllers, 2005
6) LBNL 57651 Energy Savings in Refrigerated Walk-in Boxes, 1998 http://gaia.lbl.gov/btech/papers/57651.pdf
7) Conservative estimate supported by less conservative values given by several utility-sponsored 3rd party studies including: Select Energy (2004). Analysis of Cooler Control Energy Conservation Measures. Prepared for NSTAR.
SECTION 2: Residential MeasuresMiscellaneous Page 403
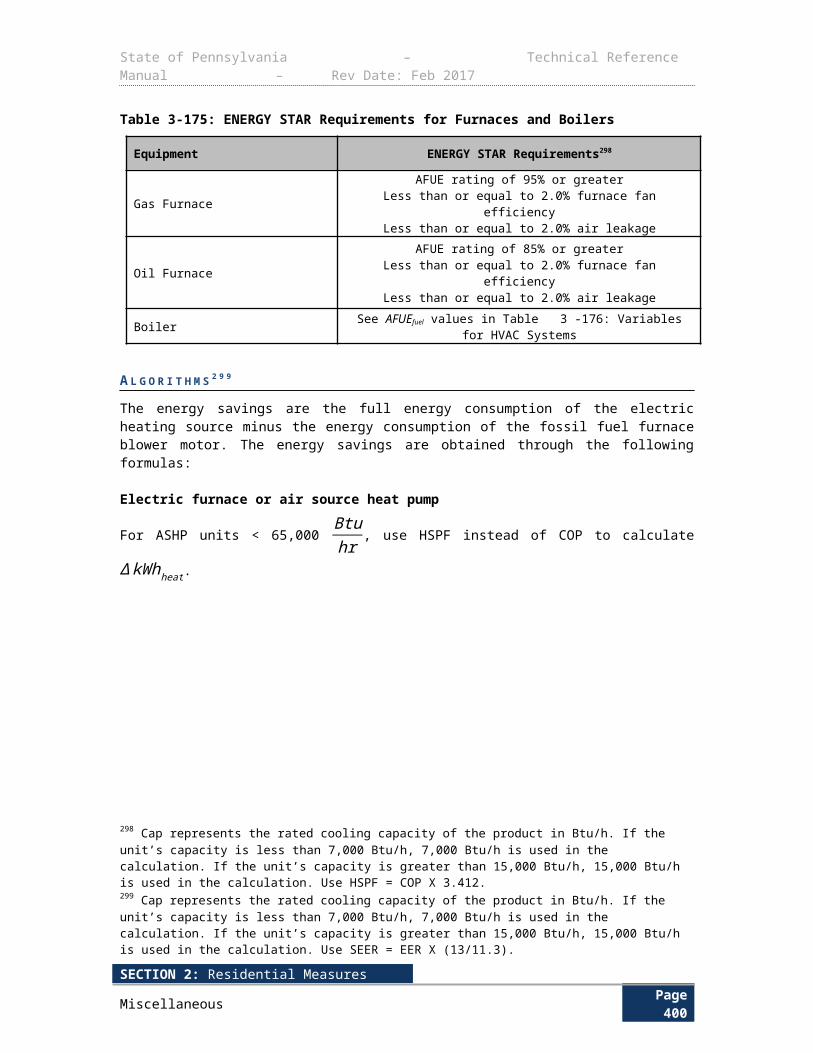
State of Pennsylvania – Technical Reference Manual – Rev Date: Feb 2017
SECTION 2: Residential MeasuresMiscellaneous Page 404
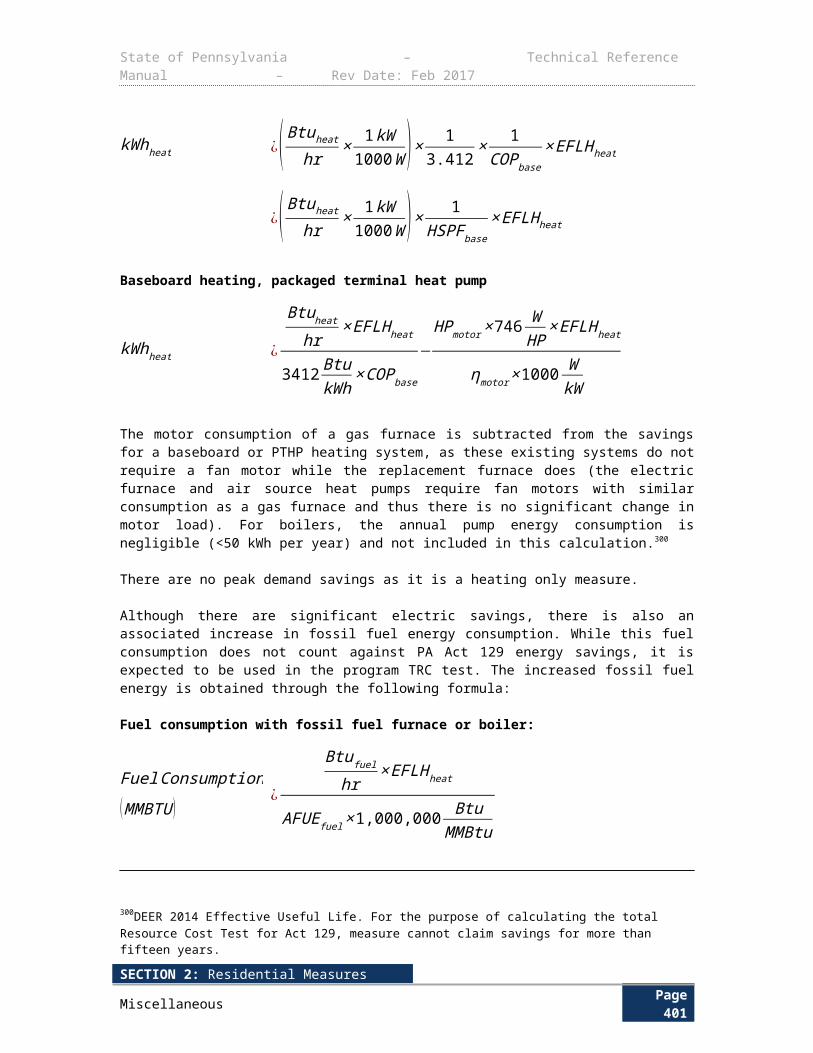
State of Pennsylvania – Technical Reference Manual – Rev Date: Feb 2017
3.5.5 CONTROLS: FLOATING HEAD PRESSURE CONTROLS
Measure Name Controls: Floating Head Pressure Control
Target Sector Commercial and Industrial Establishments
Measure Unit Floating Head Pressure Control
Unit Energy Savings Deemed by location, kWh
Unit Peak Demand Reduction 0 kW
Measure Life 15 years382
Measure Vintage Retrofit
Installers conventionally design a refrigeration system to condense at a set pressure-temperature point, typically 90 ºF. By installing a floating head pressure control383 (FHPCs) condenser system, the refrigeration system can change condensing temperatures in response to different outdoor temperatures. This means that the minimum condensing head pressure from a fixed setting (180 psig for R-22) is lowered to a saturated pressure equivalent at 70 ºF or less. Either a balanced-port or electronic expansion valve that is sized to meet the load requirement at a 70 ºF condensing temperature must be installed. Alternatively, a device may be installed to supplement the refrigeration feed to each evaporator attached to a condenser that is reducing head pressure.
E L I G I B I L I T Y This protocol documents the energy savings attributed to FHPCs applied to a single-compressor refrigeration system in commercial applications. The baseline case is a refrigeration system without FHPC whereas the efficient case is a refrigeration system with FHPC. FHPCs must have a minimum Saturated Condensing Temperature (SCT) programmed for the floating head pressure control of ≤ 70 ºF. The use of FHPC would require balanced-port expansion valves, allowing satisfactory refrigerant flow over a range of head pressures. The compressor must be 1 HP or larger.
A L G O R I T H M S
The savings are primarily dependent on the following factors:
Load factor of compressor motor horsepower (HP)
Climate zone
Refrigeration system temperature application
The savings algorithm is as follows:
kWh ¿HPcompressor×kWhHP
382 Regional Technical Forum (RTF) as part of the Northwest Power & Conservation Council, Deemed Measures List. Deemed MeasuresV26 _walkinevapfan. Provided by Adam Hadley ([email protected]). Should be made available on RTF website http://rtf.nwcouncil.org//measures/measure.asp?id=162383 AO Smith New Product Notification. I-motor 9 & 16 Watt. Stock Numbers 9207F2 and 9208F2.
SECTION 2: Residential MeasuresMiscellaneous Page 405
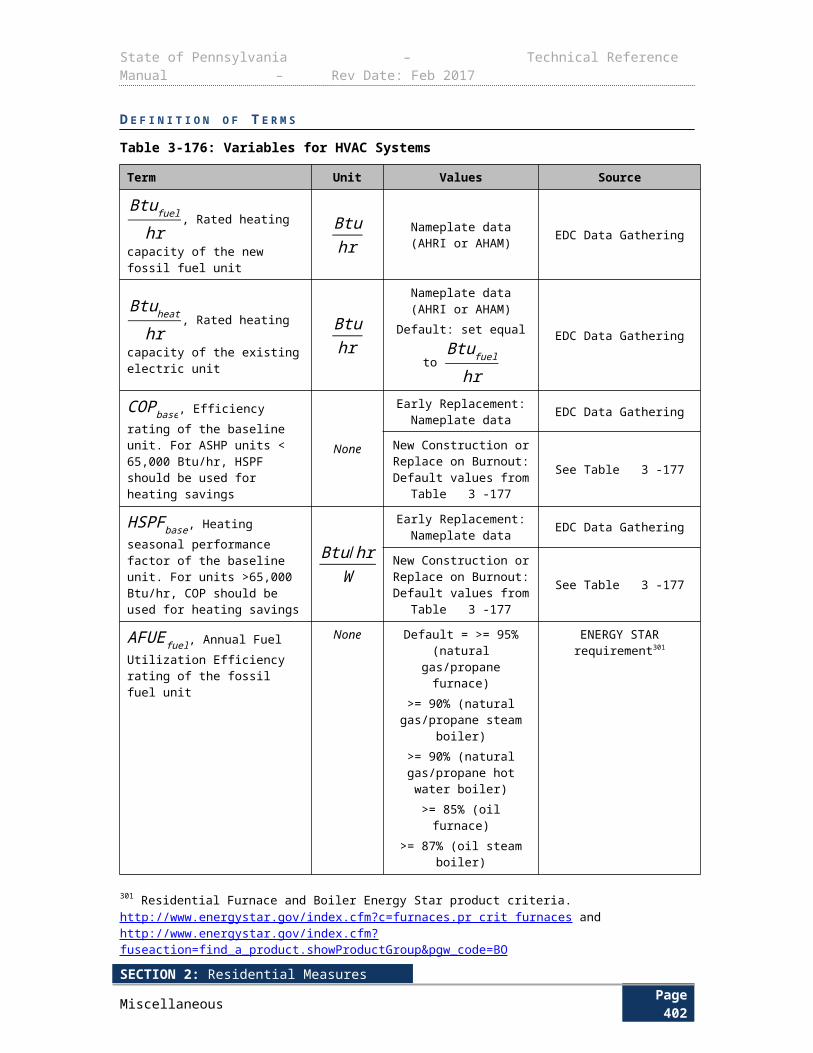
State of Pennsylvania – Technical Reference Manual – Rev Date: Feb 2017
If the refrigeration system is rated in tonnage:
kWh ¿ 4.715COP
×Tons× kWhHP
∆ kW peak ¿0
D E F I N I T I O N O F T E R M S
Table 3-234: Floating Head Pressure Controls – Values and References
Term Unit Values Source
HPcompressor, Rated horsepower (HP) per compressor
HP EDC Data Gathering EDC Data Gathering
kWhHP
, Annual savings per HPkWhHP
See Table 3-235 1
COP, Coefficient of Performance
None
Based on design conditions EDC Data Gathering
Default:
Condensing Unit;
Refrigerator (Medium Temp: 28 °F – 40 °F): 2.55 COP
Freezer (Low Temp: -20 °F – 0 °F): 1.32 COP
Remote Condenser;
Refrigerator (Medium Temp: 28 °F – 40 °F): 2.49 COP
Freezer (Low Temp: -20 °F – 0 °F): 1.45 COP
2
Tons, Refrigeration tonnage of the system
ton EDC Data Gathering EDC Data Gathering
4.715, Conversion factor to convert from ton to HP
tonHP
Engineering Estimate 3
SECTION 2: Residential MeasuresMiscellaneous Page 406
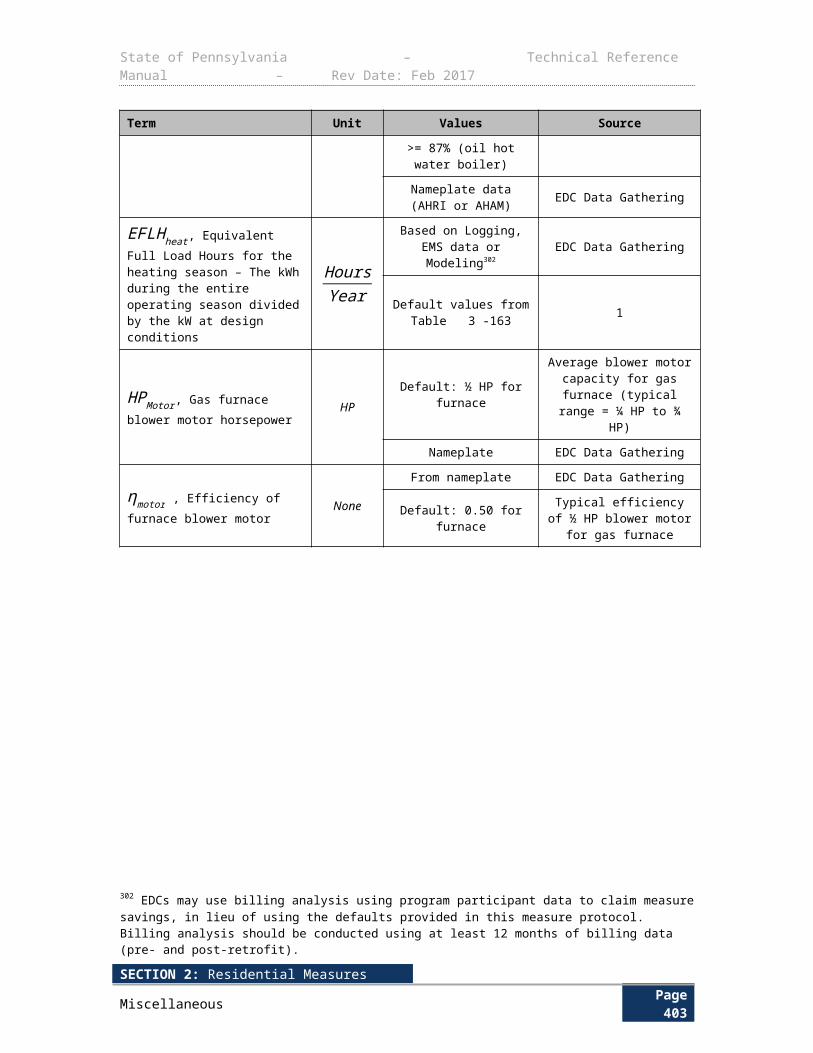
State of Pennsylvania – Technical Reference Manual – Rev Date: Feb 2017
Table 3-235: Annual Savings kWh/HP by Location
Climate Zone
Condensing Unit (kWh/HP) Remote Condenser (kWh/HP)
Refrigerator (Medium
Temp)
Freezer (Low
Temp)
Default384 (Temp
Unknown)
Refrigerator (Medium
Temp)
Freezer (Low
Temp)
Default385 (Temp
Unknown)
Allentown 630 767 674 380 639 463
Erie 681 802 720 438 657 508
Harrisburg 585 737 634 330 623 424
Philadelphia 546 710 598 286 609 390
Pittsburgh 617 759 662 366 634 452
Scranton 686 806 724 443 659 512
Williamsport 663 790 703 417 651 492
Table 3-236: Default Condenser Type Annual Savings kWh/HP by Location
Climate Zone
Unknown Condenser Type Default386 (kWh/HP)
Refrigerator (Medium Temp) Freezer (Low Temp) Temp Unknown
Allentown 505 703 568
Erie 559 730 614
Harrisburg 458 680 529
Philadelphia 416 660 494
Pittsburgh 491 697 557
Scranton 564 732 618
Williamsport 540 720 598
D E F A U L T S A V I N G S
There are no default savings for this measure.
E V A L U A T I O N P R O T O C O L S
384 Energy & Resource Solutions (2005). Measure Life Study. Prepared for the Massachusetts Joint Utilities; Table 1-1.385 An evaporator fan controller is a device or system that lowers airflow across an evaporator in medium-temperature walk-in coolers when there is no refrigerant flow through the evaporator (i.e., when the compressor is in an off-cycle).386 The assumptions and algorithms used in this section are specific to NRM products and are taken from the Massachusetts Statewide Technical Reference Manual for Estimating Savings from Energy Efficiency Measures, 2012.
SECTION 2: Residential MeasuresMiscellaneous Page 407
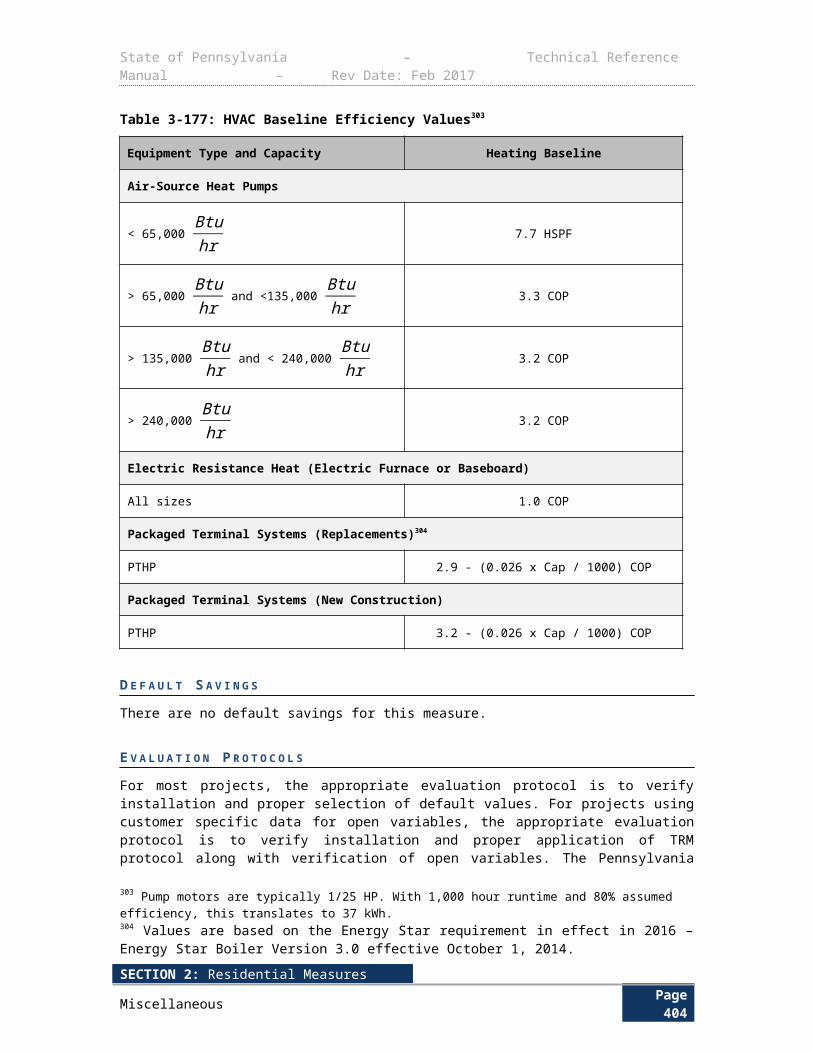
State of Pennsylvania – Technical Reference Manual – Rev Date: Feb 2017
For most projects, the appropriate evaluation protocol is to verify installation and proper selection of default values. For projects using customer specific data for open variables, the appropriate evaluation protocol is to verify installation and proper application of TRM protocol along with verification of open variables. The Pennsylvania Evaluation Framework provides specific guidelines and requirements for evaluation procedures.
S O U R C E S
1) Technical Forum (RTF) as part of the Northwest Power & Conservation Council, Deemed Measures List. Grocery Floating Head Pressure Controls for Single Compressor Systems, FY2010, V1. Using RTF Deemed saving estimates for the NW climate zone, data was extrapolated to Pennsylvania climate zones by using cooling degree days comparison based on the locale.
2) The given COP values are averaged based on the data from: Regional Technical Forum (RTF) as part of the Northwest Power & Conservation Council, Deemed Measures List. Grocery Floating Head Pressure Controls for Single Compressor Systems, FY2010, V1.
3) Conversion factor for compressor horsepower per ton: http://www.engineeringtoolbox.com/refrigeration-formulas-d_1695.html
SECTION 2: Residential MeasuresMiscellaneous Page 408
State of Pennsylvania – Technical Reference Manual – Rev Date: Feb 2017
3.5.6 CONTROLS: ANTI-SWEAT HEATER CONTROLS
Measure Name Anti-Sweat Heater Controls
Target Sector Commercial and Industrial Establishments
Measure Unit Case door
Unit Energy Savings Variable
Unit Peak Demand Reduction Variable
Measure Life 12 years387
Measure Vintage Retrofit
E L I G I B I L I T Y
Anti-sweat heater (ASH) controls sense the humidity in the store outside of reach-in, glass door refrigerated cases and turn off anti-sweat heaters during periods of low humidity. Without controls, anti-sweat heaters run continuously whether they are necessary or not. Savings are realized from the reduction in energy used by not having the heaters running at all times. In addition, secondary savings result from reduced cooling load on the refrigeration unit when the heaters are off. The ASH control is applicable to glass doors with heaters, and the savings given below are based on adding controls to doors with uncontrolled heaters. The savings calculated from these algorithms is on a per door basis for two temperatures: Refrigerator/Coolers and Freezers. A default value to be used when the case service temperature is unknown is also calculated. Furthermore, impacts are calculated for both a per-door and a per-linear-feet of case unit basis, because both are used for Pennsylvania energy efficiency programs.
A L G O R I T H M S
Refrigerator/Cooler
kWh perunit ¿kW coolerbase
Doo rFt× ( 8,760×CHAoff )×(1+
Rh
COPcool)
∆ kW peak per unit¿kW coolerbase
DoorFt×CHPoff×(1+
Rh
COPcool)×DF
∆ kWh ¿N ×kWh perunit
∆ kW peak ¿N ×∆ kW peak perunit
387 Grocery Floating Head Pressure Controls for Single Compressor Systems, FY2010, V1.3. Accessed from RTF website http://rtf.nwcouncil.org/measures/measure.asp?id=108&decisionid=444 on September 06, 2011.
SECTION 2: Residential MeasuresMiscellaneous Page 409
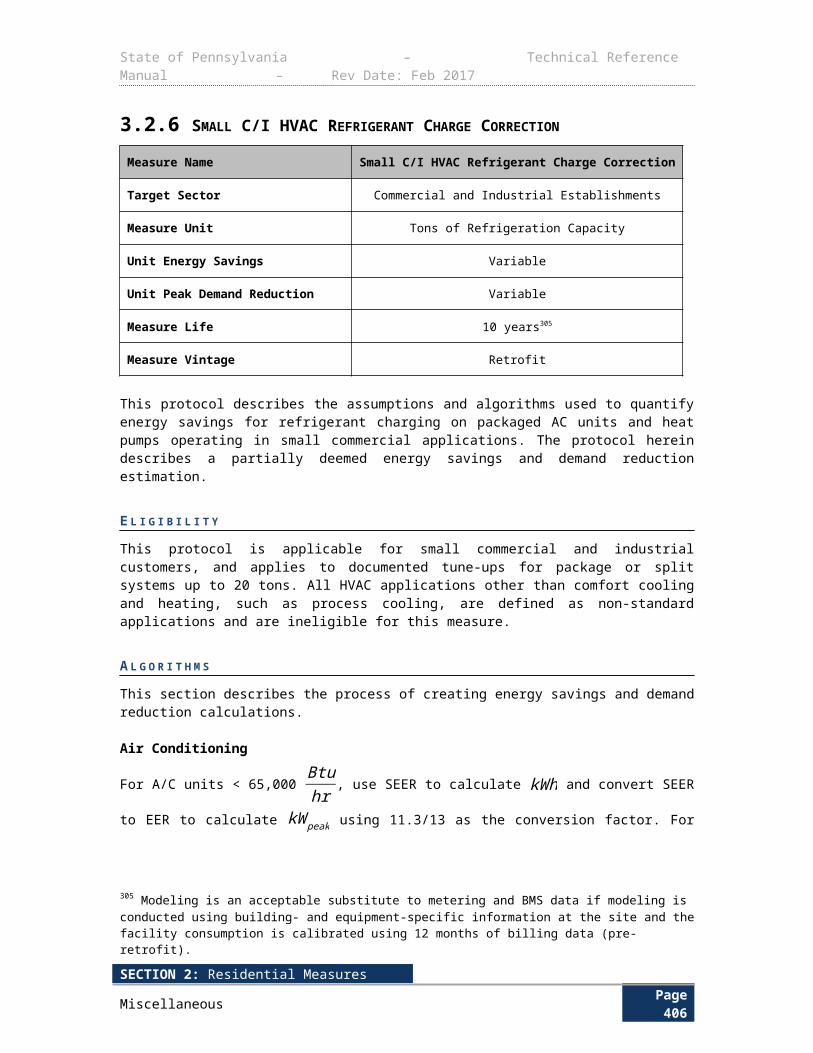
State of Pennsylvania – Technical Reference Manual – Rev Date: Feb 2017
Freezer
kWh perunit ¿kW freezerbase
DoorFt× ( 8,760×FHA off )×(1+
Rh
COPfreeze)
∆ kW peak per unit¿kW freezerbase
DoorFt×FHPoff×( Rh
COPfreeze)×DF
∆ kWh ¿N ×kWh perunit
∆ kW peak ¿N ×∆ kW peak perunit
Default (case service temperature is unknown)This algorithm should only be used when the refrigerated case type or service temperature is unknown or this information is not tracked as part of the EDC data collection.
kWh perunit ¿ (1−PctCooler )×kWhfreezerDoorFt
+PctCooler×kWhcooler
DoorFt
∆ kW peak per unit ¿ (1−PctCooler )×kW freezer
DoorFt+PctCooler×kW cooler
DoorFt
∆ kWh ¿N ×kWh perunit
∆ kW peak ¿N ×∆ kW peak perunit
D E F I N I T I O N O F T E R M S
Table 3-237 Anti-Sweat Heater Controls – Values and References
Term Unit Values Source
N , Number of doors or case length in linear feet having ASH controls installed
None# of doors or case length in linear feet
EDC Data Gathering
Rh, Residual heat fraction; estimated percentage of the heat produced by the heaters that remains in the freezer or cooler case and must be removed by the refrigeration unit
None 0.65 1
Unit , Refrigeration unit Door or ftDoor = 1Linear Feet = 2.5
2
8,760, Hours in a yearHoursyear
8,760 Conversion Factor
Refrigerator/Cooler
kW cooler base, Per door power consumption of cooler kW 0.109 1
SECTION 2: Residential MeasuresMiscellaneous Page 410
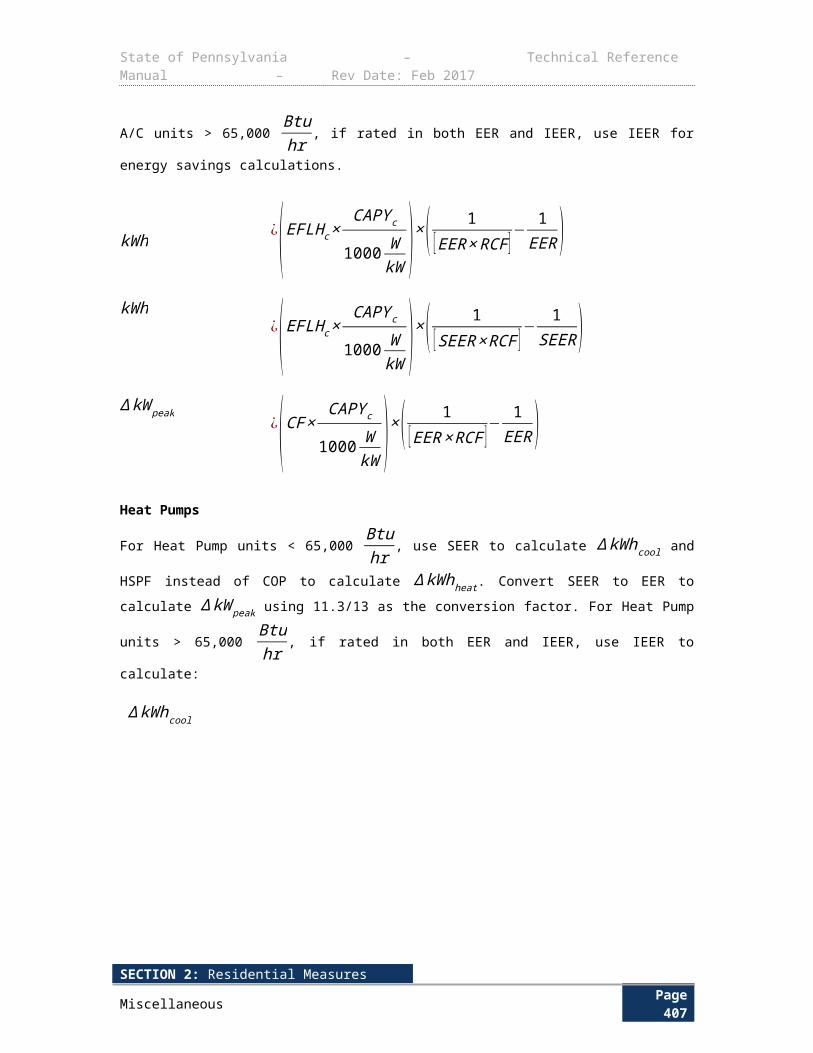
State of Pennsylvania – Technical Reference Manual – Rev Date: Feb 2017
Term Unit Values Source
case ASHs without controls
CHPoff , Percent of time cooler case ASH with controls will be off during the peak period
None 20% 1
CHAoff , Percent of time cooler case ASH with controls will be off annually
None 85% 1
DFcool, Demand diversity factor of cooler, accounting for the fact that not all anti-sweat heaters in all buildings in the population are operating at the same time.
None 1 3
COPcool, Coefficient of performance of cooler None 2.5 1
Freezer
kW freezerbase, Per door power consumption of freezer case ASHs without controls
kW 0.191 1
FHPoff , Percent of time freezer case ASH with controls will be off during the peak period
None 10% 1
FHAoff , Percent of time freezer case ASH with controls will be off annually
None 75% 1
DF freeze, Demand diversity factor of freezer, accounting for the fact that not all anti-sweat heaters in all buildings in the population are operating at the same time.
None 1 3
COP freeze, Coefficient of performance of freezer None 1.3 1
PctCooler, Typical percent of cases that are medium-temperature refrigerator/cooler cases
None 68% 4
D E F A U L T S A V I N G S
SECTION 2: Residential MeasuresMiscellaneous Page 411
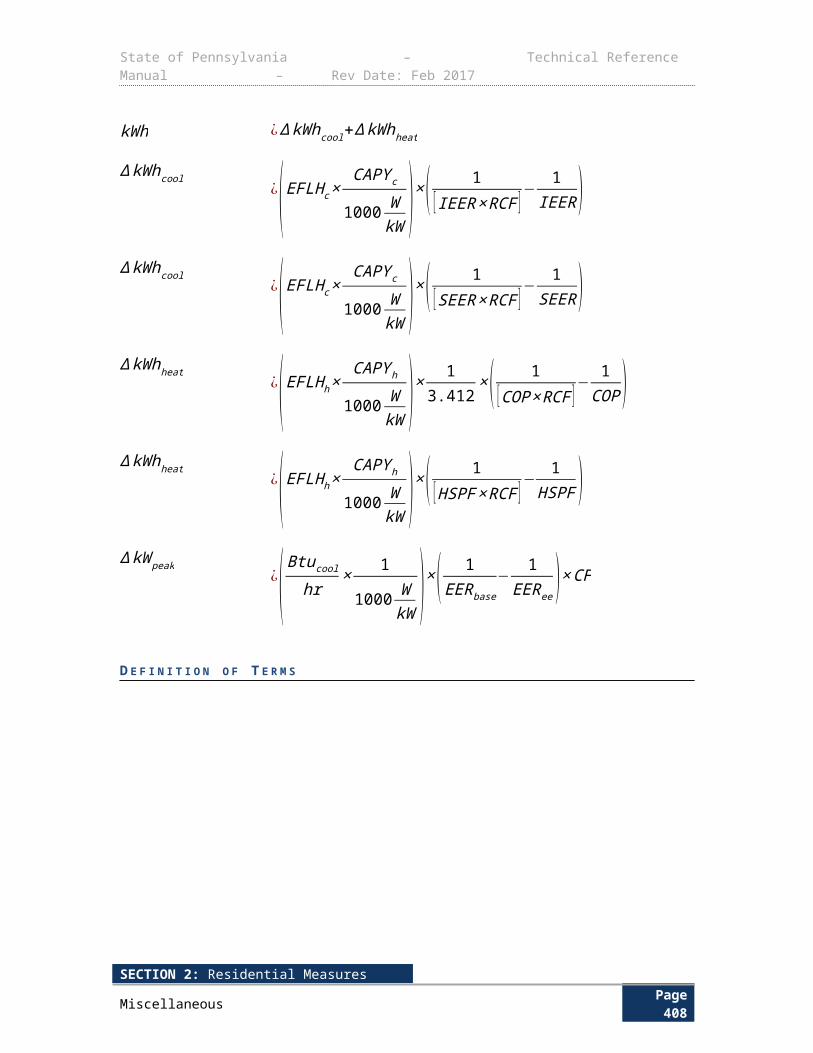
State of Pennsylvania – Technical Reference Manual – Rev Date: Feb 2017
Table 3-238: Recommended Fully Deemed Impact Estimates
DescriptionPer Door
Impact
Per Linear Ft of Case
Impact
Refrigerator/Cooler
Energy Impact 1,023 kWh per door 409 kWh per linear ft.
Peak Demand Impact 0.0275 kW per door 0.0110 kW per linear ft.
Freezer
Energy Impact 1,882 kWh per door 753 kWh per linear ft.
Peak Demand Impact 0.0287 kW per door 0.0115 kW per linear ft.
Default (case service temperature unknown)
Energy Impact 1,298 kWh per door 519 kWh per linear ft.
Peak Demand Impact 0.0279 kW per door 0.0112 kW per linear ft.
E V A L U A T I O N P R O T O C O L S
For most projects, the appropriate evaluation protocol is to verify installation and proper selection of default values. For projects using customer specific data for open variables, the appropriate evaluation protocol is to verify installation and proper application of TRM protocol along with verification of open variables. The Pennsylvania Evaluation Framework provides specific guidelines and requirements for evaluation procedures.
S O U R C E S
1) State of Wisconsin, Public Service Commission of Wisconsin, Focus on Energy Evaluation, Business Programs Deemed Savings Manual, March 22, 2010. https://focusonenergy.com/sites/default/files/bpdeemedsavingsmanuav10_evaluationreport.pdf
a) Three door heating configurations are presented in this reference: Standard, low-heat, and no-heat. The standard configuration was chosen on the assumption that low-heat and no-heat door cases will be screened from participation.
2) Review of various manufacturers’ web sites yields 2.5’ average door length. Sites include:
b) http://www.bushrefrigeration.com/bakery_glass_door_coolers.php
c) http://www.brrr.cc/home.php?cat=427
d) http://refrigeration-equipment.com/gdm_s_c_series_swing_door_reac.html
3) New York Standard Approach for Estimating Energy Savings from Energy Efficiency Measures in Commercial and Industrial Programs, Sept 1, 2009. http://www3.dps.ny.gov/W/PSCWeb.nsf/0/06f2fee55575bd8a852576e4006f9af7/$FILE/TechManualNYRevised10-15-10.pdf
4) 2010 ASHRAE Refrigeration Handbook, page 15.1 “Medium- and low-temperature display refrigerator line-ups account for roughly 68 and 32%, respectively, of a typical supermarket’s total display refrigerators.”
SECTION 2: Residential MeasuresMiscellaneous Page 412

State of Pennsylvania – Technical Reference Manual – Rev Date: Feb 2017
SECTION 2: Residential MeasuresMiscellaneous Page 413
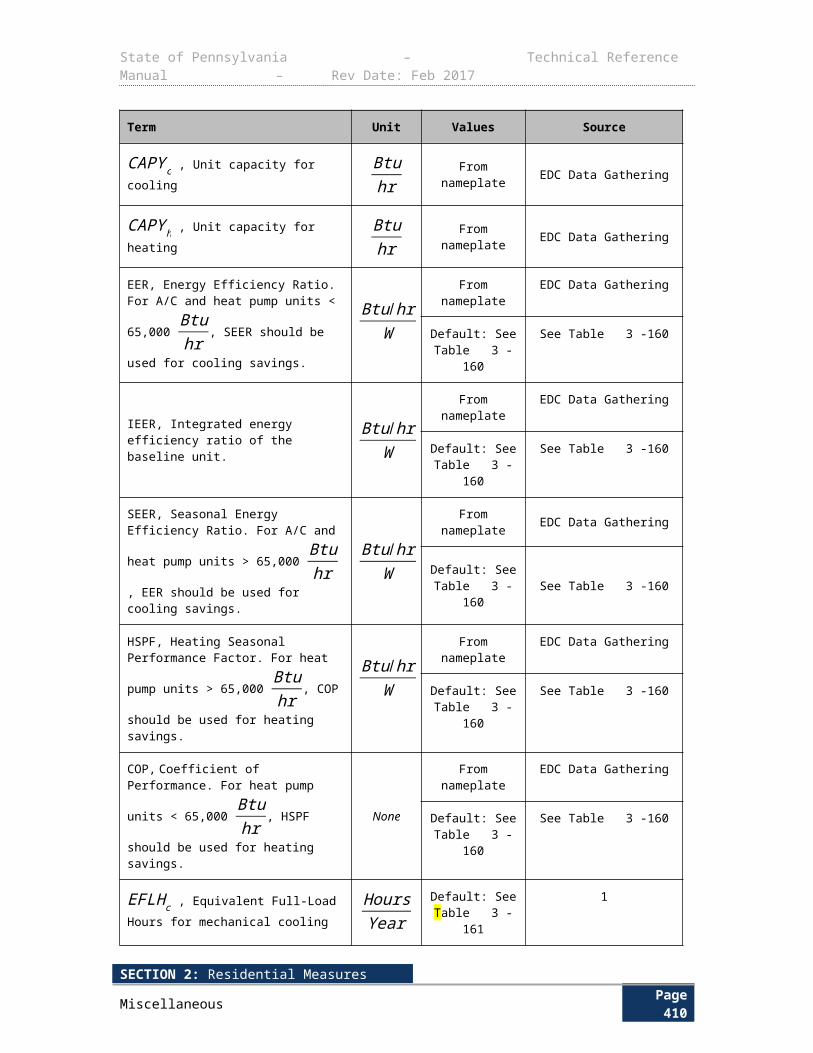
State of Pennsylvania – Technical Reference Manual – Rev Date: Feb 2017
3.5.7 CONTROLS: EVAPORATOR COIL DEFROST CONTROL
Measure Name Controls: Evaporator Coil Defrost Control
Target Sector Commercial and Industrial Establishments
Measure Unit Evaporator Coil Defrost Control
Unit Energy Savings Variable
Unit Peak Demand Reduction Variable
Measure Life 10 years388
Measure Vintage Retrofit
This protocol applies to electric defrost control on small commercial walk-in cooler and freezer systems. A freezer refrigeration system with electric defrost is set to run the defrost cycle periodically throughout the day. A defrost control uses temperature and pressure sensors to monitor system processes and statistical modeling to learn the operation and requirements of the system. When the system calls for a defrost cycle, the controller determines if it is necessary and skips the cycle if it is not.
E L I G I B I L I T Y
This measure is targeted to non-residential customers whose equipment uses electric defrost controls on small commercial walk-in freezer systems.
Acceptable baseline conditions are existing small commercial walk-in coolers or freezers without defrost controls.
Efficient conditions are small commercial walk-in coolers or freezers with defrost controls installed.
A L G O R I T H M S
∆ kW peak ¿FANS×kW DE×SVG×BF
kWh ¿∆ kW peak×HOURS
D E F I N I T I O N O F T E R M S
388 Also called as flood back control
SECTION 2: Residential MeasuresMiscellaneous Page 414
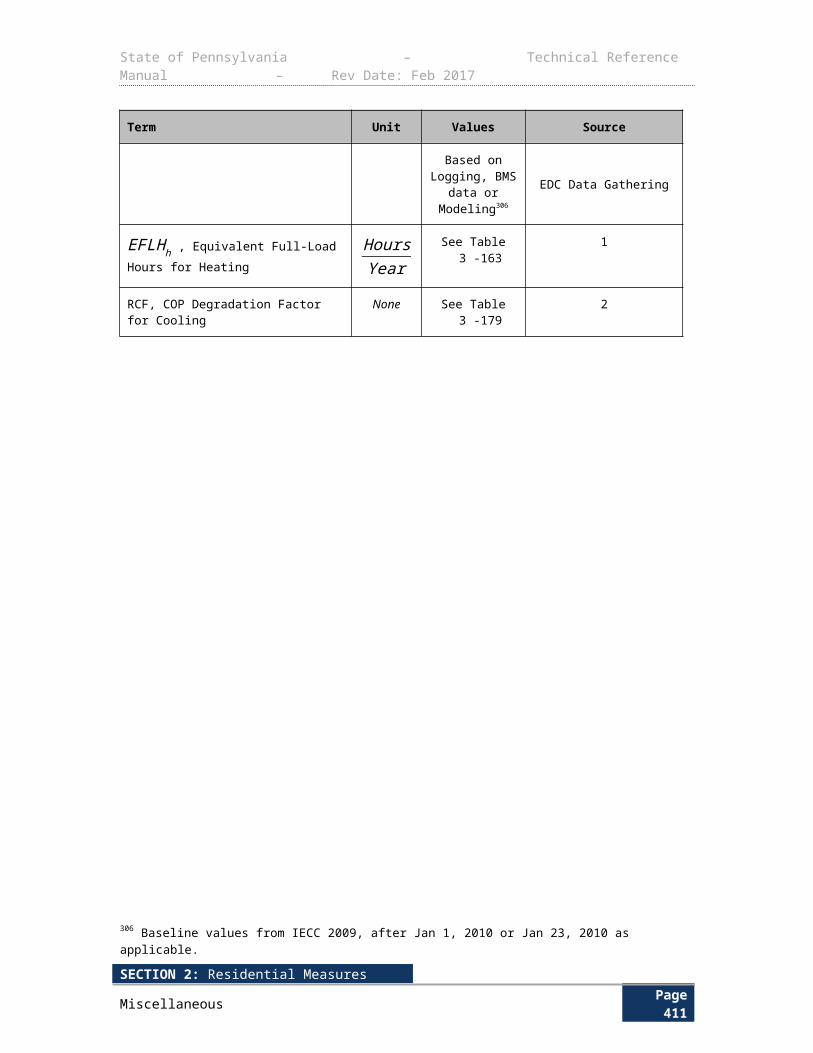
State of Pennsylvania – Technical Reference Manual – Rev Date: Feb 2017
Table 3-239: Evaporator Coil Defrost Control – Values and References
Term Unit Values Source
FANS , Number of evaporator fans Fan EDC Data Gathering EDC Data Gathering
kW DE , kW of defrost element kWEDC Data Gathering
Default: 0.9
EDC Data Gathering
1
SVG, Savings percentage for reduced defrost cycles
None 30% 2
BF , Savings factor for reduced cooling load from eliminating heat generated by the defrost element
None See Table 3-240 3
HOURS , Average annual full load defrost hours
Hoursyear
EDC Data Gathering
Default: 487
EDC Data Gathering
4
Table 3-240: Savings Factor for Reduced Cooling Load
Equipment Type Savings Factor for Reduced Cooling Load (BF)
Cooler 1.3
Freezer 1.67
D E F A U L T S A V I N G S
Default savings may be claimed using the algorithms above and the variable defaults. EDCs may also claim savings using customer specific data.
E V A L U A T I O N P R O T O C O L S
For most projects, the appropriate evaluation protocol is to verify installation and proper selection of default values. For projects using customer specific data for open variables, the appropriate evaluation protocol is to verify installation and proper application of TRM protocol along with verification of open variables. The Pennsylvania Evaluation Framework provides specific guidelines and requirements for evaluation procedures.
S O U R C E S
1) Efficiency Vermont Technical Reference Manual, 2013. The total Defrost Element kW is proportional to the number of evaporator fans blowing over the coil. The typical wattage of the defrost element is 900W per fan. See Bohn <Bohn Evap 306-0D.pdf> and Larkin <LC-03A.pdf>specifications.
2) Smart defrost kits claim 30-40% savings (with 43.6% savings by third party testing by Intertek Testing Service). MasterBilt Demand defrost claims 21% savings for northeast. Smart Defrost Kits are more common so the assumption of 30% is a conservative estimate.
SECTION 2: Residential MeasuresMiscellaneous Page 415
State of Pennsylvania – Technical Reference Manual – Rev Date: Feb 2017
3) ASHRAE Handbook 2006 Refrigeration, Section 46.15 Figure 24.
4) Efficiency Vermont Technical Reference Manual, 2013. The refrigeration system is assumed to be in operation every day of the year, while savings from the evaporator coil defrost control will only occur during set defrost cycles. This is assumed to be (4) 20-minute cycles per day, for a total of 487 hours.
SECTION 2: Residential MeasuresMiscellaneous Page 416
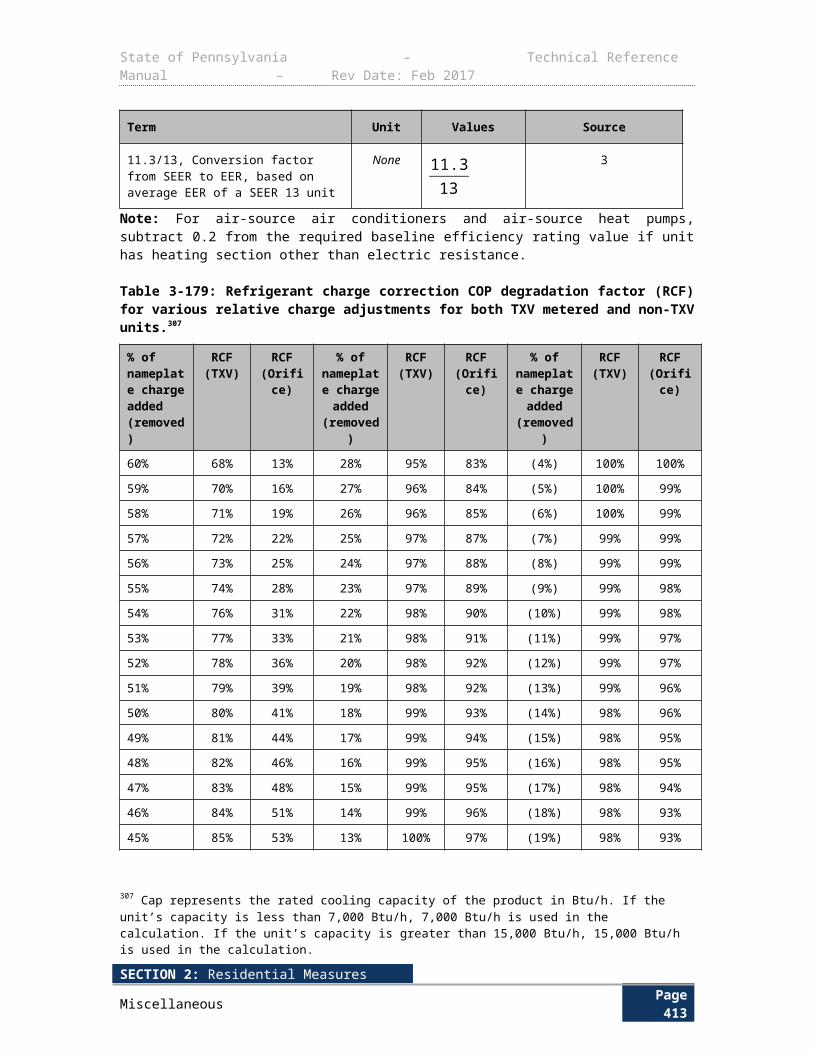
State of Pennsylvania – Technical Reference Manual – Rev Date: Feb 2017
3.5.8 VARIABLE SPEED REFRIGERATION COMPRESSOR
Measure Name VSD Refrigeration Compressor
Target Sector Commercial and Industrial Establishments
Measure Unit VSD Refrigeration Compressor
Unit Energy Savings Variable
Unit Peak Demand Reduction Variable
Measure Life 15 years389
Measure Vintage Retrofit
Variable speed drive (VSD) compressors are used to control and reduce the speed of the compressor during times when the refrigeration system does not require the motor to run at full capacity. VSD control is an economical and efficient retrofit option for existing compressor installations. The performance of variable speed compressors can more closely match the variable refrigeration load requirements thus minimizing energy consumption.
E L I G I B I L I T Y
This measure, VSD control for refrigeration systems and its eligibility targets applies to retrofit construction in the commercial and industrial building sectors; it is most applicable to grocery stores or food processing applications with refrigeration systems. This protocol is for a VSD control system replacing a slide valve control system.
A L G O R I T H M S
The savings algorithms are as follows:
If the refrigeration system is rated in tonnage:
kWh ¿Tons× ESvalue
∆ kW peak ¿Tons× DSvalue
If the refrigeration system is rated in horsepower:
kWh ¿0.445×HPcompressor× ESvalue
∆ kW peak ¿0.445×HPcompressor×DSvalue
389 Default based on: 2010 ASHRAE Refrigeration Handbook, page 15.1 “Medium- and low-temperature display refrigerator line-ups account for roughly 68% and 32%, respectively, of a typical supermarket’s total display refrigerators.”
SECTION 2: Residential MeasuresMiscellaneous Page 417
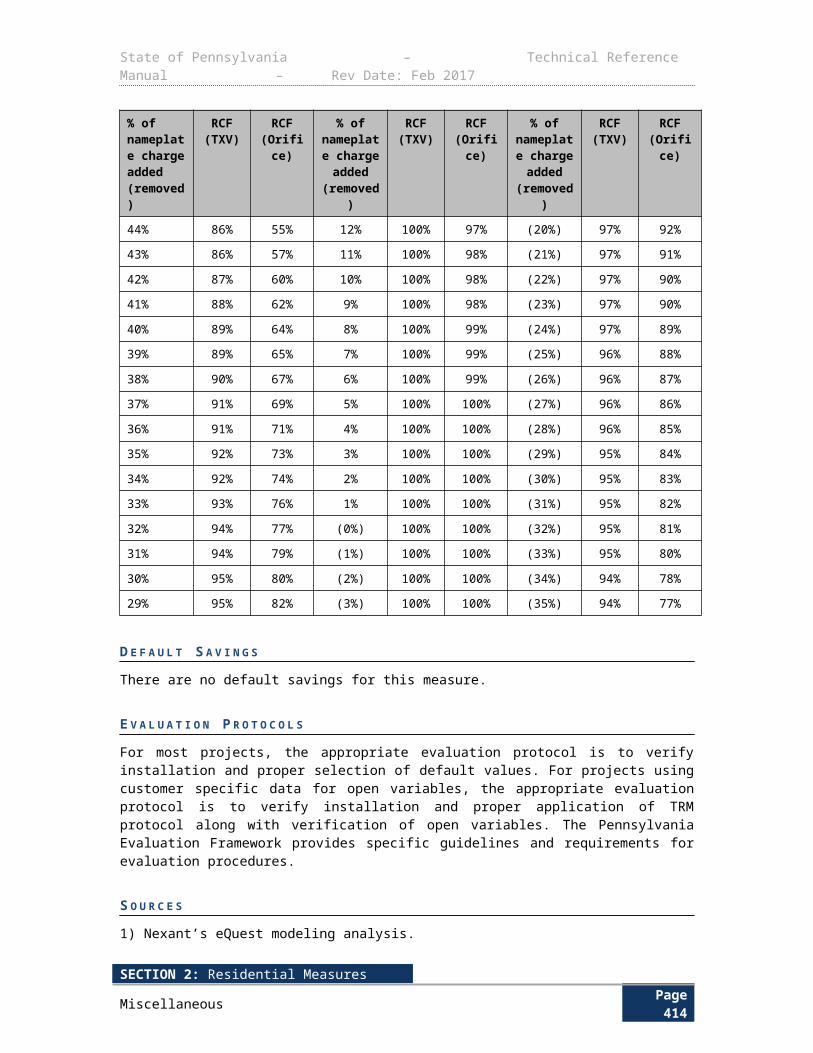
State of Pennsylvania – Technical Reference Manual – Rev Date: Feb 2017
D E F I N I T I O N O F T E R M S
Table 3-241: VSD Compressor – Values and References
Term Unit Values Sources
Tons, Refrigeration tonnage of the system
ton EDC Data Gathering EDC Data Gathering
HPcompressor, Rated horsepower per compressor
HP EDC Data Gathering EDC Data Gathering
ESvalue, Energy savings value in kWh per compressor HP
kWhton
1,696 1
DSvalue, Demand savings value in kW per compressor HP
kWton
0.22 1
0.445, Conversion factor to convert from ton to HP
tonHP
0.445 2,3
D E F A U L T S A V I N G S
There are no default savings for this measure.
E V A L U A T I O N P R O T O C O L S
For most projects, the appropriate evaluation protocol is to verify installation and proper selection of default values. For projects using customer specific data for open variables, the appropriate evaluation protocol is to verify installation and proper application of TRM protocol along with verification of open variables. The Pennsylvania Evaluation Framework provides specific guidelines and requirements for evaluation procedures.
S O U R C E S
1) 2005 DEER (Database for Energy Efficiency Resources). This measure considered the associated savings by vintage and by climate zone for compressors. The deemed value was an average across all climate zones390 and all vintages (excluding new construction). http://www.deeresources.com/index.php/deer2005
2) PSC of Wisconsin, Focus on Energy Evaluation, Business Programs: Deemed Savings Manual V1.0, p. 4-103 to 4-106. Where refrigerator (medium temp: 28 °F – 40 °F) COP equals 2.5 and freezer COP (low temp: -20 °F – 0 °F) equals 1.3. The weighted average COP equals 2.1, based on 2010 ASHRAE Refrigeration Handbook, page 15.1 “Medium- and low-temperature display refrigerator line-ups account for roughly 68% and 32%, respectively, of a typical supermarket’s total display refrigerators.”
3) Conversion factor for compressor horsepower per ton is HP/ton = 4.715/COP, using weighted average COP of 2.1. From http://www.engineeringtoolbox.com/refrigeration-formulas-d_1695.html
390 Ibid.
SECTION 2: Residential MeasuresMiscellaneous Page 418

State of Pennsylvania – Technical Reference Manual – Rev Date: Feb 2017
3.5.9 STRIP CURTAINS FOR WALK-IN FREEZERS AND COOLERS
Measure Name Strip Curtains for Walk-In Coolers and Freezers
Target Sector Commercial and Industrial Establishments
Measure Unit Walk-in unit door
Unit Energy Savings Fixed
Unit Peak Demand Reduction Fixed
Measure Life 4 years391
Measure Vintage Retrofit
Strip curtains are used to reduce the refrigeration load associated with the infiltration of non-refrigerated air into the refrigerated spaces of walk-in coolers or freezers.
The primary cause of air infiltration into walk-in coolers and freezers is the air density difference between two adjacent spaces of different temperatures. The total refrigeration load due to infiltration through the main door into the unit depends on the temperature differential between the refrigerated and non-refrigerated airs, the door area and height, and the duration and frequency of door openings. The avoided infiltration depends on the efficacy of the newly installed strip curtains as infiltration barriers,392 and on the efficacy of the supplanted infiltration barriers, if applicable. The calculation of the refrigeration load due to air infiltration and the energy required to meet that load is rather straightforward, but relies on critical assumptions regarding the aforementioned operating parameters. All the assumptions in this protocol are based on values that were determined by direct measurement and monitoring of over 100 walk-in units in the 2006-2008 evaluation for the CA Public Utility Commission.393
E L I G I B I L I T Y This protocol documents the energy savings attributed to strip curtains applied on walk-in cooler and freezer doors in commercial applications. The most likely areas of application are large and small grocery stores, supermarkets, restaurants, and refrigerated warehouses. The baseline case is a walk-in cooler or freezer that previously had either no strip curtain installed or an old, ineffective strip curtain installed. The efficient equipment is a strip curtain added to a walk-in cooler or freezer. Strip curtains must be at least 0.06 inches thick. Low temperature strip curtains must be used on low temperature applications.394
391 No data available to predict if condensing units or remote condensers will be more prevalent, assumed 50/50 split, based on discussion with Portland Energy Conservation, Inc. (PECI) GrocerySmart staff. 392 DEER 2014 Effective Useful Life.393 Estimate from Heatcraft based on expected component expected life. The only moving part is a relay which has a cycle life that is well over 15 years based on the frequency of the relay operation.394 DEER 2014 Effective Useful Life.
SECTION 2: Residential MeasuresMiscellaneous Page 419
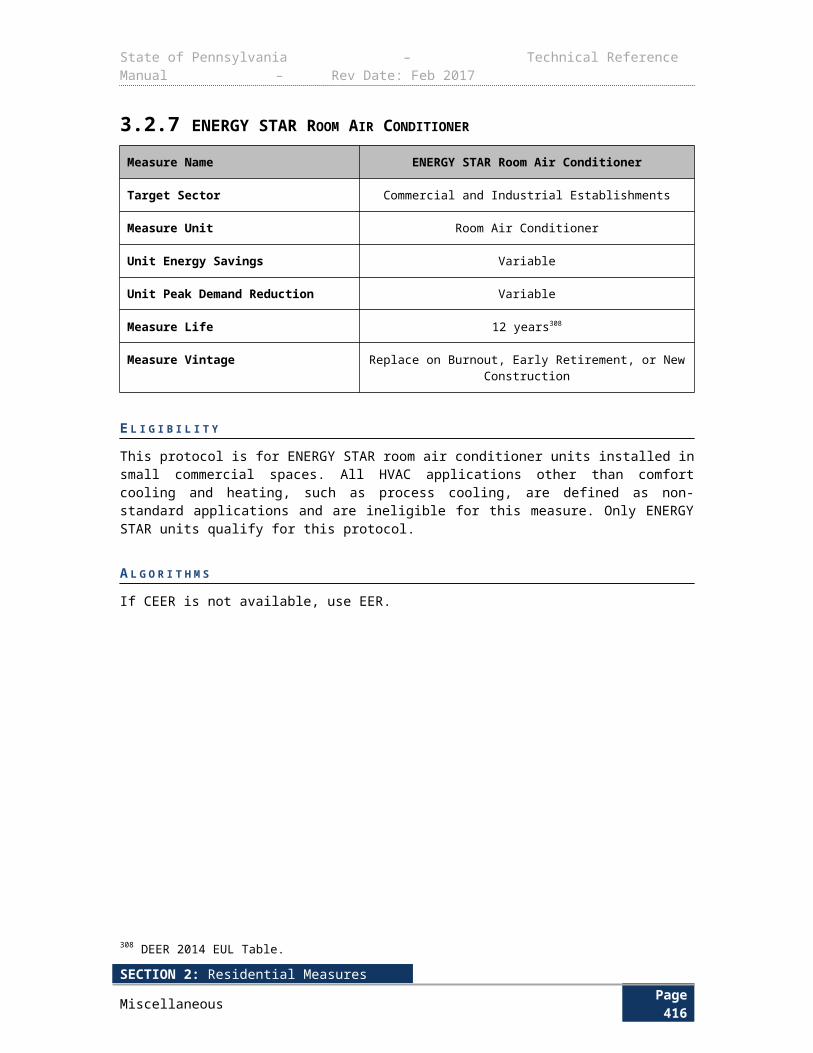
State of Pennsylvania – Technical Reference Manual – Rev Date: Feb 2017
A L G O R I T H M S
kWh ¿ ∆kWhsqft
× A
∆ kW peak ¿ ∆kWsqft
× A
The annual energy savings due to infiltration barriers is quantified by multiplying savings per square foot by area using assumptions for independent variables described in the protocol introduction. The source algorithm from which the savings per square foot values are determined is based on Tamm’s equation395 (an application of Bernoulli’s equation) and the ASHRAE handbook.396 To the extent that evaluation findings are able to provide more reliable site specific inputs assumptions, they may be used in place of the default per square foot savings using the following equation.
kWhsqft ¿
365×t open× (ηnew−ηold )×20×CD× A× {[ (T i−T r )T i ]×g×H }
0.5
× [ ρi×hi−ρr×hr ]
3,412 BtukWh×COPadj× A
The peak demand reduction is quantified by multiplying savings per square foot by area. The source algorithm is the annual energy savings divided by 8,760. This assumption is based on general observation that refrigeration is constant for food storage, even outside of normal operating conditions. This is the most conservative approach in lieu of a more sophisticated model.
∆kW peak
sqft¿ ∆kWh
8,760
The ratio of the average energy usage during Peak hours to the total annual energy usage is taken from the load shape data collected by ADM for a recent evaluation for the CA Public Utility Commission397 in the study of strip curtains in supermarkets, convenience stores, and restaurants.
395 The deemed savings was averaged across all climate zones since the variance between all cases was less than 5%.396 DEER 2014 Effective Useful Life. 397 We define curtain efficacy as the fraction of the potential airflow that is blocked by an infiltration barrier. For example, a brick wall would have an efficacy of 1.0, while the lack of any infiltration barrier corresponds to an efficacy of 0.
SECTION 2: Residential MeasuresMiscellaneous Page 420
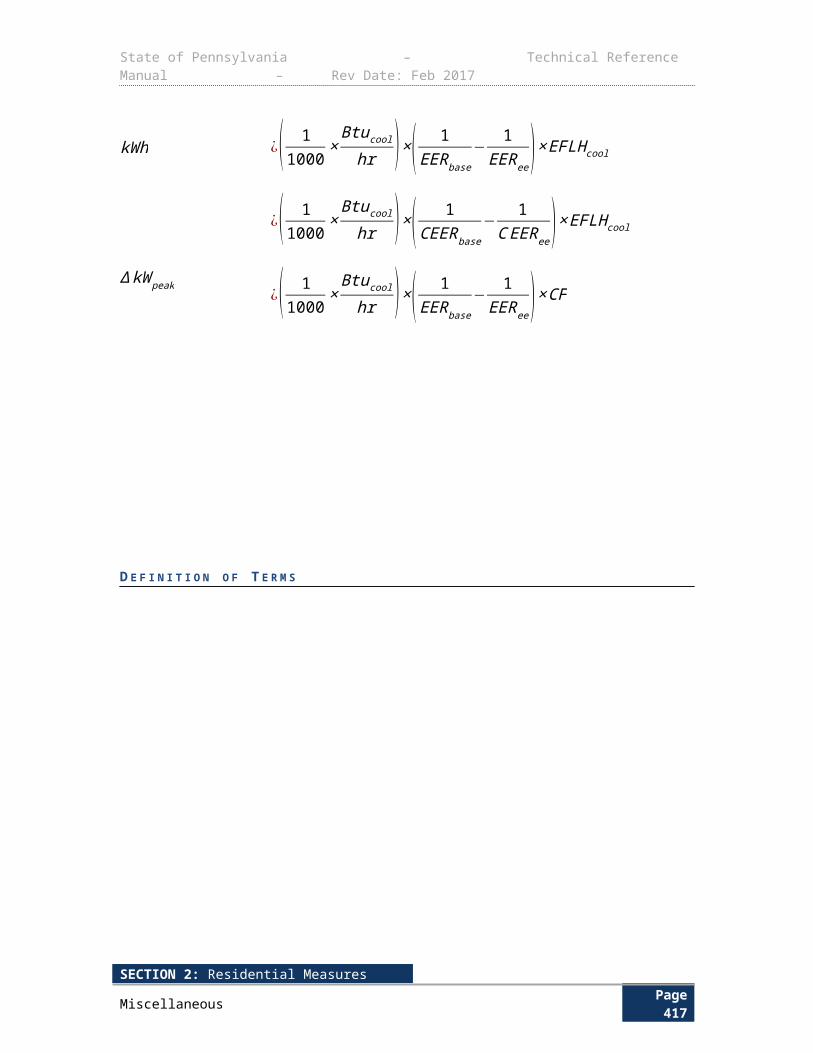
State of Pennsylvania – Technical Reference Manual – Rev Date: Feb 2017
D E F I N I T I O N O F T E R M S
Table 3-242: Strip Curtain Calculation Assumptions
Term Unit Values Source
∆kWhft2
, Average annual kWh savings per
square foot of infiltration barrier
∆kWhft2
Calculated Calculated
∆kWft2 , Average kW savings per square
foot of infiltration barrier
∆kWft2
Calculated Calculated
20, Product of 60 seconds per minute and an integration factor of 1/3
secmin
20 4
g, Gravitational constant fts2
32.174 Constant
3,412, Conversion factor: number of Btus in one kWh
BtukWh
3,412 Conversion factor
D E F A U L T S A V I N G S
The default savings values are listed in Table 3-243. Default parameters used in the source equations are listed in Table 3-244, Table 3-245, Table 3-246, and Table 3-247. The source equations and the values for the input parameters are adapted from the 2006-2008 California Public Utility Commission’s evaluation of strip curtains.398 The original work included 8,760-hourly bin calculations. The values used herein represent annual average values. For example, the differences in the temperature between the refrigerated and infiltrating airs are averaged over all times that the door to the walk-in unit is open. Recommendations made by the evaluation team have been adopted to correct for errors observed in the ex ante savings calculation.
As for the verified savings for all strip curtains installed in the refrigerated warehouses, the study found several issues that resulted in low realization rates despite the relatively high savings if the curtains are found to be installed in an actual warehouse. The main factor was the misclassification of buildings with different end-use descriptions as refrigerated warehouses. For example, the EM&C contractor found that sometimes the facilities where the curtains were installed were not warehouses at all, and sometimes the strip curtain installations were not verified. The Commission, therefore, believes that the savings for strip curtains installed at an actual refrigerated warehouse should be much higher. To accurately estimate savings for this measure, the Commission encourages the EDCs to use billing analysis for refrigerated warehouses for projects selected in the evaluation sample.
398 See source 1 for Table 3-192
SECTION 2: Residential MeasuresMiscellaneous Page 421
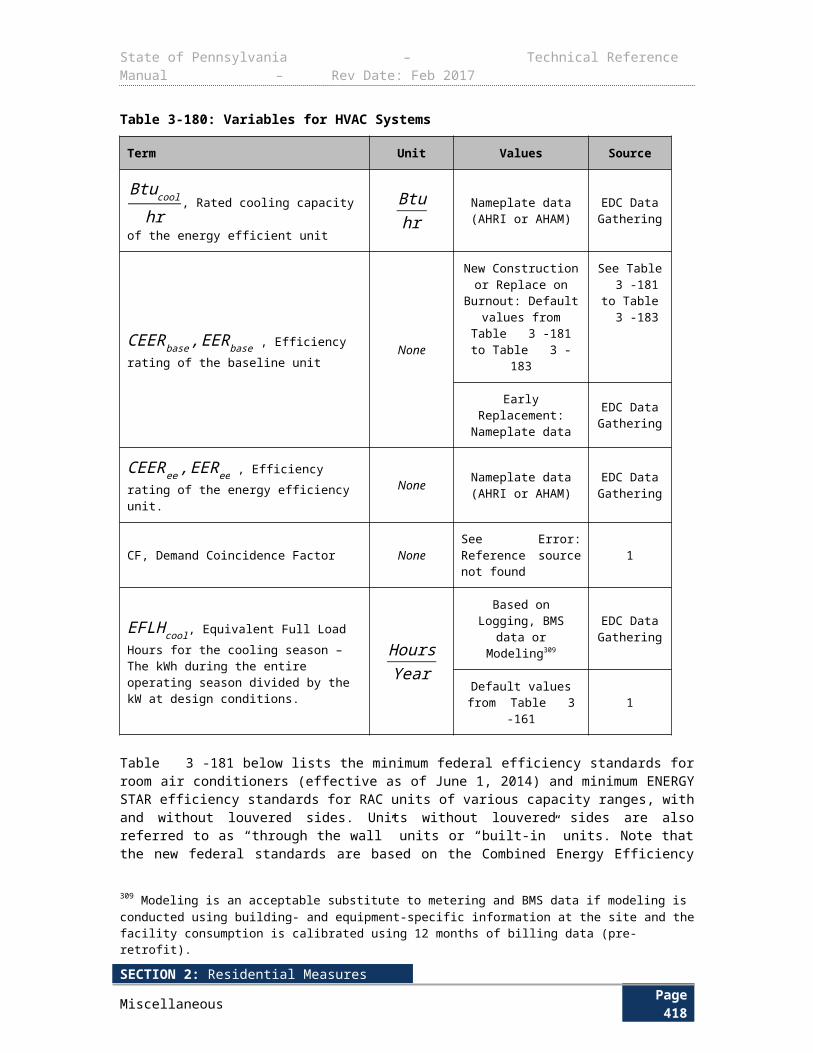
State of Pennsylvania – Technical Reference Manual – Rev Date: Feb 2017
Table 3-243: Default Energy Savings and Demand Reductions for Strip Curtains
Type Pre-existing Curtains
Energy Savings ∆kWhft2
Demand Savings ∆kWhft2
Supermarket - Cooler Yes 37 0.0042
Supermarket - Cooler No 108 0.0123
Supermarket - Cooler Unknown 108 0.0123
Supermarket - Freezer Yes 119 0.0136
Supermarket - Freezer No 349 0.0398
Supermarket - Freezer Unknown 349 0.0398
Convenience Store - Cooler Yes 5 0.0006
Convenience Store - Cooler No 20 0.0023
Convenience Store - Cooler Unknown 11 0.0013
Convenience Store - Freezer Yes 8 0.0009
Convenience Store - Freezer No 27 0.0031
Convenience Store - Freezer Unknown 17 0.0020
Restaurant - Cooler Yes 8 0.0009
Restaurant - Cooler No 30 0.0034
Restaurant - Cooler Unknown 18 0.0020
Restaurant - Freezer Yes 34 0.0039
Restaurant - Freezer No 119 0.0136
Restaurant - Freezer Unknown 81 0.0092
Refrigerated Warehouse Yes 254 0.0290
Refrigerated Warehouse No 729 0.0832
Refrigerated Warehouse Unknown 287 0.0327
SECTION 2: Residential MeasuresMiscellaneous Page 422
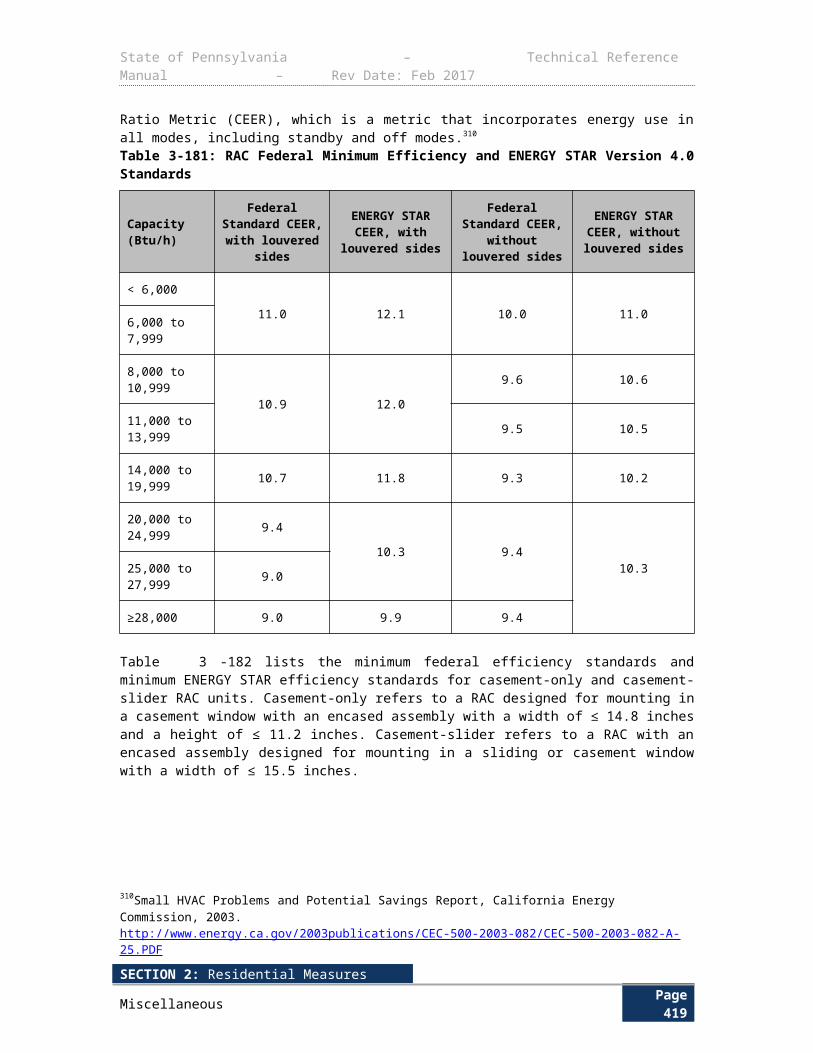
State of Pennsylvania – Technical Reference Manual – Rev Date: Feb 2017
Table 3-244: Strip Curtain Calculation Assumptions for Supermarkets
SECTION 2: Residential MeasuresMiscellaneous Page 423
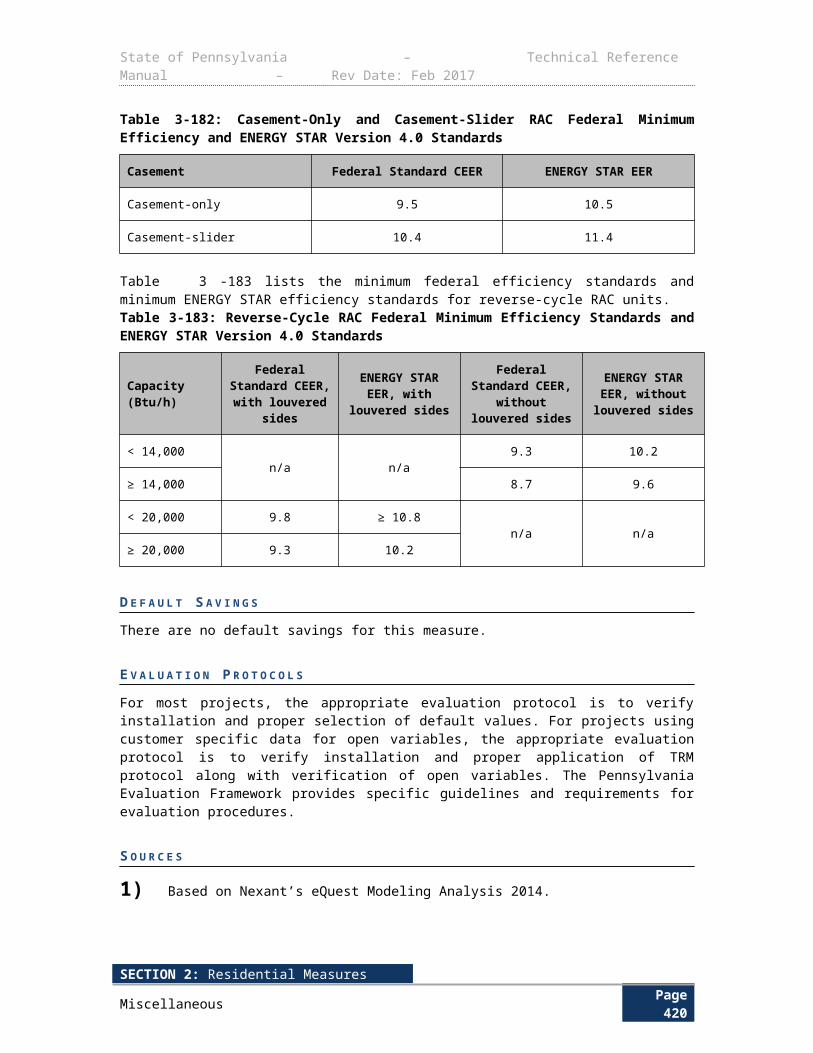
State of Pennsylvania – Technical Reference Manual – Rev Date: Feb 2017
Term Unit
Values
SourceCooler Freezer
ηnew, Efficacy of the new strip curtain – an efficacy of 1 corresponds to the strip curtain thwarting all infiltration, while an efficacy of zero corresponds to the absence of strip curtains.
None 0.88 0.88 1
ηold ,Efficacy of the old strip curtain
with Pre-existing curtain
with no Pre-existing curtain
unknown
None 0.58
0.00
0.00
0.58
0.00
0.00
1
Cd , Discharge Coefficient: empirically determined scale factors that account for differences between infiltration as rates predicted by application Bernoulli’s law and actual observed infiltration rates
None 0.366 0.415 1
t open , Minutes walk-in door is open per day minutesday
132 102 1
A , Doorway area ft2 35 35 1
H , Doorway height ft 7 7 1
T i, Dry-bulb temperature of infiltrating air, Rankine
= Fahrenheit + 459.67
° F 71 67 1 and 2
T r, Dry-bulb temperature of refrigerated air, Rankine
= Fahrenheit + 459.67
° F 37 5 1
ρi , Density of the infiltration air, based on 55% RH
lbft3
0.074 0.074 3
hi, Enthalpy of the infiltrating air, based on 55% RH.
Btulb
26.935 24.678 3
ρr, Density of the refrigerated air, based on 80% RH.
lbft3
0.079 0.085 3
hr , Enthalpy of the refrigerated air, based on 80% RH.
Btulb
12.933 2.081 3
COPadj, Time-dependent (weather dependent) None 3.07 1.95 1 and 2
SECTION 2: Residential MeasuresMiscellaneous Page 424
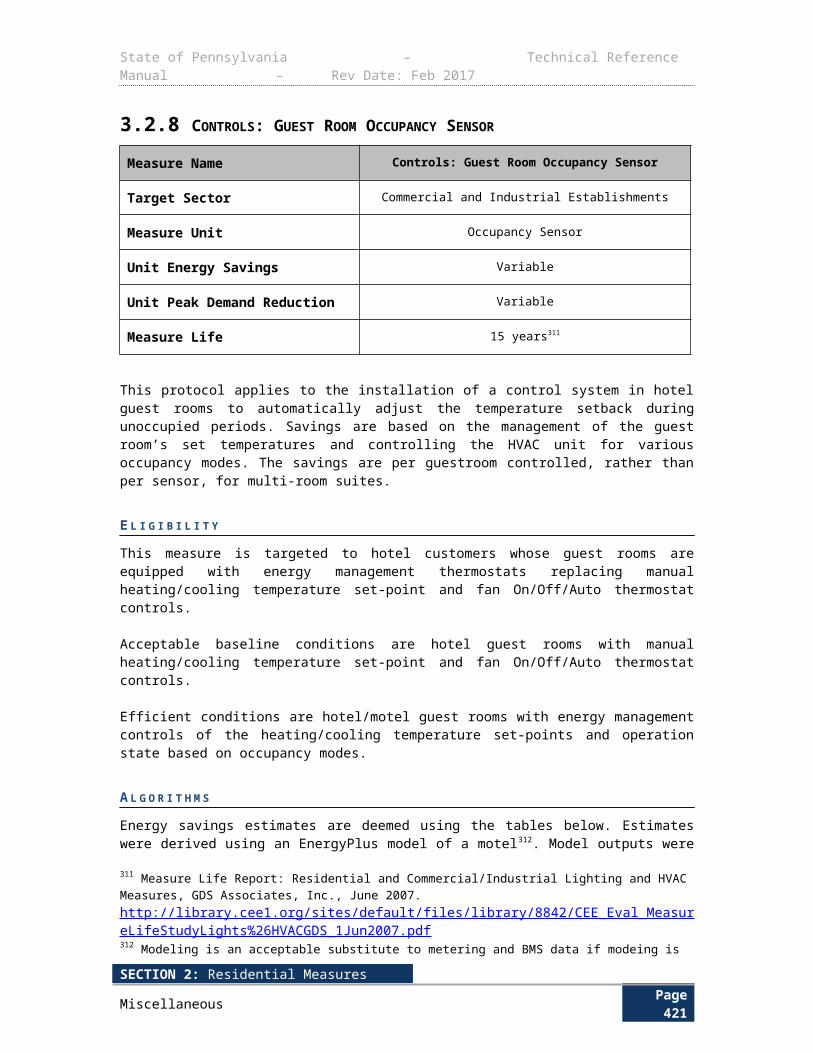
State of Pennsylvania – Technical Reference Manual – Rev Date: Feb 2017
coefficient of performance of the refrigeration system. Based on nominal COP of 1.5 for freezers and 2.5 for coolers.
SECTION 2: Residential MeasuresMiscellaneous Page 425
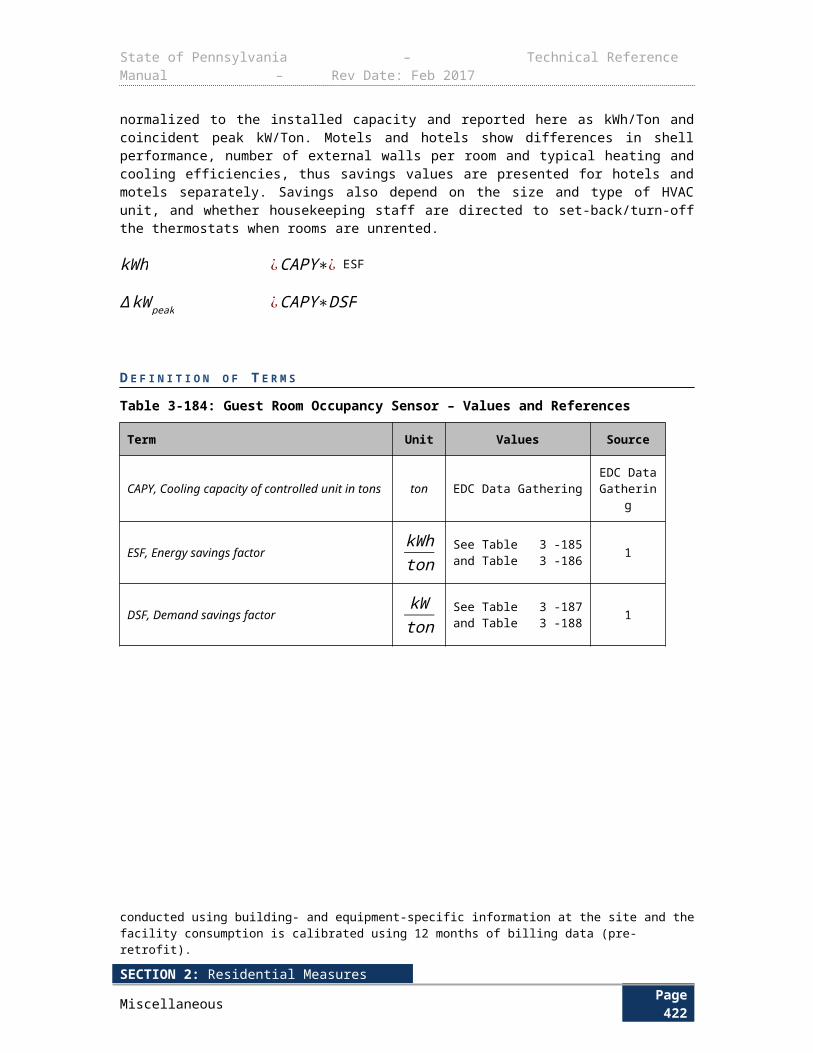
State of Pennsylvania – Technical Reference Manual – Rev Date: Feb 2017
Table 3-245: Strip Curtain Calculation Assumptions for Convenience Stores
SECTION 2: Residential MeasuresMiscellaneous Page 426
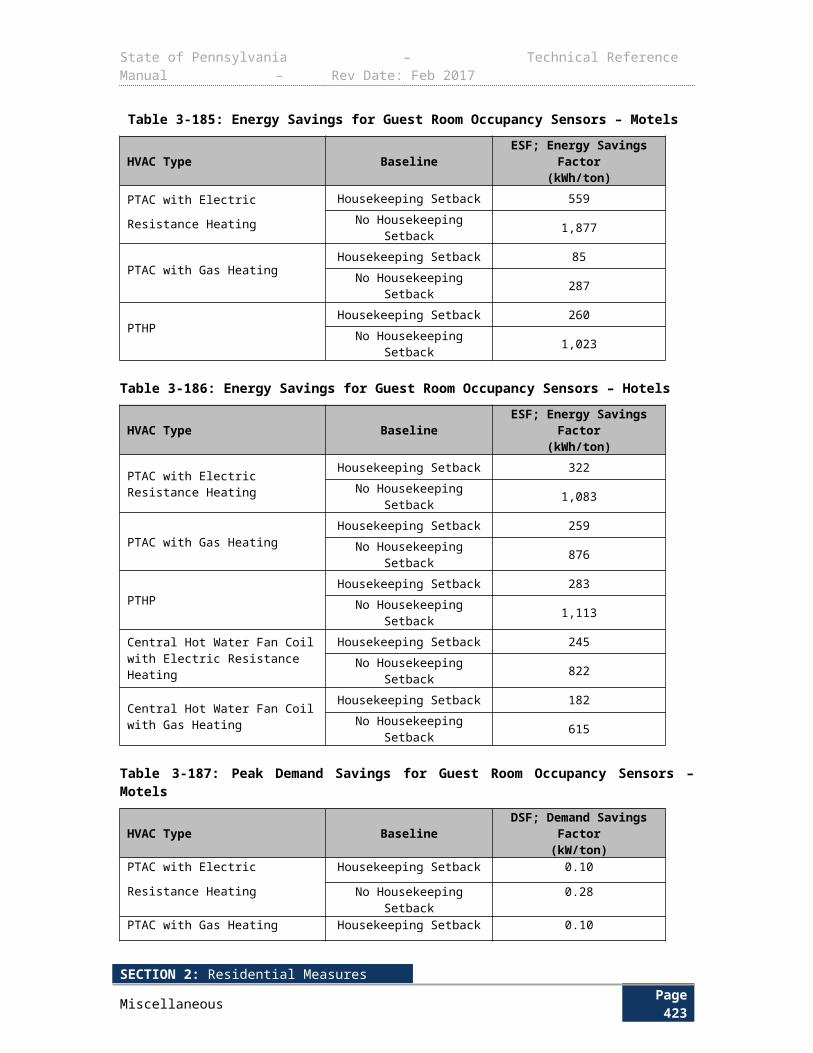
State of Pennsylvania – Technical Reference Manual – Rev Date: Feb 2017
Term Unit
Values
SourceCooler Freezer
ηnew, Efficacy of the new strip curtain – an efficacy of 1 corresponds to the strip curtain thwarting all infiltration, while an efficacy of zero corresponds to the absence of strip curtains.
None 0.79 0.83 1
ηold ,Efficacy of the old strip curtain
with Pre-existing curtain
with no Pre-existing curtain
unknown
None
0.58
0.00
0.34
0.58
0.00
0.30
1
Cd , Discharge Coefficient: empirically determined scale factors that account for differences between infiltration as rates predicted by application Bernoulli’s law and actual observed infiltration rates
None 0.348 0.421 1
t open , Minutes walk-in door is open per day minutesday
38 9 1
A , Doorway area ft2 21 21 1
H , Doorway height ft 7 7 1
T i, Dry-bulb temperature of infiltrating air, Rankine
= Fahrenheit + 459.67
° F 68 64 1 and 2
T r, Dry-bulb temperature of refrigerated air, Rankine
= Fahrenheit + 459.67
° F 39 5 1
ρi , Density of the infiltration air, based on 55% RH
lbft3
0.074 0.075 3
hi, Enthalpy of the infiltrating air, based on 55% RH.
Btulb
25.227 23.087 3
ρr, Density of the refrigerated air, based on 80% RH.
lbft3
0.079 0.085 3
hr , Enthalpy of the refrigerated air, based on 80% RH.
Btulb
13.750 2.081 3
COPadj, Time-dependent (weather dependent) None 3.07 1.95 1 and 2
SECTION 2: Residential MeasuresMiscellaneous Page 427
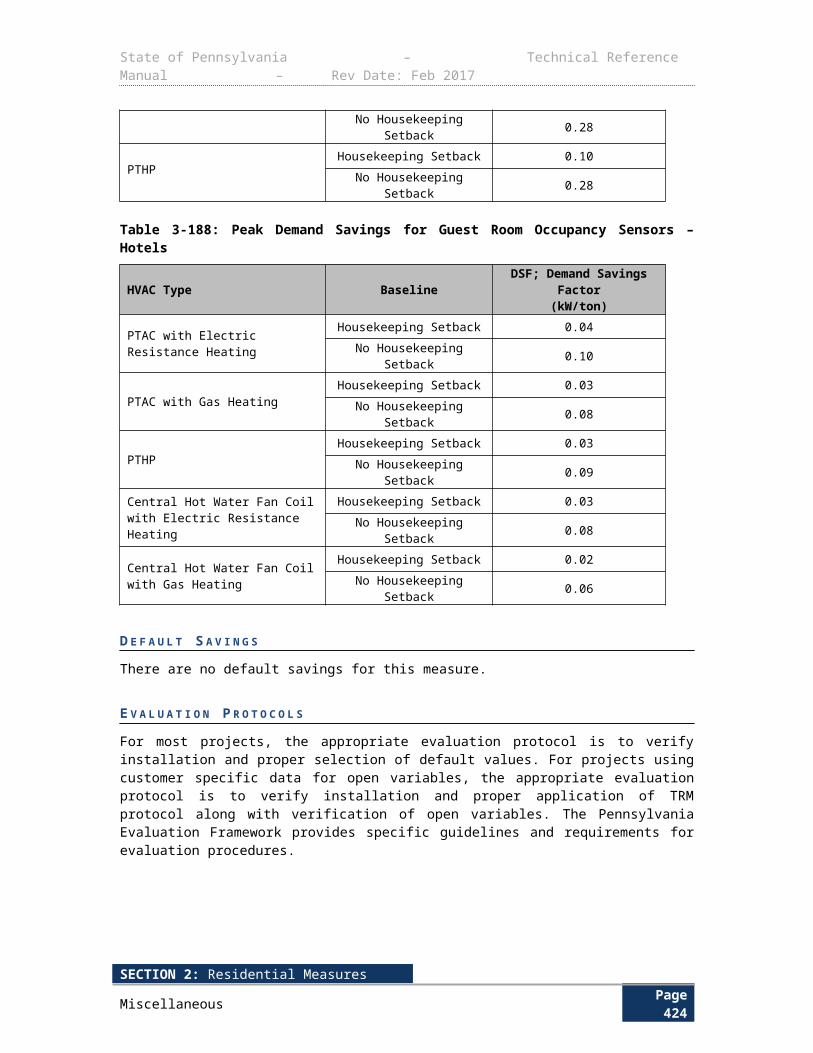
State of Pennsylvania – Technical Reference Manual – Rev Date: Feb 2017
Term Unit
Values
SourceCooler Freezer
coefficient of performance of the refrigeration system. Based on nominal COP of 1.5 for freezers and 2.5 for coolers.
SECTION 2: Residential MeasuresMiscellaneous Page 428
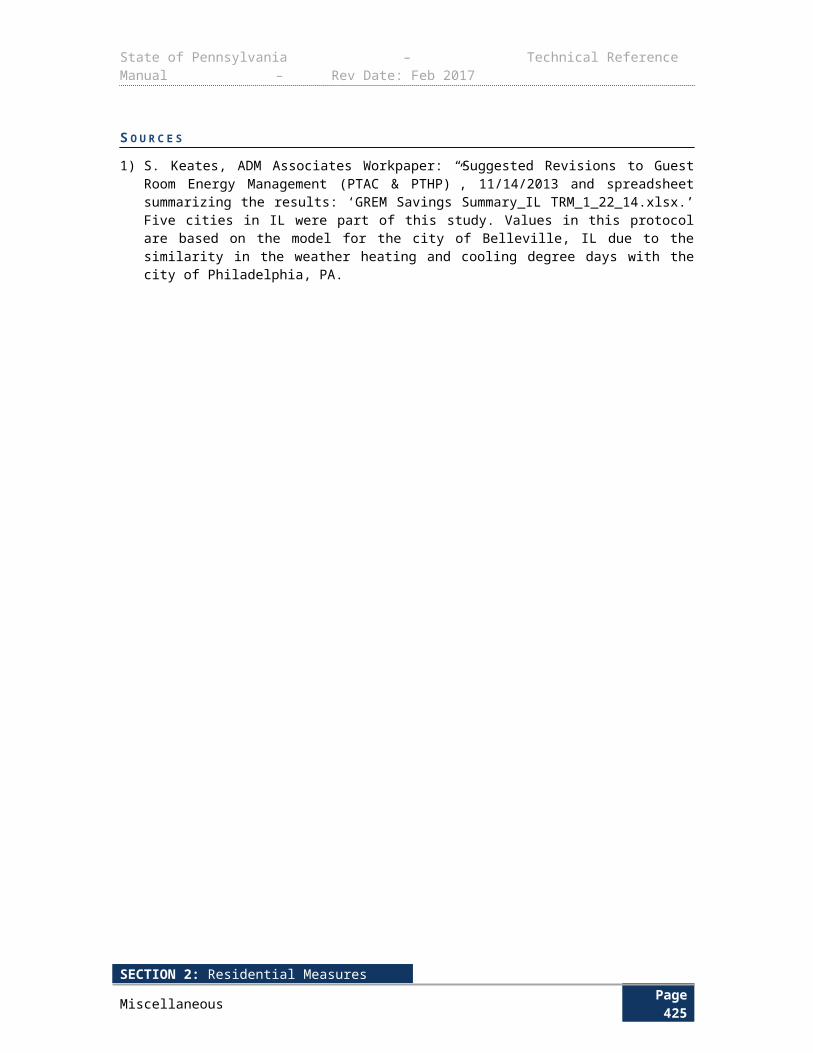
State of Pennsylvania – Technical Reference Manual – Rev Date: Feb 2017
Table 3-246: Strip Curtain Calculation Assumptions for Restaurants
SECTION 2: Residential MeasuresMiscellaneous Page 429
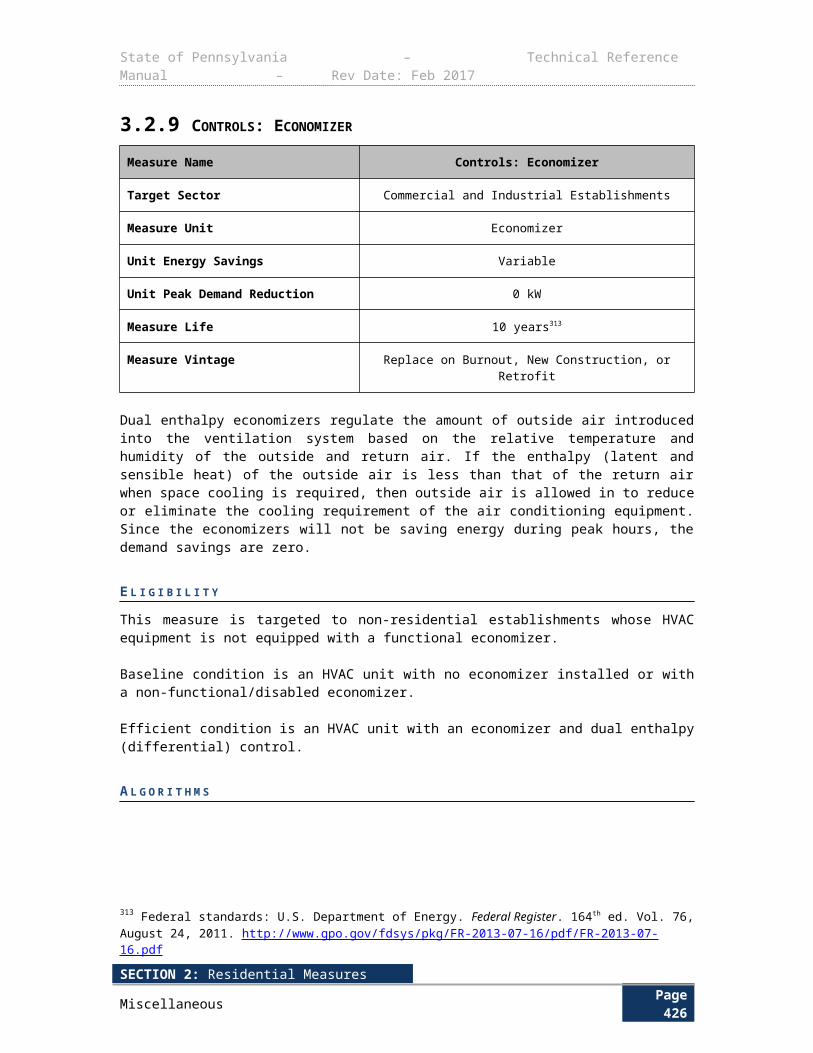
State of Pennsylvania – Technical Reference Manual – Rev Date: Feb 2017
Term Unit
Values
SourceCooler Freezer
ηnew, Efficacy of the new strip curtain – an efficacy of 1 corresponds to the strip curtain thwarting all infiltration, while an efficacy of zero corresponds to the absence of strip curtains.
None 0.80 0.81 1
ηold ,Efficacy of the old strip curtain
with Pre-existing curtain
with no Pre-existing curtain
unknown
None
0.58
0.00
0.33
0.58
0.00
0.26
1
Cd , Discharge Coefficient: empirically determined scale factors that account for differences between infiltration as rates predicted by application Bernoulli’s law and actual observed infiltration rates
None 0.383 0.442 1
t open , Minutes walk-in door is open per day minutesday
45 38 1
A , Doorway area ft2 21 21 1
H , Doorway height ft 7 7 1
T i, Dry-bulb temperature of infiltrating air, Rankine
= Fahrenheit + 459.67
° F 70 67 1 and 2
T r, Dry-bulb temperature of refrigerated air, Rankine
= Fahrenheit + 459.67
° F 39 8 1
ρi , Density of the infiltration air, based on 55% RH
lbft3
0.074 0.074 3
hi, Enthalpy of the infiltrating air, based on 55% RH.
Btulb
26.356 24.678 3
ρr, Density of the refrigerated air, based on 80% RH.
lbft3
0.079 0.085 3
hr , Enthalpy of the refrigerated air, based on 80% RH.
Btulb
13.750 2.948 3
COPadj, Time-dependent (weather dependent) None 3.07 1.95 1 and 2
SECTION 2: Residential MeasuresMiscellaneous Page 430

State of Pennsylvania – Technical Reference Manual – Rev Date: Feb 2017
coefficient of performance of the refrigeration system. Based on nominal COP of 1.5 for freezers and 2.5 for coolers.
SECTION 2: Residential MeasuresMiscellaneous Page 431
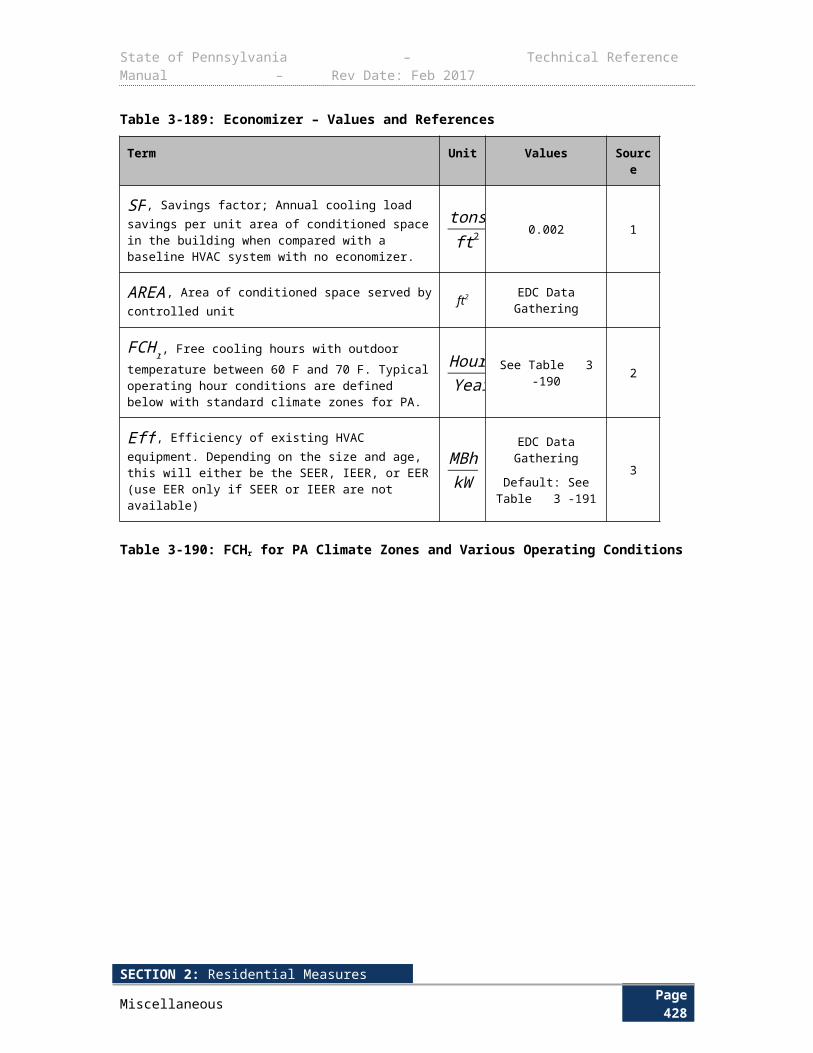
State of Pennsylvania – Technical Reference Manual – Rev Date: Feb 2017
Table 3-247: Strip Curtain Calculation Assumptions for Refrigerated Warehouses
Term Unit Values Source
ηnew, Efficacy of the new strip curtain – an efficacy of 1 corresponds to the strip curtain thwarting all infiltration, while an efficacy of zero corresponds to the absence of strip curtains.
None 0.89 1
ηold ,Efficacy of the old strip curtain
with Pre-existing curtain
with no Pre-existing curtain
unknown
None
0.58
0.00
0.54
1
Cd , Discharge Coefficient: empirically determined scale factors that account for differences between infiltration as rates predicted by application Bernoulli’s law and actual observed infiltration rates
None 0.425 1
t open , Minutes walk-in door is open per day minutesday
494 1
A , Doorway area ft2 80 1
H , Doorway height ft 10 1
T i, Dry-bulb temperature of infiltrating air, Rankine
= Fahrenheit + 459.67
° F 59 1 and 2
T r, Dry-bulb temperature of refrigerated air, Rankine
= Fahrenheit + 459.67
° F 28 1
ρi , Density of the infiltration air, based on 55% RH lbft3
0.076 3
hi, Enthalpy of the infiltrating air, based on 55% RH. Btulb
20.609 3
ρr, Density of the refrigerated air, based on 80% RH. lbft3
0.081 3
hr , Enthalpy of the refrigerated air, based on 80% RH. Btulb
9.462 3
COPadj, Time-dependent (weather dependent) coefficient of performance of the refrigeration system. Based on nominal COP of 1.5 for freezers and 2.5 for coolers.
None 1.91 1 and 2
SECTION 2: Residential MeasuresMiscellaneous Page 432
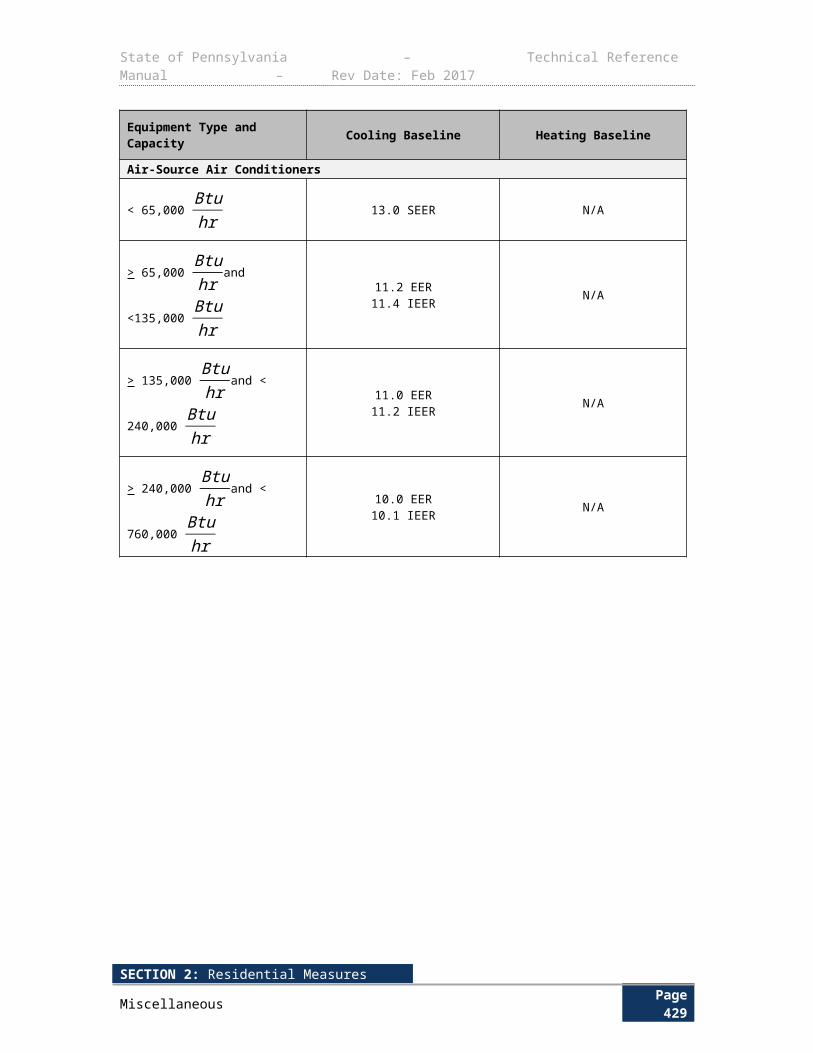
State of Pennsylvania – Technical Reference Manual – Rev Date: Feb 2017
E V A L U A T I O N P R O T O C O L S
The most appropriate evaluation protocol for this measure is verification of installation coupled with assignment of stipulated energy savings according to store type. The strip curtains are not expected to be installed directly. As such, the program tracking / evaluation effort must capture the following key information:
Fraction of strip curtains installed in each of the categories (e.g. freezer / cooler and store type)
Fraction of customers that had pre-existing strip curtains
The rebate forms should track the above information. During the M&V process, interviews with site contacts should track this fraction, and savings should be adjusted accordingly.
S O U R C E S
1) The scale factors have been determined with tracer gas measurements on over 100 walk-in refrigeration units during the California Public Utility Commission’s evaluation of the 2006-2008 CA investor owned utility energy efficiency programs. The door-open and close times, and temperatures of the infiltrating and refrigerated airs are taken from short-term monitoring of over 100 walk-in units. http://www.calmac.org/publications/ComFac_Evaluation_V1_Final_Report_02-18-2010.pdf.
2) For refrigerated warehouses, we used a bin calculation method to weight the outdoor temperature by the infiltration that occurs at that outdoor temperature. This tends to shift the average outdoor temperature during times of infiltration higher (e.g. from 54 °F year-round average to 64 °F). We also performed the same exercise to find out effective outdoor temperatures to use for adjustment of nominal refrigeration system COPs.
3) Density and enthalpy of infiltrating and refrigerated air are based on psychometric equations based on the dry bulb temperature and relative humidity. Relative humidity is estimated to be 55% for infiltrating air and 80% for refrigerated air. Dry bulb temperatures were determined through the evaluation cited in Source 1.
4) In the original equation (Tamm’s equation) the height is taken to be the difference between the midpoint of the opening and the ‘neutral pressure level’ of the cold space. In the case that there is just one dominant doorway through which infiltration occurs, the neutral pressure level is half the height of the doorway to the walk-in refrigeration unit. The refrigerated air leaks out through the lower half of the door, and the warm, infiltrating air enters through the top half of the door. We deconstruct the lower half of the door into infinitesimal horizontal strips of width W and height dh. Each strip is treated as a separate window, and the air flow through each infinitesimal strip is given by 60 x CD x A x {[(Ti – Tr ) / Ti ] x g x ΔHNPL }^0.5 where ΔHNPL represents the distance to the vertical midpoint of the door. In effect, this replaces the implicit wh1.5 (one power from the area, and the other from ΔHNPL ) with the integral from 0 to h/2 of wh’0.5 dh’ which results in wh1.5/(3×20.5¬). For more information see: Are They Cool(ing)?:Quantifying the Energy Savings from Installing / Repairing Strip Curtains, Alereza, Baroiant, Dohrmann, Mort, Proceedings of the 2008 IEPEC Conference.
SECTION 2: Residential MeasuresMiscellaneous Page 433
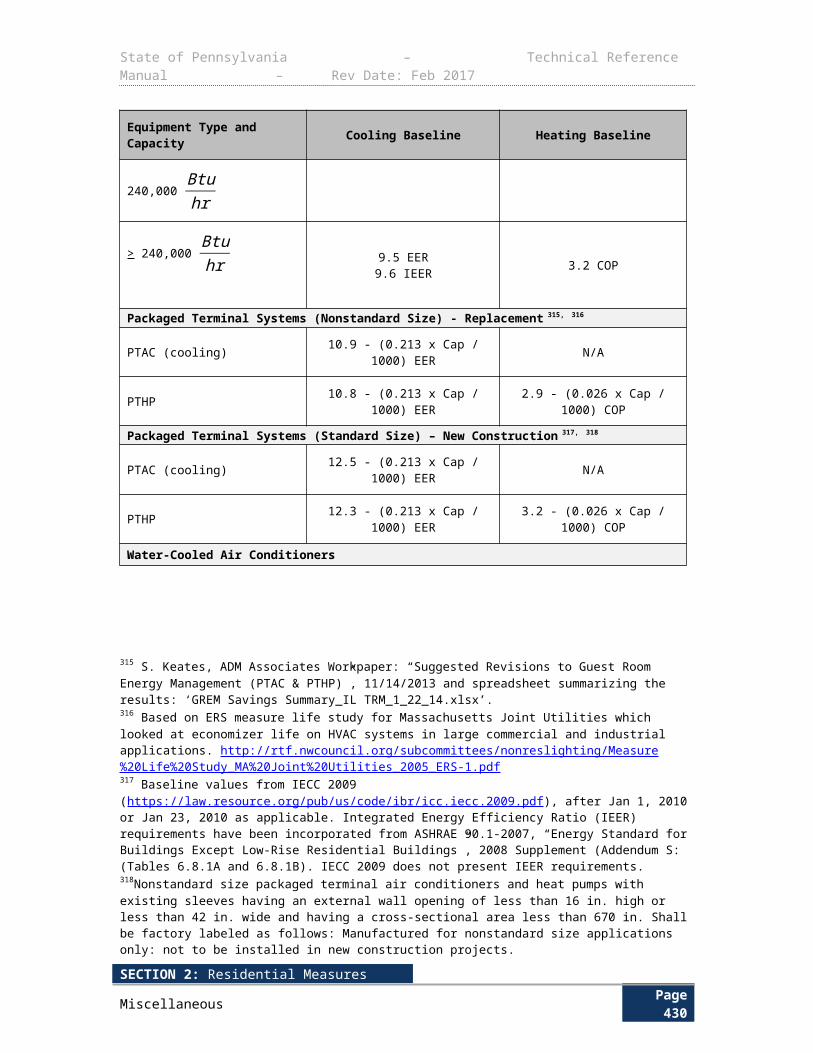
State of Pennsylvania – Technical Reference Manual – Rev Date: Feb 2017
3.5.10 NIGHT COVERS FOR DISPLAY CASES
Measure Name Night Covers for Display Cases
Target Sector Commercial and Industrial Establishments
Measure Unit Display Case
Unit Energy Savings Variable
Unit Peak Demand Reduction Variable
Measure Life 5 years399,400
Measure Vintage Retrofit
E L I G I B I L I T Y
This measure documents the energy savings associated with the installation of night covers on existing open-type refrigerated display cases, where covers are deployed during the facility’s unoccupied hours in order to reduce refrigeration energy consumption. These types of display cases can be found in small and medium to large size grocery stores. The air temperature is below 0 °F for low-temperature display cases, between 0 °F to 30 °F for medium-temperature display cases, and between 35 °F to 55 °F for high-temperature display cases401. The main benefit of using night covers on open display cases is a reduction of infiltration and radiation cooling loads. It is recommended that these covers have small, perforated holes to decrease moisture buildup.
A L G O R I T H M S
The energy savings and demand reduction are obtained through the following calculation.402
kWh ¿W ×SF×HOU
There are no demand savings for this measure because the covers will not be in use during the peak period403.
D E F I N I T I O N O F T E R M S
399 http://energysmartonline.org/documents/EnergySmart_BPA_T&Cs.pdf 400 Kalterveluste durch kuhlraumoffnungen. Tamm W,.Kaltetechnik-Klimatisierung 1966;18;142-144401 American Society of Heating, Refrigeration, and Air-Conditioning Engineers (ASHRAE). 2010. ASHRAE Handbook, Refrigeration: 13.4, 13.6402 http://www.calmac.org/publications/ComFac_Evaluation_V1_Final_Report_02-18-2010.pdf 403 http://www.cpuc.ca.gov/PUC/energy/Energy+Efficiency/EM+and+V/2006-2008+Energy+Efficiency+Evaluation+Report.htm. The scale factors have been determined with tracer gas measurements on over 100 walk-in refrigeration units during the California Public Utility Commission’s evaluation of the 2006-2008 CA investor owned utility energy efficiency programs. The door-open and close times, and temperatures of the infiltrating and refrigerated airs are taken from short-term monitoring of over 100 walk-in units. The temperature and humidity of the infiltrating air and the COP of the units have been modified to reflect the PA climate.
SECTION 2: Residential MeasuresMiscellaneous Page 434
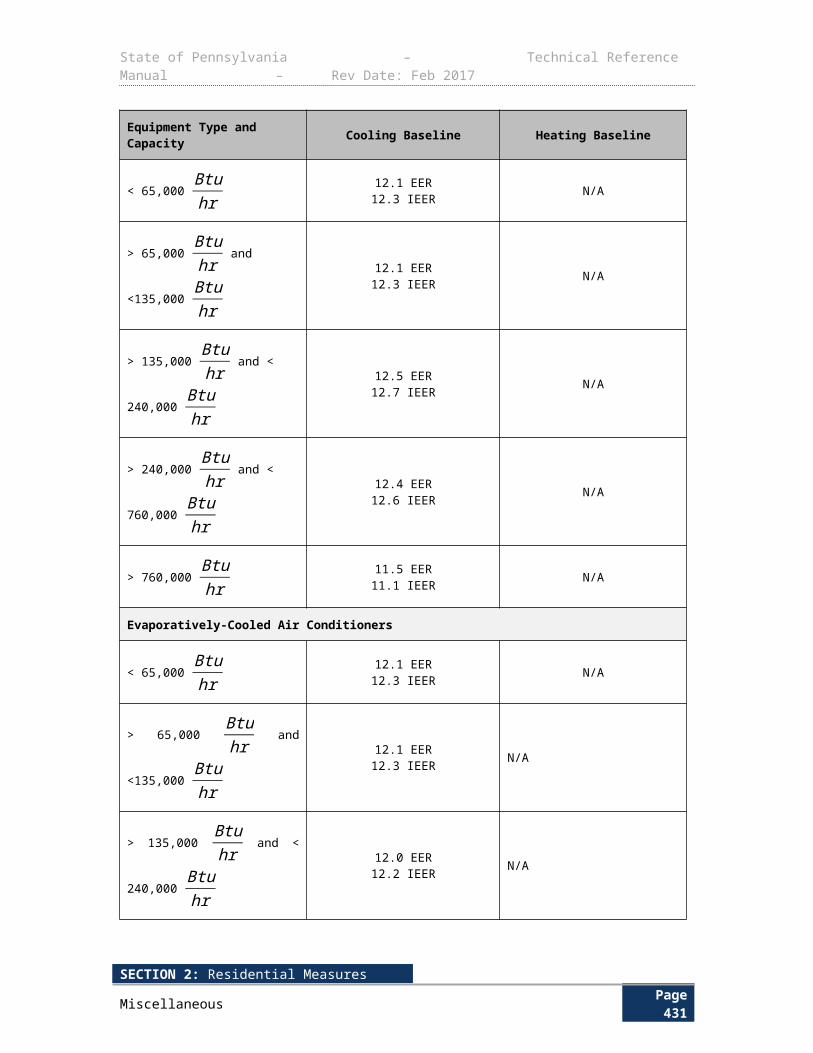
State of Pennsylvania – Technical Reference Manual – Rev Date: Feb 2017
Table 3-248: Night Covers Calculations Assumptions
Term Unit Values Source
W, Width of the opening that the night covers protect
ft EDC Data Gathering EDC Data Gathering
SF, Savings factor based on the temperature of the case
kWft
Default values in Table 3-249
1
HOU, Annual hours that the night covers are in use
HoursYear
EDC Data Gathering
Default: 2,190404
EDCs Data Gathering
Table 3-249: Savings Factors
Cooler Case Temperature Savings Factor
Low Temperature (-35 F to -5 F) 0.03 kW/ft
Medium Temperature (0 F to 30 F) 0.02 kW/ft
High Temperature (35 F to 55 F) 0.01 kW/ft
The demand and energy savings assumptions are based on analysis performed by Southern California Edison (SCE). SCE conducted this test at its Refrigeration Technology and Test Center (RTTC). The RTTC’s sophisticated instrumentation and data acquisition system provided detailed tracking of the refrigeration system’s critical temperature and pressure points during the test period. These readings were then utilized to quantify various heat transfer and power related parameters within the refrigeration cycle. The results of SCE’s test focused on three typical scenarios found mostly in supermarkets.
D E F A U L T S A V I N G S
There are no default savings for this measure.
E V A L U A T I O N P R O T O C O L S
For most projects, the appropriate evaluation protocol is to verify installation and proper selection of default values. For projects using customer specific data for open variables, the appropriate evaluation protocol is to verify installation and proper application of TRM protocol along with verification of open variables. The Pennsylvania Evaluation Framework provides specific guidelines and requirements for evaluation procedures.
S O U R C E S
1) CL&P Program Savings Documentation for 2011 Program Year (2010). Factors based on Southern California Edison (1997). Effects of the Low Emissive Shields on Performance and Power Use of a Refrigerated Display Case. http://www.energizect.com/sites/default/files/2012%20CT%20Program%20Savings%20Documentation%20FINAL.pdf
404 DEER 2014 Effective Useful Life.
SECTION 2: Residential MeasuresMiscellaneous Page 435
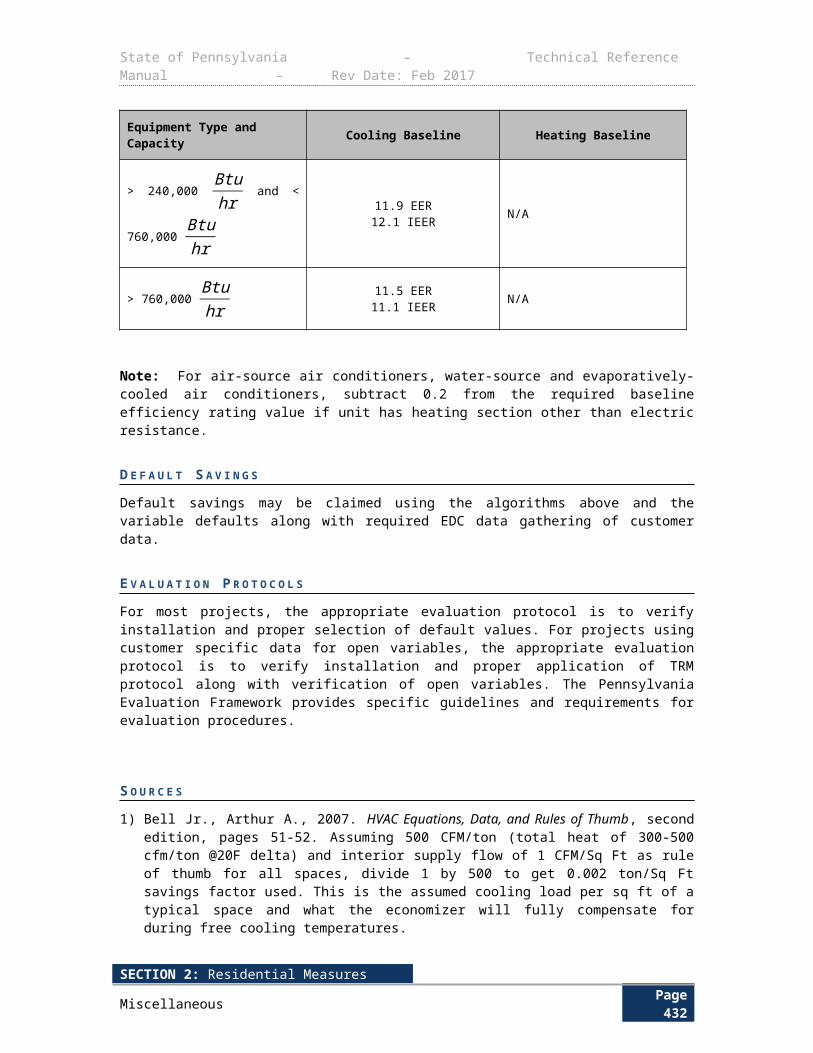
State of Pennsylvania – Technical Reference Manual – Rev Date: Feb 2017
SECTION 2: Residential MeasuresMiscellaneous Page 436
State of Pennsylvania – Technical Reference Manual – Rev Date: Feb 2017
3.5.11 AUTO CLOSERS
Measure Name Auto Closers
Target Sector Commercial and Industrial Establishments
Measure Unit Walk-in Cooler and Freezer Door
Unit Energy Savings Fixed
Unit Peak Demand Reduction Fixed
Measure Life 8 years405
Measure Vintage Retrofit
The auto-closer should be applied to the main insulated opaque door(s) of a walk-in cooler or freezer. Auto-closers on freezers and coolers can reduce the amount of time that doors are open, thereby reducing infiltration and refrigeration loads. These measures are for retrofit of doors not previously equipped with auto-closers, and assume the doors have strip curtains.
E L I G I B I L I T Y 4 0 6
This protocol documents the energy savings attributed to installation of auto closers in walk-in coolers and freezers. The auto-closer must be able to firmly close the door when it is within one inch of full closure. The walk-in door perimeter must be ≥ 16 ft.
A L G O R I T H M S
Auto-closers are treated in the Database for Energy Efficient Resources (DEER) as weather-sensitive; therefore the recommended deemed savings values indicated below are derived from the DEER runs. Climate zone 4 has been chosen as the most similar zone to the climate zones of the main seven Pennsylvania cities. This association is based on cooling degree hours (CDHs) and wet bulb temperatures. Savings estimates for each measure are averaged across six building vintages for climate-zone 4 and building type 9, Grocery Stores. The peak demand savings provided by DEER was calculated using the following peak definition:
“The demand savings due to an energy efficiency measure is calculated as the average reduction in energy use over a defined nine-hour demand period.”407
The nine hours correspond to 2 PM through 5 PM during 3-day heat waves.408
405 The Measure Life Report for Residential and Commercial/Industrial Lighting and HVAC Measures, GDS Associates, Inc., June 2007. http://library.cee1.org/sites/default/files/library/8842/CEE_Eval_MeasureLifeStudyLights%26HVACGDS_1Jun2007.pdf 406 Massachusetts 2012 Technical Reference Manual, pg. 229407 “Effects of the Low Emissivity Shields on Performance and Power Use of a Refrigerated Display Case” Southern California Edison Refrigeration Technology and Test Center Energy Efficiency Division August 8, 1997.408 Assumed that the continuous covers are deployed at night (usually 1:00 a.m. – 5:00 a.m.); therefore no demand savings is usually reported for this measure.
SECTION 2: Residential MeasuresMiscellaneous Page 437
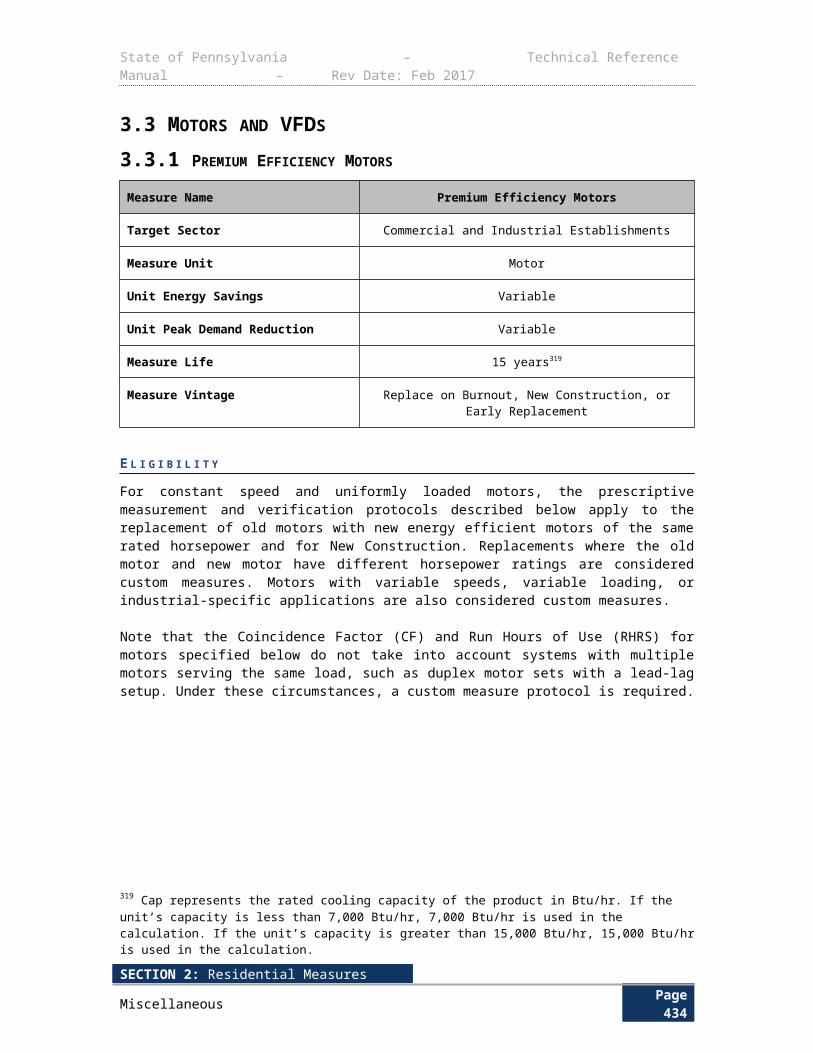
State of Pennsylvania – Technical Reference Manual – Rev Date: Feb 2017
Main Cooler Doors
kWh ¿∆ kWhcooler
∆ kW peak ¿∆ kW cooler
Main Freezer Doors
kWh ¿∆ kWhfreezer
∆ kW peak ¿∆ kW freezer
D E F I N I T I O N O F T E R M S
Table 3-250: Auto Closers Calculation Assumptions
Term Unit Values Source
∆ kWhcooler , Annual kWh savings for main cooler doors
kWh Table 3-251 1
∆ kW cooler, Summer peak kW savings for main cooler doors
kW Table 3-251 1
∆ kWhfreezer , Annual kWh savings for main freezer doors
kWh Table 3-251 1
∆ kW freezer , Summer peak kW savings for main freezer doors
kW Table 3-251 1
D E E M E D S A V I N G S
Table 3-251: Refrigeration Auto Closers Deemed Savings
Reference CityAssociated California
Climate Zone
Value
Cooler FreezerkWhcooler kWcooler kWhfreezer kWfreezer
All PA cities 4 961 0.135 2319 0.327
E V A L U A T I O N P R O T O C O L S
For most projects, the appropriate evaluation protocol is to verify installation and proper selection of default values. For projects using customer specific data for open variables, the appropriate evaluation protocol is to verify installation and proper application of TRM protocol along with verification of open variables. The Pennsylvania Evaluation Framework provides specific guidelines and requirements for evaluation procedures.
SECTION 2: Residential MeasuresMiscellaneous Page 438
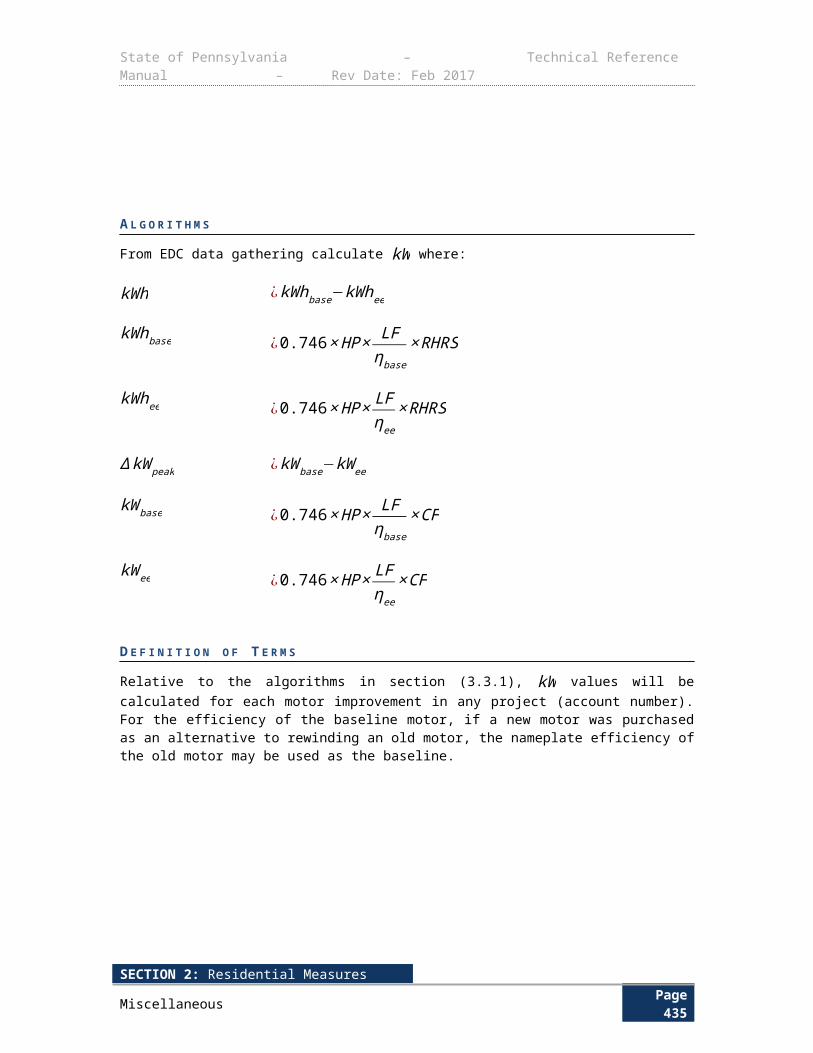
State of Pennsylvania – Technical Reference Manual – Rev Date: Feb 2017
S O U R C E S
1) 2005 DEER weather sensitive commercial data; DEER Database, http://www.deeresources.com/
SECTION 2: Residential MeasuresMiscellaneous Page 439
State of Pennsylvania – Technical Reference Manual – Rev Date: Feb 2017
3.5.12 DOOR GASKETS FOR WALK-IN AND REACH-IN COOLERS AND FREEZERS
Measure NameDoor Gaskets for Walk-in and Reach-in Coolers and
Freezers
Target Sector Commercial and Industrial Establishments
Measure Unit Walk-in Coolers and Freezers
Unit Energy Savings Fixed
Unit Peak Demand Reduction Fixed
Measure Life 4 years409
Measure Vintage Replace on Burnout
The following protocol for the measurement of energy and demand savings is applicable to commercial refrigeration and applies to the replacement of worn-out gaskets with new better-fitting gaskets. Applicable gaskets include those located on the doors of walk-in and/or reach-in coolers and freezers.
Tight fitting gaskets inhibit infiltration of warm, moist air into the cold refrigerated space, thereby reducing the cooling load. Aside from the direct reduction in cooling load, the associated decrease in moisture entering the refrigerated space also helps prevent frost on the cooling coils. Frost build-up adversely impacts the coil’s, heat transfer effectiveness, reduces air passage (lowering heat transfer efficiency), and increases energy use during the defrost cycle. Therefore, replacing defective door gaskets reduces compressor run time and improves the overall effectiveness of heat removal from a refrigerated cabinet.
E L I G I B I L I T Y This protocol applies to the main doors of both low temperature (“freezer” – below 32 °F) and medium temperature (“cooler” – above 32 °F) walk-ins.
A L G O R I T H M S
The demand and energy savings assumptions are based on analysis performed by Southern California Edison.
The energy savings and demand reduction are obtained through the following calculations:
kWh ¿ ∆kWhft
×L
∆ kW peak ¿ ∆kWft
×L
409 Hours should be determined on a case-by-case basis. Default value of 2,190 hours is estimated assuming that the annual operating hours of the refrigerated case is 8,760 hours as per Ohio 2010 Technical Reference Manual and night covers must be applied for a period of at least six hours in a 24-hour period. http://energysmartonline.org/documents/EnergySmart_BPA_T&Cs.pdf
SECTION 2: Residential MeasuresMiscellaneous Page 440
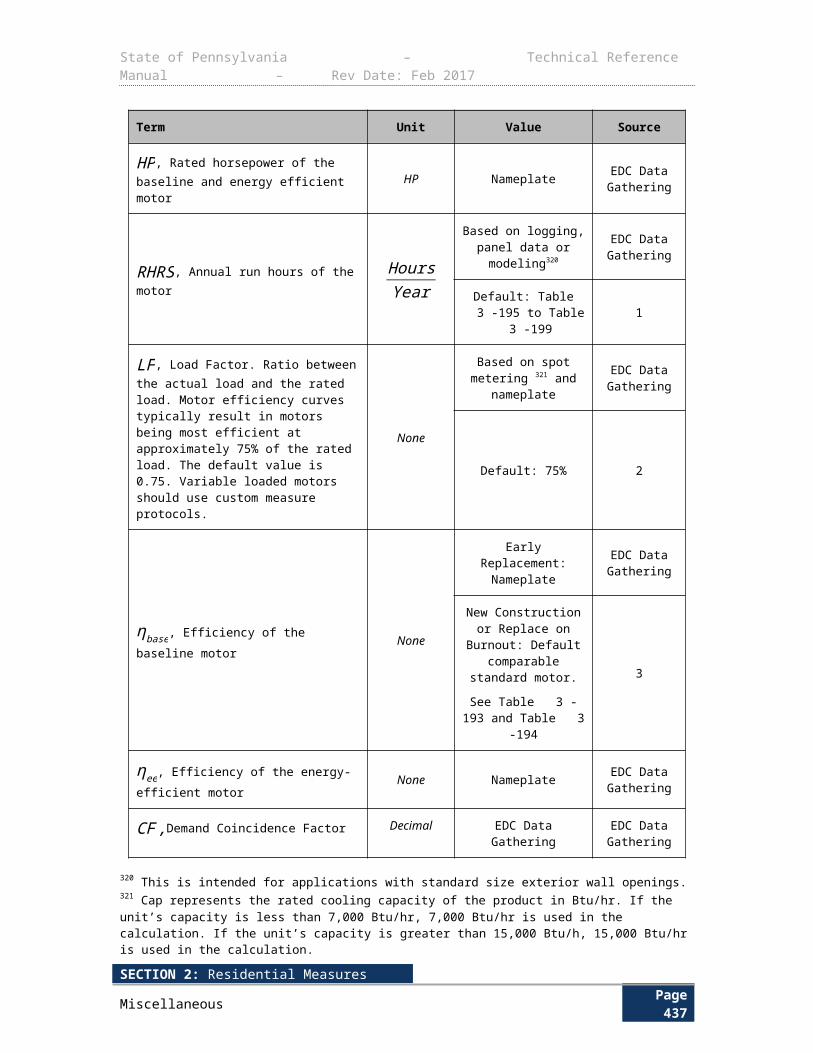
State of Pennsylvania – Technical Reference Manual – Rev Date: Feb 2017
D E F I N I T I O N O F T E R M S
Table 3-252: Door Gasket Assumptions
Term Unit Values Source
∆kWhft
, Annual energy savings per linear
foot of gasket
∆kWhft
Table 3-253 1
∆kWft
, Demand savings per linear foot of
gasket
∆kWft
Table 3-253 1
L, Total gasket length ft As Measured EDC Data Gathering
D E F A U L T S A V I N G S
The default savings values below are weather sensitive, therefore the values reference CA climate zone 4, which is the zone chosen as the most similar to the seven major Pennsylvania cities. The demand and energy savings assumptions are based on DEER 2005 and analysis performed by Southern California Edison (SCE)410.
Table 3-253: Door Gasket Savings Per Linear Foot for Walk-in and Reach-in Coolers and Freezers
Building Type
Coolers Freezers
∆kWft
∆ kWhft
∆ kWft
∆ kWhft
Restaurant 0.000886 18 0.001871 63
Small Grocery Store/ Convenience Store 0.000658 15 0.00162 64
Medium/Large Grocery Store/ Supermarkets
0.0006425 15 0.001593 91
E V A L U A T I O N P R O T O C O L S
For most projects, the appropriate evaluation protocol is to verify installation and proper selection of default values. For projects using customer specific data for open variables, the appropriate evaluation protocol is to verify installation and proper application of TRM protocol along with verification of open variables. The Pennsylvania Evaluation Framework provides specific guidelines and requirements for evaluation procedures.
S O U R C E S
1) 2005 DEER weather sensitive commercial data; DEER Database, http://www.deeresources.com/
410 http://energysmartonline.org/documents/EnergySmart_BPA_T&Cs.pdf
SECTION 2: Residential MeasuresMiscellaneous Page 441
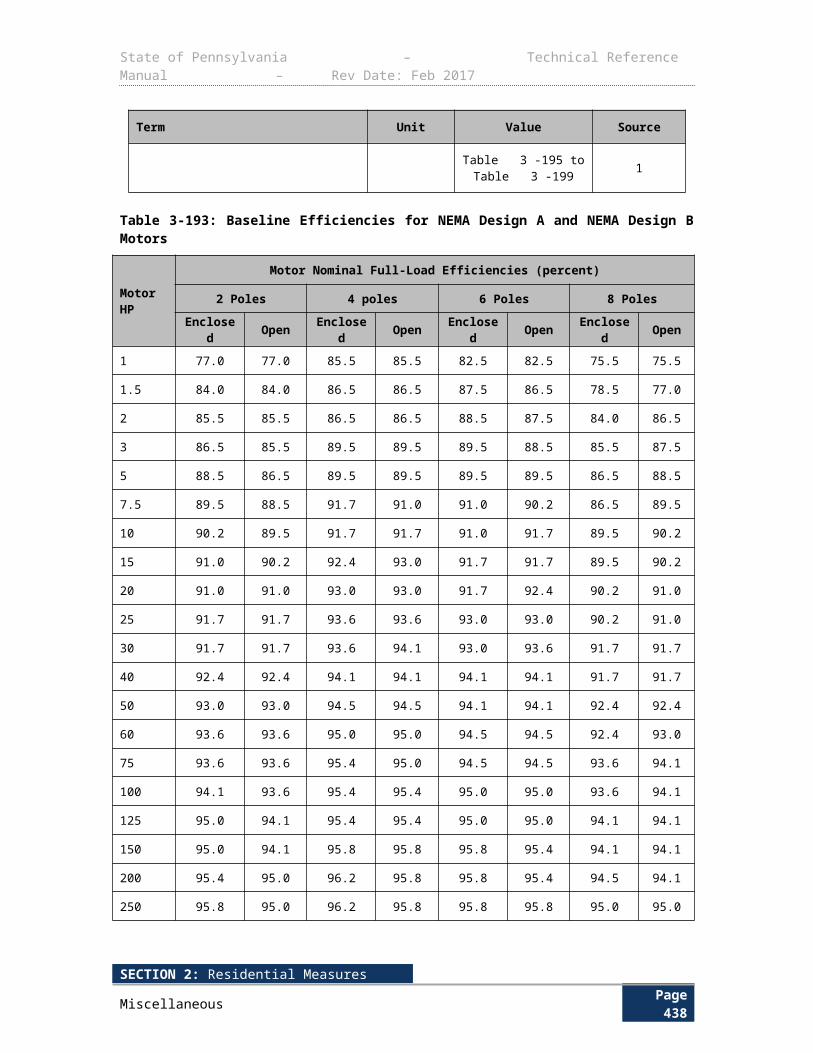
State of Pennsylvania – Technical Reference Manual – Rev Date: Feb 2017
3.5.13 SPECIAL DOORS WITH LOW OR NO ANTI-SWEAT HEAT FOR LOW TEMP CASE
Measure NameSpecial Doors with Low or No Anti-Sweat Heat for Low
Temperature Cases
Target Sector Commercial and Industrial Establishments
Measure Unit Display Cases
Unit Energy Savings Variable
Unit Peak Demand Reduction Variable
Measure Life 15 years411
Measure Vintage Retrofit
Traditional clear glass display case doors consist of two-pane glass (three-pane in low and medium temperature cases), and aluminum doorframes and door rails. Glass heaters may be included to eliminate condensation on the door or glass. The door heaters are traditionally designed to overcome the highest humidity conditions as cases are built for nation-wide applications. New low heat/no heat door designs incorporate heat reflective coatings on the glass, gas inserted between the panes, non-metallic spacers to separate the glass panes, and/or non-metallic frames (such as fiberglass).
This protocol documents the energy savings attributed to the installation of special glass doors w/low/no anti-sweat heaters for low temp cases. The primary focus of this rebate measure is on new cases to incent customers to specify advanced doors when they are purchasing refrigeration cases.
E L I G I B I L I T Y For this measure, a no-heat/low-heat clear glass door must be installed on an upright display case. It is limited to door heights of 57 inches or more. Doors must have either heat reflective treated glass, be gas filled, or both. This measure applies to low temperature cases only—those with a case temperature below 0°F. Doors must have 3 or more panes. Total door rail, glass, and frame heater amperage (@ 120 volt) cannot exceed 0.39412 amps per door for low temperature display cases. Rebate is based on the door width (not including case frame).
A L G O R I T H M S
The energy savings and demand reduction are obtained through the following calculations adopted from San Diego Gas & Electric Statewide Express Efficiency Program 413.
Assumptions: Indoor Dry-Bulb Temperature of 75 oF and Relative Humidity of 55%, (4-minute opening intervals for 16-second), neglect heat conduction through doorframe / assembly.
Compressor Savings (excluding condenser):
411 Ibid412 http://www.deeresources.com/files/DEER2011/download/2011_DEER_Documentation_Appendices.pdf413 Zarnikau, J. and Zhu, S.S. (2014) The Identification of Peak Period Impacts When a TMY Weather File Is Used in Building Energy Use Simulation. Open Journal of Energy Efficiency, 3, 25-33. http://dx.doi.org/10.4236/ojee.2014.31003
SECTION 2: Residential MeasuresMiscellaneous Page 442
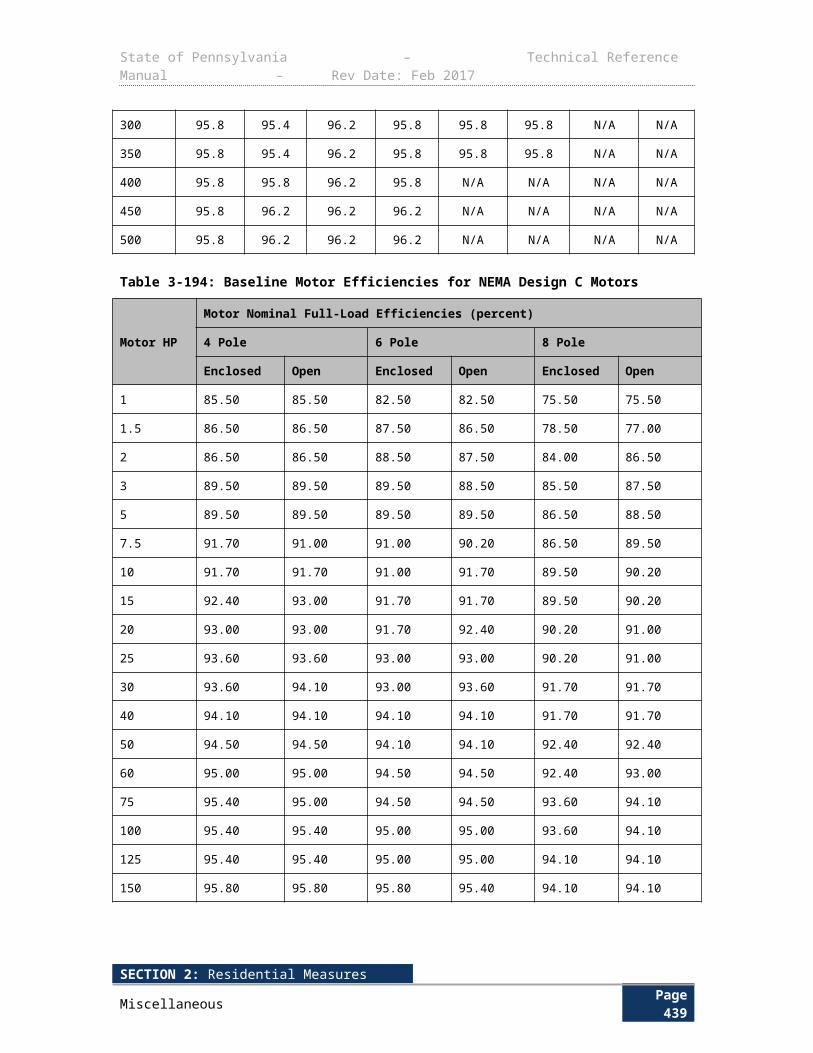
State of Pennsylvania – Technical Reference Manual – Rev Date: Feb 2017
kW compressor ¿ 11000
×Qcoolingsvg
EER
∆ kWhcompressor ¿∆ kW ×EFLH
Qcoolingsvg ¿Qcooling×K ASH
Anti-Sweat Heater Savings:
kW ASH ¿ ∆ ASH1000
∆ kWhASH ¿∆ kW ASH×t
D E F I N I T I O N O F T E R M S
Table 3-254: Special Doors with Low or No Anti-Sweat Heat for Low Temp Case Calculations Assumptions
Term Unit Values Source
Qcooling , Case rating by manufacturer
Btuhr
× 1door
From nameplate EDC Data Gathering
Qcoolingsvg , Cooling savings
Btuhr
× 1door
Calculated Value Calculated Value
kW compressor , Compressor power savings
kWdoor
Calculated Value Calculated Value
∆ kW ASH , Reduction due to ASH
kWdoor
Calculated Value Calculated Value
KASH, % of cooling load reduction due to low anti-sweat heater
None 1.5% 1
∆ ASH , Reduction in ASH power per door
Wdoor
83414 1
∆ kWhcompressor , Annual compressor energy savings (excluding condenser energy)
kWhdoor
Calculated Value Calculated Value
∆ kWhASH , Annual reduction in energy
kWhdoor
Calculated Value Calculated Value
EER, Compressor rating from manufacturer
None Nameplate EDC Data Gathering
414 Commercial Facilities Contract Group 2006-2008 Direct Impact Evaluation, California Public Utility Commission, February 2010.
SECTION 2: Residential MeasuresMiscellaneous Page 443
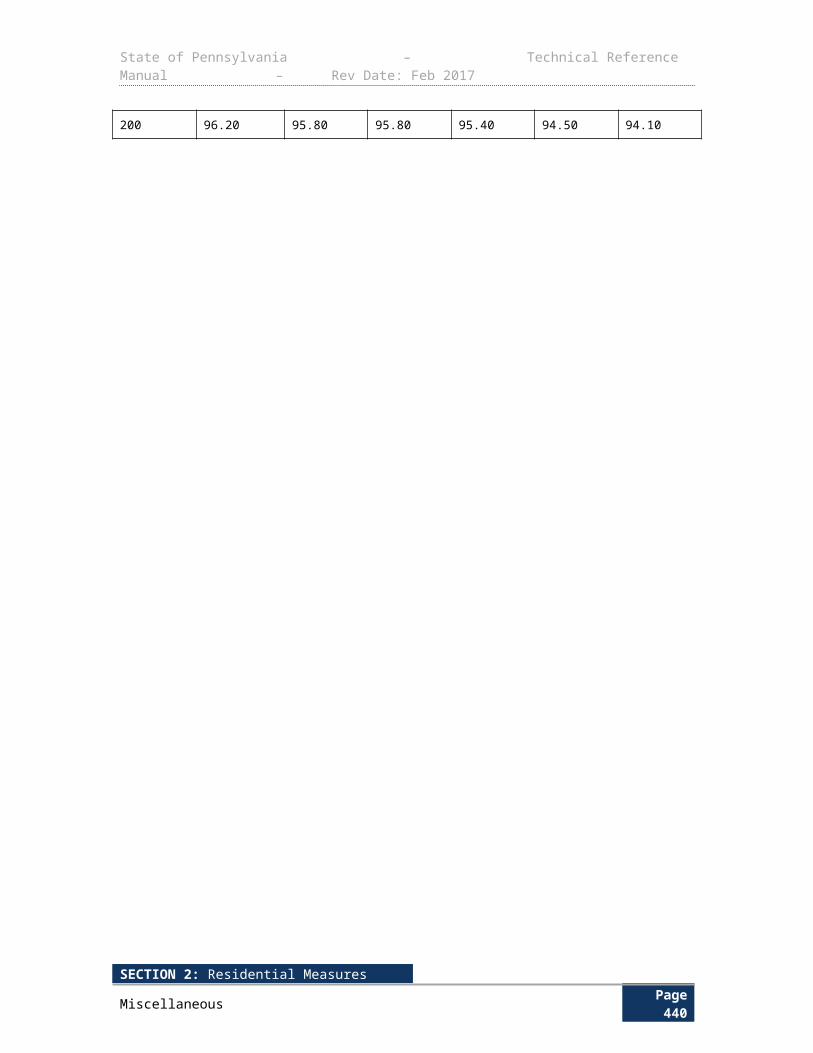
State of Pennsylvania – Technical Reference Manual – Rev Date: Feb 2017
Term Unit Values Source
EFLH, Equivalent full load annual operating hours
HoursYear
Based on Logging, BMS data or Modeling EDC Data Gathering
Default: 5,700415 1
t, Annual operating hours of Anti-sweat heater
HoursYear
8,760 1
D E F A U L T S A V I N G S
There are no default savings for this measure.
E V A L U A T I O N P R O T O C O L S For most projects, the appropriate evaluation protocol is to verify installation and proper selection of default values. For projects using customer specific data for open variables, the appropriate evaluation protocol is to verify installation and proper application of TRM protocol along with verification of open variables. The Pennsylvania Evaluation Framework provides specific guidelines and requirements for evaluation procedures.
S O U R C E S
1) San Diego Gas & Electric Statewide Express Efficiency Program https://www.sdge.com/sites/default/files/regulatory/Express%20and%20SBS%20Workpapers.pdf
415 Work papers developed by SCE filed with the CA PUC in support of its 2006 – 2008 energy efficiency program plans
SECTION 2: Residential MeasuresMiscellaneous Page 444

State of Pennsylvania – Technical Reference Manual – Rev Date: Feb 2017
3.5.14 SUCTION PIPE INSULATION FOR WALK-IN COOLERS AND FREEZERS
Measure NameSuction Pipe Insulation for Walk-In Coolers and
Freezers
Target Sector Commercial and Industrial Establishments
Measure Unit Walk-In Coolers and Freezers
Unit Energy Savings Fixed
Unit Peak Demand Reduction Fixed
Measure Life 11 years416,417
Measure Vintage Retrofit
This measure applies to the installation of insulation on existing bare suction lines (the larger diameter lines that run from the evaporator to the compressor) that are located outside of the refrigerated space for walk-in coolers and freezers. Insulation impedes heat transfer from the ambient air to the suction lines, thereby reducing undesirable system superheat. This decreases the load on the compressor, resulting in decreased compressor operating hours, and energy savings.
E L I G I B I L I T Y
This protocol documents the energy savings attributed to insulation of bare refrigeration suction pipes. The following are the eligibility requirements418:
Must insulate bare refrigeration suction lines 1-5/8 inches in diameter or less on existing equipment only
Medium temperature lines require 3/4 inch of flexible, closed-cell, nitrite rubber or an equivalent insulation
Low temperature lines require 1-inch of insulation that is in compliance with the specifications above
Insulation exposed to the outdoors must be protected from the weather (i.e. jacketed with a medium-gauge aluminum jacket)
A L G O R I T H M S
The demand and energy savings assumptions are based on DEER 2005 and analysis performed by Southern California Edison (SCE)419. Measure savings per linear foot of insulation installed on bare suction lines in Restaurants and Grocery Stores is provided in Table 3-255 and Table 3-256 below lists the “default” savings for the associated with California Climate Zone 4 which has been chosen as the representative zone for all seven major Pennsylvania cities.
416 http://energysmartonline.org/documents/EnergySmart_BPA_T&Cs.pdf417 Pacific Gas & Electric Company. Refrigeration Rebate Catalog. Pg. 5. http://www.fishnick.com/saveenergy/rebates/2014_PG&E_refrigeration_catalog_final.pdf418 San Diego Gas & Electric Statewide Express Efficiency Program https://www.sdge.com/sites/default/files/regulatory/Express%20and%20SBS%20Workpapers.pdf 419 From Actual Test: 0.250 kW per 3 doors
SECTION 2: Residential MeasuresMiscellaneous Page 445
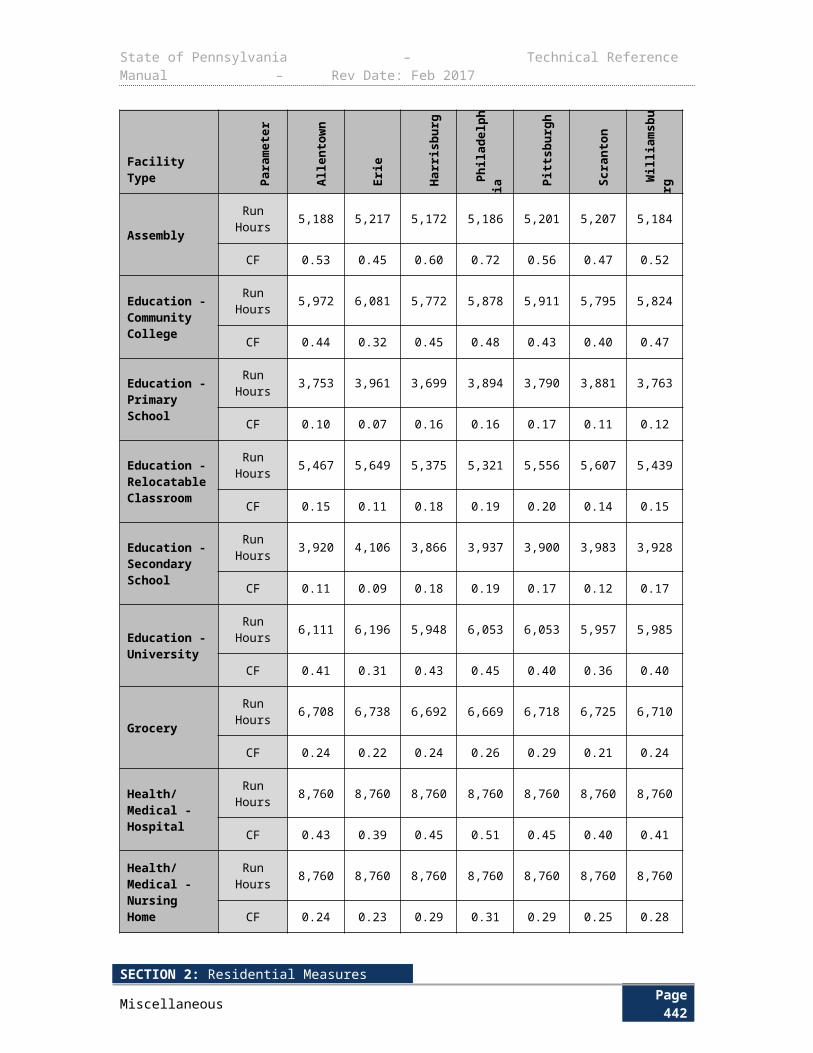
State of Pennsylvania – Technical Reference Manual – Rev Date: Feb 2017
kWh ¿ ∆kWhft
×L
∆ kW peak ¿ ∆kWft
×L
D E F I N I T I O N O F T E R M S
Table 3-255: Insulate Bare Refrigeration Suction Pipes Calculations Assumptions
Term Unit Values Source
∆kWhft
, Annual energy savings per
linear foot of insulation
∆kWhft
Table 3-256 1
∆kWft
, Demand savings per linear foot
of insulation
∆kWft
Table 3-256 1
L, Total insulation length ft. As Measured EDC Data Gathering
D E F A U L T S A V I N G S
Table 3-256: Insulate Bare Refrigeration Suction Pipes Savings per Linear Foot for Walk-in Coolers and Freezers of Restaurants and Grocery Stores420
City
Associated
California Climate Zone421
Medium-Temperature Walk-in Coolers
Low-Temperature Walk-in Freezers
ΔkW/ft. ΔkWh/ft. ΔkW/ft. ΔkWh/ft.All PA cities 4 0.00219 11.3 0.002726 14.8
E V A L U A T I O N P R O T O C O L S For most projects, the appropriate evaluation protocol is to verify installation and proper selection of default values. For projects using customer specific data for open variables, the appropriate evaluation protocol is to verify installation and proper application of TRM protocol along with verification of open variables. The Pennsylvania Evaluation Framework provides specific guidelines and requirements for evaluation procedures.
S O U R C E S
1) Southern California Edison Company, “Insulation of Bare Refrigeration Suction Lines”, Work Paper WPSCNRRN0003.
420 EFLH was determined by multiplying annual available operation hours of 8,760 by overall duty cycle factors. Duty cycle is a function of compressor capacity, defrost and weather factor. The units are assumed to be operating 24/7, 8760 hrs/yr. 421 Southern California Edison Company, “Insulation of Bare Refrigeration Suction Lines”, Work Paper WPSCNRRN0003.
SECTION 2: Residential MeasuresMiscellaneous Page 446
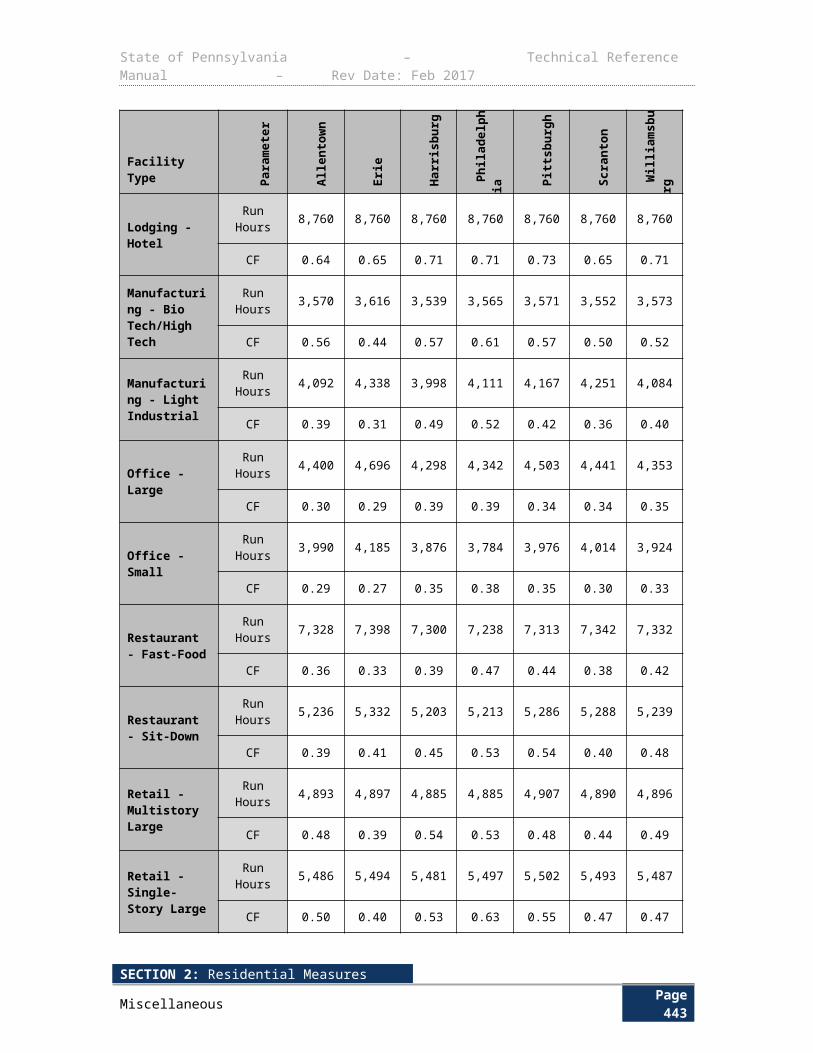
State of Pennsylvania – Technical Reference Manual – Rev Date: Feb 2017
3.5.15 REFRIGERATED DISPLAY CASES WITH DOORS REPLACING OPEN CASES
Measure NameRefrigerated Display Cases with Doors Replacing Open
Cases
Target Sector Commercial and Industrial Establishments
Measure Unit Refrigerated Display Case
Unit Energy Savings Variable
Unit Peak Demand Reduction Variable
Measure Life 12 years422
Measure Vintage Early Replacement
This measure considers the replacement of existing vertical open display cases with new closed display cases. The baseline equipment is an average existing medium temperature vertical open display case.423 The doors on the new cases must be no sweat (also known as zero heat). The display cases should be medium temperature (typically for dairy, meats, or beverages) as opposed to low temperature (typically for frozen food and ice cream). This calculation quantifies the infiltration savings seen by the compressor. Lighting or other upgrades should be considered as separate projects.
E L I G I B I L I T Y
The eligible equipment is a new case with no sweat doors that meets federal standard requirements. If a lighting retrofit is included with the new case, it must consume the same amount of energy or less than the old lighting. Upgrades to lighting or other system components should be processed separately. Horizontal cases are not eligible and should be processed as custom.
A L G O R I T H M S
Deemed energy savings per linear foot of case are based on a CLEAResult Work Paper.424
kWh ¿Energy Savings×CaseWidth
∆ kW peak ¿Demand Savings×CaseWidth
422 DEER database, EUL/RUL for insulation bare suction pipes.423 Commonwealth Edison Refrigeration Incentives Worksheet 2014. https://www.comed.com/documents/business-savings/sifyb_py6_refrigeration.pdf 424 Work papers developed by SCE filed with the CA PUC in support of its 2006 – 2008 energy efficiency program plans
SECTION 2: Residential MeasuresMiscellaneous Page 447
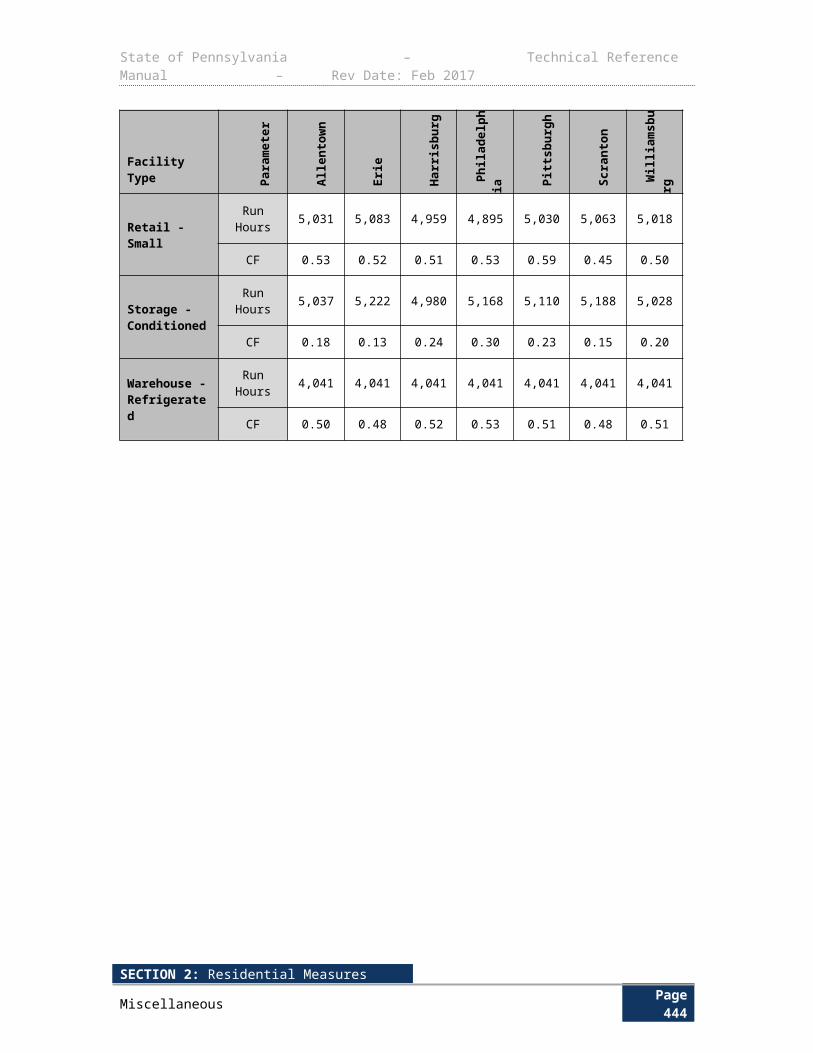
State of Pennsylvania – Technical Reference Manual – Rev Date: Feb 2017
D E F I N I T I O N O F T E R M S
Table 3-257: Assumptions for Adding Doors to Refrigerated Display Cases
Term Unit Values Source
Energy Savings kWhft
495.85 1
Demand Savings kWft
0.0437 1
CaseWidth ft EDC Data Gathering EDC Data Gathering
D E F A U L T S A V I N G S
There are no default savings for this measure.
E V A L U A T I O N P R O T O C O L S
For most projects, the appropriate evaluation protocol is to verify installation and proper selection of default values. For projects using customer specific data for open variables, the appropriate evaluation protocol is to verify installation and proper application of TRM protocol along with verification of open variables. The Pennsylvania Evaluation Framework provides specific guidelines and requirements for evaluation procedures.
S O U R C E S
1) Work Paper for Adding Doors to Existing Refrigerated Display Cases. CLEAResult. August 2014.
SECTION 2: Residential MeasuresMiscellaneous Page 448
State of Pennsylvania – Technical Reference Manual – Rev Date: Feb 2017
3.5.16 ADDING DOORS TO EXISTING REFRIGERATED DISPLAY CASES
Measure Name Adding Doors to Existing Refrigerated Display Cases
Target Sector Commercial and Industrial Establishments
Measure Unit Refrigerated Display Case
Unit Energy Savings Variable
Unit Peak Demand Reduction Variable
Measure Life 12 years425
Measure Vintage Retrofit
This measure considers adding doors to existing vertical open display cases. The baseline equipment is an existing vertical display case of medium temperature with no doors. The display cases should be medium temperature (typically for dairy, meats, or beverages) as opposed to low temperature (typically for frozen food and ice cream). The added doors may be no sweat (also known as zero heat) or they may contain anti-sweat heaters. This calculation quantifies infiltration savings which are realized at the compressor due to reduced load. Lighting or other upgrades should be considered as separate projects.
E L I G I B I L I T Y
The eligible retrofit equipment is either no sweat doors or doors with anti-sweat heaters. If a lighting retrofit is included with the new doors, it must consume the same amount of energy or less energy than the old lighting. Upgrades to lighting or other system components should be processed separately. Horizontal cases are not eligible and should be processed as custom.
A L G O R I T H M S
Deemed energy savings per linear foot of case are based on a CLEAResult Work Paper.426
kWh ¿Energy Savings×CaseWidth
∆ kW peak ¿Demand Savings×CaseWidth
D E F I N I T I O N O F T E R M S
425 A zip code mapping table is located in Appendix F: Zip Code Mapping. This table should be used to identify the reference Pennsylvania city for all zip codes in Pennsylvania426 The default savings values were adopted from the California region and are adjusted to account for differences in weather conditions in Pennsylvania based on cooling degree hours and wet bulb temperatures. The Refrigeration – Suction Pipes Insulation measure protocol follows the weather mapping table shown in Section 1.17.
SECTION 2: Residential MeasuresMiscellaneous Page 449

State of Pennsylvania – Technical Reference Manual – Rev Date: Feb 2017
Table 3-258: Assumptions for Adding Doors to Refrigerated Display Cases
Term Unit Values Source
Energy Savings kWhft
Doors with Anti-Sweat Heaters = 253.37
No Sweat Doors = 474.711
Demand Savings kWft
Doors with Anti-Sweat Heaters = 0.0223
No Sweat Doors = 0.04181
CaseWidth ft EDC Data Gathering EDC Data Gathering
D E F A U L T S A V I N G S
There are no default savings for this measure.
E V A L U A T I O N P R O T O C O L S
For most projects, the appropriate evaluation protocol is to verify installation and proper selection of default values. For projects using customer specific data for open variables, the appropriate evaluation protocol is to verify installation and proper application of TRM protocol along with verification of open variables. The Pennsylvania Evaluation Framework provides specific guidelines and requirements for evaluation procedures.
S O U R C E S
1) Work Paper for Adding Doors to Existing Refrigerated Display Cases. CLEAResult. August 2014.
SECTION 2: Residential MeasuresMiscellaneous Page 450

State of Pennsylvania – Technical Reference Manual – Rev Date: Feb 2017
3.6 APPLIANCES3.6.1 ENERGY STAR CLOTHES WASHER
Measure Name ENERGY STAR Clothes Washer
Target Sector Commercial and Industrial Establishments
Measure Unit Clothes Washer
Unit Energy Savings See Table 3-260 to Table 3-263
Unit Peak Demand Reduction See Table 3-260 to Table 3-263
Measure Life 11.3 years for Multifamily and 7.1 years for Laundromats427
Measure Vintage Replace on Burnout
This protocol discusses the calculation methodology and the assumptions regarding baseline equipment, efficient equipment, and usage patterns used to estimate annual energy savings expected from the replacement of a standard clothes washer with an ENERGY STAR clothes
washer with a minimum Modified Energy Factor (MEF) of > 2.2 (ft3×cycle )
kWh. The Federal
efficiency standard is > 1.60 (ft3×cycle )
kWh for Top Loading washers and > 2.0
(ft3×cycle )kWh
for
Front Loading washers428.
E L I G I B I L I T Y
This protocol documents the energy savings attributed to efficient clothes washers meeting ENERGY STAR or better in small commercial applications. This protocol is limited to clothes washers in laundry rooms of multifamily complexes and commercial Laundromats.
A L G O R I T H M S
The general form of the equation for the ENERGY STAR Clothes Washer measure savings algorithm is:
Total Savings ¿Number of ClothesWashers ×Savings per ClothesWasher
To determine resource savings, the per-unit estimates in the algorithms will be multiplied by the number of clothes washers.
Per unit energy and demand savings are obtained through the following calculations:
∆ kWh ¿ [ (HEt ,base+MEt ,base+De ,base )−(HEt , new+MEt ,new+De ,new ) ]×N
427 Vertical Refrigerated Case, Medium Temperature: Open to Closed (Retrofit). PECI, EnergySmart Grocer. Work Paper PECIREF_PGE604, Revision 0. July 1, 2011. http://rtf.nwcouncil.org//meetings/2011/0830/WP_PECIREF_CA%20DRAFT.pdf428 Work Paper for Adding Doors to Existing Refrigerated Display Cases. CLEAResult. August 2014.
SECTION 2: Residential MeasuresMiscellaneous Page 451
State of Pennsylvania – Technical Reference Manual – Rev Date: Feb 2017
Where:
De ¿ LAF×WGHTmax×≝×DUF×(RMC3−4 %)
RMC ¿(−0.156×MEF)+0.734
HE t ¿( CapMEF )−ME t−De
∆ kW peak ¿∆ kWh×UF
The algorithms used to calculate energy savings are taken from the U.S. Department of Energy’s Supplemental Notice of Proposed Rulemaking (SNOPR).429 DOE adopted the algorithms for commercial clothes washers in a final rule published on October 18, 2005. Commercial clothes washer per-cycle energy consumption is composed of three components: water-heating energy, machine energy, and drying energy. DOE established the annual energy consumption of commercial clothes washers by multiplying the per-cycle energy and water use by the number of cycles per year.
In the above equations, MEF is the Modified Energy Factor, which is the energy performance metric for clothes washers. MEF is defined as:
MEF is the quotient of the capacity of the clothes container, C, divided by the total clothes washer energy consumption per cycle, with such energy consumption expressed as the sum of the machine electrical energy consumption, M, the hot water energy consumption, E, and the energy required for removal of the remaining moisture in the wash load, D. The higher the value, the more efficient the clothes washer is.430
MEF= CM+E+D
The following steps should be taken to determine per-cycle energy consumption for top-loading and front-loading commercial clothes washers for both old and new clothes washers. Per-cycle energy use is disaggregated into water heating, machine, and clothes drying.
1) Calculate the remaining moisture content (RMC) based on the relationship between RMC and MEF.
2) Calculate the per-cycle clothes-drying energy use using the equation that determines the per-cycle energy consumption for the removal of moisture.
3) Use the per-cycle machine energy use value of 0.133 kWhcycle
for MEFs up to 1.40 and 0.114
kWhcycle
for MEFs greater than 1.40. These values are estimated from 2000 TSD for residential
clothes washers’ database. 4) With the per-cycle clothes dryer and machine energy known, determine the per-cycle water-
heating energy use by first determining the total per-cycle energy use (the clothes container volume divided by the MEF) and then subtracting from it the per-cycle clothes-drying and machine energy.
429 Ibid.430 Vertical Refrigerated Case, Medium Temperature: Open to Closed (Retrofit). PECI, EnergySmart Grocer. Work Paper PECIREF_PGE604, Revision 0. July 1, 2011.
SECTION 2: Residential MeasuresMiscellaneous Page 452

State of Pennsylvania – Technical Reference Manual – Rev Date: Feb 2017
The utilization factor, (UF) is equal to the average energy usage between noon and 8PM on summer weekdays to the annual energy usage. The utilization rate is derived as follows:
1) Obtain normalized, hourly load shape data for residential clothes washing.
2) Smooth the load shape by replacing each hourly value with a 5-hour average centered about that hour. This step is necessary because the best available load shape data exhibits erratic behavior commonly associated with metering of small samples. The smoothing out effectively simulates diversification.
3) Take the UF to be the average of all load shape elements corresponding to the hours between noon and 8PM on weekdays from June to September.
The value is the June-September, weekday noon to 8 PM average of the normalized load shape values associated with residential clothes washers in PG&E service territory (northern CA). Although Northern CA is far from PA, the load shape data is the best available at the time and the temporal dependence washer usage is not expected to have a strong geographical dependency. Figure 3-17 shows the utilization factor for each hour of a sample week in July. Because the load shape data derived from monitoring of in-house clothes washers is being imputed to multifamily laundry room washers (which have higher utilization rates), it is important to check that the resulting minutes of usage per hour is significantly smaller than 60. If the minutes of usage per hour approaches 60, then it should be assumed that the load shape for multi-family laundry room clothes washers must be different than the load shape for in-house clothes washers. The maximum utilization per hour is 36.2 minutes.
0
0.0002
0.0004
0.0006
0.0008
0.001
0.0012
0.0014
Utiliz
ation
Fact
or (H
ourly
Frac
tion
of A
nnua
l Usa
ge )
Residential Load Shape (Metered) MF Common Area Load Shape (Reconstructed)
Figure 3-17: Utilization factor for a sample week in July431
D E F I N I T I O N O F T E R M S
The parameters in the above equation are listed in Table 3-259 below.
431 Work Paper for Adding Doors to Existing Refrigerated Display Cases. CLEAResult. August 2014.
SECTION 2: Residential MeasuresMiscellaneous Page 453

State of Pennsylvania – Technical Reference Manual – Rev Date: Feb 2017
Table 3-259: Commercial Clothes Washer Calculation Assumptions
SECTION 2: Residential MeasuresMiscellaneous Page 454
State of Pennsylvania – Technical Reference Manual – Rev Date: Feb 2017
Term Unit Values Source
MEFb , Base Federal Standard Modified Energy Factor
NoneTop loading: 1.6432
Front loading: 2.0433
3
MEF p , Modified Energy Factor of ENERGY STAR Qualified Washing Machine
None Nameplate EDC Data Gathering
None Default: 2.2 4
HE t , Per-cycle water heating consumption
kWhcycle
Calculation Calculation
De , Per-cycle energy consumption for removal of moisture i.e. dryer energy consumption
kWhcycle
Calculation Calculation
ME t , Per-cycle machine electrical energy consumption
kWhcycle
0.114434 1
Capbase, Capacity of baseline clothes washer ft3
Nameplate EDC Data Gathering
Default:Front Loading: 2.84Top Loading: 2.95
5
Capee , Capacity of efficient clothes washer ft3
Nameplate EDC Data Gathering
Front Loading: 2.84Top Loading: 2.84
5
LAF, Load adjustment factor None 0.52 1
DEF, Nominal energy required for clothes dryer to remove moisture from clothes
kWhlb
0.5 1
DUF, Dryer usage factor, percentage of washer loads dried in a clothes dryer None 0.84 1
WGHTmax , Maximum test-load weightlbscycle
11.7 1
RMC, Remaining moisture content lbs Calculation435 Calculation
N, Number of cycles per year CycleMultifamily: 1,241
Laundromats: 2,190
1
UF, Utilization Factor None 0.0002382 2
432 “Energy Conservation Program: Energy Conservation Standards for Certain Consumer Products (Dishwashers, Dehumidifiers, Microwave Ovens, and Electric and Gas Kitchen Ranges and Ovens) and for Certain Commercial and Industrial Equipment (Commercial Clothes Washers); Final Rule,” 75 Federal Register 5 (January 8, 2010), pp.1140.433 ibid. 434 Commercial Clothes Washer Supplemental Notice of Proposed Rulemaking, Chapter 6. http://www1.eere.energy.gov/buildings/appliance_standards/commercial/pdfs/ccw_snopr_chap6.pdf 435 Definition provided on ENERGY STAR Clothes Washers Key Product Criteria website: http://www.energystar.gov/index.cfm?c=clotheswash.pr_crit_clothes_washers
SECTION 2: Residential MeasuresMiscellaneous Page 455

State of Pennsylvania – Technical Reference Manual – Rev Date: Feb 2017
D E F A U L T S A V I N G S
The default savings for the installation of a washing machine with a MEF of 2.2 or higher, is dependent on the energy source for washer. Table 3-260 thru Table 3-263 show savings for ENERGY STAR washing machines with different combinations of water heater and dryer types in multifamily buildings and laundromats. The values are based on the difference between the
baseline clothes washer with MEF Federal efficiency standard of > 1.60 (ft3×cycle )
kWh for top
loading washers and > 2.0 (ft3×cycle )
kWh for front loading washers and minimum ENERGY STAR
qualified front loading436 clothes washer of > 2.2(ft3×cycle )
kWh.
For clothes washers where fuel mix is unknown, calculate default savings using the algorithms below and EDC specific saturation values. For EDCs where saturation information is not accessible, use “Default values” described in Table 3-260 through Table 3-263 below.
ESavcw ¿kWhgwh−gd×%GWH−GDcw+kWhgwh−ed×%GWH−EDcw+kWhewh−gd×%EWH−GDcw+kWhewh−ed×%EWH−EDcw
Where:
kWhgwh−gd= Energy savings for clothes washers with gas water heater and non-electric dryer fuel from tables below
kWhgwh−ed= Energy savings for clothes washers with gas water heater and electric dryer fuel from tables below
kWhewh−gd= Energy savings for clothes washers with electric water heater and non-electric dryer fuel from tables below
kWhewh−ed= Energy savings for clothes washers with electric water heater and electric dryer fuel from tables below
%GWH−GDcw= Percent of clothes washers with gas water heater and non-electric dryer fuel
%GWH−EDcw= Percent of clothes washers with gas water heater and electric dryer fuel
%EWH−GDcw= Percent of clothes washers with electric water heater and non-electric dryer fuel
%EWH−EDcw= Percent of clothes washers with electric water heater and electric dryer fuel
436 The solid green profile is derived from a normalized load shape based on metering of residential in-unit dryers. The dashed black profile is a smoothed version of the green profile and represents the utilization factors for common laundry facilities in multifamily establishments.
SECTION 2: Residential MeasuresMiscellaneous Page 456
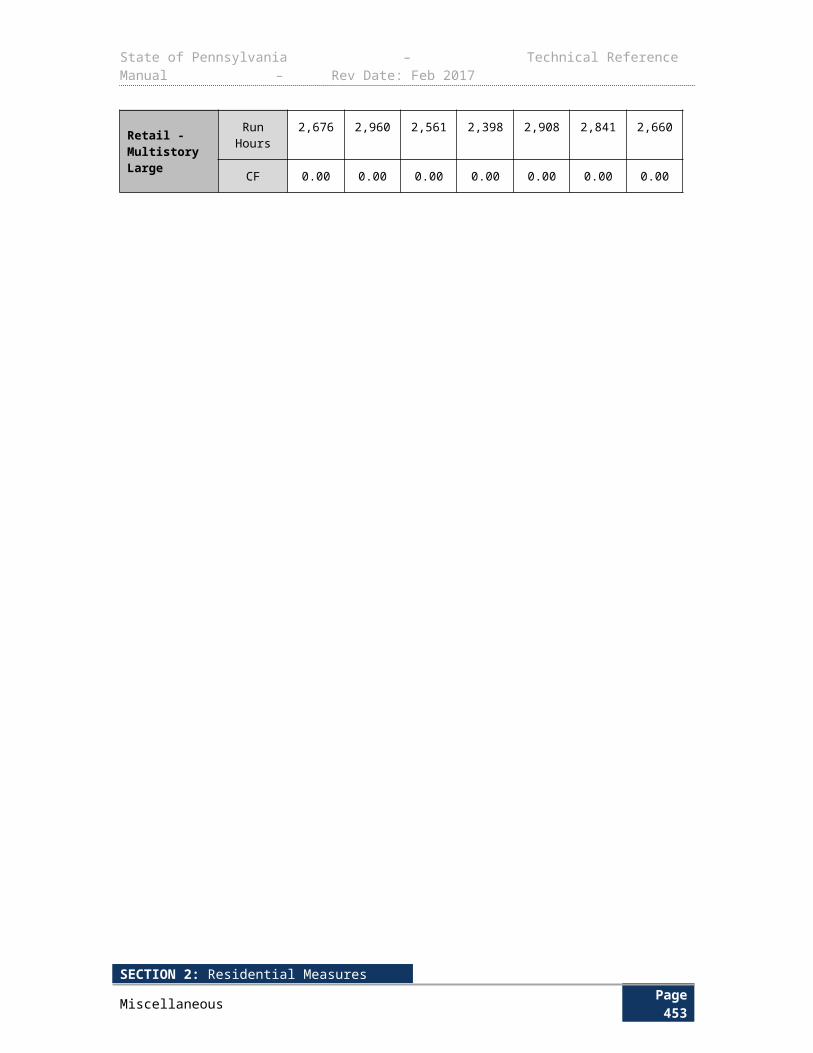
State of Pennsylvania – Technical Reference Manual – Rev Date: Feb 2017
Table 3-260: Default Savings for Top Loading ENERGY STAR Clothes Washer for Laundry in Multifamily Buildings (PY8-PY9)437
Fuel SourceCycles/
YearEnergy Savings
(kWh)Demand
Reduction (kW)
Electric Hot Water Heater, Electric Dryer 1,241 686 0.163
Electric Hot Water Heater, Gas Dryer 1,241 341 0.081
Gas Hot Water Heater, Electric Dryer 1,241 345 0.082
Gas Hot Water Heater, Gas Dryer 1,241 0 0
Default (20% Electric DHW 40% Electric Dryer)438 1,241 206 0.049
Table 3-261: Default Savings for Front Loading ENERGY STAR Clothes Washer for Laundry in Multifamily Buildings (PY8-PY9) 439
Fuel SourceCycles/
YearEnergy Savings
(kWh)Demand
Reduction (kW)
Electric Hot Water Heater, Electric Dryer 1,241 160 0.038
Electric Hot Water Heater, Gas Dryer 1,241 61 0.015
Gas Hot Water Heater, Electric Dryer 1,241 99 0.024
Gas Hot Water Heater, Gas Dryer 1,241 0 0
Default (20% Electric DHW 40% Electric Dryer)440 1,241 52 0.012
Table 3-262: Default Savings for Top Loading ENERGY STAR Clothes Washer for Laundromats (PY8-PY9) 441
Fuel SourceCycles/
YearEnergy Savings
(kWh)Demand
Reduction (kW)
Electric Hot Water Heater, Electric Dryer 2,190 1,211 0.288
Electric Hot Water Heater, Gas Dryer 2,190 602 0.143
Gas Hot Water Heater, Electric Dryer 2,190 609 0.145
Gas Hot Water Heater, Gas Dryer 2,190 0 0
Default (0% Electric DHW 0% Electric Dryer)442
2,190 0 0
437 Only applicable for PY8 and PY9. For PY10-PY12 MEFs, see Future Standards Changes section below. 438 Ibid.439 Based on residential clothes washer data from DOE 2000 Technical Support Document (TSD) 440 Based on the relationship: RMC = -0.156* MEF + 0.734441 ENERGY STAR-qualified commercial clothes washers in 2013 are likely to be front-loading units because there are no top-loading commercial clothes washers at this time which have been certified by DOE as meeting the 2013 standards
SECTION 2: Residential MeasuresMiscellaneous Page 457

State of Pennsylvania – Technical Reference Manual – Rev Date: Feb 2017
Table 3-263: Default Savings Front Loading ENERGY STAR Clothes Washer for Laundromats (PY8-PY9) 443
Fuel SourceCycles/
YearEnergy Savings
(kWh)Demand
Reduction (kW)
Electric Hot Water Heater, Electric Dryer 2,190 283 0.067
Electric Hot Water Heater, Gas Dryer 2,190 108 0.026
Gas Hot Water Heater, Electric Dryer 2,190 175 0.042
Gas Hot Water Heater, Gas Dryer 2,190 0 0
Default (0% Electric DHW 0% Electric Dryer)444
2,190 0 0
F U T U R E S T A N D A R D S C H A N G E S
The Department of Energy (DOE) published a final rule on December 15, 2014 adopting more stringent energy conservation standards for commercial clothes washers. Compliance with the new standards is required on January 1, 2018. As stated in Section 1.7, if a new federal standard is effective in January, the changes will be reflected in the TRM to be released in the following program year. Therefore, the new standards will be effective from June 1, 2018 (PY10) until the end of Phase III (PY12) provided that there are no additional code changes.
The DOE test procedures for clothes washers are codified at title 10 of the Code of Federal Regulations (CFR) part 430445, subpart B, appendix J1 and appendix J2. The PY8-PY9 standards use the test procedure in appendix J1 to determine the Modified Energy Factors (MEFs) while the PY10-PY12 standards use the methodology in appendix J2. To understand how the new standards compare with the current standards for commercial clothes washers, the DOE provided equivalent appendix J1 and appendix J2 MEFs. Since the current algorithms in the TRM use appendix J1 MEFs, appendix J1 equivalent of appendix J2 MEFs will be used for PY10-PY12 measures.
Table 3-264: Future Federal Standards for Clothes Washers (PY10-PY12)446
Equipment Type Minimum MEF
Top-loading 1.7
Front-loading 2.4
There are no default savings for PY10-PY12 measures.
E V A L U A T I O N P R O T O C O L S
For most projects, the appropriate evaluation protocol is to verify installation and proper selection of default values. For projects using customer specific data for open variables, the appropriate evaluation protocol is to verify installation and proper application of TRM protocol along with 442Based on a container volume of 2.8 cu. ft., maximum test-load weight of 11.7 lb./cycle and electric water heater at 100% efficiency.443 Commercial Clothes Washer SNOPR Life Cycle Calculator Excel Spread Sheet 444ibid445 ibid446ibid
SECTION 2: Residential MeasuresMiscellaneous Page 458
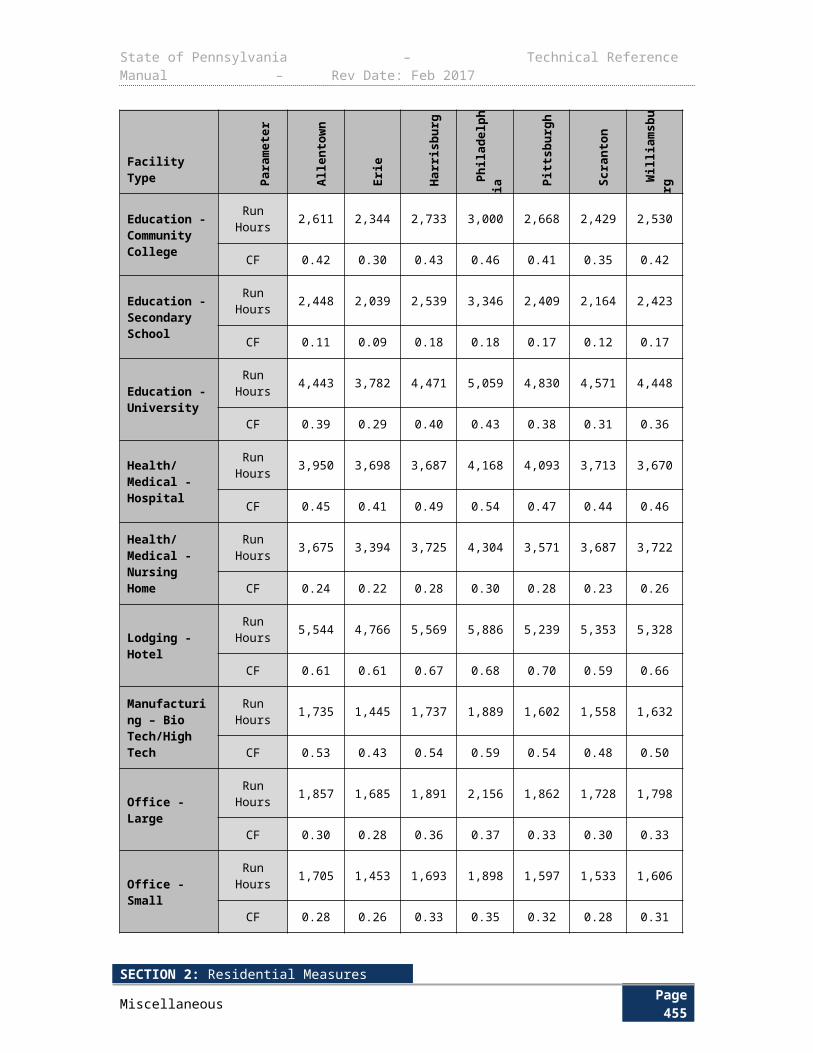
State of Pennsylvania – Technical Reference Manual – Rev Date: Feb 2017
verification of open variables. The Pennsylvania Evaluation Framework provides specific guidelines and requirements for evaluation procedures.
S O U R C E S
1) U.S. Department of Energy. Commercial Clothes Washer Supplemental Notice of Proposed Rulemaking, Chapter 6. http://www1.eere.energy.gov/buildings/appliance_standards/commercial/pdfs/ccw_snopr_chap6.pdf
2) Annual hourly load shapes taken from Energy Environment and Economics (E3), Reviewer2: http://www.ethree.com/cpuc_cee_tools.html. The average normalized usage for the hours noon to 8 PM, Monday through Friday, June 1 to September 30 is 0.000243
3) “Energy Conservation Program: Energy Conservation Standards for Certain Consumer Products (Dishwashers, Dehumidifiers, Microwave Ovens, and Electric and Gas Kitchen Ranges and Ovens) and for Certain Commercial and Industrial Equipment (Commercial Clothes Washers); Final Rule,” 75 Federal Register 5 (8 January 2010), pp. 1123
4) ENERGY STAR. U.S. Environmental Protection Agency and U.S. Department of Energy. “ENERGY STAR Program Requirements Product Specification for Clothes Washers.” ENERGY STAR Version 6.1 Clothes Washers Specification (Jan. 2013):
5) California Energy Commission (“CEC”) Appliance Efficiency database, http://www.appliances.energy.ca.gov/QuickSearch.aspx
3.7 FOOD SERVICE EQUIPMENT3.7.1 HIGH-EFFICIENCY ICE MACHINES
Measure Name High-Efficiency Ice Machines
Target Sector Commercial and Industrial Establishments
Measure Unit Ice Machine
Unit Energy Savings Variable
Unit Peak Demand Reduction Variable
Measure Life 10 Years447
Measure Vintage Replace on Burnout
E L I G I B I L I T Y
This measure applies to the installation of a high-efficiency ice machine as either a new item or replacement for an existing unit. The machine must be air-cooled batch-type or continuous ice makers to qualify, which can include self-contained, ice-making heads, or remote-condensing units. The baseline equipment is a commercial ice machine that meets federal equipment standards. The efficient machine must conform to the minimum ENERGY STAR efficiency requirements and meet the ENERGY STAR requirements for water usage given under the same criteria. 447 ibid
SECTION 2: Residential MeasuresMiscellaneous Page 459
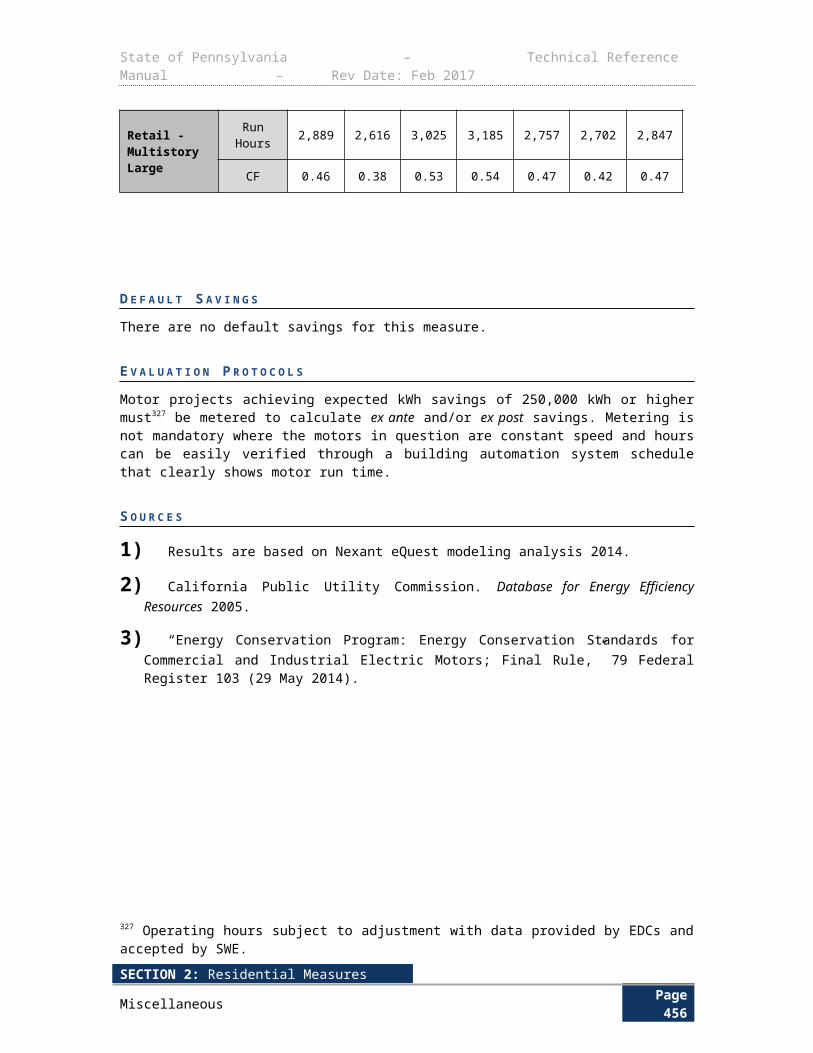
State of Pennsylvania – Technical Reference Manual – Rev Date: Feb 2017
A L G O R I T H M S
The energy savings are dependent on the capacity of ice produced on a daily basis and the duty cycle. A machine’s capacity is generally reported as an ice harvest rate, or amount of ice produced each day.
kWh ¿(kWhbase−kWhhe )
100×H×365×D
∆ kW peak ¿ ∆kWh8760×D
×CF
D E F I N I T I O N O F T E R M S
The reference values for each component of the energy impact algorithm are shown in Table 3-265. A default duty cycle (D) is provided as based on referenced values from several studies, however, EDC data gathering may be used to adjust the duty cycle for custom applications.
SECTION 2: Residential MeasuresMiscellaneous Page 460
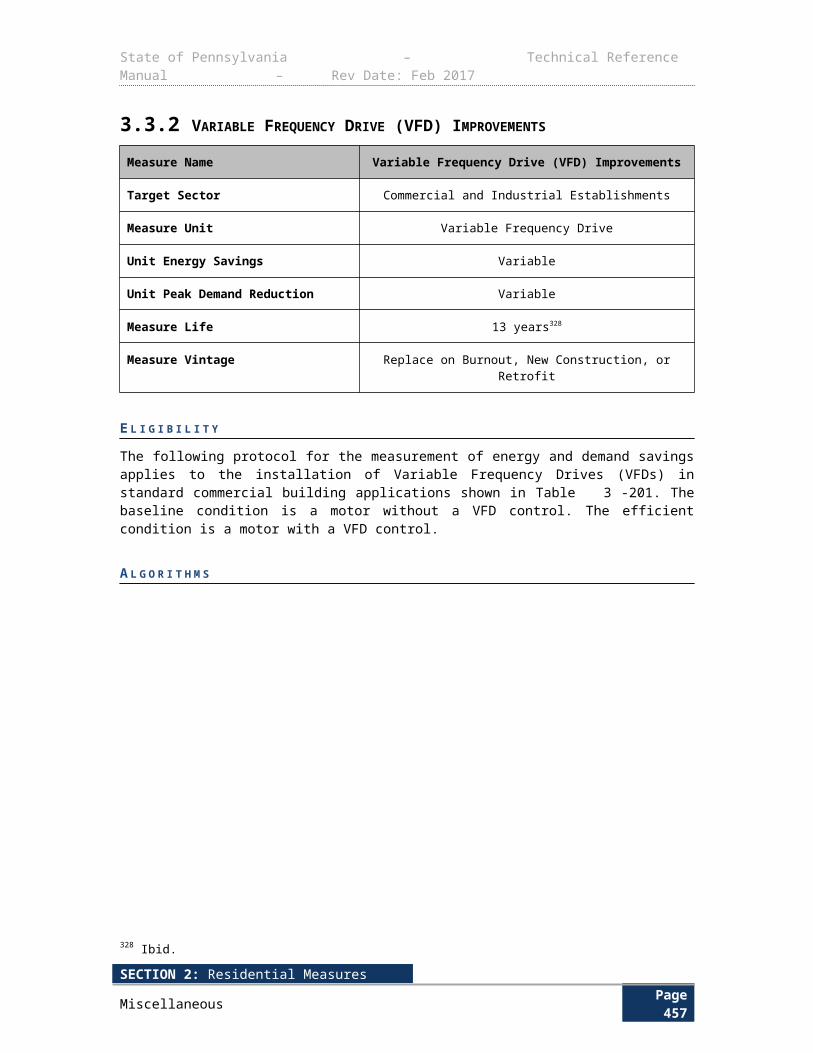
State of Pennsylvania – Technical Reference Manual – Rev Date: Feb 2017
Table 3-265: Ice Machine Reference Values for Algorithm Components
Term Unit Values Source
kWhbase , Baseline ice machine energy usage per 100 lbs. of ice
kWh100lbs
Table 3-2661
kWhhe , High-efficiency ice machine energy usage per 100 lbs. of ice
kWh100lbs
Table 3-267 2
H , Ice harvest rate per 24 hrs. lbsday
Manufacturer Specs EDC Data Gathering
D, Duty cycle of ice machine expressed as a percentage of time machine produces ice
None
Custom EDC Data Gathering
Default: 0.4448 3
365, Days per year Daysyear
365 Conversion Factor
100, Conversion to obtain energy per pound of ice
lbs100lbs
100 Conversion Factor
8760, Hours per year Hoursyear
8,760 Conversion Factor
Ice maker type None Manufacturer Specs EDC Data Gathering
CF , Demand Coincidence Factor Decimal 0.77 4
448Ibid
SECTION 2: Residential MeasuresMiscellaneous Page 461
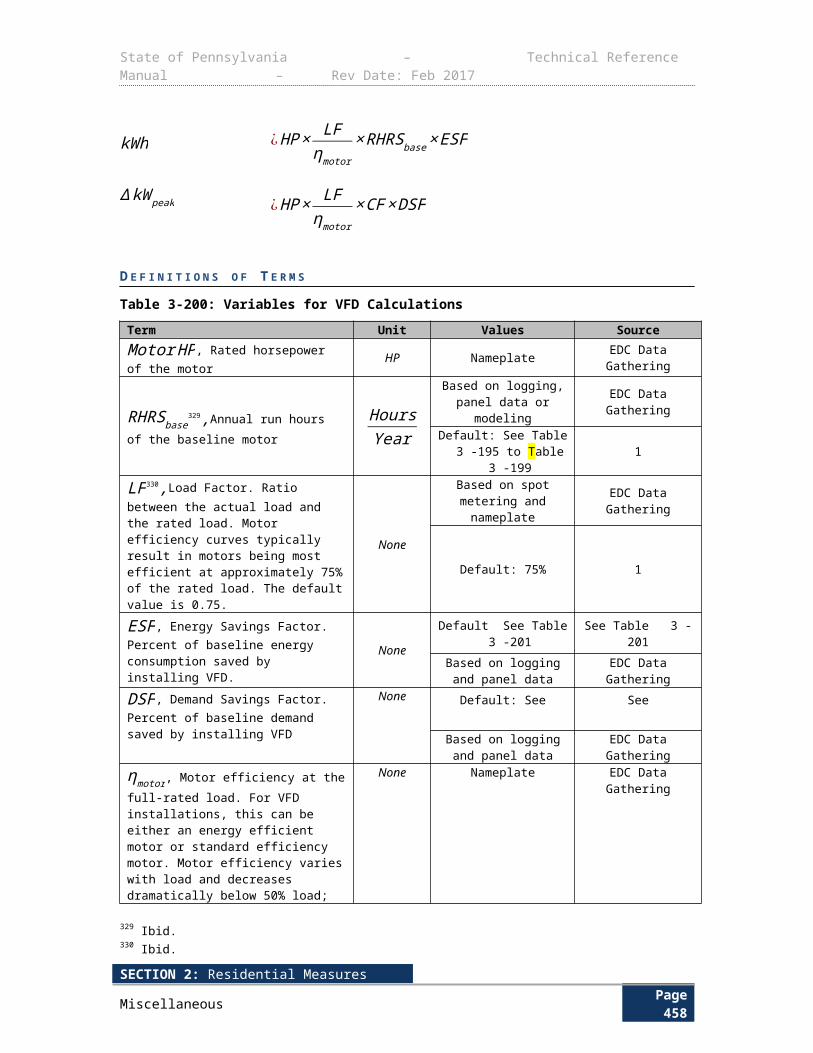
State of Pennsylvania – Technical Reference Manual – Rev Date: Feb 2017
Table 3-266: Batch-Type Ice Machine Baseline Efficiencies (PY8-PY9)
Ice machine type
Ice harvest rate (H)
( lbsday ) Baseline energy use per 100 lbs. of ice (kWhbase )
Ice-Making Head<450 10.26 – 0.0086*H
≥450 6.89 – 0.0011*H
Remote-Condensing w/out remote compressor
<1000 8.85 – 0.0038*H
≥1000 5.1
Remote-Condensing with remote compressor
<934 8.85 – 0.0038*H
≥934 5.3
Self-Contained<175 18 – 0.0469*H
≥175 9.8
Table 3-267: Batch-Type Ice Machine ENERGY STAR Efficiencies (PY8-PY9)
Ice machine type
Ice harvest rate (H)
( lbsday ) Energy use per 100 lbs. of ice (kWhee )
Ice-Making Head 200 ≤ H ≤ 1600 ≤ 37.72*H -0.298
Remote-Condensing Unit400 ≤ H ≤ 1600 ≤ 22.95*H -0.258 + 1.00
1600 ≤ H ≤ 4000 ≤ -0.00011*H + 4.60
Self-Contained (SCU) 50 ≤ H ≤ 450 ≤ 48.66*H -0.326 + 0.08
D E F A U L T S A V I N G S
There are no default savings associated with this measure.
F U T U R E S T A N D A R D S C H A N G E S
The Department of Energy (DOE) published a final rule on January 28, 2015 adopting more stringent energy conservation standards for some classes of automatic commercial ice makers as well as establishing new standards for continuous type ice-making machines that were not previously regulated by the DOE. Compliance with the new standards is required on January 28, 2018. As stated in Section 1.7, if a new federal standard is effective in January, the changes will be reflected in the TRM to be released in the following program year. Therefore, the new standards will be effective from June 1, 2018 (PY10) until the end of Phase III (PY12) provided that there are no additional code changes.
The baseline and ENERGY STAR efficiencies for ice machines are presented in Table 3-268, Table 3-269, Table 3-270, and Table 3-271.
SECTION 2: Residential MeasuresMiscellaneous Page 462
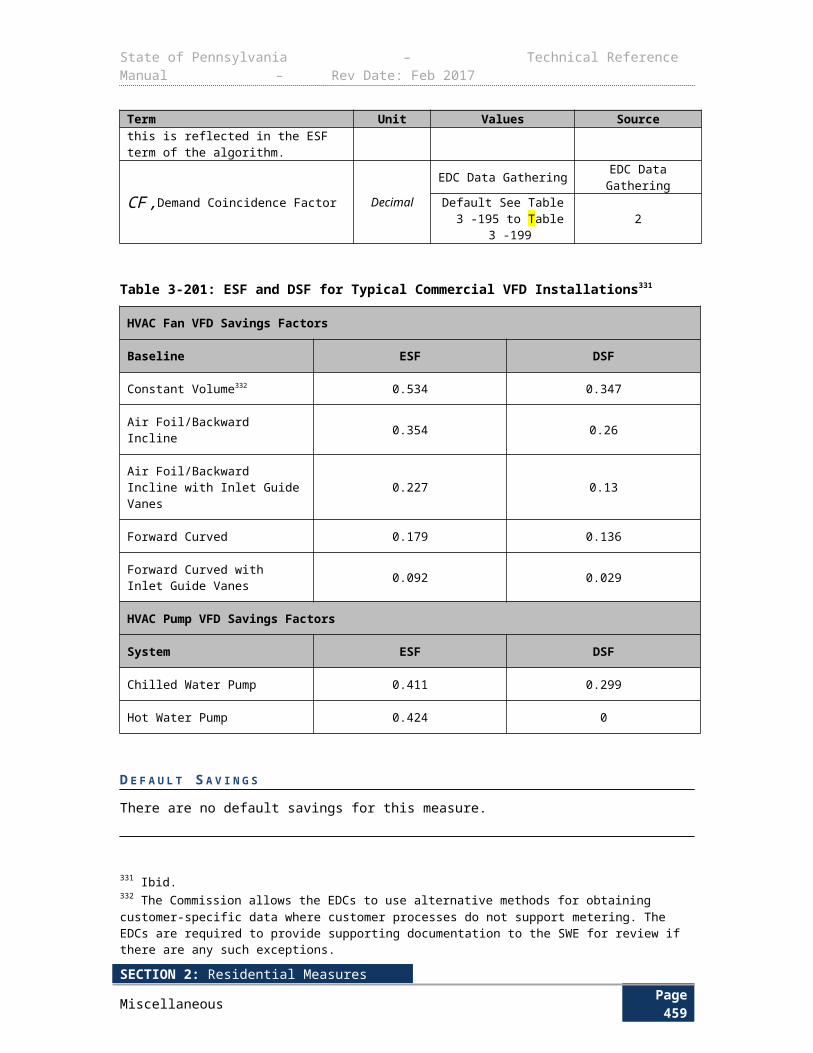
State of Pennsylvania – Technical Reference Manual – Rev Date: Feb 2017
Table 3-268: Batch-Type Ice Machine Baseline Efficiencies (PY10-PY12)449
Ice machine type
Ice harvest rate (H)
( lbsday ) Baseline energy use per 100 lbs. of ice (kWhbase )
Ice-Making Head
<300 10 - 0.01233*H
≥300 and <800 7.05 - 0.0025*H
≥800 and <1,500 5.55 - 0.00063*H
≥1,500 and <4,000 4.61
Remote-Condensing w/out remote compressor
≥50 and <1,000 7.97 - 0.00342*H
≥1,000 and <4,000 4.55
Remote-Condensing with remote compressor
<942 7.97 - 0.00342*H
≥942 and <4,000 4.75
Self-Contained
<110 14.79 - 0.0469*H
≥110 and <200 12.42 - 0.02533*H
≥200 and <4,000 7.35
Table 3-269: Continuous Type Ice Machine Baseline Efficiencies (PY10-PY12)
Ice machine type
Ice harvest rate (H)
( lbsday ) Baseline energy use per 100 lbs. of ice (kWhbase )
Ice-Making Head
<310 9.19 - 0.00629*H
≥310 and <820 8.23 - 0.0032*H
≥820 and <4,000 5.61
Remote-Condensing w/out remote compressor
<800 9.7 - 0.0058*H
≥800 and <4,000 5.06
Remote-Condensing with remote compressor
<800 9.9 - 0.0058*H
≥800 and <4,000 5.26
Self-Contained
<200 14.22 - 0.03*H
≥200 and <700 9.47 - 0.00624*H
≥700 and <4,000 5.1
449 ibid
SECTION 2: Residential MeasuresMiscellaneous Page 463
State of Pennsylvania – Technical Reference Manual – Rev Date: Feb 2017
Table 3-270: Batch-Type Ice Machine ENERGY STAR Efficiencies (PY10-PY12)450
Ice machine type
Ice harvest rate (H)
( lbsday ) Energy use per 100 lbs. of ice (kWhee )
Ice-Making Head 200 ≤ H ≤ 1600 ≤ 37.72*H -0.298
Remote-Condensing Unit400 ≤ H ≤ 1600 ≤ 22.95*H -0.258 + 1.00
1600 ≤ H ≤ 4000 ≤ -0.00011*H + 4.60
Self-Contained (SCU) 50 ≤ H ≤ 450 ≤ 48.66*H -0.326 + 0.08
Table 3-271: Continuous Type Ice Machine ENERGY STAR Efficiencies (PY10-PY12)
Ice machine type
Energy use per 100 lbs. of ice (kWhee )
Ice-Making Head ≤ 9.18*H -0.057
Remote-Condensing Unit ≤ 6.00*H -0.162 + 3.50
Self-Contained (SCU) ≤59.45*H-0.349 + 0.08
E V A L U A T I O N P R O T O C O L S
For most projects, the appropriate evaluation protocol is to verify installation and proper selection of default values. For projects using customer specific data for open variables, the appropriate evaluation protocol is to verify installation and proper application of TRM protocol along with verification of open variables. The Pennsylvania Evaluation Framework provides specific guidelines and requirements for evaluation procedures.
S O U R C E S
1) Federal energy conservation standard for automatic commercial ice makers. http://www1.eere.energy.gov/buildings/appliance_standards/product.aspx/productid/21
2) Commercial Ice Maker Key Product Criteria Version 2.0. https://www.energystar.gov/index.cfm?c=comm_ice_machines.pr_crit_comm_ice_machines
3) State of Ohio Energy Efficiency Technical Reference Manual cites a default duty cycle of 40% as a conservative value. Other studies range as high as 75%.
4) State of Ohio Energy Efficiency Technical Reference Manual cites a CF = 0.772 as adopted from the Efficiency Vermont TRM. Assumes CF for ice machines is similar to that for general commercial refrigeration equipment.
450 http://www.ecfr.gov/cgi-bin/text-idx?tpl=/ecfrbrowse/Title10/10cfr430_main_02.tpl
SECTION 2: Residential MeasuresMiscellaneous Page 464
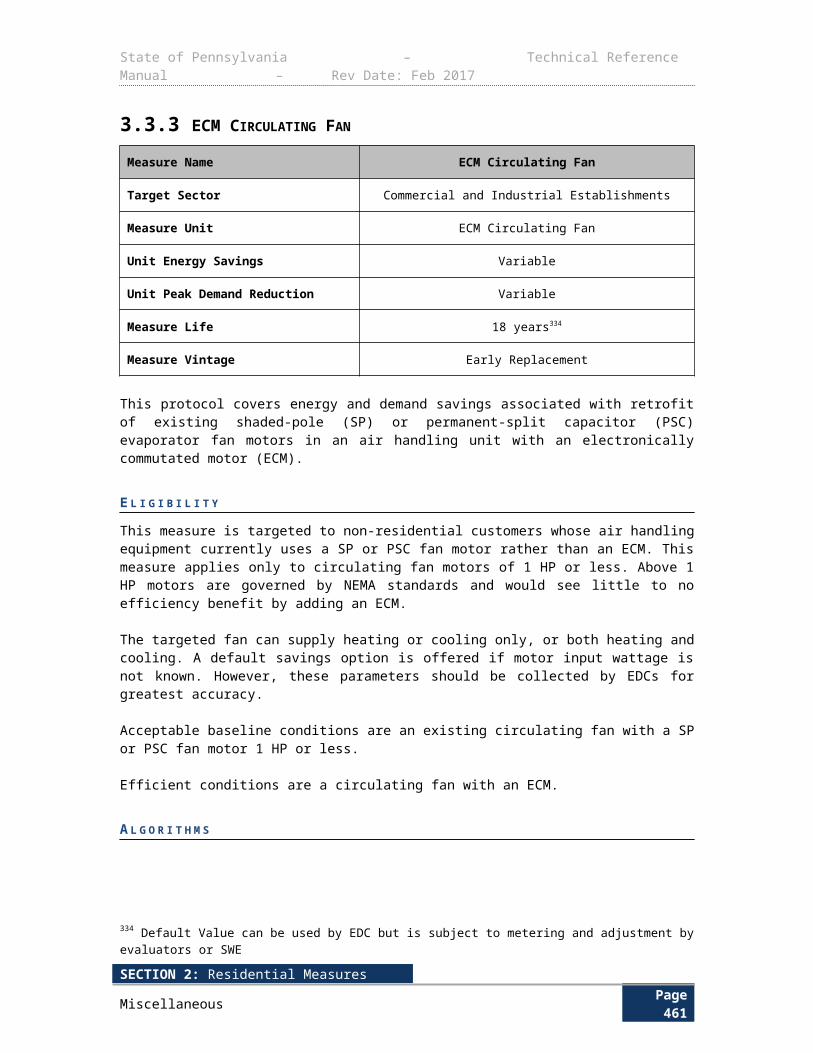
State of Pennsylvania – Technical Reference Manual – Rev Date: Feb 2017
3.7.2 CONTROLS: BEVERAGE MACHINE CONTROLS
Measure Name Controls: Beverage Machine Controls
Target Sector Commercial and Industrial Establishments
Measure Unit Machine Control
Unit Energy Savings Variable
Unit Peak Demand Reduction Variable
Measure Life 5 years451,452
Measure Vintage Retrofit
E L I G I B I L I T Y
This measure is intended for the addition of control systems to existing, non-ENERGY STAR, beverage vending machines. The applicable machines contain refrigerated, non-perishable beverages that are kept at an appropriate temperature. The control systems are intended to reduce energy consumption due to lighting and refrigeration during times of lower customer sales. Typical control systems contain a passive infrared occupancy sensor to shut down the machine after a period of inactivity in the area. The compressor will power on for one to three hour intervals, sufficient to maintain beverage temperature, and when powered on at any time will be allowed to complete at least one cycle to prevent excessive wear and tear.
The baseline equipment is taken to be an existing standard refrigerated beverage vending machine that does not contain control systems to shut down the refrigeration components and lighting during times of low customer use.
A L G O R I T H M S
Energy savings are dependent on decreased machine lighting and cooling loads during times of lower customer sales. The savings will be dependent on the machine environment, noting that machines placed in locations such as a day-use office will result in greater savings than those placed in high-traffic areas such as hospitals that operate around the clock. The algorithm below takes into account varying scenarios and can be taken as representative of a typical application.
kWh ¿kWhbase× E
∆ kW peak ¿0
There are no peak demand savings because this measure is aimed to reduce demand during times of low beverage machine use, which will typically occur during off-peak hours.
451 U.S. Department of Energy. 10 CFR Parts 429 and 430. Energy Conservation Program: Energy Conservation Standards for Residential Clothes Washers. Direct Final Rule.452 DEER 2014 Effective Useful Life.
SECTION 2: Residential MeasuresMiscellaneous Page 465
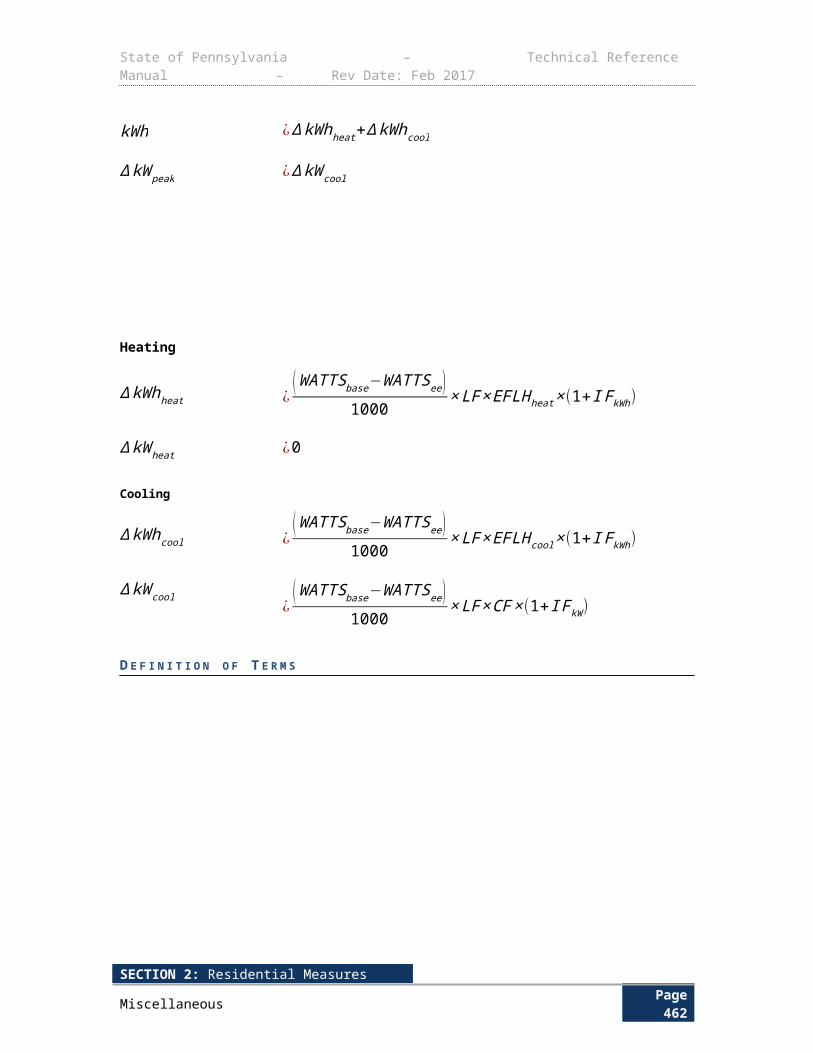
State of Pennsylvania – Technical Reference Manual – Rev Date: Feb 2017
D E F I N I T I O N O F T E R M S
Table 3-272: Beverage Machine Control Calculation Assumptions
Term Unit Values Source
kWhbase, Baseline annual beverage machine energy consumption
kWhyear
EDC Data Gathering
Default: Table 3-273
EDC Data Gathering
E, Efficiency factor due to control system, which represents percentage of energy reduction from baseline
None EDC Data Gathering EDC Data Gathering
D E F A U L T S A V I N G S
The decrease in energy consumption due to the addition of a control system will depend on the number or hours per year during which lighting and refrigeration components of the beverage machine are powered down. The average decrease in energy use from refrigerated beverage vending machines with control systems installed is 46%.453,454,455,456 It should be noted that various studies found savings values ranging between 30-65%, most likely due to differences in customer occupation.
The default baseline energy consumption and default energy savings are shown in Table 3-273. The default energy savings were derived by applying a default efficiency factor of Edefault=46 % to the energy savings algorithm above. Where it is determined that the default efficiency factor (E) or default baseline energy consumption (kWhbase ) is not representative of specific applications, EDC data gathering can be used to determine an application-specific energy savings factor (E), and/or baseline energy consumption (kWhbase ), for use in the Energy Savings algorithm.Table 3-273: Beverage Machine Controls Energy Savings
Machine Can Capacity
Default Baseline Energy Consumption (kWhbase )
( kWhyear )Default Energy Savings
(∆ kWh); ( kWhyear ) Source
< 500 3,113 1,432 1
500 3,916 1,801 1
600 3,551 1,633 1
700 4,198 1,931 1
800+ 3,318 1,526 1
453 State of Ohio Energy Efficiency Technical Reference Manual, Including Predetermined Savings Values and Protocols for Determining Energy and Demand Savings, August 6, 2010. Prepared for the Public Utilities Commission of Ohio by Vermont Energy Investment Corporation. 454 “Energy Conservation Program: Energy Conservation Standards for Automatic Commercial Ice Makers; Final Rule. Federal Register / Vol. 80, No. 18. January 28, 2015.455 ENERGY STAR Commercial Ice Maker Key Product Criteria. Version 2.0.456 DEER 2014 Effective Useful Life.
SECTION 2: Residential MeasuresMiscellaneous Page 466

State of Pennsylvania – Technical Reference Manual – Rev Date: Feb 2017
E V A L U A T I O N P R O T O C O L S
For most projects, the appropriate evaluation protocol is to verify installation and proper selection of default values. For projects using customer specific data for open variables, the appropriate evaluation protocol is to verify installation and proper application of TRM protocol along with verification of open variables. The Pennsylvania Evaluation Framework provides specific guidelines and requirements for evaluation procedures.
S O U R C E S
1) ENERGY STAR Calculator, Assumptions for Vending Machines, accessed 8/2010
SECTION 2: Residential MeasuresMiscellaneous Page 467
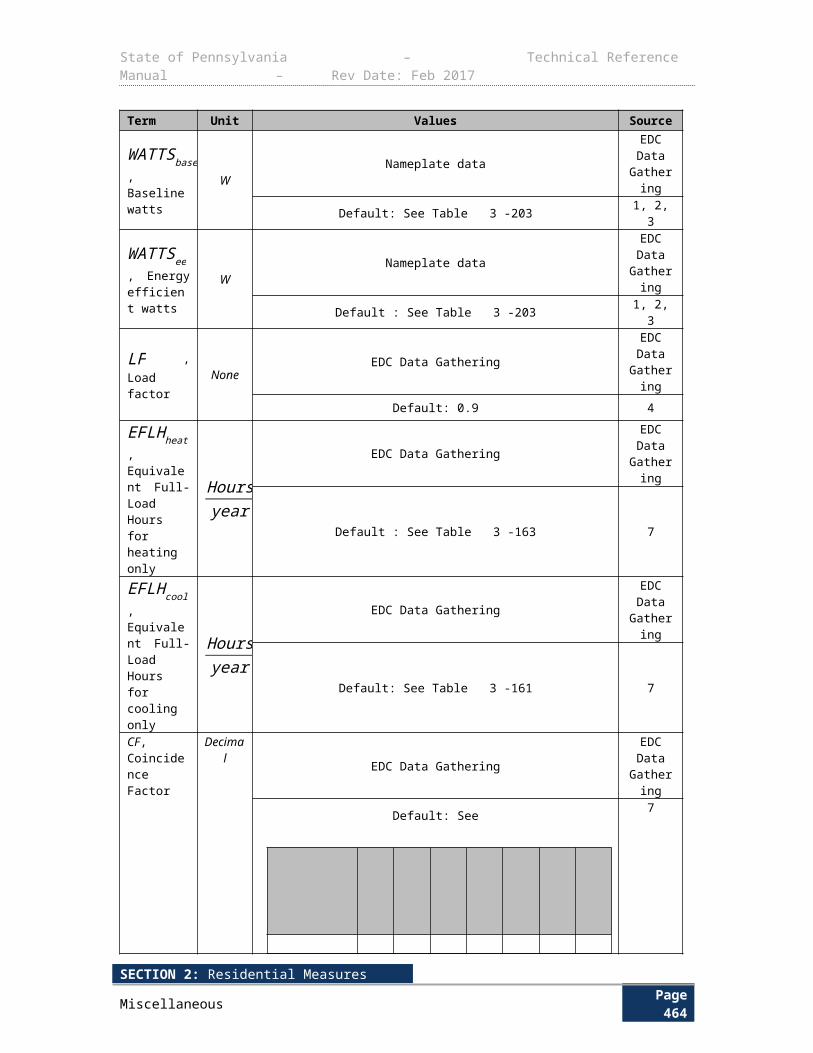
State of Pennsylvania – Technical Reference Manual – Rev Date: Feb 2017
3.7.3 CONTROLS: SNACK MACHINE CONTROLS
Measure Name Controls: Snack Machine Controls
Target Sector Commercial and Industrial Establishments
Measure Unit Machine Control
Unit Energy Savings Variable
Unit Peak Demand Reduction 0 kW
Measure Life 5 years457
Measure Vintage Retrofit
A snack machine controller is an energy control device for non-refrigerated snack vending machines. The controller turns off the machine‘s lights based on times of inactivity. This protocol is applicable for conditioned indoor installations.
E L I G I B I L I T Y
This measure is targeted to non-residential customers who install controls to non-refrigerated snack vending machines.
Acceptable baseline conditions are non-refrigerated snack vending machines.
Efficient conditions are non-refrigerated snack vending machines with controls.
A L G O R I T H M S
The energy savings for this measure result from reduced lighting operation.
kWh ¿Wattsbase
1000∗HOURS∗ESF
∆ kW peak ¿0
D E F I N I T I O N O F T E R M S
Table 3-274: Snack Machine Controls – Values and References
Term Unit Values Source
Wattsbase , Wattage of vending machine WEDC Data GatheringDefault: 85
EDC Data Gathering1
HOURS , Annual hours of operationHoursYear
EDC Data GatheringDefault: 8,760
EDC Data Gathering1
ESF , Energy savings factor None 46% 1
457 Deru et al. suggest that beverage machine life will be extended from this measure due to fewer lifetime compressor cycles.
SECTION 2: Residential MeasuresMiscellaneous Page 468
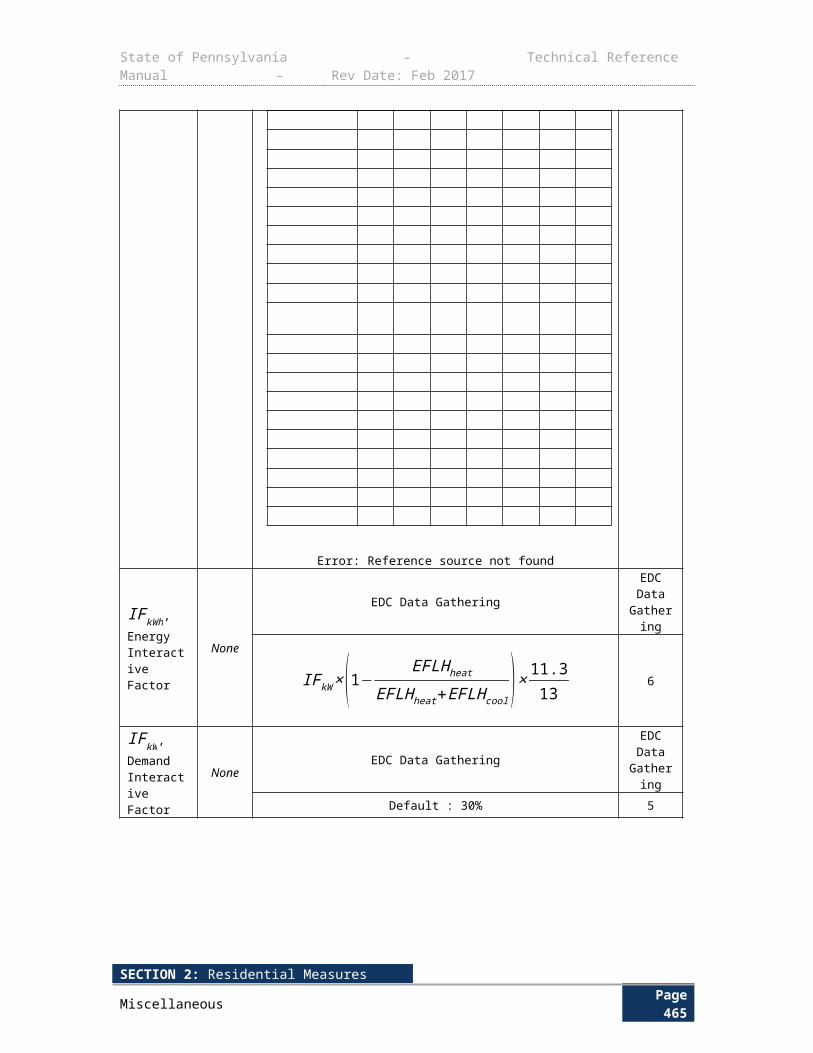
State of Pennsylvania – Technical Reference Manual – Rev Date: Feb 2017
D E F A U L T S A V I N G S
Default savings may be claimed using the algorithms above and the variable defaults. EDCs may also claim savings using customer specific data.
E V A L U A T I O N P R O T O C O L S
For most projects, the appropriate evaluation protocol is to verify installation and proper selection of default values. For projects using customer specific data for open variables, the appropriate evaluation protocol is to verify installation and proper application of TRM protocol along with verification of open variables. The Pennsylvania Evaluation Framework provides specific guidelines and requirements for evaluation procedures.
S O U R C E S
1) Illinois Statewide TRM, 2014. Machine wattages assume that the peak period is coincident with periods of high traffic diminishing the demand reduction potential of occupancy based controls. Hours of operation assume operation 24 hrs/day, 365 days/yr. http://www.efi.org/specs/snackmiser.pdf.
SECTION 2: Residential MeasuresMiscellaneous Page 469
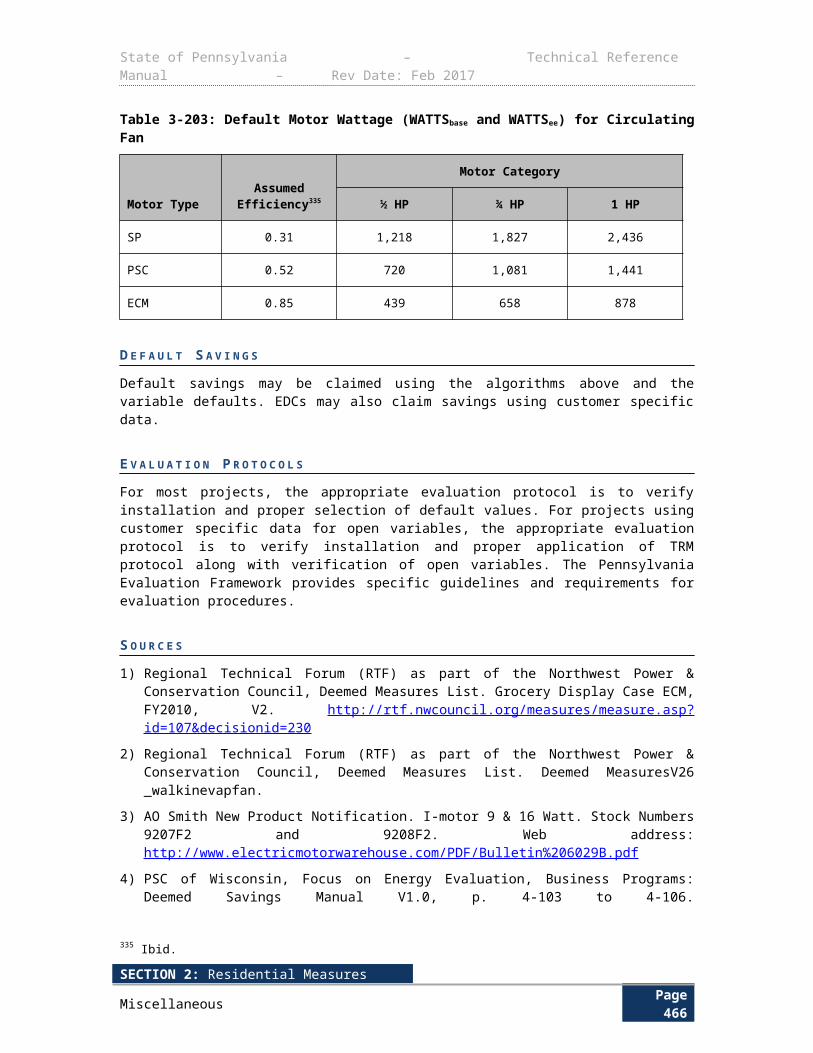
State of Pennsylvania – Technical Reference Manual – Rev Date: Feb 2017
3.7.4 ENERGY STAR ELECTRIC STEAM COOKER
Measure Name ENERGY STAR Electric Steam Cooker
Target Sector Commercial and Industrial Establishments
Measure Unit Electric Steam Cooker
Unit Energy Savings See Table 3-276
Unit Peak Demand Reduction See Table 3-276
Measure Life 12 years458
Measure Vintage Replace on Burnout
E L I G I B I L I T Y
This measure applies to the installation of electric ENERGY STAR steam cookers as either a new item or replacement for an existing unit. Gas steam cookers are not eligible. The steam cookers must meet minimum ENERGY STAR efficiency requirements. A qualifying steam cooker must meet a minimum cooking efficiency of 50 percent and meet idle energy rates specified by pan capacity.
The baseline equipment is a unit with efficiency specifications that do not meet the minimum ENERGY STAR efficiency requirements.
A L G O R I T H M S
The savings depend on three main factors: pounds of food steam cooked per day, pan capacity, and cooking efficiency.
kWh ¿ (∆kWhcooking+∆kWhidle )×365
∆ kWhcooking ¿ lbsfood× EnergytoFood×( 1Eff b
−1
Eff ee )∆ kWhidle ¿Daily kW hb−Daily kW hee
Daily kW hb¿(Power idle−b× (1−% HOURSconsteam)+%HOURSconsteam×CAPY b×Qty pans×( EnergytoFoodEff b ))×(HOURSop−( lbsfood
CAPY b×Qty pans ))Daily kW hee
¿Poweridle−ee× (1−%HOURSconsteam)+% HOURSconsteam×CAPY ee×Qty pans×( EnergytoFoodEff ee )×(HOURSop−( lbsfoodCAPY ee×Qty pans ))
∆ kW peak ¿ ∆kWhEFLH
×CF
458 Deru, M., et al., (2003), Analysis of NREL Cold-Drink Vending Machines for Energy Savings, National Renewable Energy Laboratory, NREL/TP-550-34008, http://www.nrel.gov/docs/fy03osti/34008.pdf
SECTION 2: Residential MeasuresMiscellaneous Page 470
State of Pennsylvania – Technical Reference Manual – Rev Date: Feb 2017
D E F I N I T I O N O F T E R M S
Table 3-275: Steam Cooker - Values and References
Term Unit Values Source
lbsfood , Pounds of food cooked per day in the steam cooker
lbs Nameplate EDC Data Gathering
Default values in Table3-276
Table 3-276
EnergyToFood , ASTM energy to food ratio; energy (kilowatt-hours) required per pound of food during cooking
kWhpound
0.0308 1
Eff ee , Cooking energy efficiency of the new unit
None Nameplate EDC Data Gathering
Default values in Table3-276
Table 3-276
Eff b , Cooking energy efficiency of the baseline unit
None See Table 3-276 Table 3-276
Poweridle−b , Idle power of the baseline unit
kW See Table 3-276 Table 3-276
Poweridle−ee , Idle power of the new unit
kW Nameplate EDC Data Gathering
Default values in Table3-276
Table 3-276
HOURSop , assumeddaily hours of operation
Hours Nameplate EDC Data Gathering
12 hours 1
%HOURSconsteam , Percentage of idle time per day the steamer is in continuous steam mode instead of timed cooking. The power used in this mode is the same as the power in cooking mode.
None 40% 1
CAPY b , Production capacity per pan of the baseline unit
lbhr
See Table 3-276 Table 3-276
CAPY ee , Production capacity per pan of the new unit
lbhr
See Table 3-276 Table 3-276
Qty pans , Quantity of pans in the unit None Nameplate EDC Data Gathering
EFLH , Equivalent full load hours per year
HoursYear
4,380 2
CF, Demand Coincidence Factor Decimal 0.84 3,4
1000, Conversion from watts to kilowatts
WkW
1000 Conversion factor
SECTION 2: Residential MeasuresMiscellaneous Page 471
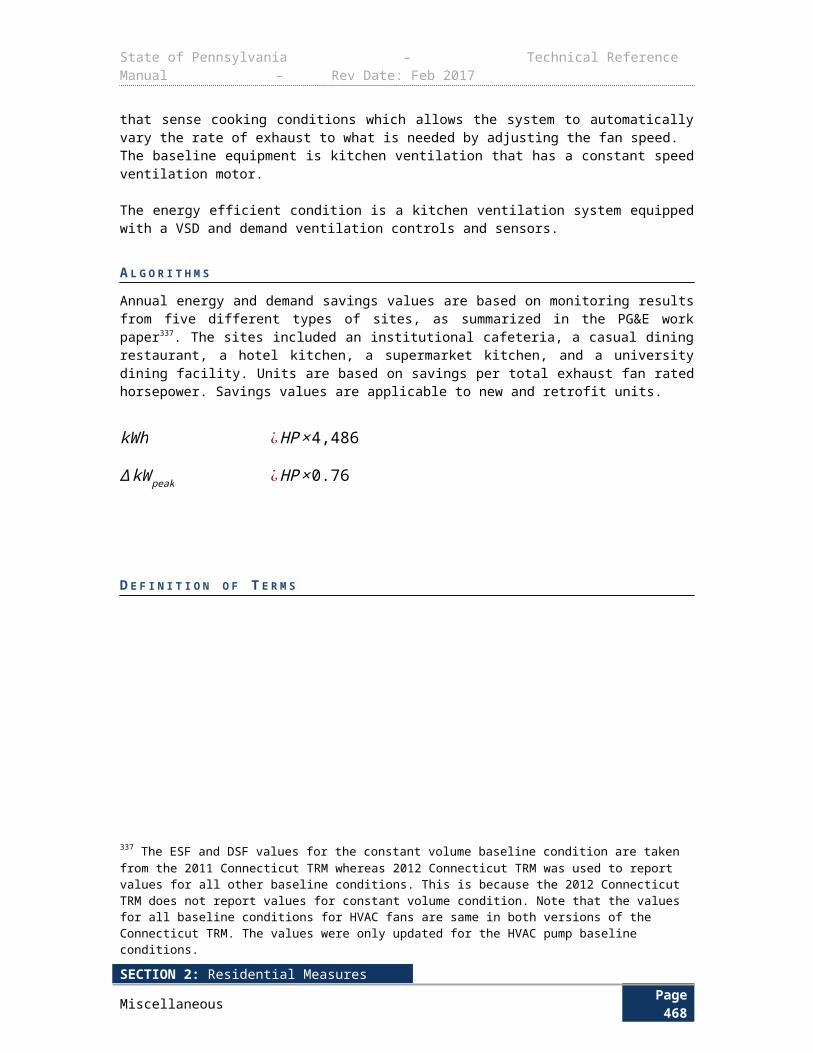
State of Pennsylvania – Technical Reference Manual – Rev Date: Feb 2017
D E F A U L T S A V I N G S
SECTION 2: Residential MeasuresMiscellaneous Page 472
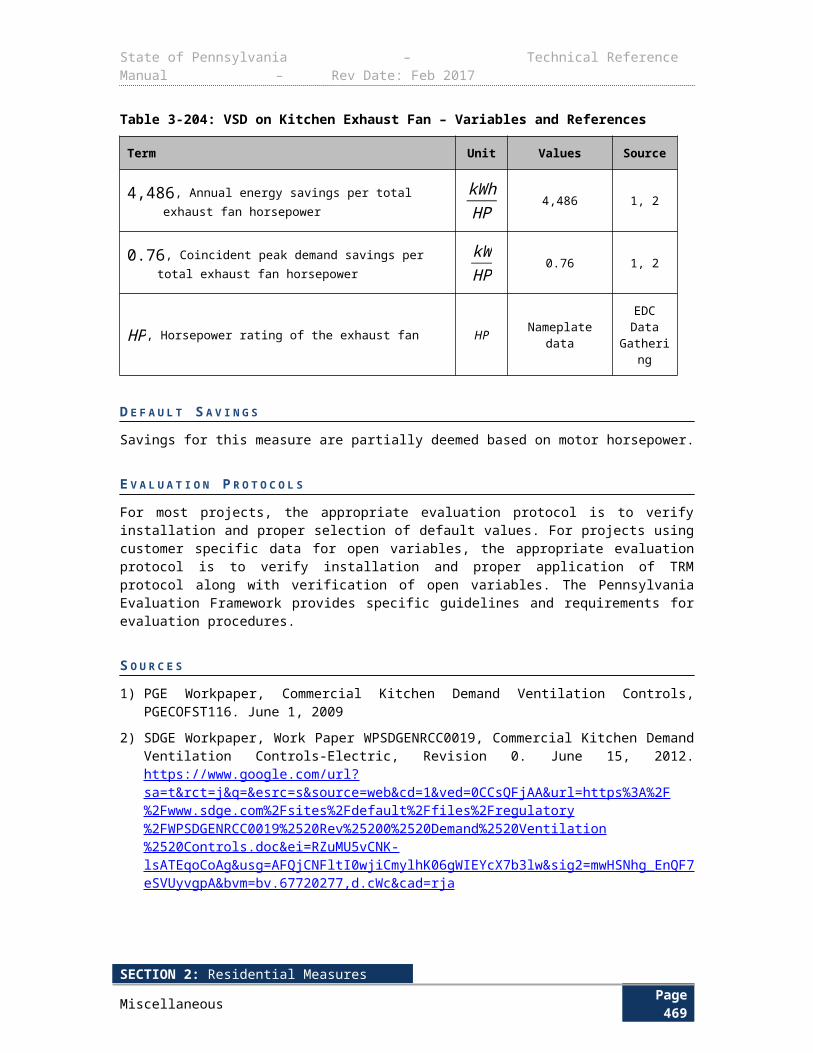
State of Pennsylvania – Technical Reference Manual – Rev Date: Feb 2017
Table 3-276: Default Values for Electric Steam Cookers by Number of Pans459
459 Ritter, J., Hugghins, J., (2000), Vending Machine Energy Consumption and VendingMiser Evaluation, Energy Systems Laboratory, Texas A&M University System, http://repository.tamu.edu/bitstream/handle/1969.1/2006/ESL-TR-00-11-01.pdf;jsessionid=6E215C09FB80BC5D2593AC81E627DA97?sequence=1
SECTION 2: Residential MeasuresMiscellaneous Page 473
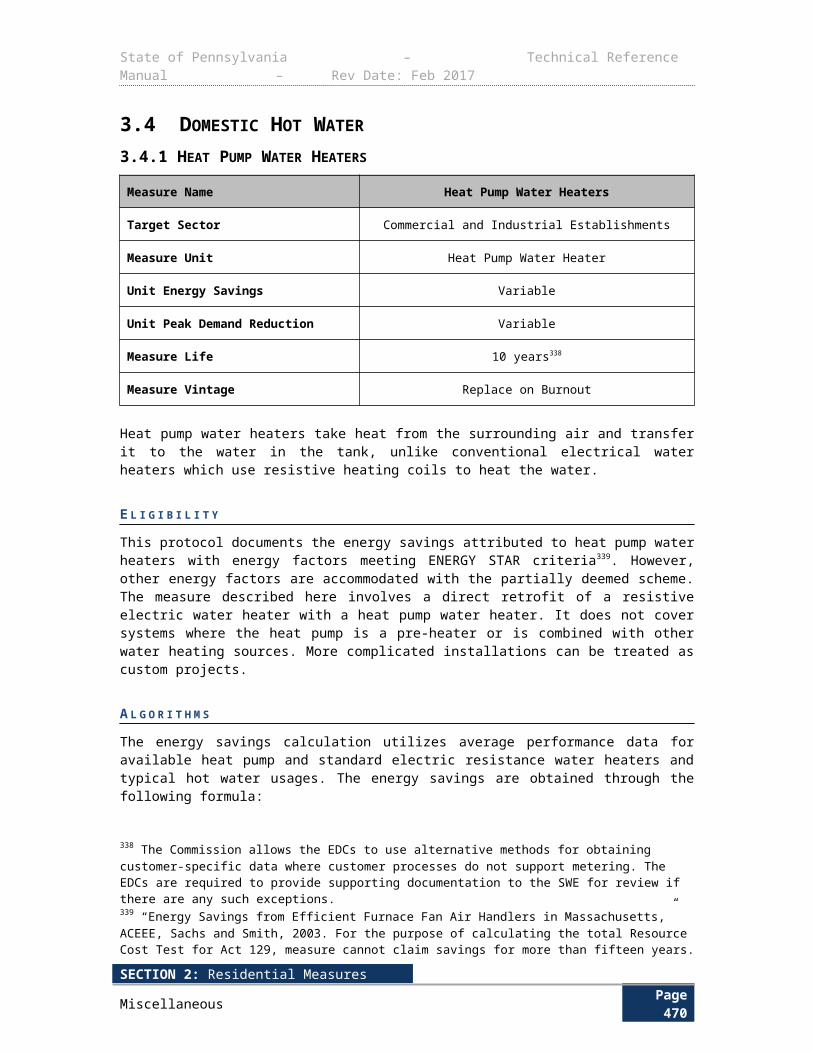
State of Pennsylvania – Technical Reference Manual – Rev Date: Feb 2017
# of Pans Parameter Baseline Model Efficient Model Savings
3
Poweridle (kW)460
1.000 0.27
CAPY ( lbhr ) 23.3 16.7
lbsfood 100 100
Eff 461 30% 59%
kWh 10,819
∆ kW peak 2.07
4
Poweridle (kW)
1.325 0.30
CAPY ( lbhr ) 21.8 16.8
lbsfood 128 128
Eff 30% 57%
kWh 13,079
∆ kW peak 2.51
5
Poweridle (kW)
1.675 0.31
CAPY ( lbhr ) 20.6 16.6
lbsfood 160 160
Eff 30% 70%
kWh 17,332
∆ kW peak 3.32
6
Poweridle (kW)
2.000 0.31
CAPY ( lbhr ) 20.0 16.7
lbsfood 192 192
Eff 30% 65%
kWh 19,461
∆ kW peak 3.73
460 State of Ohio Energy Efficiency Technical Reference Manual, Including Predetermined Savings Values and Protocols for Determining Energy and Demand Savings, August 6, 2010. Prepared for the Public Utilities Commission of Ohio by Vermont Energy Investment Corporation461 Vending Machine Energy Savings, Michigan Energy Office Case Study 05-0042, http://www.michigan.gov/documents/CIS_EO_Vending_Machine_05-0042_155715_7.pdf
SECTION 2: Residential MeasuresMiscellaneous Page 474
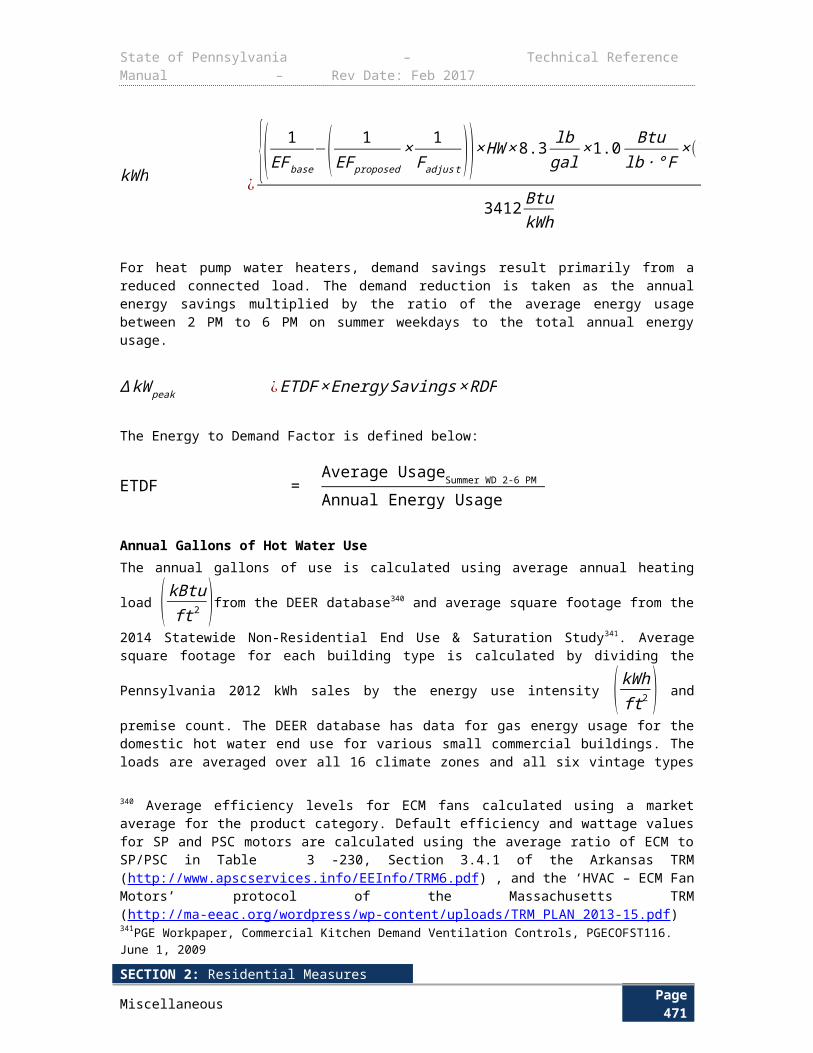
State of Pennsylvania – Technical Reference Manual – Rev Date: Feb 2017
E V A L U A T I O N P R O T O C O L S
For most projects, the appropriate evaluation protocol is to verify installation and proper selection of default values. For projects using customer specific data for open variables, the appropriate evaluation protocol is to verify installation and proper application of TRM protocol along with verification of open variables. The Pennsylvania Evaluation Framework provides specific guidelines and requirements for evaluation procedures.
S O U R C E S
1) ENERGY STAR. US Environmental Protection Agency and US Department of Energy. ENERGY STAR Commercial Kitchen Equipment Calculator.
2) Food Service Technology Center (FSTC) 2012, Commercial Cooking Appliance Technology Assessment, pg 8-14.
3) State of Ohio Energy Efficiency Technical Reference Manual cites a CF = 0.84 as adopted from the Efficiency Vermont TRM. Assumes CF is similar to that for general commercial industrial lighting equipment.
4) RLW Analytics. Coincidence Factor Study – Residential and Commercial Industrial Lighting Measures. Spring 2007. The peak demand period used to estimate the CF value is 1PM-5PM, weekday, non-holiday, June-August. http://www.puc.nh.gov/Electric/Monitoring%20and%20Evaluation%20Reports/National%20Grid/116_RLW_CF%20Res%20C&I%20ltg.pdf
SECTION 2: Residential MeasuresMiscellaneous Page 475
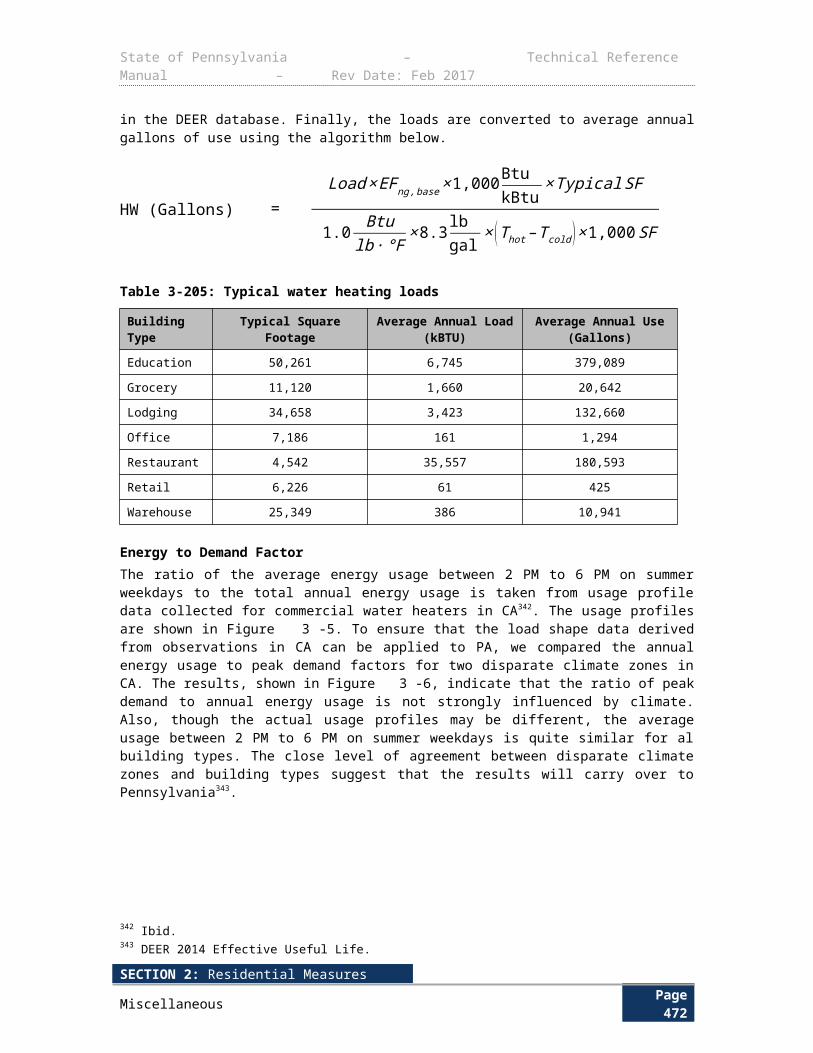
State of Pennsylvania – Technical Reference Manual – Rev Date: Feb 2017
3.7.5 ENERGY STAR REFRIGERATED BEVERAGE MACHINE
Measure Name ENERGY STAR Refrigerated Beverage Vending Machine
Target Sector Commercial and Industrial Establishments
Measure Unit Refrigerated Beverage Vending Machine
Unit Energy Savings Variable
Unit Peak Demand Reduction 0 kW
Measure Life 14 years462
Measure Vintage Replace on Burnout
ENERGY STAR vending machines are equipped with more efficient compressors, fan motors and lighting systems. In addition to more efficient components, ENERGY STAR qualified machines are programmed with software that reduces lighting and refrigeration loads during times of inactivity.
E L I G I B I L I T Y
This measure is targeted to non-residential customers who purchase and install a beverage vending machine that meets ENERGY STAR specifications rather than a non-ENERGY STAR unit. The energy efficient refrigerated vending machine can be new or rebuilt.
A L G O R I T H M S
Energy savings are dependent on decreased machine lighting and cooling loads during times of lower customer sales. The savings are dependent on the machine environment, noting that machines placed in locations such as a day-use office will result in greater savings than those placed in high-traffic areas such as hospitals that operate around the clock. The algorithm below takes into account varying scenarios and can be taken as representative of a typical application. There are no peak demand savings because this measure is aimed to reduce demand during times of low beverage machine use, which will typically occur during off-peak hours.
Class A Vending Machine A Class A machine is defined as a refrigerated bottled or canned beverage vending machine that is fully cooled, and is not a combination vending machine.
kWh ¿kWhbase−kWhee
kWhbase ¿ (0.055V +2.56 )×365
kWhee ¿(0.0523V +2.432)×365
∆ kW peak ¿0
462 Measure Life Study, prepared for the Massachusetts Joint Utilities, Energy & Resource Solutions, November 2005. http://rtf.nwcouncil.org/subcommittees/nonreslighting/Measure%20Life%20Study_MA%20Joint%20Utilities_2005_ERS-1.pdf
SECTION 2: Residential MeasuresMiscellaneous Page 476
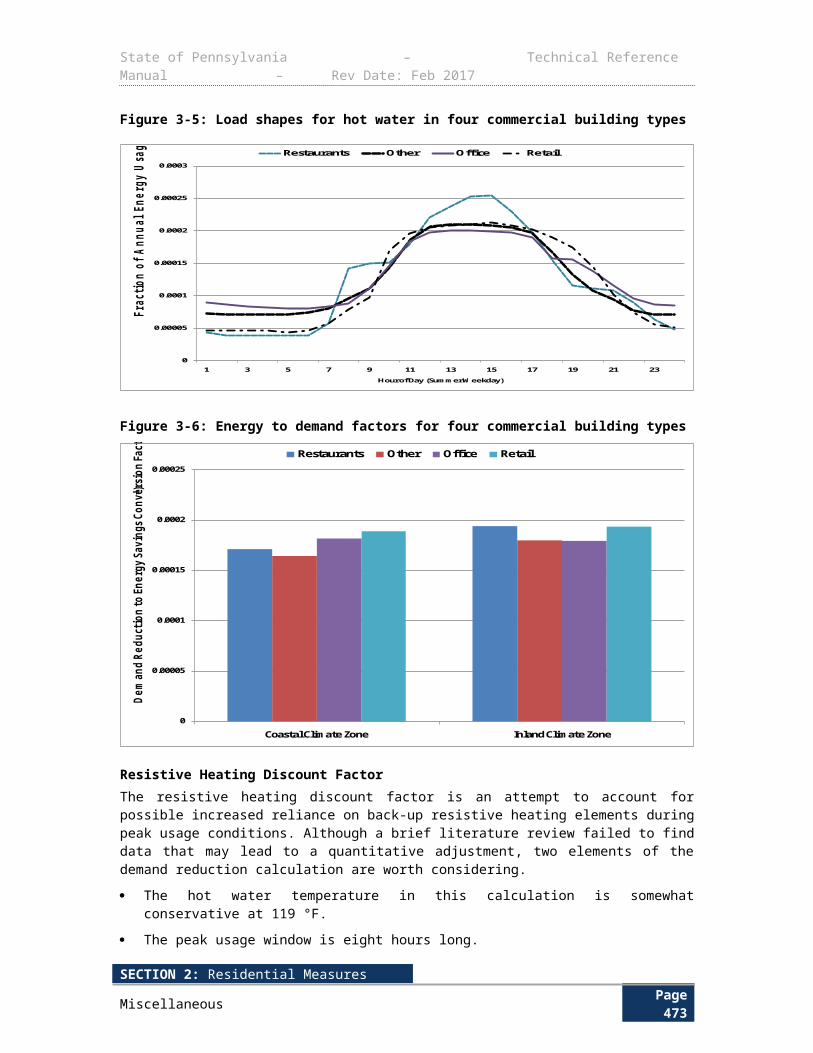
State of Pennsylvania – Technical Reference Manual – Rev Date: Feb 2017
Class B Vending Machine A Class B machine is defined as any refrigerated bottled or canned beverage vending machine not considered to be Class A, and is not a combination vending machine.
kWh ¿kWhbase−kWhee
kWhbase ¿(0.073V +3.16)×365
kWhee ¿ (0.0657V +2.844 )×365
∆ kW peak ¿0
D E F I N I T I O N O F T E R M S
Table 3-277: ENERGY STAR Refrigerated Beverage Vending Machine – Values and Resources
Term Unit Values Source
kWhbase ,energy usage of baseline vending machine
kWh EDC Data Gathering463 EDC Data Gathering
kWhee, energy usage of ENERGY STAR vending machine
kWh EDC Data Gathering464 EDC Data Gathering
V, refrigerated volume of the vending machine ft3 EDC Data Gathering
Default: 24.33
365, days per yearDaysyr
365 Conversion Factor
D E F A U L T S A V I N G S
Table 3-278: Default Beverage Vending Machine Energy Savings
Equipment Class Default kWh Savings
Class A 71
Class B 180
Energy savings for this measure are fully deemed and may be claimed using the algorithm above and the variable defaults.
463 http://www.energystar.gov/index.cfm?fuseaction=find_a_product.showProductGroup&pgw_code=COC 464 Values for ASTM parameters for baseline and efficient conditions (unless otherwise noted) were determined by FSTC according to ASTM F1484, the Standard Test Method for Performance of Steam Cookers. Pounds of Food Cooked per Day based on the default value for a 3 pan steam cooker (100 lbs from FSTC) and scaled up based on the assumption that steam cookers with a greater number of pans cook larger quantities of food per day.
SECTION 2: Residential MeasuresMiscellaneous Page 477
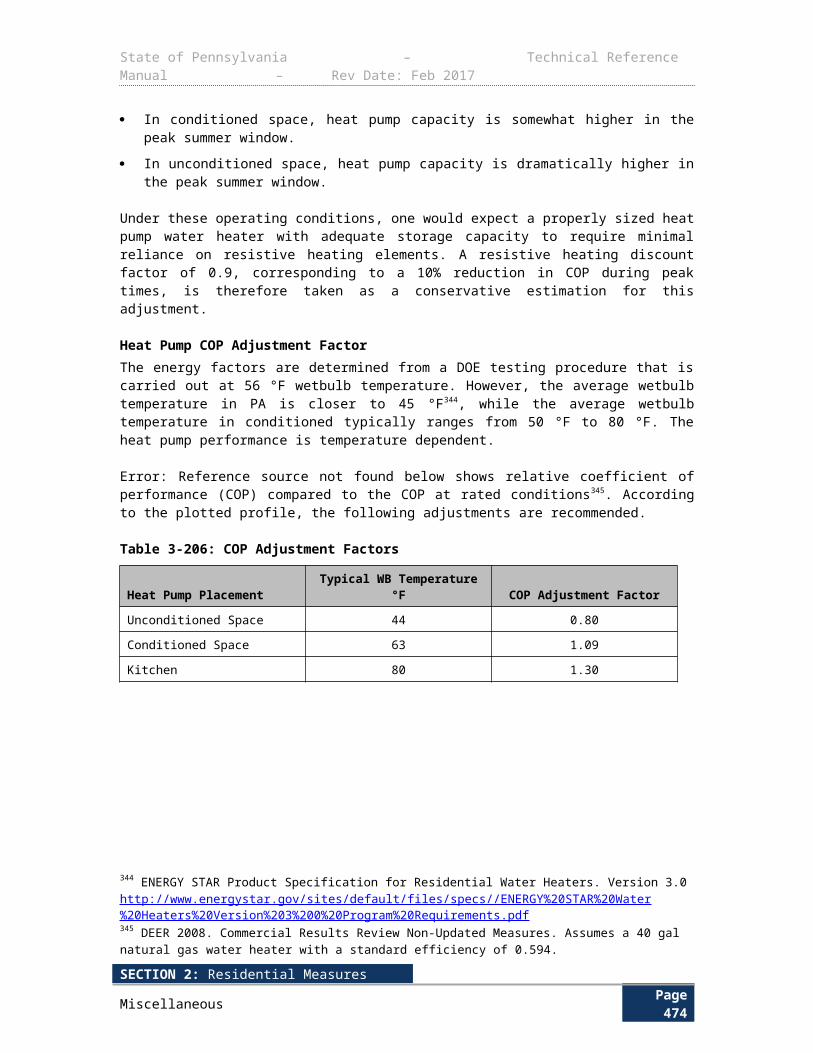
State of Pennsylvania – Technical Reference Manual – Rev Date: Feb 2017
E V A L U A T I O N P R O T O C O L S
For most projects, the appropriate evaluation protocol is to verify installation and proper selection of default values. For projects using customer specific data for open variables, the appropriate evaluation protocol is to verify installation and proper application of TRM protocol along with verification of open variables. The Pennsylvania Evaluation Framework provides specific guidelines and requirements for evaluation procedures.
S O U R C E S
1) ENERGY STAR. US Environmental Protection Agency and US Department of Energy. “Program Requirements; Product Specification for Refrigerated Beverage Vending Machines.” http://www.energystar.gov/products/specs/system/files/Vending%20Machines%20Program%20Requirements%20Version%203%201.pdf
2) US Department of Energy. “Refrigerated Beverage Vending Machines.” http://www1.eere.energy.gov/buildings/appliance_standards/product.aspx/productid/24
3) ENERGY STAR. US Environmental Protection Agency and US Department of Energy. “ENERGY STAR Certified Vending Machines Spread Sheet” http://www.energystar.gov/productfinder/product/certified-vending-machines/results
SECTION 2: Residential MeasuresMiscellaneous Page 478
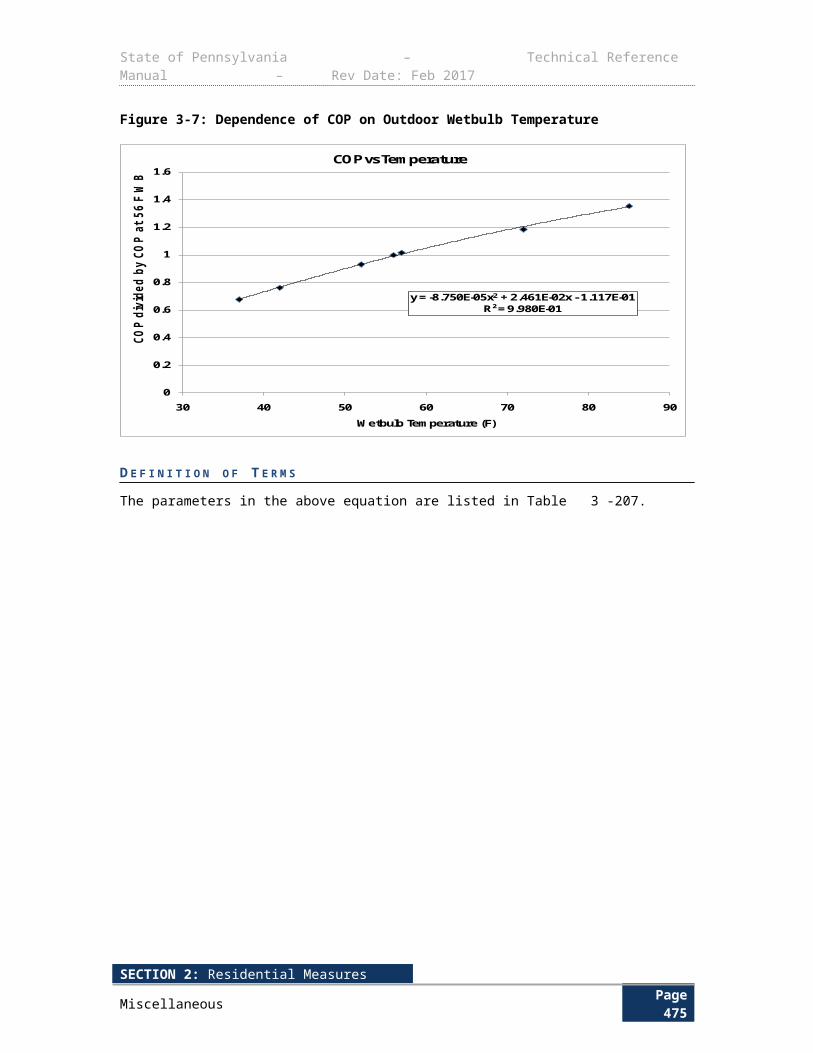
State of Pennsylvania – Technical Reference Manual – Rev Date: Feb 2017
3.8 BUILDING SHELL3.8.1 WALL AND CEILING INSULATION
Measure Name Wall and Ceiling Insulation
Target Sector Commercial and Industrial Establishments
Measure Unit Wall and Ceiling Insulation
Unit Energy Savings Variable
Unit Peak Demand Reduction Variable
Measure Life 15 years465
Measure Vintage New Construction or Retrofit
Wall and ceiling insulation is one of the most important aspects of the energy system of a building. Insulation dramatically minimizes energy expenditure on heating and cooling. Increasing the R-value of wall insulation above building code requirements generally lowers heating and cooling costs. Incentives are offered with regard to increases in R-value rather than type, method, or amount of insulation.
An R-value indicates the insulation’s resistance to heat flow – the higher the R-value, the greater the insulating effectiveness. The R-value depends on the type of insulation and its material, thickness, and density. When calculating the R-value of a multilayered installation, add the R-values of the individual layers.
E L I G I B I L I T Y
This measure applies to non-residential buildings or common areas in multifamily complexes heated and/or cooled using electricity. Existing construction buildings are required to meet or exceed the code requirement. New construction buildings must exceed the code requirement. Eligibility may vary by PA EDC; savings from chiller-cooled buildings are not included.
A L G O R I T H M S
The savings depend on four main factors: baseline condition, heating system type and size, cooling system type and size, and location. The algorithm for Central AC and Air Source Heat Pumps (ASHP) is as follows:
465 Efficient values calculated from a list of ENERGY STAR qualified products.
SECTION 2: Residential MeasuresMiscellaneous Page 479
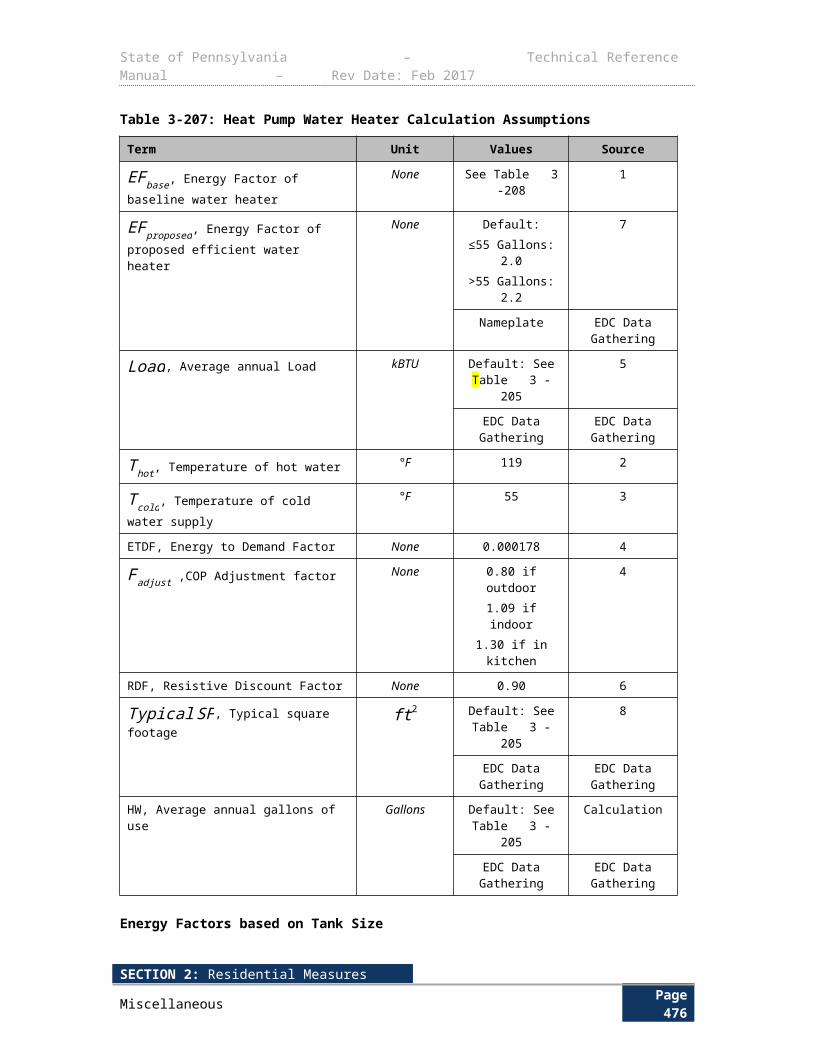
State of Pennsylvania – Technical Reference Manual – Rev Date: Feb 2017
Ceiling/Wall Insulation
kWh ¿∆ kWhcool+∆ kWhheat
∆ kWhcool¿( CDD×24Eff ×1,000 )×[ Aceiling ( 1
Ceiling R i− 1Ceiling Rf )+Awall( 1
Wall Ri− 1Wall R f )]
∆ kWhheat¿( HDD×24COP×3,412 )×[A ceiling( 1
Ceiling Ri− 1Ceiling Rf )+Awall( 1
WallR i− 1Wall Rf )]
∆ kW peak ¿∆kWhcoolEFLHcool
×CF
D E F I N I T I O N O F T E R M S
Table 3-279: Non-Residential Insulation – Values and References
Term Unit Values Source
Aceiling, Area of the ceiling/attic insulation that was installed ft2 EDC Data Gathering EDC Data
Gathering
Awall, Area of the wall insulation that was installed ft2 EDC Data Gathering EDC Data
Gathering
HDD, Heating degree days with 65 degree base
℉ ∙Days
Allentown = 5318Erie = 6353
Harrisburg = 4997Philadelphia = 4709Pittsburgh = 5429Scranton = 6176
Williamsport = 5651
1
CDD, Cooling degree days with a 65 degree base
℉ ∙Days
Allentown = 787Erie = 620
Harrisburg = 955Philadelphia = 1235
Pittsburgh = 726Scranton = 611
Williamsport = 709
1
24, Hours per dayHoursDay
24Conversion
Factor
1000, Watts per kilowattWkW
1000Conversion
Factor
3,412 , Btu per kWhBtukWh
3,412Conversion
Factor
Ceiling Ri, the R-value of the ceiling insulation and support structure before the additional insulation is installed
° F ∙ ft 2 ∙ hrBtu
For new construction buildings and when
variable is unknown for existing buildings: See Table 3-280 and Table
EDC Data Gathering; 2, 4
SECTION 2: Residential MeasuresMiscellaneous Page 480
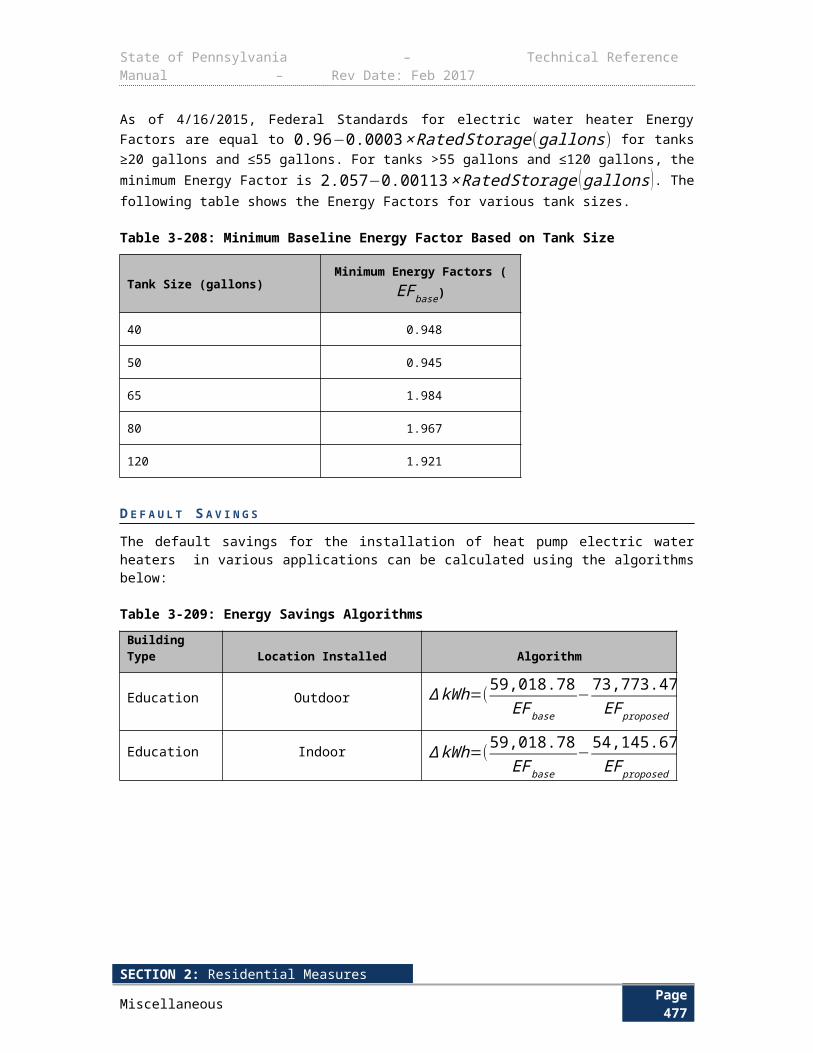
State of Pennsylvania – Technical Reference Manual – Rev Date: Feb 2017
Term Unit Values Source3-281 for values by
building type
Wall Ri, the R-value of the wall insulation and support structure before the additional insulation is installed
° F ∙ ft 2 ∙ hrBtu
For new construction buildings and when
variable is unknown for existing buildings: See Table 3-280 and Table
3-281 for values by building type
EDC Data Gathering; 3, 4
Ceiling Rf , Total R-value of all ceiling/attic insulation after the additional insulation is installed
° F ∙ ft 2 ∙ hrBtu
EDC Data Gathering EDC Data Gathering
Wall Rf , Total R-value of all wall insulation after the additional insulation is installed
° F ∙ ft 2 ∙ hrBtu
EDC Data Gathering EDC Data Gathering
EFLH cool, Equivalent full load cooling hours
HoursYear
Based on Logging, BMS data or Modeling466
EDC Data Gathering
Default: See Table 3-161
5
CF , Demand Coincidence Factor Decimal See Error: Referencesource not found
5
Eff , Efficiency of existing HVAC equipment. Depending on the size and age, this will either be the SEER, IEER, or EER (use EER only if SEER or IEER are not available)467
Btu /hrW
Nameplate EDC Data Gathering
Default: See Table 3-160
See Table 3-160
COP, Efficiency of the heating system NoneNameplate EDC Data
GatheringDefault: See Table 3-
160See Table 3-
160
466 Ibid.467 “Energy Savings Potential and R&D Opportunities for Commercial Refrigeration,” Navigant Consulting, Final Report submitted to US DOE, September 2009. http://apps1.eere.energy.gov/buildings/publications/pdfs/corporate/commercial_refrig_report_10-09.pdf
SECTION 2: Residential MeasuresMiscellaneous Page 481
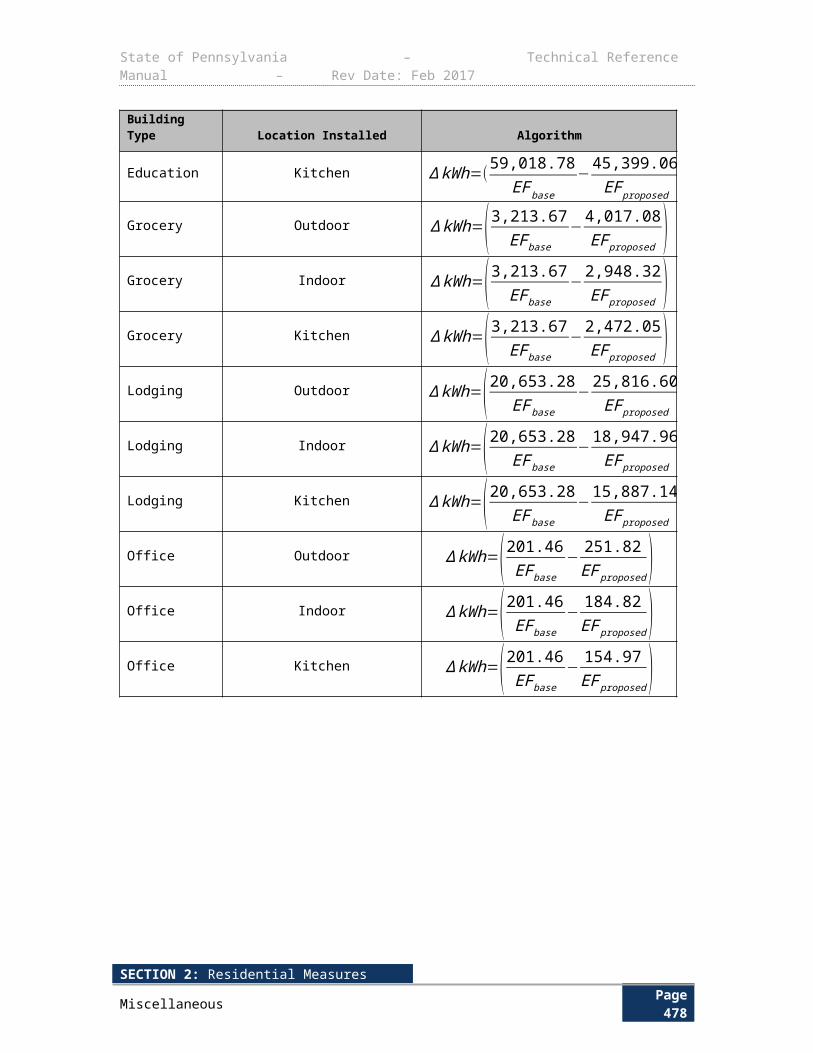
State of Pennsylvania – Technical Reference Manual – Rev Date: Feb 2017
Table 3-280: Ceiling R-Values by Building Type
Building TypeCeiling Ri-Value
(New Construction)Ceiling Ri-Value
(Existing)
Large Office
Large Retail
Lodging
Health
Education
Grocery
20 9
Small Office
Warehouse
24.4 13.4
Small Retail
Restaurant
Convenience Store
20 9
Table 3-281: Wall R-Values by Building Type
Building TypeWall Ri-Value
(New Construction)Wall Ri-Value
(Existing)
Large Office 14 1.6
Small Office
Large Retail
Small Retail
Convenience Store
14 3.0
Lodging
Health
Education
Grocery
13 2.0
Restaurant 14 3.2
Warehouse 14 2.5
D E F A U L T S A V I N G S
There are no default savings for this measure.
E V A L U A T I O N P R O T O C O L S
For most projects, the appropriate evaluation protocol is to verify installation and proper selection of default values. For projects using customer specific data for open variables, the appropriate evaluation protocol is to verify installation and proper application of TRM protocol along with
SECTION 2: Residential MeasuresMiscellaneous Page 482
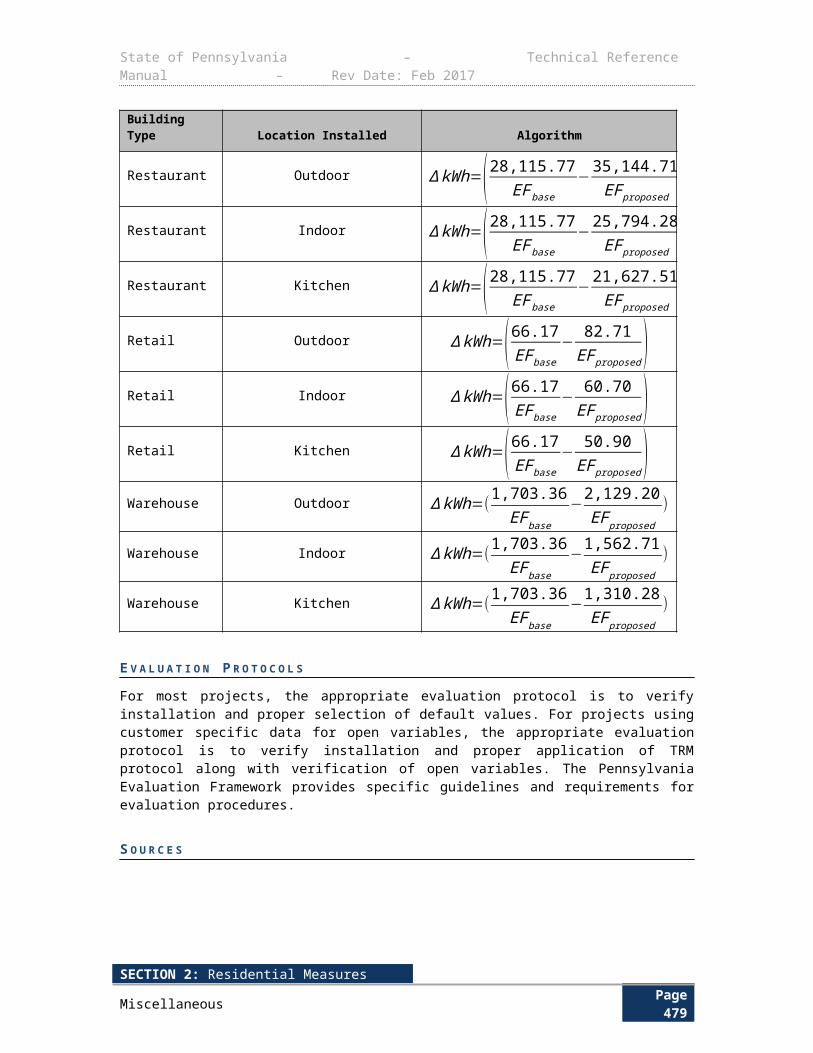
State of Pennsylvania – Technical Reference Manual – Rev Date: Feb 2017
verification of open variables. The Pennsylvania Evaluation Framework provides specific guidelines and requirements for evaluation procedures.
S O U R C E S
1) U.S. Department of Commerce. Climatography of the United States No. 81 Supplement No. 2. Annual Degree Days to Selected Bases 1971 – 2000. Scranton uses the values for Wilkes-Barre. HDD were adjusted downward to account for business hours. CDD were not adjusted for business hours, as the adjustment resulted in an increase in CDD and so not including the adjustment provides a conservative estimate of energy savings.
2) The initial R-value for a ceiling for existing buildings is based on the EDC eligibility requirement that at least R-11 be installed and that the insulation must meet at least IECC 2009 code. The initial R-value for new construction buildings is based on IECC 2009 code for climate zone 5. https://law.resource.org/pub/us/code/ibr/icc.iecc.2009.pdf
3) The initial R-value for a wall assumes that there was no existing insulation, or that it has fallen down resulting in an R-value equivalent to that of the building materials. Building simulation modeling using DOE-2.2 model (eQuest) was performed for a building with no wall insulation. The R-value is dependent upon the construction materials and their thickness. Assumptions were made about the building materials used in each sector.
4) 2009 International Energy Conservation Code. Used climate zone 5 which covers the majority of Pennsylvania. The R-values required by code were used as inputs in the eQuest building simulation model to calculate the total R-value for the wall including the building materials. https://law.resource.org/pub/us/code/ibr/icc.iecc.2009.pdf
5) Based on results from Nexant’s eQuest modeling analysis 2014.
SECTION 2: Residential MeasuresMiscellaneous Page 483
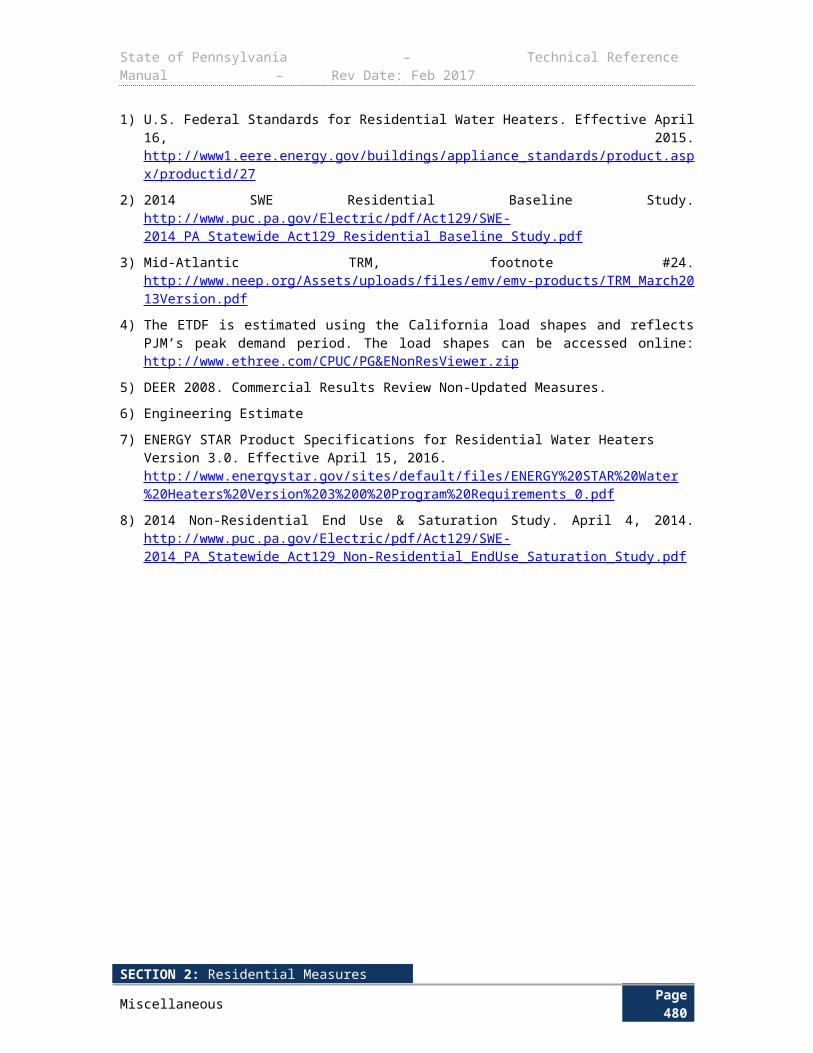
State of Pennsylvania – Technical Reference Manual – Rev Date: Feb 2017
3.9 CONSUMER ELECTRONICS3.9.1 ENERGY STAR OFFICE EQUIPMENT
Measure Name ENERGY STAR Office Equipment
Target Sector Commercial and Industrial Establishments
Measure Unit Office Equipment
Unit Energy Savings Fixed
Unit Peak Demand Reduction Fixed
Measure Life Table 3-283
Measure Vintage Replace on Burnout
E L I G I B I L I T Y
This protocol estimates savings for installing ENERGY STAR office equipment compared to standard efficiency equipment. The measurement of energy and demand savings is based on a deemed savings value multiplied by the quantity of the measure.
A L G O R I T H M S
The general form of the equation for the ENERGY STAR Office Equipment measure savings’ algorithms is:
Number of Units×Savings perUnit
To determine resource savings, the per unit estimates in the algorithms will be multiplied by the number of units. Per unit savings are primarily derived from the ENERGY STAR calculator for office equipment.
ENERGY STAR Computer
∆ kWh ¿ESAV com
∆ kW peak ¿DSAV com
ENERGY STAR Fax Machine
∆ kWh ¿ESav fax
∆ kW peak ¿DSav fax
SECTION 2: Residential MeasuresMiscellaneous Page 484
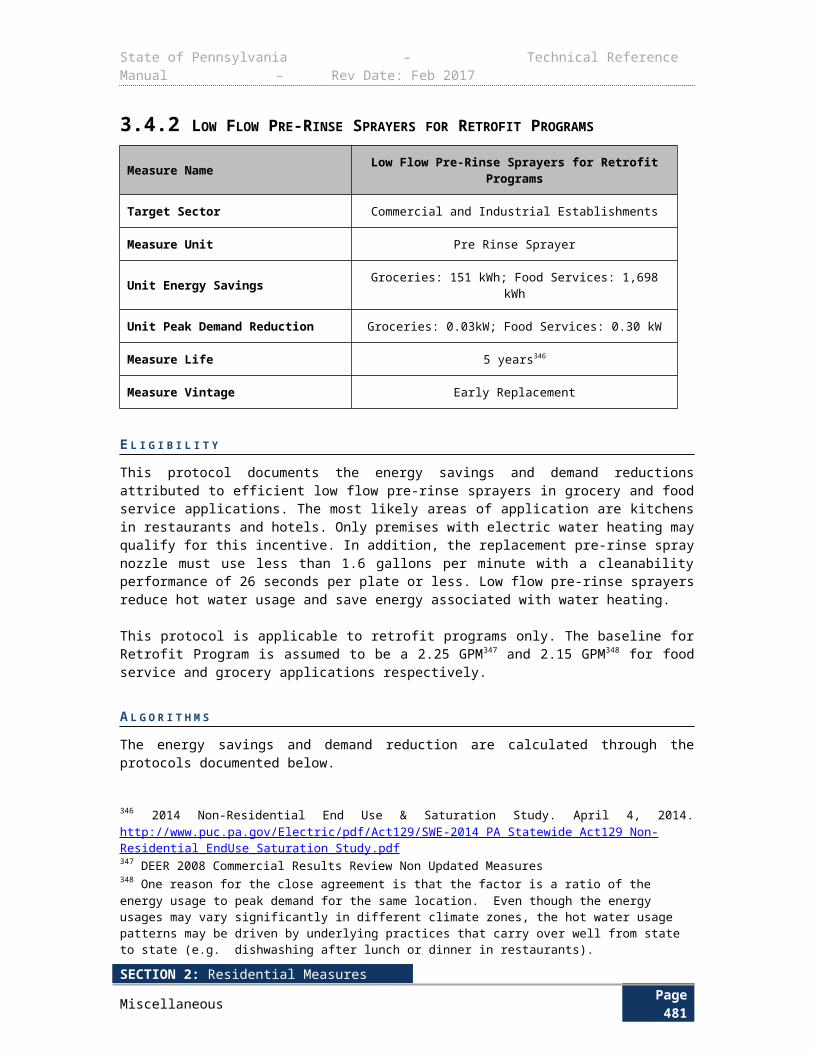
State of Pennsylvania – Technical Reference Manual – Rev Date: Feb 2017
ENERGY STAR Copier
∆ kWh ¿ESavcop
∆ kW peak ¿DSavcop
ENERGY STAR Printer
∆ kWh ¿ESav pri
∆ kW peak ¿DSavpri
ENERGY STAR Multifunction
∆ kWh ¿ESavmul
∆ kW peak ¿DSavmul
ENERGY STAR Monitor
∆ kWh ¿ESavmon
∆ kW peak ¿DSavmon
SECTION 2: Residential MeasuresMiscellaneous Page 485
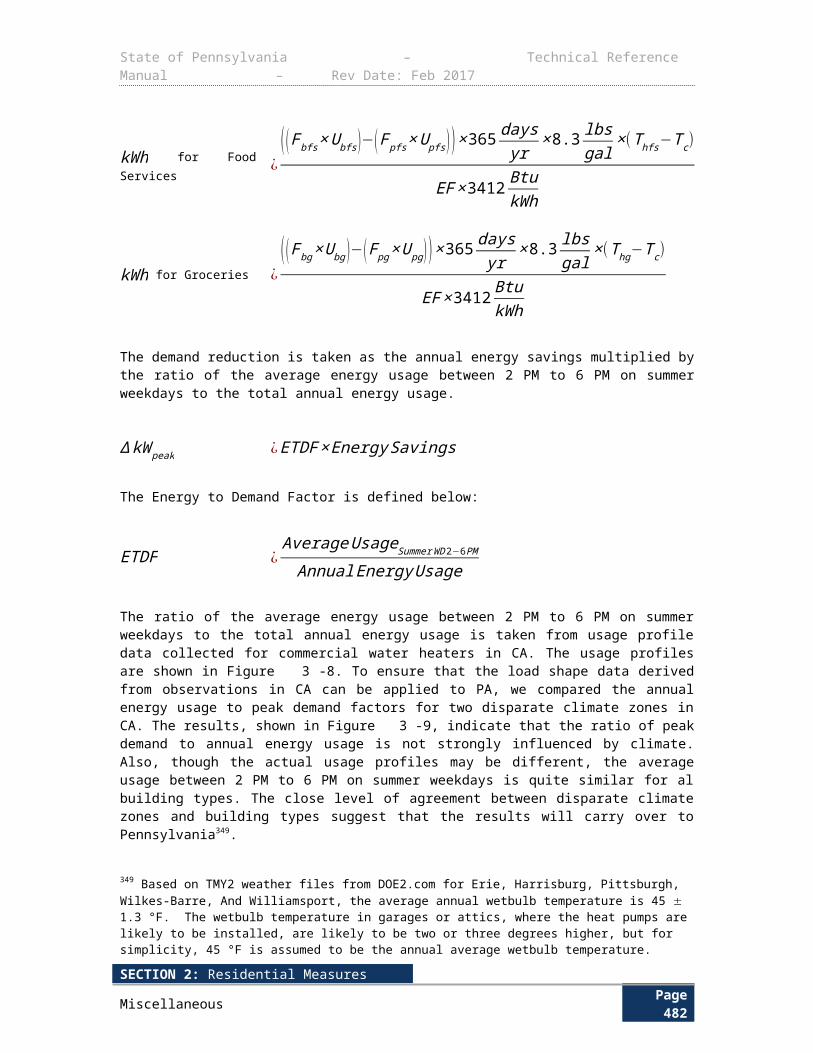
State of Pennsylvania – Technical Reference Manual – Rev Date: Feb 2017
D E F I N I T I O N O F T E R M S
Table 3-282: ENERGY STAR Office Equipment - References
Term Unit Values Source
ESav com, Electricity savings per purchased ENERGY STAR computer
ESav fax, Electricity savings per purchased ENERGY STAR fax machine.
ESav cop, Electricity savings per purchased ENERGY STAR copier.
ESav pri, Electricity savings per purchased ENERGY STAR printer.
ESavmul, Electricity savings per purchased ENERGY STAR multifunction machine.
ESavmon, Electricity savings per purchased ENERGY STAR monitor.
kWh See Table3-284
1
DSavcom, Summer demand savings per purchased ENERGY STAR computer.
DSav fax, Summer demand savings per purchased ENERGY STAR fax machine.
DSavcop, Summer demand savings per purchased ENERGY STAR copier.
DSav pri, Summer demand savings per purchased ENERGY STAR printer.
DSavmul, Summer demand savings per purchased ENERGY STAR multifunction machine.
DSavmon, Summer demand savings per purchased ENERGY STAR monitor.
kW See Table3-284
2
SECTION 2: Residential MeasuresMiscellaneous Page 486
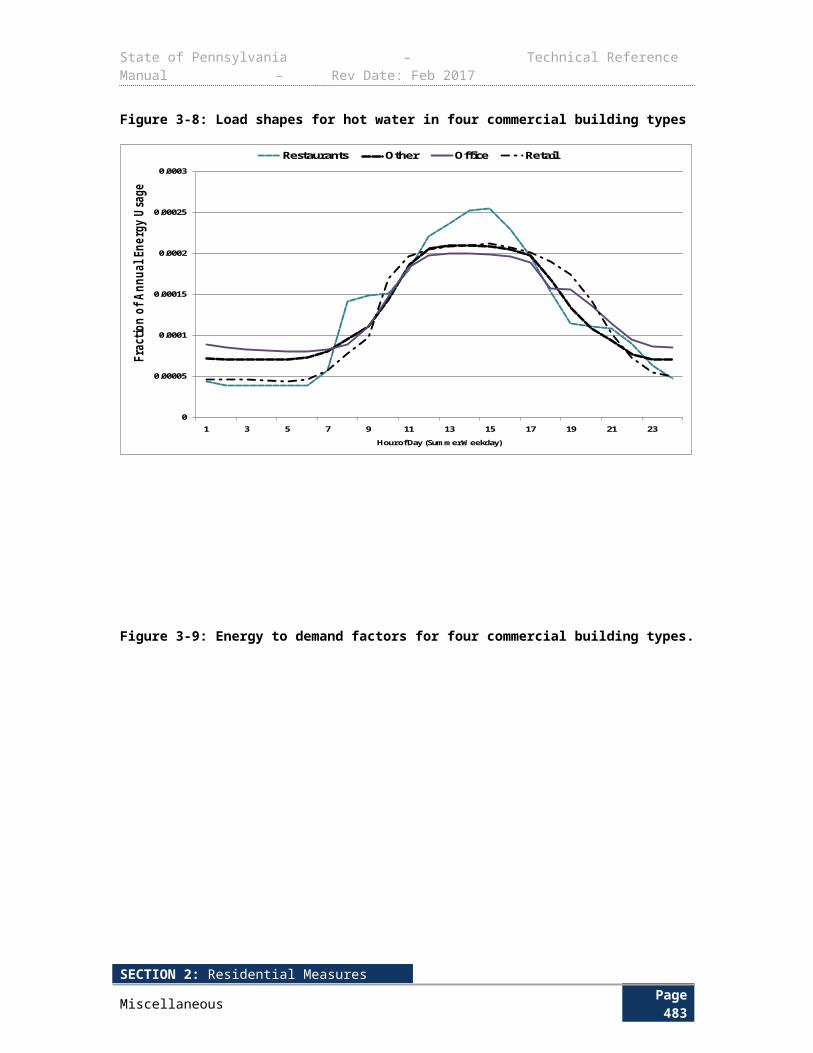
State of Pennsylvania – Technical Reference Manual – Rev Date: Feb 2017
ENERGY STAR office equipment have the following measure lives:
Table 3-283: ENERGY STAR Office Equipment Measure Life468
Equipment Commercial Life (years)
Computer 4
Monitor 4
Fax 4
Multifunction Device 6
Printer 5
Copier 6
D E E M E D S A V I N G S
Table 3-284: ENERGY STAR Office Equipment Energy and Demand Savings Values
MeasureEnergy Savings
(ESav)Summer Peak
Demand Savings (DSav) Source
Computer 133 kWh 0.018 kW 1
Fax Machine (laser) 78 kWh 0.0105 kW 1
Copier (monochrome) 1
1-25 images/min 73 kWh 0.0098 kW
26-50 images/min 151 kWh 0.0203 kW
51+ images/min 162 kWh 0.0218 kW
Printer (laser, monochrome) 1
1-10 images/min 26 kWh 0.0035 kW
11-20 images/min 73 kWh 0.0098 kW
21-30 images/min 104 kWh 0.0140 kW
31-40 images/min 156 kWh 0.0210 kW
41-50 images/min 133 kWh 0.0179 kW
51+ images/min 329 kWh 0.0443 kW
Multifunction (laser, monochrome) 1
1-10 images/min 78 kWh 0.0105 kW
11-20 images/min 147 kWh 0.0198 kW
21-44 images/min 253 kWh 0.0341 kW
45-99 images/min 422 kWh 0.0569 kW
100+ images/min 730 kWh 0.0984 kW
Monitor 15 kWh 0.0020 kW 1
468 Data gathering of vending machine volume
SECTION 2: Residential MeasuresMiscellaneous Page 487
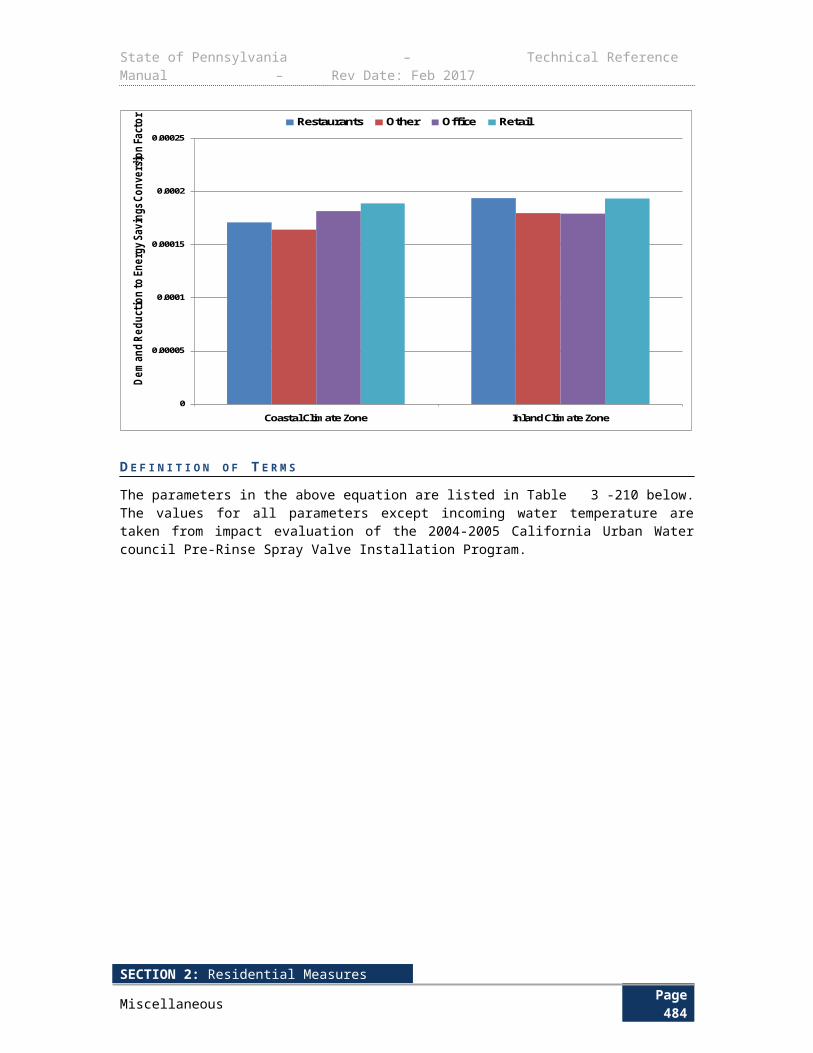
State of Pennsylvania – Technical Reference Manual – Rev Date: Feb 2017
E V A L U A T I O N P R O T O C O L S
For most projects, the appropriate evaluation protocol is to verify installation and proper selection of default values. For projects using customer specific data for open variables, the appropriate evaluation protocol is to verify installation and proper application of TRM protocol along with verification of open variables. The Pennsylvania Evaluation Framework provides specific guidelines and requirements for evaluation procedures.
S O U R C E S
1) ENERGY STAR Office Equipment Savings Calculator (Referenced latest version released in May 2013). Default values were used. Using a commercial office equipment load shape, the percentage of total savings that occur during the PJM peak demand period was calculated and multiplied by the energy savings.
1.
SECTION 2: Residential MeasuresMiscellaneous Page 488

State of Pennsylvania – Technical Reference Manual – Rev Date: Feb 2017
3.9.2 OFFICE EQUIPMENT – NETWORK POWER MANAGEMENT ENABLING
Measure Name Network Power Management Enabling
Target Sector Commercial and Industrial Establishments
Measure Unit One copy of licensed software installed on a PC workstation
Unit Energy Savings Fixed
Unit Peak Demand Reduction Fixed
Measure Life 5 years469
Measure Vintage Retrofit
Over the last few years, a number of strategies have evolved to save energy in desktop computers. One class of products uses software implemented at the network level for desktop computers that manipulates the internal power settings of the central processing unit (CPU) and of the monitor. These power settings are an integral part of a computer’s operating system (most commonly, Microsoft Windows) including “on”, “standby”, “sleep”, and “off” modes and can be set by users from their individual desktops.
Most individual computer users are unfamiliar with these energy-saving settings, and hence, settings are normally set by an IT administrator to minimize user complaints related to bringing the computer back from standby, sleep, or off modes. However, these strategies use a large amount of energy during times when the computer is not in active use. Studies have shown that energy consumed during non-use periods is large, and is often the majority of total energy consumed.Qualifying software must control desktop computer and monitor power settings within a network from a central location.
E L I G I B I L I T Y The deemed savings reported in Table 3-285 are applicable to any software that meets the following Pacific Northwest Regional Technical Forum's (“RTF”) Networked Computer Power Management Control Software Specifications470:
Workstation is defined as the computer monitor and the PC box.
The software shall have wake-on-LAN capability to allow networked workstations to be remotely wakened from or placed into any power-saving mode and to remotely boot or shut down ACPI-compliant workstations.
The software shall give the IT administrator easily-accessible central control over the power management settings of networked workstations that optionally overrides settings made by users.
The software shall be capable of applying specific power management policies to network groups, utilizing existing network grouping capabilities.
The software shall be compatible with multiple operating systems and hardware configurations on the same network.
469 Data gathering of annual energy consumption of vending machine470DEER 2014 uses 20 years; Northwest Regional Technical Forum uses 45 years. Capped based on the requirements of the Pennsylvania Technical Reference Manual (June 2010). This value is less than that used by other jurisdictions for insulation.
SECTION 2: Residential MeasuresMiscellaneous Page 489
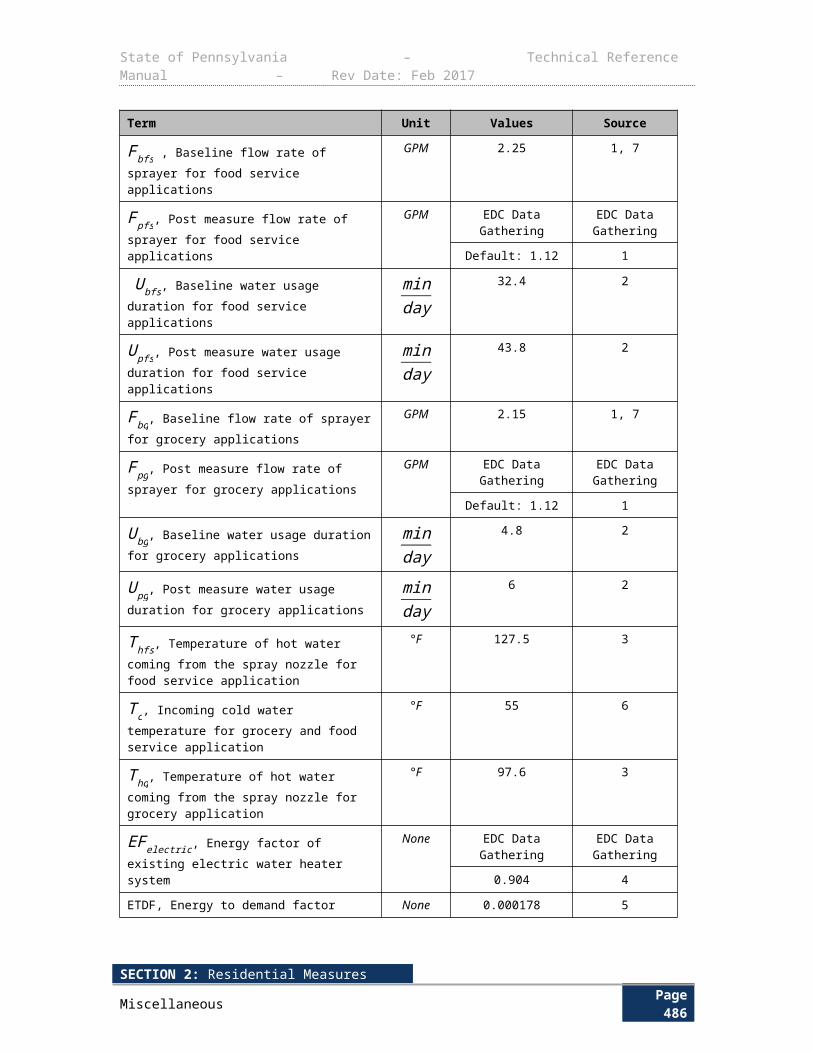
State of Pennsylvania – Technical Reference Manual – Rev Date: Feb 2017
The software shall monitor workstation keyboard, mouse, CPU and disk activity in determining workstation idleness.
A L G O R I T H M S
There are no algorithms for this measure.
D E F I N I T I O N O F T E R M S
There are no definitions of terms.
D E E M E D S A V I N G S
The energy savings per unit found in various studies specific to the Verdiem Surveyor software varied from 33.8 kWh/year to 330 kWh/year, with an average savings of about 200 kWh/year. This includes the power savings from the PC as well as the monitor. Deemed savings are based on a research study conducted by Regional Technical Forum which involves actual field measurements of the Verdiem Surveyor product. The study reports deemed energy and demand savings for three different building types (schools, large offices and small offices) in combination with different HVAC systems types (electric heat, gas heat, and heat pumps). The deemed savings values in Table 3-285 also take into account the HVAC interactive effects. A simple average is reported for Pennsylvania.
Table 3-285: Network Power Controls, Per Unit Summary Table
Measure Name Unit
Gross Peak kW Reduction per
Unit
Gross kWh Reduction per
UnitEffective Useful
Life
Network PC Plug Load Power Management Software
One copy of licensed software installed on a PC
workstation
0.00625471 135472 5
E V A L U A T I O N P R O T O C O L S
For most projects, the appropriate evaluation protocol is to verify installation and proper selection of default values. For projects using customer specific data for open variables, the appropriate evaluation protocol is to verify installation and proper application of TRM protocol along with verification of open variables. The Pennsylvania Evaluation Framework provides specific guidelines and requirements for evaluation procedures.
S O U R C E S
1) Regional Technical Forum (RTF) as part of the Northwest Power & Conservation Council, Deemed Measures List. Network Computer Power Management, v3.0.
471 Modeling is an acceptable substitute to metering and BMS data if modeling is conducted using building- and equipment-specific information at the site and the facility consumption is calibrated using 12 months of billing data (pre-retrofit). 472 Site-specific design values should be used in the calculation wherever possible, to avoid overestimating the savings using the default minimally compliant EERs.
SECTION 2: Residential MeasuresMiscellaneous Page 490
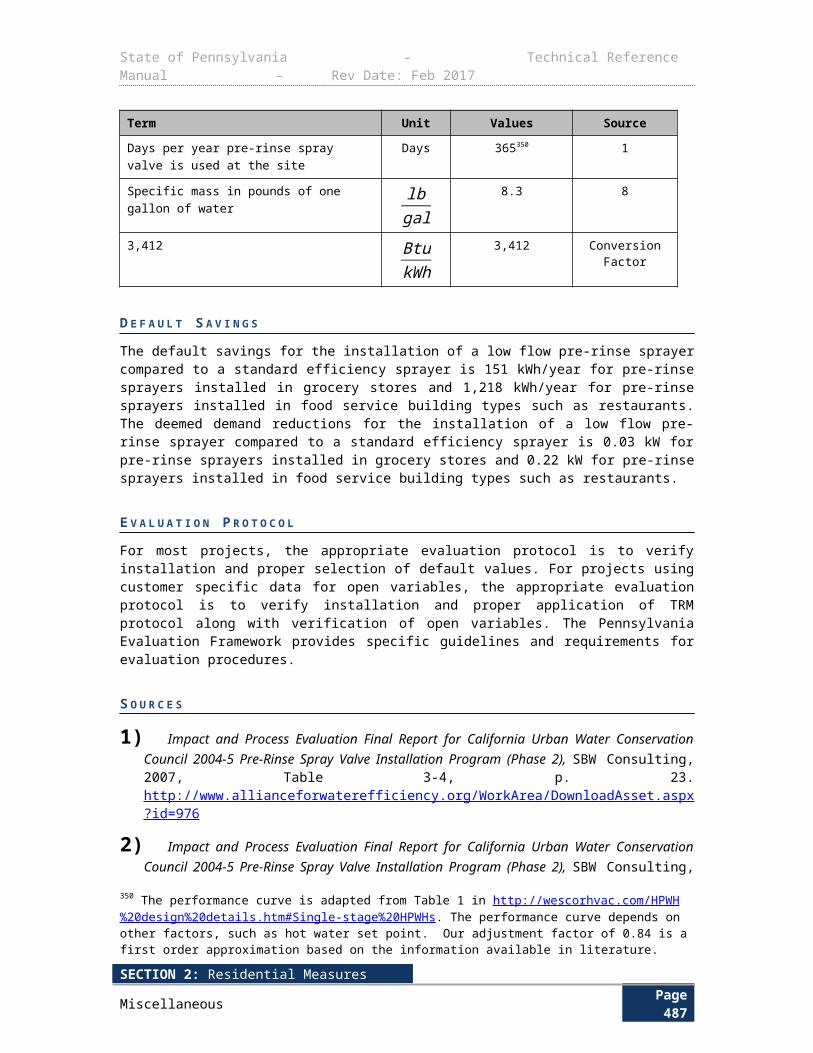
State of Pennsylvania – Technical Reference Manual – Rev Date: Feb 2017
a) Office Plug Load Field Monitoring Report, Laura Moorefield et al, Ecos Consulting, Dec, 2008.
b) PSE PC Power Management Results, Cadmus Group, Feb, 2011.
c) Non-Residential Network Computer Power Management, Avista, Feb, 2011.
d) After-hours Power Status of Office Equipment and Inventory of Miscellaneous Plug-Load Equipment, LBNL, Jan 2004.
e) Ecos Commercial Field Research Report, 2008.
2) Dimetrosky, S., Steiner, J., & Vellinga, N. (2006). San Diego Gas & Electric 2004-2005 Local Energy Savers Program Evaluation Report (Study ID: SDG0212). Portland, OR: Quantec LLC. http://www.calmac.org/publications/SDGE_ESP_EMV_Report_073106_Final.pdf
3) Greenberg, D. (2004). Network Power Management Software: Saving Energy by Remote Control (E source report No. ER-04-15). Boulder, CO: Platts Research & Consulting.
4) Roth, K., Larocque, G., & Kleinman, J. (2004). Energy Consumption by Office and Telecommunications Equipment in Commercial Buildings Volume II: Energy Savings Potential (U.S. DOE contract No. DE-AM26-99FT40465). Cambridge, MA: TIAX LLC. http://www.eere.energy.gov/buildings/info/documents/pdfs/office_telecom-vol2_final.pdf
SECTION 2: Residential MeasuresMiscellaneous Page 491
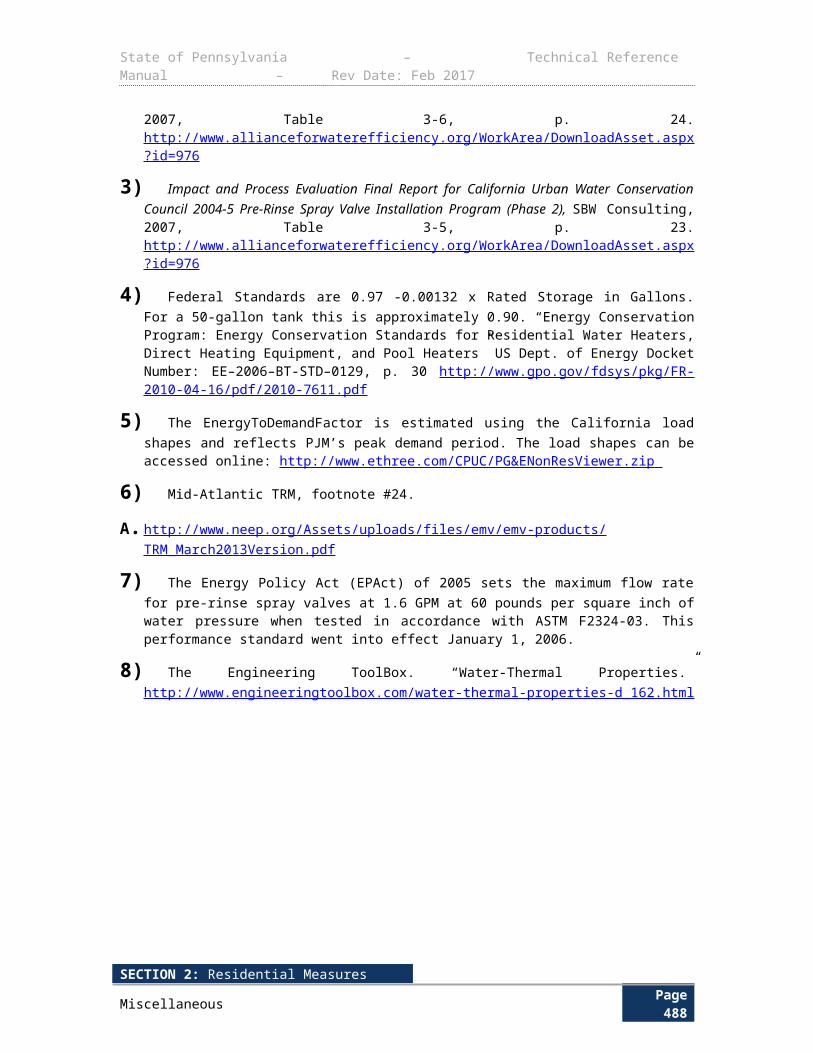
State of Pennsylvania – Technical Reference Manual – Rev Date: Feb 2017
3.9.3 SMART STRIP PLUG OUTLETS
Measure Name Smart Strip Plug Outlets
Target Sector Commercial and Industrial Establishments
Measure Unit Smart Strip Plug Outlet
Unit Energy Savings Fixed
Unit Peak Demand Reduction Fixed
Measure Life 5 years473
Measure Vintage Retrofit
Smart Strips are power strips that contain a number of controlled sockets with at least one uncontrolled socket. When the appliance that is plugged into the uncontrolled socket is turned off, the power strips then shuts off the items plugged into the controlled sockets. Qualified power strips must automatically turn off when equipment is unused / unoccupied.
E L I G I B I L I T Y
This protocol documents the energy savings attributed to the installation of smart strip plugs. The most likely area of application is within commercial spaces such as isolated workstations and computer systems with standalone printers, scanners or other major peripherals that are not dependent on an uninterrupted network connection (e.g. routers and modems).
A L G O R I T H M S
The DSMore Michigan Database of Energy Efficiency Measures performed engineering calculations using standard standby equipment wattages for typical computer and TV systems and idle times. This commercial protocol will use the computer system assumptions except it will utilize a lower idle time for commercial office use.
The computer system usage is assumed to be 10 hours per day for 5 workdays per week. The average daily idle time including the weekend (2 days of 100% idle) is calculated as follows:
Average daily commercial computer system idle time
¿Hours per week− (workdays×daily computer usage )
da ys per week
16.86hours¿
168hours−(5days×10hours)7 days
The energy savings and demand reduction were obtained through the following calculations:
∆ kWh ¿ (kW comp×Hr comp )×365=123.69 kWh (rounded¿124 kWh)
∆ kW peak ¿CF×kW comp=0.0101kW
473 ENERGY STAR Office Equipment Savings Calculator
SECTION 2: Residential MeasuresMiscellaneous Page 492
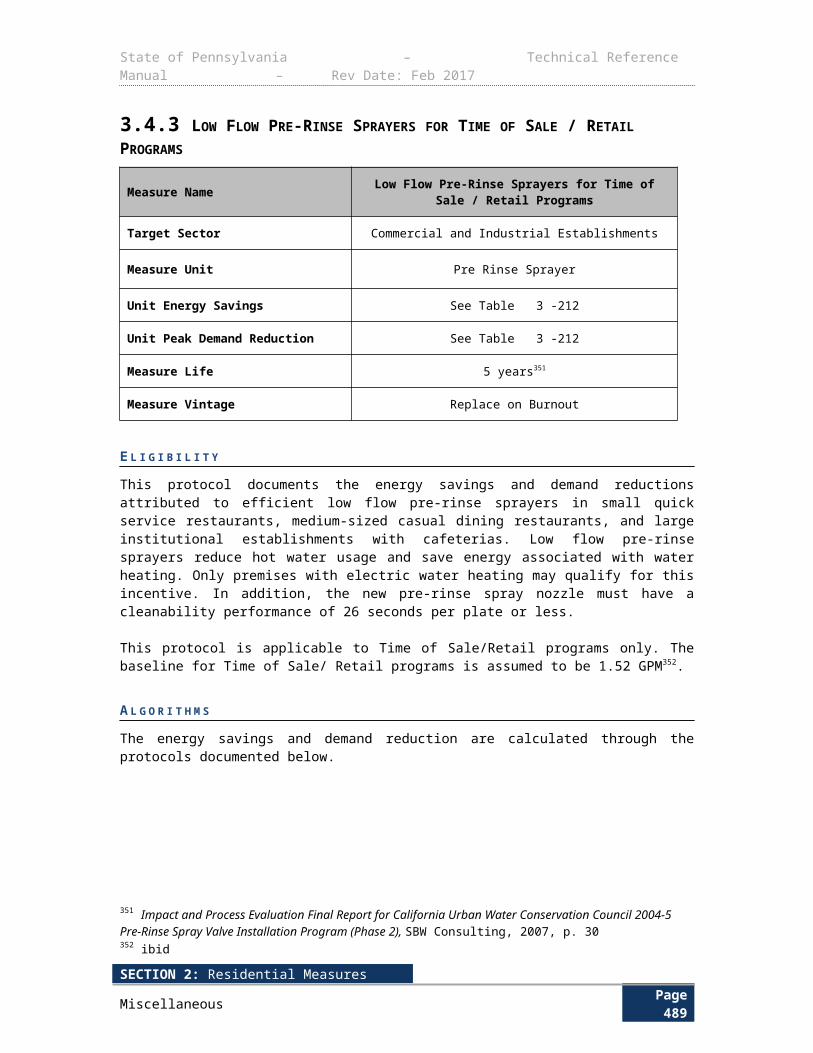
State of Pennsylvania – Technical Reference Manual – Rev Date: Feb 2017
D E F I N I T I O N O F T E R M S
The parameters in the above equation are listed below.
Table 3-286: Smart Strip Calculation Assumptions
Term Unit Values Source
kW comp , Idle kW of computer system kW 0.0201 1
Hr comp , Daily hours of computer idle timeHoursDay
16.861
CF , Coincidence Factor Decimal 0.50 1
D E E M E D S A V I N G S
∆ kWh ¿124kWh
∆ kW peak ¿0.0101kW
E V A L U A T I O N P R O T O C O L S
For most projects, the appropriate evaluation protocol is to verify installation and proper selection of default values. For projects using customer specific data for open variables, the appropriate evaluation protocol is to verify installation and proper application of TRM protocol along with verification of open variables. The Pennsylvania Evaluation Framework provides specific guidelines and requirements for evaluation procedures.
S O U R C E S
1. DSMore Michigan Database of Energy Efficiency Measures. http://michigan.gov/mpsc/0,4639,7-159-52495_55129---,00.html
SECTION 2: Residential MeasuresMiscellaneous Page 493
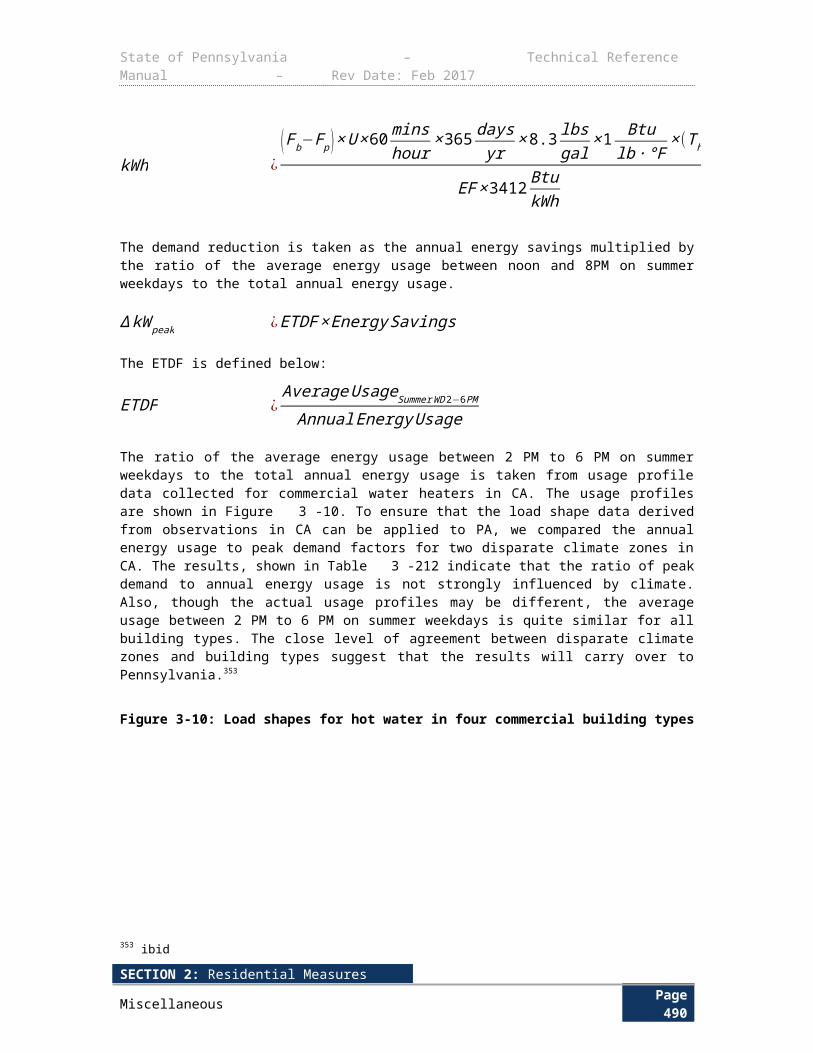
State of Pennsylvania – Technical Reference Manual – Rev Date: Feb 2017
3.10 COMPRESSED AIR3.10.1 CYCLING REFRIGERATED THERMAL MASS DRYER
Measure Name Cycling Refrigerated Thermal Mass Dryer
Target Sector Commercial and Industrial Establishments
Measure Unit Cycling Refrigerated Thermal Mass Dryer
Unit Energy Savings Variable
Unit Peak Demand Reduction Variable
Measure Life 10 years474
Measure Vintage Early Replacement
When air is compressed, water vapor in the air condenses and collects in liquid form. Some of this condensate collects in the air distribution system and can contaminate downstream components such as air tools with rust, oil, and pipe debris. Refrigerated air dryers remove the water vapor by cooling the air to its dew point and separating the condensate. Changes in production and seasonal variations in ambient air temperature lead to partial loading conditions on the dryer. Standard air dryers use a hot gas bypass system that is inefficient at partial loads. A Cycling Thermal Mass Dryer uses a thermal storage medium to store cooling capacity when the system is operated at partial loads allowing the dryer refrigerant compressor to cycle.
E L I G I B I L I T Y
This measure is targeted to non-residential customers whose equipment is a non-cycling refrigerated air dryer with a capacity of 600 cfm or below.
Acceptable baseline conditions are a non-cycling (e.g. continuous) air dryer with a capacity of 600 cfm or below. The replacement of desiccant, deliquescent, heat-of-compression, membrane, or other types of dryers does not qualify under this measure.
Efficient conditions are a cycling thermal mass dryer with a capacity of 600 cfm or below.
A L G O R I T H M S
kWh ¿((CFM ×HPcompressor×kW dryer
CFM comp .×HOURS×(1−APC ))×RTD)
∆ kW peak ¿ ∆ kWhHOURS
∗CF
474 While DEER lists the EUL of electro-mechanical plug load sensors at ten years, this product is subject to the cyclical nature of the PC software and hardware industry, so a more conservative number is appropriate. This is the same value used in the SDG&E program.
SECTION 2: Residential MeasuresMiscellaneous Page 494
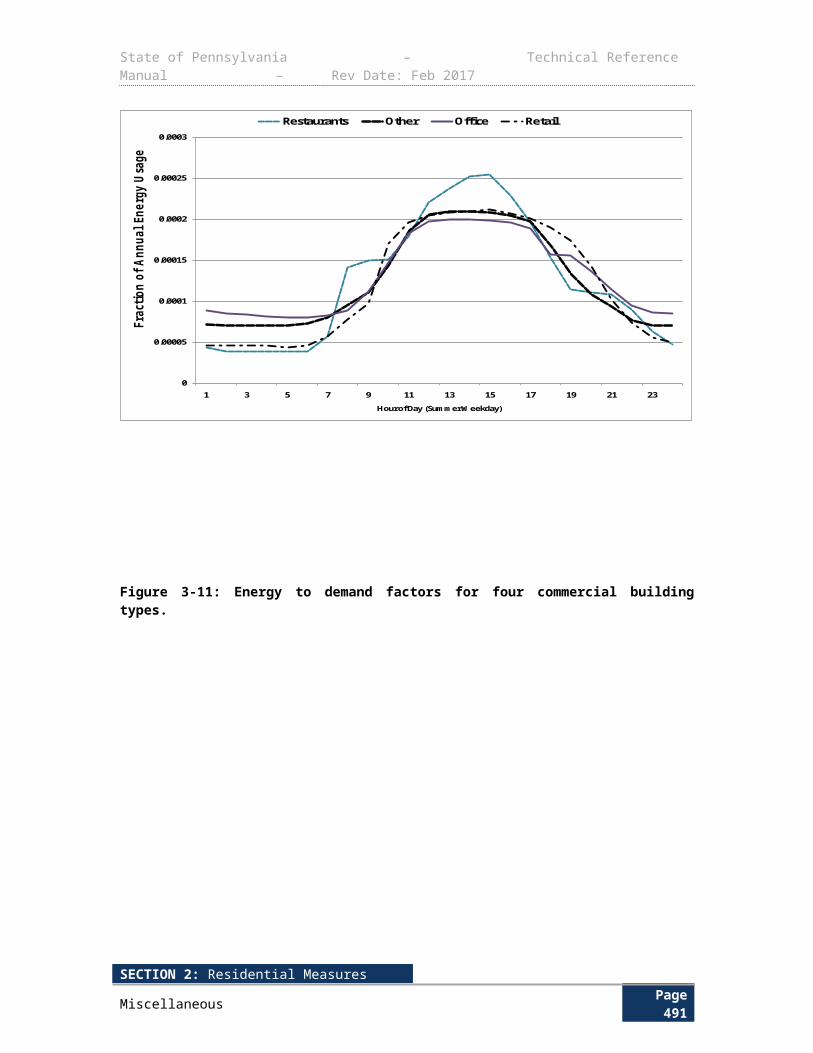
State of Pennsylvania – Technical Reference Manual – Rev Date: Feb 2017
D E F I N I T I O N O F T E R M S
Table 3-287: Cycling Refrigerated Thermal Mass Dryer – Values and References
Term Unit Values Source
CFM , Compressor output per HPCFMHP
EDC Data Gathering
Default: 4
EDC Data Gathering1
HPcompressor , Nominal HP rating of the air compressor motor
HP Nameplate data EDC Data Gathering
kWdryer/CFMcomp, Ratio of dryer kW to compressor CFM
kWCFM
EDC Data Gathering
Default: 0.0087
EDC Data Gathering2
RTD , Chilled coil response time derate HoursEDC Data Gathering
Default: 0.925
EDC Data Gathering2
APC , Average compressor operating capacity
None EDC Data GatheringDefault: 65%
EDC Data Gathering3
HOURS , Annual hours of compressor operation
Hoursyear
EDC Data Gathering
Default: See Table 3-288
EDC Data Gathering4
CF, Coincidence Factor DecimalEDC Data Gathering
Default: See Table 3-289
EDC Data Gathering5
Table 3-288: Annual Hours of Compressor Operation
Operation Facility Schedule(hours per day / days per week) HOURS
Single Shift (8/5) 2080
2-Shift (16/5) 4160
3-Shift (24/5) 6240
4-Shift (24/7) 8320
Table 3-289: Coincidence Factors
Coincidence Factor %
Single Shift (8/5) 66.7
2-Shift (16/5) 100
3-Shift (24/5) 100
4-Shift (24/7) 100
SECTION 2: Residential MeasuresMiscellaneous Page 495
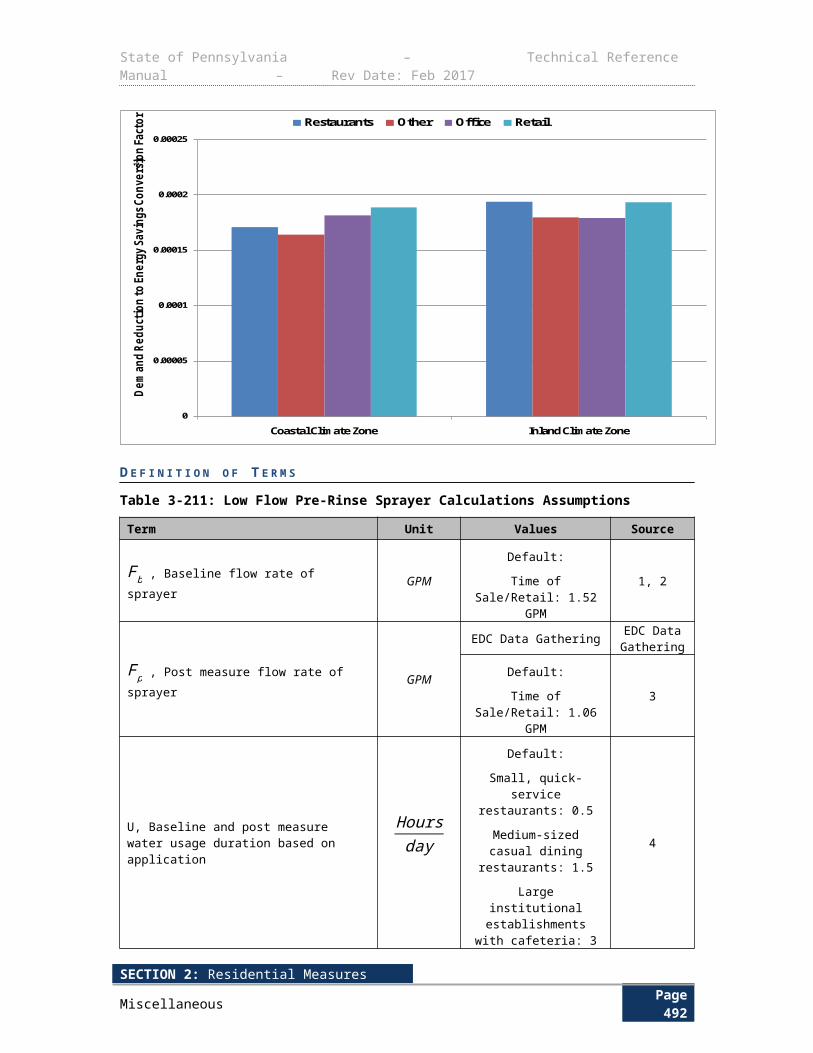
State of Pennsylvania – Technical Reference Manual – Rev Date: Feb 2017
D E F A U L T S A V I N G S
Default savings may be claimed using the algorithms above and the variable defaults. EDCs may also claim savings using customer specific data.
E V A L U A T I O N P R O T O C O L S
For most projects, the appropriate evaluation protocol is to verify installation and proper selection of default values. For projects using customer specific data for open variables, the appropriate evaluation protocol is to verify installation and proper application of TRM protocol along with verification of open variables. The Pennsylvania Evaluation Framework provides specific guidelines and requirements for evaluation procedures.
S O U R C E S
1) Manufacturer’s data suggests that cfm output per compressor HP ranges from 4 to 5. The lower estimate of 4 will slightly underestimate savings.
2) Conversion factor based on a linear regression analysis of the relationship between air compressor full load capacity and non-cycling dryer full load kW assuming that the dryer is sized to accommodate the maximum compressor capacity. See “Compressed Air Analysis.xls” for source calculations, Efficiency Vermont, Technical Reference Manual 2013-82. http://www.greenmountainpower.com/upload/photos/371TRM_User_Manual_No_2013-82-5-protected.pdf
3) Based on an analysis of load profiles from 50 facilities using air compressors 40 HP and below. See “BHP Weighted Compressed Air Load Profiles.xls” for source calculations, Efficiency Vermont, Technical Reference Manual 2013-82. http://www.greenmountainpower.com/upload/photos/371TRM_User_Manual_No_2013-82-5-protected.pdf
4) Hours account for holidays and scheduled downtime. Efficiency Vermont, Technical Reference Manual 2013-82. http://www.greenmountainpower.com/upload/photos/371TRM_User_Manual_No_2013-82-5-protected.pdf
5) Efficiency Vermont, Technical Reference Manual 2013-82. Compressed Air Loadshape calcs (compressed_air_loadshape_calc_1-4_shifts.xls). The CF is drawn from the summer period, which is when the PA peak kW peak is calculated. http://www.greenmountainpower.com/upload/photos/371TRM_User_Manual_No_2013-82-5-protected.pdf
SECTION 2: Residential MeasuresMiscellaneous Page 496
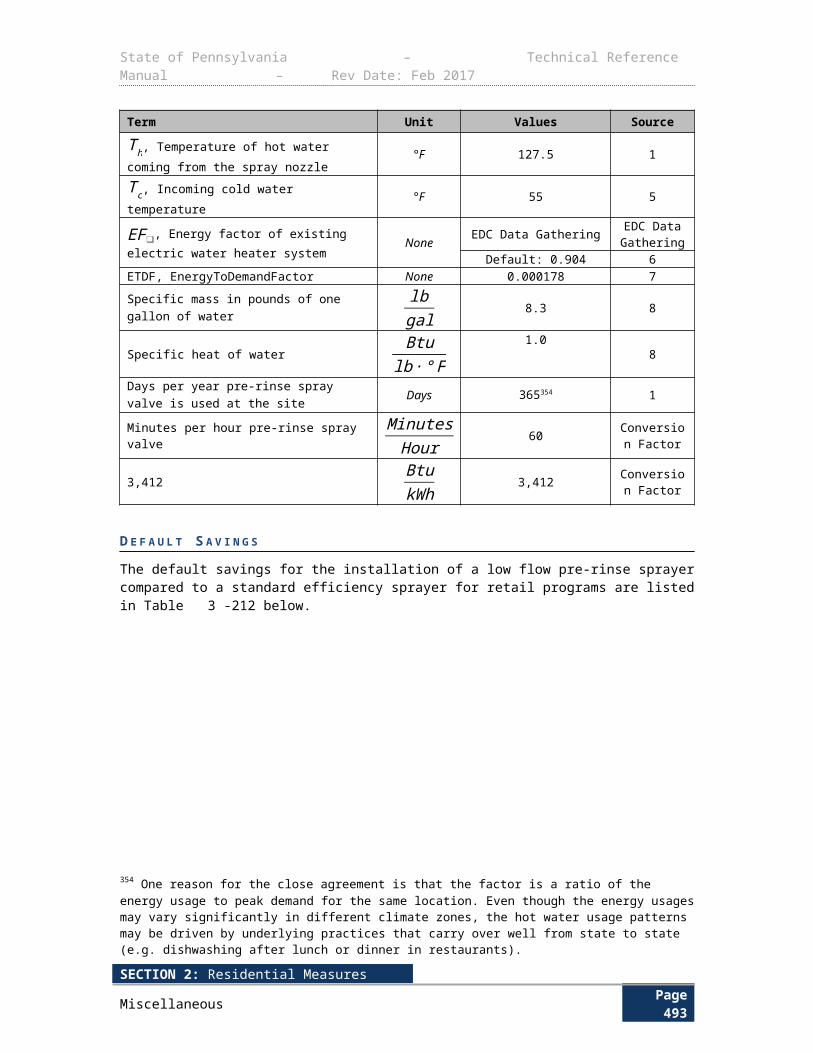
State of Pennsylvania – Technical Reference Manual – Rev Date: Feb 2017
3.10.2 AIR-ENTRAINING AIR NOZZLE
Measure Name Air-entraining Air Nozzle
Target Sector Commercial and Industrial Establishments
Measure Unit Air-entraining Air Nozzle
Unit Energy Savings Variable
Unit Peak Demand Reduction Variable
Measure Life 15 years475
Measure Vintage Early Replacement
Air entraining air nozzles use compressed air to entrain and amplify atmospheric air into a stream, increasing pressure with minimal compressed air use. This decreases the compressor work necessary to provide the nozzles with compressed air. Air entraining nozzles can also reduce noise in systems with air at pressures greater than 30 psig.
E L I G I B I L I T Y
This measure is targeted to non-residential customers whose compressed air equipment uses stationary air nozzles in a production application with an open copper tube of 1/8” or 1/4” orifice diameter.
Energy efficient conditions require replacement of an inefficient, non-air entraining air nozzle with an energy efficient air-entraining air nozzle that use less than 15 CFM at 100 psi for industrial applications.
A L G O R I T H M S
kWh ¿ (CFM base−CFM ee )×COMP×HOURS×%USE
∆ kW peak ¿ ∆ kWhHOURS
∗CF
D E F I N I T I O N O F T E R M S
475 Network PC Power Management Presentation, Regional Technical Forum, May 4, 2010.
SECTION 2: Residential MeasuresMiscellaneous Page 497
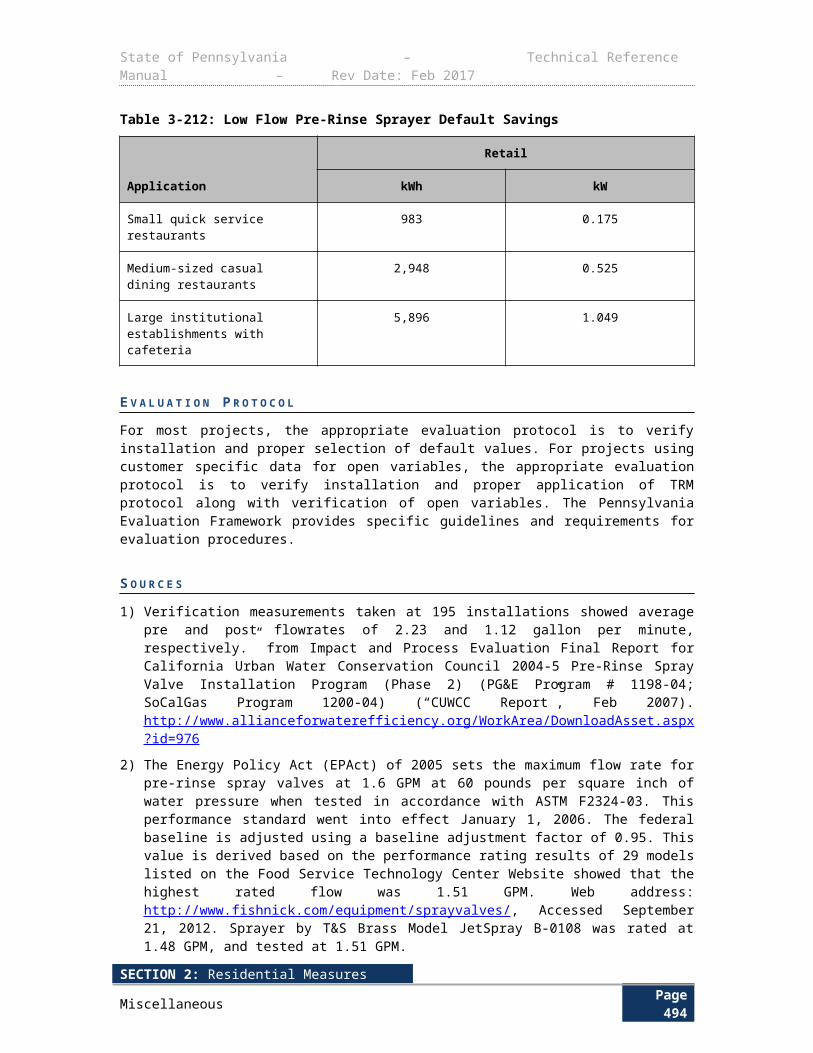
State of Pennsylvania – Technical Reference Manual – Rev Date: Feb 2017
Table 3-290: Air-entraining Air Nozzle – Values and References
Term Unit Values Source
CFMbase, Baseline nozzle air mass flow
CFM
( ft3min ) EDC Data GatheringDefault: See Table 3-291
1
CFM ee, Energy efficient nozzle air mass flow
CFM
( ft3min ) EDC Data GatheringDefault: See Table 3-292
2
COMP , Ratio of compressor kW to CFMkWCFM
EDC Data GatheringDefault: See Table 3-293
3
HOURS , Annual hours of compressor operation
Hoursyear
EDC Data GatheringDefault: See Table 3-294
4
%USE , Percent of hours when nozzle is in use
NoneEDC Data GatheringDefault: 5%
5
CF, Coincidence Factor DecimalEDC Data GatheringDefault: See Table 3-295
6
Table 3-291: Baseline Nozzle Mass Flow
Nozzle Diameter Air Mass Flow (CFM)
1/8” 21
1/4" 58
Table 3-292: Air Entraining Nozzle Mass Flow
Nozzle Diameter Air Mass Flow (CFM)
1/8” 6
1/4" 11
SECTION 2: Residential MeasuresMiscellaneous Page 498
State of Pennsylvania – Technical Reference Manual – Rev Date: Feb 2017
Table 3-293: Average Compressor kW / CFM (COMP)
Compressor Control TypeAverage Compressor kW/CFM
(COMP)Modulating w/ Blowdown 0.32
Load/No Load w/ 1 gal/CFM Storage 0.32
Load/No Load w/ 3 gal/CFM Storage 0.30
Load/No Load w/ 5 gal/CFM Storage 0.28
Variable Speed w/ Unloading 0.23
Table 3-294: Annual Hours of Compressor Operation
Facility Schedule(hours per day / days per week) HOURS
Single Shift (8/5) 2080
2-Shift (16/5) 4160
3-Shift (24/5) 6240
4-Shift (24/7) 8320
Table 3-295: Coincidence Factor
Coincidence Factor Decimal
Single Shift (8/5) 0.667
2-Shift (16/5) 1.00
3-Shift (24/5) 1.00
4-Shift (24/7) 1.00
D E F A U L T S A V I N G S
Default savings may be claimed using the algorithms above and the variable defaults. EDCs may also claim savings using customer specific data.
E V A L U A T I O N P R O T O C O L S
For most projects, the appropriate evaluation protocol is to verify installation and proper selection of default values. For projects using customer specific data for open variables, the appropriate evaluation protocol is to verify installation and proper application of TRM protocol along with verification of open variables. The Pennsylvania Evaluation Framework provides specific guidelines and requirements for evaluation procedures.
S O U R C E S
1) Machinery’s Handbook 25th Edition.
2) Survey of Engineered Nozzle Suppliers.
3) Efficiency Vermont, Technical Reference Manual 2013-82. The average compressor kW/CFM values were calculated using DOE part load curves and load profile data from 50 facilities employing compressors less than or equal to 40 hp. http://www.greenmountainpower.com/upload/photos/371TRM_User_Manual_No_2013-82-5-protected.pdf
SECTION 2: Residential MeasuresMiscellaneous Page 499
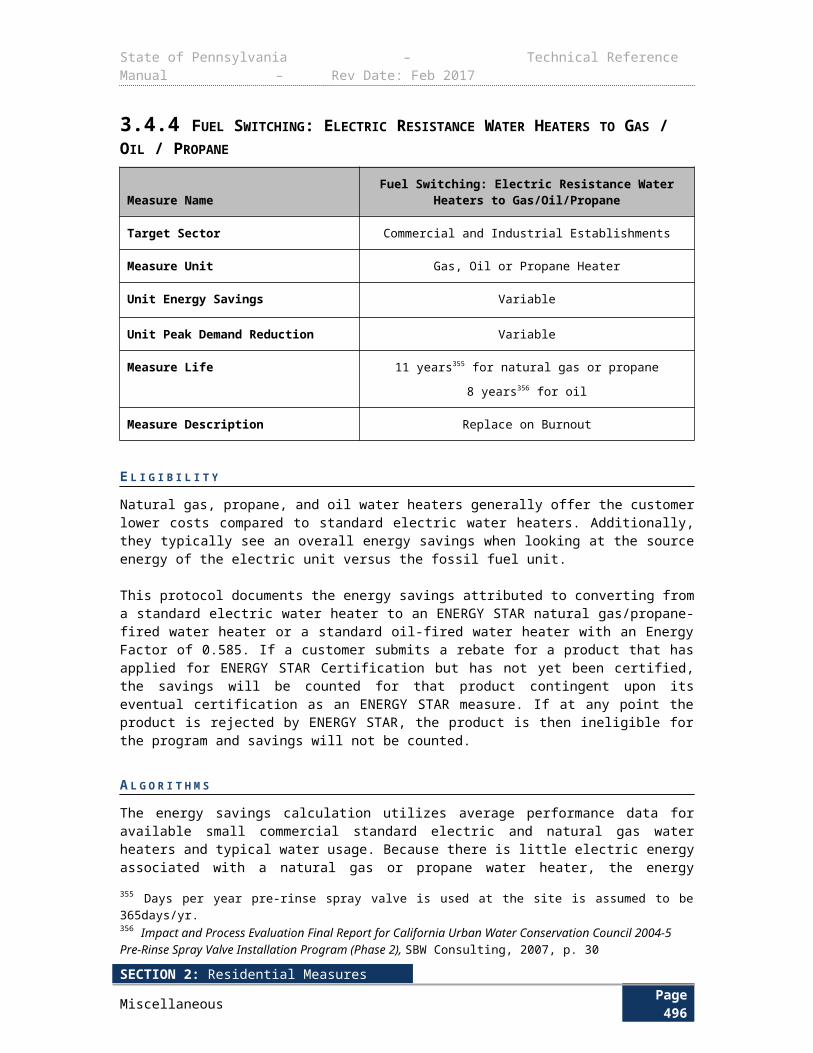
State of Pennsylvania – Technical Reference Manual – Rev Date: Feb 2017
4) Efficiency Vermont, Technical Reference Manual 2013-82. Accounts for holidays and scheduled downtime. http://www.greenmountainpower.com/upload/photos/371TRM_User_Manual_No_2013-82-5-protected.pdf
5) Assumes 50% handheld air guns and 50% stationary air nozzles. Manual air guns tend to be used less than stationary air nozzles, and a conservative estimate of 1 second of blow-off per minute of compressor run time is assumed. Stationary air nozzles are commonly more wasteful as they are often mounted on machine tools and can be manually operated resulting in the possibility of a long term open blow situation. An assumption of 5 seconds of blow-off per minute of compressor run time is used.
6) Efficiency Vermont, Technical Reference Manual 2013-82. Compressed Air Loadshape calcs (compressed_air_loadshape_calc_1-4_shifts.xls). The CF is drawn from the summer period, which is when the PA peak kW peak is calculated. http://www.greenmountainpower.com/upload/photos/371TRM_User_Manual_No_2013-82-5-protected.pdf
SECTION 2: Residential MeasuresMiscellaneous Page 500
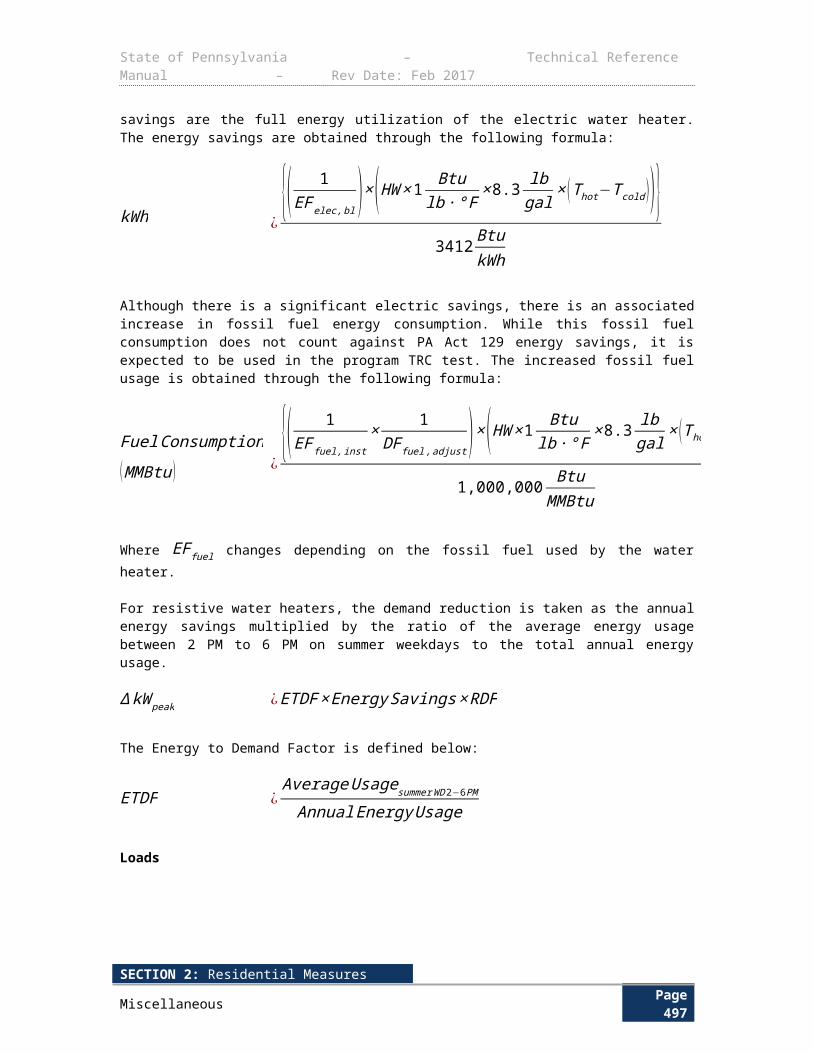
State of Pennsylvania – Technical Reference Manual – Rev Date: Feb 2017
3.10.3 NO-LOSS CONDENSATE DRAINS
Measure Name No-loss Condensate Drains
Target Sector Commercial and Industrial Establishments
Measure Unit No-loss Condensate Drains
Unit Energy Savings Variable
Unit Peak Demand Reduction Variable
Measure Life 5 years476
Measure Vintage Early Replacement
When air is compressed, water vapor in the air condenses and collects in the system. The water must be drained to prevent corrosion to the storage tank and piping system, and to prevent interference with other components of the compressed air system such as air dryers and filters. Many drains are controlled by a timer and are opened for a fixed amount of time on regular intervals regardless of the amount of condensate. When the drains are opened compressed air is allowed to escape without doing any purposeful work. No-loss Condensate Drains are controlled by a sensor that monitors the level of condensate and only open when there is a need to drain condensate. They close before compressed air is allowed to escape.
E L I G I B I L I T Y
This measure is targeted to non-residential customers whose equipment is a timed drain that operates on a pre-set schedule.
Acceptable baseline conditions are compressed air systems with standard condensate drains operated by a solenoid and timer.
Energy efficient conditions are systems retrofitted with new No-loss Condensate Drains properly sized for the compressed air system.
A L G O R I T H M S
The following algorithms apply for No-loss Condensate Drains.
kWh ¿ ALR×COMP×OPEN × AF×PNC
∆ kW peak ¿ ∆ kWhHOURS
∗CF
D E F I N I T I O N O F T E R M S
476 http://www.nwcouncil.org/energy/rtf/measures/measure.asp?id=95&decisionid=117
SECTION 2: Residential MeasuresMiscellaneous Page 501
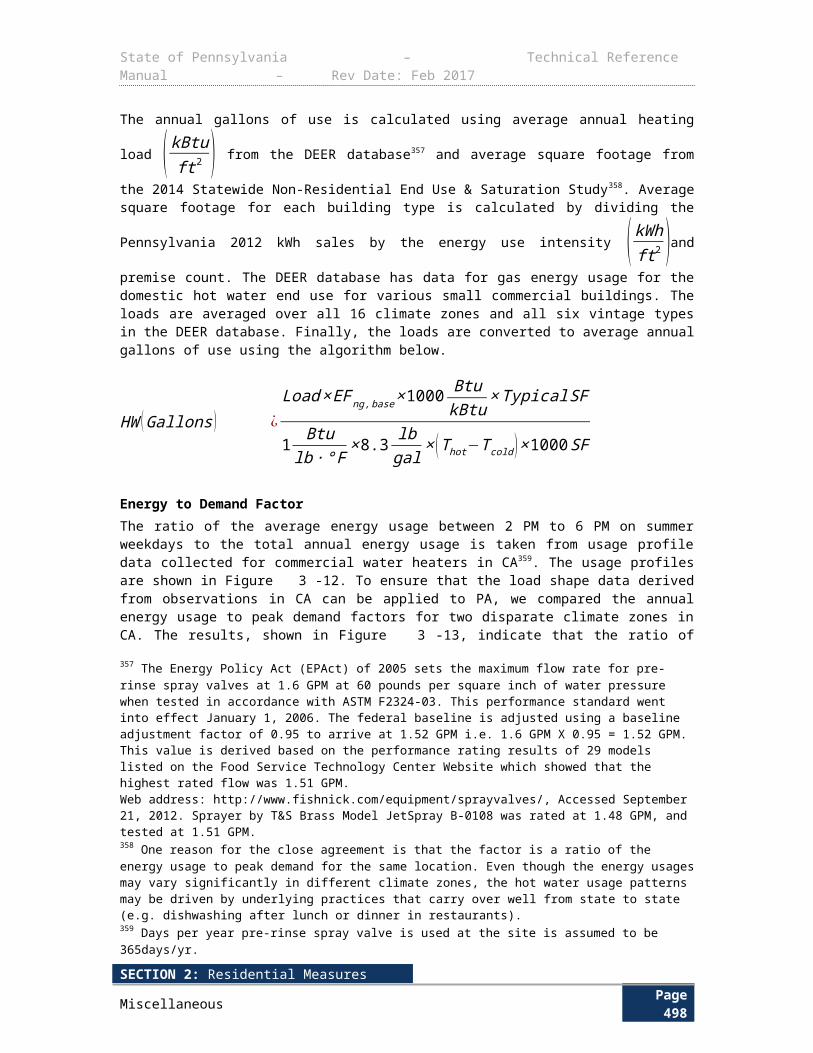
State of Pennsylvania – Technical Reference Manual – Rev Date: Feb 2017
Table 3-296: No-loss Condensate Drains – Values and References
Term Unit Values Source
ALR, Air Loss Rate; an hourly average rate for the timed drain dependent on drain orifice diameter and system pressure.
CFM ( ft3
min )EDC Data Gathering
Default: See Table 3-297
EDC Data Gathering
1
COMP, Compressor kW / CFM; the amount of electrical demand in KW required to generate one cubic foot of air at 100 PSI.
kWCFM
EDC Data Gathering Default See: Table 3-
298
EDC Data Gathering
2
OPEN , Hours per year drain is openHoursyear
EDC Data Gathering
Default: 146
EDC Data Gathering
3
AF, Adjustment Factor; accounts for periods when compressor is not running and the system depressurizes due to leaks and operation of time drains.
NoneEDC Data GatheringDefault: See Table 3-
299
EDC Data Gathering
4
PNC, Percent Not Condensate; accounts for air loss through the drain after the condensate has been cleared and the drain remains open.
NoneEDC Data Gathering
Default: 0.75
EDC Data Gathering
4
HOURS, Annual hours of compressor operation
Hoursyear
EDC Data Gathering
Default: See Table 3-300
EDC Data Gathering
5
CF , Coincidence Factor DecimalEDC Data Gathering
Default: Table 3-301
EDC Data Gathering
6
SECTION 2: Residential MeasuresMiscellaneous Page 502
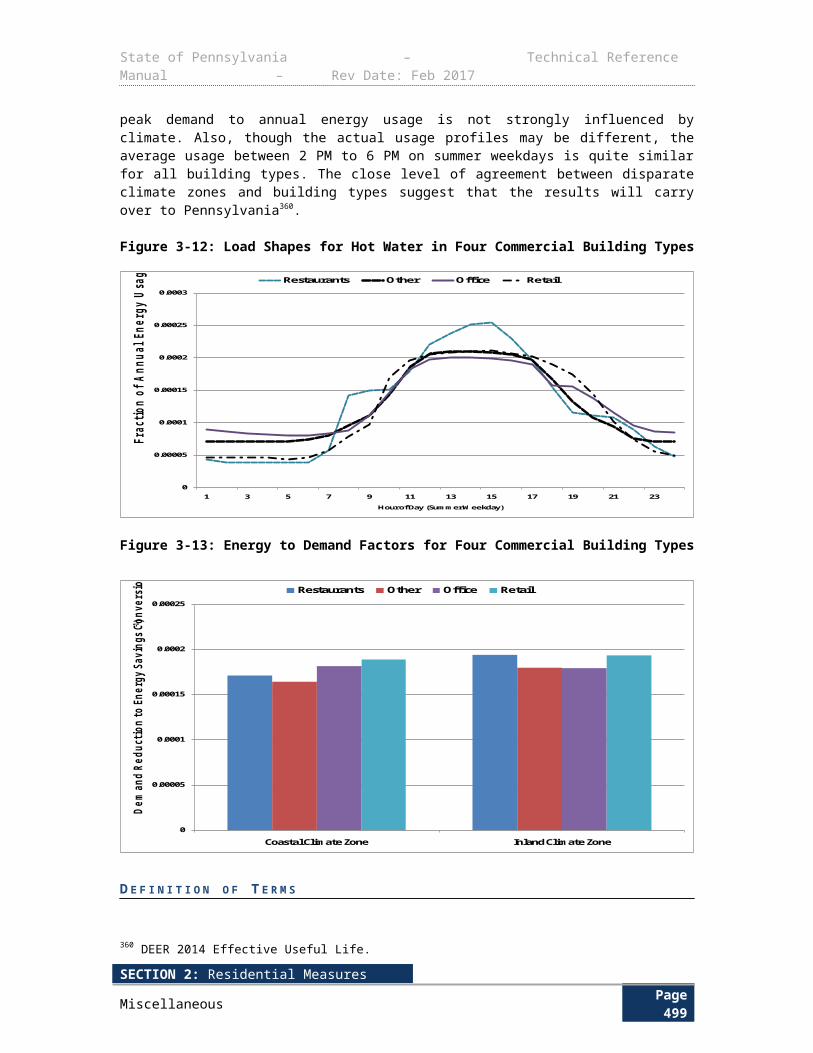
State of Pennsylvania – Technical Reference Manual – Rev Date: Feb 2017
Table 3-297: Average Air Loss Rates (ALR)
Pressure (psig)
Orifice Diameter (inches)
1/64 1/32 1/16 1/8 1/4 3/8
70 0.29 1.16 4.66 18.62 74.4 167.8
80 0.32 1.26 5.24 20.76 83.1 187.2
90 0.36 1.46 5.72 23.1 92 206.6
95 0.38 1.51 6.02 24.16 96.5 216.8
100 0.4 1.55 6.31 25.22 100.9 227
105 0.42 1.63 6.58 26.31 105.2 236.7
110 0.43 1.71 6.85 27.39 109.4 246.4
115 0.45 1.78 7.12 28.48 113.7 256.1
120 0.46 1.86 7.39 29.56 117.9 265.8
125 0.48 1.94 7.66 30.65 122.2 275.5
For well-rounded orifices, values should be multiplied by 0.97. For sharp orifices, values should be multiplied by 0.61.When the baseline value is unknown, use 100.9 CFM477.
Table 3-298: Average Compressor kW/CFM (COMP)
Compressor Control TypeAverage Compressor kW/CFM
(COMP)
Modulating w/ Blowdown 0.32
Load/No Load w/ 1 gal/CFM Storage 0.32
Load/No Load w/ 3 gal/CFM Storage 0.30
Load/No Load w/ 5 gal/CFM Storage 0.28
Variable Speed w/ Unloading 0.23
Table 3-299: Adjustment Factor (AF)
Compressor Operating Hours AF
477 ibid
SECTION 2: Residential MeasuresMiscellaneous Page 503

State of Pennsylvania – Technical Reference Manual – Rev Date: Feb 2017
Single Shift – 2080 Hours 0.62
2-Shift – 4160 Hours 0.74
3-Shift – 6240 Hours 0.86
4-Shift – 8320 Hours 0.97
Table 3-300: Annual Hours of Compressor Operation
Facility Schedule
(hours per day / days per week)HOURS
Single Shift (8/5) 2080
2-Shift (16/5) 4160
3-Shift (24/5) 6240
4-Shift (24/7) 8320
Table 3-301: Coincidence Factor
Coincidence Factor Decimal
Single Shift (8/5) 0.667
2-Shift (16/5) 1.00
3-Shift (24/5) 1.00
4-Shift (24/7) 1.00
D E F A U L T S A V I N G S
Default savings may be claimed using the algorithms above and the variable defaults. EDCs may also claim savings using customer specific data.
E V A L U A T I O N P R O T O C O L S
For most projects, the appropriate evaluation protocol is to verify installation and proper selection of default values. For projects using customer specific data for open variables, the appropriate evaluation protocol is to verify installation and proper application of TRM protocol along with verification of open variables. The Pennsylvania Evaluation Framework provides specific guidelines and requirements for evaluation procedures.
S O U R C E S
1) US DOE Compressed Air Tip Sheet #3, August 2004, from Fundamentals for Compressed Air Systems Training offered by the Compressed Air Challenge. http://www1.eere.energy.gov/manufacturing/tech_assistance/pdfs/compressed_air3.pdf
2) The average compressor kW/CFM values were calculated using DOE part load curves and load profile data from 50 facilities employing compressors less than or equal to 40 hp. Efficiency Vermont, Technical Reference Manual 2013-82.
SECTION 2: Residential MeasuresMiscellaneous Page 504

State of Pennsylvania – Technical Reference Manual – Rev Date: Feb 2017
http://www.greenmountainpower.com/upload/photos/371TRM_User_Manual_No_2013-82-5-protected.pdf
3) Assumes 10 seconds per 10 minute interval. Efficiency Vermont, Technical Reference Manual 2013-82. http://www.greenmountainpower.com/upload/photos/371TRM_User_Manual_No_2013-82-5-protected.pdf
4) Based on observed data. Efficiency Vermont, Technical Reference Manual 2013-82. http://www.greenmountainpower.com/upload/photos/371TRM_User_Manual_No_2013-82-5-protected.pdf
5) Accounts for holidays and scheduled downtime. Efficiency Vermont, Technical Reference Manual 2013-82. http://www.greenmountainpower.com/upload/photos/371TRM_User_Manual_No_2013-82-5-protected.pdf
6) Efficiency Vermont, Technical Reference Manual 2013-82. Compressed Air Loadshape calcs (compressed_air_loadshape_calc_1-4_shifts.xls). The CF is drawn from the summer period, which is when the PA peak kW peak is calculated. http://www.greenmountainpower.com/upload/photos/371TRM_User_Manual_No_2013-82-5-protected.pdf
SECTION 2: Residential MeasuresMiscellaneous Page 505
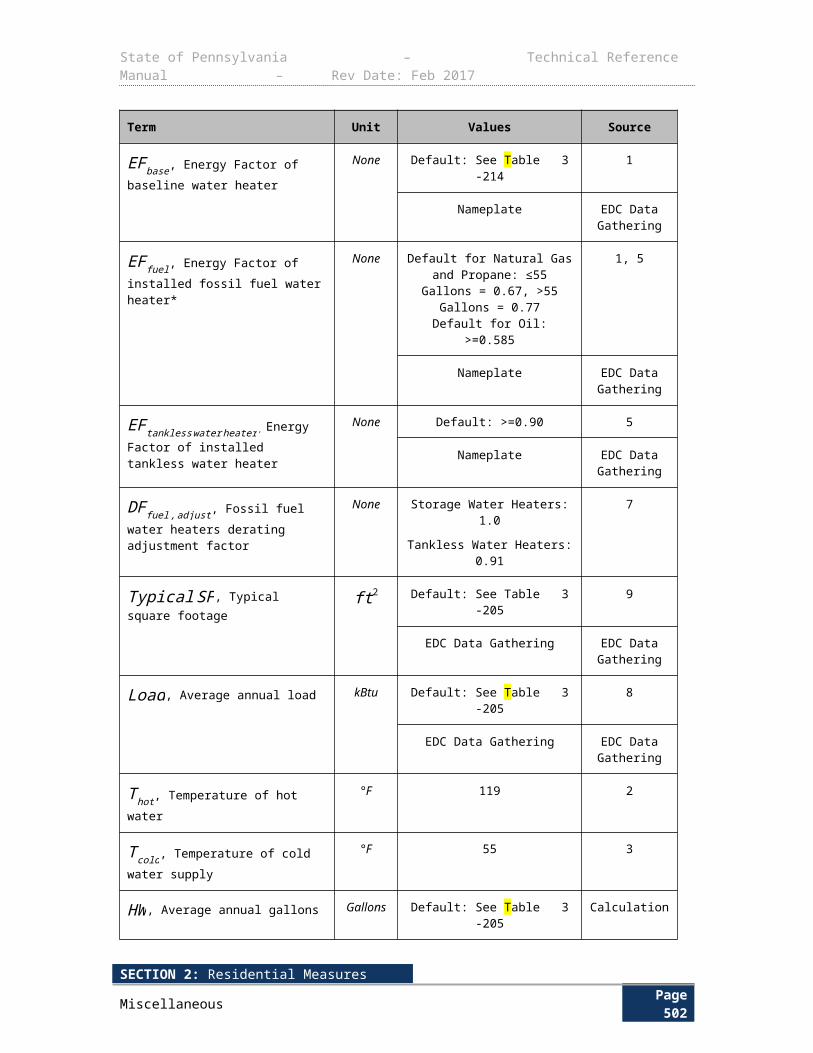
State of Pennsylvania – Technical Reference Manual – Rev Date: Feb 2017
3.10.4 AIR TANKS FOR LOAD/NO LOAD COMPRESSORS
Measure Name Air Tanks for Load/No Load Compressors
Target Sector Commercial and Industrial Establishments
Measure Unit Receiver Tank Addition
Unit Energy Savings Variable
Unit Peak Demand Reduction Variable
Measure Life 15 years478
Vintage Early Replacement
This measure protocol applies to the installation of air receivers with pressure/flow controls to load/no load compressors. Load/no load compressors unload when there is low demand. The process of unloading is done over a period of time to avoid foaming of the lubrication oil. Using a storage tank with pressure/flow control will buffer the air demands on the compressor. Reducing the number of cycles in turn reduces the number of transition times from load to no load and saves energy479. The baseline equipment is a load/no load compressor with a 1 gal/cfm storage ratio or a modulating compressor with blowdown.
E L I G I B I L I T Y
This measure protocol applies to the installation of air receivers with pressure/flow controls to load/no load compressors. The high efficiency equipment is a load/no load compressor with a minimum storage ratio of 4 gallons of storage per cfm.
A L G O R I T H M S
kWh ¿ HP×0.746×HOURS×LF× LR❑
∆ kW peak ¿ kWhHOURS
×CF
D E F I N I T I O N O F T E R M S
478 DSMore Michigan Database. http://michigan.gov/mpsc/0,4639,7-159-52495_55129---,00.html 479 Based on market activity as reported by several compressed air equipment vendors. See “Compiled Data Request Results.xls”, Efficiency Vermont, Technical Reference Manual 2013-82 for details. http://www.greenmountainpower.com/upload/photos/371TRM_User_Manual_No_2013-82-5-protected.pdf
SECTION 2: Residential MeasuresMiscellaneous Page 506
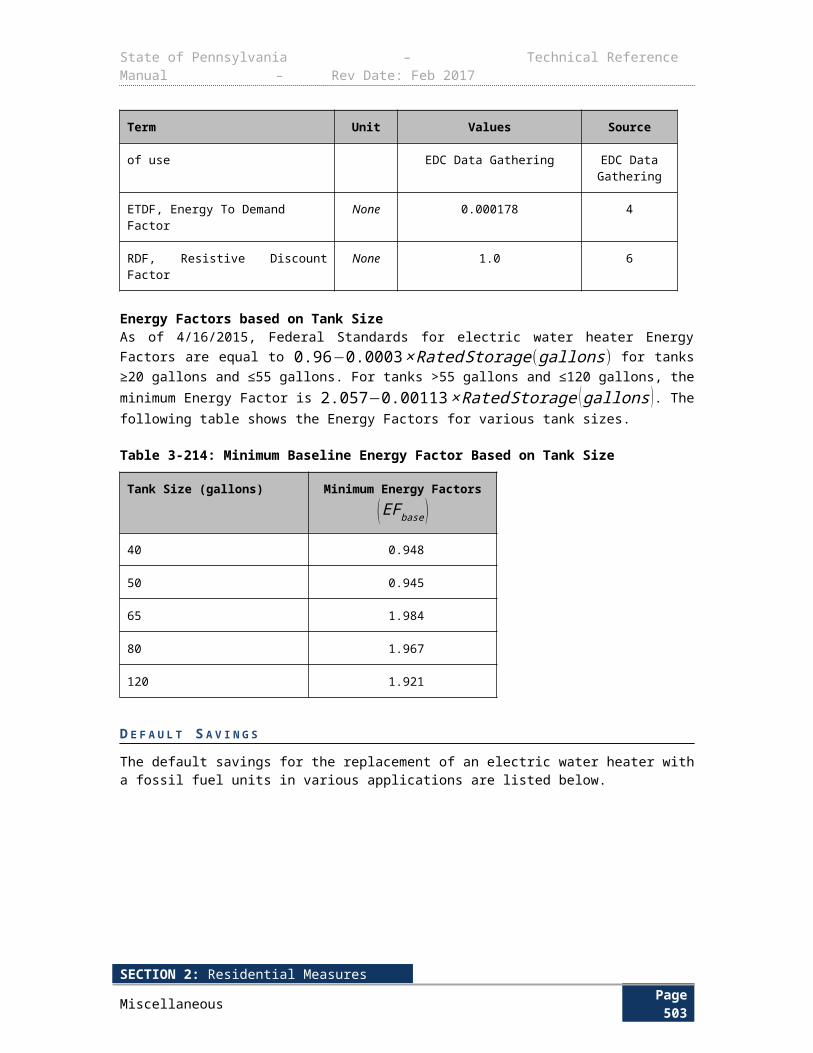
State of Pennsylvania – Technical Reference Manual – Rev Date: Feb 2017
Table 1-3-302: Assumptions for Air Tanks for Load/No Load Compressors
Term Unit Values Source
HP, horsepower of compressor motor hp Nameplate EDC Data Gathering
0.746, conversion factorkWhp
0.746 Conversion factor
HOURS, annual hours of compressor operation
hr
Based on logging, panel data or
modeling
EDC Data Gathering
Default: Table 3-303 1
LF , load factor, average load on compressor motor
Fraction Default = 0.92 2
LR, load reduction Fraction Default = 0.05 3, 4
, efficiency of compressor motor Fraction Default = 0.92 2
CF, coincidence factor FractionBased on logging, panel data or site contact interview
EDC Data Gathering
D E F A U L T S A V I N G S
Table 3-303: Annual Hours of Compressor Operation, HOURS
Motor Size (hp) HOURS
1-5 1,257
6-20 2,131
21-50 3,528
51-100 4,520
101-200 4,685
201-500 6,148
501-1000 6,156
1000+ 7,485
E V A L U A T I O N P R O T O C O L S
For most projects, the appropriate evaluation protocol is to verify installation and proper selection of default values. For projects using customer specific data for open variables, the appropriate evaluation protocol is to verify installation and proper application of TRM protocol along with verification of open variables. The Pennsylvania Evaluation Framework provides specific guidelines and requirements for evaluation procedures.
SECTION 2: Residential MeasuresMiscellaneous Page 507
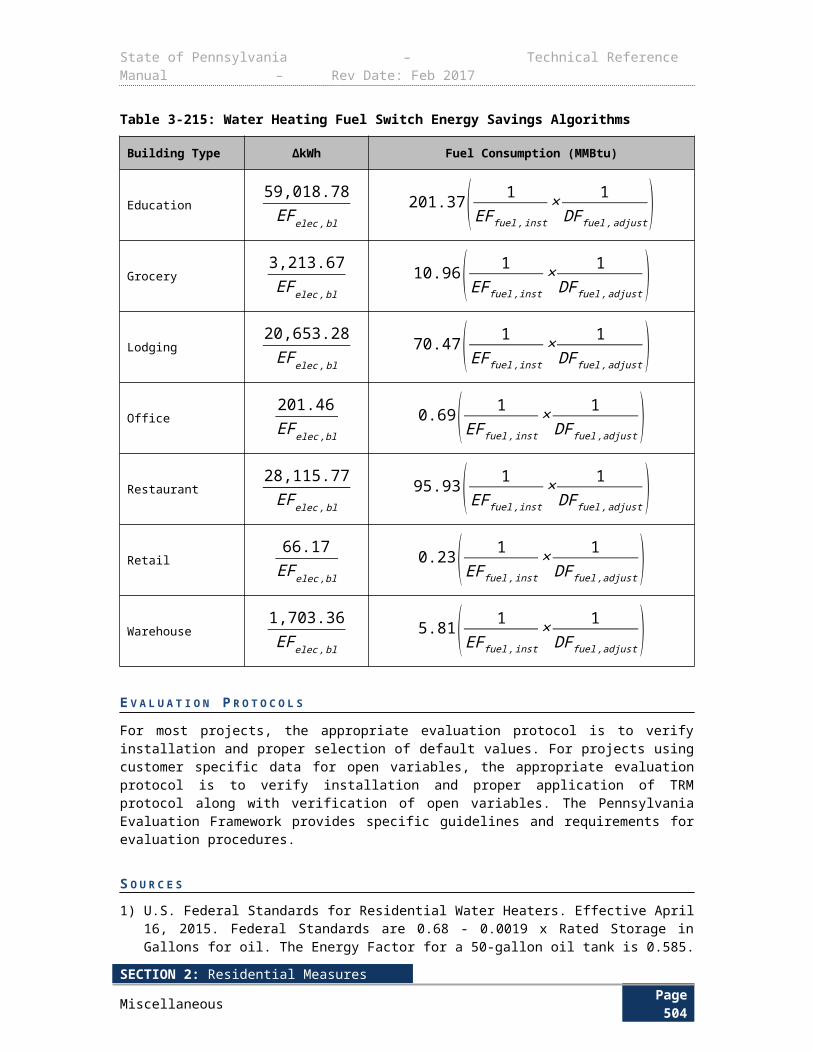
State of Pennsylvania – Technical Reference Manual – Rev Date: Feb 2017
S O U R C E S
1) US Department of Energy, Office of Energy Efficiency & Renewable Energy. United States Industrial Electric Motor Systems Market Opportunities Assessment. Dec 2002. Appendix B, air compressors. https://www1.eere.energy.gov/manufacturing/tech_assistance/pdfs/mtrmkt.pdf
2) Cascade Energy, Prepared for Regional Technical Forum. Standard Savings Estimation Protocol for Ultra-Premium Efficiency Motors. November 2012. Load factor for air compressors and average motor efficiency. http://rtf.nwcouncil.org/meetings/2012/11/Ultra-Premium%20Efficiency%20Motors%20Standard%20Protocol%20PROPOSED%2011-5-12.docx
3) United States Department of Energy, Office of Energy Efficiency & Renewable Energy. Improving Compressed Air System Performance, a Sourcebook for Industry. November 2003. Compressed air storage. https://www1.eere.energy.gov/manufacturing/tech_assistance/pdfs/compressed_air_sourcebook.pdf
4) United States Department of Energy, Office of Industrial Technologies. Compressed Air Systems Fact Sheet #4 - Pressure Drop and Controlling System Pressure. November 2003. https://www.compressedairchallenge.org/library/factsheets/factsheet04.pdf
SECTION 2: Residential MeasuresMiscellaneous Page 508
State of Pennsylvania – Technical Reference Manual – Rev Date: Feb 2017
3.11 MISCELLANEOUS3.11.1 ENERGY STAR SERVERS
Measure Name ENERGY STAR Servers
Target Sector Commercial and Industrial Establishments
Measure Unit Variable
Unit Energy Savings Variable
Unit Peak Demand Reduction Variable
Measure Life 4 years480
Measure Vintage Replace on Burnout
E L I G I B I L I T Y
This measure applies to the replacement of existing servers in a data center or server closet with new ENERGY STAR servers of similar computing capacity. On average, ENERGY STAR servers are 30% more efficient than standard servers. The servers operate particularly efficiently at low loads due to processor power management requirements that reduce power consumption when servers are idle.
A L G O R I T H M S 4 8 1
kW es ¿ ∑ES=1
n
kW es ,idle+[U es×(kW es, idle
b−kW es,idle)]
∆kWhyr
¿ [ 1(1−a)
−1]×kW es×8,760 hoursyear
∆ kW peak ¿ [ 1(1−a)
−1]×kW es
D E F I N I T I O N O F T E R M S
480 PA Consulting Group (2009). Business Programs: Measure Life Study. Prepared for State of Wisconsin Public Service Commission. https://focusonenergy.com/sites/default/files/bpmeasurelifestudyfinal_evaluationreport.pdf 481 Based on market activity as reported by several compressed air equipment vendors. See “Compiled Air Analysis.xls,” Efficiency Vermont TRM 2013 for details.
SECTION 2: Residential MeasuresMiscellaneous Page 509

State of Pennsylvania – Technical Reference Manual – Rev Date: Feb 2017
Table 3-304: ENERGY STAR Server Measure Assumptions
Term Unit Values Source
kW es ,idle , Power draw of ENERGY STAR server in idle mode
kW EDC Data Gathering 1
U es, utilization of ENERGY STAR server NoneEDC Data Gathering
Default: See Table 3-305
EDC Data Gathering
2,3,4
a, percentage ENERGY STAR server is more efficient than “standard” or “typical” unit
NoneFixed = 30% or most
current ENERGY STAR specification
5
b, ratio of idle power to full load power for an ENERGY STAR server
NoneEDC Data Gathering
Default: See Table 3-306
EDC Data Gathering
6
n, number of ENERGY STAR servers Servers EDC Data Gathering EDC Data Gathering
∆ kW peak, peak demand savings kW Calculated per algorithm 7
Table 3-305: ENERGY STAR Server Utilization Default Assumptions
Server Category Installed Processors
U es
(%)
A, B 1 15%
C, D 2 40%
Table 3-306: ENERGY STAR Server Ratio of Idle Power to Full Load Power Factors
Server Category Installed Processors Managed Server482Ratio of ES Idle/ES
Full Load (b)
A 1 No 52.1%
B 1 Yes 53.2%
C 2 No 61.3%
D 2 Yes 55.8%
D E F A U L T S A V I N G S
Default savings may be claimed using the algorithms above and the variable defaults. EDCs may also claim savings using customer specific data.
E V A L U A T I O N P R O T O C O L S
482 Ibid.
SECTION 2: Residential MeasuresMiscellaneous Page 510
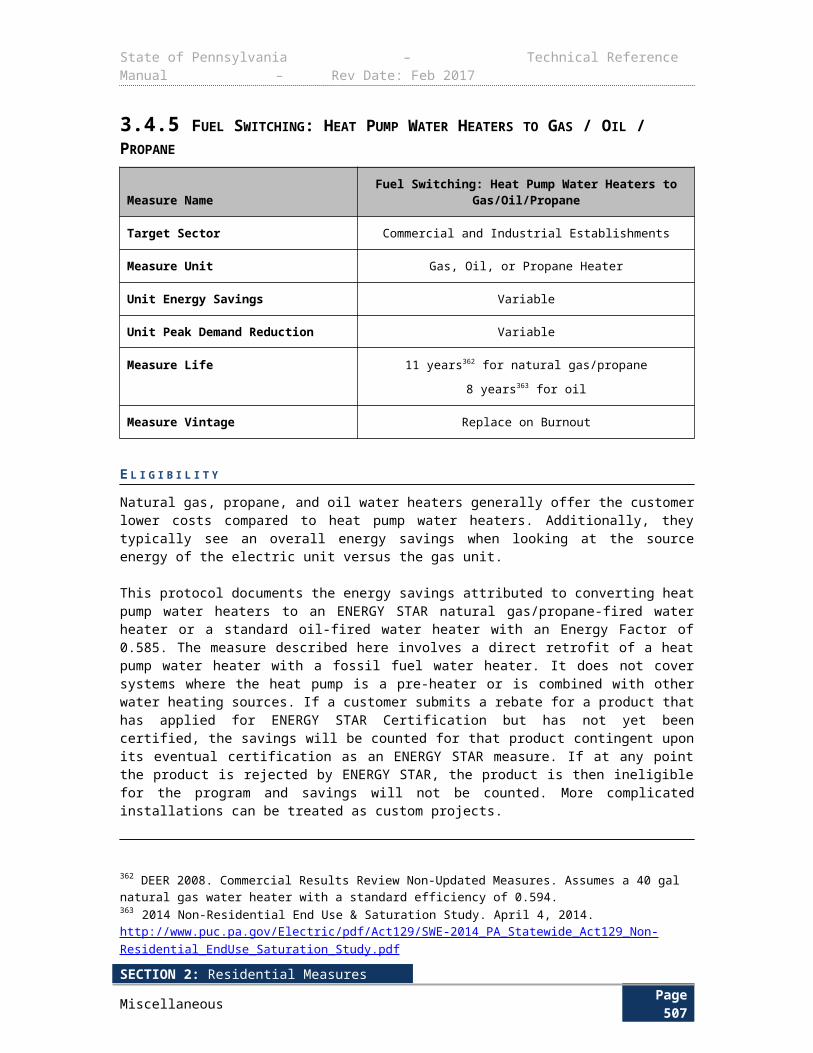
State of Pennsylvania – Technical Reference Manual – Rev Date: Feb 2017
When possible, perform M&V to assess the energy consumption. However, where metering of IT equipment in a data center is not allowed, follow the steps outlined.
Invoices should be checked to confirm the number and type of ENERGY STAR servers purchased.
If using their own estimate of active power draw, kW energy star, the manager should provide a week’s worth of active power draw data gathered from the uninterruptible power supply, PDUs, in-rack smart power strips, or the server itself.
Idle power draws of servers, kW es,idle , should be confirmed in the “Idle Power Typical or Single Configuration (W)” on the ENERGY STAR qualified product list483 .
If not using the default values listed in Table 3-305, utilization rates should be confirmed by examining the data center’s server performance software.
S O U R C E S
1) An ENERGY STAR qualified server has an “Idle Power Typical or Single Configuration (W)” listed in the qualified product list for servers. The EDC should use the server make and model number to obtain the kW es ,idle variable used in the algorithms. The ENERGY STAR qualified server list is located at here: http://www.energystar.gov/productfinder/product/certified-enterprise-servers/results .
2) Utilization of a server can be derived from a data center’s server performance software. This data should be used, instead of the default values listed in Table 3-306, when possible.
3) The estimated utilization of the ENERGY STAR server for servers with one processor was based on the average of two sources, as follows.
a) Glanz, James. Power Pollution and The Internet, The New York Times, September 22, 2012. This article cited to sources of average utilization rates between 6 to 12%.
b) Stakeholders interviewed during the development of the ENERGY STAR server specification reported that the average utilization rate for servers with 1 processor is approximately 20%.
4) The estimated utilization of the ENERGY STAR server for servers with two processor was based on the average of two sources, as follows.
c) Using Virtualization to Improve Data Center Efficiency, Green Grid White Paper, Editor: Richard Talaber, VMWare, 2009. A target of 50% server utilization is recommended when setting up a virtual host.
d) Stakeholders interviewed during the development of the ENERGY STAR server specification reported that the average utilization rate for servers with two processors is approximately 30%.
5) The default percentage savings on the ENERGY STAR server website was reported to be 30% on May 20th, 2014.
6) In December 2013, ENERGY STAR stopped including full load power data as a field in the ENERGY STAR certified product list. In order to full load power required in the Uniform Methods Project algorithm for energy efficient servers, a ratio of idle power to full load power was estimated. The idle to full load power ratios were estimated based on the ENERGY STAR qualified product list from November 18 th, 2013. The ratios listed in Table 3-306 are based on the average idle to full load ratios for all ENERGY STAR qualified servers in each server category.
483 PA Consulting Group (2009). Business Programs: Measure Life Study. Prepared for State of Wisconsin Public Service Commission. https://focusonenergy.com/sites/default/files/bpmeasurelifestudyfinal_evaluationreport.pdf.
SECTION 2: Residential MeasuresMiscellaneous Page 511
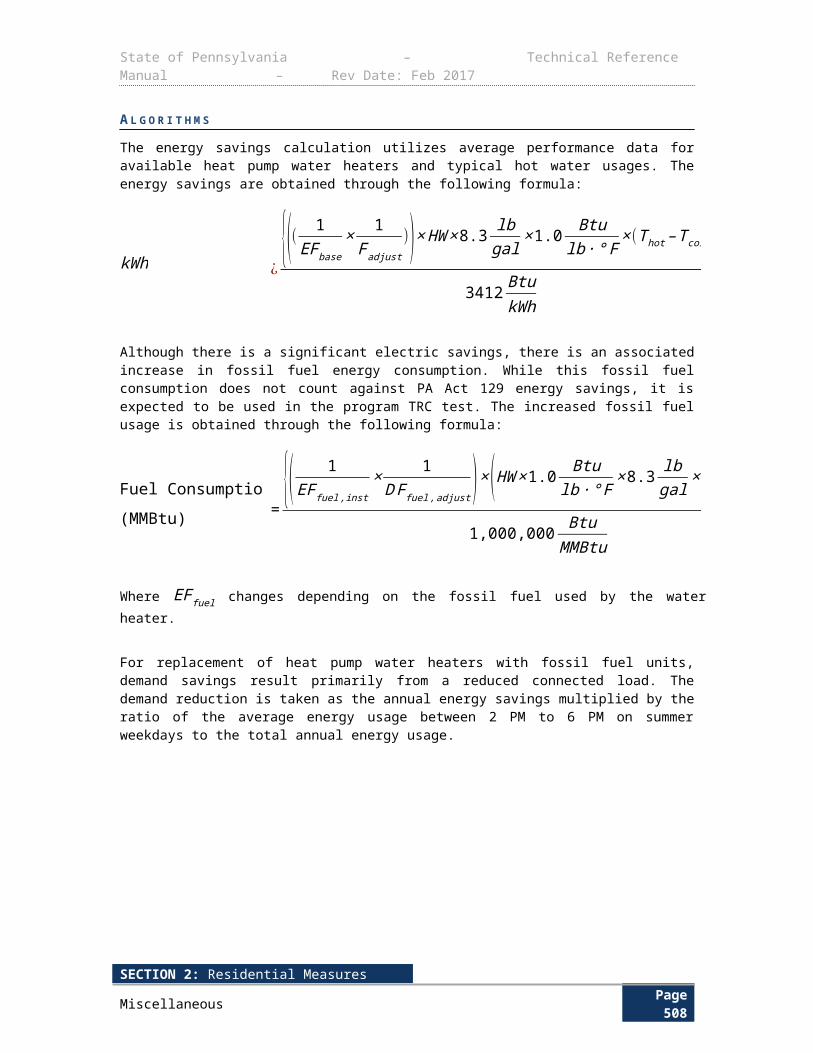
State of Pennsylvania – Technical Reference Manual – Rev Date: Feb 2017
7) The coincident peak demand factor was assumed to be 100% since the servers operate 24 hours per day, 365 days per year and the demand reduction associated with this measure is constant.
8) The three International Data Corporation (IDC) studies indicate organizations replace their servers once every three to five years
a. IDC (February 2012). “The Cost of Retaining Aging IT Infrastructure.” Sponsored by HP. Online. http://mjf.ie/wp-content/uploads/white-papers/IDC-White-Paper_the-cost-of-retaining-aging-IT-infrastructure.pdf
b. IDC (2010). “Strategies for Server Refresh.” Sponsored by Dell. Online. http://i.dell.com/sites/content/business/smb/sb360/en/Documents/server-refresh-strategies.pdf
c. DC (August 2012). “Analyst Connection: Server Refresh Cycles: The Costs of Extending Life Cycles.” Sponsored by HP/Intel. Online. http://resources.itworld.com/ccd/assets/31122/detaill
SECTION 2: Residential MeasuresMiscellaneous Page 512
State of Pennsylvania – Technical Reference Manual – Rev Date: Feb 2017
This Page Intentionally Left Blank
2016 TECHNICAL REFERENCE MANUALPage 513
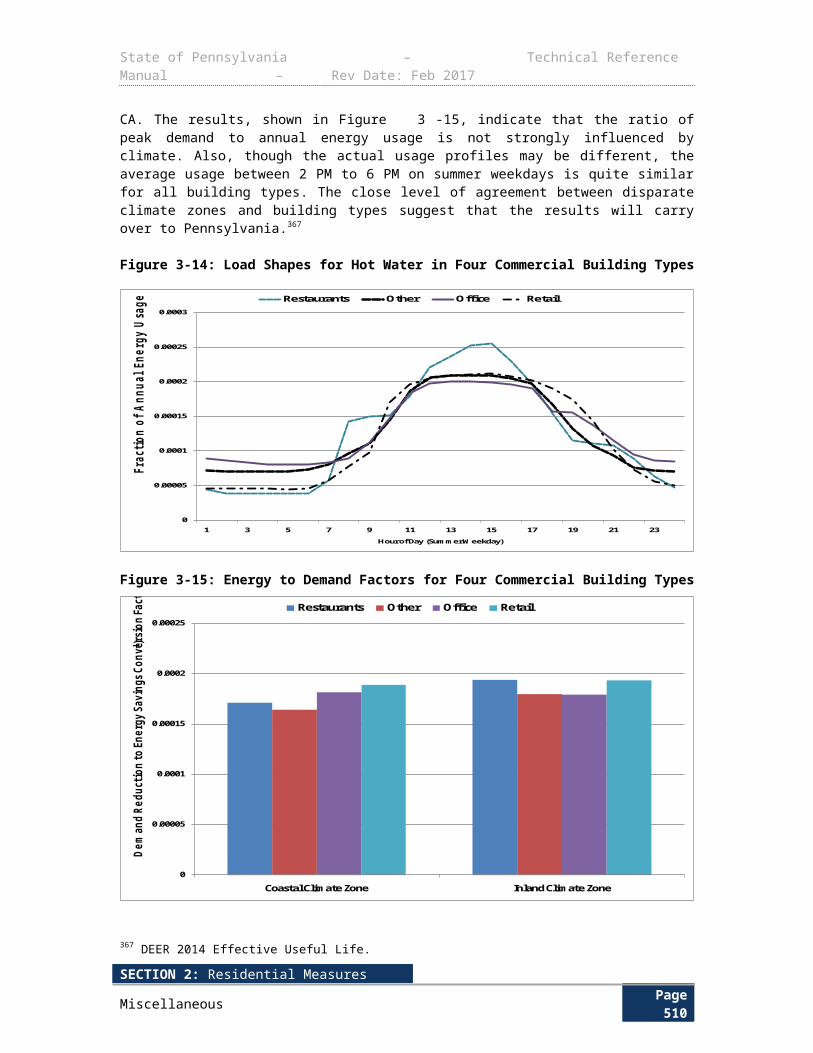
State of Pennsylvania – Technical Reference Manual – Rev Date: Feb 2017
4 AGRICULTURAL MEASURES The following section of the TRM contains savings protocols for agricultural measures that apply to both residential and commercial & industrial sector.
4.1 AGRICULTURAL 4.1.1 AUTOMATIC MILKER TAKEOFFS
Measure Name Automatic Milker Takeoffs
Target Sector Agriculture (includes Residential and Commercial)
Measure Unit Milker Takeoff System
Unit Energy Savings Variable
Unit Peak Demand Reduction Variable
Measure Life 10 years484
Measure Vintage Retrofit
E L I G I B I L I T Y
The following protocol for the calculation of energy and demand savings applies to the installation of automatic milker takeoffs on dairy milking vacuum pump systems. Automatic milker takeoffs shut off the suction on teats once a minimum flow rate is achieved. This reduces the load on the vacuum pump.
This measure requires the installation of automatic milker takeoffs to replace pre-existing manual takeoffs on dairy milking vacuum pump systems. Equipment with existing automatic milker takeoffs is not eligible. In addition, the vacuum pump system serving the impacted milking units must be equipped with a variable speed drive (VSD) to qualify for incentives. Without a VSD, little or no savings will be realized.
A L G O R I T H M S
The annual energy savings are obtained through the following formulas:
kWh ¿COWS×ESC
∆ kW peak ¿∆ kWh×CF
D E F I N I T I O N O F T E R M S
484 US Department of Energy, Office of Energy Efficiency & Renewable Energy (2004) . Compressed Air Tip Sheet #9: Energy Tips – Compressed Air. http://www.energy.gov/sites/prod/files/2014/05/f16/compressed_air9.pdf
SECTION 3: Commercial and Industrial MeasuresPage 514
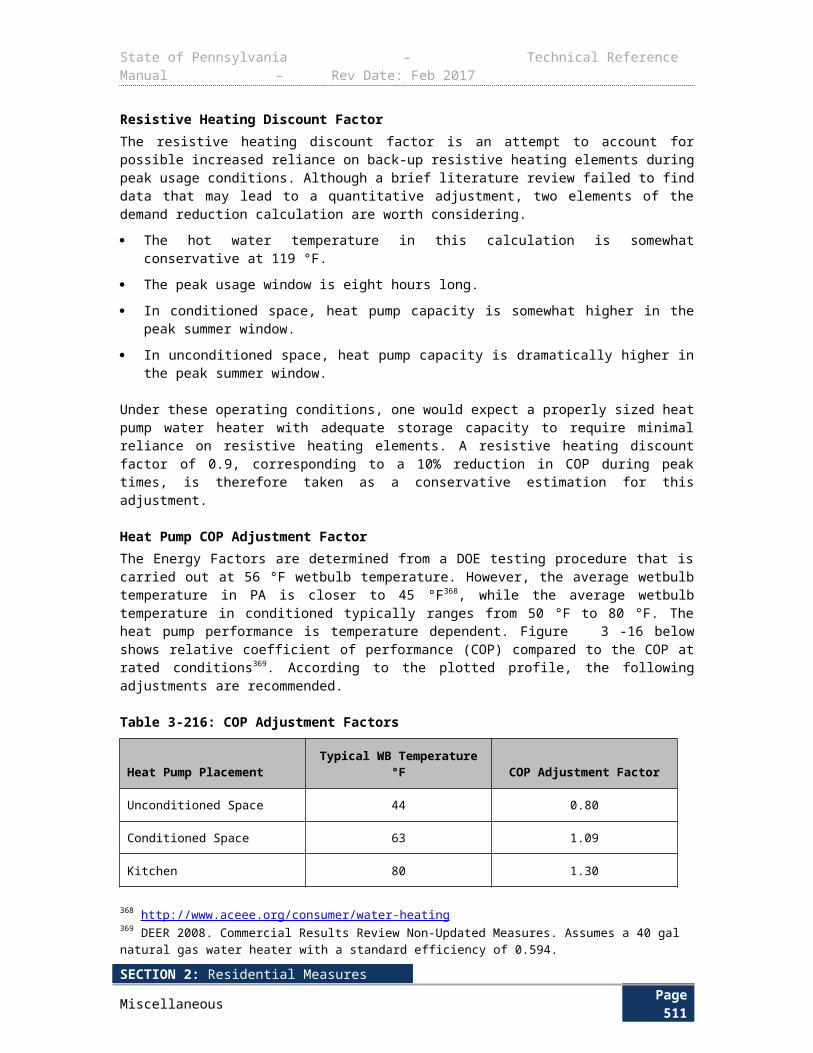
State of Pennsylvania – Technical Reference Manual – Rev Date: Feb 2017
Table 4-307: Variables for Automatic Milker Takeoffs
Term Unit Values Source
COWS, Number of cows milked per day
Cows Based on customer application
EDC Data Gathering
ESC , Energy Savings per cow per year
kWh∙ yrcow
7.5 1, 2, 3, 4, 5,6
CF, Demand Coincidence factor Decimal 0.00014 6
D E F A U L T S A V I N G S
There are no default savings for this protocol.
E V A L U A T I O N P R O T O C O L S For most projects, the appropriate evaluation protocol is to verify installation and proper selection of default values. For projects using customer specific data for open variables, the appropriate evaluation protocol is to verify installation and proper application of TRM protocol along with verification of open variables. The Pennsylvania Evaluation Framework provides specific guidelines and requirements for evaluation procedures.
S O U R C E S
1) The ESC was calculated based on the following assumptions:
a. Average herd size is 75 cows in PA (Source 2)
b. The typical dairy vacuum pump size for the average herd size is 10 horsepower
c. Based on the herd size, average pump operating hours are estimated at 8 hours per day (Source 4)
d. A 12.5% annual energy saving factor (Source 5)
2) David W. Kammel: “Dairy Modernization: Growing Pennsylvania Family Dairy Farms”, Biological Systems Engineering, University of Wisconsin. http://www.padairysummit.org/_files/live/Dairy_Modernization_PA_Program_2014_Final.pdf
3) Average dairy vacuum pump size was estimated based on the Minnesota Dairy Project literature. http://www.mnproject.org/resourcecenter/Vacuum%20System%20options.pdf
4) Annual pump operating hours is based on the assumption that 15-20 cows are milked per hour and two milkings occur per day.
5) Savings are based on the assumption that automatic milker take-offs eliminate open vacuum pump time associated with milker take-offs separating from the cow or falling off during the milking process. The following conservative assumptions were made to determine energy savings associated with the automatic milker take-offs:
e. There is 30 seconds of open vacuum pump time for every 8 cows milked.
SECTION 3: Commercial and Industrial MeasuresPage 515
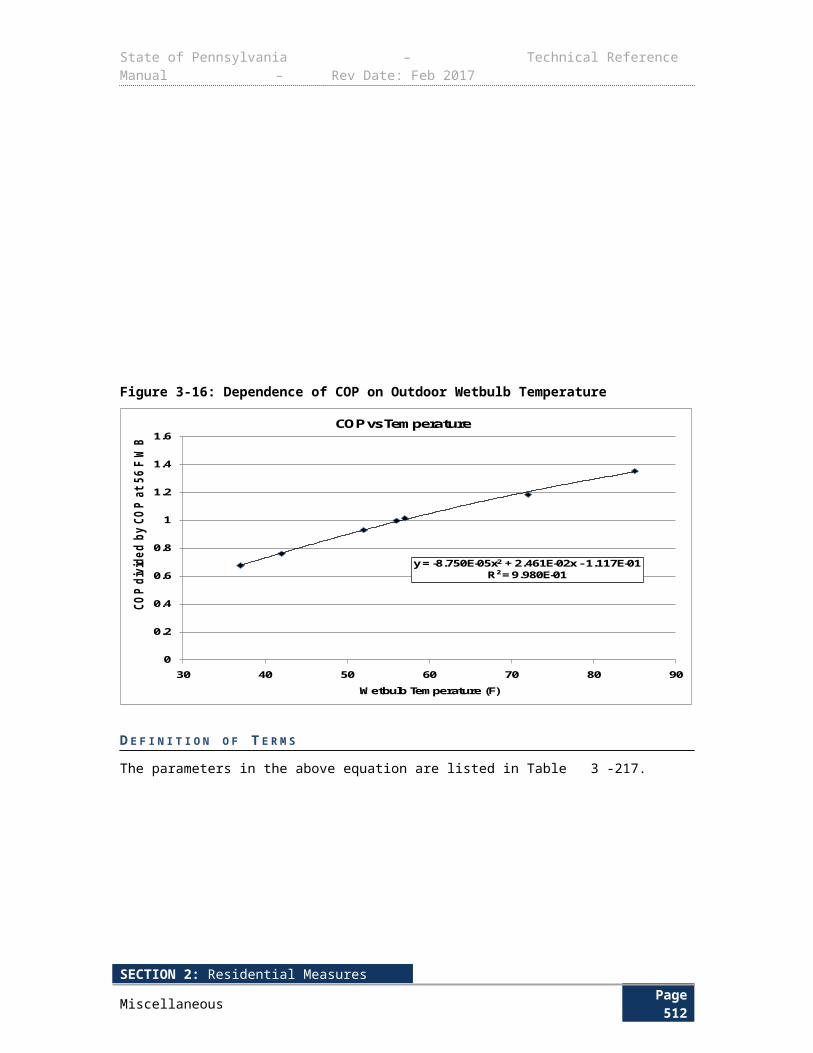
State of Pennsylvania – Technical Reference Manual – Rev Date: Feb 2017
f. The vacuum pump has the ability to turn down during these open-vacuum pump times from a 90% VFD speed to a 40% VFD speed.
g. Additionally, several case studies from the Minnesota Dairy Project include dairy pump VFD and automatic milker take-off energy savings that are estimated at 50-70% pump savings. It is assumed that the pump VFD savings are 46%, therefore the average remaining savings can be attributed to automatic milker take-offs. http://www.mnproject.org/resourcecenter/Vacuum%20System%20options.pdf
6) Regional Technical Forum (RTF) as part of the Northwest Power & Conservation Council, Deemed Measures List. Agricultural: Variable Frequency Drives-Dairy, FY2012, V1.2. Accessed from RTF website http://rtf.nwcouncil.org/measures/Default.asp on February 27, 2013.
SECTION 3: Commercial and Industrial MeasuresPage 516

State of Pennsylvania – Technical Reference Manual – Rev Date: Feb 2017
4.1.2 DAIRY SCROLL COMPRESSORS
Measure Name Dairy Scroll Compressors
Target Sector Agriculture (includes Residential and Commercial)
Measure Unit Compressor
Unit Energy Savings Variable
Unit Peak Demand Reduction Variable
Measure Life 15 years485
Measure Vintage Replace on Burnout or New Construction
E L I G I B I L I T Y
The following protocol for the calculation of energy and demand savings applies to the installation of a scroll compressor to replace an existing reciprocating compressor or the installation of a scroll compressor in a new construction application. The compressor is used to cool milk for preservation and packaging. The energy and demand savings per cow will depend on the installed scroll compressor energy efficiency ratio (EER), operating days per year, and the presence of a precooler in the refrigeration system.
This measure requires the installation of a scroll compressor to replace an existing reciprocating compressor or to be installed in a new construction application. Existing farms replacing scroll compressors are not eligible.
A L G O R I T H M S
The energy and peak demand savings are dependent on the presence of a precooler in the system, and are obtained through the following formulas:
kWh ¿( CBTUEERbase−CBTUEERee )× 1 ∙ kW
1000∙W × DAYS×COWS
∆ kW peak ¿∆ kWh×CF
D E F I N I T I O N O F T E R M S
485 The three International Data Corporation (IDC) studies indicate organizations replace their servers once every three to five years(Source 8)
SECTION 3: Commercial and Industrial MeasuresPage 517
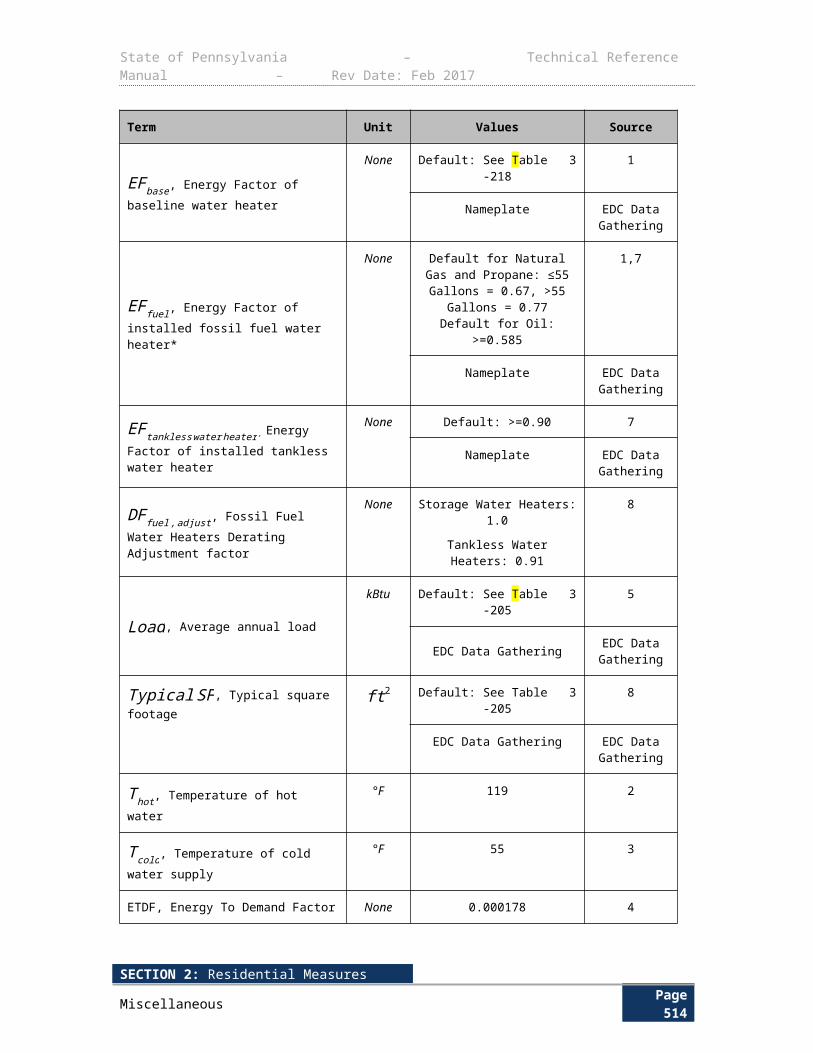
State of Pennsylvania – Technical Reference Manual – Rev Date: Feb 2017
Table 4-308: Variables for Dairy Scroll Compressors
Term Unit Values Source
EERbase, Baseline compressor efficiency
Btuhr ∙W
Baseline compressor manufacturers data
based upon customer application
EDC Data Gathering
Default: 5.85 1
EERee, Installed compressor efficiency
Btuhr ∙W
From nameplate EDC Data Gathering
CBTU , Heat load of milk per cow per day for a given refrigeration system
BtuCow∙day
System without precooler: 2,864
System with precooler: 922
2, 3
DAYS, Milking days per year DaysBased on customer
applicationEDC Data Gathering
Default: 365 days/year 3, 4
COWS, Average number of cows milked per day
Cows Based on customer application
EDC Data Gathering
CF, Demand Coincidence factor Decimal 0.00014 5
D E F A U L T S A V I N G S
There are no default savings for this measure.
E V A L U A T I O N P R O T O C O L S
For most projects, the appropriate evaluation protocol is to verify installation and proper selection of default values. For projects using customer specific data for open variables, the appropriate evaluation protocol is to verify installation and proper application of TRM protocol along with verification of open variables. The Pennsylvania Evaluation Framework provides specific guidelines and requirements for evaluation procedures.
S O U R C E S
1) Based on the average EER data for a variety of reciprocating compressors from Emerson Climate Technologies. http://www.emersonclimate.com/en-us/Pages/default.aspx
2) Based on a specific heat value of 0.93 Btulb∙℉ and density of 8.7 lb/gallon for whole milk.
American Society of Heating Refrigeration and Air-conditioning Engineers Refrigeration Handbook, 2010, Ch.19.5.
3) Based on delta T (temperature difference between the milk leaving the cow and the cooled milk in tank storage) of 59 °F for a system with no pre-cooler and 19 °F for a system with a pre-cooler. It was also assumed that an average cow produces 6 gallons of milk per day. KEMA 2009 Evaluation of IPL Energy Efficiency Programs, Appendix F, pg. 347. http://alliantenergy.com/wcm/groups/wcm_internet/@int/documents/document/mdaw/mdey/~edisp/012895.pdf
SECTION 3: Commercial and Industrial MeasuresPage 518
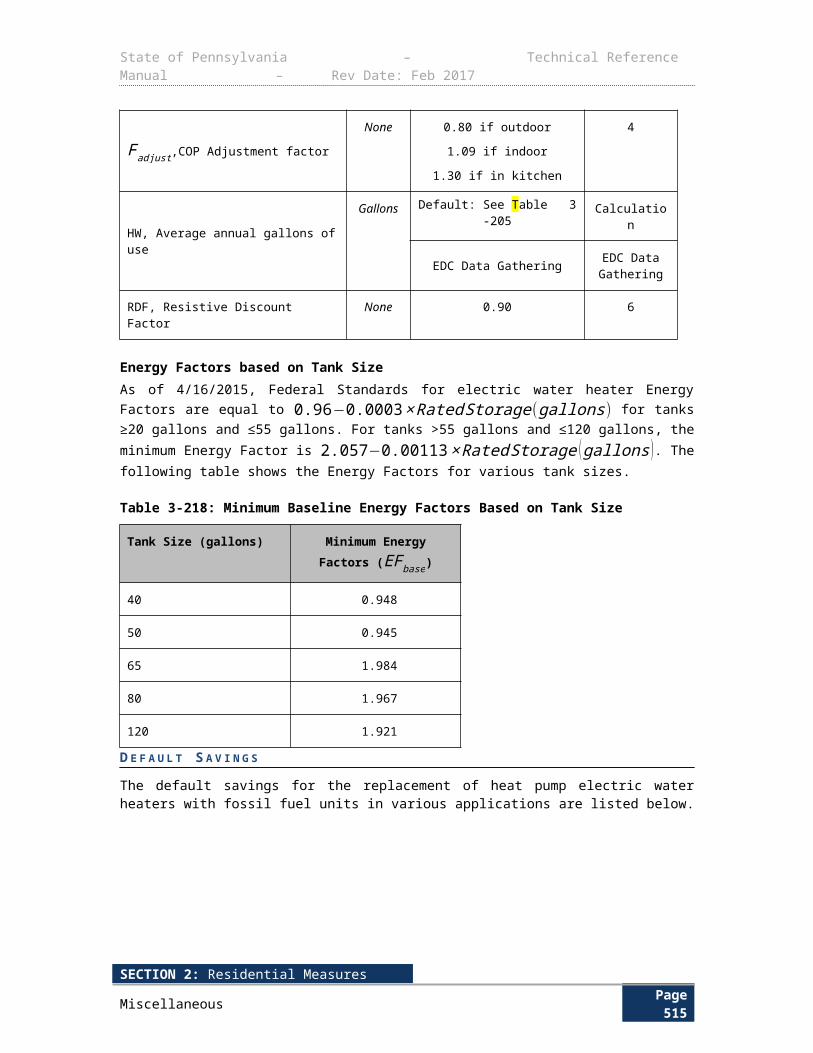
State of Pennsylvania – Technical Reference Manual – Rev Date: Feb 2017
4) Based on typical dairy parlor operating hours referenced for agriculture measures in California. California Public Utility Commission. Database for Energy Efficiency Resources (DEER) 2005. The DEER database assumes 20 hours of operation per day, but is based on much larger dairy farms (e.g. herd sizes > 300 cows). Therefore, the DEER default value was lowered to 8 hours per day, as the average herd size is 75 cows in Pennsylvania.
5) Regional Technical Forum (RTF) as part of the Northwest Power & Conservation Council, Deemed Measures List. Agricultural: Variable Frequency Drives-Dairy, FY2012, V1.2. Accessed from RTF website http://rtf.nwcouncil.org/measures/Default.asp on February 27, 2013.
SECTION 3: Commercial and Industrial MeasuresPage 519
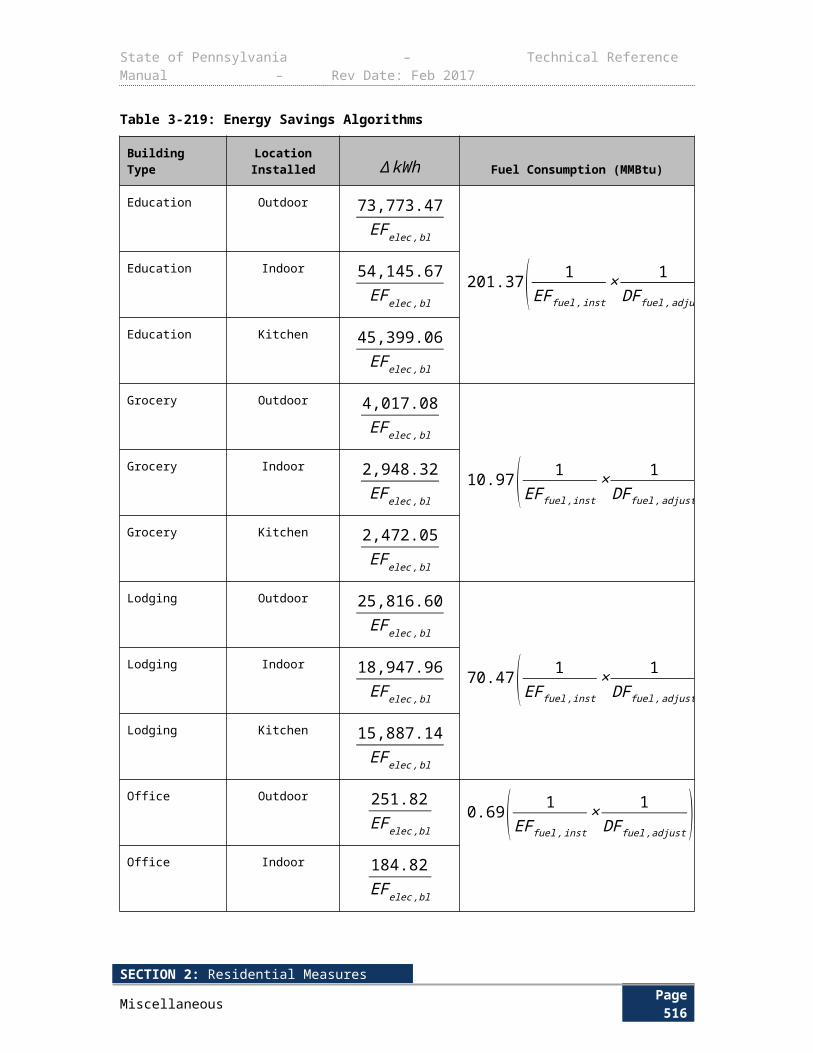
State of Pennsylvania – Technical Reference Manual – Rev Date: Feb 2017
4.1.3 HIGH EFFICIENCY VENTILATION FANS WITH AND WITHOUT THERMOSTATS
Measure Name High Efficiency Ventilation Fans with and without Thermostats
Target Sector Agriculture (includes Residential and Commercial)
Measure Unit Fan
Unit Energy Savings Variable
Unit Peak Demand Reduction Variable
Measure Life 10 years486
Measure Vintage Replace on Burnout or New Construction
E L I G I B I L I T Y
The following protocol for the calculation of energy and demand savings applies to the installation of high efficiency ventilation fans to replace standard efficiency ventilation fans or the installation of a high efficiency ventilation fans in a new construction application. The high efficiency fans move more cubic feet of air per watt compared to standard efficiency ventilation fans. Adding a thermostat control will reduce the number of hours that the ventilation fans operate. This protocol does not apply to circulation fans.
This protocol applies to: (1) the installation of high efficiency ventilation fans in either new construction or retrofit applications where standard efficiency ventilation fans are replaced, and/or (2) the installation of a thermostat controlling either new efficient fans or existing fans. Default values are provided for dairy and swine applications. Other facility types are eligible; however, data must be collected for all default values.
A L G O R I T H M S
The annual energy savings are obtained through the following formulas:
kWhfan ¿Qtystd×( 1Eff std )×CFM ×hours× 1
1,000−Qtyhigh×( 1Eff high )×CFM ×hours × 1
1,000
kWhtstat ¿( 1Eff installed )×CFM ×hourststat×
11,000
kWh¿t al ¿∆ kWhfan+∆kWhtstat
∆ kW peak ¿∆ kWhfan×CF
D E F I N I T I O N O F T E R M S
486 The energy consumption and savings algorithms represented in this section were derived from the Uniform Methods Project: Methods for Determining Energy-Efficiency Savings for Specific Measures, Draft Data Center IT Measures, 2013.
SECTION 3: Commercial and Industrial MeasuresPage 520
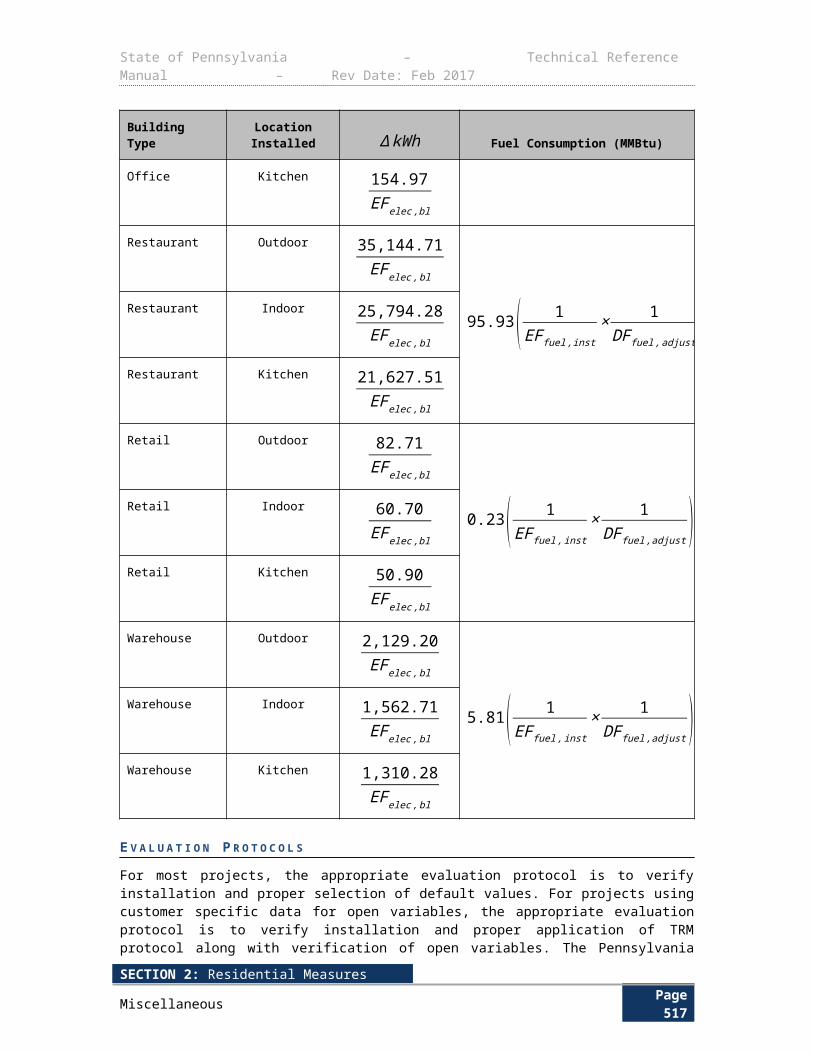
State of Pennsylvania – Technical Reference Manual – Rev Date: Feb 2017
Table 4-309: Variables for Ventilation Fans
Term Unit Values Source
Qtystd, Quantity of the standard efficiency fans
NoneBased on customer
applicationEDC Data Gathering
Qtyhigh, Quantity of high efficiency fans that were installed
NoneBased on customer
applicationEDC Data Gathering
Eff std, Efficiency of the standard efficiency fan at a static pressure of 0.1 inches water
cfmW
Based on customer application
EDC Data Gathering
Default values in Table 4-310 1
Eff high, Efficiency of the high efficiency fan at a static pressure of 0.1 inches water
cfmW
Based on customer application.
EDC Data Gathering, 2, 3
Default values in Table 4-310 1, 2, 3
Eff installed, Efficiency at a static pressure of 0.1 inches water for the installed fans controlled by the thermostat
cfmW
Based on customer application.
EDC Data Gathering, 2, 3
Default values in Table 4-310. If fans were not
replaced, use the default values forEff std. If fans were
replaced, use the default values for Eff high.
1, 2, 3
hours, operating hours per year of the fan without thermostat
Hours
Based on customer application
EDC Data Gathering
Default use values in Table4-311 1, 4
CFM , cubic feet per minute of air movement
ft3
min
Based on customer application. This can vary for pre- and post-installation if the information is known for
the pre-installation case.
EDC Data Gathering
Default values in Table 4-310 1
hours tstat, reduction in operating hours of the fan due to the thermostat
Hours Default values in Table 4-312 4
1,000, watts per kilowattwattskilowatt
1,000 Conversion Factor
CF , demand coincidence factor Decimal 0.000197 Engineering calculations
SECTION 3: Commercial and Industrial MeasuresPage 521
State of Pennsylvania – Technical Reference Manual – Rev Date: Feb 2017
Table 4-310: Default values for standard and high efficiency ventilation fans for dairy and swine facilities
Fan Size (inches)
High Efficiency Fan
(cfm/W at 0.1 inches water)
Standard Efficiency Fan
(cfm/W at 0.1 inches water) CFM
14-23 12.4 9.2 3,600
24-35 15.3 11.2 6,274
36-47 19.2 15.0 10,837
48 - 61 22.7 17.8 22,626
Table 4-311. Default Hours for Ventilation Fans by Facility Type by Location (No Thermostat)
Facility TypeAllentow
n ErieHarrisbur
gPhiladelphi
aPittsburg
hScranto
nWilliamspo
rt
Dairy - Stall Barn 5,071 4,807 5,163 5,390 5,010 4,843 5,020
Dairy – Free-Stall or Cross-Ventilated Barn 3,299 2,984 3,436 3,732 3,231 2,985 3,241
Hog Nursery or Sow House
5,864
Hog Finishing House 4,729
Table 4-312. Default Hours Reduced by Thermostats by Facility Type and Location
Facility TypeAllentow
n ErieHarrisbur
gPhiladelphi
aPittsburg
hScranto
nWilliamspor
t
Dairy - Stall Barn 3,457
3,458 3,367 3,285 3,441 3,594 3,448
Dairy – Free-Stall or Cross-Ventilated Barn 1,685
1,635 1,640 1,627 1,662 1,736 1,669
Hog Nursery or Sow House 2,629
2,985 2,323 2,179 2,732 2,885 2,666
Hog Finishing House* 0 0 0 0 0 0 0
* Hog finishing house ventilation needs are based on humidity; therefore a thermostat will not reduce the number of hours the fans operate.
SECTION 3: Commercial and Industrial MeasuresPage 522
State of Pennsylvania – Technical Reference Manual – Rev Date: Feb 2017
D E F A U L T S A V I N G S
There are no default savings for this measure.
E V A L U A T I O N P R O T O C O L S For most projects, the appropriate evaluation protocol is to verify installation and proper selection of default values. For projects using customer specific data for open variables, the appropriate evaluation protocol is to verify installation and proper application of TRM protocol along with verification of open variables. The Pennsylvania Evaluation Framework provides specific guidelines and requirements for evaluation procedures.
S O U R C E S
1) KEMA. 2009 Evaluation of IPL Energy Efficiency Programs, Appendix F, 2008. See Table H-5. http://alliantenergy.com/wcm/groups/wcm_internet/@int/documents/document/mdaw/mdey/~edisp/012895.pdf
2) Pennsylvania State University. Tunnel Ventilation for Tie Stall Dairy Barns. 2004. Downloaded from http://pubs.cas.psu.edu/freepubs/pdfs/g78.pdf. Static pressure reference point for dairy barns comes from page 3. The recommended static pressure is 0.125 to 0.1 inches water
3) Iowa State University. Mechanical Ventilation Design Worksheet for Swine Housing. 1999. Downloaded from http://www.extension.iastate.edu/Publications/PM1780.pdf. Static pressure reference point for swine housing comes from page 2. The recommended static pressure is 0.125 to 0.1 inches water for winter fans and 0.05 to 0.08 inches water for summer fans. A static pressure of 0.1 inches water was assumed for dairy barns and swine houses as it is a midpoint for the recommended values.
4) Based on the methodology in KEMA’s evaluation of the Alliant Energy Agriculture Program (Source 1). Updated the hours for dairies and thermostats using TMY3 temperature data for PA, as fan run time is dependent on ambient dry-bulb temperature. For a stall barn, it was assumed 33% of fans are on 8,760 hours per year, 67% of fans are on when the temperature is above 50 degrees Fahrenheit, and 100% of the fans are on when the temperature is above 70 degrees Fahrenheit. For a cross-ventilated or free-stall barn, it was assumed 10% of fans are on 8,760 hours per year, 40% of fans are on when the temperature is above 50 degrees Fahrenheit, and 100% of the fans are on when the temperature is above 70 degrees Fahrenheit. The hours for hog facilities are based on humidity. These hours were not updated as the methodology and temperatures for determining these hours was not described in KEMA’s evaluation report and could not be found elsewhere. However, Pennsylvania and Iowa are in the same ASHRAE climate zone (5A) and so the Iowa hours provide a good estimate for hog facilities in Pennsylvania.
SECTION 3: Commercial and Industrial MeasuresPage 523
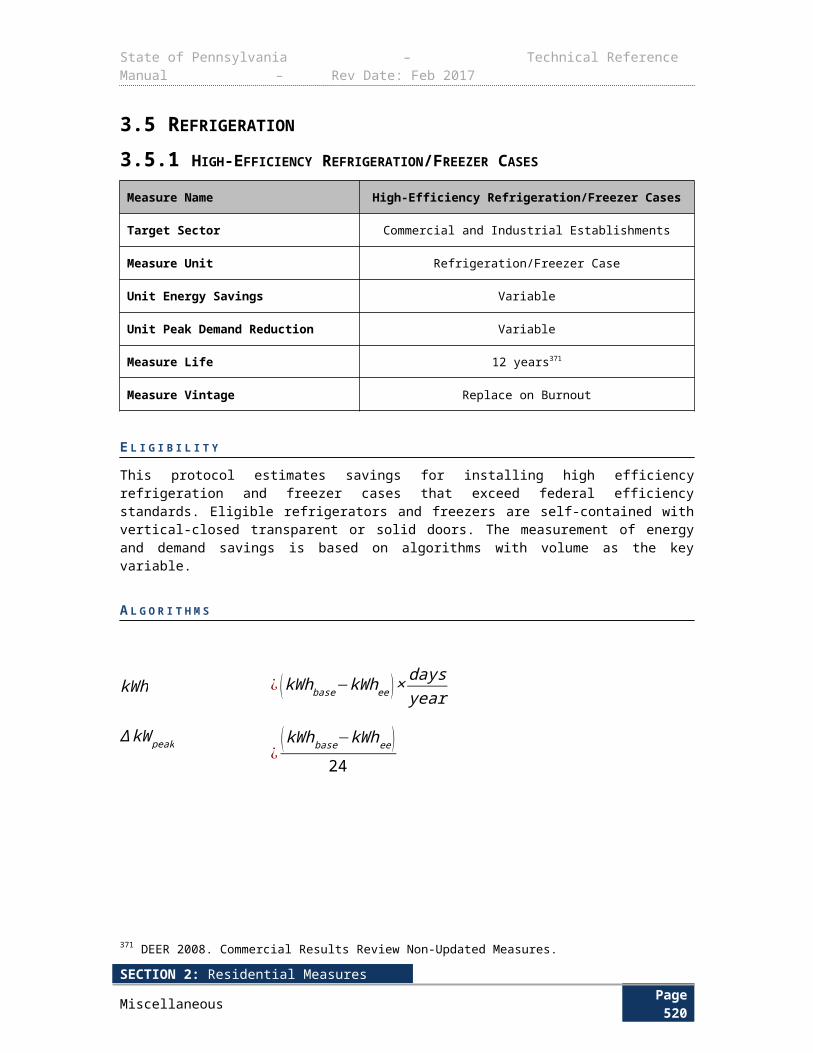
State of Pennsylvania – Technical Reference Manual – Rev Date: Feb 2017
4.1.4 HEAT RECLAIMERS
Measure Name Heat Reclaimers
Target Sector Agriculture (includes Residential and Commercial)
Measure Unit Heat Reclaimer
Unit Energy Savings Variable
Unit Peak Demand Reduction Variable
Measure Life 15 years487
Measure Vintage Replace on Burnout or New Construction
E L I G I B I L I T Y
The following protocol for the calculation of energy and demand savings applies to the installation of heat recovery equipment on dairy parlor milk refrigeration systems. The heat reclaimers recover heat from the refrigeration system and use it to pre-heat water used for sanitation, sterilization and cow washing.
This measure requires the installation of heat recovery equipment on dairy parlor milk refrigeration systems to heat hot water. This measure only applies to dairy parlors with electric water heating equipment.
The equipment installed must be one of the following pre-approved brands or equivalent: Century-Therm, Fre-Heater, Heat Bank, Sunset, Superheater, or Therma-Stor.
A L G O R I T H M S
The energy and peak demand savings are dependent on the presence of a precooler in the refrigeration system, and are obtained through the following formulas:
kWh ¿ ESηwater heater
×DAYS×COWS×HEF
∆ kW peak ¿∆ kWh×CF
487 Managed Server: A computer server that is designed for a high level of availability in a highly managed environment. For purposes of this specification, a managed server must meet all of the following criteria (from ENERGY STAR server specification 2.0):
A. is designed to be configured with redundant power supplies; andB. contains an installed dedicated management controller (e.g., service processor).
SECTION 3: Commercial and Industrial MeasuresPage 524
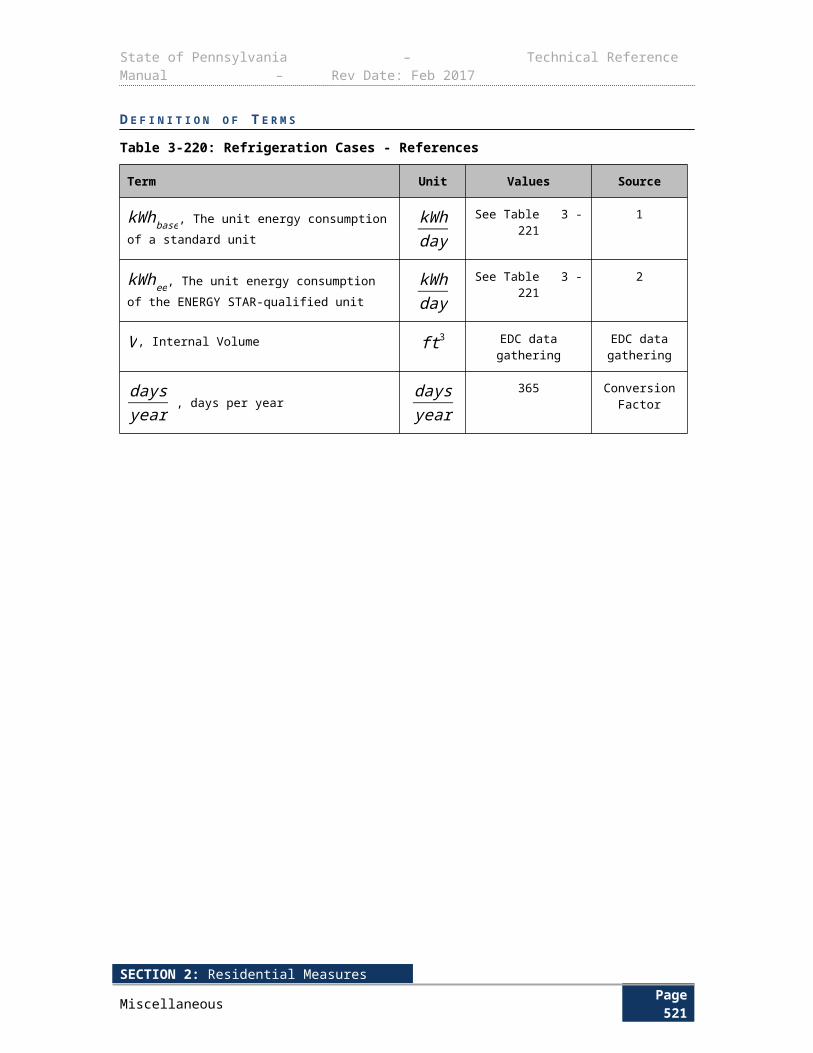
State of Pennsylvania – Technical Reference Manual – Rev Date: Feb 2017
D E F I N I T I O N O F T E R M S
Table 4-313: Variables for Heat Reclaimers
Term Unit Values Source
ES , Energy savings for specified systemkWh
cow ∙day
System with precooler: 0.29
System without precooler: 0.38
1,2
DAYS, Milking days per yeardaysyear
Based on customer application
EDC Data Gathering
Default: 365 2
COWS, Average number of cows milked per day
Cows Based on customer application
EDC Data Gathering
HEF , Heating element factor None
Heat reclaimers with no back-up heat =
1.0
Heat reclaimers with back-up heating elements = 0.50
3
ηwaterheater, Electric water heater efficiency None
Standard electric tank water heater =
0.908
High efficiency electric tank water
heater = 0.93
Heat pump water heater = 2.0
4, 5
CF, Demand Coincidence factor Decimal 0.00014 6
D E F A U L T S A V I N G S
There are no default savings for this measure.
E V A L U A T I O N P R O T O C O L S
For most projects, the appropriate evaluation protocol is to verify installation and proper selection of default values. For projects using customer specific data for open variables, the appropriate evaluation protocol is to verify installation and proper application of TRM protocol along with verification of open variables. The Pennsylvania Evaluation Framework provides specific guidelines and requirements for evaluation procedures.
SECTION 3: Commercial and Industrial MeasuresPage 525
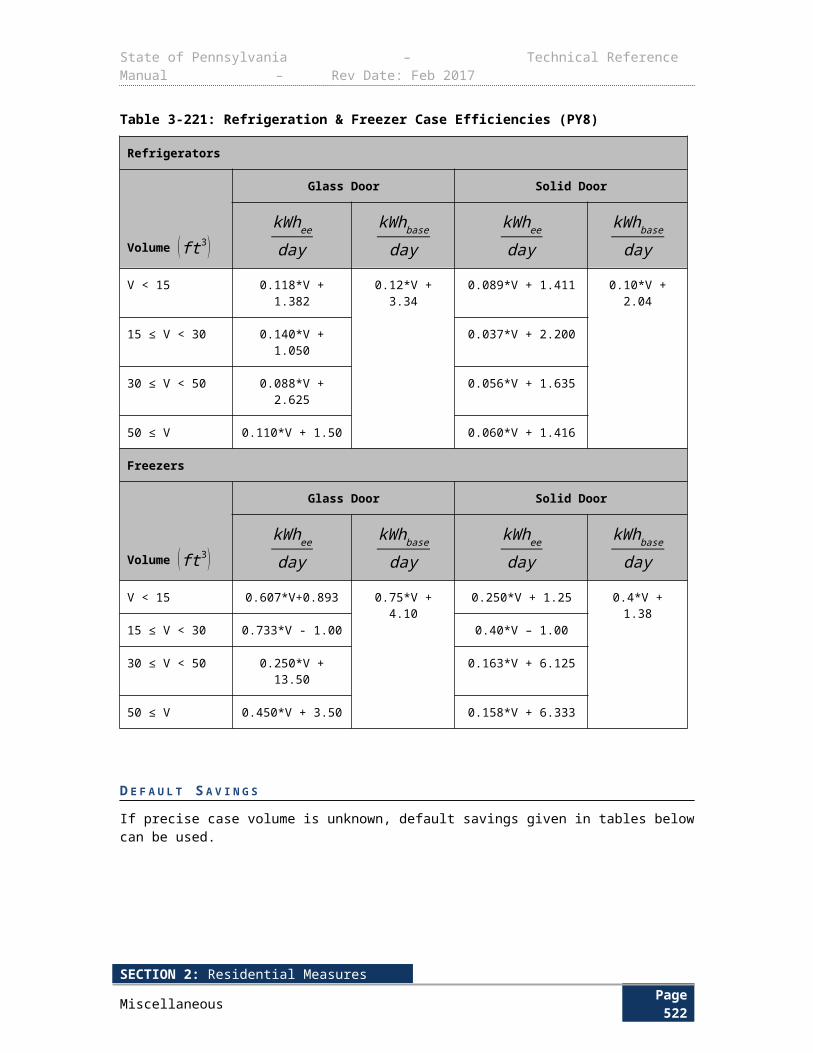
State of Pennsylvania – Technical Reference Manual – Rev Date: Feb 2017
S O U R C E S
1) Based on a specific heat value of 0.93 Btu/lb deg F and density of 8.7 lb/gallon for whole milk. American Society of Heating Refrigeration and Air-conditioning Engineers Refrigeration Handbook, 2010, Ch.19.5.
2) Based on a delta T (temperature difference between the milk leaving the cow and the cooled milk in tank storage) of 59°F for a system without a pre-cooler and 19°F for a system with a pre-cooler. It was also assumed that a cow produces 6 gallons of milk per day (based on two milkings per day), requires 2.2 gallons of hot water per day, and the water heater delta T (between ground water and hot water) is 70°F. Evaluation of Alliant Energy Agriculture Program, Appendix F, 2008. http://alliantenergy.com/wcm/groups/wcm_internet/@int/documents/document/mdaw/mdey/~edisp/012895.pdf
3) Some smaller dairy farms may not have enough space for an additional water storage tank, and will opt to install a heat reclaimer with a back-up electric resistance element. The HEF used in the savings algorithm is a conservative savings de-ration factor to account for the presence of back-up electric resistance heat. The HEF is based on the assumption that the electric resistance element in a heat reclaimer will increase the incoming ground water temperature by 40-50 °F before the water is heated by the heat reclaim coil.
4) Standard water heater based on minimum electric water heater efficiencies defined in Table 504.2 of the 2009 International Energy Conservation Code (IECC). High efficiency water heater based on water heater efficiencies defined in Table 3-216: COP Adjustment Factors of the TRM. https://law.resource.org/pub/us/code/ibr/icc.iecc.2009.pdf
5) Based on minimum heat pump water efficiencies defined by ENERGY STAR, 2009. https://www.energystar.gov/index.cfm?fuseaction=find_a_product.showProductGroup&pgw_code=WHH
6) Regional Technical Forum (RTF) as part of the Northwest Power & Conservation Council, Deemed Measures List. Agricultural: Variable Frequency Drives-Dairy, FY2012, V1.2. Accessed from RTF website http://rtf.nwcouncil.org/measures/Default.asp on February 27, 2013.
SECTION 3: Commercial and Industrial MeasuresPage 526
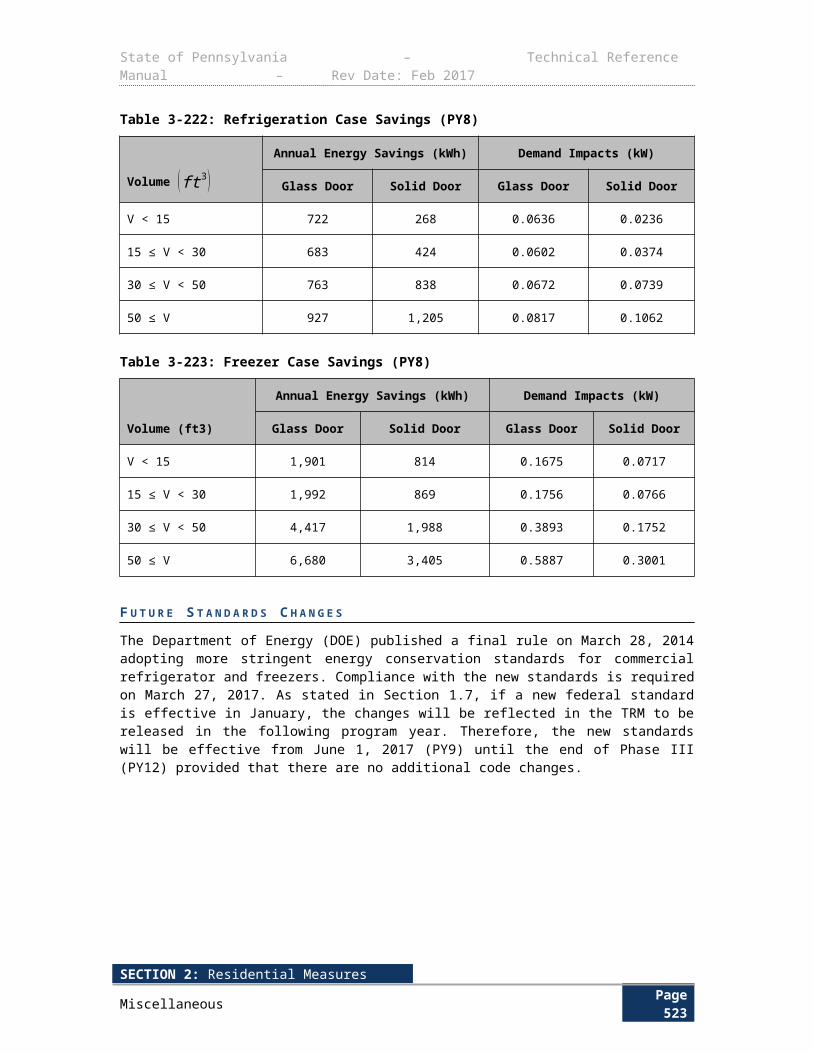
State of Pennsylvania – Technical Reference Manual – Rev Date: Feb 2017
4.1.5 HIGH VOLUME LOW SPEED FANS
Measure Name High Volume Low Speed Fans
Target Sector Agriculture (includes Residential and Commercial)
Measure Unit Fan
Unit Energy Savings Variable
Unit Peak Demand Reduction Variable
Measure Life 15 years488
Measure Vintage Replace on Burnout or New Construction
E L I G I B I L I T Y
The following protocol for the calculation of energy and demand savings applies to the installation of High Volume Low Speed (HVLS) fans to replace conventional circulating fans. HVLS fans are a minimum of 16 feet long in diameter and move more cubic feet of air per watt than conventional circulating fans. Default values are provided for dairy, poultry, and swine applications. Other facility types are eligible, however, the operating hours assumptions should be reviewed and modified as appropriate.
This measure requires the installation of HVLS fans in either new construction or retrofit applications where conventional circulating fans are replaced.
A L G O R I T H M S
The annual energy and peak demand savings are obtained through the following formulas:
kW¿
(W conventional−W hvls)1,000
kWh ¿∆ kW ×HOU
∆ kW peak ¿∆ kW ×CF
D E F I N I T I O N O F T E R M S
488 http://www.energystar.gov/productfinder/product/certified-enterprise-servers/results
SECTION 3: Commercial and Industrial MeasuresPage 527
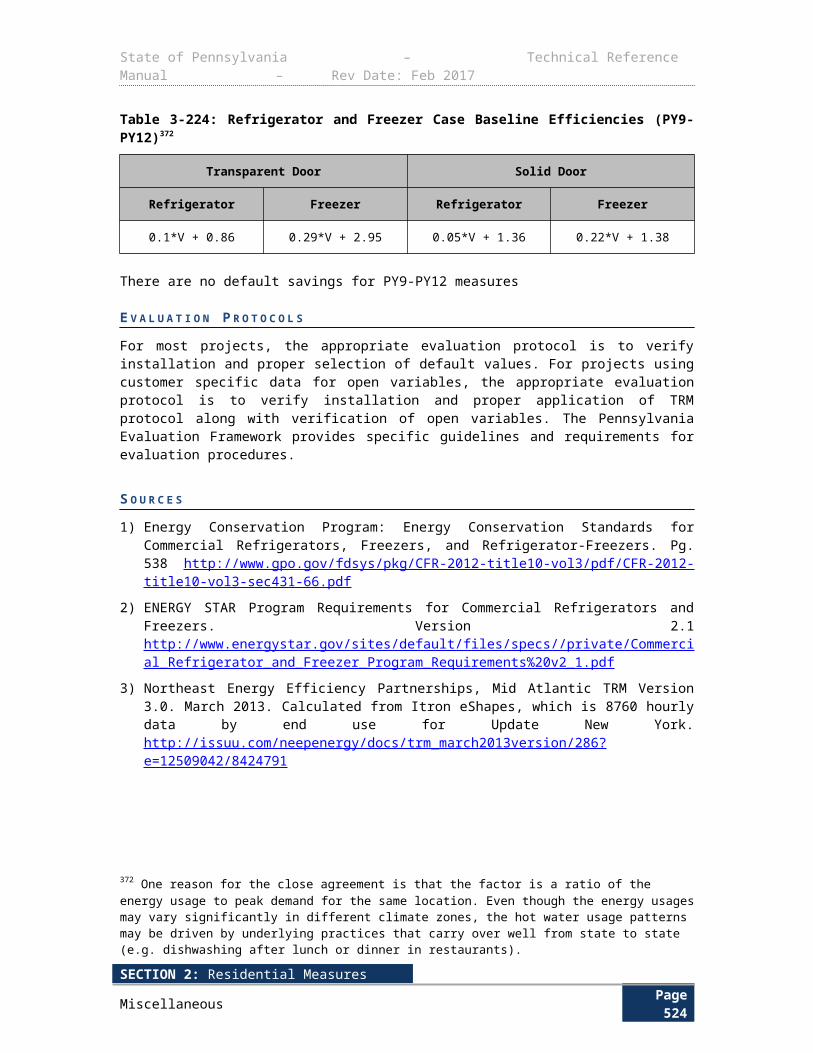
State of Pennsylvania – Technical Reference Manual – Rev Date: Feb 2017
Table 4-314: Variables for HVLS Fans
Term Unit Values Source
W conventional, Wattage of the removed conventional fans
W
Based on customer application
EDC Data Gathering
Default values in Table 4-315 1
W hvls, Wattage of the installed HVLS fan WBased on customer
applicationEDC Data Gathering
Default values in Table 4-310 1
HOU , annual hours of operation of the fans Hours
Based on customer application
EDC Data Gathering
Default values in Table 4-316 2
1000, conversion of watts to kilowattswatts
kilowatts1,000 Conversion
Factor
CF, Demand coincidence factor Decimal 1.0 2
Table 4-315: Default Values for Conventional and HVLS Fan Wattages
Fan Size (ft) W hvls W conventional
≥ 16 and < 18 761 4,497
≥ 18 and < 20 850 5,026
≥ 20 and < 24 940 5,555
≥ 24 1,119 6,613
SECTION 3: Commercial and Industrial MeasuresPage 528
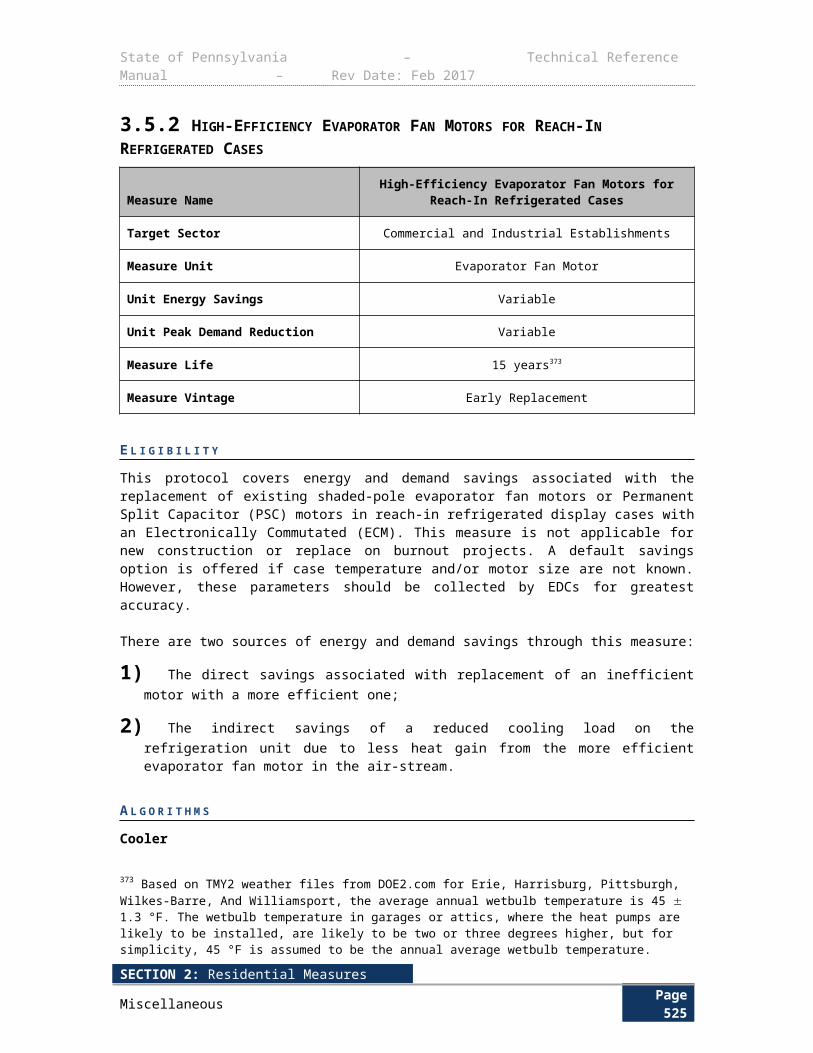
State of Pennsylvania – Technical Reference Manual – Rev Date: Feb 2017
Table 4-316. Default Hours by Location for Dairy/Poultry/Swine Applications
Location
Hoursyear
Allentown 2,446
Erie 2,107
Harrisburg 2,717
Philadelphia 2,914
Pittsburgh 2,292
Scranton 2,145
Williamsport 2,371
D E F A U L T S A V I N G S
There are no default savings for this measure.
E V A L U A T I O N P R O T O C O L S
For most projects, the appropriate evaluation protocol is to verify installation and proper selection of default values. For projects using customer specific data for open variables, the appropriate evaluation protocol is to verify installation and proper application of TRM protocol along with verification of open variables. The Pennsylvania Evaluation Framework provides specific guidelines and requirements for evaluation procedures.
S O U R C E S
1) KEMA. 2009 Evaluation of IPL Energy Efficiency Programs, Appendix F Group I Programs Volume 2. See Table H-17. http://alliantenergy.com/wcm/groups/wcm_internet/@int/documents/document/mdaw/mdey/~edisp/012895.pdf
2) Number of hours above 65 degrees Fahrenheit. Based on TMY3 data. The coincidence factor has been set at 1.0 as the SWE believes all hours during the peak window will be above 65 degrees Fahrenheit.
SECTION 3: Commercial and Industrial MeasuresPage 529
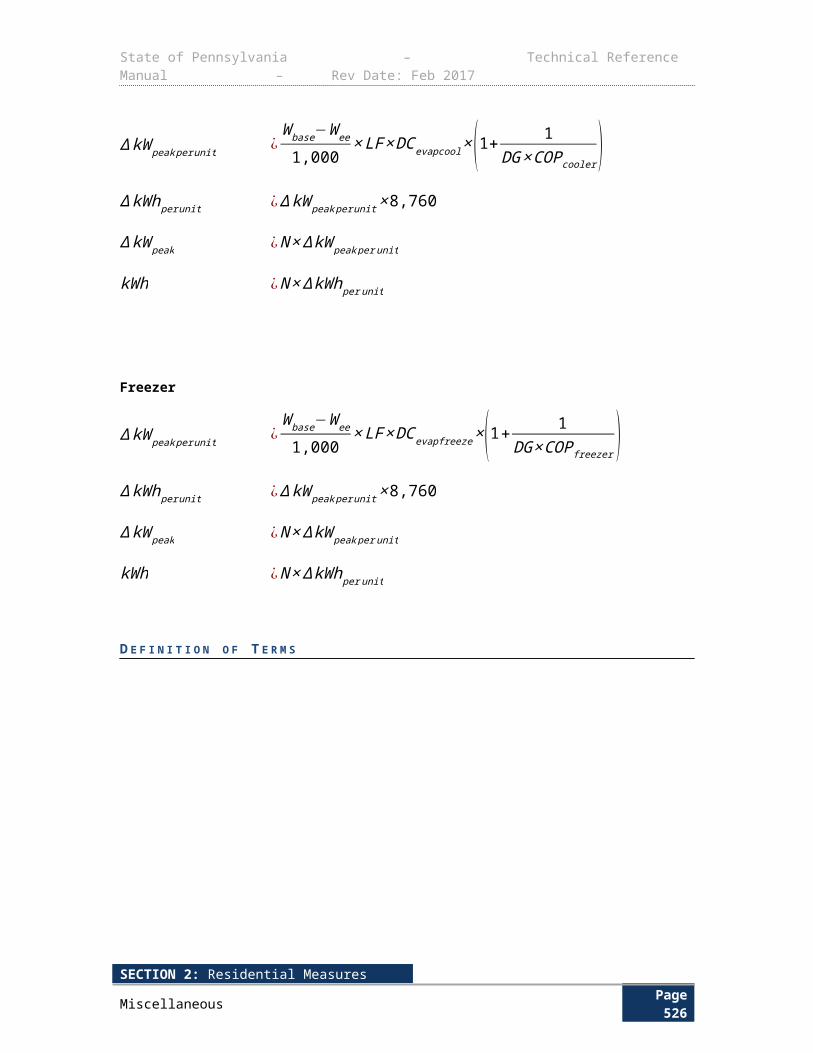
State of Pennsylvania – Technical Reference Manual – Rev Date: Feb 2017
4.1.6 LIVESTOCK WATERER
Measure Name Livestock Waterer
Target Sector Agriculture (includes Residential and Commercial)
Measure Unit Livestock Waterer System
Unit Energy Savings Variable
Unit Peak Demand Reduction 0 kW
Measure Life 10 years489
Measure Vintage Replace on Burnout or New Construction
E L I G I B I L I T Y
The following protocol for the calculation of energy and demand savings applies to the installation of energy-efficient livestock waterers. In freezing climates no or low energy livestock waterers are used to prevent livestock water from freezing. These waterers are closed watering containers that typically use super insulation, relatively warmer ground water temperatures, and the livestock’s use of the waterer to keep water from freezing.
This measure requires the installation of an energy efficient livestock watering system that is thermostatically controlled and has a minimum of two inches of factory-installed insulation.
A L G O R I T H M S
The annual energy savings are obtained through the following formula:
∆ kWh ¿QTY ×OPRHS×ESW ×HRTNo demand savings are expected for this measure, as the energy savings occur during the winter months.
D E F I N I T I O N O F T E R M S
489 Idaho Power Demand Side Management Potential Study – Volume II Appendices, Nexant, 2009.
SECTION 3: Commercial and Industrial MeasuresPage 530
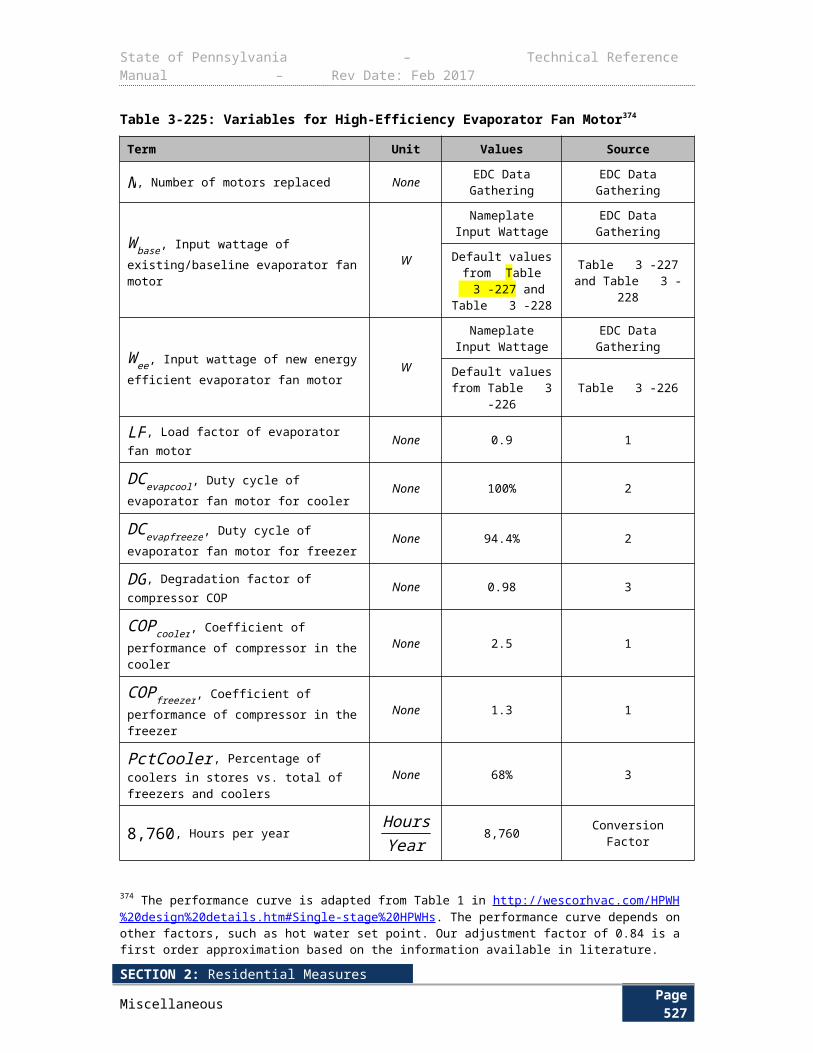
State of Pennsylvania – Technical Reference Manual – Rev Date: Feb 2017
Table 4-317: Variables for Livestock Waterers
Term Unit Values Source
QTY , Number of livestock waterers installed
None Based on customer application EDC Data Gathering
OPRHS, Annual operating hours
Hours
Allentown = 1,489
Erie = 1,768
Harrisburg = 1,302
Philadelphia = 1,090
Pittsburgh = 1,360
Scranton = 1,718
Williamsport = 1,574
1
ESW , Change in connected load (deemed)
Kilowattswaterer
0.50 2, 3, 4
HRT , % heater run time None 80% 5
D E F A U L T S A V I N G S
There are no default savings for this measure.
E V A L U A T I O N P R O T O C O L S For most projects, the appropriate evaluation protocol is to verify installation and proper selection of default values. For projects using customer specific data for open variables, the appropriate evaluation protocol is to verify installation and proper application of TRM protocol along with verification of open variables. The Pennsylvania Evaluation Framework provides specific guidelines and requirements for evaluation procedures.
S O U R C E S
1) Based on TMY3 data for various climate zones in Pennsylvania. The annual operating hours represent the annual hours when the outdoor air dry-bulb temperature is less than 32 °F, and it is assumed that the livestock waterer electric resistance heaters are required below this temperature to prevent water freezing.
2) Field Study of Electrically Heated and Energy Free Automated Livestock Water Fountains - Prairie Agricultural Machinery Institute, Alberta and Manitoba, 1994.
3) Facts Automatic Livestock Waterers Fact Sheet, December 2008. http://www1.agric.gov.ab.ca/$department/deptdocs.nsf/all/agdex5421/$file/716c52.pdf
4) Connecticut Farm Energy Program: Energy Best Management Practices Guide, 2010. http://www.ctfarmenergy.org/Pdfs/CT_Energy_BMPGuide.pdf
5) The Regional Technical Forum (RTF) analyzed metered data from three baseline livestock waterers and found the average run time of electric resistance heaters in the waterers to be approximately 80% for average monthly temperatures similar to Pennsylvania climate zones. This run time factor accounts for warmer make-up water being introduced to the tank as
SECTION 3: Commercial and Industrial MeasuresPage 531
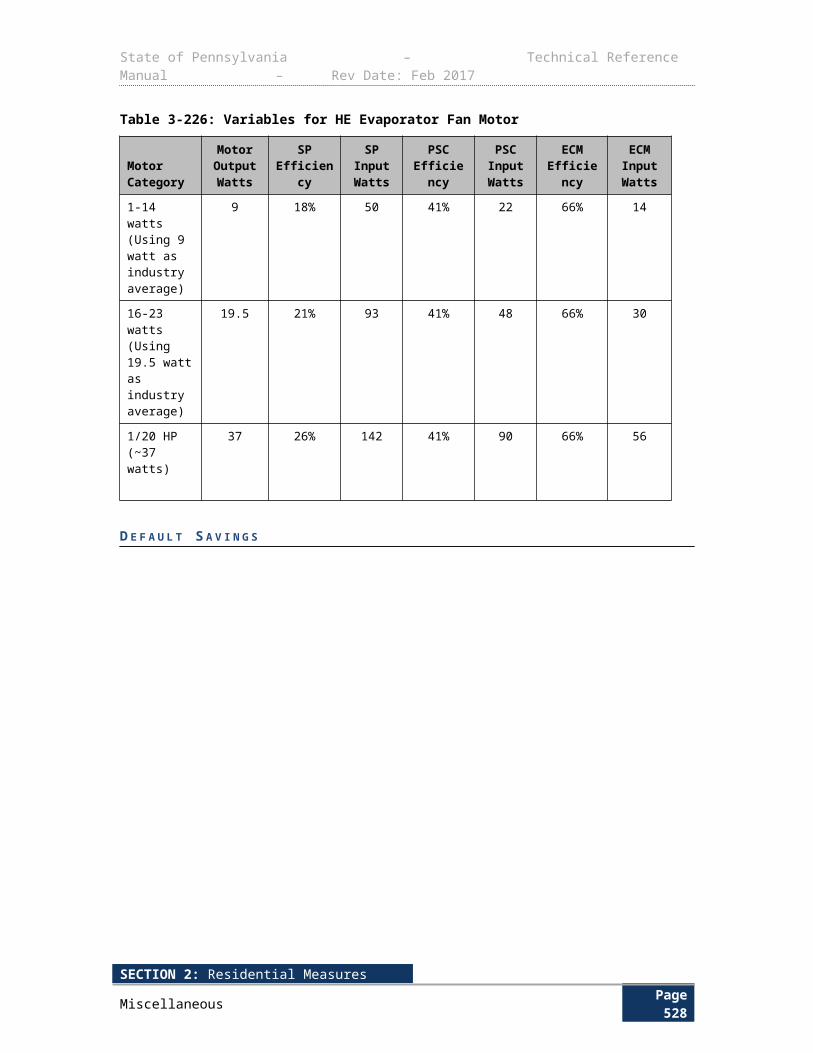
State of Pennsylvania – Technical Reference Manual – Rev Date: Feb 2017
livestock drinking occurs. Downloaded on May 30th, 2013: http://rtf.nwcouncil.org/measures/measure.asp?id=87
SECTION 3: Commercial and Industrial MeasuresPage 532
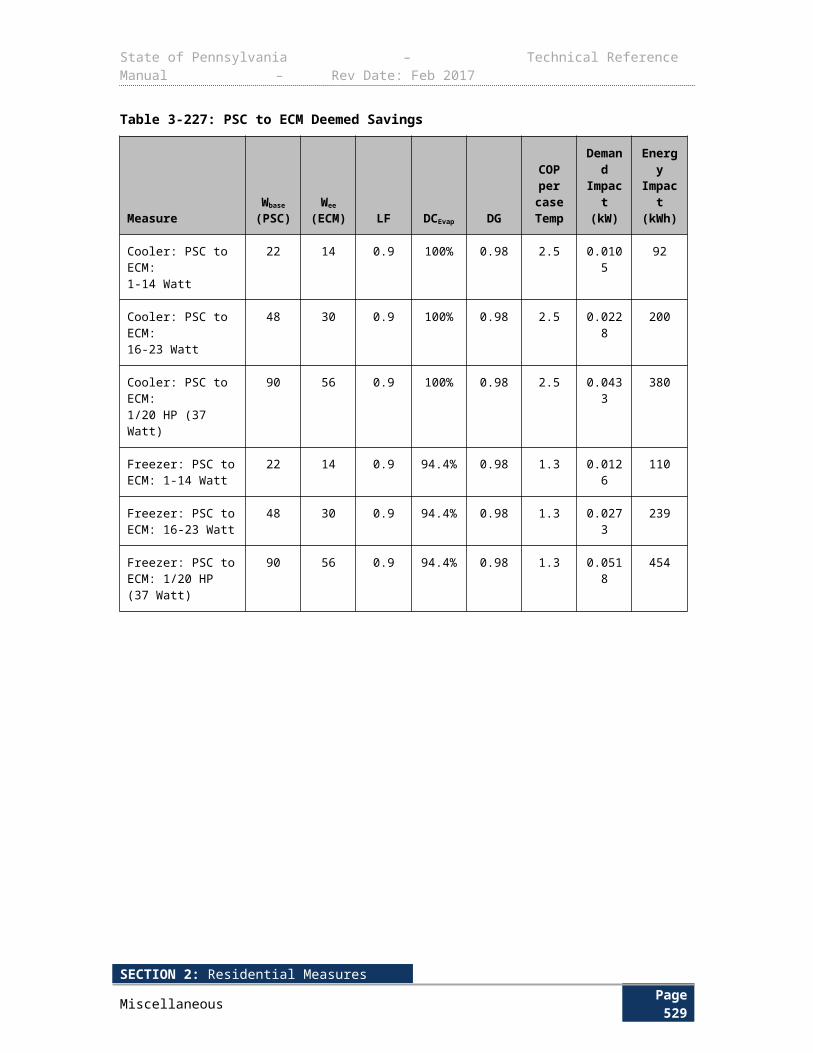
State of Pennsylvania – Technical Reference Manual – Rev Date: Feb 2017
4.1.7 VARIABLE SPEED DRIVE (VSD) CONTROLLER ON DAIRY VACUUM PUMPS
Measure Name VSD Controller on Dairy Pumps Vacuum Pumps
Target Sector Agriculture (includes Residential and Commercial)
Measure Unit Dairy Vacuum Pump VSD
Unit Energy Savings Variable
Unit Peak Demand Reduction Variable
Measure Life 15 years490
Measure Vintage Retrofit or New Construction
E L I G I B I L I T Y
The following protocol for the calculation of energy and demand savings applies to the installation of a variable speed drive (VSD) and controls on a dairy vacuum pump. The vacuum pump operates during the milk harvest and equipment washing on a dairy farm. The vacuum pump creates negative air pressure that draws milk from the cow and assists in the milk flow from the milk receiver to either the bulk tank or the receiver bowl.
Dairy vacuum pumps are more efficient with VSDs since they enable the motor to speed up or slow down depending on the pressure demand. The energy savings for this measure is based on pump capacity and hours of use of the pump.
This measure requires the installation of a VSD and controls on dairy vacuum pumps, or the purchase of dairy vacuum pumps with variable speed capability. Pre-existing pumps with VSD’s are not eligible for this measure.
A L G O R I T H M S
The annual energy savings are obtained through the following formulae:
kWh ¿HP×0.746× LFηmotor
×ESF×DHRS× ADAYS
∆ kW peak ¿∆ kWh×CF
Coincidence Factor An average of pre and post kW vacuum pump power meter data from five dairy farms in the Pacific Northwest491 are used to create the vacuum pump demand load profile in Figure 4-18. Because dairy vacuum pump operation does not vary based on geographical location, the average peak demand reduction obtained from these five sites can be applied to Pennsylvania. There are no seasonal variations in cow milking times, as dairy farms milk cows year round, so
490PA Consulting Group for the State of Wisconsin Public Service Commission, Focus on Energy Evaluation. Business Programs: Measure Life Study. August 25, 2009. Appendix B https://focusonenergy.com/sites/default/files/bpmeasurelifestudyfinal_evaluationreport.pdf 491 New York Standard Approach for Estimating Energy Savings from Energy Efficiency Measures in Commercial and Industrial Programs, September 1, 2009, based on DEER. http://www3.dps.ny.gov/W/PSCWeb.nsf/0/06f2fee55575bd8a852576e4006f9af7/$FILE/TechManualNYRevised10-15-10.pdf
SECTION 3: Commercial and Industrial MeasuresPage 533
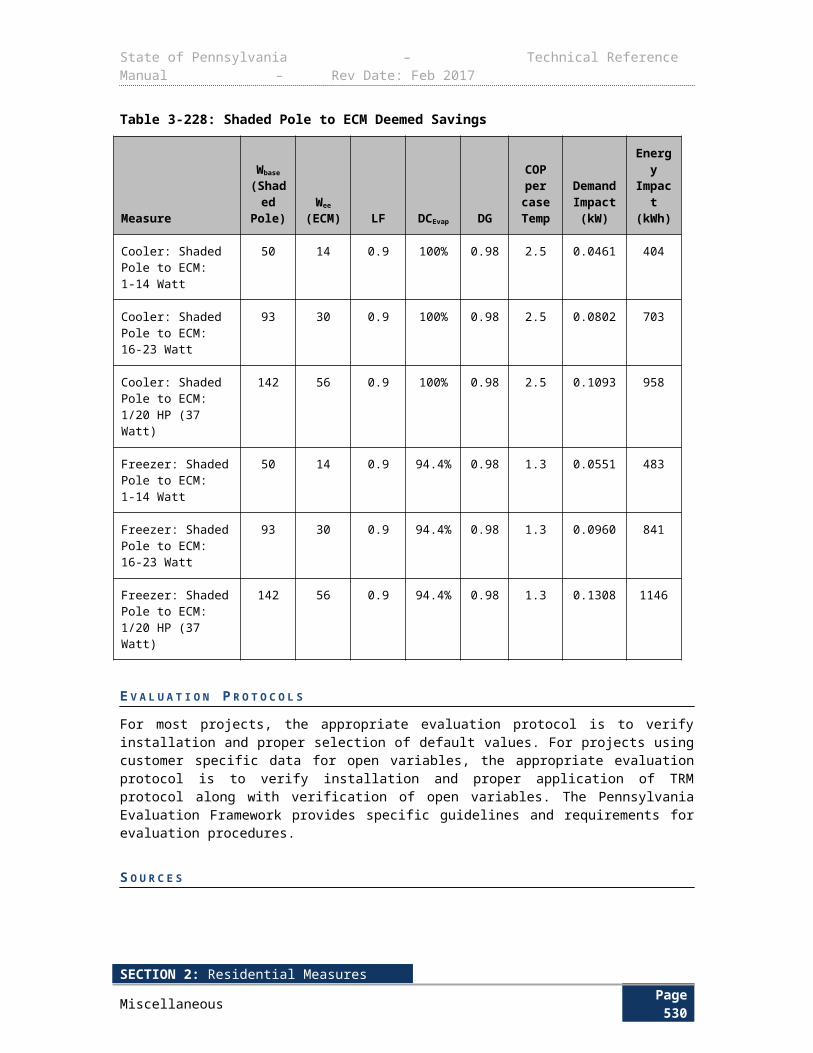
State of Pennsylvania – Technical Reference Manual – Rev Date: Feb 2017
the load profile below applies to 365 days of operation. The average percent demand reduction for these five sites during the coincident peak demand period of June through September between noon and 8 pm is 46%, which is consistent with the energy savings factors and demand savings estimated for the sources cited in this protocol.
Based on this data, the demand coincidence factor is estimated by dividing the average peak coincident demand kW reduction by kWh savings for a 1 horsepower motor. The result is a coincidence factor equal to 0.00014.
Figure 4-18: Typical Dairy Vacuum Pump Coincident Peak Demand Reduction
1 2 3 4 5 6 7 8 9 10 11 12 13 14 15 16 17 18 19 20 21 22 23 240.002.004.006.008.00
10.0012.0014.0016.0018.00
Dairy Vacuum Pump VFD load profile
No VFDVFD
Hour of the Day
kW
Summer Peak Pe-riod:Weekdays12pm - 8pm
SECTION 3: Commercial and Industrial MeasuresPage 534
State of Pennsylvania – Technical Reference Manual – Rev Date: Feb 2017
D E F I N I T I O N O F T E R M S
Table 4-318: Variables for VSD Controller on Dairy Vacuum Pump
Term Unit Values Source
Motor HP, Rated horsepower of the motor HP Nameplate EDC Data Gathering
0.746, conversion factor from horsepower to kW kWHP
0.746 Conversion Factor
LF , Load Factor. Ratio between the actual load and the rated load. The default value is 0.90
None
Based on spot metering and
nameplate
EDC Data Gathering
Default: 90%492 1
ηmotor , Motor efficiency at the full-rated load. For VFD installations, this can be either an energy efficient motor or standard efficiency motor.
None Nameplate EDC Data Gathering
ESF , Energy Savings Factor. Percent of baseline energy consumption saved by installing VFD.
None 46% 2, 3
DHRS, Daily run hours of the motor Hours
Based on customer
application
EDC Data Gathering
Default: 8 hoursday
2, 3
ADAYS, Annual operating days Days
Based on customer
application
EDC Data Gathering
Default: 365 daysyear
2, 3
CF, Demand Coincidence factor Decimal 0.00014 3
D E F A U L T S A V I N G S
There are no default savings for this measure.
E V A L U A T I O N P R O T O C O L S
For most projects, the appropriate evaluation protocol is to verify installation and proper selection of default values. For projects using customer specific data for open variables, the appropriate 492State of Wisconsin. Focus on Energy Evaluation, Business Program: Measure Life Study Final Report: August 25, 2009. Appendix B. https://focusonenergy.com/sites/default/files/bpmeasurelifestudyfinal_evaluationreport.pdf
SECTION 3: Commercial and Industrial MeasuresPage 535
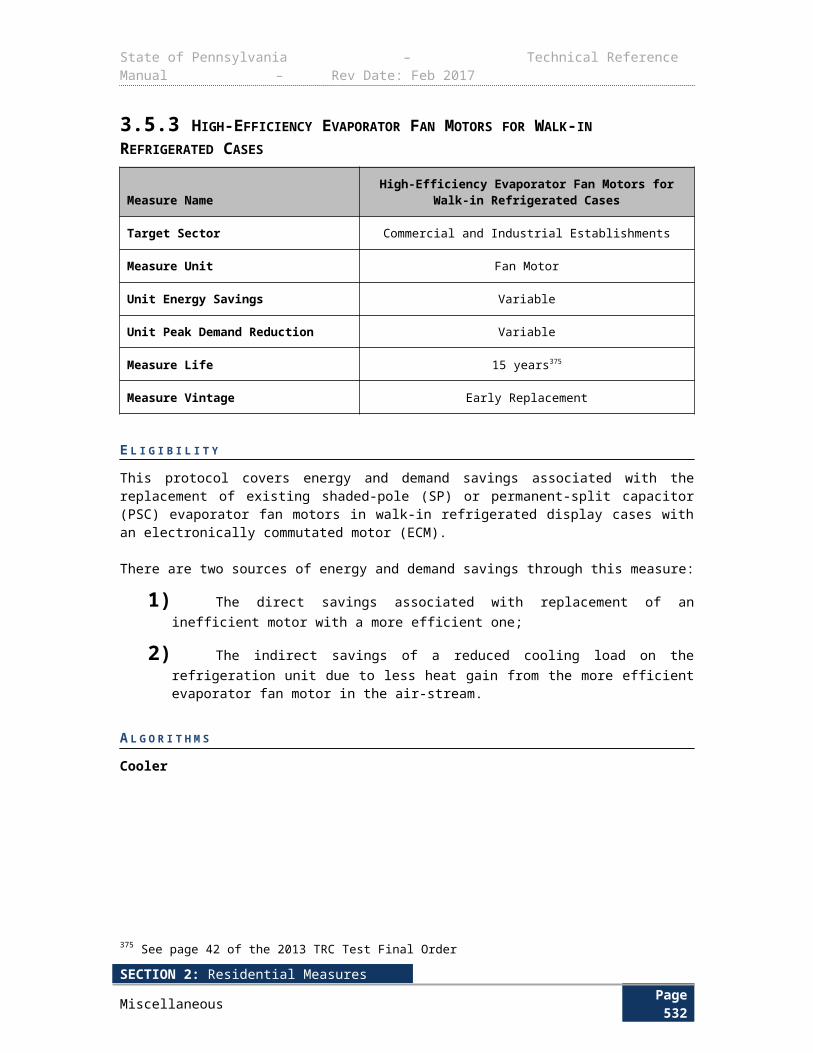
State of Pennsylvania – Technical Reference Manual – Rev Date: Feb 2017
evaluation protocol is to verify installation and proper application of TRM protocol along with verification of open variables. The Pennsylvania Evaluation Framework provides specific guidelines and requirements for evaluation procedures.
S O U R C E S
1) Southern California Edison, Dairy Farm Energy Management Guide: California, p. 11, 2004.
2) California Public Utility Commission. Database for Energy Efficiency Resources (DEER) 2005. The DEER database assumes 20 hours of operation per day, but is based on much larger dairy farms (e.g. herd sizes > 300 cows). Therefore, the DEER default value was lowered to 8 hours per day, as the average heard size in 75 cows in Pennsylvania. Regional Technical Forum (RTF) as part of the Northwest Power & Conservation Council, Deemed Measures List. Agricultural: Variable Frequency Drives-Dairy, FY2012, V1.2. Accessed from RTF website http://rtf.nwcouncil.org/measures/Default.asp on February 27, 2013.
3) Regional Technical Forum (RTF) as part of the Northwest Power & Conservation Council, Deemed Measures List. Agricultural: Variable Frequency Drives-Dairy, FY2012, V1.2. Accessed from RTF website http://rtf.nwcouncil.org/measures/Default.asp on February 27, 2013.
SECTION 3: Commercial and Industrial MeasuresPage 536
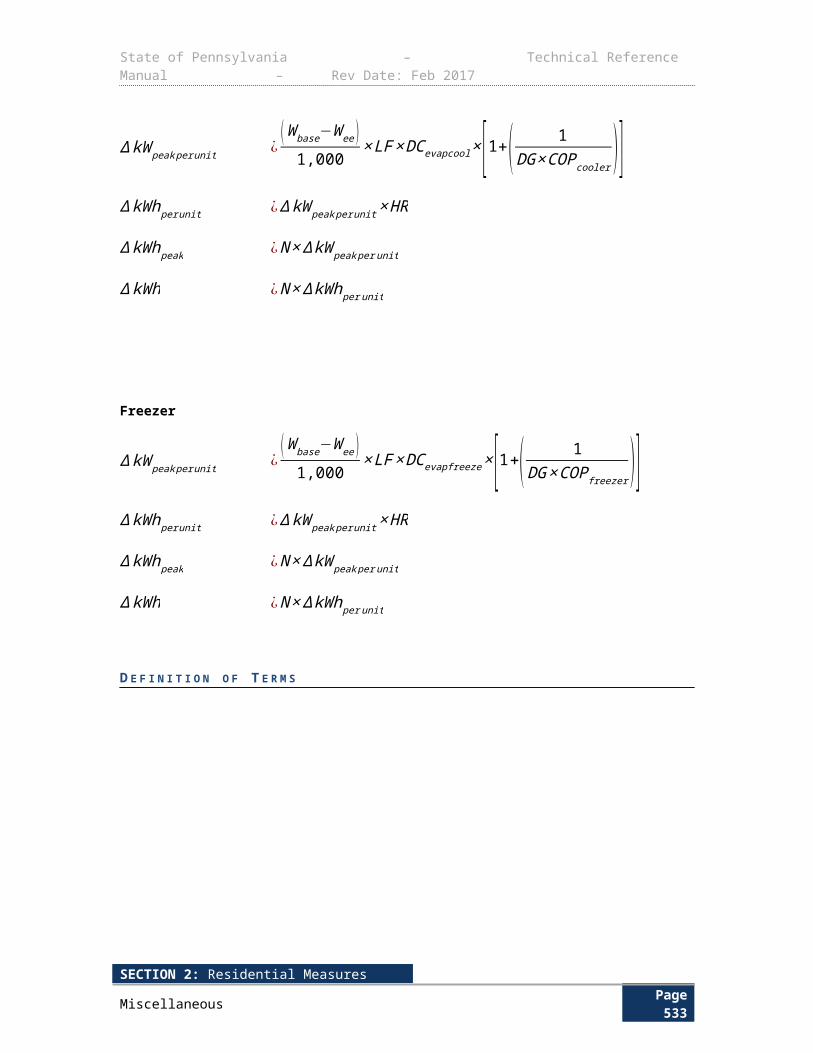
State of Pennsylvania – Technical Reference Manual – Rev Date: Feb 2017
4.1.8 LOW PRESSURE IRRIGATION SYSTEM
Measure Name Low Pressure Irrigation System
Target Sector Agriculture and Golf Courses (includes Residential and Commercial)
Measure Unit Irrigation System
Unit Energy Savings Variable
Unit Peak Demand Reduction Variable
Measure Life 5 years493
Measure Vintage Replace on Burnout or New Construction
E L I G I B I L I T Y
The following protocol for the measurements of energy and demand savings applies to the installation of a low-pressure irrigation system, thus reducing the amount of energy required to apply the same amount of water.
The amount of energy saved per acre will depend on the actual operating pressure decrease, the pumping plant efficiency, the amount of water applied, and the number of nozzle, sprinkler or micro irrigation system conversions made to the system.
This measure requires a minimum of 50% reduction in irrigation pumping pressure through the installation of a low-pressure irrigation system in agriculture or golf course applications. The pressure reduction can be achieved in several ways, such as nozzle or valve replacement, sprinkler head replacement, alterations or retrofits to the pumping plant, or drip irrigation system installation, and is left up to the discretion of the owner. Pre and post retrofit pump pressure measurements are required.
A L G O R I T H M S
The annual energy savings are obtained through the following formulas:
Agriculture applications:
∆ kWh ¿{ACRES× (PSI base−PSIeff )×GPM 1}
1,714 gpm ∙ psiHP
×ηmotor×0.746 kW
HP×OPRHS Irrigation Hours
GrowingSeason
∆ kW peak ¿ ∆kWhyr
×CF
493 State of Wisconsin. Focus on Energy Evaluation, Business Program: Measure Life Study Final Report: August 25, 2009. Appendix B. https://focusonenergy.com/sites/default/files/bpmeasurelifestudyfinal_evaluationreport.pdf
SECTION 3: Commercial and Industrial MeasuresPage 537

State of Pennsylvania – Technical Reference Manual – Rev Date: Feb 2017
Golf Course applications:
∆ kWh ¿{(PSI base−PSIeff )×GPM 2}
1,714 gpm psiHP
×ηmotor×0.746 kW
HP×DHRS×MONTHS×30 avg .days
month
No peak demand savings may be claimed for golf course applications as watering typically occurs during non-peak demand hours.
D E F I N I T I O N O F T E R M S
Table 4-319: Variables for Low Pressure Irrigation Systems
Term Unit Values Source
ACRES, Number of acres irrigated Acres Based on customer application EDC Data Gathering,1
PSIbase, Baseline pump pressure, must be measured and recorded prior to installing low-pressure irrigation equipment.
Pounds per square inch
(psi)
Based on pre retrofit pressure measurements
taken by the installer
EDC Data Gathering,1
PSI eff , Installed pump pressure, must be measured and recorded after the installation of low-pressure irrigation equipment by the installer.
Pounds per square inch
(psi)
Based on post retrofit pressure measurements
taken by the installer
EDC Data Gathering,1
GPM 1, Pump flow rate per acre for agriculture applications.
Gallons per minute (gpm)
Based on pre retrofit flow
measurements taken by the
installer
EDC Data Gathering,1
GPM 2, Pump flow rate for pumping system for golf courses.
Gallons per minute (gpm)
Based on pre retrofit flow
measurements taken by the
installer
EDC Data Gathering,1
1714, Constant used to calculate hydraulic horsepower for conversion between horsepower and pressure and flow
None HP= PSI ×GPM1714
Conversion Factor
OPHRS, Average irrigation hours per growing season for agriculture
Hours Based on customer application EDC Data Gathering
DHRS, Hours of watering per day for golf courses
Hours Based on customer application EDC Data Gathering
MONTHS, Number of months of irrigation for golf courses
Months Based on customer application EDC Data Gathering
ηmotor , Pump motor efficiency None
Based on customer application EDC Data Gathering
Look up pump motor efficiency
based on the pump nameplate
horsepower (HP) from customer application and
nominal efficiencies defined in Table 3-
2
SECTION 3: Commercial and Industrial MeasuresPage 538
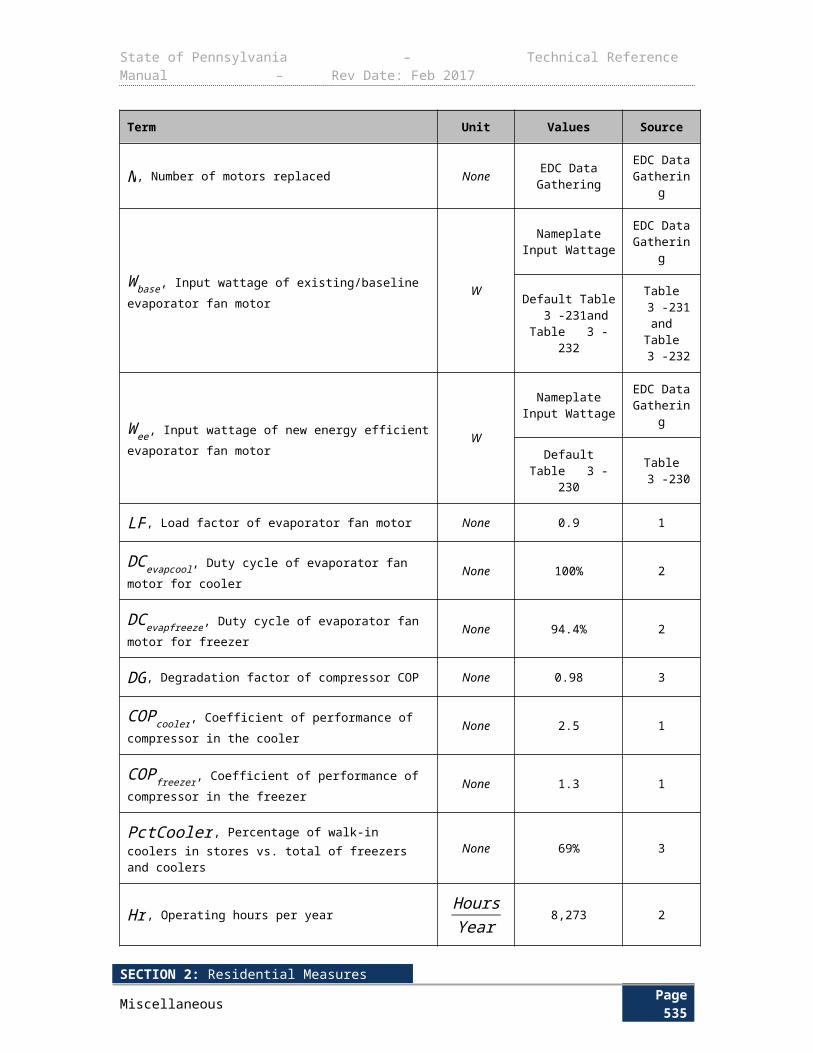
State of Pennsylvania – Technical Reference Manual – Rev Date: Feb 2017
Term Unit Values Source
CF, Demand coincidence factor for agriculture
Decimal 0.0026 3, 4
D E F A U L T S A V I N G S
There are no default savings for this measure.
E V A L U A T I O N P R O T O C O L S
For most projects, the appropriate evaluation protocol is to verify installation and proper selection of default values. For projects using customer specific data for open variables, the appropriate evaluation protocol is to verify installation and proper application of TRM protocol along with verification of open variables. The Pennsylvania Evaluation Framework provides specific guidelines and requirements for evaluation procedures.
S O U R C E S
1) Based on Alliant Energy program evaluation assumptions for low-flow pressure irrigation systems. Evaluation of Alliant Energy Agriculture Program, Appendix F, 2008. http://alliantenergy.com/wcm/groups/wcm_internet/@int/documents/document/mdaw/mdey/~edisp/012895.pdf
2) Table 3-192 contains federal motor efficiency values by motor size and type. If existing motor nameplate data is not available, these tables will be used to establish motor efficiencies. The CF was only estimated for agricultural applications, and was determined by using the
following formula CF= ∆ kW savings per acre
∆ kWhyr
savings per acre .
3) Pennsylvania census data was used to estimate an average ∆kW savings/acre and ∆kWh/yr/savings/acre value. Pamela Kanagy. Farm and Ranch Irrigation. Pennsylvania Agricultural Statistics 2009-2010. http://www.nass.usda.gov/Statistics_by_State/Pennsylvania/Publications/Annual_Statistical_Bulletin/2009_2010/fris.pdf
4) Irrigation Water Withdrawals, 2000 by the U.S. Geological Society. http://pubs.usgs.gov/circ/2004/circ1268/htdocs/table07.html
SECTION 3: Commercial and Industrial MeasuresPage 539
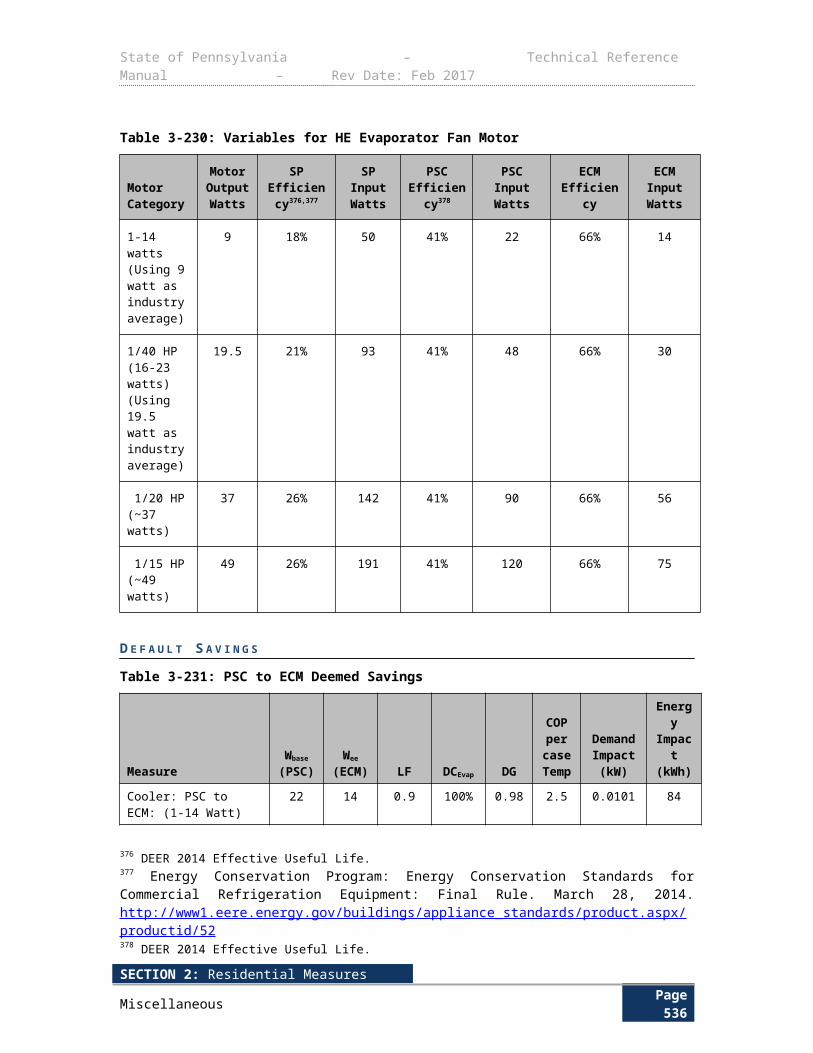
State of Pennsylvania – Technical Reference Manual – Rev Date: Feb 2017
This Page Intentionally Left Blank
2016 TECHNICAL REFERENCE MANUALPage 540
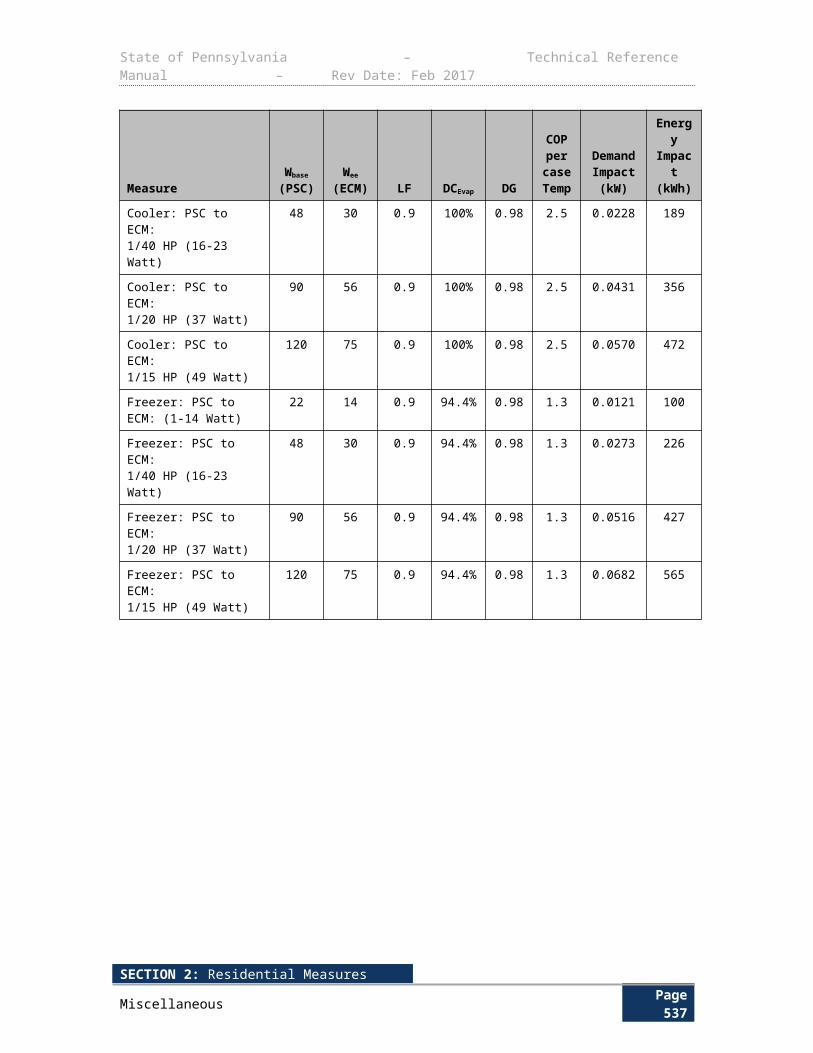
State of Pennsylvania – Technical Reference Manual – Rev Date: Feb 2017
5 DEMAND RESPONSEThe primary focus of this section of the TRM is to provide technical guidance for estimating the load impacts of demand response programs. The methods discussed are aimed at providing accurate estimates of the true load impacts at the program level. EDCs and CSPs may use alternate methods for quarterly reporting of ex ante impacts or to calculate financial settlements with participating customers, but the methods detailed in the TRM should be used to verify achievement of Phase III demand reduction targets. In some instances, the analysis may be carried out at the individual customer level, however, the outcome of interest is the aggregate load reduction (MW) that is caused by the program.
5.1 LOAD CURTAILMENT FOR COMMERCIAL AND INDUSTRIAL PROGRAMS Measure Name Load Curtailment for Commercial and Industrial
Programs
Target Sector Commercial and Industrial Establishments
Measure Unit N/A
Unit Energy Savings N/A
Unit Peak Demand Reduction N/A
Measure Life 1 year
Measure Vintage Demand Response
In a C&I Load Curtailment (LC) program, end-use customers are provided a financial incentive to reduce the amount of electricity they take from the EDC during Demand Response events. This temporary reduction in electricity consumption can be achieved in a number of ways. The specific load curtailment actions taken by program participants are outside of the scope of this protocol. Load curtailment is a dispatchable, event-based resource because the load impacts are only expected to occur on days when DR events are called. This is fundamentally different from non-dispatchable DR options such as dynamic pricing or permanent load shifting. This protocol only applies to dispatchable resources.
Peak demand reductions associated with DR resources are defined as the difference between a customer’s actual (measured) electricity demand, and the amount of electricity the customer would have demanded in the absence of the DR program incentive. The latter is inherently counterfactual because it never occurred and therefore cannot be measured and must be estimated. This estimate of how much electricity would have been consumed absent the DR program is analogous to the baseline condition for an energy efficiency measure. In this protocol this estimate is referred to as the reference load.
The reference load used to determine impacts from a LC program participant during a DR event shall be estimated using one of the following methods.494 The methods are in heirarchial order of preference based on expected accuracy. The EDCs are strongly encouraged to utilize the first three methodologies to verify achievement of the Phase III demand reductions targets. In scenarios where an EDC determines a Customer Baseline (CBL) approach is more appropriate, 494 State of Wisconsin. Focus on Energy Evaluation, Business Program: Measure Life Study Final Report: August 25, 2009. Appendix B. https://focusonenergy.com/sites/default/files/bpmeasurelifestudyfinal_evaluationreport.pdf
SECTION 5 Demand ResponseLoad Curtailment Page 541
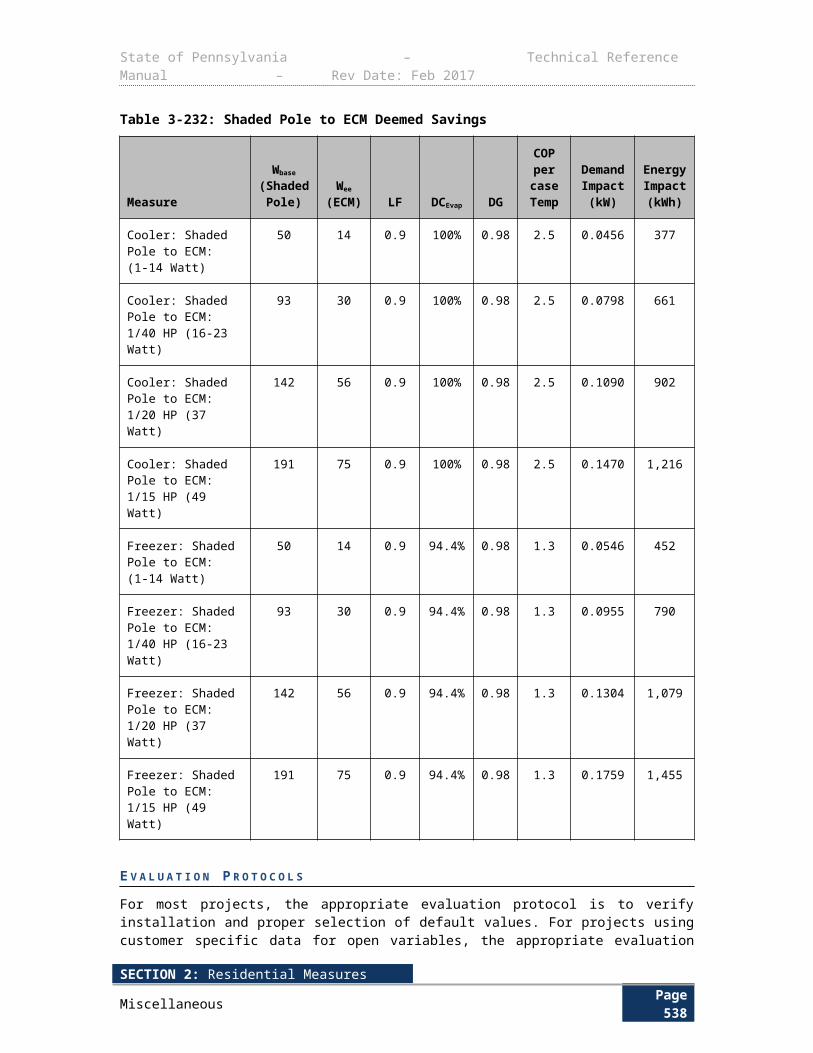
State of Pennsylvania – Technical Reference Manual – Rev Date: Feb 2017
the EDC should provide sound reasoning for the choice of the CBL approach as opposed to the first three methodologies.
1) A comparison group analysis where the loads of a group of non-participating customers that are similar to participating customers with respect to observable characteristics (e.g. non-event weekday consumption) are used to estimate the reference load. A variety of matching techniques are available and the EDC evaluation contractor can choose the technique used to select the comparison group based on their professional judgment. The primary objective of statistical matching is to eliminate bias in the reference load during the most relevant load hours. The most relevant hours are those during the event, but hours immediately prior to and immediately following the event period are also important. As such, matching methods should focus on finding customers with loads during these critical hours that are as close as possible to the loads of participating customers for days that have weather and perhaps other conditions very similar to event days. If events are most likely to be called on hot days, hot non-event days should be used for statistical matching and very cool days should be excluded). If need be, difference-in-differences techniques can be utilized to eliminate any pre-existing differences in consumption between the treatment and matched control group during estimation.
2) A ‘within-subjects’ regression analysis where the loads of participating customers on non-event days are used to estimate the reference load. The regression equation should include temperature and other variables that influence usage as explanatory variables. This method is superior to the baseline methods discussed in (4).
3) A hybrid Regression-Matching method where matching is used for most customers and regression methods are used to predict reference loads for any large customers who are too unique to have a good matching candidate. This approach allows for matching methods to be used when good matches are available without dropping unique customers who do not have valid matches from the analysis. The hybrid approach is also superior to the baseline methods discussed in (4).
4) A CBL approach with a weather adjustment to account for the more extreme conditions in place on event days. In this approach, the reference load is estimated by calculating the average usage in the corresponding hours for selected days leading up to or following an event day. Multiplicative or additive same-day adjustments for the CBL are prohibited because of the day-ahead event notification. A variety of CBL methods are available to be used and the EDC contractor should provide justification for the specific method that is selected. Reference loads should generally be calculated separately for each participant, but aggregation of accounts or meters is permissible at the discretion of the EDC evaluation contractor. CBL methods are the least preferred of the four approaches, but may produce valid results in situations where customer loads are fairly constant and are not highly sensitive to weather conditions.
The weather conditions in place at the time of the event are always used to claim savings. Weather-normalized or extrapolation of impacts to other weather conditions is not permitted.
Other curtailment event days – either Act 129 or PJM – should be removed when estimating the reference load for an Act 129 event day.
Where feasible, matching-based methods are capable of effectively removing selection bias and providing accurate impact estimates that are comparable to results from a randomized experiment and are generally superior to within-subjects approaches.495 Because of this, in situations where large and representative control pools are available, it is suggested that the comparison group approach be used.
495 DEER Effective Useful Life. October 10, 2008.
SECTION 5 Demand ResponseLoad Curtailment Page 542
State of Pennsylvania – Technical Reference Manual – Rev Date: Feb 2017
E L I G I B I L I T Y
In order to be eligible for an EDC Load Curtailment program, a customer must have an hourly or sub-hourly revenue meter. Interval demand readings are necessary to calculate the reference load and estimate load impacts from DR events. Sub-metered loads may be used for accounts which do not have interval meters at the discretion of the SWE.
A L G O R I T H M S
Annual peak demand savings must be estimated using individual customer data (e.g. account, meter, or site as defined by program rules) regardless of which evaluation method is used. Program savings are the sum of the load impacts across all participants. Equations 1 and 2 provide mathematical definitions of the average peak period load impact estimate would be calculated using an approved method.
∆ kW peak ¿∑i=1
n
ΔkW i
n(1)
ΔkW i = kW Referencei−kW Meteredi (2)
D E F I N I T I O N O F T E R M S
Table 5-320: Definitions of Terms for Estimating C&I Load Curtailment
Term Unit Values Source
n, Number of DR hours during a program year for the EDC Hours EDC Data
GatheringEDC Data Gathering
Δ kW i, Estimated load impact achieved by an LC participant in hour i. This term can be positive (a load reduction) or negative (a load increase).
kW EDC Data Gathering
EDC Data Gathering
kW Referencei , Estimated customer load absent DR during hour i
kW EDC Data Gathering
EDC Data Gathering
kW Meteredi , Measured customer load during hour i kW EDC Data Gathering
EDC Data Gathering
D E F A U L T S A V I N G S
There are no default savings for this measure.
E V A L U A T I O N P R O T O C O L S
The evaluation protocols for the Load Curtailment measure follow the calculation methodologies described in this document. Evaluation of the measure should rely on a census of program participants unless a sampling approach (either of days or participants) is approved by the SWE. Detailed protocols for implementing the methodologies described above and the outputs that must be produced are provided in the Phase III Evaluation Framework.
SECTION 5 Demand ResponseLoad Curtailment Page 543
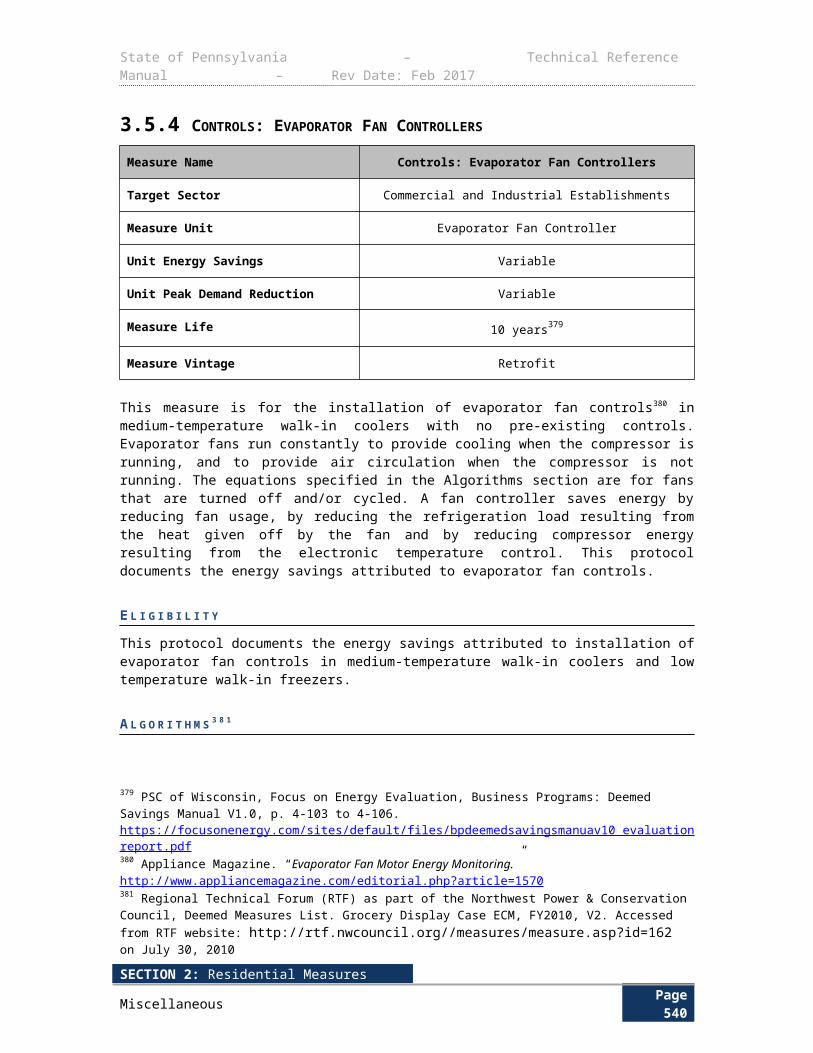
State of Pennsylvania – Technical Reference Manual – Rev Date: Feb 2017
SECTION 5 Demand ResponseLoad Curtailment Page 544
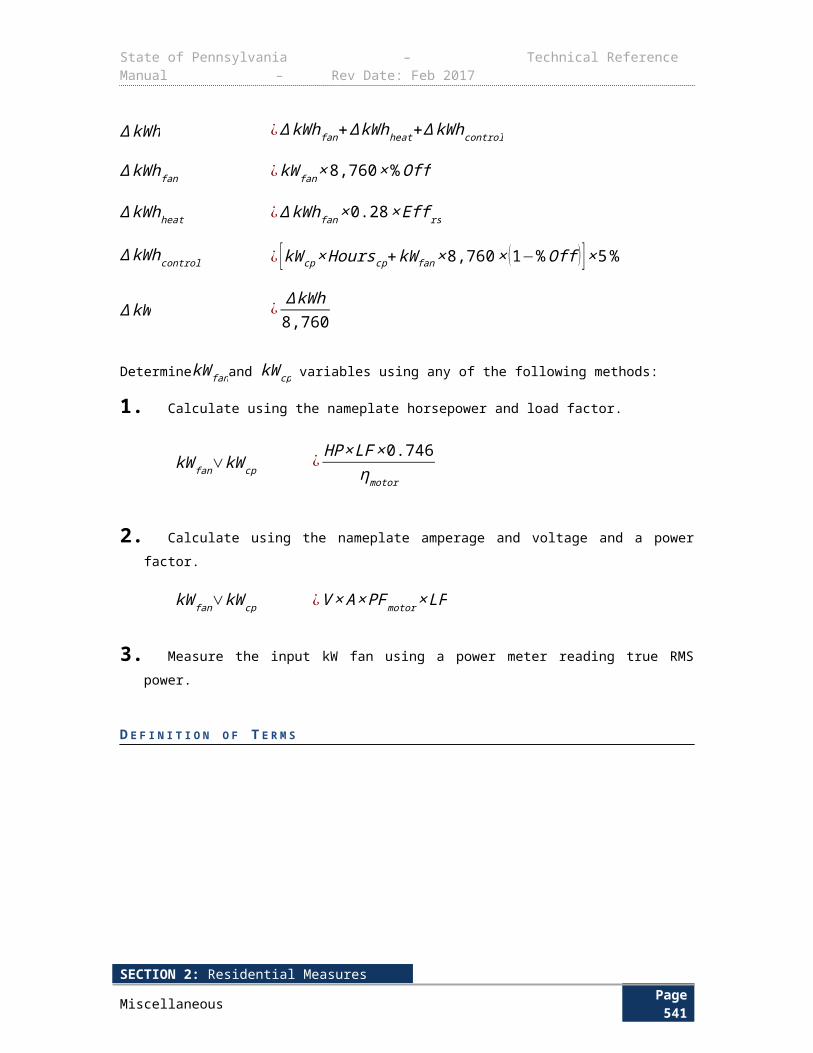
State of Pennsylvania – Technical Reference Manual – Rev Date: Feb 2017
5.2 DIRECT LOAD CONTROL AND BEHAVIOR-BASED DEMAND RESPONSE PROGRAMS
Measure Name Direct Load Control and Behavior-Based Demand Response Programs
Target Sector Residential and Small Commercial Establishments
Measure Unit N/A
Unit Energy Savings N/A
Unit Peak Demand Reduction N/A
Measure Life 10 years
Measure Vintage Demand Response
The protocols for Act 129 covering Direct Load Control (DLC) and Behavior-Based demand response programs are intended to give guidance to the EDCs when dispatching and evaluating the load impacts of an event over the course of Phase III. In these programs, residential and small commercial customers either allow EDCs to remotely reduce equipment run time during peak hours (DLC programs) or reduce their loads voluntarily in response to a combination of incentive payments, messaging and/or other behavioral stimuli.
Behavior-based demand response programs are ones that have a goal of reducing electric load during peak load hours. Examples of behavior-based demand response programs include utility programs that request customers to reduce electric loads during peak load hours voluntarily, programs where customers are provided with real-time information on the cost of electricity and can then take action voluntarily to reduce electric loads during high cost hours and other similar information programs. For purposes of the Pennsylvania TRM, behavior-based demand response programs do not include utility information programs that are based on consumer education or marketing and have a goal of reducing electricity use on a year round basis, including non-peak load hours.
For DLC programs, the participants may elect to receive incentive payments for allowing a signaled device to control or limit the power draw of certain HVAC, electric water heating, or swimming pool pump equipment at a participant’s home, contributing to the reduction of peak demand. For measurement purposes, peak demand reductions are defined as the difference between a customer’s actual (measured) electricity demand, and an estimate of the amount of electricity the customer would have demanded in the absence of the program incentive. The estimate of this counterfactual outcome is referred to as the reference load throughout this protocol.
EDCs must use one of the evaluation approaches below when estimating peak period load reductions that result from DLC and behavior-based programs. The approaches are not equivalent in terms of their ability to produce accurate and robust results and are therefore listed in descending order of desirability. Because of these differences in performance, EDCs shall use Option 2 only under circumstances when Option 1 is infeasible and shall similarly use Option 3 only under circumstances where both Option 1 and Option 2 are infeasible. In situations where Option 1 and/or 2 are not utilized, justification(s) must be provided by the EDC. EDCs with interval meter data available should use it to estimate load impacts. For DLC and behavior-based programs where advanced metering infrastructure (AMI) data is not available for all participants, estimates based on a sample of metered homes is permissible at the discretion of the SWE.
SECTION 5 Demand ResponseDirect Load Control and Behavior-Based Demand Response Programs Page 545
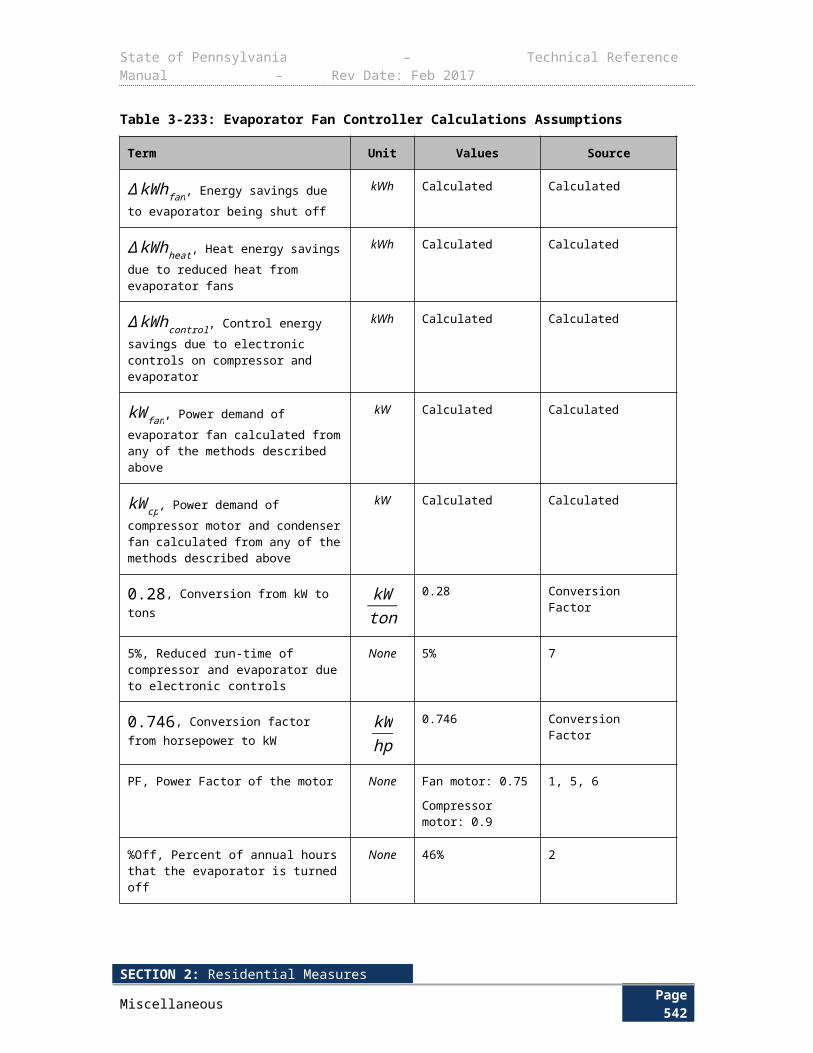
State of Pennsylvania – Technical Reference Manual – Rev Date: Feb 2017
1) An analysis based on an experimental design that makes appropriate use of random assignment so that the reference load is estimated using a representative control group of program participants.496 The most common type of design satisfying this criteria is a randomized control trial (RCT), but other designs may also be used. The specific design used can be selected by the EDC evaluation contractor based on their professional experience. It is important to note that experimental approaches to evaluation generally require the ability to call events at the individual device level. An operations strategy must be determined ahead of time in order to ensure that an appropriate control group is available for the analysis.
2) A comparison group analysis where the loads of a group of non-participating customers that are similar to participating homes with respect to observable characteristics (e.g. electricity consumption) are used to estimate the reference load. A variety of matching techniques are available and the EDC evaluation contractor can choose the technique used to select the comparison group based on their professional judgment. If events are most likely to be called on hot days, hot non-event days should be used for statistical matching and very cool days should be excluded.497 A good match will result in the loads of treatment and comparison group being virtually identical on non-event days. Difference-in-differences estimators should be used in the analysis to control for any remaining non-event day differences after matching.
3) A ‘within-subjects’ analysis where the loads of participating customers on non-event days 498
are used to estimate the reference load. This can be accomplished via a regression equation that relates loads to temperature and other variables that influence usage. The regression model should be estimated using hot days that would be similar to an event. Including cooler days in the model can degrade accuracy because it puts more pressure on accurately modeling the relationship between weather and load across a broad temperature spectrum, which is hard because the relationship is not linear. Reducing the estimating sample to relevant days reduces that modeling challenge, or a ‘day-matching’ technique with a day-of or weather adjustment to account for the more extreme conditions in place on event days. The weather conditions in place at the time of the event are always used to claim savings. Weather-normalized or extrapolation of impacts to other weather conditions is not permitted.
E L I G I B I L I T Y
In order to be eligible for the direct load control program, a customer must have a signaled device used to control the operability of the equipment specified to be called upon during an event. All residential and small commercial customers are eligible to participate in the behavior-based program.
A L G O R I T H M S
The specific algorithms(s) used to estimate the demand impacts caused by DLC and behavior-based programs will depend on the specific method of evaluation used. In general, regression-based estimates are most preferred, due to their ability to produce more precise impact estimates and quantitative measures of uncertainty. Details on specific types of equations that can be used for each evaluation approach are provided in the Phase III Evaluation Framework.
Annual peak demand savings must be estimated using individual customer data (e.g. account, meter, or site as defined by program rules) regardless of which evaluation method is used. Program savings are the sum of the load impacts across all participants. Equations 1 and 2
496 Regional Technical Forum (RTF) as part of the Northwest Power & Conservation Council, Deemed Measures List. Agricultural: Variable Frequency Drives-Dairy, FY2012, V1.2. Accessed from RTF website http://rtf.nwcouncil.org/measures/Default.asp on February 27, 2013. Pre and post power meter data for five sites were used to establish RTF energy savings for this measure, and raw data used to generate the load profile referenced in this protocol can be found in the zip file on the “BPA Case Studies” tab.497 Default Value can be used by EDC but is subject to metering and adjustment by evaluators or SWE498 DEER Effective Useful Life. October 10, 2008.
SECTION 5 Demand ResponseDirect Load Control and Behavior-Based Demand Response Programs Page 546
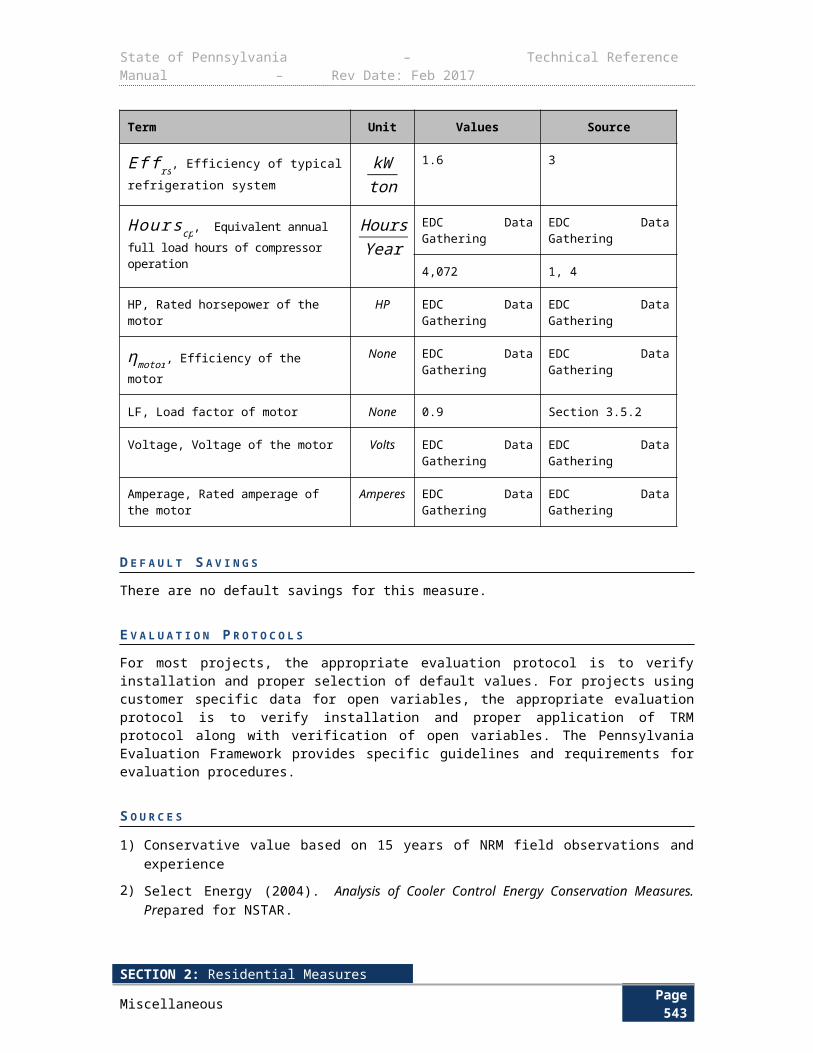
State of Pennsylvania – Technical Reference Manual – Rev Date: Feb 2017
provide mathematical definitions of the average peak period load impact estimate that would be calculated using an approved method.
∆ kW peak
¿∑i=1
n
ΔkW i
n(1)
ΔkW i = kW Referencei−kW Meteredi (2)
D E F I N I T I O N O F T E R M S
Table 5-2: Definition of Terms for Estimating DLC and Behavior-based Load Impacts
Term Unit Values Source
n, Number of DR hours during a program year for the EDC Hours EDC Data
GatheringEDC Data Gathering
Δ kW i, Estimated load impact achieved by an LC participant in hour i. This term can be positive (a load reduction) or negative (a load increase).
kW EDC Data Gathering
EDC Data Gathering
kW Referencei , Estimated customer load absent DR during hour i
kW EDC Data Gathering
EDC Data Gathering
kW Meteredi , Measured customer load during hour i kW EDC Data Gathering
EDC Data Gathering
D E F A U L T S A V I N G S
Default savings are not available for DLC or behavior-based programs.
E V A L U A T I O N P R O T O C O L S A N D R E Q U I R E D R E P O R T I N G
Technical details of the evaluation protocols for Direct Load Control measures and Behavior-based DR programs are described in the Phase III Evaluation Framework. The end result of following the protocols will be a common set of outputs that allow for an “apples-to-apples” comparison of load impacts across different DR resource options, event conditions and time. These outputs are designed to ensure that the documentation of methods and results allows knowledgeable reviewers to judge the quality and validity of the impact estimates.
SECTION 5 Demand ResponseDirect Load Control and Behavior-Based Demand Response Programs Page 547
State of Pennsylvania – Technical Reference Manual – Rev Date: Feb 2017
This Page Intentionally Left Blank
2016 TECHNICAL REFERENCE MANUALPage 548
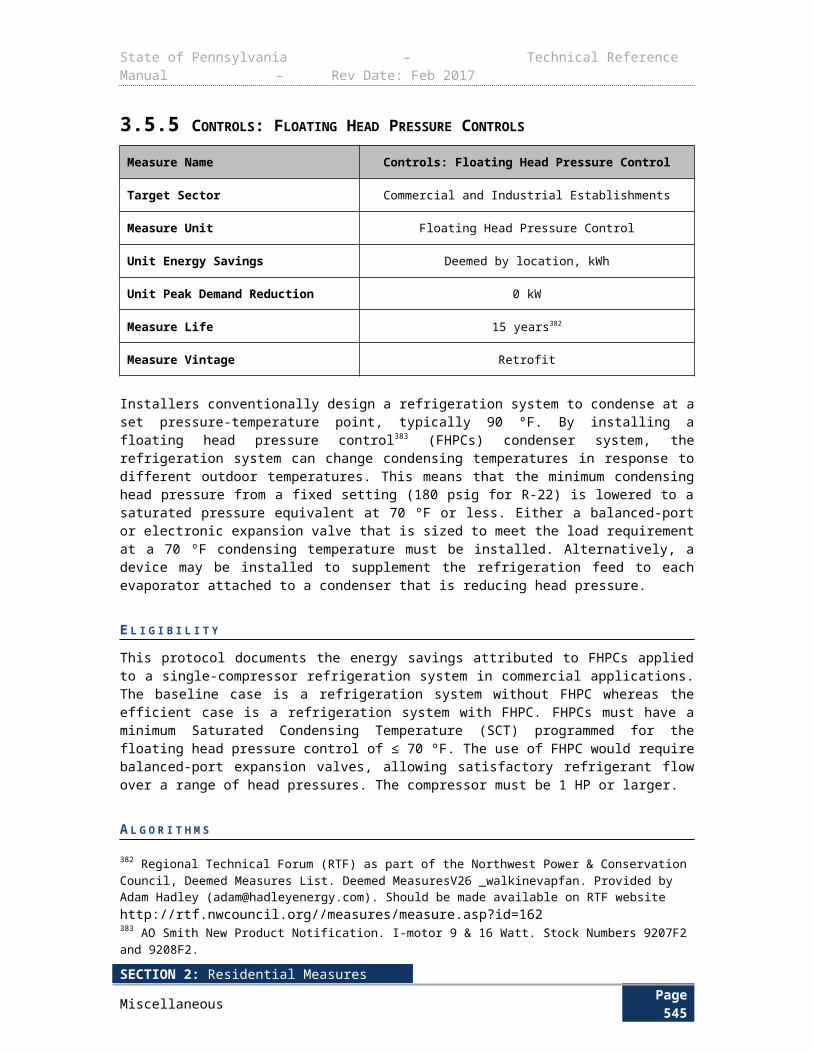
State of Pennsylvania – Technical Reference Manual – Rev Date: Feb 2017
6 APPENDICES6.1 APPENDIX A: MEASURE LIVES
Measure Lives Used in Cost-Effectiveness ScreeningAugust 2014
*For the purpose of calculating the total Resource Cost Test for Act 129, measure cannot claim savings for more than fifteen years.
Measure Measure LifeRESIDENTIAL SECTOR
Lighting End-UseElectroluminescent Nightlight 8
LED Nightlight 8
Compact Fluorescent Light Bulb 7.8
Recessed Can Fluorescent Fixture 20*
Torchieres 10
Fixtures Other 20*
ENERGY STAR LEDs 15
Residential Occupancy Sensors 10
Holiday Lights 10
HVAC End-UseCentral Air Conditioner (CAC) 14
Air Source Heat Pump 12
Central Air Conditioner proper sizing/install 14
Central Air Conditioner Quality Installation Verification 14
Central Air Conditioner Maintenance 7
Central Air Conditioner duct sealing 20
ENERGY STAR Room Air Conditioners 9
Air Source Heat Pump proper sizing/install 12
ENERGY STAR Thermostat (Central Air Conditioner) 15
ENERGY STAR Thermostat (Heat Pump) 15
Ground Source Heat Pump 30*
Room Air Conditioner Retirement 4
Furnace Whistle 14
Programmable Thermostat 11
Room AC (RAC) Retirement 4
Residential Whole House Fans 15
Ductless Mini-Split Heat Pumps 15
Fuel Switching: Electric Heat to Gas Heat 20*
Efficient Ventilation Fans with Timer 10
Packaged Terminal Systems 15
SECTION 6: AppendicesAppendix F: Zip Code Mapping Page 549
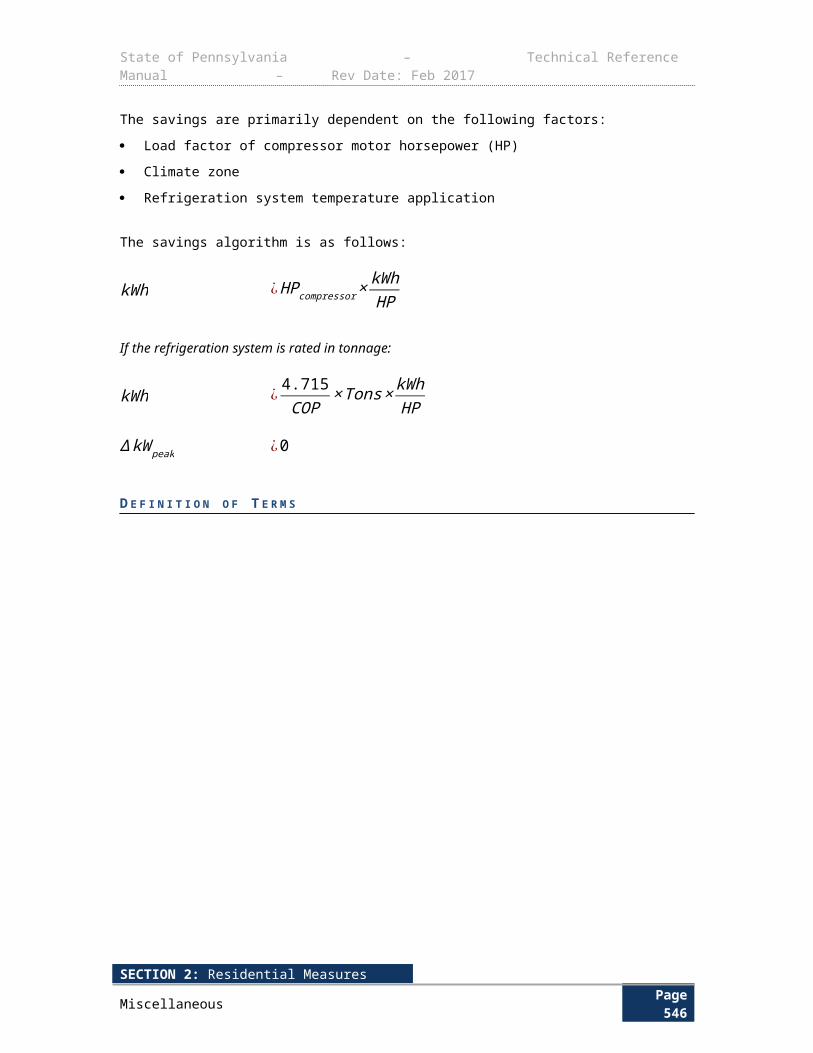
State of Pennsylvania – Technical Reference Manual – Rev Date: Feb 2017
Measure Measure LifeNew Construction (NC): Single Family - gas heat with CAC 20*
NC: Single Family - oil heat with CAC 20*
NC: Single Family - all electric 20*
NC: Multiple Single Family (Townhouse) – oil heat with CAC 20*
NC: Multiple Single Family (Townhouse) - all electric 20*
NC: Multi-Family – gas heat with CAC 20*
NC: Multi-Family - oil heat with CAC 20*
NC: Multi-Family - all electric 20*
Hot Water End-UseHeat Pump Water Heaters 10
Low Flow Faucet Aerators 10
Low Flow Showerheads 9
Solar Water Heaters 15
Electric Water Heater Pipe Insulation 13
Fuel Switching: Domestic Hot Water Electric to Gas or Propane Water Heater 11
Fuel Switching: Domestic Hot Water Electric to Oil Water Heater 8
Fuel Switching: Heat Pump Water Heater to Gas or Propane Water Heater 11
Fuel Switching: Heat Pump Water Heater to Oil Water Heater 8
Water Heater Tank Wrap 7
Appliances End-UseENERGY STAR Clothes Dryer 13
Refrigerator / Freezer Recycling without replacement 8
ENERGY STAR Refrigerators 12
ENERGY STAR Freezers 12
ENERGY STAR Clothes Washers 11
ENERGY STAR Dishwashers 10
ENERGY STAR Dehumidifiers 12
ENERGY STAR Water Coolers 10
ENERGY STAR Ceiling Fans 20*
Consumer Electronics End-UseENERGY STAR Televisions 6
Smart Strip Plug Outlets 5
ENERGY STAR Computer 4
ENERGY STAR Monitor 5
ENERGY STAR Fax 4
ENERGY STAR Multifunction Device 6
ENERGY STAR Printer 5
SECTION 6: AppendicesAppendix F: Zip Code Mapping Page 550
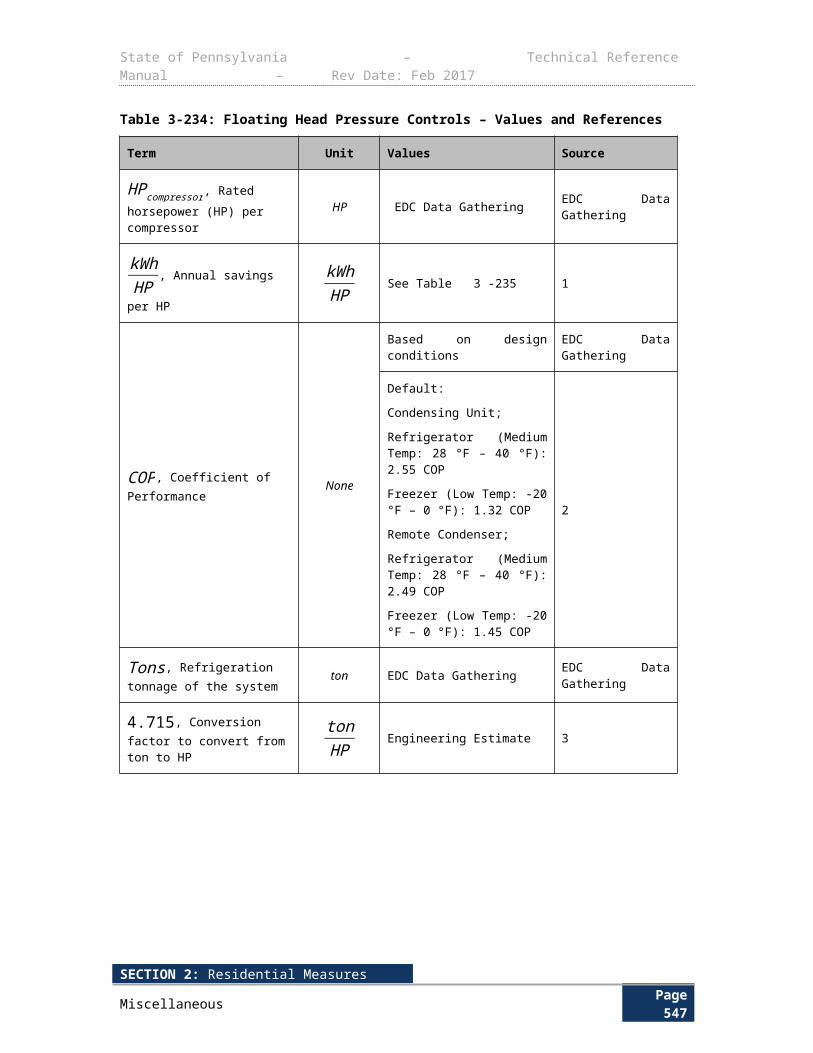
State of Pennsylvania – Technical Reference Manual – Rev Date: Feb 2017
Measure Measure LifeENERGY STAR Copier 6
Building Shell End-UseCeiling / Attic and Wall Insulation 15
Window -heat pump 20*
Window -gas heat with central air conditioning 20*
Window – electric heat without central air conditioning 20*
Window – electric heat with central air conditioning 20*
Home Audit Conservation Kits 8.1
Home Performance with ENERGY STAR 5
Residential Air Sealing 15
Crawl Space Wall Insulation 15
Rim Joist Insulation 15
MiscellaneousPool Pump Load Shifting 1
High Efficiency Two-Speed Pool Pump 10
Variable Speed Pool Pumps (with Load Shifting Option) 10
COMMERCIAL & INDUSTRIAL SECTORLighting End-UseLighting Improvements499
New Linear Fluorescent Fixture 15
Lamp Only: LED, Screw-in 15
Lamp Only: CFL, Screw-in 3
Lamp Only: Cold Cathode CFL 4
Lamp Only: CFL, Hardwired 3
Lamp Only: Induction Lamps 6
Lamp Only: Metal Halide Lamps 6
Lamp Only: High Pressure Sodium Lamps 12
Lamp Only: Mercury Vapor Lamps 6
Lamp Only: T8 Lamps 10
Lamp Only: LED, Linear 15
New Construction Lighting 15
Lighting Controls 8
Traffic Lights 10
LED Exit Signs 16*
LED Channel Signage 15
LED Refrigeration Case Lighting 8
499 Detailed technical guidance for matching techniques is provided in the Phase III Evaluation Framework.
SECTION 6: AppendicesAppendix F: Zip Code Mapping Page 551
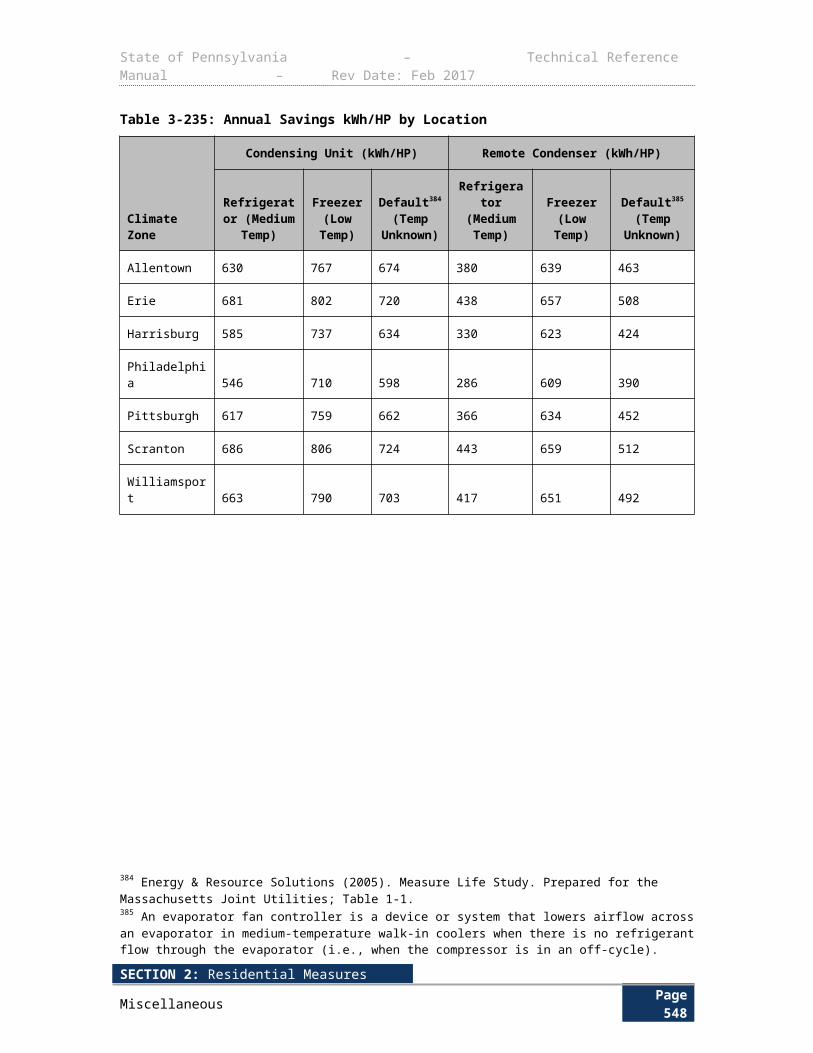
State of Pennsylvania – Technical Reference Manual – Rev Date: Feb 2017
Measure Measure LifeHVAC End-UseHVAC Systems — 15
Electric Chillers — 20*
Water Source and Geothermal Heat Pumps 15
Ductless Mini-Split Heat Pumps - Commercial < 5.4 tons 15
Commercial Chiller Optimization 18*
Fuel Switching: Small Commercial Electric Heat to Natural Gas/ Propane/ Oil Heat 20*
Small C/I HVAC Refrigerant Charge Correction 10
ENERGY STAR Room Air Conditioner 12
Controls: Guest Room Occupancy Sensor 15
Controls: Economizer 10
Motors & VFDs End-UsePremium Efficiency Motors — 15
Variable Frequency Drive (VFD) Improvements — 13
Variable Frequency Drive (VFD) Improvement for Industrial Air Compressors 20*
ECM Circulating Fan 18
VSD on Kitchen Exhaust Fan 15
Domestic Hot Water End-UseHeat Pump Water Heaters 10
Low Flow Pre-Rinse Sprayers for Retrofit Programs 5
Low Flow Pre-Rinse Sprayers for Time of Sale / Retail Programs 5Fuel Switching: Electric Resistance Water Heaters to Gas or Propane Water Heater 11
Fuel Switching: Electric Resistance Water Heaters to Oil Water Heater 8
Fuel Switching: Heat Pump Water Heater to Gas or Propane Water Heater 11
Fuel Switching: Heat Pump Water Heater to Oil Water Heater 8
Refrigeration End-UseHigh-Efficiency Refrigeration/Freezer Cases 12
High-Efficiency Evaporator Fan Motors for Reach-In Refrigerated Cases 15
High-Efficiency Evaporator Fan Motors for Walk-In Refrigerated Cases 15
–Controls: Evaporator Fan Controllers 10
–Controls: Floating Head Pressure Controls 15
Controls: Anti-Sweat Heater Controls 12
Controls: Evaporator Coil Defrost Control 10
–Variable Speed Refrigeration Compressor 15
Strip Curtains for Walk-In Freezers and Coolers 4
Night Covers for Display Cases 5
Auto Closers 8
SECTION 6: AppendicesAppendix F: Zip Code Mapping Page 552
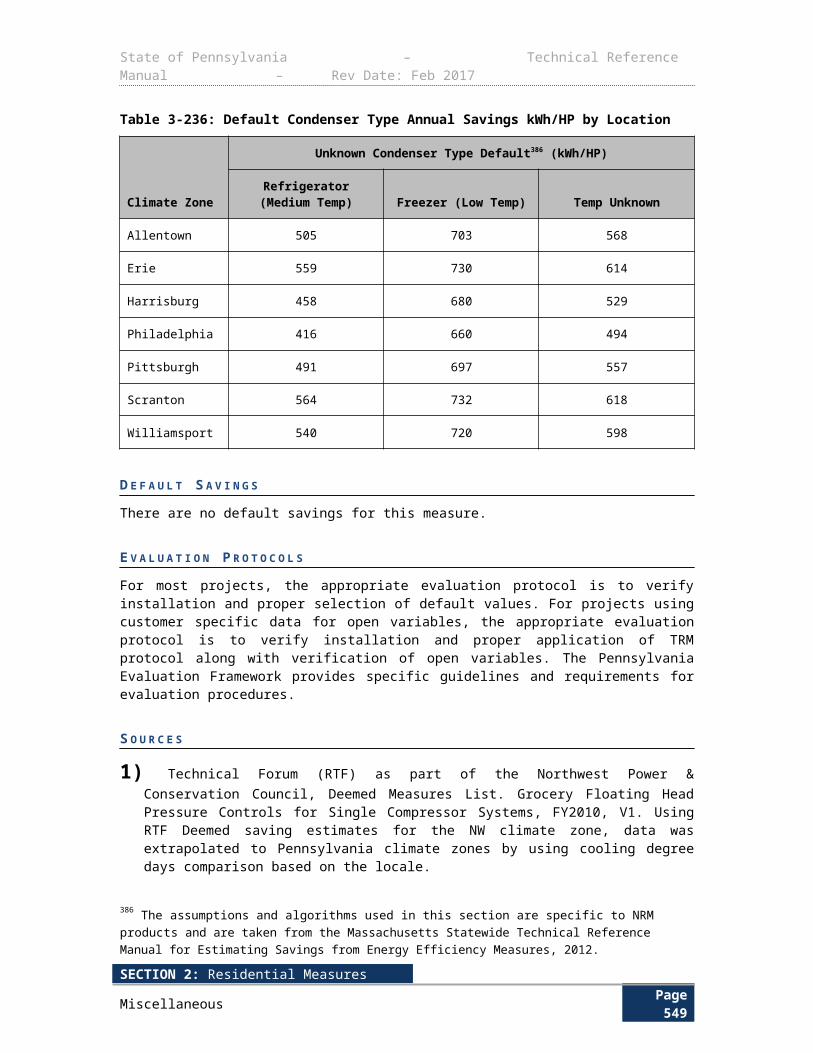
State of Pennsylvania – Technical Reference Manual – Rev Date: Feb 2017
Measure Measure LifeDoor Gaskets for Walk-in and Reach-in Coolers and Freezers 4
Special Doors with Low or No Anti-Sweat Heat for Low Temp Case 15
Suction Pipes Insulation for Walk-in Coolers and Freezers 11
Refrigerated Display Cases with Doors Replacing Open Cases 12
Adding Doors to Existing Refrigerated Display Cases 12
Appliances End-UseENERGY STAR Clothes Washer Multifamily 11.3
ENERGY STAR Clothes Washer Laundromats 7.1
Food Service Equipment End-UseHigh-Efficiency Ice Machines 10
Controls: Beverage Machine Controls 5
Controls: Snack Machine Controls 5
ENERGY STAR Electric Steam Cooker 12
ENERGY STAR Refrigerated Beverage Vending Machine 14
Building Shell End-UseWall and Ceiling Insulation 15
Consumer Electronics End-UseENERGY STAR Computer 4
ENERGY STAR Monitor 4
ENERGY STAR Fax 4
ENERGY STAR Multifunction Device 6
ENERGY STAR Printer 5
ENERGY STAR Copier 6
Office Equipment - Network Power Management Enabling 5
Smart Strip Plug Outlets 5
Compressed AirCycling Refrigerated Thermal Mass Dryer 10
Air-entraining Air Nozzle 15
No-Loss Condensate Drains 5
Air Tanks for Load/No Load Compressors 15
MiscellaneousCommercial Comprehensive New Construction Design 18*
O&M Savings 3
ENERGY STAR Servers 4
SECTION 6: AppendicesAppendix F: Zip Code Mapping Page 553

State of Pennsylvania – Technical Reference Manual – Rev Date: Feb 2017
Measure Measure LifeAgricultural End-UseAutomatic Milker Takeoffs 10
Dairy Scroll Compressors 15
High Efficiency Ventilation Fans (with or without Thermostats) 10
Heat Reclaimers 15
High Volume Low Speed Fans 15
Livestock Waterer 10
Variable Speed Drive (VSD) Controller on Dairy Vacuum Pumps 15
Low Pressure Irrigation System 5
DEMAND RESPONSELoad Curtailment for Commercial and Industrial Programs 1
Direct Load Control and Behavior-Based Demand Response Programs 10
SECTION 6: AppendicesAppendix F: Zip Code Mapping Page 554
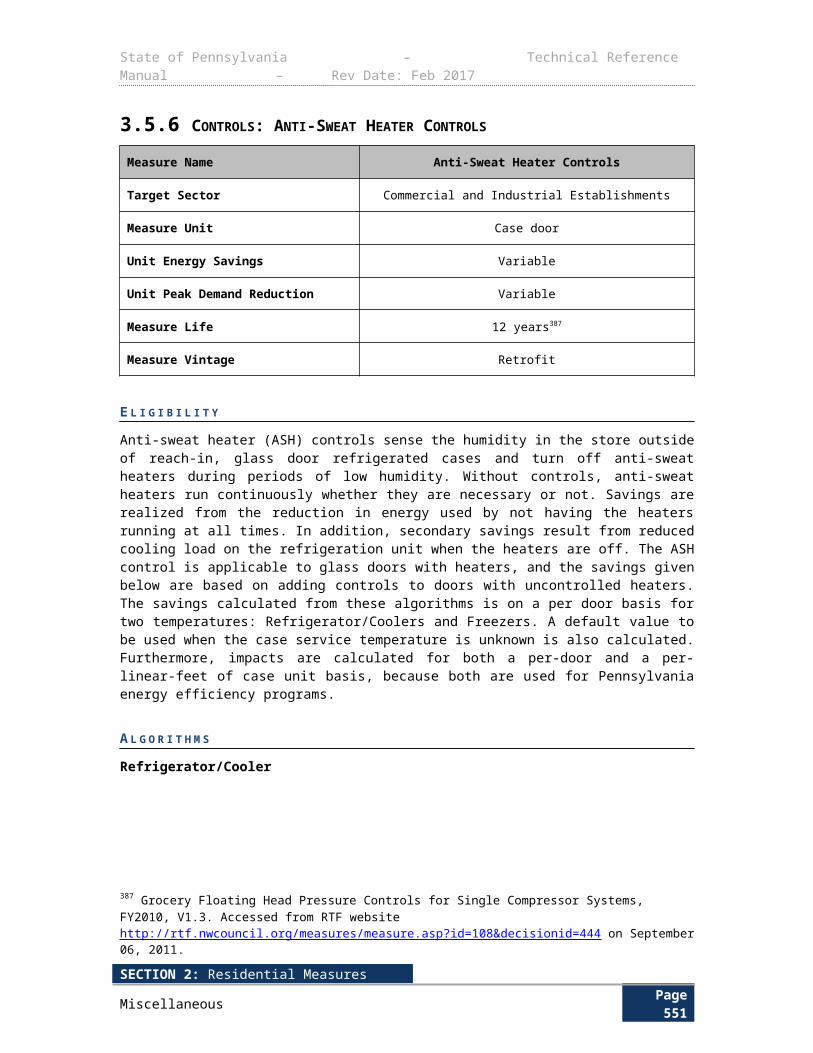
State of Pennsylvania – Technical Reference Manual – Rev Date: Feb 2017
6.2 APPENDIX B: RELATIONSHIP BETWEEN PROGRAM SAVINGS AND EVALUATION SAVINGS
There is a distinction between activities required to conduct measurement and verification of savings at the program participant level and the activities conducted by program evaluators and the SWE to validate those savings. However, the underlying standard for the measurement of the savings for both of these activities is the measurement and verification protocols approved by the PA PUC. These protocols are of two different types:
1) TRM specified protocols for standard measures, originally approved in the May 2009 order adopting the TRM
2) Interim Protocols for standard measures, reviewed and recommended by the SWE and approved for use by the Director of the CEEP, subject to modification and incorporation into succeeding TRM versions to be approved by the PA PUC
These protocols are to be uniform and used to measure and calculate savings throughout Pennsylvania. The TRM protocols are comprised of Deemed Measures and Partially Deemed Measures. Deemed Measures specify saving per energy efficiency measure and require verifying that the measure has been installed, or in cases where that is not feasible, that the measure has been purchased by a utility customer. Partially Deemed Measures require both verification of installation and the measurement or quantification of open variables in the protocol.
Stipulated and deemed numbers are valid relative to a particular classification of “standard” measures. In the determination of these values, a normal distribution of values should have been incorporated. Therefore, during the measurement and verification process, participant savings measures cannot be arbitrarily treated as “custom measures” if the category allocation is appropriate.
Custom measures are outside the scope of the TRM. The EDCs are not required to submit savings protocols for custom measures to the Commission or the SWE for each measure/technology type prior to implementing the custom measure. The Commission recommends that these protocols be established in general conformity to the IPMVP or Federal Energy Management Program M&V Guidelines. The SWE reserves the right to audit and review claimed and verified impacts of all custom measures as part of its role to perform EM&V services for the Commission.
Utility evaluators and the SWE will adjust the savings reported by program staff based on the application of the PA PUC approved protocols to a sample population and realization rates will be based on the application of these same standards. To the extent that the protocols or deemed values included in these protocols require modification, the appropriate statewide approval process will be utilized. These changes will be prospective.
SECTION 6: AppendicesAppendix F: Zip Code Mapping Page 555
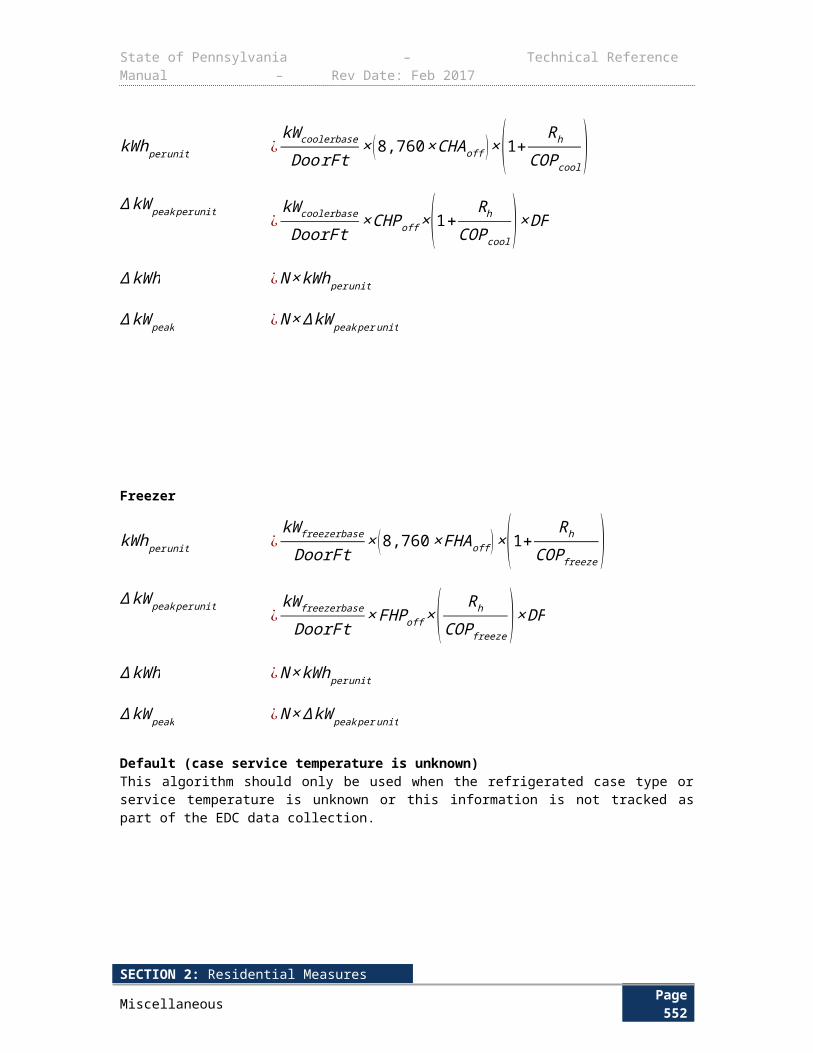
State of Pennsylvania – Technical Reference Manual – Rev Date: Feb 2017
6.3 APPENDIX C: LIGHTING AUDIT AND DESIGN TOOLThe Lighting Audit and Design Tool is located on the Public Utility Commission’s website at: http://www.puc.pa.gov/filing_resources/issues_laws_regulations/act_129_information/technical_reference_manual.aspx
SECTION 6: AppendicesAppendix F: Zip Code Mapping Page 556
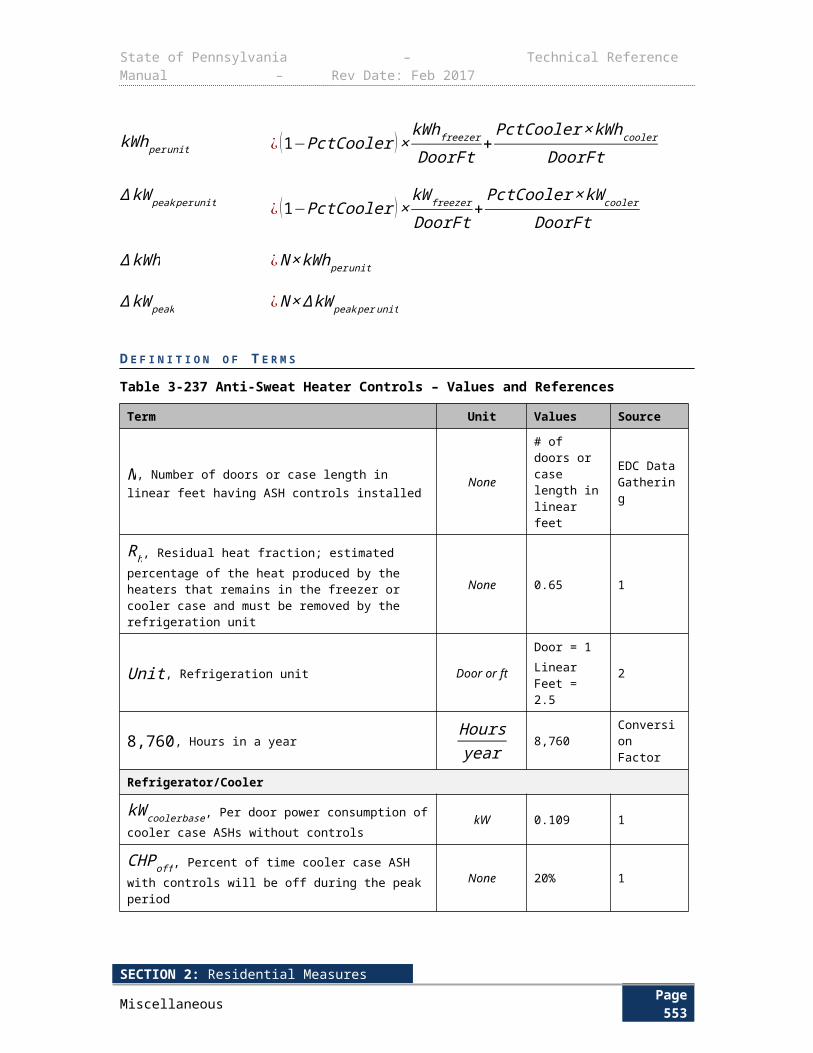
State of Pennsylvania – Technical Reference Manual – Rev Date: Feb 2017
6.4 APPENDIX D: MOTOR & VFD AUDIT AND DESIGN TOOLThe Motor and VFD Inventory Form is located on the Public Utility Commission’s website at: http://www.puc.pa.gov/filing_resources/issues_laws_regulations/act_129_information/technical_reference_manual.aspx.
SECTION 6: AppendicesAppendix F: Zip Code Mapping Page 557
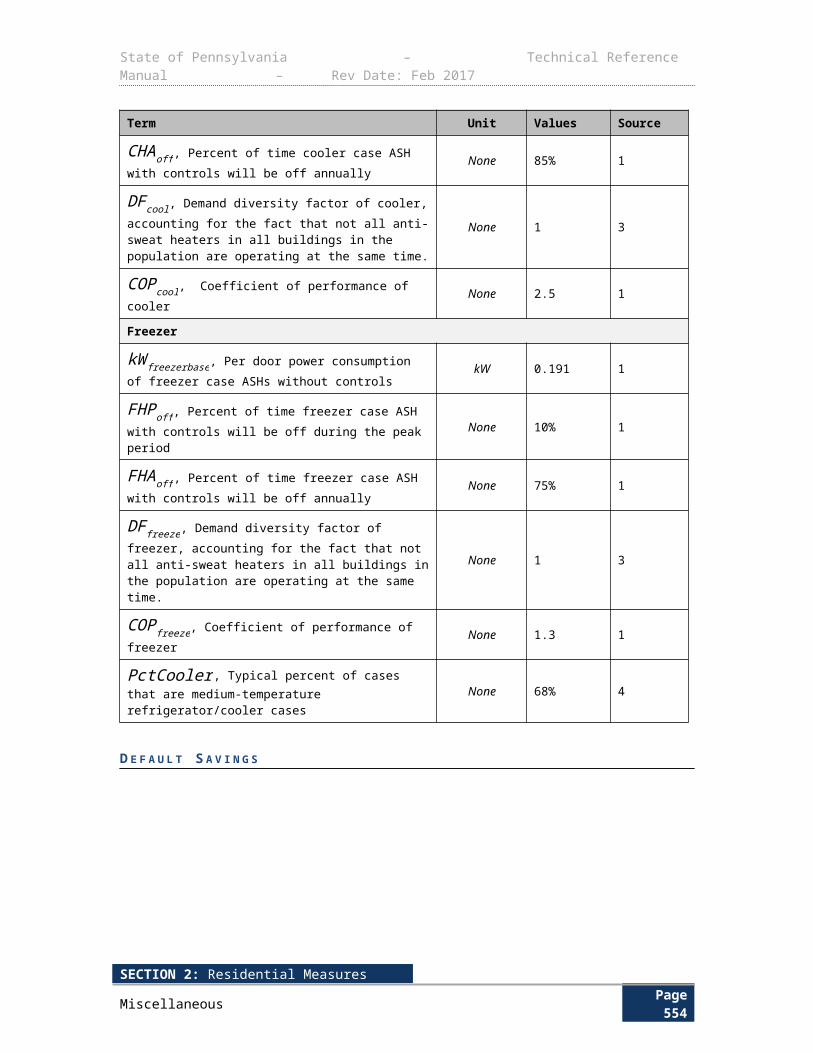
State of Pennsylvania – Technical Reference Manual – Rev Date: Feb 2017
6.5 APPENDIX E: ELIGIBILITY REQUIREMENTS FOR SOLID STATE LIGHTING PRODUCTS IN COMMERCIAL AND INDUSTRIAL APPLICATIONS
The SSL market has been inundated with a great variety of products, including those that do not live up to manufacturers’ claims. Several organizations, such as ENERGY STAR and Design Lights Consortium have responded by following standardized testing procedures and setting minimum requirements to be identified as a qualified product under those organizations.
6.5.1 SOLID STATE LIGHTING
Due to the diversity of product technologies and current lack of uniform industry standards, it is impossible to point to one source as the complete list of qualifying SSL products for inclusion in Act 129 efficiency programs. A combination of industry-accepted references have been collected to generate minimum criteria for the most complete list of products while not sacrificing quality and legitimacy of savings.
All SSL products must be submitted for three tests before they can be distributed. The In Situ Temperature Measurement Test (ISTMT) measures the LED source case temperature within the LED system while it is operating in its designed position and environment. The LM-79 test measures the electrical and photometric details of an SSL product including the total luminous flux, luminous intensity distribution, electrical power, efficacy, and color characteristics. The LM-80 test measures the lumen maintenance of a product to determine the point at which the light emitted from an LED depreciates to a level where it is no longer considered adequate for a specific application.
ENERGY STAR (a standard developed by the Environmental Protection Agency and the Department of Energy) and the Design Lights Consortium (a project developed by the Northeast Energy Efficiency Partnership) both provide “Qualified Products Lists” for consumer use in selecting the most efficient equipment. Both standards set minimum requirements for all categories tested under ISTMT, LM-79, and LM-80 tests. Besides meeting the minimum requirements, both standards also require that the testing be done at a testing facility approved by the standard’s governing agency.
For Act 129 energy efficiency measure saving qualification, products must meet the minimum requirements of either agency. Products found on the Qualified Products List500 set by either agency can be submitted for Act 129 energy efficiency programs with no additional supporting information. Products meeting the minimum requirements but not listed can still be considered for inclusion in Act 129 energy efficiency programs by submitting the following documentation to show compliance with the minimum product category criteria as described above:
Manufacturer’s product information sheet LED package/fixture specification sheet List the ENERGY STAR or DLC product category for which the luminaire qualifies Summary table listing the minimum reference criteria and the corresponding product values
for the following variables:o Light output in lumenso Luminaire efficacy (lm/W)o Color rendering index (CRI)o Correlated color temperature (CCT)o LED lumen maintenance at 6000 hrs
500 See the Phase III Evaluation Framework for a discussion of the advantages of matching over within-subjects methods.
SECTION 6: AppendicesAppendix F: Zip Code Mapping Page 558
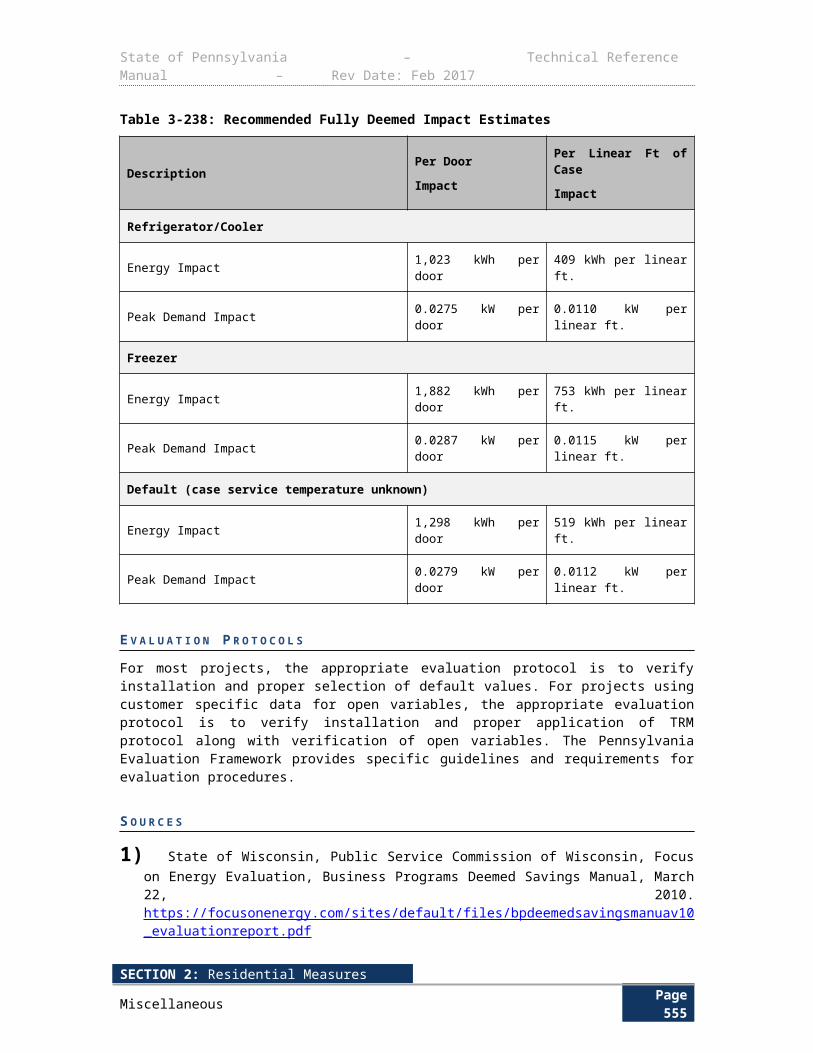
State of Pennsylvania – Technical Reference Manual – Rev Date: Feb 2017
o Manufacturer’s estimated lifetime for L70 (70% lumen maintenance at end of useful life) (manufacturer should provide methodology for calculation and justification of product lifetime estimates)
o Operating frequency of the lamp IESNA LM-79-08 test report(s) (from approved labs specified in DOE Manufacturers’ Guide)
containing:o Photometric measurements (i.e. light output and efficacy)o Colorimetry report (i.e. CCT and CRI)o Electrical measurements (i.e. input voltage and current, power, power factor, etc.)
Lumen maintenance report (select one of the two options and submit all of its corresponding required documents):
o Option 1: Compliance through component performance (for the corresponding LED package)
IESNA LM-80 test report In-situ temperature measurements test (ISTMT) report. Schematic/photograph from LED package manufacturer that shows the
specified temperature measurement point (TMP)o Option 2: Compliance through luminaire performance
IESNA LM-79-08 report at 0 hours (same file as point c) IESNA LM-79-08 report at 6000 hours after continuous operation in the
appropriate ANSI/UL 1598 environment (use ANSI/UL 1574 for track lighting systems).
All supporting documentation must include a specific, relevant model or part number.
SECTION 6: AppendicesAppendix F: Zip Code Mapping Page 559
State of Pennsylvania – Technical Reference Manual – Rev Date: Feb 2017
6.6 APPENDIX F: ZIP CODE MAPPINGPer Section 1.17, the following table is to be used to determine the appropriate reference city for each Pennsylvania zip code.
Zip Reference City15001 Pittsburgh15003 Pittsburgh15004 Pittsburgh15005 Pittsburgh15006 Pittsburgh15007 Pittsburgh15009 Pittsburgh15010 Pittsburgh15012 Pittsburgh15014 Pittsburgh15015 Pittsburgh15017 Pittsburgh15018 Pittsburgh15019 Pittsburgh15020 Pittsburgh15021 Pittsburgh15022 Pittsburgh15024 Pittsburgh15025 Pittsburgh15026 Pittsburgh15027 Pittsburgh15028 Pittsburgh15030 Pittsburgh15031 Pittsburgh15032 Pittsburgh15033 Pittsburgh15034 Pittsburgh15035 Pittsburgh15036 Pittsburgh15037 Pittsburgh15038 Pittsburgh15042 Pittsburgh15043 Pittsburgh15044 Pittsburgh15045 Pittsburgh15046 Pittsburgh15047 Pittsburgh15049 Pittsburgh15050 Pittsburgh15051 Pittsburgh15052 Pittsburgh15053 Pittsburgh15054 Pittsburgh15055 Pittsburgh
SECTION 6: AppendicesAppendix F: Zip Code Mapping Page 560
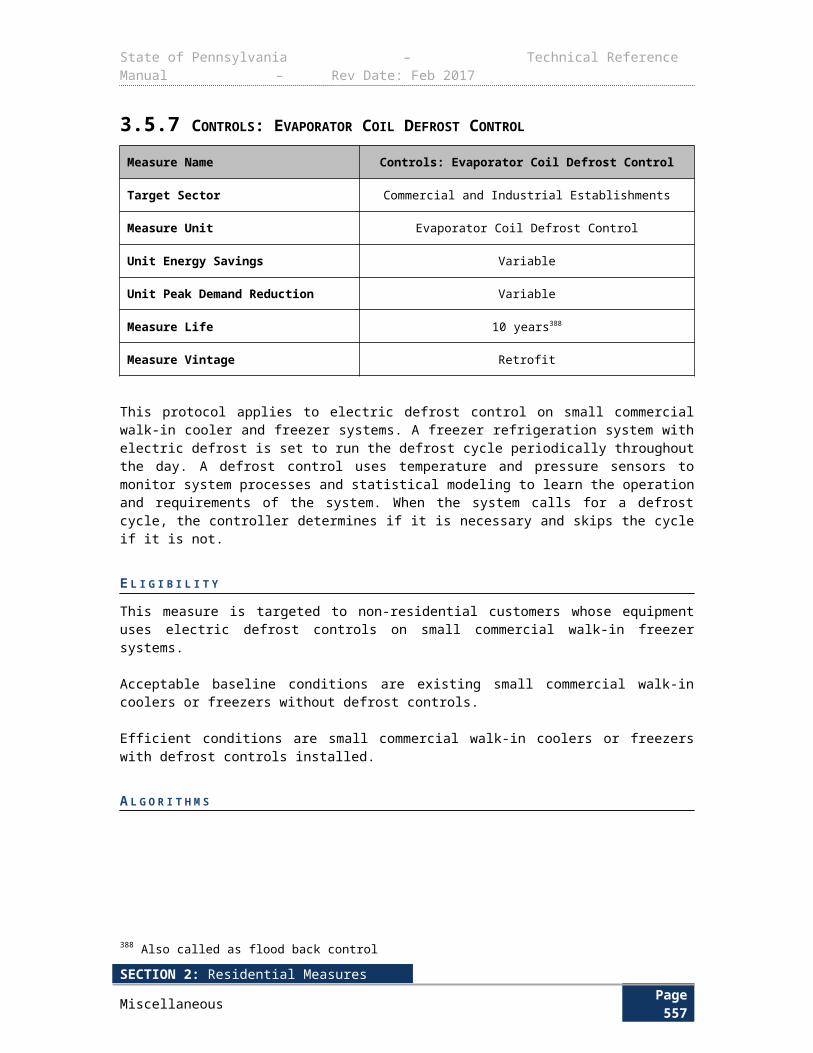
State of Pennsylvania – Technical Reference Manual – Rev Date: Feb 2017
Zip Reference City15056 Pittsburgh15057 Pittsburgh15059 Pittsburgh15060 Pittsburgh15061 Pittsburgh15062 Pittsburgh15063 Pittsburgh15064 Pittsburgh15065 Pittsburgh15066 Pittsburgh15067 Pittsburgh15068 Pittsburgh15069 Pittsburgh15071 Pittsburgh15072 Pittsburgh15074 Pittsburgh15075 Pittsburgh15076 Pittsburgh15077 Pittsburgh15078 Pittsburgh15081 Pittsburgh15082 Pittsburgh15083 Pittsburgh15084 Pittsburgh15085 Pittsburgh15086 Pittsburgh15087 Pittsburgh15088 Pittsburgh15089 Pittsburgh15090 Pittsburgh15091 Pittsburgh15095 Pittsburgh15096 Pittsburgh15101 Pittsburgh15102 Pittsburgh15104 Pittsburgh15106 Pittsburgh15108 Pittsburgh15110 Pittsburgh15112 Pittsburgh15116 Pittsburgh15120 Pittsburgh15122 Pittsburgh15123 Pittsburgh15126 Pittsburgh15127 Pittsburgh15129 Pittsburgh15130 Pittsburgh15131 Pittsburgh
Zip Reference City15132 Pittsburgh15133 Pittsburgh15134 Pittsburgh15135 Pittsburgh15136 Pittsburgh15137 Pittsburgh15139 Pittsburgh15140 Pittsburgh15142 Pittsburgh15143 Pittsburgh15144 Pittsburgh15145 Pittsburgh15146 Pittsburgh15147 Pittsburgh15148 Pittsburgh15189 Pittsburgh15201 Pittsburgh15202 Pittsburgh15203 Pittsburgh15204 Pittsburgh15205 Pittsburgh15206 Pittsburgh15207 Pittsburgh15208 Pittsburgh15209 Pittsburgh15210 Pittsburgh15211 Pittsburgh15212 Pittsburgh15213 Pittsburgh15214 Pittsburgh15215 Pittsburgh15216 Pittsburgh15217 Pittsburgh15218 Pittsburgh15219 Pittsburgh15220 Pittsburgh15221 Pittsburgh15222 Pittsburgh15223 Pittsburgh15224 Pittsburgh15225 Pittsburgh15226 Pittsburgh15227 Pittsburgh15228 Pittsburgh15229 Pittsburgh15230 Pittsburgh15231 Pittsburgh15232 Pittsburgh15233 Pittsburgh
SECTION 6: AppendicesAppendix F: Zip Code Mapping Page 561
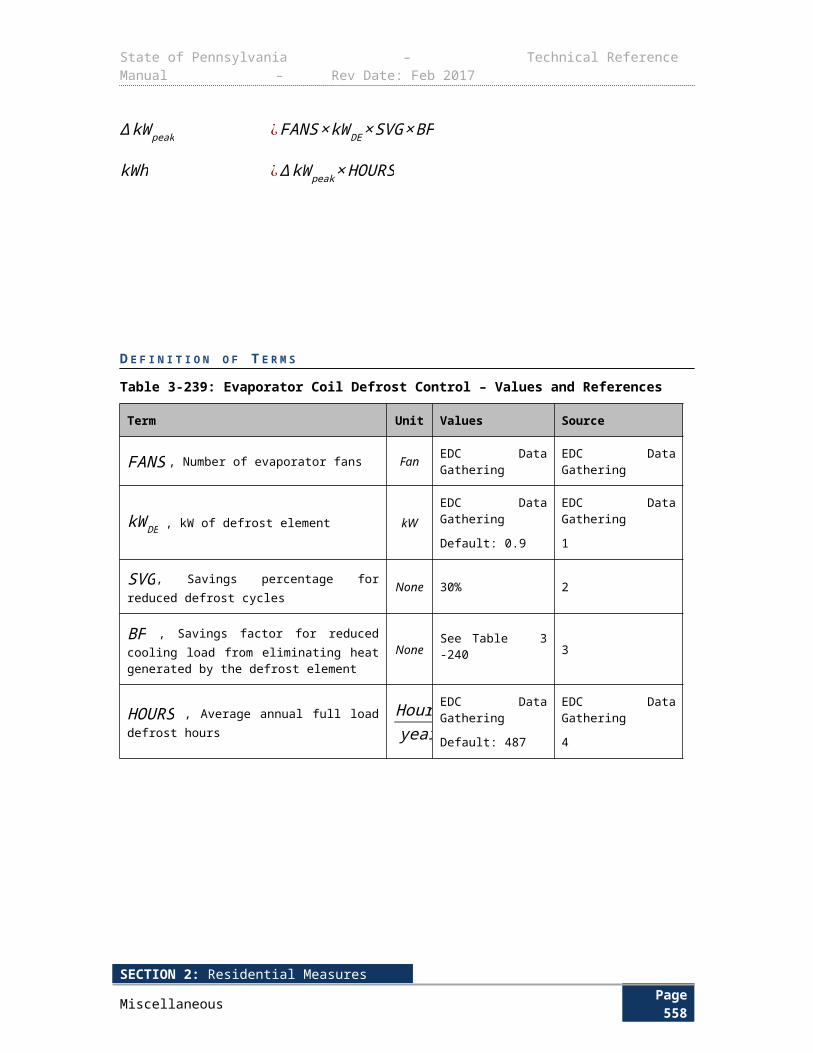
State of Pennsylvania – Technical Reference Manual – Rev Date: Feb 2017
15234 Pittsburgh15235 Pittsburgh15236 Pittsburgh15237 Pittsburgh15238 Pittsburgh15239 Pittsburgh15240 Pittsburgh15241 Pittsburgh15242 Pittsburgh15243 Pittsburgh15244 Pittsburgh15250 Pittsburgh15251 Pittsburgh15252 Pittsburgh15253 Pittsburgh15254 Pittsburgh15255 Pittsburgh15257 Pittsburgh15258 Pittsburgh15259 Pittsburgh15260 Pittsburgh15261 Pittsburgh15262 Pittsburgh15263 Pittsburgh15264 Pittsburgh15265 Pittsburgh15267 Pittsburgh15268 Pittsburgh15270 Pittsburgh15272 Pittsburgh15274 Pittsburgh15275 Pittsburgh15276 Pittsburgh15277 Pittsburgh15278 Pittsburgh15279 Pittsburgh15281 Pittsburgh15282 Pittsburgh15283 Pittsburgh15285 Pittsburgh15286 Pittsburgh15829 Pittsburgh15290 Pittsburgh15295 Pittsburgh15301 Pittsburgh15310 Pittsburgh15311 Pittsburgh15312 Pittsburgh15313 Pittsburgh15314 Pittsburgh
15315 Pittsburgh15316 Pittsburgh15317 Pittsburgh15320 Pittsburgh15321 Pittsburgh15322 Pittsburgh15323 Pittsburgh15324 Pittsburgh15325 Pittsburgh15327 Pittsburgh15329 Pittsburgh15330 Pittsburgh15331 Pittsburgh15332 Pittsburgh15333 Pittsburgh15334 Pittsburgh15336 Pittsburgh15337 Pittsburgh15338 Pittsburgh15339 Pittsburgh15340 Pittsburgh15341 Pittsburgh15342 Pittsburgh15344 Pittsburgh15345 Pittsburgh15346 Pittsburgh15347 Pittsburgh15348 Pittsburgh15349 Pittsburgh15350 Pittsburgh15351 Pittsburgh15352 Pittsburgh15353 Pittsburgh15354 Pittsburgh15357 Pittsburgh15358 Pittsburgh15359 Pittsburgh15360 Pittsburgh15361 Pittsburgh15362 Pittsburgh15363 Pittsburgh15364 Pittsburgh15365 Pittsburgh15366 Pittsburgh15367 Pittsburgh15368 Pittsburgh15370 Pittsburgh15376 Pittsburgh15377 Pittsburgh15378 Pittsburgh
15379 Pittsburgh15380 Pittsburgh15401 Pittsburgh15410 Pittsburgh15411 Pittsburgh15412 Pittsburgh15413 Pittsburgh15415 Pittsburgh15416 Pittsburgh15417 Pittsburgh15419 Pittsburgh15420 Pittsburgh15421 Pittsburgh15422 Pittsburgh15423 Pittsburgh15424 Pittsburgh15425 Pittsburgh15427 Pittsburgh15428 Pittsburgh15429 Pittsburgh15430 Pittsburgh15431 Pittsburgh15432 Pittsburgh15433 Pittsburgh15434 Pittsburgh15435 Pittsburgh15436 Pittsburgh15437 Pittsburgh15438 Pittsburgh15439 Pittsburgh15440 Pittsburgh15442 Pittsburgh15443 Pittsburgh15444 Pittsburgh15445 Pittsburgh15446 Pittsburgh15447 Pittsburgh15448 Pittsburgh15449 Pittsburgh15450 Pittsburgh15451 Pittsburgh15454 Pittsburgh15455 Pittsburgh15456 Pittsburgh15458 Pittsburgh15459 Pittsburgh15460 Pittsburgh15461 Pittsburgh15462 Pittsburgh15463 Pittsburgh
SECTION 6: AppendicesAppendix F: Zip Code Mapping Page 562
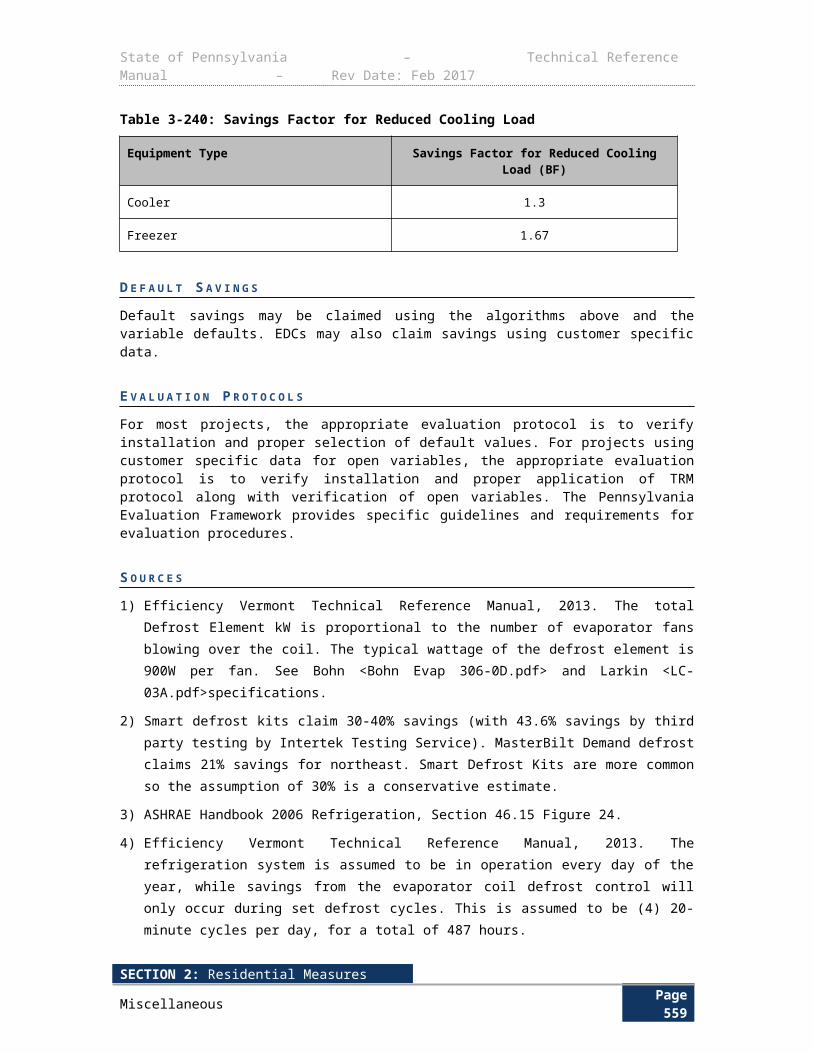
State of Pennsylvania – Technical Reference Manual – Rev Date: Feb 2017
15464 Pittsburgh15465 Pittsburgh15466 Pittsburgh15467 Pittsburgh15468 Pittsburgh15469 Pittsburgh15470 Pittsburgh15472 Pittsburgh15473 Pittsburgh15474 Pittsburgh15475 Pittsburgh15476 Pittsburgh15477 Pittsburgh15478 Pittsburgh15479 Pittsburgh15480 Pittsburgh15482 Pittsburgh15483 Pittsburgh15484 Pittsburgh15485 Pittsburgh15486 Pittsburgh15488 Pittsburgh15489 Pittsburgh15490 Pittsburgh15492 Pittsburgh15501 Pittsburgh15502 Pittsburgh15510 Pittsburgh15520 Pittsburgh15521 Pittsburgh15522 Pittsburgh15530 Pittsburgh15531 Pittsburgh15532 Pittsburgh15533 Harrisburg15534 Pittsburgh15535 Pittsburgh15536 Harrisburg15537 Harrisburg15538 Pittsburgh15539 Pittsburgh15540 Pittsburgh15541 Pittsburgh15542 Pittsburgh15544 Pittsburgh15545 Pittsburgh15546 Pittsburgh15547 Pittsburgh15548 Pittsburgh15549 Pittsburgh
15550 Pittsburgh15551 Pittsburgh15552 Pittsburgh15553 Pittsburgh15554 Pittsburgh15555 Pittsburgh15557 Pittsburgh15558 Pittsburgh15559 Pittsburgh15560 Pittsburgh15561 Pittsburgh15562 Pittsburgh15563 Pittsburgh15564 Pittsburgh15565 Pittsburgh15601 Pittsburgh15605 Pittsburgh15606 Pittsburgh15610 Pittsburgh15611 Pittsburgh15612 Pittsburgh15613 Pittsburgh15615 Pittsburgh15616 Pittsburgh15617 Pittsburgh15618 Pittsburgh15619 Pittsburgh15620 Pittsburgh15621 Pittsburgh15622 Pittsburgh15623 Pittsburgh15624 Pittsburgh15625 Pittsburgh15626 Pittsburgh15627 Pittsburgh15628 Pittsburgh15629 Pittsburgh15631 Pittsburgh15632 Pittsburgh15633 Pittsburgh15634 Pittsburgh15635 Pittsburgh15636 Pittsburgh15637 Pittsburgh15638 Pittsburgh15639 Pittsburgh15640 Pittsburgh15641 Pittsburgh15642 Pittsburgh15644 Pittsburgh
15646 Pittsburgh15647 Pittsburgh15650 Pittsburgh15655 Pittsburgh15656 Pittsburgh15658 Pittsburgh15660 Pittsburgh15661 Pittsburgh15662 Pittsburgh15663 Pittsburgh15664 Pittsburgh15665 Pittsburgh15666 Pittsburgh15668 Pittsburgh15670 Pittsburgh15671 Pittsburgh15672 Pittsburgh15673 Pittsburgh15674 Pittsburgh15675 Pittsburgh15676 Pittsburgh15677 Pittsburgh15678 Pittsburgh15679 Pittsburgh15680 Pittsburgh15681 Pittsburgh15682 Pittsburgh15683 Pittsburgh15684 Pittsburgh15685 Pittsburgh15686 Pittsburgh15687 Pittsburgh15688 Pittsburgh15689 Pittsburgh15690 Pittsburgh15691 Pittsburgh15692 Pittsburgh15693 Pittsburgh15695 Pittsburgh15696 Pittsburgh15697 Pittsburgh15698 Pittsburgh15701 Pittsburgh15705 Pittsburgh15710 Pittsburgh15711 Pittsburgh15712 Pittsburgh15713 Pittsburgh15714 Pittsburgh15715 Pittsburgh
SECTION 6: AppendicesAppendix F: Zip Code Mapping Page 563

State of Pennsylvania – Technical Reference Manual – Rev Date: Feb 2017
15716 Pittsburgh15717 Pittsburgh15720 Pittsburgh15721 Pittsburgh15722 Pittsburgh15723 Pittsburgh15724 Pittsburgh15725 Pittsburgh15727 Pittsburgh15728 Pittsburgh15729 Pittsburgh15730 Pittsburgh15731 Pittsburgh15732 Pittsburgh15733 Pittsburgh15734 Pittsburgh15736 Pittsburgh15737 Pittsburgh15738 Pittsburgh15739 Pittsburgh15740 Pittsburgh15741 Pittsburgh15742 Pittsburgh15744 Pittsburgh15745 Pittsburgh15746 Pittsburgh15747 Pittsburgh15748 Pittsburgh15750 Pittsburgh15752 Pittsburgh15753 Pittsburgh15754 Pittsburgh15756 Pittsburgh15757 Pittsburgh15758 Pittsburgh15759 Pittsburgh15760 Pittsburgh15761 Pittsburgh15762 Pittsburgh15763 Pittsburgh15764 Pittsburgh15765 Pittsburgh15767 Pittsburgh15770 Pittsburgh15771 Pittsburgh15772 Pittsburgh15773 Pittsburgh15774 Pittsburgh15775 Pittsburgh15776 Pittsburgh
15777 Pittsburgh15778 Pittsburgh15779 Pittsburgh15780 Pittsburgh15781 Pittsburgh15783 Pittsburgh15784 Pittsburgh15801 Pittsburgh15821 Williamsport15822 Williamsport15823 Pittsburgh15824 Pittsburgh15825 Pittsburgh15827 Williamsport15828 Erie15829 Pittsburgh15831 Williamsport15832 Williamsport15834 Williamsport15840 Pittsburgh15841 Williamsport15845 Erie15846 Williamsport15847 Pittsburgh15848 Pittsburgh15849 Williamsport15851 Pittsburgh15853 Erie15856 Pittsburgh15857 Williamsport15860 Erie15861 Williamsport15863 Pittsburgh15864 Pittsburgh15865 Pittsburgh15866 Pittsburgh15868 Williamsport15870 Erie15901 Pittsburgh15902 Pittsburgh15904 Pittsburgh15905 Pittsburgh15906 Pittsburgh15907 Pittsburgh15909 Pittsburgh15915 Pittsburgh15920 Pittsburgh15921 Pittsburgh15922 Pittsburgh15923 Pittsburgh
15924 Pittsburgh15925 Pittsburgh15926 Pittsburgh15927 Pittsburgh15928 Pittsburgh15929 Pittsburgh15930 Pittsburgh15931 Pittsburgh15934 Pittsburgh15935 Pittsburgh15936 Pittsburgh15937 Pittsburgh15938 Pittsburgh15940 Pittsburgh15942 Pittsburgh15943 Pittsburgh15944 Pittsburgh15945 Pittsburgh15946 Pittsburgh15948 Pittsburgh15949 Pittsburgh15951 Pittsburgh15952 Pittsburgh15953 Pittsburgh15954 Pittsburgh15955 Pittsburgh15956 Pittsburgh15957 Pittsburgh15958 Pittsburgh15959 Pittsburgh15960 Pittsburgh15961 Pittsburgh15962 Pittsburgh15963 Pittsburgh16001 Pittsburgh16002 Pittsburgh16003 Pittsburgh16016 Pittsburgh16017 Pittsburgh16018 Pittsburgh16020 Pittsburgh16021 Pittsburgh16022 Pittsburgh16023 Pittsburgh16024 Pittsburgh16025 Pittsburgh16027 Pittsburgh16028 Pittsburgh16029 Pittsburgh16030 Pittsburgh
SECTION 6: AppendicesAppendix F: Zip Code Mapping Page 564
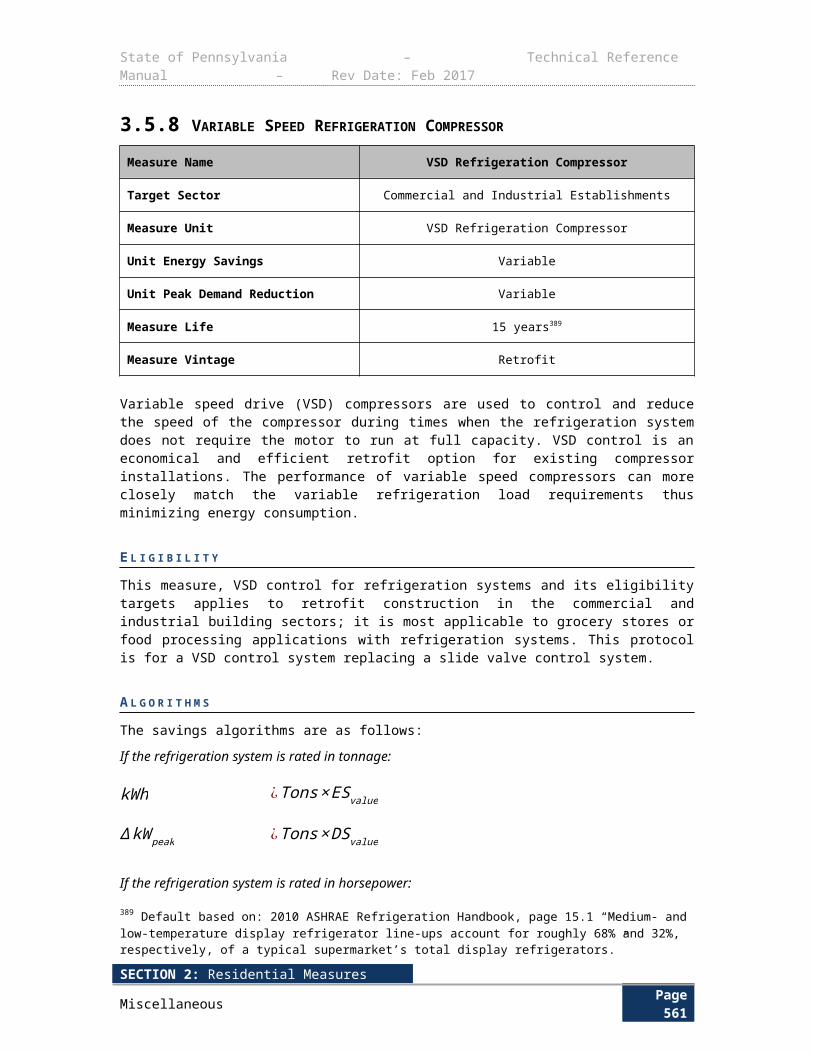
State of Pennsylvania – Technical Reference Manual – Rev Date: Feb 2017
16033 Pittsburgh16034 Pittsburgh16035 Pittsburgh16036 Pittsburgh16037 Pittsburgh16038 Pittsburgh16039 Pittsburgh16040 Pittsburgh16041 Pittsburgh16045 Pittsburgh16046 Pittsburgh16048 Pittsburgh16049 Pittsburgh16050 Pittsburgh16051 Pittsburgh16052 Pittsburgh16053 Pittsburgh16054 Pittsburgh16055 Pittsburgh16056 Pittsburgh16057 Pittsburgh16058 Pittsburgh16059 Pittsburgh16061 Pittsburgh16063 Pittsburgh16066 Pittsburgh16101 Pittsburgh16102 Pittsburgh16103 Pittsburgh16105 Pittsburgh16107 Pittsburgh16108 Pittsburgh16110 Erie16111 Erie16112 Pittsburgh16113 Erie16114 Erie16115 Pittsburgh16116 Pittsburgh16117 Pittsburgh16120 Pittsburgh16121 Pittsburgh16123 Pittsburgh16124 Erie16125 Erie16127 Pittsburgh16130 Erie16131 Erie16132 Pittsburgh16133 Pittsburgh
16134 Erie16136 Pittsburgh16137 Pittsburgh16140 Pittsburgh16141 Pittsburgh16142 Pittsburgh16143 Pittsburgh16145 Erie16146 Pittsburgh16148 Pittsburgh16150 Pittsburgh16151 Erie16153 Erie16154 Erie16155 Pittsburgh16156 Pittsburgh16157 Pittsburgh16159 Pittsburgh16160 Pittsburgh16161 Pittsburgh16172 Pittsburgh16201 Pittsburgh16210 Pittsburgh16211 Pittsburgh16212 Pittsburgh16213 Pittsburgh16214 Pittsburgh16215 Pittsburgh16217 Erie16218 Pittsburgh16220 Erie16221 Pittsburgh16222 Pittsburgh16223 Pittsburgh16224 Pittsburgh16225 Pittsburgh16226 Pittsburgh16228 Pittsburgh16229 Pittsburgh16230 Pittsburgh16232 Pittsburgh16233 Erie16234 Pittsburgh16235 Erie16236 Pittsburgh16238 Pittsburgh16239 Erie16240 Pittsburgh16242 Pittsburgh16244 Pittsburgh
16245 Pittsburgh16246 Pittsburgh16248 Pittsburgh16249 Pittsburgh16250 Pittsburgh16253 Pittsburgh16254 Pittsburgh16255 Pittsburgh16256 Pittsburgh16257 Erie16258 Pittsburgh16259 Pittsburgh16260 Erie16261 Pittsburgh16262 Pittsburgh16263 Pittsburgh16301 Erie16311 Erie16312 Erie16313 Erie16314 Erie16316 Erie16317 Erie16319 Erie16321 Erie16322 Erie16323 Erie16326 Erie16327 Erie16328 Erie16329 Erie16331 Pittsburgh16332 Erie16333 Erie16334 Erie16335 Erie16340 Erie16341 Erie16342 Erie16343 Erie16344 Erie16345 Erie16346 Erie16347 Erie16350 Erie16351 Erie16352 Erie16353 Erie16354 Erie16360 Erie
SECTION 6: AppendicesAppendix F: Zip Code Mapping Page 565
State of Pennsylvania – Technical Reference Manual – Rev Date: Feb 2017
16361 Erie16362 Erie16364 Erie16365 Erie16366 Erie16367 Erie16368 Erie16369 Erie16370 Erie16371 Erie16372 Pittsburgh16373 Pittsburgh16374 Pittsburgh16375 Pittsburgh16388 Erie16401 Erie16402 Erie16403 Erie16404 Erie16405 Erie16406 Erie16407 Erie16410 Erie16411 Erie16412 Erie16413 Erie16415 Erie16416 Erie16417 Erie16420 Erie16421 Erie16422 Erie16423 Erie16424 Erie16426 Erie16427 Erie16428 Erie16430 Erie16432 Erie16433 Erie16434 Erie16435 Erie16436 Erie16438 Erie16440 Erie16441 Erie16442 Erie16443 Erie16444 Erie16475 Erie
16501 Erie16502 Erie16503 Erie16504 Erie16505 Erie16506 Erie16507 Erie16508 Erie16509 Erie16510 Erie16511 Erie16512 Erie16514 Erie16515 Erie16522 Erie16530 Erie16531 Erie16532 Erie16533 Erie16534 Erie16538 Erie16541 Erie16544 Erie16546 Erie16550 Erie16553 Erie16554 Erie16563 Erie16565 Erie16601 Pittsburgh16602 Pittsburgh16603 Pittsburgh16611 Harrisburg16613 Pittsburgh16616 Pittsburgh16617 Williamsport16619 Pittsburgh16620 Williamsport16621 Harrisburg16622 Harrisburg16623 Harrisburg16624 Pittsburgh16625 Pittsburgh16627 Pittsburgh16629 Pittsburgh16630 Pittsburgh16631 Harrisburg16633 Harrisburg16634 Harrisburg16635 Pittsburgh
16636 Pittsburgh16637 Pittsburgh16638 Harrisburg16639 Pittsburgh16640 Pittsburgh16641 Pittsburgh16644 Pittsburgh16645 Pittsburgh16646 Pittsburgh16647 Harrisburg16648 Pittsburgh16650 Harrisburg16651 Williamsport16652 Harrisburg16654 Harrisburg16655 Pittsburgh16656 Pittsburgh16657 Harrisburg16659 Harrisburg16660 Harrisburg16661 Williamsport16662 Harrisburg16663 Williamsport16664 Pittsburgh16665 Pittsburgh16666 Williamsport16667 Pittsburgh16668 Pittsburgh16669 Harrisburg16670 Pittsburgh16671 Williamsport16672 Harrisburg16673 Pittsburgh16674 Harrisburg16675 Pittsburgh16677 Williamsport16678 Harrisburg16679 Harrisburg16680 Williamsport16681 Williamsport16682 Pittsburgh16683 Williamsport16684 Williamsport16685 Harrisburg16686 Williamsport16689 Harrisburg16691 Harrisburg16692 Pittsburgh16693 Harrisburg16694 Harrisburg
SECTION 6: AppendicesAppendix F: Zip Code Mapping Page 566
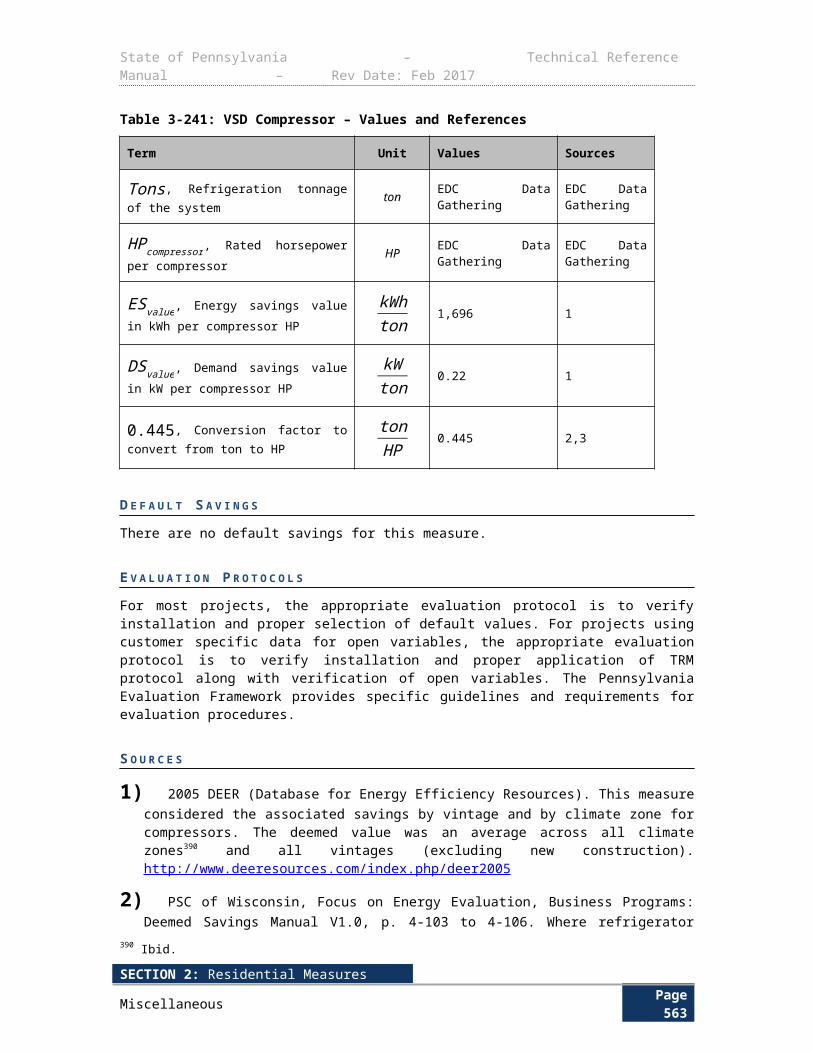
State of Pennsylvania – Technical Reference Manual – Rev Date: Feb 2017
16695 Harrisburg16698 Williamsport16699 Pittsburgh16701 Erie16720 Williamsport16724 Williamsport16725 Erie16726 Erie16727 Erie16728 Erie16729 Erie16730 Williamsport16731 Williamsport16732 Erie16733 Erie16734 Erie16735 Erie16738 Erie16740 Erie16743 Williamsport16744 Erie16745 Erie16746 Williamsport16748 Williamsport16749 Williamsport16750 Williamsport16801 Williamsport16802 Williamsport16803 Williamsport16804 Williamsport16805 Williamsport16820 Williamsport16821 Williamsport16822 Williamsport16823 Williamsport16825 Williamsport16826 Williamsport16827 Williamsport16828 Williamsport16829 Williamsport16830 Williamsport16832 Williamsport16833 Williamsport16834 Williamsport16835 Williamsport16836 Williamsport16837 Williamsport16838 Pittsburgh16839 Williamsport16840 Williamsport
16841 Williamsport16843 Williamsport16844 Williamsport16845 Williamsport16847 Williamsport16848 Williamsport16849 Williamsport16850 Williamsport16851 Williamsport16852 Williamsport16853 Williamsport16854 Williamsport16855 Williamsport16856 Williamsport16858 Williamsport16859 Williamsport16860 Williamsport16861 Williamsport16863 Williamsport16864 Williamsport16865 Williamsport16866 Williamsport16868 Williamsport16870 Williamsport16871 Williamsport16872 Williamsport16873 Williamsport16874 Williamsport16875 Williamsport16876 Williamsport16877 Williamsport16878 Williamsport16879 Williamsport16881 Williamsport16882 Williamsport16901 Williamsport16910 Williamsport16911 Williamsport16912 Williamsport16914 Williamsport16915 Williamsport16917 Williamsport16918 Williamsport16920 Williamsport16921 Williamsport16922 Williamsport16923 Williamsport16925 Williamsport16926 Williamsport16927 Williamsport
16928 Williamsport16929 Williamsport16930 Williamsport16932 Williamsport16933 Williamsport16935 Williamsport16936 Williamsport16937 Williamsport16938 Williamsport16939 Williamsport16940 Williamsport16941 Williamsport16942 Williamsport16943 Williamsport16945 Williamsport16946 Williamsport16947 Williamsport16948 Williamsport16950 Williamsport17001 Harrisburg17002 Harrisburg17003 Harrisburg17004 Harrisburg17005 Harrisburg17006 Harrisburg17007 Harrisburg17008 Harrisburg17009 Harrisburg17010 Harrisburg17011 Harrisburg17012 Harrisburg17013 Harrisburg17014 Harrisburg17015 Harrisburg17016 Harrisburg17017 Harrisburg17018 Harrisburg17019 Philadelphia17020 Harrisburg17021 Harrisburg17022 Harrisburg17023 Harrisburg17024 Harrisburg17025 Harrisburg17026 Harrisburg17027 Harrisburg17028 Harrisburg17029 Harrisburg17030 Harrisburg17032 Harrisburg
SECTION 6: AppendicesAppendix F: Zip Code Mapping Page 567
State of Pennsylvania – Technical Reference Manual – Rev Date: Feb 2017
17033 Harrisburg17034 Harrisburg17035 Harrisburg17036 Harrisburg17037 Harrisburg17038 Harrisburg17039 Harrisburg17040 Harrisburg17041 Harrisburg17042 Harrisburg17043 Harrisburg17044 Harrisburg17045 Harrisburg17046 Harrisburg17047 Harrisburg17048 Harrisburg17049 Harrisburg17050 Harrisburg17051 Harrisburg17052 Harrisburg17053 Harrisburg17054 Harrisburg17055 Harrisburg17056 Harrisburg17057 Harrisburg17058 Harrisburg17059 Harrisburg17060 Harrisburg17061 Harrisburg17062 Harrisburg17063 Williamsport17064 Harrisburg17065 Harrisburg17066 Harrisburg17067 Harrisburg17068 Harrisburg17069 Harrisburg17070 Harrisburg17071 Harrisburg17072 Harrisburg17073 Harrisburg17074 Harrisburg17075 Harrisburg17076 Harrisburg17077 Harrisburg17078 Harrisburg17080 Harrisburg17081 Harrisburg17082 Harrisburg17083 Harrisburg
17084 Williamsport17085 Harrisburg17086 Harrisburg17087 Harrisburg17088 Harrisburg17089 Harrisburg17090 Harrisburg17091 Harrisburg17093 Harrisburg17094 Harrisburg17097 Harrisburg17098 Harrisburg17099 Harrisburg17101 Harrisburg17102 Harrisburg17103 Harrisburg17104 Harrisburg17105 Harrisburg17106 Harrisburg17107 Harrisburg17108 Harrisburg17109 Harrisburg17110 Harrisburg17111 Harrisburg17112 Harrisburg17113 Harrisburg17120 Harrisburg17121 Harrisburg17122 Harrisburg17123 Harrisburg17124 Harrisburg17125 Harrisburg17126 Harrisburg17127 Harrisburg17128 Harrisburg17129 Harrisburg17130 Harrisburg17140 Harrisburg17177 Harrisburg17201 Harrisburg17202 Harrisburg17210 Harrisburg17211 Harrisburg17212 Harrisburg17213 Harrisburg17214 Harrisburg17215 Harrisburg17217 Harrisburg17219 Harrisburg17220 Harrisburg
17221 Harrisburg17222 Harrisburg17223 Harrisburg17224 Harrisburg17225 Harrisburg17228 Harrisburg17229 Harrisburg17231 Harrisburg17232 Harrisburg17233 Harrisburg17235 Harrisburg17236 Harrisburg17237 Harrisburg17238 Harrisburg17239 Harrisburg17240 Harrisburg17241 Harrisburg17243 Harrisburg17244 Harrisburg17246 Harrisburg17247 Harrisburg17249 Harrisburg17250 Harrisburg17251 Harrisburg17252 Harrisburg17253 Harrisburg17254 Harrisburg17255 Harrisburg17256 Harrisburg17257 Harrisburg17260 Harrisburg17261 Harrisburg17262 Harrisburg17263 Harrisburg17264 Harrisburg17265 Harrisburg17266 Harrisburg17267 Harrisburg17268 Harrisburg17270 Harrisburg17271 Harrisburg17272 Harrisburg17301 Harrisburg17302 Philadelphia17303 Harrisburg17304 Harrisburg17306 Harrisburg17307 Harrisburg17309 Philadelphia17310 Harrisburg
SECTION 6: AppendicesAppendix F: Zip Code Mapping Page 568
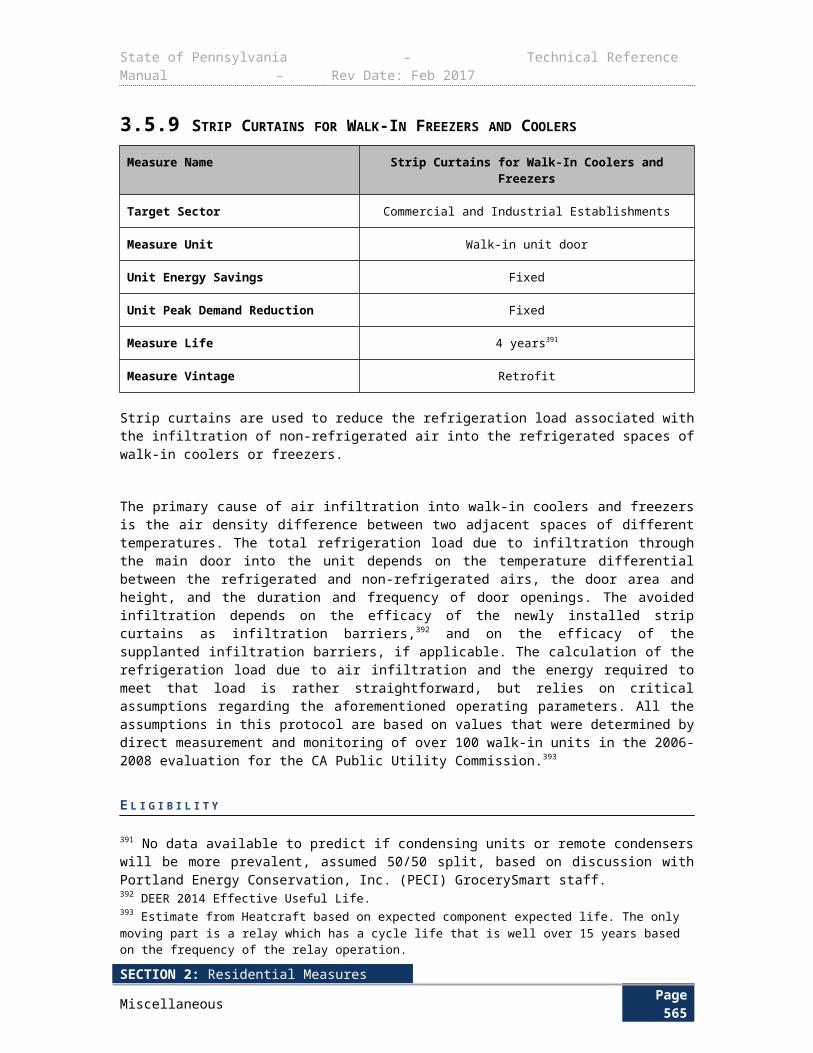
State of Pennsylvania – Technical Reference Manual – Rev Date: Feb 2017
17311 Philadelphia17312 Philadelphia17313 Philadelphia17314 Philadelphia17315 Philadelphia17316 Harrisburg17317 Philadelphia17318 Philadelphia17319 Philadelphia17320 Harrisburg17321 Philadelphia17322 Philadelphia17323 Philadelphia17324 Harrisburg17325 Harrisburg17326 Harrisburg17327 Philadelphia17329 Philadelphia17331 Philadelphia17332 Philadelphia17333 Philadelphia17334 Philadelphia17337 Harrisburg17339 Philadelphia17340 Harrisburg17342 Philadelphia17343 Harrisburg17344 Harrisburg17345 Philadelphia17347 Philadelphia17349 Philadelphia17350 Harrisburg17352 Philadelphia17353 Harrisburg17354 Philadelphia17355 Philadelphia17356 Philadelphia17358 Philadelphia17360 Philadelphia17361 Philadelphia17362 Philadelphia17363 Philadelphia17364 Philadelphia17365 Philadelphia17366 Philadelphia17368 Philadelphia17370 Philadelphia17371 Philadelphia17372 Harrisburg17375 Harrisburg
17401 Philadelphia17402 Philadelphia17403 Philadelphia17404 Philadelphia17405 Philadelphia17406 Philadelphia17407 Philadelphia17408 Philadelphia17415 Philadelphia17501 Harrisburg17502 Harrisburg17503 Harrisburg17504 Harrisburg17505 Harrisburg17506 Harrisburg17507 Allentown17508 Harrisburg17509 Harrisburg17512 Harrisburg17516 Harrisburg17517 Harrisburg17518 Harrisburg17519 Allentown17520 Harrisburg17521 Harrisburg17522 Harrisburg17527 Harrisburg17528 Allentown17529 Harrisburg17532 Harrisburg17533 Harrisburg17534 Harrisburg17535 Harrisburg17536 Harrisburg17537 Harrisburg17538 Harrisburg17540 Harrisburg17543 Harrisburg17545 Harrisburg17547 Harrisburg17549 Harrisburg17550 Harrisburg17551 Harrisburg17552 Harrisburg17554 Harrisburg17555 Allentown17557 Harrisburg17560 Harrisburg17562 Harrisburg17563 Harrisburg
17564 Harrisburg17565 Harrisburg17566 Harrisburg17567 Harrisburg17568 Harrisburg17569 Harrisburg17570 Harrisburg17572 Harrisburg17573 Harrisburg17575 Harrisburg17576 Harrisburg17577 Harrisburg17578 Harrisburg17579 Harrisburg17580 Harrisburg17581 Allentown17582 Harrisburg17583 Harrisburg17584 Harrisburg17585 Harrisburg17601 Harrisburg17602 Harrisburg17603 Harrisburg17604 Harrisburg17605 Harrisburg17606 Harrisburg17607 Harrisburg17608 Harrisburg17611 Harrisburg17622 Harrisburg17699 Harrisburg17701 Williamsport17702 Williamsport17703 Williamsport17705 Williamsport17720 Williamsport17721 Williamsport17722 Williamsport17723 Williamsport17724 Williamsport17726 Williamsport17727 Williamsport17728 Williamsport17729 Williamsport17730 Williamsport17731 Williamsport17735 Williamsport17737 Williamsport17738 Williamsport17739 Williamsport
SECTION 6: AppendicesAppendix F: Zip Code Mapping Page 569
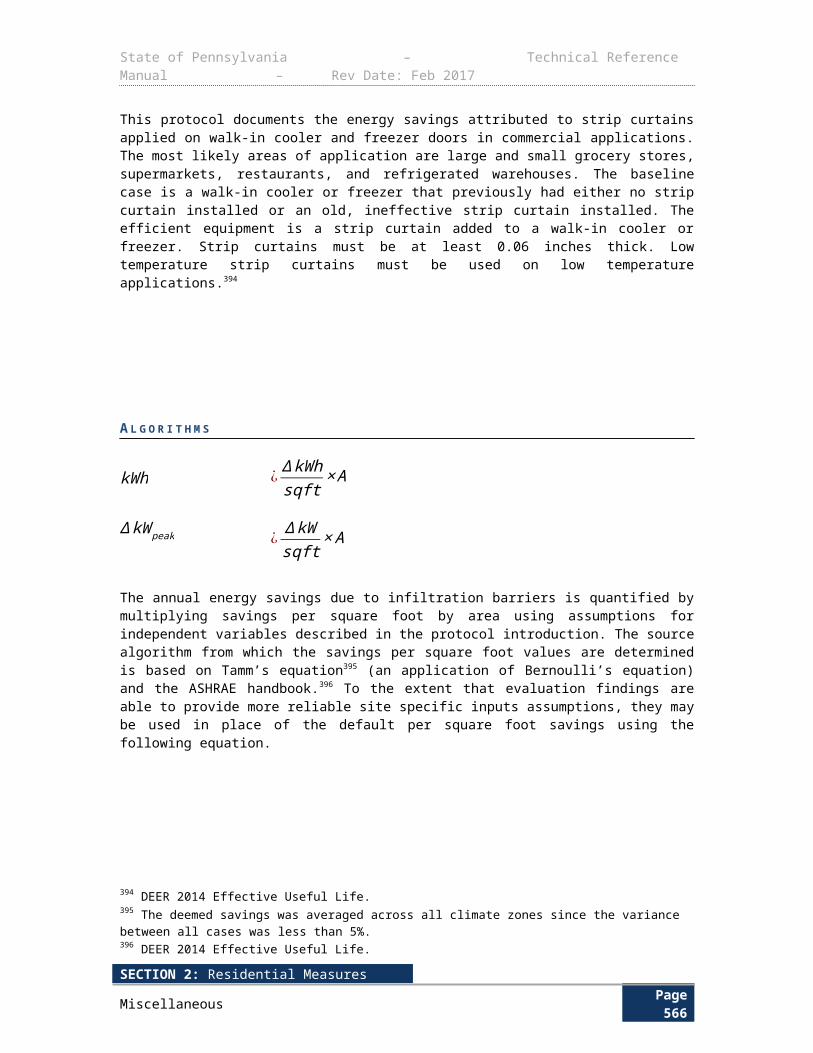
State of Pennsylvania – Technical Reference Manual – Rev Date: Feb 2017
17740 Williamsport17742 Williamsport17744 Williamsport17745 Williamsport17747 Williamsport17748 Williamsport17749 Williamsport17750 Williamsport17751 Williamsport17752 Williamsport17754 Williamsport17756 Williamsport17758 Williamsport17759 Williamsport17760 Williamsport17762 Williamsport17763 Williamsport17764 Williamsport17765 Williamsport17767 Williamsport17768 Williamsport17769 Williamsport17771 Williamsport17772 Williamsport17773 Williamsport17774 Williamsport17776 Williamsport17777 Williamsport17778 Williamsport17779 Williamsport17801 Williamsport17810 Williamsport17812 Williamsport17813 Williamsport17814 Williamsport17815 Williamsport17820 Williamsport17821 Williamsport17822 Williamsport17823 Harrisburg17824 Williamsport17827 Williamsport17829 Williamsport17830 Harrisburg17831 Williamsport17832 Williamsport17833 Williamsport17834 Harrisburg17835 Williamsport17836 Harrisburg
17837 Williamsport17839 Williamsport17840 Harrisburg17841 Williamsport17842 Williamsport17843 Williamsport17844 Williamsport17845 Williamsport17846 Williamsport17847 Williamsport17850 Williamsport17851 Harrisburg17853 Harrisburg17855 Williamsport17856 Williamsport17857 Williamsport17858 Williamsport17859 Williamsport17860 Williamsport17861 Williamsport17862 Williamsport17864 Harrisburg17865 Williamsport17866 Harrisburg17867 Harrisburg17868 Williamsport17870 Williamsport17872 Harrisburg17876 Williamsport17877 Williamsport17878 Williamsport17880 Williamsport17881 Williamsport17882 Williamsport17883 Williamsport17884 Williamsport17885 Williamsport17886 Williamsport17887 Williamsport17888 Williamsport17889 Williamsport17901 Allentown17920 Williamsport17921 Harrisburg17922 Allentown17923 Harrisburg17925 Allentown17929 Allentown17930 Allentown17931 Allentown
17932 Allentown17933 Allentown17934 Allentown17935 Allentown17936 Harrisburg17938 Harrisburg17941 Harrisburg17942 Allentown17943 Harrisburg17944 Harrisburg17945 Allentown17946 Allentown17948 Allentown17949 Allentown17951 Allentown17952 Allentown17953 Allentown17954 Allentown17957 Harrisburg17959 Allentown17960 Allentown17961 Allentown17963 Harrisburg17964 Harrisburg17965 Allentown17966 Harrisburg17967 Allentown17968 Harrisburg17970 Allentown17972 Allentown17974 Allentown17976 Allentown17978 Harrisburg17979 Allentown17980 Harrisburg17981 Harrisburg17982 Allentown17983 Harrisburg17985 Allentown18001 Allentown18002 Allentown18003 Allentown18010 Allentown18011 Allentown18012 Allentown18013 Allentown18014 Allentown18015 Allentown18016 Allentown18017 Allentown
SECTION 6: AppendicesAppendix F: Zip Code Mapping Page 570
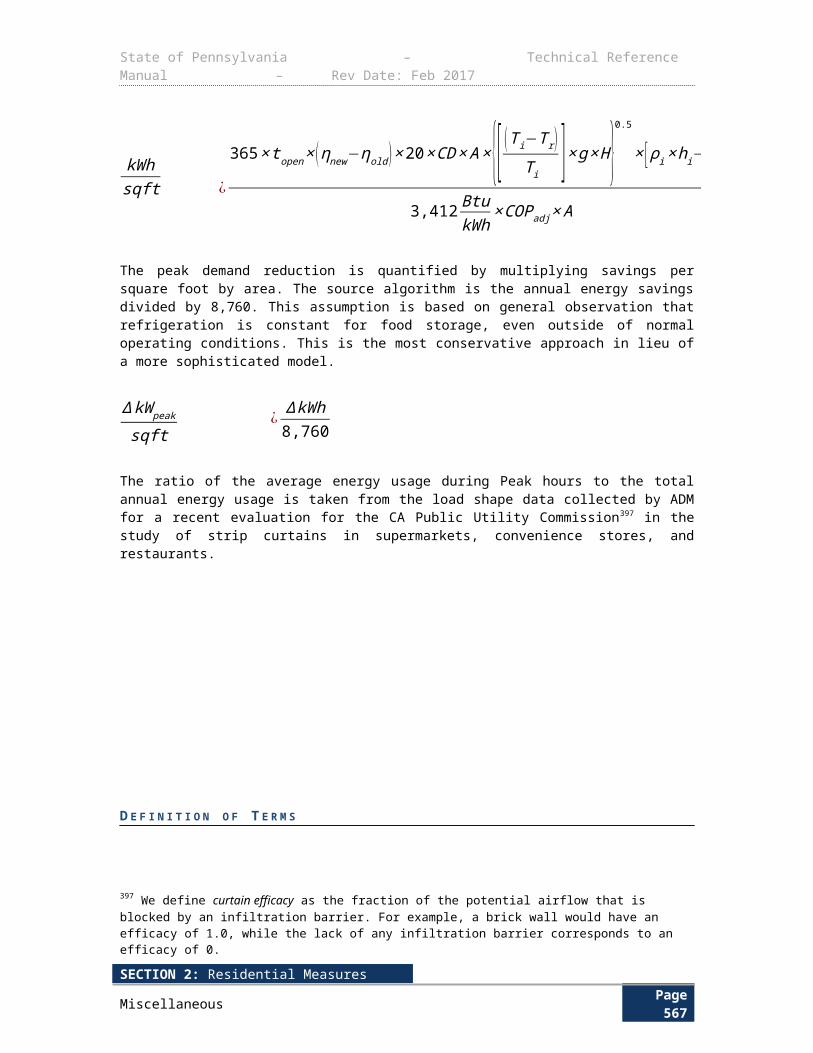
State of Pennsylvania – Technical Reference Manual – Rev Date: Feb 2017
18018 Allentown18020 Allentown18025 Allentown18030 Allentown18031 Allentown18032 Allentown18034 Allentown18035 Allentown18036 Allentown18037 Allentown18038 Allentown18039 Philadelphia18040 Allentown18041 Philadelphia18042 Allentown18043 Allentown18044 Allentown18045 Allentown18046 Allentown18049 Allentown18050 Allentown18051 Allentown18052 Allentown18053 Allentown18054 Philadelphia18055 Allentown18056 Allentown18058 Allentown18059 Allentown18060 Allentown18062 Allentown18063 Allentown18064 Allentown18065 Allentown18066 Allentown18067 Allentown18068 Allentown18069 Allentown18070 Philadelphia18071 Allentown18072 Allentown18073 Philadelphia18074 Philadelphia18076 Philadelphia18077 Philadelphia18078 Allentown18079 Allentown18080 Allentown18081 Philadelphia18083 Allentown
18084 Philadelphia18085 Allentown18086 Allentown18087 Allentown18088 Allentown18091 Allentown18092 Allentown18098 Allentown18099 Allentown18101 Allentown18102 Allentown18103 Allentown18104 Allentown18105 Allentown18106 Allentown18109 Allentown18175 Allentown18195 Allentown18201 Scranton18202 Scranton18210 Scranton18211 Allentown18212 Allentown18214 Allentown18216 Allentown18218 Allentown18219 Scranton18220 Allentown18221 Scranton18222 Scranton18223 Scranton18224 Scranton18225 Scranton18229 Allentown18230 Allentown18231 Allentown18232 Allentown18234 Scranton18235 Allentown18237 Allentown18239 Scranton18240 Allentown18241 Allentown18242 Allentown18244 Allentown18245 Allentown18246 Scranton18247 Scranton18248 Allentown18249 Scranton
18250 Allentown18251 Scranton18252 Allentown18254 Allentown18255 Allentown18256 Allentown18301 Scranton18302 Scranton18320 Scranton18321 Scranton18322 Allentown18323 Scranton18324 Scranton18325 Scranton18326 Scranton18327 Allentown18328 Scranton18330 Allentown18331 Allentown18332 Scranton18333 Allentown18334 Scranton18335 Scranton18336 Scranton18337 Scranton18340 Scranton18341 Allentown18342 Scranton18343 Allentown18344 Scranton18346 Scranton18347 Scranton18348 Scranton18349 Scranton18350 Scranton18351 Allentown18352 Allentown18353 Allentown18354 Allentown18355 Scranton18356 Allentown18357 Scranton18360 Allentown18370 Scranton18371 Scranton18372 Scranton18373 Scranton18401 Scranton18403 Scranton18405 Scranton
SECTION 6: AppendicesAppendix F: Zip Code Mapping Page 571
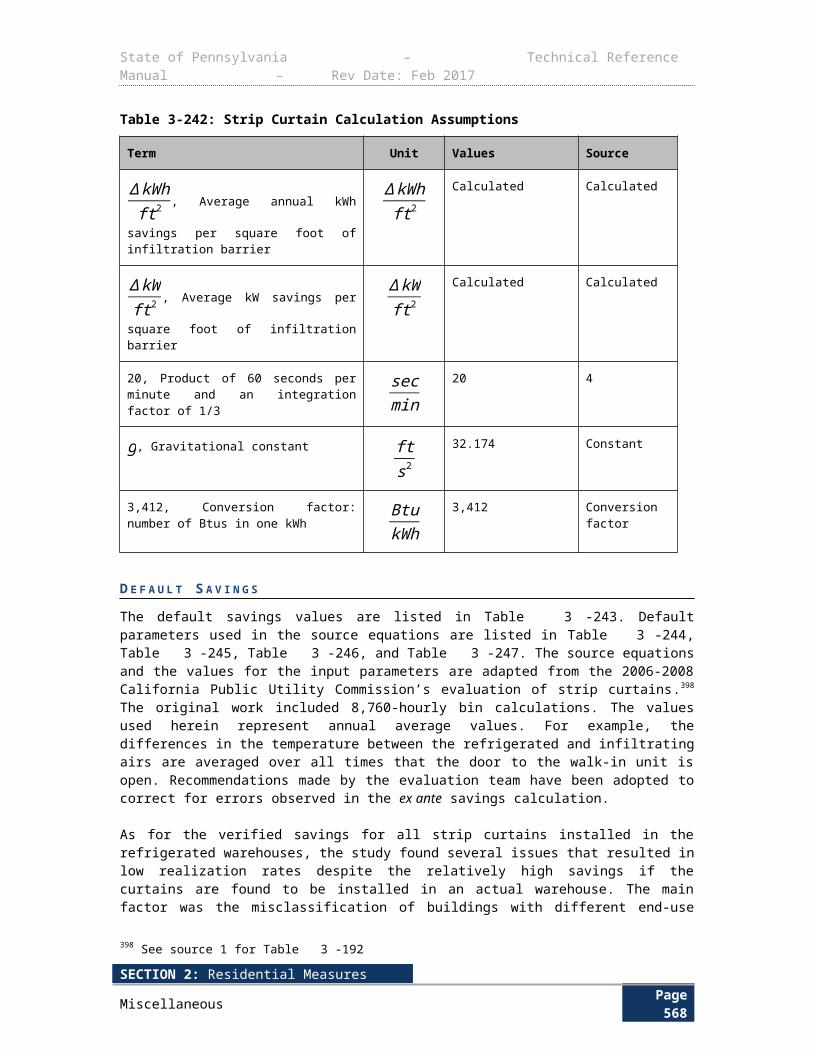
State of Pennsylvania – Technical Reference Manual – Rev Date: Feb 2017
18407 Scranton18410 Scranton18411 Scranton18413 Scranton18414 Scranton18415 Scranton18416 Scranton18417 Scranton18419 Scranton18420 Scranton18421 Scranton18424 Scranton18425 Scranton18426 Scranton18427 Scranton18428 Scranton18430 Scranton18431 Scranton18433 Scranton18434 Scranton18435 Scranton18436 Scranton18437 Scranton18438 Scranton18439 Scranton18440 Scranton18441 Scranton18443 Scranton18444 Scranton18445 Scranton18446 Scranton18447 Scranton18448 Scranton18449 Scranton18451 Scranton18452 Scranton18453 Scranton18454 Scranton18455 Scranton18456 Scranton18457 Scranton18458 Scranton18459 Scranton18460 Scranton18461 Scranton18462 Scranton18463 Scranton18464 Scranton18465 Scranton18466 Scranton
18469 Scranton18470 Scranton18471 Scranton18472 Scranton18473 Scranton18501 Scranton18502 Scranton18503 Scranton18504 Scranton18505 Scranton18507 Scranton18508 Scranton18509 Scranton18510 Scranton18512 Scranton18514 Scranton18515 Scranton18517 Scranton18518 Scranton18519 Scranton18522 Scranton18540 Scranton18577 Scranton18601 Scranton18602 Scranton18603 Scranton18610 Scranton18611 Williamsport18612 Scranton18614 Williamsport18615 Scranton18616 Williamsport18617 Scranton18618 Scranton18619 Williamsport18621 Scranton18622 Scranton18623 Scranton18624 Scranton18625 Scranton18626 Williamsport18627 Scranton18628 Scranton18629 Scranton18630 Scranton18631 Williamsport18632 Williamsport18634 Scranton18635 Scranton18636 Scranton
18640 Scranton18641 Scranton18642 Scranton18643 Scranton18644 Scranton18651 Scranton18653 Scranton18654 Scranton18655 Scranton18656 Scranton18657 Scranton18660 Scranton18661 Scranton18690 Scranton18701 Scranton18702 Scranton18703 Scranton18704 Scranton18705 Scranton18706 Scranton18707 Scranton18708 Scranton18709 Scranton18710 Scranton18711 Scranton18761 Scranton18762 Scranton18763 Scranton18764 Scranton18765 Scranton18766 Scranton18767 Scranton18768 Scranton18769 Scranton18773 Scranton18774 Scranton18801 Scranton18810 Williamsport18812 Scranton18813 Scranton18814 Williamsport18815 Scranton18816 Scranton18817 Williamsport18818 Scranton18820 Scranton18821 Scranton18822 Scranton18823 Scranton18824 Scranton
SECTION 6: AppendicesAppendix F: Zip Code Mapping Page 572
State of Pennsylvania – Technical Reference Manual – Rev Date: Feb 2017
18825 Scranton18826 Scranton18827 Scranton18828 Scranton18829 Scranton18830 Scranton18831 Williamsport18832 Williamsport18833 Williamsport18834 Scranton18837 Scranton18840 Williamsport18842 Scranton18843 Scranton18844 Scranton18845 Scranton18846 Scranton18847 Scranton18848 Williamsport18850 Williamsport18851 Scranton18853 Scranton18854 Scranton18901 Philadelphia18902 Philadelphia18910 Philadelphia18911 Philadelphia18912 Philadelphia18913 Philadelphia18914 Philadelphia18915 Philadelphia18916 Philadelphia18917 Philadelphia18918 Philadelphia18920 Philadelphia18921 Philadelphia18922 Philadelphia18923 Philadelphia18924 Philadelphia18925 Philadelphia18926 Philadelphia18927 Philadelphia18928 Philadelphia18929 Philadelphia18930 Philadelphia18931 Philadelphia18932 Philadelphia18933 Philadelphia18934 Philadelphia18935 Philadelphia
18936 Philadelphia18938 Philadelphia18940 Philadelphia18942 Philadelphia18943 Philadelphia18944 Philadelphia18946 Philadelphia18947 Philadelphia18949 Philadelphia18950 Philadelphia18951 Philadelphia18953 Philadelphia18954 Philadelphia18955 Philadelphia18956 Philadelphia18957 Philadelphia18958 Philadelphia18960 Philadelphia18962 Philadelphia18963 Philadelphia18964 Philadelphia18966 Philadelphia18968 Philadelphia18969 Philadelphia18970 Philadelphia18971 Philadelphia18972 Philadelphia18974 Philadelphia18976 Philadelphia18977 Philadelphia18979 Philadelphia18980 Philadelphia18981 Philadelphia18991 Philadelphia19001 Philadelphia19002 Philadelphia19003 Philadelphia19004 Philadelphia19006 Philadelphia19007 Philadelphia19008 Philadelphia19009 Philadelphia19010 Philadelphia19012 Philadelphia19013 Philadelphia19014 Philadelphia19015 Philadelphia19016 Philadelphia19017 Philadelphia19018 Philadelphia
19019 Philadelphia19020 Philadelphia19021 Philadelphia19022 Philadelphia19023 Philadelphia19025 Philadelphia19026 Philadelphia19027 Philadelphia19028 Philadelphia19029 Philadelphia19030 Philadelphia19031 Philadelphia19032 Philadelphia19033 Philadelphia19034 Philadelphia19035 Philadelphia19036 Philadelphia19037 Philadelphia19038 Philadelphia19039 Philadelphia19040 Philadelphia19041 Philadelphia19043 Philadelphia19044 Philadelphia19046 Philadelphia19047 Philadelphia19048 Philadelphia19049 Philadelphia19050 Philadelphia19052 Philadelphia19053 Philadelphia19054 Philadelphia19055 Philadelphia19056 Philadelphia19057 Philadelphia19058 Philadelphia19059 Philadelphia19060 Philadelphia19061 Philadelphia19063 Philadelphia19064 Philadelphia19065 Philadelphia19066 Philadelphia19067 Philadelphia19070 Philadelphia19072 Philadelphia19073 Philadelphia19074 Philadelphia19075 Philadelphia19076 Philadelphia
SECTION 6: AppendicesAppendix F: Zip Code Mapping Page 573

State of Pennsylvania – Technical Reference Manual – Rev Date: Feb 2017
19078 Philadelphia19079 Philadelphia19080 Philadelphia19081 Philadelphia19082 Philadelphia19083 Philadelphia19085 Philadelphia19086 Philadelphia19087 Philadelphia19088 Philadelphia19089 Philadelphia19090 Philadelphia19091 Philadelphia19092 Philadelphia19093 Philadelphia19094 Philadelphia19095 Philadelphia19096 Philadelphia19098 Philadelphia19099 Philadelphia19101 Philadelphia19102 Philadelphia19103 Philadelphia19104 Philadelphia19105 Philadelphia19106 Philadelphia19107 Philadelphia19108 Philadelphia19109 Philadelphia19110 Philadelphia19111 Philadelphia19112 Philadelphia19113 Philadelphia19114 Philadelphia19115 Philadelphia19116 Philadelphia19118 Philadelphia19119 Philadelphia19120 Philadelphia19121 Philadelphia19122 Philadelphia19123 Philadelphia19124 Philadelphia19125 Philadelphia19126 Philadelphia19127 Philadelphia19128 Philadelphia19129 Philadelphia19130 Philadelphia19131 Philadelphia
19132 Philadelphia19133 Philadelphia19134 Philadelphia19135 Philadelphia19136 Philadelphia19137 Philadelphia19138 Philadelphia19139 Philadelphia19140 Philadelphia19141 Philadelphia19142 Philadelphia19143 Philadelphia19144 Philadelphia19145 Philadelphia19146 Philadelphia19147 Philadelphia19148 Philadelphia19149 Philadelphia19150 Philadelphia19151 Philadelphia19152 Philadelphia19153 Philadelphia19154 Philadelphia19155 Philadelphia19160 Philadelphia19161 Philadelphia19162 Philadelphia19170 Philadelphia19171 Philadelphia19172 Philadelphia19173 Philadelphia19175 Philadelphia19176 Philadelphia19177 Philadelphia19178 Philadelphia19179 Philadelphia19181 Philadelphia19182 Philadelphia19183 Philadelphia19184 Philadelphia19185 Philadelphia19187 Philadelphia19188 Philadelphia19190 Philadelphia19191 Philadelphia19192 Philadelphia19193 Philadelphia19194 Philadelphia19195 Philadelphia19196 Philadelphia
19197 Philadelphia19244 Philadelphia19255 Philadelphia19301 Philadelphia19310 Philadelphia19311 Philadelphia19312 Philadelphia19316 Philadelphia19317 Philadelphia19318 Philadelphia19319 Philadelphia19320 Philadelphia19330 Philadelphia19331 Philadelphia19333 Philadelphia19335 Philadelphia19339 Philadelphia19340 Philadelphia19341 Philadelphia19342 Philadelphia19343 Philadelphia19344 Philadelphia19345 Philadelphia19346 Philadelphia19347 Philadelphia19348 Philadelphia19350 Philadelphia19351 Philadelphia19352 Philadelphia19353 Philadelphia19354 Philadelphia19355 Philadelphia19357 Philadelphia19358 Philadelphia19360 Philadelphia19362 Philadelphia19363 Philadelphia19365 Philadelphia19366 Philadelphia19367 Philadelphia19369 Philadelphia19371 Philadelphia19372 Philadelphia19373 Philadelphia19374 Philadelphia19375 Philadelphia19376 Philadelphia19380 Philadelphia19381 Philadelphia19382 Philadelphia
SECTION 6: AppendicesAppendix F: Zip Code Mapping Page 574
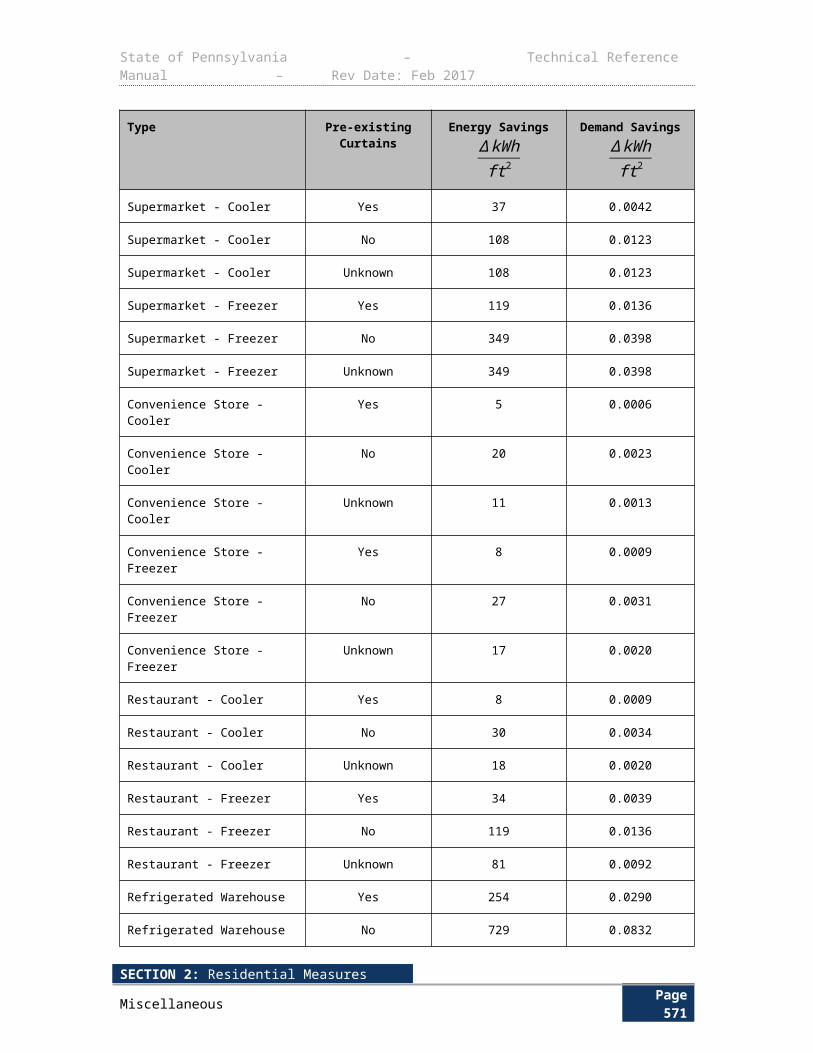
State of Pennsylvania – Technical Reference Manual – Rev Date: Feb 2017
19383 Philadelphia19388 Philadelphia19390 Philadelphia19395 Philadelphia19397 Philadelphia19398 Philadelphia19399 Philadelphia19401 Philadelphia19403 Philadelphia19404 Philadelphia19405 Philadelphia19406 Philadelphia19407 Philadelphia19408 Philadelphia19409 Philadelphia19415 Philadelphia19420 Philadelphia19421 Philadelphia19422 Philadelphia19423 Philadelphia19424 Philadelphia19425 Philadelphia19426 Philadelphia19428 Philadelphia19429 Philadelphia19430 Philadelphia19432 Philadelphia19435 Philadelphia19436 Philadelphia19437 Philadelphia19438 Philadelphia19440 Philadelphia19441 Philadelphia19442 Philadelphia19443 Philadelphia19444 Philadelphia19446 Philadelphia19450 Philadelphia19451 Philadelphia19453 Philadelphia19454 Philadelphia19455 Philadelphia19456 Philadelphia19457 Philadelphia
19460 Philadelphia19462 Philadelphia19464 Philadelphia19465 Philadelphia19468 Philadelphia19470 Philadelphia19472 Philadelphia19473 Philadelphia19474 Philadelphia19475 Philadelphia19477 Philadelphia19478 Philadelphia19480 Philadelphia19481 Philadelphia19482 Philadelphia19483 Philadelphia19484 Philadelphia19485 Philadelphia19486 Philadelphia19487 Philadelphia19488 Philadelphia19489 Philadelphia19490 Philadelphia19492 Philadelphia19493 Philadelphia19494 Philadelphia19495 Philadelphia19496 Philadelphia19501 Allentown19503 Allentown19504 Allentown19505 Allentown19506 Allentown19507 Harrisburg19508 Allentown19510 Allentown19511 Allentown19512 Allentown19516 Allentown19518 Allentown19519 Allentown19520 Philadelphia19522 Allentown19523 Allentown
19525 Philadelphia19526 Allentown19529 Allentown19530 Allentown19533 Allentown19534 Allentown19535 Allentown19536 Allentown19538 Allentown19539 Allentown19540 Allentown19541 Allentown19542 Allentown19543 Allentown19544 Harrisburg19545 Allentown19547 Allentown19548 Allentown19549 Allentown19550 Harrisburg19551 Allentown19554 Allentown19555 Allentown19557 Allentown19559 Allentown19560 Allentown19562 Allentown19564 Allentown19565 Allentown19567 Harrisburg19601 Allentown19602 Allentown19603 Allentown19604 Allentown19605 Allentown19606 Allentown19607 Allentown19608 Allentown19609 Allentown19610 Allentown19611 Allentown19612 Allentown19640 Allentown
SECTION 6: AppendicesAppendix F: Zip Code Mapping Page 575