introduction - pakistan institute of development economics tahir and pervez tahir.pdf · nadia...
TRANSCRIPT
Is Informal Sector Employment Marginal to Formal Sector Growth?
NADIA TAHIR AND PERVEZ TAHIR
This paper discusses how formal sector wage affects informal employment and overall growth. We
supplement the Labour Force Survey with a socioeconomic survey of our own in five towns of Lahore to profile
home-based workers, street vendors, and waste pickers. Our results show that the informal sector is not only
growing but also more women are joining it. It emerges as the only work opportunity for the low skilled in the
nonagricultural sector. We estimate the percentage distribution of employed labour force in the informal sector by
using dynamic panel data modeling approach. Our result confirms that increases in wages in formal sector lead to
more informal employment opportunities. Manufacturing sector growth is positively related to employment in
informal sector. However, the overall GDP growth is negatively related to informal employment. There is
unobserved gender heterogeneity and no latent time effect. Random effect and Arellano and Bond (1991) GMM
style dynamic panel model outperforms other experiments in terms of consistency of estimator and efficiency gains.
JEL classification: C32, J21, J81, J82, O17
Keywords: Informal sector, employment, wages, women, panel data
1. INTRODUCTION
Since early 2000s, Pakistan adopted a neoliberal regime to open the economy to global
competition and squeeze government spending. This directional change brought increased flow
of overseas remittances, speculative investment, and consumerism. Consequently, economy grew
but commodity-producing sector has been shrinking. Public sector spending has been falling,
especially on social sectors. There are inadequate provisions for social security and employment
Nadia Tahir<[email protected]>, Pervez Tahir <[email protected]> are, respectively, Associate
Professor in Economics, Lahore Business School, University of Lahore and former Chief Economist, Planning
Commission .
Authors’ Note: This study extends the initial work organized by Shirkatgah, WEIGO (Women in Informal
Employment: Globalizing and Organizing), Pakistan Institute of Labour Education and Research (PILER) and
Homenet Pakistan. A debt of gratitude is owed to Khawar Mumtaz for her valuable insights on the questionnaire.
Special thanks are due to the students who carried out the survey in Lahore. The disclaimers strictly apply.
based income guarantees. However, this growth and stability was short lived and we now have a
fragile state and slowing economy. In the absence of an effective regulatory role of the state, and
due to the failure in developing a long-term strategy to harness the labour force potential, we
have a huge informal sector existing side by side with the formal economy. Almost 22 million of
the employed labour force is earning its livelihood in streets and government has no record of it.
The informal workers can be categorized as self-employed workers and wage workers, doing
diversified jobs from petty traders to small producers and from rickshaw driver to shoe shiners. It
is difficult to measure the value added contribution of the informal in Pakistan. Indirect
estimation approaches on the basis of employment and hours worked are being used to estimate
the contribution of informal economy. For instance, Idris (2008) estimates the share at 36.8
percent of GNP, which is significant. Arby, Malik and Hanif (2010) tried to measure the size of
informal economy in Pakistan through a monetary approach. Their findings show that the size
has declined considerably.
Pakistan is the 6th most populous economy of the world with a total population of
177.10 million in 2011-12, of which 85.51 million (48.3%) are females. Out of the total
population 59.33 million (34 percent) constituted the recorded civilian labour force for all age
groups, almost 77 percent consisting of males.1 According to Labour Force Survey (LFS) 2010-
11, almost 74 percent of employment in non-agriculture work force is unorganized and in
informal sector. However, women’s share of the informal non-agricultural employment was a
miniscule 4 percent of all employment. Informal workers are prevalent in rural as well as in
urban areas.
According to the Articles 3 and 37e of the Constitution of Pakistan (2010), the state shall
“ensure the elimination of all forms of exploitation and the gradual fulfillment of the
1 GOP (2012)
fundamental principle, from each according to his ability, to each according to his work” and
“make provision for securing just and humane conditions of work…”. Pakistan is a signatory of
the UN Universal Declaration of Human Rights 1948 that recognizes the right to work, to freely
choose employment and to have just and favourable working conditions. It has ratified all eight
core Conventions that codify the four most basic human rights related to the world of work i.e.
the right to organize and engage in collective bargaining, the right to equality at work, the
abolition of child labour and the abolition of forced labour. For ensuring the implementation
Pakistan has the Labour Protection Policy (2006) and Labour Inspection Policy (2006).
However, the constitutional framework, ratification of ILO conventions and labour policies fail
to secure labour rights in Pakistan even in the formal sector, what to speak of the unrecorded
informal sector.
In this paper we will be looking at the existing scenario of informal sector in Pakistan, a
country that still is a victim of economic crises and is characterized as a third world developing
state. The aim is to understand the socioeconomic characteristics of individuals engaged in the
activities of street vendors, waste pickers and home-based workers in nine towns of the city
district of Lahore. The paper further seeks to illustrate the overwhelming challenges that
informal workers have to encounter in achieving “decent” work and wage in the wake of
neoliberal policies. Finally, the paper looks at the possibilities that exist for reorienting economic
policies and laws in order to increase the representative voice of informal workers, both men and
women.
According to Chen (2007), when the notion of informal sector first got attention in the
seventies, it was considered marginal and peripheral, not linked to the formal economy. Some
continued to believe that the informal sector in developing countries would disappear once they
Comment [h1]:
achieved sufficient levels of economic growth and modern industrial development. However, the
informal economy is not only growing but also contributing to economic growth and enjoying
linkages with formal sector [Pietrobelli, Rabellotti and Aquilina (2004), Bruton, Ireland and
Ketchen (2012)]. The market never accounts for vulnerability while claiming to resolve the
question of economic choices [Portes and Hoffman ( 2003)]. “Freedom without opportunity is a
devil's gift, and the refusal to provide such opportunities is criminal. The fate of the more
vulnerable offers a sharp measure of the distance from here to something that might be called
‘civilization’”[Chomsky(1997)]. Informal workers are poor because their incomes are low, they
have low skills, and there is no comprehensive government plan to protect the workers and
regulate employers in informal sector [Charmes (2000)]. Neoliberal agenda was presented as
market oriented and gender neutral. It never paid attention to family and the position of women
in a family [Coulter (2009)]. In actual practice, gender neutrality is “implicit masculinization of
these macro-structural models” [Freeman (2001)]. Neoliberal polices affect men and women
differently and their impact on various women groups is discriminatory. These policies have
increased gender inequalities and poverty. Women are economically poorer because on average
asset poverty is higher amongst women. Their mobility is low and it makes it difficult for them
to avail opportunities and alternatives [Pearson (1998), Standing (1999), Hutton and Giddens
(2000)]. Women are usually on the lower tier of the workforce, work in the informal sector as
shock absorbers [Babb (1996)]. The share of women in the export oriented industries has
increased but “international institutions and trade agreements rarely take the gendered nature of
globalization into account” [Bell and Brambilla (2002)].
Data available on the informal sector do not depict the true picture. There is no
comprehensive survey carried out to find the contribution of informal sector in Pakistan
[Gennari( 2004)]. Kemal and Mehmood (1998) made the first attempt to conduct a survey of
urban informal enterprises in Pakistan. Their study finds tax exemption and no government
intervention as a reason of growth. Informal enterprises are found to be intensive in unskilled
labour. Most of the information about the informal sector and especially women’s involvement
in Pakistan comes from individual studies [Shaheed and Mumtaz (1981), Mumtaz and Saleem
(2010)] that have highlighted the key characteristics of the sector i.e. long hours of work, lack of
continuity, absence of contracts and its often hazardous nature. Khan and Khan (2009) tried to
highlight the women’s work in informal sector as a struggle for family survival. They were of the
view that women’s contribution is an effective way to reduce family poverty. Data on informal
sector is quite general without informing about any integration with the formal sector. Moreover,
there is a lack of data on actual number of informal workers in the economy and what the factors
for their continuous growth are. The government documents such as the LFS, Medium Term
Development Framework and Poverty Reduction Strategy Paper have failed to respond to the
dilemmas of the informal workers and to the shortcomings of the informal sector, besides failing
to furnish some reasonably reliable information on the informal economy. This paper is an
attempt to bridge this gap.
Followed by this introduction, section 2 outlines our methodology and research design.
Section 3 explains some international findings, while section 4 gives descriptive analysis on the
basis of LFSs and the results of our survey of towns in Lahore. Section 5 provides results of the
dynamic panel data modeling exercise. The last section presents conclusions and major findings.
2. ANALYTICAL FRAMEWORK
We conducted a survey in Lahore to find the causative factors of employment in the
informal sector. On the basis of this information, a dynamic panel model is estimated.
Districts are the administrative divisions under the provinces in Pakistan. Punjab has 35
districts with 400 tehsils and more than 6000 union councils. Lahore is the fifth largest city in
South Asia and the 25th largest city in the world with a population above 10 million. It is the
capital of Punjab, the largest province of Pakistan and second largest city of the Pakistan. This
city has not been included in the district level employment report published by the Pakistan
Bureau of Statistics for 2009-10. It has a literacy rate of 83.5 per cent against the literacy rate of
73.3 percent for Punjab. It is thus one of the more literate areas of Pakistan. The unemployment
rate was 6.4 percent (MICS, 2008).
Lahore is divided into nine towns and one military cantonment area for administrative
purposes. The field research for this paper was done in five towns. These include Data Ganj
Baksh Town, Samanabad Town, Nishtar Town, Ravi Town and Shalimar Town. In our survey,
60 (20 percent) respondents lived in Data Ganj Baksh Town, 60 (20 percent) in Samanabad
Town, 40 (13 percent) in Nishtar Town, 80 (27 percent) in Ravi Town and 60 (20 percent) in
Shalimar Town.
Panel data refers to data sets consisting of multiple observations on each sampling unit.
This could be generated by pooling time-series observations across a variety of cross-sectional
units including countries, states, regions, firms, or randomly sampled individuals or households
Baltagi (1998). Panel data set is considered desirable because of efficiency gains due to greater
variability and alleviation of multicollinearity problem in cross sectional or time series data
[Griliches and Hausman(1986)]. One can identify some effects which are not detectable in time
series or in cross sectional data. Traditionally it is assumed that it provides more sophisticated
and reliable estimates with less restrictive behavioral model. However, individual heterogeneity
and exogeneity (common cross sectional dependence) pose real challenges. There are issues
related to measurement error and questionnaire design as well. Failure in controlling them can
generate bias and inconsistent result [Hsiao (1986)].
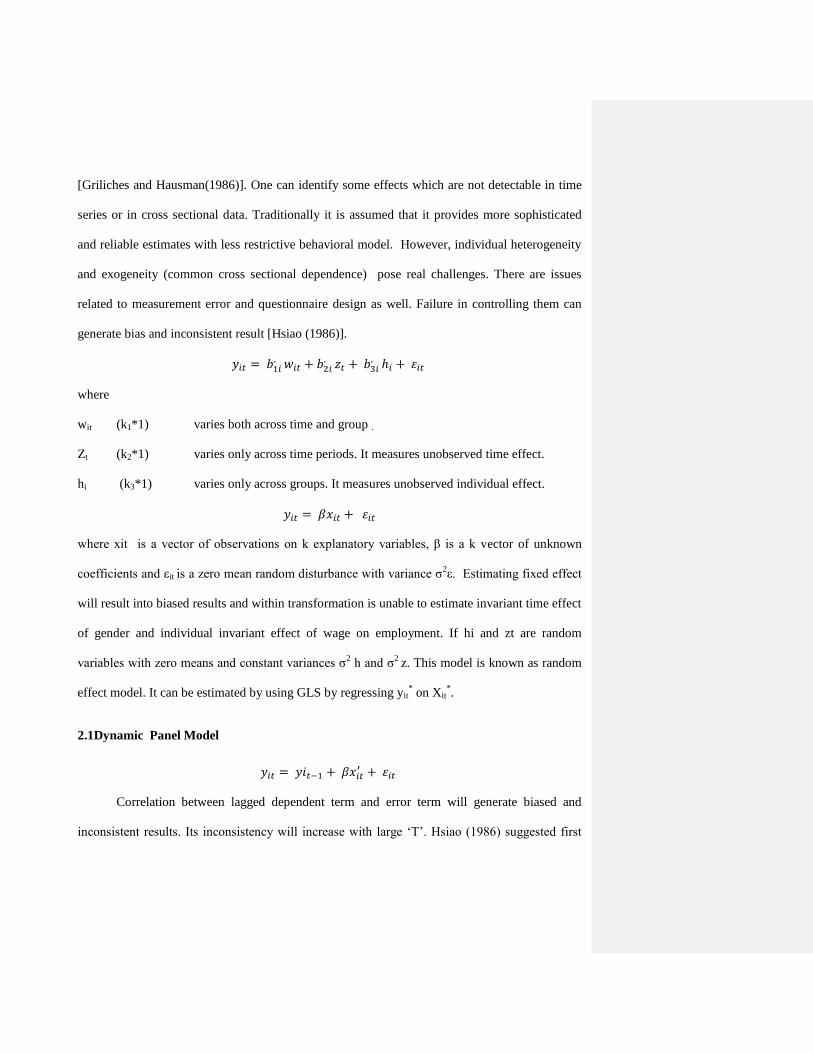
where
wit (k1*1) varies both across time and group .
Zt (k2*1) varies only across time periods. It measures unobserved time effect.
hi (k3*1) varies only across groups. It measures unobserved individual effect.
where xit is a vector of observations on k explanatory variables, β is a k vector of unknown
coefficients and εit is a zero mean random disturbance with variance σ2ε. Estimating fixed effect
will result into biased results and within transformation is unable to estimate invariant time effect
of gender and individual invariant effect of wage on employment. If hi and zt are random
variables with zero means and constant variances σ2 h and σ
2 z. This model is known as random
effect model. It can be estimated by using GLS by regressing yit* on Xit
*.
2.1Dynamic Panel Model
Correlation between lagged dependent term and error term will generate biased and
inconsistent results. Its inconsistency will increase with large ‘T’. Hsiao (1986) suggested first
difference transformation. It can resolve the problem of inconsistency of GLS estimator with T
being large and ‘N’ small, but it can generate serial correlation.
Bias can result especially when the sample is finite or small. If one uses general methods
of moments, with instrumental variables, the use of the proxy variables or instruments may
circumvent problems with correlations of errors. Moreover, there are a large number of
instruments provided by lagged variables.
Arellano (1989) uses second difference instead of difference at level, but it generated
singularity issue. Arellano and Bond (1991) recommended GMM with use of instruments and
larger orders of moments to obtain additional efficiency gains. They further recommended using
orthogonality conditions between lagged variables and GMM frame work and Sargan-type test
for over-identifying restrictions to resolve singularity point and small variance.
We used employment in informal sector (yit), measured as percentage distribution of
employed persons 10 years of age and over engaged in informal sector by major industry
division and sex. Explanatory variables include wages and growth rate of industry. Wages (wit),
is measured as average monthly wages of employees by wage group in major industry and
growth rate of manufacturing industries as control variable.
Data was taken from LFSs during 2001-2011. The LFS collects data from 36,464
households divided into four distinct, nationally representative samples. Out of these 6248
sample households are from Punjab urban areas. As the survey started to publish wage data only
from 2008 onward, some adjustments had to be made for the previous years. Moreover, we used
incomplete panel data model to deal with randomly missing observations [Baltagi (1985)].
3. INTERNATIONAL FINDINGS
Informal workers are not counted as members of organized labour force recognized by
laws. They have low incomes, live at subsistence level and have no link and interaction with or
access to government. They have no voice, no recognition and no visibility [Rodin et al. (2012)].
It is the only work opportunity for the workers who decide to join the informal sector so it is
considered as optimal decision of the worker [Chaudhuri and Mukhopadhyay (2010)]. Informal
workers rise and fall with the fate of formal sector due to its linkages with formal sector, trade
and industry, etc. It is cost effective for the large firms to hire cheap labour at the lower wages.
Informal enterprises exist because of the cumbersome procedure and rules of registration for the
firms and to save taxes [Soto (1989)]. According to De Pardo and Castano (1991), informal
activities are more prevalent in the age group of (4-19) and among individuals older than fifty
years. Findings of others show that women are more likely to be informal workers or operating
business as unpaid family workers as they are also responsible for family and child care. Various
studies showed that males are usually more involved as family traders and street vendors as
compared to women (41percent). Informal workers are usually literate and concentrated at low
level of educational skills and levels of schooling. Informal sector is characterized by longer
working hours, low wages, no job compensations, wage differential on the basis of sex and low
turnover [Guisinger and Irfan (1980), Fortuna and Prates (1991), De Pardo and Castano (1991)].
4. CHARACTERISTICS OF THE INFORMAL SECTOR
This section outlines the characteristics of the informal sector on the basis of LFSs and
our survey of Lahore.
4.1 Pakistan
According to the LFS data, the informal sector in Pakistan is more or less evenly
distributed across rural and urban areas. Almost 91 percent of the informal sector workers are
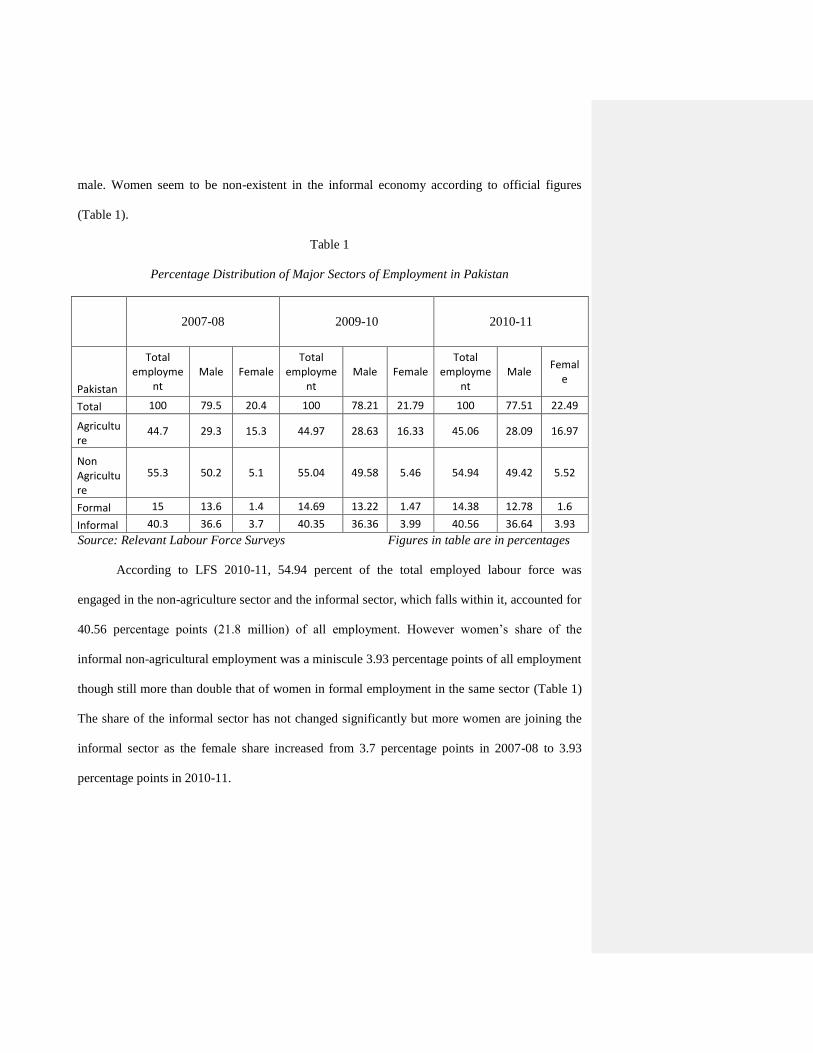
male. Women seem to be non-existent in the informal economy according to official figures
(Table 1).
Table 1
Percentage Distribution of Major Sectors of Employment in Pakistan
2007-08 2009-10 2010-11
Pakistan
Total employme
nt Male Female
Total employme
nt Male Female
Total employme
nt Male
Female
Total 100 79.5 20.4 100 78.21 21.79 100 77.51 22.49
Agriculture
44.7 29.3 15.3 44.97 28.63 16.33 45.06 28.09 16.97
Non Agriculture
55.3 50.2 5.1 55.04 49.58 5.46 54.94 49.42 5.52
Formal 15 13.6 1.4 14.69 13.22 1.47 14.38 12.78 1.6
Informal 40.3 36.6 3.7 40.35 36.36 3.99 40.56 36.64 3.93
Source: Relevant Labour Force Surveys Figures in table are in percentages
According to LFS 2010-11, 54.94 percent of the total employed labour force was
engaged in the non-agriculture sector and the informal sector, which falls within it, accounted for
40.56 percentage points (21.8 million) of all employment. However women’s share of the
informal non-agricultural employment was a miniscule 3.93 percentage points of all employment
though still more than double that of women in formal employment in the same sector (Table 1)
The share of the informal sector has not changed significantly but more women are joining the
informal sector as the female share increased from 3.7 percentage points in 2007-08 to 3.93
percentage points in 2010-11.
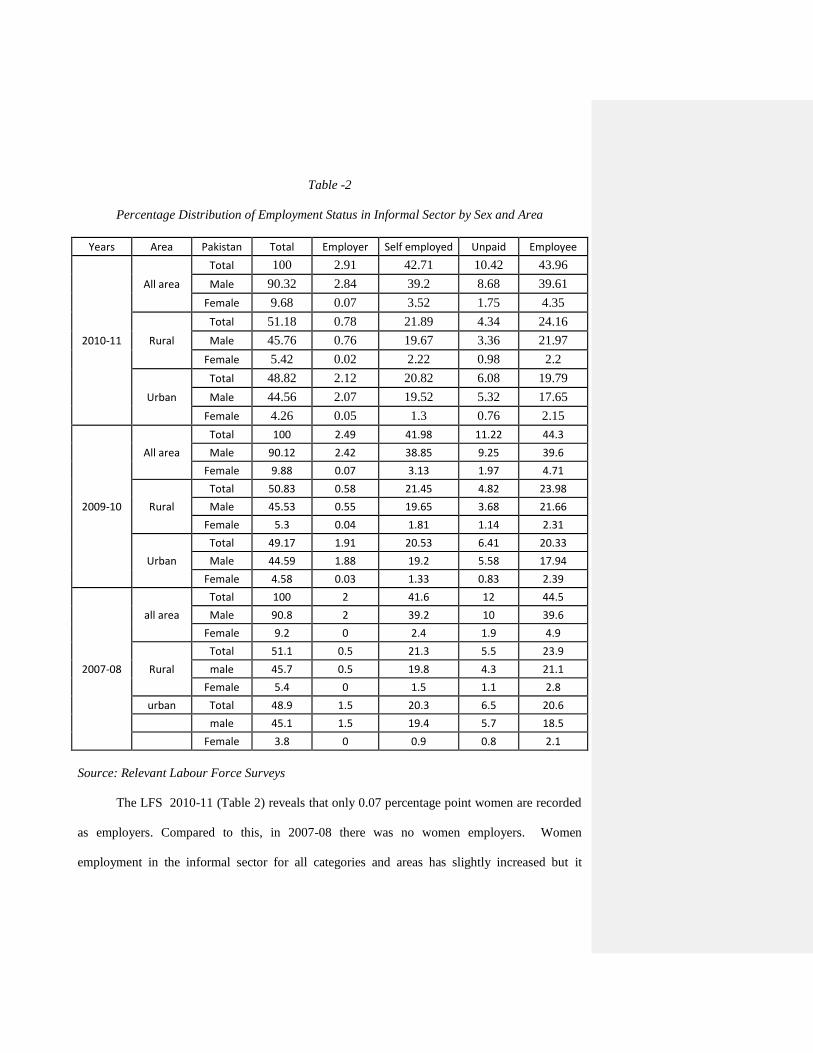
Table -2
Percentage Distribution of Employment Status in Informal Sector by Sex and Area
Years Area Pakistan Total Employer Self employed Unpaid Employee
2010-11
All area
Total 100 2.91 42.71 10.42 43.96
Male 90.32 2.84 39.2 8.68 39.61
Female 9.68 0.07 3.52 1.75 4.35
Rural
Total 51.18 0.78 21.89 4.34 24.16
Male 45.76 0.76 19.67 3.36 21.97
Female 5.42 0.02 2.22 0.98 2.2
Urban
Total 48.82 2.12 20.82 6.08 19.79
Male 44.56 2.07 19.52 5.32 17.65
Female 4.26 0.05 1.3 0.76 2.15
2009-10
All area
Total 100 2.49 41.98 11.22 44.3
Male 90.12 2.42 38.85 9.25 39.6
Female 9.88 0.07 3.13 1.97 4.71
Rural
Total 50.83 0.58 21.45 4.82 23.98
Male 45.53 0.55 19.65 3.68 21.66
Female 5.3 0.04 1.81 1.14 2.31
Urban
Total 49.17 1.91 20.53 6.41 20.33
Male 44.59 1.88 19.2 5.58 17.94
Female 4.58 0.03 1.33 0.83 2.39
2007-08
all area
Total 100 2 41.6 12 44.5
Male 90.8 2 39.2 10 39.6
Female 9.2 0 2.4 1.9 4.9
Rural
Total 51.1 0.5 21.3 5.5 23.9
male 45.7 0.5 19.8 4.3 21.1
Female 5.4 0 1.5 1.1 2.8
urban Total 48.9 1.5 20.3 6.5 20.6
male 45.1 1.5 19.4 5.7 18.5
Female 3.8 0 0.9 0.8 2.1
Source: Relevant Labour Force Surveys
The LFS 2010-11 (Table 2) reveals that only 0.07 percentage point women are recorded
as employers. Compared to this, in 2007-08 there was no women employers. Women
employment in the informal sector for all categories and areas has slightly increased but it
contracted for males. Unpaid family workers were 1.75 percentage points, another 3.52
percentage points were self-employed and employee in the sector were 1.75 percentage points.
One of the major issues regarding the informal sector is the invisibility of women
workers in the national statistics and in the policy discourse. This is due to definitional problems
and socio-cultural constraints as well as gender biases and flaws in sample sizes and data
collection methods. As a result activity patterns of women workers remain ignored, not because
they are not working but as many independent studies have highlighted, their work does not get
counted or recognized. On almost every site of the Pakistan Participatory Poverty Assessment
[PPA (2003)] for instance, women were found to be engaged in productive work (sewing shoes,
footballs, peeling nuts, etc. etc.). A number of reasons may be offered for the invisibility,
including the fact that women do not seem to own businesses in the informal economy; that
women are less likely to be reported as self-employed and much more likely than men to be
reported to be unpaid family workers. Similarly, one sees that men in the informal sector form
90 percent of the total employed whereas women barely form one-tenth of the sector.
4.2 Punjab
In Punjab 43.4 percent of the labour force is employed in the agriculture sector whereas
56.5 percent is employed in the nonagriculture sector. Approximately 13.1 percentage points of
the overall employment in Punjab is in the formal sector and 43.4 percentage points in the
informal sector. The informal sector comprises of 38.0 percentage points of male and 5.4
percentage points of female workers. Women have a small role to play in Punjab, which is
considered as the most affluent province of Pakistan. However, there are major income
disparities within the population. Poverty is increasing both in urban and rural areas of Punjab2.
It has more income poverty than food poverty. Mostly, poverty is concentrated in the depressed
areas and katchi abadis and slum concentrations.
4.3 Lahore
We carried out a survey to get further insights into the various dimensions of the
informal sector and the lives of those engaged in activities that are widespread but
underrepresented or ignored in the national surveys and planning. We used convenience
sampling technique for selecting the individuals. No comprehensive list is available for street
vendors and waste pickers. Home based workers were identified with the help of various NGOs
working in Lahore. We used structured questionnaires to interview 100 street venders out of
which 75 were male, 95 waste pickers of whom 85 were male and 105 home based workers all
of whom were females. The majority of the workers (85 percent) were within the age group of 25
years and above. The survey was completely focused on these three groups constituting a major
part of the informal economy in Lahore. Issues and policy gaps were highlighted through focus
group discussions. The following activity profiles emerged.
4.3.1Activitity Profiles
Waste pickers: These workers collect waste from street and
neighborhood dumps. Usually they rummage for recyclable items like
paper, glass, steel scrap, plastics, etc. Most of the waste pickers are
Afghan refugees who have camped in the area. Bulk of the waste is hazardous in
nature. A number of them scavenge from Lahore’s major dumping ground near Mehmood Booti
(in Ravi Town) on the banks of the River Ravi, where the city’s waste is dumped. An alarming
2 Multiple Indicator Cluster Survey 2007-08
reality is that the waste and damaged material is not vetted properly before recycling and can be
injurious to the health of the pickers as well as the end users of the recycled products.
Home based workers: These workers are usually women working in their own houses.
Women consider their work as a part time activity and usually every member is involved as
helper. It is a safe opportunity of work and a regular source of income for their family’s
education or health. These women are involved in work related to textile, garments, jewelry,
shoemaking, washing bottles, candy wrapping and electronics. One of the grave issues for these
women is low wages despite long hours of daily work. Home-based workers earn from Rs.100 to
150 for 16 hours of work. These women are aware of their exploitation by the middleman
because many NGOs are working with them in resolving their capacity issues. Women
harassment was found as a common problem.
Street vendors: This is the most visible and diversified subsector of the study. These are
usually self employed entrepreneurs who prefer to work independently as compared to work
under someone in a factory as an informal worker. This group not only varies with respect to
economic activity but also differs from each other with respect to working hours. Their clientele
also varies from formal sector factories and retailers to the poor and vulnerable. Some vendors
are involved in trading between cities and working as self employed entrepreneurs. Others own
cart or stalls and sell things by using public spaces. It also includes peddlers who hawk to sell
their products in parks, streets and at rail and bus stations. We found insignificant presence of
women workers. All types of vendors complained about inappropriate treatment by various
government departments. A few reported a regular amount of monthly charges which they have
to pay in order to have liberty at their work place. Mostly children are found as helpers working
at very low wage.
4.3.2 Socio-Economic Profiles
Our survey in Lahore showed informal workers losing out not only from the excluded
economic sector, but also suffer the pains of social exclusion. This exclusion is reflected in low
education, low skills, low wages, poverty, lesser availability of civic facilities, financial services
and harsh working conditions.
First, our research area showed that all respondents are buyers of basic urban facilities
but due to living in underserved katchi abadis, receive poor quality of service. Streets and roads
were a shambles. All respondents have shared housing, 57.2 percent of the respondents own a
house which is mostly family property, 23.4 percent live in rented houses and the rest of the
respondents live in government subsidized housing or properties owned by the employers. 70
percent of these houses were in katchi abadis. Most of these houses are small and consist of one
to two rooms. 86 percent of the houses are pucca (have concrete foundations). Almost 96 percent
of the residents have electricity, 81.4 percent of the inhabitants have access to gas, and 73
percent have usage of telephone. Drinking water is available to 96 percent of the households and
98 percent have toilet facilities available in their vicinity. 5 percent of the inhabitants own
agricultural land and of this 85 percent own land that is valued at over Rs.100,000. Almost all
informal workers complained about electricity shortages and high load shedding. About 40
percent of the respondents had no transportation facility, whereas about 10 percent use bicycles
and a quarter carts for their work related activities. Child care was an issue for women who
worked outside the house as vendors.
Secondly, low education is a distinct feature of informal sector in our research. The total
literacy rate among those who are above 10 years is 60 percent, and 56 percent for females. The
net primary enrolment rate in research area is 72 percent with 59 percent for girls. The gross
primary school enrolment rate is 104 percent with 97 percent for girls. The primary public school
attendance rate of students between 5 to 17 years is 24 percent though the access to schools (less
than 2 km) is 95 percent. Amongst the interviewed almost 65 per cent have received some type
of education. Within the literate 40 had received formal education with 41percent completion
rate at primary level. Only 4 percent manage to complete the matriculation level. None of the
workers had received any training. Only two learned on the job that they are currently doing.
This shows that in informal sector many are deprived of better education and skill training.
Thirdly, low income is also an attribute of informal sector. Most of the workers (69
percent) are earning hardly Rs. 6000 per month: 20 percent of the respondents earn less than
Rs.3000 per month, 6 percent earn more than Rs.10,000 every month and 5 percent of the
households received remittances from abroad with the median value of Rs. 400,000 in the year
2010-11. Low education, low income, large family size and high dependency ratio are reasons
for the prevalence of extreme poverty in the informal sector. Informal workers (34 percent) in
our survey felt they had no other option as preferred mode of earning. Only half of the
respondents wish to be part of the formal sector and want to benefit from the facilities that they
feel are being provided in the formal sector e.g. the minimum wage. A small number (less than 5
percent) also felt that they would be eligible to social protection and have better access to the
market through formalization and better economic prospects. The remaining respondents are
happy with their informal status. However, for more than two-thirds of the interviewed, poverty
played a key role in forcing them to join the informal sector. A small number (10 percent) felt
that with rampant unemployment they had been almost forced to join the informal sector. Almost
52.5 percent of the respondents had households with 7-9 members with 24.6 percent households
having eight to ten family members and about 5 percent having more than eleven family
members. Informal households are poor because only a few family members are part of the
workforce. There were only 20 percent families with more than two breadwinners and rest of the
families had only one member of the household with the responsibility to earn.
Fourthly, a crucial aspect of the informal sector is very low capacity to save and poor
access to financial services. Approximately 52 percent claimed that they just mange to live and
spend all their earnings, while over 44 percent of the respondents reported having taken out
loans. There seem to be five main purposes of borrowing in the sample: business, household
expenditures, marriage of daughters, medical treatment, and children’s needs. Most informal
workers borrow for medical treatment and household expenditure. These loans are usually
obtained in informal ways and only 10 percent of the respondents tried to avail loan from formal
banks and only 6 percent were granted. Around 20 percent have obtained loans from various
NGOs and rest of the respondents prefers to borrow from friends and relatives. Only 6 percent of
the households are able to save and 4 percent of them use informal ways of savings (committee
system and gold). Only 10 percent of the informal workers have bank accounts and 4 percent
have the facility of ATM card and credit card.
Fifthly, all informal workers reported poor medical facilities. They usually use traditional
medicine or fake healers. Headache was the most common ailment that the respondents suffered
from, besides seasonal ailments like fever, coughs, cold and diarrhea. Some also got injured
during work. When injured almost half of them tried home treatments and the other half sought
medical help. Those working outside homes (waste pickers and vendors) are also exposed to
road accidents and occasionally dog and snake bites. Employers/contractors were never willing
to pay compensation for the accidents occurring at work.
Sixthly, almost nonexistent entertainment facilities were reported for the lowest tier. It
appears that these workers toil all day and hardly get time for recreation. In spite of that, 75
percent respondents said they do manage to take time out for watching television, 15 percent of
the respondents said they listen to the radio and tape recorder in their leisure time. Occasionally,
they went to public parks and attended marriage ceremonies and family get-togethers on Eid,
which they reported as entertainment.
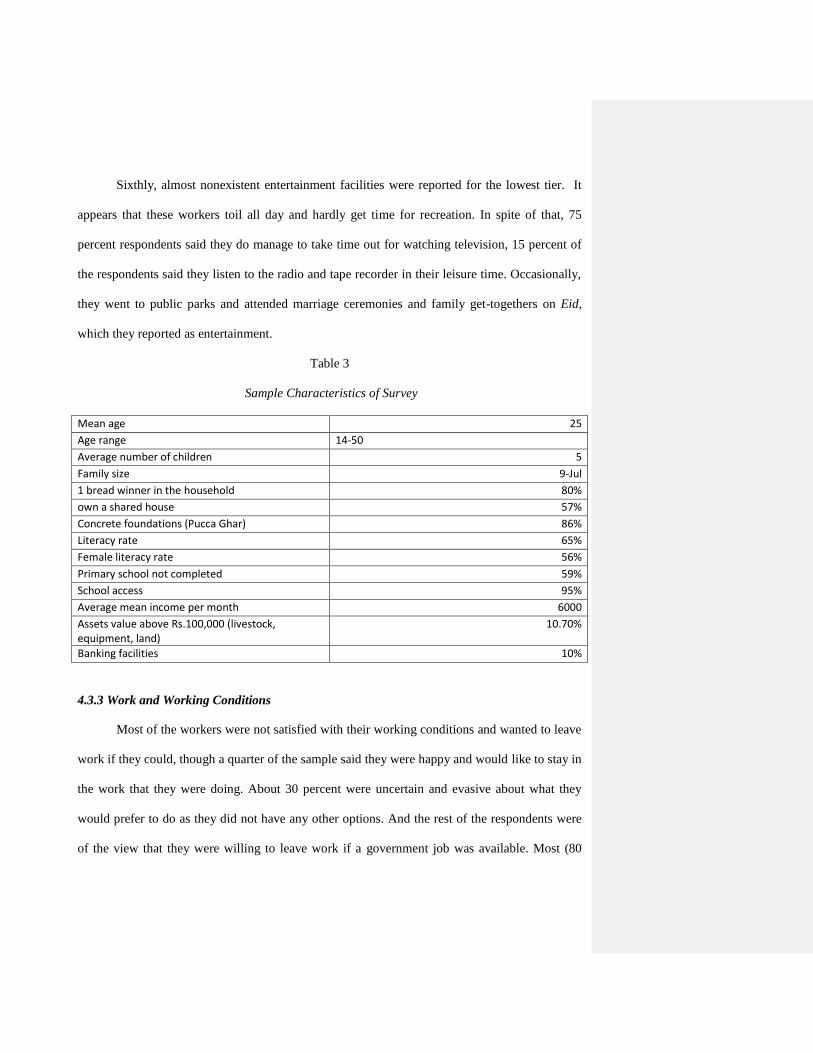
Table 3
Sample Characteristics of Survey
Mean age 25
Age range 14-50
Average number of children 5
Family size 9-Jul
1 bread winner in the household 80%
own a shared house 57%
Concrete foundations (Pucca Ghar) 86%
Literacy rate 65%
Female literacy rate 56%
Primary school not completed 59%
School access 95%
Average mean income per month 6000
Assets value above Rs.100,000 (livestock, equipment, land)
10.70%
Banking facilities 10%
4.3.3 Work and Working Conditions
Most of the workers were not satisfied with their working conditions and wanted to leave
work if they could, though a quarter of the sample said they were happy and would like to stay in
the work that they were doing. About 30 percent were uncertain and evasive about what they
would prefer to do as they did not have any other options. And the rest of the respondents were
of the view that they were willing to leave work if a government job was available. Most (80
percent) of the women are satisfied and contented with their work as it is just a part time activity,
allowing them to contribute to family earnings.
First, our research showed that harsh working conditions are a reality of the informal
sector. 68 percent of the respondents complained about it: 60 percent of them complained about
tough work and long working hours, 12 percent talked about heat and no provision of shade, and
remaining 28 percent had other problems like traveling, nonavailability of Sui gas and lack of
husband’s permission to work outside. Another prominent feature of informal work condition is
abuse at work but our respondents considered it as something separate from working conditions.
A little over a quarter reported being abused at work, the majority stating that they had been
victim of verbal abuse, 5 percent said that they have been subjected to physical abuse and one
percent of the workers had suffered from sexual abuse. It was highlighted that they were
generally abused by family members and associates. Two had been exploited by their employers.
All the home based workers in our survey reported exploitation by the middle man, whereas
waste pickers reported abuse by the contractors and family associates.
Secondly, most of the workers reported long working hours and having to carry heavy
loads, something that the home based workers are spared. But they too had to work for long
hours. About 41percent worked for 9 to 12 hours a day and another 34.3 percent for up to 8
hours a day with no day off in a week. However 25 percent respondents managed to get a day off
during the week. Almost 12 percent respondents carried up to 12 kgs of weight, 56 percent had
to carry between 13kgs to 50kgs of weight, 22 percent respondents’ load ranged between 51kgs
to 100kgs and that of 10 respondents as heavy as 100kgs to 200kgs.
Thirdly, our survey of the informal sector showed that most of the respondents (about
68.9percent) had been involved in their work for more than 5 years, and rest of the respondents
joined informal work with no experience and for less than 2 years. Most of the informal workers
are young, 70 percent of the respondents having started work when they were between 13 and
15 years of age and about 11.5 percent were forced to work at the age of seven.
Fourthly, 72 percent of those surveyed were unemployed and only 28 percent were doing
some petty work in the formal sector. Out of these 28 per cent, 4 percentage points were
working as helpers/assistants, 10 percentage points were working as contract workers in different
factories, 2 percentage points were assisting their fathers, selling vegetables or were working in a
garment factory and 12 percentage points of the respondents (mainly women) reportedly doing
nothing apart from the household chores. As the focus principally was on home-based workers,
street vendors and waste collectors, these three groups were asked about the period for which
they have been involved in this kind of work.
Fifthly, isolation and no interaction with any government official or department is the hall
mark of our survey. Non-registered, the informal workers are outside the tax net. All street
vendors pay someone either in bribes or as bhatta and think of themselves as registered. They
have the pride of working for themselves. Vendors putting up stalls in the weekly
Tuesday/Sunday Bazaars pay Rs.100/day to the Market Committee as a fee on a weekly basis.
Even those collecting waste in the Bazaars have to pay though it is not clear whether this is
official or just some kind of commission to the organizers to guarantee the collection.
Sixthly, those surveyed reported a general lack of support from official or unofficial
quarters (NGOs, contractors/intermediaries). In cases of emergency or crises about two-thirds
reported seeking help form family or friends though not necessarily receiving positive responses.
Just one-tenth of the respondents confirmed that they had been approached by non-governmental
organizations who had tried to assist them and some 15 percent reported assistance and support
from contractors. When enquired about kind of help they expect to get from the government or
the non-governmental organization, 55.7 percent respondents said that they needed financial
assistance in order to meet their expenses (home/ shelter; shop to be allocated to them in the
market where they work; funds for marriages of their daughters and sisters). Only 2 percent
respondents asked to provide education for their children and 5 percent wanted jobs for
themselves, while 38 percent were not clear about the kind of help they need.
5. RESULTS AND DISCUSSION
This section provides empirical evidence of panel data model on the informal sector of
Pakistan. A summary of the results of panel data model, fixed effect and random effect is given
in Table 4. Fixed Effects Model (FE) is used to analyze the common effect of the predicator
which may or may not have a relationship with the outcome variable. It is also called within
group effect. In our study a fixed effect model assumes that all factors that can influence
employment in informal sector are the same. Fixed-effect models cannot be biased because of
omitted time-invariant characteristics. In Random Effect Model (RE), ther is an array of effects,
so it allows variation.
Column II represents fixed effect estimates with group 1(minning and quarrying ) as a
reference category. We estimated fixed-effects model assuming that wage is not constant for all
the major industrial employment groups in informal sector in Pakistan. It allowed us to observe
heterogeneity among various employment levels. Coefficients of fixed effect model are
insignificant and show that employment in informal sector is negatively associated with wages.
Value of rho shows 97 percent of the variance is due to differences across panels.
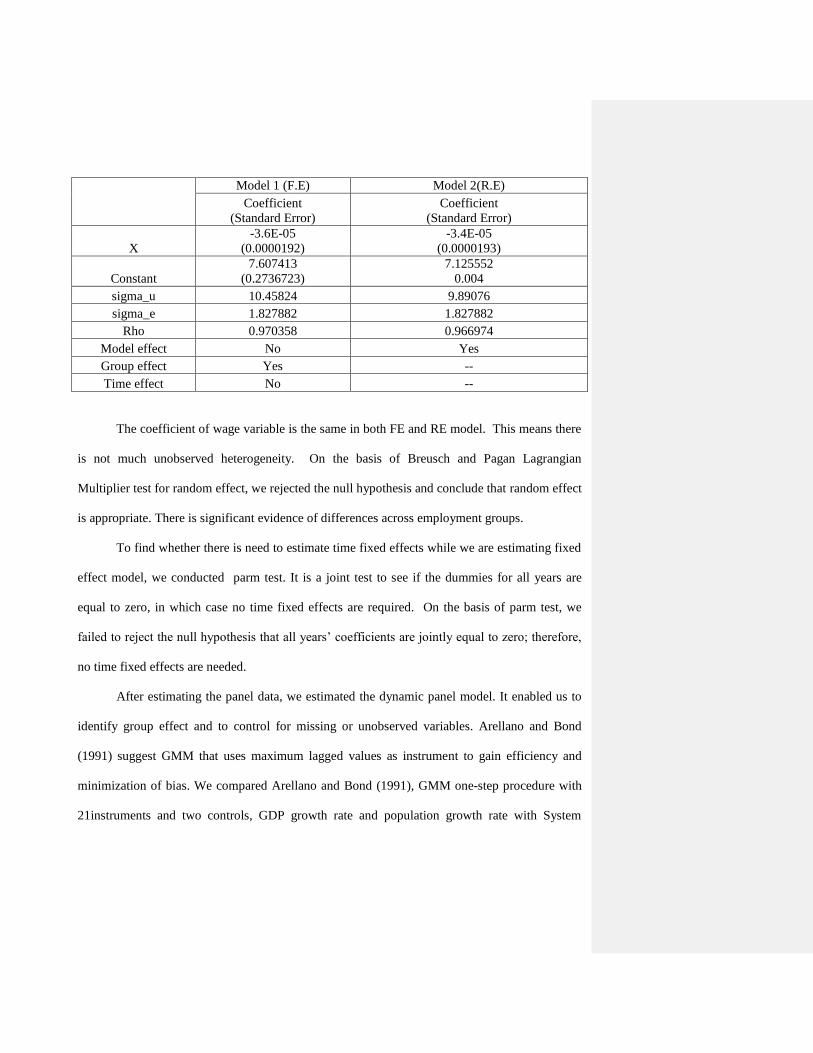
Table4
Results of Panel Data Model (Fixed Effect) and (Random Effect )
Model 1 (F.E) Model 2(R.E)
Coefficient
(Standard Error)
Coefficient
(Standard Error)
X
-3.6E-05
(0.0000192)
-3.4E-05
(0.0000193)
Constant
7.607413
(0.2736723)
7.125552
0.004
sigma_u 10.45824 9.89076
sigma_e 1.827882 1.827882
Rho 0.970358 0.966974
Model effect No Yes
Group effect Yes --
Time effect No --
The coefficient of wage variable is the same in both FE and RE model. This means there
is not much unobserved heterogeneity. On the basis of Breusch and Pagan Lagrangian
Multiplier test for random effect, we rejected the null hypothesis and conclude that random effect
is appropriate. There is significant evidence of differences across employment groups.
To find whether there is need to estimate time fixed effects while we are estimating fixed
effect model, we conducted parm test. It is a joint test to see if the dummies for all years are
equal to zero, in which case no time fixed effects are required. On the basis of parm test, we
failed to reject the null hypothesis that all years’ coefficients are jointly equal to zero; therefore,
no time fixed effects are needed.
After estimating the panel data, we estimated the dynamic panel model. It enabled us to
identify group effect and to control for missing or unobserved variables. Arellano and Bond
(1991) suggest GMM that uses maximum lagged values as instrument to gain efficiency and
minimization of bias. We compared Arellano and Bond (1991), GMM one-step procedure with
21instruments and two controls, GDP growth rate and population growth rate with System
GMM, two- step procedure with 25 instruments and no control. The results of these experiments
are given in Table 5.
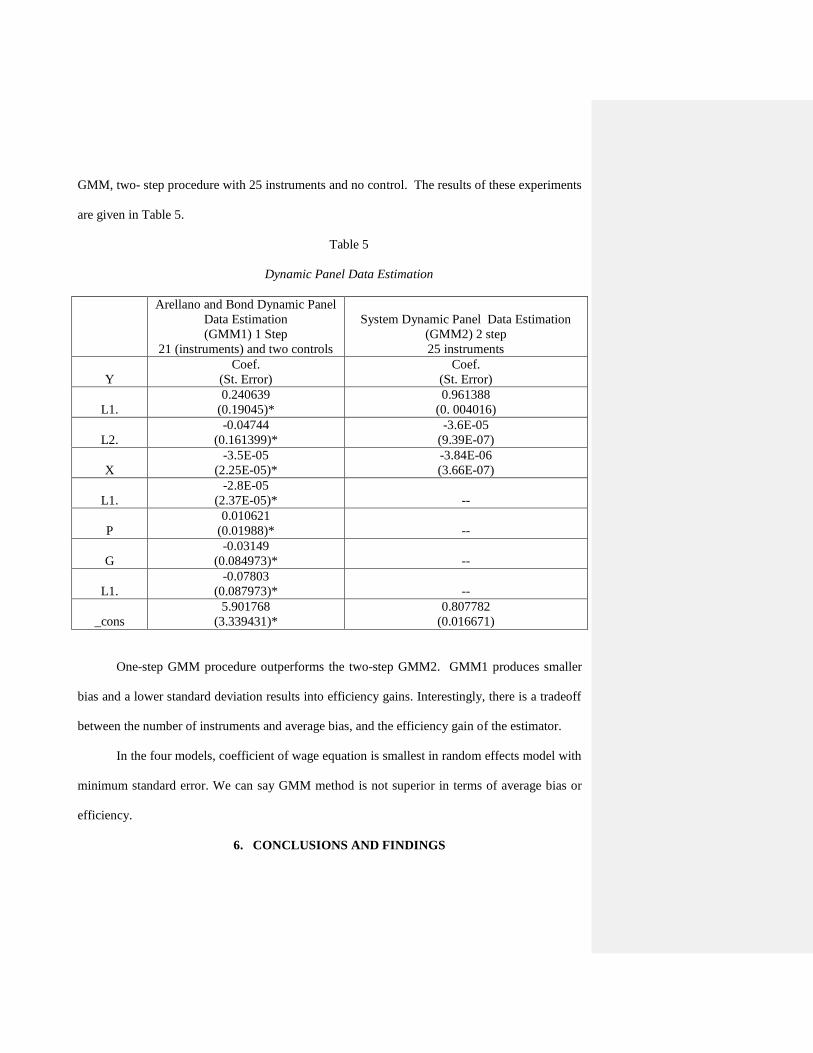
Table 5
Dynamic Panel Data Estimation
Arellano and Bond Dynamic Panel
Data Estimation
(GMM1) 1 Step
21 (instruments) and two controls
System Dynamic Panel Data Estimation
(GMM2) 2 step
25 instruments
Y
Coef.
(St. Error)
Coef.
(St. Error)
L1.
0.240639
(0.19045)*
0.961388
(0. 004016)
L2.
-0.04744
(0.161399)*
-3.6E-05
(9.39E-07)
X
-3.5E-05
(2.25E-05)*
-3.84E-06
(3.66E-07)
L1.
-2.8E-05
(2.37E-05)* --
P
0.010621
(0.01988)* --
G
-0.03149
(0.084973)* --
L1.
-0.07803
(0.087973)* --
_cons
5.901768
(3.339431)*
0.807782
(0.016671)
One-step GMM procedure outperforms the two-step GMM2. GMM1 produces smaller
bias and a lower standard deviation results into efficiency gains. Interestingly, there is a tradeoff
between the number of instruments and average bias, and the efficiency gain of the estimator.
In the four models, coefficient of wage equation is smallest in random effects model with
minimum standard error. We can say GMM method is not superior in terms of average bias or
efficiency.
6. CONCLUSIONS AND FINDINGS
Our findings are in alignment with international studies on informal workers. Informal
sector is a permanent feature of our urban industrial sector. It grew over years and can no more
be considered marginal. Informal workers have to face social and economic exclusion. These
workers face limited work opportunities because of low and poor quality of education, low skill,
low wages, poverty, lesser availability of civic facilities, banking services and harsh working
conditions.
Informal work appears as the only opportunity for earning a livelihood, which provides
meager means to satisfy basic needs. These workers are financially productive and a means of
earning for formal sector.
It has been found that women’s work is not only invisible but also not recognized. There
is no data available on the women’s work because most of the time their work is unpaid and non-
monetized. Furthermore, the rate of income that women in the informal sector earn is usually
found to be low in comparison with those that are associated with the formal sector. The crucial
factors for women employment are household size, the number of children in the household,
dependency ratios, fertility patterns and housing characteristics. Most of the women work
because of poverty, which in Pakistan has been on the rise. Our results confirm positive effect of
manufacturing sector growth rate and wages on employment in the informal sector. The results
of our empirical exercise confirm that wages are negatively associated with employment in
informal sector. Random effect and Arellano and Bond (1991) GMM style dynamic panel model
outperforms other techniques. Our results confirm positive effect of population growth on
employment in industrial informal sector whereas GDP growth rate is negatively related with
employment in informal sector. It is interesting to note that in period under study (2001-2010),
we have low GDP growth which is an outcome of following market based reforms. It resulted in
more informal employment.
Moreover, the value of the wage coefficient remained consistent in all models, which
shows there is no unobserved heterogeneity. Group effect is significant in case of manufacturing,
wholesale and retail trade, transportation and community and social work when compared with
reference to mining and quarrying sector employment opportunities. In these sectors wages are
also positively related with employment opportunities. When we compare these categories with
female workers, except for manufacturing and community and social work all types of
employment opportunities turned out to be insignificant and negatively related to wages.
However, latent time effect is not significant. Our results thus show more significant gender
heterogeneity.
It has been found that women’s work is not only invisible and non-monetised, but the
market is gender insensitive and does not have a human face. Neoliberal polices have increased
gender inequalities and poverty.
REFERENCES
Arby, M.F., M. J. Malik,and M. N. Hanif (2010) The size of informal economy in Pakistan. SBP
working Paper No 33.
Arellano, M.(1989) A note on the Anderson-Hsiao estimator for panel data. Economics Letters
31, 337-341.
Arellano, M. and S. Bond (1991) Some tests of Specification for Panel data: Monte Carlo
Evidence and an Application to Employment Equations. Review of Economic Studies 58,
277-97.
Babb, E. (1996) After the Revolution: Neoliberal Policy and Gender in Nicaragua. Latin
American Perspectives Women in Latin America Part 2, 23:1 27-48
Baltagi, Badi H. (1998) Panel Data Methods. In Aman Ullah and David E.A.Giles (eds.)
Handbook of Applied Economic Statistics. New York: Marcel Dekker
Bell, E. and Brambilla, P. (2002). Gender and Economic Globalization: An Annotated
Bibliography. BRIDGE, Institute of Development Studies, Brighton.
Bruton, G. D., R. D. Ireland , D. J. Ketchen, Jr.(2012) Toward a Research Agenda on The
Informal Economy. Academy of Management Perspectives AMP-2012-0079-A.R1
Bureau of Statistics, Planning and Development Department, Government of the Punjab –
Multiple Indicator Cluster Survey, Punjab 2007–08, Lahore, Pakistan.
Census Reports of Pakistan, 1973, 1981 and 1998. Population Census Organization, Government
of Pakistan
Charmes J. (2000), The Contribution of Informal Sector to GDP in Developing Countries:
Assessment, Estimates, Methods, Orientations for the Future, Fourth Meeting of the Expert
(Delhi) Group on Informal Sector Statistics, Geneva, August 2000, International Labour
Office, Geneva.
Chaudhuri, S. and U.Mukhopadhyay (2010) Revisiting the informal sector: A general
equilibrium approach. New York: Springer.
Chen, M.A, (2007) Rethinking the Informal Economy: Linkages with the Formal Economy and
the Formal Regulatory Environment
Chomsky, Noam (1997) Market Democracy in a Neoliberal Order: Doctrines and Reality.
Z Magazine, November, 1997
Constitution of Pakistan (2010). Islamabad: Centre of Civic Education.
Coulter, Kendra(2009) Women, Poverty Policy, and the Production of Neoliberal Politics in
Ontario, Canada. Journal of Women, Politics & Policy 30:1, 23-45.
De Pardo, M.L. & G.M. Castano, (1991). The articulation of formal and informal sectors in the
economy of Bogota, Columbia. In: Portes, A., Castells, M. & Benton, L.A. (eds.). The
informal economy, London: The John Hopkins University Press, pp. 95-111.
Fortuna, J.C. & Prates, S. (1991) Informal sector versus informalized labor relations in Uruguay.
In: Portes, A., Castells, M. & Benton, L.A. (eds.) The informal economy, London: The John
Hopkins University Press, pp. 78-95.
Freeman, C. (2001) Is Local: Global as Feminine: Masculine? Rethinking the Gender of
Globalization. Signs 26:4,1007-1038.
Gennari, P.( 2004) The Estimation of Employment and Value Added of Informal Sector in Pakistan.
7th Meeting of the Expert Group on Informal Sector Statistics (Delhi Group) New Delhi, 2-4
February 2004
Government of Pakistan (2005)Medium Term Development Framework. Planning Commission
of Pakistan, Islamabad, May, 2005
Government of Pakistan (2006) Labour Protection Policy 2006. Ministry of Labour, Manpower
and Overseas Pakistanis, Islamabad, June, 2006.
Government of Pakistan (2006) Labour Inspection Policy 2006. Ministry of Labour, Manpower
and Overseas Pakistanis, Islamabad March, 2006.
Government of Pakistan (2010) Poverty Reduction Strategy PaperII. IMF Country Report No.
10/183, Finance Division June 2010.
Griliches, Z. and J.A. Hausman,(1986). Errors in variables in panel data, Journal of
Econometrics 31, 93-118.
Guisinger, S. & Irfan, M. (1980) Pakistan’s informal sector. Journal of Development Studies,
16:4, 412-427.
Hausman, J.A., 1978, Specification tests in econometrics, Econometrica 46, 1251-1271
Hsiao, C., (1986) Analysis of panel data. Cambridge: Cambridge University Press
Hutton, W., and Giddens, A. (2000). On the Edge. Living with Global Capitalism. London:
Jonathan Cape.
Home Net Foundation. (2009). Draft Policy for home based workers in Pakistan
Idris,I. (2008). Legal Empowerment in Pakistan. United Nations Development Programme,
Pakistan
ILO (1993 a). Statistics of employment in the informal sector. Report for the XVth International
Conference of Labour Statisticians, 19-28 January 1993, Geneva.
ILO (1993 b). Report of the Conference. Report of the XVth International Conference of Labour
Statisticians, 19-28 January 1993, Geneva.
Kemal, A.R and Z. Mehmood (1998) The Urban Informal Sector of Pakistan: Some Stylized
Facts. Pakistan Institute of Development Economics (PIDE) Research Report No161.
Khan, T. and R.E. A. Khan (2009) Urban Informal Sector: How much Women are Struggling for
Family Survival. The Pakistan Development Review 48:1, 67-95.
Mumtaz ,Khawar and Saleem, Nadia (2010) “Informal Economy Budget Analysis in Pakistan
and Ravi Town, Lahore” Urban Policies Research Report, No. 3 Women in Informal
Employment: Globalizing and Organizing
Pakistan Labour Force Survey 2001-02, 2002-03, 2005-06, 2007-08 and 2009-10, 2010-11
Federal Bureau of Statistics, Statistic Division, Government of Pakistan.
Pakistan Participatory Poverty Assessment National Report. (2003)Government of Pakistan.
PPA(2003)] Pakistan Participatory Poverty Assessment, National and Punjab, Sindh, NWFP,
Baluchistan, AJK, FANA Reports. Government of Pakistan, Planning Commission,
Islamabad. 2003
Pearson, R. (1998). ‘Nimble fingers’ Revisited: Reflection on Women and Third World
Industrialization in the Late Twentieth Century, in C. Jackson & R. Pearson, Feminist Visions
of Development, Gender, Analysis and Policy. New York: Routledge
Pietrobelli, C., Rabellotti, R., & Aquilina, M. (2004). An empirical study of the determinants of
self-employment in developing countries. Journal of International Development, 16, 803820.
Portes, A. and K. Hoffman( 2003) Latin American Class Structures: Their Composition and
Change during the Neoliberal Era. Latin American Research Review, 38: 1 41-8
Rodin, D. L., K. McNeill, N. Vite-León and J. Heymann (2012): Determinants of informal
employment among working mothers in Mexico, Community, Work & Family, 15:1, 85-99
Soto, H. De (1989). The Other Path: The Economic Answer to Terrorism. New York: Basic
Books.
Shaheed, Farida and Mumtaz, Khawar (1981) Invisible Workers: Piecework Labourer among
Women in Pakistan in Lahore. Women Division,Government of Pakistan, Islamabad.

Standing, G. (1999) Global Feminization through Flexible Labour: A Theme Revisited. World
Development, 27:3, 583-602.
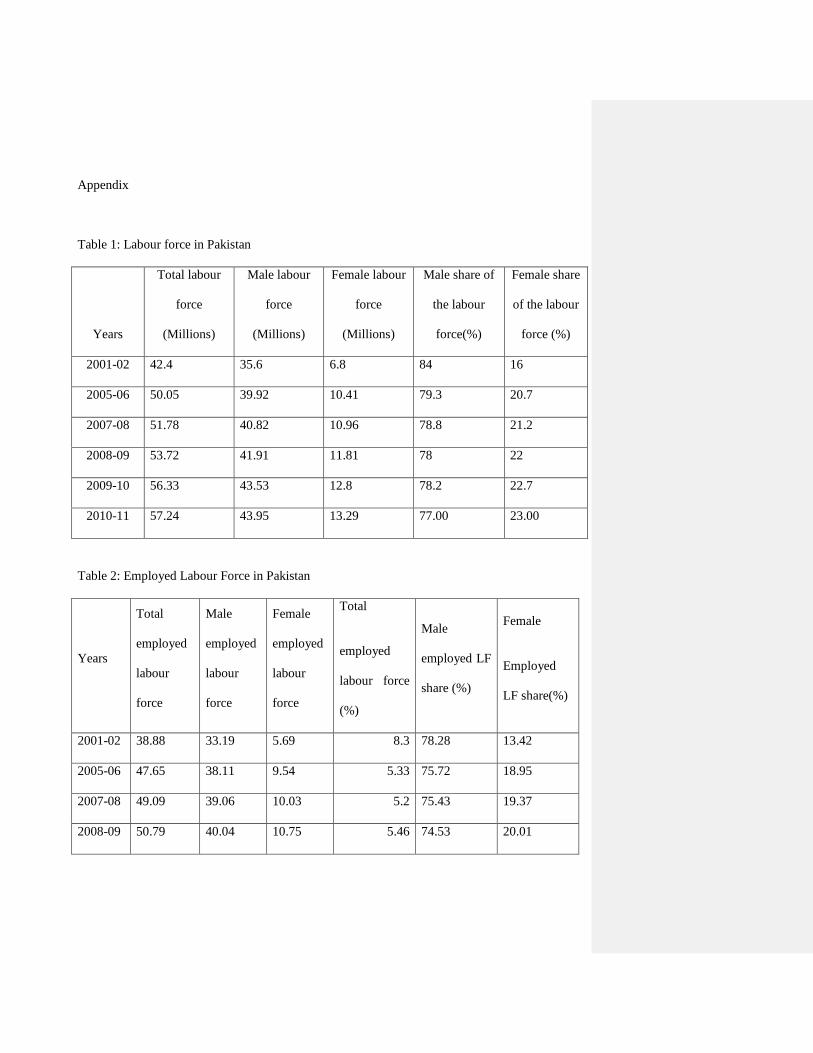
Appendix
Table 1: Labour force in Pakistan
Years
Total labour
force
(Millions)
Male labour
force
(Millions)
Female labour
force
(Millions)
Male share of
the labour
force(%)
Female share
of the labour
force (%)
2001-02 42.4 35.6 6.8 84 16
2005-06 50.05 39.92 10.41 79.3 20.7
2007-08 51.78 40.82 10.96 78.8 21.2
2008-09 53.72 41.91 11.81 78 22
2009-10 56.33 43.53 12.8 78.2 22.7
2010-11 57.24 43.95 13.29 77.00 23.00
Table 2: Employed Labour Force in Pakistan
Years
Total
employed
labour
force
Male
employed
labour
force
Female
employed
labour
force
Total
employed
labour force
(%)
Male
employed LF
share (%)
Female
Employed
LF share(%)
2001-02 38.88 33.19 5.69 8.3 78.28 13.42
2005-06 47.65 38.11 9.54 5.33 75.72 18.95
2007-08 49.09 39.06 10.03 5.2 75.43 19.37
2008-09 50.79 40.04 10.75 5.46 74.53 20.01
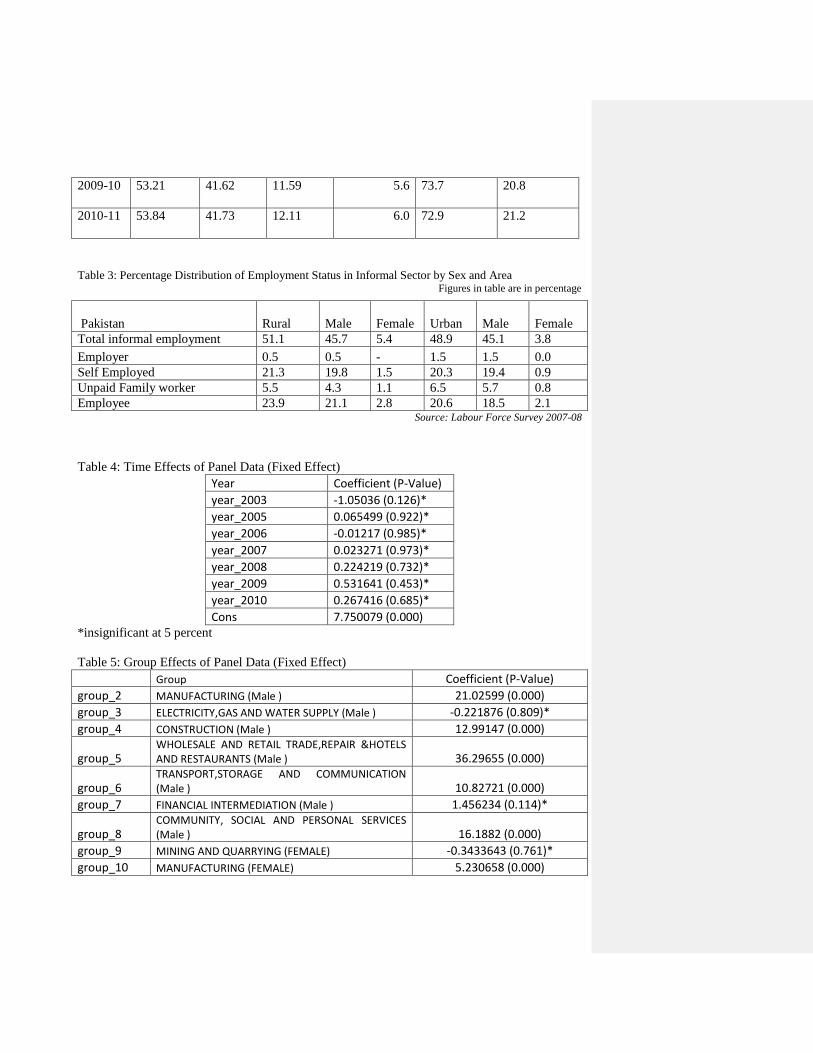
2009-10 53.21 41.62 11.59 5.6 73.7 20.8
2010-11 53.84 41.73 12.11 6.0 72.9 21.2
Table 3: Percentage Distribution of Employment Status in Informal Sector by Sex and Area Figures in table are in percentage
Pakistan Rural Male Female Urban Male Female
Total informal employment 51.1 45.7 5.4 48.9 45.1 3.8
Employer 0.5 0.5 - 1.5 1.5 0.0
Self Employed 21.3 19.8 1.5 20.3 19.4 0.9
Unpaid Family worker 5.5 4.3 1.1 6.5 5.7 0.8
Employee 23.9 21.1 2.8 20.6 18.5 2.1 Source: Labour Force Survey 2007-08
Table 4: Time Effects of Panel Data (Fixed Effect)
Year Coefficient (P-Value)
year_2003 -1.05036 (0.126)*
year_2005 0.065499 (0.922)*
year_2006 -0.01217 (0.985)*
year_2007 0.023271 (0.973)*
year_2008 0.224219 (0.732)*
year_2009 0.531641 (0.453)*
year_2010 0.267416 (0.685)*
Cons 7.750079 (0.000) *insignificant at 5 percent
Table 5: Group Effects of Panel Data (Fixed Effect)
Group Coefficient (P-Value)
group_2 MANUFACTURING (Male ) 21.02599 (0.000)
group_3 ELECTRICITY,GAS AND WATER SUPPLY (Male ) -0.221876 (0.809)*
group_4 CONSTRUCTION (Male ) 12.99147 (0.000)
group_5 WHOLESALE AND RETAIL TRADE,REPAIR &HOTELS AND RESTAURANTS (Male ) 36.29655 (0.000)
group_6 TRANSPORT,STORAGE AND COMMUNICATION (Male ) 10.82721 (0.000)
group_7 FINANCIAL INTERMEDIATION (Male ) 1.456234 (0.114)*
group_8 COMMUNITY, SOCIAL AND PERSONAL SERVICES (Male ) 16.1882 (0.000)
group_9 MINING AND QUARRYING (FEMALE) -0.3433643 (0.761)*
group_10 MANUFACTURING (FEMALE) 5.230658 (0.000)
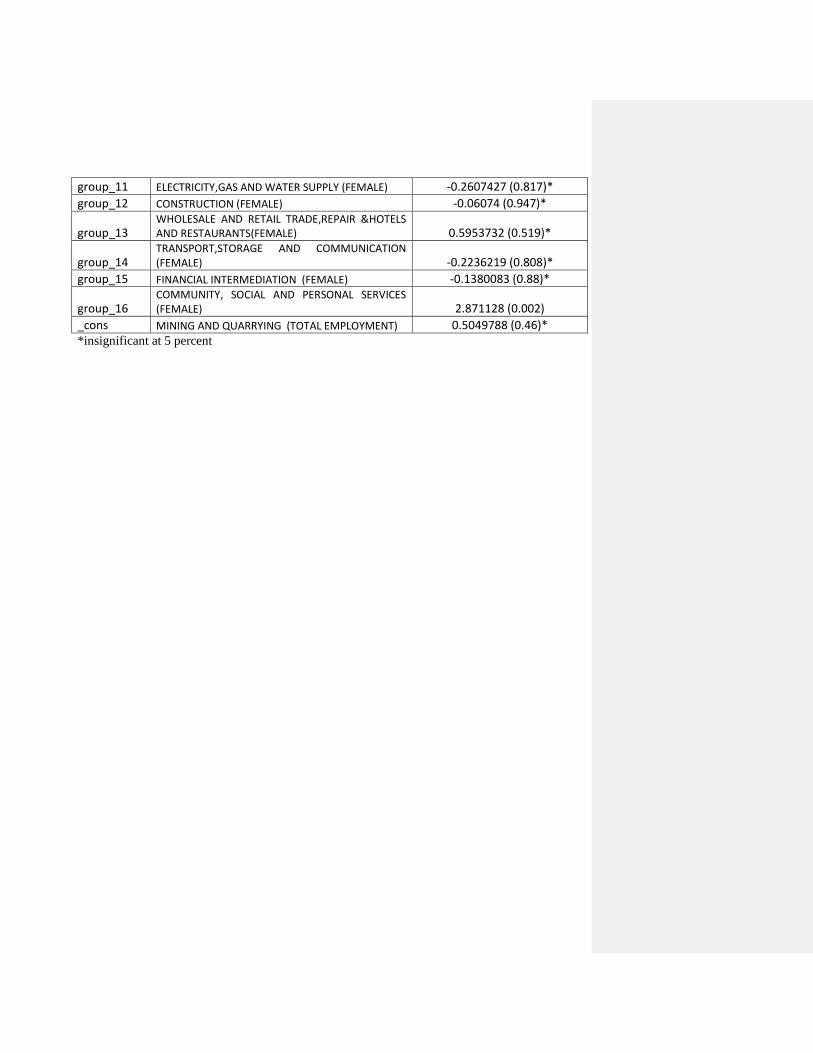
group_11 ELECTRICITY,GAS AND WATER SUPPLY (FEMALE) -0.2607427 (0.817)*
group_12 CONSTRUCTION (FEMALE) -0.06074 (0.947)*
group_13 WHOLESALE AND RETAIL TRADE,REPAIR &HOTELS AND RESTAURANTS(FEMALE) 0.5953732 (0.519)*
group_14 TRANSPORT,STORAGE AND COMMUNICATION (FEMALE) -0.2236219 (0.808)*
group_15 FINANCIAL INTERMEDIATION (FEMALE) -0.1380083 (0.88)*
group_16 COMMUNITY, SOCIAL AND PERSONAL SERVICES (FEMALE) 2.871128 (0.002)
_cons MINING AND QUARRYING (TOTAL EMPLOYMENT) 0.5049788 (0.46)* *insignificant at 5 percent