interval estimation interval estimation of a population mean: large sample case interval estimation...
Post on 19-Dec-2015
243 views
TRANSCRIPT
Interval Estimation
•Interval estimation of a population mean: Large Sample case
•Interval estimation of a population mean: Small sample case.
Interval Estimation of a Population Mean:Large-Sample Case
• Sampling Error• Probability Statements about the Sampling Error• Interval Estimation: AssumedKnown• Interval Estimation: Estimated by s
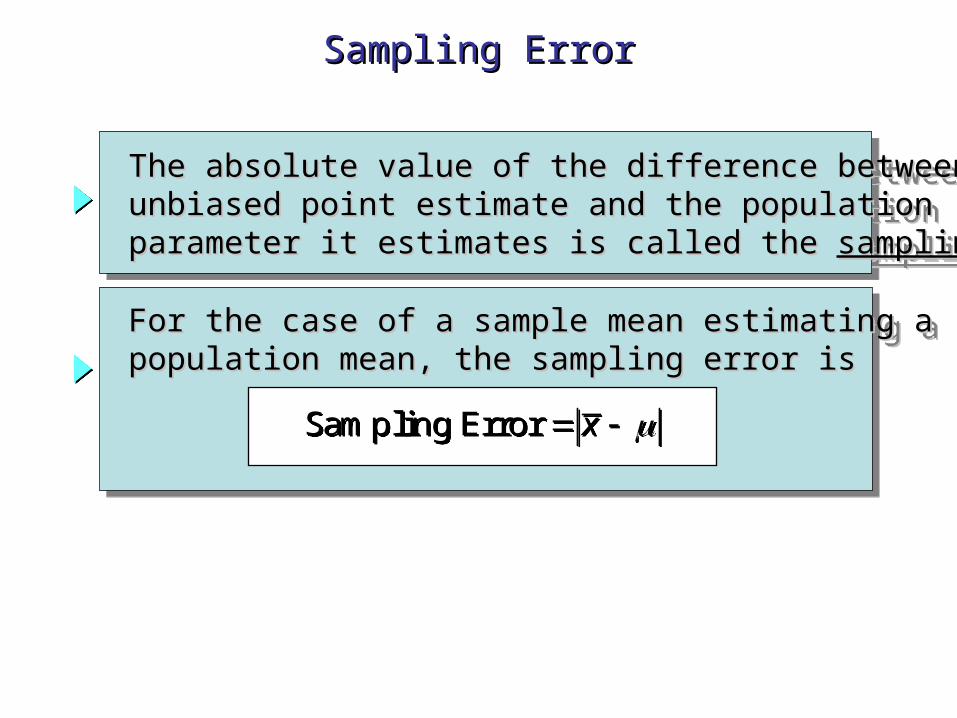
The absolute value of the difference between anThe absolute value of the difference between an unbiased point estimate and the populationunbiased point estimate and the population parameter it estimates is called the parameter it estimates is called the sampling errorsampling error..
The absolute value of the difference between anThe absolute value of the difference between an unbiased point estimate and the populationunbiased point estimate and the population parameter it estimates is called the parameter it estimates is called the sampling errorsampling error..
For the case of a sample mean estimating aFor the case of a sample mean estimating a population mean, the sampling error ispopulation mean, the sampling error is For the case of a sample mean estimating aFor the case of a sample mean estimating a population mean, the sampling error ispopulation mean, the sampling error is
Sampling Error x Sampling Error x
Sampling ErrorSampling Error
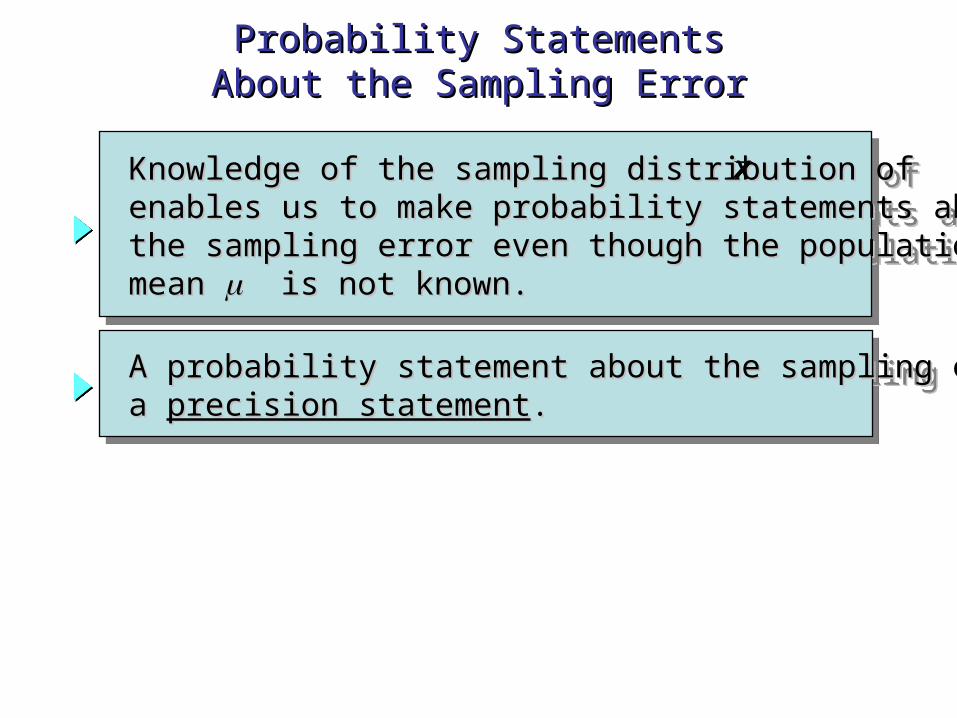
A probability statement about the sampling error isA probability statement about the sampling error is a a precision statementprecision statement.. A probability statement about the sampling error isA probability statement about the sampling error is a a precision statementprecision statement..
Knowledge of the sampling distribution of Knowledge of the sampling distribution of enables us to make probability statements aboutenables us to make probability statements about the sampling error even though the populationthe sampling error even though the population mean mean is not known. is not known.
Knowledge of the sampling distribution of Knowledge of the sampling distribution of enables us to make probability statements aboutenables us to make probability statements about the sampling error even though the populationthe sampling error even though the population mean mean is not known. is not known.
xx
Probability StatementsProbability StatementsAbout the Sampling ErrorAbout the Sampling Error
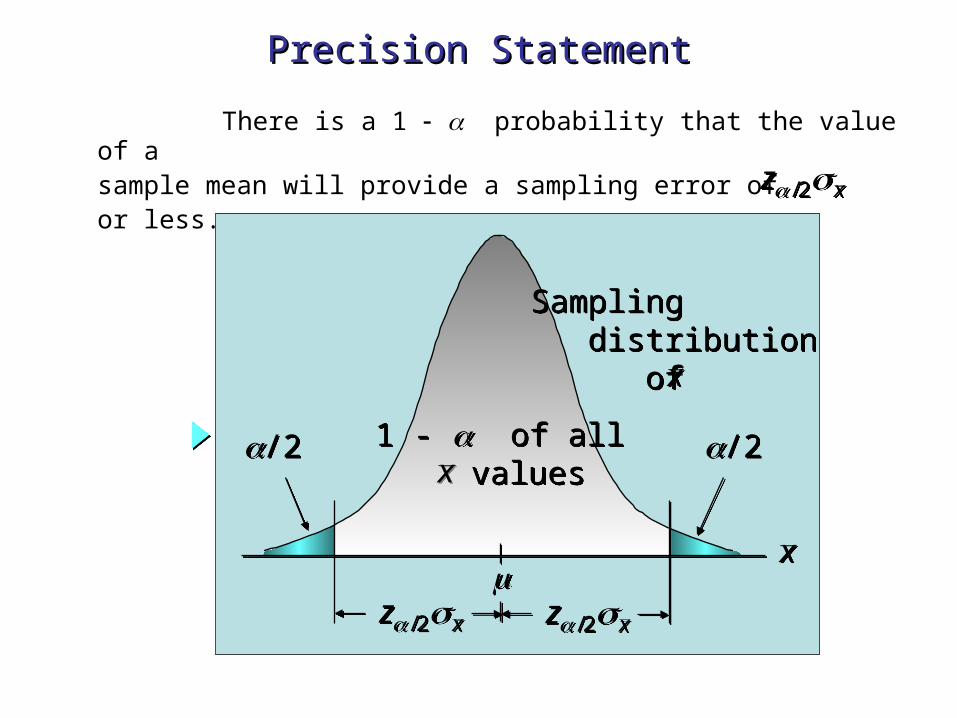
There is a 1 probability that the value of a
sample mean will provide a sampling error of or less.
z x /2z x /2
Precision StatementPrecision Statement
/2/2 /2/21 - of all values1 - of all valuesxx
Sampling distribution of
Sampling distribution of xx
xx
z x /2z x /2z x /2z x /2
/2/2 /2/21 - of all values1 - of all valuesxx
Sampling distribution of
Sampling distribution of xx
xx
z x /2z x /2z x /2z x /2
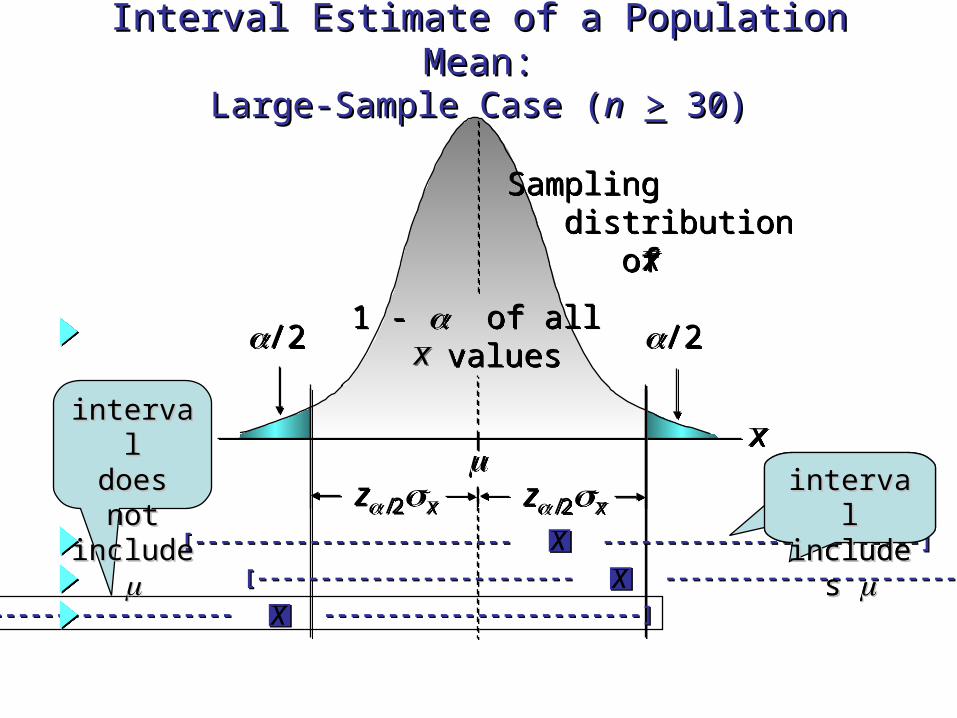
[------------------------- -------------------------][------------------------- -------------------------]
[------------------------- -------------------------][------------------------- -------------------------]
[------------------------- -------------------------][------------------------- -------------------------]
xxxx
xx
intervalintervaldoes notdoes notinclude include
intervalintervalincludes includes
intervalintervalincludes includes
Interval Estimate of a Population Mean:Interval Estimate of a Population Mean:Large-Sample Case (Large-Sample Case (nn >> 30) 30)
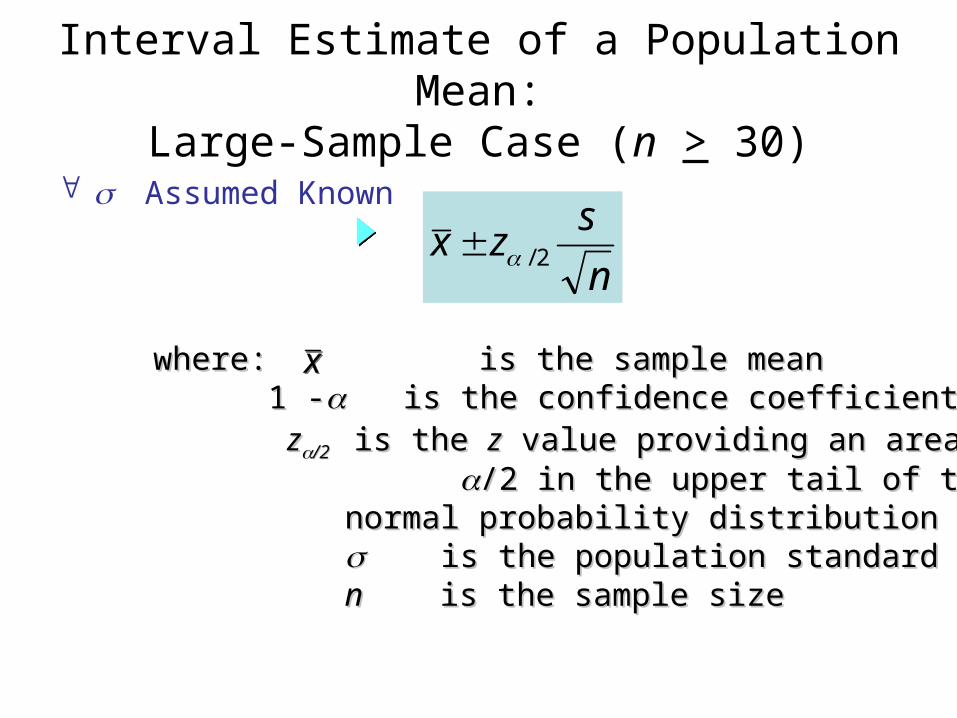
Interval Estimate of a Population Mean:Large-Sample Case (n > 30)
Assumed Known
where: is the sample meanwhere: is the sample mean 1 -1 - is the confidence coefficient is the confidence coefficient zz/2 /2 is the is the zz value providing an area of value providing an area of /2 in the upper tail of the standard /2 in the upper tail of the standard
normal probability distributionnormal probability distribution is the population standard deviationis the population standard deviation nn is the sample size is the sample size
xx
n
szx 2/
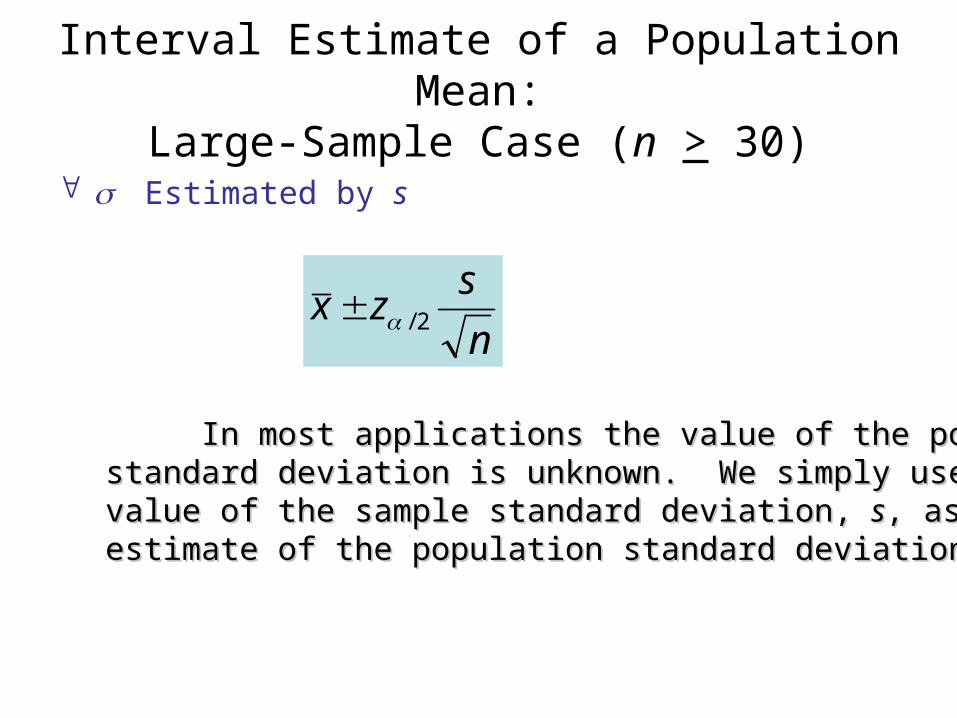
Interval Estimate of a Population Mean:Large-Sample Case (n > 30)
Estimated by s
In most applications the value of the populationIn most applications the value of the populationstandard deviation is unknown. We simply use thestandard deviation is unknown. We simply use thevalue of the sample standard deviation, value of the sample standard deviation, ss, as the point, as the pointestimate of the population standard deviation.estimate of the population standard deviation.
n
szx 2/
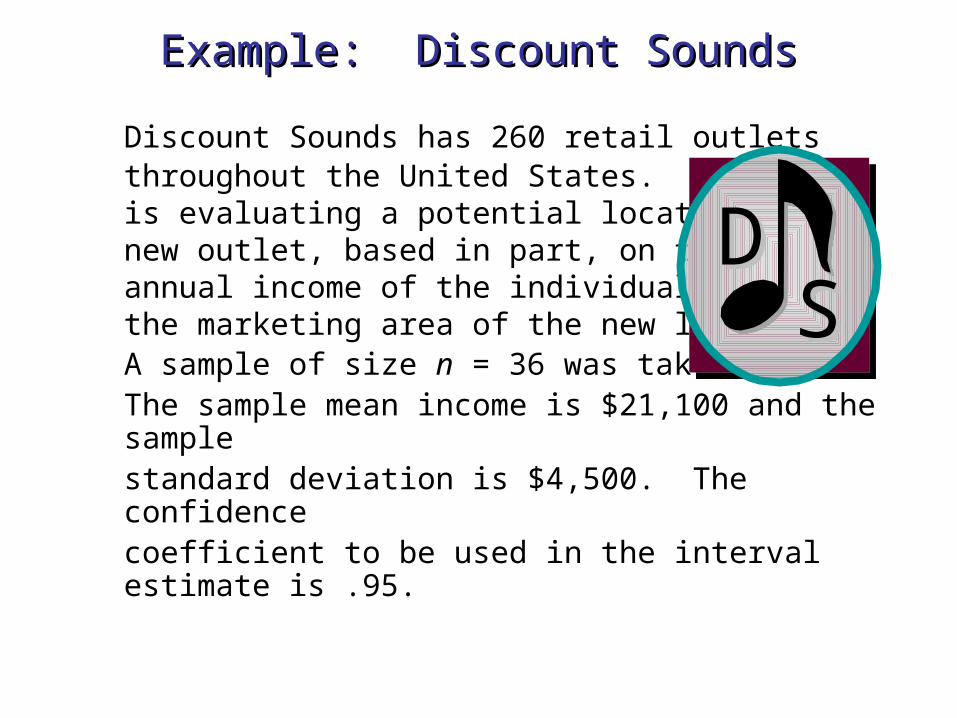
Discount Sounds has 260 retail outlets throughout the United States. The firmis evaluating a potential location for anew outlet, based in part, on the meanannual income of the individuals inthe marketing area of the new location.
A sample of size n = 36 was taken.The sample mean income is $21,100 and the samplestandard deviation is $4,500. The confidencecoefficient to be used in the interval estimate is .95.
Example: Discount SoundsExample: Discount Sounds
SSDD
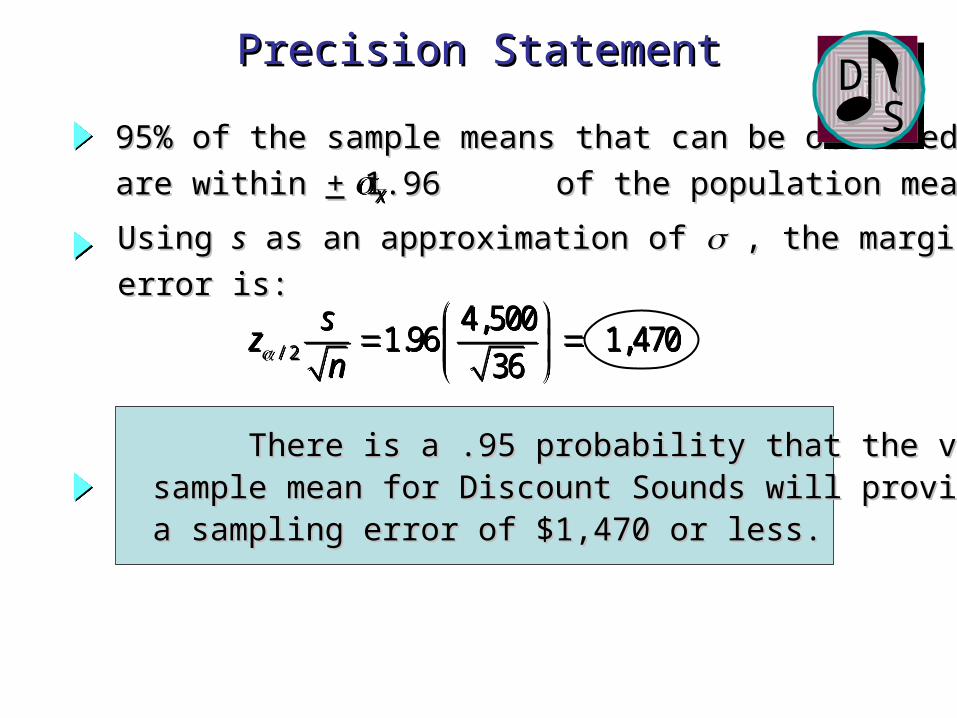
95% of the sample means that can be observed95% of the sample means that can be observed
are within are within ++ 1.96 of the population mean 1.96 of the population mean . . x x
Using Using ss as an approximation of as an approximation of , the margin of , the margin of
error is: error is:
/ 2
4,5001.96 1,470
36s
zn
/ 2
4,5001.96 1,470
36s
zn
Precision StatementPrecision Statement
There is a .95 probability that the value of aThere is a .95 probability that the value of a sample mean for Discount Sounds will providesample mean for Discount Sounds will provide a sampling error of $1,470 or less.a sampling error of $1,470 or less.
SSDD
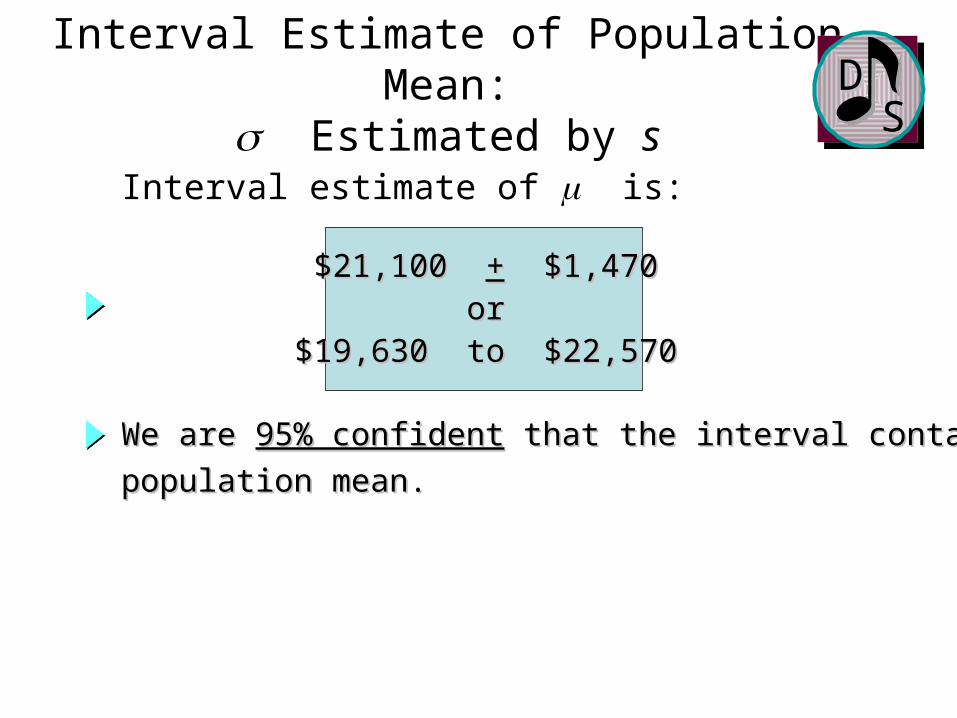
Interval estimate of is:
Interval Estimate of Population Mean: Estimated by s SS
DD
We are We are 95% confident95% confident that the interval contains the that the interval contains the
population mean.population mean.
$21,100 $21,100 ++ $1,470 $1,470oror
$19,630 to $22,570$19,630 to $22,570
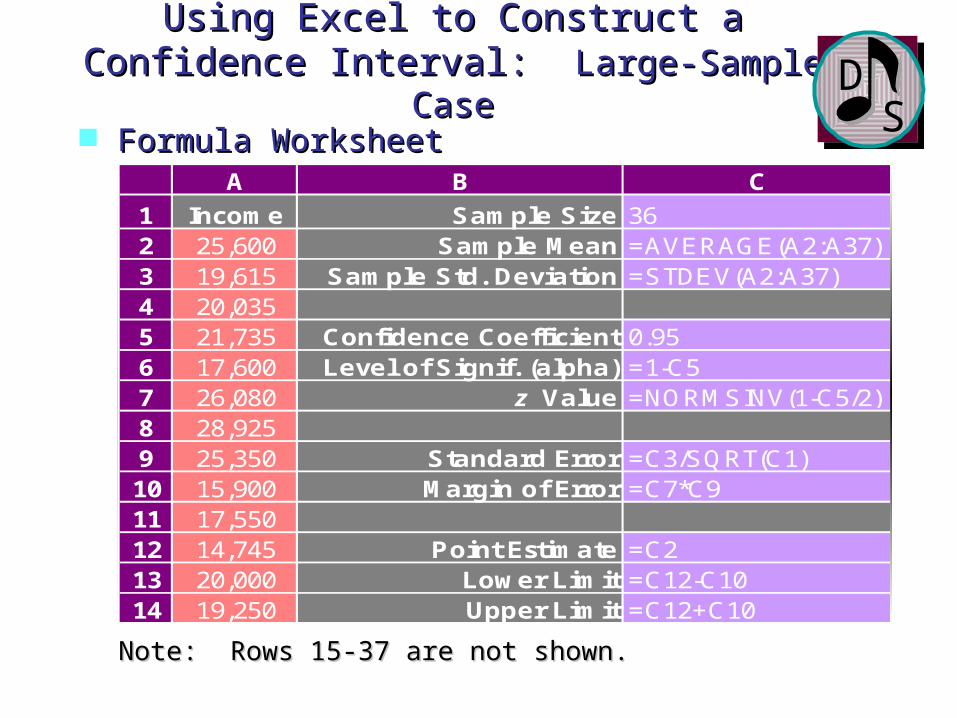
Using Excel to Construct aUsing Excel to Construct aConfidence Interval: Confidence Interval: Large-Sample CaseLarge-Sample Case Formula WorksheetFormula Worksheet
A B C
1 Income Sample Size 362 25,600 Sample Mean =AVERAGE(A2:A37)3 19,615 Sample Std. Deviation =STDEV(A2:A37)4 20,035 5 21,735 Confidence Coefficient 0.956 17,600 Level of Signif. (alpha) =1-C57 26,080 z Value =NORMSINV(1-C5/2)8 28,925 9 25,350 Standard Error =C3/SQRT(C1)10 15,900 Margin of Error =C7*C911 17,55012 14,745 Point Estimate =C213 20,000 Lower Limit =C12-C1014 19,250 Upper Limit =C12+C10
Note: Rows 15-37 are not shown.Note: Rows 15-37 are not shown.
SSDD
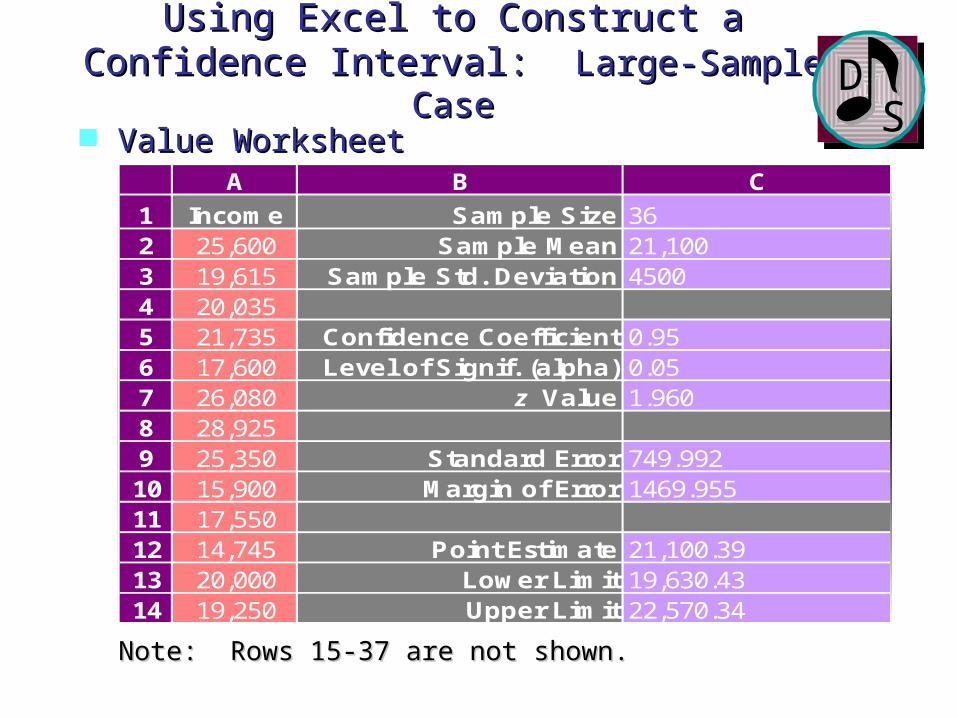
Value WorksheetValue WorksheetA B C
1 Income Sample Size 362 25,600 Sample Mean 21,1003 19,615 Sample Std. Deviation 45004 20,035 5 21,735 Confidence Coefficient 0.956 17,600 Level of Signif. (alpha) 0.057 26,080 z Value 1.9608 28,925 9 25,350 Standard Error 749.99210 15,900 Margin of Error 1469.95511 17,55012 14,745 Point Estimate 21,100.3913 20,000 Lower Limit 19,630.4314 19,250 Upper Limit 22,570.34
Note: Rows 15-37 are not shown.Note: Rows 15-37 are not shown.
Using Excel to Construct aUsing Excel to Construct aConfidence Interval: Confidence Interval: Large-Sample CaseLarge-Sample Case
SSDD
Interval Estimation of a Population Mean:Small-Sample Case (n < 30)
• Population is Not Normally DistributedThe only option is to increase the sample size to The only option is to increase the sample size to
nn >> 30 and use the large-sample interval-estimation 30 and use the large-sample interval-estimation
procedures.procedures.
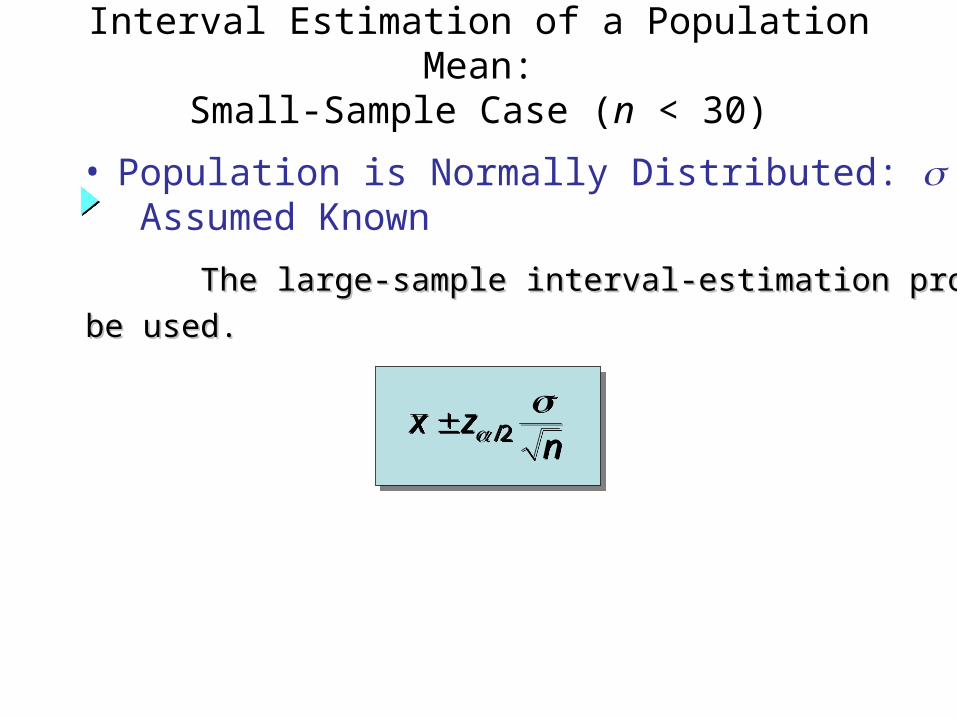
Interval Estimation of a Population Mean:Small-Sample Case (n < 30)
• Population is Normally Distributed: Assumed Known
x zn
/2x zn
/2
The large-sample interval-estimation procedure canThe large-sample interval-estimation procedure can
be used.be used.
• Population is Normally Distributed: Estimated by s
Interval Estimation of a Population Mean:Small-Sample Case (n < 30)
The appropriate interval estimate is based on aThe appropriate interval estimate is based on a
probability distribution known as the probability distribution known as the t t distributiondistribution..
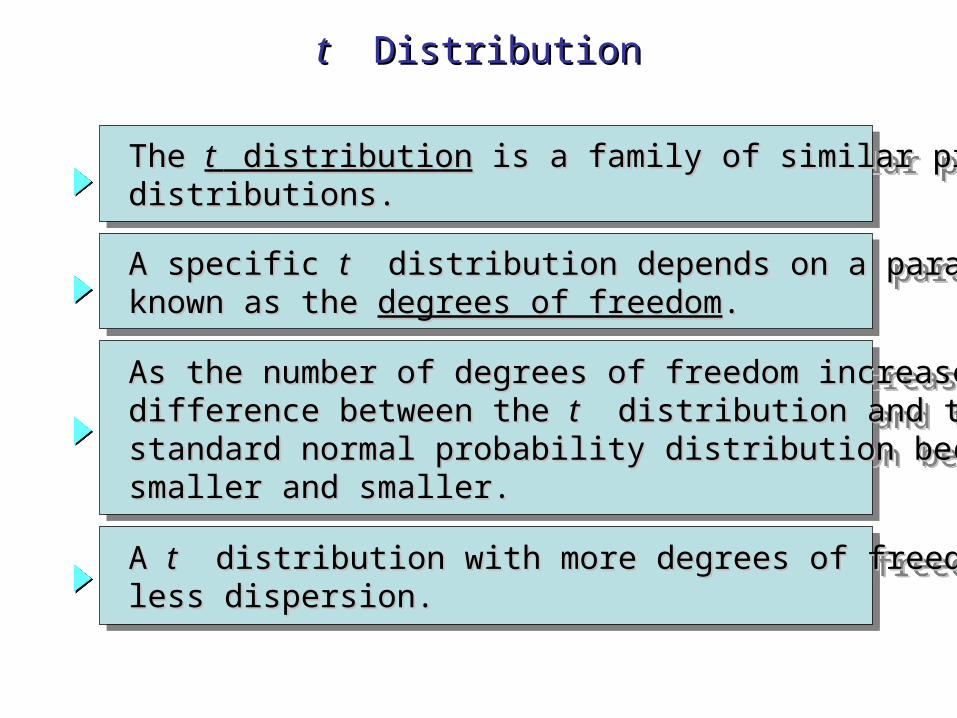
The The t t distribution distribution is a family of similar probability is a family of similar probability distributions.distributions. The The t t distribution distribution is a family of similar probability is a family of similar probability distributions.distributions.
tt Distribution Distribution
A specific A specific tt distribution depends on a parameter distribution depends on a parameter known as the known as the degrees of freedomdegrees of freedom.. A specific A specific tt distribution depends on a parameter distribution depends on a parameter known as the known as the degrees of freedomdegrees of freedom..
As the number of degrees of freedom increases, theAs the number of degrees of freedom increases, the difference between the difference between the tt distribution and the distribution and the standard normal probability distribution becomesstandard normal probability distribution becomes smaller and smaller.smaller and smaller.
As the number of degrees of freedom increases, theAs the number of degrees of freedom increases, the difference between the difference between the tt distribution and the distribution and the standard normal probability distribution becomesstandard normal probability distribution becomes smaller and smaller.smaller and smaller.
A A tt distribution with more degrees of freedom has distribution with more degrees of freedom has less dispersion.less dispersion. A A tt distribution with more degrees of freedom has distribution with more degrees of freedom has less dispersion.less dispersion.
Degrees of Freedom
Degrees of freedom (df) refers to the number of independent pieces of information that go
into the computation of 2)( xxi
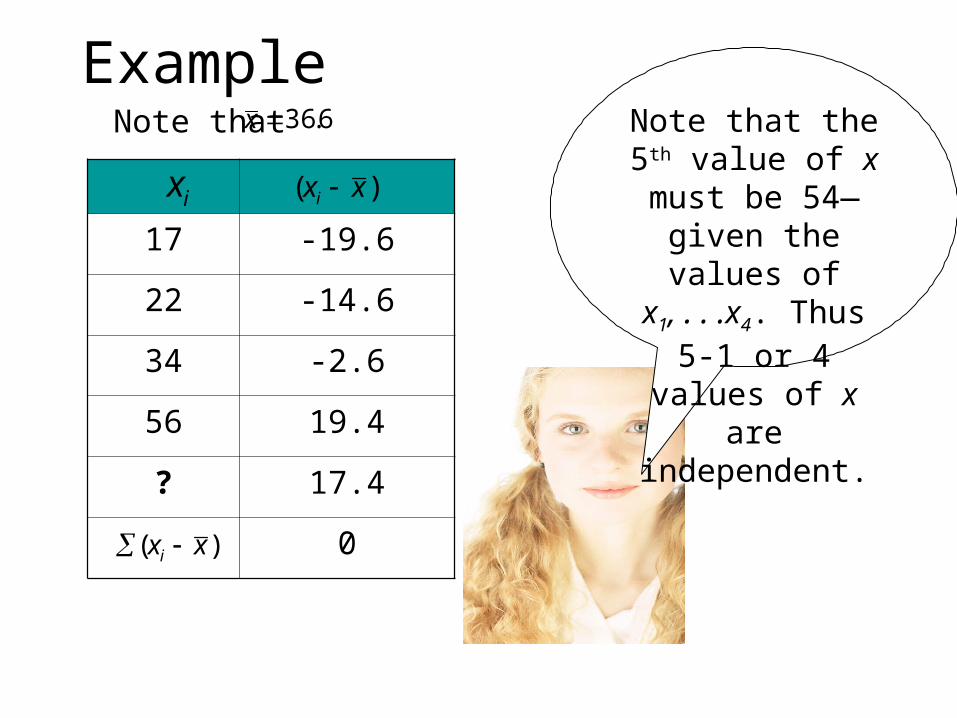
Example
17 -19.6
22 -14.6
34 -2.6
56 19.4
? 17.4
0
ix
)( xxi
ix )( xxi
Note that 6.36x Note that the 5th value of x must be
54—given the values of x1, . . .x4.
Thus 5-1 or 4 values of x are
independent.
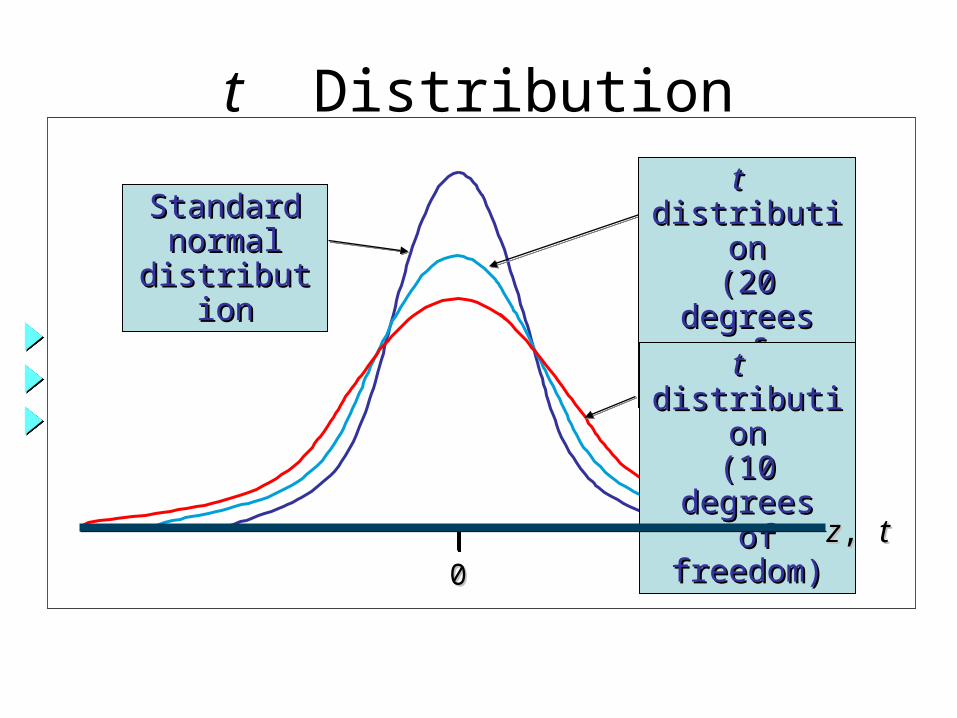
t Distribution
StandardStandardnormalnormal
distributiondistribution
tt distributiondistribution(20 degrees(20 degreesof freedom)of freedom)
tt distributiondistribution(10 degrees(10 degrees
of of freedom)freedom)
00zz, , tt
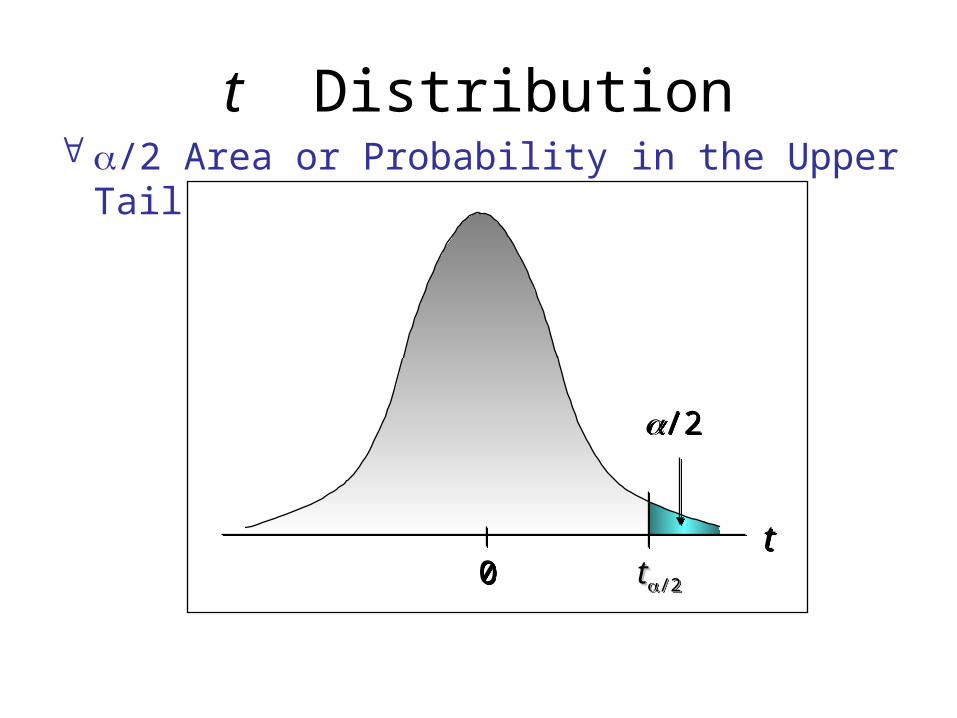
/2 Area or Probability in the Upper Tail
t Distribution
00
/2/2
tttt/2/2tt/2/2
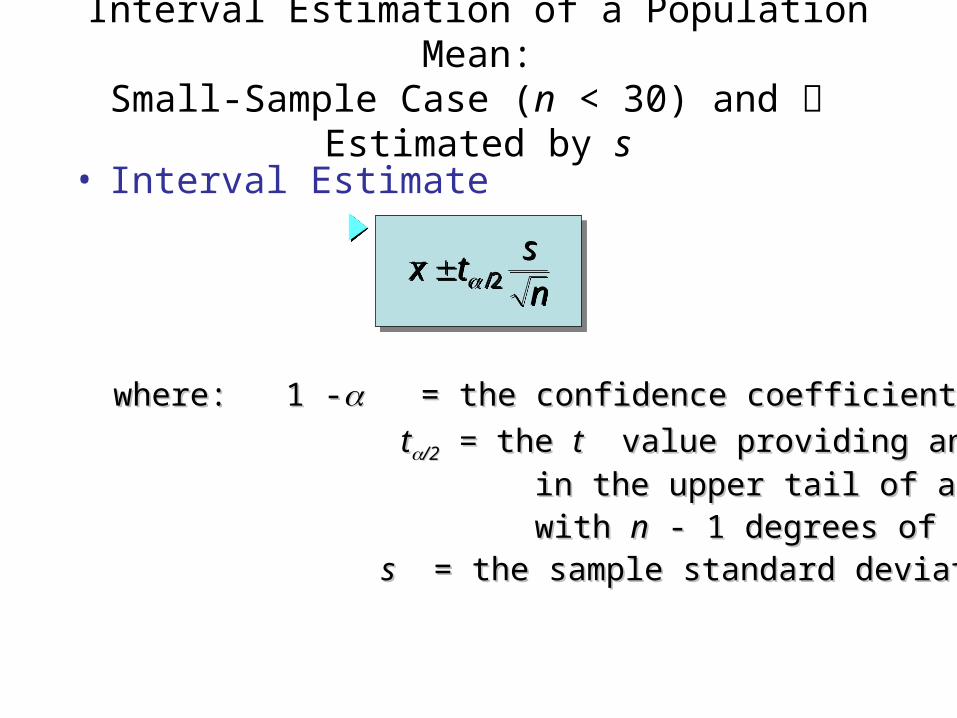
• Interval Estimate
Interval Estimation of a Population Mean:Small-Sample Case (n < 30) and
Estimated by s
x tsn
/2x tsn
/2
where: 1 -where: 1 - = the confidence coefficient = the confidence coefficient
tt/2 /2 == the the tt value providing an area of value providing an area of /2/2 in the upper tail of a in the upper tail of a t t distribution distribution with with nn - 1 degrees of freedom - 1 degrees of freedom ss = the sample standard deviation = the sample standard deviation
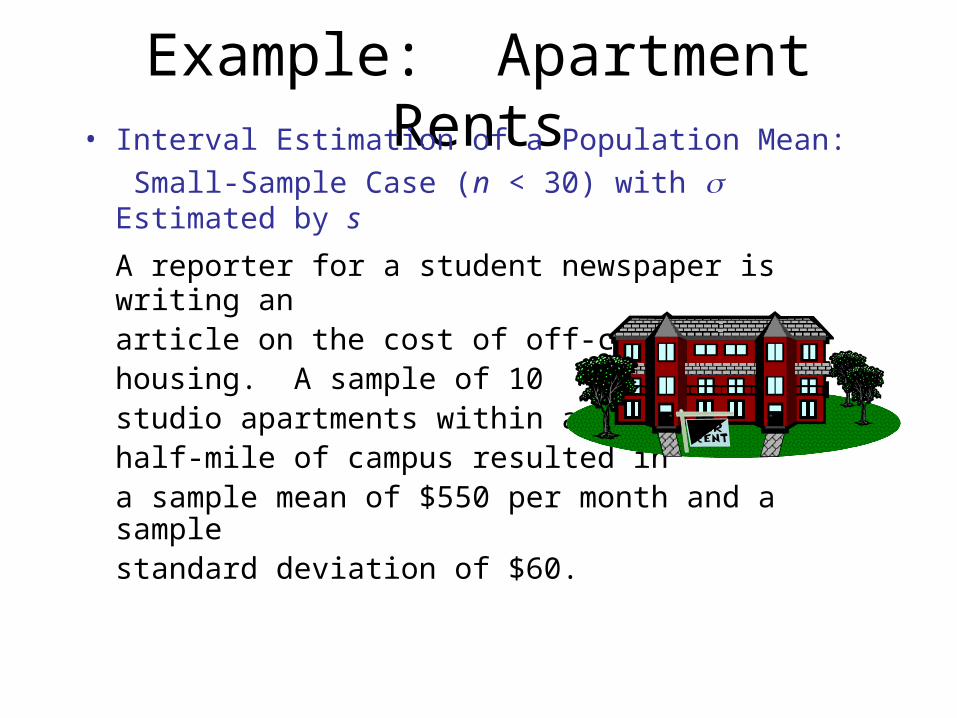
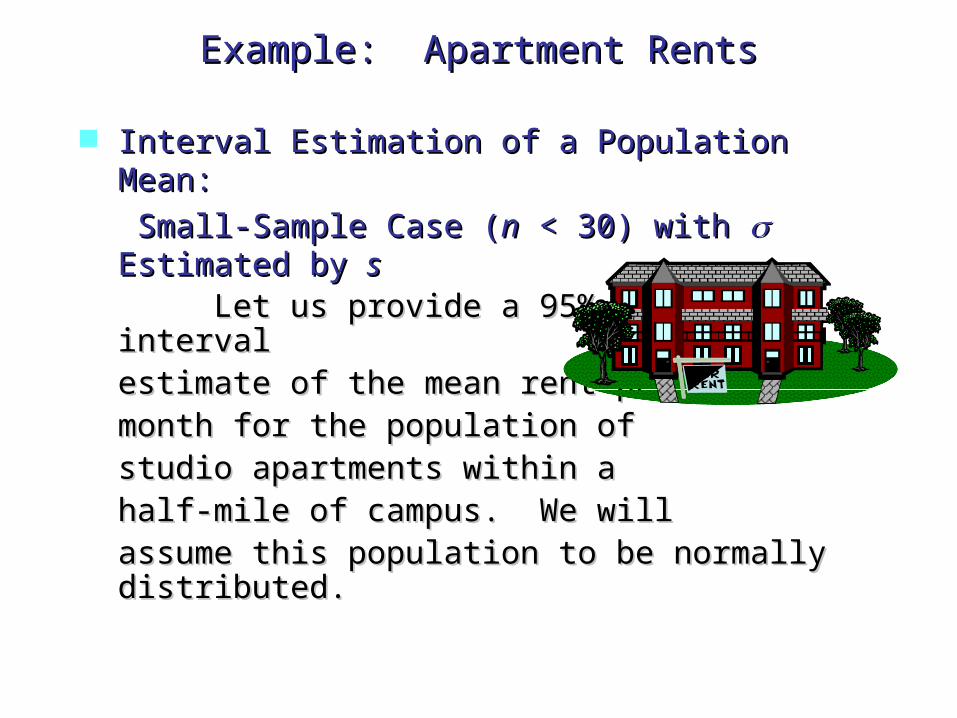
Example: Apartment Rents• Interval Estimation of a Population Mean:
Small-Sample Case (n < 30) with Estimated by s
A reporter for a student newspaper is writing anarticle on the cost of off-campushousing. A sample of 10studio apartments within ahalf-mile of campus resulted ina sample mean of $550 per month and a samplestandard deviation of $60.

Example: Apartment RentsExample: Apartment Rents
Interval Estimation of a Population Mean:Interval Estimation of a Population Mean:
Small-Sample Case (Small-Sample Case (nn < 30) with < 30) with Estimated Estimated by by ss
Let us provide a 95% confidence interval Let us provide a 95% confidence interval estimate of the mean rent perestimate of the mean rent permonth for the population of month for the population of studio apartments within astudio apartments within ahalf-mile of campus. We willhalf-mile of campus. We willassume this population to be normally assume this population to be normally distributed.distributed.
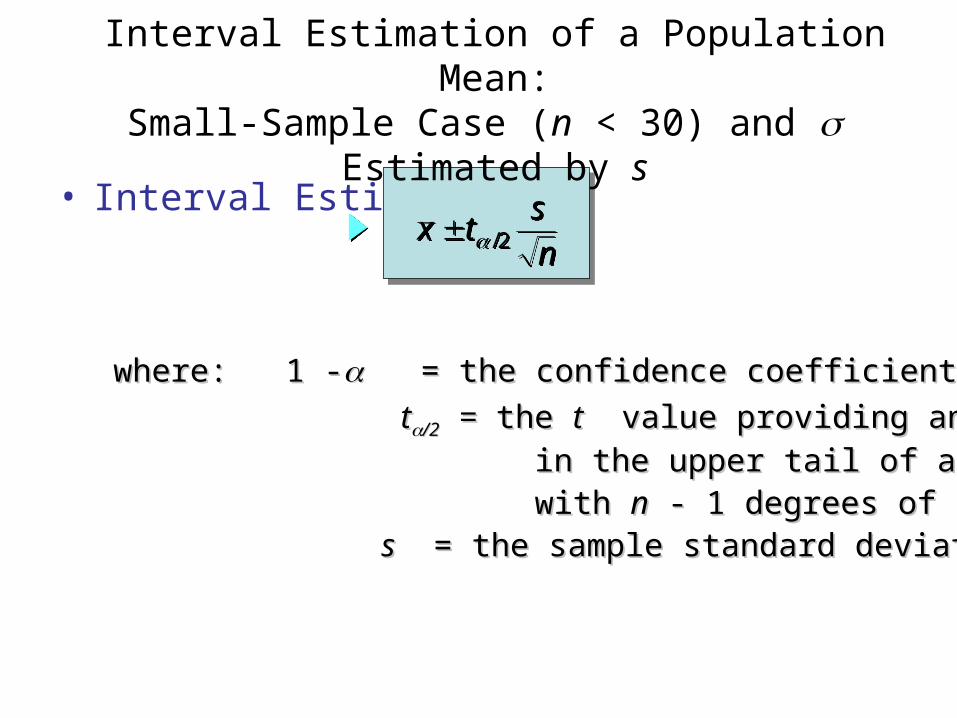
• Interval Estimate
Interval Estimation of a Population Mean:Small-Sample Case (n < 30) and Estimated by s
x tsn
/2x tsn
/2
where: 1 -where: 1 - = the confidence coefficient = the confidence coefficient
tt/2 /2 == the the tt value providing an area of value providing an area of /2/2 in the upper tail of a in the upper tail of a t t distribution distribution with with nn - 1 degrees of freedom - 1 degrees of freedom ss = the sample standard deviation = the sample standard deviation
Example: Apartment RentsExample: Apartment Rents
Interval Estimation of a Population Mean:Interval Estimation of a Population Mean:
Small-Sample Case (Small-Sample Case (nn < 30) with < 30) with Estimated Estimated by by ss
Let us provide a 95% confidence interval Let us provide a 95% confidence interval estimate of the mean rent perestimate of the mean rent permonth for the population of month for the population of studio apartments within astudio apartments within ahalf-mile of campus. We willhalf-mile of campus. We willassume this population to be normally assume this population to be normally distributed.distributed.
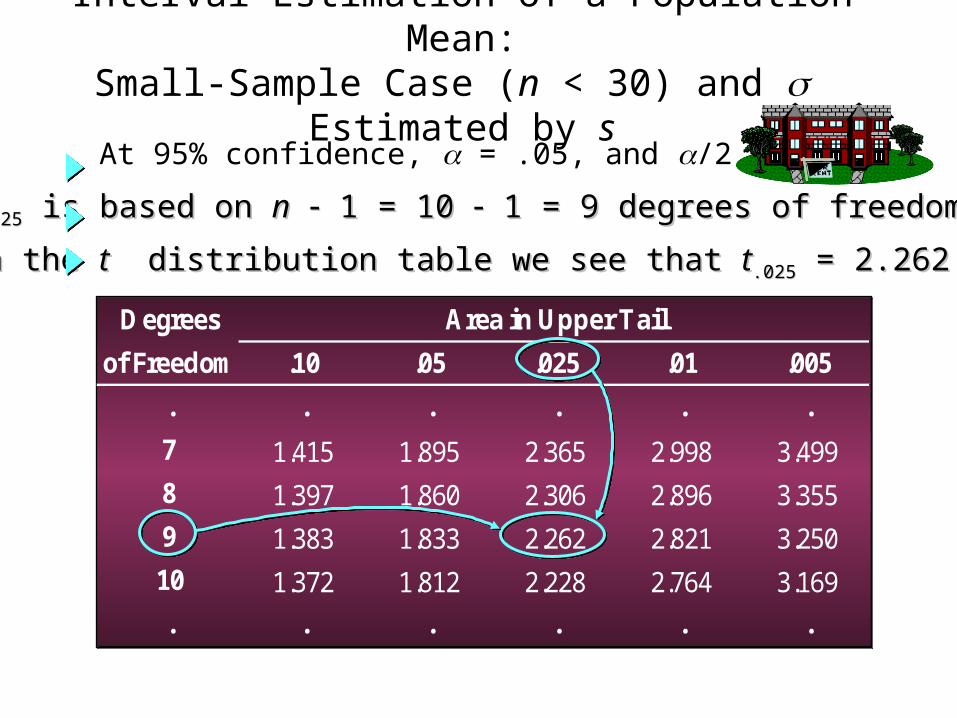
At 95% confidence, = .05, and /2 = .025.
Degrees Area in Upper Tail
of Freedom .10 .05 .025 .01 .005
. . . . . .
7 1.415 1.895 2.365 2.998 3.499
8 1.397 1.860 2.306 2.896 3.355
9 1.383 1.833 2.262 2.821 3.250
10 1.372 1.812 2.228 2.764 3.169
. . . . . .
Degrees Area in Upper Tail
of Freedom .10 .05 .025 .01 .005
. . . . . .
7 1.415 1.895 2.365 2.998 3.499
8 1.397 1.860 2.306 2.896 3.355
9 1.383 1.833 2.262 2.821 3.250
10 1.372 1.812 2.228 2.764 3.169
. . . . . .
Interval Estimation of a Population Mean:Small-Sample Case (n < 30) and Estimated by s
In the In the tt distribution table we see that distribution table we see that tt.025.025 = 2.262. = 2.262.
tt.025.025 is based on is based on nn 1 = 10 1 = 10 1 = 9 degrees of freedom. 1 = 9 degrees of freedom.
x tsn
.025x tsn
.025
Interval Estimation of a Population Mean:Small-Sample Case (n < 30) and Estimated by s
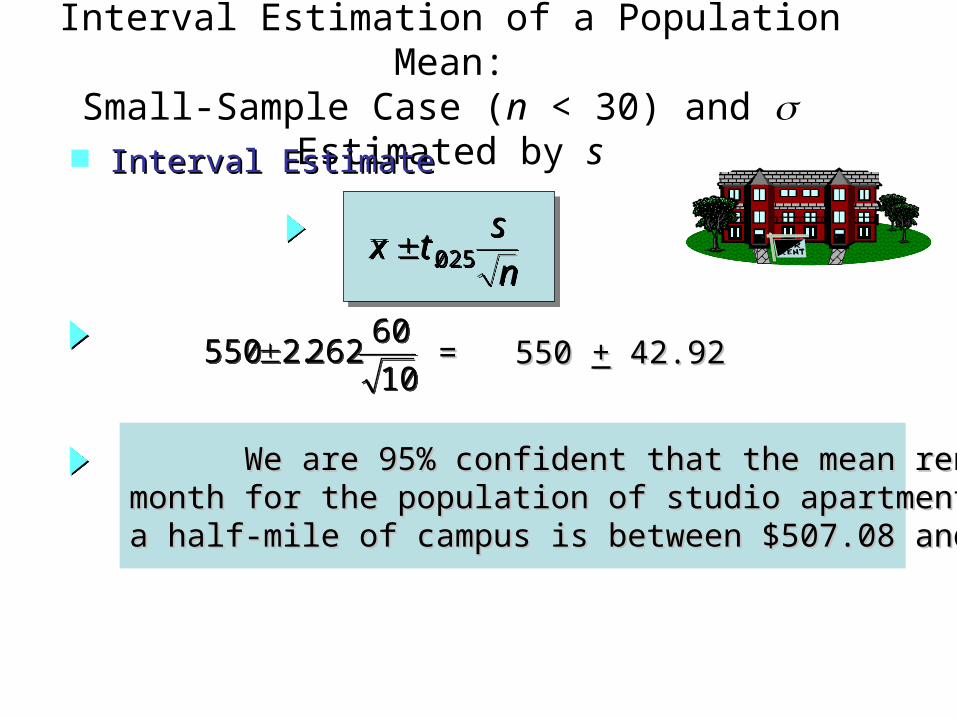
We are 95% confident that the mean rent perWe are 95% confident that the mean rent permonth for the population of studio apartments withinmonth for the population of studio apartments withina half-mile of campus is between $507.08 and $592.92.a half-mile of campus is between $507.08 and $592.92.
Interval EstimateInterval Estimate
10
60262.2550
10
60262.2550 = 550 = 550 ++ 42.92 42.92
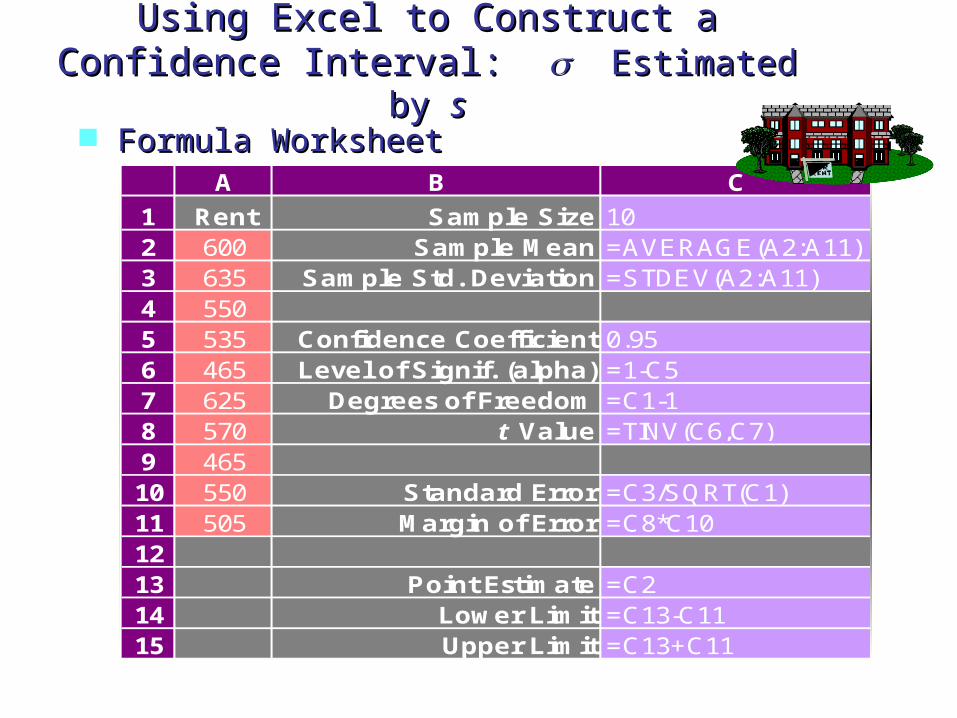
Using Excel to Construct aUsing Excel to Construct aConfidence Interval: Confidence Interval: Estimated by Estimated by ss Formula WorksheetFormula Worksheet
A B C
1 Rent Sample Size 102 600 Sample Mean =AVERAGE(A2:A11)3 635 Sample Std. Deviation =STDEV(A2:A11)4 550 5 535 Confidence Coefficient 0.956 465 Level of Signif. (alpha) =1-C57 625 Degrees of Freedom =C1-18 570 t Value =TINV(C6,C7)9 46510 550 Standard Error =C3/SQRT(C1)11 505 Margin of Error =C8*C1012 13 Point Estimate =C214 Lower Limit =C13-C1115 Upper Limit =C13+C11
Value WorksheetValue Worksheet
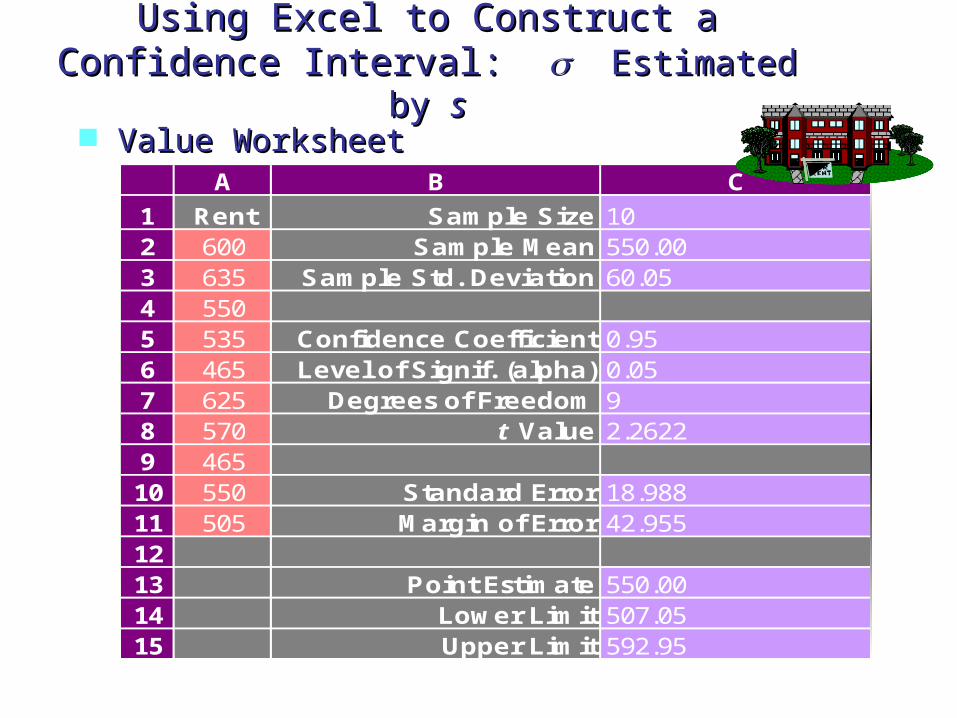
Using Excel to Construct aUsing Excel to Construct aConfidence Interval: Confidence Interval: Estimated by Estimated by ss
A B C
1 Rent Sample Size 102 600 Sample Mean 550.003 635 Sample Std. Deviation 60.054 550 5 535 Confidence Coefficient 0.956 465 Level of Signif. (alpha) 0.057 625 Degrees of Freedom 98 570 t Value 2.26229 46510 550 Standard Error 18.98811 505 Margin of Error 42.95512 13 Point Estimate 550.0014 Lower Limit 507.0515 Upper Limit 592.95
Excel’s Descriptive Statistics tool can also be used to compute the margin of error when the t distribution is used for a confidence interval estimate of a population mean.
Using Excel’sUsing Excel’sDescriptive Statistics ToolDescriptive Statistics Tool
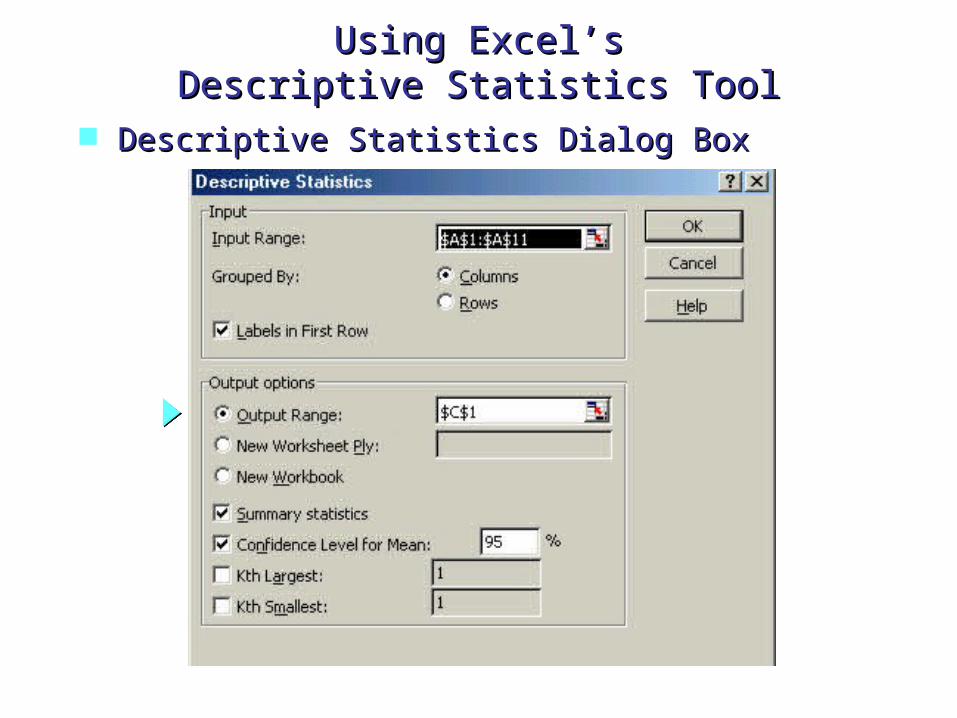
Descriptive Statistics Dialog BoxDescriptive Statistics Dialog Box
Using Excel’sUsing Excel’sDescriptive Statistics ToolDescriptive Statistics Tool
Using Excel’sUsing Excel’sDescriptive Statistics ToolDescriptive Statistics Tool
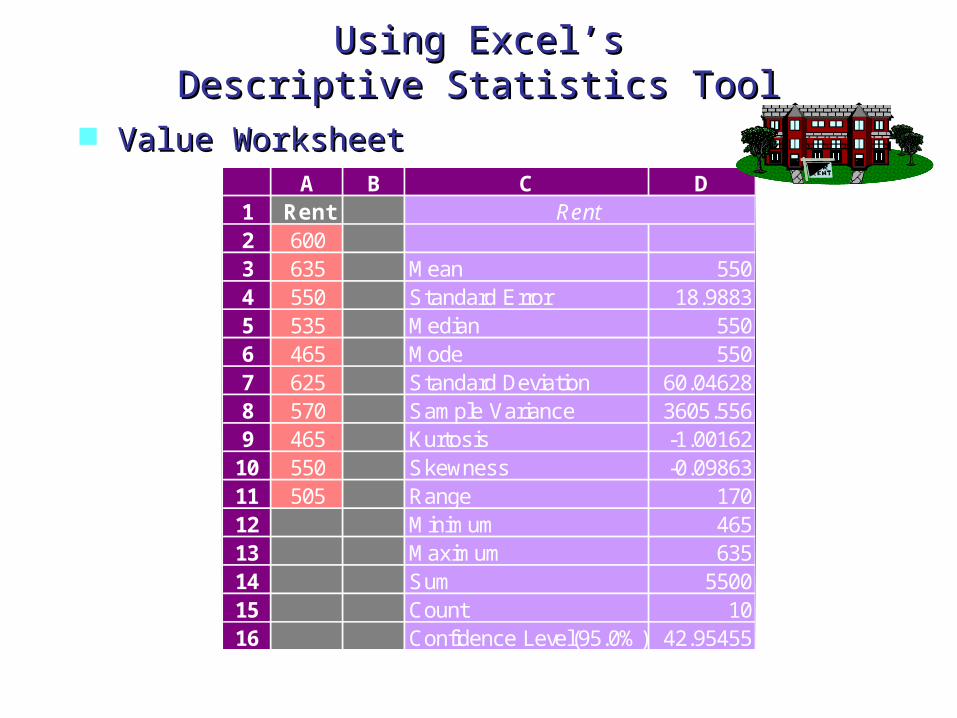
Value WorksheetValue WorksheetA B C D
1 Rent Rent2 6003 635 Mean 5504 550 Standard Error 18.98835 535 Median 5506 465 Mode 5507 625 Standard Deviation 60.046288 570 Sample Variance 3605.5569 465 Kurtosis -1.00162
10 550 Skewness -0.0986311 505 Range 17012 Minimum 46513 Maximum 63514 Sum 550015 Count 1016 Confidence Level(95.0%) 42.95455
Exercise 15, p. 334
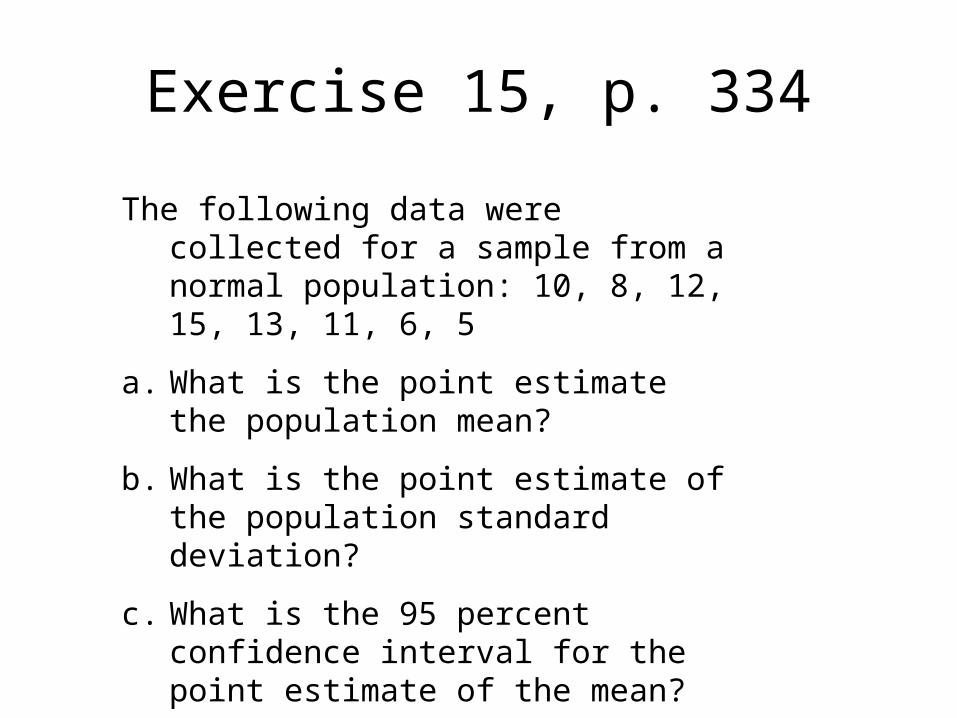
The following data were collected for a sample from a normal population: 10, 8, 12, 15, 13, 11, 6, 5
a. What is the point estimate the population mean?
b. What is the point estimate of the population standard deviation?
c. What is the 95 percent confidence interval for the point estimate of the mean?
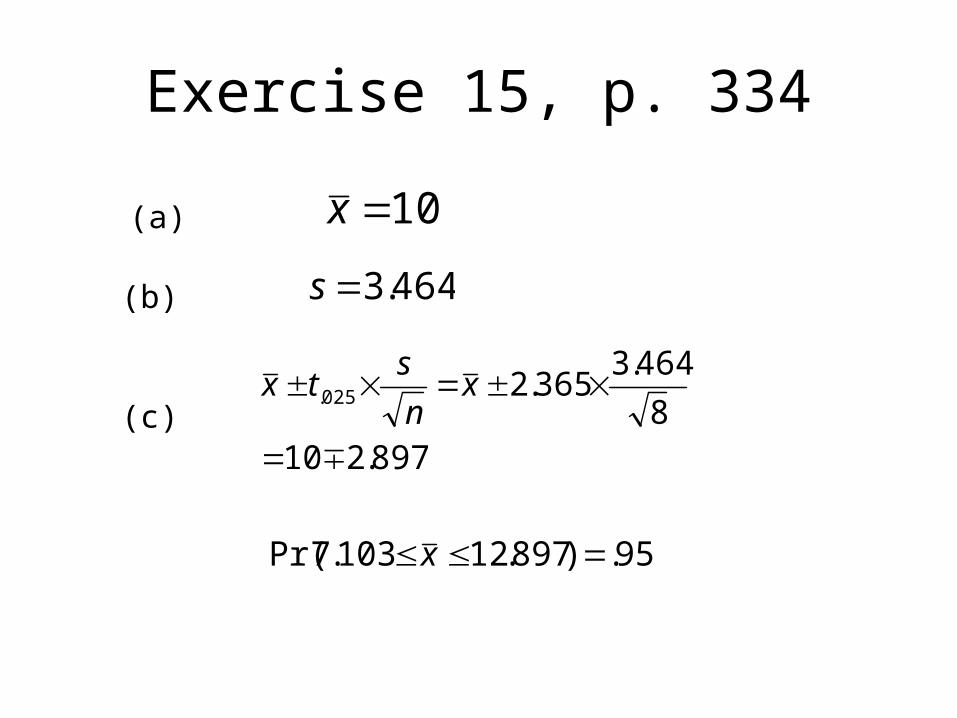
Exercise 15, p. 334
10x
464.3s
897.2108
464.3365.2025.
xn
stx
95.)897.12103.7Pr( x
(a)
(b)
(c)
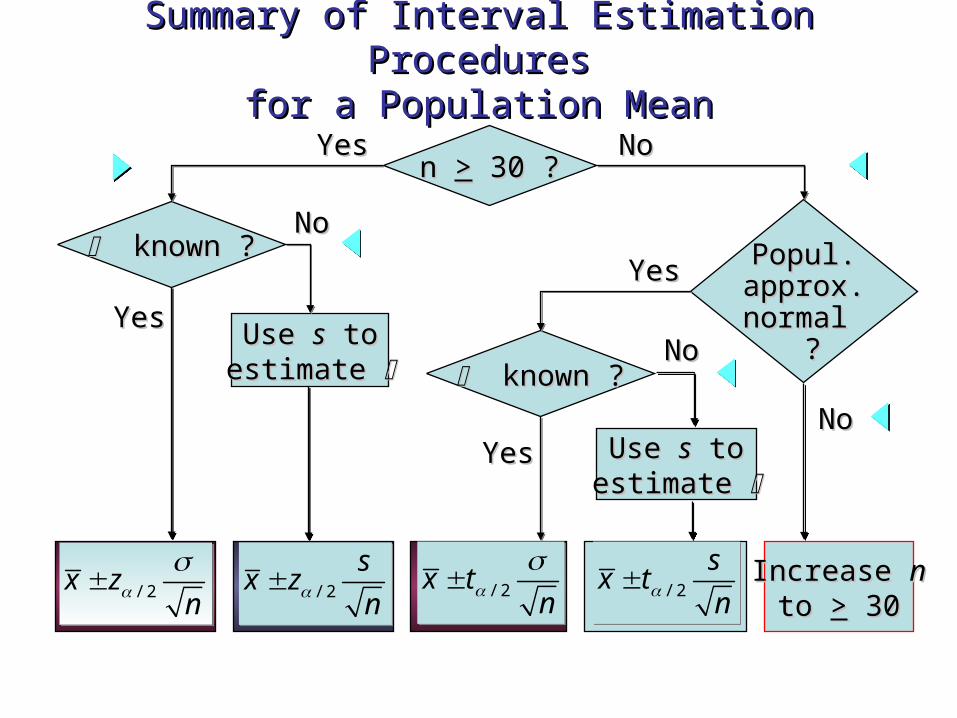
Summary of Interval Estimation Summary of Interval Estimation ProceduresProcedures
for a Population Meanfor a Population Mean
n n >> 30 ? 30 ?
known ?known ?
Popul. Popul. approx.approx.normal normal
?? known ?known ?
Use Use ss to toestimate estimate
Use Use ss to toestimate estimate
Increase Increase nnto to >> 30 30
YesYes
YesYes
YesYes
YesYes
NoNo
NoNo
NoNo
NoNo
/ 2x zn
/ 2x z
n
/ 2
sx z
n / 2
sx z
n / 2
sx t
n / 2
sx t
n/ 2x tn
/ 2x t
n