interstate freight on states’ road david gargett afzal hossain david cosgrove 29 september 2006
TRANSCRIPT

INTERSTATE FREIGHT
ON STATES’ ROADDavid Gargett
Afzal Hossain
David Cosgrove
29 September 2006

Background
• From 1971–1995, the SMVU conducted every 3–5 years, and annually since 1998
• Not specifically designed to measure the change between years due to no overlap
• Moreover, the methodological adjustment in 1998 complicates the use of the data in computing growth rates in road freight

Background (cont.)
The ABS warns: ‘Caution must be used when using the SMVU to measure change’
• Thus BTRE adjusted past SMVU freight data to be comparable to the current SMVU methodology (BTRE Freight Measurement and Modelling in Australia, Report 112)
• In addition, a methodology for estimating road freight (1971–2003) for each State and Territory was proposed earlier, based on adjusted national aggregates from the ABS SMVU

Background (cont.)
But the SMVU definition of IS freight has a flaw:
• The amount of tonne-kilometres done by other States’ trucks on a State’s road (Source: ABS)
i.e.,
• limited to ‘freight carried by trucks registered in other states on a state’s roads’

Background (cont.)
i.e.• Includes intrastate freight carried mostly
within, say NSW, by trucks registered in Victoria.
• Excludes portion of interstate tkm performed by NSW trucks within NSW as they head to, say Victoria
On both counts, estimates of interstate freight for NSW do not measure what road authorities wish measured

Objectives of Current Research
• To estimate IS road freight tasks within States [based on O–D matrices]
• To present a methodology for continually updating the estimates from future SMVUs
• To provide a time-series of the IS road freight task on States’ roads (1971–2004)

Four Past O-D Road Freight Matrices
Published in:
(1) BTE Estimates of Australian Interregional Freight Movements (1971–72)
(2) ABS Interstate Freight Movement Survey (1980–81)
(3) ABS Experimental Estimates of Freight Movements (1994–95)
(4) ABS Freight Movements Survey (2000–01)

BTE 1972 Estimates of Australian Interregional Freight Movements
• IS freight movements undertaken by the various transport modes for 1971–72
• First of their kind ever compiled on an Australia-wide basis
• Road freight estimates were subject to more error than for other modes (i.e. rail, sea & air)
• May overestimate road freight flows, but the data not adjusted

ABS 1981 IS Freight Movement Survey
• ‘Business-based’
• Collected by a census of approx. 16 000 enterprises (20 000 tonnes or more of interstate road freight movements in a year)
• Sub-contract arrangements excluded
• Tonnage data for capital cities and some specific areas by O–D
IFMS best and most reliable ABS surveys – no adjustment for IS component
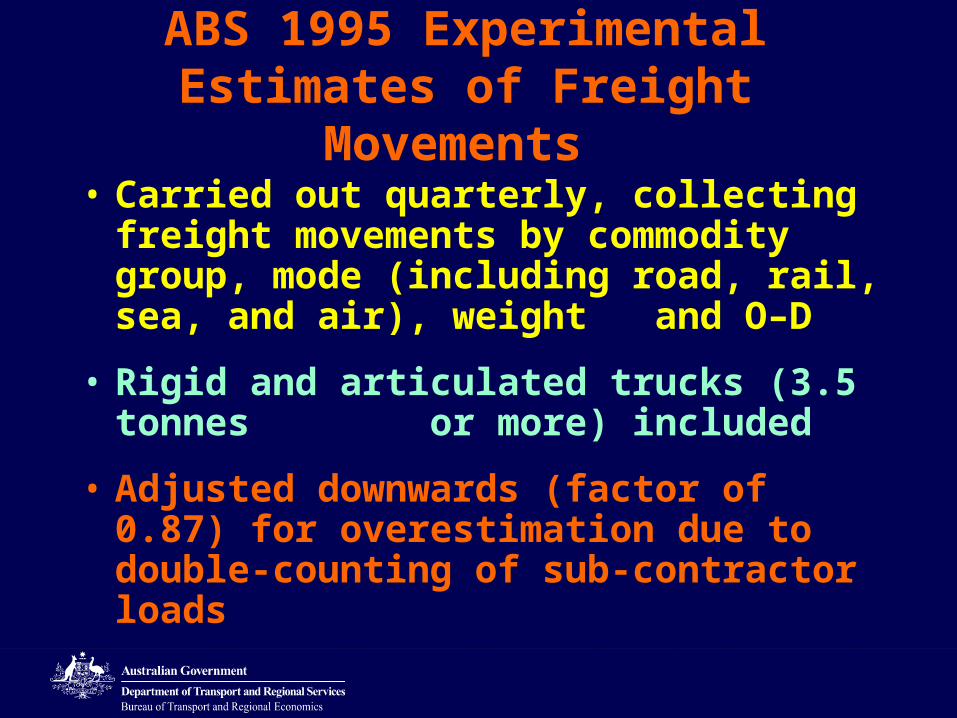
ABS 1995 Experimental Estimates of Freight Movements
• Carried out quarterly, collecting freight movements by commodity group, mode (including road, rail, sea, and air), weight and O–D
• Rigid and articulated trucks (3.5 tonnes or more) included
• Adjusted downwards (factor of 0.87) for overestimation due to double-counting of sub-contractor loads

ABS 2001 Freight Movements Survey
• Road component based on articulated vehicles
• Rigid trucks and other commercial vehicles were excluded
• Adjusted upwards (factor of 1.15) for underestimation due to “missed” trips and no rigids

Estimated IS road freight task (million tkm) (2001)
Origin Destination IS
NSW VIC Qld SA WA TAS NT ACT Total
NSW 7119 5522 2171 501 0 238 518 16068
VIC 6757 2773 2507 480 0 0 65 12581
QLD 5153 2332 588 333 0 662 37 9105
SA 2029 2694 800 1082 0 928 57 7590
WA 579 374 350 1051 0 292 0 2645
TAS 0 0 0 0 0 0 0 0
NT 36 19 240 455 200 0 0 951
ACT 163 30 22 17 0 0 0 233
IS Total 14717 12569 9707 6789 2595 0 2 119 678 49174

Adapting ABS SMVU Data to an O–D Matrix Basis
The protocol for calculating O–D matrices of ABS road freight task for 1998–2004 is:
• Take a three year average of SMVU 2000, 2001 and 2002 (Table 18, SMVU)
• Calculate a cell factor for scaling, equal to the 2001 adjusted FMS cell tkm divided by the average 2000–02 SMVU cell tkm
• Use this scaling factor on that O–D cell in each of the SMVU matrices of 1998 to 2004
• A similar operation gives the 1982 and 1985 matrices by using the 1981 O–D matrix in the scaling factor

Estimated IS road freight task (million tkm) (2004)
Origin Destination IS
NSW VIC Qld SA WA TAS NT ACT Total
NSW 6217 6 697 2387 61 0 0 662 16024
VIC 7707 2 572 2475 217 0 0 18 12989
QLD 6029 4103 2152 90 0 3006 502 15882
SA 1993 2317 525 696 0 479 52 6063
WA 675 72 453 1031 0 272 0 2504
TAS 0 0 0 0 0 0 0 0
NT 77 895 212 213 419 0 0 1816
ACT 165 40 22 3 0 0 0 231
IS Total 16647 13645 10481 8261 1483 0 3757 1 234 55508

Cell-by-Cell O–D Matrix Modelling
• Done by interpolating individual O–D road freight task data using a series on tonnages through Marulan (the number of trucks passing through Marulan, multiplied by a load per truck series)
• Example – actual and predicted road freight tasks (million tkm) between 1972 and 2005 for QLD–NSW.

Actual and predicted road freight task, 1970–2005, Qld–NSW
0
2 000
4 000
6 000
8 000
tkm
(m
illi
on
)
ActualPredicted

Data Analysis
• For the regressions ‘Log’ transformation was used
• In many cases, a time trend was included, depending on data set
• Some of the years’ data for some routes were omitted - large variability

Coefficients of regression (selected routes)
Route Coefficients
Intercept Log Marulan Time
NSW-VIC -0.6239 0.9795
VIC-NSW 2.8809 0.5421 0.0224
NSW-QLD -2.2154 1.1237
QLD-NSW -2.2446 1.1122
VIC-QLD -13.657 2.6276 -0.1227
QLD-VIC -7.1805 1.5987 -0.0105

Example of the results of regression interpolation for O–D pairs (million tkm)
ES-WANSW VIC QLD SA Total
1970 420 375 33 99 16 16 1651975 794 704 52 156 26 26 2601980 1250 1103 179 538 90 90 8961985 1697 1493 230 569 115 201 11151990 2582 2262 313 566 157 470 15061995 3323 2904 378 433 189 803 18032000 5196 4519 523 392 261 1307 24832005 6897 5982 640 480 320 1600 3040
NSW-QLD
QLD-NSW

Splitting O–D Flows by State
• To split the tkm for an O–D pair by the state in which it is performed, we use a “fractions by state” table
• This roughly allocates the total tkm for a specific O–D by the states in which it is performed

Splitting O–D Flows (Contd.)
For example, for the SA to QLD, the task should be split by the fractions
• 0.10 from the origin in SA to the VIC border
• 0.05 through the north-west corner of VIC
• 0.58 through NSW to the QLD border
• 0.27 within QLD

Fractions by States from Origin to Destination
SA to Task split by States (fractions)
NSW VIC QLD SA WA TAS NT ACT Total
NSW 0.70 0.10 0.20 1.00
VIC 0.60 0.40 1.00
QLD 0.58 0.05 0.27 0.10 1.00
WA 0.51 0.49 1.00
TAS 0.00
NT 0.46 0.54 1.00
ACT 0.00

Next Step
The fractions are then multiplied by the O–D cell’s total freight task
• SA = 0.10 * 840 = 84
• VIC = 0.05 * 840 = 42
• NSW = 0.58 * 840 = 487, and
• QLD = 0.27 * 840 = 227
Thus total gives 840.

Road freight task for 2005 by States, calculated using fractions
SA to Task split by States (million tkm)
NSW VIC QLD SA WA TAS NT ACT Total
NSW 1641 234 469 2345
VIC 2041 1361 3402
QLD 487 42 227 84 840
WA 816 784 1600
TAS
NT 237 278 516
ACT

Next Step (contd.)
Then the O–D task components are characterised as either ‘from’, ‘through’, or ‘to’. Thus in our example,
• SA ’from’ = 84
• VIC ‘through’ = 42
• NSW ‘through’ = 487, and
• QLD ’to’ = 227.

Final O-D based IS Freight Flow Estimates
• Summing the O–D component tasks gives an estimate of the amount of different types (‘from’, ‘through’ and ‘to’) of interstate freight being carried on each state’s roads
• The last column gives the new O–D based estimate of total IS freight on each State’s roads

Final estimates of IS freight (million tkm) on States’ roads (5-yr interval)
NSW VIC
From To Thru Total From To Thru Total
1970 917 956 467 2339 687 456 59 1202
1975 1633 1598 956 4187 1091 836 100 2027
1980 2494 2350 1491 6335 1596 1292 152 3041
1985 3298 3100 1792 8190 2045 1734 196 3975
1990 4836 4452 2665 11953 2840 2606 276 5722
1995 6091 5628 2999 14719 3540 3320 337 7198
2000 9176 8279 4778 22234 5059 5168 487 10714
2005 11904 10759 5854 28517 6568 6857 616 14041

Comparison of current and previous estimates
• Current estimates compare quite well to estimates of total interstate freight published in BTRE Report 112
• This previous estimate was based on total Australia interstate freight on the ABS definition, times 1.4 to account for the portion of interstate trips done within a state by that state’s trucks
• Individual State estimates calculated in this paper are now different, being based on a true ‘state of task performance’ basis, rather than a ‘state of registration by main area of operation outside of the state’ basis
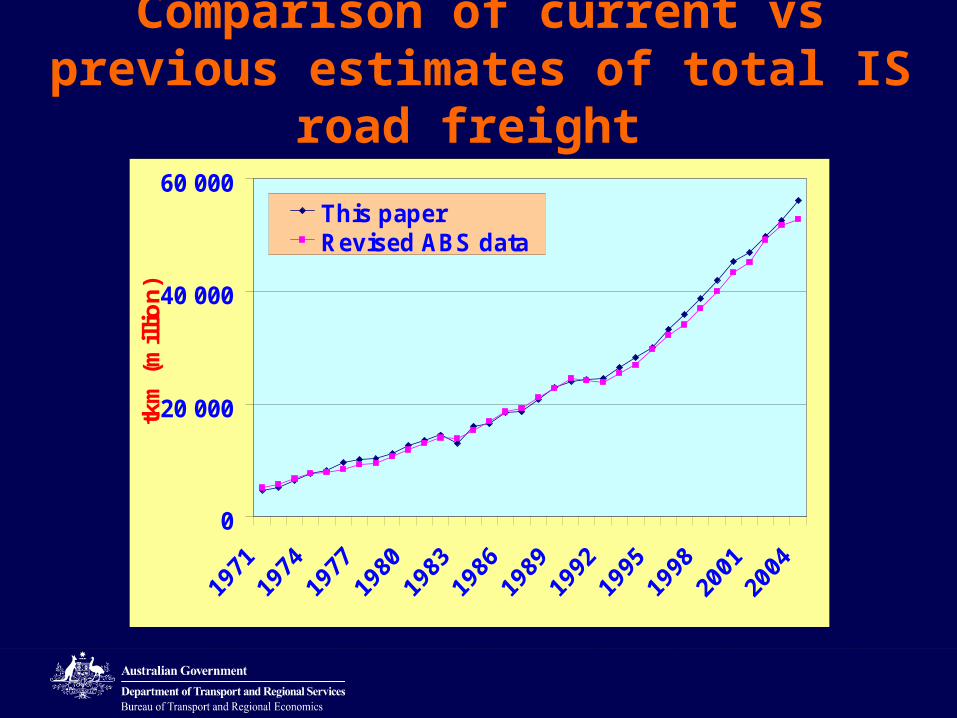
Comparison of current vs previous estimates of total IS road freight
0
20 000
40 000
60 000tk
m (
mill
ion
)
This paperRevised ABS data

Comparison of current and previous estimates (contd.)
• This, then, was the solution we sought to the problem posed at the beginning of the paper
• The new data for each state tells state authorities the growth rates of interstate freight flowing across their roads
• In addition, it allows them to understand the growth rates of particular O–D combinations
• This allows a focus on growth along the probable routes the trucks will be taking

Summary
• O–D matrices derived from 1971 to 2004
• Allow for logical control over the definition of interstate freight
• Analysis method generates levels of total IS freight similar to previous BTRE estimates, but the state split differs

Summary (contd.)
• First estimates of the concept ‘the interstate freight task performed on each state’s roads’
• Also, rough annual updates of the O–D matrix can be derived from each new SMVU
• Time series estimates can also be used for forecasts of the volume of interstate freight on states’ roads.

Thank you
Any question ?