interpreting the cbc - amazon...
TRANSCRIPT
Interpreting the CBC
Robert Miller PAAssistant Professor of Clinical Pediatrics and
Family Medicine
USC Keck School of Medicine
Retired
The CBC
3 Cell Lines
• Assess general health
• Make a diagnosis
• Monitor a diagnosis
• Monitor treatment
RBCs
WBCs
Platelets
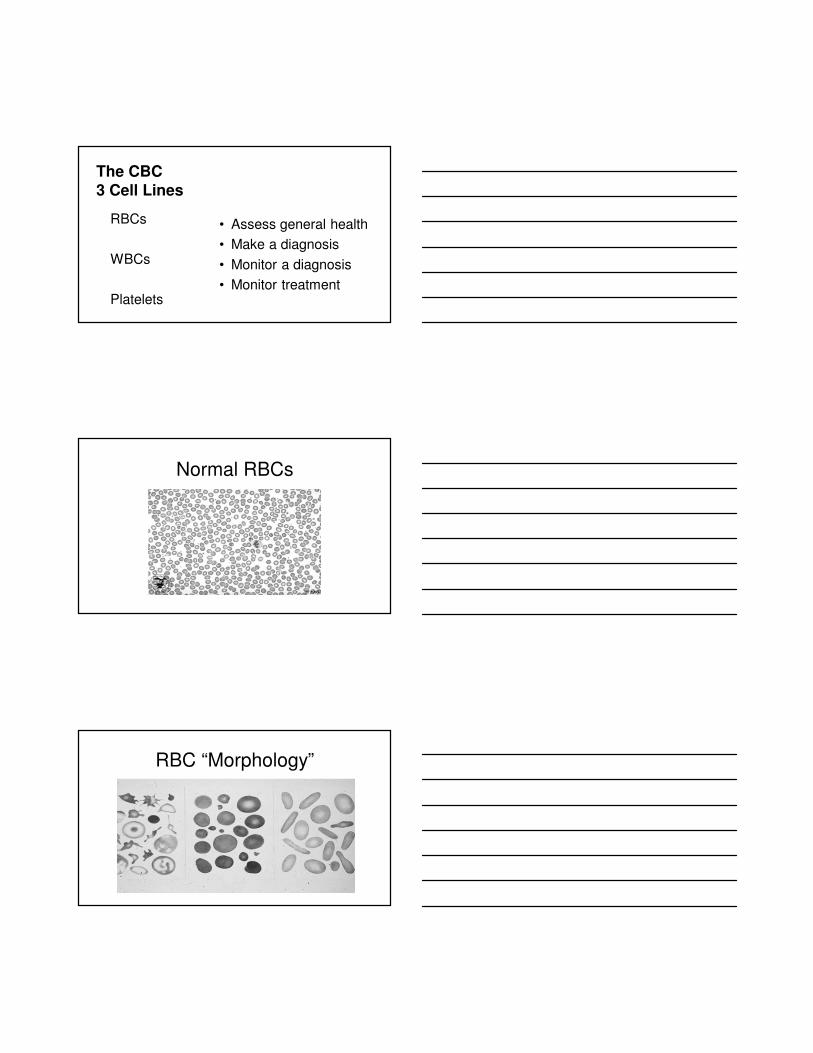
Normal RBCs
RBC “Morphology”
Red Cell Line (Adult values, Medscape)
• RBC 4.7-6.1 M cells/mcl (M), 4.2-5.4 (F)
• Hgb 13-17 g/dL (M), 12-15 (F)
• Hct 40%-52% (M), 36%-47% (F)
• MCV 80-100 fL
• MCH 27-31 pg/ml
• MCHC 30-35 g/dL
• Reticulocyte 0.5-1.5%
• RDW 11.5-14.5%
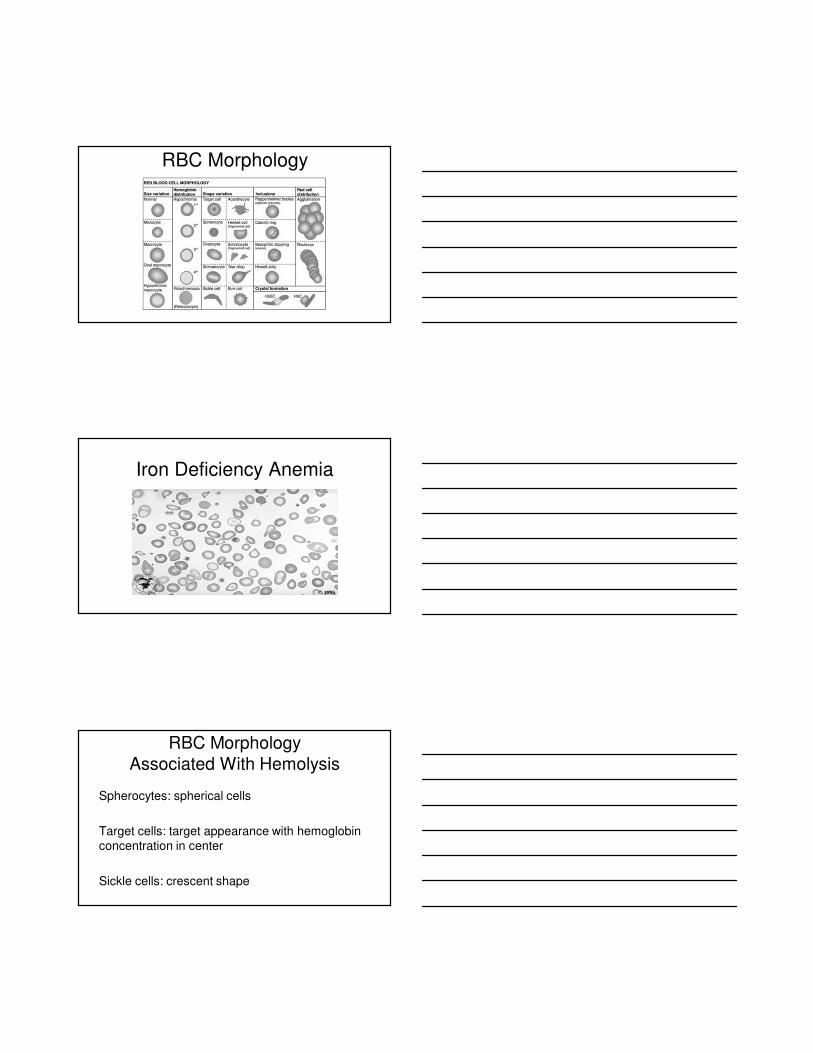
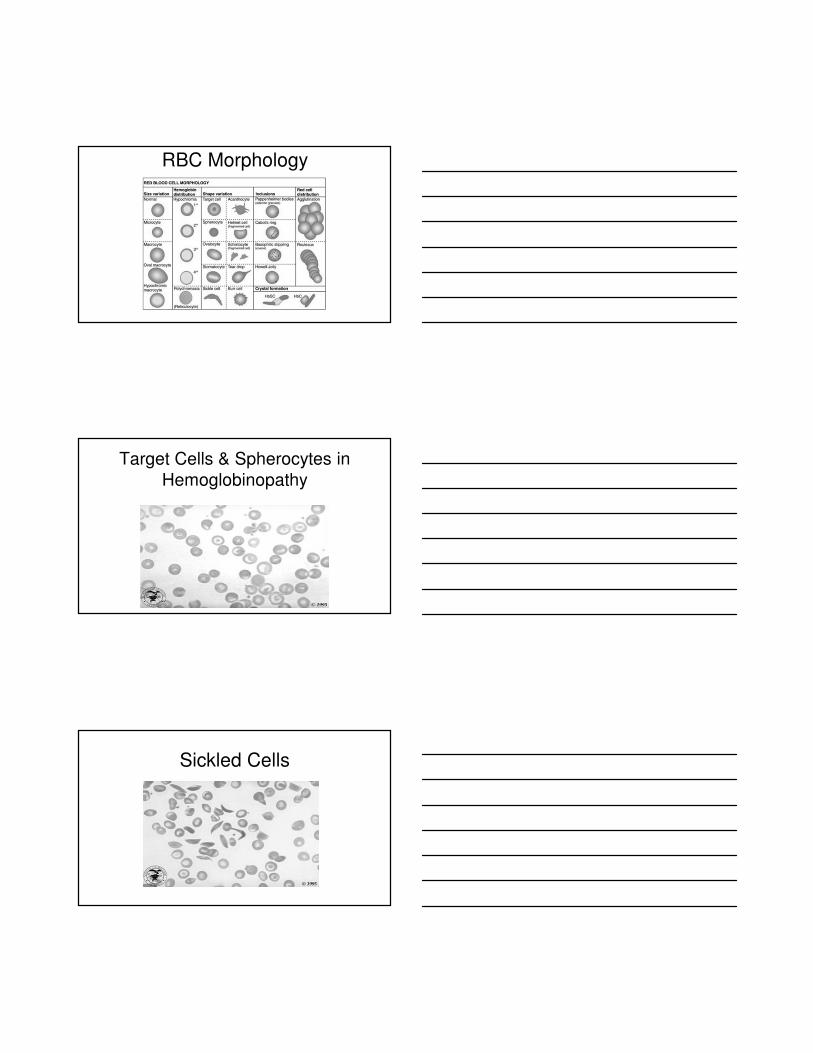
RBC Morphology
AnisocytosisPoikliocytosis
Microcytosis
Macrocytosis
Hypochromasia
Polychromasia
Spherocytosis
Target cells
Schistocytes
Fragmented cells
Sickle cells
RBC Morphology
• Anisocytosis: excess variation in size
(High RDW, iron def., many others)
• Poikilocytosis: excess variation in shape
(Hemolytic disorders, nutritional def., others)

RBC Morphology
• Microcytosis: small cells (MCV < 80)
(Iron def., hemoglobinopathy, chronic disease)
• Macrocytosis: large cells (MCV > 100)
(Megaloblastic, alcohol, liver dis., retics)
RBC Morphology
RBC Morphology
• Hypochromasia: pale cells
(Iron def., anemia of chronic dis., others)
• Polychromasia: blue tinge to cytoplasm –indicating a young cell (young reticulocyte)
RBC Morphology
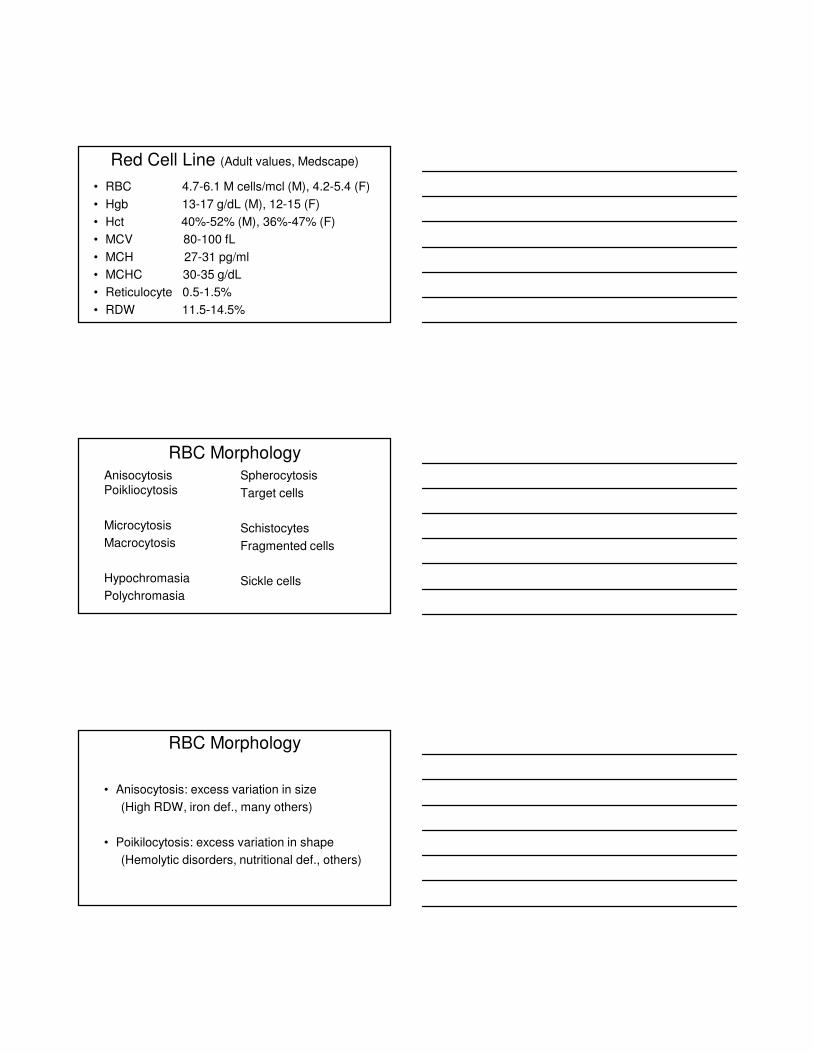
Iron Deficiency Anemia
RBC Morphology
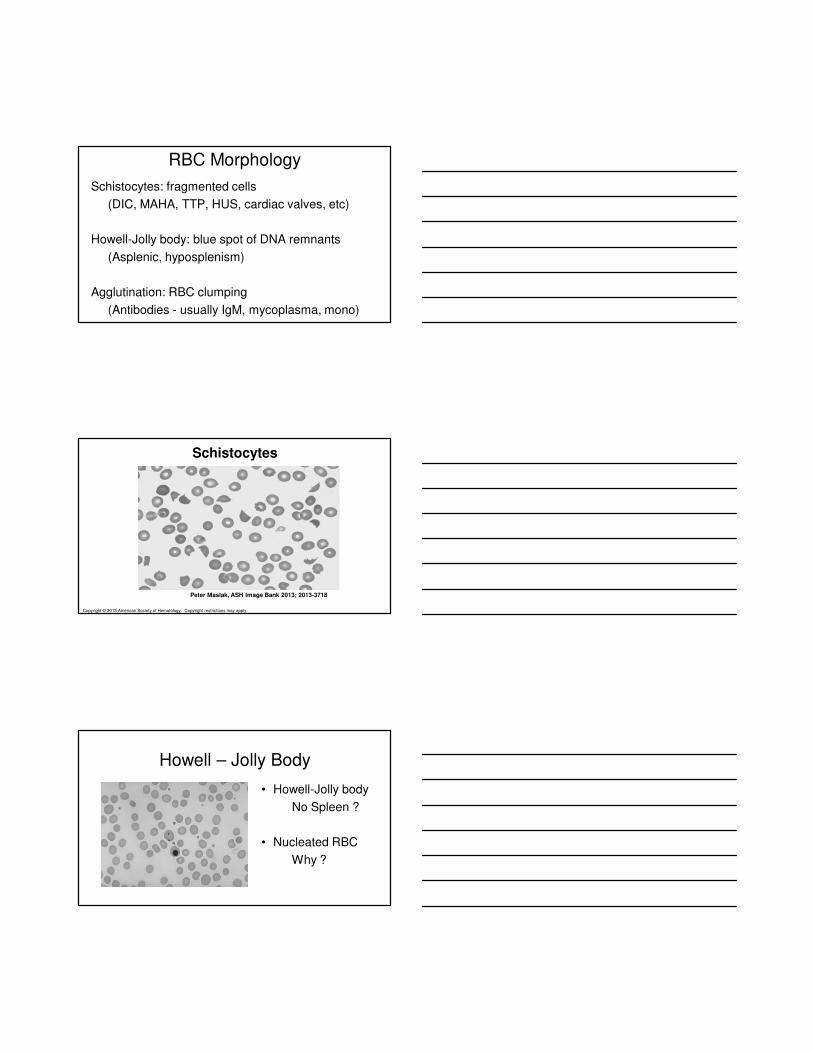
Associated With Hemolysis
Spherocytes: spherical cells
Target cells: target appearance with hemoglobin concentration in center
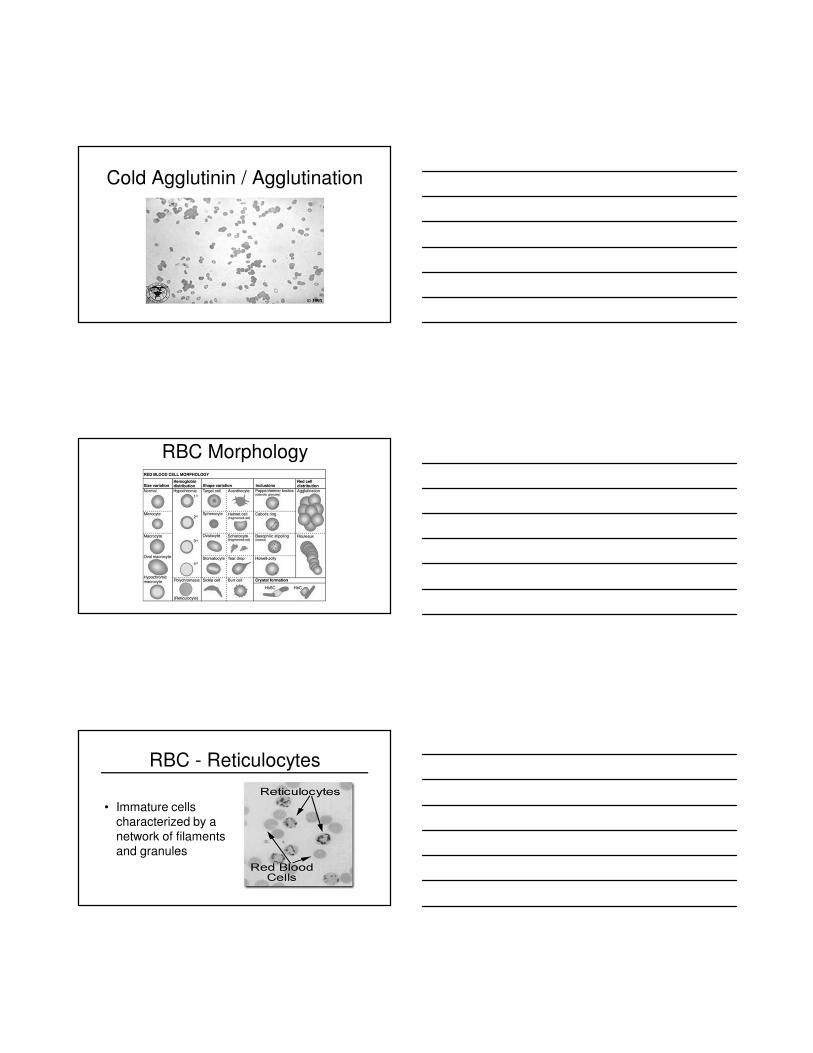
Sickle cells: crescent shape
RBC Morphology
Target Cells & Spherocytes in
Hemoglobinopathy
Sickled Cells
RBC Morphology
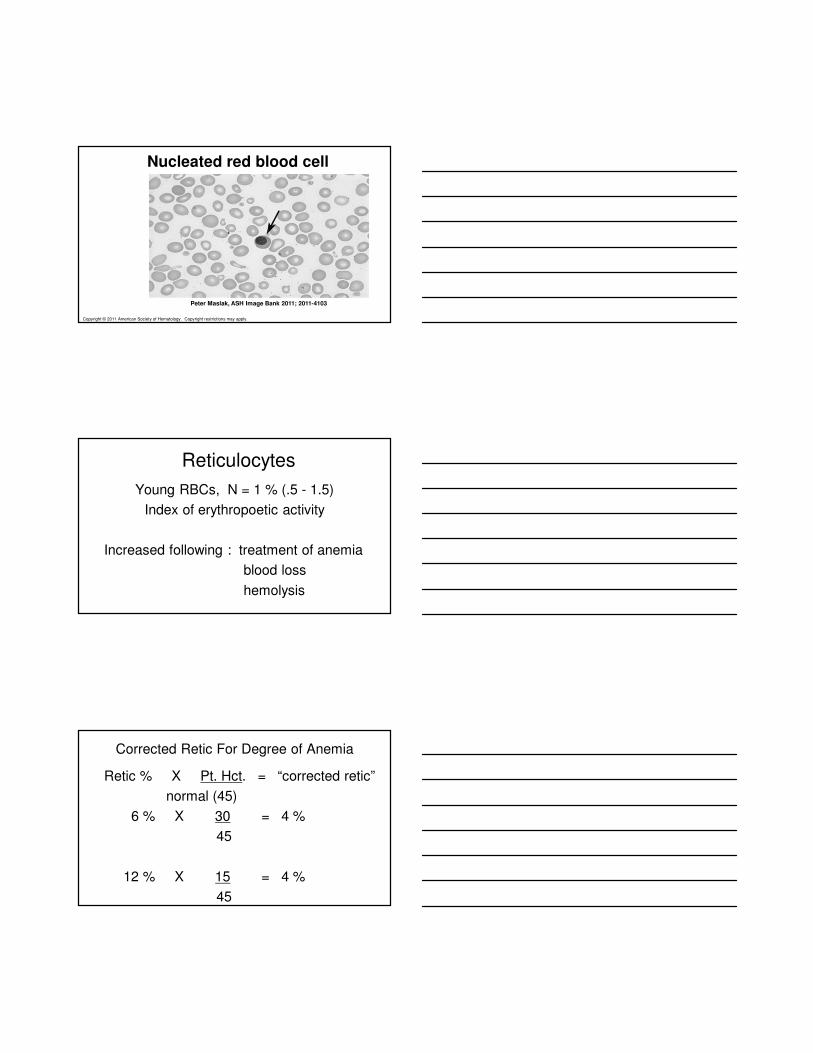
Schistocytes: fragmented cells
(DIC, MAHA, TTP, HUS, cardiac valves, etc)
Howell-Jolly body: blue spot of DNA remnants
(Asplenic, hyposplenism)
Agglutination: RBC clumping
(Antibodies - usually IgM, mycoplasma, mono)
Copyright © 2013 American Society of Hematology. Copyright restrictions may apply.
Peter Maslak, ASH Image Bank 2013; 2013-3718
Schistocytes
Howell – Jolly Body
• Howell-Jolly body
No Spleen ?
• Nucleated RBC
Why ?
Cold Agglutinin / Agglutination
RBC Morphology
RBC - Reticulocytes
• Immature cells characterized by a network of filaments and granules
Copyright © 2011 American Society of Hematology. Copyright restrictions may apply.
Peter Maslak, ASH Image Bank 2011; 2011-4103
Nucleated red blood cell
Reticulocytes
Young RBCs, N = 1 % (.5 - 1.5)
Index of erythropoetic activity
Increased following : treatment of anemia
blood loss
hemolysis
Retic % X Pt. Hct. = “corrected retic”
normal (45)
6 % X 30 = 4 %
45
12 % X 15 = 4 %
45
Corrected Retic For Degree of Anemia
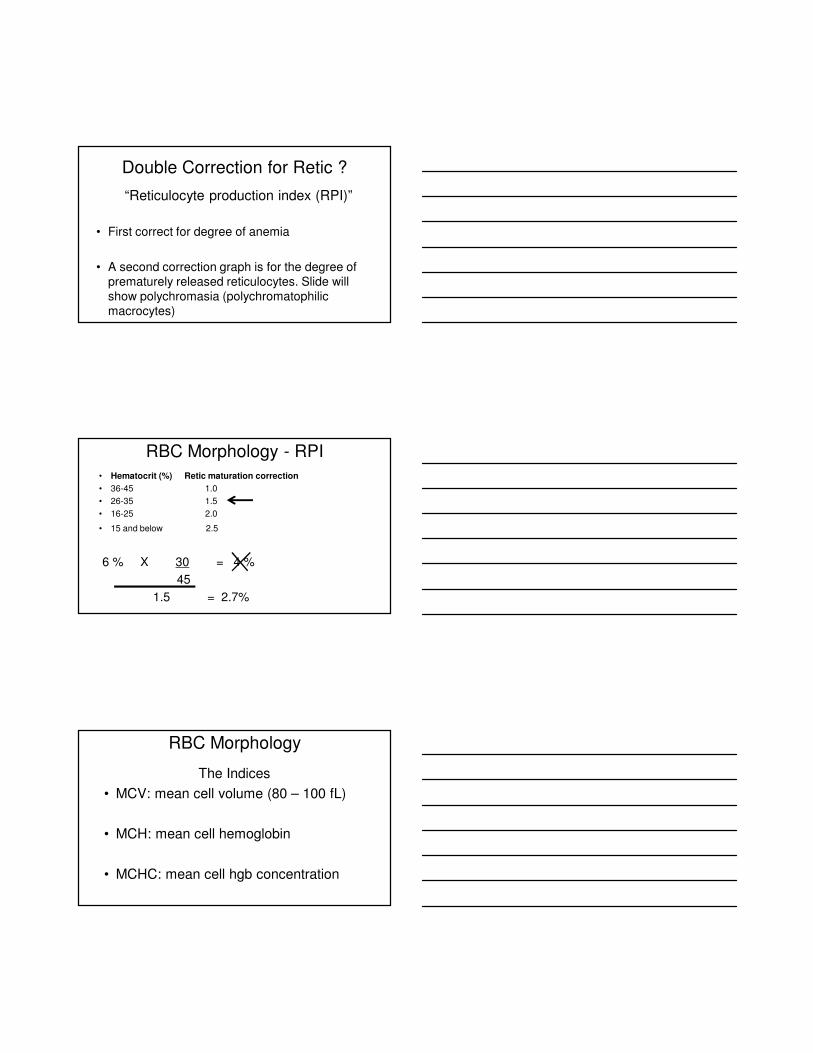
Double Correction for Retic ?
“Reticulocyte production index (RPI)”
• First correct for degree of anemia
• A second correction graph is for the degree of prematurely released reticulocytes. Slide will show polychromasia (polychromatophilicmacrocytes)
RBC Morphology - RPI
• Hematocrit (%) Retic maturation correction
• 36-45 1.0
• 26-35 1.5
• 16-25 2.0
• 15 and below 2.5
6 % X 30 = 4 %
45
1.5 = 2.7%
RBC Morphology
The Indices
• MCV: mean cell volume (80 – 100 fL)
• MCH: mean cell hemoglobin
• MCHC: mean cell hgb concentration
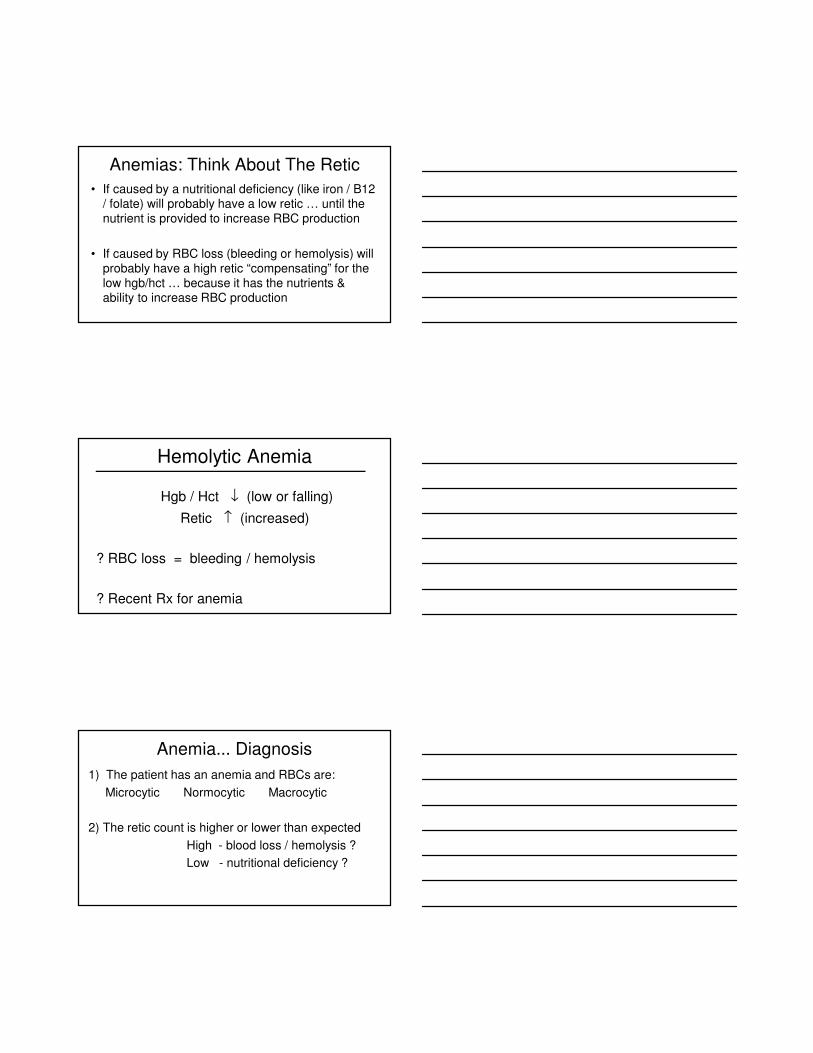
Anemias: Think About The Retic
• If caused by a nutritional deficiency (like iron / B12 / folate) will probably have a low retic … until the nutrient is provided to increase RBC production
• If caused by RBC loss (bleeding or hemolysis) will probably have a high retic “compensating” for the low hgb/hct … because it has the nutrients & ability to increase RBC production
Hemolytic Anemia
Hgb / Hct ↓ (low or falling)
Retic ↑ (increased)
? RBC loss = bleeding / hemolysis
? Recent Rx for anemia
Anemia... Diagnosis
1) The patient has an anemia and RBCs are:
Microcytic Normocytic Macrocytic
2) The retic count is higher or lower than expected
High - blood loss / hemolysis ?
Low - nutritional deficiency ?
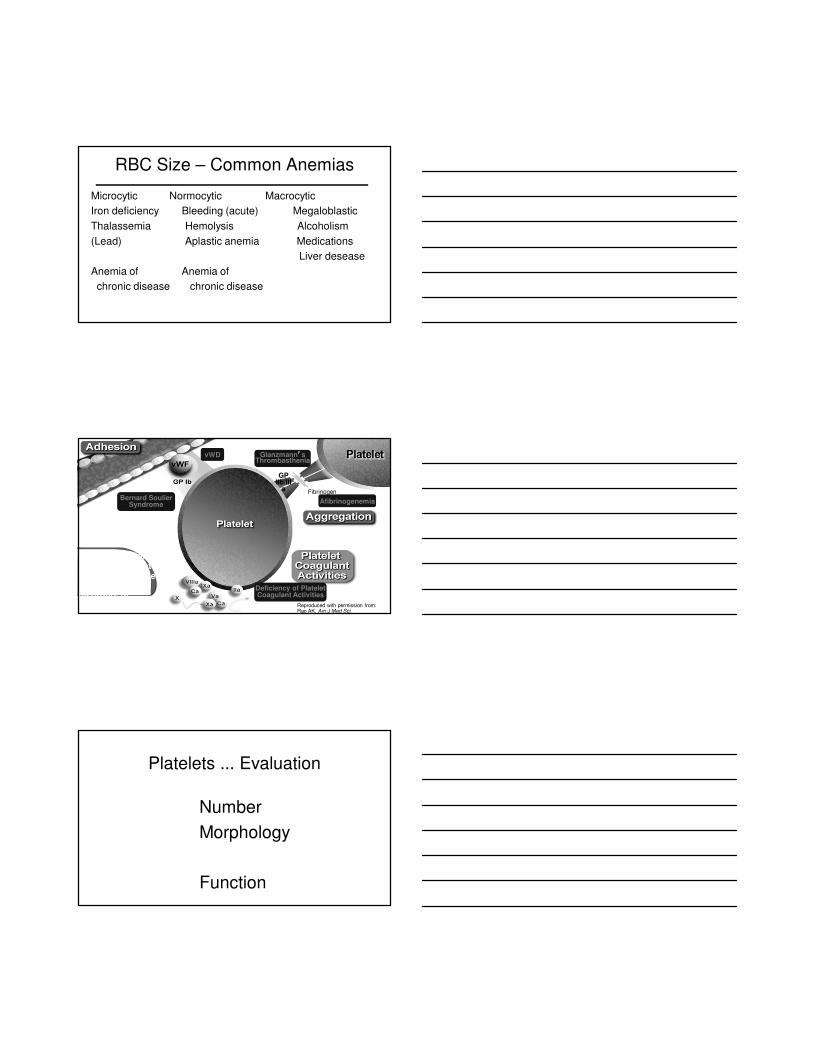
RBC Size – Common Anemias
Microcytic Normocytic Macrocytic
Iron deficiency Bleeding (acute) Megaloblastic
Thalassemia Hemolysis Alcoholism
(Lead) Aplastic anemia Medications
Liver desease
Anemia of Anemia of
chronic disease chronic disease
Reproduced with permission from: Rao AK. Am J Med Sci.
1998;316:69–76.
A representation of normal platelet responses and the congenital disorders of platelet function
Bernard Soulier Syndrome
vWD Glanzmann’’’’s Thrombasthenia
Deficiency of Platelet Coagulant Activities
Fibrinogen
GP IIb/III
a
Afibrinogenemia
Platelets ... Evaluation
Number
Morphology
Function
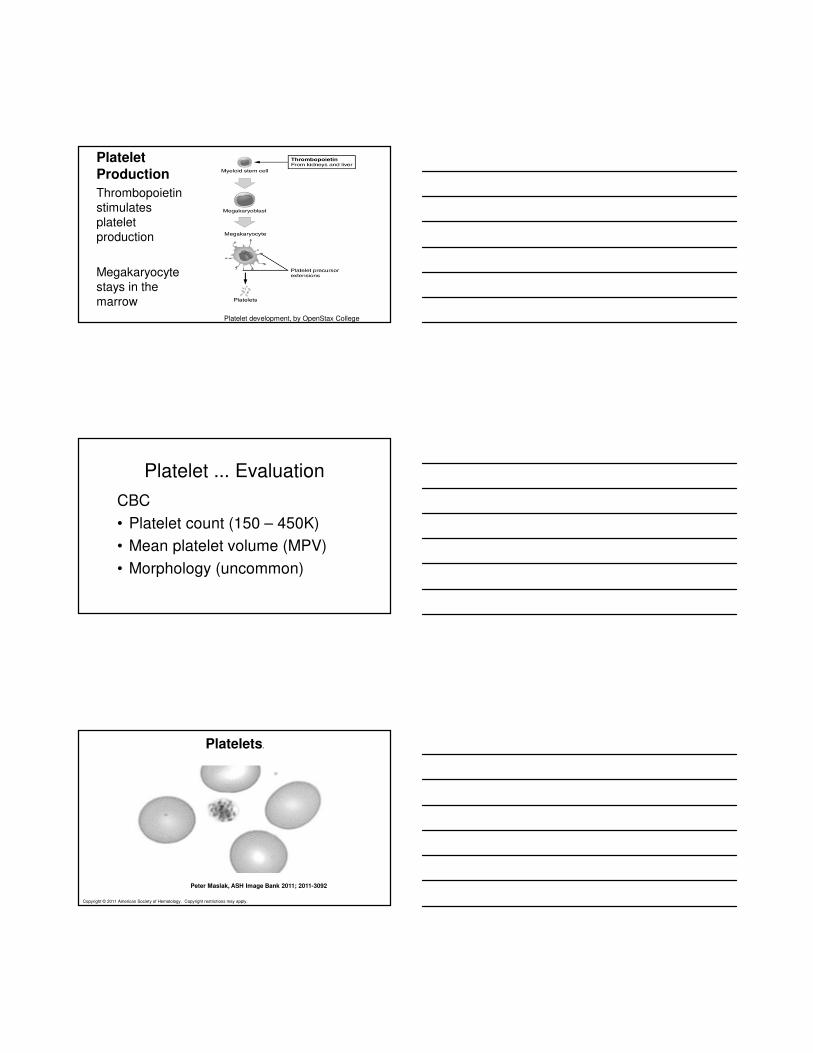
Platelet
Production
Thrombopoietinstimulates platelet production
Megakaryocyte stays in the marrow
Platelet development, by OpenStax College
Platelet ... Evaluation
CBC
• Platelet count (150 – 450K)
• Mean platelet volume (MPV)
• Morphology (uncommon)
Copyright © 2011 American Society of Hematology. Copyright restrictions may apply.
Peter Maslak, ASH Image Bank 2011; 2011-3092
Platelets.
Platelet Morphology
• Mean platelet volume (MPV)
(normal MPV 7.5 – 11.5 fL
• Large platelets
• Giant platelets
• Defective granulation
(grey platelet syndrome0
Copyright © 2011 American Society of Hematology. Copyright restrictions may apply.
Peter Maslak, ASH Image Bank 2011; 2011-4198
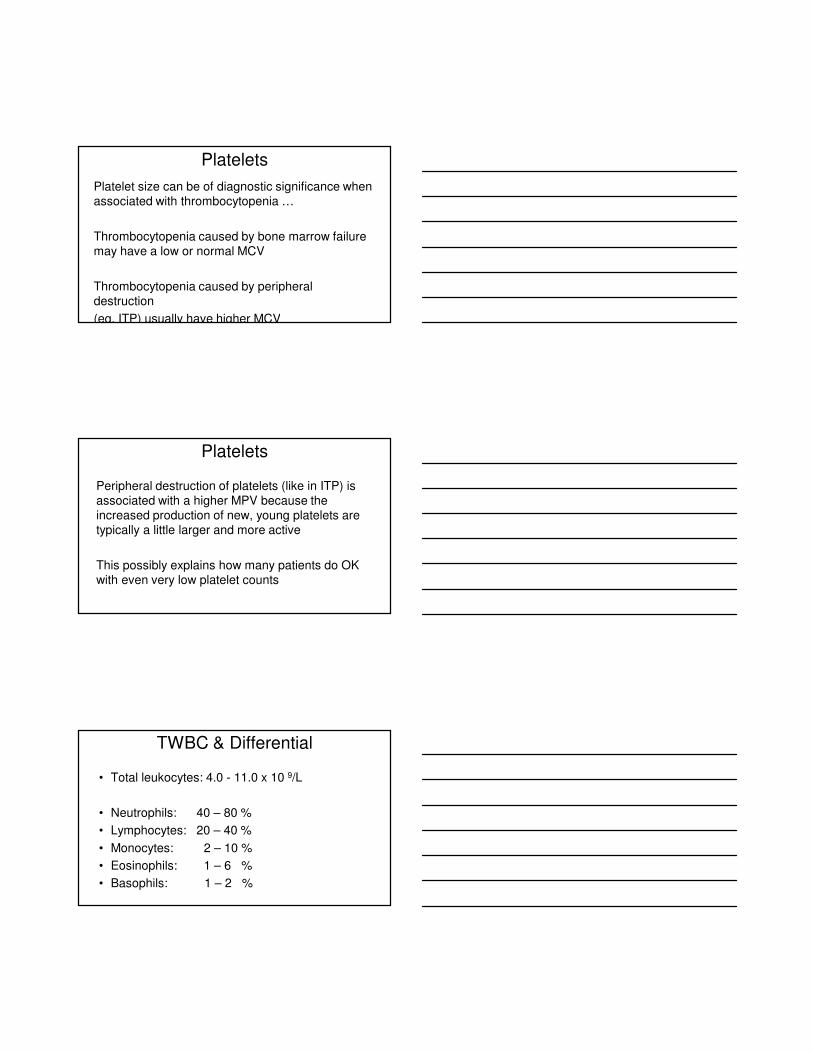
Giant platelet.
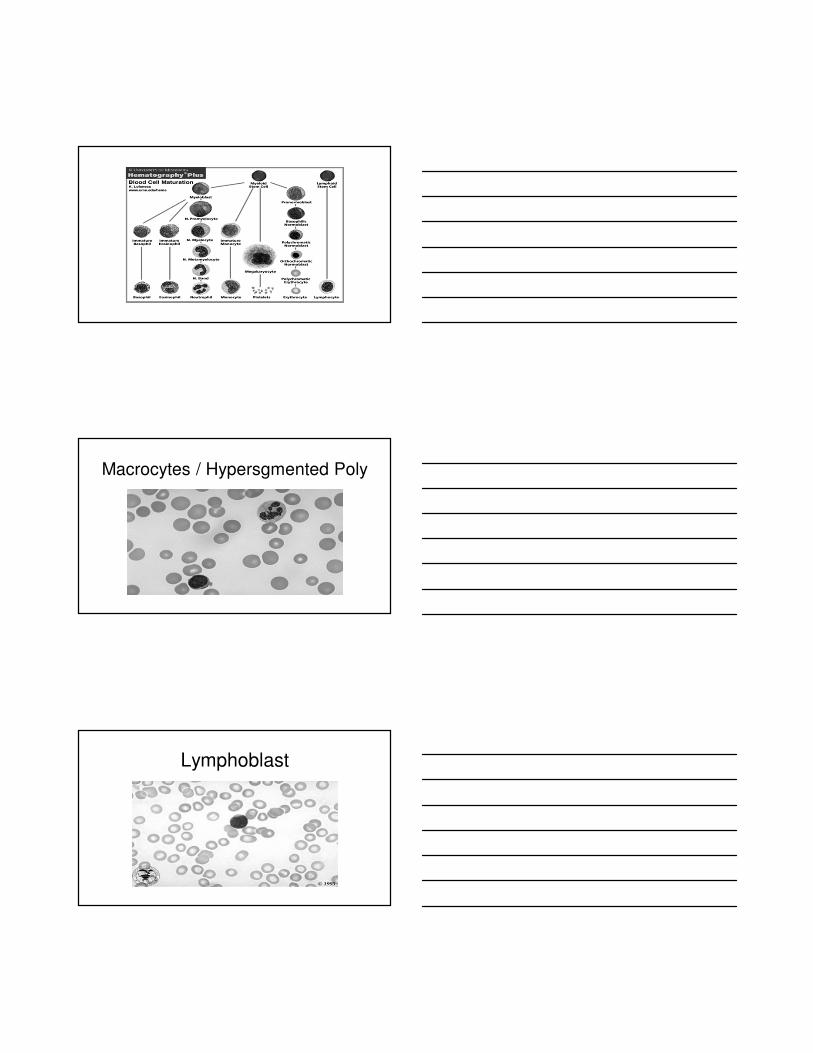
RBC, Platelet, Leukocyte
Electron micrograph facility, NCI at Fredrick
Platelets
Platelet size can be of diagnostic significance when associated with thrombocytopenia …
Thrombocytopenia caused by bone marrow failure may have a low or normal MCV
Thrombocytopenia caused by peripheral destruction
(eg. ITP) usually have higher MCV
Platelets
Peripheral destruction of platelets (like in ITP) is associated with a higher MPV because the increased production of new, young platelets are typically a little larger and more active
This possibly explains how many patients do OK with even very low platelet counts
TWBC & Differential
• Total leukocytes: 4.0 - 11.0 x 10 9/L
• Neutrophils: 40 – 80 %
• Lymphocytes: 20 – 40 %
• Monocytes: 2 – 10 %
• Eosinophils: 1 – 6 %
• Basophils: 1 – 2 %
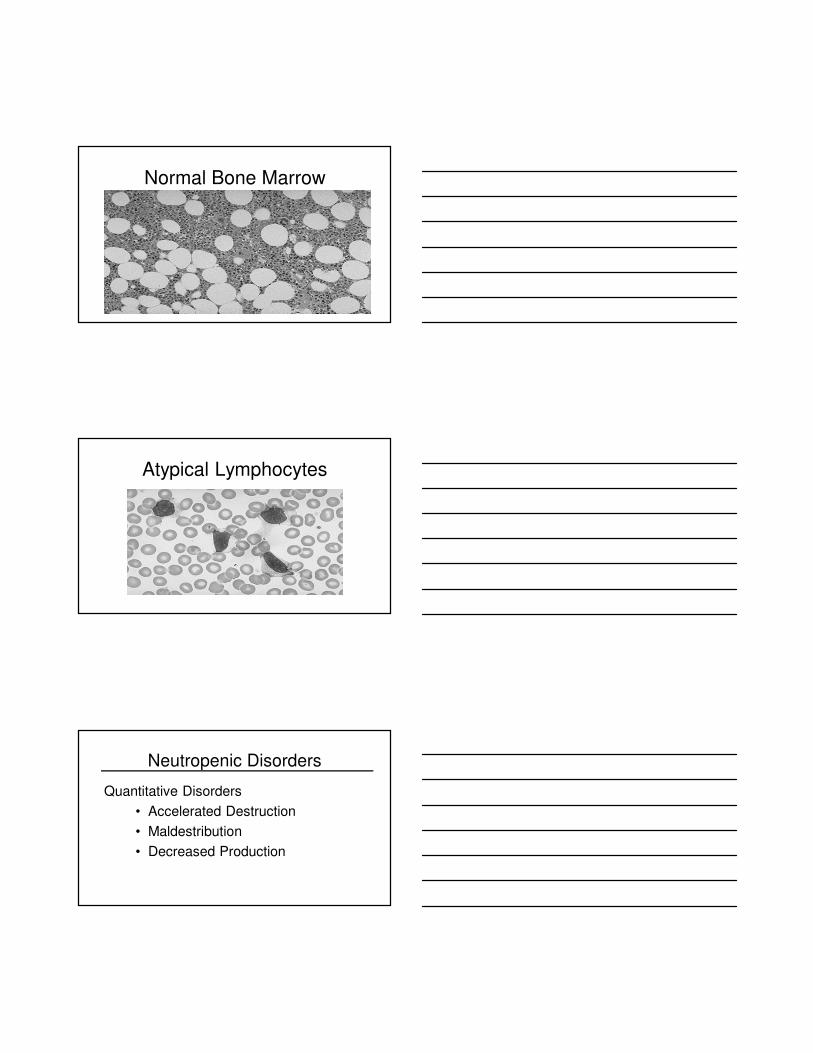
Macrocytes / Hypersgmented Poly
Lymphoblast
Normal Bone Marrow
Atypical Lymphocytes
Neutropenic Disorders
Quantitative Disorders
• Accelerated Destruction
• Maldestribution
• Decreased Production
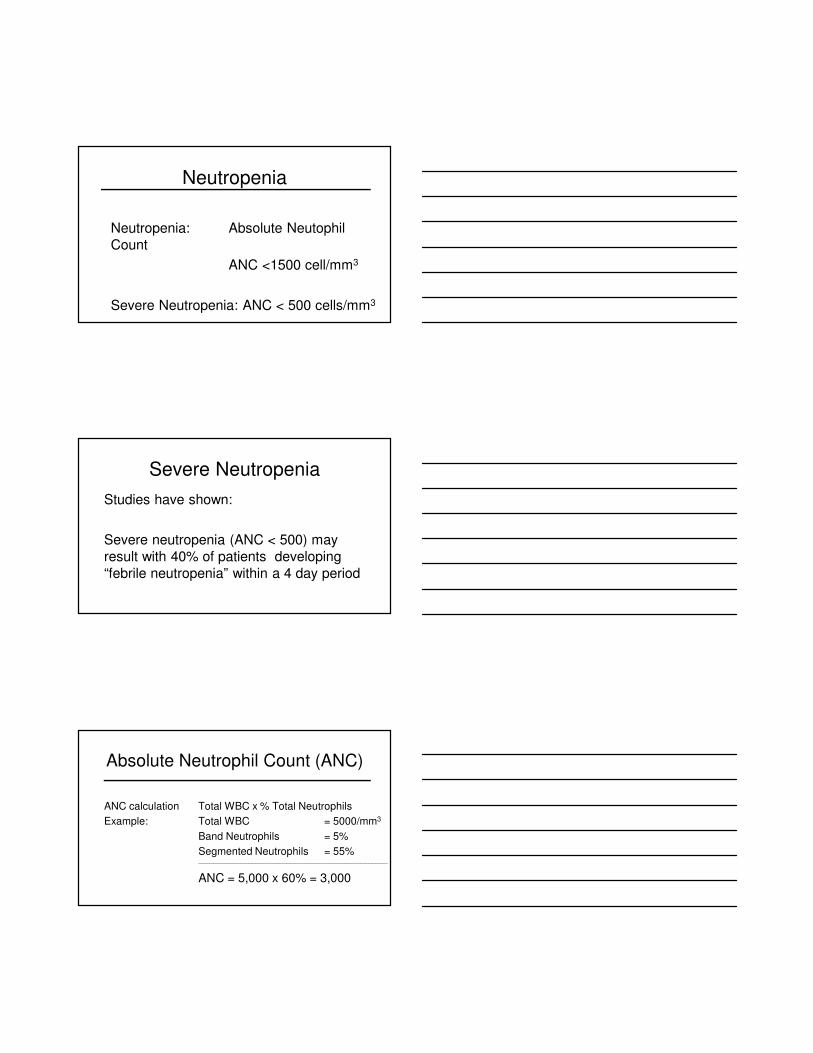
Neutropenia
Neutropenia: Absolute Neutophil
Count
ANC <1500 cell/mm3
Severe Neutropenia: ANC < 500 cells/mm3
Severe Neutropenia
Studies have shown:
Severe neutropenia (ANC < 500) may
result with 40% of patients developing
“febrile neutropenia” within a 4 day period
Absolute Neutrophil Count (ANC)
ANC calculation Total WBC x % Total Neutrophils
Example: Total WBC = 5000/mm3
Band Neutrophils = 5%
Segmented Neutrophils = 55%_________________________________________________
ANC = 5,000 x 60% = 3,000
Captain Morgan