interpreting float in resource constrained projects
TRANSCRIPT
Interpreting ¯oat in resource constrained projects
J.A. Bowers*
Department of Management and Organization, Faculty of Management, University of Stirling, Stirling, Scotland FK9 4LA, UK
Received 28 September 1999; received in revised form 31 January 2000; accepted 24 February 2000
Abstract
The concept of ¯oat has been adapted for use in resource constrained projects. However, an important characteristic of suchprojects is that alternative resource allocations are often possible, resulting in a number of schedules with identical durations. Anactivity may be critical in one schedule but have considerable ¯oat in another. Alternative measures of ¯oat are explored which
capture this ¯exibility of the resource constrained project. The practical interpretation of these measures is demonstrated in ananalysis of a simpli®ed software development programme. 7 2000 Elsevier Science Ltd and IPMA. All rights reserved.
Keywords: Resource; Scheduling; Float
1. Introduction
Float and the critical path have long been central tothe analyses of non-resource constrained project net-works. However, when resource constraints are intro-duced a new measure of ¯oat is needed; thedesirability of such a measure has been noted inreviews project network scheduling by Willis [1] andRagsdale [2]. Weist [3] proposed the `critical sequence'as an extension of the critical path: the project dur-ation is determined by a critical sequence of activitieswhich re¯ects both the precedences of the network andalso the interdependencies implied by the activities'sharing of resources. The concept was employed byWoodworth and Shanahan [4] in their study and itwas also adopted by Bowers [5] in the development ofa set of heuristics for determining resource constrained¯oat. These developments captured the impact of theresource allocation on the schedule in a measure ofresource constrained ¯oat re¯ecting the importance ofactivities which demand resources in short supply.However, this de®nition of ¯oat assumed a single
resource allocation resulting in a ®xed schedule andcritical sequence. Even in a simple resource con-strained network, alternative resource allocations areoften possible resulting in a choice of schedules withidentical project durations but di�erent criticalsequences. An activity may be critical in one schedulebut have considerable ¯oat in another. Raz and Mar-shall [6] explored a de®nition of resource constrained¯oat involving the generation of two di�erent sche-dules; this paper examines multiple alternative sche-dules and proposes de®nitions of ¯oat which attemptto capture the ¯uid nature of the resource constrainednetwork.
2. A de®nition of resource constrained ¯oat
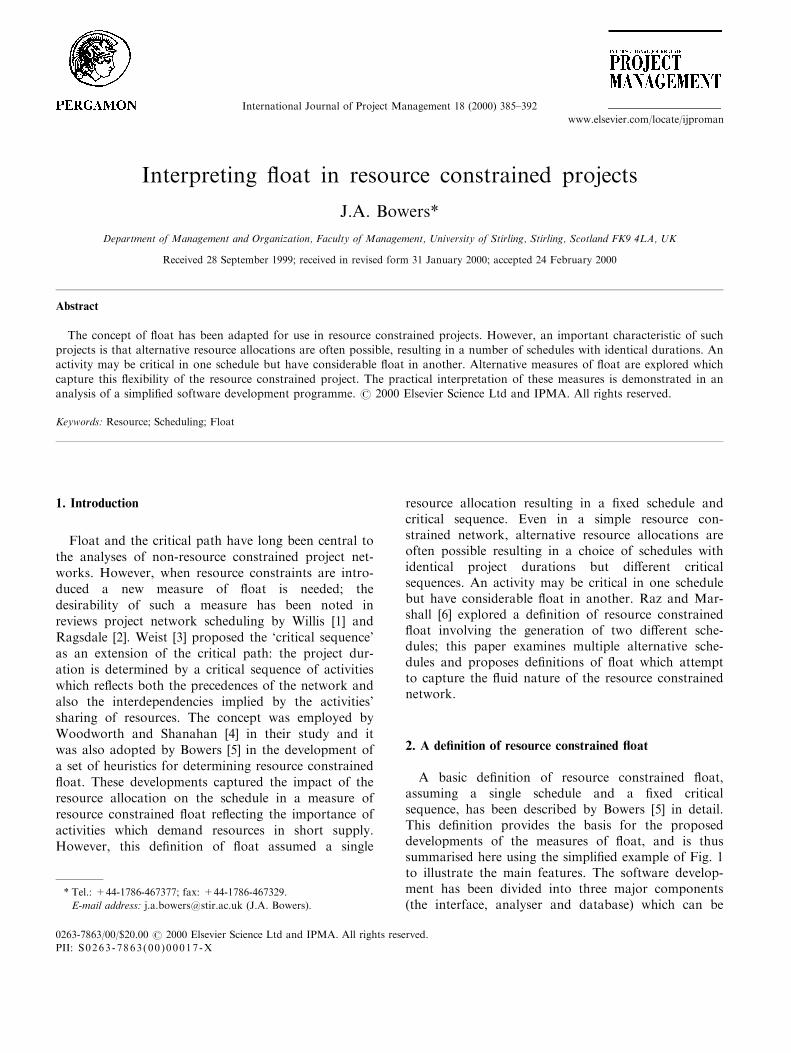
A basic de®nition of resource constrained ¯oat,assuming a single schedule and a ®xed criticalsequence, has been described by Bowers [5] in detail.This de®nition provides the basis for the proposeddevelopments of the measures of ¯oat, and is thussummarised here using the simpli®ed example of Fig. 1to illustrate the main features. The software develop-ment has been divided into three major components(the interface, analyser and database) which can be
International Journal of Project Management 18 (2000) 385±392
0263-7863/00/$20.00 7 2000 Elsevier Science Ltd and IPMA. All rights reserved.
PII: S0263-7863(00 )00017 -X
www.elsevier.com/locate/ijproman
* Tel.: +44-1786-467377; fax: +44-1786-467329.
E-mail address: [email protected] (J.A. Bowers).
designed, coded and tested in parallel. The design ac-tivities require the use of a specialist team (resourceR1) and the coding activities require a di�erent team(resource R2). Since only one of each team is avail-able, the resource constraints have a substantial impacton the project duration and the activities' ¯oats aredependent on the sequence implied by the transfer ofthe resources. The activities' durations and resourcerequirements are recorded in Table 1.
Determining the resource constrained ¯oats requiresa series of analyses of the network:
1. A conventional resource constrained analysis is per-formed generating a schedule (e.g. the early start(ES) and early ®nish (EF) dates of schedule (1) inTable 1). The ¯ows of the resources between the ac-tivities are noted (e.g. the transfers of resources arenoted in Fig. 1).
2. The resource ¯ows are incorporated as explicit pre-cedence links in the network. The use of the ac-tivity-on-node representation simpli®es this process.
3. A further pair of forward and reverse passes of thenetwork, including the links of step (2), are per-formed to determine the late start (LS), late ®nish(LF), and hence the ¯oats, as recorded in Table 1.
Examining the ¯oats, the critical sequence can beidenti®ed (1-2-4-7-6-8-11-12-13). Some of the activities(1, 2, 4, 11, 12, 13) lie in the critical sequence becauseof their technological importance in the project, butothers (7, 6, 8) are included because of their mutualdependence on the scarce resource R2. The impli-cations of the ¯oats are familiar: special attentionshould be paid to the critical activities and they maywarrant additional assistance if the project is to beaccelerated.
Fig. 1. The software development: schedule A.
J.A. Bowers / International Journal of Project Management 18 (2000) 385±392386
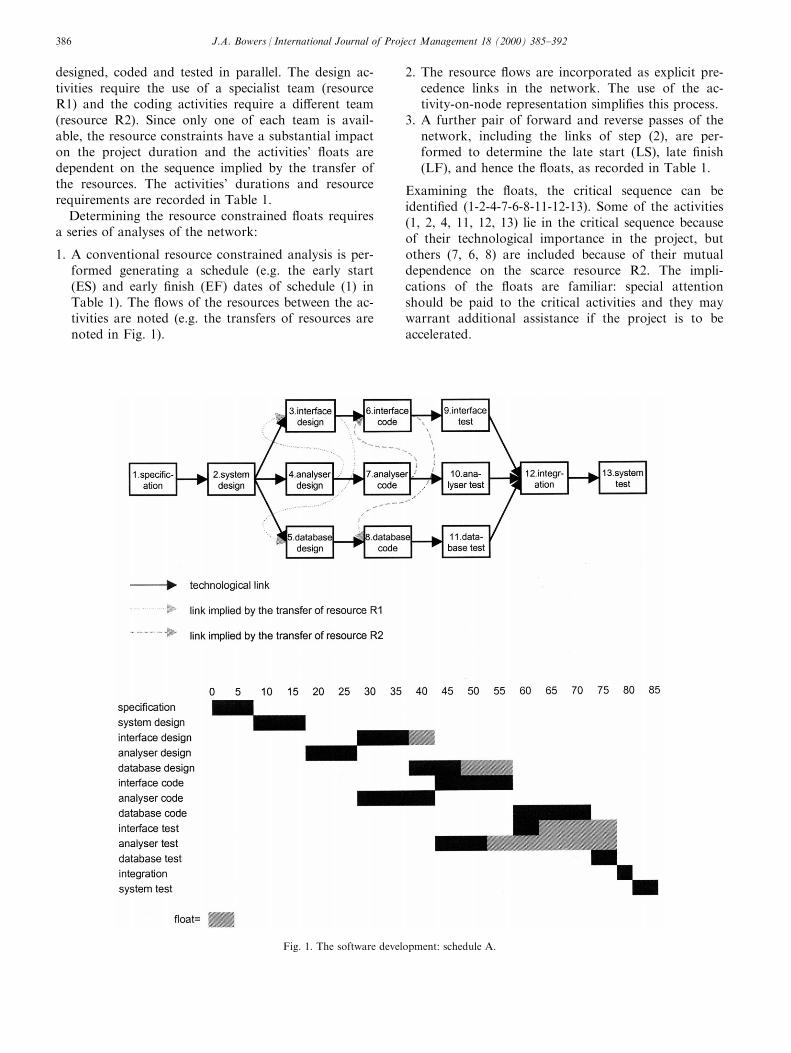
3. Multiple schedules
The ¯oats noted in Table 1 are valid if schedule (A)is adopted. However, the resource allocation might bechanged producing an alternative schedule with an
identical duration. Figs. 1±4 illustrate four such equiv-
alent schedules, each with a project duration of 85
weeks. It can be shown that the four schedules are the
only distinct schedules which deliver the minimum dur-
ation of 85 weeks. Although there are more possible
Table 1
A schedule for the software development
Activity Duration (weeks) Resource Schedule(A)
R1 R2 ES EF LS LF Float
1 Speci®cation 8 0 8 0 8 0
2 System design 10 8 18 8 18 0
3 Interface design 10 1 28 38 33 43 5
4 Analyser design 10 1 18 28 18 28 0
5 Database design 10 1 38 48 48 58 10
6 Interface code 15 1 43 58 43 58 0
7 Analyser code 15 1 28 43 28 43 0
8 Database code 15 1 58 73 58 73 0
9 Interface test 5 58 63 73 78 15
10 Analyser test 10 43 53 68 78 25
11 Database test 5 73 78 73 78 0
12 Integration 3 78 81 78 81 0
13 System test 4 81 85 81 85 0
Resource availability 1 1
Fig. 2. An alternative resource allocation: schedule B.
J.A. Bowers / International Journal of Project Management 18 (2000) 385±392 387
permutations for the allocation of the resources, the
others involve the analyser stream of activities beingallotted the resources last; since the analyser stream
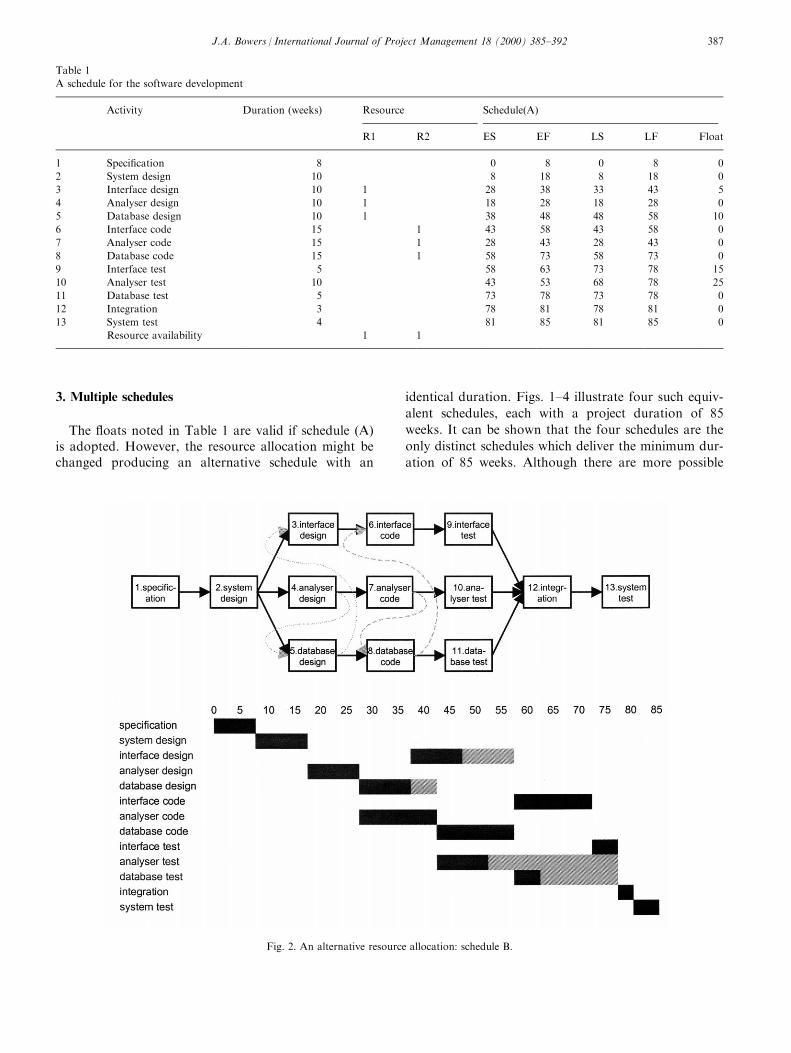
involves longer activities, such allocations result inproject durations >85 weeks. The ¯oats of each ac-tivity in the four schedules are noted in Table 2 and
are depicted in Figs. 1±4 by grey shading. Some activi-ties, such as ``interface design'' have a variable ¯oat
dependent on the particular schedule chosen: in sche-
dule (B) it has a ¯oat of 10 weeks, whereas in schedule
(C) the activity is critical. Considering just a single
schedule produces a simple measure of ¯oat but this
ignores the inherent ¯exibility of many resource con-
strained networks. Further, measures of ¯oat can be
useful in revealing this valuable ¯exibility:
1. Float2 is de®ned as the maximum of the ¯oats for
each schedule.
Fig. 3. An alternative resource allocation: schedule C.
Table 2
Alternative measures of ¯oat for the software development
Activity Sched. (A) ¯oat Sched. (B) ¯oat Sched. (C) ¯oat Sched. (D) ¯oat Float2 EES LLS Float3
1 Speci®cation 0 0 0 0 0 0 0 0
2 System design 0 0 0 0 0 8 8 0
3 Interface design 5 10 0 10 10 18 48 30
4 Analyser design 0 0 5 5 5 18 33 15
5 Database design 10 5 10 0 10 18 48 30
6 Interface code 0 0 0 0 0 28 58 30
7 Analyser code 0 0 0 0 0 28 43 15
8 Database code 0 0 0 0 0 28 58 30
9 Interface test 15 0 30 0 30 43 73 30
10 Analyser test 25 25 10 10 25 43 68 25
11 Database test 0 15 0 30 30 43 73 30
12 Integration 0 0 0 0 0 78 78 0
13 System test 0 0 0 0 0 81 81 0
J.A. Bowers / International Journal of Project Management 18 (2000) 385±392388
2. The early and latest start dates in each schedule arecompared to determine the earliest early start(EES(i ) latest, latest start (LLS(i )) for each activityi.
3. Float3 is de®ned as LLS±EES. This is similar to themeasure suggested by Raz and Marshall [6], thoughthat was based on just two schedules.
Often the EES and LLS of an activity are associatedwith di�erent schedules:
Float3(i )=LLS (i ) ÿ EES(i )Float3(i )rFloat2(i )
4. The meaning of ¯oat
The measures, Float2 and Float3 can help the pro-ject planner identify useful ¯exibility in the schedule.The interpretation of these two measures of ¯oat is il-lustrated by considering two possible problems withthe activities `interface design' and `database code'.
4.1. Problem 1: the availability of a users' representative
A manager has expressed some concern, ``There is
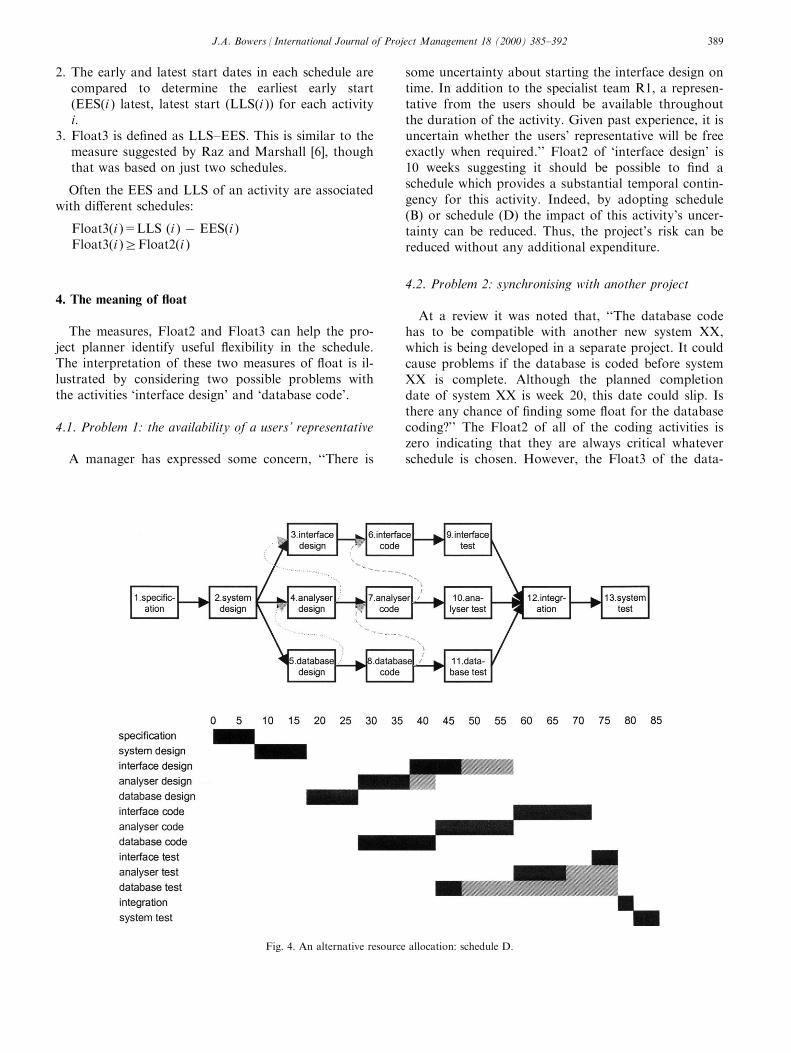
some uncertainty about starting the interface design ontime. In addition to the specialist team R1, a represen-tative from the users should be available throughoutthe duration of the activity. Given past experience, it isuncertain whether the users' representative will be freeexactly when required.'' Float2 of `interface design' is10 weeks suggesting it should be possible to ®nd aschedule which provides a substantial temporal contin-gency for this activity. Indeed, by adopting schedule(B) or schedule (D) the impact of this activity's uncer-tainty can be reduced. Thus, the project's risk can bereduced without any additional expenditure.
4.2. Problem 2: synchronising with another project
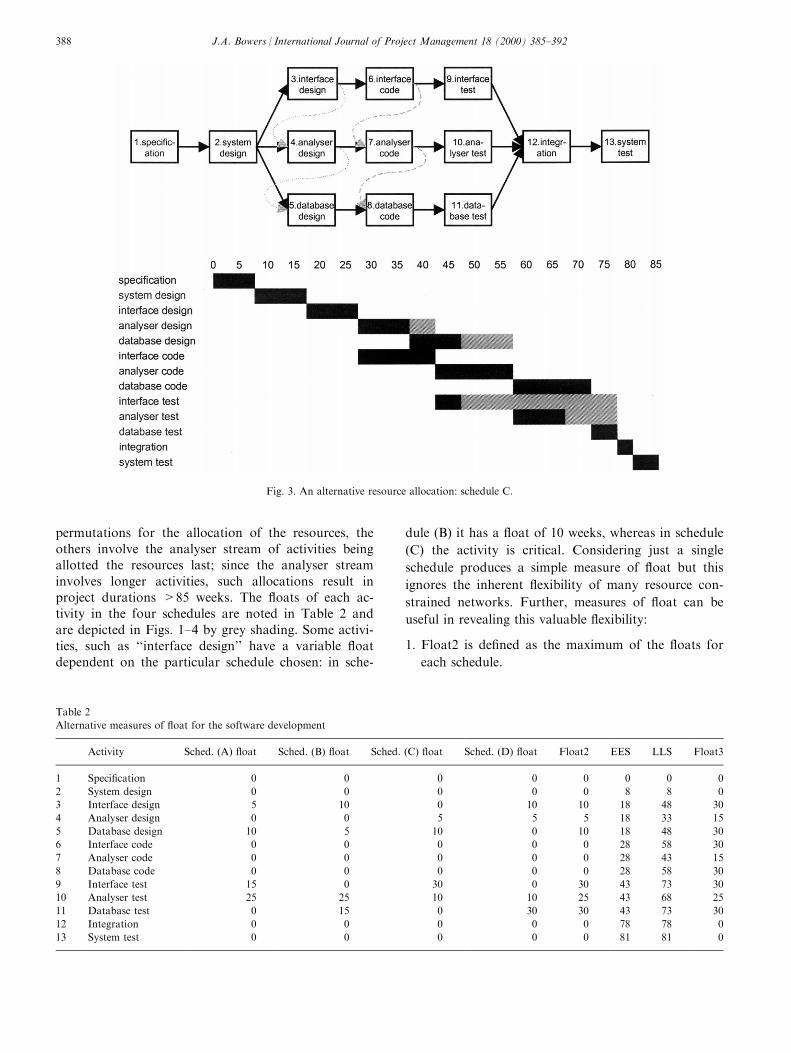
At a review it was noted that, ``The database codehas to be compatible with another new system XX,which is being developed in a separate project. It couldcause problems if the database is coded before systemXX is complete. Although the planned completiondate of system XX is week 20, this date could slip. Isthere any chance of ®nding some ¯oat for the databasecoding?'' The Float2 of all of the coding activities iszero indicating that they are always critical whateverschedule is chosen. However, the Float3 of the data-
Fig. 4. An alternative resource allocation: schedule D.
J.A. Bowers / International Journal of Project Management 18 (2000) 385±392 389
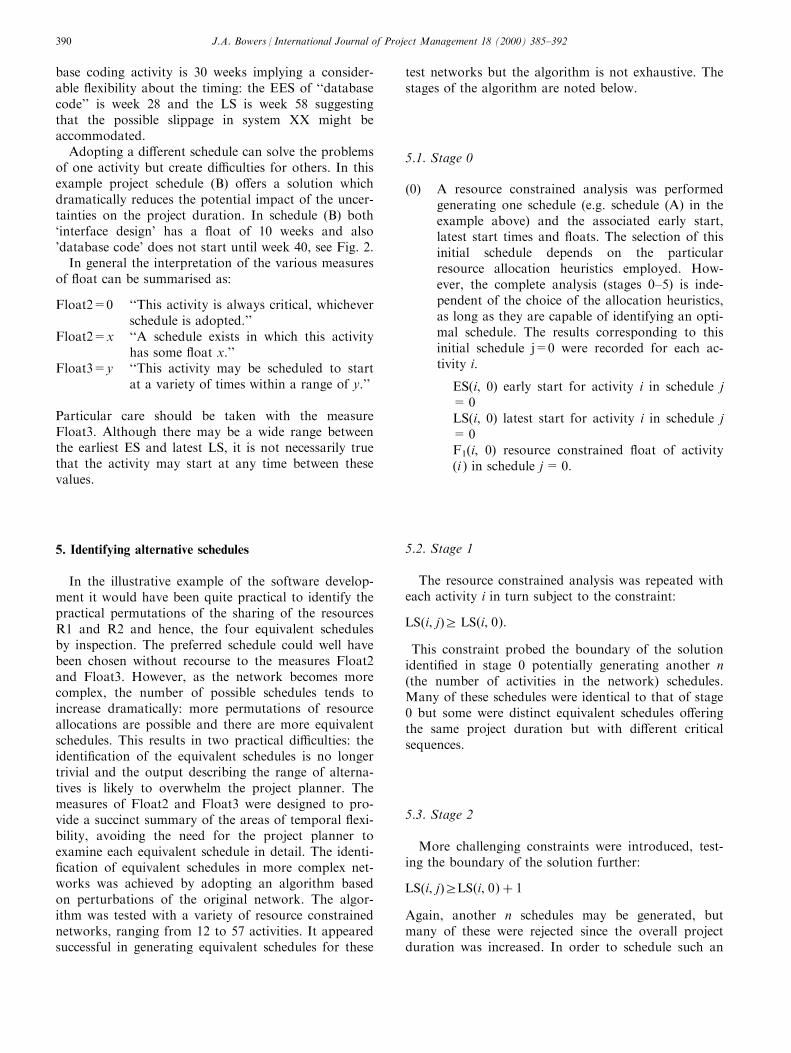
base coding activity is 30 weeks implying a consider-able ¯exibility about the timing: the EES of ``databasecode'' is week 28 and the LS is week 58 suggestingthat the possible slippage in system XX might beaccommodated.
Adopting a di�erent schedule can solve the problemsof one activity but create di�culties for others. In thisexample project schedule (B) o�ers a solution whichdramatically reduces the potential impact of the uncer-tainties on the project duration. In schedule (B) both`interface design' has a ¯oat of 10 weeks and also'database code' does not start until week 40, see Fig. 2.
In general the interpretation of the various measuresof ¯oat can be summarised as:
Float2=0 ``This activity is always critical, whicheverschedule is adopted.''
Float2=x ``A schedule exists in which this activityhas some ¯oat x.''
Float3=y ``This activity may be scheduled to startat a variety of times within a range of y.''
Particular care should be taken with the measureFloat3. Although there may be a wide range betweenthe earliest ES and latest LS, it is not necessarily truethat the activity may start at any time between thesevalues.
5. Identifying alternative schedules
In the illustrative example of the software develop-ment it would have been quite practical to identify thepractical permutations of the sharing of the resourcesR1 and R2 and hence, the four equivalent schedulesby inspection. The preferred schedule could well havebeen chosen without recourse to the measures Float2and Float3. However, as the network becomes morecomplex, the number of possible schedules tends toincrease dramatically: more permutations of resourceallocations are possible and there are more equivalentschedules. This results in two practical di�culties: theidenti®cation of the equivalent schedules is no longertrivial and the output describing the range of alterna-tives is likely to overwhelm the project planner. Themeasures of Float2 and Float3 were designed to pro-vide a succinct summary of the areas of temporal ¯exi-bility, avoiding the need for the project planner toexamine each equivalent schedule in detail. The identi-®cation of equivalent schedules in more complex net-works was achieved by adopting an algorithm basedon perturbations of the original network. The algor-ithm was tested with a variety of resource constrainednetworks, ranging from 12 to 57 activities. It appearedsuccessful in generating equivalent schedules for these
test networks but the algorithm is not exhaustive. Thestages of the algorithm are noted below.
5.1. Stage 0
(0) A resource constrained analysis was performedgenerating one schedule (e.g. schedule (A) in theexample above) and the associated early start,latest start times and ¯oats. The selection of thisinitial schedule depends on the particularresource allocation heuristics employed. How-ever, the complete analysis (stages 0±5) is inde-pendent of the choice of the allocation heuristics,as long as they are capable of identifying an opti-mal schedule. The results corresponding to thisinitial schedule j=0 were recorded for each ac-tivity i.
ES(i, 0) early start for activity i in schedule j=0LS(i, 0) latest start for activity i in schedule j=0F1(i, 0) resource constrained ¯oat of activity(i ) in schedule j=0.
5.2. Stage 1
The resource constrained analysis was repeated witheach activity i in turn subject to the constraint:
LS�i, j�r LS�i, 0�:This constraint probed the boundary of the solutionidenti®ed in stage 0 potentially generating another n(the number of activities in the network) schedules.Many of these schedules were identical to that of stage0 but some were distinct equivalent schedules o�eringthe same project duration but with di�erent criticalsequences.
5.3. Stage 2
More challenging constraints were introduced, test-ing the boundary of the solution further:
LS�i, j�rLS�i, 0� � 1
Again, another n schedules may be generated, butmany of these were rejected since the overall projectduration was increased. In order to schedule such an
J.A. Bowers / International Journal of Project Management 18 (2000) 385±392390
activity at a later time, as implied by this constraint,some other activities must take place at an earliertime: often at times earlier than those suggested by theES of stage 0. Thus, this perturbation can identifyalternative schedules with both later LS and earlierES.
5.4. Stage 3
The network was reversed such that an activity'spredecessors became its successors, and a resource con-strained analysis was performed as in stage 0. Thereversal of the network was also employed in the de®-nition of resource constrained ¯oat developed by Razand Marshall [6]. The e�ect of analysing the networkin reverse was to schedule the high priority activities aslate as possible, while still minimising the project dur-ation. This implies that other, lower priority activitieswere scheduled earlier, and hence, the analysis of thereversed network provided useful information aboutboth the latest LS and earliest ES. Assuming e�ectiveresource allocation heuristics, the same project dur-ation D should be achieved as in the previous stages.The early and late times produced by this analysis ofthe reversed network (LF ', EF ') were related to earlyand latest times for the original network (ES, EF):
ES � Dÿ LF 0
LS � Dÿ EF 0
5.5. Stage 4
The constraints of stage 1 were introduced to thereversed network.
5.6. Stage 5
The constraints of stage 2 were introduced to thereversed network.
5.7. Deducing Float2, Float3, EES and LLS
Having identi®ed the equivalent schedules j, the ES,LS and ¯oats of the activities were compared:
EES�i� � minimum�ES�i, j�
LLS�i� � maximum�ES�i, j�
Float2�i� � maximum�F1�i, j�
Float3�i� � LLS�i� ÿ EES�i�
The measures Float2, Float3, EES and LLS provide asummary of the temporal ¯exibility guiding the projectplanner to an improved schedule. Having determinedthe areas of ¯exibility of potential value, the projectplanner then examines just the particular equivalentschedules of interest.
6. Practical application
The success of the algorithm in identifying equival-ent networks allows the concepts of the equivalent net-works and the various measures of ¯oat to be appliedto any network, however, large or complex. The pro-cedures for determining the equivalent schedules andthe measures of ¯oat were encoded in a Pascal pro-gram: a development of a standard activity-on-noderesource constrained network scheduling routine. Thisprogram can then be provided as an add-on tool aspart of a conventional project network analysis pack-age. Although the measures of ¯oat have beendesigned to enhance understanding about projects'¯exibilities, the program has so far only been im-plemented as part of a specialised piece of analysiswith expert support; the full interpretation of the out-put demands considerable insight. Converting such aspecialised procedure into a practical, common toolaccessible to any project planner would require the de-sign of an interface which guides the user to a betterplan, without overwhelming with excessive data.
7. Conclusions
The de®nition of ¯oat can be extended to capturethe ¯exibility inherent in many resource constrainedprojects. This involves identifying the various alterna-tive schedules which deliver the same project duration,but o�er di�erent critical sequences of activities. In asmall network, it is possible to identify and explorethese alternatives by a simple inspection but in largernetworks this is impractical. An algorithm incorporat-ing perturbations of the network can generate theseschedules in a systematic manner providing a basis fornew measures for each activity:
Float2=the maximum ¯oat possibleEES=the earliest, early start dateLLS=the latest, latest start dateFloat3=the spread of possible dates LLS±EES
These measures can guide the project planner toareas of useful ¯exibility helping to identify an alterna-tive schedule in which problematic activities havegreater ¯oat or start at a more convenient time. Thus,the potential impact of some activities' uncertaintiesmay be reduced at no additional expense.
J.A. Bowers / International Journal of Project Management 18 (2000) 385±392 391

References
[1] Willis RJ. Critical path analysis and resource constrained sche-
duling Ð theory and practice. Eur J Opl Res 1985;23:149±55.
[2] Ragsdale C. The current state of network simulation in project
theory and practice. Omega 1989;17:21±5.
[3] Weist JD. Some properties of schedules for large projects with
limited resources. Opns Res 1964;12:395±418.
[4] Woodworth BM, Shanahan S. Identifying the critical sequence in
a resource constrained project. Int J Proj Man 1988;6:89±96.
[5] Bowers JA. Criticality in resource constrained networks. J Opl
Res Soc 1995;46:80±91.
[6] Raz T, Marshall B. E�ect of resource constraints on ¯oat calcu-
lations in project networks. Int J Proj Man 1996;14:241±8.
John Bowers worked for several years
in the Operational Reaserch Executive
of British Coal before joining Bae-
Sema as a consultant specialising in
project risk management. He was
involved in developing risk assessment
methodologies and their application in
a number of major projects. He is now
at the University of Stiring where he is
invertigating new approaches to mod-
elling projects.
J.A. Bowers / International Journal of Project Management 18 (2000) 385±392392