interpretation of qsar models: past and · pdf fileinterpretation of qsar models: past and...
TRANSCRIPT

Interpretation of QSAR models:past and present
International School-Seminar on Computer-Aided Molecular DesignKazan, Russia, 18-20 May 2016
Pavel Polishchuk
Institute of Molecular and Translational MedicineFaculty of Medicine and Dentistry
Palacky University
Interpretation of QSAR models
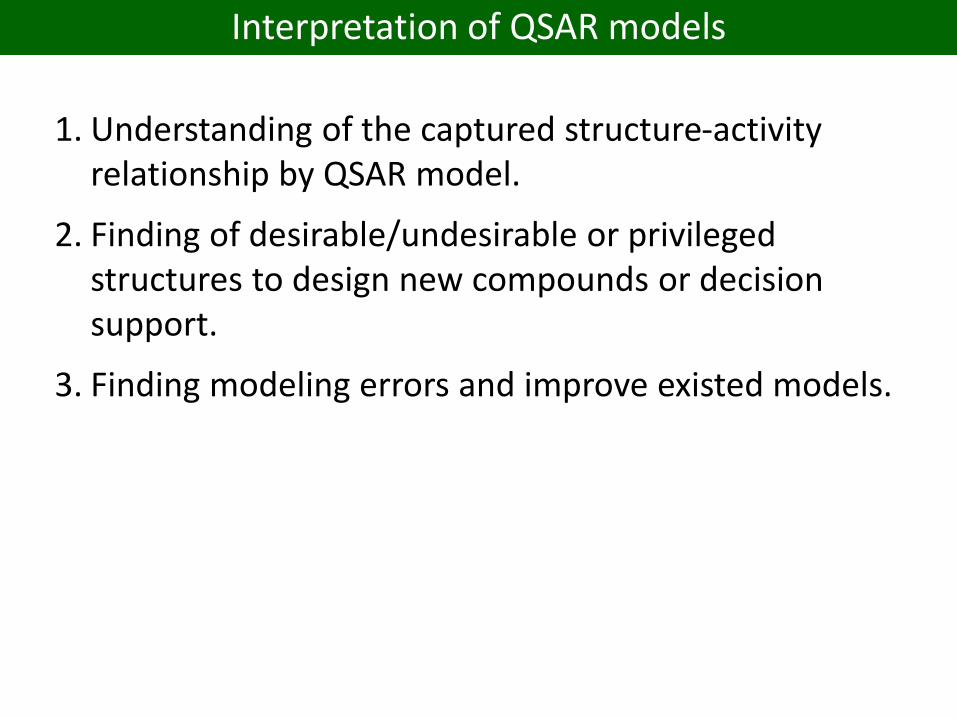
1. Understanding of the captured structure-activity relationship by QSAR model.
2. Finding of desirable/undesirable or privileged structures to design new compounds or decision support.
3. Finding modeling errors and improve existed models.
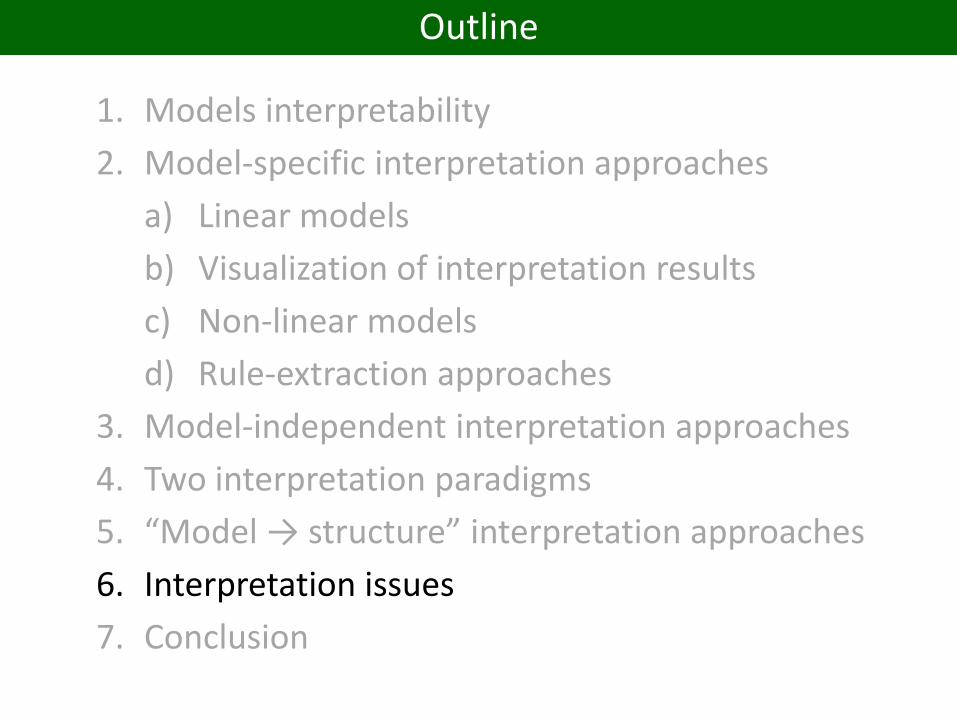
Outline
1. Models interpretability
2. Model-specific interpretation approaches
a) Linear models
b) Visualization of interpretation results
c) Non-linear models
d) Rule-extraction approaches
3. Model-independent interpretation approaches
4. Two interpretation paradigms
5. “Model → structure” interpretation approaches
6. Interpretation issues
7. Conclusion

Model interpretability
interpretability of machine learning method
interpretability of descriptor
interpretability of model
Mo
del
inte
rpre
tab
ility
Model complexity
Popular misbelief
DTMLR
PLS
NN
kNNRF
SVMensembles
interpretation of descriptor
contributions
structural interpretation

Outline
1. Models interpretability
2. Model-specific interpretation approaches
a) Linear models
b) Visualization of interpretation results
c) Non-linear models
d) Rule-extraction approaches
3. Model-independent interpretation approaches
4. Two interpretation paradigms
5. “Model → structure” interpretation approaches
6. Interpretation issues
7. Conclusion

1. Hansch
2. Free-Wilson
3. Partial least squares (PLS)
Interpretation of linear models

Hansch approach
1/C = 4.08π – 2.14π2 + 2.78σ + 3.38
Hansch, C.; Maloney, P. P.; Fujita, T.; Muir, R. M. Correlation of Biological Activity of Phenoxyacetic Acids with Hammett Substituent Constants and Partition Coefficients. Nature 1962, 194, 178-180
π = logPX – logPH
σ - Hammet constant
plant growth inhibition activity of phenoxyacetic acids
electronic factorsrate of penetration of membranes in the plant cell

Free and Wilson approach
R is H or CH3;
X is Br, Cl, NO2 and
Y is NO2, NH2, NHC(=O)CH3
Inhibition activity of compounds against Staphylococcus aureus
Act = 75RH – 112RCH3 + 84XCl – 16XBr – 26XNO2 +
123YNH2 + 18YNHC(=O)CH3 – 218YNO2
Free, S. M.; Wilson, J. W. A Mathematical Contribution to Structure-Activity Studies. Journal of Medicinal Chemistry 1964, 7, 395-399
Partial least squares (PLS)

Partial least squares (PLS)
X-scores Y-scores
loadings
weights
1) Lindberg, W.; Persson, J.-A.; Wold, S. Partial least-squares method for spectrofluorimetric analysis of mixtures of humic acid and lignin sulfonate. Analytical Chemistry 1983, 55, 643-6482) Wold, S.; Sjöström, M.; Eriksson, L. PLS-regression: a basic tool of chemometrics. Chemometrics and Intelligent Laboratory Systems 2001, 58, 109-130
T = XW’
X = TP‘ + E
Y = TC‘ + F
Y = XW'C‘ + F
Y = XB + F
regression coefficients

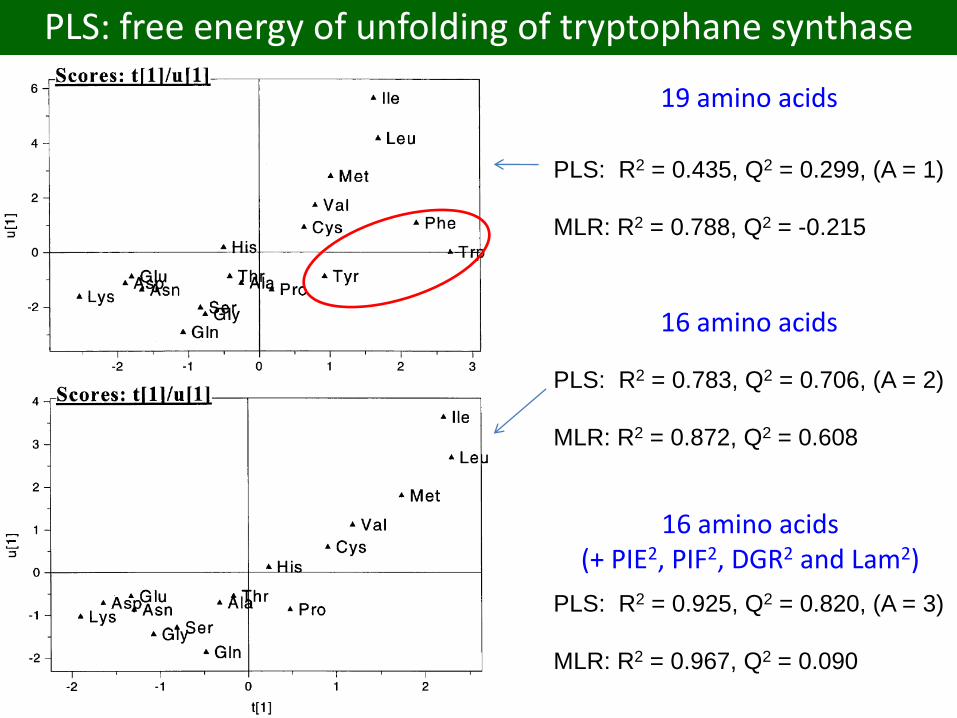
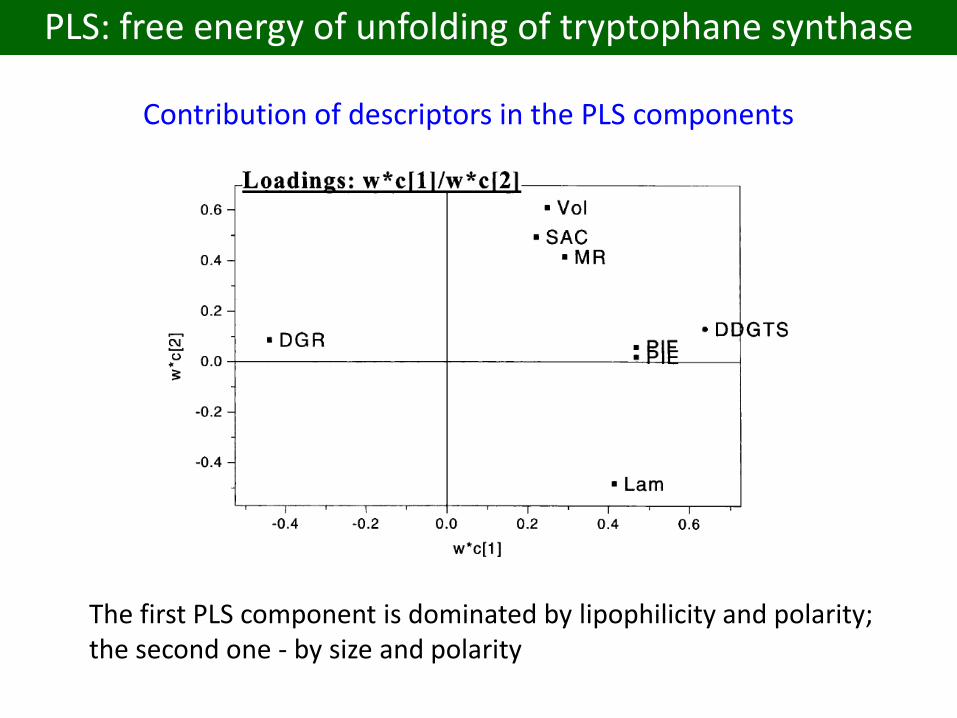
PLS: free energy of unfolding of tryptophane synthase
Position 49 is modified to contain 19 amino acids (except Arginine)
1) PIE and PIF are the lipophilicity constants2) DGR is the free energy of transfer of an AA side
chain from protein interior to water3) SAC is the water-accessible surface area 4) MR is molecular refractivity5) Lam is a polarity6) Vol is the molecular volume
PLS: R2 = 0.435, Q2 = 0.299, (A = 1)
MLR: R2 = 0.788, Q2 = -0.215
Wold, S.; Sjöström, M.; Eriksson, L. PLS-regression: a basic tool of chemometrics. Chemometrics and Intelligent Laboratory Systems 2001, 58, 109-130
PLS: free energy of unfolding of tryptophane synthase
PLS: R2 = 0.435, Q2 = 0.299, (A = 1)
MLR: R2 = 0.788, Q2 = -0.215
PLS: R2 = 0.783, Q2 = 0.706, (A = 2)
MLR: R2 = 0.872, Q2 = 0.608
19 amino acids
16 amino acids
PLS: R2 = 0.925, Q2 = 0.820, (A = 3)
MLR: R2 = 0.967, Q2 = 0.090
16 amino acids(+ PIE2, PIF2, DGR2 and Lam2)

PLS: free energy of unfolding of tryptophane synthase
Similarity of objects in the latent space
PLS: free energy of unfolding of tryptophane synthase
Contribution of descriptors in the PLS components
The first PLS component is dominated by lipophilicity and polarity;the second one - by size and polarity
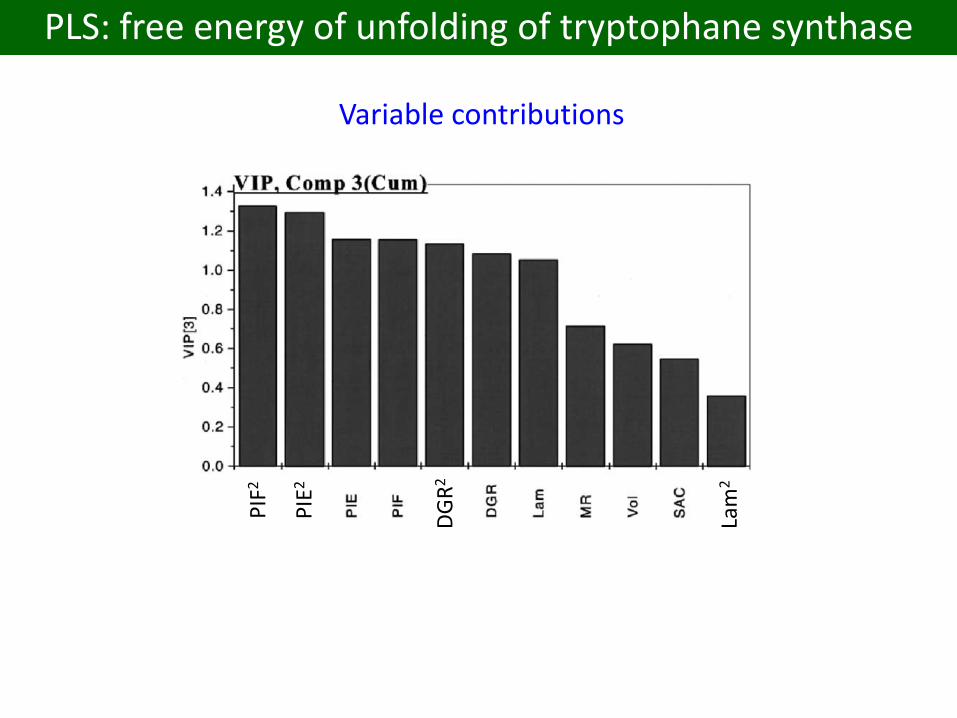
PLS: free energy of unfolding of tryptophane synthase
Variable contributions
PIF
2
PIE
2
DG
R2
Lam
2

Outline
1. Models interpretability
2. Model-specific interpretation approaches
a) Linear models
b) Visualization of interpretation results
c) Non-linear models
d) Rule-extraction approaches
3. Model-independent interpretation approaches
4. Two interpretation paradigms
5. “Model → structure” interpretation approaches
6. Interpretation issues
7. Conclusion

1. Comparative Molecular Fields Analysis (CoMFA)
2. Visualization of atomic contributions by color coding
Visualization of interpretation results
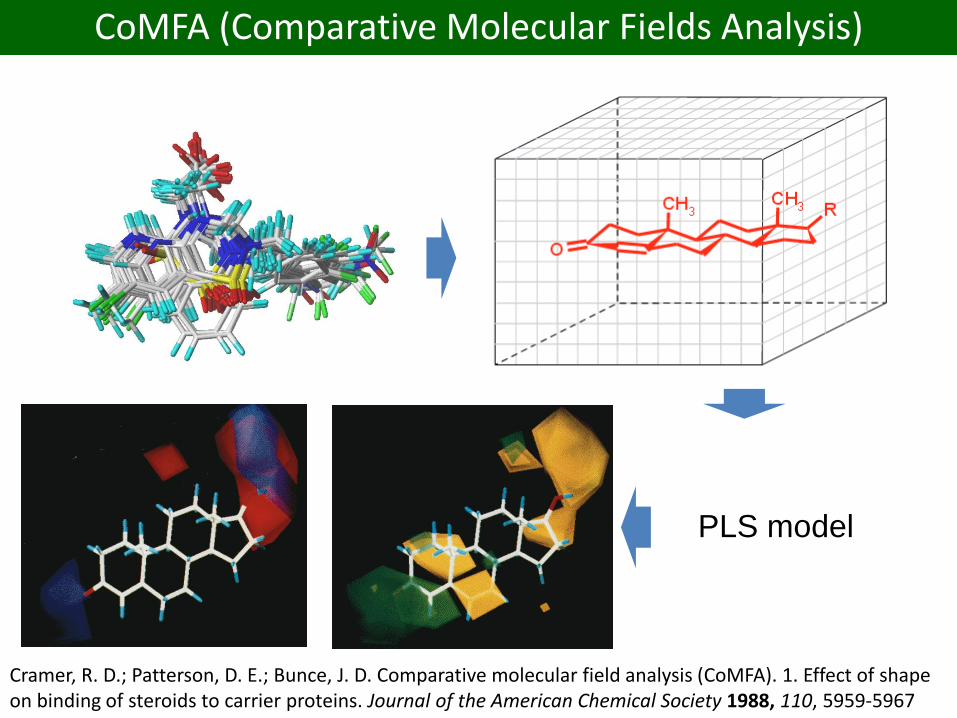
CoMFA (Comparative Molecular Fields Analysis)
Cramer, R. D.; Patterson, D. E.; Bunce, J. D. Comparative molecular field analysis (CoMFA). 1. Effect of shape on binding of steroids to carrier proteins. Journal of the American Chemical Society 1988, 110, 5959-5967
PLS model
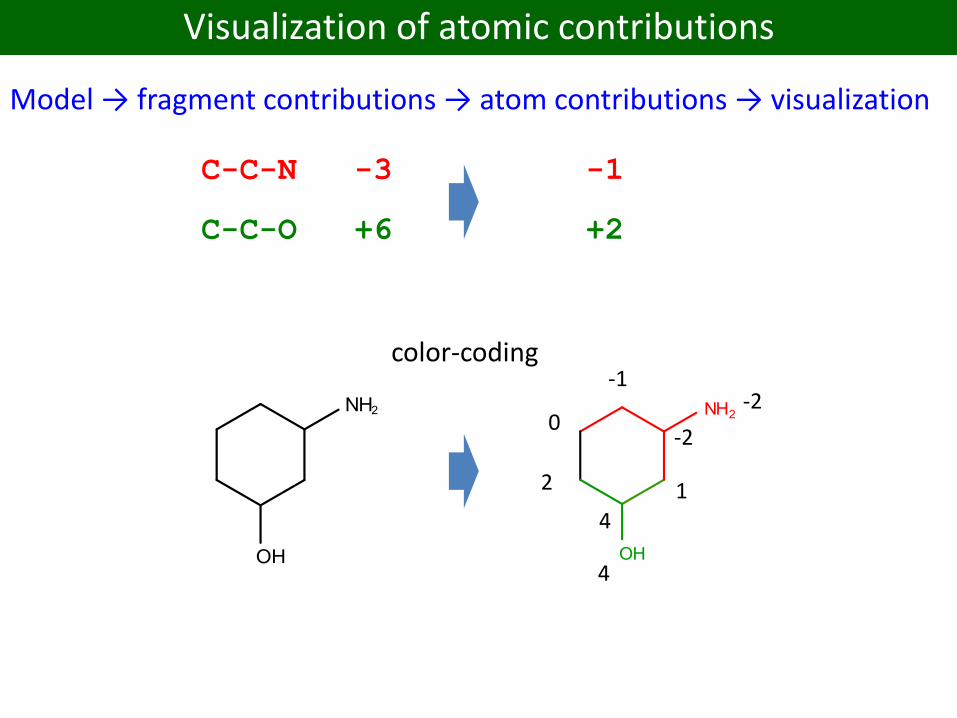
Visualization of atomic contributions
Model → fragment contributions → atom contributions → visualization
C-C-N -3
C-C-O +6
-1
+2
color-coding
-2
-2
-1
0
2
4
4
1
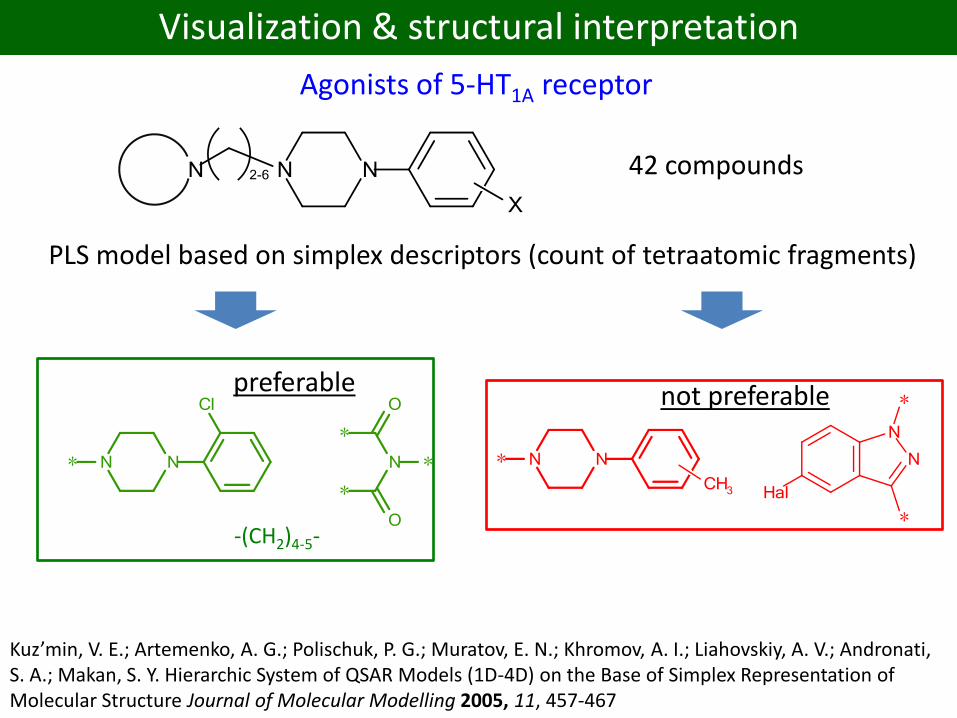
Visualization & structural interpretation
Agonists of 5-HT1A receptor
42 compounds
PLS model based on simplex descriptors (count of tetraatomic fragments)
preferable
-(CH2)4-5-
not preferable
Kuz’min, V. E.; Artemenko, A. G.; Polischuk, P. G.; Muratov, E. N.; Khromov, A. I.; Liahovskiy, A. V.; Andronati, S. A.; Makan, S. Y. Hierarchic System of QSAR Models (1D-4D) on the Base of Simplex Representation of Molecular Structure Journal of Molecular Modelling 2005, 11, 457-467

Outline
1. Models interpretability
2. Model-specific interpretation approaches
a) Linear models
b) Visualization of interpretation results
c) Non-linear models
d) Rule-extraction approaches
3. Model-independent interpretation approaches
4. Two interpretation paradigms
5. “Model → structure” interpretation approaches
6. Interpretation issues
7. Conclusion
1. Decision tree
2. Neural nets (NN)
3. Random Forest
Non-linear models

Decision treeSolid-phase fluorescence enhancement of 2-(diphenylacetyl)-1,3-indandione
1-(p-(dimethylamino)benzaldazine)
1) the maximum length ≥ 7.2Å
AND
2) pentavalent phosphorous
atom P(=R)(-X)(-Y)-Z is
present where R is O or S
AND
3) X, Y, Z contain S
Ashman, W. P.; Lewis, J. H.; Poziomek, E. J. Decision tree for chemical detection applications. Analytical Chemistry 1985, 57, 1951-1955
Decision tree
For big datasets decision trees can be very deep and extracted rules may become very complex and hardly undestandable.

Neural nets (NN)
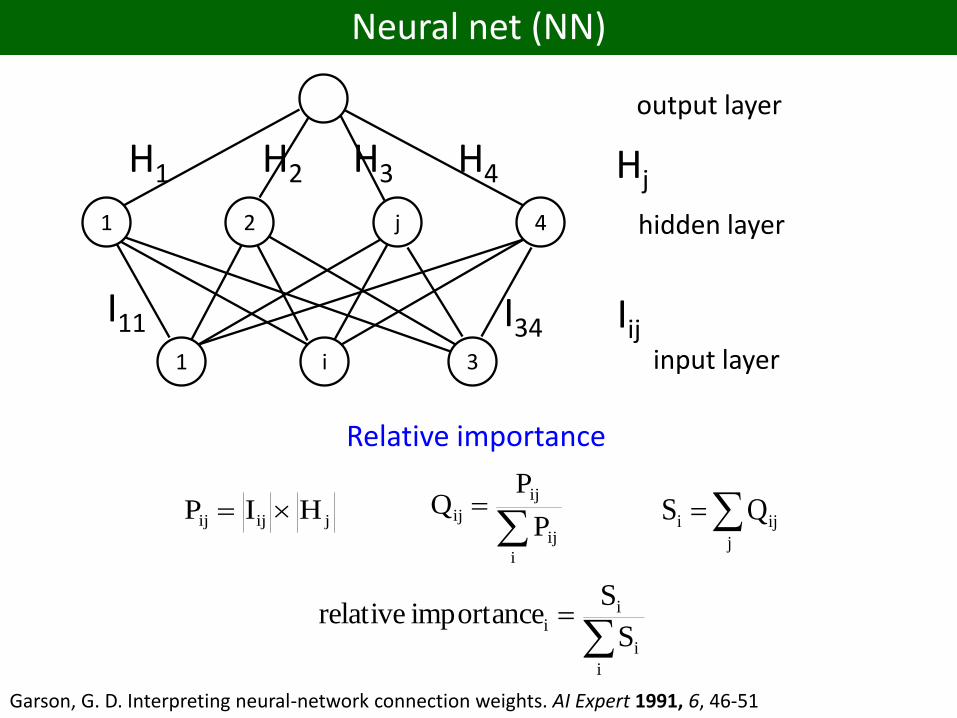
Neural net (NN)
1 i 3
1 2 j 4
H1 H2 H3 H4
I11 I34
output layer
hidden layer
input layer
Hj
Iij
jijij HIP
i
ij
ij
ijP
PQ
j
iji QS
i
i
ii
S
Simportance relative
Garson, G. D. Interpreting neural-network connection weights. AI Expert 1991, 6, 46-51
Relative importance
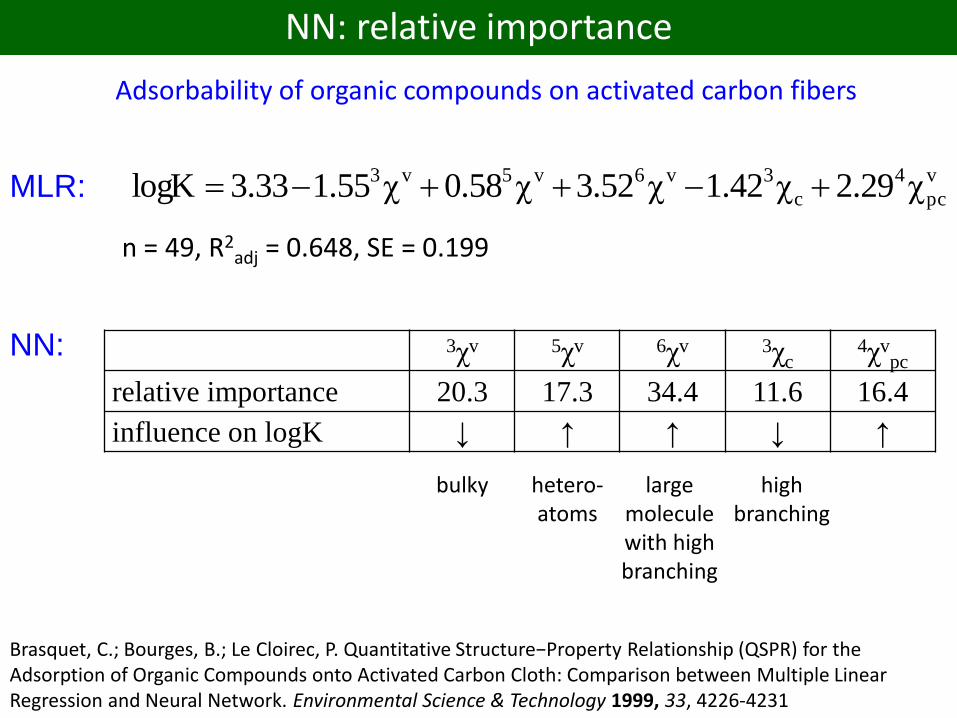
NN: relative importance
Brasquet, C.; Bourges, B.; Le Cloirec, P. Quantitative Structure−Property Relationship (QSPR) for the Adsorption of Organic Compounds onto Activated Carbon Cloth: Comparison between Multiple Linear Regression and Neural Network. Environmental Science & Technology 1999, 33, 4226-4231
Adsorbability of organic compounds on activated carbon fibers
v
pc
4
c
3v6v5v3 χ2.29χ1.42χ3.52χ0.58χ1.553.33logK
n = 49, R2adj = 0.648, SE = 0.199
3χv 5χv 6χv 3χc4χv
pc
relative importance 20.3 17.3 34.4 11.6 16.4
influence on logK ↓ ↑ ↑ ↓ ↑
MLR:
NN:
bulky large molecule with high branching
high branching
hetero-atoms
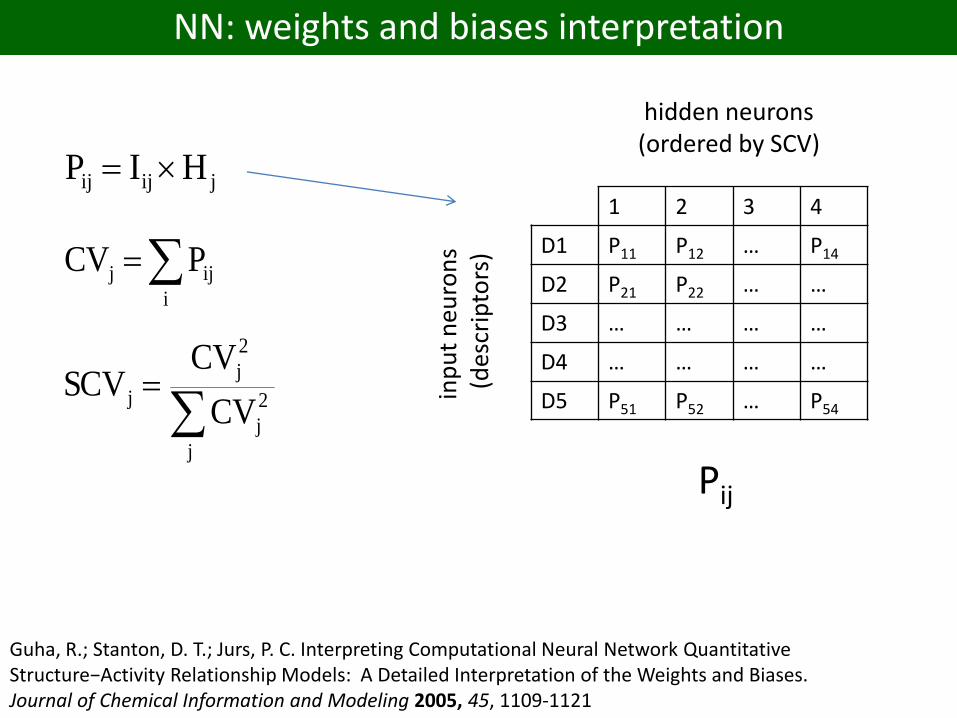
NN: weights and biases interpretation
Guha, R.; Stanton, D. T.; Jurs, P. C. Interpreting Computational Neural Network Quantitative Structure−Activity Relationship Models: A Detailed Interpretation of the Weights and Biases. Journal of Chemical Information and Modeling 2005, 45, 1109-1121
jijij HIP
i
ijj PCV
j
2
j
2
j
jCV
CVSCV
1 2 3 4
D1 P11 P12 … P14
D2 P21 P22 … …
D3 … … … …
D4 … … … …
D5 P51 P52 … P54
hidden neurons(ordered by SCV)
inp
ut
neu
ron
s (d
escr
ipto
rs)
Pij
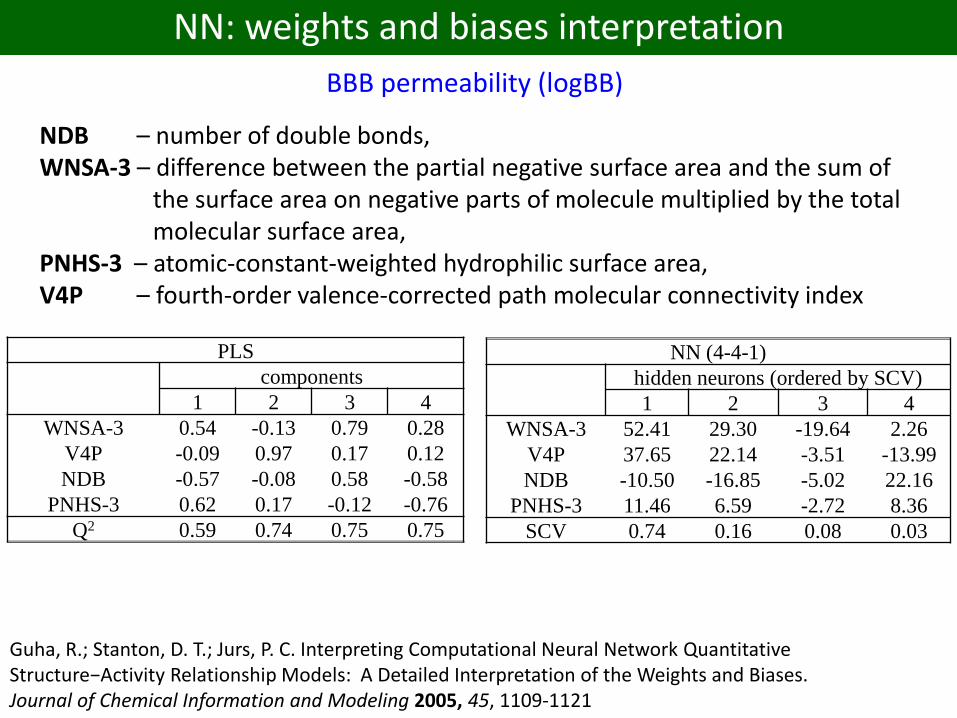
NN: weights and biases interpretation
NDB – number of double bonds, WNSA-3 – difference between the partial negative surface area and the sum of
the surface area on negative parts of molecule multiplied by the total molecular surface area,
PNHS-3 – atomic-constant-weighted hydrophilic surface area, V4P – fourth-order valence-corrected path molecular connectivity index
PLS
components
1 2 3 4
WNSA-3 0.54 -0.13 0.79 0.28
V4P -0.09 0.97 0.17 0.12
NDB -0.57 -0.08 0.58 -0.58
PNHS-3 0.62 0.17 -0.12 -0.76
Q2 0.59 0.74 0.75 0.75
Guha, R.; Stanton, D. T.; Jurs, P. C. Interpreting Computational Neural Network Quantitative Structure−Activity Relationship Models: A Detailed Interpretation of the Weights and Biases. Journal of Chemical Information and Modeling 2005, 45, 1109-1121
NN (4-4-1)
hidden neurons (ordered by SCV)
1 2 3 4
WNSA-3 52.41 29.30 -19.64 2.26
V4P 37.65 22.14 -3.51 -13.99
NDB -10.50 -16.85 -5.02 22.16
PNHS-3 11.46 6.59 -2.72 8.36
SCV 0.74 0.16 0.08 0.03
BBB permeability (logBB)

Random Forest (RF)
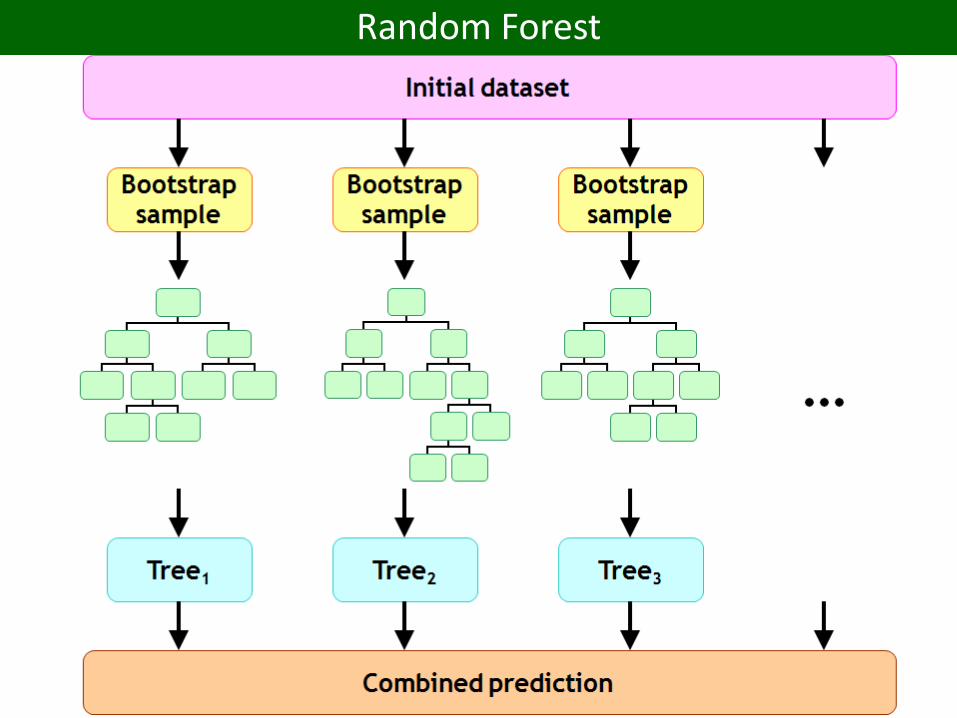
Random Forest
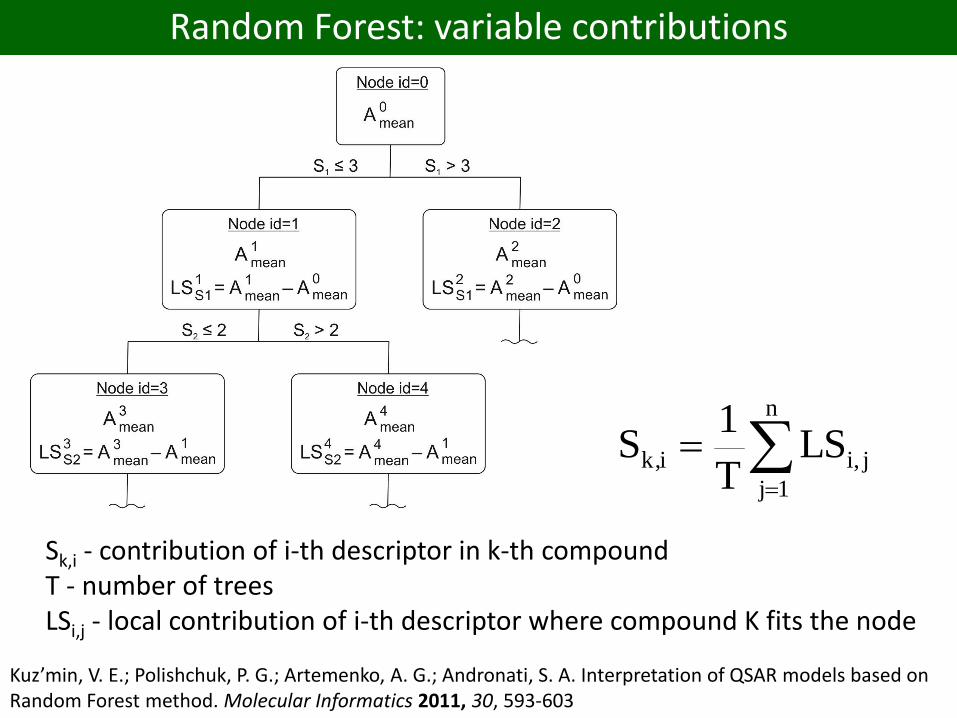
Random Forest: variable contributions
n
1j
ji,ik, LST
1S
Kuz’min, V. E.; Polishchuk, P. G.; Artemenko, A. G.; Andronati, S. A. Interpretation of QSAR models based on Random Forest method. Molecular Informatics 2011, 30, 593-603
Sk,i - contribution of i-th descriptor in k-th compoundT - number of treesLSi,j - local contribution of i-th descriptor where compound K fits the node
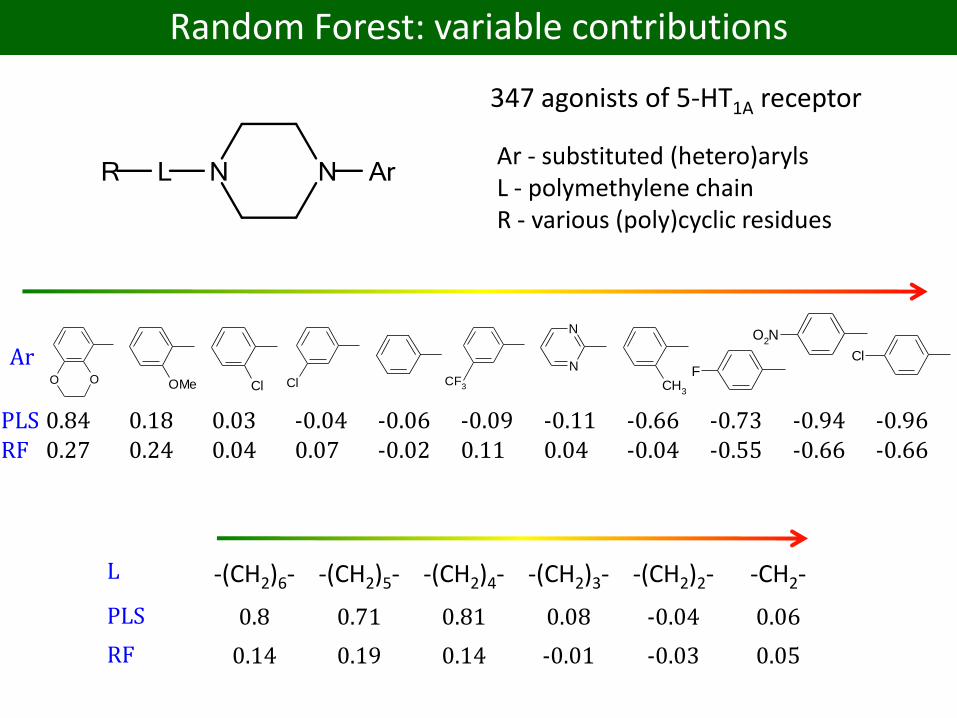
Random Forest: variable contributions
347 agonists of 5-HT1A receptor
Ar - substituted (hetero)arylsL - polymethylene chainR - various (poly)cyclic residues
O O OMe Cl Cl CF3
N
N
CH3
F
O2N
Cl
PLS 0.84 0.18 0.03 -0.04 -0.06 -0.09 -0.11 -0.66 -0.73 -0.94 -0.96RF 0.27 0.24 0.04 0.07 -0.02 0.11 0.04 -0.04 -0.55 -0.66 -0.66
Ar
L -(CH2)6- -(CH2)5- -(CH2)4- -(CH2)3- -(CH2)2- -CH2-
PLS 0.8 0.71 0.81 0.08 -0.04 0.06
RF 0.14 0.19 0.14 -0.01 -0.03 0.05

Outline
1. Models interpretability
2. Model-specific interpretation approaches
a) Linear models
b) Visualization of interpretation results
c) Non-linear models
d) Rule-extraction approaches
3. Model-independent interpretation approaches
4. Two interpretation paradigms
5. “Model → structure” interpretation approaches
6. Interpretation issues
7. Conclusion
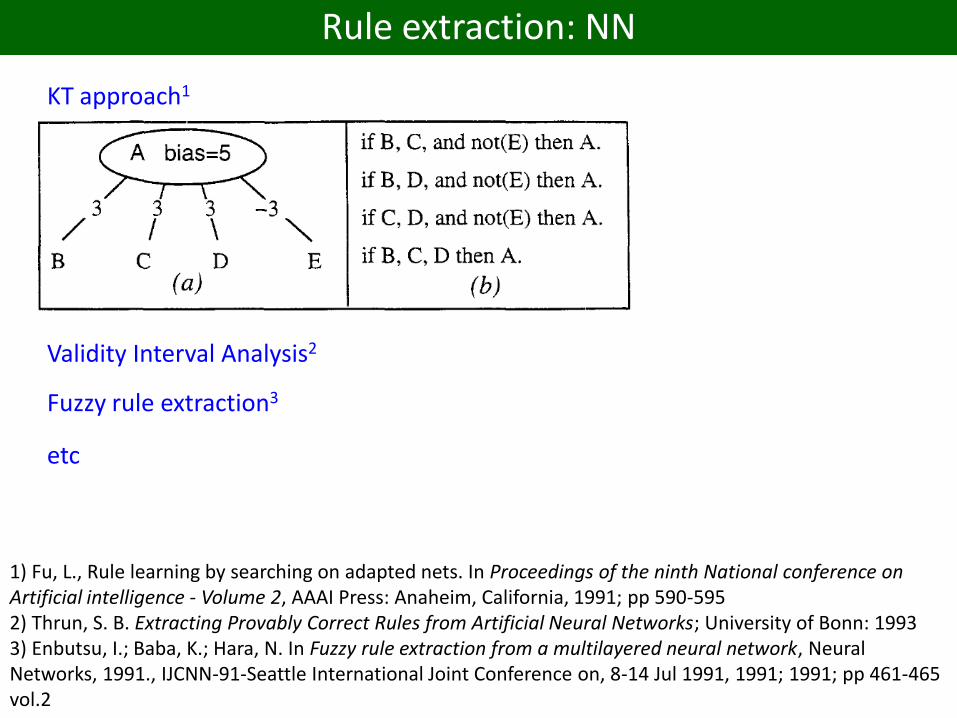
Rule extraction: NN
KT approach1
1) Fu, L., Rule learning by searching on adapted nets. In Proceedings of the ninth National conference on Artificial intelligence - Volume 2, AAAI Press: Anaheim, California, 1991; pp 590-5952) Thrun, S. B. Extracting Provably Correct Rules from Artificial Neural Networks; University of Bonn: 19933) Enbutsu, I.; Baba, K.; Hara, N. In Fuzzy rule extraction from a multilayered neural network, Neural Networks, 1991., IJCNN-91-Seattle International Joint Conference on, 8-14 Jul 1991, 1991; 1991; pp 461-465 vol.2
Validity Interval Analysis2
Fuzzy rule extraction3
etc
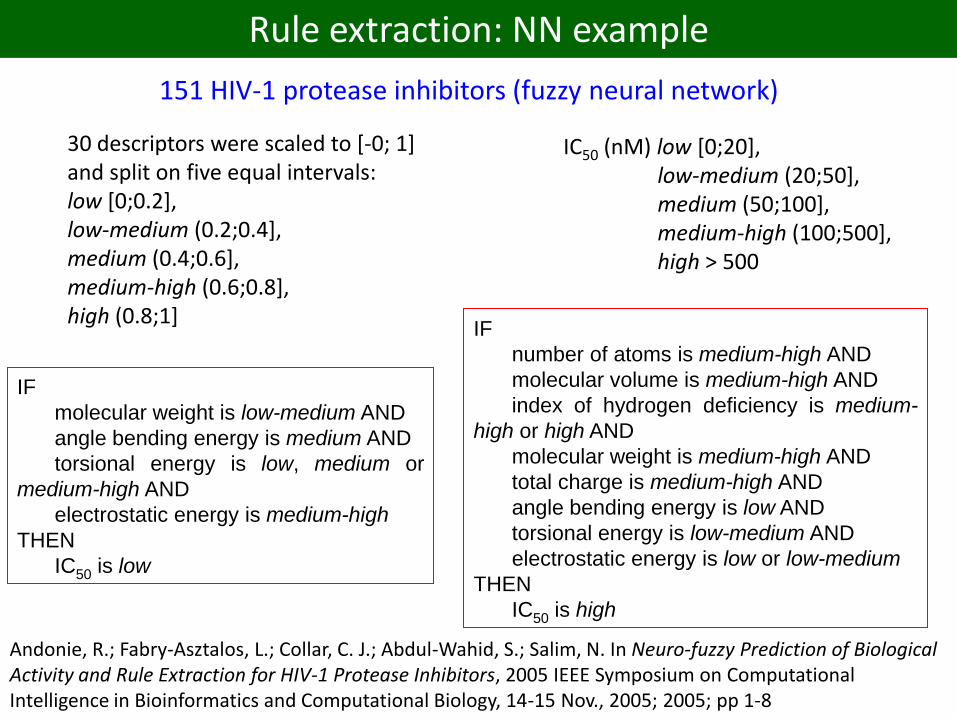
Rule extraction: NN example
151 HIV-1 protease inhibitors (fuzzy neural network)
30 descriptors were scaled to [-0; 1] and split on five equal intervals:low [0;0.2], low-medium (0.2;0.4], medium (0.4;0.6], medium-high (0.6;0.8], high (0.8;1]
Andonie, R.; Fabry-Asztalos, L.; Collar, C. J.; Abdul-Wahid, S.; Salim, N. In Neuro-fuzzy Prediction of Biological Activity and Rule Extraction for HIV-1 Protease Inhibitors, 2005 IEEE Symposium on Computational Intelligence in Bioinformatics and Computational Biology, 14-15 Nov., 2005; 2005; pp 1-8
IF
molecular weight is low-medium AND
angle bending energy is medium AND
torsional energy is low, medium or
medium-high AND
electrostatic energy is medium-high
THEN
IC50 is low
IC50 (nM) low [0;20], low-medium (20;50], medium (50;100], medium-high (100;500], high > 500
IF
number of atoms is medium-high AND
molecular volume is medium-high AND
index of hydrogen deficiency is medium-
high or high AND
molecular weight is medium-high AND
total charge is medium-high AND
angle bending energy is low AND
torsional energy is low-medium AND
electrostatic energy is low or low-medium
THEN
IC50 is high

Rule extraction: SVM
re-label
populate
Active learning based approach (ALBA)
rule induction(C4.5, etc)
Martens, D.; Baesens, B.; Gestel, T. V. Decompositional Rule Extraction from Support Vector Machines by Active Learning. IEEE Transactions on Knowledge and Data Engineering 2009, 21, 178-191
Rule extraction
Rule-extraction is not popular in chemoinformatics community
probably because relatively small number of descriptors with
clear meaning are required for modeling

Outline
1. Models interpretability
2. Model-specific interpretation approaches
a) Linear models
b) Visualization of interpretation results
c) Non-linear models
d) Rule-extraction approaches
3. Model-independent interpretation approaches
4. Two interpretation paradigms
5. “Model → structure” interpretation approaches
6. Interpretation issues
7. Conclusion
Model-independent approaches
1. Sensitivity analysis
2. Variable importance
3. Partial derivatives

Sensitivity analysis
68 inhibitors of dihydrofolate reductase
X - different substituents in positions 3, 4 or 5
log(1/K) = 0.95 MR5 + 0.89MR3 + 0.80MR4 - 0.21 MR42 +
1.58π3 - 1.77 log(β*10π3+1) + 6.65
Hansch analysis
So, S. S.; Richards, W. G. Application of neural networks: quantitative structure-activity relationships of the derivatives of 2,4-diamino-5-(substituted-benzyl)pyrimidines as DHFR inhibitors. Journal of Medicinal Chemistry 1992, 35, 3201-3207
MR3, MR4, MR5 - molar refraction of substituents in position 3, 4 or 5 π3 - lipophilicity of the substituent in position 3
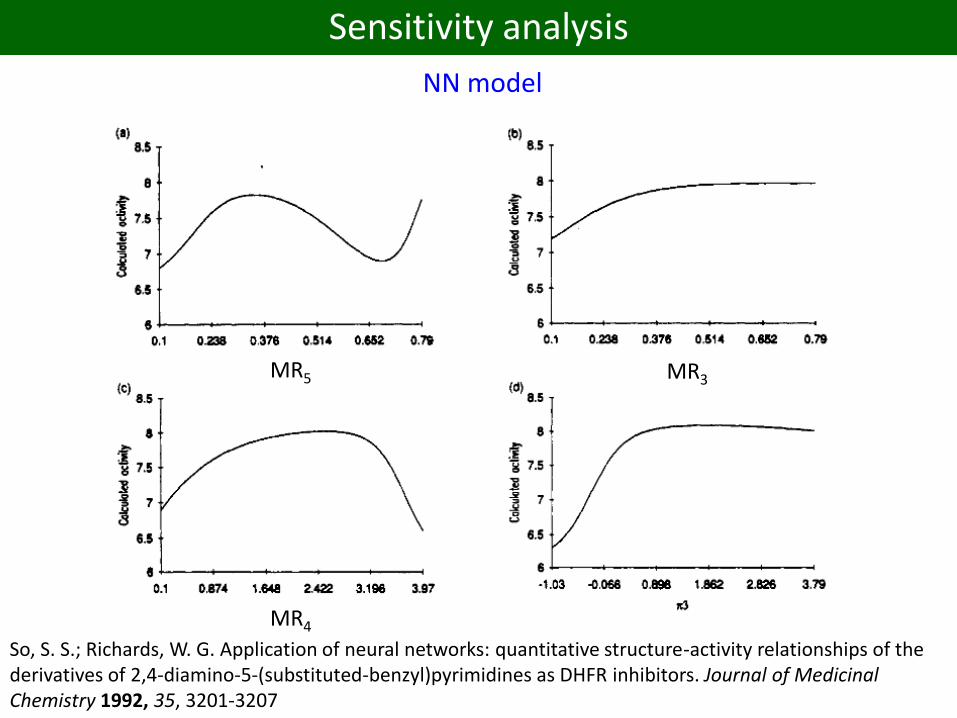
Sensitivity analysis
So, S. S.; Richards, W. G. Application of neural networks: quantitative structure-activity relationships of the derivatives of 2,4-diamino-5-(substituted-benzyl)pyrimidines as DHFR inhibitors. Journal of Medicinal Chemistry 1992, 35, 3201-3207
NN model
MR5 MR3
MR4
Sensitivity analysis
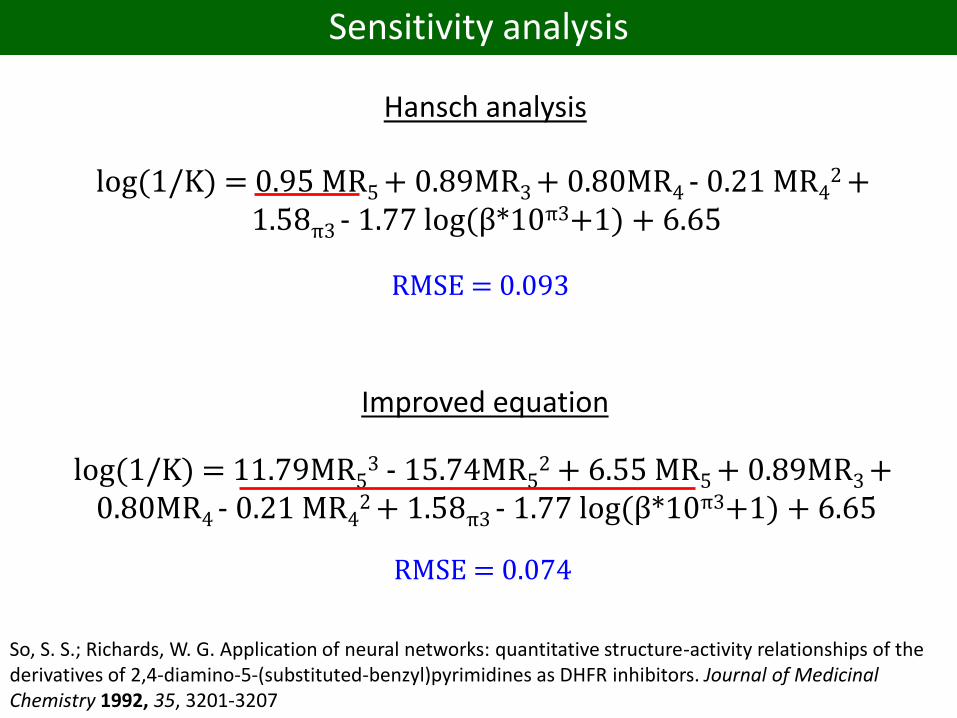
log(1/K) = 11.79MR53 - 15.74MR5
2 + 6.55 MR5 + 0.89MR3 +0.80MR4 - 0.21 MR4
2 + 1.58π3 - 1.77 log(β*10π3+1) + 6.65
log(1/K) = 0.95 MR5 + 0.89MR3 + 0.80MR4 - 0.21 MR42 +
1.58π3 - 1.77 log(β*10π3+1) + 6.65
Hansch analysis
Improved equation
So, S. S.; Richards, W. G. Application of neural networks: quantitative structure-activity relationships of the derivatives of 2,4-diamino-5-(substituted-benzyl)pyrimidines as DHFR inhibitors. Journal of Medicinal Chemistry 1992, 35, 3201-3207
RMSE = 0.093
RMSE = 0.074

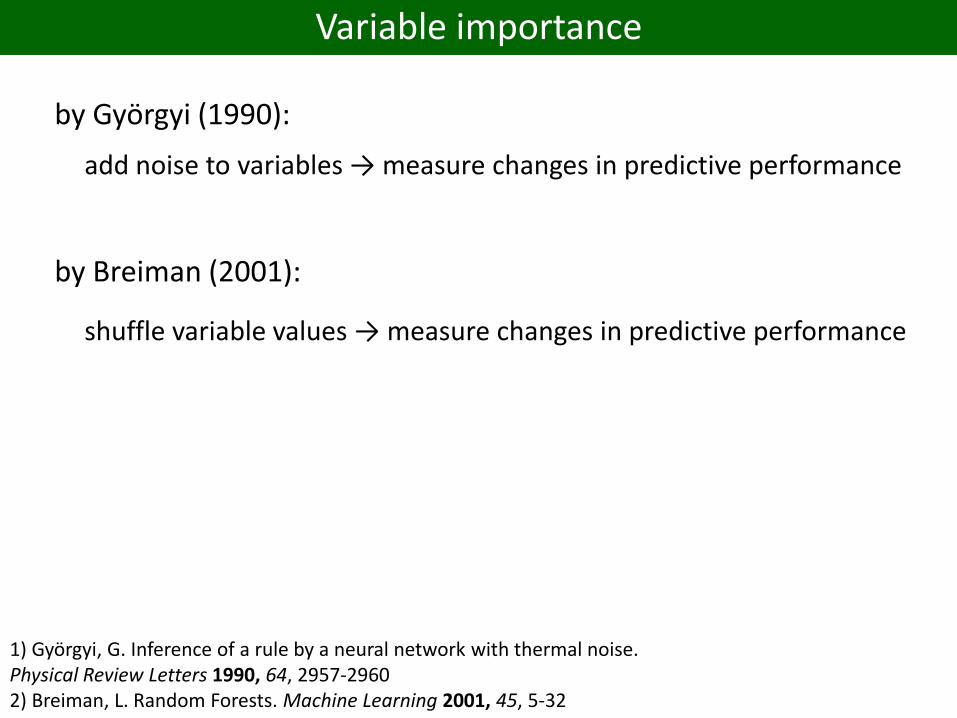
Variable importance
Variable importance
by Györgyi (1990):
add noise to variables → measure changes in predictive performance
by Breiman (2001):
shuffle variable values → measure changes in predictive performance
1) Györgyi, G. Inference of a rule by a neural network with thermal noise. Physical Review Letters 1990, 64, 2957-29602) Breiman, L. Random Forests. Machine Learning 2001, 45, 5-32
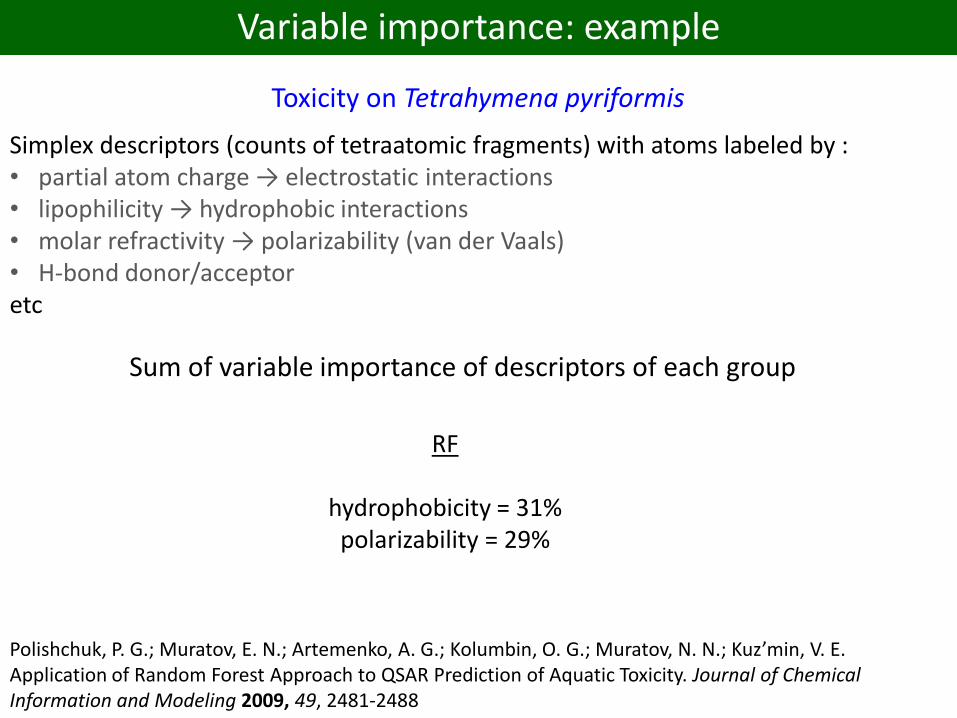
Variable importance: example
Polishchuk, P. G.; Muratov, E. N.; Artemenko, A. G.; Kolumbin, O. G.; Muratov, N. N.; Kuz’min, V. E. Application of Random Forest Approach to QSAR Prediction of Aquatic Toxicity. Journal of Chemical Information and Modeling 2009, 49, 2481-2488
Toxicity on Tetrahymena pyriformis
Simplex descriptors (counts of tetraatomic fragments) with atoms labeled by :• partial atom charge → electrostatic interactions• lipophilicity → hydrophobic interactions• molar refractivity → polarizability (van der Vaals)• H-bond donor/acceptoretc
Sum of variable importance of descriptors of each group
RF
hydrophobicity = 31%polarizability = 29%
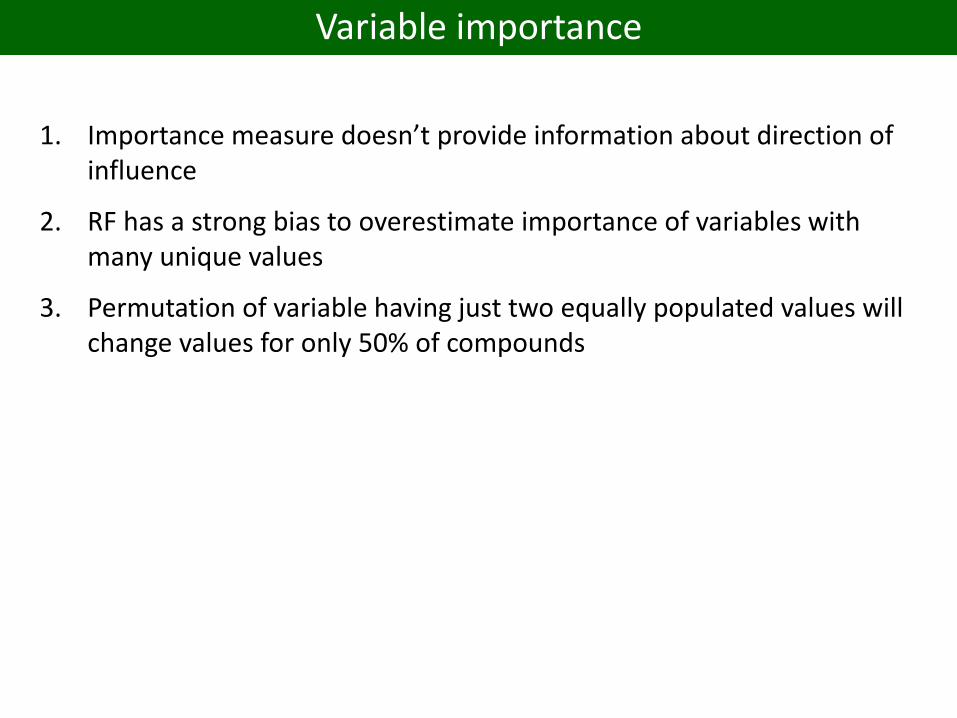
Variable importance
1. Importance measure doesn’t provide information about direction of influence
2. RF has a strong bias to overestimate importance of variables with many unique values
3. Permutation of variable having just two equally populated values will change values for only 50% of compounds

Partial derivatives

Partial derivatives
jijj
ji
(y)Hg)I(yfx
Y
for three-layer NN
f'(yj) and g'(y) are the differential functions of the activation functions in the second (hidden) layer and third (output) layer of the NN model, Iij and Hj are weights of connections between first and second layers and between second and third layers, correspondingly.
Aoyama, T.; Ichikawa, H. Neural networks as nonlinear structure-activity relationship analyzers. Useful functions of the partial derivative method in multilayer neural networks. Journal of Chemical Information and Computer Sciences 1992, 32, 492-500
13C-NMR chemical shifts for nonbornanes/nonbornenes
C1 C2 C3 C4 C5 C6 C7
exo -0.009 0.088 0.031 -0.111 -0.107 0.141 -0.213
endo 0.010 -0.088 -0.032 0.110 0.109 -0.141 0.214
NN model (8-12-2)
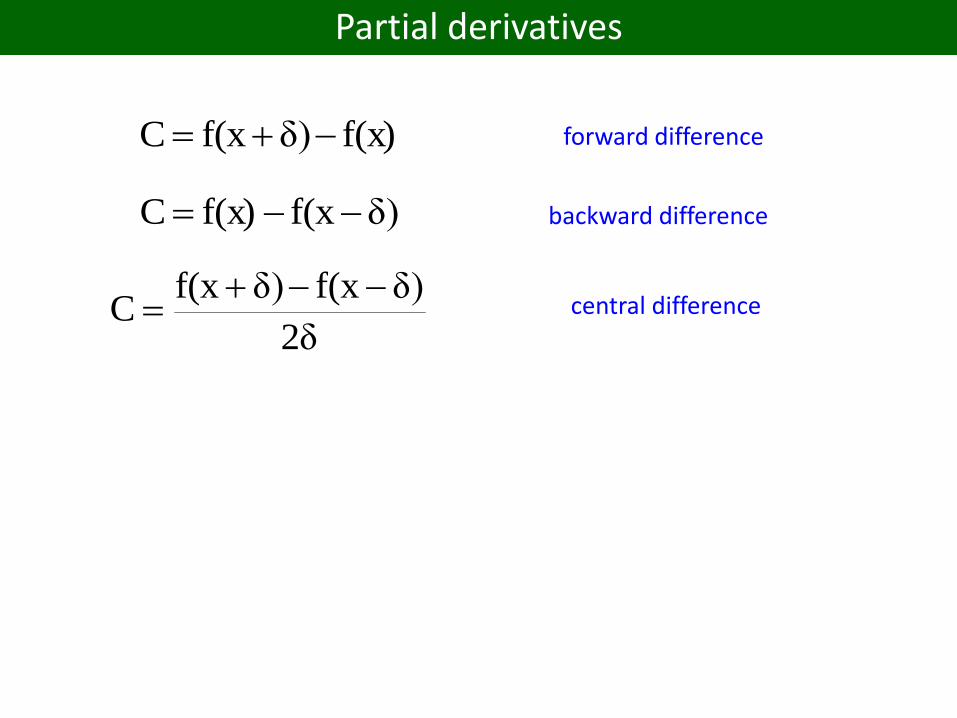
Partial derivatives
2δ
δ)f(xδ)f(xC
f(x)δ)f(xC
δ)f(xf(x)C
forward difference
backward difference
central difference

Partial derivatives: Thrombin inhibitors example
Franke, L.; Byvatov, E.; Werz, O.; Steinhilber, D.; Schneider, P.; Schneider, G. Extraction and Visualization of Potential Pharmacophore Points Using Support Vector Machines: Application to Ligand-Based Virtual Screening for COX-2 Inhibitors. Journal of Medicinal Chemistry 2005, 48, 6997-7004
Thrombin inhibitors
3-point pharmacophore
fingerprints
Ri = f(x(xi=1)) - f(x(xi=0))
Gly216
Asp189

Partial derivatives: Ames mutagenicity example
Carlsson, L.; Helgee, E. A.; Boyer, S. Interpretation of Nonlinear QSAR Models Applied to Ames Mutagenicity Data. Journal of Chemical Information and Modeling 2009, 49, 2551-2558
21
121
β2β
δ)(xfβ(x)fβδ)(xfβC
f’ - partial derivative calc by central differenceβ1, β2 - smoothing coefficients
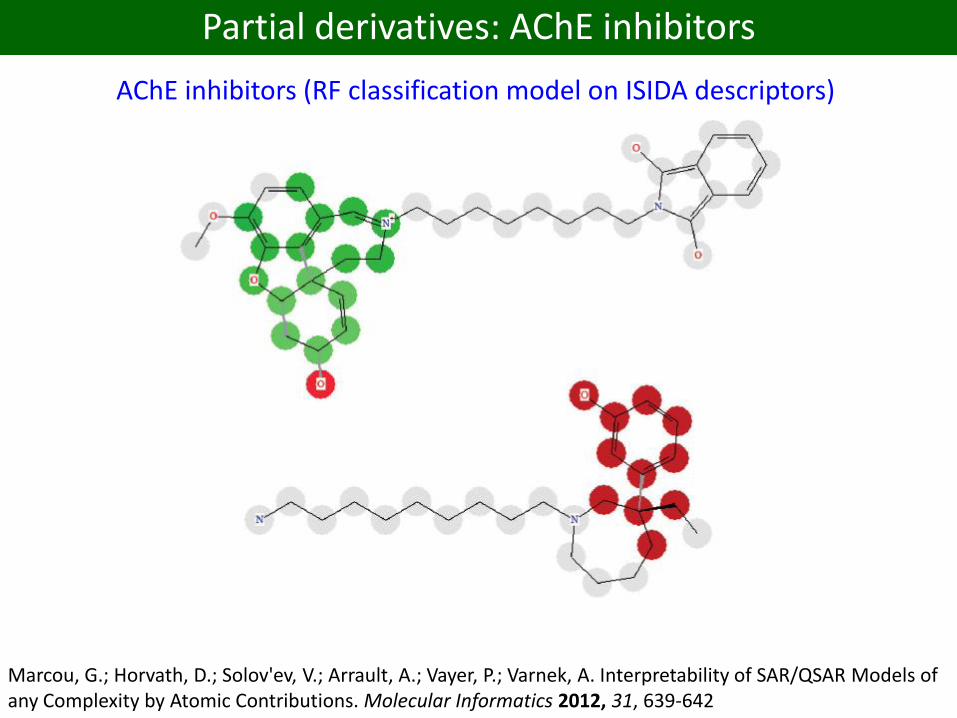
Partial derivatives: AChE inhibitors
AChE inhibitors (RF classification model on ISIDA descriptors)
Marcou, G.; Horvath, D.; Solov'ev, V.; Arrault, A.; Vayer, P.; Varnek, A. Interpretability of SAR/QSAR Models of any Complexity by Atomic Contributions. Molecular Informatics 2012, 31, 639-642
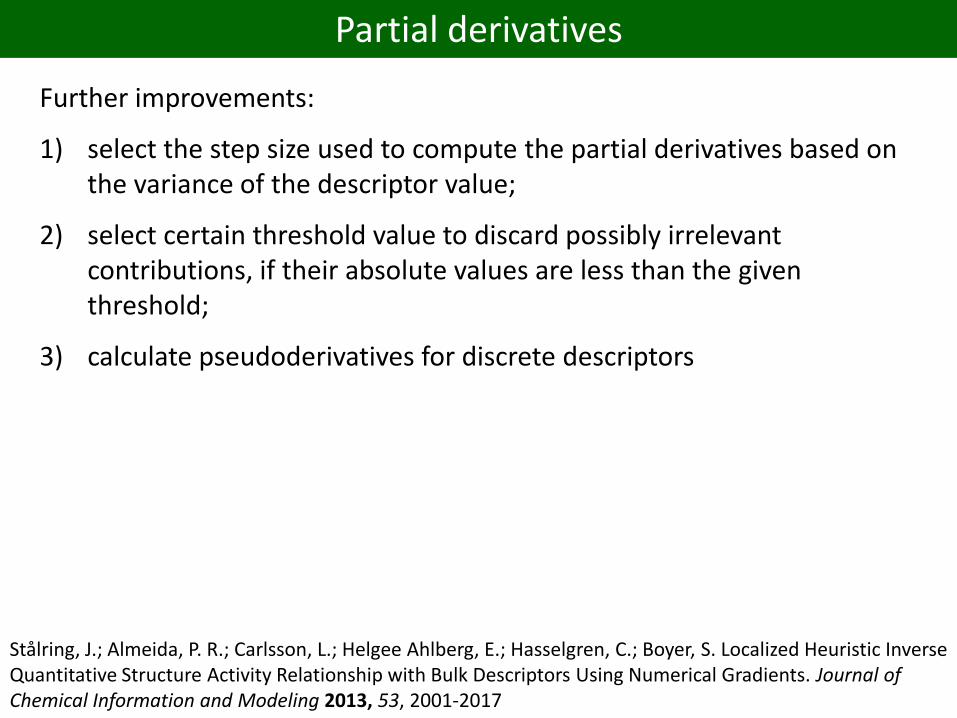
Partial derivatives
Further improvements:
1) select the step size used to compute the partial derivatives based on the variance of the descriptor value;
2) select certain threshold value to discard possibly irrelevant contributions, if their absolute values are less than the given threshold;
3) calculate pseudoderivatives for discrete descriptors
Stålring, J.; Almeida, P. R.; Carlsson, L.; Helgee Ahlberg, E.; Hasselgren, C.; Boyer, S. Localized Heuristic Inverse Quantitative Structure Activity Relationship with Bulk Descriptors Using Numerical Gradients. Journal of Chemical Information and Modeling 2013, 53, 2001-2017
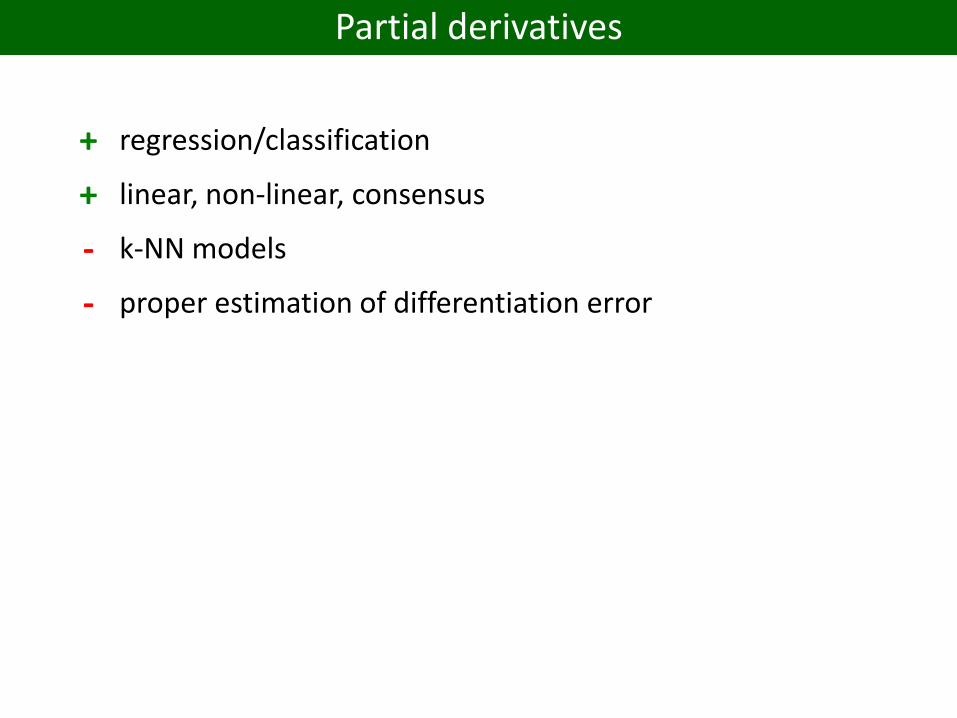
Partial derivatives
+ regression/classification
+ linear, non-linear, consensus
- k-NN models
- proper estimation of differentiation error

Outline
1. Models interpretability
2. Model-specific interpretation approaches
a) Linear models
b) Visualization of interpretation results
c) Non-linear models
d) Rule-extraction approaches
3. Model-independent interpretation approaches
4. Two interpretation paradigms
5. “Model → structure” interpretation approaches
6. Interpretation issues
7. Conclusion
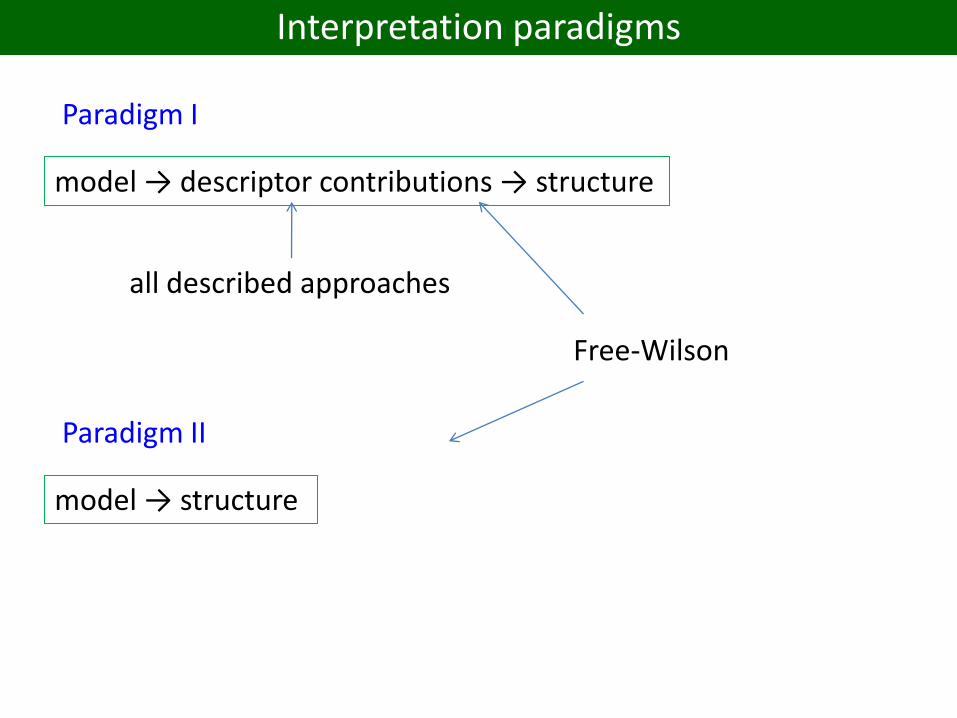
Interpretation paradigms
model → descriptor contributions → structure
Paradigm I
model → structure
Paradigm II
all described approaches
Free-Wilson

“Model → structure” paradigm
=–
A B C
Activitypred(A) Activitypred(B) Contribution(C)
f(A) = x f(B) = y W(C) = x – y
Polishchuk, P. G.; Kuz'min, V. E.; Artemenko, A. G.; Muratov, E. N. Universal Approach for Structural Interpretation of QSAR/QSPR Models. Molecular Informatics 2013, 32, 843-853
Outline
1. Models interpretability
2. Model-specific interpretation approaches
a) Linear models
b) Visualization of interpretation results
c) Non-linear models
d) Rule-extraction approaches
3. Model-independent interpretation approaches
4. Two interpretation paradigms
5. “Model → structure” interpretation approaches
6. Interpretation issues
7. Conclusion
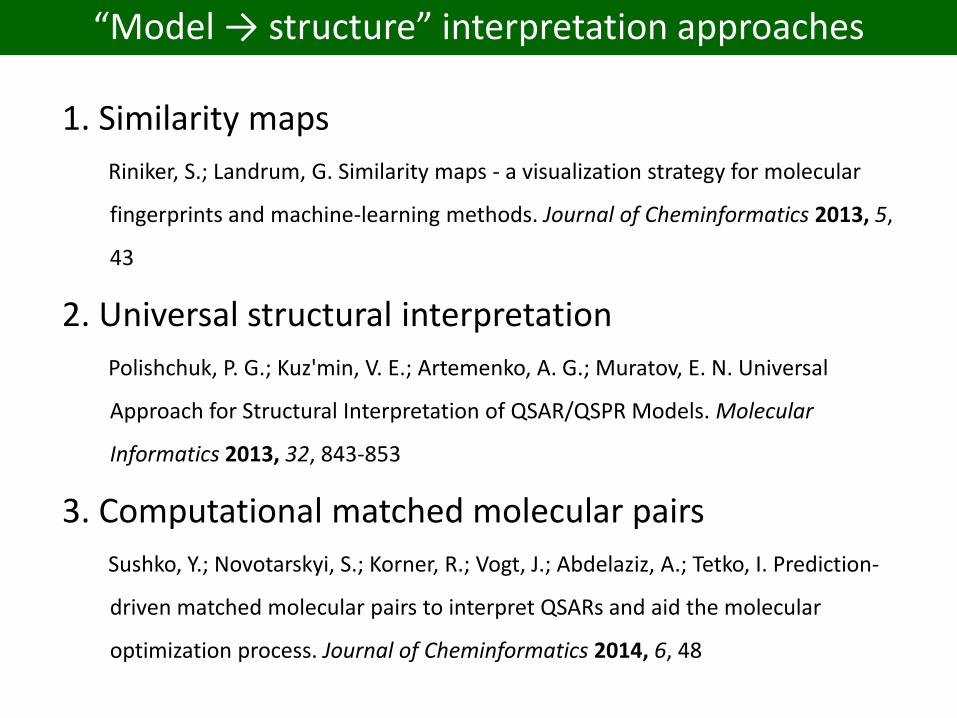
“Model → structure” interpretation approaches
1. Similarity maps
Riniker, S.; Landrum, G. Similarity maps - a visualization strategy for molecular
fingerprints and machine-learning methods. Journal of Cheminformatics 2013, 5,
43
2. Universal structural interpretation
Polishchuk, P. G.; Kuz'min, V. E.; Artemenko, A. G.; Muratov, E. N. Universal
Approach for Structural Interpretation of QSAR/QSPR Models. Molecular
Informatics 2013, 32, 843-853
3. Computational matched molecular pairs
Sushko, Y.; Novotarskyi, S.; Korner, R.; Vogt, J.; Abdelaziz, A.; Tetko, I. Prediction-
driven matched molecular pairs to interpret QSARs and aid the molecular
optimization process. Journal of Cheminformatics 2014, 6, 48
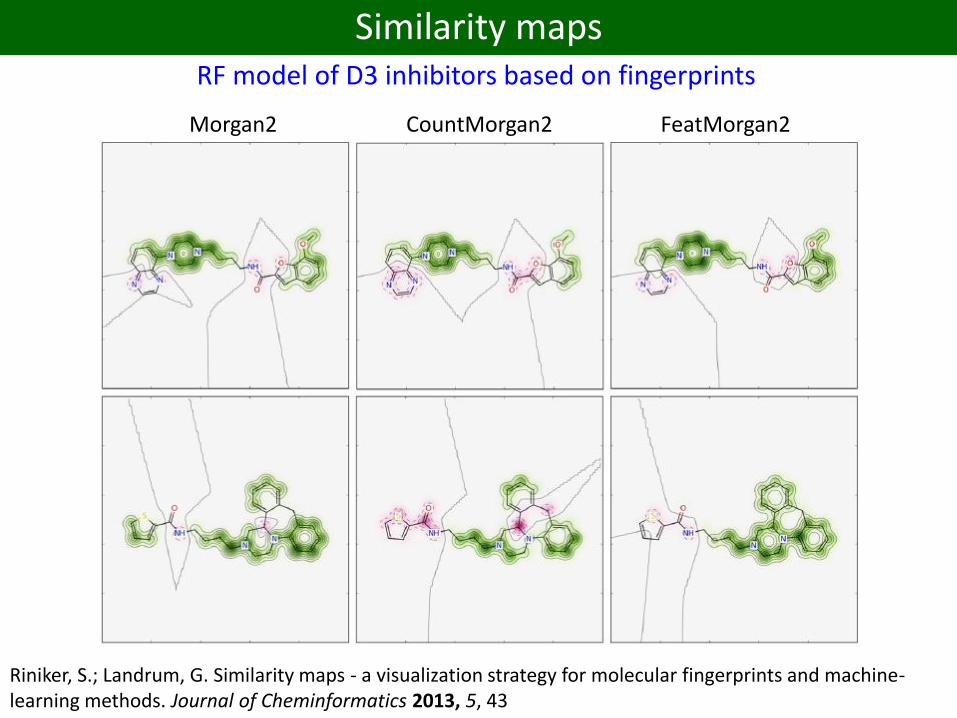
Similarity maps
Riniker, S.; Landrum, G. Similarity maps - a visualization strategy for molecular fingerprints and machine-learning methods. Journal of Cheminformatics 2013, 5, 43
RF model of D3 inhibitors based on fingerprints
Morgan2 CountMorgan2 FeatMorgan2

Universal structural interpretation

Universal structural interpretation
Comparison with Free-Wilson
R = H, CH3; R1 = H, CH3, C2H5; R2 = N(CH3)2,
N(C2H5)2, morpholino;
R3 = H, phenyl; R4 = nothing, -CONH-
unpublished results
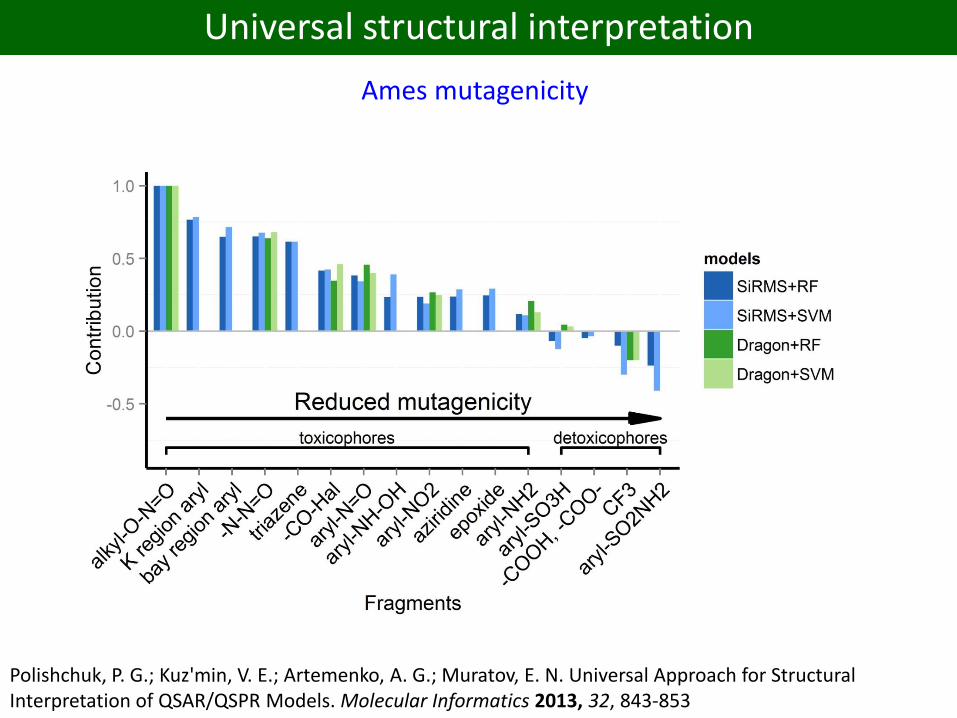
Universal structural interpretation
Ames mutagenicity
Polishchuk, P. G.; Kuz'min, V. E.; Artemenko, A. G.; Muratov, E. N. Universal Approach for Structural Interpretation of QSAR/QSPR Models. Molecular Informatics 2013, 32, 843-853

Universal structural interpretation
unpublished results
Acute oral toxicity on rats
?
?
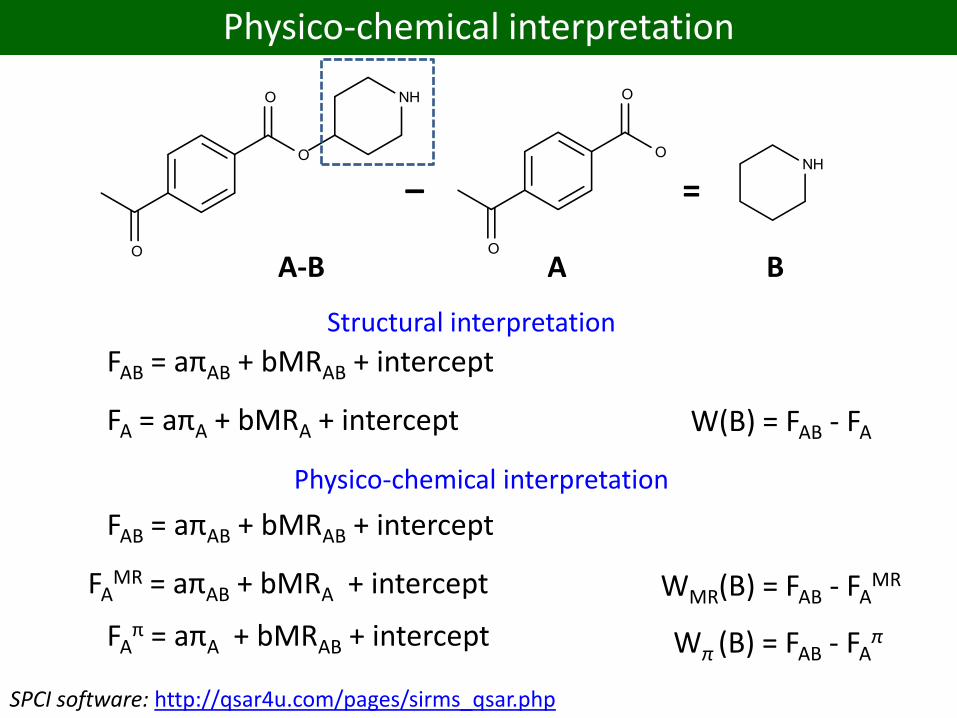
FAB = aπAB + bMRAB + intercept
Physico-chemical interpretation
=–
A-B A B
FA = aπA + bMRA + intercept
Structural interpretation
W(B) = FAB - FA
FAB = aπAB + bMRAB + intercept
FAMR = aπAB + bMRA + intercept
Physico-chemical interpretation
WMR(B) = FAB - FAMR
FAπ = aπA + bMRAB + intercept Wπ (B) = FAB - FA
π
SPCI software: http://qsar4u.com/pages/sirms_qsar.php

Physico-chemical interpretation
unpublished results
BBB permeability

Physico-chemical interpretation
unpublished results
RGD-peptidomimetic antagonists of fibrinogen receptor

Computationalmatched molecular pairs
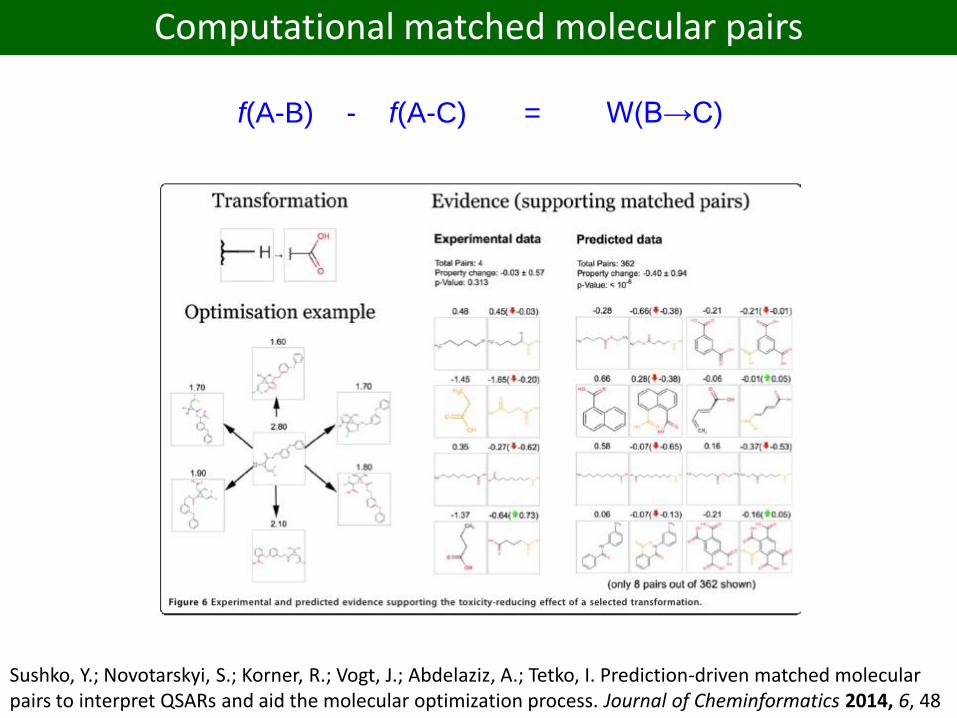
Computational matched molecular pairs
Sushko, Y.; Novotarskyi, S.; Korner, R.; Vogt, J.; Abdelaziz, A.; Tetko, I. Prediction-driven matched molecular pairs to interpret QSARs and aid the molecular optimization process. Journal of Cheminformatics 2014, 6, 48
f(A-B) - f(A-C) = W(B→C)
Computational matched molecular pairs
More suitable for optimization
Outline
1. Models interpretability
2. Model-specific interpretation approaches
a) Linear models
b) Visualization of interpretation results
c) Non-linear models
d) Rule-extraction approaches
3. Model-independent interpretation approaches
4. Two interpretation paradigms
5. “Model → structure” interpretation approaches
6. Interpretation issues
7. Conclusion
Issues in model interpretation
0. Dependence of interpretation results on a modeling dataset.
1. Significance of calculated contributions.
2. Reasonable selection of fragments.
3. Expectation from interpretation of QSAR models of differentend-points.
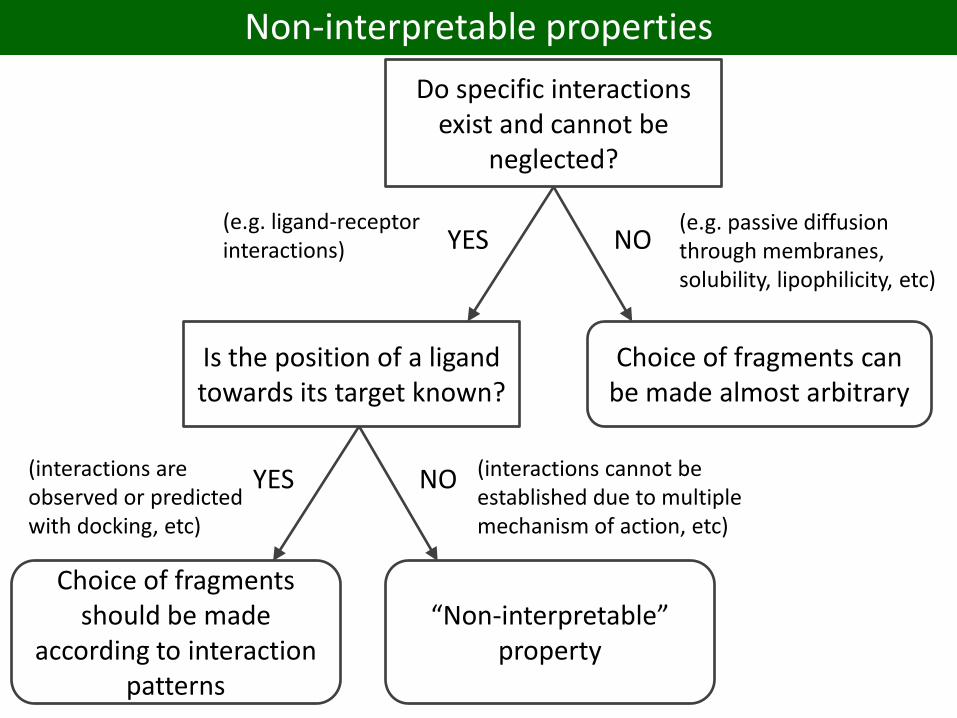
Non-interpretable properties
Do specific interactions exist and cannot be
neglected?
Is the position of a ligand towards its target known?
YES NO(e.g. passive diffusion through membranes, solubility, lipophilicity, etc)
Choice of fragments can be made almost arbitrary
(e.g. ligand-receptor interactions)
YES NO
Choice of fragments should be made
according to interaction patterns
“Non-interpretable” property
(interactions are observed or predicted with docking, etc)
(interactions cannot be established due to multiple mechanism of action, etc)

Outline
1. Models interpretability
2. Model-specific interpretation approaches
a) Linear models
b) Visualization of interpretation results
c) Non-linear models
d) Rule-extraction approaches
3. Model-independent interpretation approaches
4. Two interpretation paradigms
5. “Model → structure” interpretation approaches
6. Interpretation issues
7. Conclusion

Descriptors
interpretable non-interpretable
Models ordinary
regression
regression coefficients
(Hansch, Free-Wilson)
universal structural
interpretation
PLS (OPLS,
O2PLS, etc)
regression coefficients,
X-scores, variable importance
decision trees logical rules
NN variable importance based on weights
and biases
RF variable contributions
NN, SVM, RF rule extraction,
partial derivatives,
variable importance based on
permutation
consensus and
any other models
partial derivatives,
variable importance based on
permutation,
sensitivity analysis;
universal structural interpretation
Interpretation paradigm model → (descriptor) → structure model → structure
Models vs. descriptors interpretability
There are no non-interpretable models
but there are non-interpretable properties