international banking and liquidity risk transmission ...international banking and liquidity risk...
TRANSCRIPT
This paper presents preliminary findings and is being distributed to economists and other interested readers solely to stimulate discussion and elicit comments. The views expressed in this paper are those of the authors and do not necessarily reflect the position of the Federal Reserve Bank of New York or the Federal Reserve System. Any errors or omissions are the responsibility of the authors.
Federal Reserve Bank of New York Staff Reports
International Banking and Liquidity Risk Transmission: Lessons from across Countries
Claudia M. Buch Linda S. Goldberg
Staff Report No. 675
May 2014

International Banking and Liquidity Risk Transmission: Lessons from across Countries Claudia M. Buch and Linda S. Goldberg Federal Reserve Bank of New York Staff Reports, no. 675 May 2014 JEL classification: G01, F34, G21
Abstract Activities of international banks have been at the core of discussions on the causes and effects of the international financial crisis. Yet we know little about the actual magnitudes and mechanisms for transmission of liquidity shocks through international banks, including the reasons for heterogeneity in transmission across banks. The International Banking Research Network, established in 2012, brings together researchers from around the world with access to micro-level data on individual banks to analyze issues pertaining to global banks. This paper summarizes the common methodology and results of empirical studies conducted in eleven countries to explore liquidity risk transmission. Among the main results is, first, that explanatory power of the empirical model is higher for domestic lending than for international lending. Second, how liquidity risk affects bank lending depends on whether the banks are drawing on official-sector liquidity facilities. Third, liquidity management across global banks can be important for liquidity risk transmission into lending. Fourth, there is substantial heterogeneity in the balance sheet characteristics that affect banks’ responses to liquidity risk. Overall, balance sheet characteristics of banks matter for differentiating their lending responses, mainly in the realm of cross-border lending. Key words: international banking, liquidity, transmission, central bank liquidity, uncertainty, regulation, crises _________________
Corresponding author: Goldberg, Federal Reserve Bank of New York (e-mail: [email protected]), Buch: Magdeburg University, Halle Institute for Economic Research, CESifo (e-mail: [email protected]). The authors thank participants of the International Banking Research Network, in particular James Chapman and Matthieu Bussiere, for many thoughtful exchanges and contributions. They also thank Arun Gupta, Florian Hüfner, and Lena Tonzer for highly efficient research assistance. The views expressed in this paper are those of the authors and do not necessarily reflect the position of the Federal Reserve Bank of New York or the Federal Reserve System.

1
1 Background and Motivation
In the past decades, banking has become global and the ratio of credit over GDP has
surged. Banking systems are much larger than they used to be and have a greater exposure to
international shocks. Internationally active banks have thus been at the core of discussions on
the causes and effects of the international financial crisis. Policymakers have stated their
intention “to manage capital flows in order to deal with the risks and reap the benefits of
cross-border capital flows”, recognizing that “central banks play a major role in addressing
global liquidity shocks”.1 Yet, we know relatively little about the actual transmission of
balance sheet shocks through international banks, about which banks are affected most, and
about the effectiveness of interventions by governments and central banks in domestic and
international contexts.
The papers compiled in this symposium thus address four main questions: First, how do
liquidity conditions affecting the parent bank transmit into domestic and foreign lending for
different types of banks? Second, how does the ex-ante balance sheet composition of banks
(for example, capitalization, liquid asset shares, deposit funding) influence cross-sectional
responses to liquidity risk? Third, what role does internal liquidity management in banks,
achieved through borrowing and lending across affiliated domestic and foreign offices, play in
magnifying or damping lending effects of liquidity risk? Fourth, did the use of official sector
liquidity provision influence the cross-sectional differences across banks in domestic and
foreign lending?
Many of these questions cannot be answered using data that are aggregated or semi-
aggregated across all banks participating in an economy. Careful analysis of the transmission
of shocks through internationally active banks requires micro-data on individual banks and
perhaps markets. While the corresponding bank-level micro data are aggregated and used as
an input to the International Banking Statistics of the Bank for International Settlements
(BIS), the bank-level data are confidential and cannot be merged together across countries for
analytical work.
1 See Communiqué of the G20 Finance Ministers and Central Bank Governors, Paris, October 15, 2011. On the role of public sector liquidity provision during crises, see also Committee on the Global Financial System (2011).

2
For these reasons, the International Banking Research Network (IBRN) was
conceptualized and then established in 2012 by central bank researchers and academics from
Austria, Germany, the United Kingdom, and the United States. In 2013, the IBRN expanded
to include researchers from Australia, Canada, France, Hong Kong, Ireland, Italy, Poland, and
Spain, with representatives of the BIS and the IMF engaged in IBRN discussions. The
network brings together researchers with access to their country’s bank-level data to analyze
issues pertaining to global banks. The participants analyze bank-level datasets by country and
share empirical results and insights (not data). The resulting research yields comparable cross-
country evidence on a topic from different banking system perspectives and with the benefits
of delving into the reasons for heterogeneity within and across countries.
The papers included in this symposium focus on one specific theme, namely the exposure
of banks to liquidity shocks and the resulting impact of liquidity shocks on bank lending, both
domestically and abroad. More specifically, 11 country studies use data for the period from
2006 through 20132 and focus on the question of how liquidity shocks transmit into bank
lending and which balance sheet characteristics shape this transmission. All papers use a
common research methodology wherein changes in different types of lending are regressed on
balance sheet characteristics, measures of liquidity risk, and information on public
interventions. If relevant data are available, IBRN researchers explore the effects of official
sector policy interventions, such as bank-specific use of special lending facilities. The datasets
available at the national level differ with regard to their granularity, but they allow the
researchers to combine information on flows of funds through banks with balance sheet
characteristics of banks. Beyond applying a common analytical framework, each country
contribution provides a narrative which is specific to its national experience. Some examples
are the importance of the Vienna Initiative for Austrian banks (Segalla 2014), the distinction
between foreign branches and subsidiaries for German banks (Kerl and Koch 2014), or the
importance of foreign exchange loans for Poland (Pawlowska et al. 2014). Countries have
banks also play different roles in international financial markets. For example, Ireland
(Everett et al. 2014) and Poland are largely hosts to foreign-owned banks while the United
States (Correa et al. 2014), Germany, and the United Kingdom (Hills et al. 2014) are the
homes of many banks with foreign affiliates.
2 Countries providing research contributions to the initiative in 2013 are: Australia, Austria, Canada, France, Germany, Hong Kong, Ireland, Italy, Poland, the United Kingdom, and the United States.

3
We set up a meta analysis in order to summarize the results of the 11 studies. Meta
analyses characterize the results across empirical studies by asking which features of the
regression sample affect an outcome or the explanatory power of a particular empirical model
(Boockmann 2010, Card and Krueger 1995, Doucouliagos and Stanley 2008). The empirical
studies we summarize are very homogenous across countries because all teams used the same
baseline regression model, even if the variable definitions and samples of banks can differ
along specific dimensions. Hence, we do not have to deal with issues such as publication bias
which affect meta analyses that draw on published research only. Within our meta analysis,
we use the probability that the effect of a particular variable has a significant impact on
lending as a function of variables such as the number of banks included, the type of banking
activity (domestic versus cross-border lending versus lending internal to the organization), or
the type of banks (those with versus without foreign affiliates).
The studies show that the lending responses of domestic banks (those without foreign
affiliates) to liquidity risk do not depend on banks’ balance sheet characteristics in a
consistent way across countries. By contrast, the studies find interesting distinctions across
global banks (those with foreign affiliates) in transmission of liquidity risk into lending.3 The
meta analysis identifies the following tendencies in liquidity risk transmission:
• Across regression specification, explanatory power is higher when the dependent variable
is domestic loan growth, compared with specifications focussed on intra-bank net lending
or cross-border lending.
• How liquidity risk affects lending of banks with different balance sheet structures depends
on the time period considered. Responses in more “normal” periods, when banks are not
accessing official liquidity facilities, differ from those in periods when banks access these
facilities. Bank use of official liquidity facilities tends to replace funding support drawn
from affiliated offices.
• Internal capital market activity within banks matters for lending stability. Banks operating
within host markets support lending to a greater degree in times of increased liquidity risk
if the banks have higher net borrowing from (or lower net lending to) the rest of their
organizations.
3 Depending on the country, these banks can be domestically-owned with affiliates located outside of their country, or they can be foreign-owned banks operating in a country that is largely a host for the global banks.

4
• While balance sheets factors sometimes drive cross-sectional differences in domestic
lending growth by banks, balance sheet factors matter most consistently for cross-border
lending growth changes in response to liquidity risk conditions. It is noteworthy, however,
that no single balance sheet factor drives lending results in the same way across all
countries.
In Section 2, we provide descriptive statistics on the evolution of international banking
during the crisis. Section 3 briefly summarizes previous literature in the field and lays out the
common empirical methodology. Section 4 summarizes the main results from meta-analysis
study. Section 5 concludes, also stressing that the meta analysis is a complement to, but not a
substitute for, the rich insights include in the individual country analyses contained within the
papers of the symposium.
2 The Big Picture
The past decades have witnessed a significant increase in bank credit, both domestically
and across borders. This expansion of international credit has come to an abrupt halt since the
outbreak of the financial crisis in 2007/2008. Between 2000 and 2007, the ratio of credit over
GDP expanded from close to 100% to an average of 120% in the countries under study; at the
end of 2012, it stood at an even higher 125% of GDP. Cross-border credit, in contrast,
doubled from about 30% to 66% of GDP before the crisis but declined to 55% subsequently.4
These findings are consistent with observations that global liquidity fell more than domestic
liquidity in the wake of the crisis (BIS CGFS 2011), but also has not fully recovered.
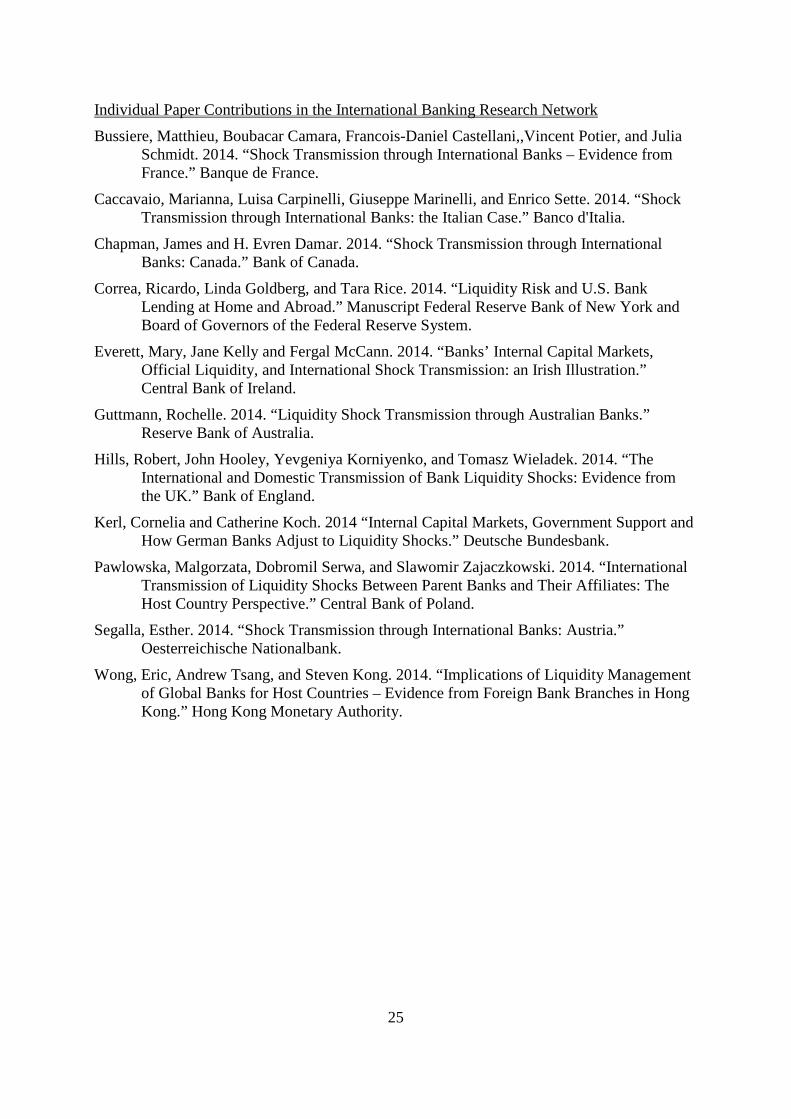
Data on cross-border banking activities as provided by the Bank for International
Settlements (BIS) are particularly useful for illustrating some of the dynamics of the crises
(Figure 1). While lending to bank and nonbank counterparties sharply contracted initially,
bank-to-bank lending has remained at lower levels while the lending to private non-bank
customers rebounded more quickly. The build up of cross-border assets before the crisis and
the subsequent withdrawal from foreign markets, as also reflected in stocks of outstanding
4 Data on annual net domestic credit (IFS line 32) and GDP are taken from the IMF and The World Bank. To convert net domestic credit from local currency to US-Dollar, we construct the annual exchange rate as implied by the conversion of GDP in local currency to GDP in US-Dollar. Data on cross-border credit are taken from the BIS Locational Banking Statistics. The corresponding numbers using the Consolidated Banking Statistics increased from 30% to 61% of GDP before the crisis and declined subsequently to 56%.

5
claims (Figure 2), look very similar for all BIS reporting countries and the IBRN countries
represented in this symposium.
However, looking behind the aggregate patterns reveals quite distinct trends across
countries (not shown). Cross-border bank flows for Germany, Ireland, and the United
Kingdom show patterns roughly in line with those seen in the aggregate data. France and the
United States exhibit similar general patterns, but the data are somewhat more volatile. Some
smaller countries in our sample look quite distinct: Australian banks, for instance, did not
build up foreign assets before the crisis, while the country experienced quite significant in-
and outflows of bank assets during the crisis. Also, Canadian banks did not increase their
exposure to foreign countries before the crisis, but these banks invested abroad at a fairly
large scale during the crisis (Chapman and Damar 2014). Italian banks moderately invested
abroad before the crisis, while in- and outflows of the Italian banking system became more
volatile after the outbreak of the crisis.
It is important to understand the driving forces and dynamics of both domestic and
international lending. If banks withdraw from international markets at a large scale, this may
reduce their ability to hedge domestic country idiosyncratic risk, but it may also increase their
resilience against global shocks. Adjustment of domestic lending ultimately affects the
financing conditions for domestic firms. Analyzing the relative adjustment of domestic and
international lending and the bank-specific features that drive this adjustment requires bank-
level data.
Figure 3 compares the evolution of loans to different counterparties, using some of the
data from the country-specific regressions in this symposium. In order to compare data across
countries, all (nominal) series in US-dollar are indexed to 100 for the beginning of the period
(2006). In terms of domestic loans, the time series are relatively flat for Germany and rose
before dropping back and recovering in late 2008 into 2009 for the United States. Data for
Ireland, in contrast, show a longer and deeper boom-bust-cycle as domestic lending increased
before the crisis, to be followed by a contraction through 2011. In Canada and, even more
pronounced, in Poland, domestic lending has increased throughout.
Foreign loans by banks follow different patterns than domestic loans. The boom-bust-
cycle is again quite pronounced for Ireland’s banks. Canadian banks increased foreign loans
during the period when US foreign loans contract, with a common growth trajectory
afterwards. German and Polish banks have contracted their foreign loans. In this sense, the

6
withdrawal from foreign markets during the crisis has been a European phenomenon. This
increasing “home bias” is stressed by the country studies for British and German banks (Hills
et al. 2014, Kerl and Koch 2014).
Finally, two panels show the pattern of net lending between banks and their affiliates,
separately displayed due to the differences in scales of change for the U.S. and German banks
as compared with the Ireland and Canada banks. First, observe that banks in all four countries
were net debtors relative to their affiliates at least through 2010. These affiliates served as net
funding sources, not for all banks within each country, but for all these countries overall
during the early sample period. Net volumes through internal capital markets varied
considerably over time, particularly for Canada and Ireland, and even reversed direction on
balance for the U.S. and Irish banks.
3 Theoretical Background and Empirical Method
The papers in this symposium ask two main research questions: First, how does liquidity
risk affect banking lending, both at home and abroad? Second, how does this response differ
across banks and countries? These questions are not new – they are, in fact, at the heart of
studies analyzing the impact of the banking system on the real economy – but previous
literature could not answer these questions from a comparative cross-country perspective. In
this section, we thus explain how research in the IBRN adds to previous literature and how we
tackle the issue of identifying shock transmission through internationally active banks.
3.1 Previous Literature
Until recently, research on international banking has been a relatively underdeveloped
field in international economics and international business. This reflects the lack of a
consistent theoretical framework to analyze international banking activities. But it also
reflects a lack of access to relevant bank-level data. In recent years, theoretical and empirical
research on international banking has made significant progress.
Two strands of theoretical literature are particularly relevant for the research conducted
in the IBRN. The first deals with the effects of the integration of banking markets for financial
stability. In their seminal work on the contagious effects of liquidity shocks, Allen and Gale
(2000) show that the link between financial integration and the risk of financial contagion is

7
highly non-linear: the risk of contagion is greatest in partially integrated banking markets with
an incomplete network of interbank linkages. Subsequent research has enriched the baseline
model by including asset price shocks, by analyzing the role of publicly provided liquidity, or
by examining the impact of systemic shocks. Generally, this literature shows that the risk of
financial contagion is greatest when banks’ liquidity buffers are depleted and the stronger the
common (liquidity) shock.
This literature on financial contagion takes the degree of integration of international
banking markets as given or does not address this dimension at all. Issues relevant for the
transmission of shocks such as the decision of banks to lend across borders or to set up
affiliates abroad are not studied. For these reasons, a new research field has developed which
successfully applies insights from international economics to international banking (Goldberg
2007). The essence of this literature is that internationalization choices of banks are strongly
driven by bank size and productivity, and that only the large and productive banks can afford
the fixed costs of entering foreign markets.5 Size effects also feature prominently in
applications of gravity models to international banking (Brueggemann et al. 2012, Niepmann
2013, Okawa and van Wincoop 2012).
Empirical studies have shifted focus to the transmission of shocks through
internationally active banks.6 Peek and Rosengren (1997, 2000) documented the transmission
of asset price shocks originating in Japan to the United States, exploiting the fact that these
shocks were exogenous to the banks affected and that the presence of Japanese banks in the
United States varied across regions. In terms of the bank-level characteristics that affect shock
transmission, recent literature has provided at least two main insights. First, balance sheet
strength matters. Several studies show that access to a stable funding base of (local) deposits
and the strength of the capital buffer of the (foreign) parent bank can affect the stability of
local lending.
Second, domestic and international banks behave differently. Multinational banks
actively use internal capital markets to manage liquidity (Cetorelli and Goldberg 2012a). In
the financial crisis, foreign banks with a high exposure to the subprime crisis reduced internal
5 See De Blas and Russ (2013) for a theoretical analysis of banks’ internationalization choices; Buch et al. (2011) for an empirical analysis using German data. Buch and DeLong (2012) provide a comprehensive survey of literature on cross-border bank mergers. 6 See also Acharya et al. (2013) or Dietrich and Vollmer (2010).

8
funds available for their affiliates in the US, leading to relative weaker lending by these
affiliates (Cetorelli and Goldberg 2012b). Purely domestic banks were more isolated from the
crisis and showed more stable lending patterns than multinational banks (Claessens and van
Horen 2012, De Haas and van Lelyveld 2011), reflecting different business models and
different customer bases. Hale et al. (2013), using data on international syndicated bank
lending to analyze the transmission of financial shocks through international banking
networks, show that these networks tend to support international trade between countries.
The structure of host country markets and the bank relationship with that market matters
as well for the transmission of shocks. Foreign banks remained more committed to countries
hosting an affiliated subsidiary, that are geographically close, and that have developed
relationships with local banks (De Haas and van Horen 2011). The shock transmission to
affiliate locations through the parent bank is weaker for those affiliate locations considered as
important investment locations and stronger for important funding locations (Cetorelli and
Goldberg 2012c). International shock transmission also was influenced by government
interventions in recent crises (Buch et al. 2014, Rose and Wieladek 2011).
In sum, empirical research on the impact of liquidity shocks on bank lending should
take into account the nature of the shock (bank-specific versus global), the balance sheet
structure, the degree of internationalization of the bank under study, and the role of public
sector liquidity support. In exploring the effects of liquidity shocks, the key challenge is the
identification of loan demand and supply effects across banks. The approach that papers in
this volume follow is to explain heterogeneity across banks (and countries) in order to identify
a loan supply effect. In the following, we describe our approach towards “identification
through heterogeneity” (Gilchrist and Zakrajsek 1995).
3.2 Theoretical Justification of Loan Specification
The country studies in this volume show changes in lending by banks in response to
changes in liquidity risk as a function of bank-specific characteristics and the pricing and
availability of official sector liquidity. In this section, we provide theoretical justification for
the specifications. We begin with the Khwaja and Mian (2008, KM2008) two-period model of
bank lending, provide extensions of this framework to map to the Cornett, McNutt, Strahan
and Tehranian (2011, CMST2011) empirical specification, and we then show how use of
official sector liquidity matters.

9
3.2.1 Baseline Model
In period t, a representative bank i and firm j negotiate a loan of size ijtL . The bank
receives funding through deposits, ijtD which are costless (or priced at a low fixed rate) up to
some given level. The implicit assumption is that bank deposits are insured through a deposit
insurance system. The bank can fund its activities through costless deposits until a certain
scale of activity is reached. Thereafter, additional external financing itB is available to bank i
with the marginal cost of funds given by iB tBα with 0Bα > . Credit demand is such that
marginal returns on loans are decreasing in loan size with every counterparty j ijt L tr Lα− .
At the end of period t, two types of shocks hit the economy. Available funds beyond
the ex ante level of deposits vary with an aggregate credit supply shock tδ and a bank-
specific or idiosyncratic shock itδ . Credit demand shocks work through the marginal returns
on loans, which increase with aggregate and idiosyncratic productivity shocks tη and jtη .
Jointly solving the first order conditions for loan supply and demand in each period, KM 2008
solve for the single first-differenced equation (1), here amended with time subscripts:
( ) ( ) ( ) ( )1, 1 1 1 11 1ij i jB
t t B t t t tL B L B L B
L αα δ η δ ηα α α α α α+ + + + +∆ = ⋅ + + +
+ + + (1)
The first term on the right hand side of (1) is a constant and thus the common shock
affecting all transactions. This common effect is captured by a time fixed effect (or a country-
time fixed effect if the data span several countries). The second term is idiosyncratic to the
bank but transmitted to all borrowers of that specific bank. KM2008 interpret itδ as the bank-
specific change in access to deposits. While KM2008 exclusively focus on the cross-sectional
adjustment at a point in time, we exploit the time series variation in lending as well. itδ could
broadly be interpreted as market liquidity risk. Moreover, we follow Cetorelli and Goldberg
(2011) and reinterpret “firm j” as corresponding to the aggregate of firms from country c as
reported by the banks in their country exposures. 7
Liquidity risk has two dimensions. On the asset side, it refers to the structure of a
bank’s assets and thus captures the share of assets that can be converted into cash quickly. On
7 Brueggemann, Kleinert and Prieto (2011) provide a gravity model for banks and show how bank-firm level relationships can be aggregated up at the country-level.

10
the liability side, liquidity risk refers to rollover risk, i.e. the risk of not being able to refinance
short-term debt as it becomes due. Our examination starts with a liquidity risk time series c
tr that is common across all banks i within some country c and that is proxied by the LIBOR-
OIS spread.8 The exposure of a specific bank to liquidity risk thus depends on the strength of
its balance sheet (CMST2011). We capture balance sheet strength through a vector itχ , which
could include the proportion of deposits in bank funding, the share of assets that are illiquid,
or outstanding credit commitments.
We substitute i i ct t trδ χ≡ ⋅∆ and re-write (1) to yield a time-series panel specification
where ex-ante balance sheet composition influences the adjustment of lending (and other
variables within ijtL ) to changes in the market price of liquidity risk c
tr∆ :
( ) ( ) ( ) ( )1, 1 1 11 1ij i c jB
t t B t t t t tL B L B L B
L rαα δ η χ ηα α α α α α+ + + +∆ = ⋅ + + ⋅∆ +
+ + + (2)
The interactions between i ct trχ ⋅∆ show which balance sheet characteristics of banks
drive responses of lending to liquidity risk.
3.2.2 The Role of Official Sector Liquidity
While specification (2) holds in “normal” periods, it may yield biased estimates of the
effects of liquidity risks in periods when banks access liquidity provided by central banks (or
other public sector sources). The availability and use of official liquidity at a price below ctr
renders the market price as being less relevant to the banks.
To illustrate this point, Figure 4a Panel I shows how banks’ external cost of finance
relate to bank characteristics, and how these cost frontier curves are shifted upward across
time 0 1 2, ,t t t for all banks as a result of exogenous shocks. Banks with different characteristics
itχ are denoted across the horizontal axis. The line at the bottom reflects the effective funding
costs facing banks at time 0t : costs of market liquidity are proportionately higher for banks
with weaker fundamentals (lower itχ ) than for banks with stronger fundamentals. The market
price of liquidity risk can evolve over time, generating pricing frontiers at different dates, and
8 See Drehmann and Nikolaou (2010) on the definition and measurement of funding risk.
11
different types of banks i = 1, 2, …, k may be affected differently. The resulting time series of
liquidity costs for specific types of banks are re-mapped in Figure 4a Panel II, appearing as
the graphical visualization of regression treatments.
Missing from this visualization is the role for publically-provided liquidity, for
example through lender of last resort facilities available through central banks. Such
emergency lending is typically available through facilities such as the discount window of the
Federal Reserve. However, the pricing of this liquidity and perceived stigma associated with
its use (Armantier et al. 2011) generally leaves the cost of funding above the market prices of
external finance. This is illustrated in Figure 4b Panel I, wherein 0t has the interpretation of
“normal” market conditions, and the public sector price of liquidity for country c is ,0c pubr .
Now suppose there is an exogenous shift in private sector liquidity costs to a higher
frontier at time 1t , As shown in Figure 4b Panel I, as long as public sector (central bank)
liquidity ,0
c pubtr = is above the market rate, the effective cost of liquidity still corresponds to the
funding costs on the private market. At the initial pricing of public sector funds, large and
potentially disruptive changes in the private cost of funds are mitigated by public sector
provision only for the weakest banks at 2t .
Alternatively, suppose public sector funding is offered at , ,1 0c pub c pubr r< . In this case,
when private sector liquidity costs rise in 1t , banks with weak fundamentals will find it cost-
effective to access public sector liquidity mechanisms. The strong banks will continue to
acquire funding in private markets. The effective price of liquidity for the weak banks is no
longer a transformation of the private price, introducing a kink into the time series profile
shown in Figure 4b Panel II. Assuming the same market price over time while, in reality, the
public cost of liquidity has been below the private cost of liquidity, will yield to biased
regression results for all firms for which itχ is lower than some threshold value. For these
banks and at these dates, elasticities of balance sheet response to changes in liquidity
provision need to be measured relative to the public cost of funds, not the private cost of
funds.
Now suppose that the jump in the private cost of funds from period 0t to 1t raises
systemic concerns arising from large potential changes in ijtL that generate a credit crunch, a
12
lack of capital in the system, or a downward spiral of asset prices across banks. Figure 4c
Panel I demonstrates the case when emergency liquidity facilities are introduced and the price
of public funding is lowered to , ,1 1c pub c pubr r′ < . As shown in Figure 4c Panel II, weak banks
experience a discrete drop in the effective cost of liquidity (denoted by the red arrow).
Additionally, a larger group of itχ banks (with characteristics between i = 1 and i = 2) are
subject to the kinked effective cost of funds due to the availability of attractively priced public
funding at date 1t . The bias in empirical specifications becomes even more pronounced in
models which assume linearities and ignore the role of public sector funding and emergency
lending in crises episodes.
3.3 Translation to an IBRN Empirical Specification
The framework described above maps into an IBRN empirical specification which has
two basic methodological antecedents. The first is CMST2011 who examined the role of ex-
ante bank balance sheet composition in explaining the ex-post differences across large and
small U.S. banks in terms of balance sheet adjustment to liquidity risk conditions. The second
is the work by Cetorelli and Goldberg (2012c) who focus on global banks, which are those
with foreign affiliates.
Within the IBRN initiative, the respective country teams delineate types of banks that
are particularly relevant for their economies. For example, IBRN countries distinguish across
three characteristics: bank size (small versus large), banks with or without foreign affiliates,
and bank type. Some countries also contrast the responses of domestic lending versus funding,
and lending with related and unrelated counterparties at home and abroad. Where data
availability permits, some IBRN studies are able to explicitly test for the kinked response to
liquidity risk under the presence of an official sector liquidity facility.
The main regression specification appears as:
( ) ( )0 1 0 1, 1 , 1_ _it i t t i t t i t it itY LIB OIS LIB OIS Fγ µ β β χ α α χ ε− −∆ = + + + + + ⋅ + (3)
where itY corresponds to bank i balance sheet items that could affect the response of lending
to liquidity risk exposures. Most countries, given our focus on lending and credit, explore
loans to domestic counterparties and loans to foreign counterparties, all scaled by bank assets.
Some countries have data on domestic banks with foreign affiliates, and can also consider

13
local claims extended by these affiliates and net due to balances (which capture the net
internal borrowing of the parent bank from its foreign affiliates).9 Some countries also follow
the CMST2011 specification more closely by including liquid assets and credit extension.
, 1i tχ − is a vector of lagged control variables that captures the degree to which a bank is
exposed to liquidity risk through ex ante balance sheet composition and market access.
Balance sheet composition is captured through bank-specific data on lagged illiquid asset
share, the share of deposits in bank funding, the size of outstanding unused commitments, and
bank capital. Because some of the banks have affiliates with which they can borrow and lend
through internal capital markets, some specifications include related net due to shares in
funding. As in CMST2011, we refrain from interpreting the role of bank size in the
specifications given its multiple potential implications. The impact of size on exposure to
liquidity risk is, in fact, not clear a priori. Large banks, for example, might have better
opportunities to diversify risk but may, at the same time, be exposed to systemic risk to a
greater degree.
To proxy liquidity risk ctr , each country team includes a relevant measure like a
LIBOR over OIS spread ( )_ tLIB OIS .10 The associated data are provided in Figure 5. The
interaction between the balance-sheet composition terms and the LIBOR over OIS spread
shows whether banks’ credit extension changes with funding risks depending on ex-ante
balance sheet features. The baseline regression model includes bank ( iγ ) and time ( tµ ) fixed
effects so that β reflect the importance of cross-sectional differences in balance sheet
compositions on the liquidity risk effects.
Data for some countries allow testing whether the use of official liquidity facilities
affects how banks respond to liquidity risks.11 For this purpose, interaction terms between the
, 1i tχ − variables and a measure of central bank interventions are introduced, for example by
9 The country teams introducing “Net Due To” positions in their specifications are Australia, Austria, Canada, Germany, Ireland, Poland, and the United States. 10 Some alternative series include the 3-month LIBOR-OIS spreads (along with its components) of the European Euro (EUR), Pound Sterling (GBP), Hong Kong Dollar (HKD), Japanese Yen (JPY), Singapore Dollar (SGD), Swiss Franc (CHF), the US dollar (USD), Australian dollar (AUD), Canadian Dollar (CAD). For Hong Kong and Singapore, the interbank rates are Hong Kong Interbank Offered Rate (HIBOR) and Singapore interbank offered rate (SIBOR), respectively. 11 The countries with specification that can control for bank use of official liquidity facilities are Austria, Canada, France, Germany, Ireland, Italy, the United Kingdom, and the United States.

14
having a itF (Facility), an indicator variable equaling 1 if a bank accessed an official liquidity
facility at time t. During periods with official support, the overall sensitivity of the balance
sheet to liquidity risk in periods of central bank facility use is captured by 1 1β α+ .
The second methodological building block exploits information by bank and by
specific foreign lending locations, following Cetorelli and Goldberg (2012c). The idea is that
the business models of global banks and the characteristics of destination countries, as
investment or funding locations for individual banks, drive the relative adjustment in banks’
lending and internal capital markets adjustment to liquidity risk. If appropriate data are
available, country studies include estimation of a modified version of (3) wherein each bank
adjusts its claims on different countries in accordance with the strategic importance of those
locations to that bank. Formally, the following equation applies:
( )
( )
0 1 2 3, 1 , 1 , 1
1 3, 1 , 1
_ _
_ _
c i c c cit t t i t t i t i t
ct t i t i t it it
Y LIB OIS LIB OIS
LIB OIS LIB OIS F
γ µ β β β χ β χ χ
α α χ χ ε
− − −
− −
∆ = + + + + + ⋅
+ + ⋅ ⋅ + (4)
where the dependent variable is a claim of bank i on a resident of country c at time t, which
can take the form of cross-border lending (claims), local claims extended through overseas
branches or subsidiaries, or internal borrowing and lending of the affiliate location. Strategic
importance variables are measures of whether countries are core investment or funding
location for each parent bank i ( ), 1ci tχ − .12 The estimating equation includes location-time fixed
effects to absorb changes in demand conditions ( )ctµ .
4 Overview of Key Cross-Country Results
The 11 country studies included in this symposium apply the common methodology to
a time frame of approximately 2006 through 2013, generally using quarterly data. The
liquidity shock variables are country specific, and explanatory variables are defined in similar
but not identical ways due to local reporting conventions. Some countries have banks that are
purely domestically focused alongside banks with global affiliates. Other countries primarily
serve as the host countries for domestic subsidiaries of foreign parents. The studies account 12 A core funding location for bank i is a location where the local foreign offices fund their operations largely through local borrowing; a core investment location for bank i is a location that represents a large share of overall foreign investments (claims) of bank i.

15
for differences in business models of banks, differences in national banking systems, and
differences in access to official liquidity support.
In this section, we summarize the results of the country studies on banks’ responses to
liquidity risk during the crisis. We focus on a subset of empirical specifications, leaving the
details, the rich idiosyncratic narratives, and additional specifications to each of the individual
papers. We describe results that cover two main groupings of banks – banks with foreign
affiliates, and banks without foreign affiliates – and four key dependent variables – changes in
domestic loans, cross-border loans, local claims, and net due to parents, reflecting the net
borrowing from the domestic location vis-à-vis the rest of the organization.
4.1 Descriptive Statistics
Table 1 shows the number of countries providing regression specifications and the
total number of specifications across these countries for each dependent variable such as
changes in domestic loans, in cross-border loans, in local claims, and in net due to of the
parent bank. 13 For example, 10 countries report specifications using a sample of banks with
foreign affiliates to study domestic loan sensitivity, with 20 regression specifications of the
form of equation (1), differing in the particular samples of included banks. For example some
countries have separate specifications for larger banks versus smaller banks, or foreign-
ownership versus domestic-ownership, or branches versus subsidiaries of respective owners. 9
of the 10 countries provide specifications covering cross-border or foreign lending, in addition
to domestic lending, while 7 of the 10 countries are able to examine the effects of liquidity
risk on internal capital market flows through banks as reflected in their Net Due To balances.
We next provide an overview of the pattern of statistical significance of the
interactions between the different balance sheet characteristics of banks (deposits, capital, or
ex ante net due to) and the Libor-OIS spreads across the regression specifications already
profiled in Table 1. We take a 10 percent level of statistical significance on the estimated
regression coefficients β , which measure whether the response of bank lending to a liquidity
shock runs through a particular balance sheet variable. We also consider the incidence of
statistical significance of these same balance sheet characteristics in periods when banks
13 Hong Kong is excluded from the meta analysis due to a difference regression format from the main specifications we analyze. For the purpose of the meta analysis, we define Net Due To for the bank in the reporting country to be the net borrowing of that bank from the rest of its organization outside of that country.
16
access official sector liquidity support, as reflected in the 1 1β α+ coefficients described in
equation (3).14 It is important to note that the type of official liquidity support the studies look
at differs across countries. For example, in the study of banks in Germany the authors use
information on guarantees and capital injections provided for distress banks (Kerl and Koch
2014), while the study of banks in the United States uses information on draws on the
discount window and the term auction facility.
There are two parts to Table 2. First, Table 2a takes the full group of specifications
across all studies (10 are included in the meta-analysis) and considers how many of the
regression specifications generate a particular β or 1 1β α+ that is positive and statistically
significant, negative and statistically significant, not statistically significant, or missing from
this group of regression specifications. These results are depicted within the cells of the table
provided under headings (a), (b), (c) and (d) respectively.
For example, recall from Table 1 that there are 7 regression specifications from
5countries that explore domestic loan growth for banks without foreign affiliates. Consider
patterns under with the columns of Table 2a, under banks without foreign affiliates, and then
under changes in domestic loans. Looking down column(s) we observe that deposit shares are
the only non-zero entry, so are the only variable interacted with LIBOR-OIS that are
associated with higher cross-sectional growth of domestic loans, and this occurs in 3 of the 7
regression specifications. This channel of support for cross-sectional differences in domestic
loan growth disappears during periods when banks access official liquidity, and from
comparing columns (a) and (b), it even turns negative and significant in one case. Particularly
striking from these first columns of Table 2a are how seldom these balance-sheet variables
explain cross-sectional differences in loan growth as liquidity conditions change, and in the
sample of banks without foreign affiliates. Also striking is that features that tend to support
more domestic loan growth can have the opposite effect in explaining cross-sectional
differences in cross-border lending growth. Generally, the results of Table 2a show that the
balance sheet differences across banks generally are typically not very important for
explaining variation in lending of banks without foreign affiliates as liquidity risk conditions
evolve. For these banks, most of the cross-sectional variation in lending growth is absorbed
by bank fixed effects. 14 This type of typology follows the approach of Card and Krueger (1995) used in summarizing the results across empirical studies on labor market policy effects.

17
The picture of statistical significance is very different when countries explore the
micro-data on banks with foreign affiliates. The corresponding results are provided under the
heading of banks with foreign affiliates for the rightmost columns of results in Table 2a.
Looking down the respective columns it is clear from the non-zero entries that cross-sectional
variation across banks in growth of domestic loans, cross-border loans, and “net due to” are in
fact associated with bank balance sheet compositions within some of the 10 countries. At the
same time, different balance sheet characteristics matter in different countries, and for the
different forms of loan growth.
Local claims of bank with foreign affiliates, which are the claims extended by
subsidiaries in other locations, are not well explained by the parent bank balance sheet
interacting with liquidity risk. Like the domestically-owned banks, the banks with foreign
activities have thus isolated differences in their local lending in the host country from parent
funding shocks.
Particularly interesting are the patterns of significance of balance sheet variables in
differentiating across banks the transmission of liquidity risk into cross-border lending
growth. For this dependent variable, cross-sectional variation in response to liquidity risk
conditions is often tied to the types of bank balance sheet characteristics such as deposit
shares, unused credit commitment balances, and net borrowing positions of the reporting bank
vis-à-vis affiliates, as demonstrated by the frequency of non-zero entries in columns (a) and
(b) under the cross-border loan column section. Also interesting, but less prevalent, is the
finding that cross-sectional differences in internal capital market borrowing by banks, often
conducted with its foreign affiliates, also are sensitive to bank balance sheet characteristics.15
Table 2b considers whether the patterns of findings just profiled occur across a group
of countries, or whether they are concentrated within specific country regressions among the
10 countries included. In this alternative table variant, we focus only on providing a
counterpart to columns (a) and (b) of Table 2a, but now also introducing the names of the
countries that find positive or negative statistical significance of a liquidity risk transmission
“channel”. Next to the names of the countries, we indicate in parentheses the number of
specifications for that country associated with this statistical significance.
15 Recall also that a smaller group of countries have analyzed the internal capital market flows by their banks.

18
For example, consider the specifications under the column headings of banks with
foreign affiliates (which are either domestic banks with external affiliates, or foreign banks
operating within a country, depending on the reporting country). Numerous country names are
represented in these columns, showing the incidence of statistical significance of particular
balance sheet characteristics in the country specifications captured by our meta-analysis.
Cross-sectional differences in domestic lending growth in response to changing
liquidity risk are linked to different factors in respective countries. In periods without official
liquidity use, net due balances matter for banks in the U.S., Ireland, and Germany, although
these balances cease to drive cross-sectional differences across banks in domestic lending
when banks are accessing official liquidity. Ex ante differences across banks in deposit shares
are correlated with domestic lending growth responses to liquidity risk for banks in Ireland
and the United Kingdom, but in different directions. Turning to columns under cross-border
loan growth, the studies show that variability across banks in response to liquidity risk is tied
to a broader set of balance sheet variables, whether illiquid asset shares, deposit funding,
commitment ratios, tier 1 capital holdings, or use of internal capital markets.
4.2 Results of the Meta Regressions
To analyze the regression results in a more systemic fashion that accounts for
differences across countries and regression specifications, we next turn to a meta analysis,
following the approach of previous applications such as in labor economics (Boockmann
2010, Card and Krueger 1995, Doucouliagos and Stanley 2008). We first examine the sample
and specification features that are associated with the explanatory power for regressions. We
then focus more specifically on the features associated with significant roles for deposit
funding, internal capital markets, and official liquidity support in loan growth response to
liquidity risk.
The result of the meta analysis are reported in Tables 3 and 4. Table 3 uses the
regression R² as the dependent variable. Because the range of the R² across countries is
relatively large, we include country fixed effects in all regressions. Given that the R² is bound
between 0 and 1, we run a censored Tobit model with robust standard errors. Next, in Table 4,
we explore through which balance sheet variables liquidity shocks affect bank lending. We
use a probit model with robust standard errors. Country fixed effects are not included because
of their colinearity with the number of banks. The dependent variable in these regressions is a
19
0/1-dummy which is set equal to one if the interaction between liquidity shocks and bank
balance sheet characteristics is significant at least at the 10%-level. We run these regressions
for three explanatory variables: deposit funding, net due to, and official support.
Consider first the explanatory power of regression specifications, as presented in
Table 3. Columns (1) through (7) of this table provide results for specification R² statistics,
while column (8) used adjusted R² as the dependent variable. A waterfall structure across
columns (1) through (5) separately considers different regression dependent variables in the
country specifications. Generally, increasing the number of banks (for a given time series
dimension of the data) lowers the explanatory power of our model. This shows the impact of
bank-level heterogeneity for our results. Also, regression specifications have higher R² for
countries when domestic loans is the dependent variable, indicating the relative stability of
growth these loans compared to the alternative forms of lending considered across countries.
Net due to, cross-border loans or foreign office loans tend to be more volatile over time and
cross-sectionally within countries, which tends to lower the R² in these regressions.
Regression specifications with bank fixed effects have marginally higher fits, but tend to not
change the overall pattern of results of the specifications.
Table 4 compares the regression sample features associated with significant roles of
internal capital market balances, deposit shares, and use of official support in the cross-
sectional distinctions among banks in liquidity risk transmission into lending. 85 of the total
of 127 specifications contain the net due measure. All 127 specifications contain a measure of
deposit share in funding. 103 of the regression specifications contain a measure of official
support utilized by banks and facilitating a distinction of results across “normal” and “stress”
periods when official sector liquidity is substituting for private liquidity on bank balance
sheets. Table 4 is set up with a waterfall structure, so we are able to determine if there are
particular types of lending which tend to be more sensitive to these three features.
From Column 1, we observe that net due balances are more likely to be significant for
liquidity risk transmission within specifications that have a larger number of banks reporting.
Column 2 shows that the country specifications on adjustments of internal capital market
positions in response to liquidity risk are significantly less likely to be sensitive to ex ante
positions of net borrowing in the organization, when contrasted with specifications covering
other forms of lending. Specification (4) shows that internal capital market positions are more

20
likely to matter for cross-sectional differences in domestic lending compared with the other
types of bank lending.
Table 4 columns (6) through (10) explore the importance of deposit funding in
explaining cross-sectional differences across banks in loan responses to liquidity risk. The
main driver is whether specifications cover the banks without foreign affiliates, as it is this
group in which deposit funding matters the most, regardless of type of lending conducted. The
French study argues that, rather than proxying for the specific funding strategy of a given
bank, the share of deposit funding proxies for the business model and the degree of risk
aversion of banks (Bussiere et al. 2014). Similarly, the UK study finds that banks which rely
on deposits cut back external lending and raise domestic lending by more (Hills et al. 2014).
In general, the mixed and relatively weak role of deposits in driving liquidity risk effects
across countries might be a result of conflating more stable bank funding balances with more
domestically-oriented loan portfolios as core businesses of banks.
Finally, columns (11) through (15) explore which types of regression specifications
are more likely to demonstrate a role for bank use of official liquidity support in changing the
pattern of transmission of liquidity risk. The test is whether any of the interaction terms with
official liquidity is significant. Results are sensitive to including or excluding interaction
terms with assets: Including this interaction term, we find that the probability of a role for
official liquidity support to be significant rises for specifications that contain larger numbers
of banks. In those regressions, the number of banks has a positive and significant impact, i.e.
when the degree of heterogeneity among banks increases, the use of official support plays
more of a role in the identification of the characteristics of banks that matter for liquidity risk
transmission. If the regression specifications exclude the interactions of official liquidity use
with assets (unreported), the dummy for banks without foreign affiliates becomes
significantly negative. This result indicates that official liquidity support is less likely to
influence the sensitivity of lending to liquidity risk in banks without foreign affiliates,
compared with for banks with foreign affiliates. This is indirect evidence that these official
liquidity facilities were utilized more by the internationally active banks and provided these
banks more relief from elevated liquidity risk.

21
5 Conclusions
Research conducted in the International Banking Research Network shows a large
degree of heterogeneity across banks and countries in terms of adjustment to liquidity shocks.
Nonetheless, we observe several common patterns in explaining the heterogeneity in bank
lending response to liquidity risk.
First, the regression specifications explain more of the cross-sectional and time-series
variation in domestic lending compared with explaining the variation observed in lending to
related affiliates (i.e. net due to or intrabank lending) or cross-border lending. In general,
patterns of domestic lending growth by banks are more stable over time and across
institutions compared with other forms of bank lending.
Second, the pattern of balance sheet drivers of lending adjustment to liquidity risk
across banks changes when banks access official liquidity support. Use of official liquidity
support is more likely to change the mechanics of transmission of liquidity risk into lending
for the banks with foreign affiliates than for the banks that without foreign affiliates. Some of
the use of official liquidity support displaced cross-sectional differences in banks in their use
of internal capital markets in relation to balance sheet structure. Given the diverse country
experiences represented by papers in this symposium, we cannot draw strong conclusions on
the design of the liquidity facilities or the conditions associated with use of these liquidity
facilities.
Third, internationally active banks have access to and have used an additional channel
of adjustment to liquidity risk, both during normal times and during the crisis. Banks that
increased net borrowing affiliates as liquidity risk rose supported domestic and cross-border
lending in some instances, but this result did not always hold.
Fourth, a stronger general result is that cross-border lending growth is more sensitive
to liquidity risk in relation to the balance sheet characteristics of the banks. One interpretation
is that banks may subordinate cross-border lending relative to domestic lending activity as
stress conditions change. This same pattern of results did not in general show up in the
changes in bank lending conducted through the foreign branches and subsidiaries of these
same banks. In general though, no single balance sheet factor affects banks’ exposure to
liquidity risk in a consistent way across time and across countries (or banks).

22
Generally, the explanatory power of the empirical model is weaker the larger the
number of banks. In other words, banks are heterogeneous in their lending patterns, and
specifications with larger numbers of banks – regardless of being domestic or global banks –
have more unexplained heterogeneity. Heterogeneity which reflects differences in bank
business models may contribute to an enhanced resilience of the system. At the same time, a
large degree of heterogeneity in which balance sheet characteristics are associated with more
volatile responses by banks also complicates finding appropriate regulatory responses.
In conclusion, the formation of the IBRN and the studies of this symposium represent
the first systemic cross-country work using individual bank micro-data using a common
methodology that is comparable across countries. This work provides an important example
of the benefits of international collaboration and communications between researchers in
academia and central banks from around the world. Such collaboration helps support the
common goals of macroeconomic stability and financial stability. These efforts also provide
lessons that inform appropriate regulatory responses to liquidity risks and other shocks by
providing comparable cross country evidence from the recent crisis.
While the IBRN will move forward with tackling research questions, there are still
broad agendas that all countries face on issues regarding data. One big advantage of the IBRN
network is the ability to access similar and very detailed datasets across countries. At the
same time, our analysis has been constrained by gaps in the collection and availability of data
within and across countries on banks and on policy interventions. The successful and ongoing
cross-country research efforts in this symposium highlight the benefits of continuing efforts to
collaborate across countries and to improve the availability, coverage, and granularity of
micro-banking data for academic research and policy analysis.

23
6 References
Acharya, V., Afonso, G., Kovner, A. 2013. How do Global Banks Scramble for Liquidity? Evidence from the Asset-Backed Commercial Paper Freeze of 2007. Stern NYU Working Paper.
Allen, F., Gale, D. 2000. Financial Contagion. Journal of Political Economy Vol. 108 No.1: 1-33.
Armantier, O., Ghysels, E., Sarkar, A., Shrader, J. 2011. Stigma in Financial Markets: Evidence from Liquidity Auctions and Discount Window Borrowing during the Crisis. Federal Reserve Bank of New York Staff Reports No. 483.
Boockmann, B. 2010. The Combined Employment Effects of Minimum Wages and Labor Market Regulation: A Meta-Analysis. Applied Economics Quarterly Vol. 56 pg.156-188.
Brüggemann, B., Kleinert, J., Prieto, E. 2012. A Gravity Equation for Bank Loans. Universities of Graz and Tuebingen. Mimeo.
Buch, C., Koch, C., Koetter, M. 2013. Do Banks Benefit from Internationalization? Revisiting the Market-Power-Risk Nexus. Review of Finance Vol. 17 No.4 pg. 1401-1435.
Buch, C.M., Delong, G. L. 2012. Banking Globalization: International Consolidation and Mergers in Banking. The Oxford Handbook of Banking.
Buch, C.M., C.T. Koch, Koetter, M. 2011. Size, Productivity, and International Banking. Journal of International Economics Vol. 85 No.2 pg. 329-334.
Buch, C.M., Koch, C. T., Koetter, M. 2014. Crises and Rescues: Monetary Policy Transmission through International Banks. Mimeo.
Buch, C.M., Eickmeier, S., Prieto, E. 2014. In Search for Yield? Survey-based Evidence on Bank Risk Taking. Journal of Economic Dynamics and Control
Card, D., Krueger, A. 1995. Time-Series Minimum-Wage Studies: A Meta-Analysis. American Economic Review, Vol. 85 No.2 pg.238-43.
Cetorelli, N., Goldberg, L. 2011. Global Banks and International Shock Transmission: Evidence from the Crisis. IMF Economic Review Vol. 59 No.1 pg.41-76.
Cetorelli, N., Goldberg, L. 2012a. Banking Globalization and Monetary Transmission. Journal of Finance Vol. 67 No.5 pg. 1811-1843.
Cetorelli, N., Goldberg, L. 2012b. Follow the Money: Quantifying Domestic Effects of Foreign Bank Shocks in the Great Recession. American Economic Review Vol. 102 No.3 pg.213-18.
Cetorelli, N., Goldberg, L. 2012c. Liquidity management of U.S. Global Banks: Internal Capital Markets in the Great Recession. Journal of International Economics Vol. 88 No.2 pg.299-311.
Claessens, S., van Horen, N. 2014. Foreign Banks: Trends and Impact. Journal of Money, Credit and Banking Vol. 46 No. 1 pg.295-326.

24
Committee on the Global Financial System (2011). Global liquidity – concept, measurement and policy implications. CGFS Papers 45. Report submitted by an Ad-hoc Group established by the Committee on the Global Financial System. November. Basel.
Cornett, M., McNutt, J., Tehranian, H., Strahan, P. 2011. Liquidity Risk Management and Credit Supply in the Financial Crisis. Journal of Financial Economics Vol. 101 Issue 2 pg.297-312.
de Blas, B., Russ, K. 2013. All Banks Great, Small, and Global: Loan Pricing and Foreign Competition. International Review of Economics & Finance Vol.26(C) pg.4-24.
De Haas, R., van Lelyveld, I. 2014. Multinational Banks and the Global Financial Crisis. Weathering the Perfect Storm? Journal of Money, Credit, and Banking Vol. 46 Issue s1 pg.333-364
De Haas, R., van Horen, N. 2013. Running for the Exit: International Banks and Crisis Transmission. The Review of Financial Studies Vol. 26 Issue 1 pg.244-285.
Dietrich, D., Vollmer, U. 2010. International Banking and Liquidity Allocation. Financial Services Research Vol. 37 pg.45–69.
Doucouliagos, H., Stanley, T.D. 2009. Publication Selection Bias in Minimum-Wage Research? A Meta-Regression Analysis. British Journal of Industrial Relations Vol. 47 Issue 2 pg.406-428.
Drehmann, M., Nikolaou, K. 2013. Funding Liquidity Risk: Definition and Measurement. Journal of Banking & Finance Vol. 37 Issue 7 pg.2173-2182.
Gilchrist, S., Zakrajsek, E. 1995. The Importance of Credit for Macroeconomic Activity: Identification through Heterogeneity. In: Is Bank Lending Important for Transmission of Monetary Policy? Federal Reserve Bank of Boston Vol.39 pg.129-173.
Goldberg, L. 2007. Financial Sector FDI and Host Countries: New and Old Lessons. Federal Reserve Bank of New York Economic Policy Review pg.1-17.
Hale, G., Minoiu, C., Kapan, T. 2014. Crisis Transmission in the Global Banking Network. Mimeo.
Khwaja, A., Mian, A. 2008. Tracing the Impact of Bank Liquidity Shocks: Evidence from an Emerging Market. American Economic Review Vol. 98 No.4 pg.1413-42
Niepmann, F. 2013. Banking across Borders. Federal Reserve Bank of New York Staff Reports No.609.
Okawa, Y., van Wincoop, E. 2012. Gravity in International Finance. Journal of International Economics Vol.87 pg.205-215.
Peek, J., Rosengren, E. 1997. The International Transmission of Financial Shocks: The Case of Japan. The American Economic Review Vol. 87 No.4 pg. 495-505.
Peek, J., Rosengren, E. 2000. Collateral Damage: Effects of the Japanese Bank Crisis on Real Activity in the United States. The American Economic Review Vol. 90 No.1 pg. 30-45.
Rose, A.K., Wieladek, T. 2012. Too Big to Fail: Some Empirical Evidence on the Causes and Consequences of Public Banking Interventions in the UK. Journal of International Money and Finance Vol. 31 No.8 pg.2038-2051.
25
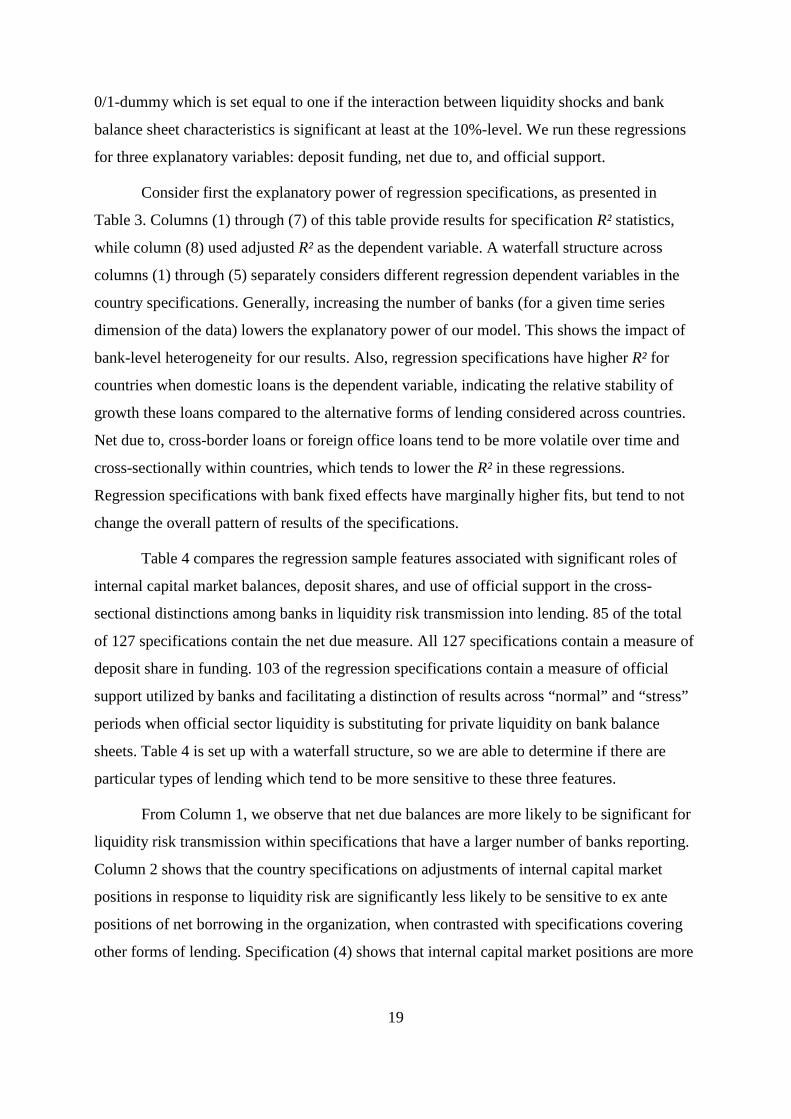
Individual Paper Contributions in the International Banking Research Network
Bussiere, Matthieu, Boubacar Camara, Francois-Daniel Castellani,,Vincent Potier, and Julia Schmidt. 2014. “Shock Transmission through International Banks – Evidence from France.” Banque de France.
Caccavaio, Marianna, Luisa Carpinelli, Giuseppe Marinelli, and Enrico Sette. 2014. “Shock Transmission through International Banks: the Italian Case.” Banco d'Italia.
Chapman, James and H. Evren Damar. 2014. “Shock Transmission through International Banks: Canada.” Bank of Canada.
Correa, Ricardo, Linda Goldberg, and Tara Rice. 2014. “Liquidity Risk and U.S. Bank Lending at Home and Abroad.” Manuscript Federal Reserve Bank of New York and Board of Governors of the Federal Reserve System.
Everett, Mary, Jane Kelly and Fergal McCann. 2014. “Banks’ Internal Capital Markets, Official Liquidity, and International Shock Transmission: an Irish Illustration.” Central Bank of Ireland.
Guttmann, Rochelle. 2014. “Liquidity Shock Transmission through Australian Banks.” Reserve Bank of Australia.
Hills, Robert, John Hooley, Yevgeniya Korniyenko, and Tomasz Wieladek. 2014. “The International and Domestic Transmission of Bank Liquidity Shocks: Evidence from the UK.” Bank of England.
Kerl, Cornelia and Catherine Koch. 2014 “Internal Capital Markets, Government Support and How German Banks Adjust to Liquidity Shocks.” Deutsche Bundesbank.
Pawlowska, Malgorzata, Dobromil Serwa, and Slawomir Zajaczkowski. 2014. “International Transmission of Liquidity Shocks Between Parent Banks and Their Affiliates: The Host Country Perspective.” Central Bank of Poland.
Segalla, Esther. 2014. “Shock Transmission through International Banks: Austria.” Oesterreichische Nationalbank.
Wong, Eric, Andrew Tsang, and Steven Kong. 2014. “Implications of Liquidity Management of Global Banks for Host Countries – Evidence from Foreign Bank Branches in Hong Kong.” Hong Kong Monetary Authority.

26
Table 1: Counts of Regressions Included in the Meta-Analysis This Table summarizes the number of countries reporting regression results for each combination of dependent variable (columns) and specification feature (rows), followed by the number of regressions reported in total by all countries. Countries included are Australia, Austria, Canada, France, Germany, Ireland, Italy, Poland, the United Kingdom, and the United States.
Dependent variable
Regression sample ∆ domestic loans ∆ x-border loans ∆ foreign office claims ∆ net due
to parent
Specifications including bank fixed effects
Banks with foreign affiliates 10 19 9 19 4 8 7 13
Banks without foreign affiliates 5 7 4 6 0 0 1 1
Specifications excluding bank fixed effects
Banks with foreign affiliates 10 14 9 14 4 6 7 10
Banks without foreign affiliates 5 5 4 4 0 0 1 1

27
Table 2a: Patterns of Significance on Liquidity Risk Across Regressions This Table shows the significance of the interaction terms with Libor-OIS for the bank fixed effect models only. It gives the number of specifications with positive significant coefficients and negative and significant coefficients, both at the 10%-level. The following countries have specifications with Net Due To (LHS) (with Bank FEs): Canada, Austria, Germany, US, Ireland, Australia, and Poland. The following countries do not have specifications with Net Due To (LHS) (with Bank FEs): Italy, UK, France. The following countries have information on official support: Canada, France, Italy, Austria, Germany, US, Ireland, UK. The following countries are missing information on official support: Poland, Australia (no official support information for Australia aside from one of their tabs called "Locational Table", whose specifications were not included in the meta analysis).
Banks without foreign affiliates Banks with foreign affilates
Period with official support?
∆ domestic loans ∆ x-border loans ∆ domestic loans ∆ x-border loans ∆ foreign office claims ∆ net due
a = positive significant at the 10%-level, b = negative significant at the 10% level, c = insignificant, d = missing a b c d a b c d a b c d a b c d a b c d a b c d
Illiquid assets No 0 1 6 0 0 0 6 0 0 0 17 2 2 1 14 2 0 1 7 0 0 0 11 2 Yes 0 0 5 2 0 0 5 1 0 3 11 5 4 1 10 4 0 1 7 0 0 2 6 5
Commitment ratio No 0 2 4 1 0 0 5 1 1 0 14 4 5 0 10 4 1 0 5 2 1 1 7 4 Yes 0 0 5 2 1 0 4 1 1 1 12 5 1 3 11 4 0 0 6 2 1 2 5 5
Deposits No 3 0 4 0 0 3 3 0 1 2 16 0 3 0 16 0 1 0 7 0 0 0 13 0 Yes 0 1 4 2 0 1 4 1 0 1 15 3 0 5 12 2 1 2 5 0 1 0 9 3
Tier 1 No 0 0 6 1 0 0 5 1 0 0 13 6 2 2 9 6 0 0 6 2 0 0 8 5 Yes 0 0 4 3 0 0 4 2 2 0 9 8 0 0 12 7 0 1 5 2 1 1 4 7
Net Due To No 0 0 1 6 0 0 0 6 2 3 10 4 3 0 12 4 0 0 7 1 0 1 12 0 Yes 0 0 0 7 0 0 0 6 0 0 12 7 1 3 8 7 0 0 7 1 0 2 8 3

28
Table 2b: Country Names of Regressions with Significant Coefficients This table identifies the countries corresponding to nonzero counts in the positive significant and negative significant (10% level) columns. For example, the table shows that for the regressions using the change in domestic loans as the dependent variable conducted on the "Banks without foreign affiliates" subsample, three such regressions reported positive significant (10% level) coefficient estimates for the Deposits*Libor_OIS interaction term. The corresponding cell in this table identifies these to be from the Austria, US, and Poland results. Canada, Austria, Germany, US, Ireland, Australia, and Poland reported specifications with the Net Due dependent variable, while Italy, UK, and France did not. Canada, France, Italy, Austria, Germany, US, Ireland, and UK report information on official support (through triple interaction terms), while Poland and Australia did not. Abbreviations: AU = Austria, AUS = Australia, CN = Canada, US = United States, FR = France, GER = Germany, IRE = Ireland, IT = Italy, PO = Poland, UK = United Kingdom. Number in parenthesis next denotes the number of regressions from each country, only specifications with bank fixed effects reported.
Banks without foreign affiliates Banks with foreign affiliates ∆ domestic loans ∆ x-border loans ∆ domestic loans ∆ x-border loans ∆ foreign office claims ∆ net due
Explanatory variable
Period with official
support?
Illiquid assets No 0 AUS(1) 0 0 0 0 CN(1),
US(1) GER(1) 0 CN(1) 0 0
Yes 0 0 0 0 0 CN(2), GER(1)
AU(2), GER(2) CN(1) 0 CN(1) 0 US(1),
CN(1)
Commitment ratio
No 0 AU(2) 0 0 UK(1) 0
AU(1), US(1), IRE(2), UK(1)
0 FR(1) 0 US(1) PO(1)
Yes 0 0 AU(1) 0 AU(1) GER(1) US(1) AU(1), GER(2) 0 0 AU(1) GER(2)
Deposits
No AU(1), US(1), PO(1)
0 0 AU(2), US(1) IRE(1) AU(1),
UK(1)
CN(1), GER(1), AUS(1)
0 CN(1) 0 0 0
Yes 0 AU(1) 0 US(1) 0 CN(1) 0 CN(1), AU(2), GER(2)
AU(1) CN(1), AU(1) US(1) 0
Tier 1 No 0 0 0 0 0 0 GER(2) AU(1),
UK(1) 0 0 0 0
Yes 0 0 0 0 GER(1), US(1) 0 0 0 0 0 GER(1) US(1)
Net Due No 0 0 0 0 US(1),
IRE(1) GER(3) US(2), AUS(1) 0 0 0 0 AUS(1)
Yes 0 0 0 0 0 0 US(1) AU(2), GER(1) 0 0 0 CN(1),
GER(1)

29
Table 3: Determinants of the Regression R² This Table reports the results of Tobit regressions, using the regression R² as the dependent variable (columns (1)-(7)). The regressions account for the fact that the dependent variable has an upper (1) and a lower bound (0). Column (8) used the adjusted R² as the dependent variable. Robust standard errors are reported in brackets. ***, **, * indicates significance at the 1%, 5%, 10%-level.
(1) (2) (3) (4) (5) (6) (7) (8) Dependent variable R² R² R² R² R² R² R² adjusted R²
Bank fixed effects included 0.034* 0.033* 0.034* 0.033* 0.033* 0.033* 0.014 0.029 (0.018) (0.018) (0.018) (0.018) (0.017) (0.017) (0.022) (0.021) log banks -0.087*** -0.086*** -0.085*** -0.089*** -0.091*** -0.089*** -0.135*** -0.030* (0.013) (0.014) (0.013) (0.013) (0.014) (0.014) (0.013) (0.017) Banks without foreign affiliates 0.007 -0.002 0.012 0.005 -0.005 -0.006 -0.022 -0.075*** (0.019) (0.021) (0.018) (0.020) (0.021) (0.021) (0.025) (0.025) Dependent variable net due -0.057** -0.018 -0.028 -0.036 (0.024) (0.024) (0.025) (0.031) Dependent variable cross-border loans -0.043*** (0.014) Dependent variable foreign office claims -0.017 0.008 0.002 -0.067** (0.033) (0.029) (0.039) (0.025) Dependent variable domestic loans 0.082*** 0.077*** 0.080*** 0.115*** (0.018) (0.017) (0.028) (0.025) Constant 0.492*** 0.499*** 0.503*** 0.501*** 0.487*** 0.485*** 0.643*** 0.233*** (0.056) (0.059) (0.054) (0.059) (0.053) (0.052) (0.047) (0.065) Country fixed effects included Yes Yes Yes Yes Yes Yes No Yes Sigma 0.095*** 0.092*** 0.092*** 0.094*** 0.086*** 0.086*** 0.122*** 0.101*** (0.007) (0.006) (0.007) (0.007) (0.006) (0.006) (0.007) (0.010) Observations 127 127 127 127 127 127 127 103

30
Table 4: Determinants of Banks’ Responses to Liquidity Shocks This Table reports the results of Probit regressions, using a 0/1-dummy indicating whether the interaction between liquidity risk and the respective variable is significant at least at the 10%-level. For example, the first column should be read as follows: The interaction term between “net due” and liquidity risk is more likely to be significant in regressions with a larger number of banks (log banks) and less likely to be significant in regressions using the change on “net due to” as the dependent variable. Not all variables are included in all models due to colinearity. Robust standard errors are reported in brackets. ***, **, * indicates significance at the 1%, 5%, 10%-level.
Explanatory variable
Specification
(1) (2) (3) (4) (5) (6) (7) (8) (9) (10) (11) (12) (13) (14) (15)
Net due
Deposits
Official support
Bank fixed effects included 0.051 0.053 0.050 0.056 0.068 0.163 0.161 0.162 0.168 0.174 -0.015 -0.018 -0.015 -0.021 -0.013
(0.356) (0.363) (0.356) (0.368) (0.381) (0.276) (0.276) (0.276) (0.278) (0.292) (0.262) (0.262) (0.262) (0.263) (0.263)
log banks 0.556*** 0.613*** 0.556*** 0.558*** 0.548*** -0.143 -0.147 -0.140 -0.159 -0.184 0.270** 0.271** 0.268** 0.310** 0.276**
(0.171) (0.182) (0.177) (0.145) (0.165) (0.148) (0.151) (0.149) (0.144) (0.155) (0.130) (0.131) (0.131) (0.135) (0.132)
Banks without foreign affiliates
0.993*** 0.977*** 1.000*** 0.965*** 0.946*** -0.486 -0.537 -0.492 -0.456 -0.464 (0.326) (0.328) (0.332) (0.328) (0.359) (0.380) (0.387) (0.382) (0.379) (0.384)
Dependent variable net due -1.017* -1.321** -0.252
(0.562) (0.578) (0.347)
Dependent variable cross-border loans
0.201 -0.377 0.223 -0.031 0.050 (0.373) (0.406) (0.289) (0.311) (0.267)
Dependent variable foreign office claims
0.068 -0.164 0.523 (0.447) (0.474) (0.416)
Dependent variable domestic loans
0.813** 0.284 -0.155 (0.357) (0.282) (0.272)
Constant -2.803*** -2.802*** -2.865*** -3.112*** -2.272*** -0.865* -0.931* -0.884* -0.924* -0.552 -0.551 -0.501 -0.561 -0.753 -0.521
(0.592) (0.608) (0.620) (0.559) (0.588) (0.514) (0.505) (0.527) (0.528) (0.546) (0.441) (0.448) (0.446) (0.474) (0.444)
Observations 85 85 85 85 73 127 127 127 127 102 103 103 103 103 103
Pseudo R² 0.0910 0.153 0.0950 0.158 0.176 0.0822 0.0874 0.0823 0.0907 0.0793 0.0304 0.0343 0.0307 0.0436 0.0328
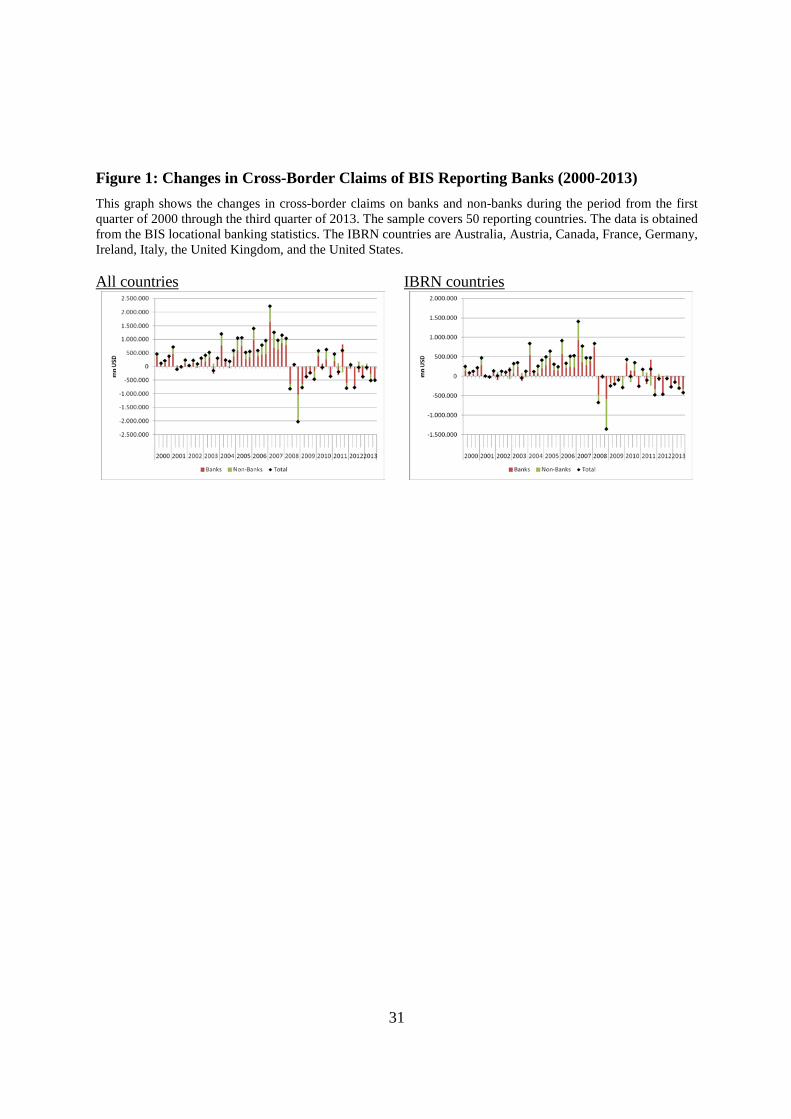
31
Figure 1: Changes in Cross-Border Claims of BIS Reporting Banks (2000-2013) This graph shows the changes in cross-border claims on banks and non-banks during the period from the first quarter of 2000 through the third quarter of 2013. The sample covers 50 reporting countries. The data is obtained from the BIS locational banking statistics. The IBRN countries are Australia, Austria, Canada, France, Germany, Ireland, Italy, the United Kingdom, and the United States. All countries
IBRN countries
32
Figure 2: Stocks of Banks’ Foreign Assets This graph shows cross-border claims on banks and non-banks during the period from the first quarter of 2000 through the third quarter of 2013. The sample covers 50 reporting countries. The data is obtained from the BIS locational banking statistics. The IBRN countries are Australia, Austria, Canada, France, Germany, Ireland, Italy, the United Kingdom, and the United States. Locational Banking Statistics
All countries
IBRN countries
Consolidated Banking Statistics All countries
IBRN countries

33
Figure 3: Lending by Selected IBRN Countries These graphs show domestic loans (Figure a), foreign loans (Figure b) and net intra-bank lending (net due) positions (Figure c) for selected countries and first quarter of 2006 through the fourth quarter of 2012. All series are based on data in national currency and indexed to data of the first quarter of 2006. Net due is positive if a domestic bank is a net debtor to its foreign affiliates. Domestic loans in the first quarter of 2006: USA 8,320,683 Million USD; Canada 783,000 Million CAD; Germany 1,809,324 Million EUR; Ireland 313,332 Million EUR; and Poland 359,114 Million PLN. Foreign loans in the first quarter of 2006: USA 1,414,507 Million USD; Canada 154,000 Million CAD; Germany 630,432 Million EUR; Ireland 73,957 Million EUR; and Poland 77,717 Million PLN. Net due in the first quarter of 2006: USA 219,765 Million USD; Canada 14,600 Million CAD; Germany 121,260 Million EUR; and Ireland 7,099 Million EUR. For Canada, the series refer to all banks including foreign. For Germany, the series refer to German parent banks. For Ireland, the series refer to all residing retail banks including parent and foreign-owned branches and subsidiaries. For Poland, the series refer to banks located in Poland. For the USA, the data series refer to banks with foreign affiliates. Index defined as 100 at 2006Q1. Source: Data provided by country teams.
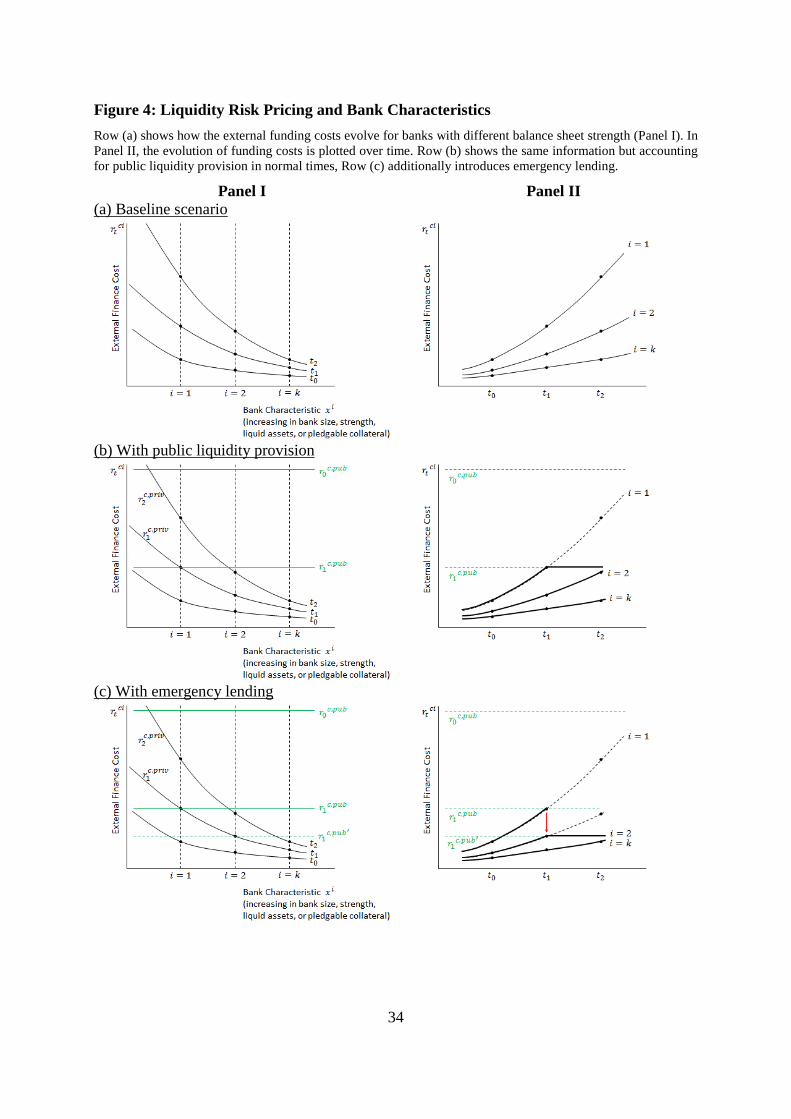
34
Figure 4: Liquidity Risk Pricing and Bank Characteristics Row (a) shows how the external funding costs evolve for banks with different balance sheet strength (Panel I). In Panel II, the evolution of funding costs is plotted over time. Row (b) shows the same information but accounting for public liquidity provision in normal times, Row (c) additionally introduces emergency lending.
Panel I Panel II (a) Baseline scenario
(b) With public liquidity provision
(c) With emergency lending
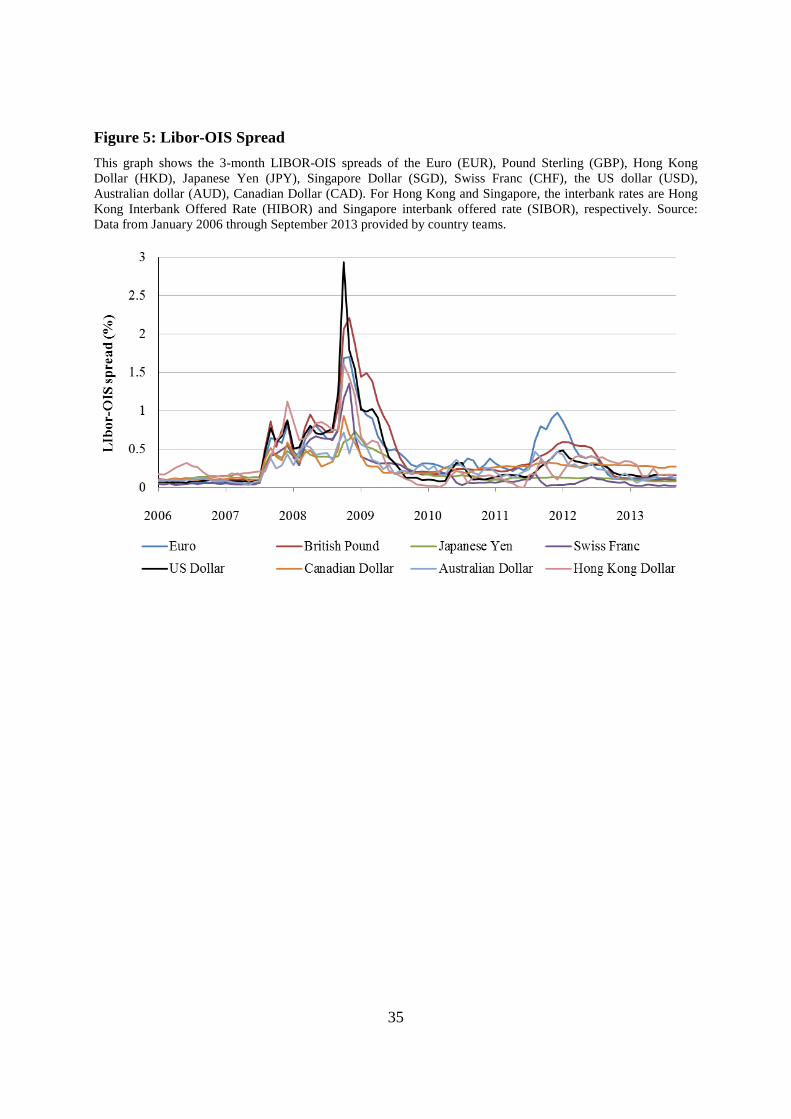
35
Figure 5: Libor-OIS Spread This graph shows the 3-month LIBOR-OIS spreads of the Euro (EUR), Pound Sterling (GBP), Hong Kong Dollar (HKD), Japanese Yen (JPY), Singapore Dollar (SGD), Swiss Franc (CHF), the US dollar (USD), Australian dollar (AUD), Canadian Dollar (CAD). For Hong Kong and Singapore, the interbank rates are Hong Kong Interbank Offered Rate (HIBOR) and Singapore interbank offered rate (SIBOR), respectively. Source: Data from January 2006 through September 2013 provided by country teams.