international bank for reconstruction and...
TRANSCRIPT

Document of
The World Bank
FOR OFFICIAL USE ONLY
Report No: 92248-CV
INTERNATIONAL BANK FOR RECONSTRUCTION AND DEVELOPMENT
INTERNATIONAL DEVELOPMENT ASSOCIATION
INTERNATIONAL FINANCE CORPORATION
MULTILATERAL INVESTMENT GUARANTEE AGENCY
COUNTRY PARTNERSHIP STRATEGY
FOR
THE REPUBLIC OF CABO VERDE
FOR THE PERIOD FY15-17
November 18, 2014
Country Department for Cabo Verde (AFCF1) Africa Region International Finance Corporation Multilateral Investment Guarantee Agency
This document has a restricted distribution and may be used by recipient only in the performance of their official duties. Its contents may not otherwise be disclosed without World Bank authorization
Pub
lic D
iscl
osur
e A
utho
rized
Pub
lic D
iscl
osur
e A
utho
rized
Pub
lic D
iscl
osur
e A
utho
rized
Pub
lic D
iscl
osur
e A
utho
rized

The date of the previous World Bank Country Assistance Strategy for Cabo Verde Progress Report (FY09-12) was January 13, 2011
CURRENCY EQUIVALENTS
(as of November 10, 2014)
Currency Unit: Cabo Verdean Escudo
CVE 129.0287 = 1SDR US$1 = 87.74 CVE 1 SDR 1 = 1.47058
FISCAL YEAR
January 1 – December 31
ABBREVIATIONS AND ACRONYMS
AAA Analytic and Advisory Activities AECID Spanish Agency for International Cooperation and Development AfDB African Development Bank AFRVP Vice President, Africa Region (World Bank) AMP Port and Maritime Agency APL Adaptable Program Loan BADEA Banque Arabe pour le Développement Economique en Afrique (Arab Bank
for Economic Development in Africa) BCV Banco de Cabo Verde (Central Bank) BNPP Bank Netherlands Partnership Program BSG Budget Support Group CAS Country Assistance Strategy CCT Conditional Cash Transfer CEM Country Economic Memorandum CFTD Competitiveness for Tourism Development Project CPIA Country Policy and Institutional Assessment CPPR Country Portfolio Performance Review CPS Country Partnership Strategy CPSPR Country Partnership Strategy – Progress Report CVE Cabo Verdean Escudo CVI Cabo Verde Investments DFID Department for International Development (United Kingdom) DGALF General Directorate of Customs DGT General Directorate of Tourism DSA Debt Sustainability Analysis EC European Commission ECOWAS Economic Community of West African States ECREEE ECOWAS Center for Renewable and Energy Efficiency EPA Economic Partnership Agreement ERDF European Regional Development Fund ETS Economic Transformation Strategy ESW Economic and Sector Work

EU European Union FDI Foreign Direct Investment FSAP Financial Sector Assessment Program FY Fiscal Year GDP Gross Domestic Product GEF Global Environment Facility GNI Gross National Income GPRSP Growth and Poverty Reduction Strategy Paper GTFP Global Trade Finance Program HIV/AIDS Human Immunodeficiency Virus/Acquired Immunodeficiency Syndrome IBRD International Bank for Reconstruction and Development ICIEG Institute for Gender Equality and Equity ICR Implementation Completion Report ICT Information and Communications Technology IDA International Development Agency IDF Institutional Development Fund IDRF Inquérito às Despensas e Receitas Familiares (Family Expenditure and
Income Survey) IE Instituto de Estradas (Road Agency) IFC International Finance Corporation IMF International Monetary Fund IMP Instituto Maritimo Portuario (Maritime Port Institute) INE Instituto National de Estatística (National Statistics Institute) IPP Independent Power Production ISR Implementation Status and Results Report JSAN Joint Staff Advisory Note JSDF Japan Social Development Fund LDC Least Developed Country LPRP Luxembourg Poverty Reduction Partnership M&E Monitoring and Evaluation MCA Millennium Challenge Account MCC Millennium Challenge Corporation MDG Millennium Development Goal MIGA Multilateral Investment Guarantee Agency MpD Movimento para a Democracia (Movement for Democracy) MTEF Medium-Term Expenditure Framework NIS National Investment System NPL Nonperforming Loan ODA Official Development Assistance PAICV Partido Africano da Independência de Cabo Verde (African Party for the
Independence of Cabo Verde) PBC Performance-Based Contract PEMFAR Public Expenditure Management and Financial Accountability Review PER Public Expenditure Review PFM Public Finance Management PIM Public Investment Management PIP Public Investment Program PPP Public-Private Partnership PREM Poverty Reduction and Economic Management Department (World Bank) PRG Partial Risk Guarantee PRSC Poverty Reduction Support Credit

PSI Policy Support Instrument (IMF) QUIBB Questionário Unificado de Indicadores Básicos de Bem Estar (Unified
Survey of Core Welfare Indicators) RRESP Recovery and Reform of the Electricity Sector Project SIGOF Sistema Integrado de Gestão Orçamental e Financeira (Integrated Budget
and Financial Management System) SIL Sector Investment Loan SIM Sistema de Informação Municipal (Municipal Information System) SME Small and Medium Enterprises SOE State-Owned Enterprise SPA Special Partnership Agreement SPE State Participation Service SSA Sub-Saharan African TA Technical Assistance TFP Total Factor Productivity TTCI Travel & Tourism Competitiveness Index TSRP Transport Sector Rehabilitation Project TACV Transportes Aéreos de Cabo Verde (Cabo Verde Airlines) TVET Technical and Vocational Education and Training USD United States Dollar VAT Value-added Tax WAAPP West Africa Agricultural Productivity Program
IDA IFC MIGA
Vice President: Makhtar Diop Jean Philippe Prosper Keiko Honda
Country Director Vera Songwe Saran Kebet-Koulibaly Ravi Vish
Task Team Leader Marie-Chantal Uwanyiligira
Jerome Cretegny Conor Healy
The CPS Core Team was composed of: IDA/IBRD: Vera Songwe (AFCF1), Demetrios Papathanasiou (AFCF1), Eric Brintet (GGODR), Jean Michel N. Marchat (GTCDR), Raja Bentaouet Kattan (AFCF1), Philip English (AFCF1), Mademba Ndiaye (AFREC), Marie-Chantal Uwanyiligira (AFCSN), Sidy Diop (GGDOR), Upulee Iresha Dasanayake (AFCF1), Aifa Fatimata Niane Ndoye (GFADR), Fabrice Karl Bertholet (GEEDR), Jean-Philippe Tre (GFADR), , Pierre Graftieaux (EACNF); Tojoarofenitra Ramanankirahina (GTIDR), Isabelle Celine Kane (GSURR); Evelyn Awittor (AFCF1), Fernando Blanco (GMFDR); Marek Hanusch (GMFDR), Ehui Adovor (DECFP), Andres F. Garcia (GTCDR), Eneida Fernandes Mateev (GTCDR), Kjetil Hansen (GGODR), Andrew Asibey (AFTDE), Edgardo S. Mimica (GGODR), Kofi-Boateng Agyen (GTCDR), Julian Casal (GFMDR), Ndeye Aissatou Diagne Diouf (AFCF1), Ramatulay Barbosa (AFCSN), Anta Loum Lo (AFCSN), IFC Jerome P Cretegny (CAFW3), Elsa Perrine Fabienne Le Borgne (CNGS6), MIGA: Conor Healy (MIGEC).

CABO VERDE
COUNTRY PARTNERSHIP STRATEGY (CPS) FY15-17 TABLE OF CONTENTS
EXECUTIVE SUMMARY ........................................................................................................... I
I. INTRODUCTION ................................................................................................................. 1
II. COUNTRY DIAGNOSIS .................................................................................................. 1
2.1. OVERVIEW..................................................................................................................... 1
2.2. MAJOR DEVELOPMENT CHALLENGES AND THE WAY FORWARD .................. 5
2.3. OTHER DEVELOPMENT CHALLENGES ................................................................. 16
III. GOVERNMENT VISION ............................................................................................... 17
IV. WORLD BANK GROUP COUNTRY PARTNERSHIP STRATEGY ...................... 18
4.1. LESSONS LEARNED AND PROCESS OF CONSULTATION ................................. 18
4.2. WBG COUNTRY PARTNERSHIP STRATEGY FOR FY15-17 ................................ 21
4.3. FINANCING OF THE PROGRAM .............................................................................. 26
4.4. RISKS AND MITIGATION .......................................................................................... 27
List of Figures Figure 1: Cabo Verde’s Polity IV Score Independence ................................................................................ 2
Figure 2: CPIA Scores for SSA, 2013 .......................................................................................................... 2
Figure 3: Changes in Poverty Incidence from 2000 to 2007 ........................................................................ 3
Figure 4: Growth in Cabo Verde and Europe ............................................................................................... 5
Figure 5: The Current and New Fiscal Diamonds ........................................................................................ 9
Figure 6: Key Economic Activities as a Share of GDP, 1998 to 2011 ....................................................... 11
Figure 7: Growth Accounting with Raw Labor .......................................................................................... 13
Figure 8: Growth Accounting with Human Capital .................................................................................... 13
Figure 9: Global Competitiveness of Cabo Verde’s Economy (min = 0, max = 7) .................................... 13
Figure 10: Legal Environment for Business in Cabo Verde and Comparators ........................................... 14 List of Tables Table 1: Poverty by Gender of Household Head, 2007 ................................................................................ 4
Table 2: Analytical Underpinnings of the CPS ............................................................................................. 5
Table 3: Key macroeconomic indicators: 2011 – 2017 ................................................................................ 7
Table 4: Current Active World Bank Portfolio in Cabo Verde .................................................................. 19
Table 5: Pillar I: Outcomes and Indicators* ............................................................................................... 22
Table 6: Pillar II Outcomes and Indicators* ............................................................................................... 24
Table 7: Proposed Lending and Non-Lending Activities ........................................................................... 27 List of Boxes Box 1: Combination of DPL and Sector Operations Instrumental in Advancing Structural Reforms ....... 10
Box 2: Summary of CPS Consultations ..................................................................................................... 20
List of Annexes Annex 1: Cabo Verde CPS Results Framework ......................................................................................... 29
Annex 2: Development Partners: Division of Labor .................................................................................. 32
Annex 3: Statistics in Cabo Verde .............................................................................................................. 33
Annex 4: CPS Completion Report (FY09-12) ............................................................................................ 34
Annex 5: Cabo Verde at a Glance ............................................................................................................... 65
Annex 6: Selected Indicators* of Bank Portfolio Performance and Management ..................................... 68
Annex 7: Summary of Non-lending Services ............................................................................................. 69
Annex 8: Key Economic Indicators ............................................................................................................ 70
Annex 9: Key Exposure Indicators ............................................................................................................. 72
Annex 10: Operations Portfolio – (IBRD/IDA and Grants) ....................................................................... 73 MAP IBRD No. 33383

i
EXECUTIVE SUMMARY
i. Cabo Verde’s strong growth from 2000 to 2008, driven by steadily growing tourism services and accelerated capital accumulation, translated into considerable poverty reduction and boosted shared prosperity. During those years, GDP growth averaged 6 percent annually and the economy grew from US$0.5 billion in 2000 to US$1.8 billion in 2012. Per capita Gross National Income (GNI, Atlas method) reached US$3,630 in 2013, more than four times what it was in 1990, placing the country firmly in the World Bank’s lower-middle-income category. In 2007, Cabo Verde became one of the few nations to graduate from the United Nations list of Least Developed Countries (LDC). The poverty rate dropped from 37 percent in 2001/2002 to 27 percent in 2007. The extreme-poverty rate dropped from 21 percent in 2002 to 12 percent in 2007, while the Gini coefficient fell from 0.55 to 0.48 over the same period. The income of the bottom 40 percent of the population increased as a share of total income from 9.9 percent to 21 percent; its share of consumption expenditures increased from 7 percent to 19 percent. The country also made such steady progress towards achievement of the Millennium Development Goals (MDGs) that achieving all of them by 2015 is within reach.
ii. However, since 2008, Cabo Verde has been severely affected by the global financial crisis and the impact of the European sovereign debt crisis on markets. GDP growth fell from an average of 6.7 percent in the pre-global crisis period (2000-08) to an average of 1.2 percent since then (2009-12). The global crisis has also affected macroeconomic stability, reflected in weakened fiscal and debt sustainability. The adverse external context marked a strong shift in the Government’s fiscal stance. The Government has accelerated its public investment program since 2008 as part of an ambitious drive to draw on remaining concessional resources to provide key infrastructure. The Public Investment Program (PIP) provided a modest impetus to economic growth but resulted in large fiscal deficits and increasing indebtedness.
iii. Cabo Verde understands the need to reset its diversified sources of growth. The Government recognizes that capital accumulation alone cannot sustain high growth rates indefinitely, and that the positive external circumstances that contributed to strong growth in the past have now become significantly less favorable. In the face of a difficult macroeconomic position and a highly uncertain global scenario, the Government’s Third Growth and Poverty Reduction Strategy Paper (GPRSP III) articulates a macroeconomic adjustment in the short to medium term, with a strong structural reform agenda to enhance productivity as the new source of growth and to promote shared and more diverse growth.
iv. Enhancing macroeconomic resilience and ensuring sustained growth through improvements in productivity are two interdependent endeavors. It will be crucial to contain expenditure, and especially to maintain the commitment toward decelerating the Public Investment Program. Fiscal consolidation implies a smaller fiscal envelope, which means that the public sector will need to increase its efficiency in expenditure management and promote a greater role for the private sector in Cabo Verde’s economic growth. A dynamic economy will be a crucial ingredient for reducing the debt-to-GDP ratio and thus strengthening fiscal and debt sustainability.
v. Cabo Verde will have to prepare itself for financing at market terms given that graduating from the UN list of LDCs in 2007 means that access to concessional financing is phasing out. Domestic public borrowing is limited by the need to support the currency peg and the risk of crowding out private investment. Thus, the government will have to mobilize new external resources to finance its existing and future debt obligations. Strong fiscal discipline and

ii
a downward-trending debt-to-GDP ratio will be indispensable for accessing financing at market terms, both from development partners and international capital markets more generally.
vi. Tourism will remain the key driver for growth and enhancing its performance will be critical. Over the past 15 years, the country has succeeded to position itself as a “sun, sea and sand” destination, and in 2013, for the first time the number of tourists visiting in one year exceeded the population of Cabo Verde. The contribution of tourism to local GDP grew from 5 percent in 2000 to around 20 percent in 2012. Given the sustained inflow of Foreign Direct Investment (FDI) in tourism, the sector is expected to continue being a driver of growth and a source of employment in the medium and long term.
vii. Against this backdrop, the FY15-17 Country Partnership Strategy (CPS) aims at supporting Cabo Verde in enhancing macro-fiscal stability and addressing growth challenges. The CPS outlines the financial and technical support of the World Bank Group (WBG), organized around two complementary programmatic pillars: (a) enhancing macro-fiscal stability in order to set the foundation for sustained growth, and (b) improving competitiveness and private sector development. The latter includes support to establish a conducive investment climate and improve the performance of the tourism sector and other sectors (e.g. fisheries and agriculture) that are potential drivers of poverty reduction. Knowledge products will include, among others, technical assistance to help the country develop external financing tools as part of its transition for financing at market terms.

1
I. INTRODUCTION
1. Cabo Verde is an archipelago of 10 islands located off the west coast of Africa. Nine of these islands are inhabited by approximately 500,000 inhabitants. The country has few natural resources and suffers from serious water shortages exacerbated by cycles of long-term drought, one of the main causes of emigration in Cabo Verde’s earlier history. It is believed that now at least as many Cabo Verdeans (and descendants) live abroad as on the archipelago.
2. The preparation of the proposed CPS (FY15-17) was delayed in order to give time to the government and the World Bank Group to assess the severe impact of the global financial crisis and the European sovereign debt crisis on Cabo Verde’s economy. This assessment has informed the design of the proposed CPS. The CPS was also informed by broad consultations with all stakeholders, including government officials and members of civil society and the private sector.
3. The CPS is in line with the GRSP III, and guided by the WBG’s two strategic goals of reducing poverty and boosting shared prosperity. Cabo Verde has already made great strides in reducing extreme poverty and increasing the welfare of the bottom 40 percent. Through the WBG’s focus on agriculture as a cornerstone of poverty reduction, and on strengthening the linkages of tourism to the agriculture and fisheries sectors, the WBG program will support the Government’s target of reducing the poverty rate to 20 percent by 2016. Through support to private sector development, in particular to the tourism sector, the WBG program will boost shared prosperity.
II. COUNTRY DIAGNOSIS
2.1. OVERVIEW
4. Cabo Verde is a robust democracy. The Polity IV index, which measures the strength of a country’s democratic institutions, rates Cabo Verde high in the region. Cabo Verde has not experienced a single coup d’état, a West African record shared only by Senegal. Since the adoption of a multiparty system in 1991, Cabo Verde has enjoyed remarkable political stability. The African Party for the Independence of Cabo Verde (PAICV) and the Movement for Democracy (MpD) have dominated Cabo Verdean politics, with each party having ruled for about a decade and alternating power regularly and peacefully.1 In 2003, Freedom House lauded Cabo Verde’s achievements since independence (Figure 1). Cabo Verde’s strong institutions are reflected in its score in the World Bank’s Country Policy and Institutional Assessment (CPIA) (Figure 2): it ranks at the top among IDA-recipient countries in the Sub-Saharan African (SSA) region, and third among all IDA countries.
1 In fact, currently both parties are in the Government, with the PAICV controlling the cabinet and the MpD the presidency. This power sharing arrangement, in place since the 2011 elections, has been functioning smoothly.

2
Figure 1: Cabo Verde’s Polity IV Score Independence
Figure 2: CPIA Scores for SSA, 2013
Source: Polity IV Project. Note: -10 denotes most autocratic and +10 most democratic. Graph displays West African countries, data availability permitting.
Source: World Bank. Note: SSA average only includes IDA countries.
5. A steadily expanding tourism sector and accelerated capital accumulation were the drivers of economic growth. Fueled by strong external demand, tourism export receipts grew from US$40 million in 2000 to more than US$400 million in 20122, an annual growth rate of 19 percent, much higher than the 6 percent observed for worldwide tourism in this period. The boom in tourism was driven by large FDI inflows, while the extensive utilization of Official Development Assistance (ODA) enabled the Government of Cabo Verde to increase public investment to about 10 percent of GDP over the last two decades. Consequently, Cabo Verde now has a relatively well-developed stock of infrastructure assets. Pivotal to the economic success was the establishment of the exchange rate regime, pegged to the euro, as a new mechanism for conducting monetary and exchange rate policy, which was supported by prudent fiscal policies. In addition, the fixed exchange rate facilitated the growth of FDI, remittances and migrant deposits, producing positive effects on growth, consumption and national savings, and providing liquidity to the domestic financial sector.
6. There has been noticeable progress in terms of poverty reduction and boosting shared prosperity. The poverty rate dropped from 49 percent in 1988/89 to 37 percent in 2001/2002 and then to 27 percent in 2007. The proportion of the population in extreme poverty also dropped significantly, from 21 percent in 2002 to 12 percent 2007. Income distribution and shared prosperity have improved. The Gini coefficient fell from 0.55 in 2002 to 0.48 in 2007, while the income of the bottom 40 percent as a share of total income increased from 9.9 percent in 2002 to 21 percent in 2007. Moreover, the share of expenditures of the bottom 40 percent in total expenditures increased from 7 percent in 2002 to 19 percent in 2007, demonstrating that the welfare of the bottom 40 percent has improved substantially. The GPRSP III projects a reduction in the poverty rate to 20 percent by 2016, to be achieved by promoting modernization of the agriculture and fisheries sectors, in which poverty incidence is most acute, thereby enhancing employment prospects for poor and vulnerable groups.
7. A poverty mapping exercise revealed that tourism growth in Cabo Verde has the potential to lift more people out of poverty. Poverty is particularly low in Sal and Boa Vista, the islands that have experienced much of the tourism growth (Figure 3). These islands were two
2 Latest available official data.
‐10
‐8
‐6
‐4
‐2
0
2
4
6
8
10
1975 1980 1985 1990 1995 2000 2005 2010

3
of the three islands that reduced poverty the most between 2000 and 2007, when tourism grew from 7 percent of GDP to nearly 20 percent. The large drop in poverty rates is largely due to the migration of Cabo Verdeans from other islands to seek economic opportunities in the relatively well-paying tourism sector. While the national poverty headcount is about 27 percent, the poverty headcount among agriculture and fisheries workers is 44 percent and 35 percent, respectively. Poverty among households linked to the tourism sector is just 12 percent. Falling poverty rates on other islands have likely been fueled by internal remittances from relatives working in the tourism sector in Sal and Boa Vista.
Figure 3: Changes in Poverty Incidence from 2000 to 2007
Poverty Incidence (%)
Island 2000 2007
Sal 25 10
S. Nicolau 44 21
Boa Vista 23 11
S. Vicente 29 17
Maio 34 21
Santiago 37 28
S. Antão 48 41
Brava 43 38
Fogo 42 40
Total 37 27
Contribution of population growth and poverty reduction between 2000 and 2010 to the fall in the poverty rate, displayed as changes in natural logarithms to approximate percentage changes.
8. Cabo Verde has also improved its social indicators. Cabo Verde ranks 132nd out of 187 countries in the UNDP’s 2013 Human Development Index (HDI), the third-highest ranking in SSA, putting it in the “medium human development” category. Cabo Verde’s average life expectancy, estimated at 71 years, is the highest in SSA. The infant mortality rate fell from 26 per 1,000 live births in 2007 to 15 in 2011. The maternal mortality rate fell from 36 per 100,000 live births in 2006 to 26 in 2011. By 2011, 94 percent of children under one year of age were fully immunized, and the percentage of the total population living less than half an hour from a health center reached 86 percent. Similarly, education outcomes put Cabo Verde at the top of Sub-Saharan Africa. The adult literacy rate is estimated at 87 percent, although disparities persist between men and women.
9. Despite its rapid economic growth in the 2000s, Cabo Verde continues to experience high unemployment, currently at 16.4 percent, as the rate of job creation has been lower than the growth of the economically active population. The current and projected demographic structure will likely generate a high and growing number of young workers entering the labor force. An analysis of the dynamics of labor force participation by gender indicates that an increasing number of women will enter the workforce. Without a comparable increase in the demand for labor, this trend will increase the unemployment rate, and likely affect women disproportionately. Female unemployment is almost 3 percentage points higher than male unemployment. Cabo Verde’s unemployment is not only biased towards women but also towards youth, and is especially acute among low-skilled workers. Large regional differences in
‐1.1
‐0.9
‐0.7
‐0.5
‐0.3
‐0.1
0.1
due to population growth
due to poverty reduction

4
unemployment are also observed. In addition to high unemployment, the islands of Santiago, Santo Antão and São Vicente show evidence of significant skill gaps.
10. Unemployment is not the only problem affecting Cabo Verde’s young and female populations. Young people and women generally have lower skills and labor productivity and tend to work in low-quality jobs. The available data show that informality is higher than average among women and youth. Individuals younger than 25 years old are mainly employed in the informal sector, the population between 25 and 35 years old is mainly formal, and the population between 35 and 60 years old is distributed almost evenly between formality and informality. The majority of elderly workers are employed in the informal sector. Results also show that informality is highly correlated with female workers, disadvantaging them in the labor market. Table 1 show that households headed by women are significantly poorer than households headed by men across all of the nine inhabited islands.
Table 1: Poverty by Gender of Household Head, 2007
11. In Cabo Verde, the importance of the diaspora is indisputable. The Cabo Verdean diaspora is large and estimated to number at least as many as the population of the archipelago. The vast majority are based in European countries and the United States. Indeed, emigration has been essential to the archipelago and today it is one of the main channels through which the country participates in the global economy. The diaspora supports the Cabo Verdean economy in four ways. First, they send home remittances. Second, they deposit a considerable amount of savings in Cabo Verdean banks, accounting for 40 percent of total deposits. Through financial intermediation, these deposits can support domestic investment and growth. Third, some members of the diaspora have invested in domestic enterprises through FDI. And fourth, it is estimated that Cabo Verdeans returning for holidays and vacations comprise about 20 percent of the total tourism industry.
12. While the diaspora has played and continues to play a critical role in the country’s economic and social life, there is untapped potential to engage the diaspora in supporting the transition of Cabo Verde to a higher income country, either as investors or as agents for the transfer of know-how in several areas of expertise. Furthermore, with about two-thirds of Cabo Verde’s tertiary-educated population living abroad, the diaspora can generate human capital gains. The GPRSP III recognizes the central role that the diaspora can play in the economic development of the country
Island Total Men Women
Santo Antão 0,28 0,26 0,32
Fogo 0,28 0,28 0,30
Brava 0,30 0,25 0,34
Santiago 0,18 0,14 0,21
S. Nicolau 0,12 0,10 0,15
Maio 0,14 0,14 0,14
S. Vicente 0,10 0,08 0,12
Boavista 0,06 0,05 0,06
Sal 0,04 0,04 0,04
.
Poverty at the household level

5
2.2. MAJOR DEVELOPMENT CHALLENGES AND THE WAY FORWARD
13. Cabo Verde faces three interrelated development challenges. First, it is confronted with a difficult external macroeconomic environment, compounded by weakened fiscal accounts and vulnerable external accounts. Second, while economic growth will continue to be mainly driven by the tourism industry, the sector needs to be more closely linked to the rest of the economy, to increase tourism’s multiplier effect. Third, Cabo Verde needs to increase its competitiveness by fostering private sector investment as its future growth has to rely less on physical capital accumulation and more on improvements in productivity.
14. Analytical work prepared in the last 4 years has informed the identification of the country challenges, in particular the recently completed Country Economic Memorandum (CEM).
Table 2: Analytical Underpinnings of the CPS
Cabo Verde: Country Economic Memorandum (2014)
Cabo Verde: Assessment of the performance of the tourism sector (2014)
Cabo Verde: A Diagnosis of Cabo Verde’s Public Investment Management System (2012)
Cabo Verde: Public Expenditure Management and Financial Accountability Review – PEMFAR (2012)
ELECTRA: From Recovery to Sustainability Study (PPIAF) (2011)
Policy Note on SOEs institutional arrangements (2012)
Cabo Verde: Inter-island Transport Study (2011)
Review of the air and port sectors in Cabo Verde (IFC), (2012)
Cabo Verde: Shaping the Future: How Higher Education can Support the Economic and Social Transformation Agenda in Cabo Verde (2012)
Cabo Verde : Policy Note on Macro-Financial Sector Vulnerabilities (2013)
2.2.1 A difficult macro-fiscal scenario and the need to enhance stability
15. The global financial crisis and double-dip recession in the Eurozone exacted a heavy toll on Cabo Verde’s economic growth and macroeconomic stability (Figure 4). After strong GDP growth that averaged 6.7 percent annually since 2000, Cabo Verde experienced a recession in 2009 as GDP contracted by 1.3 percent, recovering modestly to 1.5 percent in 2010 and to 4 percent in 2011. Another recession in the Eurozone in 2012 contributed to renewed economic weakening. Falling imports, decelerating credit to the private sector, contracting FDI, frail business confidence, flat inflation, and increases in unemployment and non-performing loans, suggest that growth has remained anemic since then, estimated at 0.5 percent for 2013 and 1.0 percent for 2014. Overall, Cabo Verde’s average GDP growth rate in the post-crisis period (2009-13) fell to 1.2 percent from 6.7 percent in the pre-crisis period.
Figure 4: Growth in Cabo Verde and Europe
Source: INE, Eurostat, and World Bank staff.
‐6
‐4
‐2
0
2
4
6
8
10
12
2003 2004 2005 2006 2007 2008 2009 2010 2011 2012 2013
Eurozone
Cabo Verde

6
16. The fall in revenues as a consequence of the economic slowdown accounted for almost 40 percent of the deterioration of fiscal balances.3 Due to the simultaneous drop in both tax revenues and donor grants, Government revenues fell from an average of 28.7 percent of GDP in 2006-08 to 25.2 percent in 2009-2013. Tax revenues fell from an average of 21.5 percent of GDP in 2006-08 to 18.6 percent in 2009-13. As a result of the economic crisis among Cabo Verde’s main development partners in Europe, external grants fell from an average of 4.9 percent of GDP to 3.6 percent in 2009-13. In 2014, the government made a considerable effort to increase revenues to counteract the fall in revenues, including the raising of VAT rates to the national level of 15 percent for sectors, including hotels and restaurants, which were previously only subjected to a 6 percent rate. The revenue outturn of the first half of 2014 shows that this has translated into considerable revenue gains on VAT; however, persistent economic weakness continues to moderate the overall revenue outturn. This CPS, through the PSRCs series, will continue to support government’s efforts in improving tax revenues.
17. Increases in total spending, and in particular investment, have been responsible for the remaining 60 percent of the worsening fiscal balances. The wage bill has remained stable at around 11 percent of GDP, which is comparable to that of other small economies in which economies of scale are not available. As a result of the recent elimination of energy subsidies, price-supporting measures in Cabo Verde are very low, at less than 1 percent of GDP. However, the authorities have undertaken an ambitious investment program, mostly financed by concessional borrowing. When the Public Investment Program was initiated in 2008, public investment more than doubled. Since then, public investment as a percentage of GDP (including investments through SOEs) has remained in double-digits. To some extent, strong public investment constituted a counter-cyclical policy response against strong economic headwinds from 2009 onward—although its economic multiplier effect tends to be small due to an import content of about 90 percent. Expansionary fiscal policy led to increased deficits and reversed the declining trajectory of the public debt, which reached an estimated 99 percent of GDP in 2013. However the debt is largely concessional, with an average maturity of 23 years and an average interest rate of only 0.75 percent, such that interest payments are low, at about 2 percent of GDP.
18. A stochastic Debt Sustainability Analysis (DSA) prepared by the Bank team indicates that the trajectory of public debt is sustainable, but significant vulnerabilities will persist in the short term. Based on the authorities’ Medium-Term Expenditure Framework (MTEF) and Medium-Term Debt Strategy (MTDS) for 2014-17, which were agreed by the Bank and authorities, the DSA indicates that the debt-to-GDP ratio is expected to reverse its increasing trend in 2016, when it will reach a peak of about 120 percent of GDP. It is then expected to fall slowly to about 80 percent of GDP by 2030.
19. Financing its debt obligations will become a key challenge for the country, as concessional resources decline. The Public Investment Program is almost entirely financed by project loans from bilateral and multilateral development partners. Gaps in the operating balance4 and amortizations are financed mainly with domestic public borrowing and budget support. Both are limited: domestic public borrowing is limited by law to 3 percent of GDP, and budget support is limited by the financing allocations of development partners—which are either phasing out or becoming less concessional following the country’s graduation from LDC status. Future borrowing will increasingly be devoted to servicing the outstanding debt (i.e. interest payments and amortizations). Gross Financing Needs (GFN) are expected to fall, driven by the retrenchment of the Public Investment Program, and by recent efforts to mobilize domestic
3 The CEM (2013) provides details on the contributing factors of the fiscal expansion 2009-13. 4 The operating balance is the fiscal balance, excluding capital expenditure.

7
revenue. However, it will be a crucial challenge for Cabo Verde to access new non-concessional external financing to service its debt obligations. Table 3 presents the key economic indicators for 2011-2017.
Table 3: Key macroeconomic indicators: 2011 – 2017

8
Medium term outlook
20. The challenge for fiscal policy in the coming years is to strike the right balance between supporting growth and preserving macroeconomic discipline and debt sustainability. The Government should pursue a gradual medium-term fiscal adjustment trajectory. On the revenue side, building on the achievements of the tax reform5, the Government should continue the revenue reform by closing tax loopholes, and consolidate achievements in tax administration.
21. On the expenditure side, the Government should pursue the gradual declining trajectory of public investment. Both the 2015 budget and the Medium-Term Expenditure Framework (MTFF) for 2014-2017 indicate that the retrenchment of public investment and net lending has commenced in earnest. Some large foreign-financed investments, including a social housing program, expansion of the Praia airport, the renovation of the Boa Vista seaport, and an energy project financed by IBRD, will keep investment spending relatively high until the completion of these projects. The Government will not add any new projects to the PIP but focus on execution of existing projects. Furthermore, the Government has begun developing a new national public investment system with Bank support whereby all investment projects will be subject to a rigorous technical assessment to calculate financial, economic and social returns based on reliable statistics. This should help the Government select investment projects that guarantee value for money.
22. The fiscal adjustment required over the medium term to maintain debt sustainability is feasible and consistent with the Government’s new economic growth model. Reducing debt levels implies lower spending, which suggests that growth-enhancing fiscal policies will come not from higher public investment, but mainly from expenditure reallocations and efficiency enhancements. At the same time, falling ODA needs to be offset by increased efficiency in tax collection. The “fiscal diamond” (Figure 5) illustrates Cabo Verde’s shifting fiscal priorities, with a stronger emphasis on domestic revenue and expenditure efficiency. Reducing borrowing in a context of declining ODA flows requires efforts to increase domestic resource mobilization and reducing public expenditures, especially public investment. Not only do these have short-term macroeconomic implications, but they should also shape the country’s new fiscal policy for growth: less aid, less borrowing, more domestic revenue and more efficiency. Implementation of the PEMFAR6 recommendations through the modernization of public finance management (PFM), enhancement of the public investment management (PIM) system, and improvements in the performance of SOEs, will be critical for the fiscal consolidation.
5 To strengthen domestic revenue mobilization, the Government adopted a tax package that increased the value-added tax (VAT) rate paid by hotels and restaurants from 6 to the standard rate of 15 percent; broadened the base of the VAT to include public utilities and oil; introduced a tourism fee of 2 euros per guest per night and a fee for the statistical registration of customs transactions; and expanded the base of the ecological tax on non-biodegradable imports. 6 The recent Public Expenditure Management and Financial Accountability Review (PEMFAR, 2013) prepared by the Bank, the AfdB, the EU and the Spanish Agency for International Cooperation (EACID), provides a more detailed assessment of Cabo Verde’s government expenditure management. This assessment covers expenditure management in the health, energy and environment sectors

9
Figure 5: The Current and New Fiscal Diamonds
Source: Bank staff, Country Economic Memorandum, 2014
23. Finally, the Government will need to prepare itself for financing at market terms. Expanding the financing envelope and reducing reliance on concessional budget support, while staying within the statutory limit for domestic borrowing, will be crucial for the Government to finance its debt. The African Development Bank has already phased out concessional budget support to Cabo Verde; the European Union will stop providing concessional budget support grants in 2020. In the future, World Bank budget support will be provided under IBRD terms. Moreover, as any emerging economy, Cabo Verde will increasingly have to access international capital markets. The small volumes of bond issues associated with a small economy, and high indebtedness resulting in weak sovereign credit ratings, will pose hindrances.
2.2.2 Improving state-owned enterprise (SOE) performance and public sector efficiency
24. Contingent liabilities incurred through state-owned enterprises pose significant fiscal risks and exacerbate medium-term vulnerabilities. SOEs in Cabo Verde provide vital services, especially in the strategic areas of transport, water, and electricity. The five largest SOEs in Cabo Verde are Empresa Nacional de Aeroportos e Segurança Aréa (ASA, operating the country’s airports); Empresa Nacional de Administração dos Portos (ENAPOR, operating the country’s harbors); Transportes Aéreos de Cabo Verde (TACV, the state airline); Empresa de Electricidade e Águas (ELECTRA, the national water and electricity utility); and Imobiliária, Fundiária e Habitat (IFH, providing housing services). These five SOEs account for 70 percent of state-owned capital and hold assets equivalent to 32 percent of GDP. Four of the five focus on transport and utilitiesvital areas for economic development and poverty reduction.
25. These SOEs have long been a source of contingent liabilities for the government, due to their generally weak commercial and financial performance. Given that the central government is the main shareholder, it directly or indirectly bears all risks of the SOEs’ poor financial performance. The total debt of SOEs reached 26 percent of GDP in 2012. While the SOE debt guaranteed by the state amounts to just 4 percent of GDP, the critical services that SOEs provide mean that the state is effectively obligated to lend financial support to the SOEs even on non-guaranteed obligations. The SOEs sometimes cover their losses by postponing maintenance or reducing services, but normally they induce financial transfers from the central government by defaulting on debts or accumulating arrears with providers. Cumulative debts and triggered contingent liabilities result in periodic recapitalization and debt swaps. Therefore, the effective contingent liabilities generated are actually much higher than the SOE debt officially guaranteed by the state. According to a recent Ministry of Finance report on SOEs (2013),
0
2
4
6Aid
Domestic Revenue
Debt
Expenditureefficiency
Current New

10
Box 1: Combination of DPL and Sector Operations Instrumental in Advancing Structural Reforms
The PRSC series and the transport sector credits have been supporting each other and helping advance the reform agenda in the transport sector. Actions supported under PRSC VIII related to publication of the consolidated report on the 2011 SOE financial statements by the Ministry of Finance. The audited statements of the main SOEs provided the detailed financial information needed to analyze the weaknesses of those SOEs, and to define the needs of the transport SOEs in terms of technical assistance and reforms. TA in the air transport sector (funded by the Road Sector Support Project closed in June 2013) helped define short-term strategic cost-saving measures, including actions under the PRSC VIII, such as shutting down losing routes and reviewing the free travel policies for staff and families.
The signing of performance agreements between the Government and ASA, ENAPOR, and TACV is a proposed action for PRSC X. The drafting of these agreements will be supported by the TA component of the new Transport Sector Reform Project (TSRP). In the road sector, the TSRP is funding performance-based road rehabilitation and maintenance contracts covering four islands and about 35 percent of the national road network, contributing to the 65 percent target objective set for 2015 in the PRSC series. PRSC IX supported the revised fare policies for ENAPOR (ports), also supported by the TSRP, which finances the necessary consulting services.
In the electricity sector, reforms supported by the PRSC series led to the resolution of longstanding legislative and regulatory issues (passage of legislation securing electricity bill payment by municipalities, and more recently final adoption of new legislation to strengthen judicial enforcement of measures against electricity theft). This was complemented by the IBRD-funded Recovery and Reform of the Electricity Sector Project (RRESP) which is financing energy mix investments and ELECTRA reform that have reduced the frequency and duration of load shedding and fuel costs.
underlying contingent liabilities in SOEs amounted to 11.6 percent of GDP in 2012 (including both guaranteed and non-guaranteed debt). The same report states that aggregate financial losses reached 1.4 percent of GDP in 2011 and 1 percent of GDP in 2012. A social housing project, Casa Para Todos, implemented by IFH, is financed with a loan equivalent to about 11 percent of 2013 GDP.
26. Reforming SOEs to ensure their financial sustainability is one of the major challenges for the near future. Support under the previous CPS has yielded tangible results (Box 1). But analytical work conducted by the WBG confirms that there is room to significantly improve SOE performance in delivering services. Over the last five years, the Government has been working to strengthen SOE management and oversight. In 2009, the Govenment adopted a new law restructuring the legal and governance framework for SOEs (Lei do Setor Empresarial do Estado). However, the effectiveness of state oversight and ownership continues to be limited by weak institutional capacities. Reforming the governance of SOEs need not only address inefficiencies in service delivery, but also improve financial performance to reduce contingent liabilities and improve the sustainability of public debt. In particular, ensuring that Casa Para Todos is implemented as originally anticipated will make a major contribution to reducing the debt-to-GDP burden.
2.2.3 Enhancing the performance of the tourism sector
27. Since 2007, tourism has been the main driver of growth in Cabo Verde (Figure 6). Tourism in Cabo Verde began when the Government started buying vast tracts of land in Sal and Boa Vista, two islands with attractive beaches and small populations; and also created special tourism development zones to encourage FDI. In 2010, hotels and restaurants generated 83 percent more jobs than in 2000, underlining the sector’s ability to generate employment. Sixty-four percent of those jobs were held by women. The World Travel and Tourism Council7
7 World Travel and Tourism Council. 2013. Cabo Verde Economic Impact Report.

11
estimates that the tourism and travel sector generates around one-eighth of all jobs in Cabo Verde. If indirect jobs are added to the equation, the sector generates more than 30 percent of employment with its linkages to other sectors such as construction, and to a lesser extent, agriculture, and fisheries.
Figure 6: Key Economic Activities as a Share of GDP, 1998 to 2011
Source: Central Bank 2012a and 2012b.
28. The capacity to design and implement a second generation tourism strategy is very limited and dispersed among several stakeholders. The tourism sector is currently overseen by the General Directorate of Tourism (DGT) within the Ministry of Tourism, Industry, and Energy. Tourism investment promotion is handled by Cabo Verde Investments (CVI), but its activities are limited in scope. As highlighted in the GPRSP III, the CVI’s inadequate capacity and dispersion are reflected in poor promotion and marketing, lack of data8 analysis to support decision-making, weak regulatory capacity, limited dialogue with the private sector, and lack of product diversity and supply. As identified in the GPRSP III, the Government needs to establish a national tourism organization with strong private sector involvement to provide much-needed leadership.
29. Environmental quality is a matter of serious and growing concern, particularly given the importance of natural capital to the tourism industry. Maplecroft, in its 2015 climate change vulnerability index (CCVI)9 identifies West Africa coastal areas as at high risk. Coastal erosion, sand extraction, the mismanagement of limited water resources and various forms of pollution all pose a significant threat to the country’s growth prospects. In addition, as a small island nation, Cabo Verde faces significant challenges associated with climate change—especially rising sea levels and the greater frequency of severe weather patterns—which could increase the likelihood and severity of droughts and flooding. Rapid economic growth is often associated with environmental degradation, and environmental issues are particularly pertinent for Cabo Verde, as the health of the tourism industry largely depends on the natural beauty of the archipelago.
30. The country’s tourism potential and the corresponding development impact remain to be fully exploited. Tourism development in general, and especially more recent projects, have 8 Cabo Verde’s 2013 ranking of 111 (of 140 countries) in “Comprehensiveness of Travel & Tourism Data” by the World Economic Forum’s Travel & Tourism Competitiveness Index (TTCI). The TTCI assesses 140 countries against 75 indicators under 14 different pillars. 9 Climate Change and Environmental Risk Atlas (CCERA) released by global risk analytics company Maplecroft on 29 October 2014.
0%
5%
10%
15%
20%
25%
1998 2000 2002 2004 2006 2008 2010% o
f G
ross
Dom
estic
Pro
duct
Tourism
Air transport
Primary sector
Industry

12
tended to favor the model of large-scale, all-inclusive resorts, with smaller accommodations on more populated islands often catering to the local population rather than to international visitors. A recent World Bank study finds that all-inclusive resorts and larger bed and breakfasts, especially those targeting high-end tourism, have the biggest effect on the economy. Apart from their considerable contribution to the national budget through taxation and the generation of employment, they can also have a considerable effect on national production through linkages with other sectors, especially services, fishing and agriculture (fresh food and vegetables). However, such linkages are underdeveloped due to the weakness of inter-island transport and local agriculture, which limits the ability of the tourism sector to reduce poverty and increase shared prosperity.
31. Investing in agriculture value chain development will focus on increasing agricultural productivity and promoting links between producers and the tourism sector. Efforts in the agriculture sector have focused on managing irrigation, dam and reservoir construction, expanding the area under drip irrigation; introducing new technologies10; extension services, rural road construction; and improving access to finance. In total eight dams are planned in order to supply 7 million m³ of water to irrigate 700 ha of land and allow several crop rotations a year. The result is a clear increase in output and a more commercial orientation away from subsistence and reliance on staples, but more efforts are needed to improve agriculture productivity through the adoption of improved technologies. In addition, to enable producers to enter the tourism value chain will require promoting contract farming mechanisms with local food traders and hotels and ensuring that the local supply is of the quality required for targeted markets. There is a clear opportunity for job creation for youth and women in particular in the areas of services, production, processing and marketing. This will help address some of the country’s major development challenges, including the high rate of poverty among farmers (44 percent) as well as the high rate of unemployment among local youth and women.
2.2.4 Improving competitiveness and private sector development
32. In Cabo Verde, total factor productivity (TFP) has been weak in recent years. Different growth decomposition exercises undertaken for the 2014 Country Economic Memorandum indicate that TFP has had a negligible or even negative impact on growth. A simple decomposition exercise using physical capital and labor force shows that after a negative contribution since independence in 1974, only in the period of 19952000 did TFP have a positive contribution to growth. Factoring in Cabo Verde’s considerable improvements in education, as well as a growth dividend from an expanding labor force, the calculations suggest that TFP has made a consistent and negative contribution to GDP growth (Figures 7 and 8).
33. To continue to enhance its growth potential and move up the income ladder, Cabo Verde will need to make productivity its new driver of growth. Intensifying investment in human capital is one element of this story. Reallocation of factors from low to high-productivity sectors will also be necessary, with improvements in labor force skills and labor market flexibility to enable these reallocations. This implies enhancing the performance of the main source of growth—the tourism sector—as well as the supporting sectors (such as infrastructure, financial sector, and skills development). The public sector will increasingly have to assume an enabling role for private sector-led growth.
10 For example new varieties, micro irrigation, hydroponics.

13
2.2.4.1 Investment climate
34. Cabo Verde needs to undertake further investment climate reforms and address a number of cross-cutting constraints to improve its global competitiveness. Some of Cabo Verde’s key weaknesses identified by the 2014 Global Competitiveness Report (Figure 9) include its market size (due to its limited domestic market); infrastructure (constraints relating to electricity supply, mobile phone subscriptions, availability of airline seats); innovation (limited availability of scientists and engineers, weak spending on R&D, limited patents); financial market development (high cost of financial services, difficult access to credit); and technological readiness (relatively limited internet bandwidth and internet penetration).
Figure 9: Global Competitiveness of Cabo Verde’s Economy (min = 0, max = 7)
Source: Global Competitiveness Report 2013-2014, World Economic Forum.
35. In terms of the legal environment, Cabo Verde was 122nd out of 189 countries in the overall 2015 Doing Business ranking (Figure 10): There has been significant progress in some areas. For example, the One-Stop-Shop reduced the registration process from 52 to 10 days, and the number of procedures from 12 to 7, between 2008 and 2014. However, from an international
0
1
2
3
4
5
6
7Institutions
Infrastructure
Macroeconomicenvironment
Health and primaryeducation
Higher education andtraining
Goods marketefficiency
Labor marketefficiency
Financial marketdevelopment
Technologicalreadiness
Market size
Businesssophistication
Innovation
Cabo Verde (122th) Switzerland (1st)
Figure 7: Growth Accounting with Raw Labor
Figure 8: Growth Accounting with Human Capital
‐8
‐4
0
4
8
12
16
80‐85 85‐90 90‐95 95‐00 00‐05 05‐10
Capital:a*dlnK
Labor:(1‐a)*dlnL
Productivity:dtfp
‐10
0
10
20
80‐85 85‐90 90‐95 95‐00 00‐05 05‐10
Capital:a*dlnK
Human Capital: (1‐a)*dlnH
Productivity:dtfp

14
perspective, although the country performs better than immediate neighbors such as Mauritania, Senegal or The Gambia, it ranks well below the best African performer—Mauritius—which is ranked 28th. Cabo Verde still lags behind in many areas, including (a) lengthy procedures to get construction permits; (b) difficulty in obtaining credit; (c) complexity of trade procedures; (d) the lack of a bankruptcy law; an ineffective court system (e.g., it takes many years for banks to redeem collateral in case of loan default); and (f) the high cost of electricity. Investment climate reforms in these and other areas are critically needed if the private sector is to play the envisioned leading role in economic growth. This is especially important for the tourism sector, as it operates in a very competitive global market, where the high cost of doing business translates into a less price competitive sector.
Figure 10: Legal Environment for Business in Cabo Verde and Comparators
Source: The World Bank
36. Despite substantial progress in human capital development over the past two decades, improving human capital productivity remains a challenge. The Government has spent a considerable share of its budget on improving the education system. Between 2000 and 2010, total economically active population increased by 28 percent and the employed population by 25 percent, even as total population increased only 13 percent. Increased labor force participation resulted in a demographic dividend for the economy. However, the World Economic Forum 2012 Competitiveness Report scores Cabo Verde poor on labor market efficiency (124th out of 142 countries). A better functioning of the labor market is another element of the reform agenda to ensure that improvements in the qualifications of the labor force are reflected in higher labor productivity.
2.2.4.2 Ensuring financial stability and expanding access to credit
37. Cabo Verde’s financial sector is relatively well developed, with credit to the economy close to 60 percent of GDP. The financial sector is dominated by eight commercial banks (four larger and four smaller), which together account for about 80 percent of financial sector assets. There are 10 non-bank financial institutions including a venture capital firm, three currency exchange bureaus, a payment services provider, a leasing company, three securities fund management companies, and a money services provider. A public-private risk guarantee agency has been established to support lending to small and medium enterprises (SMEs), but it is not yet operational. The stock exchange has four listed companies with a total market capitalization of US$91 million. There are also a number of offshore national banks, which have very limited linkages with the domestic economy and are poorly regulated, making them a source of reputational risk for the country. Most Cabo Verdeans have bank accounts at commercial banks. There are 1,138 bank accounts per 1,000 adults, about twice as many as in peer countries, which have a median of 545 accounts. The Government has started a number of

15
initiatives to improve financing for SMEs, including Novo Banco (a publicly owned commercial bank), CV Garante (a credit guarantee scheme), a venture capital fund, and a fund to foster entrepreneurship. The Government is also improving the conditions for microfinance.
38. However, access to finance for small and medium enterprises remains a major obstacle in Cabo Verde. While large corporations can borrow relatively easily and at interest rates comparable to those in the Eurozone, SMEs, which account for 95 percent of Cabo Verde’s private sector companies, struggle to obtain finance. In the 2014 Global Competitiveness Report, access to finance is rated as the single most important constraint to doing business in Cabo Verde, with almost a quarter of survey respondents identifying it as a major obstacle. In addition, the global financial crisis and Eurozone recession have not left Cabo Verde’s banks unscathed, aggravating existing vulnerabilities. Some of the vulnerabilities in Cabo Verde’s financial sector are a consequence of the small size of the market. For example, most banks are exposed to the same large clients, mostly in the real estate and construction sector. This increases the risk of contagion from shocks across financial institutions.
39. Regulatory capital ratios have been falling as asset quality has declined due to weak profitability. Non-performing loans (NPLs) have increased considerably since the onset of the global financial crisis, reaching 20 percent in September 2013. Capital asset ratios fell as banks built provisions, accounting for rising NPLs. The Central Bank has taken an increasingly proactive role in supervising banks, with a considerable amount of technical assistance from partners to closely monitor and address vulnerabilities in the financial sector.
2.2.4.3 Improving infrastructure management
40. Cabo Verde has taken significant steps to close its infrastructure deficits through high rates of public investment, which have largely been financed through an intense effort to mobilize external revenues. Cabo Verde now has a relatively well-developed stock of basic infrastructure. Nearly all of the nine inhabited islands have both marine and air access, and more than 72 percent of the national road network is paved, however maintenance is still an issue. The country has four international airports and three local airports, as well as nine seaports, seven of which have been modernized and expanded in the last five years. Its energy generation capacity is 156 MWs, of which almost 25 percent is renewable. As of 2014, more than 98 percent and 60 percent of the population have access to electricity and running water services, respectively.
41. Maintaining and making the most of the country’s infrastructure has become a top priority for Cabo Verde. For example, while the national electrification rate is high—as a consequence of large investments in energy—the 2014 Global Competitiveness Report ranks the quality of Cabo Verde’s electricity supply as very poor, with frequent and lengthy power cuts. And whereas much of the transport infrastructure is in good condition, inter-island connectivity is a major bottleneck for economic integration. Therefore, one of the most crucial challenges at this stage is to improve the management of electricity and transport SOEs, bringing in the private sector through private-public partnerships (PPPs) to improve services and maintain existing infrastructure.
42. Energy: With support of World Bank investments and TA and development policy loans, since 2011, notable progress has taken place in the electricity sector, including the resolution of longstanding legislative and regulatory issues (passage of legislation securing electricity bill payment by municipalities, and more recently final adoption of new legislation to strengthen judicial enforcement of measures against electricity theft). Since 2012, Cabo Verde is unique in West Africa in having adopted and successfully implemented tariff regulation mechanisms which ensure full cost recovery on a sustained basis. While much remains to be done to improve

16
ELECTRA’s operational performance, the measures implemented by the GoCV since 2011, have allowed the utility company to make significant progress in key areas such as addressing the backlog of gen-set maintenance and improving the generation mix. In particular, the frequency and duration of load shedding have improved markedly since 2011 and 2012, and fuel costs have decreased significantly thanks to renewable generation penetration. The government is pursuing the reform of ELECTRA and the scale up of its energy mix, including increasing the share of renewable energy.
43. Ports: In 2013, the Government undertook a series of reforms with WBG support, aimed at increasing private sector participation in the operation and delivery of port services. These included review and amendment of the Law of Ports of 2010; a new regulatory framework for the sector; changes in the statutes of the Maritime Port Institute (Instituto Maritimo Portuario, IMP), which became the Port and Maritime Agency (AMP), charged with economic and technical regulation of the sector; and changes in ENAPOR to turn it into a concessionaire of existing ports, with a new legal basis for entering into sub-concession contracts.
44. Air transport: One of the most difficult challenges facing the transportation sector is air transport. At the core of these challenges is the difficult financial position of Cabo Verde’s national airline, Transportes Aereos de Cabo Verde (TACV). Due to the geographic disposition of the Cabo Verde archipelago and the unreliability of maritime transportation between islands, air transportation has become the dominant transport mode for the development of tourism beyond the three islands with international airports, and the only practical option for reaching certain destinations. TACV’s financial solvency has been hampered for years by an array of managerial and structural issues, such as the lack of proper assessment of economically viable routes and ticket pricing, high labor costs, revenue leakages, lack of appropriate controls and financial reporting, and rapidly accumulating arrears. Large resulting losses have required capitalizations by the central government, which have made TACV, as currently managed, a fiscal liability for the state.
2.3. OTHER DEVELOPMENT CHALLENGES
2.3.1 Regional Integration
45. While Cabo Verde is a very open economy, its links with the global economy are highly concentrated in Western Europe. The increasing importance of the tourism industry has led to a commensurate dependence on the Eurozone economies. The United Kingdom, France, Germany, Portugal, and Spain are the most important consumer markets for Cabo Verde’s tourism service exports, as well as the most important sources of imports and FDI inflows. These countries are also among the major destinations for Cabo Verdean emigrants, and together with the United States they represent the main source of remittances. In addition, donor institutions of Portugal, Spain, and the European Union (EU) have been major sources of ODA inflows. The exchange rate peg to the euro also reinforces the ties with Europe. In addition, in 2007, Cabo Verde and the EU signed a Special Partnership Agreement (SPA), which offers Cabo Verde access to European internal markets as well as the possibility to gradually take part in certain EU policies and programs. The agreement also encompasses the possibility of funding from the European Regional Development Fund (ERDF) in the framework of cooperation with the outermost regions and other budget lines managed by the European Commission.
46. Despite some increase in the last years, Cabo Verde’s trade, investments and migration flows with the Africa Region are marginal. Cabo Verde is part of ECOWAS, but its share of exports and imports to the other 13 members of ECOWAS constitute barely 2 percent of total trade flows. For many years, ECOWAS regional integration was slow and uneven, but this

17
process has recently been accelerated, especially due to the adoption of the ECOWAS common external tariff, expected to begin in January, 1, 2015, and the ongoing negotiations on the West Africa Economic Partnership Agreement (EPA) with the EU. Furthermore, the protracted recovery of the Eurozone countries and Cabo Verde’s overall diversification strategy suggest that integration with the Africa Region and other markets needs to be explored, in view of the potential now arising from trade with emerging economies. The GPRSP III recognizes the need to diversify Cabo Verde’s partnerships, and this CPS will further strengthen Cabo Verde’s regional cooperation, with the inclusion of Cabo Verde in West Africa regional programs, including the ongoing West Africa Regional Fisheries Program and the upcoming West Africa Agricultural Productivity Program.
2.3.2 Statistical capacity
47. Cabo Verde’s statistical development is weak for a middle-income country (Annex 3). According to the World Bank’s statistical capacity index, Cabo Verde scored 66 in 2013, above the averages of 63 and 60 for IDA countries and Sub-Saharan African countries respectively, but well below the IBRD average of 75. The main constraints include lack of predictable funding, dependence on donor support for the implementation of surveys and censuses, and the scarce human resource capacities associated with the small size and geographic fragmentation of the country. The low and unpredictable funding and limited technical capacity led to (a) infrequent and limited quality of micro- and macro-data; (b) weak systems and analytical capacity to monitor and evaluate the effectiveness of public policies; (c) undeveloped systems to archive, disseminate and grant access to statistical products and indicators. Several donors, including the World Bank through the Trust Fund for Statistical Capacity Building, as well as the African Development Bank, the IMF, and bilateral donors are currently providing TA to the National Statistics Institute (INE).
III. GOVERNMENT VISION
48. The challenges identified above are reflected in the GPRSP III, which lays out Cabo Verde’s transition to a productivity-driven economic model. The GPRSP III entails several important policy shifts compared with previous poverty reduction strategies. The most important is significantly greater emphasis on the structural reforms needed to improve the country’s competitiveness. The GPRSP III sets out an ambitious structural reform agenda to improve the efficiency of public sector investment and SOE service delivery, enhance the investment climate, and reform the labor market to raise productivity and foster private sector development. Gender is identified as a cross-cutting issue in the GPRSP III, with the Cabo Verde Institute for Gender Equality and Equity (ICIEG) responsible for implementing its gender-related objectives. The CPS and the GPRSP III are closely aligned across all these areas.
49. A notable shift is the focus on eliminating extreme poverty through the development and modernization of the agriculture and fisheries sectors, and promoting shared prosperity by strengthening the linkages of the tourism sector with these primary sectors. Because of the untapped potential of the agriculture sector, and, given the strong incidence of extreme poverty in rural areas, the GPRSP III directs special attention to enhancing agricultural productivity and its linkages with the tourism sector by, for example, increasing the use of Cabo Verdean agriculture products by tourism operators. In addition, policies on human capital development, in particular TVET, are priority areas to boost shared prosperity
50. The GPRSP III supports the development of these seven economic clusters through interventions organized under five areas of intervention, or axes:

18
Infrastructure. Policies under this axis are designed to alleviate remaining infrastructure bottlenecks through completion of the Government’s public investment program in energy, multi-modal transportation (seaports, airports and road transportation), and water mobilization and irrigation facilities. The GPRSP III pays particular attention to institutional and managerial reforms in the energy and transportation sectors, as infrastructure assets in these sectors have been completed in the recent years.
Developing Human Capital. Interventions under this axis have two objectives: (a) to create a more competitive labor force and ensure that growth is sufficiently inclusive to improve income distribution; and (b) to strengthen Cabo Verde’s global competitiveness in technology-intensive industries. Programs under this pillar are viewed as fundamental for the promotion of sustainable and shared prosperity.
Good Governance. The objectives of this axis are to (a) bolster the country’s resilience to adverse shocks by strengthening its macro-fiscal position; and (b) increase the effectiveness of public service delivery, including new initiatives in critical areas such as the national planning system, public investment management, the government-wide M&E system, statistical development, and the oversight and reform of SOEs.
Support to the Private Sector. The overarching focus of the GPRSP III is to shift responsibility for the country’s economic development to the private sector. This axis includes specific measures to expand trade openness, improve the tax system, promote financial sector stability, and enhance the overall business and investment climate, and increased private sector participation in infrastructure service delivery. The GPRSP III clearly depicts the Government’s role as a catalyst and facilitator of the new economic model it proposes.
Development of Global Partnerships. In an environment of declining aid flows and reduced access to concessional financing, Cabo Verde still requires intense resource mobilization and technical assistance from both traditional and new partners. Hence the GPRSP III calls for comprehensive plan to diversify sources of funding to include new bilateral trading partners such as China, Brazil, the Middle East, and the West Africa region.
IV. WORLD BANK GROUP COUNTRY PARTNERSHIP STRATEGY
4.1. LESSONS LEARNED AND PROCESS OF CONSULTATION
51. The proposed CPS builds on the achievements of the previous CPS11. The Bank Group’s CPS for Cabo Verde and its program of support activities were designed to assist the Government in achieving the higher-level development goals that were outlined in its second Growth and Poverty and Reduction Strategy Paper for 2008-2011. The performance of the previous CPS-supported program (FY09-FY12) was rated Moderately Unsatisfactory, mainly due to slow implementation of pillar three (Strengthening Human Capital and Social Inclusion). As detailed in Annex 4, substantial outcomes were achieved under pillar 1 (Promoting Good Governance and Public Sector Capacity), and to some extent under pillar II (Improving Competitiveness and the Investment Climate for Private Sector Growth).
52. The approach of the CPS is informed by lessons learned from the implementation of the previous CPS, including:
11 The previous CPS was not a joint a WBG product; it was only a World Bank product.
19
Use of instruments: Cabo Verde’s experience in transport and energy demonstrates how policy reforms under the PRSC series, combined with operational support under investment projects, can be mutually reinforcing. Going forward, the WBG should continue the approach of combining sectoral policy work with investment projects.
Selectivity: Given the limited IDA/IBRD allocation for Cabo Verde, the WBG program will be highly selective; a maximum of two operations per year would be the norm.
South-South cooperation: As an emerging middle-income country, Cabo Verde could become a focal point for South-South learning. The Bank has already supported successful exchanges on policy and institutional reform issues with Mauritius and Seychelles, and on performance-based road management with Brazil, through the South-South Exchange Trust Fund.
Statistics development: The WBG will continue to assist the Government in statistical capacity building. Together with AfDB, the WBG is coordinating on the statistics agenda through the multi-donor Budget Support Group.
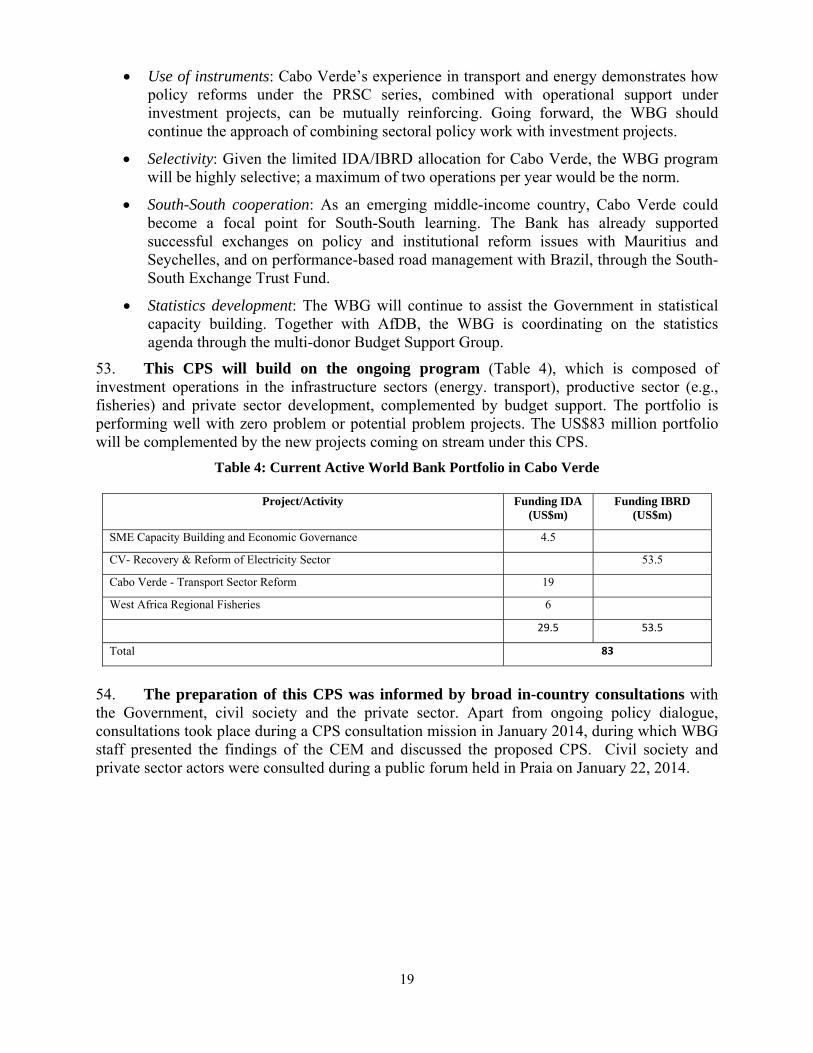
53. This CPS will build on the ongoing program (Table 4), which is composed of investment operations in the infrastructure sectors (energy. transport), productive sector (e.g., fisheries) and private sector development, complemented by budget support. The portfolio is performing well with zero problem or potential problem projects. The US$83 million portfolio will be complemented by the new projects coming on stream under this CPS.
Table 4: Current Active World Bank Portfolio in Cabo Verde
Project/Activity Funding IDA (US$m)
Funding IBRD (US$m)
SME Capacity Building and Economic Governance 4.5
CV- Recovery & Reform of Electricity Sector 53.5
Cabo Verde - Transport Sector Reform 19
West Africa Regional Fisheries 6
29.5 53.5
Total 83
54. The preparation of this CPS was informed by broad in-country consultations with the Government, civil society and the private sector. Apart from ongoing policy dialogue, consultations took place during a CPS consultation mission in January 2014, during which WBG staff presented the findings of the CEM and discussed the proposed CPS. Civil society and private sector actors were consulted during a public forum held in Praia on January 22, 2014.

20
Box 2: Summary of CPS Consultations
Key Messages and Priority Areas Identified from Consultations
Government (Ministerial and
Technical Levels)
CPS is well aligned with Government Strategy – GPRSP III Proposed program is potentially a transformative agenda for medium to long-term sustained
growth, and welcomed the new focus on tourism and agriculture sectors Worried about the small IDA and IBRD allocation Welcomed IFC increased role in Cabo Verde as this was not the case for past CPS
Private Sector
Welcomed the focus of the WBG on private sector development Welcomed the WBG focus on tourism sector, as this remains by far the fastest growth sector, and
asked WBG to explore potential links between tourism and agriculture. Suggested consideration of the fishery sector, which is potentially transformative
Diversifying the tourism base will improve competitiveness Requested that WBG address the delays in VAT reimbursements Called for expedited reform in air transport, notably increase the frequency of flights through
expanded open skies agreements and other measures to increase and facilitate access to the islands Welcomed the reforms to the Labor Code and asked for sustained WBG support for this critical and
sensitive reform Encouraged increased role of IFC under this CPS
Development Partners, Civil
Society and Others
Insisted on the need for the WBG to focus on improving the quality of public investments through the introduction of a national investment system and results-based monitoring
Confirmed that proposed focus of the WBG in this CPS reflects its comparative advantage but called for increased donor coordination, especially with those outside the Budget Support Group (BSG), such as the UN agencies on the social agenda
Appreciated the WB’s leading role in the BSG and called for an expanded framework to harmonize and coordinate the activities of donors in order to reduce conflicting advice to the Government
Appreciated the WBG’s possible support to the rural development and agriculture sectors, and stressed the need for the Bank to support the fishery sector, which is potentially transformative
Increased attention needs to be paid to environment protection and sustainability
55. Gender is identified as a cross-cutting issue in the GPRSP III, with the Cabo Verde Institute for Gender Equality and Equity (ICIEG) responsible for implementing its gender-related objectives. This CPS is informed by the Government’s gender assessment as presented in the July 2013 Progress Report on Implementation of the Millennium Development 2010-2011-2012; as well as by a Gender Portfolio Review12 conducted by the World Bank Africa Region Gender Practice Group in 2013, the Country Economic Memorandum, and in-country consultations with the ICIEG. The WBG regards these combined assessments and consultations as constituting a full country gender assessment, as laid out in OP/BP 4.20. The findings and conclusions indicate that the following issues require immediate attention: (a) improved water and sanitation for rural women; (b) increased economic opportunities for young women in the formal sector; and (c) technical and vocational education and training (TVET) for women. Since the Millennium Challenge Corporation is addressing the water and sanitation issues and the Luxembourg Cooperation is focusing on TVET, the WBG will focus on creating more economic opportunities, especially for young women whose high levels of human development have yet to be translated into equal opportunities in the formal sector, 13 through the proposed
12 The 2013 Cabo Verde Gender Portfolio Review, completed as a background paper for the CPS, provides an overview of the current state of gender in the country as well as an assessment of the coverage of gender in the World Bank portfolio. 13 The parity index for gross enrollment ratio in higher education in the academic years 2011/2012 was 1.42; i.e., for every 142 women in higher education there were only 100 men. One third of women—33.5 percent—aged 15-24 years were unemployed in 2011, well above the overall unemployment rate of 27.1 percent, and 22.1 percent for men of the same age . Also for the age group ≥ 15 years the rate of unemployment for women is 13.2 percent, compared to 11.4 percent for men. Briefly, unemployment affects women more. (Source: Progress Report on Implementation of the Millennium Development 2010-2011-2012).

21
Competitiveness for Tourism Development Project as well as the West Africa Agricultural Productivity Program.
56. The Gender Portfolio Review conducted by the World Bank Africa Region Gender Practice Group in 2013 found that only 20 percent14 of the Bank’s portfolio for Cabo Verde is gender informed. The review also looked at four Analytical and Advisory Activities (AAA) and found that only one out of four activities was gender informed. The low integration of gender in the portfolio may be partly explained by the fact that Cabo Verde is already performing well in the areas in which the WBG tends to be strong on gender mainstreaming, such as health and education. However, more support is required in other areas, such as gender-based violence. Gender-informed activities in the current portfolio include support to women-run MSMEs and a gender-informed analysis of human capital and labor market issues. The Poverty and Gender assessment to be carried out under this CPS will further inform the mainstreaming of gender in projects supported by this CPS.
57. The proposed CPS aims to increase the gender sensitivity of the portfolio by:
Increasing attention to gender in the area of economic opportunity through the proposed program on competitiveness;
Increasing attention to gender empowerment through the program on agriculture development;
Ensuring that future projects are consistent and coherent in addressing gender across analysis, actions, and monitoring and evaluation (M&E).
4.2. WBG COUNTRY PARTNERSHIP STRATEGY FOR FY15-17
58. The objective of the proposed CPS for FY15-17 is to provide a framework for supporting the implementation of GPRSP III, as the previous CPS did for GPRSP II. The proposed CPS will be structured around two complementary pillars: (a) enhancing macro-fiscal stability, setting the foundations for renewed growth; and (b) improving competitiveness and private sector development. This represents a continuation of the two successful pillars under the previous CPS, with some adjustments, to respond to the country’s needs as articulated in the GPRSP III. To the extent possible, the Bank, IFC and MIGA will carry out joint or complementary programs in the transport and energy sectors that have great potential in terms of PPPs. The Bank will focus on the policy agenda and IFC and MIGA will bring in their expertise and financing tools for PPPs. In the tourism sector, IFC will complement the Bank’s interventions by exploring financing for hotel operators as well as possible support to improve the linkage between the tourism and agriculture sectors. The World Bank and IFC teams will also work together on improving the investment climate. More detailed information per pillar follows.
Pillar I: Enhancing Macro-Fiscal Stability – Setting the foundation for renewed growth
59. As a small island economy, Cabo Verde is highly vulnerable to external macroeconomic volatility. Its heavy reliance on tourism export receipts, FDI, and ODA makes the country highly sensitive to changes in global market conditions and critical macroeconomic buffers have been severely strained by the impact of the global financial and Eurozone crises. Under its new growth model supported by this CPS, the Government will need to enhance domestic resource mobilization and improve the cost-effectiveness of its spending.
14 This rate is well below the IDA-16 target of 60 percent of gender-informed activities.

22
60. Link to the WBG twin goals: the objective of Pillar I is the enhancement of macro-fiscal stability to support the authorities’ efforts to boost domestic resources and improve the public investment system to ensure high-quality investment, in addition to reducing fiscal risks and improving service delivery by promoting a set of priority reforms focusing on the performance of state-owned enterprises (SOEs). Activities under Pillar I are expected to create some additional fiscal space, which in turn, if put to good use, could expand the ability of the Government to invest in social sectors and accelerate human capital formation and raise the employability of the labor force. The second objective of making public expenditures more efficient is expected to reinforce these effects. Raising the quality of public spending can improve service delivery, both coverage and quality, especially among those living in the islands that benefit relatively less from tourism and are more dependent on agriculture. More and better public services will enable a broader fraction of the population, particularly low and middle income individuals, to benefit from more diversified growth, contributing to poverty reduction and enhancing shared prosperity. Pillar I outcomes are summarized in Table 5; a more detailed discussion, per outcome follows the table.
Table 5: Pillar I: Outcomes and Indicators*
Outcomes Indicators 1. Improved tax
revenues ‐ Domestic revenue to GDP ratio increased from 21% in 2013 to 24% in 2017
2. Improved public expenditure efficiency
- Reduction of GoCV lending to SOEs as a % of GDP from 8.8% in 2013 to 6.7% in 2017
- Number of SOEs with a results-based management system increased from 1 in 2013 to 5 in 2017
‐ Percentage of new public investment projects in the budget approved by the NIS increased from 0 in 2013 to 50% in 2017
‐ Timeliness and reliability of the yearly government’s accounts measured by the delay in presentation of audited accounts to Parliament after the end of financial year reduced from 24 months in 2013 to 10 months in 2017
*Related WBG instruments are reflected in the Results Matrix (Annex 1)
61. Outcome 1: Improved tax revenues: Cabo Verde’s attractiveness to private investment has been enhanced by a generous system of fiscal incentives; however, this system has negative implications for fiscal revenues. Building on the achievement of the previous series, the PRSCs series will support the tax-policy agenda for 2014-15 to enable the tax authority to expedite collection procedures, reduce tax evasion and accelerate the clearance of tax arrears.
62. Outcome 2: Improved public expenditure efficiency: The public sector efficiency reform agenda will focus on three main areas: (i) SOE reform; (ii) strengthening the national public investment system is also critical to ensure that public resources are allocated to projects with high rates of financial, economic and social returns; and(iii) continuation of PFM reforms.
63. World Bank instruments include development policy operations, sector investments and knowledge products.
The PRSCs series VIII-XI will be the main Bank instrument for the support to Pillar I. Specific activities will include the preparation of result-based management contracts between the MoFP and the major SOEs; the strengthening of the national investment system (NIS) and the consolidation of major PFM reform, including the full use of the electronic financial management system (SIGOF); the monitoring of fiscal liabilities related to state-owned enterprises; and improved external audits and controls.

23
The Economic Governance/Public Sector Efficiency Project will strengthen the SOE Unit (within the Ministry of Finance) capacity to monitor performance contracts, including progress toward achieving financial and service delivery targets. It will also support the implementation of the action plan prepared jointly by the World Bank and IMF on the basis of the PEMFAR.
The ongoing IDA Transport Sector Reform Project (US$19 million) will support the implementation of transport sector State Owned Enterprise (SOE) reform. This will be complemented by IFC support for the development of selected PPP transactions.
The ongoing IBRD Electricity Sector Project (US$53.5 million) will continue to support implementation of the performance contract for ELECTRA.
64. Analytical work will include the following:
An SOE Policy Note will help analyze options to improve SOEs’ fiscal management and service performance. This note will inform the preparation of the proposed Economic Governance/Public Sector Efficiency Project.
An Institutional Development Fund (IDF) grant will support implementation of the 3-year action plan to enhance the efficiency of the NIS. The grant will also establish a project appraisal unit at the Ministry of Finance, which will be responsible for screening and selecting investment projects.
65. Donor Coordination: In line with the division of labor among development partners (see Annex 2), the World Bank is taking the lead on macroeconomic stability in coordination with other Budget Support Group (BSG) members. Under the Memorandum of Understanding signed with the Government in 200615, the BSG supports the Government’s current GPRSP III in ten policy areas. BSG members conduct joint reviews twice a year, which reduce transaction costs for the Government and promote harmonization. The Bank is the current BSG coordinator. The BSG coordination mechanism has proven to be effective in facilitating the division of labor among the BSG members. It has also helped improve donor harmonization. For example, in the absence of an IMF program, the Bank has assumed the responsibility of providing macroeconomic assessments to the other BSG members, in close coordination with the IMF’s Washington-based team. The mechanism has also enhanced the Government’s ability to attract additional external budget support. However, the BSG coordination mechanism will need to be expanded to include non-BSG members. The WBG will work with the Government to further integrate all active donors in the mechanism.
Pillar II: Improving Competitiveness and Private Sector Development
66. Under Pillar II, the CPS supports the objective of improving competiveness and private sector development by focusing on three areas: (a) improving investment climate, (b) enhancing the performance of the tourism sector and agricultural productivity, and (c) supporting enabling sectors (energy and roads).
67. Link to the WBG strategic goals: enhancing competitiveness and the business climate will improve the functioning of markets. In turn, complete and competitive markets are central to achieving more efficient utilization of the productive assets of households, in particular their labor and human capital. This is of high importance in the context of Cabo Verde, where the unemployment rate has remained high, even in periods of strong economic growth—more than
15 The Partnership Framework between Budget Support Partners and the Government of Cabo Verde for the Provision of Budget Support

24
half of the economically active population is employed in informal jobs; and labor force participation is substantially lower among some groups of the population (women and youth), despite increases in school enrollment and attainment. Improving the business climate, reducing production costs (e.g. increasing the efficiency of the electricity sector), improving connectivity through better management of the road network, and improving the productivity of critical sectors (e.g. agriculture) will increase the accessibility of the poor to markets, strengthen the demand for their labor. Pillar II outcomes are summarized in Table 6; a more detailed discussion, per outcome follows the table.
Table 6: Pillar II Outcomes and Indicators*
Outcomes Indicators 3. Improved Investment
Climate
- Number of investment projects through the single window investment facility increased from 0 in 2013 to 30 in 2017
- Number of startups owned by women increased from 0 (through project) in 2013 to 50 in 2017
‐ Time to import reduced from 18 days in 2013 to less than 15 days in 2017
4a. Improved Electricity Sector Performance
‐ Increase Electricity generation; net (Gwh/year) in São Vicente from 66.01 Gwh/year in 2011 to 97 Gwh/year in 2016; and Santiago 198.52 Gwh/year in 2011 to 267.77 Gwh/year in 2016
‐ Reduce total electricity losses per year on Santiago Island from 35.4 % in 2011 to 25.4% in 2016
4b. Improved management of National Roads Network
‐ Roads in good and fair condition as a share of total national roads increased from 50% in 2013 to 75% in 2017
5. Increased agricultural productivity and linkages to markets
‐ Average yield of key agricultural commodities increased by 15% using new technologies by 2017
‐ Number of female beneficiaries using improved technologies increased to 40% by 2017
68. Outcome 3: Improved investment climate: From 2010 to 2011, an aggressive reform agenda produced strong improvements in Cabo Verde’s business climate.
69. World Bank Group instruments: This CPS will support further actions to improve the investment climate, and instruments will include the PRSC series, sector specific projects as well as participation of IFC.
The PRSCs VIII-XI series will support the establishment of a single window system for investments, which will significantly expedite the registry and licensing of operations by foreign investors, and the provision of tax benefits.
Competitiveness for Tourism Development Project will assist the Government in implementing investment climate reforms under the Government’s "Move to Compete" program to improve competitiveness; including the strengthening of the investment promotion agency, the establishment of a national tourism organization, and the creation of an investment marketplace to encourage innovation in startups.
IFC is exploring financing for hotel projects to complement the WB’s investment in the tourism sector. IFC will also work with a commercial bank to create a facility to support trade under the IFC’s Global Trade Finance Program (GTFP), and a credit line (or equity participation).
70. Analytical work and technical assistance will include the following:

25
Financial Sector Assessment Program. Building on the financial sector strategy prepared with Bank’s support, the FSAP will carry out an in-depth review of financial sector performance.
The Leveraging the Diaspora ESW will explore the scope for expanding the role of the diaspora in developing the country's economy.
71. Outcome 4a: Improved Electricity Sector Performance. With World Bank support, the Government has implemented the key elements of a comprehensive reform program for the electricity sector and the public electric and water utility, including a result-based management contract.
72. World Bank Group instruments: This CPS, through the series of PSRCs and ongoing investment operations, will support further actions to improve operational efficiency in the energy and transport sectors, including ELECTRA’s financial viability.
PRSCs series will continue to support policy reforms aiming at reducing ELECTRA’s commercial and technical losses.
The ongoing IBRD Electricity Sector Project will support priority investments in the electricity sector that will allow ELECTRA to meet the electricity needs of a growing economy, including the extension of Palmarejo Power Plant in Praia (Island of Santiago), and extension of Lazareto Power Plant in Mindelo (Island of Sao Vicente). The project will also support additional water storage capacity.
Support to support renewable projects will be provided, under the WB/IFC new initiative, Scale Up Solar energy, in a way that would help leverage other sources of funding (IBRD funds, private investors, IFC lending and equity, carbon funds, etc.).
73. Outcome 4b: Improved management of National Roads Network: with World Bank support, steady progress has been achieved in the institutional reform of the road sector, including the creation of a road maintenance fund, the establishment of a dedicated road agency (Instituto de Estradas IE), and the introduction of a four-year performance-based rehabilitation and maintenance contract (PBC).
74. WBG instruments: this CPS will continue its support to the transport sector to consolidate these achievements through a mix of World Bank and IFC instruments.
The ongoing IDA Transport Sector Reform Project will help improve efficiency and management of its national road assets, and support reform of the transport sector SOEs.
IFC, together with MIGA, will complement this by supporting the implementation of selected PPP transactions in the sector.
The PRSCs series will support the introduction of performance-based management tools for maintenance of about 60 percent of the paved road network.
75. Outcome 5: Increased agricultural productivity and linkages to markets: in order to address current sector challenges and promote the role of agriculture as a fundamental sector for poverty reduction and growth, there is a need to increase agricultural productivity.
76. WBG instruments will include the following:
Cabo Verde will join the program under the regional West Africa Agricultural Productivity Project for Capo Verde (WAAPP-1D) series whose objective will be to generate and accelerate the adoption of improved technologies for the country’s key
26
agricultural commodities that are aligned with the sub-region’s top agricultural commodity priorities.
The Competitiveness for Tourism Development Project will foster linkages with the tourism value chain, including those in the fisheries and agriculture sectors.
IFC is exploring financing for hotel projects for which it will support linkages between the tourism and the agriculture sectors.
77. Analytical work will include:
An agriculture sector review will assess the agricultural sector in Cabo Verde through: (a) a review of current agriculture sector strategies and policies; and, (b) an identification of key intervention areas for value chain development based on the country's comparative advantage in promising value chains. The study will highlight both poverty- and growth-based impacts of the proposed interventions, and will guide the preparation of the proposed WAAPP-1D.
78. Donor coordination: in line with the division of labor among development partners (see annex 2), the WBG will focus on competitiveness and infrastructure development. This will be done closely with the African Development Bank (AfDB). In the absence of other donors’ interventions, the WBG will explore new interventions in the agriculture sector, a cornerstone for poverty reduction; and in the tourism sector as the leading driver of growth in Cabo Verde. For other sectors with no WBG financing, such as human development, where the UN agencies, EU and Luxembourg are leading, the WBG will play a supporting role by focusing on policy and structural reforms through its PRSC series, and on selected knowledge products. Similarly, the WBG will work closely with the Millennium Challenge Corporation and Japan, which are leading on other infrastructure sectors, such as water and sanitation.
4.3. FINANCING OF THE PROGRAM
79. The indicative IDA17 envelope is SDR 32 million, equivalent to US$49.5 million for FY15-FY1716. Cabo Verde will also have access to IBRD resources during the CPS period. IBRD lending limits will depend on country performance, IBRD's lending capacity, demand by other borrowers and global economic developments. The indicative program is shown in Table 7.
16 Using the exchange rate 1.54563$/SDR. The actual exchange rate for each operation depends on the applicable prevailing rate at the time of approval. The amounts shown in outer years are indicative only. Actual allocations will depend on: (i) the total IDA resources available; (ii) the country’s performance rating, per capita GNI, and population; (iii) the terms of IDA assistance (grants/credits); (iv) the allocation deductions associated with MDRI annual debt service foregone as applicable; (v) the performance, other allocation parameters, and IDA assistance terms for other IDA borrowers; and (vi) the number of IDA-eligible countries.

27
Table 7: Proposed Lending and Non-Lending Activities
4.4. RISKS AND MITIGATION
80. Implementation of this CPS will face three main types of risks: external, domestic and operational. External risks are associated with the uncertain global economic scenario. The recovery of the global economy remains anemic and uncertain, and there are significant downside risks associated with major developed economies, especially the Eurozone. A further deterioration in external conditions would have detrimental effects on Cabo Verde’s growth trajectory and puts at risk the delivery of the development policy loans. This risk is rated substantial. Together with the IMF (the country is under Article IV arrangement), the Bank, through its PRSC series, will provide mitigation measures aimed at enhancing macro-fiscal stability and the country’s resilience to both internal and external shocks. In addition, the Bank will have flexibility in the type of financial instruments deployed to address changing country conditions.
81. A set of domestic risks arises from the private sector’s ability and willingness to respond positively to the Government’s structural reform agenda. A pivotal assumption behind the structural reforms supported by the PRSC series is that the private sector will become the country’s primary engine of economic growth as the Government scales back its investment program. However, it is unknown whether the incentives created by the Government’s strategy will be sufficient to induce the level of private-sector growth that the strategy envisions; this could potentially put at risk the reform program supported by this CPS. This risk is rated modest as the robustness of the structural reform agenda, the active participation of the private sector in the preparation of the GPRSP III and permanent dialogue between the Government and private stakeholders should mitigate these risks. Through its focus on infrastructure development and
Fiscal Year
Project Name IDA
$m
IBRD
$m
IFC/MIGA TF/Other ESW/TA/AAA
FY15 PRSC IX
Competitiveness for Tourism Development
10
10
Selected PPPs
Agriculture Sector Review
Programmatic knowledge TA: Focus on human development sectors.
Legal land framework review
PPIAF on PPPs
Financial Sector Strategy
TA on debt financing
FY16 PRSC X
WAAPP-1D
Governance and Public Sector Efficiency
Transport PPPs
10
5
5
Selected PPPs, tourism, services and/or agribusiness
Regional IDA: 10 GEF:7
SOE Policy Note
TA on financial sector regulation
Leveraging diaspora
FSAP
Poverty and gender
assessment
FY17 PRSC XI ( or new series)
Multisectoral Infrastructure
9.5
TBD
ICA
Programmatic knowledge TA on Human Capital
Systematic Country diagnosis
Total IDA 17 49.5

28
SOE reform, the proposed WBG programs, including the active role of IFC and MIGA, will provide the financial and technical support and guarantees that will help crowd in private sector participation.
82. There are also political economy risks for sensitive reforms. Some of the proposed reform operations under this CPS will require parliamentary approval and are likely to face some resistance. The Government has been very effective in building consensus on the diagnosis of the country’s development challenges and the need for reforms during the preparation of the GPRSP III. But, given that the next national elections will be in 2016 making 2015 a pre-election year, ambitious reforms will become less likely and the risk is substantial. The reform agenda to be supported by this CPS, notably the PRSC series in FY15 and FY16, is being accompanied by a communication strategy which involves representatives of the private sector, the managers of SOEs, civil servants and other stakeholders.
83. Finally, operational risks are still considerable. While by regional standards Cabo Verde’s institutional and technical capacity is strong, the limited number of technical staff in several core ministries poses substantial implementation risks. The reform of SOEs is particularly challenging, as it involves special processes that are not routine for the relevant agencies. To address these risks, the WBG and other development partners have made available a combination of capacity building assistance, technical support and sector-specific investment operations, which will substantially improve prospects for success in the reform areas supported by this operation.

29
Annex 1: Cabo Verde CPS Results Framework
FY 15-17
Strategic Area Issues and Challenges Expected CPS Results and Indicators
Milestones Proposed Bank/Other Development Partner Instruments
Pillar 1: Enhancing Macro-Fiscal Stability– Setting the foundation for renewed growth Enhance domestic revenue mobilization Improve public expenditure efficiency
Tax revenues contracted in 2009 and 2012 due to economic slowdown. These were further exacerbated by a reduction in personal and corporate tax rates The SOEs, especially the five major companies such as ASA, ELECTRA, ENAPOR, IFH and TACV have been a source of contingent liabilities for the Government of Cabo Verde due to their generally weak commercial and financial performance Public investment averaged 11.3 % of GDP between 2009-2012 which contributed to worsen fiscal accounts and was responsible for 25 % decline in fiscal balances
Outcome 1: Improved tax revenues Domestic revenue to GDP ratio Baseline (2012) 21.0% Target (2017) 24% Outcome 2: Improved public expenditure efficiency Performance of SOEs - Reduction of GoCV lending to SOEs as a % of GDP Baseline (2013) 8.8% Target (2017) 6.7% - Number of SOEs with a results-based management system Baseline (2013) 1 Target (2017) 5 Public investment management Percentage of new public investment projects in the budget approved by the NIS Baseline (2013) 0 Target (2017) Higher than 50%
Various tax measures especially those related to VAT are passed by Parliament and promulgated. And satisfactory implementation of the strategic tax administration plan Preparation of results-based management contracts between MoFP and the five major SOEs fully implemented A new planning system that establishes the legal basis for the national investment system (NIS) is approved by Parliament
On-going and Planned Financing: PRSC IX; PRSC X and PRSC XI On-going and Planned Financing: PRSC IX; PRSC X and PRSC XI Economic Governance/Public Sector Efficiency Project Transform Sector Reform Project Electricity Sector Support Project ESW/TA/AAA: Institutional Development Find (IDF) grant SOE Policy Note Poverty and Gender Assessment

30
Increased fiscal deterioration between 2009-2012 while public expenditure rose exponentially
Public Financial Management Timeliness and reliability of the yearly government’s accounts measured by the delay in presentation of audited accounts to Parliament after the end of financial year. Baseline (2013): 24 months Target (2017): 10 months
Parliamentary approval of the revised Budget Framework Law
Pillar 2: Improving Competitiveness and Private Sector Development Strengthen the investment climate Improve Energy and Roads infrastructure
Investors face cumbersome administrative barriers and complex tax incentive system Importers and exporters face lengthy delays for clearance of goods In the energy sector, there is high growth of electricity demand averaging 6 % per year but nearly 15 % in Praia alone. This requires large investments in generation, transmission and distribution
Outcome 3:Improved investment climate Increased investment projects - Number of investment projects through the single window investment facility Baseline (2013) ) 0 Target (2017) 30 - Number of startups owned by women Baseline (2014) 0 through project Target (2017) 50 Trade regulations - Time to import (Days) Baseline (2013) 18 Target (2017) Lower than 15 days Outcome 4a: Improved electricity sector performance - Increase Electricity generation; net (Gwh/year) São Vicente: Baseline (2011) 66.01 Target: (2016) 97 Santiago (2011) Baseline: 198.52 Target: (2016)267.77 - Reduce total electricity losses per year on Santiago Island (%) Baseline (2011) 35.4% Target (2016) 25.4%
A single window system for investments is established. And the tax benefit code is approved by Parliament Regulations to the 2010 Customs Code designed to improve customs procedures are adopted by the Council of Ministers
On-going and Planned Financing: PRSC IX; PRSC X and PRSC XI Competitiveness for Tourism Development Project Economic Governance/Public Sector Efficiency Project ESW/TA/AAA: Financial Sector Strategy FSAP TA on debt financing Leveraging the diaspora
On-going and Planned Financing: Recovery and Reform of the Electricity Sector Project PRSC IX; PRSC X and PRSC XI Transport Sector Reform Project

31
Strengthen Agricultural productivity
While several kilometers of roads network have been constructed in the last few years. The efficiency and quality of these roads could be improved through regular maintenance works, etc. Sustained agricultural productivity and growth
Outcome 4b: Management of National roads network improved Roads in good and fair condition as a share of total national roads (%) Baseline (2013) 50 Target (2017) 75 Outcome 5: Increased agricultural productivity and improved linkages to markets - Average yield of key
agricultural commodities increased by 15% using new technologies
- Number of beneficiaries of improved technologies, of which 40% is female
Planned Financing: West Africa Agricultural Productivity Program (WAAP-ID) ESW/TA/AAA: Agriculture Sector Review

32
Annex 2: Development Partners: Division of Labor
African Development Bank
European Union
Luxembourg
Cooperation
Portugal Spanish Cooperation
World Bank UN Agencies
MCC Japan IMF
Macroeconomic Stability/ PFM/Statistics
Water & Sanitation
Health
Education & Vocational Training
Private Sector Development /Tourism
Environment
Infrastructure
Security
Social housing
Social Protection
Agriculture/Fisheries

33
Annex 3: Statistics in Cabo Verde
Cabo Verde’s statistical development is weak for a middle income country. According to the World Bank’s statistical capacity index, Cabo Verde scored 66 in 2013, above the averages of 63 and 60 for IDA countries and Sub-Saharan African countries respectively, but well below the IBRD average of 75. The main constraints include the lack of predictable funding, the dependence on donor support for the implementation of surveys and censuses, and the scarce human resource capacities associated with the small size and with the geographic fragmentation of the country.
There are a number of shortfalls. The last household survey was performed in 2007 and a national census was conducted in 2010 with the support of international development partners. A light poverty study was conducted in 2012 as part of the preparation of the third edition of the GPRSP III with the support of the World Bank. The preparation of official national accounts was interrupted in 2008 and a new GDP series including recent years was only presented in January 2013, updated to the UN accounting methodology of 1993. However, national accounts data continue to be produced with a considerable time lag, beyond what is foreseen in national law. Employment surveys are scarce and are, similarly, not released in a timely manner; the latest information on unemployment rate corresponds to 2012. Cabo Verde does not have a tourism satellite account which could provide thorough information on the most important economic sector of the country.
The GPRSP III considers the National Statistics System, led by the national statistics institute, INE, a fundamental pillar of the National System of Planning. Throughout 2012 and 2013, the government approved a set of decrees to define and strengthen the institutional capacity of the National Statistics System including new statutes for INE and a new organic structure, the establishment of the National Statistics Council; and complementary regulations granting INE more power to collect information from public agencies and private sector. Several donors, including the World Bank through the Trust Fund for Statistical Capacity Building, as well as the African Development Bank, the IMF, and bilateral donors are currently providing TA to the INE.
For 2014, the main new outputs in terms of surveys from INE include the household survey of expenses and revenues – which will provide critical data to update the poverty analysis; the demographic and reproductive health survey which will update important health indicators (pertinent also for MDG measuring); and the General Agricultural Survey, a comprehensive operation that will provide critical data for fine tuning of agro-business policy decisions in this critical primary sector as noted in the GPRSP III.

34
Annex 4: CPS Completion Report (FY09-12)
I – INTRODUCTION
A. Methodology
1. This Country Partnership Strategy Completion Report (CPSCR) presents an assessment of the Country Partnership Strategy (CPS) for Cabo Verde for FY09-12, supported jointly by the International Development Association (IDA) and the International Bank for Reconstruction and Development (IBRD) – collectively “the Bank.” The report evaluates (a) the CPS support program’s performance in achieving or influencing the objectives set out in the CPS results matrix; and (b) the Bank’s performance in designing and implementing the program. Although IFC did not participate in the CPS support program, IFC was active in projects to improve access to finance to SMEs and infrastructure projects development during the period, which are noted in the report. 2. This self–assessment was conducted in line with the OPCS guidelines related to “Assessing Country Partnerships Strategies: A shared approach” dated November 2013. Based on the assessment, the overall CPS outcome is rated as moderately unsatisfactory as only Pillar 1 is rated satisfactory, while pillar 2 and 3 are both rated moderately unsatisfactory. The World Bank performance is rated fair. As outlined in Table 1, Pillar 117 is rated satisfactory, as 2 of its objectives were fully achieved and 1 mostly achieved; Pillar 2 is rated moderately unsatisfactory with one objective out of 2 mostly achieved; and Pillar 3 is rated moderately unsatisfactory as both of its objectives were only partially achieved.
Table 1: Achievement of CPS Outcomes (Overview)
Objectives Status at Completion Achieved Mostly
Achieved Partially Achieved
Not Achieved
Pillar 1: Promoting Good Governance and Public Sector Capacity 1. Reduced and better managed liabilities 2. Strengthened management of public resources at central and
local levels
3. Strengthened public administration regulatory and oversight role
Pillar 2: Improving Competitiveness and the Investment Climate for Private Sector Growth 1. An improved business climate 2. Improved access to and quality of key economic infrastructure
services
Pillar 3: Strengthening Human Capital and Social Inclusion 1. Better positioning of education and TVET sectors to meet
labor market needs
2. Improved targeting of public expenditures and of specific programs
17 Under the CPS FY09-12, Pillar 1 and Pillar 2 accounted for more than 95 % of the total IDA and IBRD financing; Pillar 3 was mostly technical assistance.

35
B. Summary of Program and Bank Performance
3. The Bank’s CPS for Cabo Verde and its program of support activities were designed to assist the Government of Cabo Verde in achieving the higher-level development goals outlined in its second Growth and Poverty and Reduction Strategy Paper (GPRSP II) for 2008-2011. The overall Moderately Unsatisfactory (MU) rating is a weighted measure of progress made toward achieving all major CPS objectives as detailed in Annex 1. Most CPS program activities were concentrated under the GPRSP’s Pillar One, “Promoting Good Governance and Public Sector Capacity.” Great strides were made during the CPS period to enhance the use of public resources and its transparency, to better manage debt and strengthen the regulatory and oversight role of the public administration. The program also carried out activities under Pillar Two, “Improving Competitiveness and the Investment Climate for Private Sector-Led Growth.” Under that pillar, program activities helped raise the country’s Doing Business ranking from 146th in 2010 to 122nd in 2012 mainly through the simplification of firms’ closure procedures, reduction of registering costs and a more transparent and predictable investment code, and to expand the administrative services readily available to citizen and investors. The program helped to lay the foundation for development of the energy sector, and also contributed to satisfactory progress in the road transport sector. Progress in the air transport sector, however, has been modest and objectives are expected to appear in the next CPS. In the fisheries sector, the program successfully established fisheries management tools and is on track to reach the expected results. Under Pillar Three, “Strengthening Human Capital and Social Inclusion,” the program partially achieved its goals. In the education sector and the technical and vocational education and training (TVET) sector, the Bank’s program was limited to technical assistance (TA); while investments were supported by other development partners (DPs) and, due to the hard fiscal constraints, Government contributions have been limited. The program also supported the Government’s social inclusion agenda through the establishment of legal centers staffed with legal counselors. However, the planned evaluations of poverty, gender and other social impact investments, as well as the household surveys for poverty, were not carried out. The four Poverty Reduction Strategy Credits (PRSCs) over the three-year period (PRSCs IV-VII), have provided a strong knowledge base for preparation of the next CPS. 4. Bank performance and implementation are rated fair overall. The CPS program design and objectives were relevant and well-aligned with the objectives of the GPRSP II. In spite of the adverse environment following the global and euro crisis, particularly difficult for CV and other small island economies, the Bank maintained a productive dialogue with the Government throughout implementation of the program. The indicators in the results matrix were, for the most part, appropriate to measure CPS objectives, although some had weak logical links with those objectives and were not realistically aligned with the CPS timeframe. The Bank’s program also included risk identification and mitigation efforts (see paras. 38-39), with the provision of TA to assist the Government in weathering the impacts of the global financial crisis and defining realistic targets for the CPS. As an active member of the Joint Budget Support Group (BSG),18 the Bank also played a key role in harmonizing the aid architecture in the
18 The members of the Budget Support Group (BSG) are the African Development Bank, the European Union, the Luxembourg Agency for Development Cooperation, the Government of Portugal, the Spanish Agency for International Development Cooperation, and the World Bank.

36
country. Additionally, the Bank demonstrated timely flexibility by increasing its IDA allocation for Cabo Verde to mitigate the reduction in concessional financing. An Independent Evaluation Group (IEG) review of projects closed during the CPS period rated three out of four projects Satisfactory. However, IEG noted that cost overruns reduced the value for money in two out of three investment projects. IEG also found room for improvement in the design, implementation, and use of monitoring and evaluation (M&E). Finally, the strong commitment of the Bank’s country team ensured that the portfolio was managed proactively to quickly adjust to changing circumstances within the targeted sectors.
C. Economic and Sociopolitical Context
5. During the CPS period, Cabo Verde consolidated its position as a service-based economy and graduated from Least Developed Countries, per the UN’s classification in 2007. With a GNI per capita of US$3,540, the country is firmly placed in the lower-middle income countries group, per the Bank’s classification.19 The effects of the global financial crisis and the ongoing Eurozone crisis on Cabo Verde have been strongly negative. GDP growth dropped from 6.2 % in 2008 to -1.3 % in 2009 and recovered modestly to 1.5 % in 2010. GDP growth rate increased to 4 % in 2011, but the worsening of the Eurozone crisis has prevented the consolidation of the recovery trend. GDP growth rate increased to 4 % in 2011, but the worsening of the Eurozone crisis has prevented the consolidation of the recovery trend. Cabo Verde’s GDP growth slowed again to 1.2% in 2012 and weak growth is also estimated for 2013 (0.5 %) and 2014 (2-3 %). The country’s development vision is rooted in the need to leverage its geo-strategic position and its natural and cultural assets. Capital accumulation and the expansion of the tourism industry have been the driving forces of the country’s economic growth. The tourism sector accounts for around 20 % of GDP. Foreign direct investment (FDI) flows in the tourism and real estate sectors represent more than 90 % of total FDI flows to the country. Private investments have driven the rapid development of tourism facilities and related real estate construction activities, while public investments have financed the development of transportation infrastructure services and energy supply. 6. Rapid economic growth during most of the 2000s has also translated into improved social conditions. Poverty in Cabo Verde dropped from 37 % in 2000 to 27 % in 2010, and the country is currently on track to achieve nearly all of its Millennium Development Goals (MDGs) by 2015. In general, these successes are, however, weakened by relatively high unemployment in the country, especially among vulnerable groups such as women and youth.
7. The two most recent rounds of national elections, both held in 2011, brought about a novel arrangement in Cabo Verdean politics. For the first time, the President and Prime Minister are supported by the main opposing parties: the MpD (Movimento para a Democracia - Movement for Democracy) and PAICV (Partido Africano da Independência de Cabo Verde - African Party for the Independence of Cabo Verde), respectively. The transition and subsequent power sharing exercise between the MpD and the PAICV have been going smoothly. Although there are concerns that the two parties might have different visions of how
19 GNI per capita, Atlas method (current US$), World Development Indicators, 2011

37
to implement reforms, the country has so far benefited from the leadership of an administratively competent Government in a stable political environment. 8. This political stability and economic growth that have made possible CV’s transition to a MIC (Middle Income Country) also bring new challenges including those related to debt monitoring and access to concessional finance. During the CPS period, Cabo Verde experienced a significant increase in its debt burden, with the public debt stock increasing from 67.9 % of GDP in 2008 to 88 % in 2012. Based on a recent stochastic debt sustainability analysis (DSA) prepared by the Bank team, the present trajectory of public debt is expected to remain sustainable in the long term, but significant vulnerabilities will persist in the short and medium terms. The declining access to concessional finance and rapid debt accumulation are expected to increase borrowing costs and reduce the fiscal space needed to sustain high public investment rates. The ongoing European sovereign debt crisis has already reduced FDI flows and FDI-funded private investments. Additionally, the heavy reliance on an undiversified set of economic drivers, and the small domestic labor pool and consumer market, limit the potential for economies of scale across sectors. Other factors, such as high unit costs of core infrastructure and public goods arising from indivisibilities in public goods supply, along with the high transport costs and significant exposure to natural hazards characteristic of small island economies, could compromise Cabo Verde’s natural capital, which is its main tourism attraction. 9. Looking forward, the intensive capital accumulation and growth in the tourism sector that enabled Cabo Verde to graduate from Least-Developed Country status is unlikely to be sustainable in the longer term. Consequently, Cabo Verde faces what may be its greatest development policy challenge to date: how to adapt its development model to its new economic and financial circumstances, and still sustain high growth and competitiveness in the face of its vulnerability to global macroeconomic fluctuations. During the CPS period, Cabo Verde was able to effectively use fiscal tools to partially insulate itself from global shocks, and to boost public investment while maintaining control over current expenditures. Going forward, in order to meet the challenges of transitioning to MIC status, the Government must now build the foundation for enhanced macroeconomic resilience and facilitate a new growth model that encourages improved productivity and human capital development rather than physical accumulation, while still closely monitoring its vulnerability to external shocks. II – CPS Program Performance
A. Program Overview and Principles of Engagement
10. The GPRSP II for 2008-2011 put strong emphasis on infrastructure and private sector development to support growth and reduce poverty. In support of the GPRSP, the CPS also focused on sustaining high levels of growth and reducing unemployment, poverty, and inequality. The five strategic pillars of the GPRSP II were: (a) promotion of Government reform; (b) development of human resources; (c) enhancing competitiveness; (d) investment in the country’s economic infrastructure; and (e) strengthening social cohesion. The CPS support program was articulated around three pillars: (a) promotion of good governance and public sector capacity; (b) improving competitiveness and the investment climate for private sector-growth; and (c) strengthening human capital and social inclusion.

38
11. The Bank delivered its technical and financial support program using a blend of investment loans and a series of four Poverty Reduction Strategy Credits (Annex 2). Box 1 presents an overview of the PRSC series which accounted for 78 % of the total IDA lending. The original indicative IDA envelope of SDR27 million (US$40 million equivalent) envisaged in the CPS was reduced to SDR25.2 million (US$37.3 million) in FY10 as a result of the higher GNI per capita and in line with the Performance-Based Allocation System. Under IDA16, Cabo Verde’s IDA envelope was raised to SDR30.7 million (US$46 million equivalent). The initial IBRD envelope of US$52.8 million remained unchanged during the period.
12. The Analytical and Advisory Assistance (AAA) program comprised policy notes and core diagnostic assessments (see annex 3) that provided targeted and just-in-time policy support on key issues in the infrastructure, social, and financial sectors. With a total net grant amount close to US$8.2 million, the Trust Funds program was fully integrated into investment lending activities and significantly supported the Bank’s analytical program.
13. Four projects were closed over the course of the CPS (see Table 2), and all had identical IEG and ICR ratings. The PRSC IV and the Growth and Competiveness Project were both rated Satisfactory; the HIV/AIDS Project was rated Moderately Satisfactory; and the Energy and Water Sector Reform and Development Project was rated Unsatisfactory, due to its failure to enhance the supply, efficiency, and management of water and electricity in Cabo Verde, and to inadequate Bank supervision. Both the ICR and IEG ratings for M&E design, implementation, and utilization were modest except in the case of the Growth and Competiveness Project, where M&E had the rare rating of Substantial.
Box 1. Areas of Focus of the PRSC Series Four PRSCs (IV-VII) were implemented over the course of the CPS period, and the joint work under these operations helped to link the policy reforms with enhanced public financial management. Under PRSC IV (which supported the last year of GPRSP I implementation and enabled continued policy dialogue with the Government during preparation of GPRSP II), the Government made progress in promoting good governance and improving health and education outcomes. PRSC V through PRSC VII supported four main policy areas namely (i) good governance; (ii) human capital enhancement; (iii) competitiveness; and (iv) infrastructure. PRSC VI-VII explicitly had all the four main policy areas while PRSC V only highlighted (i) good governance; and (ii) competitiveness and growth. However, human capital enhancement, and infrastructure were embedded as pillars, often with benchmark indicators, in the program supported by PRSC V. Reforms in the pillar on social cohesion included in PRSC V were dropped. PRSC V had included this area to align itself with the Government’s GPRSP II. However, as the Government increasingly considered this area as cross-cutting, the series was already wide-ranging, and this component was rather weak, the team for PRSC VI and VII decided to abandon it. The joint Bank-development and Government work under the PRSC series also made it possible for the country to maximize the return on its public investments, by: (a) linking medium-term investment planning to long-term strategic objectives; (b) improving the selection of public investment; (c) integrating financial management systems into performance contracts; and (d) establishing transparent procurement measures to track the quality of investments.
The supervision of the PRSCs was through the donor Budget Support Group’s biannual missions which focused on the monitoring of prior actions and brought together experts from the country’s priority sectors. The missions evaluated progress on the joint matrix, facilitated coordination, and built consensus among donors.

39
Table 2: ICR and IEG Review Ratings Project ICR IEG Review PRSC IV (P106502) Outcome Satisfactory Satisfactory HIV/AIDS Project (P074249) Outcome Moderately
Satisfactory Moderately Satisfactory
Growth and Competiveness Project (P074055) Outcome Satisfactory Satisfactory Energy and Water Sector Reform and Development Project (P040990)
Outcome Unsatisfactory Unsatisfactory
Source: ICRRs and IEG Review documents
14. The Bank’s post-CPS portfolio includes a total of four investment projects, in the Energy, Transport, Fisheries, and Finance and Private Sector Development sectors. Overall, planned activities have been implemented in a timely manner and all four projects are on track to achieve results. The PRSC VIII, with a net commitment of US$12 million over the period July-December 2012, has substantially achieved its objectives, according to a preliminary assessment. Progress toward the achievement of Project Development Objectives and the overall Implementation Progress are in the satisfactory range.
B. CPS Program Performance by Strategic Pillar
15. The three strategic pillars of the CPS program were organized around seven objectives, as measured by 36 indicators. The assessment presented here is based on the self-assessments (Achieved, Mostly Achieved, Partially Achieved, Not Achieved) in the CPS results matrix, as updated in the CPS Progress Report (CPSPR).20 More details are presented in Annex 1. CPS Pillar 1 – Promoting Good Governance and Public Sector Capacity
16. Pillar 1 is rated satisfactory as the three objectives of Pillar 1 were fully or mostly achieved. 17. Objective 1: Reduced and better managed liabilities. The two indicators of this objective were fully achieved. This outcome was achieved through successful implementation of the PRSC series and the TA on debt management. The Government cleared all of the arrears identified in 2005 by the end of the CPS period. Also, ELECTRA, the public electricity and water utility company, has restructured its arrears and reestablished access to suppliers’ credit. To improve the management of liabilities, the Bank also carried out a new public expenditure management and financial accountability review (PEMFAR), and worked closely with the Government to ensure adoption of the public financial management (PFM) reform agenda. The
20 An outcome is considered Achieved if the program fully achieved the Objective during the CPS period (e.g. all the quantitative targets were met). An outcome is considered Mostly Achieved if the program made good progress towards achieving the Objective during the CPS period (e.g. more than half of the quantitative targets were met and the program is on track to meet the remainder of the targets). An outcome is considered Partially Achieved if the program made only limited progress toward achieving the Objective during the CPS period (e.g. less than half of the quantitative targets were met). An outcome is considered Not Achieved if the program made little progress toward achieving the Objective during the CPS period (e.g. few if any of the quantitative targets were met). See Annex Table 1 for details.

40
Bank also supported the preparation of the first Medium Term Debt Strategy in 2011 which lays the main orientations for Government borrowing in the next years in which a reduction of concessional financing is expected and an increase in access to international markets. 18. Objective 2: Strengthened management of public resources at central and local levels. The four indicators of this objective were fully achieved. Considerable progress has been made in rationalizing Government structures with the definition and harmonization of internal structures for all the Ministries, establishing principles for a merit-result oriented civil service through the career plan and improving the efficiency of public finance management (PFM). A commitment to enhanced budget credibility, supported by continuous improvements in preparation, execution and reporting, has substantially increased the reliability and efficiency of public expenditures, as well as the transparency and accountability of the budget process. The introduction of a Medium Term Fiscal Framework (MTEF), and key reforms to the legal framework for Government procurement, combined with ongoing efforts to strengthen the capacity of agencies involved in public procurement, have been among the most notable achievements made under good governance pillar. It should be noted that these achievements were also supported by the European Union (EU), the African Development Bank (AfDB), Spanish Cooperation, and the Millennium Challenge Corporation (MCC), which provided much-needed technical assistance and resources, in particular working in close collaboration with the public procurement agencies. 19. Substantial institutional strengthening at the municipality level was achieved through implementation of a municipal information system (SIM). The SIM, which serves as a management and communication tool between the central level and the municipalities, and among the municipalities themselves, enabled the central and local Governments to streamline processes related to revenue collection and management, land management, human resources, and other administrative activities. It also enabled municipal Governments to improve the timeliness of their audited accounts; the court of auditors reported that 14 out of 22 municipalities were audited in 2011. Further, the Bank’s Public Investment Program technical assistance helped the Government to improve management of its public investment program by more closely aligning the program with the objectives supported by the GPRSP II and the Medium-Term Expenditure Framework (MTEF). 20. Objective 3: Strengthened public administration regulatory and oversight role. Two out of the six indicators under this objective were fully achieved. The delay between budget execution and auditing of the State accounts has been reduced to two years, down from three years in 2008. The PRSC series supported the establishment of the Government wide Monitoring and Evaluation (M&E) System which has served as the foundation of a results-based management system. The preparation of the Third Growth and Poverty Reduction Strategy Paper (GPRSP III) has benefited from the M&E system and all its programs have a result framework and their implementation is closely monitored and linked to the financial execution of projects. 21. Overall, the selection of indicators was broadly appropriate to capture the progress made under this pillar, and targets were largely met. For instance, the indicator on “use of updated indicators by Government in planning and monitoring” encouraged the Government to adopt a results-based approach to monitoring public investments.

41
CPS Pillar 2 – Improving Competitiveness and the Investment Climate for Private Sector-Led Growth
22. Pillar 2 is rated moderately unsatisfactory as one of the two objectives was mostly achieved and the other partially achieved. 23. Objective 1: Improved business climate. Four out of the five indicators were fully achieved. The Bank assistance helped Cabo Verde to rise from 143rd in the Doing Business rankings in 2008 to 122nd in 2012 (better than the original target of 132nd). Investment climate reforms were aimed at reducing bureaucratic hurdles and the cost of doing business, and included tax reforms, removal of administrative barriers, establishment of regulatory agencies, and private sector and institutional capacity building. From 2009 to 2011 an aggressive reform agenda for this area produced strong improvements in Cabo Verde’s business climate that have been reflected in the 2011 and 2012 Doing Business Reports. Cabo Verde was selected in the 2011 and 2012 DB reports as one of the top 10 countries that have made significant progress in improving the ease of doing business, improving twenty-five positions from the 146th position in 2010 to the 122nd in 2012. Both the PRSC series and the Growth and Competitiveness Project supported strengthening of the investment climate. The latter targeted private sector stakeholders, while the former largely supported policy reforms. At the closure of the Growth and Competitiveness Project, to speed up the pace of reforms and improve access to finance, the Bank agreed to prepare the SME Capacity Building and Economic Governance project, which supported the reduction of the number of days it takes to receive a business license and the cost of registering property. 24. The Bank also supported the reform agenda associated with Cabo Verde’s accession to the World Trade Organization (WTO) reached in 2008. Within this agenda, the PRSC series supported the adoption of a new customs code in 2009, the law on intellectual property in 2010 and the approval of a new investment code in 2012. The full implementation of the WTO agreements is expected to enable Cabo Verde to attract greater foreign investment inflows and level the playing field for business with the elimination of subsidies and fiscal incentives to specific sectors.
25. Objective 2: Improved access to and quality of key economic infrastructure services. Only four out of eleven indicators under this objective were fully achieved, hence this objective was only partially achieved. The design of the Energy and Water Sector Reform and Development Project was too ambitious, as both sectors lacked adequate institutional and regulatory, technical and managerial frameworks. Nonetheless, the project helped to push forward and shape the reform agenda in both sectors. The Bank’s engagement in the electricity and water sectors continued with the project on Recovery and Reform of Electricity Sector, which addresses the country’s chronic energy shortage Effective since May 2012, the project aims to increase electricity generation on the islands of Sao Vicente and Santiago, and to assist ELECTRA in reducing losses on Santiago. The Road Sector Support Project successfully established a road maintenance fund, estimated at Escudos 500 million (about US$6 million). New investments in rural roads significantly improved the mobility level of several small rural communities. The West Africa Regional Fisheries Program is on track to achieve and even surpass the objectives set at the design stage. For instance, the project has made considerable

42
progress in registering domestic fishing vessels by working closely with the Operational Nucleus for the Information Society (NOSI), an e- government system. Considering the post CPS period, we would like to underscore that three more indicators have since been fully or mostly achieved (Financial viability of ELECTRA, quality of the road network, and wind energy installed) although they were not accounted for in rating this CPS in line with OPCS guidelines. ELECTRA’s financial performance significantly improved in 2013 and will continue to do so in 2014. The “quality of the road network improved by increasing the proportion of roads rated fair to good condition” will surpass the 55% target by October 2014. And when smaller windmills installed in other islands such as Santo Antao are taken into account, the “wind energy installed” indicator will also have been achieved. 26. In addition to the Bank’s involvement in the energy, water, road, and fishery sectors under Pillar 2, IFC financed activities to improve access to finance for SMEs and for infrastructure projects development. In SME finance, an IFC credit line of EUR 5 million helped the publicly owned commercial bank, Caixa Economica de Cabo Verde (CECV), to increase its loan book and provide more private sector financing. IFC also supported the development of a credit bureau and a leasing program as alternative sources of finance for SMEs. In infrastructure, IFC financed the expansion of cellular telephone networks, which increased mobile phone penetration to 83 % in 2012 from 22 % in 2008. All 10 major islands now have expanded coverage. In addition, the communication tariffs were brought down to about US$0.10 per minute, compared to US$1 in 2008.
27. The achievement of objectives under Pillar 2 was complicated by the fact that it encompassed several distinct sectors. Considerable progress was made in the energy sector over the course of the CPS, despite some slippages. In the road sector project, there was a disparity between the baseline in the CPS and the project baseline; and the target in the CPS results matrix was higher than the one in the project document as per the Implementation Status and Results Report (ISR). In the fisheries sector, the indicators were not specific or time sensitive. CPS Pillar 3 – Strengthening Human Capital and Social Inclusion
28. Pillar 3 is rated moderately unsatisfactory as one of the two objectives was only partially achieved. 29. Objective 1: Better positioning of the education and TVET sectors to meet the needs of the labor market. Only one indicator out of three for this objective was fully achieved. The Bank carried out analytical work to inform policymaking in the TVET sector, and financial support for the expansion of the TVET supply has been provided by the Dutch Cooperation (from 2008 to 11) and by the Luxemburg Cooperation (from 2012 onwards). Up to 2010 the delivery of technical and vocational courses increased substantially from 1,500 beneficiaries in 2008 to 5,200 in 2010. Supported by the Dutch Cooperation, the Training Support Fund (TSF) reactivated in 2009 played an important role in the expansion of TVET courses. In 2010, 55 projects involving 11 public and private providers had been financed in the amount of about €550,000 for the period 2009-2010, very close to the €600,000 target for the period. Good progress was also obtained on the institutional arrangements of the TEVET sector. In 2011, the

43
Government approved new statutes for the Employment and Professional Training Institute (IEFP) and for the publicly funded Employment Centers (ECs). The integration of vocational training programs and ECs under the new IEFP model would ensure that vocational training is better attuned to the needs of private employers, indeed the private sector has been involved in consultations on qualifications and courses. The Government also introduced a national qualification framework to ensure the quality of training is consistent with international benchmarks, namely the system applied in the EU. Finally, the certification/accreditation system for TVET programs was operationalized and new 7 training centers were certified in 2011-2012. 30. However, fiscal constraints and the end of the Dutch cooperation program interrupted the expansionary trend observed until 2010. The number of beneficiaries of TVET actions dropped from 5,150 trainees in 2010 to 2,300 in 2011 and further to 1,552 in 2012. This drop also resulted from the Government’s decision to put on hold the TSF in 2011 while new regulations and financial arrangements to ensure its financial sustainability were defined at the end of 2012. In 2013, the Government capitalized the TSF and it is expected that the number of beneficiaries will recover in the short run. 31. Objective 2: Improved targeting of public expenditures and specific programs. Three out of the five indicators of this objective were achieved. The TA on access to justice, financed by the Japan Social Development Fund, supported the social inclusion agenda. It provided the most vulnerable groups with access to basic legal advice in the most pressing legal issues. Four new legal centers became operational increasing the number to eleven. Communities and community leaders have thus received legal literacy training and legal counseling by trained paralegals in the eleven legal centers. The HIV/AIDS project aimed to reduce the spread of HIV/AIDS infection in Cabo Verde but it was challenging to ensure political commitment to target vulnerable populations.
32. Financed by the Capacity Development for Poverty Work & PRSPs in African Countries, the Bank supported the Government efforts on the building-up of the Government’s M&E system to assess progress in the GRPS-2. The grant activities encompassed the preparation of a Diagnostic Report of the M&E system, workshops on M&E, impact evaluation, Software Platform for Automated Economic Analysis (ADePT) and Poverty Map which supported the definition of outcome indicators for the GPRSP III and are expected to improve the targeting of Government programs.
33. The implementation of household living standards surveys for poverty indicators and diagnostic of the incidence of key public programs has not been carried out by the National Statistical Institute (INE) which suffers from a shortage of financial and human resources. Once the activities envisioned under the Trust Fund for Statistical Capacity Building begin, they will be able to address some of INE’s limitations. Indeed, the project will support training on sampling techniques, revision of survey tools, data bank management and civil registration data analysis to name a few.
34. The indicators under this pillar are mostly linked to AAA products and the PRSC series making it difficult to discern the direct impact of the Bank’s assistance. As a case in point, the change in the indicator ‘%age of secondary school pupils of the third cycle proceeding
44
to technical school increased from base of 13.8 in 2008 to 14.1 % in 2012’ is attributable to the financing the Bank provided to the GoCV through the PRSC series. The Bank solely relied on the Government’s commitment to allocate some of the funding from the budget support line to the education sector but the budget allocation for education did not meet the target. Moreover, the AAA products focused on the diagnostic aspect of the issues while the GoCV and other DPs (under the umbrella of the Budget Support Group) were expected to carry out the activities to allow a better positioning of the education and TVET sectors for the labor market. For the indicator “Increase in number of vocational trainees to 8,000 by 2012” training had mainly been supported by a Training Support Fund (TSF) set up with financial support from the Dutch Government. In 2011 the Dutch Government withdrew from the sector and the GoCV has not been able to finance the TSF. Although the Bank supported the Government’s strategy in this sector through a Higher Education AAA, highlighting how higher education can support the economic and social transformation agenda in Cabo Verde, there was no investment project to impact the change in number of vocational trainees. Finally, the HIV/AIDS project lacked baseline data for key indicators, which complicated the process of results-oriented project management.
C. Overall CPS Assessment
35. The CPS program broadly delivered the major expected objectives across the three strategic pillars. Under Pillar 1, most of the planned public reforms were achieved. Under Pillar 2, progress was made in the transport and energy sectors, and the private sector development agenda was advanced. Under Pillar 3, some progress was made in the social inclusion agenda, but activities to strengthen human capital fell short of the expected results. There were some minor shortcomings, such as the lack of clear and logical connections between Bank projects and some of the outcome indicators, which weakened the results matrix. On balance, the CPS performance is rated Moderately Unsatisfactory. III - BANK PERFORMANCE
36. Evaluation of the Bank’s performance focuses on two key dimensions: (a) design of the program; and (b) implementation of the CPS program.
A. CPS Design and Relevance
37. The FY09-12 CPS was well-aligned with the development priorities underscored in the GPRSP II. The Bank continued to concentrate its financial resources in selected areas within the three pillars of the CPS so as to achieve transformational change over time. The areas of engagement of the CPS were well aligned with those of the GPRSP II, including a strong emphasis on energy, infrastructure, and private sector development. The Bank was commended by the two main Chambers of Commerce (Sotavento and Barlavento) for its successful engagement with small and medium enterprises through the matching grants program. The timeframe for project implementation was mostly adequate. Among the Bank’s client countries, Cabo Verde is a strong performer with demonstrated Government capacity on structural reforms. Thus, the choice of the PRSC series as the main lending instrument supported by investment projects in the critical sectors was adequate.

45
38. Overall, the expected objectives were well defined and appropriate. However, the results framework could have been strengthened by omitting results that were not expected to be achieved over the CPS period. The implementation of some activities was delayed due to internal Bank procurement and legal procedures. A more realistic assessment of preparation time and implementation readiness could have helped to set achievable target values for some of the indicators. The flexibility in the choice of AAA products provided the Bank with the tools to effectively respond to the Government’s demands throughout the CPS period, including with a Public Expenditure Management and Financial Accountability Review, and knowledge products to support policymaking in education and transport.
B. Implementation of CPS Support Program
39. The Bank team demonstrated a high level of commitment to implementing the projects in the CPS portfolio; and the PRSC series successfully supported broader structural reforms in public financial management. However, changes in the program’s leadership and lack of coordination among project implementation units somewhat impeded the transfer of experience and knowledge gained from earlier projects. In the area of private sector development, for instance, the design of the SME Capacity Building and Economic Governance Project did not build on the lessons learned from implementation of the Growth and Competitiveness Project. Further, some of the indicators were not well aligned with the specificities of the country’s FDI landscape. 40. The Analytical and Advisory Assistance program was responsive to the client’s needs and focused on the priority issues of infrastructure development, public sector effectiveness, and private sector competitiveness. The analytical portfolio consistently informed the design of new projects. As a case in point, the design of the new transport project built on the findings of the Air Transport Diagnostic AAA. In addition, the Bank – cognizant of the weak institutional capacity in the energy and water sectors, and in preparation of the current IBRD project on Recovery and Reform of the Electricity Sector – supported in-depth analytical work on institutional arrangements in those sectors through the Public-Private Infrastructure Advisory Facility (PPIAF)’s TA program for ELECTRA. The Poverty Assessment TA informed the dialogue on reforming targeted social assistance, while the Financial Sector Assessment Program identified areas for strengthening banking supervision. The Initial Labor Market Assessment reviewed constraints in the labor market, and provided grounds for optimism regarding net job creation and integration of the national labor market. The TA for the Public Investment Program helped develop the Government's capacity to routinely evaluate the poverty, gender, and other social impacts of investments. The PEMFAR provided important inputs to the policy dialogue under the PRSC series. 41. Effective country team involvement in implementing the program helped to maintain the focus on development objectives despite the adverse effects of the global and then the euro crisis. The smooth implementation of the program at the project level benefited from the strong commitment of the country team coupled with multiple supervision visits from the project TTLs and ongoing dialogue with the Project Implementation Unites (PIUs). However, internal Bank fiduciary (procurement and financial management) processes delayed the

46
implementation of several projects over the course of the CPS. The cost of implementation exceeded the initial allocation for the Growth and Competitiveness and HIV/AIDs projects.
42. The Bank was highly responsive to the changing priorities and demands of the Government. The team’s flexibility was key to achieving salient objectives not initially included in individual project designs. For instance, the Growth and Competitiveness Project did not include the design of a Strategic Plan for the Chamber of Commerce of Cabo Verde. Yet the Bank team foresaw the value of creating a strategic plan for the Chamber of Commerce, and worked with the PIU to include it in the project’s activities. The strategic plan has since guided the work and increased the efficiency of the Chamber of Commerce. The Bank’s responsiveness was also demonstrated by the West Africa Regional Fisheries Program which added a component to upgrade the port of Praia to make it suitable for exports towards Europe. This will bring to two the number of ports certified to serve the European Union market, the first one being the port of Mindelo in San Vicente. 43. The use of the CPS Progress Report (CPSPR) to introduce course correction and update the results matrix was broadly satisfactory. As requested by the World Bank Executive Directors at the time of the CPS Board discussion, the CPSPR was completed before the completion of the first two years of the CPS to provide the necessary course correction in light of the global economic crisis. To make the changes inclusive and relevant, the review process included consultations with private sector stakeholders and civil society. The CPSPR included new indicators to replace those unlikely to be achieved, and adjusted those whose targets had already been achieved by increasing target values. Some outcome indicators were not adequately revised to reflect changing sector and project contexts, such as implementation delays and shifting Government priorities. Overall, the Bank’s strategy remained unchanged, with only minor adjustments to the timing and amount of credits disbursed. The CPSPR also recognized that the initial objectives of GPRSP II, to reduce unemployment below 10 %, attain a real economic growth rate above 10 %, and cut poverty by half, were too ambitious in view of the global crisis. 44. The Bank’s efforts to enhance the overall value of donor assistance were highly effective. In accordance with the Paris Declaration for Aid Effectiveness, the Bank joined other major bilateral and multilateral donors to harmonize their budget support around a mutually agreed-upon policy matrix aligned with the Government’s GPRSP II. During the implementation of the CPS, the Bank contributed to the Budget Support Group (BSG) with an envelope of US$37 million, and coordinated the activities of the group in 2012. In that capacity, and in the absence of an IMF program in Cabo Verde, the Bank has been providing macroeconomic assessments to the other BSG members since June 2012.21 The ongoing Country Economic Memorandum (CEM) will further support the Government’s macroeconomic agenda. In addition, the Bank played a key role in ensuring strategic coherence of donor support in the public finance, roads, and energy sectors through policy dialogue and technical support. The Bank is continuing to lead the discussions within the Budget Support Group regarding the definition of a new common matrix for the 2013-16 GPRSP III.
21 The last IMF Policy Support Instrument (PSI) closed in February 2012.

47
45. Sustained dialogue and smooth implementation of the CPS strengthened the already good partnership between the Bank and the Government. The Bank has a good reputation among Government counterparts and PIUs. As a member of the Budget Support Group, the Bank’s work was further reinforced by the unified communication system. In fact, under the unified communication system, the GoCV only deals with one interlocutor on the donors’ side in charge of consolidating the views of all the DPs. 46. Risk identification and corresponding mitigation measures played a key role in the overall achievements of the program. At the CPS design stage, the Bank identified the global economic slowdown and the euro crisis as risks that could hamper achievement of the country’s development objectives. The measures recommended in the CPS22 helped to mitigate these risks. The Poverty Assessment identified additional mitigation measures for vulnerable groups. The CPSPR was then used to review and adjust the program’s development objectives. The risk of political interference with major structural reforms in the infrastructure sectors was accounted for by setting realistic objectives indicators. To mitigate the risks pertaining to contingent liabilities, the CPS provided targeted support to the energy sector through ELECTRA’s recapitalization; supported the strengthening of the Economic Regulation Agency (ARE) which regulates public agencies; and helped identify sustainable Public Private Partnerships in the SMEs sector.
47. The weak administrative capacity in the public sector was offset with capacity-building activities and technical support from the BSG. As the prospect of declining concessional financing became palpable, the Government included only firm agreements rather than notional commitments in its budget and medium-term framework. Via the PRSC series, the Bank increased its IDA financing for Cabo Verde, with a total allocation of US$46 million for IDA 16. In FY 11 the Bank also made available US$12 million in unused IDA resources within the Africa Region to Cabo Verde. Using its convening power, the Bank also encouraged donor partners to maintain concessional commitments to the country.
C. Bank Performance Rating
48. The overall design of the strategy was adequate and well aligned with Cabo Verde’s GPRSP II goals. However, some of the outcome indicators could have been better designed to capture the impacts attributable to the Bank. The Bank can be commended for its substantial level of proactivity, the good dialogue maintained with the Government throughout CPS implementation, and the strong focus on results. However, the monitoring and evaluation aspect of the program fell short in terms of timely results reporting and adjustment of indicators. The good performance of the current portfolio and the strong commitment of the country team have laid the groundwork for good results in the next strategy period. Therefore, the World Bank Group performance is overall rated as fair.
22The mitigation measures included Cabo Verde’s build-up of sizable international reserves in recent years; its standing line of credit with the Central Bank of Portugal; continued monitoring of its macroeconomic situation under the IMF PSI, and after it was discontinued, by the Bank; its access to budget support from the BSG donors; and the country’s solid track record of proactive economic management and timely adjustment to shocks.

48
IV- KEY LESSONS LEARNED AND SUGGESTIONS FOR THE NEXT CPS
A. CPS Design and Focus
49. The results matrix needs to be aligned only with objectives of projects in the portfolio, and not with objectives dependent on external factors. In Pillar 2, some of the indicators linked to the completion of reforms were not updated in the CPSPR, which led to difficulties during the evaluation. In fact, the design of reforms was ambitious and not time sensitive. Pillar 3 was supported mainly by non-lending activities, without any Bank investment projects to carry out the recommendations arising from the analytical work. This made it difficult during the evaluation to attribute changes to the Bank’s involvement, particularly since the objectives were achieved as a result of other donor activities and the Government’s commitment to invest in economic infrastructure.
50. The Bank’s focus on the critical energy sector was appropriate, and should continue, building on the knowledge gained from its involvement in the sector over the years. The Bank turned the unsatisfactory performance of the Energy and Water Sector Reform and Development Project into a learning opportunity, 23 and began to focus on institutional strengthening. For example, the Bank encouraged the Government to adopt performance-based contracts, strengthen the collection system through the use of smart metering, and reform the management of the sector. The lessons learned from all of these actions subsequently guided the design of the Recovery and Reform of the Electricity Sector Project which is currently rated Satisfactory.
51. As an emerging middle-income country, Cabo Verde could become a focal point for South-South learning. The Bank has already supported a successful exchange on policy and institutional reform issues between Cabo Verde and Mauritius through the South Experience Exchange Trust Fund. Based on this experience, the Bank could assist Cabo Verde in facilitating South-South exchanges on sectoral reforms and on the provision of guidance to low-income countries.
52. Going forward, stronger institutional capacity building will be necessary as Cabo Verde develops its IBRD portfolio. Bank-financed projects could include stronger institutional capacity building activities to strengthen the sector ministries. The National Planning Department, housed in the Ministry of Finance, has strong implementation capacity, but other ministries generally have weak capacity, particularly in the collection, evaluation, and dissemination of the data needed to monitor their projects and programs.
B. CPS Implementation
53. There is a lack of economies of scale due to the small size of the country. Better resource management will be necessary in the future, and the country team could leverage the resources of the Dakar Country Office to continue to maintain close dialogue with the Government of Cabo Verde as the IBRD portfolio in the country increases.
23 The Bank paid closer attention to regulatory strengthening, tariff policy, institutional arrangements, and strengthening the financial position of ELECTRA.

49
54. Cabo Verde’s experience in transport and energy demonstrates how policy reforms under the PRSC series, combined with operations support under investment projects, can be mutually reinforcing. Going forward, the Bank should continue the approach of combining sectoral policy work with investment projects. 55. The Bank should continue to assist the Government in statistical capacity building. Targeted assistance could build on the work started under two of the expected objectives this CPS and include (a) providing funding to the National Statistics Institute (INE) for the “Implementation of household living standards surveys for poverty indicators and diagnostic of the incidence of key public programs”; and (b) focusing on the social sector to allow “Public investment programs to routinely evaluate poverty, gender and other social impacts of investments.”

50
ANNEX 1: SUMMARY OF CPS PROGRAM SELF-EVALUATION (FY09-FY12)
CPS Objectives Status and Evaluation Summary Lending and Non-Lending Activities that Contributed to the Outcome
Lessons and Suggestions for the New CPS
Pillar 1: Promoting Good Governance and Public Sector Capacity 1. Reduced and
better managed liabilities
Achieved Outstanding stock of Government arrears cleared
and no new arrears accumulated. Actual: The Government has completed the clearance of outstanding arrears recognized in 2005 at the end of the first CPS.
Effective implementation of ELECTRA suppliers’ arrears clearance plan, following its adoption in 2009. Actual: A new reform agenda based on PEMFAR 2012 was adopted, and the Government is preparing an action plan for PFM reform.
PRSC IV-VII Public-Private
Infrastructure Advisory Facility (PPIAF) Study on Economic Regulatory Agency (ARE)
TA on Debt Management
Country Economic Memorandum
The PRSC series, supported by targeted analytical notes, closely monitored the achievement of this outcome, and such actions should be continued under the new CPS.
2. Strengthened management of public resources at central and local levels
Achieved All municipal Governments produce timely
accounts as a result of generalization of the Municipal Information System (SIM). Actual: The Court of Auditors reported that 14 municipalities were audited in 2011.
The number of municipalities using SIM and producing timely accounts increases from 3 in 2008 to 12 in 2010. Actual: The indicator was revised to refer only to the use of SIM, not the production of timely accounts. The number of municipalities using the SIM rose from 3 in 2008 to 18 as of June 2010, so the indicator was achieved.
PRSC IV-VII Public Investment
Program TA

51
CPS Objectives Status and Evaluation Summary Lending and Non-Lending Activities that Contributed to the Outcome
Lessons and Suggestions for the New CPS
Budgeted expenditures are closely aligned with the GPRSP and MTEF. Actual: The public investment portfolio was closely aligned with the five pillars of the GPRSP II and supported by the MTEF.
Percentage of Government budget units with access to and effective utilization of the Integrated Budget and Financial Management System (SIGOF) increases from 80 to 100 %. Actual: This indicator was achieved.
3. Strengthened public administration regulatory and oversight role
Mostly Achieved The delay between budget execution and
auditing of State accounts is reduced from 3 years in 2008 to 2 years by 2012. Actual: The number of years between budget execution and completion of audits was 2 years by 2011.
2009 accounts are submitted by 2010 and audited by 2011, and 2010 accounts are submitted by 2011 and audited by 2012. Actual: The timely submission of the State’s Annual General Accounts and the external audits by the Court of Accounts were achieved under the PRSC programmatic series.
Fully operational national M&E system. Actual: platform linking INE database with M&E system in Ministry of Finance is not fully operational as it is not fed with input indicators from other parts of the administration.
All output indicators for active projects and
PRSC IV-VII Trust fund for
Statistical Capacity Building
The timely availability of up-to-date indicators is contingent on funding. The next CPS could provide technical and financial assistance to INE for timely collection and evaluation of data.

52
CPS Objectives Status and Evaluation Summary Lending and Non-Lending Activities that Contributed to the Outcome
Lessons and Suggestions for the New CPS
programs are integrated in a national M&E system. Actual: As of 2010, 67% of the annual budget has gone to programs integrated into the national M&E system, up from zero in 2008. The indicator ‘percentage of the annual budget allocated to the integration of programs into the national M&E system’ was dropped in PRSC VI. In 2010, the indicators for all active programs were being monitored. GPRSP III will be monitored by a well-developed M&E system.
Use of updated indicators by Government in planning and monitoring programs. Actual: The national M&E system includes all investments in the public investment program. GPRSP III will include updated indicators to monitor the public investment portfolio.
Up-to-date indicators on tourism, transport, water and sanitation. Actual: The 2010 Census included monitored data on water and sanitation. However, lack of funding impeded the availability of 2012 data on water and sanitation. INE has 2011 indicators for transport, tourism. This outcome was partially achieved.
Pillar 2: Improving Competitiveness and the Investment Climate for Private Sector Growth 1. An improved
business climate Achieved Doing Business ranking improved from 143 in
2008 to 132 in 2012. Actual: In the 2012 DB report, Cabo Verde ranked 122nd. This indicator was achieved.
PRSC IV-VII Growth &
Competitiveness Project
SME Capacity
Ensure that indicators selected for CPS are monitored and corrected at CPSPR as needed to avoid detrimental ratings.

53
CPS Objectives Status and Evaluation Summary Lending and Non-Lending Activities that Contributed to the Outcome
Lessons and Suggestions for the New CPS
More services added to the Citizen House. Actual: This indicator was achieved with the addition of bill and tax payment services to business licenses and birth, marriage and death certificates.
Improved access to microfinance and telecommunications. Actual: Access to cellphones and broadband rose 123% and 184 %, respectively, during 2007-09. The indicator had been revised at CPSPR to improved access to business development services for SMEs, and to telecommunications. At the end of the CPS, 150 SMEs had improved access to business development services. This indicator was achieved.
Tourism master plan with local content approved. Actual: National Tourism Plan was adopted by Council of Ministers in 2009. Tourism planning to diversify tourism across islands is supported under the SME Capacity Building and Economic Governance Project. This indicator was achieved.
Increased FDI in tourism in line with National Tourism Plan. Actual: Baseline indicator was 0.427 in 2012 with a target of 0.405 for 2014. Although the level of FDI increased, as of April 30, 2012 there was no progress from the baseline. This indicator was not achieved
Building and Economic Governance Project
IFC investments in finance and telecom
Poverty Assessment
Skills Development Study

54
CPS Objectives Status and Evaluation Summary Lending and Non-Lending Activities that Contributed to the Outcome
Lessons and Suggestions for the New CPS
2. Improved access to and quality of key economic infrastructure services
Partially achieved Generation capacity increased by 50 % during
2008-12, with the share from renewable energy rising from 3% to15% by 2012. Actual: The generation capacity was 73.9MW in 2008 and 116MW in 2012, which is a 57% increase. The share of renewable energy generated was 16% in 2012. This indicator was achieved.
The generation capacity was 73.9 MW in 2008. 30MW of additional heavy fuel oil generation capacity contracted by 2012. Actual: Heavy fuel oil generation capacity was above 30MW in 2012. This indicator was achieved.
Financial viability of ELECTRA significantly strengthened by 2012, as evidenced by an increase in the debt service coverage ratio from 0.3 in 2008 to 1.1 by 2012. Actual: The DSCR for 2012 was either 0.4 or 1.4 depending on the inclusion or not in the debt service calculation of a major bond refinancing which happened in that year. Substantially, ELECTRA remains financially dependent from Government support, but its performance is improving thanks to the measures put in place by the GoCV and the utility (tariff adjustments, improved revenue collection, investments, efficiency drive…). ELECTRA’s financial performance significantly improved in 2013 and will continue to do so in 2014. This indicator was not achieved by end of
Financial Sector Assessment Program
Sub-national TA Support to ELECTRA
Energy and Water Sector Reform and Development Project
Road Sector Support Project/Road Sector AF
Air Transport Diagnostic AAA
West Africa Regional Fisheries Program
Public Investment Program TA
Ensure that indicators selected for CPS are adjusted at CPS Progress Report to correct for discrepancies in the targets and baselines noted in the CPS results matrix versus those in the project documents. Better specification, (definition and measurability) of indicators achievable during the CPS timeframe could also help improve the quality of the results matrix. Including different sectors under the same outcome is not ideal, as the overall moderate performance of the energy and water sector overshadowed the satisfactory achievements in the road and fisheries sectors.

55
CPS Objectives Status and Evaluation Summary Lending and Non-Lending Activities that Contributed to the Outcome
Lessons and Suggestions for the New CPS
CPS period. 28MW of wind energy installed. Actual: The
installed and functioning wind energy generation capacity was 27MW at the end of 2012 from about 3MW in 2008. This indicator was not achieved during the CPS period. However, 27 MW is for the 4 wind farms developed by the Cabeolica project company. In addition, there are a few additional smaller windmills installed in other Islands such as Santo Antao – when they are taken into account, the installed capacity is around 29MW.
Technical and non-technical losses decline from 30% toward less than 22-23% in 2012 (2010 benchmark: 24%). Actual: The technical and non-technical losses stood at 27.8% in 2012. This indicator was not achieved.
Percentage of road network with maintenance increases from 35% to 50%. Actual: 44% of the road network was covered by a performance-based maintenance contract that began in 2010 and expired in December 2012. This indicator was substantially achieved but did not meet the target value set in the CPS; therefore, it was partially achieved.
Quality of the road network improved by increasing the proportion of roads rated fair to good condition by 10% (baseline: 45%; target: 55%). Actual: In the ISR, baseline is 41%; target

56
CPS Objectives Status and Evaluation Summary Lending and Non-Lending Activities that Contributed to the Outcome
Lessons and Suggestions for the New CPS
is 50% for 2013). There is a discrepancy between the baseline and target values in the CPS and in the project documents. As of November 2011, the value of the indicator was 41%. The indicator was not achieved by end of CPS period. However, in mid-2013, the % was at 50 according to the Results Framework of the Transport Sector Reform Project. This figure continues to change as there are three ongoing rehab contracts (Santo Antão, Fogo and São Nicolau) and one more will be signed soon (Maio). When these rehab works are completed (before October 2014 for the first three), the % will have reached more than 60%. At mid-2014, this indicator is mostly achieved.
Road maintenance financing mechanism implemented. Actual: A road maintenance fund estimated at Escudos 500 million has been established. This indicator was achieved.
Action plan to strengthen Transportes Aéreos de Cabo Verde (Cabo Verde Airlines) (TACV) adopted and under implementation. Actual: No action plan to strengthen TACV was adopted during the CPS. Hence this indicator was not achieved during the CPS period. However, in January 2013, the consulting firm Global Energy completed a very comprehensive diagnostic of TACV, accompanied by a multi-year business development strategy. In parallel, out of the
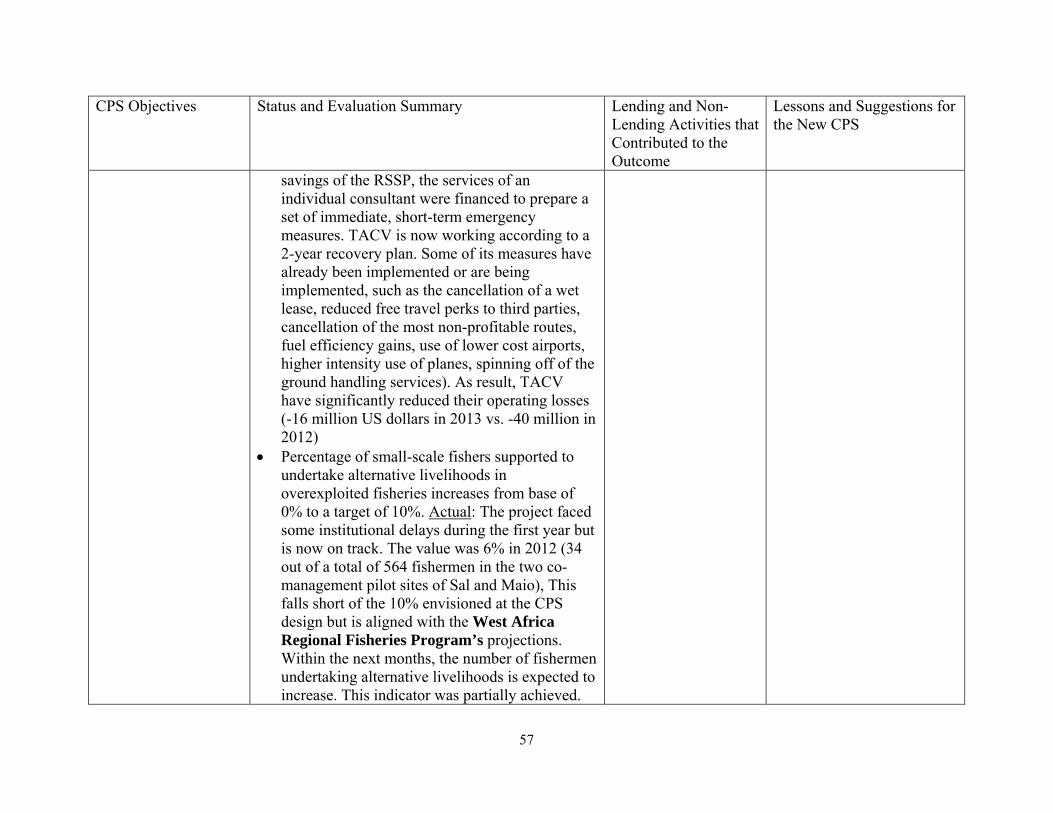
57
CPS Objectives Status and Evaluation Summary Lending and Non-Lending Activities that Contributed to the Outcome
Lessons and Suggestions for the New CPS
savings of the RSSP, the services of an individual consultant were financed to prepare a set of immediate, short-term emergency measures. TACV is now working according to a 2-year recovery plan. Some of its measures have already been implemented or are being implemented, such as the cancellation of a wet lease, reduced free travel perks to third parties, cancellation of the most non-profitable routes, fuel efficiency gains, use of lower cost airports, higher intensity use of planes, spinning off of the ground handling services). As result, TACV have significantly reduced their operating losses (-16 million US dollars in 2013 vs. -40 million in 2012)
Percentage of small-scale fishers supported to undertake alternative livelihoods in overexploited fisheries increases from base of 0% to a target of 10%. Actual: The project faced some institutional delays during the first year but is now on track. The value was 6% in 2012 (34 out of a total of 564 fishermen in the two co-management pilot sites of Sal and Maio), This falls short of the 10% envisioned at the CPS design but is aligned with the West Africa Regional Fisheries Program’s projections. Within the next months, the number of fishermen undertaking alternative livelihoods is expected to increase. This indicator was partially achieved.

58
CPS Objectives Status and Evaluation Summary Lending and Non-Lending Activities that Contributed to the Outcome
Lessons and Suggestions for the New CPS
Value per unit of fishing effort in targeted fisheries increased by 10% from base of 37kg/motorized vessel for artisanal fisheries, and base of 170kg/motorized vessel for artisanal small pelagic fisheries. Actual: This indicator is on track in relation to the projections established under the West Africa Regional Fisheries Program 32 kg/trip/motorized vessel for artisanal fisheries (2010 data). For artisanal small pelagic fisheries it is 210 kg/trip/motorized vessel (for purse seine fisheries: 280 kg/trip/motorized vessel; for gillnet fisheries: 135 kg/trip/motorized vessel; for hand-line fisheries: 75 kg/trip/motorized vessel (2010 data)). For artisanal fisheries, the catch rate has decreased, but the use of newly established fisheries management tools will improve rate of return in the short to medium term. This indicator was partially achieved.
Pillar 3: Strengthening Human Capital and Social Inclusion 1. Better positioning
of education and TVET sectors to meet labor market needs
Partially achieved Percentage of secondary school pupils of third
cycle proceeding to technical school increased from base of 13.8% in 2008 to 16% in 2012. Actual: In 2011, 15% of secondary school pupils of third cycle proceeded to technical school. The value for 2012 was not available. This indicator was partially achieved.
Studies conducted to estimate future labor
PRSC IV-VII Skills
Development Study
Initial Assessment of Labor Markets-Higher Education AAA
This outcome was mainly supported by analytical work and the Bank’s contribution to the Government’s general budget through the PRSC series. As such, Bank activities were not attributable and did not

59
CPS Objectives Status and Evaluation Summary Lending and Non-Lending Activities that Contributed to the Outcome
Lessons and Suggestions for the New CPS
demand and TVET training needs in various sectors. Actual: Four studies conducted in 2009. This indicator was achieved.
Increase in number of vocational trainees to 8,000 by 2012. Actual: The number of vocational trainees was 6,000 in 2010 and 1,500 in 2012. This indicator was not achieved.
directly influence the change in outcome. In the future, policy work could be strengthened with the implementation of investment projects funded by the Bank.
2. Improved targeting of public expenditures and specific programs
Partially achieved Public investment program routinely evaluates
poverty, gender and other social impacts of investments. Actual: There was no evaluation of poverty, gender and other social impacts of investments. This indicator was not achieved.
Capacity building on poverty and social impact analysis conducted for staff in key ministries. Actual: In March 2012, the Bank conducted a workshop on M&E for 60 key ministry officials. This indicator was achieved.
Access to basic legal advice on the most pressing legal issues increased for the most vulnerable groups. Actual: This indicator was met via legal literacy training for communities and community leaders, and is continuing via legal counseling by trained paralegals in 11 new legal centers. This indicator was achieved.
Number of legal centers operating increases from 7 in 2008 to 11 in 2010. Actual: 11 legal centers were established as of June 2009. This indicator was achieved.
PRSC V-VII Poverty
Assessment Public Investment
Program TA HIV/AIDS project Trust Fund for
Statistical Capacity Building
Going forward, strengthen diagnostic of key public programs and evaluate poverty, gender and other social impacts of public investments.

60
CPS Objectives Status and Evaluation Summary Lending and Non-Lending Activities that Contributed to the Outcome
Lessons and Suggestions for the New CPS
Implementation of household living standards surveys for poverty indicators, and diagnostic of the incidence of key public programs. Actual: The latest household living standards surveys for poverty indicators by INE were produced in 2007. This indicator was not achieved.

61
ANNEX 2: PLANNED LENDING PROGRAM AND ACTUAL DELIVERIES (FY09-FY12)
CPS PLANS (March 25, 2009) STATUS* FY Project US$ (M) US$ (M)
IDA IBRD IDA IBRD2009 PRSC IV
Subtotal
10.0 0.0 Actual Subtotal
10.0 0.0
2010 PRSC V Road Sector Support SME Capacity Building and Economic Governance Energy Sector Support Operation Energy Sector Partial Risk Guarantee West Africa Regional Fisheries Program Subtotal
10.0 5.0 3.5 0.0 0.0 1.5
0.0 0.0 0.0 41.0 11.8 0.0
Actual Forwarded to FY11 Actual Actual Dropped Actual Subtotal
15.0 4.5 0.0 0.0 2.0
0.0 0.0 53.5 0.0 0.0
Subtotal FY09-10 30 52.8 31.5 53.5 PROGRESS REPORT PLANS (January 13, 2011) STATUS 2011 PRSC VI
Subtotal
10.0
0.0
Actual Additional Actual project Road Sector Support Subtotal
10.0 9.0
0.0 0.0
2012 PRSC VII Transport Sector SIL Subtotal
10.0 1.5
0.0 0.0
Actual Actual Subtotal
12. 4.0
0.0 0.0
2013 PRSC VIII Transport Sector Reform Project
10.0 Place holder
0.0 Actual Actual
15.5 19.0
0.0 0.0
Subtotal FY11-13 31.5 62.8 Subtotal FY09-13 69.5 0.0 Total FY09-13 61.5 115.6 Total FY09-13 101 0.0 *Actual, dropped, or forward to a different FY, additional actual projects.

62
ANNEX 3: PLANNED WORLD BANK NON-LENDING PROGRAM AND ACTUAL DELIVERIES (FY09-FY12)
CPS PLANS (March 25, 2009) STATUS 2009 Poverty Assessment
Financial Sector Assessment Program
Actual Actual
2010
Initial Labor Market Assessment Debt Management Performance Assessment
Actual Actual
PROGRESS REPORT PLANS (January 13, 2011)
STATUS
2011
Air Transport Diagnostic AAA Higher Education AAA
Actual Delivered Additional Product ELECTRA: From Recovery to Sustainability Study – Sub-national Technical Assistance Program (SNTA) – Public-Private Infrastructure Advisory Facility (PPIAF)
2012
Country Economic Memorandum Public Investment Program TA
Actual Actual Additional Product Public Expenditure Management and Financial Accountability Review Policy note on SOEs institutional arrangements Review of the air and port sectors in Cabo Verde (IFC) Shaping the Future: How Higher Education can Support the Economic and Social Transformation Agenda in Cabo Verde
2013 Policy Note on Macro-Financial Sector Vulnerabilities

63
CPS CR Annex – Table 2: Planned World Bank Lending Program and Actual Deliveries (FY09-FY12)
CPS PLANS (March 25, 2009) STATUS* FY Project US$ (M) US$ (M)
IDA IBRD IDA IBRD2009 PRSC IV
Subtotal
10.0 0.0 Actual Subtotal
10.0 0.0
2010 PRSC V Road Sector Support SME Capacity Building and Economic Governance Energy Sector Support Operation Energy Sector Partial Risk Guarantee West Africa Regional Fisheries Program Subtotal
10.0 5.0 3.5 0.0 0.0 1.5
0.0 0.0 0.0 41.0 11.8 0.0
Actual Forwarded to FY11 Actual Actual Dropped Actual Subtotal
15.0 4.5 0.0 0.0 2.0
0.0 0.0 53.5 0.0 0.0
Subtotal FY09-10 30 52.8 31.5 53.5 PROGRESS REPORT PLANS (January 13, 2011) STATUS 2011 PRSC VI
Subtotal
10.0
0.0
Actual Additional Actual project Road Sector Support Subtotal
10.0 9.0
0.0 0.0
2012 PRSC VII Transport Sector SIL Subtotal
10.0 1.5
0.0 0.0
Actual Actual Subtotal
10. 4.0
0.0 0.0
Subtotal FY11-12 21.5 62.8 Subtotal FY09-12 33 0 Total FY09-12 Total FY09-12 *Actual, dropped, or forward to a different FY, additional actual projects.

64
CPS CR Annex – Table 3: Planned Non-Lending Program and Actual Deliveries (FY09-FY12)
CPS PLANS (March 25, 2009) STATUS 2009 Poverty Assessment
Financial Sector Assessment Program
Actual Actual
2010
Initial Labor Market Assessment Debt Management Performance Assessment
Actual Actual
PROGRESS REPORT PLANS (January 13, 2011)
STATUS
2011
Air Transport Diagnostic AAA Higher Education AAA
Actual Delivered Additional Product ELECTRA: From Recovery to Sustainability Study – Sub-national Technical Assistance Program (SNTA) – Public-Private Infrastructure Advisory Facility (PPIAF)
2012
Country Economic Memorandum Public Investment Program TA
Actual Actual Additional Product Public Expenditure Management and Financial Accountability Review

65
Annex 5: Cabo Verde at a Glance
Cabo Verde at a glance 3/25/14
Sub- LowerKey D evelo pment Indicato rs Cape Saharan middle
Verde Africa income(2012)
Population, mid-year (millions) 0.49 911 2,507Surface area (thousand sq. km) 4.0 24,262 20,742Population growth (%) 0.8 2.7 1.5Urban population (% of to tal population) 63 37 39
GNI (Atlas method, US$ billions) 1,790 1,230 4,745GNI per capita (Atlas method, US$) 3,620 1,350 1,893GNI per capita (PPP, international $) 4,930 2,227 3,877
GDP growth (%) 1.0 4.3 4.7GDP per capita growth (%) 0.2 1.5 3.2
(mo st recent est imate, 2005–2012)
Poverty headcount ratio at $1.25 a day (PPP, %) 21 a 48 27.1Poverty headcount ratio at $2.00 a day (PPP, %) 41 a 70 56.3Life expectancy at birth (years) 74 56 66Infant mortality (per 1,000 live births) 19 64 46Child malnutrition (% of children under 5) .. 21 24
Adult literacy, male (% of ages 15 and o lder) 90 69 80Adult literacy, female (% of ages 15 and o lder) 80 51 62Gross primary enro llment, male (% of age group) 114 104 107Gross primary enro llment, female (% of age group) 105 96 104
Access to an improved water source (% o f population) 89 64 88Access to improved sanitation facilities (% of population) 63 29 47
N et A id F lo ws 1980 1990 2000 2012
(US$ millions)Net ODA and official aid 62 105 94 246Top 3 donors (in 2012): Portugal .. 16 23 168 Luxembourg .. 0 8 18 Japan 2 1 11 13
Aid (% of GNI) 34.8 34.1 17.8 14.0Aid per capita (US$) 205 299 212 498
Lo ng-T erm Eco no mic T rends
Consumer prices (annual % change, eop) .. .. -1.1 4.1GDP implicit deflator (annual % change) 17.4 2.3 -1.9 3.0
Exchange rate (annual average, local per US$) 40.2 70.0 119.7 85.8Terms of trade index (2000 = 100) .. .. .. ..
1980–90 1990–2000 2000–12
Population, mid-year (millions) 0.3 0.4 0.4 0.5 1.5 2.3 0.9GDP (US$ millions) 139 307 539 1,796 5.4 7.1 6.3
Agriculture 18.6 14.4 12.9 8.0 3.2 1.9 4.6Industry 17.0 21.4 15.3 18.2 7.4 4.6 3.9 M anufacturing 5.2 8.3 6.1 6.2 8.0 5.1 2.7Services 64.5 64.2 71.8 73.8 5.6 7.6 5.6
Household final consumption expenditure .. .. .. .. .. .. ..General gov't final consumption expenditure .. .. .. .. .. .. ..Gross capital formation .. .. .. .. .. .. ..
Exports of goods and services .. .. 27.0 43.4 .. .. 14.3Imports of goods and services .. .. 60.5 65.2 .. .. 8.4Gross savings .. .. .. 35.0
Note: Figures in italics are for years other than those specified. .. indicates data are not available.a. Country poverty estimate is for earlier period.
Development Economics, Development Data Group (DECDG).
(average annual growth %)
(% o f GDP)
10 5 0 5 10
0-4
15-19
30-34
45-49
60-64
75-79
percent of total population
Age distribution, 2012
Male (..) Female (..)
020406080
100120140160180200
1990 1995 2000 2012
Cape Ve rde Sub-Sah aran Africa
Under-5 mortality rate (per 1,000)
-4-2024
68
101214
95 05
GDP GDP per capita
Growth of GDP and GDP per capita (%)

66
B alance o f P ayments and T rade 2000 2012
(US$ millions)
Total merchandise exports (fob) 38 184Total merchandise imports (cif) 226 900Net trade in goods and services -181 -177
Current account balance -59 -201 as a % of GDP -10.9 -11.2
Workers' remittances and compensation of employees (receipts) 85 168
Reserves, including gold 28 393
C entral Go vernment F inance
(% of GDP)Current revenue (including grants) 20.4 22.8
Tax revenue 16.2 17.9Current expenditure 27.7 22.2
T echno lo gy and Infrastructure 2000 2012Overall surplus/deficit (incl. onlending) -6.8 -13.5
Paved roads (% of to tal) 69.0 ..Highest marginal tax rate (%) Fixed line and mobile phone Individual .. 35 subscribers (per 100 people) 17 100
Corporate .. 25 High technology exports (% of manufactured exports) 0.8 0.6
External D ebt and R eso urce F lo ws
Enviro nment(US$ millions)Total debt outstanding and disbursed 320 1,597 Agricultural land (% of land area) 18 19Total debt service 16 121 Forest area (% of land area) 20.4 21.0Debt relief (HIPC, M DRI) – – Terrestrial protected areas (% of land area) 2.5 2.5
Total debt (% of GDP) 59.3 88.9 Freshwater resources per capita (cu. meters) 653 612Total debt service (% ofG&S exports) 11.1 12.4 Freshwater withdrawal (% of internal resources) 7.3 7.3
Foreign direct investment (net inflows) 42 58 CO2 emissions per capita (mt) 0.42 0.73Portfo lio equity (net inflows) 0 0
GDP per unit o f energy use (2005 PPP $ per kg of o il equivalent) .. 16.8
Energy use per capita (kg of o il equivalent) .. 213
Wo rld B ank Gro up po rtfo lio 2000 2012
(US$ millions)
IBRD Total debt outstanding and disbursed – 1 Disbursements – 1 Principal repayments – 0 Interest payments – 0
IDA Total debt outstanding and disbursed 98 313 Disbursements 10 16
P rivate Secto r D evelo pment 2000 2012 Total debt service 1 7
Time required to start a business (days) – 11 IFC (fiscal year)Cost to start a business (% of GNI per capita) – 14.9 Total disbursed and outstanding portfo lio 0 3Time required to register property (days) – 31 o f which IFC own account 0 3
Disbursements for IFC own account 0 0Ranked as a major constraint to business 2000 2012 Portfo lio sales, prepayments and (% of managers surveyed who agreed) repayments fo r IFC own account 1 1 n.a. .. .. n.a. .. .. M IGA
Gross exposure 2 0Stock market capitalization (% of GDP) .. 33.7 New guarantees 0 0Bank capital to asset ratio (%) .. 13.4
Note: Figures in italics are for years other than those specified. 3/25/14.. indicates data are not available. – indicates observation is not applicable.
Development Economics, Development Data Group (DECDG).
0.0 25.0 50.0 75.0 100.0
Control of corruption
Rule of law
Regulatory quality
Polit ical stability
Voice and accountability
Country's percentile rank (0-100)higher values imply better ratings
2012
2000
Governance indicators, 2000 and 2012
Source: Worldw ide Governance Indicators (www .govindicators.org)
IBRD, 1IDA, 313
IMF, 18
Other multi-lateral, 323
Bilateral, 486
Private, 118
Short-term, 2
Composition of total external debt, 2012
US$ millions

67
Millennium Development Goals Cape Verde
With selected targets to achieve between 1990 and 2015(estimate closest to date shown, +/- 2 years)
Go al 1: halve the rates fo r extreme po verty and malnutrit io n 1990 1995 2000 2012
Poverty headcount ratio at $1.25 a day (PPP, % of population) .. .. 21.0 .. Poverty headcount ratio at national poverty line (% of population) .. .. .. 26.6 Share of income or consumption to the poorest qunitile (%) .. .. 4.5 .. Prevalence o f malnutrition (% of children under 5) .. 11.8 .. ..
Go al 2: ensure that children are able to co mplete primary scho o ling
Primary school enro llment (net, %) 99 99 99 93 Primary completion rate (% of relevant age group) 56 73 106 99 Secondary school enro llment (gross, %) 20 28 67 93 Youth literacy rate (% of people ages 15-24) 88 .. .. 98
Go al 3: e liminate gender disparity in educat io n and empo wer wo men
Ratio of girls to boys in primary and secondary education (%) 99 97 99 103 Women employed in the nonagricultural sector (% of nonagricultural employment) .. .. 39 .. Proportion o f seats held by women in national parliament (%) 12 11 11 21
Go al 4: reduce under-5 mo rtality by two -thirds
Under-5 mortality rate (per 1,000) 62 50 38 22 Infant mortality rate (per 1,000 live births) 47 39 31 19 M easles immunization (proportion o f one-year o lds immunized, %) 79 85 86 96
Go al 5: reduce maternal mo rtality by three-fo urths
M aternal mortality ratio (modeled estimate, per 100,000 live births) 200 200 170 79 B irths attended by skilled health staff (% of to tal) .. 54 89 78 Contraceptive prevalence (% of women ages 15-49) 24 .. 53 61
Go al 6: halt and begin to reverse the spread o f H IV/ A ID S and o ther majo r diseases
Prevalence o f HIV (% of population ages 15-49) 0.4 0.7 0.6 0.2 Incidence of tuberculosis (per 100,000 people) 175 168 160 145 Tuberculosis case detection rate (%, all fo rms) 36 45 41 59
Go al 7: halve the pro po rt io n o f peo ple witho ut sustainable access to basic needs
Access to an improved water source (% of population) 80 81 83 89 Access to improved sanitation facilities (% of population) 36 37 44 63 Forest area (% of land area) 14.3 17.3 20.4 21.0 Terrestrial protected areas (% of land area) 2.5 2.5 2.5 2.5 CO2 emissions (metric tons per capita) 0.3 0.3 0.4 0.7 GDP per unit of energy use (constant 2005 PPP $ per kg o f o il equivalent) 12.3 .. .. 16.8
Go al 8: develo p a glo bal partnership fo r develo pment
Telephone mainlines (per 100 people) 2.3 5.4 12.4 14.2 M obile phone subscribers (per 100 people) 0.0 0.0 4.5 86.0 Internet users (per 100 people) 0.0 0.2 1.8 34.7 Households with a computer (%) .. .. 4.1 26.5
Note: Figures in italics are for years other than those specified. .. indicates data are not available. 3/25/14
Development Economics, Development Data Group (DECDG).
C ape Verde
0
25
50
75
100
125
2000 2005 2010
Primary net enrollm ent ratio
Ratio of girls to boys in pr ima ry & secondaryeducation
Education indicators (%)
0
20
40
60
80
100
120
2000 2005 2010
Fixed + mob ile subscribers
Internet users
ICT indicators (per 100 people)
0
25
50
75
100
1990 1995 2000 2012
Cape Ve rde Sub-Sah aran Afr ica
Measles immunization (% of 1-year olds)

68
Annex 6: Selected Indicators* of Bank Portfolio Performance and Management
As Of Date 10/28/2014
Indicator 2012 2013 2014 2015Portfolio Assessment
Number of Projects Under Implementation a 3 3 4 4
Average Implementation Period (years) b 3.2 1.5 2.0 2.3
Percent of Problem Projects by Number a, c 0.0 0.0 0.0 0.0
Percent of Problem Projects by Amount a, c 0.0 0.0 0.0 0.0
Percent of Projects at Risk by Number a, d 0.0 0.0 0.0 0.0
Percent of Projects at Risk by Amount a, d 0.0 0.0 0.0 0.0
Disbursement Ratio (%) e 23.2 17.2 37.6 22.7Portfolio Management CPPR during the year (yes/no) Supervision Resources (total US$) Average Supervision (US$/project)
Memorandum Item Since FY 80
Last Five FYs
Proj Eval by OED by Number 23 1 Proj Eval by OED by Amt (US$ millions) 280.3 29.1 % of OED Projects Rated U or HU by Number 8.7 0.0 % of OED Projects Rated U or HU by Amt 9.4 0.0
a. As shown in the Annual Report on Portfolio Performance (except for current FY). b. Average age of projects in the Bank's country portfolio. c. Percent of projects rated U or HU on development objectives (DO) and/or implementation progress (IP). d. As defined under the Portfolio Improvement Program. e. Ratio of disbursements during the year to the undisbursed balance of the Bank's portfolio at the
beginning of the year: Investment projects only. * All indicators are for projects active in the Portfolio, with the exception of Disbursement Ratio, which includes all active projects as well as projects which exited during the fiscal year.

69
Annex 7: Summary of Non-lending Services
CAS Annex B4 - Summary of Non-lending Services - Cabo Verde
As Of Date 10/28/2014
Product Completion FY Cost (US$000) Audiencea Objectiveb
Recent completions
Increasing Linkages for Pro-poor Tourism FY14 178
Government, donor, Bank,
public dissemination.
Knowledge generation,
public debate, problem-solving.
ROSC Accounting & Auditing (FY12) FY14 71 Government,
Bank
Knowledge generation, problem-solving.
Cabo Verde Public Expenditure Management and Financial Accountability Report (PEMFAR)
FY14 68 Government, Bank, donor
Knowledge generation, problem-solving.
NLTA for Pub. Inv. Prog. Capacity Bld FY14 147 Government, Bank, donor
Knowledge generation, problem-solving.
Macro-Financial Sector Vulnerability FY14 125 Government, Bank, donor
Knowledge generation, problem-solving.
Sources of Growth FY14 399
Government, donor, Bank,
public dissemination.
Knowledge generation,
public debate, problem-solving.
Underway Energy Conservation and Energy Efficiency Plan FY 15
20
Program Capacity Building Increasing Linkages – Certificates FY15 147 Debt Management Reform Plan Social Protection TA CV PFM Dialogue ROSC Implementation Support
Planned Policy note on SOE
a. Government, donor, Bank, public dissemination. b. Knowledge generation, public debate, problem-solving.

70
Annex 8: Key Economic Indicators

71
Cape Verde - Key Economic Indicators(Continued)
Actual Estimate Projected
Indicator 2007 2008 2009 2010 2011 2012 2013 2014 2015
Public finance (as % of GDP at market prices)e
Current revenues 28.1 28.7 27.6 28.6 25.6 22.8 23.4 25.2 25.4 Current expenditures 24.1 21.6 23.7 23.9 23.1 22.2 22.1 25.1 24.5 Current account surplus (+) or deficit (-) 4.0 7.1 3.9 4.7 2.5 0.6 1.3 0.1 0.9 Capital expenditure 2.8 8.6 9.8 15.3 10.2 10.4 9.0 8.8 7.4 Foreign financing 0.1 -0.3 -0.1 -0.4 6.0 7.5 4.9 5.9 2.9
Monetary indicators M2/GDP 72.7 72.0 74.1 77.1 75.4 77.1 82.5 83.0 82.7 Growth of M2 (%) 10 9 4 6 4 6 11 5 5 Private sector credit growth / 27 27 12 9 13 0 1 3 3 total credit growth (%) 26 25 11 9 14 0 1 3 3
Price indices( YR07 =100) Merchandise export price index .. .. .. .. .. .. .. .. .. Merchandise import price index .. .. .. .. .. .. .. .. .. Merchandise terms of trade index .. .. .. .. .. .. .. .. ..
Real exchange rate (US$/LCU)f
102.9 107.4 107.1 110.4 .. .. .. .. ..
Real interest rates 13 6 12 13 7 6 .. .. .. Consumer price index (avg. % change) 4.4 6.8 1.0 2.1 4.5 2.5 4.0 3.3 2.8 GDP deflator (avg. % change) 2.7 3.5 2.2 0.5 2.7 3.0 3.0 1.6 1.8
a. GDP at market pricesb. "GNFS" denotes "goods and nonfactor services."c. Includes net unrequited transfers excluding official capital grants.d. Includes use of IMF resources.e. Consolidated central government.f. "LCU" denotes "local currency units." An increase in US$/LCU denotes appreciation.

72
Annex 9: Key Exposure Indicators

73
Annex 10: Operations Portfolio – (IBRD/IDA and Grants)

74