interim report 1 2013 - klp/menu/standard... · interim report 1/2013 ... the investments in the...
TRANSCRIPT
for the days to come
Interim report 1/2013Report from the board of directors - Income statement & Balance sheet - Notes

Report from the Board of directors 3- Results 4- Key figures 4
Group accounts after the first quarter 2013- Income statement 8- Balance 9- Notes to the Group accounts 12
Non-financial accounts interim report 35
Accounts after the first quarter Kommunal Landspensjonskasse gjensidig forsikringsselskap- Income statement 36- Balance 37- Notes to the accounts 39
Contents
KLP – a customer-owned Group in developmentThe KLP Group is the leading provider of occupational pensions, group life and non-life insurance to the local government sec-tor and health enterprises, the second largest lender in the local government sector and the leading Norwegian provider of index-tracker funds products. The KLP Group's progress continues into 2013. At the end of the quarter the Group had total assets of NOK 341 billion and an op-erating profit of NOK 3923 million.
During 2012 KLP strengthened its position as the leading provider of public sector occupational pensions when 17 of the 18 local authorities that put their pension schemes out to tender selected the KLP Group as the provider from the start of 2013. This is reflected in the financial statements at the end of the first quarter and brings a positive transfer balance of NOK 5.8 billion (before final settlement).
Value-adjusted returns on our life customers' assets were good during the first quarter mainly because of good equities markets.
Kommunal Landspensjonskasse gjensidig forsikringsselskap (KLP)Pension schemes within the public sector are offered and managed by the Group's parent company Kommunal Landspensjonskasse (KLP). Of the Group's total assets of NOK 341 billion, NOK 310 billion rep-resents pension funds belonging to this customer group.
Result in the first quarter 2013
Returns resultOnce again in the first quarter of 2013, KLP achieved a good re-turns result (return in excess of guaranteed interest) of NOK 0.9
billion (NOK 1.2 billion). Financial income from customers' assets totalled NOK 6.1 billion (NOK 6.5 billion) for the quarter. Value-adjusted return on the common portfolio was 2.2 per cent for the quarter and book return was 1.1 per cent.
Risk resultThere were no unexpected risk matters of significance in the Com-pany's insurance portfolio during the first quarter. The risk result was NOK 91 million for the quarter. This has been provisionally allocated with NOK 74 million to customer profit and NOK 17 million to corporate income for provision in the risk equalization fund.
Administration resultThe Company's administration result shows a surplus of NOK 30 million (NOK 8 million) in the first quarter of 2013. Insurance-related operating costs represent 0.29 (0.33) per cent of customer funds. This reflects increased efficiency through lower cost growth than growth in business volume.
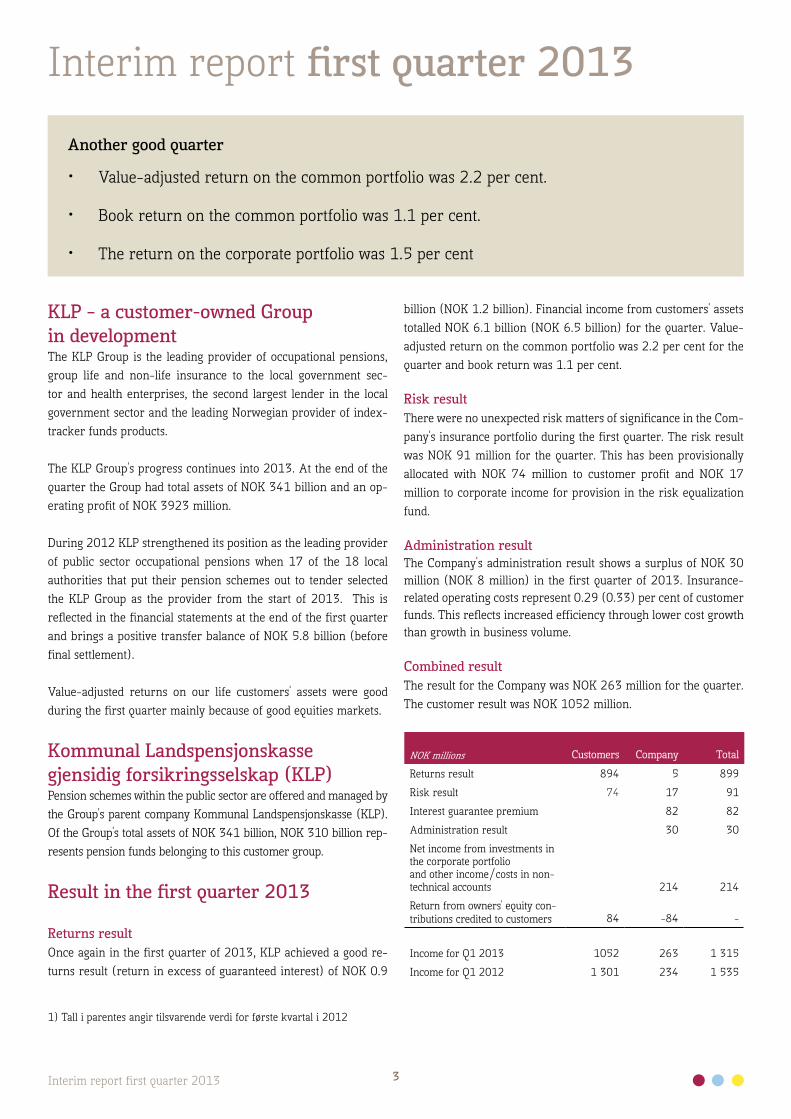
Combined resultThe result for the Company was NOK 263 million for the quarter. The customer result was NOK 1052 million.
NOK millions Customers Company Total
Returns result 894 5 899
Risk result 74 17 91
Interest guarantee premium 82 82
Administration result 30 30
Net income from investments in the corporate portfolioand other income/costs in non-technical accounts 214 214
Return from owners' equity con-tributions credited to customers 84 -84 -
Income for Q1 2013 1052 263 1 315
Income for Q1 2012 1 301 234 1 535
Another good quarter
• Value-adjustedreturnonthecommonportfoliowas2.2percent.
• Bookreturnonthecommonportfoliowas1.1percent.
• Thereturnonthecorporateportfoliowas1.5percent
1) Tall i parentes angir tilsvarende verdi for første kvartal i 2012
3Interim report first quarter 2013
Interim report first quarter 2013
4Interim report first quarter 2013
Increases in reserves for longevity On 8 March the Financial Supervisory Authority of Norway (the FSA) promulgated a new tariff for premiums and reserve provi-sions, K2013, as a result of the longevity trend. The new tar-iff comes into effect on 1 January 2014, but the life insurance industry is being given a further five years to implement fully the increase in reserves resulting from the new tariff. Two ma-jor KLP schemes already have longevity reserves in accordance with the tariff: for other schemes the need to increase reserves in regard to the longevity adjustment in the pension obligations amounts to NOK 10.7 billion. The FSA has declared that a mini-mum of 20 per cent of the increased reserve requirement ought to be covered by the company. Of the total requirement of NOK 10.7 billion, NOK 4.5 billion had been financed as at 31 Decem-ber 2012. KLP will enter into a dialogue with the FSA on how the remaining increase in reserves is to be implemented. The stated period for increasing reserves gives the Company good room to manoeuvre to finalize the increasing reserves based on the cur-rent buffer situation and the Company's returns expectations.
Following discussions with the authorities, KLP will assess how quickly increases to reserves should be carried out. Provisional allocation in the financial statements is based on the FSA's agree-ment to transferring a sum corresponding to 0.3 per cent of the customers' premium reserve in all pension schemes to the cus-tomers' premium fund and calling in a corresponding sum as own-ers' equity contribution in 2014. The remaining returns surplus and half of the risk surplus in the two fully reserved schemes is being returned to the customers' premium fund. Returns surplus and risk surplus other than this is being used to increase longevity reserves. The sum that has been provisioned for increased re-serves based on the Q1 results amounts to NOK 348 millions. This interim provision is provisional and not binding on the Company.
Financial strength and capital-related mattersTotal assets show growth during the quarter of NOK 10.6 billion and amount to NOK 310.1 billion. The growth is the result of growth in the insurance obligations on public sector occupational pensions. The capital adequacy ratio in KLP at the end of the quarter was 10.6 per cent (11.0) and core capital adequacy was 8.7 per cent (8.8). This reflects in part a conscious reallocation from govern-ment loans to credit bonds with high creditworthiness which, according to the regulations, have higher capital weighting.
The securities adjustment fund was strengthened by NOK 3.3 billion to NOK 12.6 million during the quarter and is a solid buf-fer against fluctuations in the financial markets. Supplementary reserves total NOK 12.4 billion.
At the end of the quarter KLP had total solvency capital of NOK 48.4 billion, corresponding to 18.4 per cent of the insurance funds with interest guarantee.
The Board of Directors considers the Company's solvency sat-isfactory in relation to the composition of the financial position and prevailing market conditions, both under the current and the notified future requirements of the authorities.
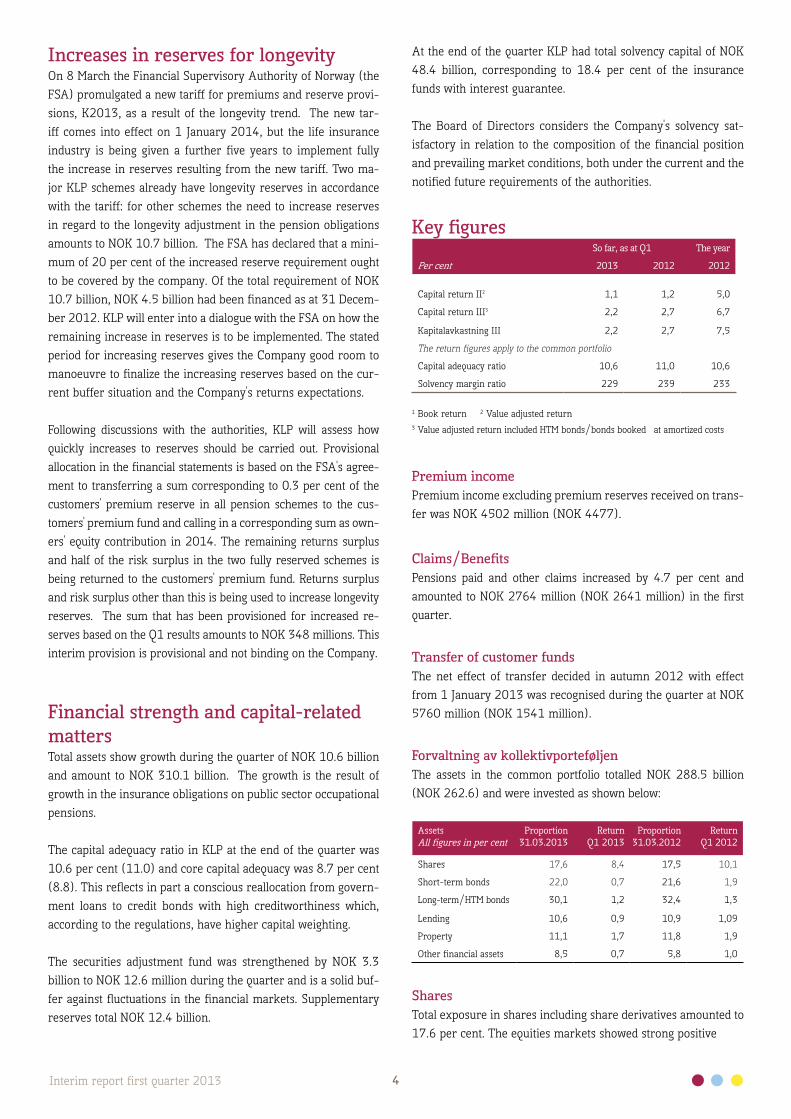
Key figuresSo far, as at Q1 The year
Per cent 2013 2012 2012Capital return I¹
Capital return II² 1,1 1,2 5,0
Capital return III³ 2,2 2,7 6,7
Kapitalavkastning III 2,2 2,7 7,5
The return figures apply to the common portfolio
Capital adequacy ratio 10,6 11,0 10,6
Solvency margin ratio 229 239 233
1 Book return 2 Value adjusted return3 Value adjusted return included HTM bonds/bonds booked at amortized costs
Premium incomePremium income excluding premium reserves received on trans-fer was NOK 4502 million (NOK 4477).
Claims/BenefitsPensions paid and other claims increased by 4.7 per cent and amounted to NOK 2764 million (NOK 2641 million) in the first quarter.
Transfer of customer fundsThe net effect of transfer decided in autumn 2012 with effect from 1 January 2013 was recognised during the quarter at NOK 5760 million (NOK 1541 million).
Forvaltning av kollektivporteføljenThe assets in the common portfolio totalled NOK 288.5 billion (NOK 262.6) and were invested as shown below:
AssetsAll figures in per cent
Proportion31.03.2013
ReturnQ1 2013
Proportion 31.03.2012
ReturnQ1 2012
Shares 17,6 8,4 17,5 10,1
Short-term bonds 22,0 0,7 21,6 1,9
Long-term/HTM bonds 30,1 1,2 32,4 1,3
Lending 10,6 0,9 10,9 1,09
Property 11,1 1,7 11,8 1,9
Other financial assets 8,5 0,7 5,8 1,0
SharesTotal exposure in shares including share derivatives amounted to 17.6 per cent. The equities markets showed strong positive
5Interim report first quarter 2013
development during the quarter, partly in the light of signs of dawning economic growth in important markets such as the USA. KLP's global index (currency-hedged) rose 9.8 per cent whilst Oslo Børs (the Oslo Stock Exchange) was up 6.1 per cent.
Short-term bondsShort-term bonds and money market instruments amounted to 22.0 per cent of the assets in the common portfolio. The inter-national credit bonds index KLP uses had a currency-hedged return of 0.7 per cent during the first quarter of 2013. The index for international government bonds had a more modest development at 0.5 per cent.
Bonds held to maturityInvestments in bonds held to maturity represented 30.1 per cent of the common portfolio. Additional value not brought to book amounted to NOK 5216 million. The portfolio is well di-versified and comprises securities issued by highly creditworthy institutions. No write-downs have been carried out as a result of credit losses during 2013.
PropertyProperty investments represented 11.1 per cent of the com-mon portfolio. KLP conducts a thorough valuation of its property holdings each quarter. The first quarter 2013 review shows sta-bility in pricing of central properties with long, secure contracts. The property values in the common portfolio have been value adjusted by NOK 345 million. The operating return in the com-mon portfolio was 1.7 per cent.
LendingLending in the common portfolio was NOK 30.4 billion. This was divided between NOK 21.6 billion in lending to local au-thorities and other organisations, and NOK 8.8 billion in hous-ing mortgages. The lending portfolio is characterized by high quality, with no losses on local government loans and very mod-est loss provisions on housing loans. Added value not brought to book in the lending portfolio (fixed interest rate loans) repre-sented NOK 417 million as at 31 March 2013.
Return on the corporate portfolioThe corporate portfolio covers investment of owners' equity and subordinated loan capital.
The corporate portfolio is managed with a long-term invest-ment horizon aiming at stable returns and growth in the owners' equity. The investments in the corporate portfolio achieved a return of 1.5 per cent during the first quarter.
Regulatory framework, product and market conditionsFinal implementation of the Solvency II regulations appears provisionally to be postponed until 2017. KLP is continuing its work to prepare for the transition, with inter alia emphasis on
the Own Risk and Solvency Assessment (ORSA) process.
As reported elsewhere a new tariff, K2013, has been introduced resulting in a substantial requirement to increase reserves for the industry. The longevity adjustment of National Insurance benefits, which has also been made applicable for public sector occupational pensions, helps to ameliorate the increased reserves requirement in public sector schemes.
Again in 2013 it is expected that a large number of local authori-ties will put out their pension schemes to competitive tendering. The competitive situation may to some extent be affected by the continuing strengthening of longevity reserves and the parameters for this, where not all the factors have been fully clarified. A major pension fund is being established for the hospitals in the Oslo region for which KLP has made a bid to supply a range of services. One company has withdrawn from the market for insur-ance schemes for public sector occupational pension, but is still a provider of pension fund services in this area. There are also several other providers of all or parts of the service spectrum for pension funds with public sector occupational pensions..
The business areas of the subsidiaries
Private occupational pensionsThe Group's private occupational pension effort is through its sub-sidiary KLP Bedriftspensjon AS.
There is high market activity in KLP Bedriftspensjon and this is providing satisfactory volume growth. The company has NOK 1.5 billion in total assets at the end of the first quarter.
94 new customers took out pension agreements with KLP Bedrifts-pensjon in the first quarter. KLP Bedriftspensjon achieved good management results on its cus-tomer funds, with a book return in the common portfolio of 1.2 per cent and a value-adjusted return of 1.8 per cent in the first quarter. The defined contribution pension customers achieved a return of 4.6 per cent for the quarter.
Profit for the pension customers for the first quarter amounted to NOK 4.4 million.
The administration result continues to be marked by low business volume in relation to the level of investment in systems and other costs. Including the negative administration result of NOK 8.7 mil-lion the company's comprehensive income for the first quarter was NOK 6.1 million.
Capital expansion of NOK 25 million was started during the first quarter and will be incorporated into Tier 1 and Tier 2 capital to increase the capital adequacy ratio from the middle of April.
6Interim report first quarter 2013
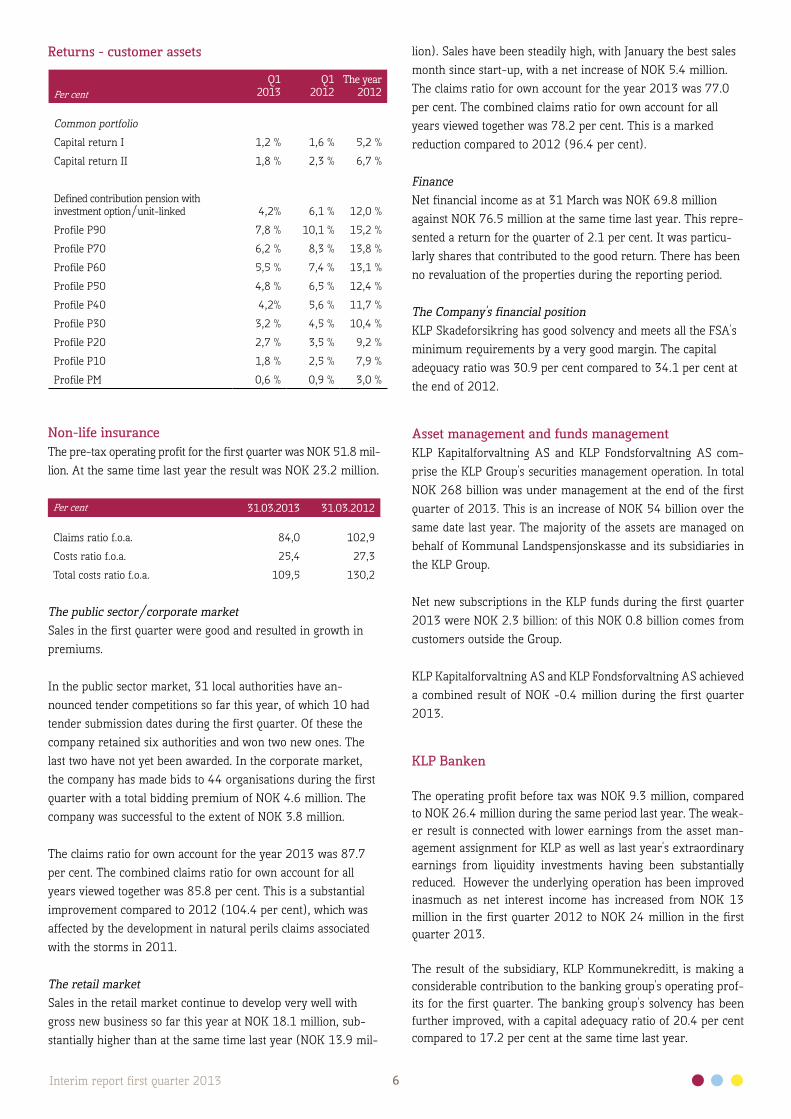
Returns - customer assets
Per cent Q1
2013 Q1
2012 The year
2012
Common portfolio
Capital return I 1,2 % 1,6 % 5,2 %
Capital return II 1,8 % 2,3 % 6,7 %
Defined contribution pension with investment option/unit-linked 4,2% 6,1 % 12,0 %
Profile P90 7,8 % 10,1 % 15,2 %
Profile P70 6,2 % 8,3 % 13,8 %
Profile P60 5,5 % 7,4 % 13,1 %
Profile P50 4,8 % 6,5 % 12,4 %
Profile P40 4,2% 5,6 % 11,7 %
Profile P30 3,2 % 4,5 % 10,4 %
Profile P20 2,7 % 3,5 % 9,2 %
Profile P10 1,8 % 2,5 % 7,9 %
Profile PM 0,6 % 0,9 % 3,0 %
Non-life insuranceThe pre-tax operating profit for the first quarter was NOK 51.8 mil-lion. At the same time last year the result was NOK 23.2 million.
Per cent 31.03.2013 31.03.2012
Claims ratio f.o.a. 84,0 102,9
Costs ratio f.o.a. 25,4 27,3
Total costs ratio f.o.a. 109,5 130,2
The public sector/corporate marketSales in the first quarter were good and resulted in growth in premiums.
In the public sector market, 31 local authorities have an-nounced tender competitions so far this year, of which 10 had tender submission dates during the first quarter. Of these the company retained six authorities and won two new ones. The last two have not yet been awarded. In the corporate market, the company has made bids to 44 organisations during the first quarter with a total bidding premium of NOK 4.6 million. The company was successful to the extent of NOK 3.8 million.
The claims ratio for own account for the year 2013 was 87.7 per cent. The combined claims ratio for own account for all years viewed together was 85.8 per cent. This is a substantial improvement compared to 2012 (104.4 per cent), which was affected by the development in natural perils claims associated with the storms in 2011.
The retail marketSales in the retail market continue to develop very well with gross new business so far this year at NOK 18.1 million, sub-stantially higher than at the same time last year (NOK 13.9 mil-
lion). Sales have been steadily high, with January the best sales month since start-up, with a net increase of NOK 5.4 million. The claims ratio for own account for the year 2013 was 77.0 per cent. The combined claims ratio for own account for all years viewed together was 78.2 per cent. This is a marked reduction compared to 2012 (96.4 per cent).
FinanceNet financial income as at 31 March was NOK 69.8 million against NOK 76.5 million at the same time last year. This repre-sented a return for the quarter of 2.1 per cent. It was particu-larly shares that contributed to the good return. There has been no revaluation of the properties during the reporting period.
The Company's financial positionKLP Skadeforsikring has good solvency and meets all the FSA's minimum requirements by a very good margin. The capital adequacy ratio was 30.9 per cent compared to 34.1 per cent at the end of 2012.
Asset management and funds managementKLP Kapitalforvaltning AS and KLP Fondsforvaltning AS com-prise the KLP Group's securities management operation. In total NOK 268 billion was under management at the end of the first quarter of 2013. This is an increase of NOK 54 billion over the same date last year. The majority of the assets are managed on behalf of Kommunal Landspensjonskasse and its subsidiaries in the KLP Group. Net new subscriptions in the KLP funds during the first quarter 2013 were NOK 2.3 billion: of this NOK 0.8 billion comes from customers outside the Group.
KLP Kapitalforvaltning AS and KLP Fondsforvaltning AS achieved a combined result of NOK -0.4 million during the first quarter 2013.
KLP Banken
The operating profit before tax was NOK 9.3 million, compared to NOK 26.4 million during the same period last year. The weak-er result is connected with lower earnings from the asset man-agement assignment for KLP as well as last year's extraordinary earnings from liquidity investments having been substantially reduced. However the underlying operation has been improved inasmuch as net interest income has increased from NOK 13 million in the first quarter 2012 to NOK 24 million in the first quarter 2013.
The result of the subsidiary, KLP Kommunekreditt, is making a considerable contribution to the banking group's operating prof-its for the first quarter. The banking group's solvency has been further improved, with a capital adequacy ratio of 20.4 per cent compared to 17.2 per cent at the same time last year.
7Interim report first quarter 2013
Oslo, 7 May 2012The Board of Directors of Kommunal Landspensjonskasse gjensidig forsikringsselskap
Arne Øren Liv Kari Eskeland Herlof NilssenChair Deputy Chair
Jan Helge Gulbrandsen Marit Torgersen Anita Krohn Traaseth
Susanne Torp-Hansen Freddy Larsen Elected by and from the employees Elected by and from the employees
The business of the KLP Banken Group is divided into the retail market and the public sector market.
In the retail market the housing mortgage growth on the bank's balance sheet has been NOK 353 million (24 per cent) since the end of last year. Housing loans from the bank have increased to NOK 1.9 billion. In addition housing loans of NOK 8.8 billion are managed for KLP. Deposits growth in the same period was NOK 513 million divided between NOK 373 million from retail customers and NOK 140 million in corporate deposits. Deposits total NOK 3.5 billion, and the whole of the Bank's lending port-folio is financed by deposits.
During the first quarter the mobile bank was launched. There were almost 1000 downloads of the bank's mobile app in the first two weeks. An external 24/7 support service has also been established offering technical assistance to its customers.
The public sector as a whole had about the same volume of loans at the end of the first quarter as at the end of last year, about NOK 42 billion divided between NOK 20 billion for own account and NOK 22 billion in managed loans.
After the end of the quarter a settlement has been reached with Eksportfinans in two lawsuits subsequent to the acquisition of Kommunekreditt Norge in 2009. The settlement means that KLP Banken will take to book an income of NOK 50 million in the second quarter.
Corporate social responsibilityThe KLP Group sets requirements for its suppliers in regard to quality, the environment and ethics. KLP is to be a responsible purchaser and safeguard considerations of human rights, labour rights, the environment and ethical business principles in accor-dance with KLP's espousal of the UN Global Compact.
Exclusion from KLP's investments will normally have conse-quences for the same companies as suppliers of goods and ser-vices to the Group.
Attention is also drawn to the non-financial accounts that are a part of this report.
A responsible investor and ownerKLP and the KLP funds are active owners and consider it impor-tant to use their voting rights at general meetings.
Future prospectsKey figures after the first quarter are good. With a normal posi-tive development over the rest of the year the Company will be very strongly positioned in regard to the remaining need to in-crease reserves.
In the longer term, continued low interest rates will be challeng-ing in regard to securing good and high returns that limit our customers' costs. Good solvency and a large portfolio of bonds held to maturity, with a current return substantially above the guaranteed base interest rate, are however a good basis for con-tinuing to achieve good results in the future.
KLP works continuously on preparing for transition to the new solvency rules for insurance under Solvency II, for example by updating our in-house assessment (ORSA) of KLP's risk- bearing ability in the course of the year.
KLP is a customer-owned company. Work on continuous devel-opment of the Company's products and services for the good of its owners and customers therefore remains crucial. KLP will continue in the future to work for low costs, good returns and customer-friendly service in order to contribute to competitive value creation.

8Interim report first quarter 2013
Group accounts after Q1 2013
NotesIncome statement GroupNOK millions Q1 2013 Q1 2012
01.01.2012-31.12.2012
4 Premium income for own account 10 697 6 370 29 946Current return on financial assets 2 483 2 287 9 144Net interest income banking 24 43 166Net value changes on financial instruments 3 217 3 664 5 956
5 Net income from investment properties 529 733 2 2066 Other income 196 165 663
Total net income 17 145 13 262 48 081
Claims for own account -3 091 -2 960 -11 457Change in technical reserves -9 558 -4 810 -27 344
7 Net costs subordinated loan and hybrid Tier 1 securities -104 245 2348 Operating expenses -307 -294 -8619 Other expenses -162 -162 -651
Total expenses -13 222 -7 981 -40 079
Operating profit/loss 3 923 5 281 8 002
To/from securities adjustment fund – life insurance -3 286 -3 623 -4 342To supplementary reserves – life insurance 0 0 0Assets allocated to insurance customers - life insurance -668 -1 305 -2 370Pre-tax income -31 353 1 290
Cost of taxes 0 -4 -7Income -31 349 1 283
Items will not be reclassified subsequently to profit or lossCurrency translation foreign subsidiaries 33 -22 -47Items will be reclassified subsequently to profit or loss when specific conditions are metRevaluation real property for use in own operation 8 12 23Currency translation foreign subsidiaries 255 -97 -161Total other comprehensive income 295 -107 -185
Total comprehensive income 264 242 1 098
9Interim report first quarter 2013
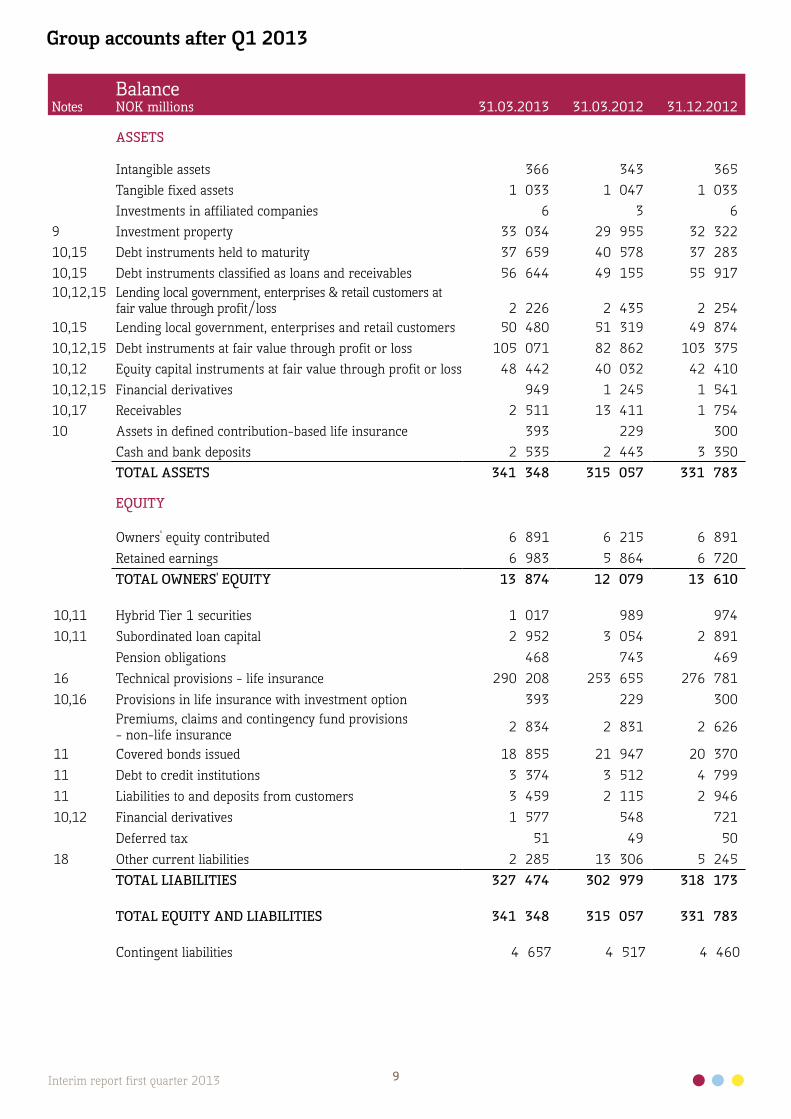
NotesBalanceNOK millions 31.03.2013 31.03.2012 31.12.2012
ASSETS
Intangible assets 366 343 365Tangible fixed assets 1 033 1 047 1 033Investments in affiliated companies 6 3 6
9 Investment property 33 034 29 955 32 32210,15 Debt instruments held to maturity 37 659 40 578 37 28310,15 Debt instruments classified as loans and receivables 56 644 49 155 55 91710,12,15 Lending local government, enterprises & retail customers at
fair value through profit/loss 2 226 2 435 2 25410,15 Lending local government, enterprises and retail customers 50 480 51 319 49 87410,12,15 Debt instruments at fair value through profit or loss 105 071 82 862 103 37510,12 Equity capital instruments at fair value through profit or loss 48 442 40 032 42 41010,12,15 Financial derivatives 949 1 245 1 54110,17 Receivables 2 511 13 411 1 75410 Assets in defined contribution-based life insurance 393 229 300
Cash and bank deposits 2 535 2 443 3 350TOTAL ASSETS 341 348 315 057 331 783
EQUITY
Owners' equity contributed 6 891 6 215 6 891Retained earnings 6 983 5 864 6 720TOTAL OWNERS' EQUITY 13 874 12 079 13 610
10,11 Hybrid Tier 1 securities 1 017 989 97410,11 Subordinated loan capital 2 952 3 054 2 891
Pension obligations 468 743 46916 Technical provisions - life insurance 290 208 253 655 276 78110,16 Provisions in life insurance with investment option 393 229 300
Premiums, claims and contingency fund provisions - non-life insurance 2 834 2 831 2 626
11 Covered bonds issued 18 855 21 947 20 37011 Debt to credit institutions 3 374 3 512 4 79911 Liabilities to and deposits from customers 3 459 2 115 2 94610,12 Financial derivatives 1 577 548 721
Deferred tax 51 49 5018 Other current liabilities 2 285 13 306 5 245
TOTAL LIABILITIES 327 474 302 979 318 173
TOTAL EQUITY AND LIABILITIES 341 348 315 057 331 783
Contingent liabilities 4 657 4 517 4 460
Group accounts after Q1 2013
10Interim report first quarter 2013
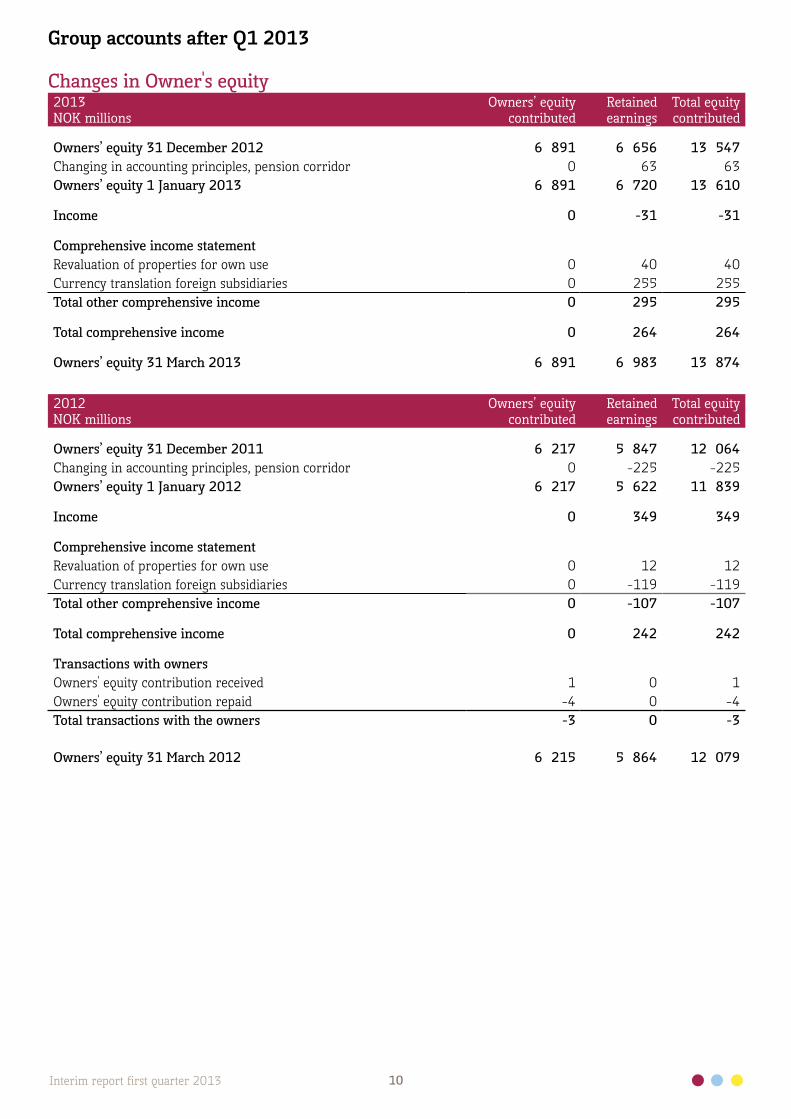
Changes in Owner's equity2013NOK millions
Owners’ equitycontributed
Retainedearnings
Total equitycontributed
Owners’ equity 31 December 2012 6 891 6 656 13 547Changing in accounting principles, pension corridor 0 63 63Owners’ equity 1 January 2013 6 891 6 720 13 610
Income 0 -31 -31
Comprehensive income statementRevaluation of properties for own use 0 40 40Currency translation foreign subsidiaries 0 255 255Total other comprehensive income 0 295 295
Total comprehensive income 0 264 264
Owners’ equity 31 March 2013 6 891 6 983 13 874
2012NOK millions
Owners’ equitycontributed
Retainedearnings
Total equitycontributed
Owners’ equity 31 December 2011 6 217 5 847 12 064Changing in accounting principles, pension corridor 0 -225 -225Owners’ equity 1 January 2012 6 217 5 622 11 839
Income 0 349 349
Comprehensive income statementRevaluation of properties for own use 0 12 12Currency translation foreign subsidiaries 0 -119 -119Total other comprehensive income 0 -107 -107
Total comprehensive income 0 242 242
Transactions with ownersOwners' equity contribution received 1 0 1Owners' equity contribution repaid -4 0 -4Total transactions with the owners -3 0 -3
Owners’ equity 31 March 2012 6 215 5 864 12 079
Group accounts after Q1 2013
11Interim report first quarter 2013
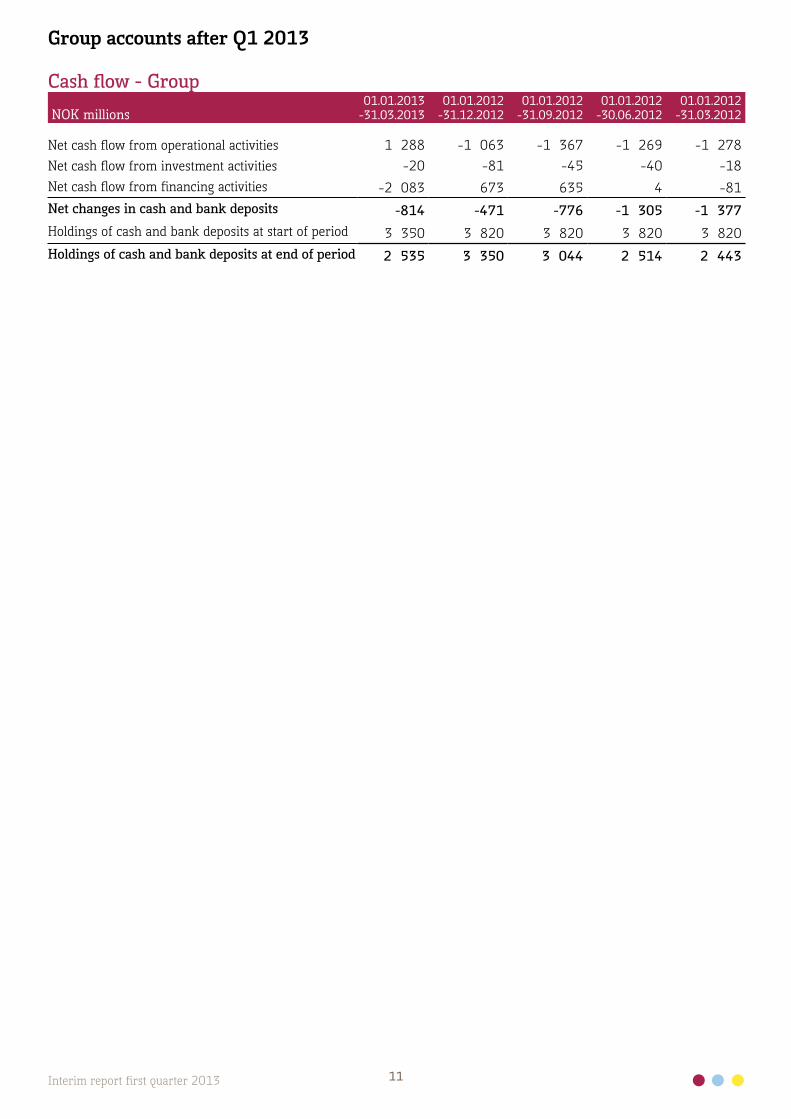
NOK millions01.01.2013
-31.03.2013 01.01.2012-31.12.2012
01.01.2012-31.09.2012
01.01.2012-30.06.2012
01.01.2012-31.03.2012
Net cash flow from operational activities 1 288 -1 063 -1 367 -1 269 -1 278Net cash flow from investment activities -20 -81 -45 -40 -18Net cash flow from financing activities -2 083 673 635 4 -81Net changes in cash and bank deposits -814 -471 -776 -1 305 -1 377Holdings of cash and bank deposits at start of period 3 350 3 820 3 820 3 820 3 820 Holdings of cash and bank deposits at end of period 2 535 3 350 3 044 2 514 2 443
Group accounts after Q1 2013
Cash flow - Group
12Interim report first quarter 2013
Notes to the Group accounts after the first quarter 2013
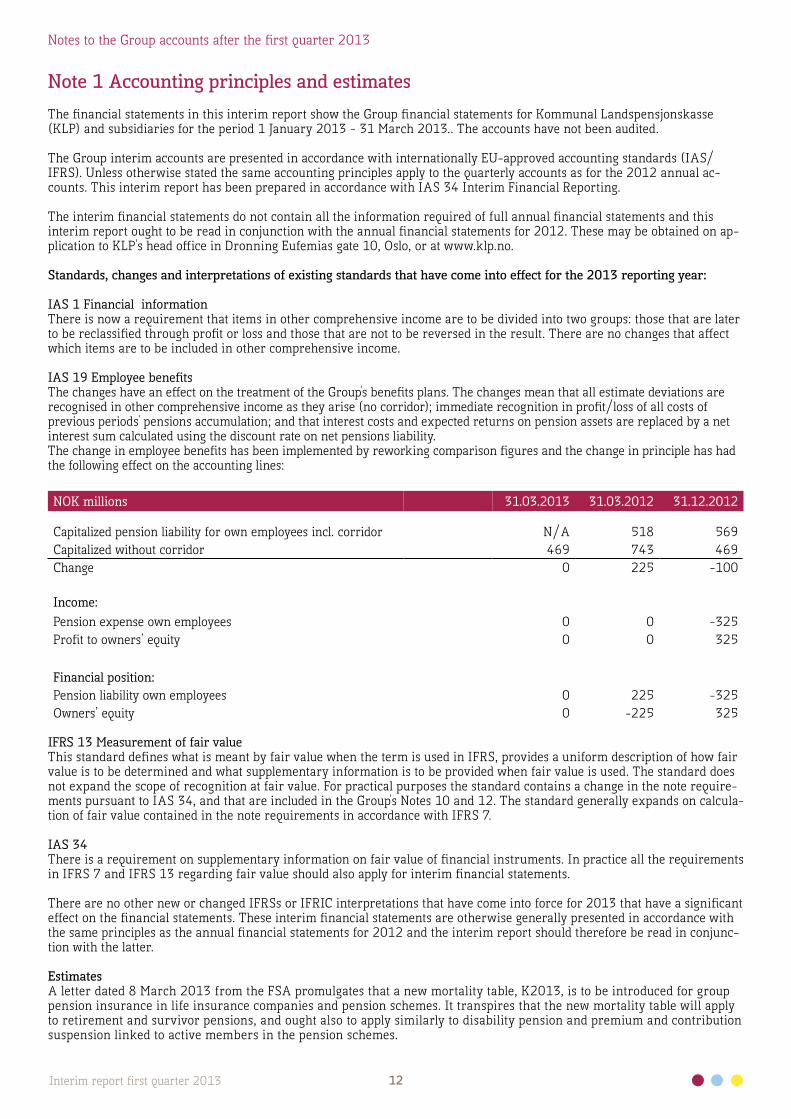
Note 1 Accounting principles and estimatesThe financial statements in this interim report show the Group financial statements for Kommunal Landspensjonskasse (KLP) and subsidiaries for the period 1 January 2013 - 31 March 2013.. The accounts have not been audited.
The Group interim accounts are presented in accordance with internationally EU-approved accounting standards (IAS/IFRS). Unless otherwise stated the same accounting principles apply to the quarterly accounts as for the 2012 annual ac-counts. This interim report has been prepared in accordance with IAS 34 Interim Financial Reporting.
The interim financial statements do not contain all the information required of full annual financial statements and this interim report ought to be read in conjunction with the annual financial statements for 2012. These may be obtained on ap-plication to KLP's head office in Dronning Eufemias gate 10, Oslo, or at www.klp.no.
Standards, changes and interpretations of existing standards that have come into effect for the 2013 reporting year:
IAS 1 Financial informationThere is now a requirement that items in other comprehensive income are to be divided into two groups: those that are later to be reclassified through profit or loss and those that are not to be reversed in the result. There are no changes that affect which items are to be included in other comprehensive income.
IAS 19 Employee benefitsThe changes have an effect on the treatment of the Group's benefits plans. The changes mean that all estimate deviations are recognised in other comprehensive income as they arise (no corridor); immediate recognition in profit/loss of all costs of previous periods' pensions accumulation; and that interest costs and expected returns on pension assets are replaced by a net interest sum calculated using the discount rate on net pensions liability. The change in employee benefits has been implemented by reworking comparison figures and the change in principle has had the following effect on the accounting lines:
NOK millions 31.03.2013 31.03.2012 31.12.2012
Capitalized pension liability for own employees incl. corridor N/A 518 569Capitalized without corridor 469 743 469Change 0 225 -100
Income:Pension expense own employees 0 0 -325Profit to owners’ equity 0 0 325
Financial position:Pension liability own employees 0 225 -325Owners’ equity 0 -225 325
IFRS 13 Measurement of fair valueThis standard defines what is meant by fair value when the term is used in IFRS, provides a uniform description of how fair value is to be determined and what supplementary information is to be provided when fair value is used. The standard does not expand the scope of recognition at fair value. For practical purposes the standard contains a change in the note require-ments pursuant to IAS 34, and that are included in the Group's Notes 10 and 12. The standard generally expands on calcula-tion of fair value contained in the note requirements in accordance with IFRS 7.
IAS 34There is a requirement on supplementary information on fair value of financial instruments. In practice all the requirements in IFRS 7 and IFRS 13 regarding fair value should also apply for interim financial statements.
There are no other new or changed IFRSs or IFRIC interpretations that have come into force for 2013 that have a significant effect on the financial statements. These interim financial statements are otherwise generally presented in accordance with the same principles as the annual financial statements for 2012 and the interim report should therefore be read in conjunc-tion with the latter.
EstimatesA letter dated 8 March 2013 from the FSA promulgates that a new mortality table, K2013, is to be introduced for group pension insurance in life insurance companies and pension schemes. It transpires that the new mortality table will apply to retirement and survivor pensions, and ought also to apply similarly to disability pension and premium and contribution suspension linked to active members in the pension schemes.
13Interim report first quarter 2013
Notes to the Group accounts after the first quarter 2013
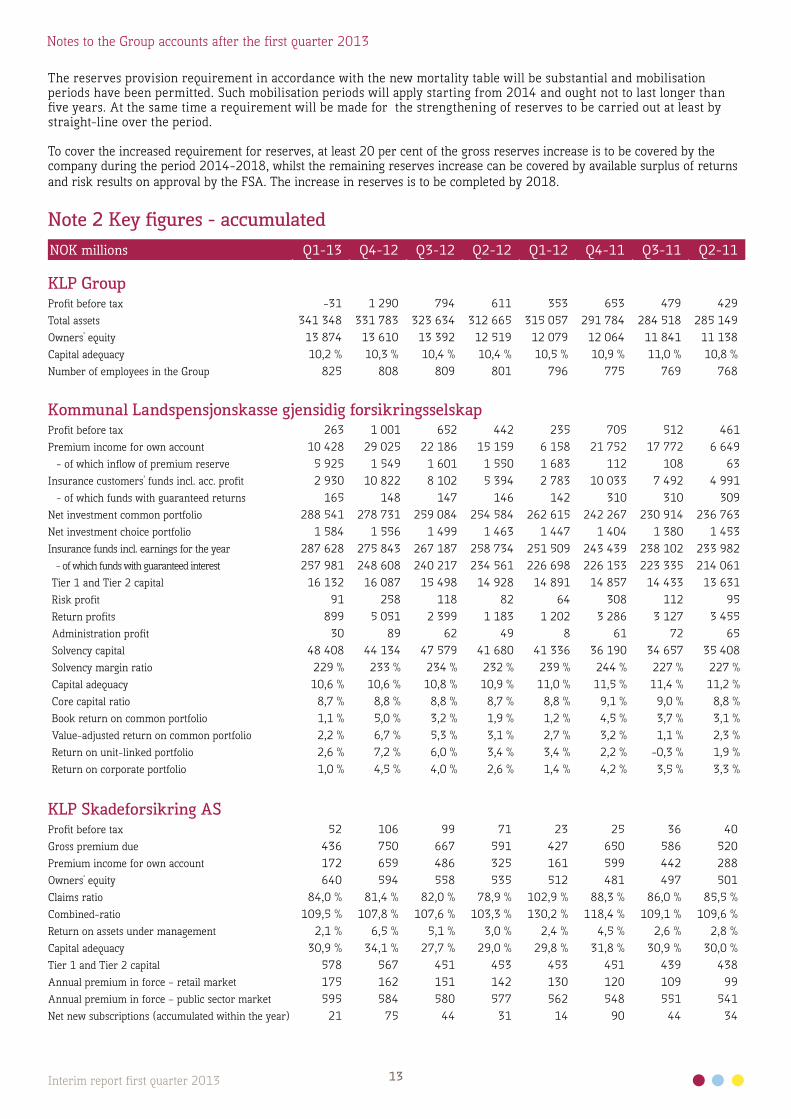
The reserves provision requirement in accordance with the new mortality table will be substantial and mobilisation periods have been permitted. Such mobilisation periods will apply starting from 2014 and ought not to last longer than five years. At the same time a requirement will be made for the strengthening of reserves to be carried out at least by straight-line over the period.
To cover the increased requirement for reserves, at least 20 per cent of the gross reserves increase is to be covered by the company during the period 2014-2018, whilst the remaining reserves increase can be covered by available surplus of returns and risk results on approval by the FSA. The increase in reserves is to be completed by 2018.
Note 2 Key figures - accumulatedNOK millions Q1-13 Q4-12 Q3-12 Q2-12 Q1-12 Q4-11 Q3-11 Q2-11
KLP GroupProfit before tax -31 1 290 794 611 353 653 479 429 Total assets 341 348 331 783 323 634 312 665 315 057 291 784 284 518 285 149 Owners' equity 13 874 13 610 13 392 12 519 12 079 12 064 11 841 11 138 Capital adequacy 10,2 % 10,3 % 10,4 % 10,4 % 10,5 % 10,9 % 11,0 % 10,8 %Number of employees in the Group 825 808 809 801 796 775 769 768
Kommunal Landspensjonskasse gjensidig forsikringsselskapProfit before tax 263 1 001 652 442 235 705 512 461 Premium income for own account 10 428 29 025 22 186 15 159 6 158 21 752 17 772 6 649 - of which inflow of premium reserve 5 925 1 549 1 601 1 550 1 683 112 108 63
Insurance customers' funds incl. acc. profit 2 930 10 822 8 102 5 394 2 783 10 033 7 492 4 991 - of which funds with guaranteed returns 165 148 147 146 142 310 310 309
Net investment common portfolio 288 541 278 731 259 084 254 584 262 615 242 267 230 914 236 763 Net investment choice portfolio 1 584 1 556 1 499 1 463 1 447 1 404 1 380 1 453 Insurance funds incl. earnings for the year 287 628 275 843 267 187 258 734 251 509 243 439 238 102 233 982 - of which funds with guaranteed interest 257 981 248 608 240 217 234 561 226 698 226 153 223 335 214 061 Tier 1 and Tier 2 capital 16 132 16 087 15 498 14 928 14 891 14 857 14 433 13 631 Risk profit 91 258 118 82 64 308 112 95 Return profits 899 5 051 2 399 1 183 1 202 3 286 3 127 3 455 Administration profit 30 89 62 49 8 61 72 65 Solvency capital 48 408 44 134 47 579 41 680 41 336 36 190 34 657 35 408 Solvency margin ratio 229 % 233 % 234 % 232 % 239 % 244 % 227 % 227 %Capital adequacy 10,6 % 10,6 % 10,8 % 10,9 % 11,0 % 11,5 % 11,4 % 11,2 %Core capital ratio 8,7 % 8,8 % 8,8 % 8,7 % 8,8 % 9,1 % 9,0 % 8,8 %Book return on common portfolio 1,1 % 5,0 % 3,2 % 1,9 % 1,2 % 4,5 % 3,7 % 3,1 %Value-adjusted return on common portfolio 2,2 % 6,7 % 5,3 % 3,1 % 2,7 % 3,2 % 1,1 % 2,3 %Return on unit-linked portfolio 2,6 % 7,2 % 6,0 % 3,4 % 3,4 % 2,2 % -0,3 % 1,9 %Return on corporate portfolio 1,0 % 4,5 % 4,0 % 2,6 % 1,4 % 4,2 % 3,5 % 3,3 %
KLP Skadeforsikring ASProfit before tax 52 106 99 71 23 25 36 40Gross premium due 436 750 667 591 427 650 586 520Premium income for own account 172 659 486 325 161 599 442 288Owners' equity 640 594 558 535 512 481 497 501Claims ratio 84,0 % 81,4 % 82,0 % 78,9 % 102,9 % 88,3 % 86,0 % 85,5 %Combined-ratio 109,5 % 107,8 % 107,6 % 103,3 % 130,2 % 118,4 % 109,1 % 109,6 %Return on assets under management 2,1 % 6,5 % 5,1 % 3,0 % 2,4 % 4,5 % 2,6 % 2,8 %Capital adequacy 30,9 % 34,1 % 27,7 % 29,0 % 29,8 % 31,8 % 30,9 % 30,0 %Tier 1 and Tier 2 capital 578 567 451 453 453 451 439 438Annual premium in force – retail market 175 162 151 142 130 120 109 99Annual premium in force – public sector market 595 584 580 577 562 548 551 541Net new subscriptions (accumulated within the year) 21 75 44 31 14 90 44 34
14Interim report first quarter 2013
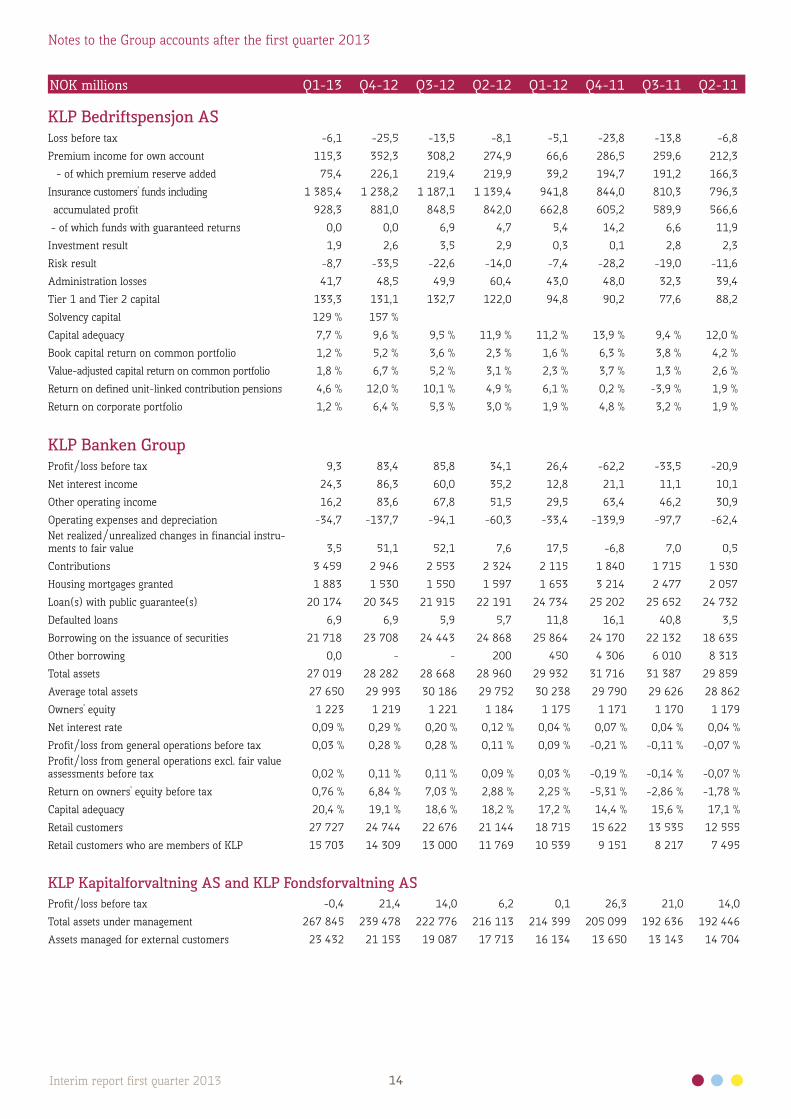
NOK millions Q1-13 Q4-12 Q3-12 Q2-12 Q1-12 Q4-11 Q3-11 Q2-11
KLP Bedriftspensjon ASLoss before tax -6,1 -25,5 -13,5 -8,1 -5,1 -23,8 -13,8 -6,8
Premium income for own account 115,3 352,3 308,2 274,9 66,6 286,5 259,6 212,3
- of which premium reserve added 75,4 226,1 219,4 219,9 39,2 194,7 191,2 166,3
Insurance customers' funds including 1 385,4 1 238,2 1 187,1 1 139,4 941,8 844,0 810,3 796,3
accumulated profit 928,3 881,0 848,5 842,0 662,8 605,2 589,9 566,6
- of which funds with guaranteed returns 0,0 0,0 6,9 4,7 5,4 14,2 6,6 11,9
Investment result 1,9 2,6 3,5 2,9 0,3 0,1 2,8 2,3
Risk result -8,7 -33,5 -22,6 -14,0 -7,4 -28,2 -19,0 -11,6
Administration losses 41,7 48,5 49,9 60,4 43,0 48,0 32,3 39,4
Tier 1 and Tier 2 capital 133,3 131,1 132,7 122,0 94,8 90,2 77,6 88,2
Solvency capital 129 % 157 %
Capital adequacy 7,7 % 9,6 % 9,5 % 11,9 % 11,2 % 13,9 % 9,4 % 12,0 %
Book capital return on common portfolio 1,2 % 5,2 % 3,6 % 2,3 % 1,6 % 6,3 % 3,8 % 4,2 %
Value-adjusted capital return on common portfolio 1,8 % 6,7 % 5,2 % 3,1 % 2,3 % 3,7 % 1,3 % 2,6 %
Return on defined unit-linked contribution pensions 4,6 % 12,0 % 10,1 % 4,9 % 6,1 % 0,2 % -3,9 % 1,9 %
Return on corporate portfolio 1,2 % 6,4 % 5,3 % 3,0 % 1,9 % 4,8 % 3,2 % 1,9 %
KLP Banken GroupProfit/loss before tax 9,3 83,4 85,8 34,1 26,4 -62,2 -33,5 -20,9
Net interest income 24,3 86,3 60,0 35,2 12,8 21,1 11,1 10,1
Other operating income 16,2 83,6 67,8 51,5 29,5 63,4 46,2 30,9
Operating expenses and depreciation -34,7 -137,7 -94,1 -60,3 -33,4 -139,9 -97,7 -62,4 Net realized/unrealized changes in financial instru-ments to fair value 3,5 51,1 52,1 7,6 17,5 -6,8 7,0 0,5
Contributions 3 459 2 946 2 553 2 324 2 115 1 840 1 715 1 530
Housing mortgages granted 1 883 1 530 1 550 1 597 1 653 3 214 2 477 2 057
Loan(s) with public guarantee(s) 20 174 20 345 21 915 22 191 24 734 25 202 25 652 24 732
Defaulted loans 6,9 6,9 5,9 5,7 11,8 16,1 40,8 3,5
Borrowing on the issuance of securities 21 718 23 708 24 443 24 868 25 864 24 170 22 132 18 635
Other borrowing 0,0 - - 200 450 4 306 6 010 8 313
Total assets 27 019 28 282 28 668 28 960 29 932 31 716 31 387 29 859
Average total assets 27 650 29 993 30 186 29 752 30 238 29 790 29 626 28 862
Owners' equity 1 223 1 219 1 221 1 184 1 175 1 171 1 170 1 179
Net interest rate 0,09 % 0,29 % 0,20 % 0,12 % 0,04 % 0,07 % 0,04 % 0,04 %
Profit/loss from general operations before tax 0,03 % 0,28 % 0,28 % 0,11 % 0,09 % -0,21 % -0,11 % -0,07 %Profit/loss from general operations excl. fair value assessments before tax 0,02 % 0,11 % 0,11 % 0,09 % 0,03 % -0,19 % -0,14 % -0,07 %
Return on owners' equity before tax 0,76 % 6,84 % 7,03 % 2,88 % 2,25 % -5,31 % -2,86 % -1,78 %
Capital adequacy 20,4 % 19,1 % 18,6 % 18,2 % 17,2 % 14,4 % 15,6 % 17,1 %
Retail customers 27 727 24 744 22 676 21 144 18 715 15 622 13 535 12 555
Retail customers who are members of KLP 15 703 14 309 13 000 11 769 10 539 9 151 8 217 7 495
KLP Kapitalforvaltning AS and KLP Fondsforvaltning ASProfit/loss before tax -0,4 21,4 14,0 6,2 0,1 26,3 21,0 14,0
Total assets under management 267 845 239 478 222 776 216 113 214 399 205 099 192 636 192 446
Assets managed for external customers 23 432 21 153 19 087 17 713 16 134 13 650 13 143 14 704
Notes to the Group accounts after the first quarter 2013
15Interim report first quarter 2013
Notes to the Group accounts after the first quarter 2013
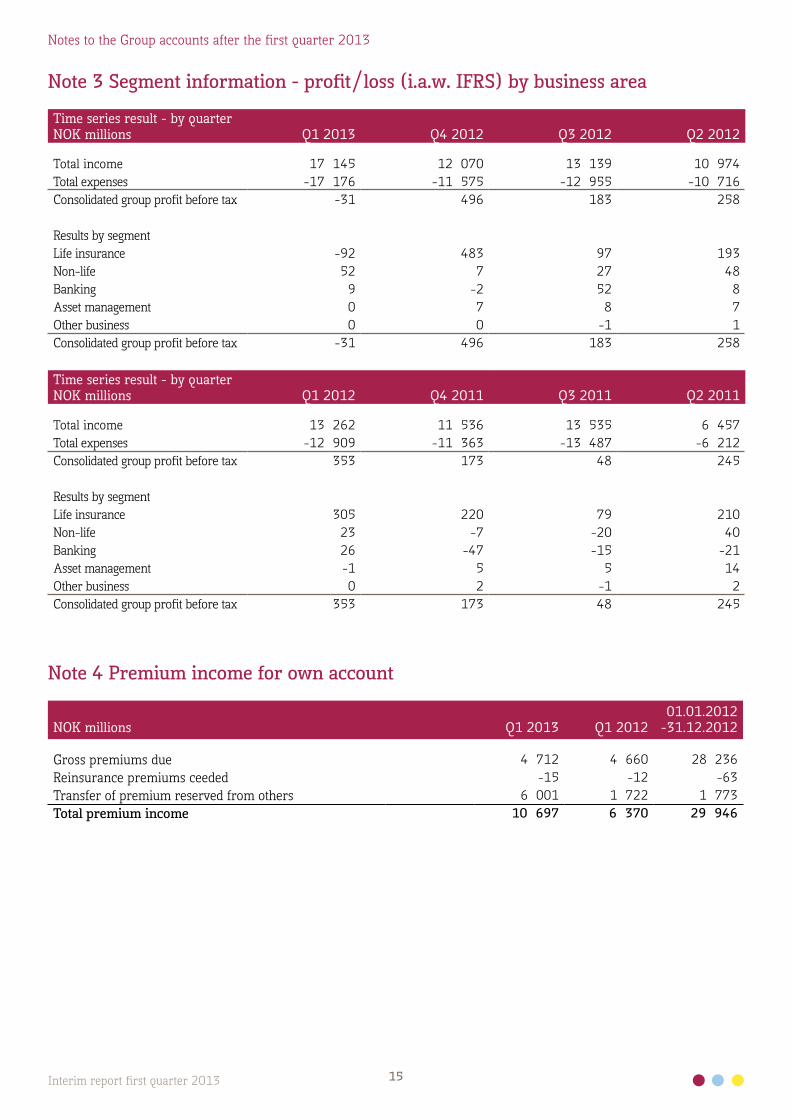
Note 3 Segment information - profit/loss (i.a.w. IFRS) by business area
Time series result - by quarterNOK millions Q1 2013 Q4 2012 Q3 2012 Q2 2012
Total income 17 145 12 070 13 139 10 974Total expenses -17 176 -11 575 -12 955 -10 716Consolidated group profit before tax -31 496 183 258
Results by segmentLife insurance -92 483 97 193Non-life 52 7 27 48Banking 9 -2 52 8Asset management 0 7 8 7Other business 0 0 -1 1Consolidated group profit before tax -31 496 183 258
Time series result - by quarterNOK millions Q1 2012 Q4 2011 Q3 2011 Q2 2011
Total income 13 262 11 536 13 535 6 457Total expenses -12 909 -11 363 -13 487 -6 212Consolidated group profit before tax 353 173 48 245
Results by segmentLife insurance 305 220 79 210Non-life 23 -7 -20 40Banking 26 -47 -15 -21Asset management -1 5 5 14Other business 0 2 -1 2Consolidated group profit before tax 353 173 48 245
Note 4 Premium income for own account
NOK millions Q1 2013 Q1 201201.01.2012
-31.12.2012
Gross premiums due 4 712 4 660 28 236Reinsurance premiums ceeded -15 -12 -63Transfer of premium reserved from others 6 001 1 722 1 773Total premium income 10 697 6 370 29 946
16Interim report first quarter 2013
Notes to the Group accounts after the first quarter 2013
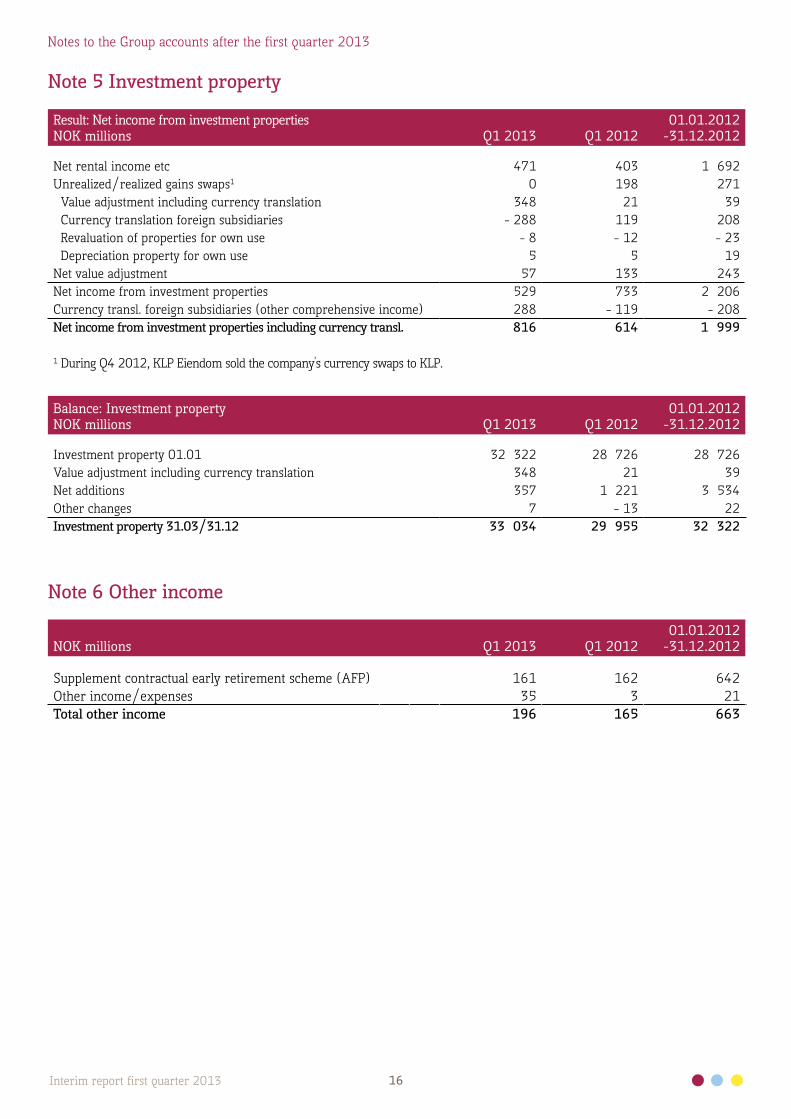
Note 6 Other income
NOK millions Q1 2013 Q1 201201.01.2012
-31.12.2012
Supplement contractual early retirement scheme (AFP) 161 162 642Other income/expenses 35 3 21Total other income 196 165 663
Note 5 Investment property
Result: Net income from investment propertiesNOK millions Q1 2013 Q1 2012
01.01.2012-31.12.2012
Net rental income etc 471 403 1 692Unrealized/realized gains swaps1 0 198 271 Value adjustment including currency translation 348 21 39 Currency translation foreign subsidiaries - 288 119 208 Revaluation of properties for own use - 8 - 12 - 23 Depreciation property for own use 5 5 19Net value adjustment 57 133 243Net income from investment properties 529 733 2 206Currency transl. foreign subsidiaries (other comprehensive income) 288 - 119 - 208Net income from investment properties including currency transl. 816 614 1 999
1 During Q4 2012, KLP Eiendom sold the company's currency swaps to KLP.
Balance: Investment propertyNOK millions Q1 2013 Q1 2012
01.01.2012-31.12.2012
Investment property 01.01 32 322 28 726 28 726Value adjustment including currency translation 348 21 39Net additions 357 1 221 3 534Other changes 7 - 13 22Investment property 31.03/31.12 33 034 29 955 32 322
17Interim report first quarter 2013
Notes to the Group accounts after the first quarter 2013
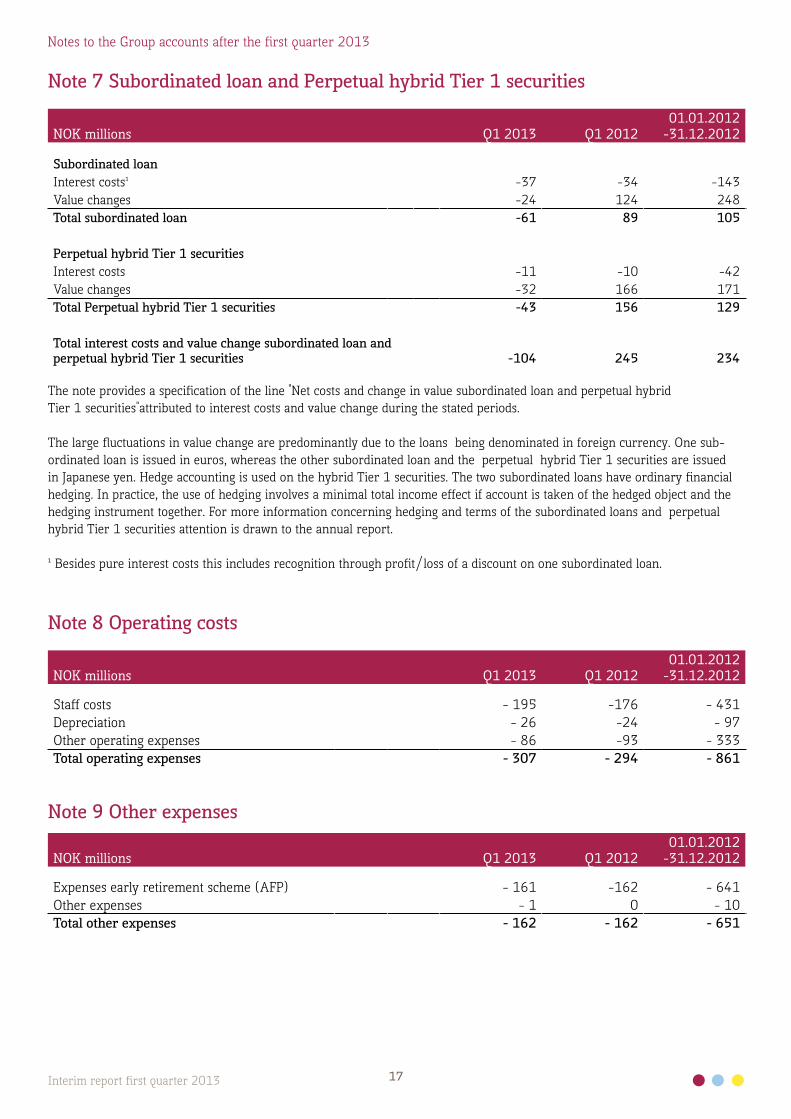
Note 7 Subordinated loan and Perpetual hybrid Tier 1 securities
NOK millions Q1 2013 Q1 201201.01.2012
-31.12.2012
Subordinated loan Interest costs¹ -37 -34 -143Value changes -24 124 248Total subordinated loan -61 89 105
Perpetual hybrid Tier 1 securitiesInterest costs -11 -10 -42Value changes -32 166 171Total Perpetual hybrid Tier 1 securities -43 156 129
Total interest costs and value change subordinated loan and perpetual hybrid Tier 1 securities -104 245 234
The note provides a specification of the line "Net costs and change in value subordinated loan and perpetual hybrid Tier 1 securities"attributed to interest costs and value change during the stated periods.
The large fluctuations in value change are predominantly due to the loans being denominated in foreign currency. One sub-ordinated loan is issued in euros, whereas the other subordinated loan and the perpetual hybrid Tier 1 securities are issued in Japanese yen. Hedge accounting is used on the hybrid Tier 1 securities. The two subordinated loans have ordinary financial hedging. In practice, the use of hedging involves a minimal total income effect if account is taken of the hedged object and the hedging instrument together. For more information concerning hedging and terms of the subordinated loans and perpetual hybrid Tier 1 securities attention is drawn to the annual report.
¹ Besides pure interest costs this includes recognition through profit/loss of a discount on one subordinated loan.
Note 8 Operating costs
NOK millions Q1 2013 Q1 201201.01.2012
-31.12.2012
Staff costs - 195 -176 - 431Depreciation - 26 -24 - 97Other operating expenses - 86 -93 - 333Total operating expenses - 307 - 294 - 861
Note 9 Other expenses
NOK millions Q1 2013 Q1 201201.01.2012
-31.12.2012
Expenses early retirement scheme (AFP) - 161 -162 - 641Other expenses - 1 0 - 10Total other expenses - 162 - 162 - 651
18Interim report first quarter 2013
Notes to the Group accounts after the first quarter 2013
Note 10 Fair value of financial assets and liabilitiesFair value of investments listed in an active market is based on the current purchase price. A financial instrument is considered to be listed in an active market if the listed price is simply and regularly available from a stock market, dealer, broker, industry group-ing, price setting service or regulatory authority, and these prices represent actual and regularly occurring transactions at arm’s length. If the market for the security is not active, or the security is not listed on a stock exchange or similar, the Group uses valu-ation techniques to set fair value. These are based for example on information on recently completed transactions carried out on business terms and conditions, reference to trading in similar instruments and pricing using externally collected interest rate curves and spread curves. As far as possible the estimates are based on externally observable market data and rarely on company-specific information. The different financial instruments are thus priced in the following way:
a) Shares (listed) Liquid shares are generally valued on the basis of prices provided by an index provider. At the same time prices are compared
between different sources to identify any errors. The following sources are used for shares: Oslo Børs (Oslo Stock Exchange) Morgan Stanley Capital International (MSCI) Reuters Oslo Børs has first priority, followed by MSCI and finally Reuters. b) Shares (unlisted) As far as possible the Group uses the industry recommendations of the Norwegian Mutual Fund Association (NMFA). Broadly
this means the following: The last traded price has the highest priority. If the last traded price lies outside this in the market, price is adjusted accordingly.
I.e. if the last traded price is below the offer price, price is adjusted up to the offer price. If it is above the bid price it is adjusted down to bid. If the price picture is considered outdated, the price is adjusted according to a market index. The Company has selected the Oslo Stock Exchange’s Small Cap Index (OSESX) as an approach for unlisted shares.
For shares on which very little information is available, valuations are obtained from brokers to provide a basis for estimating
an assumed market price. c) Foreign fixed income securities Foreign fixed income securities are generally priced on the basis of prices obtained from an index provider. At the same time
prices are compared between several different sources to identify any errors. The following sources are used: JP Morgan Barclays Capital Indices Bloomberg Reuters JP Morgan and Barclays Capital Indices have the first priority (they cover government and corporate bonds respectively). After
that Bloomberg is used ahead of Reuters based on Bloomberg’s price source, Business Valuator Accredited in Litigation (BVAL). BVAL contains verified prices from Bloomberg. The final priority is Reuters.
d) Norwegian fixed income securities - government Reuters is used as a source for pricing Norwegian government bonds. It is Oslo Børs that provides the price (via Reuters). The
prices are compared with the prices from Bloomberg to reveal any errors. e) Norwegian fixed income securities - other than government All Norwegian fixed income securities except government are priced theoretically. A zero coupon curve is used as well as yield
curves for the pricing. Reuters is used as the source for the zero coupon curve from 0 to 10 years. From 12 years and over, Bloomberg is used as the source since Reuters does not provide prices over 10 years.
The yield curves are received from the Norwegian Mutual Fund Association (NMFA). These are based on yield curves collected
from five different market operators and converted to an average curve. f) Fixed income securities issued by foreign enterprises, but denominated in NOK Fair value is calculated in accordance with the same principle as for Norwegian fixed income securities described above. Yield
curves provided by SE Banken and Swedbank are converted to an average curve used as the basis for calculation of fair value. g) Futures/FRA/IRF All Group futures contracts are traded on stock exchanges. Reuters is used as a price source. Prices are also obtained from
another source to check the Reuters prices are correct.
19Interim report first quarter 2013
Notes to the Group accounts after the first quarter 2013
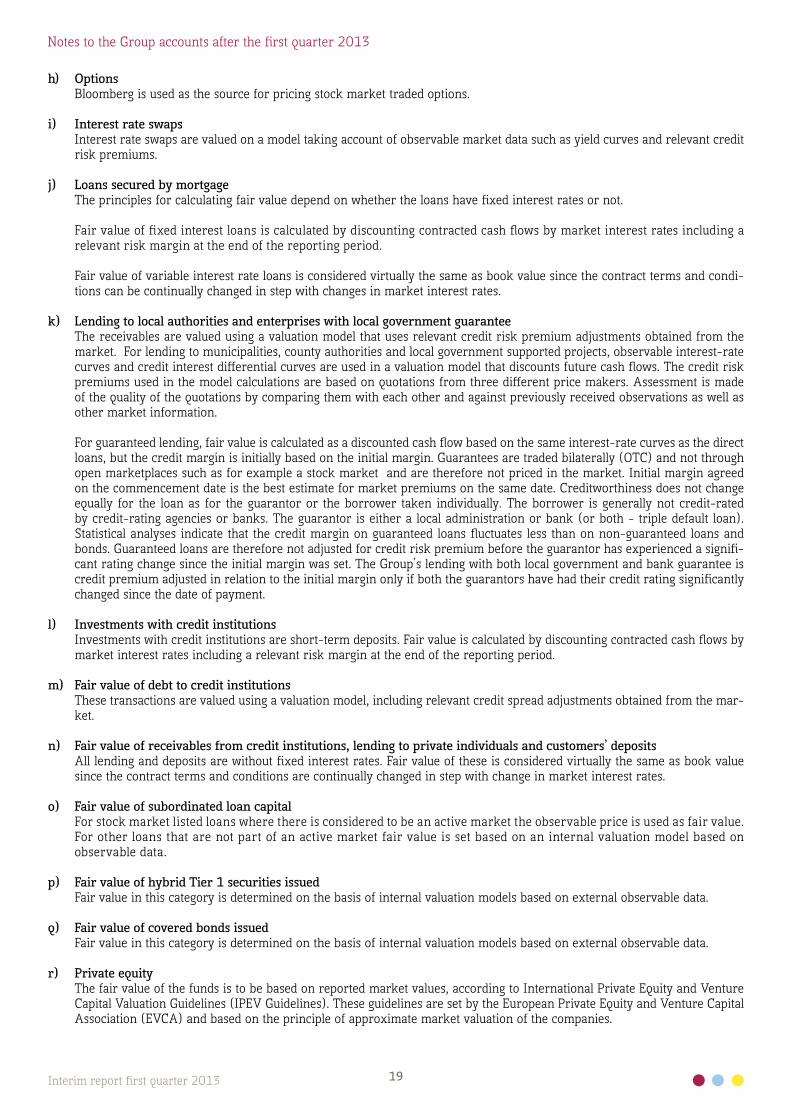
h) Options Bloomberg is used as the source for pricing stock market traded options. i) Interest rate swaps Interest rate swaps are valued on a model taking account of observable market data such as yield curves and relevant credit
risk premiums. j) Loans secured by mortgage The principles for calculating fair value depend on whether the loans have fixed interest rates or not. Fair value of fixed interest loans is calculated by discounting contracted cash flows by market interest rates including a
relevant risk margin at the end of the reporting period.
Fair value of variable interest rate loans is considered virtually the same as book value since the contract terms and condi-tions can be continually changed in step with changes in market interest rates.
k) Lending to local authorities and enterprises with local government guarantee The receivables are valued using a valuation model that uses relevant credit risk premium adjustments obtained from the
market. For lending to municipalities, county authorities and local government supported projects, observable interest-rate curves and credit interest differential curves are used in a valuation model that discounts future cash flows. The credit risk premiums used in the model calculations are based on quotations from three different price makers. Assessment is made of the quality of the quotations by comparing them with each other and against previously received observations as well as other market information.
For guaranteed lending, fair value is calculated as a discounted cash flow based on the same interest-rate curves as the direct
loans, but the credit margin is initially based on the initial margin. Guarantees are traded bilaterally (OTC) and not through open marketplaces such as for example a stock market and are therefore not priced in the market. Initial margin agreed on the commencement date is the best estimate for market premiums on the same date. Creditworthiness does not change equally for the loan as for the guarantor or the borrower taken individually. The borrower is generally not credit-rated by credit-rating agencies or banks. The guarantor is either a local administration or bank (or both - triple default loan). Statistical analyses indicate that the credit margin on guaranteed loans fluctuates less than on non-guaranteed loans and bonds. Guaranteed loans are therefore not adjusted for credit risk premium before the guarantor has experienced a signifi-cant rating change since the initial margin was set. The Group’s lending with both local government and bank guarantee is credit premium adjusted in relation to the initial margin only if both the guarantors have had their credit rating significantly changed since the date of payment.
l) Investments with credit institutions Investments with credit institutions are short-term deposits. Fair value is calculated by discounting contracted cash flows by
market interest rates including a relevant risk margin at the end of the reporting period.
m) Fair value of debt to credit institutions These transactions are valued using a valuation model, including relevant credit spread adjustments obtained from the mar-
ket.
n) Fair value of receivables from credit institutions, lending to private individuals and customers’ deposits All lending and deposits are without fixed interest rates. Fair value of these is considered virtually the same as book value
since the contract terms and conditions are continually changed in step with change in market interest rates.
o) Fair value of subordinated loan capital For stock market listed loans where there is considered to be an active market the observable price is used as fair value.
For other loans that are not part of an active market fair value is set based on an internal valuation model based on observable data.
p) Fair value of hybrid Tier 1 securities issued Fair value in this category is determined on the basis of internal valuation models based on external observable data.
q) Fair value of covered bonds issued Fair value in this category is determined on the basis of internal valuation models based on external observable data.
r) Private equity The fair value of the funds is to be based on reported market values, according to International Private Equity and Venture
Capital Valuation Guidelines (IPEV Guidelines). These guidelines are set by the European Private Equity and Venture Capital Association (EVCA) and based on the principle of approximate market valuation of the companies.
20Interim report first quarter 2013
Notes to the Group accounts after the first quarter 2013
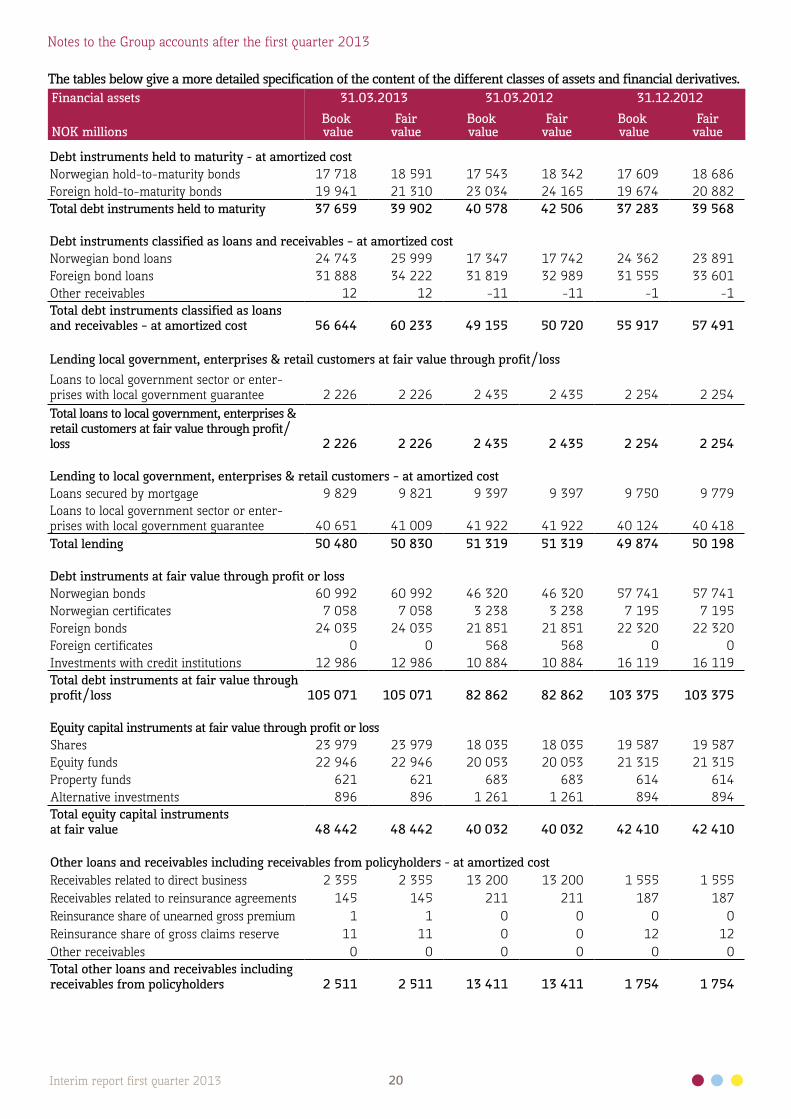
The tables below give a more detailed specification of the content of the different classes of assets and financial derivatives.Financial assets 31.03.2013 31.03.2012 31.12.2012
NOK millionsBook value
Fairvalue
Book value
Fairvalue
Book value
Fairvalue
Debt instruments held to maturity - at amortized costNorwegian hold-to-maturity bonds 17 718 18 591 17 543 18 342 17 609 18 686Foreign hold-to-maturity bonds 19 941 21 310 23 034 24 165 19 674 20 882Total debt instruments held to maturity 37 659 39 902 40 578 42 506 37 283 39 568
Debt instruments classified as loans and receivables – at amortized costNorwegian bond loans 24 743 25 999 17 347 17 742 24 362 23 891Foreign bond loans 31 888 34 222 31 819 32 989 31 555 33 601Other receivables 12 12 -11 -11 -1 -1Total debt instruments classified as loans and receivables – at amortized cost 56 644 60 233 49 155 50 720 55 917 57 491
Lending local government, enterprises & retail customers at fair value through profit/lossLoans to local government sector or enter-prises with local government guarantee 2 226 2 226 2 435 2 435 2 254 2 254Total loans to local government, enterprises & retail customers at fair value through profit/loss 2 226 2 226 2 435 2 435 2 254 2 254
Lending to local government, enterprises & retail customers – at amortized costLoans secured by mortgage 9 829 9 821 9 397 9 397 9 750 9 779Loans to local government sector or enter-prises with local government guarantee 40 651 41 009 41 922 41 922 40 124 40 418Total lending 50 480 50 830 51 319 51 319 49 874 50 198
Debt instruments at fair value through profit or lossNorwegian bonds 60 992 60 992 46 320 46 320 57 741 57 741Norwegian certificates 7 058 7 058 3 238 3 238 7 195 7 195Foreign bonds 24 035 24 035 21 851 21 851 22 320 22 320Foreign certificates 0 0 568 568 0 0Investments with credit institutions 12 986 12 986 10 884 10 884 16 119 16 119Total debt instruments at fair value through profit/loss 105 071 105 071 82 862 82 862 103 375 103 375
Equity capital instruments at fair value through profit or lossShares 23 979 23 979 18 035 18 035 19 587 19 587Equity funds 22 946 22 946 20 053 20 053 21 315 21 315Property funds 621 621 683 683 614 614Alternative investments 896 896 1 261 1 261 894 894Total equity capital instruments at fair value 48 442 48 442 40 032 40 032 42 410 42 410
Other loans and receivables including receivables from policyholders - at amortized costReceivables related to direct business 2 355 2 355 13 200 13 200 1 555 1 555Receivables related to reinsurance agreements 145 145 211 211 187 187Reinsurance share of unearned gross premium 1 1 0 0 0 0Reinsurance share of gross claims reserve 11 11 0 0 12 12Other receivables 0 0 0 0 0 0Total other loans and receivables including receivables from policyholders 2 511 2 511 13 411 13 411 1 754 1 754
21Interim report first quarter 2013
Notes to the Group accounts after the first quarter 2013
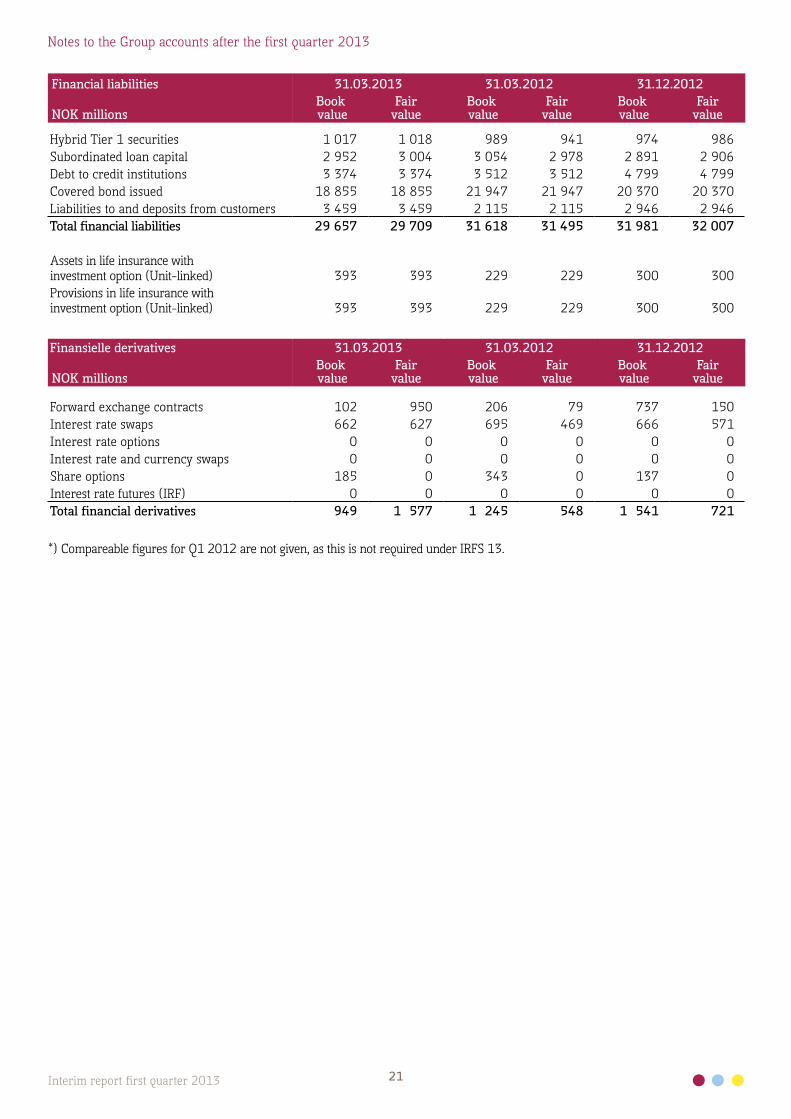
Financial liabilities 31.03.2013 31.03.2012 31.12.2012
NOK millionsBook value
Fairvalue
Book value
Fairvalue
Book value
Fairvalue
Hybrid Tier 1 securities 1 017 1 018 989 941 974 986Subordinated loan capital 2 952 3 004 3 054 2 978 2 891 2 906Debt to credit institutions 3 374 3 374 3 512 3 512 4 799 4 799Covered bond issued 18 855 18 855 21 947 21 947 20 370 20 370Liabilities to and deposits from customers 3 459 3 459 2 115 2 115 2 946 2 946Total financial liabilities 29 657 29 709 31 618 31 495 31 981 32 007
Assets in life insurance with investment option (Unit-linked) 393 393 229 229 300 300Provisions in life insurance with investment option (Unit-linked) 393 393 229 229 300 300
Finansielle derivatives 31.03.2013 31.03.2012 31.12.2012
NOK millionsBook value
Fairvalue
Book value
Fairvalue
Book value
Fairvalue
Forward exchange contracts 102 950 206 79 737 150Interest rate swaps 662 627 695 469 666 571Interest rate options 0 0 0 0 0 0Interest rate and currency swaps 0 0 0 0 0 0Share options 185 0 343 0 137 0Interest rate futures (IRF) 0 0 0 0 0 0Total financial derivatives 949 1 577 1 245 548 1 541 721
*) Compareable figures for Q1 2012 are not given, as this is not required under IRFS 13.
22Interim report first quarter 2013
Notes to the Group accounts after the first quarter 2013
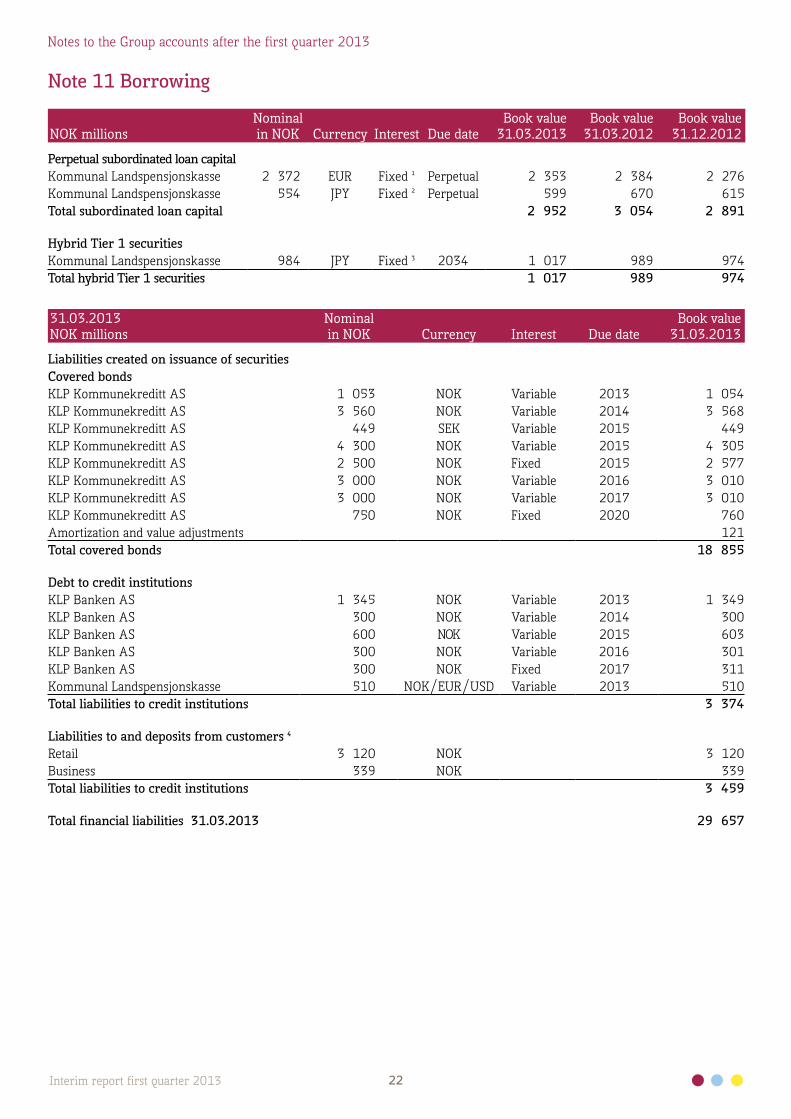
Note 11 Borrowing
NOK millionsNominal in NOK Currency Interest Due date
Book value 31.03.2013
Book value 31.03.2012
Book value 31.12.2012
Perpetual subordinated loan capitalKommunal Landspensjonskasse 2 372 EUR Fixed ¹ Perpetual 2 353 2 384 2 276Kommunal Landspensjonskasse 554 JPY Fixed ² Perpetual 599 670 615Total subordinated loan capital 2 952 3 054 2 891
Hybrid Tier 1 securitiesKommunal Landspensjonskasse 984 JPY Fixed ³ 2034 1 017 989 974Total hybrid Tier 1 securities 1 017 989 974
31.03.2013NOK millions
Nominal in NOK Currency Interest Due date
Book value 31.03.2013
Liabilities created on issuance of securitiesCovered bonds KLP Kommunekreditt AS 1 053 NOK Variable 2013 1 054KLP Kommunekreditt AS 3 560 NOK Variable 2014 3 568KLP Kommunekreditt AS 449 SEK Variable 2015 449KLP Kommunekreditt AS 4 300 NOK Variable 2015 4 305KLP Kommunekreditt AS 2 500 NOK Fixed 2015 2 577KLP Kommunekreditt AS 3 000 NOK Variable 2016 3 010KLP Kommunekreditt AS 3 000 NOK Variable 2017 3 010KLP Kommunekreditt AS 750 NOK Fixed 2020 760Amortization and value adjustments 121Total covered bonds 18 855
Debt to credit institutionsKLP Banken AS 1 345 NOK Variable 2013 1 349KLP Banken AS 300 NOK Variable 2014 300KLP Banken AS 600 NOK Variable 2015 603KLP Banken AS 300 NOK Variable 2016 301KLP Banken AS 300 NOK Fixed 2017 311Kommunal Landspensjonskasse 510 NOK/EUR/USD Variable 2013 510Total liabilities to credit institutions 3 374
Liabilities to and deposits from customers ⁴Retail 3 120 NOK 3 120Business 339 NOK 339Total liabilities to credit institutions 3 459
Total financial liabilities 31.03.2013 29 657
23Interim report first quarter 2013
Notes to the Group accounts after the first quarter 2013
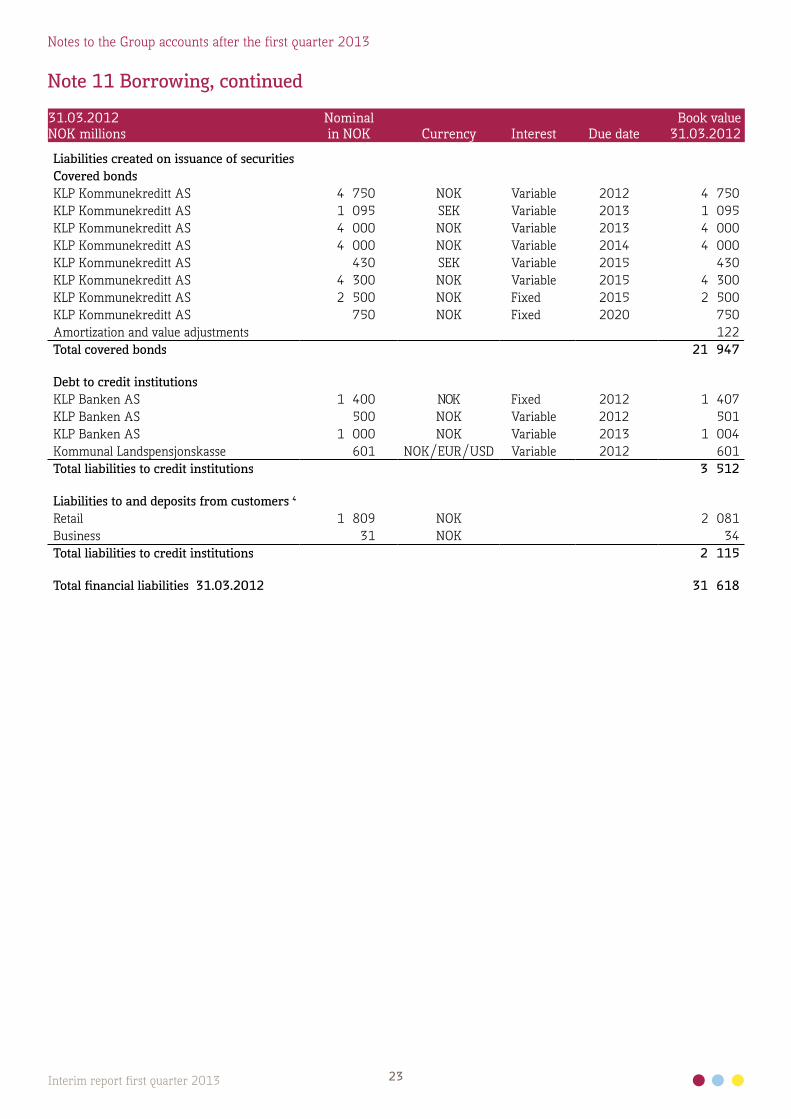
31.03.2012NOK millions
Nominal in NOK Currency Interest Due date
Book value 31.03.2012
Liabilities created on issuance of securitiesCovered bonds KLP Kommunekreditt AS 4 750 NOK Variable 2012 4 750KLP Kommunekreditt AS 1 095 SEK Variable 2013 1 095KLP Kommunekreditt AS 4 000 NOK Variable 2013 4 000KLP Kommunekreditt AS 4 000 NOK Variable 2014 4 000KLP Kommunekreditt AS 430 SEK Variable 2015 430KLP Kommunekreditt AS 4 300 NOK Variable 2015 4 300KLP Kommunekreditt AS 2 500 NOK Fixed 2015 2 500KLP Kommunekreditt AS 750 NOK Fixed 2020 750Amortization and value adjustments 122Total covered bonds 21 947
Debt to credit institutionsKLP Banken AS 1 400 NOK Fixed 2012 1 407KLP Banken AS 500 NOK Variable 2012 501KLP Banken AS 1 000 NOK Variable 2013 1 004Kommunal Landspensjonskasse 601 NOK/EUR/USD Variable 2012 601Total liabilities to credit institutions 3 512
Liabilities to and deposits from customers ⁴Retail 1 809 NOK 2 081Business 31 NOK 34Total liabilities to credit institutions 2 115
Total financial liabilities 31.03.2012 31 618
Note 11 Borrowing, continued
24Interim report first quarter 2013
Notes to the Group accounts after the first quarter 2013
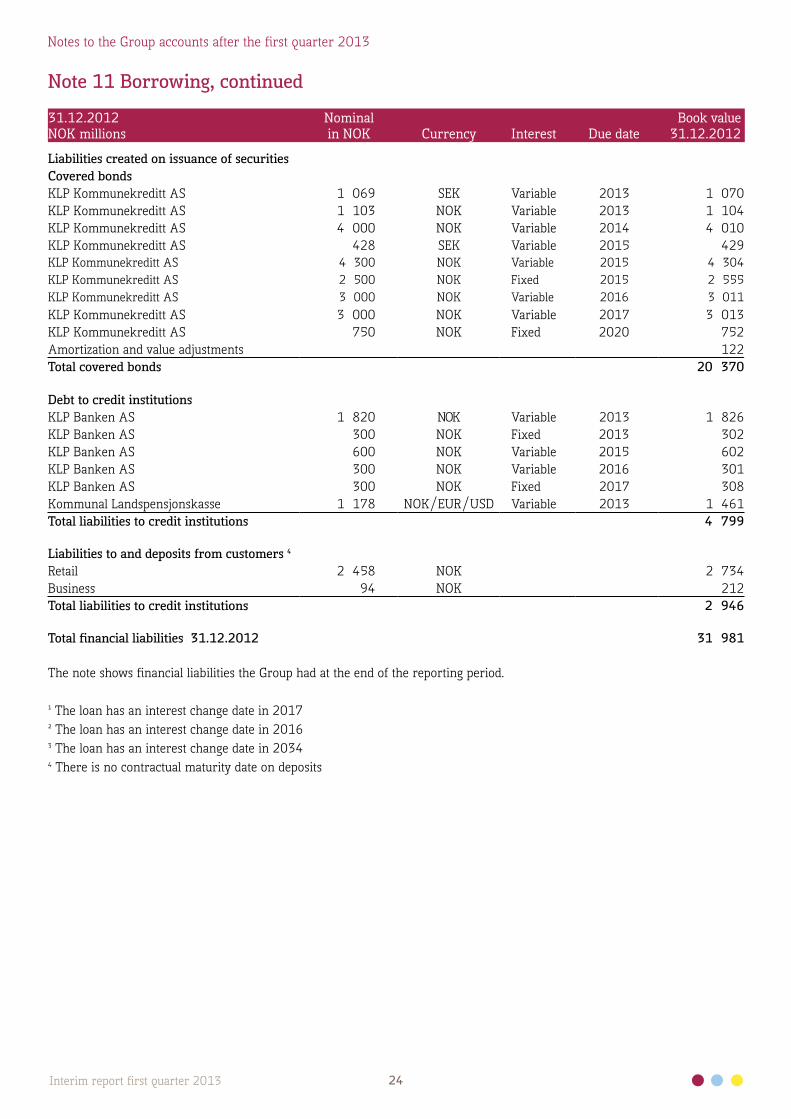
31.12.2012NOK millions
Nominal in NOK Currency Interest Due date
Book value 31.12.2012
Liabilities created on issuance of securitiesCovered bonds KLP Kommunekreditt AS 1 069 SEK Variable 2013 1 070KLP Kommunekreditt AS 1 103 NOK Variable 2013 1 104KLP Kommunekreditt AS 4 000 NOK Variable 2014 4 010KLP Kommunekreditt AS 428 SEK Variable 2015 429KLP Kommunekreditt AS 4 300 NOK Variable 2015 4 304KLP Kommunekreditt AS 2 500 NOK Fixed 2015 2 555KLP Kommunekreditt AS 3 000 NOK Variable 2016 3 011KLP Kommunekreditt AS 3 000 NOK Variable 2017 3 013KLP Kommunekreditt AS 750 NOK Fixed 2020 752Amortization and value adjustments 122Total covered bonds 20 370
Debt to credit institutionsKLP Banken AS 1 820 NOK Variable 2013 1 826KLP Banken AS 300 NOK Fixed 2013 302KLP Banken AS 600 NOK Variable 2015 602KLP Banken AS 300 NOK Variable 2016 301KLP Banken AS 300 NOK Fixed 2017 308Kommunal Landspensjonskasse 1 178 NOK/EUR/USD Variable 2013 1 461Total liabilities to credit institutions 4 799
Liabilities to and deposits from customers ⁴Retail 2 458 NOK 2 734Business 94 NOK 212Total liabilities to credit institutions 2 946
Total financial liabilities 31.12.2012 31 981
The note shows financial liabilities the Group had at the end of the reporting period.
¹ The loan has an interest change date in 2017² The loan has an interest change date in 2016³ The loan has an interest change date in 2034⁴ There is no contractual maturity date on deposits
Note 11 Borrowing, continued
25Interim report first quarter 2013
Notes to the Group accounts after the first quarter 2013
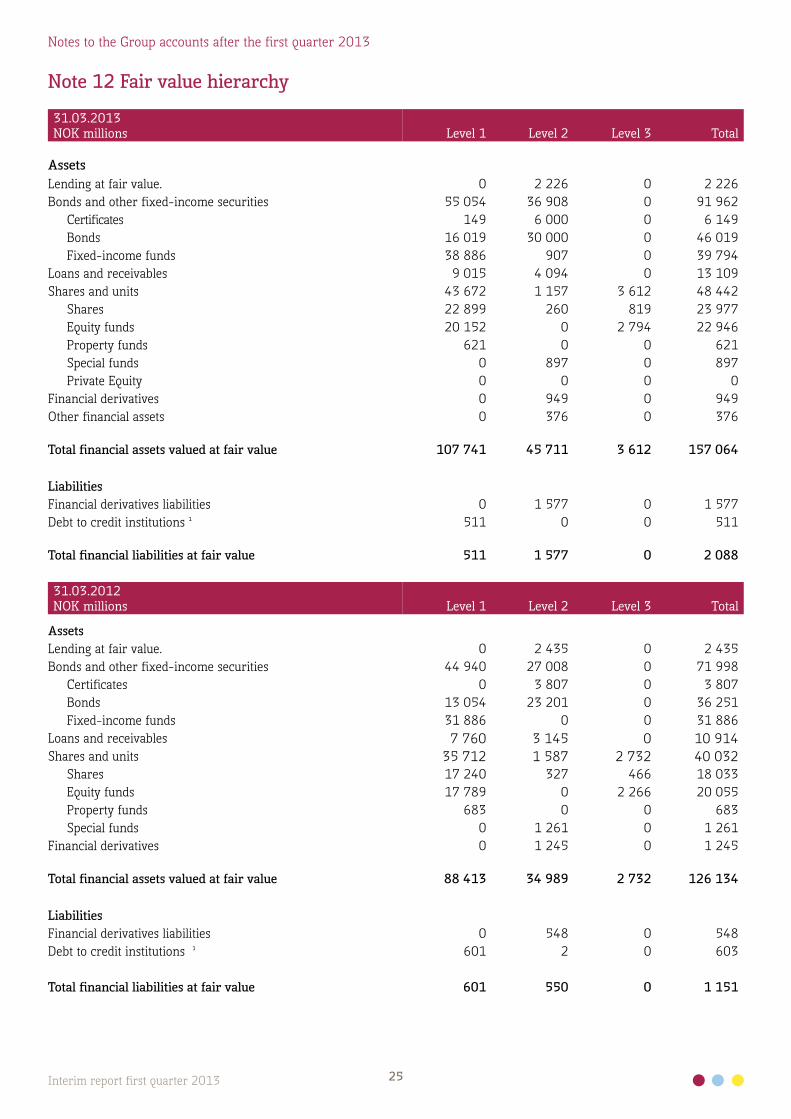
Note 12 Fair value hierarchy
31.03.2013NOK millions Level 1 Level 2 Level 3 Total
AssetsLending at fair value. 0 2 226 0 2 226Bonds and other fixed-income securities 55 054 36 908 0 91 962
Certificates 149 6 000 0 6 149Bonds 16 019 30 000 0 46 019Fixed-income funds 38 886 907 0 39 794
Loans and receivables 9 015 4 094 0 13 109Shares and units 43 672 1 157 3 612 48 442
Shares 22 899 260 819 23 977Equity funds 20 152 0 2 794 22 946Property funds 621 0 0 621Special funds 0 897 0 897Private Equity 0 0 0 0
Financial derivatives 0 949 0 949Other financial assets 0 376 0 376
Total financial assets valued at fair value 107 741 45 711 3 612 157 064
LiabilitiesFinancial derivatives liabilities 0 1 577 0 1 577Debt to credit institutions ¹ 511 0 0 511
Total financial liabilities at fair value 511 1 577 0 2 088
31.03.2012NOK millions Level 1 Level 2 Level 3 Total
AssetsLending at fair value. 0 2 435 0 2 435Bonds and other fixed-income securities 44 940 27 008 0 71 998
Certificates 0 3 807 0 3 807Bonds 13 054 23 201 0 36 251Fixed-income funds 31 886 0 0 31 886
Loans and receivables 7 760 3 145 0 10 914Shares and units 35 712 1 587 2 732 40 032
Shares 17 240 327 466 18 033Equity funds 17 789 0 2 266 20 055Property funds 683 0 0 683Special funds 0 1 261 0 1 261
Financial derivatives 0 1 245 0 1 245
Total financial assets valued at fair value 88 413 34 989 2 732 126 134
LiabilitiesFinancial derivatives liabilities 0 548 0 548Debt to credit institutions ¹ 601 2 0 603
Total financial liabilities at fair value 601 550 0 1 151
26Interim report first quarter 2013
Notes to the Group accounts after the first quarter 2013
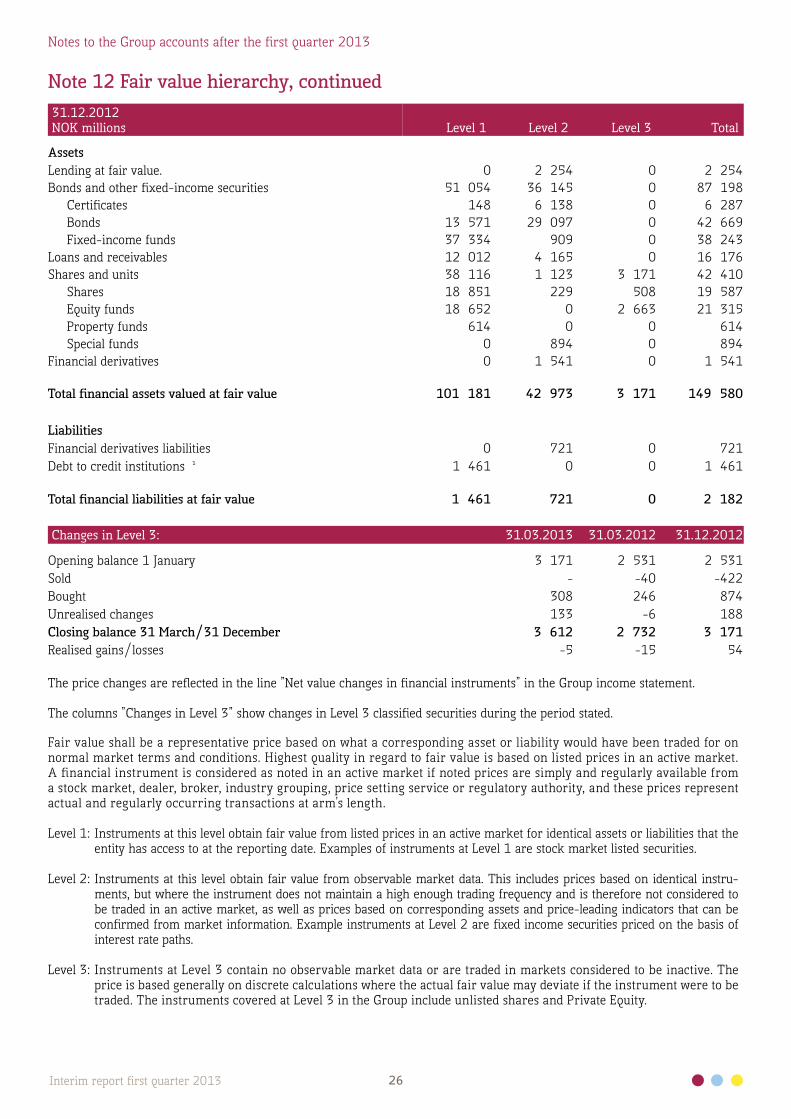
Note 12 Fair value hierarchy, continued31.12.2012NOK millions Level 1 Level 2 Level 3 Total
AssetsLending at fair value. 0 2 254 0 2 254Bonds and other fixed-income securities 51 054 36 145 0 87 198
Certificates 148 6 138 0 6 287Bonds 13 571 29 097 0 42 669Fixed-income funds 37 334 909 0 38 243
Loans and receivables 12 012 4 165 0 16 176Shares and units 38 116 1 123 3 171 42 410
Shares 18 851 229 508 19 587Equity funds 18 652 0 2 663 21 315Property funds 614 0 0 614Special funds 0 894 0 894
Financial derivatives 0 1 541 0 1 541
Total financial assets valued at fair value 101 181 42 973 3 171 149 580
LiabilitiesFinancial derivatives liabilities 0 721 0 721Debt to credit institutions ¹ 1 461 0 0 1 461
Total financial liabilities at fair value 1 461 721 0 2 182
Changes in Level 3: 31.03.2013 31.03.2012 31.12.2012
Opening balance 1 January 3 171 2 531 2 531 Sold - -40 -422 Bought 308 246 874 Unrealised changes 133 -6 188 Closing balance 31 March/31 December 3 612 2 732 3 171 Realised gains/losses -5 -15 54
The price changes are reflected in the line ”Net value changes in financial instruments” in the Group income statement.
The columns ”Changes in Level 3” show changes in Level 3 classified securities during the period stated.
Fair value shall be a representative price based on what a corresponding asset or liability would have been traded for on normal market terms and conditions. Highest quality in regard to fair value is based on listed prices in an active market. A financial instrument is considered as noted in an active market if noted prices are simply and regularly available from a stock market, dealer, broker, industry grouping, price setting service or regulatory authority, and these prices represent actual and regularly occurring transactions at arm’s length.
Level 1: Instruments at this level obtain fair value from listed prices in an active market for identical assets or liabilities that the entity has access to at the reporting date. Examples of instruments at Level 1 are stock market listed securities.
Level 2: Instruments at this level obtain fair value from observable market data. This includes prices based on identical instru-ments, but where the instrument does not maintain a high enough trading frequency and is therefore not considered to be traded in an active market, as well as prices based on corresponding assets and price-leading indicators that can be confirmed from market information. Example instruments at Level 2 are fixed income securities priced on the basis of interest rate paths.
Level 3: Instruments at Level 3 contain no observable market data or are traded in markets considered to be inactive. The price is based generally on discrete calculations where the actual fair value may deviate if the instrument were to be traded. The instruments covered at Level 3 in the Group include unlisted shares and Private Equity.
27Interim report first quarter 2013
Note 12 Fair value hierarchy, continuedThe investment option portfolio is not included in the table. The investment option portfolio has NOK 392 million in financial assets measured at fair value. On 31 March 2013 the NOK 392 million were included with NOK 179 million in shares and units in Level 1 and NOK 213 million in debt instruments at fair value.
¹ The line Debt to credit institutions in the financial position statement includes liabilities measured at fair value and amortized cost. This line is therefore not reconcilable against the financial position. The liabilities measured at amortized cost amounted to NOK 2 863 million on 31 March 2013.
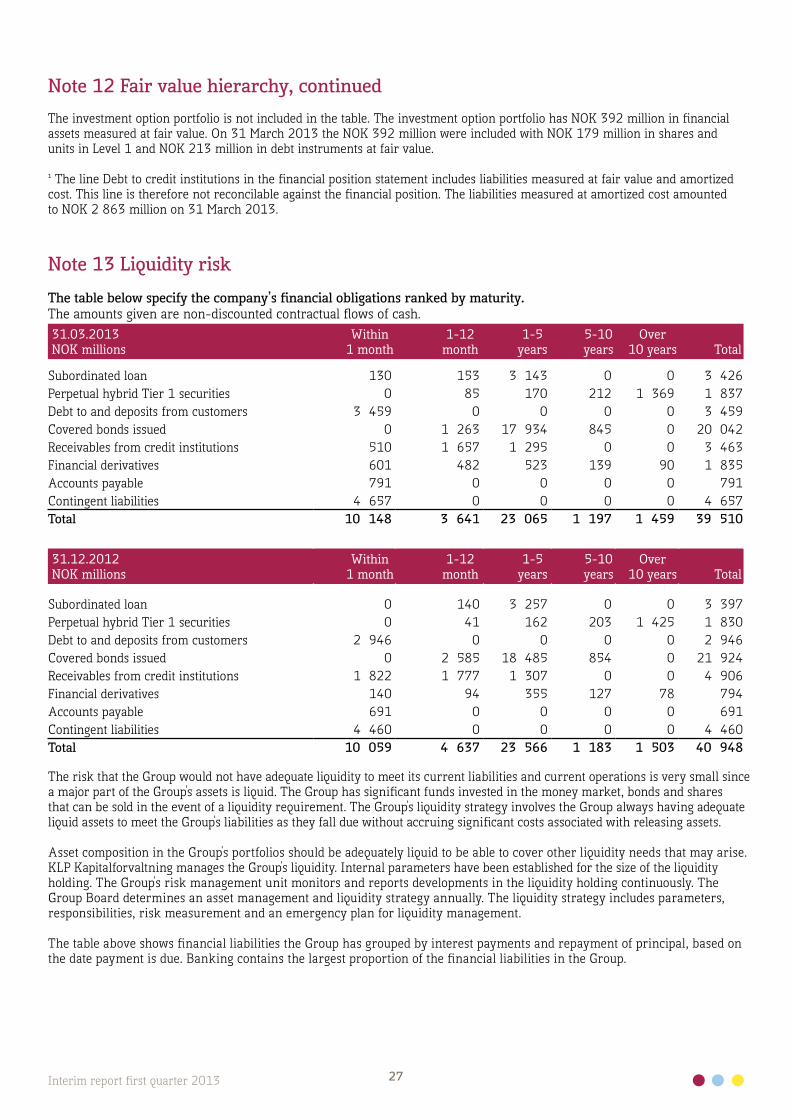
Note 13 Liquidity riskThe table below specify the company’s financial obligations ranked by maturity. The amounts given are non-discounted contractual flows of cash.31.03.2013NOK millions
Within 1 month
1-12 month
1-5years
5-10 years
Over 10 years Total
Subordinated loan 130 153 3 143 0 0 3 426Perpetual hybrid Tier 1 securities 0 85 170 212 1 369 1 837Debt to and deposits from customers 3 459 0 0 0 0 3 459Covered bonds issued 0 1 263 17 934 845 0 20 042Receivables from credit institutions 510 1 657 1 295 0 0 3 463Financial derivatives 601 482 523 139 90 1 835Accounts payable 791 0 0 0 0 791Contingent liabilities 4 657 0 0 0 0 4 657Total 10 148 3 641 23 065 1 197 1 459 39 510
31.12.2012NOK millions
Within 1 month
1-12 month
1-5years
5-10 years
Over 10 years Total
Subordinated loan 0 140 3 257 0 0 3 397Perpetual hybrid Tier 1 securities 0 41 162 203 1 425 1 830Debt to and deposits from customers 2 946 0 0 0 0 2 946Covered bonds issued 0 2 585 18 485 854 0 21 924Receivables from credit institutions 1 822 1 777 1 307 0 0 4 906Financial derivatives 140 94 355 127 78 794Accounts payable 691 0 0 0 0 691Contingent liabilities 4 460 0 0 0 0 4 460Total 10 059 4 637 23 566 1 183 1 503 40 948
The risk that the Group would not have adequate liquidity to meet its current liabilities and current operations is very small since a major part of the Group's assets is liquid. The Group has significant funds invested in the money market, bonds and shares that can be sold in the event of a liquidity requirement. The Group's liquidity strategy involves the Group always having adequate liquid assets to meet the Group's liabilities as they fall due without accruing significant costs associated with releasing assets.
Asset composition in the Group's portfolios should be adequately liquid to be able to cover other liquidity needs that may arise. KLP Kapitalforvaltning manages the Group's liquidity. Internal parameters have been established for the size of the liquidity holding. The Group's risk management unit monitors and reports developments in the liquidity holding continuously. The Group Board determines an asset management and liquidity strategy annually. The liquidity strategy includes parameters, responsibilities, risk measurement and an emergency plan for liquidity management.
The table above shows financial liabilities the Group has grouped by interest payments and repayment of principal, based on the date payment is due. Banking contains the largest proportion of the financial liabilities in the Group.

28Interim report first quarter 2013
Note 14 Interest rate risk
31.03.2013
NOK millionsUp to 3months
From 3 mnths.
to 12 mnths.
From 1 year
to 5 years
From 5 years
to 10 yearsOver
10 yearsChanges incashflow Total
AssetsMutual funds shares1 -1 0 0 0 0 1 0Alternative investments 0 0 0 0 0 0 0Financial derivatives classified as assets 16 8 -147 -155 -108 -20 -406Debt instruments classified as loans and receivables – at amortised cost 0 0 0 0 0 2 2Bonds and other fixed-return securities -25 -49 -359 -474 -253 49 -1 112Fixed income fund holdings -2 007 0 0 0 0 6 -2 001Shares in Non-UCIT funds 21 0 0 0 0 2 23Lending and receivables -1 -10 0 0 0 120 109Lending 0 0 -1 0 0 153 152Total assets -1 997 -51 -507 -629 -362 312 -3 234
LiabilitiesDeposit 0 0 0 0 0 -35 -35Liabilities created on issue of securities 0 0 65 55 0 -179 -59Financial derivatives classified as liabilities -15 -4 195 141 2 19 337Hybrid capital, subordinated loans 0 0 0 64 20 0 84Call Money 0 0 0 0 0 -2 -2Total liabilities -15 -4 260 261 21 -197 325
Total, before and after tax -2 013 -55 -247 -368 -340 114 -2 909
31.12.2012
NOK millionsUp to 3months
From 3 mnths.
to 12 mnths.
From 1 year
to 5 years
From 5 years
to 10 yearsOver
10 yearsChanges incashflow Total
AssetsMutual funds shares1 -1 0 0 0 0 4 3Alternative investments 0 0 0 0 0 3 3Financial derivatives classified as assets 7 11 -155 -100 -171 -71 -478Debt instruments classified as loans and receivables – at amortised cost
0 0 0 0 0 7 7
Bonds and other fixed-return securities -23 -42 -342 -407 -198 133 -879Fixed income fund holdings -1 923 0 0 0 0 22 -1 901Shares in Non-UCIT funds 14 0 0 0 0 5 19Lending and receivables -1 -14 0 0 0 81 66Lending 0 0 -1 0 0 153 152Total assets -1 926 -45 -498 -507 -369 336 -3 009
29Interim report first quarter 2013
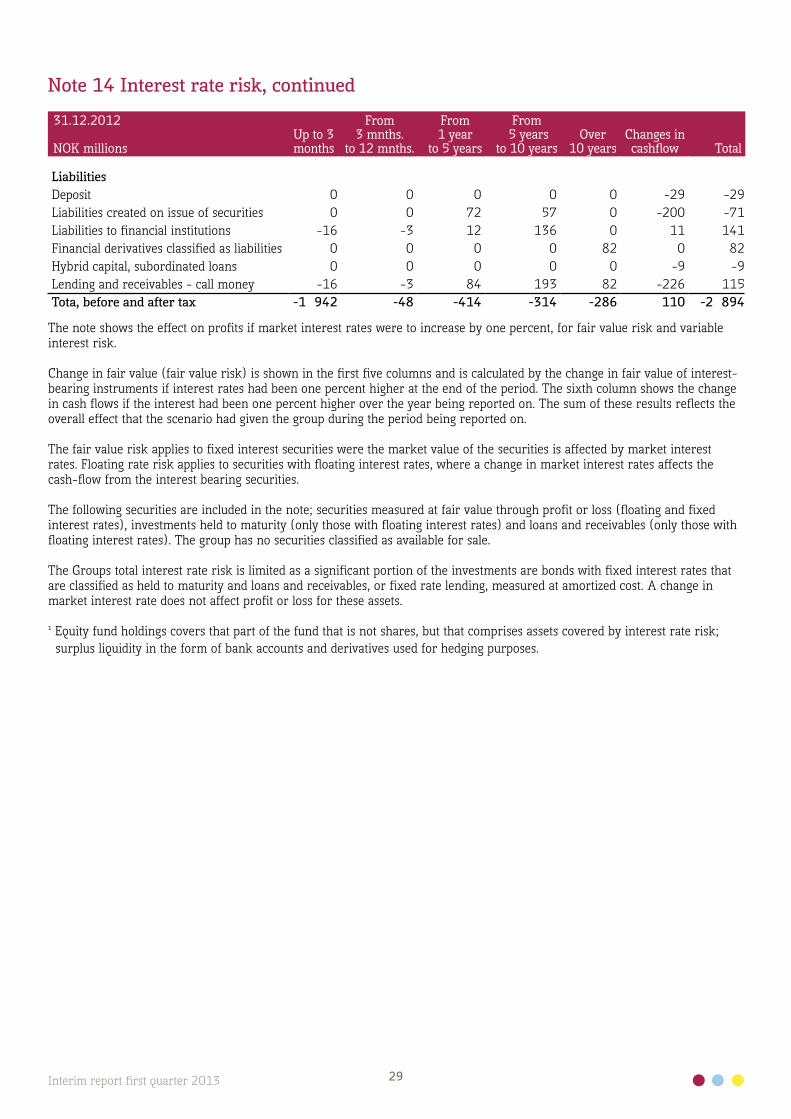
Note 14 Interest rate risk, continued
31.12.2012
NOK millionsUp to 3months
From 3 mnths.
to 12 mnths.
From 1 year
to 5 years
From 5 years
to 10 yearsOver
10 yearsChanges incashflow Total
LiabilitiesDeposit 0 0 0 0 0 -29 -29Liabilities created on issue of securities 0 0 72 57 0 -200 -71Liabilities to financial institutions -16 -3 12 136 0 11 141Financial derivatives classified as liabilities 0 0 0 0 82 0 82Hybrid capital, subordinated loans 0 0 0 0 0 -9 -9Lending and receivables - call money -16 -3 84 193 82 -226 115Tota, before and after tax -1 942 -48 -414 -314 -286 110 -2 894
The note shows the effect on profits if market interest rates were to increase by one percent, for fair value risk and variable interest risk.
Change in fair value (fair value risk) is shown in the first five columns and is calculated by the change in fair value of interest-bearing instruments if interest rates had been one percent higher at the end of the period. The sixth column shows the change in cash flows if the interest had been one percent higher over the year being reported on. The sum of these results reflects the overall effect that the scenario had given the group during the period being reported on.
The fair value risk applies to fixed interest securities were the market value of the securities is affected by market interest rates. Floating rate risk applies to securities with floating interest rates, where a change in market interest rates affects the cash-flow from the interest bearing securities.
The following securities are included in the note; securities measured at fair value through profit or loss (floating and fixed interest rates), investments held to maturity (only those with floating interest rates) and loans and receivables (only those with floating interest rates). The group has no securities classified as available for sale.
The Groups total interest rate risk is limited as a significant portion of the investments are bonds with fixed interest rates that are classified as held to maturity and loans and receivables, or fixed rate lending, measured at amortized cost. A change in market interest rate does not affect profit or loss for these assets.
¹ Equity fund holdings covers that part of the fund that is not shares, but that comprises assets covered by interest rate risk; surplus liquidity in the form of bank accounts and derivatives used for hedging purposes.

30Interim report first quarter 2013
Note 15 Credit risk
31.03.2013NOK millions AAA AA A BBB NR/NIG Total
Debt instruments held to maturity - at amortized costBanks 0 1 039 796 0 298 2 134Finance and credit enterprises 0 35 0 0 1 035 1 070Public sector guarantee 1 371 0 0 0 81 1 452Government and government guarantee within OECD 20 105 0 0 850 0 20 955Public sector enterprises and covered bonds 2 727 542 0 0 1 478 4 748Other 0 964 3 107 0 3 230 7 301Total 24 203 2 580 3 904 850 6 122 37 659
Debt instruments classified as loans and receivables – at amortized costBanks 0 1 056 4 591 0 654 6 608Finance and credit enterprises 518 263 264 0 264 1 310Public sector guarantee 1 115 0 0 0 325 1 439Government and government guarantee within OECD 12 382 0 0 2 067 0 14 449Public sector enterprises and covered bonds 6 320 1 588 1 355 0 2 427 11 690Other 0 3 507 3 346 832 13 770 21 455Total 20 335 6 413 9 556 2 899 17 441 56 644
Debt instruments at fair value - bonds and other securities with fixed returnsBanks 0 443 2 158 51 10 216 12 867Finance and credit enterprises 11 598 466 0 265 1 339Public sector guarantee 861 56 0 0 1 903 2 820Government and government guarantee within OECD 9 573 4 115 0 0 0 13 687Public sector enterprises and covered bonds 1 889 588 0 0 6 092 8 569Other 0 329 747 121 11 380 12 578Total 12 334 6 128 3 371 172 29 855 51 860
Financial derivatives classified as assetsDenmark 0 0 205 0 0 205Finland 0 66 0 0 0 66Norway 0 7 242 0 0 249UK 0 0 185 0 0 185Sweden 0 0 144 0 0 144Germany 0 0 2 0 0 2USA 0 0 99 0 0 99Total 0 73 876 0 0 949
Debt instruments at fair value - Fixed income fund unitsPublic sector guarantee 0 0 0 0 2 179 2 179Government and government guarantee within OECD 0 0 0 0 137 137Other 0 0 22 377 0 15 111 37 489Total 0 0 22 377 0 17 427 39 804
Debt instruments at fair value - Loans and receivablesDenmark 0 0 1 086 0 0 1 086Finland 0 482 0 0 0 482Norway 0 0 4 940 0 3 090 8 030UK 0 0 1 689 0 0 1 689Sweden 0 1 615 185 0 0 1 800Germany 0 0 2 0 0 2USA 0 0 317 0 0 317Total 0 2 097 8 220 0 3 090 13 406
Total securities 56 872 17 290 48 612 3 921 73 935 200 322
Lending local government, enterprises & retail customers ¹ 0 % 20 % 35 % 100 % TotalPublic sector 0 37 865 0 1 568 39 433Enterprises 0 1 122 4 1 424 2 550Private individuals 0 0 10 249 474 10 723Total 0 38 987 10 253 3 466 52 706
31Interim report first quarter 2013
Note 15 Credit risk, continued
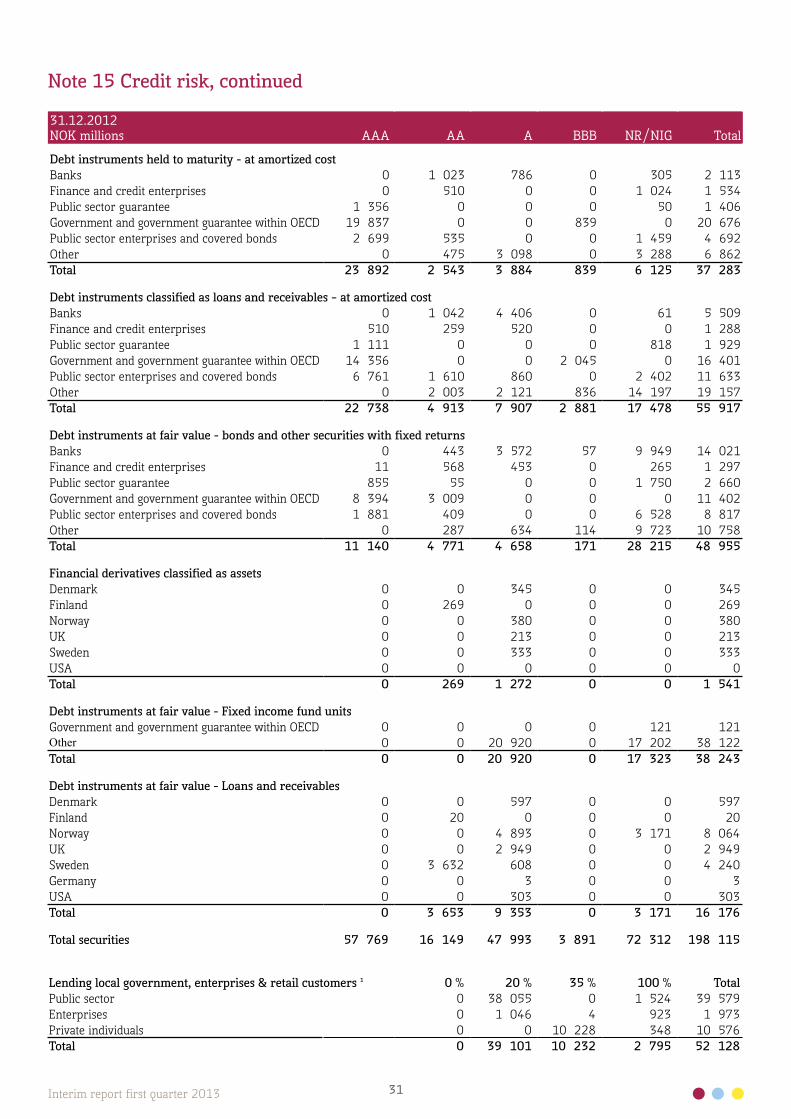
31.12.2012NOK millions AAA AA A BBB NR/NIG Total
Debt instruments held to maturity - at amortized costBanks 0 1 023 786 0 305 2 113Finance and credit enterprises 0 510 0 0 1 024 1 534Public sector guarantee 1 356 0 0 0 50 1 406Government and government guarantee within OECD 19 837 0 0 839 0 20 676Public sector enterprises and covered bonds 2 699 535 0 0 1 459 4 692Other 0 475 3 098 0 3 288 6 862Total 23 892 2 543 3 884 839 6 125 37 283
Debt instruments classified as loans and receivables – at amortized costBanks 0 1 042 4 406 0 61 5 509Finance and credit enterprises 510 259 520 0 0 1 288Public sector guarantee 1 111 0 0 0 818 1 929Government and government guarantee within OECD 14 356 0 0 2 045 0 16 401Public sector enterprises and covered bonds 6 761 1 610 860 0 2 402 11 633Other 0 2 003 2 121 836 14 197 19 157Total 22 738 4 913 7 907 2 881 17 478 55 917
Debt instruments at fair value - bonds and other securities with fixed returnsBanks 0 443 3 572 57 9 949 14 021Finance and credit enterprises 11 568 453 0 265 1 297Public sector guarantee 855 55 0 0 1 750 2 660Government and government guarantee within OECD 8 394 3 009 0 0 0 11 402Public sector enterprises and covered bonds 1 881 409 0 0 6 528 8 817Other 0 287 634 114 9 723 10 758Total 11 140 4 771 4 658 171 28 215 48 955
Financial derivatives classified as assetsDenmark 0 0 345 0 0 345Finland 0 269 0 0 0 269Norway 0 0 380 0 0 380UK 0 0 213 0 0 213Sweden 0 0 333 0 0 333USA 0 0 0 0 0 0Total 0 269 1 272 0 0 1 541
Debt instruments at fair value - Fixed income fund unitsGovernment and government guarantee within OECD 0 0 0 0 121 121Other 0 0 20 920 0 17 202 38 122Total 0 0 20 920 0 17 323 38 243
Debt instruments at fair value - Loans and receivablesDenmark 0 0 597 0 0 597Finland 0 20 0 0 0 20Norway 0 0 4 893 0 3 171 8 064UK 0 0 2 949 0 0 2 949Sweden 0 3 632 608 0 0 4 240Germany 0 0 3 0 0 3USA 0 0 303 0 0 303Total 0 3 653 9 353 0 3 171 16 176
Total securities 57 769 16 149 47 993 3 891 72 312 198 115
Lending local government, enterprises & retail customers ¹ 0 % 20 % 35 % 100 % TotalPublic sector 0 38 055 0 1 524 39 579Enterprises 0 1 046 4 923 1 973Private individuals 0 0 10 228 348 10 576Total 0 39 101 10 232 2 795 52 128
32Interim report first quarter 2013
Note 15 Credit risk, continuedEmphasis is placed on diversification of credit exposure to avoid concentration of credit risk against individual debtors. To monitor credit risk in lending and investments a special credit committee has been established, meeting regularly. The limits for credit risk against the individual debtor are set by the committee. Changes in debtors’ credit assessments are monitored and followed up by KLP Kapitalforvaltning AS.
The Group has good balance between Norwegian bonds and international bonds and has a portfolio of exclusively good credit notes. The Group can be said to have a high concentration of debt instruments directed at the Norwegian public sector, however this does not imply concentration risk in the ordinary meaning since the counterparty risk is minimal.
Only ratings from Standard and Poor’s have been used in the note grouping. KLP Group also uses ratings from Moody’s Investor Services and Fitch Ratings and all three are considered equal as a basis for investments in fixed income securities. The table shows exposure against the rating categories that S&P uses, where AAA is linked to securities with the highest creditworthiness. Non-rated/non-investment-grade applies in the main to municipalities/county administrations, certain Norwegian financial institutions and other investments within Norwegian finance. KLP Group has strict guidelines for investments in fixed-intcome securities, which also apply to investments falling into this category.
The lines in the note coincide with the financial position statement layout. The exceptions are debt instruments at fair value, which are divided into three categories in the note and lending which is shown combined in the note, but is shown in two lines in the financial position statement (fair value and amortized cost).
Geographic extract of debt instruments - Exposure against profiled countries in the Eurozone (PIIGS²)
31.03.2013NOK millions
Acquisition cost
Unrealized gain/loss
Of which due to currency
Marketvalue
Book value31.03.2013
SpainFixed income securities at amortized cost 813 24 0 837 813Total Spain 813 24 0 837 813
ItalyFixed income securities at amortized cost 2 000 99 0 2 099 2 000Total Italy 2 000 99 0 2 099 2 000
Total exposure PIIGS 2 813 123 0 2 936 2 813
In Spain, government debt was NOK 0 million and government guaranteed securities NOK 837 million. In Italy, pure government debt was NOK 2,099 million and government guaranteed securities NOK 0 (market value) as at 31 March 2013.
31.03.2013Rating Spain Italy
Moody´s Baa3 Baa2Standard & Poor´s BBB- BBB+Fitch BBB BBB+

33Interim report first quarter 2013
Note 15 Credit risk, continued
31.12.2012NOK millions
Acquisition cost
Unrealized gain/loss
Of which due to currency
Marketvalue
Book value31.12.2012
SpainFixed income securities at amortized cost 813 1 0 814 813Total Spain 813 1 0 814 813
ItalyFixed income securities at amortized cost 2 000 76 0 2 076 2 000Total Italy 2 000 76 0 2 076 2 000
Total exposure PIIGS 2 813 77 0 2 889 2 813
In Spain, government debt was NOK 0 million and government guaranteed securities NOK 814 million. In Italy, pure government debt was NOK 2,076 million and government guaranteed securities NOK 0 (market value) as at 31 December 2012.
31.12.2012Rating Spain Italy
Moody´s Baa3 Baa2Standard & Poor´s BBB- BBB+Fitch BBB A-
The overview shows government debt the KLP Group holds against selected countries, and the rating. The countries in the table are selected on the basis of the profile they have gained as exposed economies in the Eurozone, and in the continuing unease about debt. The debt unease is primarily based on the fear of default in government debt. The KLP Group has no government securities in Greece, Ireland or Portugal as at 31 March 2013. The securities measured at amortized cost have not been written down.
¹ The credit risk to which lending is exposed is calculated based on the regulations concerning minimum requirements for capital adequacy, and the rules that apply on determining the calculation base. The lending is placed separately since it is not included with the same rating categories. In regard to weighting in the table, 0% indicates the lowest expected credit risk and 100% the highest.
² The acronym PIIGS refers to the countries assumed to be most exposed as a result of the market disquiet concerning government debt in the Eurozone and is used in regard to Portugal, Ireland, Italy, Greece, Spain.

34Interim report first quarter 2013
Notes to the Group accounts after the first quarter 2013
Note 16 Insurance-related provisions in life including investment choice
NOK millions 31.03.2013 31.03.2012 31.12.2012
Premium reserves - ordinary tarif 255 492 228 635 246 417Premium reserves - longevity reserving 4 874 0 4 486Premium funds, buffer funds and pensioners’ surplus funds 1 602 968 1 595Supplementary reserves 12 407 12 344 12 403Securities adjustment fund 12 585 8 580 9 300Other provisions 219 73 220Profit/loss allocated to insurance contracts 3 029 3 054 2 360Insurance-related provisions in life insurance incl. investment options 290 208 253 655 276 781
Premium reserves - ordinary tarif 386 223 293
Deposit funds 7 6 7
Reserving life insurance with investment options 393 229 300
Reserves increase K2013NOK millions
Estimated gross reserves increase for new tariff K2013: 10 775Reserves increase as at 31.12.2012 4 486Additional reserves increase Q1 2013 ¹ 388Total reserves increase as at 31.03.2013 4 874
Remaining reserves increase requirement 5 901
¹ Reserves increase is calculated based on the results of Q1, but is not binding on the Company result for the year.
Note 17 Accounts receivable
NOK millions 31.03.2013 31.03.2012 31.12.2012
Short-term receivable trade in securities 469 11 124 196Premium receivable 731 1 158 207Reinsurance share of gross outstanding claims provisions 145 211 185Other receivable 1 167 918 1 166Total receivable 2 511 13 411 1 754
Note 18 Other short term liabilitiesNOK millions 31.03.2013 31.03.2012 31.12.2012
Short-term liabilities securities 391 12 011 3 696Advance tax-deduction pension scheme 214 208 214Accounts payable 791 557 691Pre-called contribution to insurance 49 46 438Other short-term liabilities 840 484 204Total other short-term liabilities 2 285 13 306 5 245

35Interim report first quarter 2013
Non- financial accounts interim report Q1 2013
Note Per Q1 2013 2012 2011 2010
Environment1 Energy consumption kWh KLP Huset 1 134 254 3 795 878 3 489 425 5 367 259
1 Energy consumption kWh own offices Trondheim 80 688 221 703 165 135 357 159
1 Energy consumption kwh own office Bergen 163 615 445 918 460 518 541 337
Kilo co2 equivalent from aircrafts 151 659 387 429 333 081 300 370
Note
EmployeesNumber of employees 825 808 775 762
Percentage reported sickness absence 12 month rolling 4,5 4,2 4,6 4,4
Percentage reported sickness absence quarter 4,5
Note
Responsible investmentsNumber of exclusions of companies from the investment portfolio 64 64 64 59Number of companies reinstated in the investement portfolio 0 1 1 3
2 Number of general meetings in Norwegian companies in which KLP has voted 3 (100 %) 113 (92%) 130 127
2 Number of general meetings in foreign companies in which KLP has voted 203 (54%) 2 099 (75%) 1 662 1 533Number of companies KLP has been in dialogue with 9 143 96
Note 1 Energy consumptionTarget is set at 5 per cent reduction in tonnes co2/employee. 1kwh approximates to NOK 1and 100g co2 equivalents at "Nordic mix".In the first quarter 2013 new and improved details regarding reporting of CO2 aircraft engine emissions are available. This makes comparisions with previos years inaccurate.
Note 2 Responsible investingThe indicator shows both percentage and total numer of general meetings and actual number.
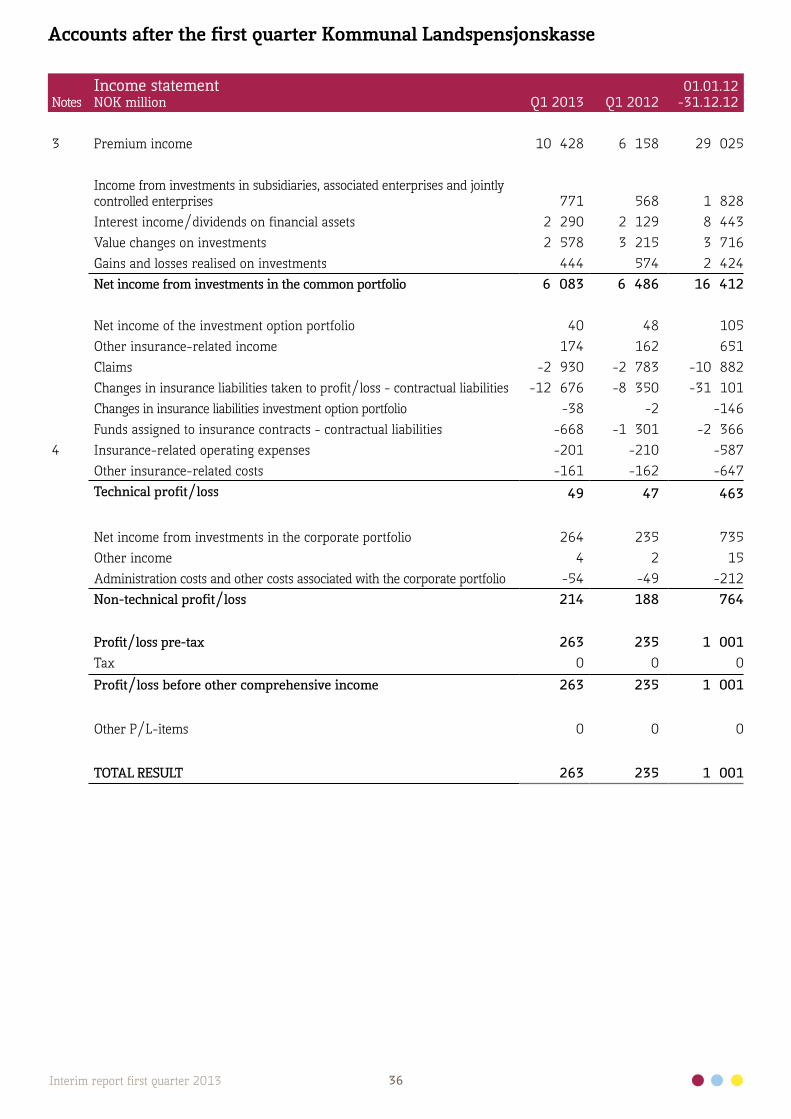
36Interim report first quarter 2013
NotesIncome statementNOK million Q1 2013 Q1 2012
01.01.12 -31.12.12
3 Premium income 10 428 6 158 29 025
Income from investments in subsidiaries, associated enterprises and jointly controlled enterprises 771 568 1 828Interest income/dividends on financial assets 2 290 2 129 8 443Value changes on investments 2 578 3 215 3 716Gains and losses realised on investments 444 574 2 424Net income from investments in the common portfolio 6 083 6 486 16 412
Net income of the investment option portfolio 40 48 105Other insurance-related income 174 162 651Claims -2 930 -2 783 -10 882Changes in insurance liabilities taken to profit/loss - contractual liabilities -12 676 -8 350 -31 101Changes in insurance liabilities investment option portfolio -38 -2 -146Funds assigned to insurance contracts - contractual liabilities -668 -1 301 -2 366
4 Insurance-related operating expenses -201 -210 -587Other insurance-related costs -161 -162 -647Technical profit/loss 49 47 463
Net income from investments in the corporate portfolio 264 235 735Other income 4 2 15Administration costs and other costs associated with the corporate portfolio -54 -49 -212Non-technical profit/loss 214 188 764
Profit/loss pre-tax 263 235 1 001Tax 0 0 0
Profit/loss before other comprehensive income 263 235 1 001
Other P/L-items 0 0 0
TOTAL RESULT 263 235 1 001
Accounts after the first quarter Kommunal Landspensjonskasse
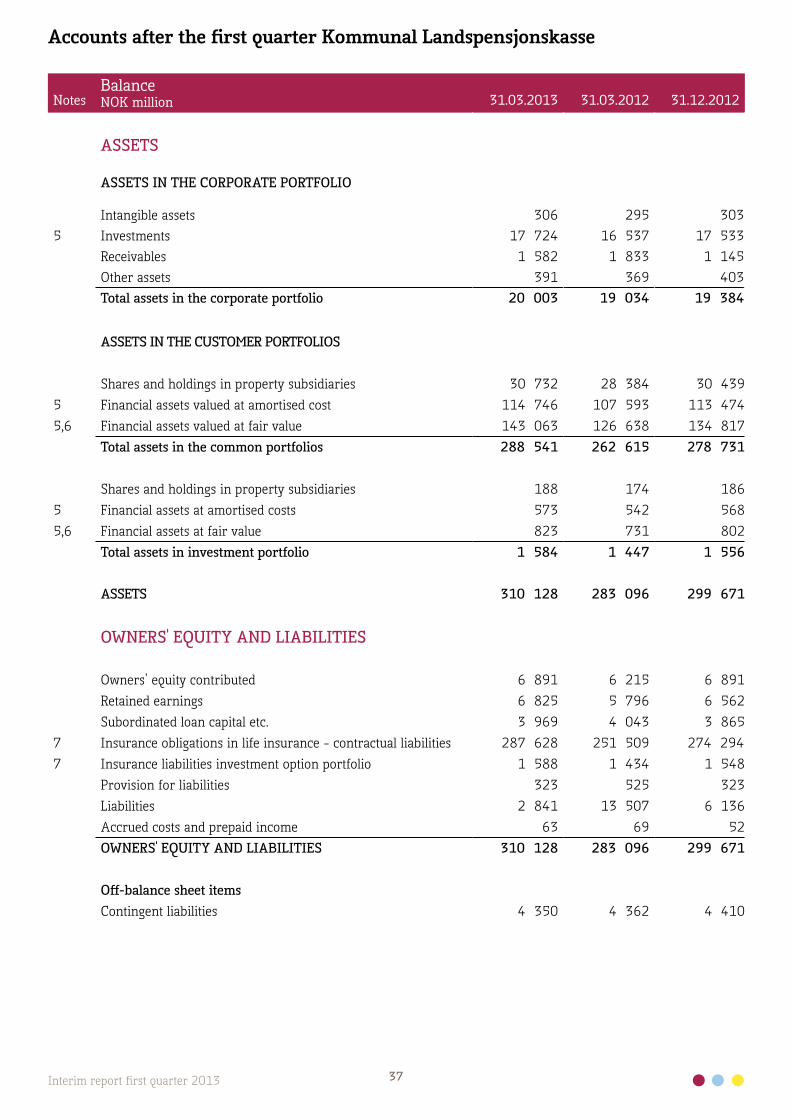
37Interim report first quarter 2013
Accounts after the first quarter Kommunal Landspensjonskasse
NotesBalanceNOK million 31.03.2013 31.03.2012 31.12.2012
ASSETS
ASSETS IN THE CORPORATE PORTFOLIO
Intangible assets 306 295 3035 Investments 17 724 16 537 17 533
Receivables 1 582 1 833 1 145Other assets 391 369 403Total assets in the corporate portfolio 20 003 19 034 19 384
ASSETS IN THE CUSTOMER PORTFOLIOS
Shares and holdings in property subsidiaries 30 732 28 384 30 4395 Financial assets valued at amortised cost 114 746 107 593 113 4745,6 Financial assets valued at fair value 143 063 126 638 134 817
Total assets in the common portfolios 288 541 262 615 278 731
Shares and holdings in property subsidiaries 188 174 1865 Financial assets at amortised costs 573 542 5685,6 Financial assets at fair value 823 731 802
Total assets in investment portfolio 1 584 1 447 1 556
ASSETS 310 128 283 096 299 671
OWNERS' EQUITY AND LIABILITIES
Owners’ equity contributed 6 891 6 215 6 891Retained earnings 6 825 5 796 6 562Subordinated loan capital etc. 3 969 4 043 3 865
7 Insurance obligations in life insurance - contractual liabilities 287 628 251 509 274 2947 Insurance liabilities investment option portfolio 1 588 1 434 1 548
Provision for liabilities 323 525 323Liabilities 2 841 13 507 6 136Accrued costs and prepaid income 63 69 52OWNERS' EQUITY AND LIABILITIES 310 128 283 096 299 671
Off-balance sheet itemsContingent liabilities 4 350 4 362 4 410
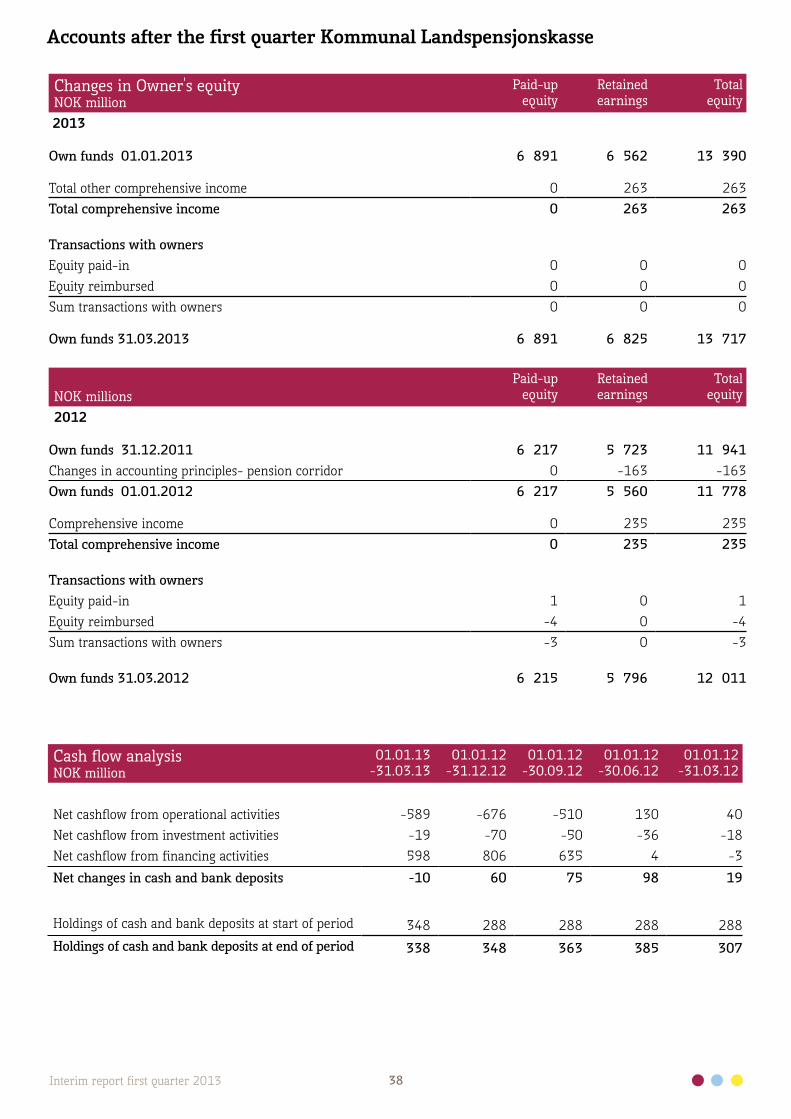
38Interim report first quarter 2013
Cash flow analysisNOK million
01.01.13-31.03.13
01.01.12-31.12.12
01.01.12-30.09.12
01.01.12-30.06.12
01.01.12-31.03.12
Net cashflow from operational activities -589 -676 -510 130 40Net cashflow from investment activities -19 -70 -50 -36 -18Net cashflow from financing activities 598 806 635 4 -3Net changes in cash and bank deposits -10 60 75 98 19
Holdings of cash and bank deposits at start of period 348 288 288 288 288Holdings of cash and bank deposits at end of period 338 348 363 385 307
Accounts after the first quarter Kommunal Landspensjonskasse
Changes in Owner's equityNOK million
Paid-upequity
Retained earnings
Totalequity
2013
Own funds 01.01.2013 6 891 6 562 13 390
Total other comprehensive income 0 263 263Total comprehensive income 0 263 263
Transactions with ownersEquity paid-in 0 0 0Equity reimbursed 0 0 0Sum transactions with owners 0 0 0
Own funds 31.03.2013 6 891 6 825 13 717
NOK millionsPaid-up
equityRetained earnings
Totalequity
2012
Own funds 31.12.2011 6 217 5 723 11 941Changes in accounting principles- pension corridor 0 -163 -163Own funds 01.01.2012 6 217 5 560 11 778
Comprehensive income 0 235 235Total comprehensive income 0 235 235
Transactions with ownersEquity paid-in 1 0 1Equity reimbursed -4 0 -4Sum transactions with owners -3 0 -3
Own funds 31.03.2012 6 215 5 796 12 011

39Interim report first quarter 2013
Note 1 Accounting principlesThe financial statements in this interim report show the accounts for Kommunal Landspensjonskasse (KLP) for the period 1 January 2013 - 31 March 2013. The accounts have not been audited.
Similarly to the annual financial statements for 2012, the interim financial statements have been presented in accor-dance with Regulation 1241 of 16 December 1998: Regulations on annual accounts etc. for insurance companies (the Annual Accounts Regulations) and IAS 34 Interim reporting. Unless otherwise stated the same accounting principles apply to the quarterly accounts as for the 2012 annual accounts.
The interim financial statements do not contain all the information required of full annual financial statements and this interim report ought to be read in conjunction with the annual financial statements for 2012. These may be obtai-ned on application to KLP's head office in Dronning Eufemias gate 10, Oslo, or at www.klp.no.
IAS 1 Financial informationThere is now a requirement that items in other comprehensive income are to be divided into two groups: those that are later to be reclassified through profit or loss and those that are not to be reversed in the result. There are no changes that affect which items are to be included in other comprehensive income.
IAS 19 Employee benefitsThe changes have an effect on the treatment of the Company's benefits plans. The changes mean that all estimate devia-tions are recognised in other comprehensive income as they arise (no corridor); immediate recognition in profit/loss of all costs of previous periods' pensions accumulation; and that interest costs and expected returns on pension assets are replaced by a net interest sum calculated using the discount rate on net pensions liability.
The change in employee benefits has been implemented by reworking comparison figures and the change in principle has had the following effect on the accounting lines:
NOK millions 31.03.2013 31.03.2012 31.12.2012
Capitalized pension liability for own employees incl. corridor N/A 362 386Capitalized without corridor 323 525 323Change 0 163 -63
Income:Pension expense own employees 0 0 226Profit to owners’ equity
Financial position:
0 0 226
Pension liability own employees 0 163 -63Owners’ equity] 0 -163 63
IFRS 13 Measurement of fair valueThis standard defines what is meant by fair value when the term is used in IFRS, provides a uniform description of how fair value is to be determined and what supplementary information is to be provided when fair value is used. The standard does not expand the scope of recognition at fair value. For practical purposes the standard contains change in the note requirements pursuant to IAS 34, and that are included in the Company's Notes 5 and 6. The standard gene-rally expands on calculation of fair value contained in the note requirements in accordance with IFRS 7.
IAS 34There is a requirement on supplementary information on fair value of financial instruments. In practice all the requi-rements in IFRS 7 and IFRS 13 regarding fair value should also apply for interim financial statements.
There are no other new or changed IFRSs or IFRIC interpretations that have come into force for 2013 that have a significant effect on the financial statements. These interim financial statements are otherwise generally presented in accordance with the same principles as the annual financial statements for 2012 and the interim report should there-fore be read in conjunction with the latter.
Notes to the accounts after the first quarter 2013 - KLP
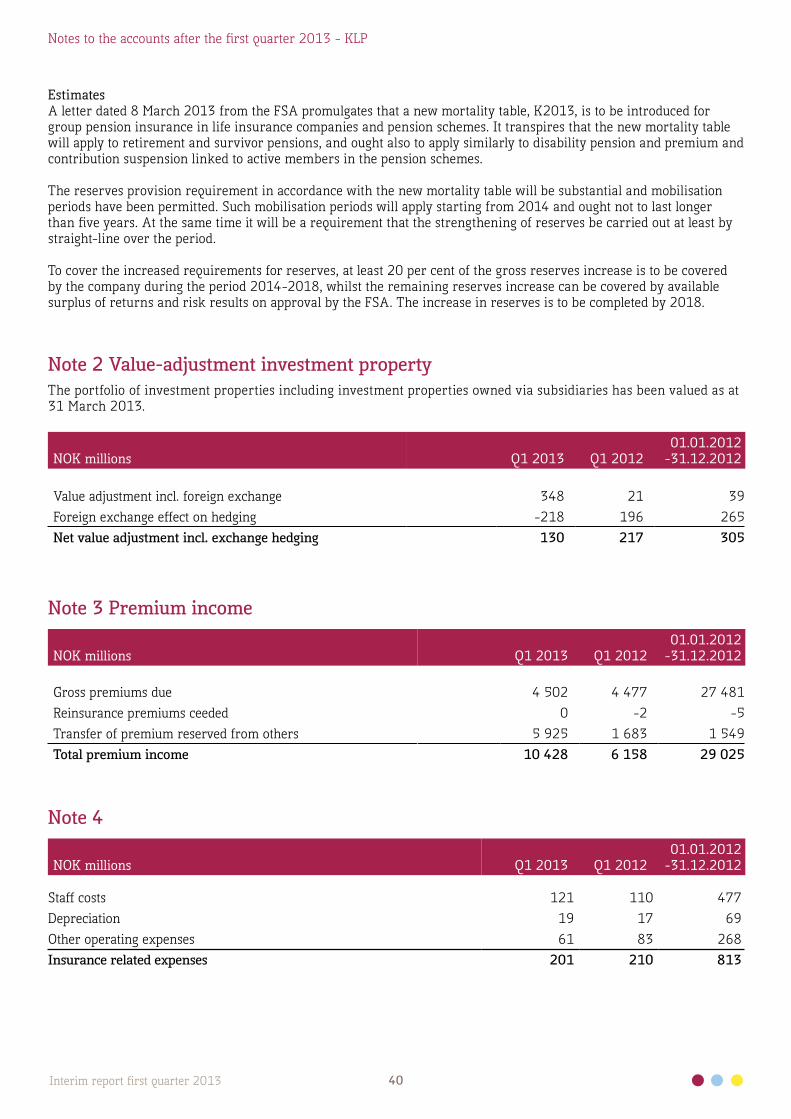
40Interim report first quarter 2013
EstimatesA letter dated 8 March 2013 from the FSA promulgates that a new mortality table, K2013, is to be introduced for group pension insurance in life insurance companies and pension schemes. It transpires that the new mortality table will apply to retirement and survivor pensions, and ought also to apply similarly to disability pension and premium and contribution suspension linked to active members in the pension schemes.
The reserves provision requirement in accordance with the new mortality table will be substantial and mobilisation periods have been permitted. Such mobilisation periods will apply starting from 2014 and ought not to last longer than five years. At the same time it will be a requirement that the strengthening of reserves be carried out at least by straight-line over the period.
To cover the increased requirements for reserves, at least 20 per cent of the gross reserves increase is to be covered by the company during the period 2014-2018, whilst the remaining reserves increase can be covered by available surplus of returns and risk results on approval by the FSA. The increase in reserves is to be completed by 2018.
Note 2 Value-adjustment investment propertyThe portfolio of investment properties including investment properties owned via subsidiaries has been valued as at 31 March 2013.
NOK millions Q1 2013 Q1 201201.01.2012
-31.12.2012
Value adjustment incl. foreign exchange 348 21 39Foreign exchange effect on hedging -218 196 265Net value adjustment incl. exchange hedging 130 217 305
Note 3 Premium income
NOK millions Q1 2013 Q1 201201.01.2012
-31.12.2012
Gross premiums due 4 502 4 477 27 481Reinsurance premiums ceeded 0 -2 -5Transfer of premium reserved from others 5 925 1 683 1 549Total premium income 10 428 6 158 29 025
Note 4
NOK millions Q1 2013 Q1 201201.01.2012
-31.12.2012
Staff costs 121 110 477Depreciation 19 17 69Other operating expenses 61 83 268Insurance related expenses 201 210 813
Notes to the accounts after the first quarter 2013 - KLP

41Interim report first quarter 2013
Note 5 Fair value of financial assets and liabilitiesFair value of investments listed in an active market is based on the current purchase price. A financial instrument is considered to be listed in an active market if the listed price is simply and regularly available from a stock market, dealer, broker, industry grouping, price setting service or regulatory authority, and these prices represent actual and regularly occurring transactions at arm’s length. If the market for the security is not active, or the security is not listed on a stock market or similar, the Company uses valuation techniques to set fair value. These are based for example on information on recently completed transactions carried out on business terms and conditions, reference to trading in similar instruments and pricing using externally collected interest rate curves and spread curves. As far as possible the estimates are based on externally observable market data and rarely on company-specific information. The different financial instruments are thus priced in the following way: a) Shares (listed) Liquid shares are generally valued on the basis of prices provided by an index provider. At the same time prices are compared
between different sources to identify any errors. The following sources are used for shares: Oslo Børs (Oslo Stock Exchange) Morgan Stanley Capital International (MSCI) Reuters Oslo Børs has first priority, followed by MSCI and finally Reuters. b) Shares (unlisted) As far as possible the Company uses the industry recommendations of the Norwegian Mutual Fund Association (NMFA).
Broadly this means the following: The last traded price has the highest priority. If the last traded price lies outside the offer/bid spread in the market, price is
adjusted accordingly. I.e. if the last traded price is below the offer price, price is adjusted up to the offer price. If it is above the bid price it is adjusted down to bid. If the price picture is considered outdated, the price is adjusted according to a market index. The Company has selected the Oslo Børs’s Small Cap Index (OSESX) as an approach for unlisted shares.
For shares on which very little information is available, valuations are obtained from brokers to provide a basis for estimat-
ing an assumed market price. c) Foreign fixed interest securities Foreign fixed interest securities are generally priced on the basis of prices obtained from an index provider. At the same
time prices are compared between several different sources to identify any errors. The following sources are used: JP Morgan Barclays Capital Indices Bloomberg Reuters JP Morgan and Barclays Capital Indices have the first priority (they cover government and corporate bonds respectively). After that
Bloomberg is used ahead of Reuters based on Bloomberg’s price source, Business Valuator Accredited in Litigation (BVAL). BVAL contains verified prices from Bloomberg. The final priority is Reuters.
d) Norwegian fixed interest securities - government Reuters is used as a source for pricing Norwegian government bonds. It is Oslo Børs that provides the price (via Reuters).
The prices are compared with the prices from Bloomberg to reveal any errors. e) Norwegian fixed interest securities - other than government All Norwegian fixed interest securities except government are priced theoretically. A zero coupon curve is used as well as
yield curves for the pricing. Reuters is used as the source for the zero coupon curve from 0 to 10 years. From 12 years and over, Bloomberg is used as the source since Reuters does not provide prices over 10 years.
The yield curves are received from the Norwegian Mutual Fund Association (NMFA). These are based on yield curves col-lected from five different market operators and converted to an average curve.
f) Fixed interest securities issued by foreign enterprises, but denominated in NOK Fair value is calculated in accordance with the same principle as for Norwegian fixed interest securities described above.
Yield curves provided by SE Banken and Swedbank are converted to an average curve used as the basis for calculation of fair value.
Notes to the accounts after the first quarter 2013 - KLP
42Interim report first quarter 2013
g) Futures/FRA/IRF All Company futures contracts are traded on stock exchanges. Reuters is used as a price source. Prices are also obtained
from another source to check the Reuters prices are correct. h) Options Bloomberg is used as the source for pricing stock market traded options. i) Interest rate swaps Interest rate swaps are valued on a model taking account of observable market data such as yield curves and relevant credit
risk premiums. j) Loans secured by mortgage The principles for calculating fair value depend on whether the loans have fixed interest rates or not.
Fair value of fixed interest loans is calculated by discounting contracted cash flows by market interest rates including a relevant risk margin at the end of the reporting period.
Fair value of variable interest rate loans is considered virtually the same as book value since the contract terms and
conditions can be continually changed in step with change in market interest rates. k) Lending to local authorities and enterprises with local government guarantee The receivables are valued using a valuation model that uses relevant credit risk premium adjustments obtained from
the market. For lending to municipalities, county authorities and local government supported projects, observable interest-rate curves and credit interest differential curves are used in a valuation model that discounts future cash flows. The credit risk premiums used in the model calculations are based on quotations from three different price makers. Assessment is made of the quality of the quotations by comparing them with each other and against previously received observations as well as other market information.
For guaranteed loans, fair value is calculated as a discounted cash flow based on the same interest-rate curves as the
direct loans, but the credit margin is initially based on the initial margin. Guarantees are traded bilaterally and not through open marketplaces such as for example a stock market (OTC) and are therefore not priced in the market. Initial margin agreed on the commencement date is the best estimate for market premiums on the same date. Creditworthiness does not change equally for the loan as for the guarantor or the borrower taken individually. The borrower is generally not credit-rated by credit-rating agencies or banks. The guarantor is either a local administration or bank (or both - triple default loan). Statistical analyses indicate that the credit margin on guaranteed loans fluctuates less than on non-guaranteed loans and bonds. Guaranteed loans are therefore not adjusted for credit risk premium before the guarantor has experienced a significant rating change since the initial margin was set. The Company’s lending with both local government and bank guarantee is credit premium adjusted in relation to the initial margin only if both the guarantors have had their credit rating significantly changed since the date of payment.
l) Investments with credit institutions Investments with credit institutions are short-term deposits. Fair value is calculated by discounting contracted cash flows
by market interest rates including a relevant risk margin at the end of the reporting period.
m) Fair value of subordinated loan capital For stock market listed loans where there is considered to be an active market the observable price is used as fair value.
For other loans that are not part of an active market fair value is set based on an internal valuation model based on observable data.
n) Fair value of hybrid Tier 1 securities issued Fair value in this category is determined on the basis of internal valuation models based on external observable data.
o) Private Equity The fair (market) value of the funds is to be based on reported market values, according to International Private Equity
and Venture Capital Valuation Guidelines (IPEV Guidelines). These guidelines are set by the European Private Equity and Venture Capital Association (EVCA) and based on the principle of approximate market valuation of the companies.
Notes to the accounts after the first quarter 2013 - KLP
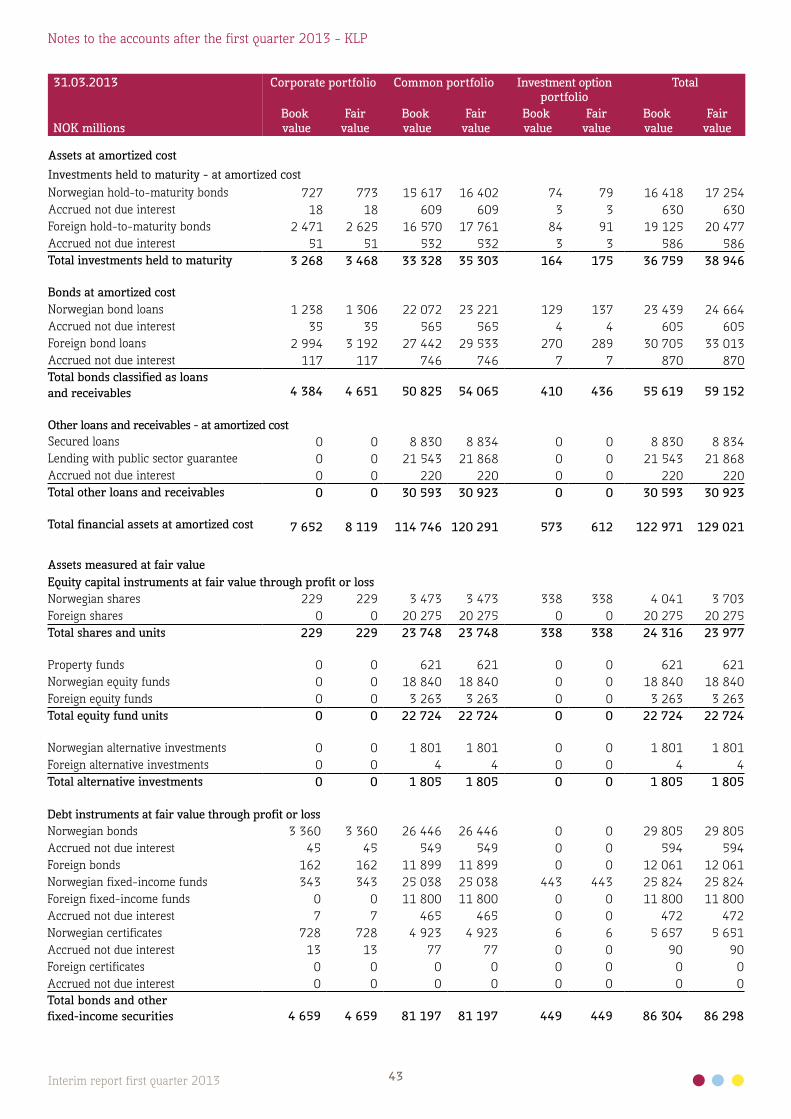
43Interim report first quarter 2013
31.03.2013 Corporate portfolio Common portfolio Investment optionportfolio
Total
NOK millionsBook value
Fairvalue
Book value
Fairvalue
Book value
Fairvalue
Book value
Fairvalue
Assets at amortized costInvestments held to maturity - at amortized costNorwegian hold-to-maturity bonds 727 773 15 617 16 402 74 79 16 418 17 254Accrued not due interest 18 18 609 609 3 3 630 630Foreign hold-to-maturity bonds 2 471 2 625 16 570 17 761 84 91 19 125 20 477Accrued not due interest 51 51 532 532 3 3 586 586Total investments held to maturity 3 268 3 468 33 328 35 303 164 175 36 759 38 946
Bonds at amortized costNorwegian bond loans 1 238 1 306 22 072 23 221 129 137 23 439 24 664Accrued not due interest 35 35 565 565 4 4 605 605Foreign bond loans 2 994 3 192 27 442 29 533 270 289 30 705 33 013Accrued not due interest 117 117 746 746 7 7 870 870Total bonds classified as loans and receivables 4 384 4 651 50 825 54 065 410 436 55 619 59 152
Other loans and receivables - at amortized costSecured loans 0 0 8 830 8 834 0 0 8 830 8 834Lending with public sector guarantee 0 0 21 543 21 868 0 0 21 543 21 868Accrued not due interest 0 0 220 220 0 0 220 220Total other loans and receivables 0 0 30 593 30 923 0 0 30 593 30 923
Total financial assets at amortized cost 7 652 8 119 114 746 120 291 573 612 122 971 129 021
Assets measured at fair valueEquity capital instruments at fair value through profit or lossNorwegian shares 229 229 3 473 3 473 338 338 4 041 3 703Foreign shares 0 0 20 275 20 275 0 0 20 275 20 275Total shares and units 229 229 23 748 23 748 338 338 24 316 23 977
Property funds 0 0 621 621 0 0 621 621Norwegian equity funds 0 0 18 840 18 840 0 0 18 840 18 840Foreign equity funds 0 0 3 263 3 263 0 0 3 263 3 263Total equity fund units 0 0 22 724 22 724 0 0 22 724 22 724
Norwegian alternative investments 0 0 1 801 1 801 0 0 1 801 1 801Foreign alternative investments 0 0 4 4 0 0 4 4Total alternative investments 0 0 1 805 1 805 0 0 1 805 1 805
Debt instruments at fair value through profit or lossNorwegian bonds 3 360 3 360 26 446 26 446 0 0 29 805 29 805Accrued not due interest 45 45 549 549 0 0 594 594Foreign bonds 162 162 11 899 11 899 0 0 12 061 12 061Norwegian fixed-income funds 343 343 25 038 25 038 443 443 25 824 25 824Foreign fixed-income funds 0 0 11 800 11 800 0 0 11 800 11 800Accrued not due interest 7 7 465 465 0 0 472 472Norwegian certificates 728 728 4 923 4 923 6 6 5 657 5 651Accrued not due interest 13 13 77 77 0 0 90 90Foreign certificates 0 0 0 0 0 0 0 0Accrued not due interest 0 0 0 0 0 0 0 0Total bonds and other fixed-income securities 4 659 4 659 81 197 81 197 449 449 86 304 86 298
Notes to the accounts after the first quarter 2013 - KLP

44Interim report first quarter 2013
31.03.2013 Corporate portfolio Common portfolio Investment optionportfolio
Total
NOK millionsBook value
Fairvalue
Book value
Fairvalue
Book value
Fairvalue
Book value
Fairvalue
Norwegian loans and receivables 207 207 10 018 10 018 25 25 10 250 10 250Foreign loans and receivables 235 235 2 585 2 585 8 8 2 827 2 827Total loans and receivables 442 442 12 603 12 603 32 32 13 077 13 077
DerivativesInterest rate swaps 102 102 398 398 0 0 501 501Share options 0 0 185 185 1 1 186 186Forward exchange contracts 0 0 29 29 0 0 30 30Total financial derivatives classified as assets 102 102 612 612 2 2 716 716
Other financial assets 0 0 374 374 1 1 376 376
Total financial assets valued at fair value 5 431 5 431 143 063 143 063 823 823 149 318 148 973
Investment propertiy 974 974 0 0 0 0 974 974Investments in subsidaries 3 667 3 667 0 0 0 0 3 667 3 667
Total investments 17 724 18 191 257 809 263 354 1 396 1 434 276 929 282 635
LiabilitiesDerivativesInterest rate swaps 0 0 -287 -287 0 0 -287 -287Interest rate futures (IRF) 0 0 0 0 0 0 0 0Interest rate and currency swaps 0 0 -596 -596 -2 -2 -598 -598Forward exchange contracts -4 -4 -348 -348 -1 -1 -353 -353Total financial derivatives classified as liabilities -4 -4 -1 231 -1 231 -3 -3 -1 238 -1 238
Subordinated loan capitalPerpetual subordinated loan capital -2 952 -3 004 0 0 0 0 -2 952 -3 004Hybrid Tier 1 securities -1 017 -1 018 0 0 0 0 -1 017 -1 018Total subordinated loan capital etc. -3 969 -4 022 0 0 0 0 -3 969 -4 022
Debt to credit institutionsNorwegian call money 0 0 -163 -163 0 0 -163 -163Foreign call money -69 -69 -279 -279 0 0 -348 -348Total debt to credit institutions -69 -69 -441 -441 -1 -1 -511 -511
31.03.2012 Corporate portfolio Common portfolio Investment optionportfolio
Total
NOK millionsBook value
Fairvalue
Book value
Fairvalue
Book value
Fairvalue
Book value
Fairvalue
Assets at amortized cost
Investments held to maturity - at amortized costNorwegian hold-to-maturity bonds 627 648 15 488 16 223 74 79 16 189 16 949Accrued not due interest 17 17 609 609 3 3 628 628Foreign hold-to-maturity bonds 2 508 2 652 19 436 20 405 111 116 22 056 23 173Accrued not due interest 52 52 632 632 4 4 688 688Total investments held to maturity 3 204 3 368 36 165 37 869 192 201 39 561 41 438
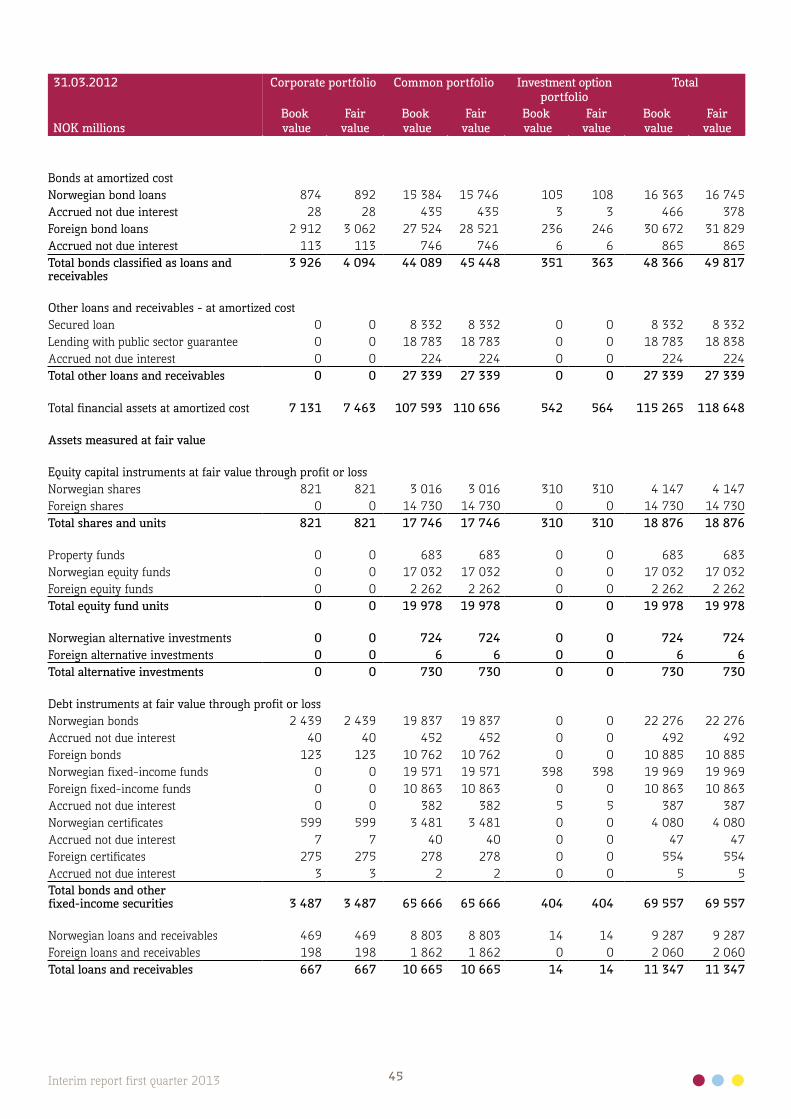
45Interim report first quarter 2013
31.03.2012 Corporate portfolio Common portfolio Investment optionportfolio
Total
NOK millionsBook value
Fairvalue
Book value
Fairvalue
Book value
Fairvalue
Book value
Fairvalue
Bonds at amortized costNorwegian bond loans 874 892 15 384 15 746 105 108 16 363 16 745Accrued not due interest 28 28 435 435 3 3 466 378Foreign bond loans 2 912 3 062 27 524 28 521 236 246 30 672 31 829Accrued not due interest 113 113 746 746 6 6 865 865Total bonds classified as loans and receivables
3 926 4 094 44 089 45 448 351 363 48 366 49 817
Other loans and receivables - at amortized costSecured loan 0 0 8 332 8 332 0 0 8 332 8 332Lending with public sector guarantee 0 0 18 783 18 783 0 0 18 783 18 838Accrued not due interest 0 0 224 224 0 0 224 224Total other loans and receivables 0 0 27 339 27 339 0 0 27 339 27 339
Total financial assets at amortized cost 7 131 7 463 107 593 110 656 542 564 115 265 118 648
Assets measured at fair value
Equity capital instruments at fair value through profit or lossNorwegian shares 821 821 3 016 3 016 310 310 4 147 4 147Foreign shares 0 0 14 730 14 730 0 0 14 730 14 730Total shares and units 821 821 17 746 17 746 310 310 18 876 18 876
Property funds 0 0 683 683 0 0 683 683Norwegian equity funds 0 0 17 032 17 032 0 0 17 032 17 032Foreign equity funds 0 0 2 262 2 262 0 0 2 262 2 262Total equity fund units 0 0 19 978 19 978 0 0 19 978 19 978
Norwegian alternative investments 0 0 724 724 0 0 724 724Foreign alternative investments 0 0 6 6 0 0 6 6Total alternative investments 0 0 730 730 0 0 730 730
Debt instruments at fair value through profit or lossNorwegian bonds 2 439 2 439 19 837 19 837 0 0 22 276 22 276Accrued not due interest 40 40 452 452 0 0 492 492Foreign bonds 123 123 10 762 10 762 0 0 10 885 10 885Norwegian fixed-income funds 0 0 19 571 19 571 398 398 19 969 19 969Foreign fixed-income funds 0 0 10 863 10 863 0 0 10 863 10 863Accrued not due interest 0 0 382 382 5 5 387 387Norwegian certificates 599 599 3 481 3 481 0 0 4 080 4 080Accrued not due interest 7 7 40 40 0 0 47 47Foreign certificates 275 275 278 278 0 0 554 554Accrued not due interest 3 3 2 2 0 0 5 5Total bonds and other fixed-income securities 3 487 3 487 65 666 65 666 404 404 69 557 69 557
Norwegian loans and receivables 469 469 8 803 8 803 14 14 9 287 9 287Foreign loans and receivables 198 198 1 862 1 862 0 0 2 060 2 060Total loans and receivables 667 667 10 665 10 665 14 14 11 347 11 347
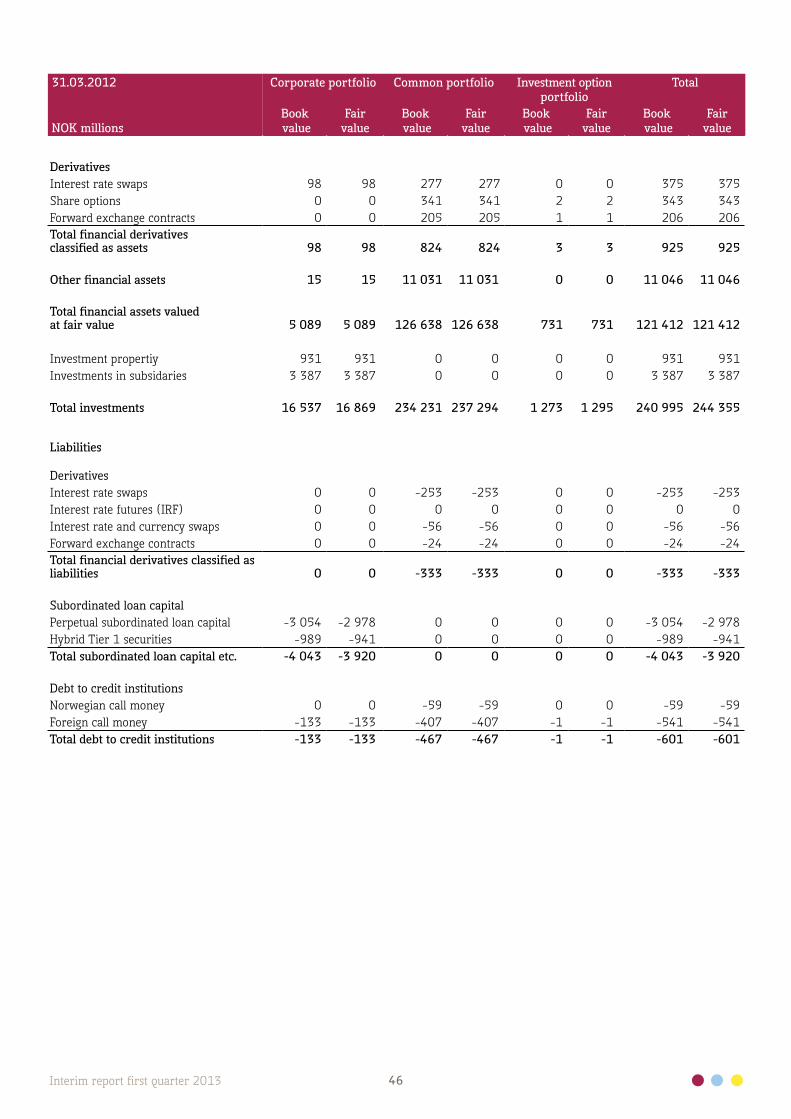
46Interim report first quarter 2013
31.03.2012 Corporate portfolio Common portfolio Investment optionportfolio
Total
NOK millionsBook value
Fairvalue
Book value
Fairvalue
Book value
Fairvalue
Book value
Fairvalue
DerivativesInterest rate swaps 98 98 277 277 0 0 375 375Share options 0 0 341 341 2 2 343 343Forward exchange contracts 0 0 205 205 1 1 206 206Total financial derivatives classified as assets 98 98 824 824 3 3 925 925
Other financial assets 15 15 11 031 11 031 0 0 11 046 11 046
Total financial assets valued at fair value 5 089 5 089 126 638 126 638 731 731 121 412 121 412
Investment propertiy 931 931 0 0 0 0 931 931Investments in subsidaries 3 387 3 387 0 0 0 0 3 387 3 387
Total investments 16 537 16 869 234 231 237 294 1 273 1 295 240 995 244 355
Liabilities
DerivativesInterest rate swaps 0 0 -253 -253 0 0 -253 -253Interest rate futures (IRF) 0 0 0 0 0 0 0 0Interest rate and currency swaps 0 0 -56 -56 0 0 -56 -56Forward exchange contracts 0 0 -24 -24 0 0 -24 -24Total financial derivatives classified as liabilities 0 0 -333 -333 0 0 -333 -333
Subordinated loan capitalPerpetual subordinated loan capital -3 054 -2 978 0 0 0 0 -3 054 -2 978Hybrid Tier 1 securities -989 -941 0 0 0 0 -989 -941Total subordinated loan capital etc. -4 043 -3 920 0 0 0 0 -4 043 -3 920
Debt to credit institutionsNorwegian call money 0 0 -59 -59 0 0 -59 -59Foreign call money -133 -133 -407 -407 -1 -1 -541 -541Total debt to credit institutions -133 -133 -467 -467 -1 -1 -601 -601

47Interim report first quarter 2013
Note 6 Fair value hierarchy31.03.2013NOK millions Level 1 Level 2 Level 3 Total
Assets
Corporate portfolioBonds and other fixed-income securities 747 3 912 0 4 659
Certificates 0 741 0 741Bonds 396 3 171 0 3 567Fixed-income funds 350 0 0 350
Loans and receivables 415 27 0 442Shares and units 0 223 6 229
Shares 0 223 6 229Financial derivatives 0 102 0 102Other financial assets 0 0 0 0
Total corporate portfolio 1 161 4 264 6 5 431
Common portfolioBonds and other fixed-income securities 52 848 28 348 0 81 197
Certificates 0 5 000 0 5 000Bonds 15 545 23 348 0 38 894Fixed-income funds 37 303 0 0 37 303
Loans and receivables 8 549 4 067 0 12 616Shares and units 42 829 1 828 3 606 48 264
Shares 22 899 37 813 23 748Equity funds 19 310 0 2 794 22 103Property funds 621 0 0 621Special funds 0 1 792 0 1 792
Financial derivatives 0 612 0 612Other financial assets 0 374 0 374
Total common portfolio 104 227 35 231 3 606 143 064
Investment option portfolioBonds and other fixed-income securities 449 0 0 449
Fixed-income funds 449 0 0 449Loans and receivables 19 0 0 19Shares and units 338 13 0 352
Equity funds 338 0 0 338Special funds 0 13 0 13
Financial derivatives 0 2 0 2Other financial assets 0 1 0 1
Total investment option portfolio 806 16 0 823
Total financial assets valued at fair value 106 194 39 511 3 612 149 318
Liabilities
Corporate portfolioFinancial derivatives 0 4 0 4Debt to credit institutions 69 0 0 69Total corporate portfolio 69 4 0 72
Common portfolioFinancial derivatives 0 1 231 0 1 231Debt to credit institutions 441 0 0 441Total common portfolio 441 1 231 0 1 673
Investment option portfolioFinancial derivatives 0 3 0 3Debt to credit institutions 0 0 0 0Total investment option portfolio 0 3 0 3
Total financial liabilities at fair value 511 1 238 0 1 748

48Interim report first quarter 2013
Note 6 Fair value hierarchy, continued31.03.2012NOK millions Level 1 Level 2 Level 3 Total
Assets
Corporate portfolioBonds and other fixed-income securities 308 3 179 0 3 487
Certificates 0 885 0 885Bonds 308 2 294 0 2 602
Loans and receivables 641 26 0 667Shares and units 0 810 11 821
Shares 0 279 11 290Special funds 0 531 0 531
Financial derivatives 0 98 0 98Other financial assets 0 15 0 15
Total corporate portfolio 949 4 129 11 5 089
Common portfolioBonds and other fixed-income securities 43 491 22 175 0 65 666
Certificates 0 3 800 0 3 800Bonds 12 676 18 375 0 31 050Fixed-income funds 30 815 0 0 30 815
Loans and receivables 7 088 3 578 0 10 665Shares and units 34 954 779 2 720 38 453
Shares 17 240 50 456 17 746Equity funds 17 031 0 2 264 19 295Property funds 683 0 0 683Special funds 0 730 0 730
Financial derivatives 0 824 0 824Other financial assets 0 11 031 0 11 031
Total common portfolio 85 532 38 386 2 720 126 638
Investment option portfolioBonds and other fixed-income securities 404 0 0 404
Fixed-income funds 404 0 0 404Loans and receivables 14 0 0 14Shares and units 310 0 0 310
Equity funds 310 0 0 310Financial derivatives 0 3 0 3Other financial assets 0 0 0 0
Total investment option portfolio 728 3 0 731
Total financial assets valued at fair value 87 210 42 518 2 730 132 458
Liabilities
Corporate portfolioFinancial derivatives 0 0 0 0Debt to credit institutions 133 0 0 133Total corporate portfolio 133 0 0 133
Common portfolioFinancial derivatives 0 333 0 333Debt to credit institutions 467 0 0 467Total common portfolio 467 333 0 800
Investment option portfolioFinancial derivatives 0 0 0 0Debt to credit institutions 1 0 0 1Total investment option portfolio 1 0 0 1
Total financial liabilities at fair value 601 333 0 934
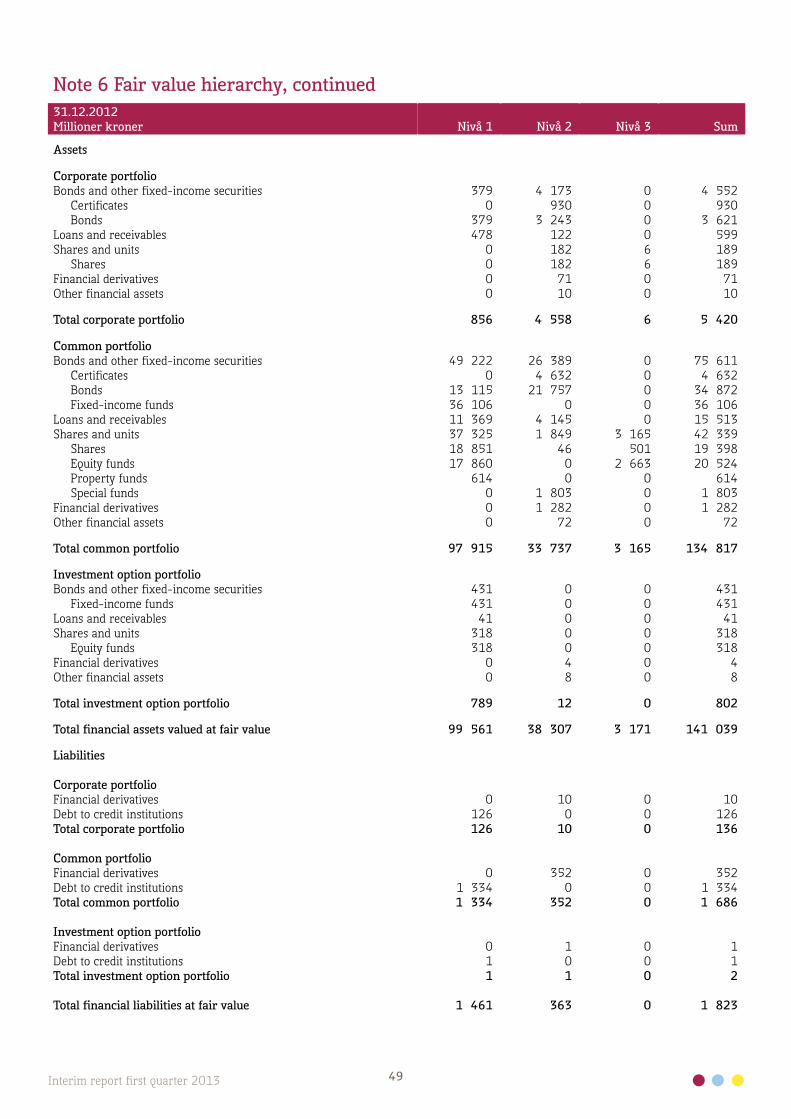
49Interim report first quarter 2013
Note 6 Fair value hierarchy, continued31.12.2012Millioner kroner Nivå 1 Nivå 2 Nivå 3 Sum
Assets
Corporate portfolioBonds and other fixed-income securities 379 4 173 0 4 552
Certificates 0 930 0 930Bonds 379 3 243 0 3 621
Loans and receivables 478 122 0 599Shares and units 0 182 6 189
Shares 0 182 6 189Financial derivatives 0 71 0 71Other financial assets 0 10 0 10
Total corporate portfolio 856 4 558 6 5 420
Common portfolioBonds and other fixed-income securities 49 222 26 389 0 75 611
Certificates 0 4 632 0 4 632Bonds 13 115 21 757 0 34 872Fixed-income funds 36 106 0 0 36 106
Loans and receivables 11 369 4 145 0 15 513Shares and units 37 325 1 849 3 165 42 339
Shares 18 851 46 501 19 398Equity funds 17 860 0 2 663 20 524Property funds 614 0 0 614Special funds 0 1 803 0 1 803
Financial derivatives 0 1 282 0 1 282Other financial assets 0 72 0 72
Total common portfolio 97 915 33 737 3 165 134 817
Investment option portfolioBonds and other fixed-income securities 431 0 0 431
Fixed-income funds 431 0 0 431Loans and receivables 41 0 0 41Shares and units 318 0 0 318
Equity funds 318 0 0 318Financial derivatives 0 4 0 4Other financial assets 0 8 0 8
Total investment option portfolio 789 12 0 802
Total financial assets valued at fair value 99 561 38 307 3 171 141 039
Liabilities
Corporate portfolioFinancial derivatives 0 10 0 10Debt to credit institutions 126 0 0 126Total corporate portfolio 126 10 0 136
Common portfolioFinancial derivatives 0 352 0 352Debt to credit institutions 1 334 0 0 1 334Total common portfolio 1 334 352 0 1 686
Investment option portfolioFinancial derivatives 0 1 0 1Debt to credit institutions 1 0 0 1Total investment option portfolio 1 1 0 2
Total financial liabilities at fair value 1 461 363 0 1 823

50Interim report first quarter 2013
Note 6 Fair value hierarchy, continued
Changes in Level 3 shares, unlistedCorporate portfolio
Book value31.03.2013
Book value31.03.2012
Book value31.12.2012
Opening balance 1 January 6 11 11Sold 0 0 0Bought 0 0 0Unrealised changes 0 0 -4Closing balance 31.03/31.12. 6 11 6Realised gains/losses 0 0 0
Unrealized changes are reflected in the line “Value changes on investments" in the corporate portfolio in the income statement.
Changes in Level 3 shares, unlistedCommon portfolio
Book value31.03.2013
Book value31.03.2012
Book value31.12.2012
Opening balance 1 January 353 340 340Sold 0 0 -9Bought 308 0 0Unrealised changes 0 0 22Closing balance 31.03/31.12. 661 340 353Realised gains/losses 0 0 3
Unrealized changes are reflected in the line “Value changes on investments" in the corporate portfolio in the income statement.
Changes in Level 3 shares, Private EquityCommon portfolio
Book value31.03.2013
Book value31.03.2012
Book value31.12.2012
Opening balance 1 January 2 812 2 180 2 180Sold 0 -40 -413Bought 0 246 874Unrealised changes 133 -5 171Closing balance 31.03/31.12. 2 946 2 381 2 812Realised gains/losses -5 -15 51
Total Level 3 3 612 2 732 3 171
Unrealized changes are reflected in the line “Value changes on investments" in the corporate portfolio in the income statement.
Fair value shall be a representative price based on what a corresponding asset or liability would have been traded for on normal market terms and conditions. Highest quality in regard to fair value is based on listed prices in an active market. A financial instrument is considered to be listed in an active market if the listed price is simply and regularly available from a stock market, dealer, broker, industry grouping, price setting service or regulatory authority, and these prices represent actual and regularly occurring transactions at arm’s length.
Level 1: Instruments in this level obtain fair value from listed prices in an active market for identical assets or liabilities to which the entity has access at the reporting date. Examples of instruments at Level 1 are stock market listed securities.
Level 2: Instruments at this level are not considered to have an active market. Fair value is obtained from observable market data: this mainly includes prices based on identical instruments, but where the instrument does not have a high enough trading frequency, as well as prices based on corresponding assets and price leading indicators that can be confirmed from market information. Example instruments at Level 2 are fixed interest securities priced on the basis of interest rate paths.For more information concerning pricing of Level 2 instruments see Note 5 for the different classes found in this level.
Level 3: Instruments at Level 3 contain no observable market data or are traded in markets considered to be inactive. The price is based generally on discrete calculations where the actual fair value may deviate if the instrument were to be traded. The instruments covered by Level 3 in KLP are unlisted shares and private equity investments.For more information concerning pricing of Level 3 instruments see Note 5 for the different classes found in this level.
Note 5 provides information on fair value of assets and liabilities measured at amortized cost. The level-based distribution of these items will be as follows: assets classified as hold to maturity will be included in Level 1 , lending, and loans and receivables will be included in Level 2. Liabilities, measured at amortized cost, will be distributed as follows: subordinated loan capital distributed at Levels 1 and Level 2, the hybrid Tier 1 securities will be distributed at Level 2, debt to credit institutions will be distributed at Levels 1. For information concerning pricing of these interest-bearing securities see Note 5. No sensitivity analysis has been carried out on securities included in Level 3. A change in the variables of the pricing is considered of little significance. On a general basis, a change in the pricing of 5% produces a change in the value of NOK 181 million as at 31 March 2013 and NOK 137 million as at 31 March 2012 at Level 3.
Securities have not been moved between the levels in the fair value hierarchy. The values at the end of the reporting period provide the basis for any movement between the levels.

51Interim report first quarter 2013
Note 7 Insurance liabilities
NOK millions 31.03.2013 31.03.2012 31.12.2012
Premium reserve - ordinary tariff 253 226 226 605 244 208Premium reserve - longevity reinforcement 4 755 0 4 400Premium fund, buffer fund and pensioners' surplus fund 3 899 2 667 1 528Supplementary reserves 12 296 12 235 12 293Securities adjustment fund 12 567 8 575 9 288Other provisions 217 165 212Unallocated result - insurance contracts in the common portfolio 667 1 263 0Allocated result - insurance contracts in the common portfolio 0 0 2 366Insurance liabilities in life insurance - contractual liabilities 287 628 251 509 274 294
Premium reserve - ordinary tariff 1 459 1 276 1 361Premium reserve - longevity reinforcement 89 0 60Premium fund, buffer fund and pensioners' surplus fund 45 35 45Supplementary reserves 83 85 83Unallocated result - insurance contracts in the unit-linked portfolio 1 38 0Insurance-related provisions - investment option portfolio 1 677 1 434 1 548
Reserves increase K2013
NOK millions
Estimated gross reserves increase for new tariff K2013: 10 700Reserves increase as at 31.12.2012 4 460Additional reserves increase Q1 2013 1 384Total reserves increase as at 31.03.2013 4 844Remaining reserves increase requirement 5 856
¹Reserves increase is calculated based on the results of Q1, but is not binding on the Group result for the year.

Head officeDronning Eufemias gate 10,0103 Oslo, NorwayTel: 22 03 35 00Fax: 22 03 36 00
Regional officeVågsallmenningen 16 BergenNorwayTel: 05554Fax: 55 54 85 90
Kommunal Landspensjonskasse gjensidig forsikringsselskapOrg.nr. 938 708 606P.O. Box 400 Sentrum, 0103 OsloE-mail: [email protected]