interim group report ih1 2011 hapag-lloyd holding … · interim group report ih1 2011 hapag-lloyd...
TRANSCRIPT
interim group report i H1 2011
Hapag-lloyd Holding ag · 1 January to 30 June 2011
2
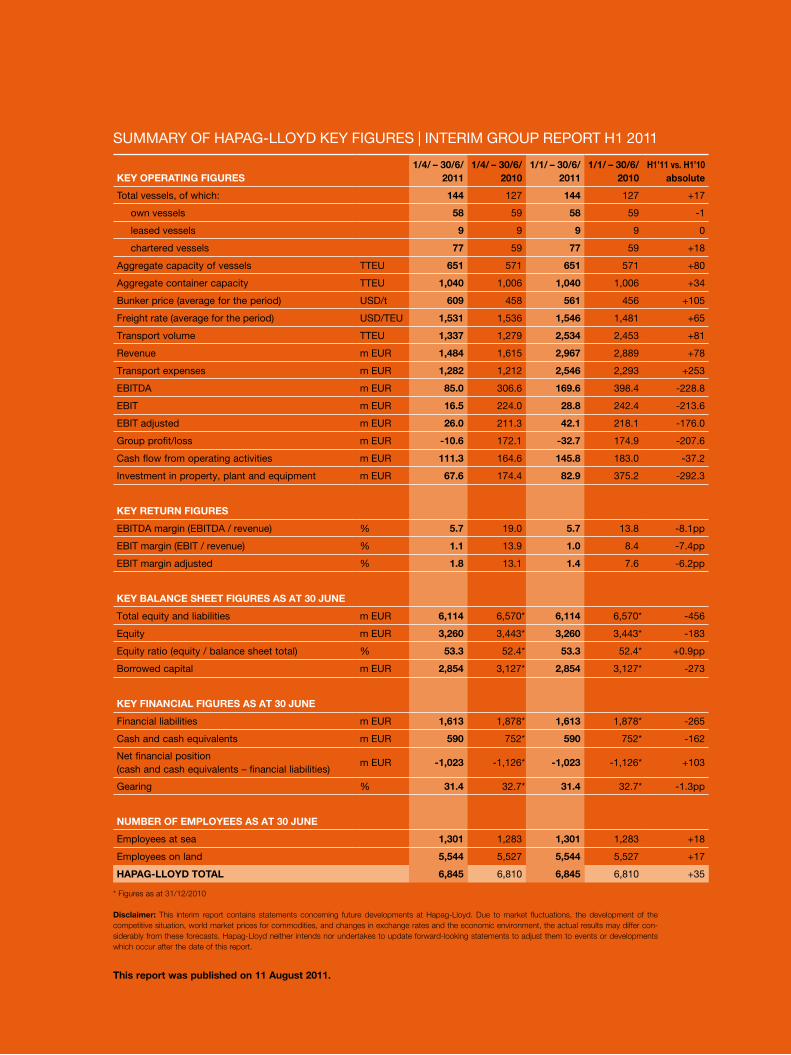
key operating figures1/4/ – 30/6/
20111/4/ – 30/6/
20101/1/ – 30/6/
20111/1/ – 30/6/
2010H1’11 vs. H1’10
absolute
total vessels, of which: 144 127 144 127 +17
own vessels 58 59 58 59 -1
leased vessels 9 9 9 9 0
chartered vessels 77 59 77 59 +18
aggregate capacity of vessels tteu 651 571 651 571 +80
aggregate container capacity tteu 1,040 1,006 1,040 1,006 +34
Bunker price (average for the period) uSd/t 609 458 561 456 +105
Freight rate (average for the period) uSd/teu 1,531 1,536 1,546 1,481 +65
transport volume tteu 1,337 1,279 2,534 2,453 +81
revenue m eur 1,484 1,615 2,967 2,889 +78
transport expenses m eur 1,282 1,212 2,546 2,293 +253
eBitda m eur 85.0 306.6 169.6 398.4 -228.8
eBit m eur 16.5 224.0 28.8 242.4 -213.6
eBit adjusted m eur 26.0 211.3 42.1 218.1 -176.0
group profit/loss m eur -10.6 172.1 -32.7 174.9 -207.6
Cash flow from operating activities m eur 111.3 164.6 145.8 183.0 -37.2
investment in property, plant and equipment m eur 67.6 174.4 82.9 375.2 -292.3
key return figures
eBitda margin (eBitda / revenue) % 5.7 19.0 5.7 13.8 -8.1pp
eBit margin (eBit / revenue) % 1.1 13.9 1.0 8.4 -7.4pp
eBit margin adjusted % 1.8 13.1 1.4 7.6 -6.2pp
key balance sHeet figures as at 30 June
total equity and liabilities m eur 6,114 6,570* 6,114 6,570* -456
equity m eur 3,260 3,443* 3,260 3,443* -183
equity ratio (equity / balance sheet total) % 53.3 52.4* 53.3 52.4* +0.9pp
Borrowed capital m eur 2,854 3,127* 2,854 3,127* -273
key financial figures as at 30 June
Financial liabilities m eur 1,613 1,878* 1,613 1,878* -265
Cash and cash equivalents m eur 590 752* 590 752* -162
net financial position (cash and cash equivalents – financial liabilities)
m eur -1,023 -1,126* -1,023 -1,126* +103
gearing % 31.4 32.7* 31.4 32.7* -1.3pp
number of employees as at 30 June
employees at sea 1,301 1,283 1,301 1,283 +18
employees on land 5,544 5,527 5,544 5,527 +17
Hapag-lloyd total 6,845 6,810 6,845 6,810 +35
* Figures as at 31/12/2010
Summary oF Hapag-lloyd key FigureS | interim group report H1 2011
disclaimer: This interim report contains statements concerning future developments at Hapag-Lloyd. Due to market fluctuations, the development of the competitive situation, world market prices for commodities, and changes in exchange rates and the economic environment, the actual results may differ con-siderably from these forecasts. Hapag-Lloyd neither intends nor undertakes to update forward-looking statements to adjust them to events or developments which occur after the date of this report.
this report was published on 11 august 2011.
3
Hapag-lloyd interim group report H1 · 2011 i contents
ContentS
4 Hapag-lloyd’s capital market activities
6 interim group management report
6 Business and company fundamentals
6 Group structure
6 Corporate management
8 Operating activities
8 Company objectives and strategy
8 Business development
8 General economic conditions
9 Sector-specific conditions
10 Important performance indicators
14 Group earnings position
17 Group financial and net asset position
20 Risk and opportunity report
21 Events after the balance sheet date
21 Outlook
22 interim consolidated financial statements
22 Consolidated income statement
23 Consolidated statement of comprehensive income
24 Consolidated statement of financial position
26 Consolidated statement of changes in equity
27 Condensed consolidated statement of cash flows
28 condensed notes to the interim consolidated financial statements
28 Notes on the principles and methods underlying the interim consolidated
financial statements
30 Selected notes to the consolidated income statement
31 Selected notes to the consolidated statement of financial position
33 Notes to the condensed consolidated statement of cash flows
33 Other notes
34 Significant transactions after the balance sheet date
36 financial calendar, imprint
4
Hapag-lloyd’s capital market activities i Hapag-lloyd interim group report H1 · 2011
Hapag-lloyd’S Capital market aCtivitieS
Risks of a slowdown in growth and debt crisis weigh on global capital markets
High commodity prices and the possible negative impact on the global economic upturn dampened the
upswing in share prices on international stock markets in the second quarter. According to information pro-
vided by Ben Bernanke, Chairman of the Federal Reserve, the US economy grew less in the first six months
of 2011 than was originally forecast. Growth in the world’s largest economy is not expected to strengthen
until 2012. Investors were also perturbed by the USA’s high budget deficit and the worsening of the debt
crisis in Europe. The good earnings trends experienced by many companies and the high liquidity at hand
had little impact on the course of the international stock markets. As a result, on 30 June 2011 the most
important international stock market indices closed below their yearly highs reached in May.
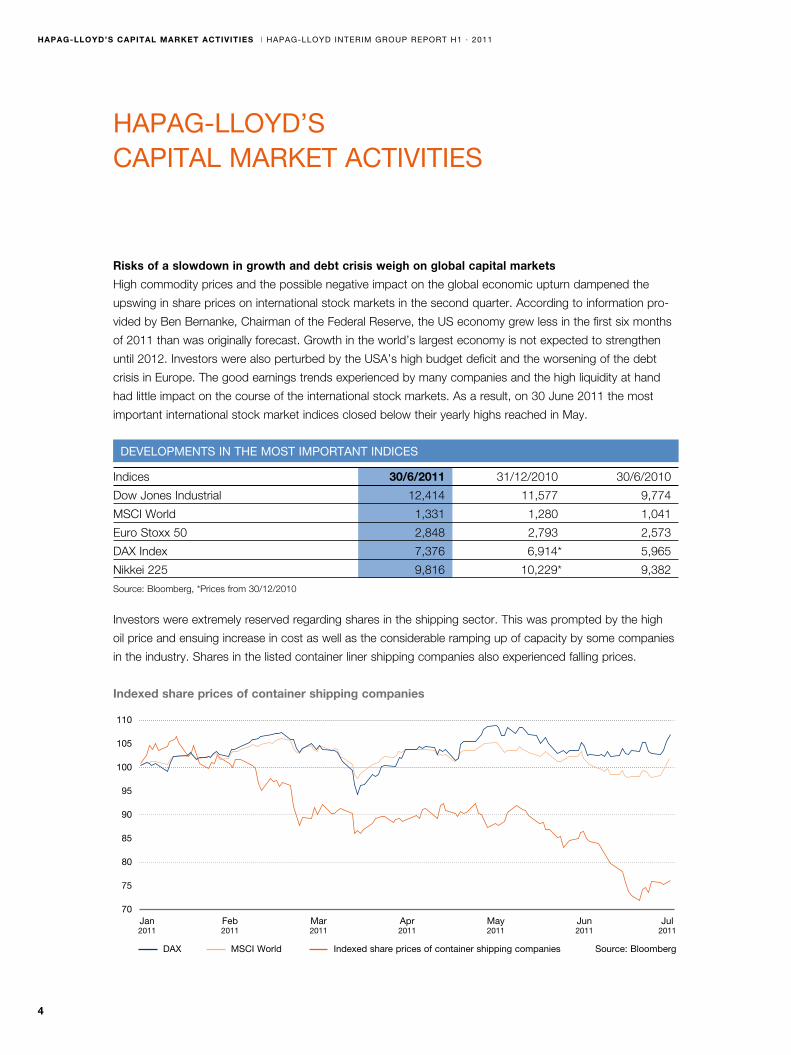
Investors were extremely reserved regarding shares in the shipping sector. This was prompted by the high
oil price and ensuing increase in cost as well as the considerable ramping up of capacity by some companies
in the industry. Shares in the listed container liner shipping companies also experienced falling prices.
110
105
100
95
90
85
80
75
70 Jan Feb mar apr may Jun Jul 2011 2011 2011 2011 2011 2011 2011
indexed share prices of container shipping companies
daX mSCi World indexed share prices of container shipping companies Source: Bloomberg
developmentS in tHe moSt important indiCeS
Indices 30/6/2011 31/12/2010 30/6/2010
Dow Jones Industrial 12,414 11,577 9,774
MSCI World 1,331 1,280 1,041
Euro Stoxx 50 2,848 2,793 2,573
DAX Index 7,376 6,914* 5,965
Nikkei 225 9,816 10,229* 9,382
Source: Bloomberg, *Prices from 30/12/2010
5
Hapag-lloyd interim group report H1 · 2011 i Hapag-lloyd’s capital market activities
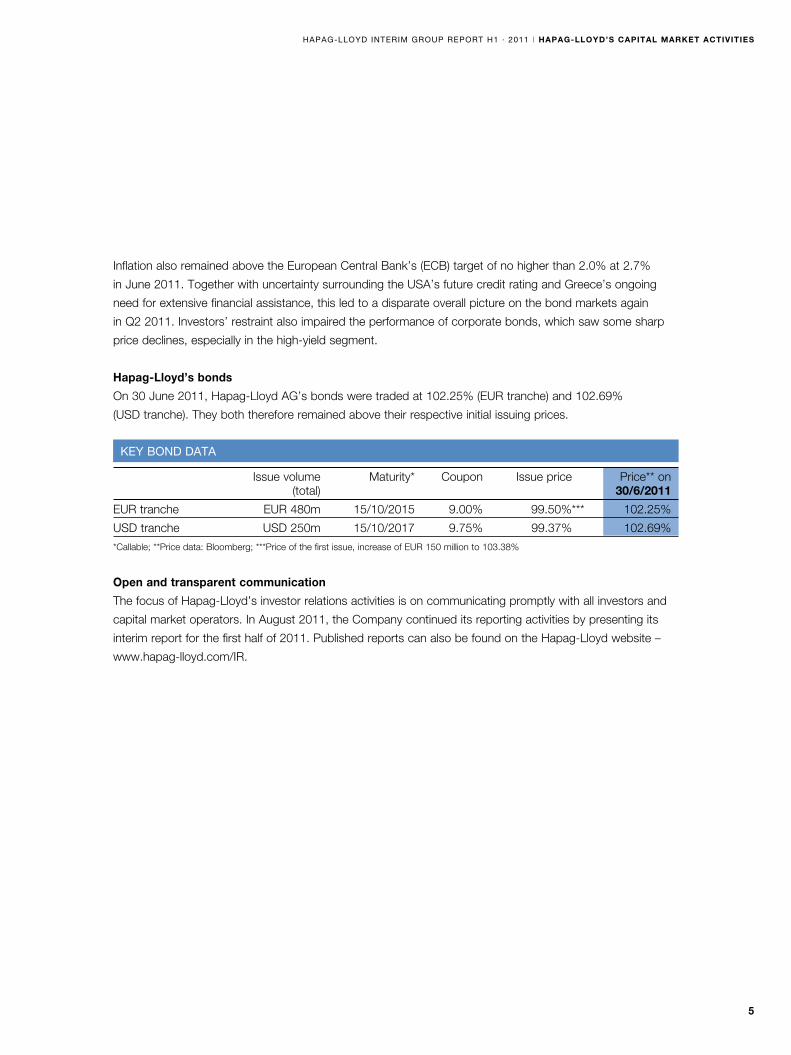
Inflation also remained above the European Central Bank’s (ECB) target of no higher than 2.0% at 2.7%
in June 2011. Together with uncertainty surrounding the USA’s future credit rating and Greece’s ongoing
need for extensive financial assistance, this led to a disparate overall picture on the bond markets again
in Q2 2011. Investors’ restraint also impaired the performance of corporate bonds, which saw some sharp
price declines, especially in the high-yield segment.
Hapag-Lloyd’s bonds
On 30 June 2011, Hapag-Lloyd AG’s bonds were traded at 102.25% (EUR tranche) and 102.69%
(USD tranche). They both therefore remained above their respective initial issuing prices.
Open and transparent communication
The focus of Hapag-Lloyd’s investor relations activities is on communicating promptly with all investors and
capital market operators. In August 2011, the Company continued its reporting activities by presenting its
interim report for the first half of 2011. Published reports can also be found on the Hapag-Lloyd website –
www.hapag-lloyd.com/IR.
key Bond data
Issue volume Maturity* Coupon Issue price Price** on (total) 30/6/2011
EUR tranche EUR 480m 15/10/2015 9.00% 99.50%*** 102.25%
USD tranche USD 250m 15/10/2017 9.75% 99.37% 102.69%
*Callable; **Price data: Bloomberg; ***Price of the first issue, increase of EUR 150 million to 103.38%
6
interim group management report i Hapag-lloyd interim group report H1 · 2011
business and company fundamentals
group structure
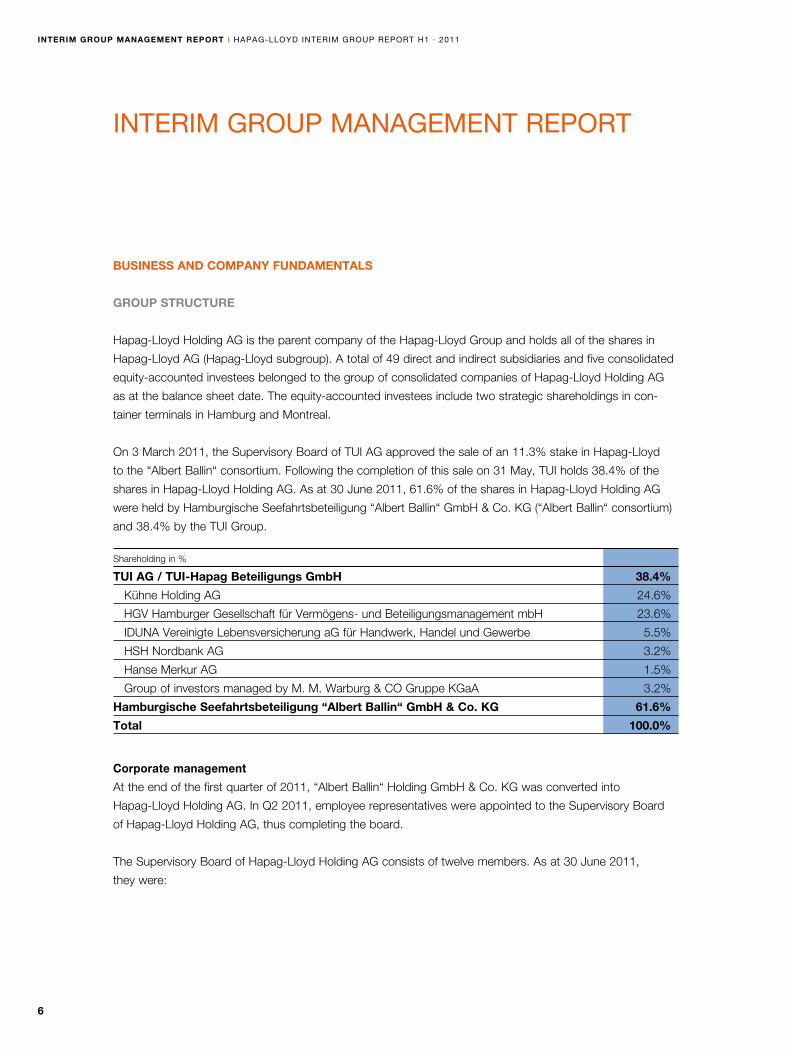
Hapag-Lloyd Holding AG is the parent company of the Hapag-Lloyd Group and holds all of the shares in
Hapag-Lloyd AG (Hapag-Lloyd subgroup). A total of 49 direct and indirect subsidiaries and five consolidated
equity-accounted investees belonged to the group of consolidated companies of Hapag-Lloyd Holding AG
as at the balance sheet date. The equity-accounted investees include two strategic shareholdings in con-
tainer terminals in Hamburg and Montreal.
On 3 March 2011, the Supervisory Board of TUI AG approved the sale of an 11.3% stake in Hapag-Lloyd
to the “Albert Ballin“ consortium. Following the completion of this sale on 31 May, TUI holds 38.4% of the
shares in Hapag-Lloyd Holding AG. As at 30 June 2011, 61.6% of the shares in Hapag-Lloyd Holding AG
were held by Hamburgische Seefahrtsbeteiligung “Albert Ballin“ GmbH & Co. KG (“Albert Ballin“ consortium)
and 38.4% by the TUI Group.
Corporate management
At the end of the first quarter of 2011, “Albert Ballin“ Holding GmbH & Co. KG was converted into
Hapag-Lloyd Holding AG. In Q2 2011, employee representatives were appointed to the Supervisory Board
of Hapag-Lloyd Holding AG, thus completing the board.
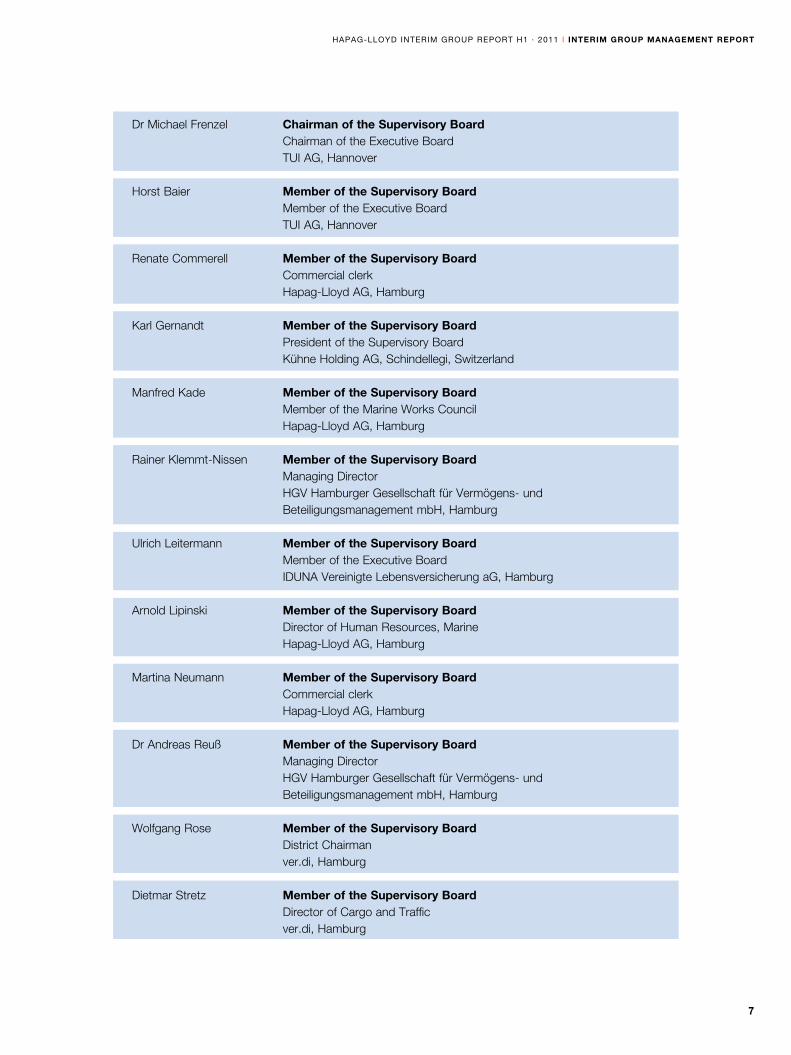
The Supervisory Board of Hapag-Lloyd Holding AG consists of twelve members. As at 30 June 2011,
they were:
interim group management report
Shareholding in %
tui ag / tui-Hapag beteiligungs gmbH 38.4%
Kühne Holding AG 24.6%
HGV Hamburger Gesellschaft für Vermögens- und Beteiligungsmanagement mbH 23.6%
IDUNA Vereinigte Lebensversicherung aG für Handwerk, Handel und Gewerbe 5.5%
HSH Nordbank AG 3.2%
Hanse Merkur AG 1.5%
Group of investors managed by M. M. Warburg & CO Gruppe KGaA 3.2%
Hamburgische seefahrtsbeteiligung “albert ballin“ gmbH & co. kg 61.6%
total 100.0%
7
Hapag-lloyd interim group report H1 · 2011 i interim group management report
Dr Michael Frenzel chairman of the supervisory board Chairman of the Executive Board TUI AG, Hannover
Horst Baier member of the supervisory board Member of the Executive Board TUI AG, Hannover Renate Commerell member of the supervisory board Commercial clerk Hapag-Lloyd AG, Hamburg
Karl Gernandt member of the supervisory board President of the Supervisory Board Kühne Holding AG, Schindellegi, Switzerland
Manfred Kade member of the supervisory board Member of the Marine Works Council Hapag-Lloyd AG, Hamburg
Rainer Klemmt-Nissen member of the supervisory board Managing Director HGV Hamburger Gesellschaft für Vermögens- und Beteiligungsmanagement mbH, Hamburg
Ulrich Leitermann member of the supervisory board Member of the Executive Board IDUNA Vereinigte Lebensversicherung aG, Hamburg
Arnold Lipinski member of the supervisory board Director of Human Resources, Marine Hapag-Lloyd AG, Hamburg
Martina Neumann member of the supervisory board Commercial clerk Hapag-Lloyd AG, Hamburg Dr Andreas Reuß member of the supervisory board Managing Director HGV Hamburger Gesellschaft für Vermögens- und Beteiligungsmanagement mbH, Hamburg
Wolfgang Rose member of the supervisory board District Chairman ver.di, Hamburg Dietmar Stretz member of the supervisory board Director of Cargo and Traffic ver.di, Hamburg
8
interim group management report i Hapag-lloyd interim group report H1 · 2011
operating activities
Hapag-Lloyd is Germany’s largest container liner shipping company and is one of the world’s leading liner
shipping companies in terms of global market coverage. The Hapag-Lloyd fleet consists of 144 container
ships. Hapag-Lloyd currently has around 300 sales offices in 114 countries and offers its customers
worldwide access to a network of 76 liner services. In the first six months of 2011, Hapag-Lloyd served
16,115 customers around the world. The functional currency used by the international container liner
shipping industry – and therefore also by the Hapag-Lloyd subgroup – is the US dollar. Payment flows
in currencies other than the US dollar are hedged to the US dollar. However, the reporting currency of
Hapag-Lloyd Holding AG is the euro. The translation of individual balance sheet items from foreign
currencies, such as fixed assets and financial liabilities, results in some cases in significant valuation effects.
These are recognised directly in the Group’s cumulative other equity.
company obJectives and strategy
The Hapag-Lloyd Group’s prime objective is long-term profitable growth. Increasing global demand for
container transport forms the basis for this planned organic growth. According to current forecasts, the
volume of global container transport is expected to grow largely in line with world trade over the next few
years. Hapag-Lloyd believes that selling transport services at viable prices is more important than expanding
volume at any cost. Sustainable operating cash flows along with solid liquidity and equity are also of
considerable importance in conducting business successfully. In order to utilise the medium-term market
opportunities, between July 2012 and November 2013 Hapag-Lloyd will launch a total of ten new container
ships into service, each with a storage space capacity of 13,200 TEU.
business development
general economic conditions
According to economic experts, the worldwide economic upturn is expected to continue in the quarters to
come. The International Monetary Fund (IMF) anticipates global economic growth of 4.3% in the current year
and growth of 4.5% in 2012. However, the IMF also believes that the risk of a possible deterioration in the
prospects for global growth have increased considerably. Although the rate of growth remains good overall
at a global level, there are still huge imbalances in regional economic developments. The newly industrialis-
ing countries in Asia and Latin America are still making an above-average contribution to the international
9
Hapag-lloyd interim group report H1 · 2011 i interim group management report
economic upswing. However, below-average increases are expected in the economic output of the world’s
largest economy – the USA – and many eurozone countries over the next few quarters. Furthermore, the
sharp rise in commodity prices could curb growth.
The further economic upswing could also be impaired by the escalating debt crisis in Europe, the USA’s
high budget deficit and a possible slowdown in China’s economic growth. On the other hand, the Japanese
economy seems to be gradually recovering from the consequences of the natural and environmental disas-
ter. Nevertheless, a lack of components and energy shortages are still restricting production in the Japanese
automotive, mechanical engineering and electrical industries.
sector-specific conditions
Demand for container transport services can be expected to rise in tandem with growth in the world trad-
ing volume. For instance, IHS Global Insight Industry Intelligence (June 2011) expects a 6.6% increase in the
global cargo volume this year and growth of 7.4% for 2012. The projected increase in the global transport
volume for container shipping should therefore largely match the growth rates in world trade.
With the total capacity of the world container ship fleet estimated at 15.6 million TEU at the beginning of
2011, the supply capacity could see increases totalling 1.6 million TEU in 2011 (Transmodal July 2011) and
approximately 1.5 million TEU in 2012 due to new vessels. Despite an increase in orders for new vessels, the
tonnage of the commissioned container ships is currently equivalent to 27% of the global container fleet’s
capacity. It therefore remains well below the highest level seen to date, 56% in 2008. The heightened trend
towards larger vessels is reflected in the distribution of the orders. Some 70% of the newbuild orders are for
vessels with a capacity of over 8,000 TEU.
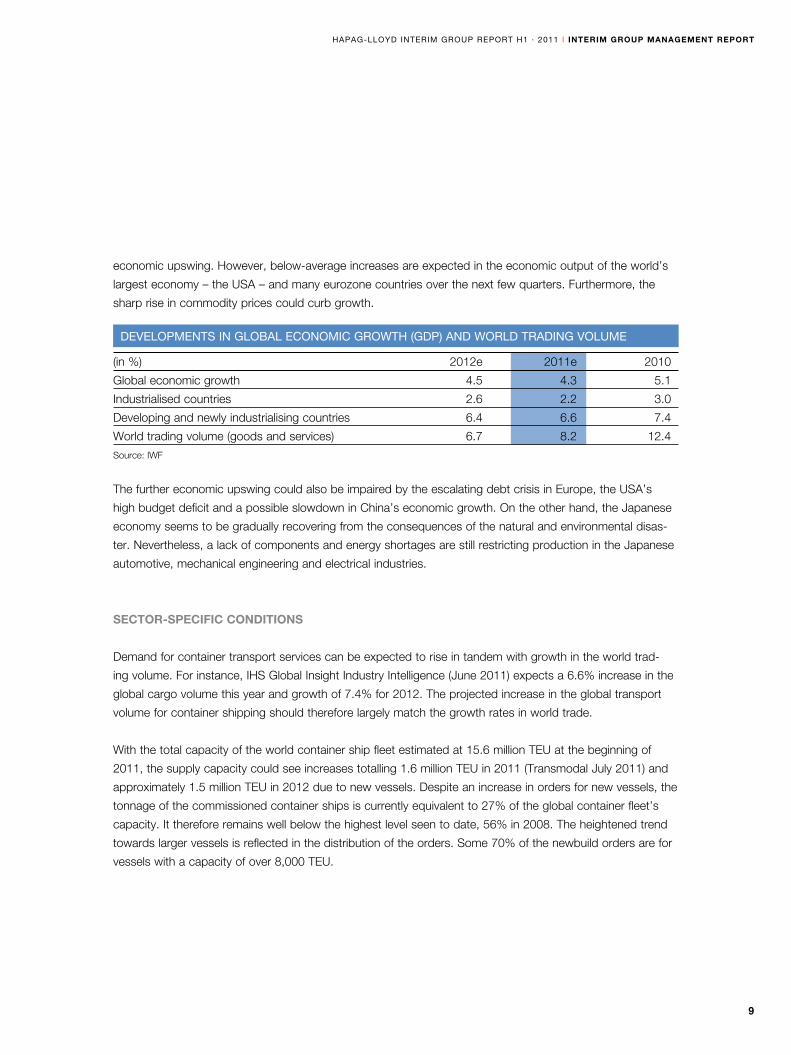
developmentS in gloBal eConomiC groWtH (gdp) and World trading volume
(in %) 2012e 2011e 2010
Global economic growth 4.5 4.3 5.1
Industrialised countries 2.6 2.2 3.0
Developing and newly industrialising countries 6.4 6.6 7.4
World trading volume (goods and services) 6.7 8.2 12.4
Source: IWF
10
interim group management report i Hapag-lloyd interim group report H1 · 2011
In the future too, the actual growth in the global container fleet’s transport capacity is expected to be
lower than the projected increase as old and inefficient vessels are scrapped, deliveries of newbuilds are
postponed and slow steaming (reducing the speed at which services operate) is used.
The relatively small number of laid-up – i.e. idle – vessels illustrates the good overall deployment rate for
container ships at present. At 120,000 TEU (Alphaliner July 2011), the idle capacity corresponds to less
than 1% of the global container fleet’s total capacity.
Although the prospects for growth remain positive in the medium term, we may see temporary imbalances
in supply and demand, which could have a substantial impact on the respective transport volumes and
freight rates. For example, the effect of new vessels going into service and the return of idle capacity into
service resulting in a sharp increase in transport capacities is currently affecting the development of freight
rates, especially on services from and to Asia. Uncertainty regarding short-term industry developments is
generated primarily by the soaring transport expenses seen in recent months. This is chiefly attributable to
the escalating oil price.
Since May 2011, the European Commission has been examining whether EU competition law has been
violated since the exemption regulation for liner conferences was abolished in October 2008. Hapag-Lloyd
is also affected by the investigations. The Company believes that the transport services were provided in
line with EU competition regulations. Hapag-Lloyd is cooperating fully with the investigating body.
important performance indicators
Efficient fleet
Hapag-Lloyd’s fleet currently comprises 144 container ships, which are all certified in accordance with the
ISM (International Safety Management) Code and have a valid ISSC (ISPS) certificate. The majority of the
vessels are also certified as per ISO 9001 (quality management) and ISO 14001 (environmental manage-
ment). There are ten ships on the order book, which will be equipped with state-of-the-art technology
and have a storage space capacity of up to 13,200 TEU each. The Hapag-Lloyd fleet’s total storage space
capacity currently amounts to approximately 651 TTEU. Hapag-Lloyd also owns or leases 642,063 con-
tainers with a capacity of 1.04 million TEU for transporting cargo.
11
Hapag-lloyd interim group report H1 · 2011 i interim group management report
Transport volumes and freight rates
Freight rates and transport volumes are among the main performance indicators used to gauge corporate
development at the Hapag-Lloyd Group. Both indicators developed positively overall in comparison with the
average figures from recent years.
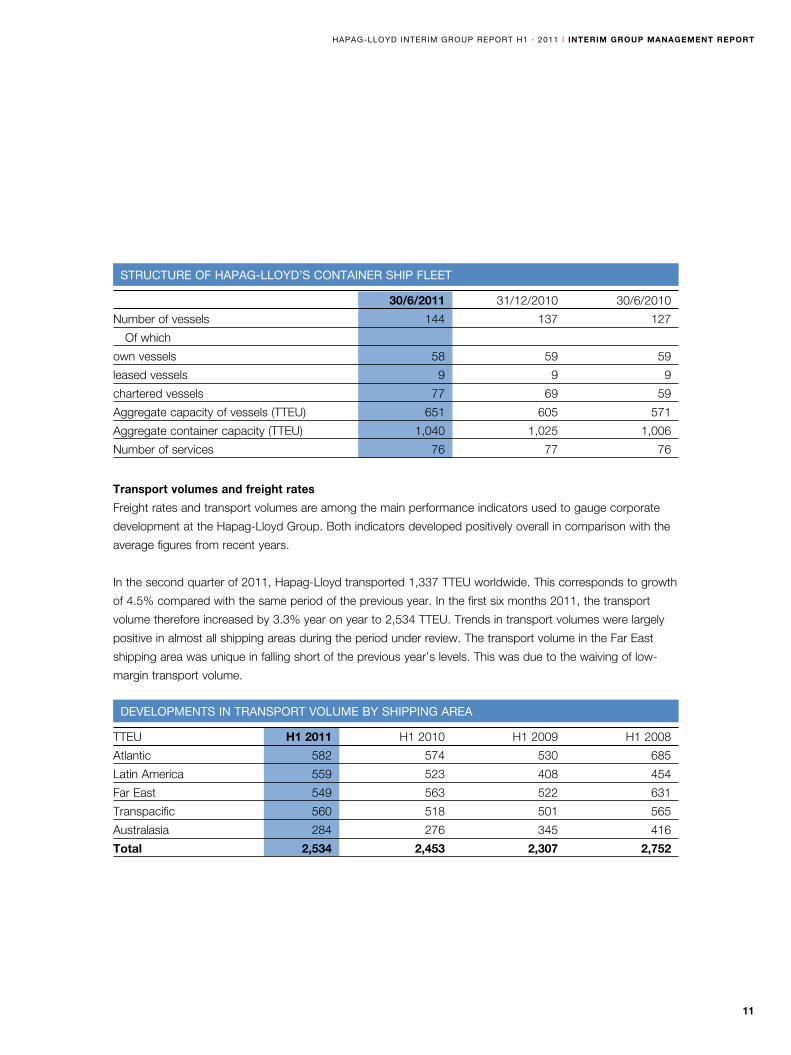
In the second quarter of 2011, Hapag-Lloyd transported 1,337 TTEU worldwide. This corresponds to growth
of 4.5% compared with the same period of the previous year. In the first six months 2011, the transport
volume therefore increased by 3.3% year on year to 2,534 TTEU. Trends in transport volumes were largely
positive in almost all shipping areas during the period under review. The transport volume in the Far East
shipping area was unique in falling short of the previous year’s levels. This was due to the waiving of low-
margin transport volume.
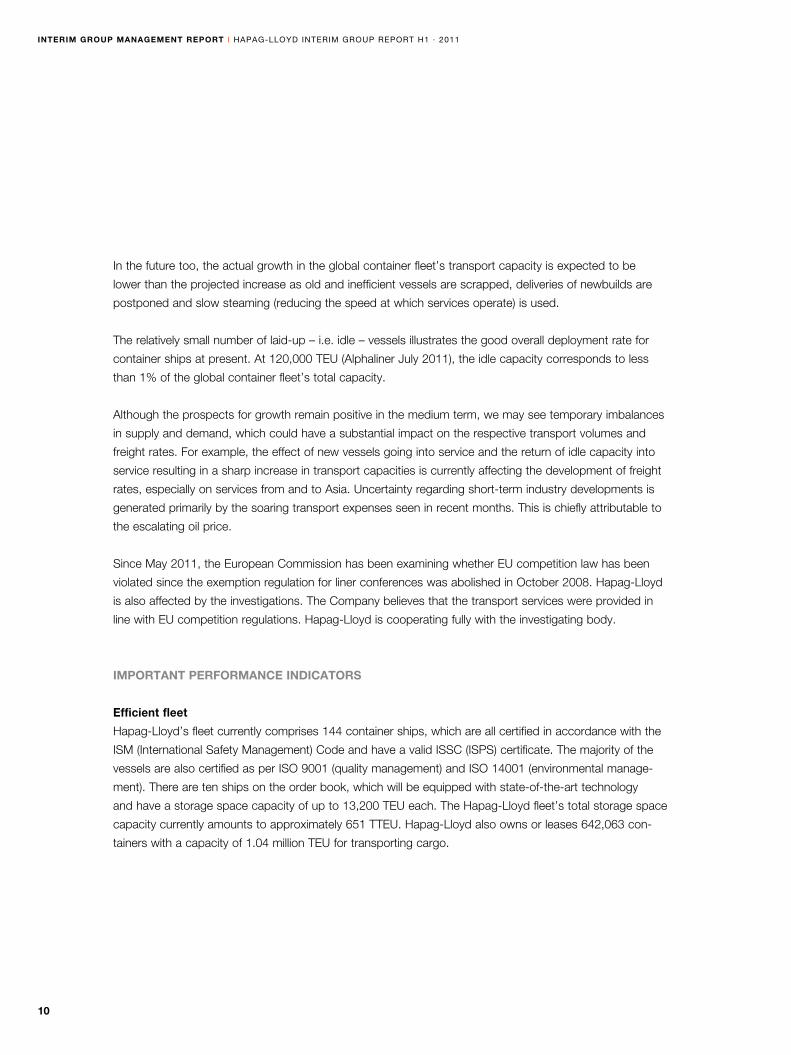
StruCture oF Hapag-lloyd’S Container SHip Fleet
30/6/2011 31/12/2010 30/6/2010
Number of vessels 144 137 127
Of which
own vessels 58 59 59
leased vessels 9 9 9
chartered vessels 77 69 59
Aggregate capacity of vessels (TTEU) 651 605 571
Aggregate container capacity (TTEU) 1,040 1,025 1,006
Number of services 76 77 76
developmentS in tranSport volume By SHipping area
TTEU H1 2011 H1 2010 H1 2009 H1 2008
Atlantic 582 574 530 685
Latin America 559 523 408 454
Far East 549 563 522 631
Transpacific 560 518 501 565
Australasia 284 276 345 416
total 2,534 2,453 2,307 2,752
12
interim group management report i Hapag-lloyd interim group report H1 · 2011
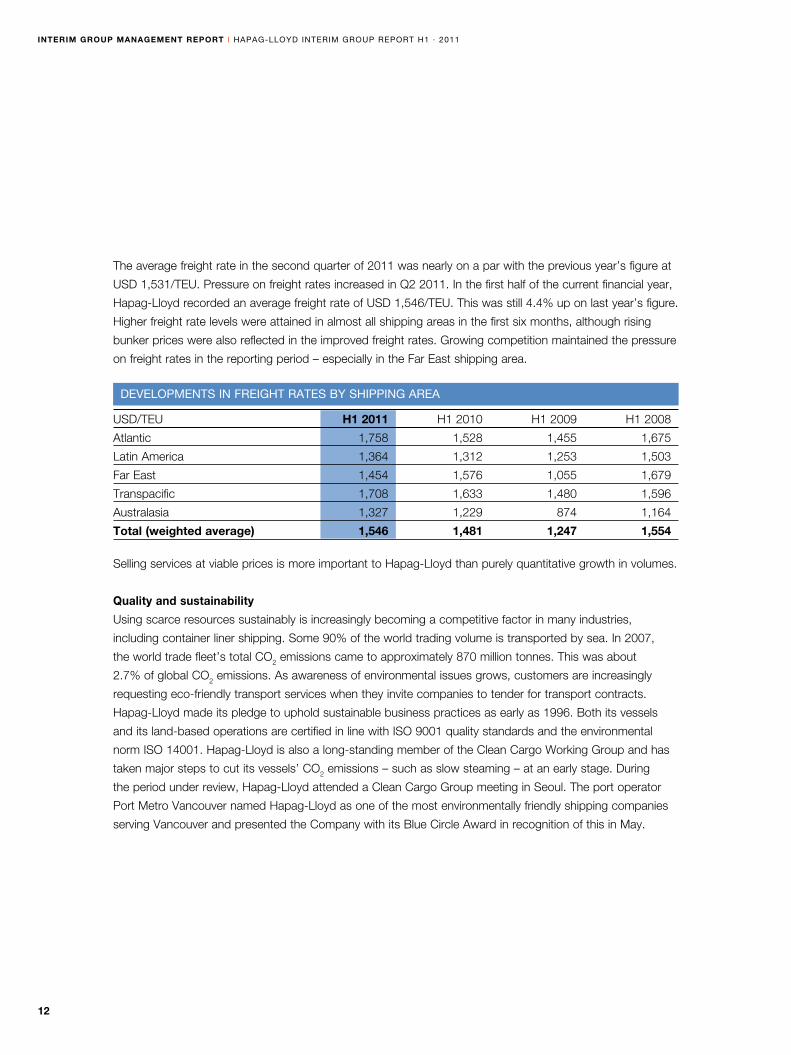
The average freight rate in the second quarter of 2011 was nearly on a par with the previous year’s figure at
USD 1,531/TEU. Pressure on freight rates increased in Q2 2011. In the first half of the current financial year,
Hapag-Lloyd recorded an average freight rate of USD 1,546/TEU. This was still 4.4% up on last year’s figure.
Higher freight rate levels were attained in almost all shipping areas in the first six months, although rising
bunker prices were also reflected in the improved freight rates. Growing competition maintained the pressure
on freight rates in the reporting period – especially in the Far East shipping area.
Selling services at viable prices is more important to Hapag-Lloyd than purely quantitative growth in volumes.
Quality and sustainability
Using scarce resources sustainably is increasingly becoming a competitive factor in many industries,
including container liner shipping. Some 90% of the world trading volume is transported by sea. In 2007,
the world trade fleet’s total CO2 emissions came to approximately 870 million tonnes. This was about
2.7% of global CO2 emissions. As awareness of environmental issues grows, customers are increasingly
requesting eco-friendly transport services when they invite companies to tender for transport contracts.
Hapag-Lloyd made its pledge to uphold sustainable business practices as early as 1996. Both its vessels
and its land-based operations are certified in line with ISO 9001 quality standards and the environmental
norm ISO 14001. Hapag-Lloyd is also a long-standing member of the Clean Cargo Working Group and has
taken major steps to cut its vessels’ CO2 emissions – such as slow steaming – at an early stage. During
the period under review, Hapag-Lloyd attended a Clean Cargo Group meeting in Seoul. The port operator
Port Metro Vancouver named Hapag-Lloyd as one of the most environmentally friendly shipping companies
serving Vancouver and presented the Company with its Blue Circle Award in recognition of this in May.
developmentS in FreigHt rateS By SHipping area
USD/TEU H1 2011 H1 2010 H1 2009 H1 2008
Atlantic 1,758 1,528 1,455 1,675
Latin America 1,364 1,312 1,253 1,503
Far East 1,454 1,576 1,055 1,679
Transpacific 1,708 1,633 1,480 1,596
Australasia 1,327 1,229 874 1,164
total (weighted average) 1,546 1,481 1,247 1,554
13
Hapag-lloyd interim group report H1 · 2011 i interim group management report
Customers
Long-term, close business relations with clients are also important in driving value for corporate devel-
opment. Relationships with major customers are managed by a special key account team. This enables
the Company to establish and maintain long-standing, sustainable customer relationships. In the first six
months of the 2011 financial year, transport contracts were completed for 16,115 customers.
Employees
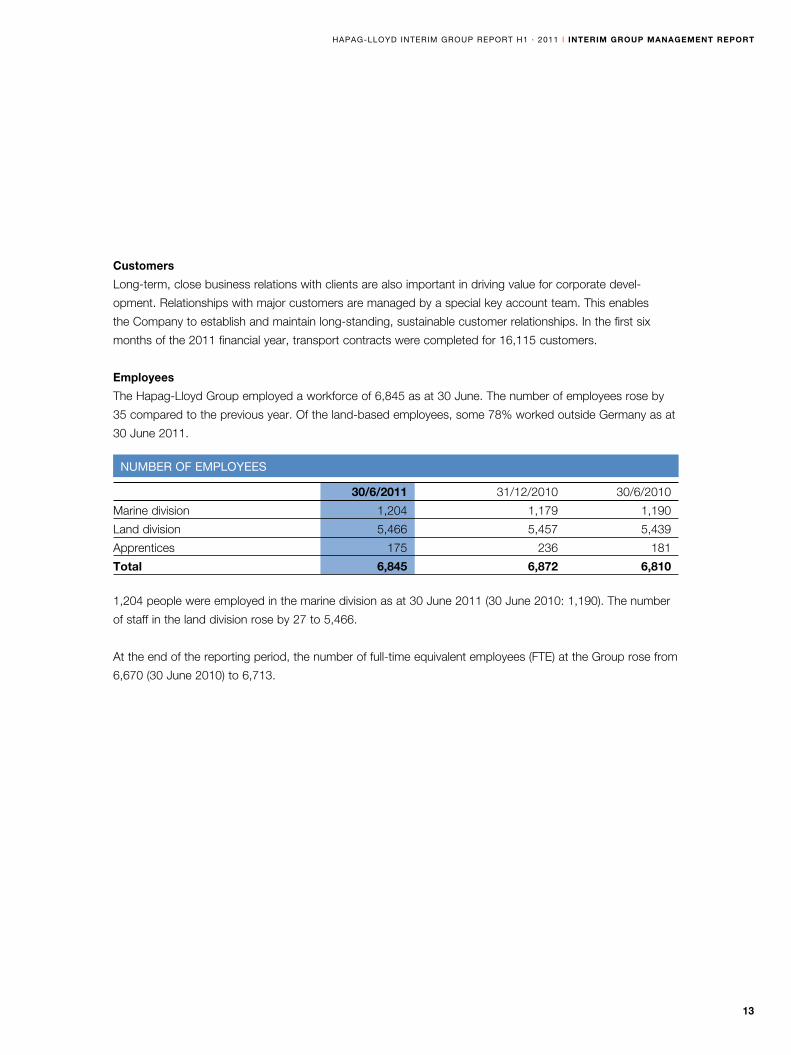
The Hapag-Lloyd Group employed a workforce of 6,845 as at 30 June. The number of employees rose by
35 compared to the previous year. Of the land-based employees, some 78% worked outside Germany as at
30 June 2011.
1,204 people were employed in the marine division as at 30 June 2011 (30 June 2010: 1,190). The number
of staff in the land division rose by 27 to 5,466.
At the end of the reporting period, the number of full-time equivalent employees (FTE) at the Group rose from
6,670 (30 June 2010) to 6,713.
numBer oF employeeS
30/6/2011 31/12/2010 30/6/2010
Marine division 1,204 1,179 1,190
Land division 5,466 5,457 5,439
Apprentices 175 236 181
total 6,845 6,872 6,810
14
interim group management report i Hapag-lloyd interim group report H1 · 2011
group earnings position
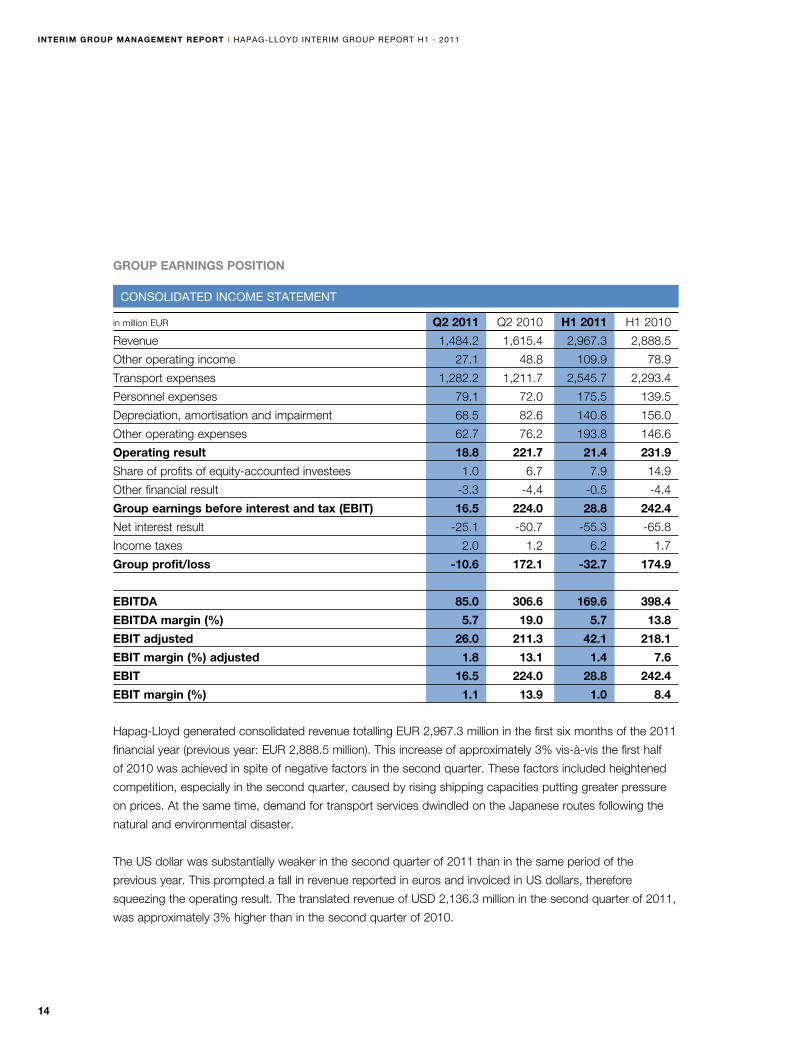
Hapag-Lloyd generated consolidated revenue totalling EUR 2,967.3 million in the first six months of the 2011
financial year (previous year: EUR 2,888.5 million). This increase of approximately 3% vis-à-vis the first half
of 2010 was achieved in spite of negative factors in the second quarter. These factors included heightened
competition, especially in the second quarter, caused by rising shipping capacities putting greater pressure
on prices. At the same time, demand for transport services dwindled on the Japanese routes following the
natural and environmental disaster.
The US dollar was substantially weaker in the second quarter of 2011 than in the same period of the
previous year. This prompted a fall in revenue reported in euros and invoiced in US dollars, therefore
squeezing the operating result. The translated revenue of USD 2,136.3 million in the second quarter of 2011,
was approximately 3% higher than in the second quarter of 2010.
ConSolidated inCome Statement
in million EUR Q2 2011 Q2 2010 H1 2011 H1 2010
Revenue 1,484.2 1,615.4 2,967.3 2,888.5
Other operating income 27.1 48.8 109.9 78.9
Transport expenses 1,282.2 1,211.7 2,545.7 2,293.4
Personnel expenses 79.1 72.0 175.5 139.5
Depreciation, amortisation and impairment 68.5 82.6 140.8 156.0
Other operating expenses 62.7 76.2 193.8 146.6
operating result 18.8 221.7 21.4 231.9
Share of profits of equity-accounted investees 1.0 6.7 7.9 14.9
Other financial result -3.3 -4.4 -0.5 -4.4
group earnings before interest and tax (ebit) 16.5 224.0 28.8 242.4
Net interest result -25.1 -50.7 -55.3 -65.8
Income taxes 2.0 1.2 6.2 1.7
group profit/loss -10.6 172.1 -32.7 174.9
ebitda 85.0 306.6 169.6 398.4
ebitda margin (%) 5.7 19.0 5.7 13.8
ebit adjusted 26.0 211.3 42.1 218.1
ebit margin (%) adjusted 1.8 13.1 1.4 7.6
ebit 16.5 224.0 28.8 242.4
ebit margin (%) 1.1 13.9 1.0 8.4
15
Hapag-lloyd interim group report H1 · 2011 i interim group management report
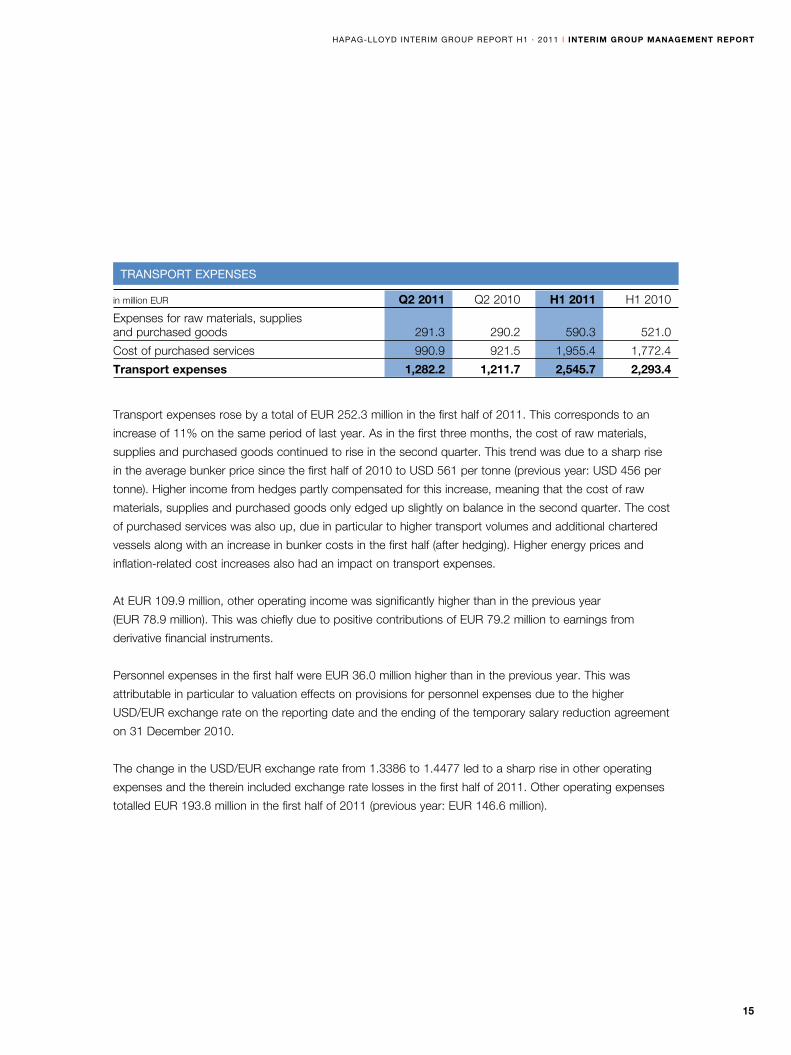
Transport expenses rose by a total of EUR 252.3 million in the first half of 2011. This corresponds to an
increase of 11% on the same period of last year. As in the first three months, the cost of raw materials,
supplies and purchased goods continued to rise in the second quarter. This trend was due to a sharp rise
in the average bunker price since the first half of 2010 to USD 561 per tonne (previous year: USD 456 per
tonne). Higher income from hedges partly compensated for this increase, meaning that the cost of raw
materials, supplies and purchased goods only edged up slightly on balance in the second quarter. The cost
of purchased services was also up, due in particular to higher transport volumes and additional chartered
vessels along with an increase in bunker costs in the first half (after hedging). Higher energy prices and
inflation-related cost increases also had an impact on transport expenses.
At EUR 109.9 million, other operating income was significantly higher than in the previous year
(EUR 78.9 million). This was chiefly due to positive contributions of EUR 79.2 million to earnings from
derivative financial instruments.
Personnel expenses in the first half were EUR 36.0 million higher than in the previous year. This was
attributable in particular to valuation effects on provisions for personnel expenses due to the higher
USD/EUR exchange rate on the reporting date and the ending of the temporary salary reduction agreement
on 31 December 2010.
The change in the USD/EUR exchange rate from 1.3386 to 1.4477 led to a sharp rise in other operating
expenses and the therein included exchange rate losses in the first half of 2011. Other operating expenses
totalled EUR 193.8 million in the first half of 2011 (previous year: EUR 146.6 million).
tranSport eXpenSeS
in million EUR Q2 2011 Q2 2010 H1 2011 H1 2010
Expenses for raw materials, supplies and purchased goods 291.3 290.2 590.3 521.0
Cost of purchased services 990.9 921.5 1,955.4 1,772.4
transport expenses 1,282.2 1,211.7 2,545.7 2,293.4
16
interim group management report i Hapag-lloyd interim group report H1 · 2011
The other financial result of EUR -0.5 million includes changes to the fair value of currency options
amounting to EUR -18.7 million, effects of EUR 17.9 million from the early repayment of a shareholder loan,
and exchange rate effects of EUR 0.3 million in conjunction with this.
The USD/EUR exchange rate had an adverse effect on earnings. Together with the currently high bunker
and energy prices and increased other transport expenses, this led to a sharp fall in the Group operating
profit before interest and taxes (EBIT). EBIT was EUR 213.6 million down on the first half of 2010 at
EUR 28.8 million in the first half of 2011.
Adjusted for special items from the purchase price allocation and non-recurring factors, the Group profit
before interest and taxes amounted to EUR 42.1 million in the first six months (adjusted EBIT).
The improvement in the interest result compared with the first half of the previous year was attributable in
particular to the interest expenses and charges recorded in the second quarter of 2010 in connection with
the syndicated loan agreement which was, however, terminated almost immediately in the third quarter.
These expenses had a one-off impact on the interest result last year. In total, a negative interest result of
EUR 55.3 million was posted for the first half of 2011 (previous year: EUR 65.8 million).
In the first half of 2011 the Group posted a loss of EUR 32.7 million (previous year: profit of EUR 174.9 million).
17
Hapag-lloyd interim group report H1 · 2011 i interim group management report
group financial and net asset position
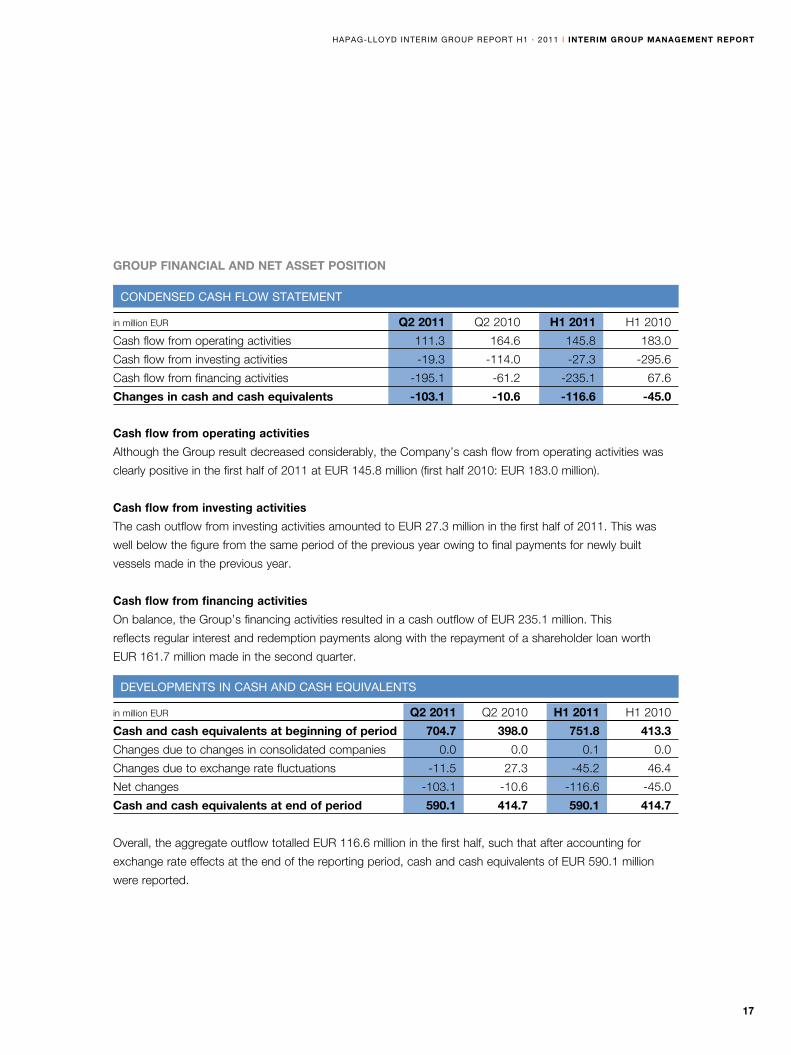
Cash flow from operating activities
Although the Group result decreased considerably, the Company’s cash flow from operating activities was
clearly positive in the first half of 2011 at EUR 145.8 million (first half 2010: EUR 183.0 million).
Cash flow from investing activities
The cash outflow from investing activities amounted to EUR 27.3 million in the first half of 2011. This was
well below the figure from the same period of the previous year owing to final payments for newly built
vessels made in the previous year.
Cash flow from financing activities
On balance, the Group’s financing activities resulted in a cash outflow of EUR 235.1 million. This
reflects regular interest and redemption payments along with the repayment of a shareholder loan worth
EUR 161.7 million made in the second quarter.
Overall, the aggregate outflow totalled EUR 116.6 million in the first half, such that after accounting for
exchange rate effects at the end of the reporting period, cash and cash equivalents of EUR 590.1 million
were reported.
developmentS in CaSH and CaSH equivalentS
in million EUR Q2 2011 Q2 2010 H1 2011 H1 2010
cash and cash equivalents at beginning of period 704.7 398.0 751.8 413.3
Changes due to changes in consolidated companies 0.0 0.0 0.1 0.0
Changes due to exchange rate fluctuations -11.5 27.3 -45.2 46.4
Net changes -103.1 -10.6 -116.6 -45.0
cash and cash equivalents at end of period 590.1 414.7 590.1 414.7
CondenSed CaSH FloW Statement
in million EUR Q2 2011 Q2 2010 H1 2011 H1 2010
Cash flow from operating activities 111.3 164.6 145.8 183.0
Cash flow from investing activities -19.3 -114.0 -27.3 -295.6
Cash flow from financing activities -195.1 -61.2 -235.1 67.6
changes in cash and cash equivalents -103.1 -10.6 -116.6 -45.0
18
interim group management report i Hapag-lloyd interim group report H1 · 2011
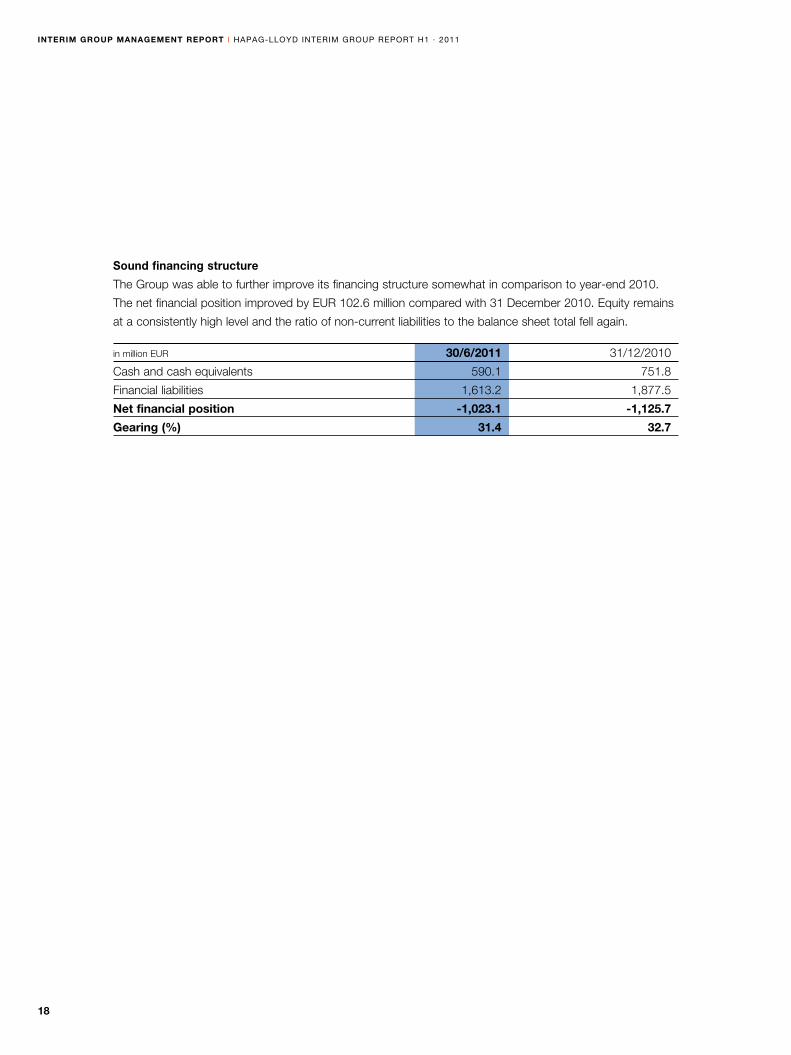
Sound financing structure
The Group was able to further improve its financing structure somewhat in comparison to year-end 2010.
The net financial position improved by EUR 102.6 million compared with 31 December 2010. Equity remains
at a consistently high level and the ratio of non-current liabilities to the balance sheet total fell again.
in million EUR 30/6/2011 31/12/2010
Cash and cash equivalents 590.1 751.8
Financial liabilities 1,613.2 1,877.5
net financial position -1,023.1 -1,125.7
gearing (%) 31.4 32.7

19
Hapag-lloyd interim group report H1 · 2011 i interim group management report
The Group’s balance sheet total shrank by 6.9% as compared with the end of the 2010 financial year and
came in at EUR 6,113.7 million. This was largely due to the stronger USD/EUR exchange rate of 1.4477 on
the closing date (year-end 2010: 1.3386).
The main reductions seen within non-current assets affected the carrying amounts of property, plant and
equipment and intangible assets, which fell to EUR 4,261.4 million as a result of depreciation/amortisation
and exchange rate effects of EUR 335.8 million on the reporting date. However, increases in the market
value of non-current derivative financial instruments had the opposite effect, as did charges accrued within
other assets for a financing commitment in connection with the orders for newbuild ships.
CHangeS in tHe aSSet StruCture
in million EUR 30/6/2011 31/12/2010
assets
Non-current assets 4,695.3 5,057.1
Current assets 1,418.4 1,512.4
Of which cash and cash equivalents 590.1 751.8
total assets 6,113.7 6,569.5
equity and liabilities
Equity 3,259.6 3,442.8
Borrowed capital 2,854.1 3,126.7
Of which non-current liabilities 1,629.1 1,878.8
Of which current liabilities 1,225.0 1,247.9
Of which financial liabilities 1,613.2 1,877.5
Of which non-current financial liabilities 1,432.7 1,673.9
Of which current financial liabilities 180.5 203.6
total equity and liabilities 6,113.7 6,569.5
Cash ratio I 48.2% 60.2%
Net financial position -1,023.1 -1,125.7
Equity ratio 53.3% 52.4%
20
interim group management report i Hapag-lloyd interim group report H1 · 2011
Within current assets, raw materials, supplies and purchased goods grew by EUR 29.2 million due to soaring
bunker prices in the course of the first half. The market value of the current financial derivatives associated
with fuel and currency hedges also rose by EUR 58.5 million.
Cash and cash equivalents fell by a total of EUR 161.7 million compared to 31 December 2010 due to
outflows of EUR 116.6 million and currency valuation effects of EUR 45.1 million.
On the liabilities side, equity shrank by EUR 183.2 million compared with 31 December 2010 and totalled
EUR 3,259.6 million. The positive effects from changes in the market value of hedges reported in the reserve
for cash flow hedges served to boost equity. However, they were counteracted by currency translation
effects and the Group loss. The equity ratio remained virtually unchanged at 53.3%, taking it just above the
figure of 52.4% from 31 December 2010.
The fall in non-current and current liabilities resulted primarily from exchange rate effects on the reporting
date and the repayment of a shareholder loan including interest in the second quarter of 2011. Furthermore,
the movement in financial liabilities was offset by the setting up of a securitisation programme for receivables
worth USD 100 million (EUR 69.1 million).
Taking cash and cash equivalents and financial liabilities into account, the net financial position as at
30 June 2011 was EUR -1,023.1 million (31 December 2010: EUR -1,125.7 million).
For further information on significant changes to specific balance sheet items, please refer to the Notes
beginning on page 31.
risk and opportunity report
Please refer to the 2010 Annual Report for details of specific opportunities and risks. At the time of report-
ing, there were no risks which threatened the ongoing existence of the Hapag-Lloyd Group. From today’s
perspective, we do not anticipate any fundamental changes to the risk position.
Since May 2011, the European Commission has been examining whether EU competition law has been
violated since the exemption regulation for liner conferences was abolished in October 2008. The Company
believes that the transport services were provided in line with EU competition regulations.
The ramifications of the natural and environmental disaster in Japan may give rise to both risks and
opportunities for container shipping.
21
Hapag-lloyd interim group report H1 · 2011 i interim group management report
Due to the present industrial production stoppages in Japan, transport volumes could remain lower than
expected over the next few months, especially on services to and from Japan. In the medium term,
however, transport volumes could be higher than anticipated on services to Japan if reconstruction work
in the Japanese provinces affected picks up pace over the coming quarters.
There were no other major changes to the external environment or the Company’s internal conditions
in the first six months of 2011.
events after tHe balance sHeet date
There were no significant transactions after the balance sheet date.
outlook
The statements made in the “Outlook” section of the Group management report for 2010 generally remain
valid as regards the medium-term growth prospects for container shipping. However, the short-term
prospects for the industry remain shrouded in uncertainty due to increasing imbalances in global economic
developments. Growth is primarily being curbed by the escalating debt crisis in the EU and the USA’s high
budget deficit. In addition to this, the inflation rate remains high in major newly industrialising countries, which
may prove a negative factor. Furthermore, competition is becoming tougher due to the impact of very large
container ships going into service. This affects Asia-related shipping areas in particular. Combined with
the ongoing sharp rise in crude oil prices, this can be expected to have a significant adverse effect on the
industry and therefore also on business developments at Hapag-Lloyd in the current financial year.
22
interim consolidated financial statements i Hapag-lloyd interim group report H1 · 2011
interim ConSolidated FinanCial StatementS
consolidated income statement
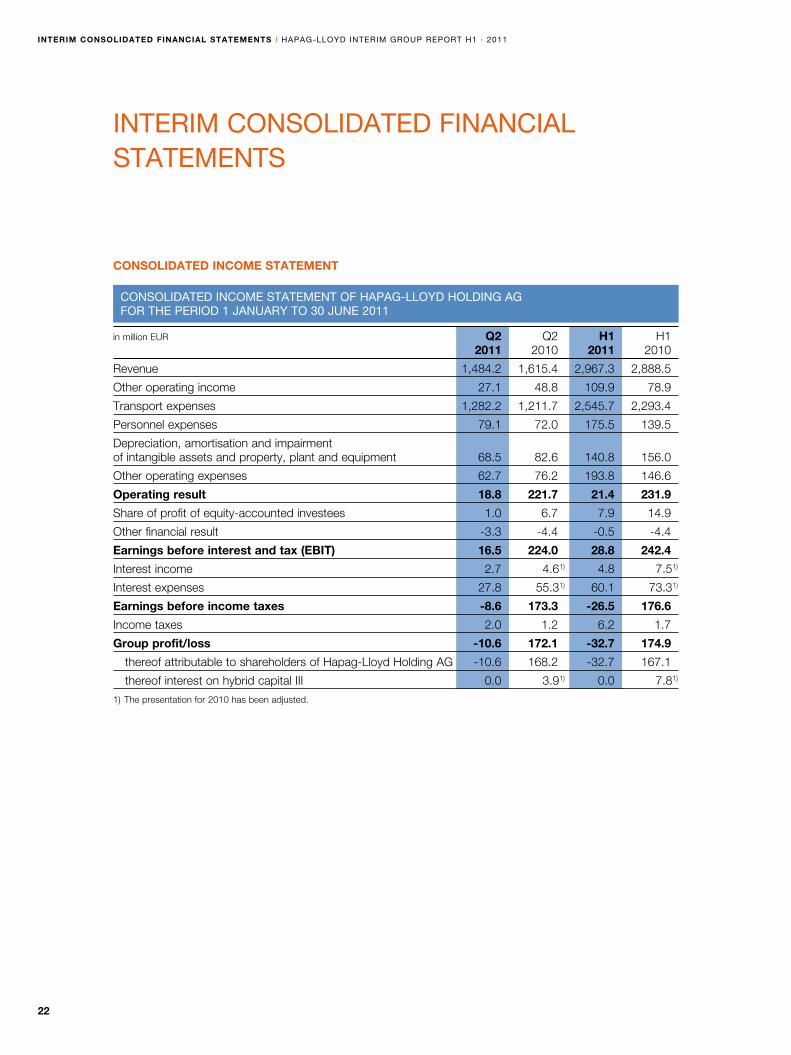
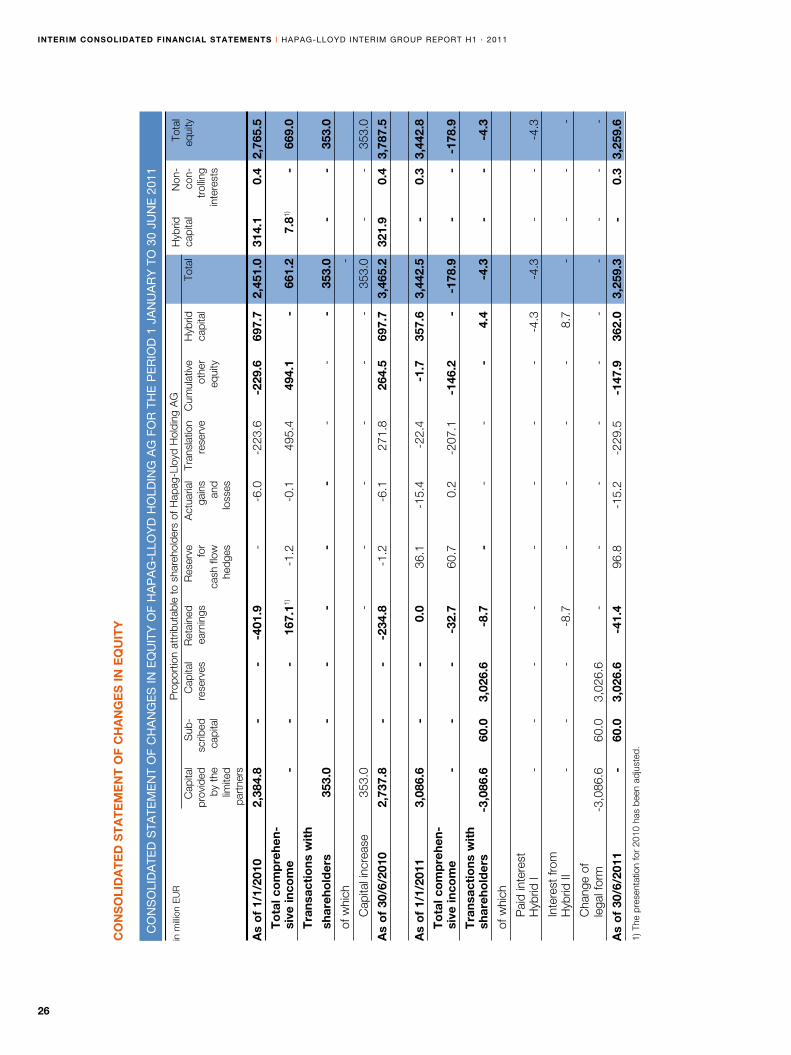
ConSolidated inCome Statement oF Hapag-lloyd Holding ag For tHe period 1 January to 30 June 2011
in million EUR Q2 Q2 H1 H1 2011 2010 2011 2010
Revenue 1,484.2 1,615.4 2,967.3 2,888.5
Other operating income 27.1 48.8 109.9 78.9
Transport expenses 1,282.2 1,211.7 2,545.7 2,293.4
Personnel expenses 79.1 72.0 175.5 139.5
Depreciation, amortisation and impairment of intangible assets and property, plant and equipment 68.5 82.6 140.8 156.0
Other operating expenses 62.7 76.2 193.8 146.6
operating result 18.8 221.7 21.4 231.9
Share of profit of equity-accounted investees 1.0 6.7 7.9 14.9
Other financial result -3.3 -4.4 -0.5 -4.4
earnings before interest and tax (ebit) 16.5 224.0 28.8 242.4
Interest income 2.7 4.61) 4.8 7.51)
Interest expenses 27.8 55.31) 60.1 73.31)
earnings before income taxes -8.6 173.3 -26.5 176.6
Income taxes 2.0 1.2 6.2 1.7
group profit/loss -10.6 172.1 -32.7 174.9
thereof attributable to shareholders of Hapag-Lloyd Holding AG -10.6 168.2 -32.7 167.1
thereof interest on hybrid capital III 0.0 3.91) 0.0 7.81)
1) The presentation for 2010 has been adjusted.
23
Hapag-lloyd interim group report H1 · 2011 i interim consolidated financial statements
consolidated statement of compreHensive income
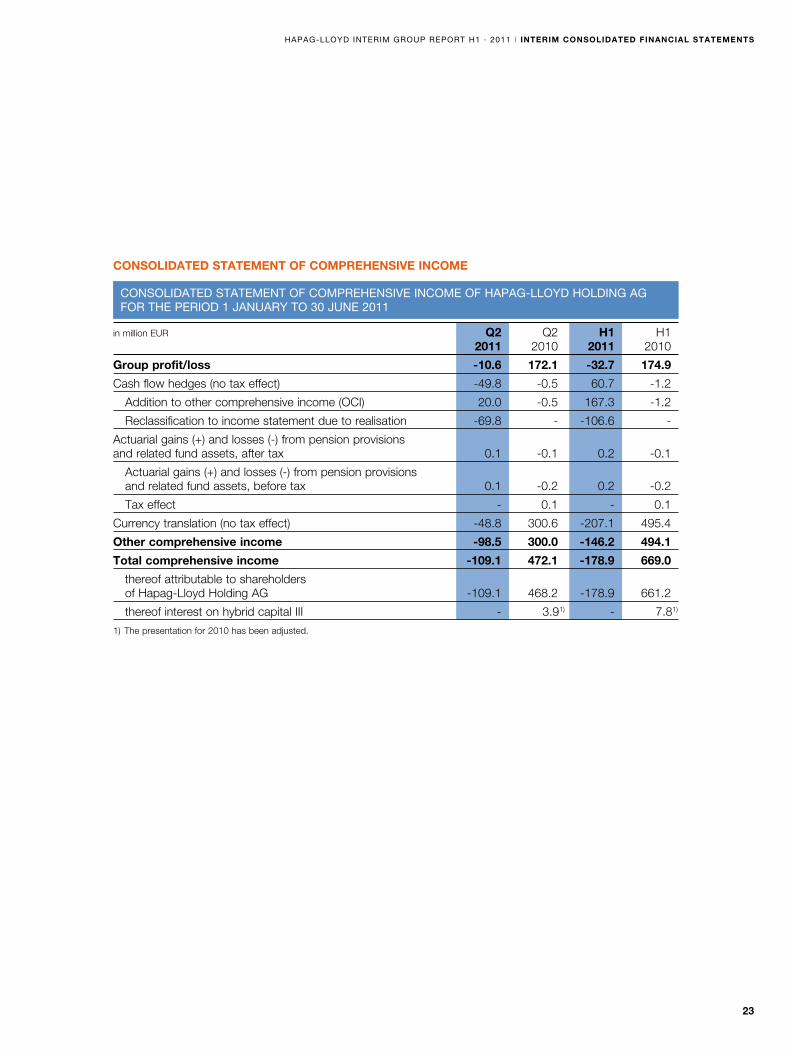
ConSolidated Statement oF CompreHenSive inCome oF Hapag-lloyd Holding ag For tHe period 1 January to 30 June 2011
in million EUR Q2 Q2 H1 H1 2011 2010 2011 2010
group profit/loss -10.6 172.1 -32.7 174.9
Cash flow hedges (no tax effect) -49.8 -0.5 60.7 -1.2
Addition to other comprehensive income (OCI) 20.0 -0.5 167.3 -1.2
Reclassification to income statement due to realisation -69.8 - -106.6 -
Actuarial gains (+) and losses (-) from pension provisions and related fund assets, after tax 0.1 -0.1 0.2 -0.1
Actuarial gains (+) and losses (-) from pension provisions and related fund assets, before tax 0.1 -0.2 0.2 -0.2
Tax effect - 0.1 - 0.1
Currency translation (no tax effect) -48.8 300.6 -207.1 495.4
other comprehensive income -98.5 300.0 -146.2 494.1
total comprehensive income -109.1 472.1 -178.9 669.0
thereof attributable to shareholders of Hapag-Lloyd Holding AG -109.1 468.2 -178.9 661.2
thereof interest on hybrid capital III - 3.91) - 7.81)
1) The presentation for 2010 has been adjusted.
24
interim consolidated financial statements i Hapag-lloyd interim group report H1 · 2011
consolidated statement of financial position
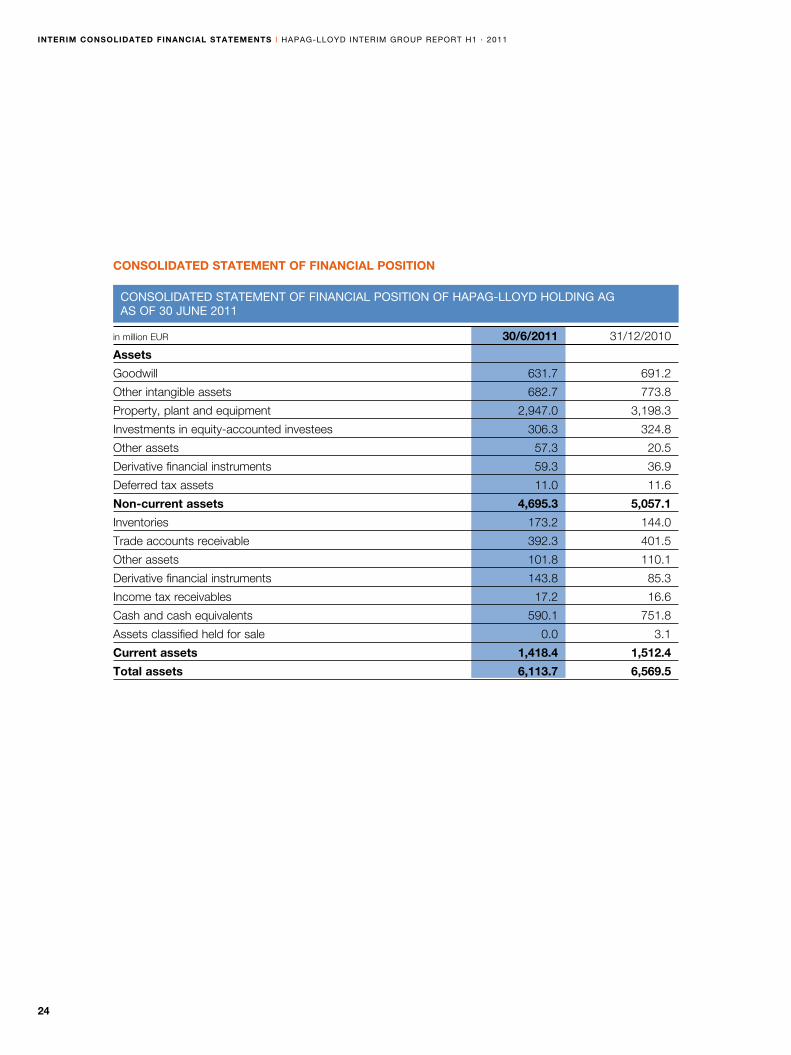
ConSolidated Statement oF FinanCial poSition oF Hapag-lloyd Holding ag aS oF 30 June 2011
in million EUR 30/6/2011 31/12/2010
assets
Goodwill 631.7 691.2
Other intangible assets 682.7 773.8
Property, plant and equipment 2,947.0 3,198.3
Investments in equity-accounted investees 306.3 324.8
Other assets 57.3 20.5
Derivative financial instruments 59.3 36.9
Deferred tax assets 11.0 11.6
non-current assets 4,695.3 5,057.1
Inventories 173.2 144.0
Trade accounts receivable 392.3 401.5
Other assets 101.8 110.1
Derivative financial instruments 143.8 85.3
Income tax receivables 17.2 16.6
Cash and cash equivalents 590.1 751.8
Assets classified held for sale 0.0 3.1
current assets 1,418.4 1,512.4
total assets 6,113.7 6,569.5
25
Hapag-lloyd interim group report H1 · 2011 i interim consolidated financial statements
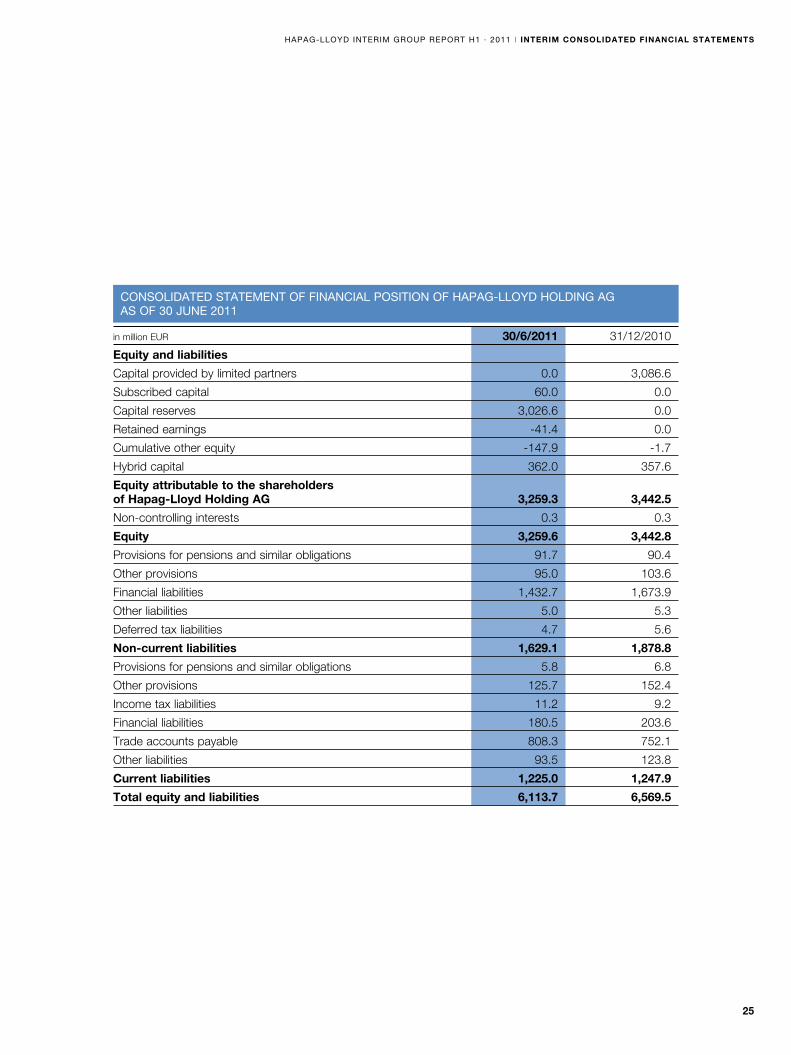
ConSolidated Statement oF FinanCial poSition oF Hapag-lloyd Holding ag aS oF 30 June 2011
in million EUR 30/6/2011 31/12/2010
equity and liabilities
Capital provided by limited partners 0.0 3,086.6
Subscribed capital 60.0 0.0
Capital reserves 3,026.6 0.0
Retained earnings -41.4 0.0
Cumulative other equity -147.9 -1.7
Hybrid capital 362.0 357.6
equity attributable to the shareholders of Hapag-lloyd Holding ag 3,259.3 3,442.5
Non-controlling interests 0.3 0.3
equity 3,259.6 3,442.8
Provisions for pensions and similar obligations 91.7 90.4
Other provisions 95.0 103.6
Financial liabilities 1,432.7 1,673.9
Other liabilities 5.0 5.3
Deferred tax liabilities 4.7 5.6
non-current liabilities 1,629.1 1,878.8
Provisions for pensions and similar obligations 5.8 6.8
Other provisions 125.7 152.4
Income tax liabilities 11.2 9.2
Financial liabilities 180.5 203.6
Trade accounts payable 808.3 752.1
Other liabilities 93.5 123.8
current liabilities 1,225.0 1,247.9
total equity and liabilities 6,113.7 6,569.5
26
interim consolidated financial statements i Hapag-lloyd interim group report H1 · 2011
C
on
So
lid
ate
d S
tate
me
nt
oF
CH
an
ge
S in
eq
uit
y o
F H
ap
ag
-llo
yd
Ho
ldin
g a
g F
or
tH
e p
er
iod
1 J
an
ua
ry
to
30
Jun
e 2
011
in m
illion
EU
R
P
ropo
rtio
n at
trib
utab
le t
o sh
areh
olde
rs o
f Hap
ag-L
loyd
Hol
ding
AG
Hyb
rid
Non
- To
tal
C
apita
l S
ub-
Cap
ital
Ret
aine
d R
eser
ve
Act
uaria
l Tr
ansl
atio
n C
umul
ativ
e H
ybrid
To
tal
capi
tal
con-
eq
uity
prov
ided
sc
ribed
re
serv
es
earn
ings
fo
r ga
ins
rese
rve
othe
r ca
pita
l
tr
ollin
g
by
the
ca
pita
l
ca
sh fl
ow
and
eq
uity
inte
rest
s
limite
d
hedg
es
loss
es
pa
rtne
rs
as
of
1/1/
2010
2,
384.
8
-
-
-4
01.9
-
-6
.0
-223
.6
-229
.6
697.
7 2,
451.
0 31
4.1
0.4
2,76
5.5
t
ota
l co
mp
rehe
n-
sive
inco
me
-
-
-
16
7.11)
-1
.2
-0
.1
495.
4 49
4.1
-
66
1.2
7.81)
-
669.
0
t
rans
acti
ons
wit
h
shar
eho
lder
s 35
3.0
-
-
-
-
-
-
-
-
353.
0
-
-
353.
0
of
whi
ch
-
Cap
ital i
ncre
ase
35
3.0
-
-
-
-
-
-
353.
0
-
-
353.
0
as
of
30/6
/201
0 2,
737.
8
-
-
-2
34.8
-1
.2
-6.1
27
1.8
264.
5 69
7.7
3,46
5.2
321.
9 0.
4 3,
787.
5
as
of
1/1/
2011
3,
086.
6 -
- 0.
0 36
.1
-15.
4 -2
2.4
-1.7
35
7.6
3,44
2.5
-
0.
3 3,
442.
8
t
ota
l co
mp
rehe
n-
sive
inco
me
-
-
-
-3
2.7
60.7
0.
2 -2
07.1
-1
46.2
-
-178
.9
-
-
-1
78.9
t
rans
acti
ons
wit
h
shar
eho
lder
s -3
,086
.6
60.0
3,
026.
6 -8
.7
-
-
-
-
4.4
-4
.3
-
-
-4
.3
of
whi
ch
Pai
d in
tere
st
Hyb
rid I
-
-
-
-
-
-
-
-
-4.3
-4
.3
-
-
-4
.3
Inte
rest
from
H
ybrid
II
-
-
-
-8
.7
-
-
-
-
8.
7
-
-
-
-
Cha
nge
of
lega
l for
m
-3,0
86.6
60
.0
3,02
6.6
-
-
-
-
-
-
-
-
-
-
as
of
30/6
/201
1
-
60.0
3,
026.
6 -4
1.4
96.8
-1
5.2
-229
.5
-147
.9
362.
0 3,
259.
3
-
0.3
3,25
9.6
1) T
he p
rese
ntat
ion
for
2010
has
bee
n ad
just
ed.
co
ns
oli
da
te
d s
ta
te
me
nt
of
cH
an
ge
s i
n e
Qu
ity
27
Hapag-lloyd interim group report H1 · 2011 i interim consolidated financial statements
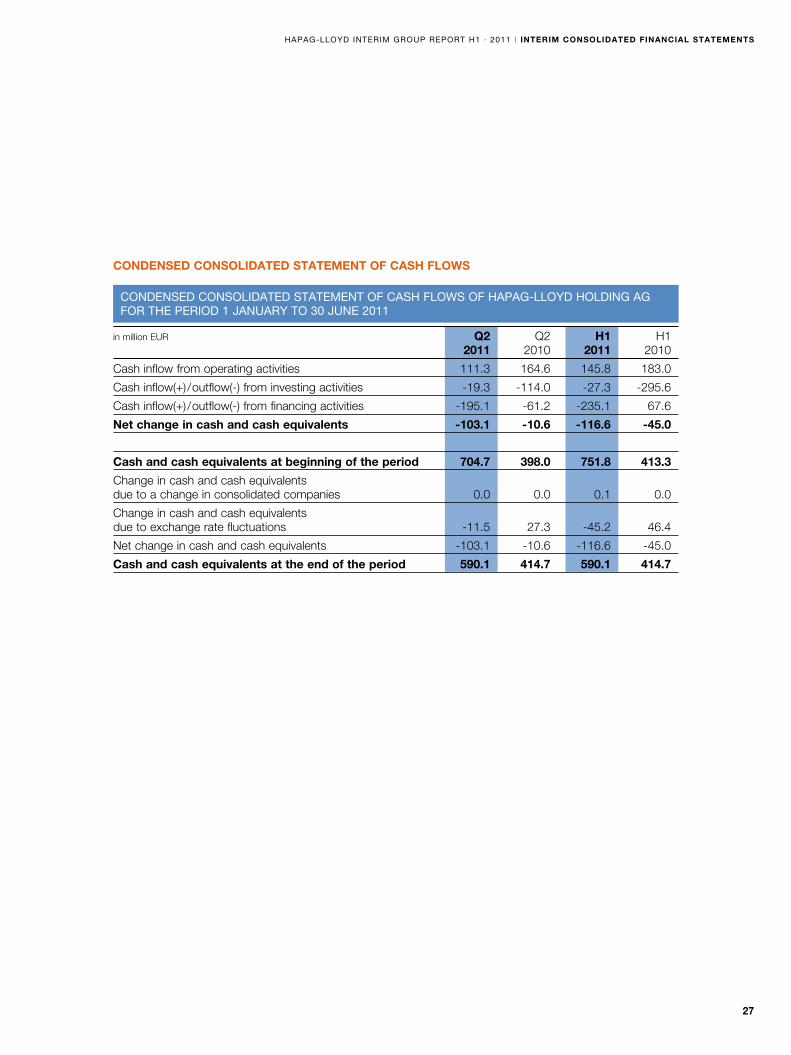
condensed consolidated statement of casH flows
CondenSed ConSolidated Statement oF CaSH FloWS oF Hapag-lloyd Holding ag For tHe period 1 January to 30 June 2011
in million EUR Q2 Q2 H1 H1 2011 2010 2011 2010
Cash inflow from operating activities 111.3 164.6 145.8 183.0
Cash inflow(+)/outflow(-) from investing activities -19.3 -114.0 -27.3 -295.6
Cash inflow(+)/outflow(-) from financing activities -195.1 -61.2 -235.1 67.6
net change in cash and cash equivalents -103.1 -10.6 -116.6 -45.0
cash and cash equivalents at beginning of the period 704.7 398.0 751.8 413.3
Change in cash and cash equivalents due to a change in consolidated companies 0.0 0.0 0.1 0.0
Change in cash and cash equivalents due to exchange rate fluctuations -11.5 27.3 -45.2 46.4
Net change in cash and cash equivalents -103.1 -10.6 -116.6 -45.0
cash and cash equivalents at the end of the period 590.1 414.7 590.1 414.7
28
condensed group notes i Hapag-lloyd interim group report H1 · 2011
notes on tHe principles and metHods underlying tHe interim consolidated
financial statements
General notes
As of 31 March 2011 “Albert Ballin“ Holding GmbH & Co. KG was converted to Hapag-Lloyd Holding AG
by a change of its legal form.
The presented condensed interim consolidated financial statements of Hapag-Lloyd Holding AG and its
subsidiaries, hereinafter referred to as Hapag-Lloyd Group, were prepared for the interim report according
to the International Financial Reporting Standards (IFRS) and the relevant interpretations by the International
Accounting Standards Board (IASB) as they are to be applied in the European Union (EU). Therefore,
these financial statements to the interim report in accordance with IAS 34 do not contain all information and
notes that are necessary according to IFRS for complete consolidated financial statements at the end of a
financial year.
The presented interim consolidated financial statements comprise the period from 1 January to 30 June 2011.
The underlying accounting principles and methods in the interim consolidated financial statements are the
same as those used for the last consolidated financial statements as at the end of the financial year.
Results of interim periods are not necessarily indicative of results that can be expected for future periods
or the entire financial year. The earnings position of the Hapag-Lloyd Group is principally shaped by the
seasonality of transport volumes and freight rates in the container shipping business. Fluctuations result from
the usually higher demand for transport services in the container shipping business during the second and
third quarters.
The interim consolidated financial statements are presented in euros (EUR). All amounts recognised for the
financial year are reported in million euros (EUR million) unless otherwise stated.
The functional currency of Hapag-Lloyd AG and its subsidiaries is the US dollar. For purposes of integration
into the financial statements of the Hapag-Lloyd Group assets and liabilities are translated into euros as of
the reporting date (closing date rate) using the middle rate of that day. Expenses, income and earnings are
translated at the average exchange rate for the reporting period. The resulting differences are recognised
directly in cumulative other equity.
The translation of individual balance sheet items such as fixed assets and financial liabilities results in
part in significant valuation effects due to the strengthening of the euro compared to the US dollar as of the
reporting dates (closing rate: 30 June 2011 USD/EUR 1.4477; 31 December 2010 USD/EUR 1.3386;
average rate: first half 2011 USD/EUR 1.4035; first half 2010 USD/EUR 1.3285).
CondenSed noteS to tHe interim ConSolidated FinanCial StatementS
29
Hapag-lloyd interim group report H1 · 2011 i condensed group notes
Segment reporting
Since the Hapag-Lloyd Holding AG at the time of the preparation of the interim financial statements
as of 30 June 2011 neither traded bonds or equity instruments on any public market nor presented the
consolidated financial statements to regulatory authorities for the emission of instruments, there was
no obligation to prepare any segment reporting as of the reporting date.
Accounting principles applied for the first time
The following new standards and changes of existing standards published by the IASB, for which the
endorsement has already been made, had to be applied for the first time in the interim financial statements
presented; however, there was no significant effect due to the first-time application on the net asset,
financial and earnings position of the Hapag-Lloyd Group:
• IAS 24: Related Party Disclosures
• Amendments to IAS 32: Classification of Rights Issues
• IFRIC 14: Prepayments of a Minimum Funding Requirement
• IFRIC 19: Extinguishing Financial Liabilities with Equity Instruments
• Improvements to IFRS (2010)
Due to the revision of IAS 24 “Related Party Disclosures” the definition of related companies and individuals
was fundamentally amended. Relief provisions regarding “government-related entities” of sections 25 to
27 have already been applied ahead of schedule by the Hapag-Lloyd Group in the annual financial state-
ments for the financial year 2010. These regulations implement exemptions for the reporting of business with
national institutions or companies; only the names and relations to national institutions and companies must
be reported, as well as any significant transactions.
IAS 32 “Classification of Rights Issues” has been amended such that rights issues, options and subscription
warrants must be reported as equity instruments on a fixed number of own shares against a fixed amount in
any currency in so far as these are granted solely to owners of the same category.
The amendment of IFRIC 14 “Prepayments of a Minimum Funding Requirement” relates to pension plans
which include a minimum funding requirement and for which the company pays contributions in advance.
The economic benefit from these prepayments, which reduce future premium payments due to the minimum
funding requirements, is capitalised as an asset.
30
condensed group notes i Hapag-lloyd interim group report H1 · 2011
The newly published interpretation of IFRIC 19 “Extinguishing Financial Liabilities with Equity Instruments”
regulates the accounting for the liable party if newly negotiated contract terms result in financial liabilities
being extinguished through the issuance of own equity instruments in part or in full and if the creditor is an
independent third party. Equity instruments are to be valued at fair value and the difference to the carrying
amount of the extinguished liability is to be recorded affecting net income.
As part of the 2010 improvements to IFRS several smaller changes to the IFRS have been carried out.
These concern IFRS 1 in relation to the use of the revaluation basis as a substitute for acquisition and pro-
duction costs; IFRS 7 in connection with disclosures on the type and scope of risks arising from financial
instruments; IAS 1 in relation to equity offsetting and reconciliation; disclosures in the notes about significant
business transactions as defined by IAS 34; and the valuation of bonus credits in IFRIC 13.
Consolidated companies
The consolidated financial statements include all significant subsidiaries and investments accounted for using
the equity method. Within the interim financial statements as of 30 June 2011 Hapag-Lloyd Holding AG and
49 companies were fully consolidated, and five additional companies were included using the equity method.
As of 1 January 2011, “Albert Ballin” Terminal Holding GmbH, Hamburg, left the group of consolidated
companies due to its merger into Hapag-Lloyd AG, Hamburg. Hapag-Lloyd Nederland B.V., Rotterdam,
was also liquidated in the first half of 2011.
Hapag-Lloyd Guatemala S.A., Guatemala City, and Hapag-Lloyd Special Finance Ltd., Dublin, were fully con -
solidated for the first time on 28 February 2011 and 30 April 2011 respectively after commencing operations.
selected notes to tHe consolidated income statement
Revenue was primarily generated from the rendering of transport services. The increase in revenue compared
with the first half of the previous year is mainly due to higher transport volumes and increased freight rates.
Revenue includes proportional income from unfinished voyages as at the reporting date.
Transport expenses mainly comprise fuel costs, port and terminal costs, container transport costs, charter-
ing, leases and container rental, maintenance and repair costs, and other services. The increase compared
to last year is attributable to higher transport volumes, a rise in the cost of purchased services due to the use
of additional chartered vessels, elevated energy prices and inflation-related increases in costs.
Interest result essentially comprises interest expenses for bank loans and bonds as well as loan interest
on shareholder loans.
31
Hapag-lloyd interim group report H1 · 2011 i condensed group notes
selected notes on tHe consolidated statement of financial position
Goodwill
Goodwill fell by EUR 59.5 million compared with 31 December 2010. Of this decline, EUR 52.1 million was
accounted for by the change in USD/EUR exchange rates, while EUR 7.5 million resulted from the repayment
of a cash deposit for sales collateral by TUI AG, Hannover, which was originally recorded within goodwill.
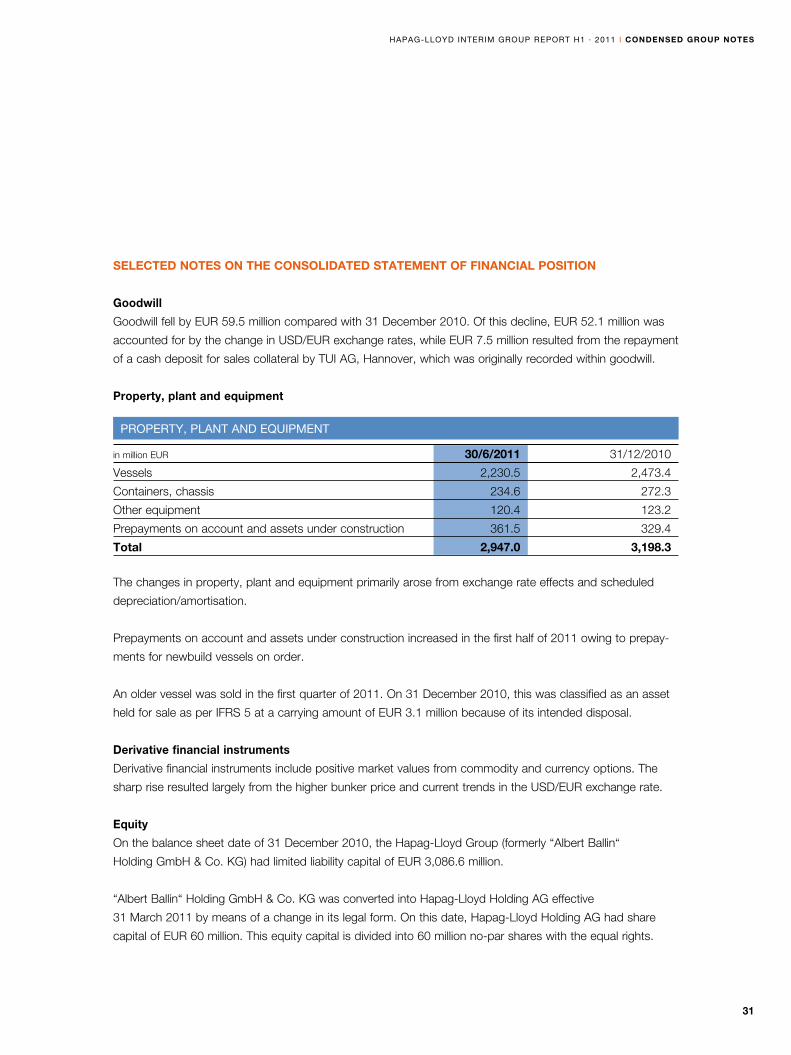
Property, plant and equipment
The changes in property, plant and equipment primarily arose from exchange rate effects and scheduled
depreciation/amortisation.
Prepayments on account and assets under construction increased in the first half of 2011 owing to prepay-
ments for newbuild vessels on order.
An older vessel was sold in the first quarter of 2011. On 31 December 2010, this was classified as an asset
held for sale as per IFRS 5 at a carrying amount of EUR 3.1 million because of its intended disposal.
Derivative financial instruments
Derivative financial instruments include positive market values from commodity and currency options. The
sharp rise resulted largely from the higher bunker price and current trends in the USD/EUR exchange rate.
Equity
On the balance sheet date of 31 December 2010, the Hapag-Lloyd Group (formerly “Albert Ballin“
Holding GmbH & Co. KG) had limited liability capital of EUR 3,086.6 million.
“Albert Ballin“ Holding GmbH & Co. KG was converted into Hapag-Lloyd Holding AG effective
31 March 2011 by means of a change in its legal form. On this date, Hapag-Lloyd Holding AG had share
capital of EUR 60 million. This equity capital is divided into 60 million no-par shares with the equal rights.
property, plant and equipment
in million EUR 30/6/2011 31/12/2010
Vessels 2,230.5 2,473.4
Containers, chassis 234.6 272.3
Other equipment 120.4 123.2
Prepayments on account and assets under construction 361.5 329.4
total 2,947.0 3,198.3
32
condensed group notes i Hapag-lloyd interim group report H1 · 2011
The former paid-in limited liability capital of EUR 3,026.6 million which exceeded share capital was
transferred to capital reserves.
Changes in market values from cash flow hedges which were offset directly against equity caused an
increase of EUR 60.7 million in equity in the first half of 2011 (first half 2010: decrease of EUR 1.2 million).
The effects arising from currency translation recorded in the first six months of 2011 totalled EUR -207.1 million
(first half 2010: EUR 495.4 million). This contains differences from the translation of subsidiary financial
statements prepared in a foreign currency and from the conversion of goodwill carried in foreign currency.
Other provisions
During the purchase price allocation, existing contracts were identified, the contractual terms of which
at the time of acquisition substantiated negative fair values compared with the current market conditions.
The amortisation of these items in the first half of the financial year 2011 essentially led to a reduction in
transport expenses.
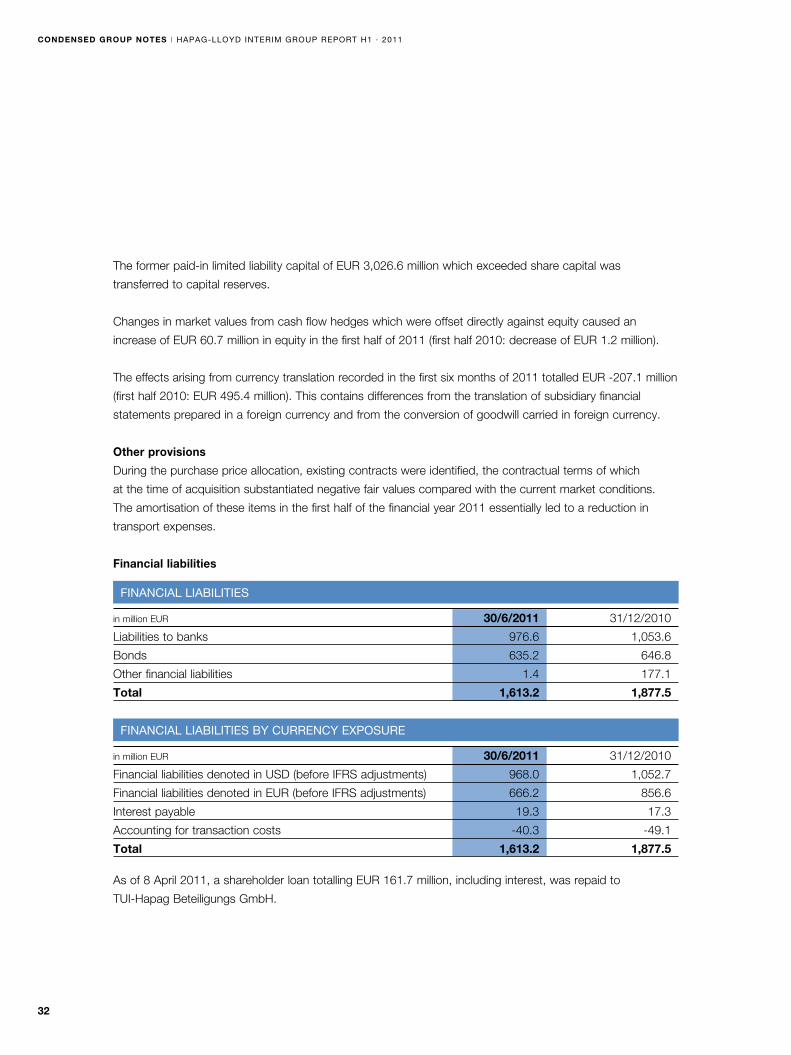
Financial liabilities
As of 8 April 2011, a shareholder loan totalling EUR 161.7 million, including interest, was repaid to
TUI-Hapag Beteiligungs GmbH.
FinanCial liaBilitieS
in million EUR 30/6/2011 31/12/2010
Liabilities to banks 976.6 1,053.6
Bonds 635.2 646.8
Other financial liabilities 1.4 177.1
total 1,613.2 1,877.5
FinanCial liaBilitieS By CurrenCy eXpoSure
in million EUR 30/6/2011 31/12/2010
Financial liabilities denoted in USD (before IFRS adjustments) 968.0 1,052.7
Financial liabilities denoted in EUR (before IFRS adjustments) 666.2 856.6
Interest payable 19.3 17.3
Accounting for transaction costs -40.3 -49.1
total 1,613.2 1,877.5
33
Hapag-lloyd interim group report H1 · 2011 i condensed group notes
Financial liabilities decreased due primarily to scheduled repayments of bank loans and the effect on
exchange rates of the weaker US dollar.
Furthermore, the movement in financial liabilities was offset by the setting up of a securitisation programme
for receivables worth USD 100 million (EUR 69.1 million).
notes to tHe condensed consolidated statement of casH flows
Ordinary business activities resulted in an inflow of cash and cash equivalents totalling EUR 145.8 million
(first half 2010: EUR 183.0 million).
The cash outflow from investing activities amounted to EUR 27.3 million in the first half of the 2011 financial
year (first half 2010: EUR 295.6 million). EUR 73.7 million (first half 2010: EUR 348.8 million) was paid
for investments in property, plant and equipment and other non-current assets in the first six months of
the financial year. The outlays relate in particular to prepayments made for newly built vessels and essential
classification costs (expenses for repairs and maintenance in conjunction with the classification docking
conducted every five years). These were partly offset by incoming payments from the sale of property,
plant and equipment, intangible assets and other non-current assets plus dividends received totalling
EUR 46.4 million (first half 2010: EUR 53.2 million).
The outflow of cash and cash equivalents from financing activities came in at EUR 235.1 million in the
first half of 2011 (first half 2010: inflow of EUR 67.6 million). This was largely due to the repayment of a
shareholder loan to TUI-Hapag Beteiligungs GmbH and the scheduled repayment of bank loans.
otHer notes
Legal disputes
At Hapag-Lloyd Mexico in 2009, tax audits were completed for the financial years 2002 and 2003. The
assessments were received on 21 January 2010 and 26 February 2010 respectively. These oblige the com-
pany to make additional corporate income tax and income tax payments and to pay fines and additional
sums for inflation and other charges. Furthermore, the tax office is demanding that the company allow its
employees to share in the additional profits that were identified. The lawyers handling the case are of the
opinion that the tax assessments are not lawful. The company has lodged objections to the tax assessments
for 2002 and 2003.
34
condensed group notes i Hapag-lloyd interim group report H1 · 2011
Since May 2011, the European Commission has been examining whether EU competition has been violated
since the exemption regulation for liner conferences was abolished in October 2008. There are no grounds
to suggest that Hapag-Lloyd AG violated competition regulations.
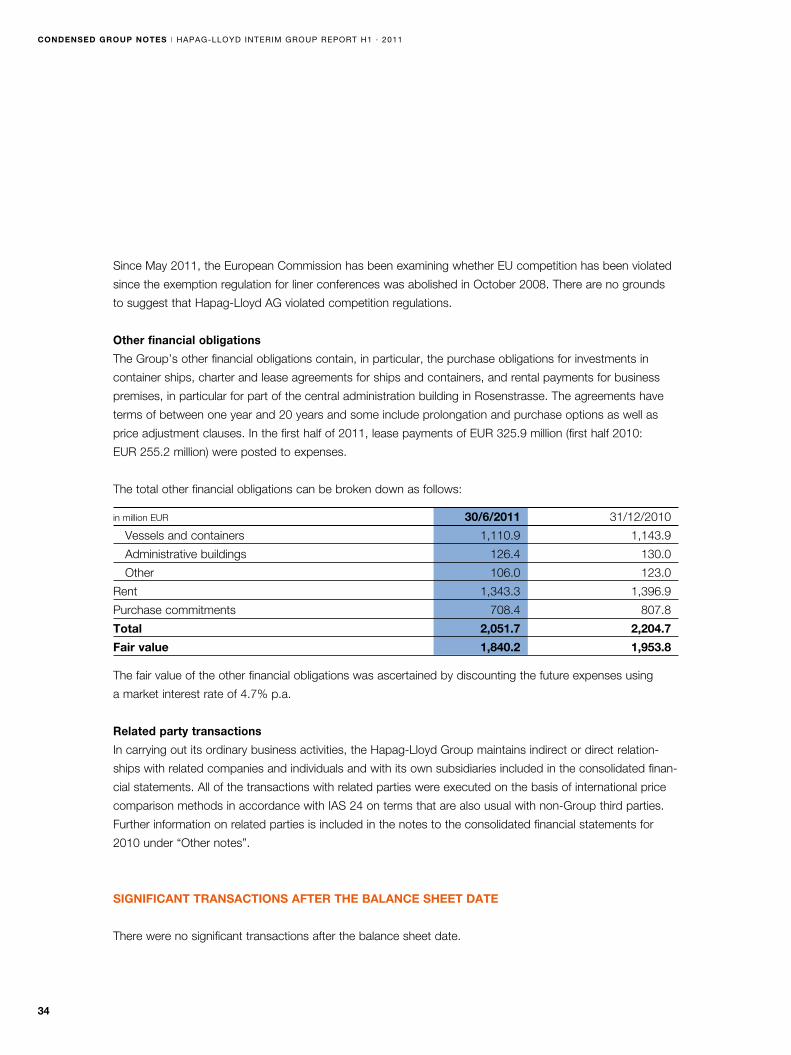
Other financial obligations
The Group’s other financial obligations contain, in particular, the purchase obligations for investments in
container ships, charter and lease agreements for ships and containers, and rental payments for business
premises, in particular for part of the central administration building in Rosenstrasse. The agreements have
terms of between one year and 20 years and some include prolongation and purchase options as well as
price adjustment clauses. In the first half of 2011, lease payments of EUR 325.9 million (first half 2010:
EUR 255.2 million) were posted to expenses.
The total other financial obligations can be broken down as follows:
The fair value of the other financial obligations was ascertained by discounting the future expenses using
a market interest rate of 4.7% p.a.
Related party transactions
In carrying out its ordinary business activities, the Hapag-Lloyd Group maintains indirect or direct relation-
ships with related companies and individuals and with its own subsidiaries included in the consolidated finan-
cial statements. All of the transactions with related parties were executed on the basis of international price
comparison methods in accordance with IAS 24 on terms that are also usual with non-Group third parties.
Further information on related parties is included in the notes to the consolidated financial statements for
2010 under “Other notes”.
significant transactions after tHe balance sHeet date
There were no significant transactions after the balance sheet date.
in million EUR 30/6/2011 31/12/2010
Vessels and containers 1,110.9 1,143.9
Administrative buildings 126.4 130.0
Other 106.0 123.0
Rent 1,343.3 1,396.9
Purchase commitments 708.4 807.8
total 2,051.7 2,204.7
fair value 1,840.2 1,953.8
35
Hamburg, August 2011
Hapag-Lloyd Holding AG
The Executive Board
Michael Behrendt
Peter Ganz Ulrich Kranich Jesper Praestensgaard
Hapag-lloyd interim group report H1 · 2011 i
august 2011 Publication of interim report for second quarter/first six months of 2011
november 2011 Publication of interim report for third quarter/first nine months of 2011
imprint
Hapag-Lloyd AG
Ballindamm 25
20095 Hamburg
Investor Relations
Telephone: +49 (0)40 3001-9150
Fax: +49 (0)40 3001-9155
Group Communication
Telephone: +49 (0)40 3001-2529
Fax: +49 (0)40 335360
www.hapag-lloyd.com
FinanCial Calendar 2011
financial calendar i Hapag-lloyd interim group report H1 · 2011
36

The German version of this Interim Report is legally binding.
The Company cannot be held responsible for any misunderstandings
or misinterpretation arising from translation.
Both versions are available on the web: www.hapag-lloyd.com


Hapag-lloyd ag · Ballindamm 25 · 20095 Hamburg · www.hapag-lloyd.com
© g
roup
Com
mun
icat
ion
08/2
011