interim condensed consolidated financial ... - cma-cgm.com · the accompanying notes are part of...
TRANSCRIPT
INTERIM CONDENSED
CONSOLIDATED FINANCIAL STATEMENTS
* * *
Three-month period ended March 31, 2018
The accompanying notes are part of the interim condensed consolidated financial statements.
CMA CGM / 2 Interim condensed consolidated financial statements Three-month period ended March 31, 2018
Content Interim Condensed Consolidated Statement of Profit & Loss ........................................................................... 3 Interim Condensed Consolidated Statement of Comprehensive Income .......................................................... 4 Interim Condensed Consolidated Statement of Financial Position - Assets ....................................................... 5 Interim Condensed Consolidated Statement of Financial Position - Liabilities & Equity .................................... 6 Interim Condensed Consolidated Statement of changes in Equity ..................................................................... 7 Interim Condensed Consolidated Statement of Cash Flows .............................................................................. 8 Notes to the Interim Condensed Consolidated Financial Statements ............................................................... 9
Note 1 - Corporate information .................................................................................................................. 9 Note 2 - General accounting principles ....................................................................................................... 9
2.1 Basis of preparation ................................................................................................................. 9 2.2 Change in accounting policies and new accounting policies .................................................... 10 2.3 Significant accounting judgments, estimates and assumptions .............................................. 11
Note 3 - Business combinations and significant events .............................................................................. 12 3.1 Business combinations ........................................................................................................... 12 3.2 Group fleet development ........................................................................................................ 12
Note 4 - Results for the period ................................................................................................................... 13 4.1 Operating segments ............................................................................................................... 13 4.2 Operating expenses ................................................................................................................ 14 4.3 Gains / (Losses) on disposal of property and equipment and subsidiaries ................................ 14 4.4 Other income and (expenses) ................................................................................................. 15 4.5 Financial result ....................................................................................................................... 15 4.6 Income and deferred taxes .....................................................................................................16
Note 5 - Invested capital and working capital ............................................................................................ 17 5.1 Goodwill and other intangible assets ...................................................................................... 17 5.2 Property and equipment ......................................................................................................... 18 5.3 Working Capital ..................................................................................................................... 20 5.4 Free cash flow ......................................................................................................................... 21
Note 6 - Capital structure and financial debt ............................................................................................. 22 6.1 Derivative financial instruments ............................................................................................ 22 6.2 Other non-current financial assets - Securities and other current financial assets ................... 23 6.3 Cash and cash equivalents, and liquidity ................................................................................ 24 6.4 Borrowings ............................................................................................................................ 25 6.5 Cash flow from financing activities ........................................................................................ 26
Note 7 - Scope of consolidation ................................................................................................................. 27 7.1 Investments in associates and joint ventures .......................................................................... 27 7.2 Related party transactions ...................................................................................................... 27
Note 8 - Other Notes ................................................................................................................................ 28 8.1 Provisions, employee benefits and contingent liabilities ........................................................ 28 8.2 Commitments ....................................................................................................................... 29 8.3 Significant subsequent events ............................................................................................... 29
The accompanying notes are part of the interim condensed consolidated financial statements.
Interim condensed consolidated financial statements CMA CGM / 3 Three-month period ended March 31, 2018
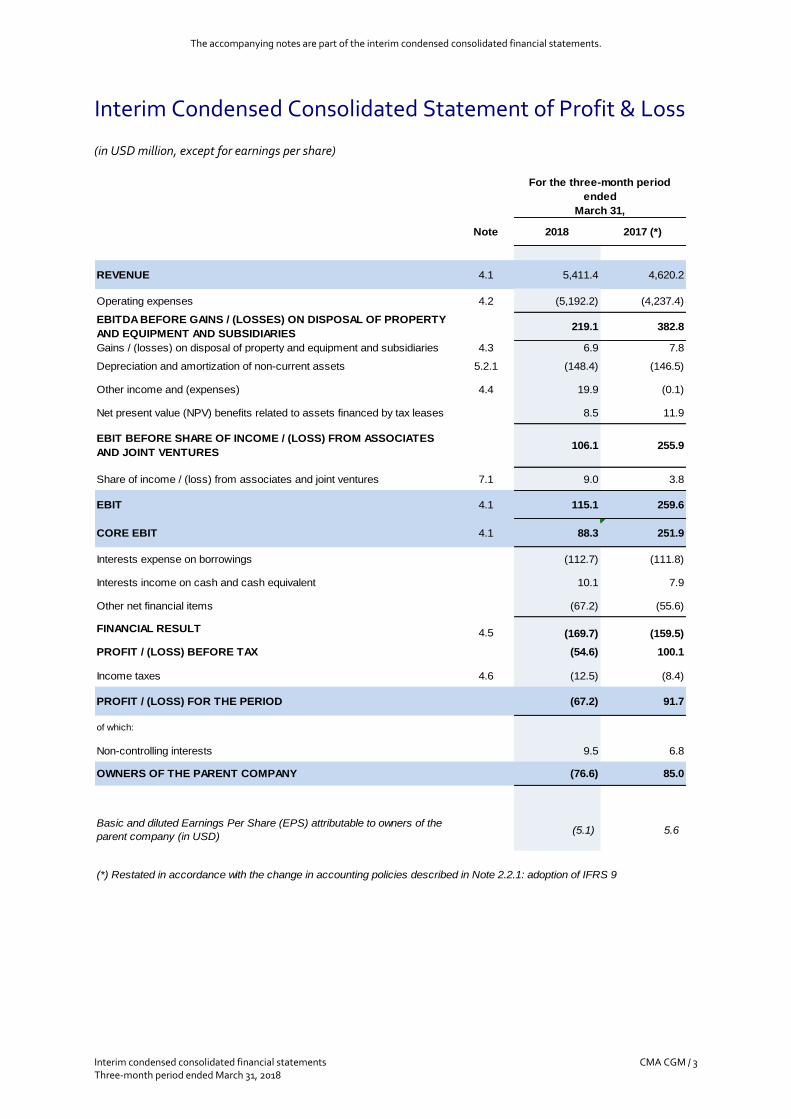
Interim Condensed Consolidated Statement of Profit & Loss
(in USD million, except for earnings per share)
Note 2018 2017 (*)
REVENUE 4.1 5,411.4 4,620.2
Operating expenses 4.2 (5,192.2) (4,237.4)
EBITDA BEFORE GAINS / (LOSSES) ON DISPOSAL OF PROPERTY
AND EQUIPMENT AND SUBSIDIARIES219.1 382.8
Gains / (losses) on disposal of property and equipment and subsidiaries 4.3 6.9 7.8
Depreciation and amortization of non-current assets 5.2.1 (148.4) (146.5)
Other income and (expenses) 4.4 19.9 (0.1)
Net present value (NPV) benefits related to assets financed by tax leases 8.5 11.9
EBIT BEFORE SHARE OF INCOME / (LOSS) FROM ASSOCIATES
AND JOINT VENTURES106.1 255.9
Share of income / (loss) from associates and joint ventures 7.1 9.0 3.8
EBIT 4.1 115.1 259.6
CORE EBIT 4.1 88.3 251.9
Interests expense on borrowings (112.7) (111.8)
Interests income on cash and cash equivalent 10.1 7.9
Other net financial items (67.2) (55.6)
FINANCIAL RESULT 4.5 (169.7) (159.5)
PROFIT / (LOSS) BEFORE TAX (54.6) 100.1
Income taxes 4.6 (12.5) (8.4)
PROFIT / (LOSS) FOR THE PERIOD (67.2) 91.7
of which:
Non-controlling interests 9.5 6.8
OWNERS OF THE PARENT COMPANY (76.6) 85.0
Basic and diluted Earnings Per Share (EPS) attributable to owners of the
parent company (in USD) (5.1) 5.6
(*) Restated in accordance with the change in accounting policies described in Note 2.2.1: adoption of IFRS 9
For the three-month period
ended
March 31,
The accompanying notes are part of the interim condensed consolidated financial statements.
Interim condensed consolidated financial statements CMA CGM / 4 Three-month period ended March 31, 2018
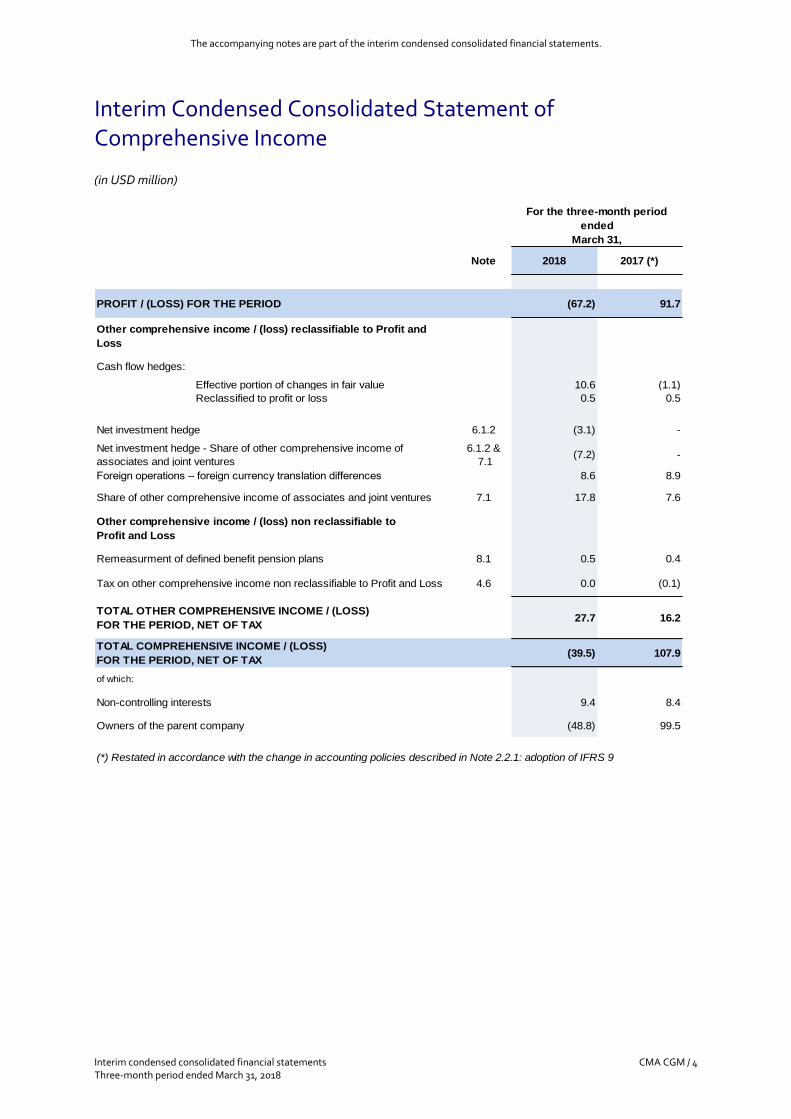
Interim Condensed Consolidated Statement of Comprehensive Income
(in USD million)
Note 2018 2017 (*)
PROFIT / (LOSS) FOR THE PERIOD (67.2) 91.7
Other comprehensive income / (loss) reclassifiable to Profit and
Loss
Cash flow hedges:
Effective portion of changes in fair value 10.6 (1.1)
Reclassified to profit or loss 0.5 0.5
Net investment hedge 6.1.2 (3.1) -
Net investment hedge - Share of other comprehensive income of
associates and joint ventures
6.1.2 &
7.1(7.2) -
Foreign operations – foreign currency translation differences 8.6 8.9
Share of other comprehensive income of associates and joint ventures 7.1 17.8 7.6
Other comprehensive income / (loss) non reclassifiable to
Profit and Loss
Remeasurment of defined benefit pension plans 8.1 0.5 0.4
Tax on other comprehensive income non reclassifiable to Profit and Loss 4.6 0.0 (0.1)
TOTAL OTHER COMPREHENSIVE INCOME / (LOSS)
FOR THE PERIOD, NET OF TAX27.7 16.2
TOTAL COMPREHENSIVE INCOME / (LOSS)
FOR THE PERIOD, NET OF TAX(39.5) 107.9
of which:
Non-controlling interests 9.4 8.4
Owners of the parent company (48.8) 99.5
(*) Restated in accordance with the change in accounting policies described in Note 2.2.1: adoption of IFRS 9
For the three-month period
ended
March 31,
The accompanying notes are part of the interim condensed consolidated financial statements.
Interim condensed consolidated financial statements CMA CGM / 5 Three-month period ended March 31, 2018
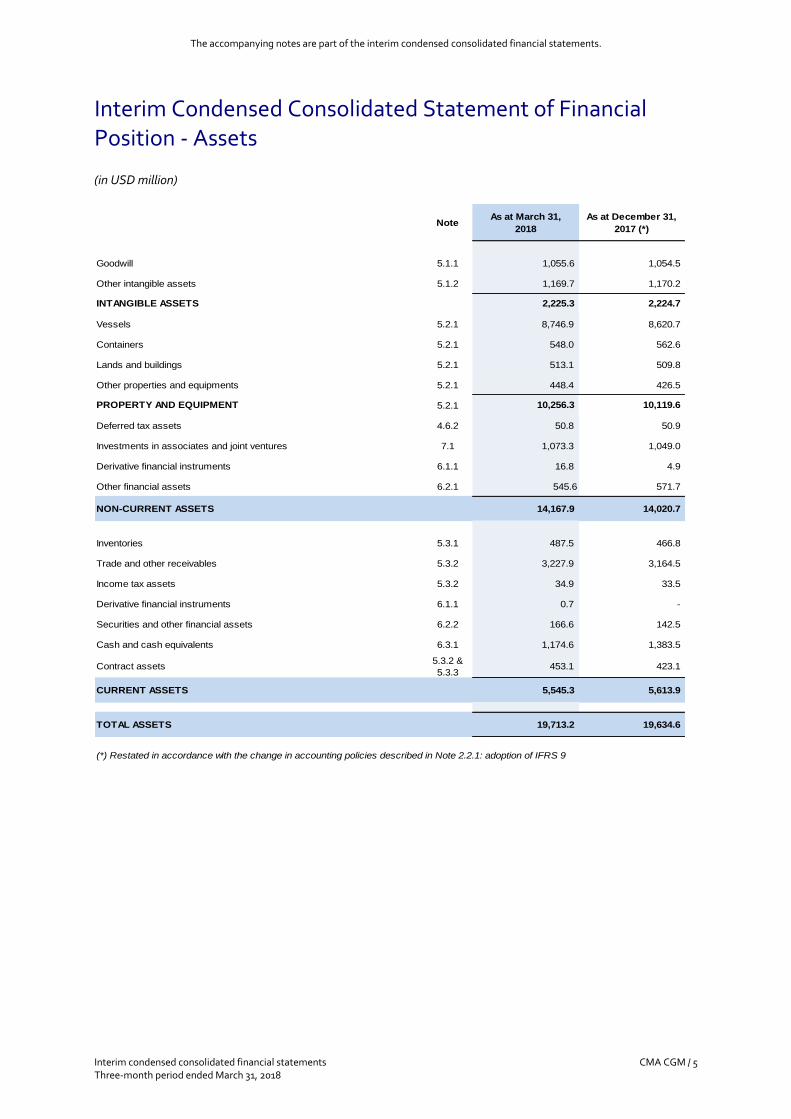
Interim Condensed Consolidated Statement of Financial Position - Assets
(in USD million)
ASSETS NoteAs at March 31,
2018
As at December 31,
2017 (*)
Goodwill 5.1.1 1,055.6 1,054.5
Other intangible assets 5.1.2 1,169.7 1,170.2
INTANGIBLE ASSETS 2,225.3 2,224.7
Vessels 5.2.1 8,746.9 8,620.7
Containers 5.2.1 548.0 562.6
Lands and buildings 5.2.1 513.1 509.8
Other properties and equipments 5.2.1 448.4 426.5
PROPERTY AND EQUIPMENT 5.2.1 10,256.3 10,119.6
Deferred tax assets 4.6.2 50.8 50.9
Investments in associates and joint ventures 7.1 1,073.3 1,049.0
Derivative financial instruments 6.1.1 16.8 4.9
Other financial assets 6.2.1 545.6 571.7
NON-CURRENT ASSETS 14,167.9 14,020.7
Inventories 5.3.1 487.5 466.8
Trade and other receivables 5.3.2 3,227.9 3,164.5
Income tax assets 5.3.2 34.9 33.5
Derivative financial instruments 6.1.1 0.7 -
Securities and other financial assets 6.2.2 166.6 142.5
Cash and cash equivalents 6.3.1 1,174.6 1,383.5
Contract assets5.3.2 &
5.3.3453.1 423.1
CURRENT ASSETS 5,545.3 5,613.9
TOTAL ASSETS 19,713.2 19,634.6
(*) Restated in accordance with the change in accounting policies described in Note 2.2.1: adoption of IFRS 9
The accompanying notes are part of the interim condensed consolidated financial statements.
Interim condensed consolidated financial statements CMA CGM / 6 Three-month period ended March 31, 2018
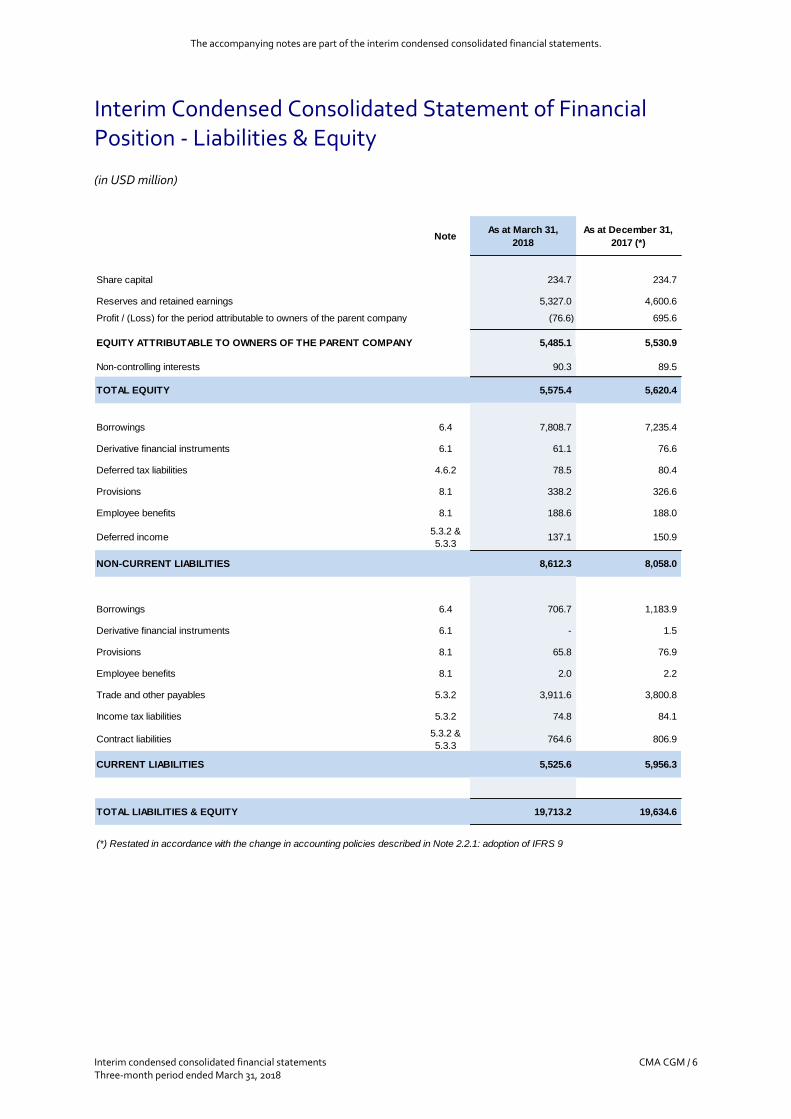
Interim Condensed Consolidated Statement of Financial Position - Liabilities & Equity
(in USD million)
LIABILITIES AND EQUITY NoteAs at March 31,
2018
As at December 31,
2017 (*)
Share capital 234.7 234.7
Reserves and retained earnings 5,327.0 4,600.6
Profit / (Loss) for the period attributable to owners of the parent company (76.6) 695.6
EQUITY ATTRIBUTABLE TO OWNERS OF THE PARENT COMPANY 5,485.1 5,530.9
Non-controlling interests 90.3 89.5
TOTAL EQUITY 5,575.4 5,620.4
Borrowings 6.4 7,808.7 7,235.4
Derivative financial instruments 6.1 61.1 76.6
Deferred tax liabilities 4.6.2 78.5 80.4
Provisions 8.1 338.2 326.6
Employee benefits 8.1 188.6 188.0
Deferred income5.3.2 &
5.3.3137.1 150.9
NON-CURRENT LIABILITIES 8,612.3 8,058.0
Borrowings 6.4 706.7 1,183.9
Derivative financial instruments 6.1 - 1.5
Provisions 8.1 65.8 76.9
Employee benefits 8.1 2.0 2.2
Trade and other payables 5.3.2 3,911.6 3,800.8
Income tax liabilities 5.3.2 74.8 84.1
Contract liabilities5.3.2 &
5.3.3764.6 806.9
CURRENT LIABILITIES 5,525.6 5,956.3
TOTAL LIABILITIES & EQUITY 19,713.2 19,634.6
(*) Restated in accordance with the change in accounting policies described in Note 2.2.1: adoption of IFRS 9
The accompanying notes are part of the interim condensed consolidated financial statements.
Interim condensed consolidated financial statements CMA CGM / 7 Three-month period ended March 31, 2018
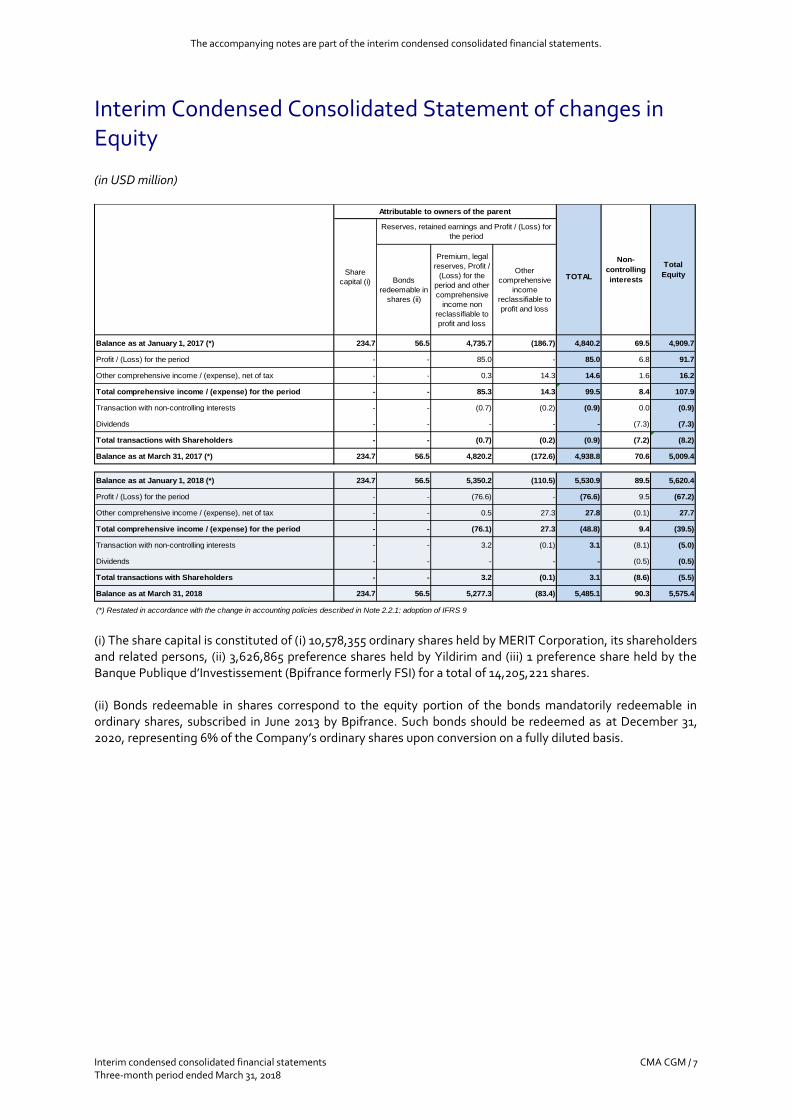
Interim Condensed Consolidated Statement of changes in Equity
(in USD million)
Bonds
redeemable in
shares (ii)
Premium, legal
reserves, Profit /
(Loss) for the
period and other
comprehensive
income non
reclassifiable to
profit and loss
Other
comprehensive
income
reclassifiable to
profit and loss
Balance as at January 1, 2017 (*) 234.7 56.5 4,735.7 (186.7) 4,840.2 69.5 4,909.7
Profit / (Loss) for the period - - 85.0 - 85.0 6.8 91.7
- - 0.3 14.3 14.6 1.6 16.2
Total comprehensive income / (expense) for the period - - 85.3 14.3 99.5 8.4 107.9
Transaction with non-controlling interests - - (0.7) (0.2) (0.9) 0.0 (0.9)
Dividends - - - - - (7.3) (7.3)
Total transactions with Shareholders - - (0.7) (0.2) (0.9) (7.2) (8.2)
Balance as at March 31, 2017 (*) 234.7 56.5 4,820.2 (172.6) 4,938.8 70.6 5,009.4
Balance as at January 1, 2018 (*) 234.7 56.5 5,350.2 (110.5) 5,530.9 89.5 5,620.4
Profit / (Loss) for the period - - (76.6) - (76.6) 9.5 (67.2)
- - 0.5 27.3 27.8 (0.1) 27.7
Total comprehensive income / (expense) for the period - - (76.1) 27.3 (48.8) 9.4 (39.5)
Transaction with non-controlling interests - - 3.2 (0.1) 3.1 (8.1) (5.0)
Dividends - - - - - (0.5) (0.5)
Total transactions with Shareholders - - 3.2 (0.1) 3.1 (8.6) (5.5)
Balance as at March 31, 2018 234.7 56.5 5,277.3 (83.4) 5,485.1 90.3 5,575.4
(*) Restated in accordance with the change in accounting policies described in Note 2.2.1: adoption of IFRS 9
Non-
controlling
interestsTOTAL
Attributable to owners of the parent
Reserves, retained earnings and Profit / (Loss) for
the period
Total
Equity
Other comprehensive income / (expense), net of tax
Share
capital (i)
Other comprehensive income / (expense), net of tax
(i) The share capital is constituted of (i) 10,578,355 ordinary shares held by MERIT Corporation, its shareholders and related persons, (ii) 3,626,865 preference shares held by Yildirim and (iii) 1 preference share held by the Banque Publique d’Investissement (Bpifrance formerly FSI) for a total of 14,205,221 shares. (ii) Bonds redeemable in shares correspond to the equity portion of the bonds mandatorily redeemable in ordinary shares, subscribed in June 2013 by Bpifrance. Such bonds should be redeemed as at December 31, 2020, representing 6% of the Company’s ordinary shares upon conversion on a fully diluted basis.
The accompanying notes are part of the interim condensed consolidated financial statements.
Interim condensed consolidated financial statements CMA CGM / 8 Three-month period ended March 31, 2018
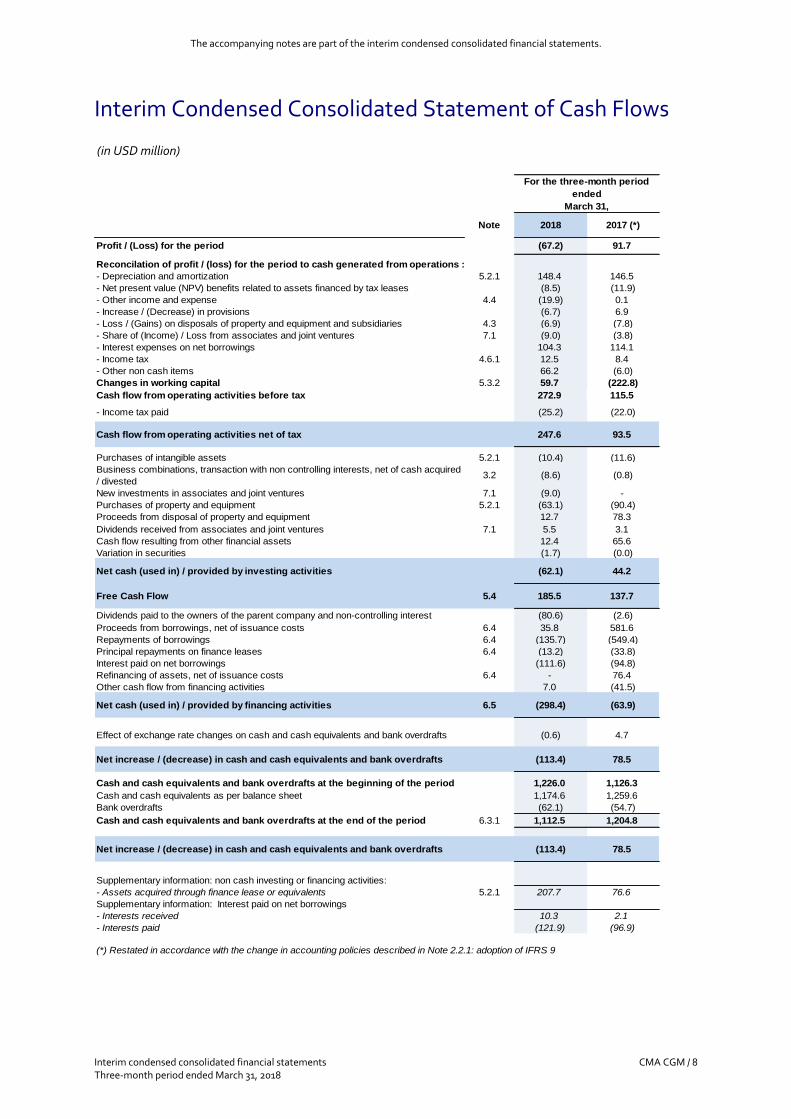
Interim Condensed Consolidated Statement of Cash Flows
(in USD million)
Note 2018 2017 (*)
Profit / (Loss) for the period (67.2) 91.7
Reconcilation of profit / (loss) for the period to cash generated from operations :
- Depreciation and amortization 5.2.1 148.4 146.5
- Net present value (NPV) benefits related to assets financed by tax leases (8.5) (11.9)
- Other income and expense 4.4 (19.9) 0.1
- Increase / (Decrease) in provisions (6.7) 6.9
- Loss / (Gains) on disposals of property and equipment and subsidiaries 4.3 (6.9) (7.8)
- Share of (Income) / Loss from associates and joint ventures 7.1 (9.0) (3.8)
- Interest expenses on net borrowings 104.3 114.1
- Income tax 4.6.1 12.5 8.4
- Other non cash items 66.2 (6.0)
Changes in working capital 5.3.2 59.7 (222.8)
Cash flow from operating activities before tax 272.9 115.5
- Income tax paid (25.2) (22.0)
Cash flow from operating activities net of tax 247.6 93.5
Purchases of intangible assets 5.2.1 (10.4) (11.6)
Business combinations, transaction with non controlling interests, net of cash acquired
/ divested3.2 (8.6) (0.8)
New investments in associates and joint ventures 7.1 (9.0) -
Purchases of property and equipment 5.2.1 (63.1) (90.4)
Proceeds from disposal of property and equipment 12.7 78.3
Dividends received from associates and joint ventures 7.1 5.5 3.1
Cash flow resulting from other financial assets 12.4 65.6
Variation in securities (1.7) (0.0)
Net cash (used in) / provided by investing activities (62.1) 44.2
Free Cash Flow 5.4 185.5 137.7
Dividends paid to the owners of the parent company and non-controlling interest (80.6) (2.6)
Proceeds from borrowings, net of issuance costs 6.4 35.8 581.6
Repayments of borrowings 6.4 (135.7) (549.4)
Principal repayments on finance leases 6.4 (13.2) (33.8)
Interest paid on net borrowings (111.6) (94.8)
Refinancing of assets, net of issuance costs 6.4 - 76.4
Other cash flow from financing activities 7.0 (41.5)
Net cash (used in) / provided by financing activities 6.5 (298.4) (63.9)
Effect of exchange rate changes on cash and cash equivalents and bank overdrafts (0.6) 4.7
Net increase / (decrease) in cash and cash equivalents and bank overdrafts (113.4) 78.5
Cash and cash equivalents and bank overdrafts at the beginning of the period 1,226.0 1,126.3
Cash and cash equivalents as per balance sheet 1,174.6 1,259.6
Bank overdrafts (62.1) (54.7)
Cash and cash equivalents and bank overdrafts at the end of the period 6.3.1 1,112.5 1,204.8
Net increase / (decrease) in cash and cash equivalents and bank overdrafts (113.4) 78.5
Supplementary information: non cash investing or financing activities:
- Assets acquired through finance lease or equivalents 5.2.1 207.7 76.6
Supplementary information: Interest paid on net borrowings
- Interests received 10.3 2.1
- Interests paid (121.9) (96.9)
(*) Restated in accordance with the change in accounting policies described in Note 2.2.1: adoption of IFRS 9
For the three-month period
ended
March 31,
Interim condensed consolidated financial statements CMA CGM / 9 Three-month period ended March 31, 2018
Notes to the Interim Condensed Consolidated Financial Statements
Note 1 - Corporate information The interim condensed Consolidated Financial Statements (“CFS”) of CMA CGM S.A. (“CMA CGM”) and its subsidiaries (hereafter referred to together as “the Group” or “the Company”) for the three-month period ended March 31, 2018 were approved by the Board of Directors on May 25, 2018. The Group is headquartered in France and is one of the largest container shipping company in the world. The Group operates primarily in the international containerized transportation of goods. Other activities mainly include container terminal operations and freight forwarding. CMA CGM S.A. is a limited liability company (“Société Anonyme”) incorporated and located in France. The address of its registered office is 4, Quai d’Arenc, 13002 Marseille, France.
Note 2 - General accounting principles
2.1 Basis of preparation The interim condensed CFS of CMA CGM for the three-month period ended March 31, 2018 have been prepared in accordance with IAS 34 “Interim Financial Reporting” and under the historical cost basis, with the exception of available-for-sale financial assets, securities, derivative financial instruments and net assets acquired through business combinations which have all been measured at fair value.
2.1.1 Statement of compliance The interim condensed CFS do not include all the information and disclosures required in the annual financial statements prepared in accordance with IFRS as adopted by the European Union, and should be read in conjunction with the Group’s audited annual consolidated financial statements for the year ended December 31, 2017. However, selected explanatory notes are included to explain events and transactions that are significant to an understanding of the changes in the Group’s financial position and performance since the last financial statements. IFRSs can be found at: www.ec.europa.eu/internal_market/accounting/ias/index_en.htm IFRSs include the standards approved by the IASB, that is, IAS and accounting interpretations issued by the IFRIC or the former SIC.
2.1.2 Basis of consolidation The CFS comprise:
▪ the financial statements of CMA CGM;
▪ the financial statements of its subsidiaries; and
▪ the share in the net result and the net asset of associates and joint ventures. The CFS are presented in U.S. Dollars (“USD”), which is also the currency of the primary economic environment in which CMA CGM operates (the “functional currency”). The functional currency of the shipping activities is U.S. Dollars. This means that, among other things, the carrying amounts of property, plant and equipment and intangible assets and, hence, depreciation and amortization are maintained in USD from the date of acquisition. For other activities, the functional currency is generally the local currency of the country in which such activities are operated.
Interim condensed consolidated financial statements CMA CGM / 10 Three-month period ended March 31, 2018
All values are rounded to the nearest million (USD 000,000) with a decimal unless otherwise indicated.
2.2 Change in accounting policies and new accounting policies The accounting policies adopted in the preparation of these CFS have been applied consistently with those described in the annual consolidated financial statements for the year ended December 31, 2017, except as outlined in the paragraphs below.
2.2.1 Adoption of new and amended IFRS and IFRIC interpretations from January 1, 2018 IFRS 9: Financial instruments This new standard replaces the existing guidance in IAS 39 “Financial instruments: Recognition and measurement”. IFRS 9 includes revised guidance on the classification and measurement of financial instruments, a new expected credit loss model for calculating impairment on financial assets, and new general hedge accounting requirements. The guidance on recognition and derecognition of financial instruments is carried forward from current IAS 39 principles. Management assessed that this new standard had the following impacts on the CFS which have been applied in accordance with transition guidelines:
▪ Classification and measurement of financial assets and liabilities : the implementation of IFRS 9 did
not affect the current classification and measurement of the Group’s financial instruments; the review of financial liabilities modifications led the Group to slightly adjust the carrying value of some borrowings (see Note 6.6), for an amount impacting equity by USD (1.2) million and USD (1.9) million as of January 1, 2018 and 2017, respectively; the impact on profit and loss amounts to USD 0.6 million for the three month period ended March 31, 2017;
▪ Depreciation of financial assets : the change from the “incurred loss” model under IAS 39 to the “expected credit loss” model under IFRS 9 has impacted the Group’s equity for an amount of USD (22.6) million and USD (16.0) million as of January 1, 2018 and 2017, respectively; the impact on profit and loss amounts to USD (2.0) million for the three month period ended March 31, 2017; the above impacts relate to the Group’s current and non current financial assets (see Note 6.2;1) and the Group’s cash equivalents (see Note 6.3.1).
Regarding depreciation of the Group’s trade receivables, to date, Management did not identify material changes compared to the impacts currently recorded.
▪ Hedge accounting : the new standard does not materially change the hedging relationships as welle as the accounting cnsequences therefrom, based on the current derivative financial instruments’ portfolio.
IFRS 15 and amendments to IFRS 15: Revenue from contracts with customers IFRS 15 was initially issued in May 2014 by the IASB on the recognition of revenue from contracts with customers. The core principle of the new standard is for companies to recognize revenue to depict the transfer of goods or services to customers in amounts that reflect the consideration (that is, payment) to which the company expects to be entitled in exchange for those goods or services. The new Standard also results in enhanced disclosures about revenue, provide guidance for transactions that were not previously addressed comprehensively (for example, service revenue and contract modifications) and improve guidance for multiple-element arrangements. As disclosed in the 2017 annual CFS, CMA CGM practice for revenue recognition under the previsous standard, based on the percentage of completion, is still an appropriate method under the new standard. Management assessed that there was a single performance obligation per shipment in the shipping container business.
Interim condensed consolidated financial statements CMA CGM / 11 Three-month period ended March 31, 2018
Further analysis has been performed regarding freight forwarding activity for which one could see the freight forwarder as an agent rather than a principal. However, the result of the analysis performed regarding the responsibility of the Group subsidiaries operating in such business, with regards to the customers, concluded that those entities were the primary responsible of determining the transaction price, delivering the performance obligation and dealing with the customer’s credit risk. As a result, such entities were determined as being principal rather than agent and hence, the freight forwarding revenue has been maintained in the Group’s revenue rather than only accounting the net remuneration derived from the obligation. Hence, the new standard did not have any material impact on the the Group’s financial position and performance. The following amended Standards did not have any significant impact on the Group’s CFS and performance: Amendments to IAS 40: Transfer of Investment Property Amendments to IFRS 2: Classification and Measurement of Share-based payments transactions Amendments to IFRS 4: Applying IFRS 9 Financial instruments with IFRS 4 Insurance contracts Annual improvements to IFRS 2014-2016
2.2.2 New IFRS and IFRIC interpretations effective for the financial year beginning after January 1, 2018, endorsed by the European Union and not early adopted
IFRS 16: Leases: adopted by the European Union on November 9, 2017; effective date January 1, 2019 with earlier application permitted The Group pursued the activities relating to the IFRS 16 implementation project in the first quarter of 2018. There has been no new significant findings compared to the information disclosed in the 2017 annual CFS.
2.2.3 New IFRS and IFRIC interpretations effective for the financial year beginning on or after January 1, 2018 and not yet endorsed by the European Union
The impacts of the following new or amended Standards are currently being assessed by the Company:
▪ New IFRS and IFRIC interpretations effective for the financial year beginning on January 1, 2018 and not yet endorsed by the European Union
IFRS 14: Regulatory Deferral Accounts
▪ New IFRS and IFRIC interpretations effective for the financial year beginning after January 1, 2018 and not yet endorsed by the European Union
Amendments to IFRS 10 and IAS 28: Sale or Contribution of Assets between an Investor and its Associate or Joint Venture IFRIC 22: Foreign Currency Transactions and Advance Consideration IFRIC 23: Uncertainty over Income Tax Treatments IFRS 17: Insurance contracts
2.3 Significant accounting judgments, estimates and assumptions The preparation of the interim condensed CFS requires the use of judgments, estimates and assumptions that affect the reported amount of revenues, expenses, assets, liabilities and the disclosure of contingent liabilities at the reporting date.
Interim condensed consolidated financial statements CMA CGM / 12 Three-month period ended March 31, 2018
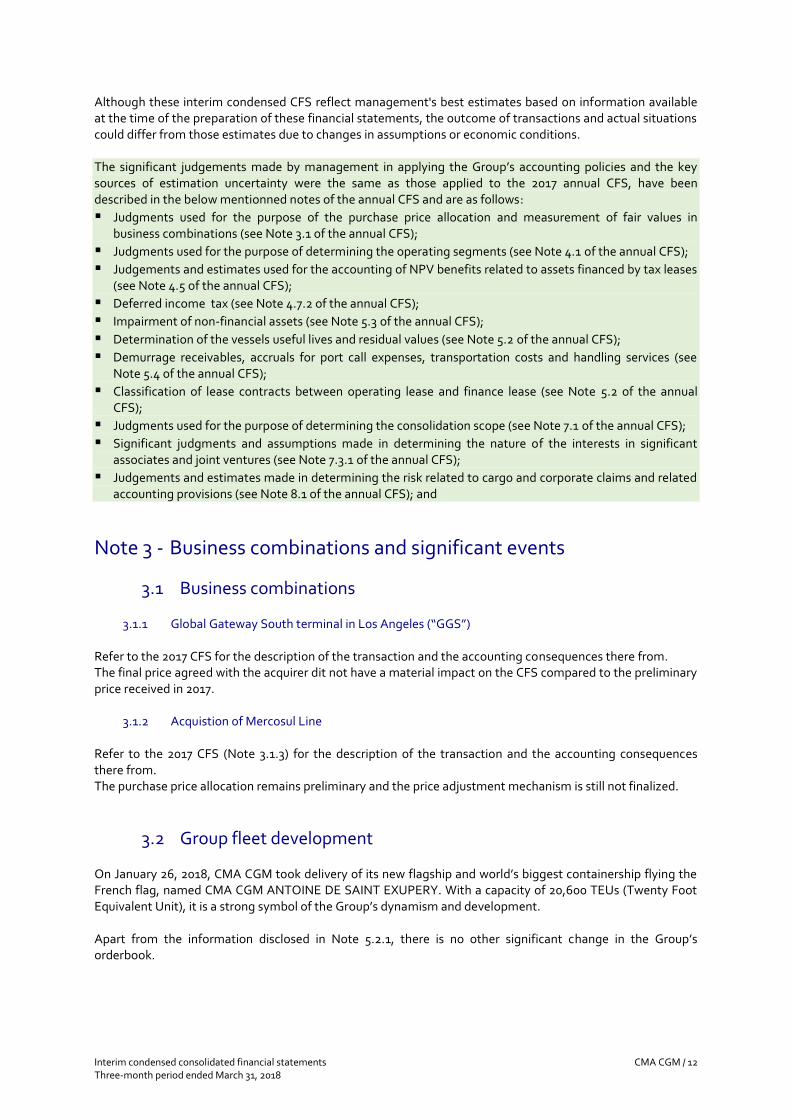
Although these interim condensed CFS reflect management's best estimates based on information available at the time of the preparation of these financial statements, the outcome of transactions and actual situations could differ from those estimates due to changes in assumptions or economic conditions. The significant judgements made by management in applying the Group’s accounting policies and the key sources of estimation uncertainty were the same as those applied to the 2017 annual CFS, have been described in the below mentionned notes of the annual CFS and are as follows:
▪ Judgments used for the purpose of the purchase price allocation and measurement of fair values in business combinations (see Note 3.1 of the annual CFS);
▪ Judgments used for the purpose of determining the operating segments (see Note 4.1 of the annual CFS);
▪ Judgements and estimates used for the accounting of NPV benefits related to assets financed by tax leases (see Note 4.5 of the annual CFS);
▪ Deferred income tax (see Note 4.7.2 of the annual CFS);
▪ Impairment of non-financial assets (see Note 5.3 of the annual CFS);
▪ Determination of the vessels useful lives and residual values (see Note 5.2 of the annual CFS);
▪ Demurrage receivables, accruals for port call expenses, transportation costs and handling services (see Note 5.4 of the annual CFS);
▪ Classification of lease contracts between operating lease and finance lease (see Note 5.2 of the annual CFS);
▪ Judgments used for the purpose of determining the consolidation scope (see Note 7.1 of the annual CFS);
▪ Significant judgments and assumptions made in determining the nature of the interests in significant associates and joint ventures (see Note 7.3.1 of the annual CFS);
▪ Judgements and estimates made in determining the risk related to cargo and corporate claims and related accounting provisions (see Note 8.1 of the annual CFS); and
Note 3 - Business combinations and significant events
3.1 Business combinations
3.1.1 Global Gateway South terminal in Los Angeles (“GGS”) Refer to the 2017 CFS for the description of the transaction and the accounting consequences there from. The final price agreed with the acquirer dit not have a material impact on the CFS compared to the preliminary price received in 2017.
3.1.2 Acquistion of Mercosul Line Refer to the 2017 CFS (Note 3.1.3) for the description of the transaction and the accounting consequences there from. The purchase price allocation remains preliminary and the price adjustment mechanism is still not finalized.
3.2 Group fleet development On January 26, 2018, CMA CGM took delivery of its new flagship and world’s biggest containership flying the French flag, named CMA CGM ANTOINE DE SAINT EXUPERY. With a capacity of 20,600 TEUs (Twenty Foot Equivalent Unit), it is a strong symbol of the Group’s dynamism and development. Apart from the information disclosed in Note 5.2.1, there is no other significant change in the Group’s orderbook.

Interim condensed consolidated financial statements CMA CGM / 13 Three-month period ended March 31, 2018
Note 4 - Results for the period
4.1 Operating segments The segment information for the reportable segments for three-month period ended March 31, 2018 and 2017 is as follows:
2018 2017 2018 2017
Container shipping segment 5,263.1 4,520.8 79.7 234.2
Other activities 291.7 287.9 8.6 17.7
Total core measures 5,554.8 4,808.7 88.3 251.9
Reconciling items & Eliminations (143.5) (188.5) 26.8 7.7
Total consolidated measures 5,411.4 4,620.2 115.1 259.6
For the three-month period ended March 31,
Revenue EBIT
Certain items included in EBIT are unallocated as management considers that they do not affect the recurring operating performance of the Group. As a consequence, these items are not reported in the line item “Total Core measures”. Reconciling items impacting EBIT include (i) the impact of the disposal of property and equipment and subsidiaries (see Note 4.3), (ii) other income and expenses (see Note 4.4) and (iii) potential impairment charge in associates and joint ventures – None in the three-month period ended March 31, 2018 (see Note 7.1). Since most of the Group’s assets and liabilities are allocated to the container shipping segment and that this information is reviewed by the chief operating decision maker only on a consolidated basis, there is no specific disclosure relative to their segment allocation. Regarding the investment in associates and joint ventures which primarily relates to the “Other activities” segment, see Note 7.1. Seasonality The Company usually experiences seasonality in its activity characterized by a higher level of demand in the summer-fall period. As a result of these seasonal fluctuations, the Company’s cash flows from operations and revenue are not evenly distributed between quarters over the year.
Interim condensed consolidated financial statements CMA CGM / 14 Three-month period ended March 31, 2018
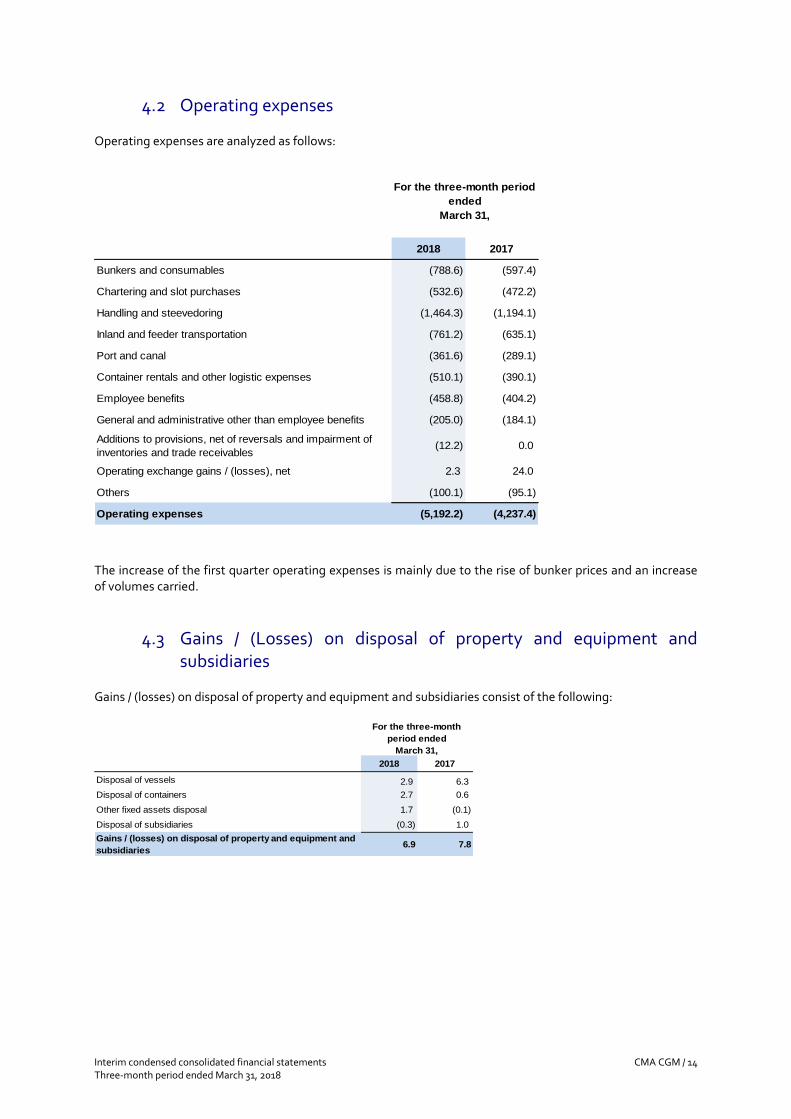
4.2 Operating expenses Operating expenses are analyzed as follows:
2018 2017
Bunkers and consumables (788.6) (597.4)
Chartering and slot purchases (532.6) (472.2)
Handling and steevedoring (1,464.3) (1,194.1)
Inland and feeder transportation (761.2) (635.1)
Port and canal (361.6) (289.1)
Container rentals and other logistic expenses (510.1) (390.1)
Employee benefits (458.8) (404.2)
General and administrative other than employee benefits (205.0) (184.1)
Additions to provisions, net of reversals and impairment of
inventories and trade receivables(12.2) 0.0
Operating exchange gains / (losses), net 2.3 24.0
Others (100.1) (95.1)
Operating expenses (5,192.2) (4,237.4)
For the three-month period
ended
March 31,
The increase of the first quarter operating expenses is mainly due to the rise of bunker prices and an increase of volumes carried.
4.3 Gains / (Losses) on disposal of property and equipment and subsidiaries
Gains / (losses) on disposal of property and equipment and subsidiaries consist of the following:
2018 2017
Disposal of vessels 2.9 6.3
Disposal of containers 2.7 0.6
Other fixed assets disposal 1.7 (0.1)
Disposal of subsidiaries (0.3) 1.0
Gains / (losses) on disposal of property and equipment and
subsidiaries6.9 7.8
For the three-month
period ended
March 31,
Interim condensed consolidated financial statements CMA CGM / 15 Three-month period ended March 31, 2018
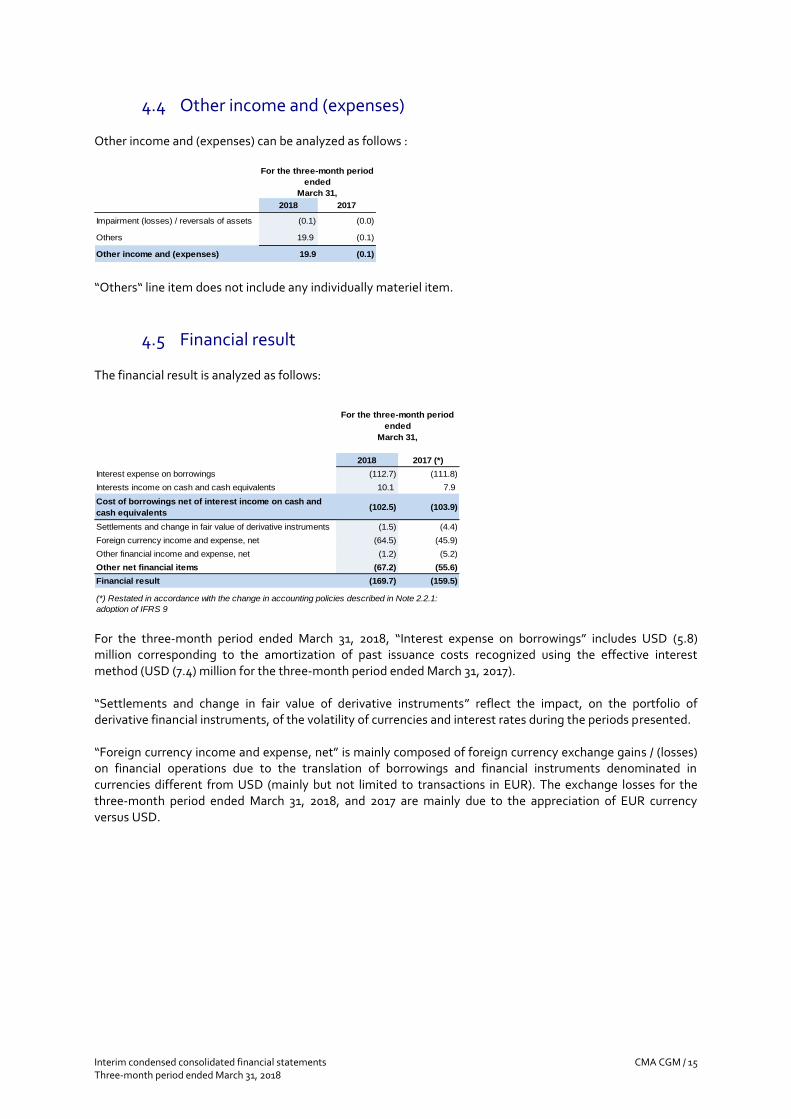
4.4 Other income and (expenses) Other income and (expenses) can be analyzed as follows :
2018 2017
Impairment (losses) / reversals of assets (0.1) (0.0)
Others 19.9 (0.1)
Other income and (expenses) 19.9 (0.1)
For the three-month period
ended
March 31,
“Others“ line item does not include any individually materiel item.
4.5 Financial result The financial result is analyzed as follows:
2018 2017 (*)
Interest expense on borrowings (112.7) (111.8)
Interests income on cash and cash equivalents 10.1 7.9
Cost of borrowings net of interest income on cash and
cash equivalents(102.5) (103.9)
Settlements and change in fair value of derivative instruments (1.5) (4.4)
Foreign currency income and expense, net (64.5) (45.9)
Other financial income and expense, net (1.2) (5.2)
Other net financial items (67.2) (55.6)
Financial result (169.7) (159.5)
(*) Restated in accordance with the change in accounting policies described in Note 2.2.1:
adoption of IFRS 9
For the three-month period
ended
March 31,
For the three-month period ended March 31, 2018, “Interest expense on borrowings” includes USD (5.8) million corresponding to the amortization of past issuance costs recognized using the effective interest method (USD (7.4) million for the three-month period ended March 31, 2017). “Settlements and change in fair value of derivative instruments” reflect the impact, on the portfolio of derivative financial instruments, of the volatility of currencies and interest rates during the periods presented. “Foreign currency income and expense, net” is mainly composed of foreign currency exchange gains / (losses) on financial operations due to the translation of borrowings and financial instruments denominated in currencies different from USD (mainly but not limited to transactions in EUR). The exchange losses for the three-month period ended March 31, 2018, and 2017 are mainly due to the appreciation of EUR currency versus USD.
Interim condensed consolidated financial statements CMA CGM / 16 Three-month period ended March 31, 2018
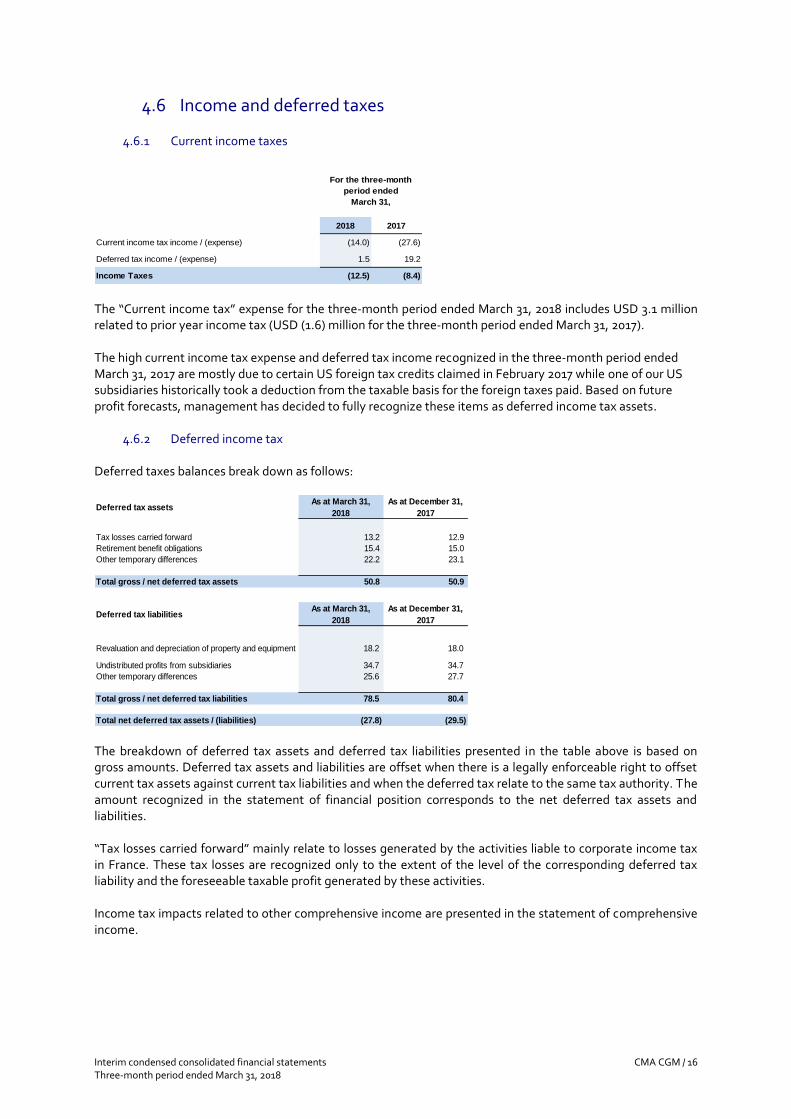
4.6 Income and deferred taxes
4.6.1 Current income taxes
2018 2017
Current income tax income / (expense) (14.0) (27.6)
Deferred tax income / (expense) 1.5 19.2
Income Taxes (12.5) (8.4)
For the three-month
period ended
March 31,
The “Current income tax” expense for the three-month period ended March 31, 2018 includes USD 3.1 million related to prior year income tax (USD (1.6) million for the three-month period ended March 31, 2017). The high current income tax expense and deferred tax income recognized in the three-month period ended March 31, 2017 are mostly due to certain US foreign tax credits claimed in February 2017 while one of our US subsidiaries historically took a deduction from the taxable basis for the foreign taxes paid. Based on future profit forecasts, management has decided to fully recognize these items as deferred income tax assets.
4.6.2 Deferred income tax Deferred taxes balances break down as follows:
Deferred tax assetsAs at March 31,
2018
As at December 31,
2017
Tax losses carried forward 13.2 12.9
Retirement benefit obligations 15.4 15.0
Other temporary differences 22.2 23.1
Total gross / net deferred tax assets 50.8 50.9
Deferred tax liabilitiesAs at March 31,
2018
As at December 31,
2017
Revaluation and depreciation of property and equipment 18.2 18.0
Undistributed profits from subsidiaries 34.7 34.7
Other temporary differences 25.6 27.7
Total gross / net deferred tax liabilities 78.5 80.4
Total net deferred tax assets / (liabilities) (27.8) (29.5) The breakdown of deferred tax assets and deferred tax liabilities presented in the table above is based on gross amounts. Deferred tax assets and liabilities are offset when there is a legally enforceable right to offset current tax assets against current tax liabilities and when the deferred tax relate to the same tax authority. The amount recognized in the statement of financial position corresponds to the net deferred tax assets and liabilities. “Tax losses carried forward” mainly relate to losses generated by the activities liable to corporate income tax in France. These tax losses are recognized only to the extent of the level of the corresponding deferred tax liability and the foreseeable taxable profit generated by these activities. Income tax impacts related to other comprehensive income are presented in the statement of comprehensive income.
Interim condensed consolidated financial statements CMA CGM / 17 Three-month period ended March 31, 2018
2018 2017
Net deferred tax at the begining of the year (29.5) (56.8)
Changes through Profit & Loss 1.5 19.2
Changes through Other Comprehensive Income 0.0 (0.1)
Currency translation adjustment 0.3 0.2
Other variations (0.0) -
Net deferred tax at the end of the period (27.8) (37.5)
For the three-month period ended
March 31,
Note 5 - Invested capital and working capital
5.1 Goodwill and other intangible assets
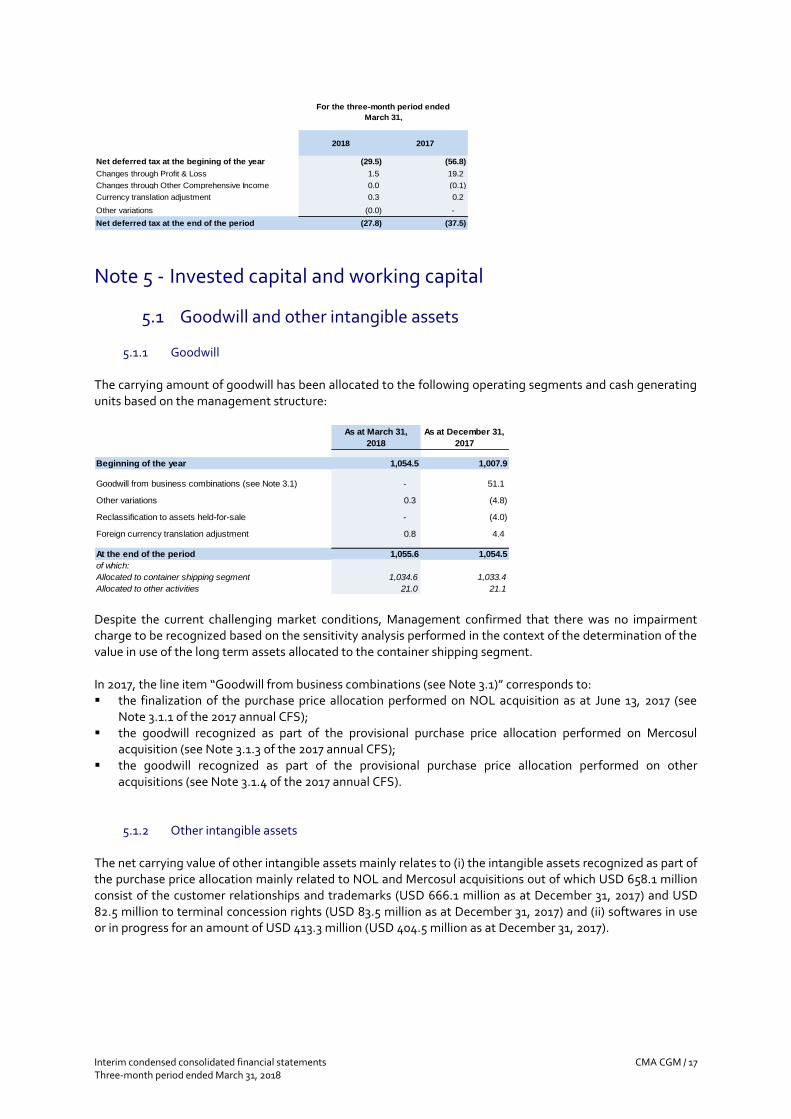
5.1.1 Goodwill The carrying amount of goodwill has been allocated to the following operating segments and cash generating units based on the management structure:
As at March 31,
2018
As at December 31,
2017
Beginning of the year 1,054.5 1,007.9
Goodwill from business combinations (see Note 3.1) - 51.1
Other variations 0.3 (4.8)
Reclassification to assets held-for-sale - (4.0)
Foreign currency translation adjustment 0.8 4.4
At the end of the period 1,055.6 1,054.5
of which:
Allocated to container shipping segment 1,034.6 1,033.4
Allocated to other activities 21.0 21.1 Despite the current challenging market conditions, Management confirmed that there was no impairment charge to be recognized based on the sensitivity analysis performed in the context of the determination of the value in use of the long term assets allocated to the container shipping segment. In 2017, the line item “Goodwill from business combinations (see Note 3.1)” corresponds to: ▪ the finalization of the purchase price allocation performed on NOL acquisition as at June 13, 2017 (see
Note 3.1.1 of the 2017 annual CFS); ▪ the goodwill recognized as part of the provisional purchase price allocation performed on Mercosul
acquisition (see Note 3.1.3 of the 2017 annual CFS); ▪ the goodwill recognized as part of the provisional purchase price allocation performed on other
acquisitions (see Note 3.1.4 of the 2017 annual CFS).
5.1.2 Other intangible assets The net carrying value of other intangible assets mainly relates to (i) the intangible assets recognized as part of the purchase price allocation mainly related to NOL and Mercosul acquisitions out of which USD 658.1 million consist of the customer relationships and trademarks (USD 666.1 million as at December 31, 2017) and USD 82.5 million to terminal concession rights (USD 83.5 million as at December 31, 2017) and (ii) softwares in use or in progress for an amount of USD 413.3 million (USD 404.5 million as at December 31, 2017).
Interim condensed consolidated financial statements CMA CGM / 18 Three-month period ended March 31, 2018
5.2 Property and equipment
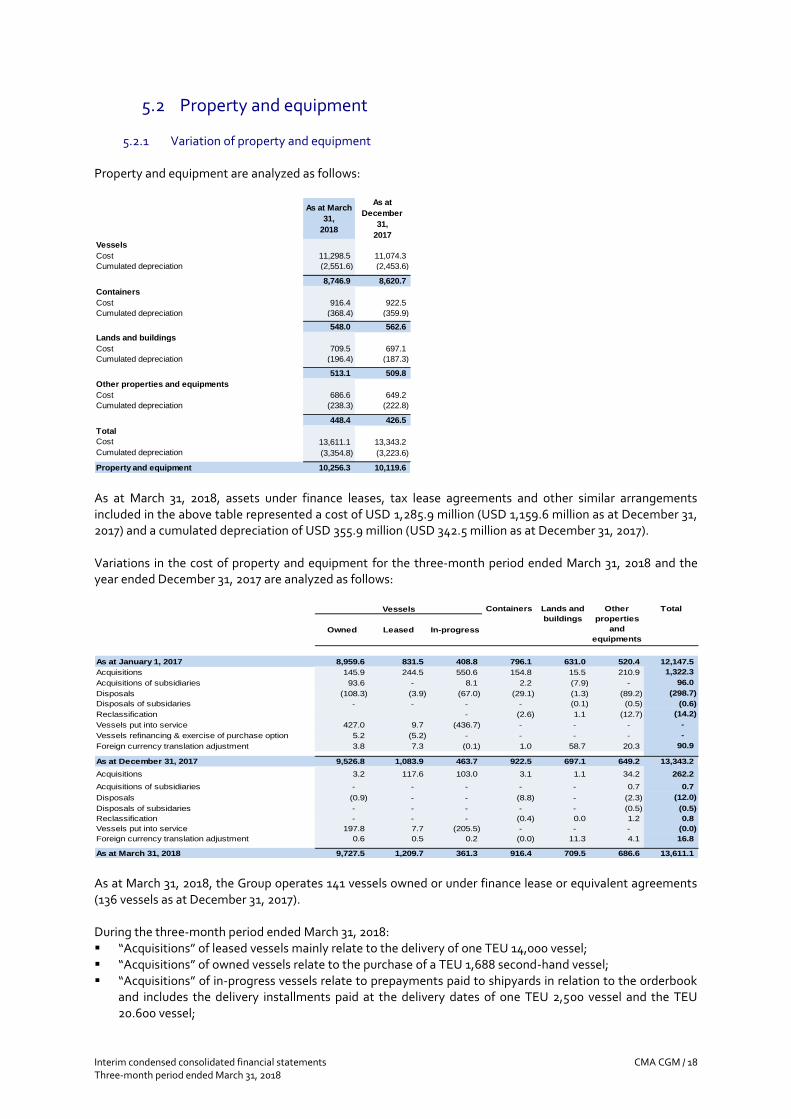
5.2.1 Variation of property and equipment Property and equipment are analyzed as follows:
As at March
31,
2018
As at
December
31,
2017
Vessels
Cost 11,298.5 11,074.3
Cumulated depreciation (2,551.6) (2,453.6)
8,746.9 8,620.7
Containers
Cost 916.4 922.5
Cumulated depreciation (368.4) (359.9)
548.0 562.6
Lands and buildings
Cost 709.5 697.1
Cumulated depreciation (196.4) (187.3)
513.1 509.8
Other properties and equipments
Cost 686.6 649.2
Cumulated depreciation (238.3) (222.8)
448.4 426.5
Total
Cost 13,611.1 13,343.2
Cumulated depreciation (3,354.8) (3,223.6)
Property and equipment 10,256.3 10,119.6 As at March 31, 2018, assets under finance leases, tax lease agreements and other similar arrangements included in the above table represented a cost of USD 1,285.9 million (USD 1,159.6 million as at December 31, 2017) and a cumulated depreciation of USD 355.9 million (USD 342.5 million as at December 31, 2017). Variations in the cost of property and equipment for the three-month period ended March 31, 2018 and the year ended December 31, 2017 are analyzed as follows: Cost of Property and equipment Containers Total
Owned Leased In-progress
As at January 1, 2017 8,959.6 831.5 408.8 796.1 631.0 520.4 12,147.5
Acquisitions 145.9 244.5 550.6 154.8 15.5 210.9 1,322.3
Acquisitions of subsidiaries 93.6 - 8.1 2.2 (7.9) - 96.0
Disposals (108.3) (3.9) (67.0) (29.1) (1.3) (89.2) (298.7)
Disposals of subsidaries - - - - (0.1) (0.5) (0.6)
Reclassification - (2.6) 1.1 (12.7) (14.2)
Vessels put into service 427.0 9.7 (436.7) - - - -
Vessels refinancing & exercise of purchase option 5.2 (5.2) - - - - -
Foreign currency translation adjustment 3.8 7.3 (0.1) 1.0 58.7 20.3 90.9
As at December 31, 2017 9,526.8 1,083.9 463.7 922.5 697.1 649.2 13,343.2
Acquisitions 3.2 117.6 103.0 3.1 1.1 34.2 262.2
Acquisitions of subsidiaries - - - - - 0.7 0.7
Disposals (0.9) - - (8.8) - (2.3) (12.0)
Disposals of subsidaries - - - - - (0.5) (0.5)
Reclassification - - - (0.4) 0.0 1.2 0.8
Vessels put into service 197.8 7.7 (205.5) - - - (0.0)
Foreign currency translation adjustment 0.6 0.5 0.2 (0.0) 11.3 4.1 16.8
As at March 31, 2018 9,727.5 1,209.7 361.3 916.4 709.5 686.6 13,611.1
Other
properties
and
equipments
Vessels Lands and
buildings
As at March 31, 2018, the Group operates 141 vessels owned or under finance lease or equivalent agreements (136 vessels as at December 31, 2017). During the three-month period ended March 31, 2018: ▪ “Acquisitions” of leased vessels mainly relate to the delivery of one TEU 14,000 vessel; ▪ “Acquisitions” of owned vessels relate to the purchase of a TEU 1,688 second-hand vessel; ▪ “Acquisitions” of in-progress vessels relate to prepayments paid to shipyards in relation to the orderbook
and includes the delivery installments paid at the delivery dates of one TEU 2,500 vessel and the TEU 20.600 vessel;
Interim condensed consolidated financial statements CMA CGM / 19 Three-month period ended March 31, 2018
▪ “Vessels put into service” relate to the reclassification of the prepayments mainly following the deliveries of one TEU 20,600 vessel and one TEU 2,500 vessel;
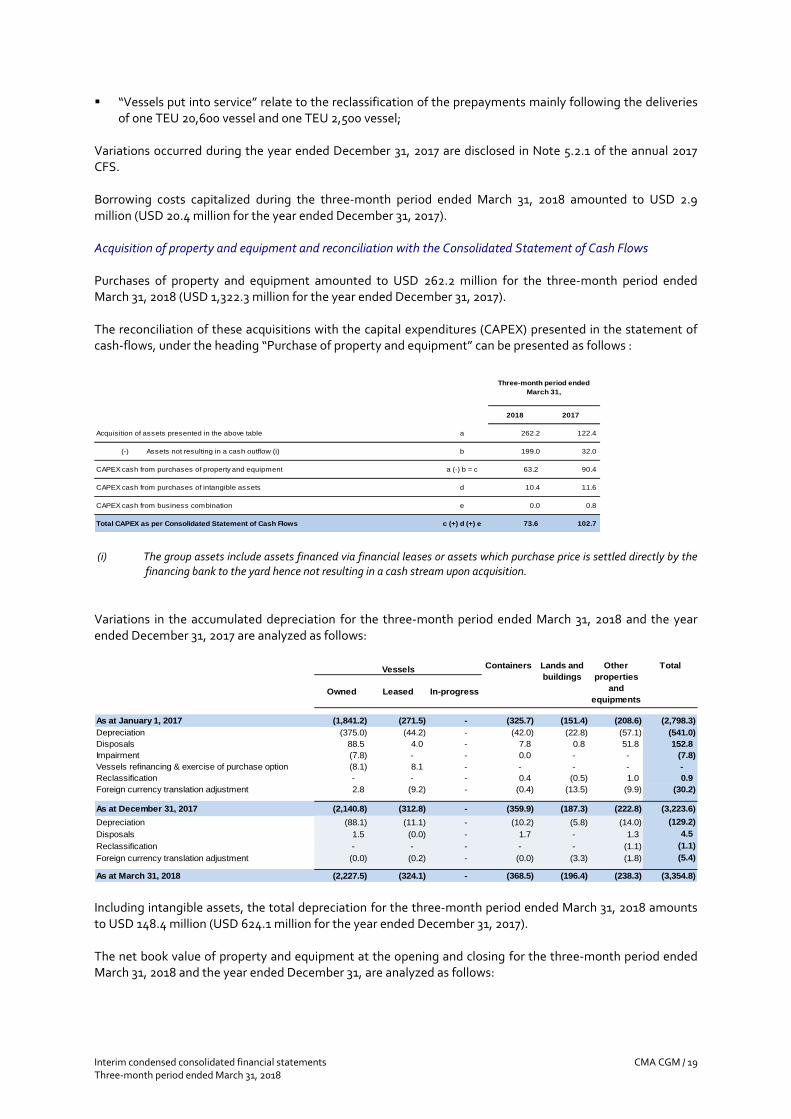
Variations occurred during the year ended December 31, 2017 are disclosed in Note 5.2.1 of the annual 2017 CFS. Borrowing costs capitalized during the three-month period ended March 31, 2018 amounted to USD 2.9 million (USD 20.4 million for the year ended December 31, 2017). Acquisition of property and equipment and reconciliation with the Consolidated Statement of Cash Flows Purchases of property and equipment amounted to USD 262.2 million for the three-month period ended March 31, 2018 (USD 1,322.3 million for the year ended December 31, 2017). The reconciliation of these acquisitions with the capital expenditures (CAPEX) presented in the statement of cash-flows, under the heading “Purchase of property and equipment” can be presented as follows :
2018 2017
Acquisition of assets presented in the above table a 262.2 122.4
(-) Assets not resulting in a cash outflow (i) b 199.0 32.0
CAPEX cash from purchases of property and equipment a (-) b = c 63.2 90.4
CAPEX cash from purchases of intangible assets d 10.4 11.6
CAPEX cash from business combination e 0.0 0.8
Total CAPEX as per Consolidated Statement of Cash Flows c (+) d (+) e 73.6 102.7
Three-month period ended
March 31,
(i) The group assets include assets financed via financial leases or assets which purchase price is settled directly by the
financing bank to the yard hence not resulting in a cash stream upon acquisition.
Variations in the accumulated depreciation for the three-month period ended March 31, 2018 and the year ended December 31, 2017 are analyzed as follows:
Total
Owned Leased In-progress
As at January 1, 2017 (1,841.2) (271.5) - (325.7) (151.4) (208.6) (2,798.3)
Depreciation (375.0) (44.2) - (42.0) (22.8) (57.1) (541.0)
Disposals 88.5 4.0 - 7.8 0.8 51.8 152.8
Impairment (7.8) - - 0.0 - - (7.8)
Vessels refinancing & exercise of purchase option (8.1) 8.1 - - - - -
Reclassification - - - 0.4 (0.5) 1.0 0.9
Foreign currency translation adjustment 2.8 (9.2) - (0.4) (13.5) (9.9) (30.2)
As at December 31, 2017 (2,140.8) (312.8) - (359.9) (187.3) (222.8) (3,223.6)
Depreciation (88.1) (11.1) - (10.2) (5.8) (14.0) (129.2)
Disposals 1.5 (0.0) - 1.7 - 1.3 4.5
Reclassification - - - - - (1.1) (1.1)
Foreign currency translation adjustment (0.0) (0.2) - (0.0) (3.3) (1.8) (5.4)
As at March 31, 2018 (2,227.5) (324.1) - (368.5) (196.4) (238.3) (3,354.8)
Lands and
buildings
Other
properties
and
equipments
Vessels Containers
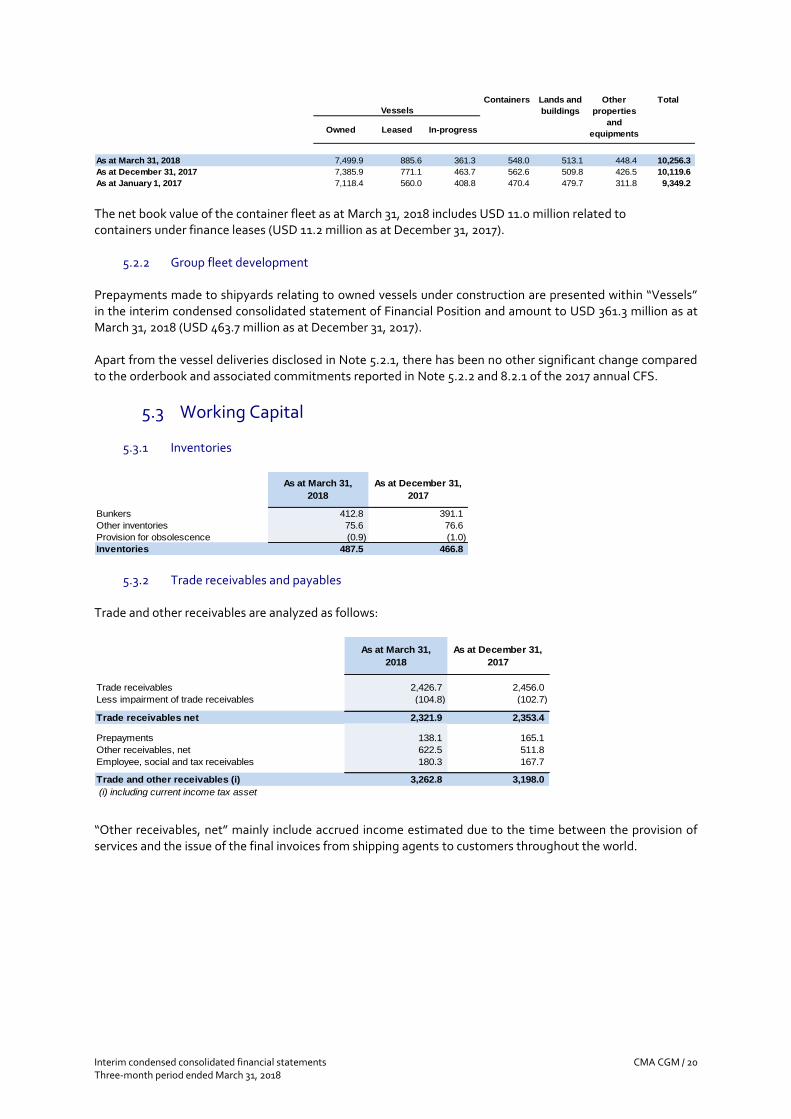
Including intangible assets, the total depreciation for the three-month period ended March 31, 2018 amounts to USD 148.4 million (USD 624.1 million for the year ended December 31, 2017). The net book value of property and equipment at the opening and closing for the three-month period ended March 31, 2018 and the year ended December 31, are analyzed as follows:
Interim condensed consolidated financial statements CMA CGM / 20 Three-month period ended March 31, 2018
Total
Owned Leased In-progress
As at March 31, 2018 7,499.9 885.6 361.3 548.0 513.1 448.4 10,256.3
As at December 31, 2017 7,385.9 771.1 463.7 562.6 509.8 426.5 10,119.6
As at January 1, 2017 7,118.4 560.0 408.8 470.4 479.7 311.8 9,349.2
Vessels
Containers Lands and
buildings
Other
properties
and
equipments
The net book value of the container fleet as at March 31, 2018 includes USD 11.0 million related to containers under finance leases (USD 11.2 million as at December 31, 2017).
5.2.2 Group fleet development Prepayments made to shipyards relating to owned vessels under construction are presented within “Vessels” in the interim condensed consolidated statement of Financial Position and amount to USD 361.3 million as at March 31, 2018 (USD 463.7 million as at December 31, 2017). Apart from the vessel deliveries disclosed in Note 5.2.1, there has been no other significant change compared to the orderbook and associated commitments reported in Note 5.2.2 and 8.2.1 of the 2017 annual CFS.
5.3 Working Capital
5.3.1 Inventories
As at March 31,
2018
As at December 31,
2017
Bunkers 412.8 391.1
Other inventories 75.6 76.6
Provision for obsolescence (0.9) (1.0)
Inventories 487.5 466.8
5.3.2 Trade receivables and payables Trade and other receivables are analyzed as follows:
As at March 31,
2018
As at December 31,
2017
Trade receivables 2,426.7 2,456.0
Less impairment of trade receivables (104.8) (102.7)
Trade receivables net 2,321.9 2,353.4
Prepayments 138.1 165.1
Other receivables, net 622.5 511.8
Employee, social and tax receivables 180.3 167.7
Trade and other receivables (i) 3,262.8 3,198.0
(i) including current income tax asset
“Other receivables, net” mainly include accrued income estimated due to the time between the provision of services and the issue of the final invoices from shipping agents to customers throughout the world.
Interim condensed consolidated financial statements CMA CGM / 21 Three-month period ended March 31, 2018
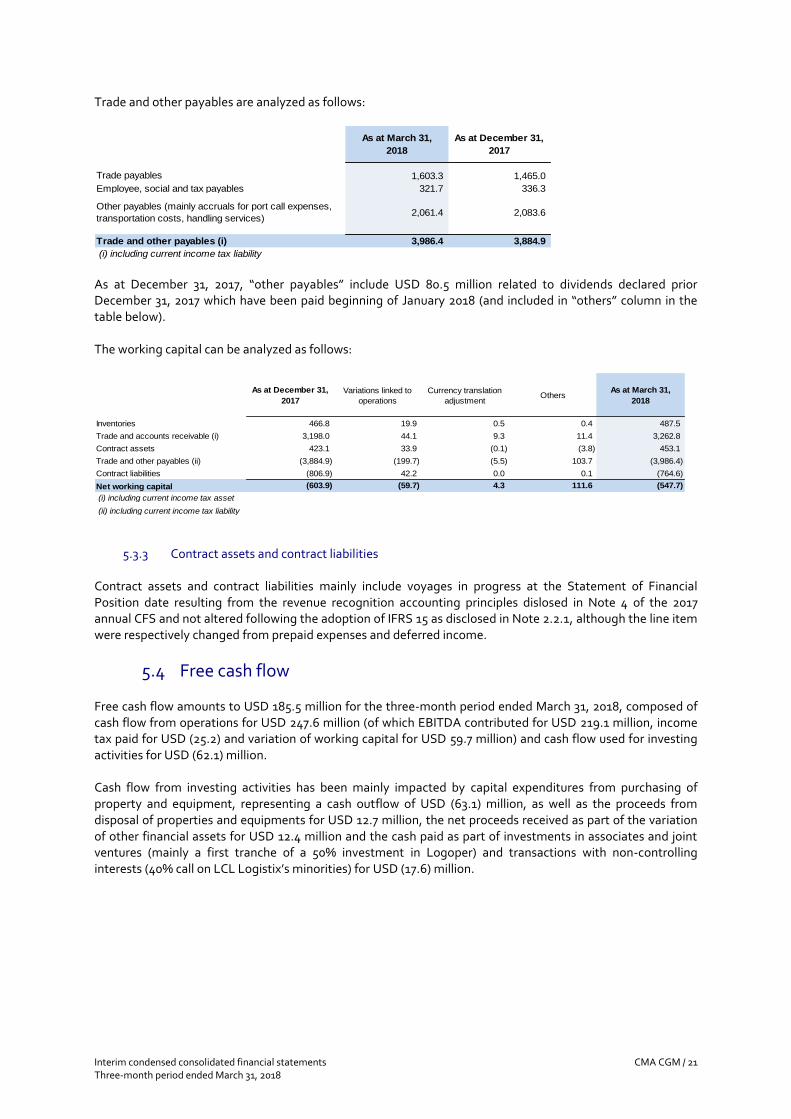
Trade and other payables are analyzed as follows:
As at March 31,
2018
As at December 31,
2017
Trade payables 1,603.3 1,465.0
Employee, social and tax payables 321.7 336.3
Other payables (mainly accruals for port call expenses,
transportation costs, handling services)2,061.4 2,083.6
Trade and other payables (i) 3,986.4 3,884.9
(i) including current income tax liability As at December 31, 2017, “other payables” include USD 80.5 million related to dividends declared prior December 31, 2017 which have been paid beginning of January 2018 (and included in “others” column in the table below). The working capital can be analyzed as follows:
As at December 31,
2017
Variations linked to
operations
Currency translation
adjustmentOthers
As at March 31,
2018
Inventories 466.8 19.9 0.5 0.4 487.5
Trade and accounts receivable (i) 3,198.0 44.1 9.3 11.4 3,262.8
Contract assets 423.1 33.9 (0.1) (3.8) 453.1
Trade and other payables (ii) (3,884.9) (199.7) (5.5) 103.7 (3,986.4)
Contract liabilities (806.9) 42.2 0.0 0.1 (764.6)
Net working capital (603.9) (59.7) 4.3 111.6 (547.7)
(i) including current income tax asset
(ii) including current income tax liability
5.3.3 Contract assets and contract liabilities Contract assets and contract liabilities mainly include voyages in progress at the Statement of Financial Position date resulting from the revenue recognition accounting principles dislosed in Note 4 of the 2017 annual CFS and not altered following the adoption of IFRS 15 as disclosed in Note 2.2.1, although the line item were respectively changed from prepaid expenses and deferred income.
5.4 Free cash flow Free cash flow amounts to USD 185.5 million for the three-month period ended March 31, 2018, composed of cash flow from operations for USD 247.6 million (of which EBITDA contributed for USD 219.1 million, income tax paid for USD (25.2) and variation of working capital for USD 59.7 million) and cash flow used for investing activities for USD (62.1) million. Cash flow from investing activities has been mainly impacted by capital expenditures from purchasing of property and equipment, representing a cash outflow of USD (63.1) million, as well as the proceeds from disposal of properties and equipments for USD 12.7 million, the net proceeds received as part of the variation of other financial assets for USD 12.4 million and the cash paid as part of investments in associates and joint ventures (mainly a first tranche of a 50% investment in Logoper) and transactions with non-controlling interests (40% call on LCL Logistix’s minorities) for USD (17.6) million.
Interim condensed consolidated financial statements CMA CGM / 22 Three-month period ended March 31, 2018
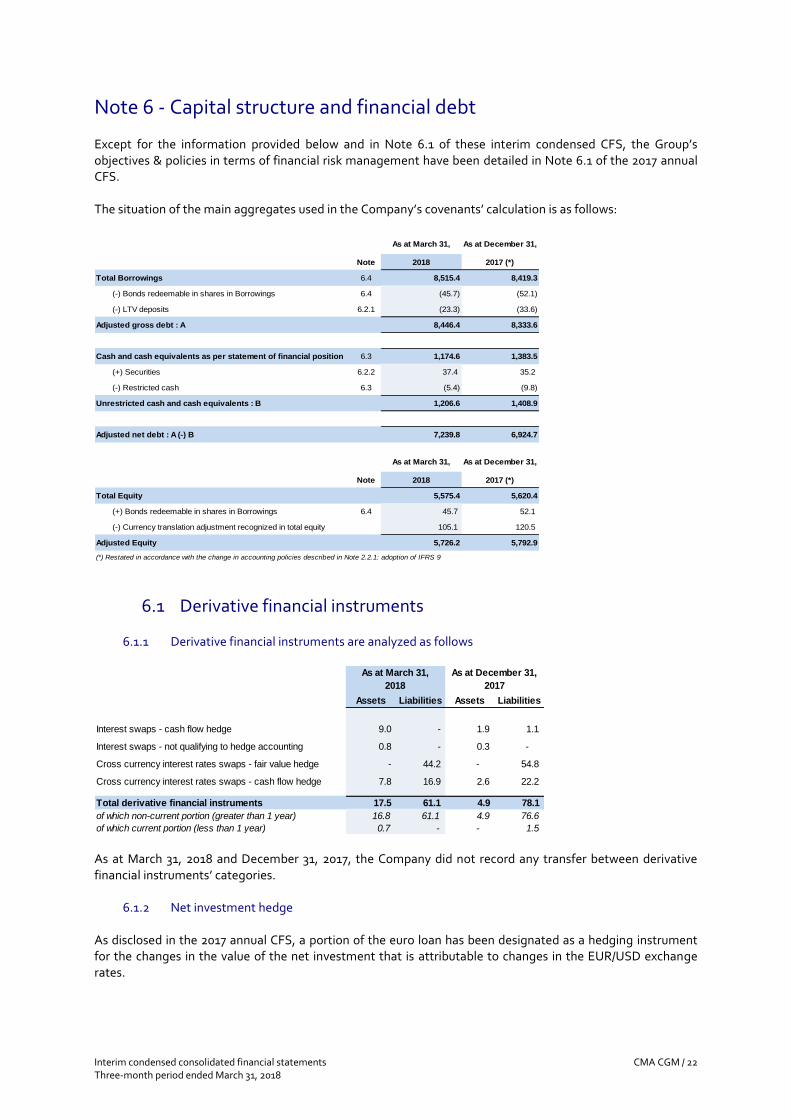
Note 6 - Capital structure and financial debt Except for the information provided below and in Note 6.1 of these interim condensed CFS, the Group’s objectives & policies in terms of financial risk management have been detailed in Note 6.1 of the 2017 annual CFS. The situation of the main aggregates used in the Company’s covenants’ calculation is as follows:
As at March 31, As at December 31,
Note 2018 2017 (*)
Total Borrowings 6.4 8,515.4 8,419.3
(-) Bonds redeemable in shares in Borrowings 6.4 (45.7) (52.1)
(-) LTV deposits 6.2.1 (23.3) (33.6)
Adjusted gross debt : A 8,446.4 8,333.6
Cash and cash equivalents as per statement of financial position 6.3 1,174.6 1,383.5
(+) Securities 6.2.2 37.4 35.2
(-) Restricted cash 6.3 (5.4) (9.8)
Unrestricted cash and cash equivalents : B 1,206.6 1,408.9
Adjusted net debt : A (-) B 7,239.8 6,924.7
As at March 31, As at December 31,
Note 2018 2017 (*)
Total Equity 5,575.4 5,620.4
(+) Bonds redeemable in shares in Borrowings 6.4 45.7 52.1
(-) Currency translation adjustment recognized in total equity 105.1 120.5
Adjusted Equity 5,726.2 5,792.9
(*) Restated in accordance with the change in accounting policies described in Note 2.2.1: adoption of IFRS 9
6.1 Derivative financial instruments
6.1.1 Derivative financial instruments are analyzed as follows
Assets Liabilities Assets Liabilities
Interest swaps - cash flow hedge 9.0 - 1.9 1.1
Interest swaps - not qualifying to hedge accounting 0.8 - 0.3 -
Cross currency interest rates swaps - fair value hedge - 44.2 - 54.8
Cross currency interest rates swaps - cash flow hedge 7.8 16.9 2.6 22.2
Total derivative financial instruments 17.5 61.1 4.9 78.1
of which non-current portion (greater than 1 year) 16.8 61.1 4.9 76.6
of which current portion (less than 1 year) 0.7 - - 1.5
As at December 31,
2017
As at March 31,
2018
As at March 31, 2018 and December 31, 2017, the Company did not record any transfer between derivative financial instruments’ categories.
6.1.2 Net investment hedge As disclosed in the 2017 annual CFS, a portion of the euro loan has been designated as a hedging instrument for the changes in the value of the net investment that is attributable to changes in the EUR/USD exchange rates.
Interim condensed consolidated financial statements CMA CGM / 23 Three-month period ended March 31, 2018
The amount of the change in the value of the Senior Notes that has been recognized in OCI to offset the currency translation adjustment of the foreign operation amounts to USD 10.3 million for the three-month period ended March 31, 2018 (USD 50.7 million for the year ended December 31, 2017).
6.2 Other non-current financial assets - Securities and other current financial assets
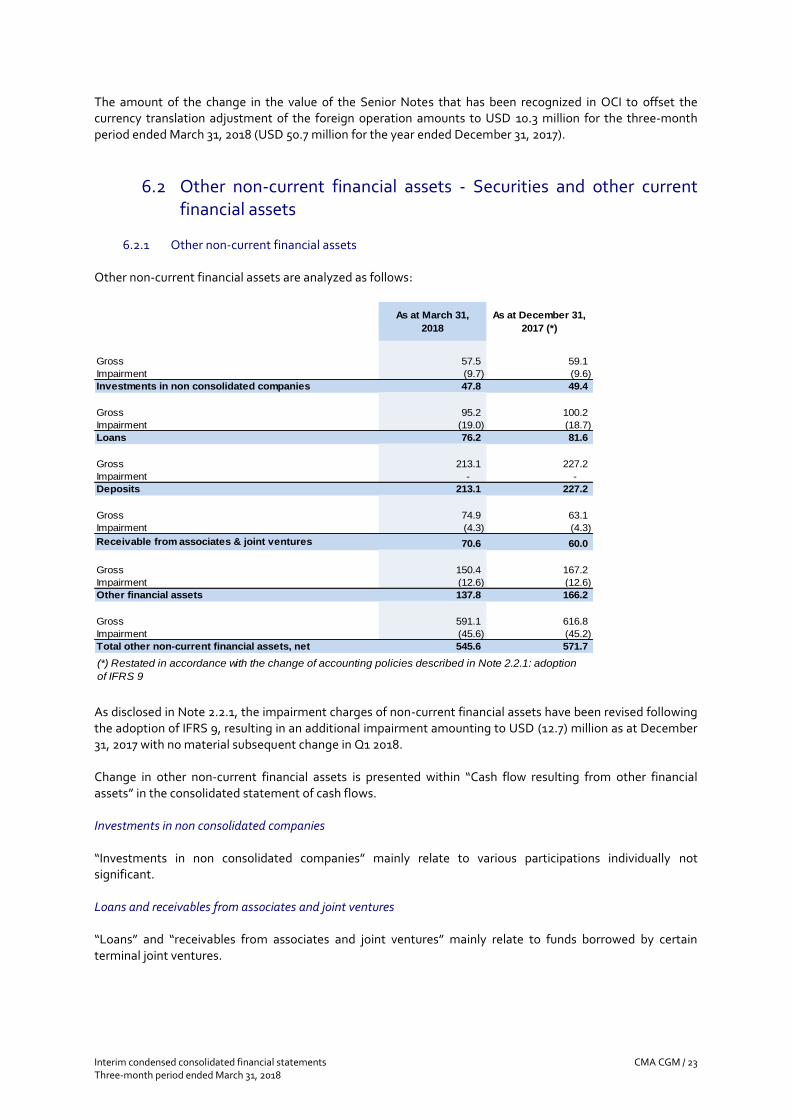
6.2.1 Other non-current financial assets
Other non-current financial assets are analyzed as follows:
As at March 31,
2018
As at December 31,
2017 (*)
Gross 57.5 59.1
Impairment (9.7) (9.6)
Investments in non consolidated companies 47.8 49.4
Gross 95.2 100.2
Impairment (19.0) (18.7)
Loans 76.2 81.6
Gross 213.1 227.2
Impairment - -
Deposits 213.1 227.2
Gross 74.9 63.1
Impairment (4.3) (4.3)
Receivable from associates & joint ventures 70.6 60.0
Gross 150.4 167.2
Impairment (12.6) (12.6)
Other financial assets 137.8 166.2
Gross 591.1 616.8
Impairment (45.6) (45.2)
Total other non-current financial assets, net 545.6 571.7
(*) Restated in accordance with the change of accounting policies described in Note 2.2.1: adoption
of IFRS 9
As disclosed in Note 2.2.1, the impairment charges of non-current financial assets have been revised following the adoption of IFRS 9, resulting in an additional impairment amounting to USD (12.7) million as at December 31, 2017 with no material subsequent change in Q1 2018. Change in other non-current financial assets is presented within “Cash flow resulting from other financial assets” in the consolidated statement of cash flows. Investments in non consolidated companies “Investments in non consolidated companies” mainly relate to various participations individually not significant. Loans and receivables from associates and joint ventures “Loans” and “receivables from associates and joint ventures” mainly relate to funds borrowed by certain terminal joint ventures.
Interim condensed consolidated financial statements CMA CGM / 24 Three-month period ended March 31, 2018
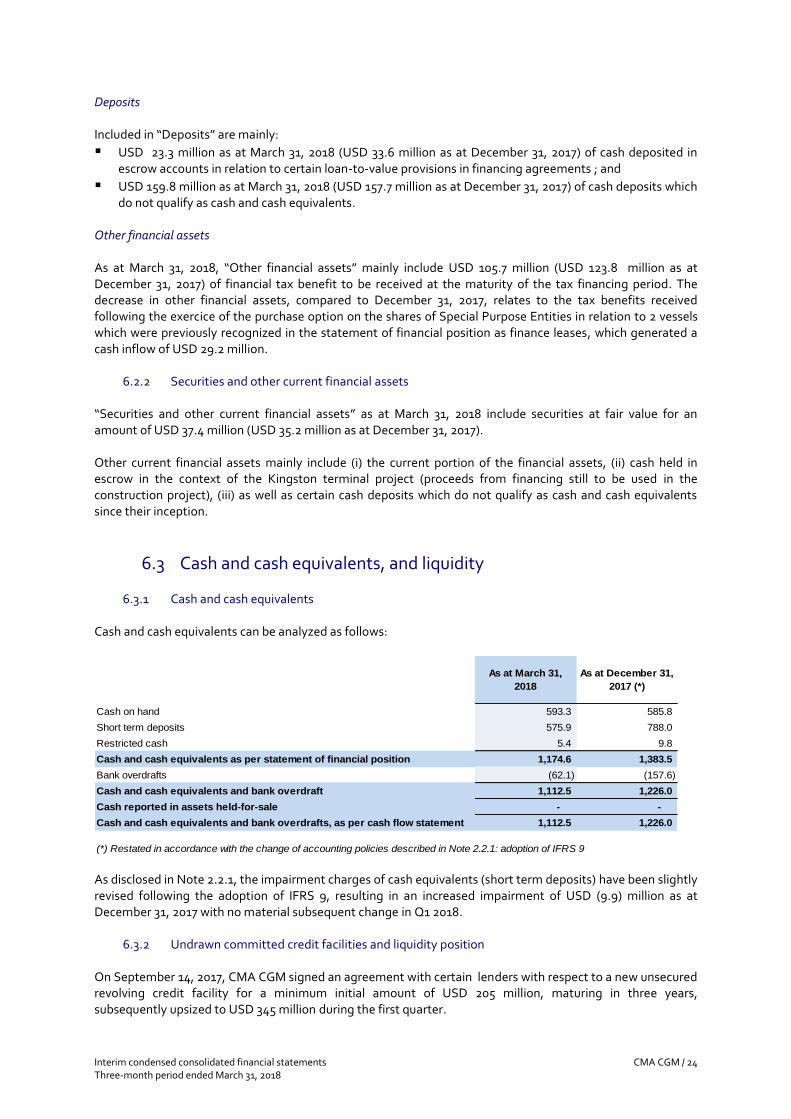
Deposits
Included in “Deposits” are mainly:
▪ USD 23.3 million as at March 31, 2018 (USD 33.6 million as at December 31, 2017) of cash deposited in escrow accounts in relation to certain loan-to-value provisions in financing agreements ; and
▪ USD 159.8 million as at March 31, 2018 (USD 157.7 million as at December 31, 2017) of cash deposits which do not qualify as cash and cash equivalents.
Other financial assets As at March 31, 2018, “Other financial assets” mainly include USD 105.7 million (USD 123.8 million as at December 31, 2017) of financial tax benefit to be received at the maturity of the tax financing period. The decrease in other financial assets, compared to December 31, 2017, relates to the tax benefits received following the exercice of the purchase option on the shares of Special Purpose Entities in relation to 2 vessels which were previously recognized in the statement of financial position as finance leases, which generated a cash inflow of USD 29.2 million.
6.2.2 Securities and other current financial assets “Securities and other current financial assets” as at March 31, 2018 include securities at fair value for an amount of USD 37.4 million (USD 35.2 million as at December 31, 2017). Other current financial assets mainly include (i) the current portion of the financial assets, (ii) cash held in escrow in the context of the Kingston terminal project (proceeds from financing still to be used in the construction project), (iii) as well as certain cash deposits which do not qualify as cash and cash equivalents since their inception.
6.3 Cash and cash equivalents, and liquidity
6.3.1 Cash and cash equivalents Cash and cash equivalents can be analyzed as follows:
As at March 31,
2018
As at December 31,
2017 (*)
Cash on hand 593.3 585.8
Short term deposits 575.9 788.0
Restricted cash 5.4 9.8
Cash and cash equivalents as per statement of financial position 1,174.6 1,383.5
Bank overdrafts (62.1) (157.6)
Cash and cash equivalents and bank overdraft 1,112.5 1,226.0
Cash reported in assets held-for-sale - -
Cash and cash equivalents and bank overdrafts, as per cash flow statement 1,112.5 1,226.0
(*) Restated in accordance with the change of accounting policies described in Note 2.2.1: adoption of IFRS 9 As disclosed in Note 2.2.1, the impairment charges of cash equivalents (short term deposits) have been slightly revised following the adoption of IFRS 9, resulting in an increased impairment of USD (9.9) million as at December 31, 2017 with no material subsequent change in Q1 2018.
6.3.2 Undrawn committed credit facilities and liquidity position On September 14, 2017, CMA CGM signed an agreement with certain lenders with respect to a new unsecured revolving credit facility for a minimum initial amount of USD 205 million, maturing in three years, subsequently upsized to USD 345 million during the first quarter.
Interim condensed consolidated financial statements CMA CGM / 25 Three-month period ended March 31, 2018
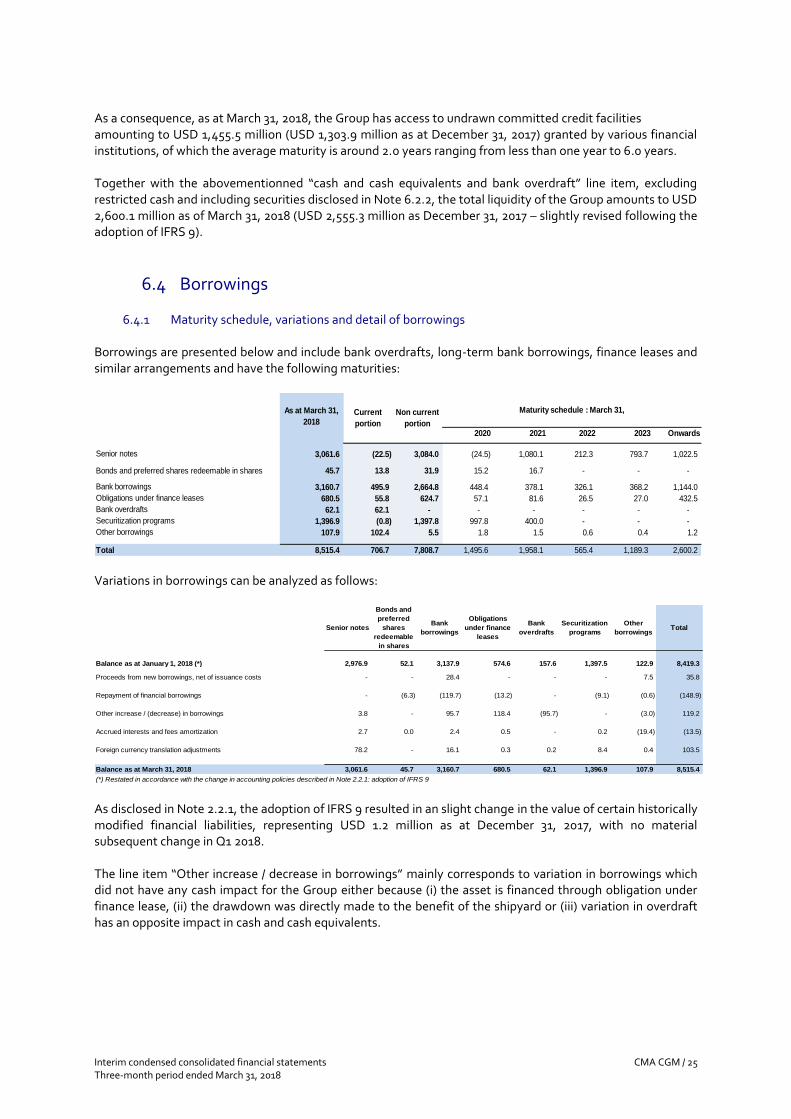
As a consequence, as at March 31, 2018, the Group has access to undrawn committed credit facilities amounting to USD 1,455.5 million (USD 1,303.9 million as at December 31, 2017) granted by various financial institutions, of which the average maturity is around 2.0 years ranging from less than one year to 6.0 years. Together with the abovementionned “cash and cash equivalents and bank overdraft” line item, excluding restricted cash and including securities disclosed in Note 6.2.2, the total liquidity of the Group amounts to USD 2,600.1 million as of March 31, 2018 (USD 2,555.3 million as December 31, 2017 – slightly revised following the adoption of IFRS 9).
6.4 Borrowings
6.4.1 Maturity schedule, variations and detail of borrowings
Borrowings are presented below and include bank overdrafts, long-term bank borrowings, finance leases and similar arrangements and have the following maturities:
As at March 31,
2018
2020 2021 2022 2023 Onwards
Senior notes 3,061.6 (22.5) 3,084.0 (24.5) 1,080.1 212.3 793.7 1,022.5
Bonds and preferred shares redeemable in shares 45.7 13.8 31.9 15.2 16.7 - - -
Bank borrowings 3,160.7 495.9 2,664.8 448.4 378.1 326.1 368.2 1,144.0
Obligations under finance leases 680.5 55.8 624.7 57.1 81.6 26.5 27.0 432.5
Bank overdrafts 62.1 62.1 - - - - - -
Securitization programs 1,396.9 (0.8) 1,397.8 997.8 400.0 - - -
Other borrowings 107.9 102.4 5.5 1.8 1.5 0.6 0.4 1.2
Total 8,515.4 706.7 7,808.7 1,495.6 1,958.1 565.4 1,189.3 2,600.2
Maturity schedule : March 31,Non current
portion
Current
portion
Variations in borrowings can be analyzed as follows:
Senior notes
Bonds and
preferred
shares
redeemable
in shares
Bank
borrowings
Obligations
under finance
leases
Bank
overdrafts
Securitization
programs
Other
borrowingsTotal
Balance as at January 1, 2018 (*) 2,976.9 52.1 3,137.9 574.6 157.6 1,397.5 122.9 8,419.3
- - 28.4 - - - 7.5 35.8
- (6.3) (119.7) (13.2) - (9.1) (0.6) (148.9)
Other increase / (decrease) in borrowings 3.8 - 95.7 118.4 (95.7) - (3.0) 119.2
2.7 0.0 2.4 0.5 - 0.2 (19.4) (13.5)
78.2 - 16.1 0.3 0.2 8.4 0.4 103.5
Balance as at March 31, 2018 3,061.6 45.7 3,160.7 680.5 62.1 1,396.9 107.9 8,515.4
Foreign currency translation adjustments
Repayment of financial borrowings
Accrued interests and fees amortization
(*) Restated in accordance with the change in accounting policies described in Note 2.2.1: adoption of IFRS 9
Proceeds from new borrowings, net of issuance costs
As disclosed in Note 2.2.1, the adoption of IFRS 9 resulted in an slight change in the value of certain historically modified financial liabilities, representing USD 1.2 million as at December 31, 2017, with no material subsequent change in Q1 2018. The line item “Other increase / decrease in borrowings” mainly corresponds to variation in borrowings which did not have any cash impact for the Group either because (i) the asset is financed through obligation under finance lease, (ii) the drawdown was directly made to the benefit of the shipyard or (iii) variation in overdraft has an opposite impact in cash and cash equivalents.
Interim condensed consolidated financial statements CMA CGM / 26 Three-month period ended March 31, 2018
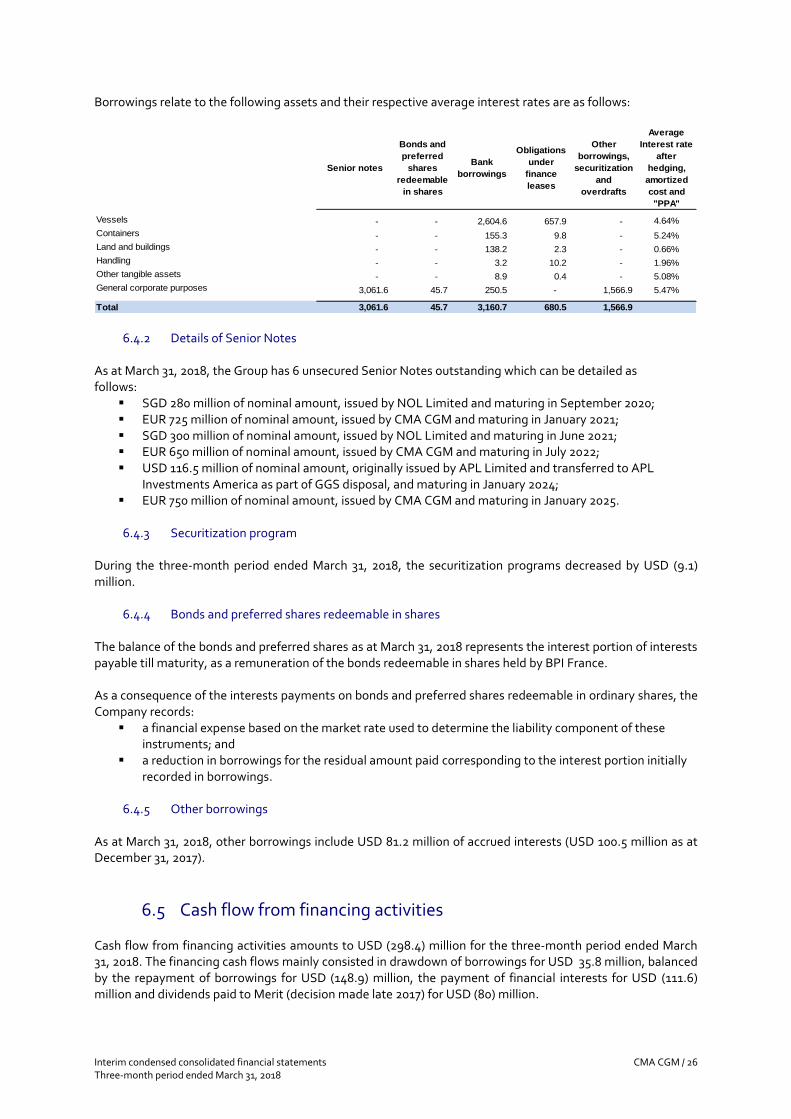
Borrowings relate to the following assets and their respective average interest rates are as follows:
Senior notes
Bonds and
preferred
shares
redeemable
in shares
Bank
borrowings
Obligations
under
finance
leases
Other
borrowings,
securitization
and
overdrafts
Average
Interest rate
after
hedging,
amortized
cost and
"PPA"
Vessels - - 2,604.6 657.9 - 4.64%
Containers - - 155.3 9.8 - 5.24%
Land and buildings - - 138.2 2.3 - 0.66%
Handling - - 3.2 10.2 - 1.96%
Other tangible assets - - 8.9 0.4 - 5.08%
General corporate purposes 3,061.6 45.7 250.5 - 1,566.9 5.47%
Total 3,061.6 45.7 3,160.7 680.5 1,566.9
6.4.2 Details of Senior Notes As at March 31, 2018, the Group has 6 unsecured Senior Notes outstanding which can be detailed as follows:
▪ SGD 280 million of nominal amount, issued by NOL Limited and maturing in September 2020; ▪ EUR 725 million of nominal amount, issued by CMA CGM and maturing in January 2021; ▪ SGD 300 million of nominal amount, issued by NOL Limited and maturing in June 2021; ▪ EUR 650 million of nominal amount, issued by CMA CGM and maturing in July 2022; ▪ USD 116.5 million of nominal amount, originally issued by APL Limited and transferred to APL
Investments America as part of GGS disposal, and maturing in January 2024; ▪ EUR 750 million of nominal amount, issued by CMA CGM and maturing in January 2025.
6.4.3 Securitization program
During the three-month period ended March 31, 2018, the securitization programs decreased by USD (9.1) million.
6.4.4 Bonds and preferred shares redeemable in shares The balance of the bonds and preferred shares as at March 31, 2018 represents the interest portion of interests payable till maturity, as a remuneration of the bonds redeemable in shares held by BPI France. As a consequence of the interests payments on bonds and preferred shares redeemable in ordinary shares, the Company records:
▪ a financial expense based on the market rate used to determine the liability component of these instruments; and
▪ a reduction in borrowings for the residual amount paid corresponding to the interest portion initially recorded in borrowings.
6.4.5 Other borrowings
As at March 31, 2018, other borrowings include USD 81.2 million of accrued interests (USD 100.5 million as at December 31, 2017).
6.5 Cash flow from financing activities Cash flow from financing activities amounts to USD (298.4) million for the three-month period ended March 31, 2018. The financing cash flows mainly consisted in drawdown of borrowings for USD 35.8 million, balanced by the repayment of borrowings for USD (148.9) million, the payment of financial interests for USD (111.6) million and dividends paid to Merit (decision made late 2017) for USD (80) million.
Interim condensed consolidated financial statements CMA CGM / 27 Three-month period ended March 31, 2018
Note 7 - Scope of consolidation The list of main companies or subgroups included in the consolidation scope has been disclosed in Note 7.4 of the 2017 annual CFS. There has not been any material change during the three-month period ended March 31, 2018.
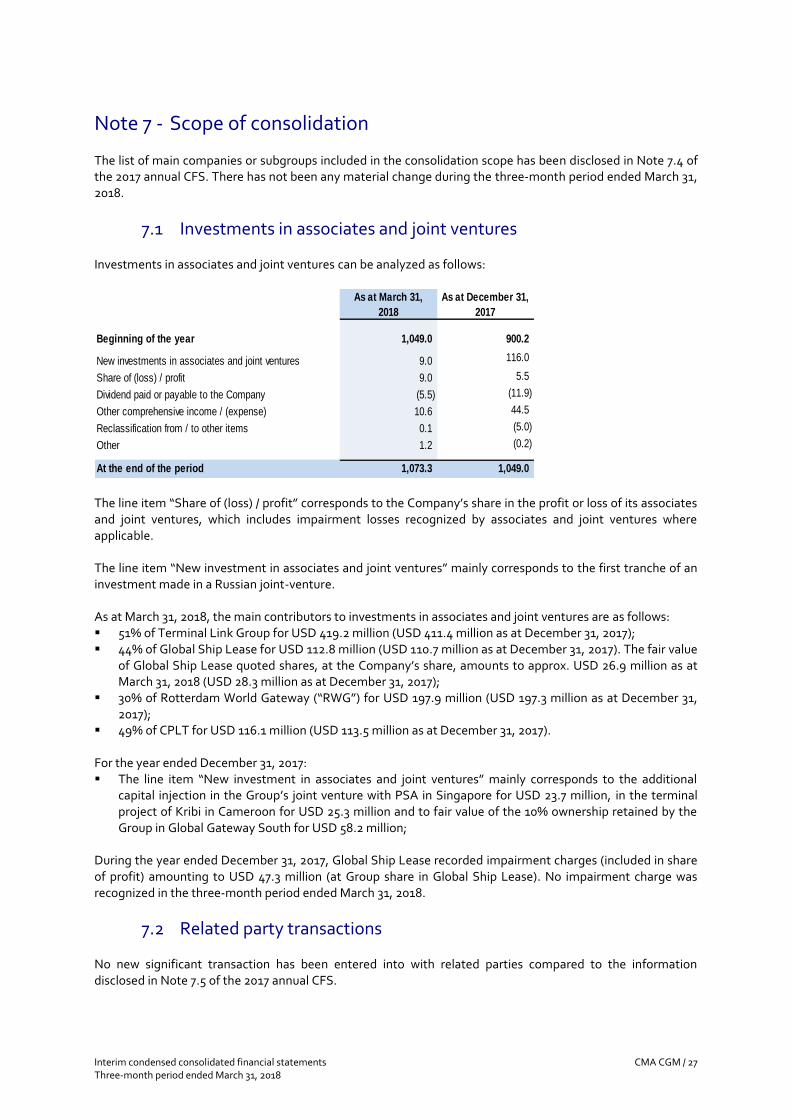
7.1 Investments in associates and joint ventures Investments in associates and joint ventures can be analyzed as follows:
As at March 31,
2018
As at December 31,
2017
Beginning of the year 1,049.0 900.2
New investments in associates and joint ventures 9.0 116.0
Share of (loss) / profit 9.0 5.5
Dividend paid or payable to the Company (5.5) (11.9)
Other comprehensive income / (expense) 10.6 44.5
Reclassification from / to other items 0.1 (5.0)
Other 1.2 (0.2)
At the end of the period 1,073.3 1,049.0 The line item “Share of (loss) / profit” corresponds to the Company’s share in the profit or loss of its associates and joint ventures, which includes impairment losses recognized by associates and joint ventures where applicable. The line item “New investment in associates and joint ventures” mainly corresponds to the first tranche of an investment made in a Russian joint-venture. As at March 31, 2018, the main contributors to investments in associates and joint ventures are as follows: ▪ 51% of Terminal Link Group for USD 419.2 million (USD 411.4 million as at December 31, 2017); ▪ 44% of Global Ship Lease for USD 112.8 million (USD 110.7 million as at December 31, 2017). The fair value
of Global Ship Lease quoted shares, at the Company’s share, amounts to approx. USD 26.9 million as at March 31, 2018 (USD 28.3 million as at December 31, 2017);
▪ 30% of Rotterdam World Gateway (“RWG”) for USD 197.9 million (USD 197.3 million as at December 31, 2017);
▪ 49% of CPLT for USD 116.1 million (USD 113.5 million as at December 31, 2017). For the year ended December 31, 2017: ▪ The line item “New investment in associates and joint ventures” mainly corresponds to the additional
capital injection in the Group’s joint venture with PSA in Singapore for USD 23.7 million, in the terminal project of Kribi in Cameroon for USD 25.3 million and to fair value of the 10% ownership retained by the Group in Global Gateway South for USD 58.2 million;
During the year ended December 31, 2017, Global Ship Lease recorded impairment charges (included in share of profit) amounting to USD 47.3 million (at Group share in Global Ship Lease). No impairment charge was recognized in the three-month period ended March 31, 2018.
7.2 Related party transactions No new significant transaction has been entered into with related parties compared to the information disclosed in Note 7.5 of the 2017 annual CFS.
Interim condensed consolidated financial statements CMA CGM / 28 Three-month period ended March 31, 2018
Note 8 - Other Notes
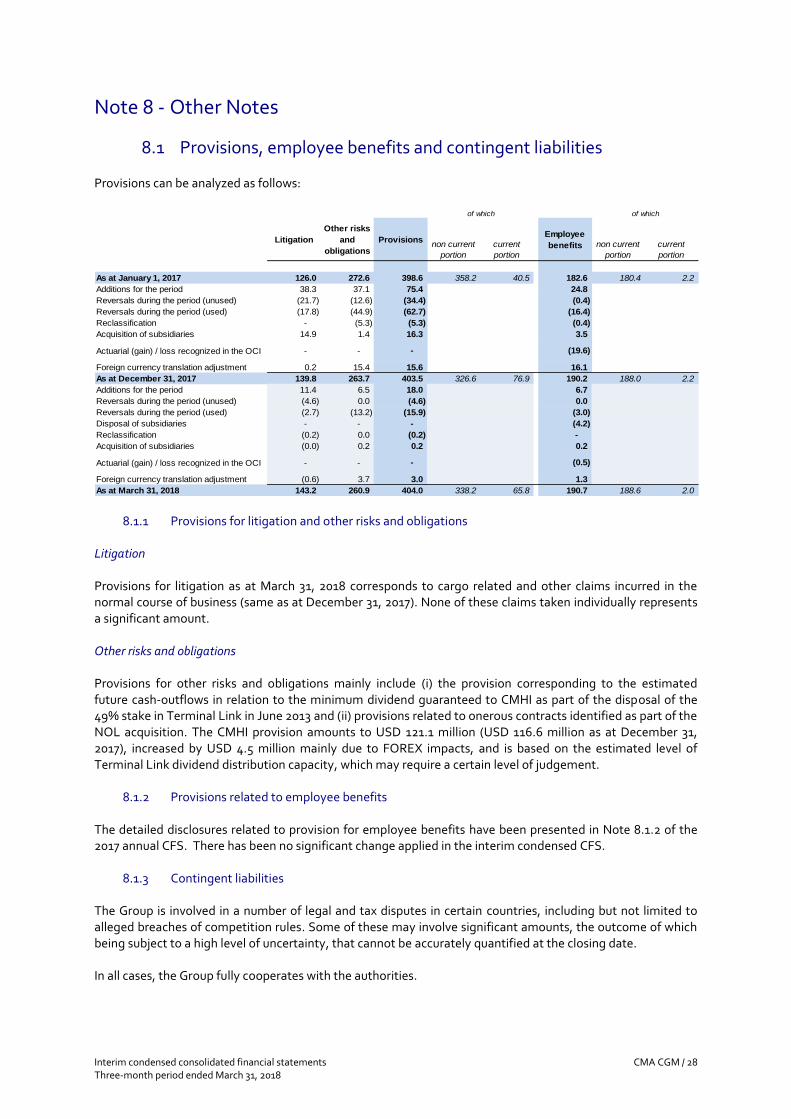
8.1 Provisions, employee benefits and contingent liabilities Provisions can be analyzed as follows:
Litigation
Other risks
and
obligations
Provisionsnon current
portion
current
portion
Employee
benefits non current
portion
current
portion
As at January 1, 2017 126.0 272.6 398.6 358.2 40.5 182.6 180.4 2.2
Additions for the period 38.3 37.1 75.4 24.8
Reversals during the period (unused) (21.7) (12.6) (34.4) (0.4)
Reversals during the period (used) (17.8) (44.9) (62.7) (16.4)
Reclassification - (5.3) (5.3) (0.4)
Acquisition of subsidiaries 14.9 1.4 16.3 3.5
Actuarial (gain) / loss recognized in the OCI - - - (19.6)
Foreign currency translation adjustment 0.2 15.4 15.6 16.1
As at December 31, 2017 139.8 263.7 403.5 326.6 76.9 190.2 188.0 2.2
Additions for the period 11.4 6.5 18.0 6.7
Reversals during the period (unused) (4.6) 0.0 (4.6) 0.0
Reversals during the period (used) (2.7) (13.2) (15.9) (3.0)
Disposal of subsidiaries - - - (4.2)
Reclassification (0.2) 0.0 (0.2) -
Acquisition of subsidiaries (0.0) 0.2 0.2 0.2
Actuarial (gain) / loss recognized in the OCI - - - (0.5)
Foreign currency translation adjustment (0.6) 3.7 3.0 1.3
As at March 31, 2018 143.2 260.9 404.0 338.2 65.8 190.7 188.6 2.0
of which of which
8.1.1 Provisions for litigation and other risks and obligations Litigation Provisions for litigation as at March 31, 2018 corresponds to cargo related and other claims incurred in the normal course of business (same as at December 31, 2017). None of these claims taken individually represents a significant amount. Other risks and obligations Provisions for other risks and obligations mainly include (i) the provision corresponding to the estimated future cash-outflows in relation to the minimum dividend guaranteed to CMHI as part of the disposal of the 49% stake in Terminal Link in June 2013 and (ii) provisions related to onerous contracts identified as part of the NOL acquisition. The CMHI provision amounts to USD 121.1 million (USD 116.6 million as at December 31, 2017), increased by USD 4.5 million mainly due to FOREX impacts, and is based on the estimated level of Terminal Link dividend distribution capacity, which may require a certain level of judgement.
8.1.2 Provisions related to employee benefits The detailed disclosures related to provision for employee benefits have been presented in Note 8.1.2 of the 2017 annual CFS. There has been no significant change applied in the interim condensed CFS.
8.1.3 Contingent liabilities The Group is involved in a number of legal and tax disputes in certain countries, including but not limited to alleged breaches of competition rules. Some of these may involve significant amounts, the outcome of which being subject to a high level of uncertainty, that cannot be accurately quantified at the closing date. In all cases, the Group fully cooperates with the authorities.
Interim condensed consolidated financial statements CMA CGM / 29 Three-month period ended March 31, 2018
Antitrust matters
The Group’s US agent CMA CGM (America) LLC was served with a subpoena by the Department of Justice in the United States on March 15, 2017. The subpoena appears to relate to an antitrust investigation of the liner shipping industry in the U.S. The subpoena seeks documents from CMA CGM (America) LLC and its affiliates, including CMA CGM S.A. The Group is currently reviewing this case with its external legal counsels, who are in contact with the Department of Justice to discuss CMA CGM’s compliance with the subpoena. As the investigation is still in its initial stages, it is too early to determine the outcome of this investigation and the financial effects therefrom, if any.
8.2 Commitments Apart from the information disclosed elsewhere in these interim condensed CFS, no significant commitment has been entered into since the information disclosed in the 2017 annual CFS.
8.3 Significant subsequent events
8.3.1 Business combination On May 3, 2018, CMA CGM confirmed its investment in CEVA Logistics (“CEVA”), a global leading player in the logistics sector, on the occasion of CEVA’s initial public offering (IPO). This investment takes the form of convertible bonds, which will be converted into CEVA common shares, upon obtaining all the requisite regulatory approvals. CMA CGM’s investment will represent 24.99% of CEVA’s capital. At an IPO price of 27.5 CHF per share, CMA CGM’s investment amounts to 379 million CHF (USD 379.9 million). With this transaction, CMA CGM will expand its presence in the logistics sector, which is closely related to shipping. The two companies have agreed to explore together the development of joint commercial offerings, according to terms to be defined in the coming months. With the nomination of 2 board members and a stake at 25%, Management believes it has obtained a significant influence and, as a consequence, this investment will be accounted under equity method.
8.3.2 Terminal & Logistics development On April 16, 2018, the CMA CGM Group and Lekki Port LFTZ Enterprise signed a Memorandum of Agreement to operate Lekki Port’s future container terminal. Located in Nigeria, Africa’s largest economy, the future Lekki Deep Sea Port will be developed, built and operated by LPLE, a joint venture enterprise led by the Tolaram Group, the Lagos State Government and the Nigerian Ports Authority.