interannual variability of primary production and ... · suggested that the 14c-pp measurements may...
TRANSCRIPT
Interannual variability of primary production and dissolvedorganic nitrogen storage in the North Pacific Subtropical Gyre
Ya-Wei Luo,1 Hugh W. Ducklow,2 Marjorie A. M. Friedrichs,3 Matthew J. Church,4
David M. Karl,4 and Scott C. Doney1
Received 6 August 2011; revised 20 June 2012; accepted 21 June 2012; published 10 August 2012.
[1] The upper ocean primary production measurements from the Hawaii Ocean Timeseries (HOT) at Station ALOHA in the North Pacific Subtropical Gyre showed substantialvariability over the last two decades. The annual average primary production varied withina limited range over 1991–1998, significantly increased in 1999–2000 and then graduallydecreased afterwards. This variability was investigated using a one-dimensional ecosystemmodel. The long-term HOT observations were used to constrain the model by prescribingphysical forcings and lower boundary conditions and optimizing the model parametersagainst data using data assimilation. The model reproduced the general interannual patternin the observed primary production, and mesoscale variability in vertical velocity wasidentified as a major contributing factor to the interannual variability in the simulation.Several strong upwelling events occurred in 1999, which brought up nitrate at rates severaltimes higher than other years and elevated the model primary production. Our modelresults suggested a hypothesis for the observed interannual variability pattern of primaryproduction at Station ALOHA: Part of the upwelled nitrate input in 1999 was converted toand accumulated as semilabile dissolved organic nitrogen (DON), and subsequentrecycling of this semilabile DON supported enhanced primary productivity for the nextseveral years as the semilabile DON perturbation was gradually removed via export.
Citation: Luo, Y.-W., H. W. Ducklow, M. A. M. Friedrichs, M. J. Church, D. M. Karl, and S. C. Doney (2012), Interannualvariability of primary production and dissolved organic nitrogen storage in the North Pacific Subtropical Gyre, J. Geophys. Res.,117, G03019, doi:10.1029/2011JG001830.
1. Introduction
[2] The North Pacific Subtropical Gyre is one of theEarth’s largest biomes [Sverdrup et al., 1942; Karl et al.,2008]. To study this remote and poorly known habitat, theHawaii Ocean Time series (HOT) Station ALOHA wasestablished in the eastern portion of the North Pacific Sub-tropical Gyre in 1988 [Karl and Lukas, 1996]. The compre-hensive biogeochemical and physical monthly observationsat this station provide opportunities to study the temporalvariability of the ecosystem in the North Pacific SubtropicalGyre. Primary production is one of the most important indi-cators of ecosystem dynamics, and by analyzing rates of
primary production between 1988 and 2007, as measured bythe in situ 14C-bicarbonate assimilation method (14C-PP),Corno et al. [2007], Bidigare et al. [2009] and Saba et al.[2010] concluded that primary production at StationALOHA was increasing. However, with inclusion of morerecent measurements (through 2009), the observations indi-cate a gradual decline in rates of productivity after 2002.Further study of this pattern leads to new insights about themechanisms controlling the variability of primary productionin the North Pacific Subtropical Gyre.[3] The North Pacific Subtropical Gyre is characterized by
oligotrophic (low nutrient) conditions, with low concentra-tions of dissolved inorganic nitrogen (N), a condition main-tained by persistent stratification of the upper ocean waters.The maximum winter mixed-layer depth at Station ALOHAaverages �100 m [Dore et al., 2002], rarely penetrating thetop of the nitracline (110� 10m) [Dore and Karl, 1996]. Theresulting mixed-layer nitrate plus nitrite concentrationsaverage <10 nM [Karl et al., 2001b], and nitrate plus nitrite tosoluble reactive phosphorus ratios within the euphotic zone(0–150 m) are considerably less (�2:1) than the Redfieldratio of 16:1 for the average requirement of oceanic phyto-plankton [Redfield, 1958].[4] Although the ratio of total dissolved N to phosphorus
(P) in the euphotic zone is �19:1, higher than the Redfield
1Department of Marine Chemistry and Geochemistry, Woods HoleOceanographic Institution, Woods Hole, Massachusetts, USA.
2The Ecosystems Center, Marine Biological Laboratory, Woods Hole,Massachusetts, USA.
3Virginia Institute of Marine Science, College of William and Mary,Gloucester Point, Virginia, USA.
4School of Ocean and Earth Science and Technology, University ofHawaii, Honolulu, Hawaii, USA.
Corresponding author: Y.-W. Luo, Department of Marine Chemistryand Geochemistry, Woods Hole Oceanographic Institution, MS#25,Woods Hole, MA 02543, USA. ([email protected])
©2012. American Geophysical Union. All Rights Reserved.0148-0227/12/2011JG001830
JOURNAL OF GEOPHYSICAL RESEARCH, VOL. 117, G03019, doi:10.1029/2011JG001830, 2012
G03019 1 of 12
ratio [Karl et al., 2001a], a large component of the total dis-solved N is refractory dissolved organic N (DON) [Carlson,2002]. If we deduct refractory (deep water) DON and refrac-tory dissolved organic P (DOP) from the total dissolved pools,the resulting ratio of bioavailable N to P in the euphotic zone is�14:1, slightly lower than the Redfield ratio. In addition,apparently nitrate, nitrite and soluble reactive phosphorusturnover more quickly than DON and DOP and thus appearmore bioavailable. The evidence thus indicates the contem-porary North Pacific Subtropical Gyre is likely an N-limitedhabitat. P supply may lead to an enhanced dinitrogen (N2)fixation and thus can also indirectly limit the primary pro-ductivity [Karl and Letelier, 2008].[5] As a result of the strong vertical stratification, meso-
scale eddy activity can be a major source of nutrients to themixed layer in the North Pacific Subtropical Gyre [Letelieret al., 2000; Vaillancourt et al., 2003; Calil and Richards,2010; Calil et al., 2011]. N2 fixation is another importantsource, which has been estimated to supply up to half of thenew N in this region [Karl et al., 1997; Deutsch et al., 2001;Casciotti et al., 2008]. It was found recently that mesoscaleeddies can also promote N2 fixation in this region by sup-plying P- and Silicate-enriched waters [Church et al., 2009].However, the export of N may not be tightly coupled withnew N input. The largest oceanic organic matter pool, dis-solved organic matter (DOM) [Hedges, 1992], can accu-mulate in the surface over seasons or even years and be usedby phytoplankton and bacteria before it is exported to depth[Carlson et al., 1994; Ducklow et al., 1995; Church et al.,2002; Luo et al., 2010; McCarren et al., 2010]. Thisrecovery of DOM reintroduces N to the primary producers, aprocess known as the “microbial loop” [Azam et al., 1983],and thus it has a potential impact on the response of theprimary production to new N input over variable time scales[Jackson and Williams, 1985].
[6] Currently, understanding of marine biogeochemicalprocesses is greatly limited by sampling and analyticalconstraints. Even the HOT data set at Station ALOHA,which is one of the most extensive and comprehensive in theworld’s ocean, may lack critical measurements needed tocharacterize ecosystem functioning. Numeric modeling canbe used to fill in gaps of unmeasured and temporally orspatially under-sampled properties. In this study, we utilizeda one-dimensional data assimilative ecosystem modeldeveloped for the subtropical North Pacific [Luo et al.,2010] to address the observed pattern of interannual todecadal variability of primary production at Station ALOHAin 1991–2009. By conducting a variety of forcing sensitivityexperiments with this existing framework, we explored thehypothesis that the increase in 14C-PP prior to year 2000 andsubsequent slow decline reflected a nutrient injection eventand retention of the nitrogen as semilabile DOM. Throughsuch experiments it is possible to generate testable hypoth-eses pertaining to mechanisms for the observed primaryproduction variability that are amenable to direct fieldexperimentation.
2. Methods
2.1. Model Structure and Setupin Standard Experiment
[7] The model structure and data assimilative frameworkwere adopted from Luo et al. [2010], with temporal coveragein this study spanning 1991–2009. 1989–1990 was utilizedas the model spin-up period. The model structure and setupare briefly described here, particularly the N cycle as it isdirectly relevant to this study. Refer to Luo et al. [2010] formore details.[8] The ecosystem model tracked carbon (C), N and P in
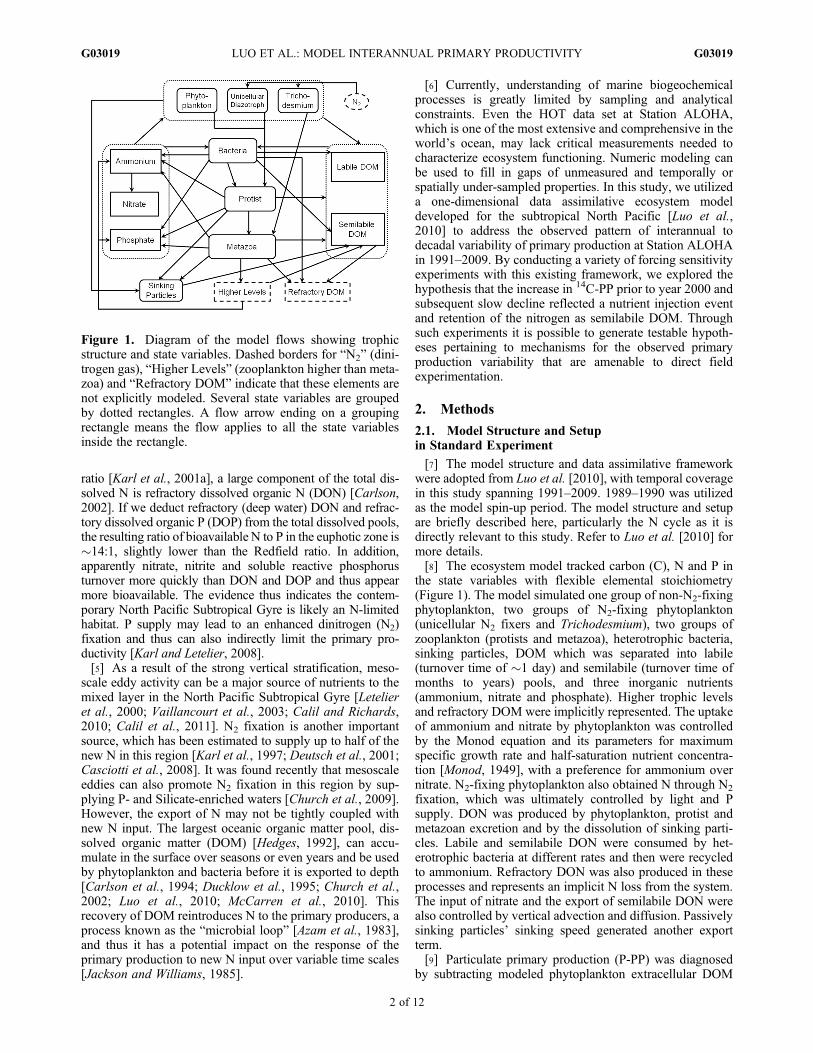
the state variables with flexible elemental stoichiometry(Figure 1). The model simulated one group of non-N2-fixingphytoplankton, two groups of N2-fixing phytoplankton(unicellular N2 fixers and Trichodesmium), two groups ofzooplankton (protists and metazoa), heterotrophic bacteria,sinking particles, DOM which was separated into labile(turnover time of �1 day) and semilabile (turnover time ofmonths to years) pools, and three inorganic nutrients(ammonium, nitrate and phosphate). Higher trophic levelsand refractory DOM were implicitly represented. The uptakeof ammonium and nitrate by phytoplankton was controlledby the Monod equation and its parameters for maximumspecific growth rate and half-saturation nutrient concentra-tion [Monod, 1949], with a preference for ammonium overnitrate. N2-fixing phytoplankton also obtained N through N2
fixation, which was ultimately controlled by light and Psupply. DON was produced by phytoplankton, protist andmetazoan excretion and by the dissolution of sinking parti-cles. Labile and semilabile DON were consumed by het-erotrophic bacteria at different rates and then were recycledto ammonium. Refractory DON was also produced in theseprocesses and represents an implicit N loss from the system.The input of nitrate and the export of semilabile DON werealso controlled by vertical advection and diffusion. Passivelysinking particles’ sinking speed generated another exportterm.[9] Particulate primary production (P-PP) was diagnosed
by subtracting modeled phytoplankton extracellular DOM
Figure 1. Diagram of the model flows showing trophicstructure and state variables. Dashed borders for “N2” (dini-trogen gas), “Higher Levels” (zooplankton higher than meta-zoa) and “Refractory DOM” indicate that these elements arenot explicitly modeled. Several state variables are groupedby dotted rectangles. A flow arrow ending on a groupingrectangle means the flow applies to all the state variablesinside the rectangle.
LUO ET AL.: MODEL INTERANNUAL PRIMARY PRODUCTIVITY G03019G03019
2 of 12
release from modeled net primary production. It has beensuggested that the 14C-PP measurements may overestimateP-PP because of 14C-labeled dissolved organic carbon(DOC) adsorption onto glass fiber filters [Karl et al., 1998].In this study, however, we used the P-PP as the modelequivalent for the available Station ALOHA 14C-PP data,both for the model optimization with data assimilation (seebelow) and for the analysis of model performance. Theunderlying assumption was that the overestimation percent-age of 14C-PP measurements was constant, so that it wouldnot affect our variability analysis.[10] HOT 14C-PP rates were measured mostly in upper
175 m before 2001, while only in upper 125 m afterwards.For consistency, all the 14C-PP profile were linearly inter-polated and integrated in upper 137.5 m using the mea-surements at 5 m, 25 m, 45 m, 75 m, 100 m and 125 m. Notethat the 14C-PP below this depth ranged �2–4% of the totalrate, shown by the measurements before 2001.[11] The model covered the surface 200 m at Station
ALOHA (22�45′N, 158�W) with 25 vertical layers. Only theresults from surface 150 m were analyzed to represent theeuphotic zone. The time step was 1 h. The model was forcedby physical forcings (Table 1) and bottom boundary condi-tions, which were derived and linearly interpolated fromHOTdata (http://hahana.soest.hawaii.edu/hot/hot_jgofs.html). Anexception was the photosynthetically active radiation (PAR)that was derived from NCEP reanalysis data (http://www.esrl.noaa.gov/psd/data/reanalysis/). Vertical velocity wasderived from HOT potential density data. An isopycnal withaverage depth of 200 m was selected, and the first orderderivative with time of this isopycnal’s depth was used as theestimated vertical velocity at 200 m. Then the vertical
velocity was linearly interpolated to the surface by assumingzero vertical velocity at the surface. Physical fluxes of nitrate,phosphate and semilabile DOM (including its C, N and Pcomponents) were specified at the model bottom boundaryusing concentrations estimated from the HOT data. Sinkingparticles (including their C, N and P components) exportedacross the model bottom boundary. Bottom boundary fluxesof other state variables were set to zero because of their lowconcentrations/biomass and low gradients at the depth of themodel bottom boundary.[12] As in Luo et al. [2010], an existing one-dimensional
data assimilative framework [Friedrichs et al., 2007] wasutilized. Specifically, the variational adjoint technique[Lawson et al., 1995] was used to objectively optimizemodel parameters by minimizing the differences between thesimulated values and HOT observations. Seventeen types ofobservations were assimilated (Table 2).[13] For the purposes of both the model bottom boundary
conditions and the data assimilation, the C, N and P com-ponents of semilabile DOM were derived by assumingrefractory DOM was uniformly distributed at the StationALOHA, and DOM in the deep ocean was all refractory[Carlson, 2002]. Thus for each measured DOM profile atStation ALOHA, the semilabile DOM concentration wasderived by subtracting the measured DOM concentration at1,000 m from the profile.
2.2. Forcing Sensitivity Experiments
[14] To further investigate the mechanisms for the mod-eled P-PP variability in the standard experiment, severalforcing sensitivity experiments were conducted (see below).
Table 1. Physical Forcings for the Model
Physical Forcing Source and Description
Photosynthetically active radiation NCEP reanalysis dataVertical velocity Estimated from HOT potential density data: temporal variation of 200 m isopycnalWater temperature HOT CTD dataMixed layer depth Depth with 0.5�C temperature offset from surface (all state variables fully mixed in mixed layer at each time step)Diffusivity Not required in mixed layer. Below mixed layer depth (MLD), decreasing exponentially over depth
k(z) = k0 � e�a(z-MLD), k0 = 1.1 � 10�4 m2s�1 is k at MLD, a = 0.01.
Table 2. Comparison Between the Assimilated Observations and Their Model Equivalents (Mean � Standard Deviation of All PointsWithout Differentiation of Depth or Time)a
PHYn CHL P-PP BAc BP NO3 PO4 MZc
Assimilated observations 0.11 0.13 0.34 0.31 0.039 0.0031 0.059 0.17�0.07 �0.07 �0.23 �0.12 �0.033 �0.0021 �0.032 �0.06
Model equivalents 0.08 0.13 0.34 0.26 0.033 0.0015 0.010 0.15�0.04 �0.04 �0.17 �0.13 �0.024 �0.0072 �0.003 �0.02
sDOC sDON sDOP POC PON POP STc STn STp
Assimilated observations 33 3.3 0.18 1.6 0.25 0.010 2.3 0.29 0.0095�10 �0.7 �0.05 �0.7 �0.10 �0.005 �0.8 �0.10 �0.0038
Model equivalents 39 3.4 0.18 1.3 0.19 0.012 2.3 0.30 0.0087�7 �0.4 �0.03 �0.6 �0.08 �0.005 �0.4 �0.05 �0.0019
aAll the data points are profiles over 0–200 m except NO3, PO4, MZc, STc, STn and STp. All concentrations are in mmol m�3 except for CHL, which isin mg m�3; P-PP and BP are in mmol C m�3 d�1; and STc, STn and STp are in mmol m�2 d�1. PHYn: phytoplankton nitrogen biomass; CHL,phytoplankton chlorophyll a; P-PP: 14C-primary production for observation and particulate primary production for model; BAc and BP: heterotrophicbacteria carbon biomass and production; NO3: nitrate (nitrate + nitrite in observation) at 10 m; PO4: phosphate at 10 m; MZc: averagemesozooplankton carbon biomass in surface 0–175 m; sDOC, sDON and sDOP: semilabile dissolved organic carbon, nitrogen and phosphorus; POC,PON and POP: particulate organic carbon, nitrogen and phosphorus, note observations for carbon and phosphorus did not separate organic matter butmeasured gross particulate carbon and phosphorus; STc, STn and STp: sediment trap (particulate export) carbon, nitrogen and phosphorus data at 150 m.
LUO ET AL.: MODEL INTERANNUAL PRIMARY PRODUCTIVITY G03019G03019
3 of 12

2.2.1. Experiments to Identify Impacts of ForcingVariability[15] A series of sensitivity experiments was set up to
investigate how the physical forcing terms contribute to themodeled P-PP variability. Although the data assimilationscheme used in this study can force the model to match theaverage measurements and the amplitudes of seasonal vari-ability by optimizing model parameters, interannual vari-ability in our configuration cannot be generated by changesin model parameters because the parameter values were heldconstant through all the years. The interannually varyingforcings must explain modeled variability. A series of sensi-tivity experiments was conducted using combinations oftime-varying forcing and seasonal climatological forcing ofthe different variables: the time-varying forcings incorporatedboth interannual and seasonal variations (those used in thestandard experiment), while the seasonal climatological for-cings repeated the seasonal climatological averages over allmodel years and thus did not include interannual variability.Exceptions were the seasonal climatological forcings of ver-tical velocity and bottom boundary conditions of nitrate andphosphate. Instead of seasonal climatologies, we used values
from a typical year (2003) repeated in each model yearbecause these forcings did not have well characterized sea-sonal patterns and using climatological averages wouldsmooth out essential subannual variability. These forcings arestill referred as “seasonal climatological forcing” to simplifythe terminology of this paper.[16] In a first set of experiments, seasonal climatological
forcing was used only for a single forcing term while time-varying forcing was used for all other forcing terms. That is, ineach experiment only one forcing term in the standard exper-iment was adjusted to the seasonal climatology. Thus if theinterannual variability pattern of the modeled P-PP changedsubstantially from the standard experiment then it was likelythat the adjusted forcing term can be justified as a contributingfactor.[17] In a second set of complementary experiments, time-
varying forcing was used for only one forcing factor whileall of the other forcings were seasonal climatologies. Thus ifthe experiment reproduced the modeled P-PP interannualvariability pattern to some extent, then it was likely that thesole time-varying forcing term used in the experiment can bejustified as a contributing factor.
Figure 2. (a) Comparison of depth-integrated 14C primary production (14C-PP) measurements (red dots)and their 3-point running average (red line) with the model particulate primary production (P-PP) in thestandard experiment (monthly running average, blue line) at Station ALOHA in 1991–2009. (b) Theannual means: 14C-PP measurements with standard errors (red), model P-PP in the standard experiment(blue) and model P-PP in the experiment using seasonal climatological vertical velocity w (black).
LUO ET AL.: MODEL INTERANNUAL PRIMARY PRODUCTIVITY G03019G03019
4 of 12
2.2.2. Pulse Experiment[18] To better isolate the model response, we also con-
ducted an idealized “pulse” experiment in which the time-varying forcings were used only for 1999 while the seasonalclimatological forcings were used for all other years.[19] The optimized (by data assimilation) model para-
meters in the standard experiment were used for all of theforcing sensitivity experiments; that is, the data assimilationscheme was not used to re-optimize parameters to theobservations for any of the sensitivity experiments.
3. Results and Discussion
3.1. Interannual Variability of MeasuredPrimary Production
[20] There were 181 vertically resolved 14C-PP determi-nations at Station ALOHA measured between 1991 and2009 (Figure 2a) with at least 8 profiles for each year, atapproximately monthly intervals, except for 1993, whichhad only 6 available profiles. The arithmetic means of the14C-PP determinations were calculated for each year(Figure 2b). Figure 2b shows that the temporal evolution ofthe annual average primary production at Station ALOHAcan be roughly grouped into several stages over the studyperiod: (1) 14C-PP varied in 1991–1998 with an average of
488 � 15 (standard error, same hereafter) mg C m�2 d�1;(2) 14C-PP exceeded the previous variation range in 1999–2000 and maintained high rates in 2000–2002 (582 � 10mg C m�2 d�1), which was significantly greater (Student’st-test p < 0.01) than measured during the previous stage;and (3) 14C-PP then gradually decreased through 2009.Linear regression analyses for the average annual 14C-PPbetween 2000 (the first year when the 14C-PP reached thepeak) and 2009 revealed a decreasing trend of 7.9 � 3.8 mgC m�2 d�1 yr�1 (p = 0.07; R2 = 0.36) (Table 3). The annualaverage 14C-PP of 494 mg C m�2 d�1 in 2009 suggestedthat the primary production may have returned to theobserved range for 1991–1998. We utilized the ecosystemmodel to explore the hypothesis that the observed increasein 14C-PP between 1999 and 2002, and subsequent declinepost 2002, was supported by a nutrient injection event andsubsequent retention of the N in the upper ocean as semi-labile DOM.
3.2. Modeled Particulate Primary Productionin the Standard Experiment
[21] The model parameters were first optimized by dataassimilation, which greatly minimized the model misfits tothe observations [Luo et al., 2010]. The average values of themodel variables were mostly comparable to the observations
Table 3. Interannual Variability Pattern of Annual Average Primary Production Rates in Forcing Experimentsa
1991–1998Average 2000
2000 Minus1991–1998
Slope in2000–2009 p
14C Measurements 488 587 99 �7.9 � 3.8 0.068Standard experiment: All
time-varying forcings507 570 63 �9.4 � 1.5 0.000
Experiments: All seasonalclimatological forcings
552 551 �1 0.0 0.621
Experiments: Time-Varying Forcings Except for Identified Forcing Variablesb
Vertical velocity 557(+50) 565(�5) 9 �5.1 � 1.5 0.011PAR 515(+8) 573(+3) 58 �8.9 � 2.0 0.002Water temperature 509(+2) 571(+1) 62 �9.0 � 1.9 0.001Mixed-layer depth and
eddy diffusivity519(+12) 580(+10) 61 �11.5 � 1.6 0.000
Nitrate BBC 528(+21) 649(+79) 121 �16.1 � 2.4 0.000Phosphate BBC 508(+1) 570(0) 62 �7.8 � 1.5 0.001Semilabile DOC BBC 506(�1) 561(�9) 55 �8.9 � 1.5 0.000Semilabile DON BBC 499(�8) 523(�47) 24 �2.9 0.194Semilabile DOP BBC 502(�5) 570(0) 68 �9.4 � 1.6 0.000
Experiments: Seasonal Climatological Forcings Except for Identified Forcing Variablesc
Vertical velocityd 555(+48) 657(+87) (in 1999) 101(1999 Minus1991–1998)
�7.5 � 5.7(Slope in1999–2009)
0.039
PAR 542(+35) 548(�22) 6 �0.9 0.319Water temperature 548(+41) 550(�20) 2 �0.4 0.774Mixed-layer depth and
eddy diffusivity549(+42) 560(�10) 11 �1.7 � 0.6 0.019
Nitrate BBC 564(+57) 534(�36) �30 2.1 � 1.0 0.076Phosphate BBC 553(+46) 552(�18) �1 0.0 0.490Semilabile DOC BBC 552(+45) 554(�16) 2 �0.5 0.154Semilabile DON BBC 557(+50) 569(�1) 12 �4.2 � 0.5 0.000Semilabile DOP BBC 552(+45) 552(�18) 0 �0.5 � 0.1 0.001
aNumbers in brackets are anomalies of the experiments from the model with standard time-varying forcings. BBC: bottom boundary conditions. Theslope and the p value (F statistics) in 2000–2009 use linear regression. For cases where p < 0.1, standard errors for slope are also shown. All units arein mg C m�2 d�1 except the slope in mg C m�2 d�1 yr�1.
bIn these experiments, the identified forcing is seasonal climatology, and all the other forcings are time-varying.cIn these experiments, the time-varying forcing applies only to the identified parameter; all other forcings are seasonal climatologies.dModeled primary production in this experiment peaks in 1999 instead of in 2000 as in other experiments.
LUO ET AL.: MODEL INTERANNUAL PRIMARY PRODUCTIVITY G03019G03019
5 of 12
(Table 2). The only exceptions were surface (at depth of 10m) concentration of phosphate, which were underestimatedby the model. However, the model surface primary produc-tivity was still N-limited even with the underestimated sur-face phosphate, so that the performance of the modeled Ncycle was not impacted. After data assimilation the modelsuccessfully reproduced the observed seasonality in produc-tivity (Figure 2a).[22] The modeled annual averages of P-PP in the standard
experiment were low in 1991–1998, then increased in 1999–2000 and decreased after 2000 (Figure 2b), which wassimilar to the pattern of the 14C-PP measurements, exceptthat the modeled P-PP started to decrease two years earlier(after 2000) than the 14C-PP measurements (after 2002)(Figure 2b). To facilitate the evaluation of the model per-formance in reproducing this interannual primary productionpattern, we looked at three indicators: the average annualmean value for 1991–1998 to represent the first stage;whether the annual value in 2000 was higher than the aver-age value in 1991–1998 to represent the stage shift; and thelinear trend between 2000 and 2009 (Table 3). The averagemodeled P-PP in the standard experiment in 1991–1998 was507 � 4.5 mg C m�2 d�1, �20 mg C m�2 d�1 greater thanthe measured rates, because the model was not able toreproduce the low measurements in 1993, 1994 and 1997.The modeled P-PP also had a smaller increase of 63 mg Cm�2 d�1 in 2000, over the 1991–1998 baseline, compared tothe measurements. The modeled annual value in 2000 wasstill significantly higher than the mean of the modeled valuesin 1991–1998 (Student’s t-test, p < 0.001). The decreasingrate of modeled P-PP in 2000–2009 was �9.4 � 1.5 mg Cm�2 d�1 yr�1, similar to that based on the measured rates.
3.3. Contributing Forcings for the ModeledInterannual Variability of Primary Production
[23] Before conducting the sensitivity experiments, themodel was first tested using the seasonal climatologicalforcings over all years. The simulation approached a cyclo-stationary seasonal variation with a steady state annualaverage P-PP (see Figure S1 in Text S1 in the auxiliarymaterials),1 indicating that the seasonal climatological for-cings did not introduce the interannual variability of thesimulated P-PP.[24] The experiments replacing a single forcing term in
turn in the standard experiment with seasonal climatologicalforcing showed that three forcing terms substantiallyaffected the modeled P-PP pattern: vertical velocity and thenitrate and semilabile DON bottom boundary conditions(Table 3). When the seasonal climatology was used for thevertical velocity, the modeled shift toward elevated modeledP-PP in 1999–2000 disappeared and the downward trendafter 2000 was lower (Figure 2b and Table 3). When theseasonal climatology was used for the nitrate bottomboundary condition, the increase of the modeled P-PP in2000 was even higher, and the decrease of P-PP after 2000was faster (Table 3). In other words, the standard time-varying, nitrate bottom boundary condition actually weak-ened the pattern of the modeled P-PP variability. When theseasonal climatology was used for the semilabile DON
bottom boundary condition, the increase of P-PP in 2000became smaller (Table 3). This was because the semilabileDON bottom boundary condition seasonal climatologyexhibited lower concentrations in 1999 and 2000 than in thestandard time-varying values (derived from the observa-tions). Thus the accumulated semilabile DON was exportedby physical diffusion more quickly in the seasonal climato-logical experiment in 1999 and 2000, and less N was recy-cled to support primary production (the details of this effectare discussed in the next section).[25] The identified contributing factors were also con-
firmed by the other set of sensitivity experiments with onetime-varying forcing term. In the sensitivity experimentwhere time-varying forcing was applied only for the verticalvelocity (with seasonal climatologies for the other forcings),the P-PP peak occurred earlier in time and was larger inmagnitude than in the standard results (Table 3). In thestandard experiment, the effect of the time-varying verticalvelocity is damped partially by an opposing effect from thetime-variations in the nitrate bottom boundary condition. Asexpected, with only a time-varying nitrate bottom boundarycondition, the model produced an opposite pattern from thestandard results with a decrease of P-PP in 2000 andincreasing P-PP after 2000 (Table 3). The time-varyingsemilabile DON bottom boundary conditions alone pro-duced a much smaller P-PP increase in 2000, and a signifi-cant decrease after 2000 (Table 3). The pair of sensitivityexperiments testing the effect of semilabile DON bottomboundary conditions suggested that the decreasing P-PPtrend in the standard experiment was partly contributed bythe bottom boundary condition of semilabile DON. Unfor-tunately there were no DON measurements after 2000 atStation ALOHA, and the time-varying semilabile DONbottom boundary condition after 2000 was constructedindirectly from DOC measurements using a constant C:Nratio of 11:1. Thus we cannot conclusively affirm the effectof the semilabile DON bottom boundary condition after2000.[26] Together, these sensitivity experiments indicated that
the interannual variability of the vertical velocity, modulatedand partially opposed by the nitrate bottom boundary con-dition, was the principal forcing term contributing to themodeled interannual variability in P-PP. As discussed above,the vertical velocity (Figure 3) was derived from themonthly measurements of potential density at StationALOHA and therefore may have incorporated some infor-mation on mesoscale phenomena (e.g., eddies, Rossbywaves, etc.), which could be a physical mechanism for theinterannual variability of primary production in the NorthPacific Subtropical Gyre.
3.4. Responses of the Modeled Primary Production
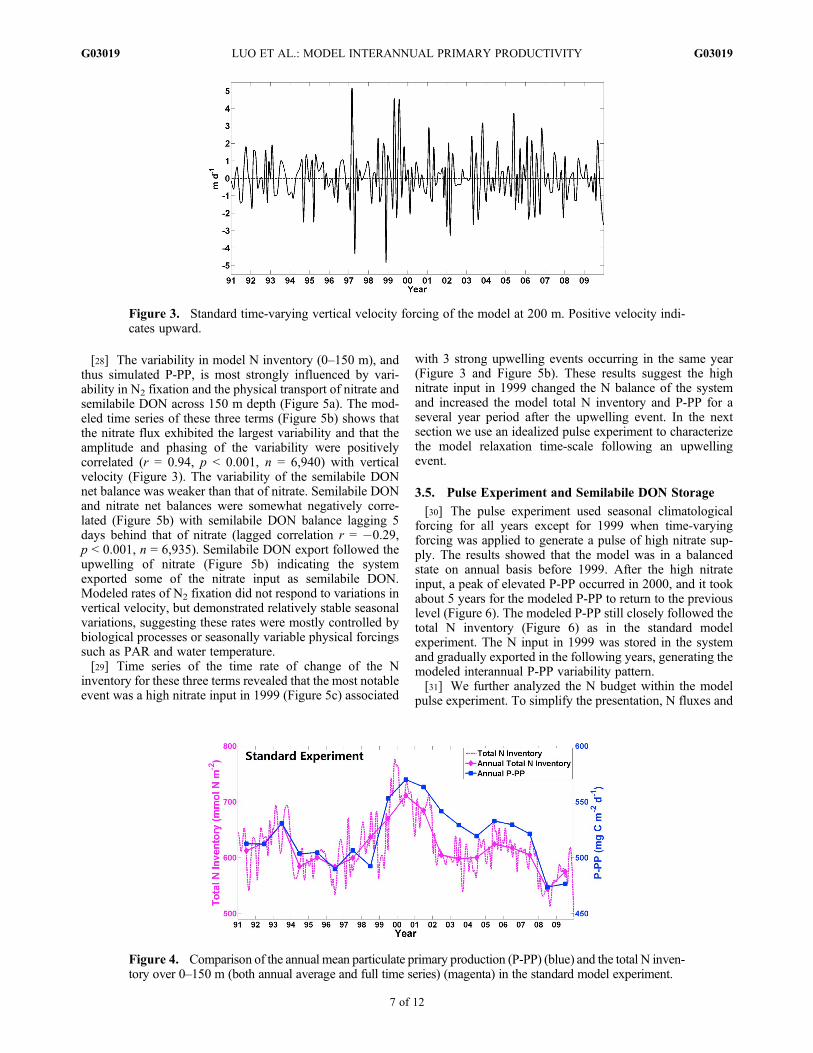
[27] Although the forcing terms were the ultimate causesfor the interannual variability of modeled primary produc-tion, further analysis was necessary to study how the modeledprimary production variability responded to these forcings. Inthis N-limited system, the modeled annual average P-PPclosely followed the modeled total N inventory (N from allstate variables) over the 0–150 m depth range (correlationr = 0.83, p < 0.001, n = 19) (Figure 4). Thus the variability inmodel primary production greatly depended on the time rateof change in the bioavailable N inventory.
1Auxiliary materials are available in the HTML. doi:10.1029/2011JG001830.
LUO ET AL.: MODEL INTERANNUAL PRIMARY PRODUCTIVITY G03019G03019
6 of 12
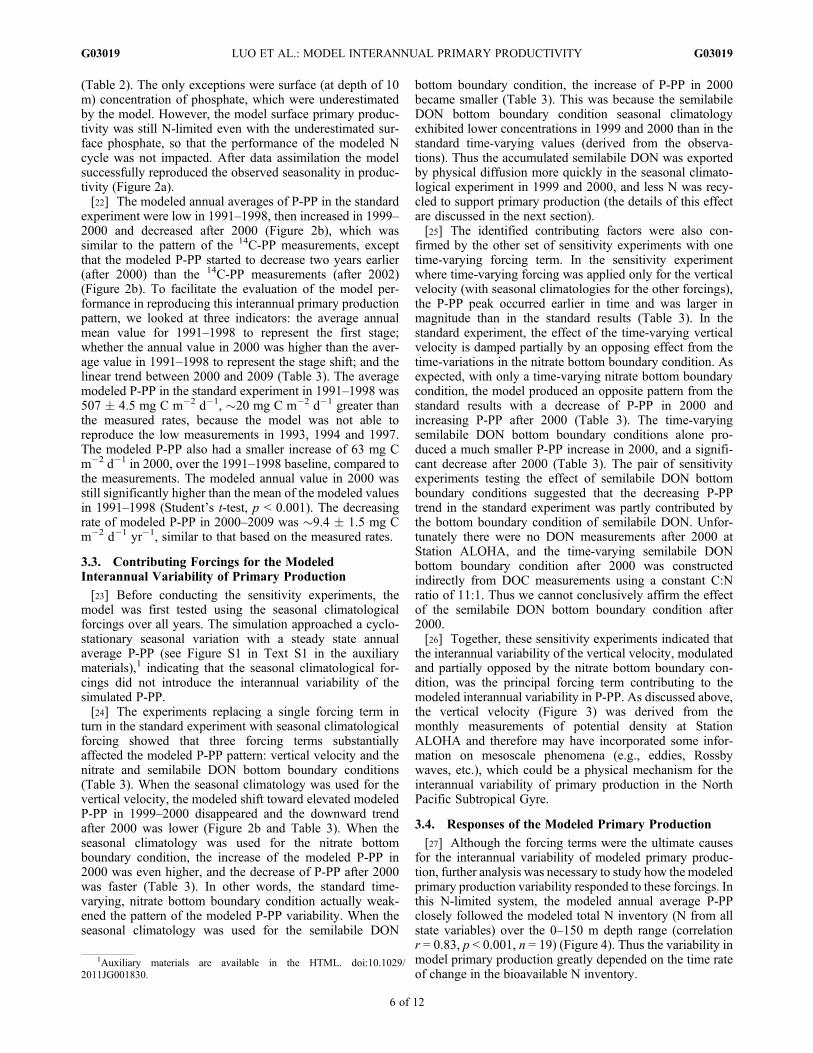
[28] The variability in model N inventory (0–150 m), andthus simulated P-PP, is most strongly influenced by vari-ability in N2 fixation and the physical transport of nitrate andsemilabile DON across 150 m depth (Figure 5a). The mod-eled time series of these three terms (Figure 5b) shows thatthe nitrate flux exhibited the largest variability and that theamplitude and phasing of the variability were positivelycorrelated (r = 0.94, p < 0.001, n = 6,940) with verticalvelocity (Figure 3). The variability of the semilabile DONnet balance was weaker than that of nitrate. Semilabile DONand nitrate net balances were somewhat negatively corre-lated (Figure 5b) with semilabile DON balance lagging 5days behind that of nitrate (lagged correlation r = �0.29,p < 0.001, n = 6,935). Semilabile DON export followed theupwelling of nitrate (Figure 5b) indicating the systemexported some of the nitrate input as semilabile DON.Modeled rates of N2 fixation did not respond to variations invertical velocity, but demonstrated relatively stable seasonalvariations, suggesting these rates were mostly controlled bybiological processes or seasonally variable physical forcingssuch as PAR and water temperature.[29] Time series of the time rate of change of the N
inventory for these three terms revealed that the most notableevent was a high nitrate input in 1999 (Figure 5c) associated
with 3 strong upwelling events occurring in the same year(Figure 3 and Figure 5b). These results suggest the highnitrate input in 1999 changed the N balance of the systemand increased the model total N inventory and P-PP for aseveral year period after the upwelling event. In the nextsection we use an idealized pulse experiment to characterizethe model relaxation time-scale following an upwellingevent.
3.5. Pulse Experiment and Semilabile DON Storage
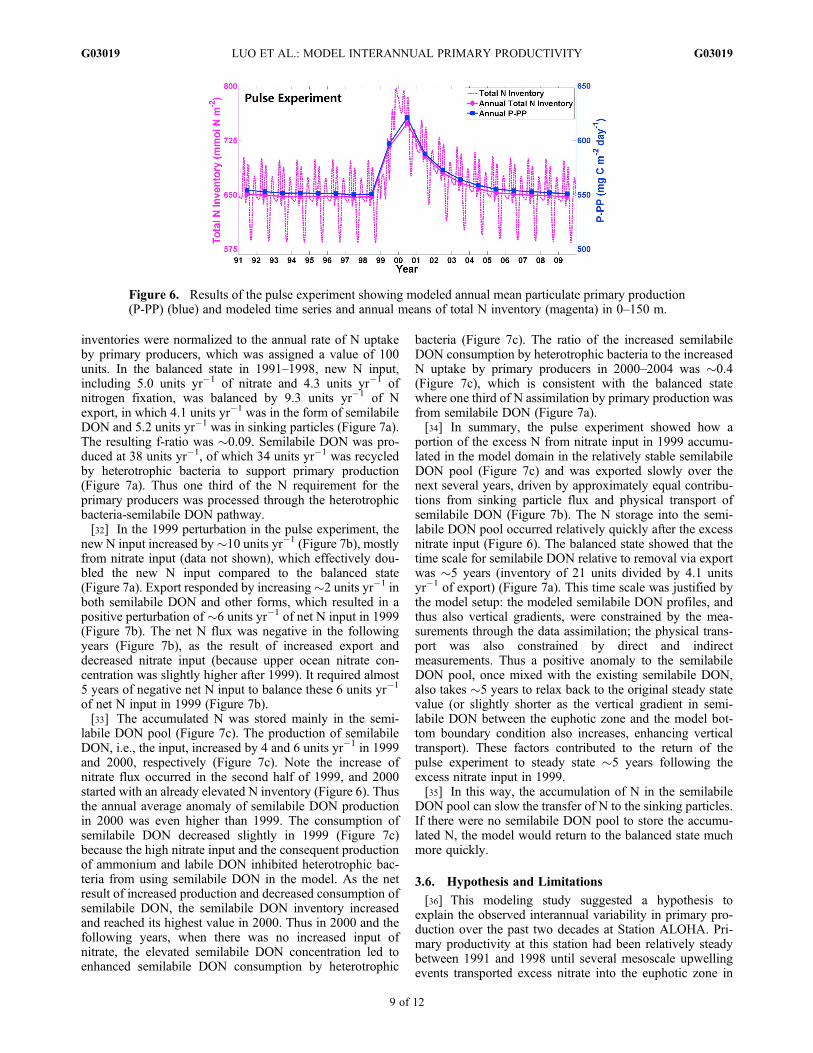
[30] The pulse experiment used seasonal climatologicalforcing for all years except for 1999 when time-varyingforcing was applied to generate a pulse of high nitrate sup-ply. The results showed that the model was in a balancedstate on annual basis before 1999. After the high nitrateinput, a peak of elevated P-PP occurred in 2000, and it tookabout 5 years for the modeled P-PP to return to the previouslevel (Figure 6). The modeled P-PP still closely followed thetotal N inventory (Figure 6) as in the standard modelexperiment. The N input in 1999 was stored in the systemand gradually exported in the following years, generating themodeled interannual P-PP variability pattern.[31] We further analyzed the N budget within the model
pulse experiment. To simplify the presentation, N fluxes and
Figure 4. Comparison of the annual mean particulate primary production (P-PP) (blue) and the total N inven-tory over 0–150 m (both annual average and full time series) (magenta) in the standard model experiment.
Figure 3. Standard time-varying vertical velocity forcing of the model at 200 m. Positive velocity indi-cates upward.
LUO ET AL.: MODEL INTERANNUAL PRIMARY PRODUCTIVITY G03019G03019
7 of 12
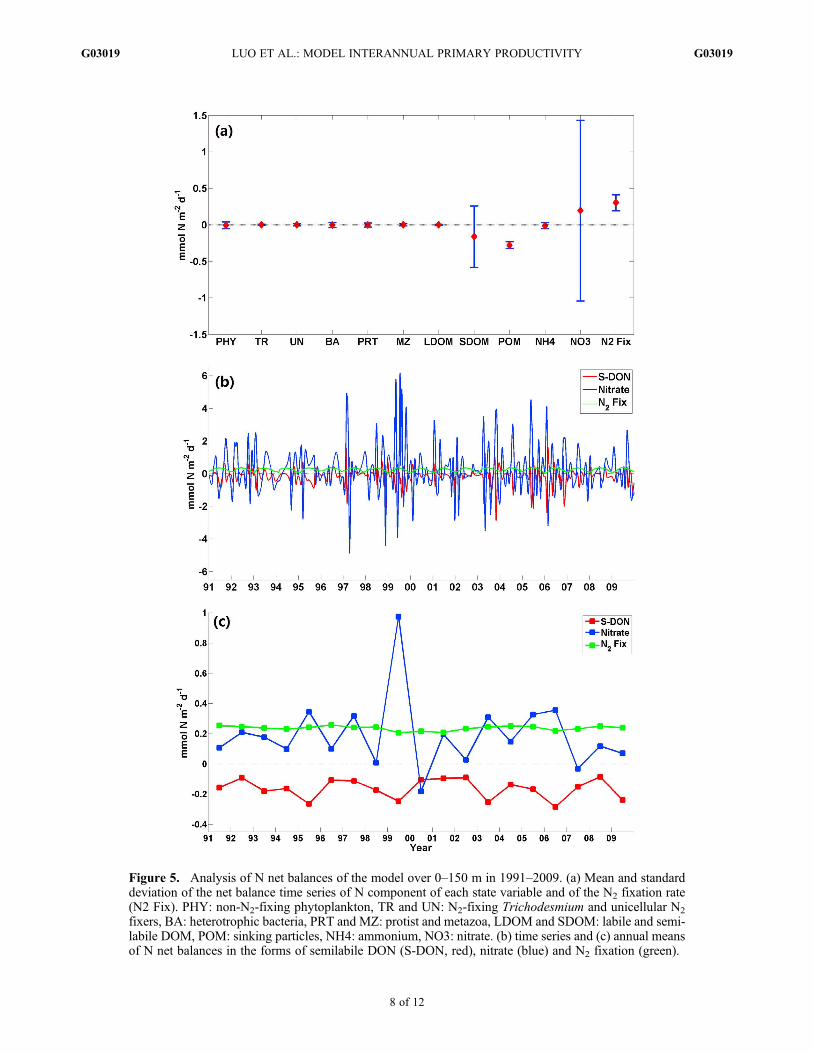
Figure 5. Analysis of N net balances of the model over 0–150 m in 1991–2009. (a) Mean and standarddeviation of the net balance time series of N component of each state variable and of the N2 fixation rate(N2 Fix). PHY: non-N2-fixing phytoplankton, TR and UN: N2-fixing Trichodesmium and unicellular N2
fixers, BA: heterotrophic bacteria, PRT and MZ: protist and metazoa, LDOM and SDOM: labile and semi-labile DOM, POM: sinking particles, NH4: ammonium, NO3: nitrate. (b) time series and (c) annual meansof N net balances in the forms of semilabile DON (S-DON, red), nitrate (blue) and N2 fixation (green).
LUO ET AL.: MODEL INTERANNUAL PRIMARY PRODUCTIVITY G03019G03019
8 of 12
inventories were normalized to the annual rate of N uptakeby primary producers, which was assigned a value of 100units. In the balanced state in 1991–1998, new N input,including 5.0 units yr�1 of nitrate and 4.3 units yr�1 ofnitrogen fixation, was balanced by 9.3 units yr�1 of Nexport, in which 4.1 units yr�1 was in the form of semilabileDON and 5.2 units yr�1 was in sinking particles (Figure 7a).The resulting f-ratio was �0.09. Semilabile DON was pro-duced at 38 units yr�1, of which 34 units yr�1 was recycledby heterotrophic bacteria to support primary production(Figure 7a). Thus one third of the N requirement for theprimary producers was processed through the heterotrophicbacteria-semilabile DON pathway.[32] In the 1999 perturbation in the pulse experiment, the
new N input increased by�10 units yr�1 (Figure 7b), mostlyfrom nitrate input (data not shown), which effectively dou-bled the new N input compared to the balanced state(Figure 7a). Export responded by increasing�2 units yr�1 inboth semilabile DON and other forms, which resulted in apositive perturbation of �6 units yr�1 of net N input in 1999(Figure 7b). The net N flux was negative in the followingyears (Figure 7b), as the result of increased export anddecreased nitrate input (because upper ocean nitrate con-centration was slightly higher after 1999). It required almost5 years of negative net N input to balance these 6 units yr�1
of net N input in 1999 (Figure 7b).[33] The accumulated N was stored mainly in the semi-
labile DON pool (Figure 7c). The production of semilabileDON, i.e., the input, increased by 4 and 6 units yr�1 in 1999and 2000, respectively (Figure 7c). Note the increase ofnitrate flux occurred in the second half of 1999, and 2000started with an already elevated N inventory (Figure 6). Thusthe annual average anomaly of semilabile DON productionin 2000 was even higher than 1999. The consumption ofsemilabile DON decreased slightly in 1999 (Figure 7c)because the high nitrate input and the consequent productionof ammonium and labile DON inhibited heterotrophic bac-teria from using semilabile DON in the model. As the netresult of increased production and decreased consumption ofsemilabile DON, the semilabile DON inventory increasedand reached its highest value in 2000. Thus in 2000 and thefollowing years, when there was no increased input ofnitrate, the elevated semilabile DON concentration led toenhanced semilabile DON consumption by heterotrophic
bacteria (Figure 7c). The ratio of the increased semilabileDON consumption by heterotrophic bacteria to the increasedN uptake by primary producers in 2000–2004 was �0.4(Figure 7c), which is consistent with the balanced statewhere one third of N assimilation by primary production wasfrom semilabile DON (Figure 7a).[34] In summary, the pulse experiment showed how a
portion of the excess N from nitrate input in 1999 accumu-lated in the model domain in the relatively stable semilabileDON pool (Figure 7c) and was exported slowly over thenext several years, driven by approximately equal contribu-tions from sinking particle flux and physical transport ofsemilabile DON (Figure 7b). The N storage into the semi-labile DON pool occurred relatively quickly after the excessnitrate input (Figure 6). The balanced state showed that thetime scale for semilabile DON relative to removal via exportwas �5 years (inventory of 21 units divided by 4.1 unitsyr�1 of export) (Figure 7a). This time scale was justified bythe model setup: the modeled semilabile DON profiles, andthus also vertical gradients, were constrained by the mea-surements through the data assimilation; the physical trans-port was also constrained by direct and indirectmeasurements. Thus a positive anomaly to the semilabileDON pool, once mixed with the existing semilabile DON,also takes �5 years to relax back to the original steady statevalue (or slightly shorter as the vertical gradient in semi-labile DON between the euphotic zone and the model bot-tom boundary condition also increases, enhancing verticaltransport). These factors contributed to the return of thepulse experiment to steady state �5 years following theexcess nitrate input in 1999.[35] In this way, the accumulation of N in the semilabile
DON pool can slow the transfer of N to the sinking particles.If there were no semilabile DON pool to store the accumu-lated N, the model would return to the balanced state muchmore quickly.
3.6. Hypothesis and Limitations
[36] This modeling study suggested a hypothesis toexplain the observed interannual variability in primary pro-duction over the past two decades at Station ALOHA. Pri-mary productivity at this station had been relatively steadybetween 1991 and 1998 until several mesoscale upwellingevents transported excess nitrate into the euphotic zone in
Figure 6. Results of the pulse experiment showing modeled annual mean particulate primary production(P-PP) (blue) and modeled time series and annual means of total N inventory (magenta) in 0–150 m.
LUO ET AL.: MODEL INTERANNUAL PRIMARY PRODUCTIVITY G03019G03019
9 of 12
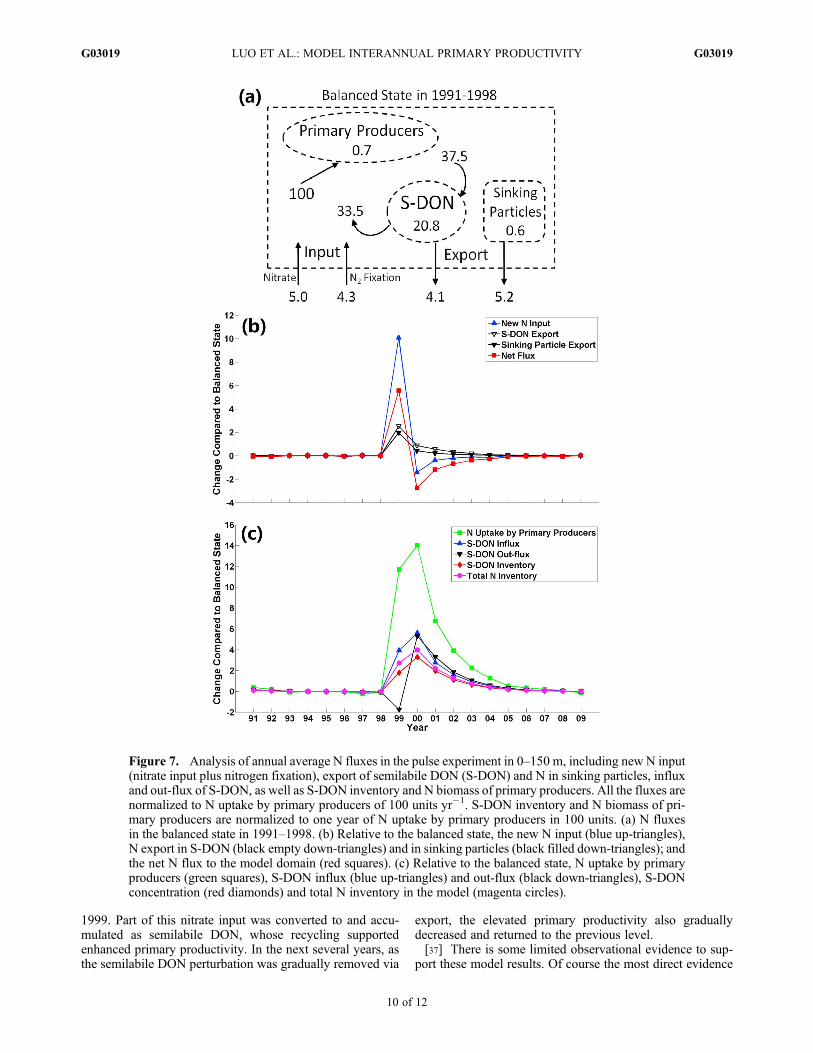
1999. Part of this nitrate input was converted to and accu-mulated as semilabile DON, whose recycling supportedenhanced primary productivity. In the next several years, asthe semilabile DON perturbation was gradually removed via
export, the elevated primary productivity also graduallydecreased and returned to the previous level.[37] There is some limited observational evidence to sup-
port these model results. Of course the most direct evidence
Figure 7. Analysis of annual average N fluxes in the pulse experiment in 0–150 m, including new N input(nitrate input plus nitrogen fixation), export of semilabile DON (S-DON) and N in sinking particles, influxand out-flux of S-DON, as well as S-DON inventory and N biomass of primary producers. All the fluxes arenormalized to N uptake by primary producers of 100 units yr�1. S-DON inventory and N biomass of pri-mary producers are normalized to one year of N uptake by primary producers in 100 units. (a) N fluxesin the balanced state in 1991–1998. (b) Relative to the balanced state, the new N input (blue up-triangles),N export in S-DON (black empty down-triangles) and in sinking particles (black filled down-triangles); andthe net N flux to the model domain (red squares). (c) Relative to the balanced state, N uptake by primaryproducers (green squares), S-DON influx (blue up-triangles) and out-flux (black down-triangles), S-DONconcentration (red diamonds) and total N inventory in the model (magenta circles).
LUO ET AL.: MODEL INTERANNUAL PRIMARY PRODUCTIVITY G03019G03019
10 of 12
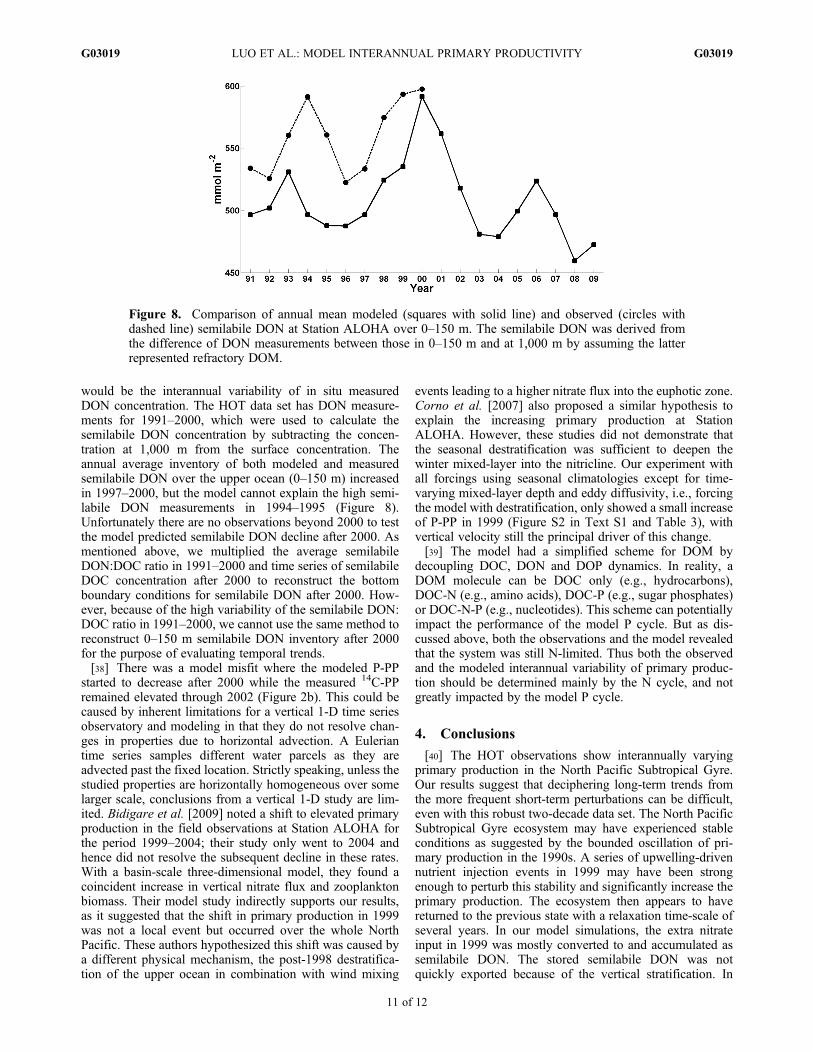
would be the interannual variability of in situ measuredDON concentration. The HOT data set has DON measure-ments for 1991–2000, which were used to calculate thesemilabile DON concentration by subtracting the concen-tration at 1,000 m from the surface concentration. Theannual average inventory of both modeled and measuredsemilabile DON over the upper ocean (0–150 m) increasedin 1997–2000, but the model cannot explain the high semi-labile DON measurements in 1994–1995 (Figure 8).Unfortunately there are no observations beyond 2000 to testthe model predicted semilabile DON decline after 2000. Asmentioned above, we multiplied the average semilabileDON:DOC ratio in 1991–2000 and time series of semilabileDOC concentration after 2000 to reconstruct the bottomboundary conditions for semilabile DON after 2000. How-ever, because of the high variability of the semilabile DON:DOC ratio in 1991–2000, we cannot use the same method toreconstruct 0–150 m semilabile DON inventory after 2000for the purpose of evaluating temporal trends.[38] There was a model misfit where the modeled P-PP
started to decrease after 2000 while the measured 14C-PPremained elevated through 2002 (Figure 2b). This could becaused by inherent limitations for a vertical 1-D time seriesobservatory and modeling in that they do not resolve chan-ges in properties due to horizontal advection. A Euleriantime series samples different water parcels as they areadvected past the fixed location. Strictly speaking, unless thestudied properties are horizontally homogeneous over somelarger scale, conclusions from a vertical 1-D study are lim-ited. Bidigare et al. [2009] noted a shift to elevated primaryproduction in the field observations at Station ALOHA forthe period 1999–2004; their study only went to 2004 andhence did not resolve the subsequent decline in these rates.With a basin-scale three-dimensional model, they found acoincident increase in vertical nitrate flux and zooplanktonbiomass. Their model study indirectly supports our results,as it suggested that the shift in primary production in 1999was not a local event but occurred over the whole NorthPacific. These authors hypothesized this shift was caused bya different physical mechanism, the post-1998 destratifica-tion of the upper ocean in combination with wind mixing
events leading to a higher nitrate flux into the euphotic zone.Corno et al. [2007] also proposed a similar hypothesis toexplain the increasing primary production at StationALOHA. However, these studies did not demonstrate thatthe seasonal destratification was sufficient to deepen thewinter mixed-layer into the nitricline. Our experiment withall forcings using seasonal climatologies except for time-varying mixed-layer depth and eddy diffusivity, i.e., forcingthe model with destratification, only showed a small increaseof P-PP in 1999 (Figure S2 in Text S1 and Table 3), withvertical velocity still the principal driver of this change.[39] The model had a simplified scheme for DOM by
decoupling DOC, DON and DOP dynamics. In reality, aDOM molecule can be DOC only (e.g., hydrocarbons),DOC-N (e.g., amino acids), DOC-P (e.g., sugar phosphates)or DOC-N-P (e.g., nucleotides). This scheme can potentiallyimpact the performance of the model P cycle. But as dis-cussed above, both the observations and the model revealedthat the system was still N-limited. Thus both the observedand the modeled interannual variability of primary produc-tion should be determined mainly by the N cycle, and notgreatly impacted by the model P cycle.
4. Conclusions
[40] The HOT observations show interannually varyingprimary production in the North Pacific Subtropical Gyre.Our results suggest that deciphering long-term trends fromthe more frequent short-term perturbations can be difficult,even with this robust two-decade data set. The North PacificSubtropical Gyre ecosystem may have experienced stableconditions as suggested by the bounded oscillation of pri-mary production in the 1990s. A series of upwelling-drivennutrient injection events in 1999 may have been strongenough to perturb this stability and significantly increase theprimary production. The ecosystem then appears to havereturned to the previous state with a relaxation time-scale ofseveral years. In our model simulations, the extra nitrateinput in 1999 was mostly converted to and accumulated assemilabile DON. The stored semilabile DON was notquickly exported because of the vertical stratification. In
Figure 8. Comparison of annual mean modeled (squares with solid line) and observed (circles withdashed line) semilabile DON at Station ALOHA over 0–150 m. The semilabile DON was derived fromthe difference of DON measurements between those in 0–150 m and at 1,000 m by assuming the latterrepresented refractory DOM.
LUO ET AL.: MODEL INTERANNUAL PRIMARY PRODUCTIVITY G03019G03019
11 of 12
addition, compared to other N pools, the lower lability ofsemilabile DON in this oligotrophic environment results inrelatively low recycling by heterotrophic bacteria, slowingthe transfer of the accumulated N away from rapid export viasinking particles. Instead, the stored semilabile DON wasgradually remineralized and recycled over a prolongedperiod of several years. Our study suggests the ecologicalimpacts of physical nutrient inputs may occur over extendedtime periods and highlights the importance of DOM-het-erotrophic bacterial dynamics in controlling how and forhow long oligotrophic subtropical ecosystems can takeadvantage of extra nutrients brought by mesoscale eddies orother sources of external nutrients.
[41] Acknowledgments. We thank all of the scientists and crew whohave contributed to the Hawaii Ocean Time (HOT) series. This work wassupported in part by the Center for Microbial Oceanography, Researchand Education (C-MORE) (NSF EF-0424599), Hawaii Ocean Time seriesprogram (NSF OCE09–26766), the Gordon and Betty Moore Foundation,and the Marine Biological Laboratory. The computational resources wereprovided by the College of William and Mary SciClone cluster. We thankthree anonymous reviewers for their constructive comments, which greatlyhelped us to improve the quality of this paper.
ReferencesAzam, F., T. Fenchel, J. G. Field, J. S. Gray, L. A. Meyer-Reil, and F.Thingstad (1983), The ecological role of water-column microbes in thesea, Mar. Ecol. Prog. Ser., 10(3), 257–263, doi:10.3354/meps010257.
Bidigare, R. R., F. Chai, M. R. Landry, R. Lukas, C. C. S. Hannides, S. J.Christensen, D. M. Karl, L. Shi, and Y. Chao (2009), Subtropical oceanecosystem structure changes forced by North Pacific climate variations,J. Plankton Res., 31(10), 1131–1139, doi:10.1093/plankt/fbp064.
Calil, P. H. R., and K. J. Richards (2010), Transient upwelling hot spots inthe oligotrophic North Pacific, J. Geophys. Res., 115, C02003,doi:10.1029/2009JC005360.
Calil, P. H. R., S. C. Doney, K. Yumimoto, K. Eguchi, and T. Takemura(2011), Episodic upwelling and dust deposition as bloom triggers inlow nutrient low chlorophyll (LNLC) regions, J. Geophys. Res., 116,C06030, doi:10.1029/2010JC006704.
Carlson, C. A. (2002), Production and removal processes, in Biogeochemistryof Marine Dissolved Organic Matter, edited by D. A. Hansell and C. A.Carlson, pp. 91–151, Elsevier Sci., New York, doi:10.1016/B978-012323841-2/50006-3.
Carlson, C. A., H.W.Ducklow, andA. F.Michaels (1994), Annual flux of dis-solved organic carbon from the euphotic zone in the northwestern SargassoSea, Nature, 371, 405–408, doi:10.1038/371405a0.
Casciotti, K. L., T. W. Trull, D. M. Glover, and D. Davies (2008), Con-straints on nitrogen cycling at the subtropical North Pacific StationALOHA from isotopic measurements of nitrate and particulate nitrogen,Deep Sea Res., Part II, 55(14–15), 1661–1672, doi:10.1016/j.dsr2.2008.04.017.
Church, M. J., H. W. Ducklow, and D. M. Karl (2002), Multiyear increasesin dissolved organic matter inventories at station ALOHA in the NorthPacific Subtropical Gyre, Limnol. Oceanogr., 47(1), 1–10, doi:10.4319/lo.2002.47.1.0001.
Church, M. J., C. Mahaffey, R. M. Letelier, R. Lukas, J. P. Zehr, and D. M.Karl (2009), Physical forcing of nitrogen fixation and diazotroph commu-nity structure in the North Pacific subtropical gyre, Global Biogeochem.Cycles, 23, GB2020, doi:10.1029/2008GB003418.
Corno, G., D. M. Karl, M. J. Church, R. M. Letelier, R. Lukas, R. R.Bidigare, and M. R. Abbott (2007), Impact of climate forcing on ecosys-tem processes in the North Pacific Subtropical Gyre, J. Geophys. Res.,112, C04021, doi:10.1029/2006JC003730.
Deutsch, C., N. Gruber, R.M. Key, and J. L. Sarmiento (2001), Denitrificationand N2 fixation in the Pacific Ocean, Global Biogeochem. Cycles, 15(2),483–506, doi:10.1029/2000GB001291.
Dore, J. E., and D. M. Karl (1996), Nitrite distributions and dynamics atStation ALOHA, Deep Sea Res., Part II, 43(2–3), 385–402,doi:10.1016/0967-0645(95)00105-0.
Dore, J. E., J. R. Brum, L.M. Tupas, and D.M. Karl (2002), Seasonal and inter-annual variability in sources of nitrogen supporting export in the oligotrophic
subtropical North Pacific Ocean, Limnol. Oceanogr., 47(6), 1595–1607,doi:10.4319/lo.2002.47.6.1595.
Ducklow, H. W., C. A. Carlson, N. R. Bates, A. H. Knap, and A. F.Michaels (1995), Dissolved organic carbon as a component of the biolog-ical pump in the North Atlantic Ocean, Philos. Trans. R. Soc. London,Ser. B, 348, 161–167, doi:10.1098/rstb.1995.0058.
Friedrichs, M. A. M., et al. (2007), Assessment of skill and portability inregional marine biogeochemical models: Role of multiple planktonicgroups, J. Geophys. Res., 112, C08001, doi:10.1029/2006JC003852.
Hedges, J. I. (1992), Global biogeochemical cycles: Progress and problems,Mar. Chem., 39, 67–93, doi:10.1016/0304-4203(92)90096-S.
Jackson, G. A., and P. M. Williams (1985), Importance of dissolved organicnitrogen and phosphorus to biological nutrient cycling, Deep Sea Res.,Part A, 32, 223–235, doi:10.1016/0198-0149(85)90030-5.
Karl, D. M., and R. M. Letelier (2008), Nitrogen fixation-enhanced carbonsequestration in low nitrate, low chlorophyll seascapes, Mar. Ecol. Prog.Ser., 364, 257–268, doi:10.3354/meps07547.
Karl, D. M., and R. Lukas (1996), The Hawaii Ocean Time-series (HOT)Program: Background, rationale and field implementation, Deep SeaRes., Part II, 43(2–3), 129–156, doi:10.1016/0967-0645(96)00005-7.
Karl, D. M., R. Letelier, L. Tupas, J. Dore, J. Christian, and D. Hebel(1997), The role of nitrogen fixation in biogeochemical cycling in thesubtropical North Pacific Ocean, Nature, 388, 533–538, doi:10.1038/41474.
Karl, D. M., D. V. Hebel, K. Björkman, and R. M. Letelier (1998), The roleof dissolved organic matter release in the productivity of the oligotrophicNorth Pacific Ocean, Limnol. Oceanogr., 43(6), 1270–1286, doi:10.4319/lo.1998.43.6.1270.
Karl, D. M., K. M. Björkman, J. E. Dore, L. Fujieki, D. V. Hebel, T. Houlihan,R. M. Letelier, and L. M. Tupas (2001a), Ecological nitrogen-to-phosphorus stoichiometry at station ALOHA, Deep Sea Res., PartII, 48(8–9), 1529–1566, doi:10.1016/S0967-0645(00)00152-1.
Karl, D. M., J. E. Dore, R. Lukas, A. F. Michaels, N. R. Bates, and A. Knap(2001b), Building the long-term picture: The U.S. JGOFS time-seriesprograms, Oceanography, 14(4), 6–17, doi:10.5670/oceanog.2001.02.
Karl, D. M., R. R. Bidigare, M. J. Church, J. E. Dore, R. M. Letelier,C. Mahaffey, and J. P. Zehr (2008), The nitrogen cycle in the NorthPacific Trades biome: An evolving paradigm, in Nitrogen in the MarineEnvironment, 2nd ed., edited by D. G. Capone et al., pp. 705–769,Elsevier, Amsterdam, doi:10.1016/B978-0-12-372522-6.00016-5.
Lawson, L. M., Y. H. Spitz, E. E. Hofmann, and R. B. Long (1995), A dataassimilation technique applied to a predator–prey model, Bull. Math.Biol., 57(4), 593–617, doi:10.1007/BF02460785.
Letelier, R. M., D. M. Karl, M. R. Abbott, P. Flament, M. Freilich, R. Lukas,and T. Strub (2000), Role of late winter mesoscale events in the biogeo-chemical variability of the upper water column of the North Pacific Sub-tropical Gyre, J. Geophys. Res., 105(C12), 28,723–28,739, doi:10.1029/1999JC000306.
Luo, Y. W., M. A. M. Friedrichs, S. C. Doney, M. J. Church, and H. W.Ducklow (2010), Oceanic heterotrophic bacterial nutrition by semilabileDOM as revealed by data assimilative modeling, Aquat. Microb. Ecol.,60(3), 273–287, doi:10.3354/ame01427.
McCarren, J., J. W. Becker, D. J. Repeta, Y. M. Shi, C. R. Young, R. R.Malmstrom, S. W. Chisholm, and E. F. DeLong (2010), Microbial commu-nity transcriptomes reveal microbes and metabolic pathways associated withdissolved organic matter turnover in the sea, Proc. Natl. Acad. Sci. U. S. A.,107(38), 16,420–16,427, doi:10.1073/pnas.1010732107.
Monod, J. (1949), The growth of bacterial cultures, Annu. Rev. Microbiol.,3(1), 371–394, doi:10.1146/annurev.mi.03.100149.002103.
Redfield, A. C. (1958), The biological control of chemical factors in theenvironment, Am. Sci., 46, 205–221.
Saba, V. S., et al. (2010), Challenges of modeling depth-integrated marineprimary productivity over multiple decades: A case study at BATS andHOT, Global Biogeochem. Cycles, 24, GB3020, doi:10.1029/2009GB003655.
Sverdrup, H. U., M. W. Johnson, and R. H. Fleming (1942), The Oceans,Their Physics, Chemistry, and General Biology, Prentice-Hall, NewYork.
Vaillancourt, R. D., J. Marra, M. P. Seki, M. L. Parsons, and R. R.Bidigare (2003), Impact of a cyclonic eddy on phytoplankton com-munity structure and photosynthetic competency in the subtropical NorthPacific Ocean,Deep Sea Res., Part I, 50(7), 829–847, doi:10.1016/S0967-0637(03)00059-1.
LUO ET AL.: MODEL INTERANNUAL PRIMARY PRODUCTIVITY G03019G03019
12 of 12