interactive hiking map of yosemite national … · williams, neumann: interactive hiking map of...
TRANSCRIPT
INTERACTIVE HIKING MAP OF YOSEMITE NATIONAL PARK
Juliana Neumann-Williams 1 Andreas Neumann 2
Swiss FEDERAL Institute, Dr.Heinrich Jäckli AG, Zurich (Switzerland) [email protected]
Institute of Cartography, ETH Zurich, Zurich (Switzerland) [email protected]
Abstract: The interactive hiking map of the Yosemite National Park is a web based hiking information system. It provides interactive topographic maps, hiking information and thematic and touristic information. A hike can be selected according to certain criteria. The chosen trail is displayed in the map along with a profile and a list of useful information and tips. The user can print a part of the map and integrate his personal GPS data. A gallery of georeferenced photos complements the hiking GIS. The webmapping client is written in SVG and runs in most modern web browser and operating systems. Thematic data for the hiking trails and georeferenced photo information is delivered in XML-format. GIS-data was obtained from the USGS and from the National Park Service. The vector data is served by a spatial database and raster data is loaded from OGC WMS services. A level of detail concept, multi-scale datasets and scale-dependent symbology ensure an appealing map design. The application can be viewed online at http://www.carto.net/williams/yosemite/ . To be able to view the site, a SVG viewer, plugin or webbrowser with SVG rendering capabilities is required. Internet Explorer users can install the Adobe SVG Plugin, which can be downloaded at http://www.adobe.com/svg/viewer/install/. The Adobe plugin also installs in Safari, Opera and potentially other browsers. The new Firefox browser (version 1.5 or later) already has builtin SVG support. In the future, the application will be tested with upcoming releases of Safari (version 3) and Opera (version 9), which will feature native SVG support.
INTRODUCTION
The goal of this project was to design a high quality map application for hikers which offers a high level of interactivity and is easy to use. A detailed topographic map as well as information regarding the hike is provided. A terrain model gives access to elevation information and enables the calculation of interactive profiles along the trail. When going on a hike, the user can print the map and information of the selected trail. The user can upload GPX track log and waypoint files and visualize them in the map. The application also allows the digitizing of GPS waypoints. A gallery with georeferenced photos invites the visitor to explore a variety of plants and the remarkable landscape of the park. Additionally, the system provides information on access to the park, accommodation and restaurants. A list of links presents other useful online ressources.
MAP CONTENT AND DATA SOURCES
The map offers the following map layers:
• Shaded Relief • Orthophoto (Black and White) • Landcover • Geology • Hydrology • Transportation • Trails • Buildings • Contour Lines • Names

WILLIAMS, NEUMANN: INTERACTIVE HIKING MAP OF YOSEMITE NATIONAL PARK
2
Data for this project was obtained from the USGS, from the National Park Service, Tom Harrison Maps and the Microsoft Terraserver project. The different data sources were compiled and completed within desktop GIS-Systems and reprojected to the final projection system (Datum: NAD83, Projection: UTM, Ellipsoid: GRS80). As part of the data refinement, additional attributes were added and missing ones completed. In particular, a level of detail system was introduced. For the landcover, hydrology and geology map layers, two differrent map scales were compiled. The small scale geology layer was created by aggregating and simplifying smaller geologic units to major entities. The compiled vector data was transfered to an open source spatial database (Post-GIS).
While the map application is based on the metric UTM coordinate system, the base units for the contour lines are in feet. A few years ago the USGS decided to change the units for elevation datasets to meters. As a result of this gradual change, a small portion of the park contour lines are now available in meters. However, the user is able to display both values at the same time.
Orthophotos are directly loaded from the Terraserver Webmapping Service. Every time the user changes the map extent, a new WMS request is generated. The shaded relief is delivered by an inhouse WMS, provided by the UMN Mapserver. The relief layer consists of three datasets with different resolutions. The relief shown at small scales is a handmade relief from the National Park Service. The other two are digitally created and derived from the USGS DTM (30 meter resolution) dataset. Before they were added to the application they were edited with Shadow (a cartographic relief shading software by Bernhard Jenny) and Adobe Photoshop.
With the help of Shadow it was possible to substantially improve the raw output of the analytic shading. The semi-automatic approch involves local changes to the light direction, as well as the brightening of gray values in flat areas. After using Shadow, Photoshop was used to lighten the entire relief. The relief is supposed to be a discreet background and not dominate the entire map.
SYMBOLOGY
The symbology of the map is dependent on the level of detail. The complexity of the generalization process and various generalization operators, forces the use of only certain generalization rules: choice of elements, simplification of geometry, classification and assignment of line widths, symbol size and font size. If existant, several scales are used within a single map layer, e.g. the hydrology layer is made up of two datasets with different levels of generalization. When a defined threshold level is exeeded, a different data set is shown. The symbol size, font size, line width, etc. were defined according to the conventional cartographic guidelines. The values are always proportional to the current map width. The symbols for bus stops are shown only after a certain scale is reached and the names layer becomes more detailed every time the user zooms further into the map.
Label Placement
The label placement occurs automatically. The table of names is read from the database using a PHP script and placed in the map according to the x and y coordinates. In this application there are two label types: point (e.g. peaks, passes) and area (e.g. field names, campsites). The symbol is scaled to change its size depending on the width of the map. The angle of the pass and waterfall symbols corresponds to the direction of the trail or river. For area symbols invisible anchor points are used. The labels are placed depending on the order in which they are extracted from the database. For this reason the labels were classified and ordered according to their importance.
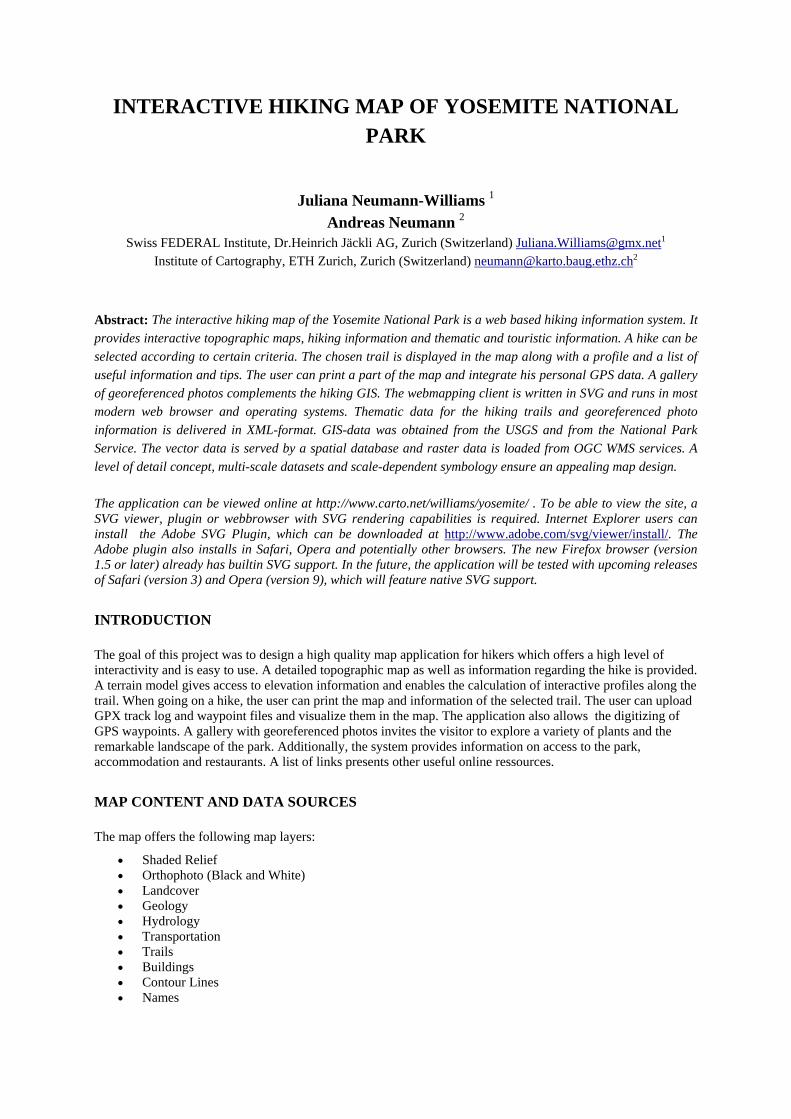
To avoid having the labels overlap with symbols or other text elements or intersect with the map boundary, an algorithm is used to place them correctly according to cartographic guidelines. The labels are placed per default in the upper right hand corner of the symbol. By using the bounding box, it is tested whether the label collides with the border of the map. If it does, the next best position is selected, using the 8 label placement possibilities. All 8 options are tested until the name can be placed completely within the map. The next step is to test whether the label collides with other labels or their symbol. To test this, a bounding box for the text and the symbol is used. An individual label is tested against an array of bounding boxes of map symbols and already placed labels. If the label cannot be placed despite shifting, it is left out.
WILLIAMS, NEUMANN: INTERACTIVE HIKING MAP OF YOSEMITE NATIONAL PARK
3
Figure 1: Label Placement for Point Features
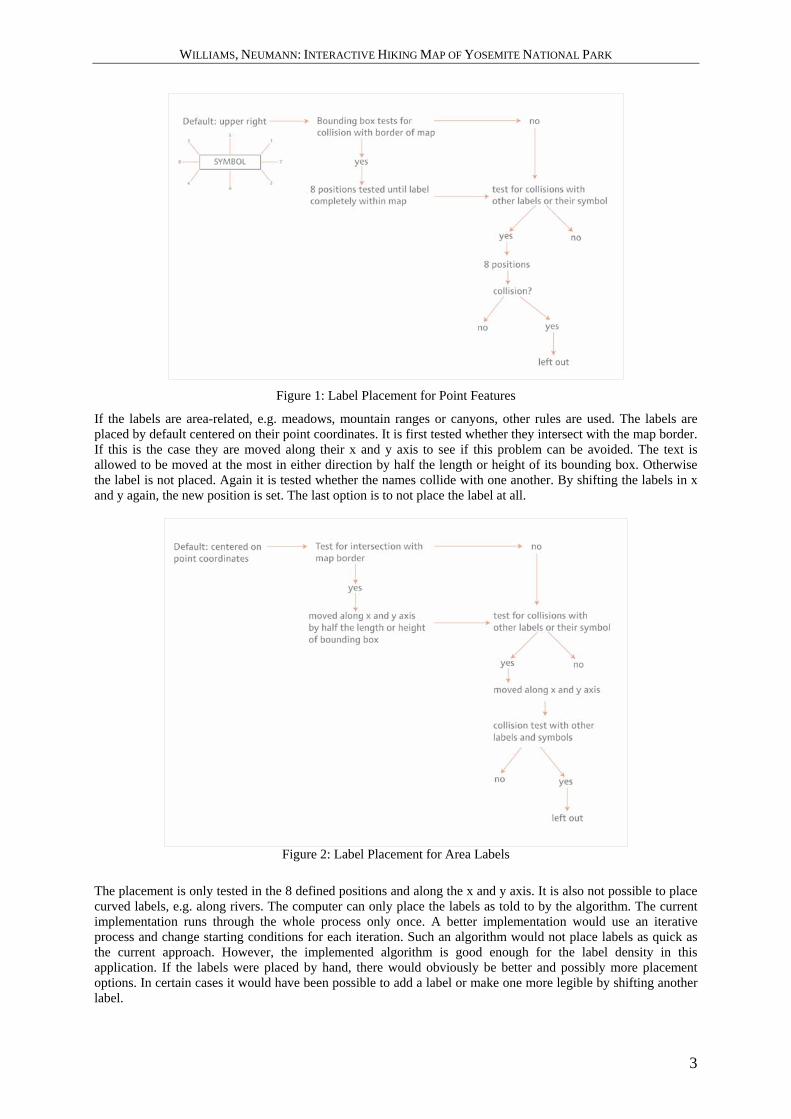
If the labels are area-related, e.g. meadows, mountain ranges or canyons, other rules are used. The labels are placed by default centered on their point coordinates. It is first tested whether they intersect with the map border. If this is the case they are moved along their x and y axis to see if this problem can be avoided. The text is allowed to be moved at the most in either direction by half the length or height of its bounding box. Otherwise the label is not placed. Again it is tested whether the names collide with one another. By shifting the labels in x and y again, the new position is set. The last option is to not place the label at all.
Figure 2: Label Placement for Area Labels
The placement is only tested in the 8 defined positions and along the x and y axis. It is also not possible to place curved labels, e.g. along rivers. The computer can only place the labels as told to by the algorithm. The current implementation runs through the whole process only once. A better implementation would use an iterative process and change starting conditions for each iteration. Such an algorithm would not place labels as quick as the current approach. However, the implemented algorithm is good enough for the label density in this application. If the labels were placed by hand, there would obviously be better and possibly more placement options. In certain cases it would have been possible to add a label or make one more legible by shifting another label.

WILLIAMS, NEUMANN: INTERACTIVE HIKING MAP OF YOSEMITE NATIONAL PARK
4
In order to be able to distinguish the labels from the map elements, a white halo had to be placed around the letters. As the Adobe SVG viewer has a bug with linestroking around characters in certain coordinate systems, this was done using a dilation filter which is globaly defined in the SVG file. In all other viewers, a white text stroke is attached to an instance object of the original text element. The cloned text element is placed directly beneath the original element. The font used in this application is Cisalpin. This is a new font designed by Felix Arnold and is especially useful for maps as it runs relatively narrow and can be well read in small font sizes. Even when placed over complex map layers it is still legible.
DETAILED FUNCTIONALITY OF THE SYSTEM
Interactivity plays a major role in this application. The user can give commands and control them individually. As not all of the information can be shown at once, it is made accessible in appropriate situations and the user can decide when he wants to see and do what. As a result, the user has the feeling that he is communicating with the system. During his interaction, the user learns how to operate the system and makes more complex queries. Following is a list of the functionalities of the system.
Spatial Navigation and Reference
Map navigation is enabled through navigation controls and a linked reference map. Four navigation modes are available. The default is the info mode where the user can query map information. Other modes are manual zooming, panning and recentering. The modes are initialized by clicking the corresponding button. Three additional buttons allow the user to zoom in, out and back to full view. Zooming in and out is also possible by using the zoom slider which gives immediate feedback in the reference map prior to reloading the main map. The history buttons let the user go back and forth in the history of previous map extents. All symbols are explained with tool tips.
The reference map is used for navigation and orientation and always corresponds with the main map. The current map extent is indicated by a blue rectangle. If the user zooms in past a certain threshold, an additional blue cross emphasizes the current map extent and position. The user may also click on a certain point in the reference map or move the blue rectangle to set a new position. Spatial reference is shown using different indicators. First, the reference map. Secondly, the UTM and geographic coordinates are displayed while moving the mouse cursor in the main map or reference map. The adaptive scale bar shows the distances graphically for both kilometers/meters and miles/yards. The elevation can be shown additionally, if the DTM layer is switched on.
Figure 3: Spatial Map Navigation
Layer Manager
The various map layers can be switched on and off as desired. These include: hydrology, landcover, contour lines, names, transportation, trails, buildings, geology, shaded relief, orthophoto, DTM (to show Z values). The trails are shown only if the map width is below 12000 meters. The geology and the hydrology map switches from the generalized map to a detailed map at a map width of 10000 and the landcover map switches at a map width of 5000. Legends for the layers hydrology, landcover, names, transportation, geology and features (for the trails) can also be displayed. The geology map has two legends which are dependent on the level of detail.
WILLIAMS, NEUMANN: INTERACTIVE HIKING MAP OF YOSEMITE NATIONAL PARK
5
Figure 4: Layer Manager
Infopanel and Thematic Navigation
While moving the mouse over map features, related attributes are displayed in the infopanel. These include object names, object classes and numerical values. Elevation values for the contour lines and peaks are indicated in meters and feet. A legend exists for every map layer. More complex map legends (geology and landcover) are directly linked to the map. A corresponding legend box is highlighted when the user moves the mouse over a certain geology or vegetation class in the map. Thematic navigation allows the user to choose from different categories such as trails, photo gallery, general information, links, GPS and printing. The major part of the application (trails and photo gallery) occurs here.
Trails
The trails play a major role in this application. The user has the ability to choose a trail by name, difficulty, duration and location. The names are alphabetically sorted. When choosing by difficulty, duration or location, the user is first asked to specify his wishes before being given a filtered list of trails. The list is generated out of an XML-file and is filtered by criteria prior to displaying the customized version.
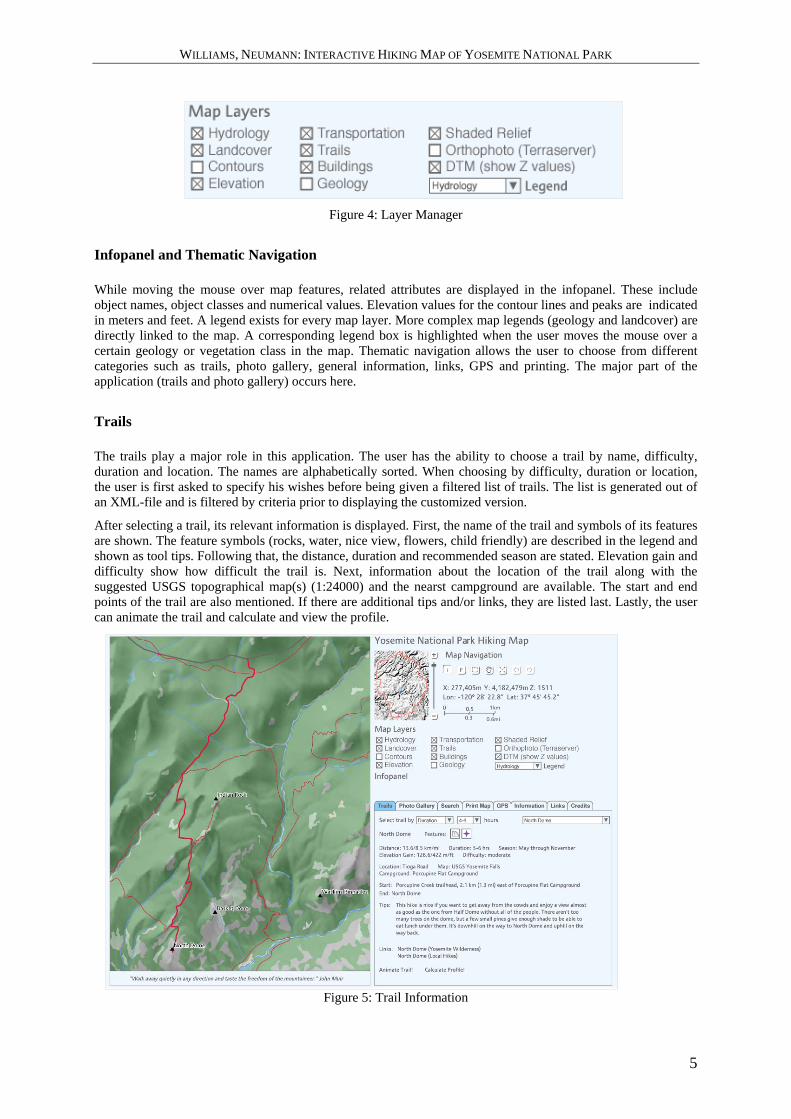
After selecting a trail, its relevant information is displayed. First, the name of the trail and symbols of its features are shown. The feature symbols (rocks, water, nice view, flowers, child friendly) are described in the legend and shown as tool tips. Following that, the distance, duration and recommended season are stated. Elevation gain and difficulty show how difficult the trail is. Next, information about the location of the trail along with the suggested USGS topographical map(s) (1:24000) and the nearst campground are available. The start and end points of the trail are also mentioned. If there are additional tips and/or links, they are listed last. Lastly, the user can animate the trail and calculate and view the profile.
Figure 5: Trail Information
WILLIAMS, NEUMANN: INTERACTIVE HIKING MAP OF YOSEMITE NATIONAL PARK
6
If the viewer is capable of SMIL animation the trail can be animated, otherwise it is only highlighted in the map by increasing the stroke width. The trail segments are concatenated as described in the XML trail description. Segment directions are switched if necessary.
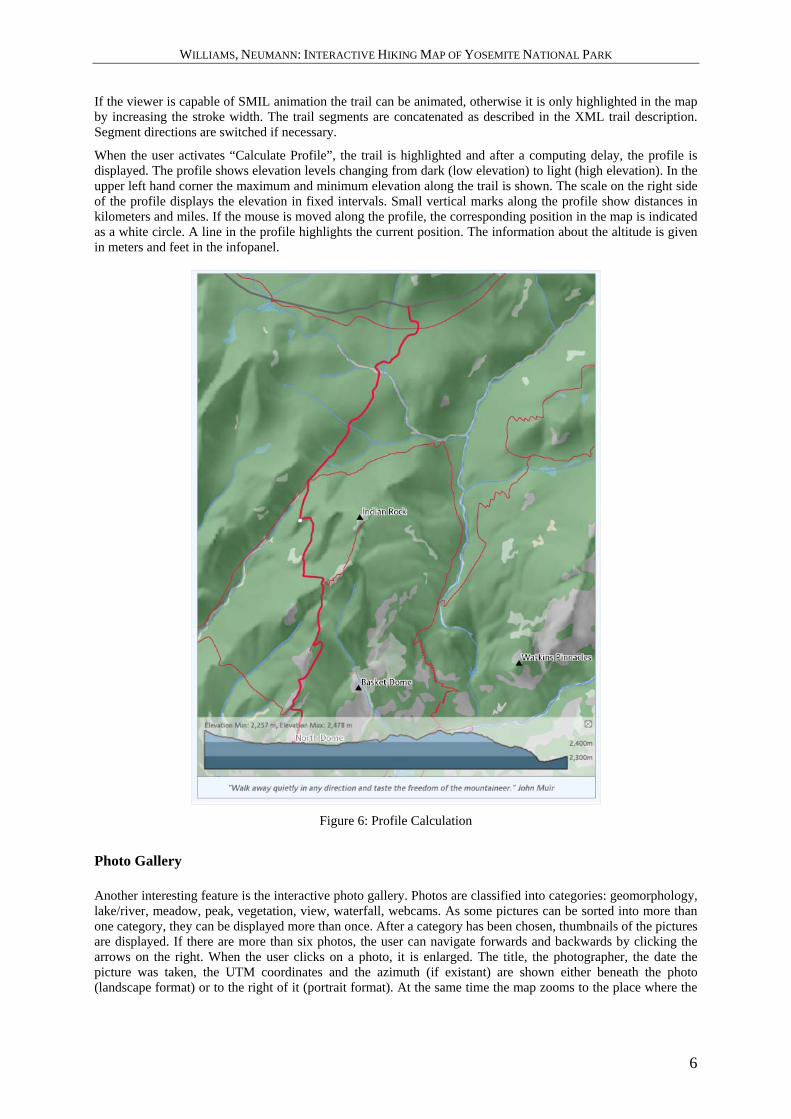
When the user activates “Calculate Profile”, the trail is highlighted and after a computing delay, the profile is displayed. The profile shows elevation levels changing from dark (low elevation) to light (high elevation). In the upper left hand corner the maximum and minimum elevation along the trail is shown. The scale on the right side of the profile displays the elevation in fixed intervals. Small vertical marks along the profile show distances in kilometers and miles. If the mouse is moved along the profile, the corresponding position in the map is indicated as a white circle. A line in the profile highlights the current position. The information about the altitude is given in meters and feet in the infopanel.
Figure 6: Profile Calculation
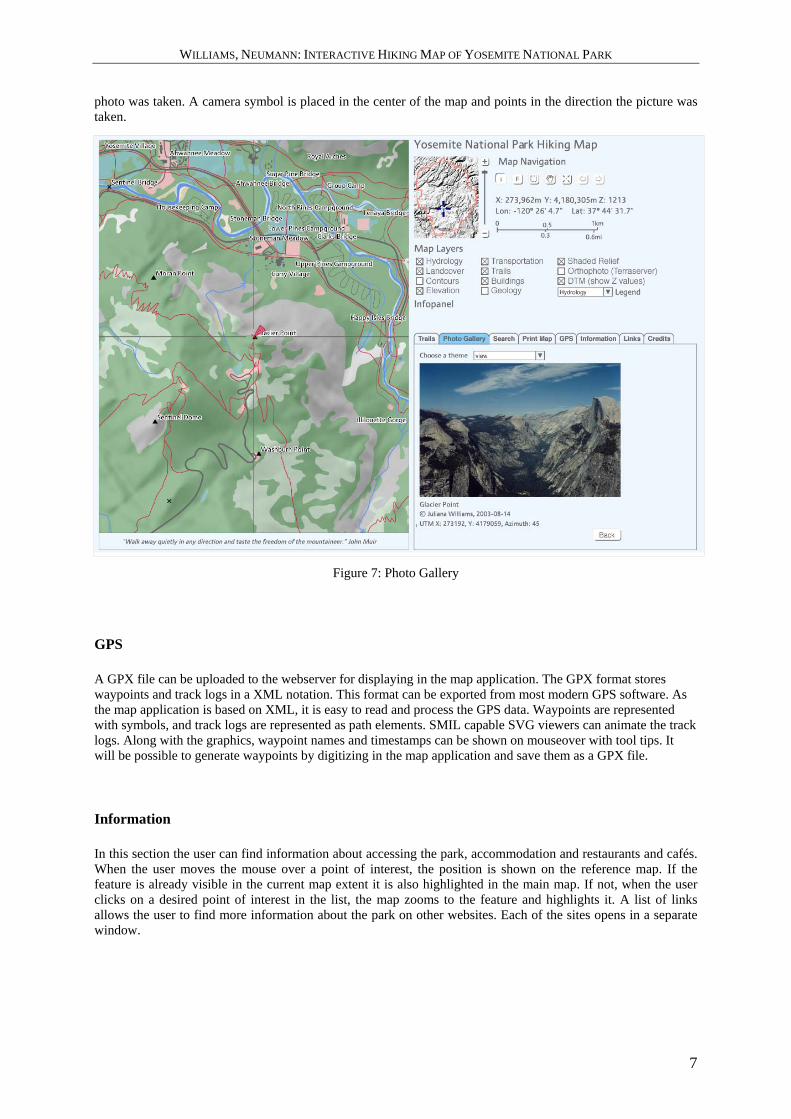
Photo Gallery
Another interesting feature is the interactive photo gallery. Photos are classified into categories: geomorphology, lake/river, meadow, peak, vegetation, view, waterfall, webcams. As some pictures can be sorted into more than one category, they can be displayed more than once. After a category has been chosen, thumbnails of the pictures are displayed. If there are more than six photos, the user can navigate forwards and backwards by clicking the arrows on the right. When the user clicks on a photo, it is enlarged. The title, the photographer, the date the picture was taken, the UTM coordinates and the azimuth (if existant) are shown either beneath the photo (landscape format) or to the right of it (portrait format). At the same time the map zooms to the place where the
WILLIAMS, NEUMANN: INTERACTIVE HIKING MAP OF YOSEMITE NATIONAL PARK
7
photo was taken. A camera symbol is placed in the center of the map and points in the direction the picture was taken.
Figure 7: Photo Gallery
GPS
A GPX file can be uploaded to the webserver for displaying in the map application. The GPX format stores waypoints and track logs in a XML notation. This format can be exported from most modern GPS software. As the map application is based on XML, it is easy to read and process the GPS data. Waypoints are represented with symbols, and track logs are represented as path elements. SMIL capable SVG viewers can animate the track logs. Along with the graphics, waypoint names and timestamps can be shown on mouseover with tool tips. It will be possible to generate waypoints by digitizing in the map application and save them as a GPX file.
Information
In this section the user can find information about accessing the park, accommodation and restaurants and cafés. When the user moves the mouse over a point of interest, the position is shown on the reference map. If the feature is already visible in the current map extent it is also highlighted in the main map. If not, when the user clicks on a desired point of interest in the list, the map zooms to the feature and highlights it. A list of links allows the user to find more information about the park on other websites. Each of the sites opens in a separate window.

WILLIAMS, NEUMANN: INTERACTIVE HIKING MAP OF YOSEMITE NATIONAL PARK
8
Figure 8: Additional Information
Printing
As some web browsers can only print SVG graphics in low resolution, this application adds a printing functionality by generating PDF files. First, the user has to select the desired paper format and map scale. Then a fixed rectangle representing the print frame appears on the map. The user moves the rectangle to his desired region, and finally triggers the creation of the PDF. Along with the map content, the map title, scale, scale bar and grid lines are included. Alternatively, a map of a selected trail with the corresponding information can be printed directly from the trail information tab.
Figure 9: Printing Feature with Example of PDF
WILLIAMS, NEUMANN: INTERACTIVE HIKING MAP OF YOSEMITE NATIONAL PARK
9
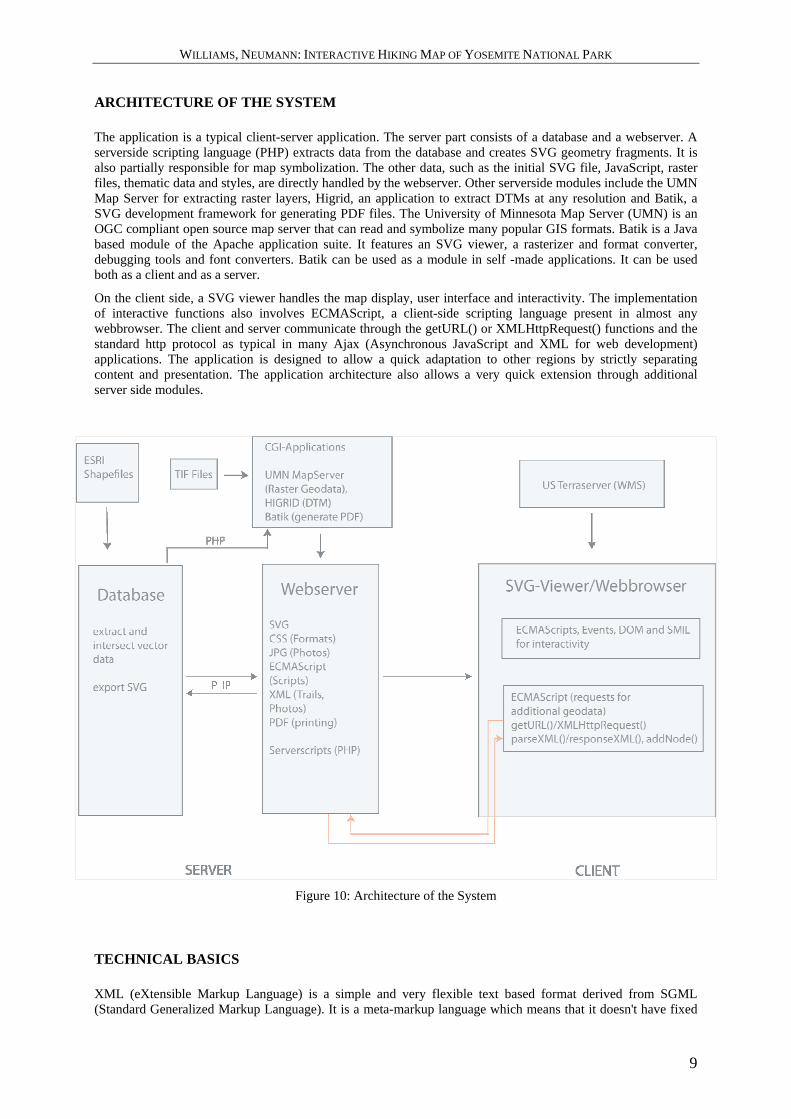
ARCHITECTURE OF THE SYSTEM
The application is a typical client-server application. The server part consists of a database and a webserver. A serverside scripting language (PHP) extracts data from the database and creates SVG geometry fragments. It is also partially responsible for map symbolization. The other data, such as the initial SVG file, JavaScript, raster files, thematic data and styles, are directly handled by the webserver. Other serverside modules include the UMN Map Server for extracting raster layers, Higrid, an application to extract DTMs at any resolution and Batik, a SVG development framework for generating PDF files. The University of Minnesota Map Server (UMN) is an OGC compliant open source map server that can read and symbolize many popular GIS formats. Batik is a Java based module of the Apache application suite. It features an SVG viewer, a rasterizer and format converter, debugging tools and font converters. Batik can be used as a module in self -made applications. It can be used both as a client and as a server.
On the client side, a SVG viewer handles the map display, user interface and interactivity. The implementation of interactive functions also involves ECMAScript, a client-side scripting language present in almost any webbrowser. The client and server communicate through the getURL() or XMLHttpRequest() functions and the standard http protocol as typical in many Ajax (Asynchronous JavaScript and XML for web development) applications. The application is designed to allow a quick adaptation to other regions by strictly separating content and presentation. The application architecture also allows a very quick extension through additional server side modules.
Figure 10: Architecture of the System
TECHNICAL BASICS
XML (eXtensible Markup Language) is a simple and very flexible text based format derived from SGML (Standard Generalized Markup Language). It is a meta-markup language which means that it doesn't have fixed
WILLIAMS, NEUMANN: INTERACTIVE HIKING MAP OF YOSEMITE NATIONAL PARK
10
tags and elements. This allows data structures to be designed as needed. However, there are strict rules as to how to place tags and where they appear, which element names are valid, how attributes are attached to elements, etc. This allows the development of general purpose XML parsers which can read any XML document. These documents must be well-formed and valid. Documents are checked for validness with a XML schema or DTD. This schema defines the element and attribute names, the correct nesting, the used datatypes and valid data ranges. In this application, XML is used for the trail information, for the photo gallery and tourist information. This separation of content and presentation allows a fast adaptation to other regions.
SVG (Scalable Vector Graphics) is a language for describing two-dimensional graphics in XML. Three types of graphic objects are allowed: vector graphic shapes, images and text. These objects can be grouped, styled, transformed and composited into exisiting objects. SVG drawings can be interactive and dynamic. Animations can be defined and triggered either declaratively or by script. [W3C2003] SVG vectors are defined in a Cartesian coordinate system. The origin is in the upper left corner of the canvas and the positive y-axis points downward. SVG supports nested coordinate systems which allows the use of screen oriented and map oriented coordinate systems within one application. The support of real world coordinates facilitates the integrations of various distributed data sources.
Information about the data is directly visible in the code of the SVG files which can be viewed, opened and changed. This has the advantage that one can learn from other people's codes, but it also has the disadvantage that (map)graphics could be copied and misused. In cases where the map is generated automatically and individually from a database and generalized depending on the scale, this is only a small problem. A "Digital Rights Management" for future SVG versions is being considered.
This application was tested in the Adobe SVG-Viewer (version 3 and 6), the Apache Batik SVG-Viewer, Mozilla SVG and Opera 9. None of the viewers support the entire SVG 1.1 specification, but the current functionality already allows a creation of an appealing interactive map application. As a result of missing features, e.g. animation features do not exisit in Apache Batik and Mozilla SVG, parts of the code needed to be forked. As a result, not all of the features within this application are accessible in all viewers.
ECMAScript, better known as JavaScript, is an object-oriented scripting language, which allows the dynamic creation of web content. It can also include programs that interact with the user and control the browser. [FLANAGAN2002] ECMAScript, in collaboration with the DOM, is often used to manipulate a SVG document. This way, individual functionalities can be implemented. Examples include the creation, modification, reordering and removal of graphic elements.
PostgreSQL is a highly developed open source object-relational multi-platform database management system. It has the following features: complex queries, foreign keys, triggers, views, transactional integrity, multiuser concurrency control.[POSTGRESQL2005] PostGIS is a spatial extension of PostgreSQL which supports simple features according to the specifications of the Open GIS Consortium, spatial queries, GIS-analysis functions and spatial indexing of GIS objects.[POSTGIS] In combination with the OGR Library [1] it can import many popular GIS formats.
PHP (Personal Home Page, Hypertext Preprocessor) is a programming language which can be used in three different ways: server-side scripting, command-line scripting and client-side GUI applications. PHP was originally developed to create dynamic websites. Now, PHP is often used to create XML documents, graphics, Flash animations, PDF files, etc. [LERDORF2002] In this application, PHP is used to extract data from the PostgreSQL database and to create SVG fragments. PHP supports many databases including MySQL, PostgreSQL and Oracle.
In order to extract parts of the DTM, an additional CGI [2] program is needed. The DTM-data is needed to show the elevation of a given coordinate and calculate the trail profile. For this application a program called Higrid [3] is used to create pyramids using raster data and to extract raster data in any resolution. When extracting, the parameters xmin, xmax, ymin, ymax, cellsize and output format are required. In this case, the output format is XML. Every row in the terrain model is stored in a XML-element. After receiving the data, a JavaScript code reads the rows and creates a two dimensional field which contains the elevation data. With bilinear interpolation an elevation value of any coordinate can be calculated.
Open GIS Consortium (OGC) Web Map Service (WMS): A WMS produces maps according to ISO/DIS 19128. This standard defines a map as a portrayal of geographic information as a digital image file which is suited to be displayed on a computer screen. These maps are usually rendered in a raster format, e.g. PNG, GIF or JPEG. They are seldom found as SVG (vector format) or as WebCGM (Web Computer Graphics Metafile, vector format).[OGC] In this application the WMS is used to request parts of larger raster datasets, in particular for the
WILLIAMS, NEUMANN: INTERACTIVE HIKING MAP OF YOSEMITE NATIONAL PARK
11
shaded relief and the black and white orthoimages. While the shaded relief is served from an inhouse WMS server (UMN), the orthoimages are requested from the US Terraserver.
CONCLUSION
SVG was well suited for the implementation of the application. An increasing number of webbrowsers now support SVG natively without the need to install a browser plugin. A large part of the client application was written in ECMAScript. This project can be regarded as one of the first interactive, vectorbased online applications with a database backend. The vectorbasis and rich functionality sets new standards for graphic quality and interactivity. The separation between content and presentation, using XML, allows a fast update and adaptation of the application to other regions.
Further Development Options
Such an application can never be completely “finished”. More trails should be included with detailed information. The georeferenced photos could be shown along the trail, and additional georeferenced information such als swimming possibilities, vista points, etc. would enrich the information system. Additional real-time information, e.g. wildfires, road conditions, access restrictions, weather and events could be integrated into the application. It is easy to imagine such an application at a visitor center of a National Park which can give tourists information about the hiking options.
Another very worthwile addition would be an offline version of this application. That way, trails could be searched without the need of an internet connection. The largest problem for such a version would be the spatial database. At the moment there are hardly any geographic databases which can be used by the user without installation or database knowledge.
As it is increasingly popular to integrate navigation functions in mobile devices, it would be imaginable that hikers take their mobile phones or PDAs with them on the hike and consult them along the trail. Such location based services are already popular in Japan. It would be nessessary to redesign the GUI and the map symbology. By utilizing SVG-Tiny or SVG-Basic it would be possible to adapt the application to mobile phones or PDAs.
REFERENCES
[HAROLD2001] Harold, Elliotte Rusty W., Scott Means, 2001. XML in a Nutshell A Desktop Quick Reference, O'Reilly&Associates
[W3C2003] W3C Recommendation Scalable Vector Graphics(SVG) 1.1 Specification 2003
[FLANAGAN2002] DavidFlanagan, 2003. JavaScript- The Definite Guide , O'Reilly&Associates
[POSTGRESQL2005] PostgreSQL 8.0.0 Documentation
[POSTGIS] PostGIS Documentation
[LERDORF2002] Rasmus, Lerdorf, Kevin Tatroe, 2002. Programming PHP O'Reilly&Associates
[OGC] Web Map Service; Version 1.3
[1] OGR Library: Open Geometry Referencce
[2] Common Gateway Interface: an intercafe between the webserver and other applications. Parameters are given using wither the methos "Get" (data is encoded in the URL) or "Post" (data is passed by standard input).
[3] Higrid (Hierarchical Grid) was programmed by Dr. Hans-Ruedi Bär at the Institute of Cartography, ETH Zurich
[4] A program by Bernhard Jenny (Institute of Cartography, ETH Zurich) to locally adjust shading parameters of digital relief shadings

WILLIAMS, NEUMANN: INTERACTIVE HIKING MAP OF YOSEMITE NATIONAL PARK
12
Biography of Authors
Andreas NEUMANN Institute of Cartography ETH Zurich Wolfgang-Pauli-Strasse 15 8093 Zurich Switzerland Tel: +41 44 633 30 31 Fax: +41 44 633 11 53 [email protected], http://www.carto.net/neumann SWITZERLAND
Andreas Neumann got a masters degree in Geography/Cartography from Vienna University, in 2001. In 1999 he joined the Cartographic Institute of the Swiss Federal Institute of Technology, first as a system administrator and later as a teaching and research assistant. At the same institute he advised several thesis and student projects in the webmapping domain. Currently, he is working on a PhD as part of a ETH project called "Distributed Publishing of Cartographic Information on Demand", with the topic "Navigation in Space, Time and Topic". Besides university, he occasionally consults in the domain of SVG for Webmapping and Online GIS. From 2001 to 2003 he worked as a GIS specialist at a Zurich based geology consulting company. He was one of the initiators of the SVG.Open 2002 conference in Zurich, the first international SVG developers conference, co-organized by the W3C consortium.
Juliana NEUMANN - WILLIAMS Swiss FEDERAL Institute, Dr. Heinrich Jäckli AG Albulastrasse 55 8048 Zurich Switzerland Tel: +41 44 344 55 66 Fax: +41 44 344 55 91 [email protected], http://www.carto.net/williams SWITZERLAND
Juliana Williams studied Cartograhy and Geomediatechnology at the University of Applied Sciences in Munich, Germany. She wrote her masters thesis “Interactive Hiking Map of Yosemite National Park” at the Institute of Cartography at the Swiss Ferdal Institute of Technology (ETH) in Zurich, Switzerland. She now works as a GIS specialist at a geology consulting company in Zurich.