intelligent video driving profits case study: sales …...case study : sales analysis i3...
TRANSCRIPT
INTELLIGENT VIDEO DRIVING PROFITS
CASE STUDY: SALES ANALYSIS
Executive Summary
Introduction
Design of Case Study
Resultf of Case Study
Accuracy
Conclusion
1
2
3
4
5
5
TABLE OF CONTENTS

1Case Study : Sales analysisi3 International Inc. www.i3international.com
Douglas Cumming, a tenured professor of finance and
entrepreneurship at York University’s Schulich School of
Business was engaged by i3 International to analyze sales
data collected from six sporting goods stores in the northeastern
region of the United States. The data was collected between
January 1, 2013 and May 9, 2013.
The data analyzed indicated the use of video technology is
highly effective in improving sales results. In particular, the
most conservative estimates show that the technology
generated the following:
• an increase in total sales per hour by 29.27%;
• an increase in the number of transactions per hour by 14.74%;
• an increase in the average size of each transaction by 11.27%
EXECUTIVE SUMMARYCase Study: Sales Analysist
A number of additional interesting findings, along with suggestions
for ways in which the data can be used to further improve the
effectiveness of sales efforts were made.

2Case Study : Sales Analysisi3 International Inc. www.i3international.com
Modell’s Sporting Goods is America’s oldest, family-owned
and operated retailer of sporting goods, athletic footwear,
active apparel and fan gear. Founded in 1889, the chain
has grown to over 150 stores located throughout New
York, New Jersey, Pennsylvania, Connecticut, Rhode Island,
Massachusetts, New Hampshire, Delaware, Maryland,
Virginia and the District of Columbia.
Although Modell’s already had video surveillance in
place, they were interested in determining if adding video
analytics would impact sales results and if so, could the
impact be convincingly proven. i3 proposed to conduct
a controlled experiment to answer these questions.
The goals for the study were:
ABOUT MODELL’S SPORTING GOODSIntroduction
• To increase sales using business intelligence to drive positive behavioral changes;
• To increase conversion rates;
• Successfully integrate Aspect point of sales software with the i3 system;
• Measure dwell time and increase conversion rates in the “Mo’s Zone”
Six Modell’s stores were chosen for the study. Three were
“treatment” (video analytics were employed) and three
were “non-treatment” (video analytics were not employed).
The study was conducted over a five-month period.
“...Although Modell’s already had video surveillance in place, they were interested in determining if adding video analytics would impact sales results... ”

3Case Study : Sales Analysis Case Study : Sales analysisi3 International Inc. www.i3international.com
Design of Case Study
Data were collected in which three of six Modell’s stores utilized
information from video half-way through the sample period.
All six stores employed video technology, whereby information
was recorded on the following:
• Times at which customers entered and exited the store, including the direction in which they went;
• Whether the customer entered alone or as a couple, and
• Whether or not there were accompanying children, among other things.
Three of these six stores (“treatment stores”) started to use
this data on March 1, 2013 (“the post-treatment period”) by
adjusting promotion and sales techniques in response to information
learned. The other three stores (“non-treatment stores”) made
no such changes.
A number of statistical techniques were employed to analyze
the data. First used was a simple comparison of mean and
median statistics. Stores that used the video were compared
to those that did not, and the pre-versus post-March 1, 2013
period was examined. Second, graphic analysis was made for
these different periods. Third, simple correlation statistics
were determined across all of the variables in the data. Fourth,
and most importantly, regression evidence was scrutinized to
consider the impact of the technology, controlling for other
things being equal. A well accepted regression technique,
panel data regressions1 was employed, with fixed effects
across stores and time (each hour), and included a wide array
of control variables.
1 See, e.g., Badi Baltagi, 2008. Econometric Analysis of Panel Data, 4th Ed., Wiley.

4Case Study : Sales Analysisi3 International Inc. www.i3international.com
The data indicated the use of video analytics is measurably
and highly effective in improving sales results. In
particular, video analytics technology increased the
stores’ total sales per hour by 29.27%, relative to
the average sales per hour among the treatment
stores in the pre-treatment period. Also increased
were transactions per hour by 14.74%, relative to
the average transactions per hour among the treatment
stores in the pre-treatment period. The average size
of each transaction increased by 11.27% relative to
the average transaction size per hour among the
treatment stores in the pre-treatment period. These
estimates are conservative and are based on panel
data regression techniques with fixed effects by
store and hour and a complete set of control variables.
Results of the Case Study
Figure 1.
Total Sales by Hour for Treatment Stores that Used Surveillance Technology
Figure 3.
Total Transactions Per Hour for Treatment Stores that Used Surveillance Technology
Figure 4.
Total Transactions Per Hour for Non-Treatment Stores that Did Not Use Surveillance Technology
Figure 2.
Total Sales by Hour for Non-Treatment Stores that Did Not Use Surveillance Technology

5Case Study : Sales Analysis Case Study : Sales analysisi3 International Inc. www.i3international.com
A simple comparison of the data across time showed that
the percentage increase in total value of transactions, number
of transactions, and average value of transactions was
greater among the stores that made use of video analytic
technology compared to those that did not. The differences
in means and medians were statistically and economically
significant, and are apparent in a graphical representation
of the data.
The panel data regression evidence, which controls for
other things being equal, and considers alternative possible
effects, provided a precise assessment of the value of video
analytic technology. Under Dr Cumming’s most conservative
estimates, he found that relative to the average amounts in
the data, the technology increased total sales per hour by
16.93%, increased the number of transaction per hour by
9.69%, and increased the average size of each transaction
by 9.59%. These effects were statistically significant at
the 1% level, meaning that there is less than a 1% chance
that these findings are due to random chance.
The data highlight a number of other interesting patterns
pertaining to the number of customers entering and exiting
the stores, the directions in which they travel, and the effect
of couples and children. The data analyzed are consistent
with the view that this technology could be utilized in a
very profitable way with the existing set of information that
has been gathered. For instance, the effect of specific
types of advertising and product placement in one store
and its impact on conversion rates could be examined at
different points in time during the day, for singles versus
couples, and for adults versus children. These types of
targeted interventions could be analyzed to promote
increased sales thus maximizing marketing efforts.
6Case Study : Sales Analysisi3 International Inc. www.i3international.com
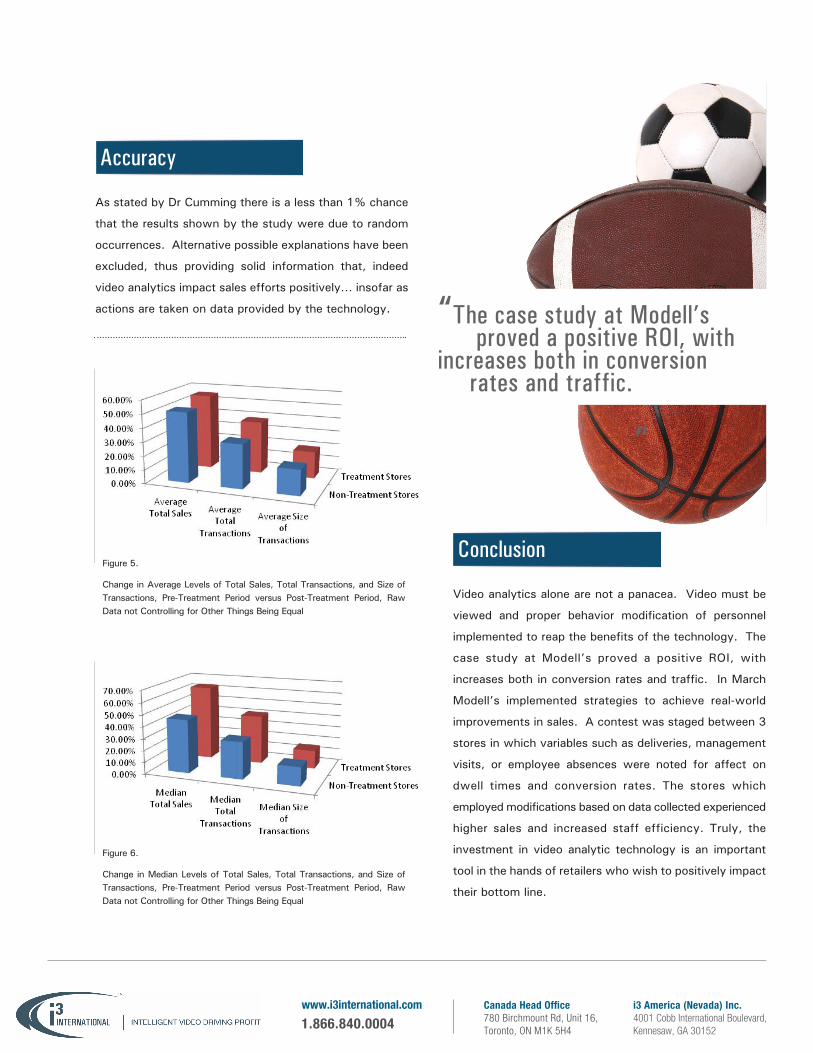
As stated by Dr Cumming there is a less than 1% chance
that the results shown by the study were due to random
occurrences. Alternative possible explanations have been
excluded, thus providing solid information that, indeed
video analytics impact sales efforts positively… insofar as
actions are taken on data provided by the technology.
Video analytics alone are not a panacea. Video must be
viewed and proper behavior modification of personnel
implemented to reap the benefits of the technology. The
case study at Modell’s proved a positive ROI, with
increases both in conversion rates and traffic. In March
Modell’s implemented strategies to achieve real-world
improvements in sales. A contest was staged between 3
stores in which variables such as deliveries, management
visits, or employee absences were noted for affect on
dwell times and conversion rates. The stores which
employed modifications based on data collected experienced
higher sales and increased staff efficiency. Truly, the
investment in video analytic technology is an important
tool in the hands of retailers who wish to positively impact
their bottom line.
Accuracy
ConclusionFigure 5.
Change in Average Levels of Total Sales, Total Transactions, and Size of Transactions, Pre-Treatment Period versus Post-Treatment Period, Raw Data not Controlling for Other Things Being Equal
Figure 6.
Change in Median Levels of Total Sales, Total Transactions, and Size of Transactions, Pre-Treatment Period versus Post-Treatment Period, Raw Data not Controlling for Other Things Being Equal
© Copyright i3 International Inc. 2012
Produced in Canada 09/2012All Rights Reserved
“The case study at Modell’s proved a positive ROI, with increases both in conversion rates and traffic.
”
Canada Head Of�ce780 Birchmount Rd, Unit 16,Toronto, ON M1K 5H4
www.i3international.com
1.866.840.0004i3 America (Nevada) Inc.4001 Cobb International Boulevard,Kennesaw, GA 30152