intellectual capitals and financial performance indices...
TRANSCRIPT
European Journal of Accounting Auditing and Finance Research
Vol.2.No.2, pp.50-62, April 2014
Published by European Centre for Research Training and Development UK (www.ea-journals.org)
50
INTELLECTUAL CAPITALS AND FINANCIAL PERFORMANCE INDICES OF
DEPOSIT MONEY BANKS IN NIGERIA: A COMPARATIVE ASSESSMENT
Michael Chidiebere Ekwe Ph.D. ACA
Department of Accountancy, Enugu State University of Science & Technology,
Enugu State of Nigeria
ABSTRACT: The emergence of high technology, information, and innovation based
environment in the world today has greatly altered the way and manner businesses are done
globally. This new technology which of course utilizes high level of intellectual capital also
determines the level of financial performance of business organizations. Some organizations
which hitherto were rated very high in terms of their profitability and other financial
performances are today being rated very low simply because of their non-adoption of this
intellectually based technology. This study uses the Value Added Intellectual Coefficient (VAIC)
model to compare both the intellectual capital indices as well as the financial performance
variables of six highly rated banks in Nigeria with the aim of determining if the deviations in
their financial performance indices could be explained by the deviations in the banks’
intellectual capital variables. The study adopted the ex-post facto research design. It was
systematically conducted using longitudinal time series data generated from the Nigeria Stock
Exchange and from annual reports and accounts of the selected banks in Nigeria spanning from
year 2000 to 2012. The study adopted the Duncan Multiple Range Test (DMRT) of ANOVA
across the six selected banks in Nigeria for the test of the hypotheses. The SPSS statistical
software (version 17.0) was used for the data analysis. From the analyses, it was discovered that
there were significant deviations in both the financial performance indicators and in the
intellectual capital variables among the six banks studied. The results further showed that the
banks are statistically different in both the intellectual capital indices and in the financial
performance indicators. The study also established that the banks with high intellectual capital
also recorded high financial performance and therefore recommends that all banks should
embrace this new intellectually based technology in order to enhance their financial
performances, returns to their different stakeholders as well as in their service delivery to their
customers.
KEYWORDS: Intellectual Capital, VAIC, Financial Performance, Nigerian Banks,
INTRODUCTION
It is an established fact today that the intellectual assets of a company in combination with other
physical assets of the company, determine the extent that companies can go in terms of their
financial performance and in rendering returns on the stakeholders investments. This is
particularly true in service firms where intellectual capital is not only more pronounced but
physical assets are almost non-existent when compared to the extent of the intellectual capital in
use. Bornemann et al. (1999) discover that enterprises, which have managed their intellectual
capital better, had achieved stronger competitive advantage than the other enterprises. Also they
European Journal of Accounting Auditing and Finance Research
Vol.2.No.2, pp.50-62, April 2014
Published by European Centre for Research Training and Development UK (www.ea-journals.org)
51
reported that companies which had strengthened their own intellectual capital management,
compared to the others had performed better. Furthermore, human capital – a sub set of
intellectual capital, has also been recognized as one of the key determinants of growth today in
any business enterprise (OECD, 2001).
The banking sector in Nigeria, being a service oriented sector, has recognized this fact and has
taken some drastic decisions with respect to enhancing its intellectual capital base. For example,
banks in Nigeria nowadays engage mostly university graduates, who possess a minimum of
second class honors upper division in their employment policies, thereby giving credence to the
fact that intellectual capital significantly affects financial performance (Ekwe, 2013). Most of the
banks in Nigeria have also recognized the importance of computerization and employee training
and have decided that their prospective employees must not only be computer literate, but must
undergo regular performance enhancement training.
Furthermore, according to Ekwe (2013), before the year 2000, the three strongest and most
popular banks in Nigeria were: the First bank of Nigeria (FBN), Union bank of Nigeria (UBN)
and United Bank for Africa (UBA). Their volume of transactions as well as their assets and
customer bases were not only very high but also very strong. With the emergence and
introduction of modern technologies in banking, which depended heavily on their intellectual
capital, these trio were generally classified as old generation banks because they did not embrace
the technology immediately; while the banks that immediately embraced the modern
technologies, such as Zenith bank Plc, Eco bank Plc, Diamond bank Plc, etc, were classified as
the new generation banks. Even then, the new generation banks could only make minor impact in
the economy and at the Nigeria Stock Exchange as these older banks dominated trading and
other activities at the exchange. Most people then preferred to bank and carry out their
transactions with these old generation banks because of these attributes. Today, the trend has
been altered. While some of the old generation banks still record higher book values of their
physical assets, most of the new generation banks post better and higher financial performance
figures and better services than the old generation banks owing to the innovations introduced by
these new generation banks. Consequently, people now prefer to bank with the new generation
banks and as a result, the customer bases of the older banks have dropped significantly.
Furthermore, even at the Nigeria Stock Exchange (NSE), the rate of stock turnover of these new
generation banks as well as their market capitalization has consistently been higher than those of
the old generation banks. An explanation to what has caused this change in trend needs to be
empirically made, hence this research sets to compare the intellectual capital performance
indices among banks in Nigeria as well as their financial performance indicators to see if an
explanation could be found on what caused the change in trend and to see if there is significant
differences in their financial performance indicators and their intellectual capital indices.
Furthermore, the banking sector, in any country plays a pivotal role in setting the economy in
motion and in its development process. Banks promote growth and success of businesses in both
developed and developing countries. According to Kamath (2007), the banking sector is an ideal
area for intellectual capital research because the banking sector is “intellectually” intensive and
its employees are (intellectually) more homogeneous than those in other economic sectors.
Empirical evidence of the understanding and development of intellectual capital (IC) concepts in
European Journal of Accounting Auditing and Finance Research
Vol.2.No.2, pp.50-62, April 2014
Published by European Centre for Research Training and Development UK (www.ea-journals.org)
52
emerging economies is still at its infant stage (Firer and Williams, 2003) and because emerging
economies like Nigeria, contribute significantly to the prosperity and stability of the world
economy, there is a need to establish evidence of the development of intellectual capital in these
economies. Following from the above, this paper compares the intellectual capital indices and
some selected financial performance indicators among the six selected banks in Nigeria. In
particular, the paper examines and compares the performances of the components of intellectual
capital as defined in Pulic (1998) value added intellectual coefficient (VAIC) model. These
components are: Human capital coefficients, structural capital coefficients and the capital
employed coefficients. Also the paper further examines and compares banks’ financial
performance indicators across the six highly rated banks in Nigeria. The paper contributes to the
literature by focusing on Nigeria rather than a developed western economy.
The remaining sections of this paper are organized as follows: First, a review of literature is
presented. It discusses the definition of intellectual capital, reviews previous studies and presents
the hypotheses. Next, is the section discussing the research methods adopted in this study. It is
followed by a presentation and discussion of the findings. Finally, the paper ends with a
conclusion.
REVIEW OF RELATED LITERATURE AND DEVELOPMENT OF HYPOTHESES:
Definition of Intellectual Capital:
Several studies exist in the extant literature on the impact of intellectual capitals on financial
performance of organizations. Despite these studies, there has not been a unified or common
definition of intellectual capital. Engstrom et al (2003) agree that there is no generally agreed
definition of intellectual capital. This notwithstanding, some attempts have been made at
providing some definitions for intellectual capital. Edvinsson and Malone (1997) define
intellectual capital as ‘the possession of knowledge, applied experience, organizational
technology, customer relations and professional skills that provide a company with a competitive
edge in the market’. Ahangar (2011) sees the term intellectual capital to include inventions,
ideas, general knowledge, design approaches, computer programs and publications. Intellectual
Capital (IC) can be briefly defined as the knowledge based equity of organizations and has
attracted, during the last decade, a significant amount of practical interest (Campisi and Costa,
2008; Petty and Guthrie, 2000). Stewart (1997) defines Intellectual Capital as packaged useful
knowledge, while Fredriksen (1998), states that intellectual capital can be defined as skills and
knowledge acquired by people during their lifetime and which can be used for the production of
goods and services. Brooking (1996) in Ismail and Karem (2011), defines intellectual capital as
the combined intangible assets which enable the company to function and see an enterprise as the
sum of its tangible assets and intangible assets as expressed in the following formula:
Enterprise = Tangible Assets + Intellectual Capital.
Saint-Onge’s, (1996) model developed in the early 1990s divides intellectual capital into three
parts: Human capital, Structural capital; and Customer capital. Also Edvinsson (1997) agrees that
intellectual capital comprises human capital, structural capital and customer capital. Bontis
(2000) adjusts customer capital into relational capital arguing that it not only the customer’s
contribution that affects intellectual capital but the whole lot of relations with customers,
European Journal of Accounting Auditing and Finance Research
Vol.2.No.2, pp.50-62, April 2014
Published by European Centre for Research Training and Development UK (www.ea-journals.org)
53
suppliers, shareholders and other partners. Tseng and Goo (2005) categorized intellectual capital
(IC) framework in term of human capital, organizational capital, innovation capital and
relationship capital. Therefore following from the above arguments, intellectual capital as
adopted in this study is expressed mathematically as:
Intellectual Capital = Human Capital + Structural Capital.
Human Capital
In line with the above, human capital has been recognized as one of the key determinants of
growth today (OECD, 2001). This applies especially to modern economies such as Switzerland,
United States of America, China, and Japan etc as companies with a large share of unskilled
labour have moved to other countries of the world as a consequence of their comparative
intellectual capital advantage (Polasek et al, 2011). According to Ahangar (2011), human capital
is recognized as the largest and the most important intangible asset in an organization which
ultimately provides the goods and/or services that customers require or the solutions to their
problems. It includes the collective knowledge, competency, experience, skills and talents of
people within an organization. It also includes an organization’s creative capacity and its ability
to be innovative. Although investment in human capital is growing, there is still no standard
measure of its effectiveness and reporting in companies’ balance sheets.
Structural Capital
Structural capital is the supportive infrastructure for human capital. It is the capital which
remains in the factory or office when the employees leave at the end of the day. It includes
organizational ability, processes, data and patents. Unlike human capital, it is company’s’
property and can be traded, reproduced and shared by, and within, the organization (Ahangar,
2011). From the above definitions, it is clear that intellectual capital is an important asset which
has not been fully recognized and reported in financial statements but contributes significantly to
improved financial performance and transformation of organizations.
Comparing Intellectual Capital (IC) and financial performance
There are so many methods available to measure the success of physical capital and assess its
impact on financial performance. For measuring the effectiveness or efficiency of the use of the
physical capital the well known conventional tools like profit, return on investments (ROI),
return on equity (ROE), and return on assets (ROA) can be used, but these are considered to be
ineffective for measuring the performance of intellectual capital (Santanu and Amitava, 2009).
ROI and ROA and growth rate were adopted as the measure of financial performance (Andrzej
and Marian, 2009) and in this paper; we adopted the following financial performance indicators:
ROA, Employee Productivity, ROE, Ratio of Market to Book Values and Growth in Revenue.
Tan et al (2007) have reported a positive association between intellectual capital of firms and
their financial performances. The study of Riahi-Belkaoui (2003) found a positive relationship
between Intellectual Capital (IC) and financial performance, while Bontis et al (2000) concluded
that, regardless of industry, the development of structural capital has a positive impact on
business performance. On the other hand, Firer and Williams (2003) examined the relationship
between IC and traditional measures of firm performance (ROA, ROE) and failed to establish
European Journal of Accounting Auditing and Finance Research
Vol.2.No.2, pp.50-62, April 2014
Published by European Centre for Research Training and Development UK (www.ea-journals.org)
54
any relationship, while Chen et al (2005), using the same methodology, concluded that
Intellectual Capital (IC) has an significant impact on profitability.
Despite these various studies, no one has compared the deviations among the intellectual capital
components and related them to the deviations in the financial performance variables. Hence this
present study centers on comparing the deviations among the intellectual capital components of
different banks in Nigeria and relating these deviations to the differences in the financial
performance variables in order to find out if the deviations in Intellectual Capital (IC) can
explain the differences of the banks in Nigeria. Following from the above, the following
Hypotheses will guide this study:
H0: There are no significant differences among the critical intellectual capital and financial
performance indices of deposit money banks in Nigeria.
For ease of analysis, this hypothesis is further broken down as:
H1: There are no significant differences among the critical intellectual capital indices of deposit
money banks in Nigeria
H2: There are significant differences among the critical financial performance indices of deposit
money banks in Nigeria
METHODOLOGY
This section of the paper first identifies and describes the proxies used for the research variables.
The model for the Duncan Multiple Range Test (DMRT) of ANOVA is outlined at the latter part
of the section. Data were computed from the annual report of the banks of study for a period of
thirteen years (2000-2012). The paper adopted the ex-post facto research design since the
research relied on historical data generated from annual reports and accounts of these banks as
well as data from the publications of the Nigeria Stock Exchange (NSE).
Description of the Research Variables
For the purpose of conducting the analysis in this study, five variables, which are proxies for
financial performance, were taken into account, namely: Return on Assets (ROA), Return on
Equity (ROE), Employee Productivity (log EP), Growth in Revenues (GR) and Market to Book
value ratio (MB). Presently, there is no specific theoretical perspective or adequate empirical
evidence that supports the superiority of any specific proxy measure over the others. It was,
therefore, decided that for the purposes of the study, to adopt the commonly used proxy
measures of financial performance.
Financial Performance Variables
(1) Return on Assets (ROA): Profitability shows the degree to which a firm’s revenues exceed
its cost. ROA is an indicator of how profitable a company is in relation to its total assets. It gives
an idea as to how efficient the management uses assets to generate earnings. It is the ratio of the
net income (less preference dividends) divided by book value of total assets as reported in the
annual reports; (Williams and Firer, 2003; Chen, et al ,2005). It is expressed mathematically as:
ROA= Net Income / Total Assets
European Journal of Accounting Auditing and Finance Research
Vol.2.No.2, pp.50-62, April 2014
Published by European Centre for Research Training and Development UK (www.ea-journals.org)
55
(2) Return on Equity (ROE): Measures an organization’s profitability by revealing how much
profit the organization generates with the money shareholders have invested. It is expressed
mathematically as: ROE = Net Income / Shareholder's Equity
(3) Employee Productivity (log EP): Employee Productivity is a measure for the net revenue
per employee, which reflects employees’ productive capability (Chen, Cheng and Hwang, 2005;
Najibullah, 2005). It is calculated as follows: EP = Total Revenue for the period/ number of
employees. Using the Duncan Multiple Range Test (DMRT) of ANOVA for analysis we used
natural log of EP (LEP).
(4) Growth in Revenue (GR): Growth in Revenue measures the changes in firm’s current year’s
sales over last year’s sales. Increase in sales signals the firm’s growth prospect (Chen, Cheng and
Hwang, 2005; Najibullah, 2005). It is calculated as:
GR= (a given year’s revenue – the preceding year’s revenue) / the preceding year’s revenue *100
(5) Market Value to Book Value ratio (MB): This ratio shows the relationship between the
market value per share and book value per share for each bank. While the market values per
share were sourced from the Nigeria Stock Exchange reports, the book values per share were
calculated from the balance sheet figures for each bank for the period covered in this study.
(6) Employee Productivity (log EP): Employee Productivity is a measure for the net
revenue per employee, which reflects employees’ productive capability (Chen, Cheng and
Hwang, 2005; Najibullah, 2005). It is calculated as follows: EP = Total Revenue for the period/
number of employees. Using the Duncan Multiple Range Test (DMRT) of ANOVA for analysis
we adopted the natural log of EP (LEP).
Description of the Intellectual Capital Variables
The Value Added Intellectual Co-efficient (VAIC) methodology developed by Ante Pulic in
1998 formed the underlying measurement basis for the intellectual variable in this study. It made
use of three component coefficients as follows: Capital Employed Efficiency, Human Capital
Efficiency, and Structural Capital Efficiency. Pulic (1998, 2000a) opines that VAIC is an
analytical procedure designed to enable management, shareholders and other relevant
stakeholders to effectively monitor and evaluate the efficiency of Value Added by a firm’s total
resources and each major resource component. VAIC is a composite sum of two major indicators
these are:
(1) Capital Employed Efficiency (CEE) – indicator of value added efficiency of capital
employed which is defined as the book value of a firm’s net assets.
(2) Intellectual Capital Efficiency (ICE) – indicator of value added efficiency of company’s
Intellectual Capital base. Intellectual Capital Efficiency is composed of two other variables as
follows:
(a) Human Capital Efficiency (HCE) – indicator of value added efficiency of human capital.
Total salary and wage costs are an indicators of a firm’s human capital (HC) and
(b) Structural Capital Efficiency (SCE) – indicator of value added efficiency of structural
capital. The two sub-components of VAIC form the independent variables in this study.
Equation (1) formalizes the VAIC relationship algebraically:
VAIC = CEE + HCE + SCE----------------------------------- [Equation (1)]
Where: VAIC = VA intellectual coefficient of the banks,
CEE = capital employed efficiency coefficient of the banks,
European Journal of Accounting Auditing and Finance Research
Vol.2.No.2, pp.50-62, April 2014
Published by European Centre for Research Training and Development UK (www.ea-journals.org)
56
HCE = human capital efficiency coefficient of the bank and
SCE = structural capital efficiency of the banks.
VA = Value Added by each year for the banks.
Pulic (1998) states the higher the VAIC coefficient, the better the efficiency of VA by a firm’s
total resources. The first step in calculating CEE, HCE and SCE is to determine a firm’s total
VA.
This calculation is defined by the following algebraic equation:
VA = I + DP + D + T + M + R + WS -------------------------- [Equation (2)]
Where: VA(value added) for the banks are computed as the sum of interest expenses (I);
depreciation expenses (DP); dividends (D); corporate taxes (T); equity of minority shareholders
in net income of subsidiaries (M); and profits retained for the year (R) wages and salaries.
Alternatively, VA can be calculated by deducting operating expenses (materials costs,
maintenance costs, other external costs) from operating revenues. (Pulic 1998).
Pulic (1998) further states that CEE is the ratio of total VA divided by the total amount of capital
Employed (CE) where capital employed is defined as the book value of a firm’s net assets.
Equation (3) presents the CEE relationship algebraically:
CEE = VA/CE ----------------------------------------------------- Equation (3)
Where: CEE = capital employed efficiency coefficient of the banks,
VA = VA of the banks; and
CE = book value of the net assets of the banks.
Consistent with views of other leading Intellectual Capital researchers (such as, Edvinsson, 1997;
Sveiby, 2001), Pulic (1998) argues that total salary and wage costs are indicators of a firm’s
human capital (HC).
HCE, therefore, is calculated as the ratio of total VA divided by the total salary and wages spent
by the firm on its employees.
Equation (4) shows this relationship algebraically as follows:
HCE = VA/HC ------------------------------------------------ Equation (4)
Where: HCE = human capital efficiency coefficient of the banks,
VA = VA of the banks. and
HC = total salary and wage costs of the banks.
In order to calculate SCE, it is first necessary to determine the value of a firm’s structural capital
(SC). Pulic (1998) proposes a firm’s total VA less its human capital is an appropriate proxy of a
firm’s SC. That is: SC = VA – HC ------------------------------------------------------- [Equation (5)]
Where: SC = Structural capital of the banks,
VA = VA of the banks and
HC = total salary and wage expenditure of the banks.
Based on prior empirical research findings, Pulic (1998) argues that there is a proportionate
inverse relationship between HC and SC in the value creation process attributable to the entire
Intellectual Capital base, the less Human Capital participates in value creation; the more
Structural Capital is involved. Consequently, Pulic (1998) argues the formula for calculating
SCE differed to that for CEE and HCE respectively. Specifically, Pulic (1998) states SCE is the
ratio of a firm’s SC divided by the total VA. This relationship is shown in Equation (6):
European Journal of Accounting Auditing and Finance Research
Vol.2.No.2, pp.50-62, April 2014
Published by European Centre for Research Training and Development UK (www.ea-journals.org)
57
SCE = SC/ VA ----------------------------------------------------- [Equation (6)]
Where: SCE = structural capital efficiency coefficient VA of the banks,
SC = Structural capital of the banks; and
VA = VA of the banks.
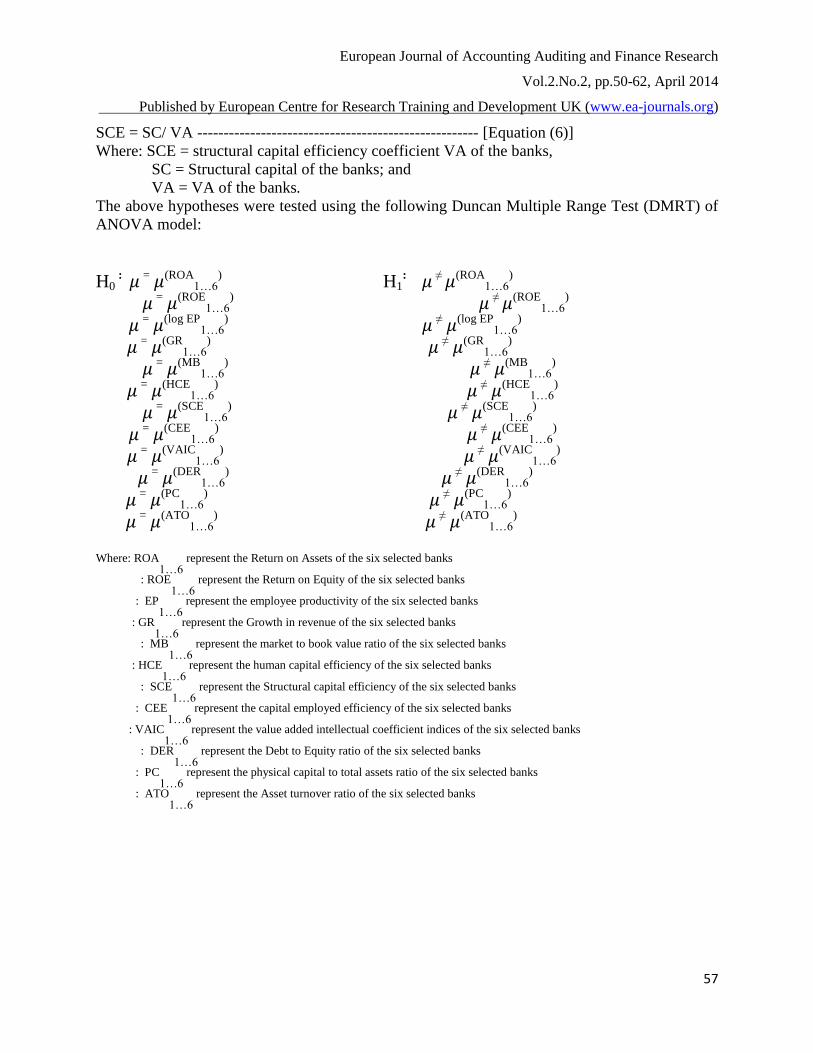
The above hypotheses were tested using the following Duncan Multiple Range Test (DMRT) of
ANOVA model:
H0 : = (ROA
1…6)
H1: ≠ (ROA
1…6)
= (ROE1…6
) ≠ (ROE1…6
)
= (log EP1…6
) ≠ (log EP1…6
)
= (GR1…6
)
≠ (GR1…6
)
= (MB1…6
)
≠ (MB1…6
)
= (HCE1…6
)
≠ (HCE1…6
)
= (SCE1…6
)
≠ (SCE1…6
)
= (CEE1…6
)
≠ (CEE1…6
)
= (VAIC1…6
)
≠ (VAIC1…6
)
= (DER1…6
)
≠ (DER1…6
)
= (PC1…6
)
≠ (PC1…6
)
= (ATO1…6
)
≠ (ATO1…6
)
Where: ROA
1…6 represent the Return on Assets of the six selected banks
: ROE
1…6 represent the Return on Equity of the six selected banks
: EP1…6
represent the employee productivity of the six selected banks
: GR1…6
represent the Growth in revenue of the six selected banks
: MB
1…6 represent the market to book value ratio of the six selected banks
: HCE1…6
represent the human capital efficiency of the six selected banks
: SCE
1…6 represent the Structural capital efficiency of the six selected banks
: CEE1…6
represent the capital employed efficiency of the six selected banks
: VAIC1…6
represent the value added intellectual coefficient indices of the six selected banks
: DER
1…6 represent the Debt to Equity ratio of the six selected banks
: PC1…6
represent the physical capital to total assets ratio of the six selected banks
: ATO1…6
represent the Asset turnover ratio of the six selected banks
European Journal of Accounting Auditing and Finance Research
Vol.2.No.2, pp.50-62, April 2014
Published by European Centre for Research Training and Development UK (www.ea-journals.org)
58
ANALYSIS AND DISCUSSIONS
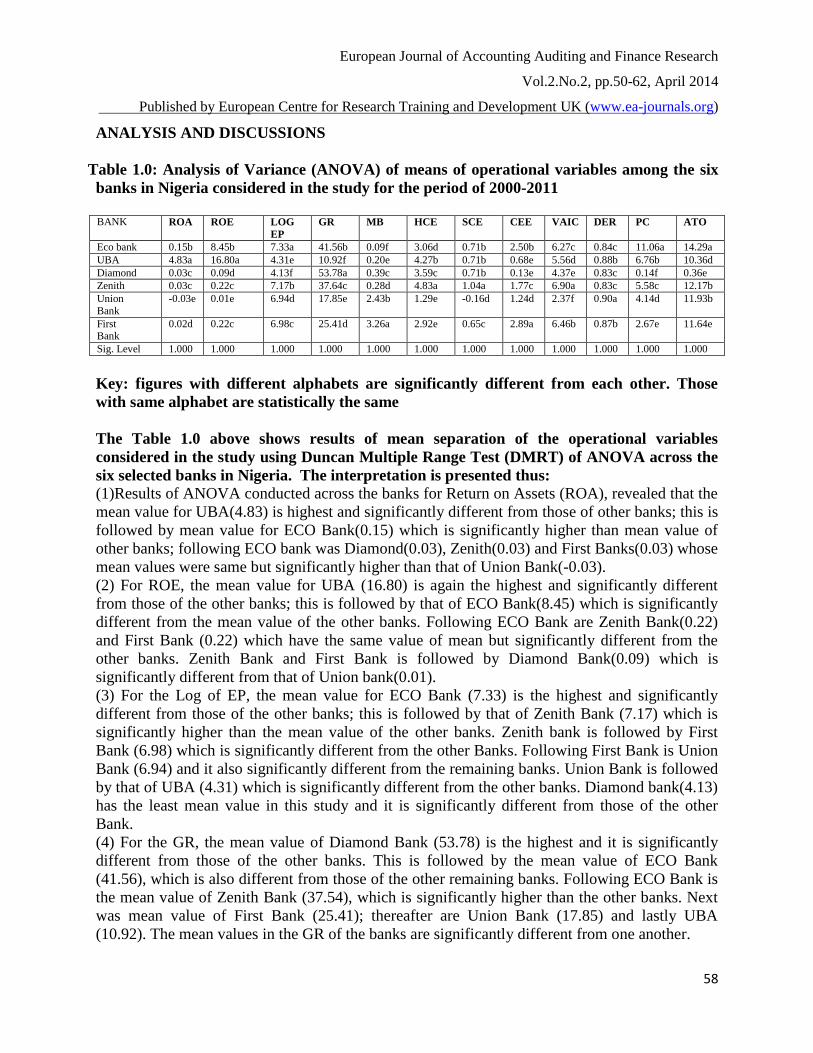
Table 1.0: Analysis of Variance (ANOVA) of means of operational variables among the six
banks in Nigeria considered in the study for the period of 2000-2011
BANK ROA ROE LOG
EP
GR MB HCE SCE CEE VAIC DER PC ATO
Eco bank 0.15b 8.45b 7.33a 41.56b 0.09f 3.06d 0.71b 2.50b 6.27c 0.84c 11.06a 14.29a
UBA 4.83a 16.80a 4.31e 10.92f 0.20e 4.27b 0.71b 0.68e 5.56d 0.88b 6.76b 10.36d
Diamond 0.03c 0.09d 4.13f 53.78a 0.39c 3.59c 0.71b 0.13e 4.37e 0.83c 0.14f 0.36e
Zenith 0.03c 0.22c 7.17b 37.64c 0.28d 4.83a 1.04a 1.77c 6.90a 0.83c 5.58c 12.17b
Union
Bank
-0.03e 0.01e 6.94d 17.85e 2.43b 1.29e -0.16d 1.24d 2.37f 0.90a 4.14d 11.93b
First Bank
0.02d 0.22c 6.98c 25.41d 3.26a 2.92e 0.65c 2.89a 6.46b 0.87b 2.67e 11.64e
Sig. Level 1.000 1.000 1.000 1.000 1.000 1.000 1.000 1.000 1.000 1.000 1.000 1.000
Key: figures with different alphabets are significantly different from each other. Those
with same alphabet are statistically the same
The Table 1.0 above shows results of mean separation of the operational variables
considered in the study using Duncan Multiple Range Test (DMRT) of ANOVA across the
six selected banks in Nigeria. The interpretation is presented thus:
(1)Results of ANOVA conducted across the banks for Return on Assets (ROA), revealed that the
mean value for UBA(4.83) is highest and significantly different from those of other banks; this is
followed by mean value for ECO Bank(0.15) which is significantly higher than mean value of
other banks; following ECO bank was Diamond(0.03), Zenith(0.03) and First Banks(0.03) whose
mean values were same but significantly higher than that of Union Bank(-0.03).
(2) For ROE, the mean value for UBA (16.80) is again the highest and significantly different
from those of the other banks; this is followed by that of ECO Bank(8.45) which is significantly
different from the mean value of the other banks. Following ECO Bank are Zenith Bank(0.22)
and First Bank (0.22) which have the same value of mean but significantly different from the
other banks. Zenith Bank and First Bank is followed by Diamond Bank(0.09) which is
significantly different from that of Union bank(0.01).
(3) For the Log of EP, the mean value for ECO Bank (7.33) is the highest and significantly
different from those of the other banks; this is followed by that of Zenith Bank (7.17) which is
significantly higher than the mean value of the other banks. Zenith bank is followed by First
Bank (6.98) which is significantly different from the other Banks. Following First Bank is Union
Bank (6.94) and it also significantly different from the remaining banks. Union Bank is followed
by that of UBA (4.31) which is significantly different from the other banks. Diamond bank(4.13)
has the least mean value in this study and it is significantly different from those of the other
Bank.
(4) For the GR, the mean value of Diamond Bank (53.78) is the highest and it is significantly
different from those of the other banks. This is followed by the mean value of ECO Bank
(41.56), which is also different from those of the other remaining banks. Following ECO Bank is
the mean value of Zenith Bank (37.54), which is significantly higher than the other banks. Next
was mean value of First Bank (25.41); thereafter are Union Bank (17.85) and lastly UBA
(10.92). The mean values in the GR of the banks are significantly different from one another.
European Journal of Accounting Auditing and Finance Research
Vol.2.No.2, pp.50-62, April 2014
Published by European Centre for Research Training and Development UK (www.ea-journals.org)
59
(5) For the MB, the mean value of First Bank (3.26) is again the highest and significantly
different from those of the other banks; this is followed by that of Union Bank (2.43) which is
also significantly higher than the mean value of the other banks. Next is Diamond Bank (0.39)
whose mean value is also significantly higher than those of other banks. Thereafter is Zenith
Bank (0.28) which is significantly different from that of UBA (0.20). The MB of UBA is
significantly higher than that of ECO Bank (0.09).
(6) The bank with the highest performance in terms of its HCE is Zenith Bank and its mean
value (4.83) is significantly higher than that of the other banks. Zenith Bank is followed by that
of UBA (4.27) which is also significantly higher than those of other banks. Following thereafter
is that of Diamond Bank (3.59), and it is also significantly higher from those of the other banks.
Next is ECO Bank (3.06), which is again significantly higher than those of First Bank (2.92) and
then Union Bank (2.29). These last two are not significantly different from each other in terms of
their HCE performance.
(7) For the SCE, the bank with the highest performance in terms of its SCE in this study is again
Zenith Bank (1.04) and its mean value is significantly higher than that of the other banks. Zenith
Bank is followed by that of UBA, ECO Bank, and Diamond Bank. These three are not
significantly different from each other as they have a value of 0.71 each. Following them is First
Bank (0.65) which is significantly higher than that of Union Bank (-0.16).
(8) For the CEE, the bank with the highest performance in terms of its CEE in this study is First
Bank and its mean value (2.89) is significantly higher than that of the other banks. First Bank is
followed by that of ECO Bank (2.50) which is also significantly higher than those of the other
banks. Following ECO Bank is that of Zenith Bank (1.77), and it is also significantly higher than
those of the other banks. Next is Union Bank (1.24), which is again significantly different from
those of UBA Bank (0.68) and then Diamond Bank.(0.13) These last two are not significantly
different from each other in terms of their CEE performance.
For VAIC the results show that the mean value for Zenith Bank (6.90) is significantly higher
than those of other banks. Next is the mean value for First Bank (6.46) which also significantly
higher than those of other banks. The mean value of ECO bank (6.27) was third and still
significantly higher than others. Following ECO Bank is UBA with mean Value of 5.56 which is
higher than those of Diamond Bank (4.37) and Union Bank (2.37)
(9) For the DER, the mean value of Union Bank (0.90) is the highest and it is significantly
different from those of the other banks. This is followed by the mean value of UBA (0.88) and
First Bank (0.87). The mean values of these two banks are not significantly different from each
other. They are followed by those of Zenith (0.83), Diamond (0.83) and ECO Bank (0.84) which
is also not significantly different from each other.
(10) For the PC, the mean value of ECO Bank (11.06) is the highest and it is significantly higher
than those of the other banks. This is followed by the mean value of UBA (6.76), which is also
significantly higher than those of the other banks. Following UBA Bank is the mean value of
Zenith Bank (5.58), which is significantly higher than those of the other banks. The mean value
of Union Bank (4.14) follows next, thereafter; that of First Ban (2.67)k and lastly that of
Diamond Bank (0.14). The mean values in the PC of the banks are significantly different from
one another.
(11) For the ATO, the bank with the highest performance in terms of its ATO in this study is
ECO Bank and its mean value (14.29) is significantly higher than that of the other banks. ECO
Bank is followed by that of Zenith Bank (12.17), Union Bank (11.93) and First bank (11.64).
European Journal of Accounting Auditing and Finance Research
Vol.2.No.2, pp.50-62, April 2014
Published by European Centre for Research Training and Development UK (www.ea-journals.org)
60
These three are not significantly different from one another but they are significantly different
from that of the other banks. They are followed by the mean value of UBA (10.36) which is also
significantly higher than that of Diamond Bank (0.36).
CONCLUSIONS & RECOMMENDATIONS
This current research paper examined and compared the deviations in the intellectual capital
components of six highly rated banks in Nigeria as well as the corresponding financial
performance indicators of the same banks. The study sought to establish a relationship between
the intellectual capital components and the financial performance indicators of deposit money
banks operating in Nigeria. Specifically, the study appraised the degree of relationship existing
between the intellectual capitals and the financial performance indicators of the banks. It tried to
find out if the deviations in the intellectual capital components of these banks can explain the
deviations in the banks’ financial performance indices among developing economies with a
specific focus on the deposit money banks in Nigeria. The study adopted the Value Added
Intellectual Coefficient (VAIC) approach developed by Pulic Ante in calculating the intellectual
capital components. Hypotheses were formulated for the study and they dealt with the
comparison of the intellectual capital components of the six deposit money banks in Nigeria
selected for the study and also compared the financial performance indicators as proxied by
ROA, ROE, Employee Productivity, growth in revenue, ratio of market to book values, Asset
Turnover, physical capital ratio and debt to equity ratio. In respect of the hypotheses, the results
as shown in table 1 showed the results of the analysis. From the analyses and interpretations, it is
discovered that there were significant deviations in both the financial performance indicators and
in the intellectual capital variables among the six banks studied. The results further showed that
the banks are statistically different in both the intellectual capital indices and in the financial
performance indicators. The study also established that the banks with high intellectual capital
also recorded high financial performance and therefore recommends that all banks should
embrace this new intellectually based technology in order to enhance their financial
performances, returns to their different stakeholders as well as in their service delivery to their
customers. It also established that there is a positive correlation between intellectual capital
indices and the financial performance indicators of the deposit money banks in Nigeria.. It is
therefore recommended that adequate attention should be paid on the banks’ human capital as the
most important asset to the banks. Constant and regular training of employees is also in all aspect
of the banks’ operations is very strongly recommended because it is established that regular
training programmes will positively impact on the employee performances and service delivery
thereby boosting their financial performance indicators. Following from the discussions above, it
is considered that since Human Capital and Structural Capital make up Intellectual Capital; it
implies that there is a strong significant and positive effect of Intellectual Capital on the financial
performance indicators of deposit money banks in Nigeria. This is of special importance to the
management of banks in Nigeria and entire service industry; that should adequate working
environment be created for workers, with good welfare package, and good training programmes,
the banks are bound to continue to flourish.
European Journal of Accounting Auditing and Finance Research
Vol.2.No.2, pp.50-62, April 2014
Published by European Centre for Research Training and Development UK (www.ea-journals.org)
61
References
Ahangar, R. G. (2011). The relationship between Intellectual Capitals and Financial
Performance: An empirical investigation in an Iranian company. African Journal of
Business Management Vol. 5(1), pp. 88-95, 4 January, 2011.
http://www.academicjournals.org/AJBM.
Bontis, N, Chua, W., Richardson S. (2000). Intellectual capital and the nature of business in
Malaysia. Journal of Intellectual Capital, 1(1), 85-100.
Bornemann, M (1999): “Empirical Analysis of the Intellectual Potential of Value Systems in
Austria According to the VAIC”. Journal of Intellectual. Capital, 3(5):16-43.
Campisi, D., and R. Costa,( 2008), “A DEA-Based Method to Enhance Intellectual Capital
Management”, Journal Knowledge and Process Management, 15(3), 170–183.
Chen, M. C., Cheng, S. J., & Hwang, Y. (2005). An empirical investigation of the relationship
between intellectual capital and firms’ market value and financial performance, Journal of
Intellectual Capital, 6 (2), 159-176.
Edvinsson, L. (1997). Developing intellectual capital at Skandia. Long Range Planning, 30 (3),
320-373.
Edvinsson L., Malone M. S. (1997). Intellectual capital: The proven way to establish your
company's real value by measuring its hidden brainpower. London: Judy Piatkus.
Engstrom, T. E. J., Westnes, P., & Westnes, S. F. (2003). Evaluating intellectual capital in the
hotel industry. Journal of Intellectual Capital, 4 (3), 287-303.
Ekwe Michael Chidiebere, (2013), ‘The Relationship between Intellectual Capitals and Growth
in Revenue of Deposit Money Banks in Nigeria’ Research Journal of Finance and
Accounting, Vol. 4 No 12 Hong Kong, China, Pp 55 – 64. Available online at
http://www.iiste.org/Journals/index.php/RJFA/article/view/7759/7801
Firer, S. & Williams, S. M. (2003). Intellectual capital and traditional measures of corporate
performance. Journal of Intellectual Capital, 4 (3), 348-360.
Frederiksen, J. and Westphalen, S.Å. (1998) “Human resource accounting: interest and
conflicts”. A discussion paper. Presented at the European Centre for the Development of
Vocational Training, Thessaloniki.
Kamath, G. B. (2007). The Intellectual Capital Performance of the Indian Banking Sector.
Journal of Intellectual Capital, 8(1): 96-123.
Najibullah Syed (2005), “An Empirical Investigation of the Relationship between Intellectual
Capital and Firms’ Market Value and Financial Performance in Context of
Commercial Banks of Bangladesh”. Available Online
Organization for Economic Co-operation and Development (2001), “The Well-Being of Nations,
The Role of Human and Social Capital”, Centre for Education Research and Innovation,
OECD.
Petty, R., and J. Guthrie, (2000), “Intellectual capital literature review: Measurement, reporting
and management”, Journal of Intellectual Capital, 1(2): 155-176.
Polasek W., Wolfgang S., & Richard S., (2011), “Human Capital and Regional Growth in
Switzerland”, Review of Economic Analysis. Available Online.
Pulic, A. (1998). Measuring the performance of intellectual potential in knowledge economy,
available at: http://www.measuring ip.at/Opapers/Pulic/Vaictxt.vaictxt.html (accessed 4
November 2008).
European Journal of Accounting Auditing and Finance Research
Vol.2.No.2, pp.50-62, April 2014
Published by European Centre for Research Training and Development UK (www.ea-journals.org)
62
Pulic, A. (2000). MVA and VAIC analysis of randomly selected companies from FTSE 250,
available at: http://www.vaic-on.net/downloads/ftse30.pdf (accessed 2 September 2008).
Riahi-Belkaoui A., (2003). Intellectual capital and firm performance of U. S. multinational firms.
Journal of Intellectual Capital, 4(2): 215-226.
Saint-Onge, H., (1996). Tacit knowledge: the key to the strategic alignment of intellectual
capital. Strategic Leadership, 24(2): 10-14.
Stewart, T. (1997). Intellectual capital: the new wealth of organizations. New York, NY.
Doubleday.