intel parallel advisor workflow david valentine computer science slippery rock university
TRANSCRIPT

Intel Parallel Advisor Workflow
David ValentineComputer Science
Slippery Rock University

Parallel Advisor: the goal
• Find the sections of your application that, when parallelized, will give you the best performance gains and scalability, while maintaining correct results

Advisor Workflow (from .NET)
“Open Advisor Work flow”Can also get here from Tools-Intel Advisor XE 2013-Open
Advisor XE Workflow
Simple, 5-step process-all analysis done on your
serial code

Different Builds needed at Different Steps in the Workflow
Workflow Stage Release Build Debug Build
Survey Target(Annotate Sources)Check Suitability
XXX
Check Correctness(Add Parallel Framework)
XXX
Release Build Options
C/C++ > General tab Debug Info Format > Program Database (/Zi)
Compiler: Optimization Optimization > Maximize Speed (/O2)
Inline Function Expansion > Only_inline (/Ob1)
Compiler: Code Generation Runtime Library > MultiThreaded DLL (/MD or /MDd)
Linker Options Generate Debug Info > Yes (/DEBUG)

Different Builds needed at Different Steps in the Workflow
Workflow Stage Release Build Debug Build
Survey Target(Annotate Sources)Check Suitability
XXX
Check Correctness(Add Parallel Framework)
XXX
Debug Build Options
C/C++ > General tab Debug Info Format > Program Database (/Zi) or (/ZI)
Compiler > Optimization Disabled (/Od)
Code Generation Runtime Library > Multi-Threaded DLL (/MD) or Multi-Threaded Debug DLL (/MDd)
Linker > Debugging Generate Debug Info > YES (/DEBUG)

Work Flow Step 1: Survey Target
• This “hot spot” tool needs a “Release Mode” configuration along with Project Properties:– C/C++
• General tab: Debug info to /Zi or /ZI• Optimization: Max Speed /O2 & Only_Inline /Ob1• Code Generation: Runtime Library to Multi-threaded /MD or
/MDd
– Linker- Debugging set to YES (/DEBUG)• Build Project • Click “Collect Survey Data”

Look at Survey Report
100% of time spent in the loop in function trap. Double click to see the code involved.

Summary Report
We can see all the time was spent in a single, time-
consuming loop. We now have a target to parallelize.

Step 2: Annotate Source• The Workflow Advisor gives us 5 tasks:
1. Specify the Intel Advisor XE Include directorya. I prefer to set .NET IDE for this. Tools-Options-Projects &
Solutions-VC++ Directories-b. Then drop the box “Show directories for” to Include Filesc. Browse to “C:\Program Files\Intel\Advisor XE 2013\include”
2. Include the annotation definitionsa) Go to top of code (in #include’s) and right clickb) Select Intel Advisor XE 2013 – Insert Annotation Definitions
Reference and the #include will be inserted for you.
3. Specify the library name and directory

Checking Suitability
4. Insert the actual Annotations: highlight & rt-click
ANNOTATE_SITE_BEGIN(MySite1);for(int i=1; i<numIntervals; i++) {//get the interior points
ANNOTATE_TASK_BEGIN(MyTask1);x = xLo + i*width;area += f(x);ANNOTATE_TASK_END(MyTask1);
}ANNOTATE_SITE_END(MySite1);

Checking Suitability
5. Rebuild project (Release configuration)• The Survey & Suitability tools take RELEASE build• The Correctness tool (when we get there) takes a DEBUG
build.

Suitability ReportWe can almost double
speed on dual core
But the tasks are VERY small

Check Correctness
• Rebuild Project with Debug configurationa. Compiler: Debug (/Zi)b. Compiler: Optimization Disabled (/Od)c. Compiler: Code Generation Runtime Library (/MD or
/MDd)d. Linker Debugging: Generate Debug info YES (/DEBUG)
• And KNOCK DOWN THE ITERATIONS! Correctness takes a LONG LONG time

We find a data race error
Each thread tries to update “area”; we have a data race.
(There is also a bug in Advisor)
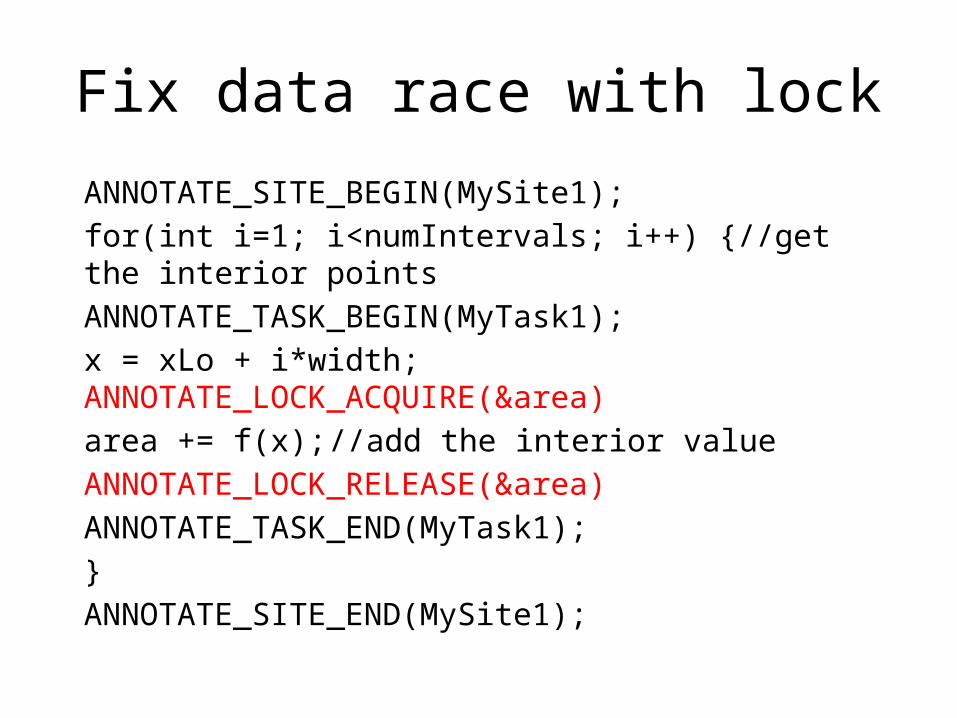
Fix data race with lock
ANNOTATE_SITE_BEGIN(MySite1);for(int i=1; i<numIntervals; i++) {//get the interior points
ANNOTATE_TASK_BEGIN(MyTask1);x = xLo + i*width;
ANNOTATE_LOCK_ACQUIRE(&area)area += f(x); //add the interior value ANNOTATE_LOCK_RELEASE(&area)ANNOTATE_TASK_END(MyTask1);
}ANNOTATE_SITE_END(MySite1);

Run Correctness againClean bill of health!

Now add Parallel Framework#pragma omp parallel for default(none) \ //make newbie list ALL
private(x) \ //each thread has own xshared(numIntervals, xLo, width) \ //all share thesereduction(+:area) //threads combine areas at end
for(int i=1; i<numIntervals; i++) {//get the interior pointsx = xLo + i*width; //makes each iteration independent of othersarea += f(x); //add the interior value ***
}
• Will also need to add:– #include <omp.h>– Properties-Configuration- C/C++ -Language-OpenMP Support > Yes

Watch it run!100% core
usage!

Now on to the Nifties…
• Please respect the work of colleagues• DO NOT POST SOURCE CODE• Give credit back to the authors• DO NOT POST SOURCE CODE• Feel free to tweak the assignments• DO NOT POST SOURCE CODE