integration of geological and … · integration of data for seismic hazard analysis 689 each of...
TRANSCRIPT
Bulletin of the Seismological Society of America, Vol. 74, No.2, pp. 687~708, April1984
INTEGRATION OF GEOLOGICAL AND SEISMOLOGICAL DATA FOR THE ANALYSIS OF SEISMIC HAZARD: A CASE STUDY OF JAPAN
BY S. G. WESNOUSKY,* C. H. SCHOLZ, K. SHIMAZAKI, AND T. MATSUDA
ABSTRACT
Seismic hazard analyses are associated with large uncertainties when historical data are insufficient to define secular rates of seismicity. Such uncertainties may be decreased with geological data in areas where seismicity is shallow and produced by Quaternary faulting. To illustrate, we examine intraplate Japan. Large intraplate earthquakes in Japan characteristically produce surface ruptures along mappable Quaternary faults and show a systematic relation between seismic moment, Mo and rupture length I (log Mo = 23.5 + 1.94 x log l). It is observed that, within the bounds placed by geologically assessed slip rates, the mean regional moment release rate Mo resulting from slip on mapped Quaternary faults is in accord with estimates of M0 determined with the 400-yr record of seismicity. Recent work also shows that when the repeat timeT of earthquakes on Quaternary faults in southwest Japan is assumed to equal Mo/Mo 9 (where Mo is estimated for rupture extended over the entire fault length and Mo 9 is the geologically assessed moment release rate of each fault), the moment frequency distribution of earthquakes predicted from the geologic record is virtually identical to that seen with the 400-yr record of seismicity. These observations indicate that the geologic record of Quaternary fault offsets contains sufficient information to predict both the spatial and size distribution of intraplate earthquakes in Japan. A contour map of the average recurrence time of ground shaking of JMA intensity ~V is thus computed using an empirical relation between seismic moment and the areal distribution of seismic intensity and assuming that the repeat time T of earthquakes on each Quaternary fault equals Mo/Mo9 • The map demonstrates
' how Quaternary fault data may be used to assess long-term seismic hazard in areas of active faulting where historical records of seismicity are relatively short or absent. Another shortcoming of conventional seismic hazard analysis is that hazard is not considered a function of the time since each fault in a region last ruptured. A simple procedure is used to demonstrate how the time-dependent nature of the earthquake cycle affects the evaluation of seismic hazard. The distribution of seismic shaking characteristic of large interplate earthquakes offshore of Japan is estimated from published isoseismal maps. The observed average repeat times of ruptures along specific segments of the plate boundaries then provide the basis to make probabilistic estimates of the next expected time of seismic shaking due to plate boundary earthquakes. When data are too few to document the average repeat times of rupture, the estimates of probability are calculated with data relating to the relative coseismic slip during past earthquakes and the rate of interseismic strain accumulation, interpreted within the framework of the time predictable model of earthquake occurrence. Results are displayed as maps of instantaneous seismic hazard: the probability that seismic shaking will occur conditional to knowledge of where in time each fault in a region presently resides with respect to the earthquake cycle.
INTRODUCTION
A fundamental input to analyses of seismic hazard is an estimate of the average occurrence rate of earthquakes of different magnitude in a region of interest. Such
*Present address: Seismological Laboratory, California Institute of Technology Pasadena California 91125. , ,
687
688 WESNOUSKY, SCHOLZ, SHIMAZAKI, AND MATSUDA
estimates are conventionally made with earthquake frequency statistics based upon data listed in historical catalogs of seismicity. Conventional forms of seismic hazard analysis are, as a result, associated with large uncertainties when historical data are insufficient to define secular rates of seismicity. Uncertainties, for example, will be large when the repeat time of large earthquakes on given faults in a region are greater than the length of the existing historical record, which is the usual case. In contrast to historical data, the geologic record of Quaternary fault offsets contains information on the occurrence of earthquakes through periods of time many orders longer than the average repeat time of large earthquakes on individual faults, and orders of magnitude greater than periods covered by historical records. It is now also recognized that moderate to large earthquakes of shallow depth commonly produce surface ruptures along faults that show evidence of prior Quaternary movements (e.g., Allen, 1975; Matsuda, 1977). A number of studies have further shown a near coincidence between fault offset rates determined from instrumental seismic moment sums and slip rates calculated with geologic or plate tectonic methods (Brune, 1968; Davies and Brune, 1970; Anderson, 1979; Doser and Smith, 1982; Wesnousky et al., 1982). It follows that the geologic record of Quaternary fault offsets, rather than the historical record of seismicity, is better suited for estimating long-term rates of seismicity, and hence, seismic hazard in regions characterized by shallow seismicity, Quaternary faulting, and a relatively short recorded history (e.g., Allen, 1975).
A separate but equally important shortcoming of conventional methods of seismic hazard analysis is that seismic hazard will generally be a function of time. As an example, consider a region where tectonic stress is released during earthquakes on a single fault. It is now generally understood that fault behavior is well approximated by the elastic rebound theory (Reid, 1910; Imamura, 1930; Fitch and Scholz, 1971; Kanamori, 1973; Shimazaki, 1974; Scholz arid Kato, 1978). This well-known theory simply states that strain along faults accumulates slowly through time and upon reaching a critical level is released as sudden slip during an earthquake. The repeated buildup and seismic release of strain on a fault is the earthquake cycle. A direct consequence of the earthquake cycle is that seismic hazard particular to a fault will be dependent on the occurrence time of the previous earthquake on the fault. The seismic hazard, or probability of another large earthquake, excluding possible aftershocks, should be lowest during the period immediately following a major earthquake; the time when accumulated strain is minimal. Accordingly, the relative hazard should increase with time as strain accumulates along the fault. Similarly, in areas characterized by many faults, seismic hazard will be a function of the occurrence time of the event that last ruptured each fault. Conventional methods of seismic hazard analysis do not as a general rule take this behavior into account. Rather, conventional analyses approximate the occurrence of earthquakes in a region as a stochastic or, more specifically, a Poisson process (e.g., Cornell, 1968; Algermissen and Perkins, 1975; Algermissen et al., 1982). Probabilistic estimates of seismic hazard made with this approximation are necessarily independent of the recent history of earthquakes on each fault in the region of interest.
Conventional methods of seismic hazard analysis are thus commonly characterized by two deficiencies. The first of these is the large uncertainty involved in estimating long-term average rates of seismicity, and hence, seismic hazard from insufficiently short historical records. Failure to accurately consider the timedependent nature of the earthquake rupture process is the second. The purpose of this work, then, is to discuss and present some simple ideas that work to alleviate
INTEGRATION OF DATA FOR SEISMIC HAZARD ANALYSIS 689
each of these deficiencies. Specifically, we shall initially examine the assumptions and problems that are intrinsic to the incorporation of Quaternary fault data into a quantitative evaluation of seismic hazard. A method is presented that utilizes data describing the average slip rates of Quaternary faults, rather than the historical record of seismicity, to determine the average spatial and size distribution of earthquakes in a region through time. The method, when coupled with empirical relations between earthquake strength and strong ground motion, provides a basis for quantitatively evaluating the long-term seismic hazard, defined here as the average expected repeat time of seismic shaking of specific intensity at a certain site. The latter section of this paper is then devoted to incorporating present
130°E
INTRAPLATE EARTHQUAKES IN JAPAN OF M;;. 6.9
EURASIAN PLATE
• M;;. 7.6 rJ
•
• 7.2.;;M < 7.6 • • • M.;; 7.2
PHILIPPINE SEA PLATE
PACIFIC PLATE
30°
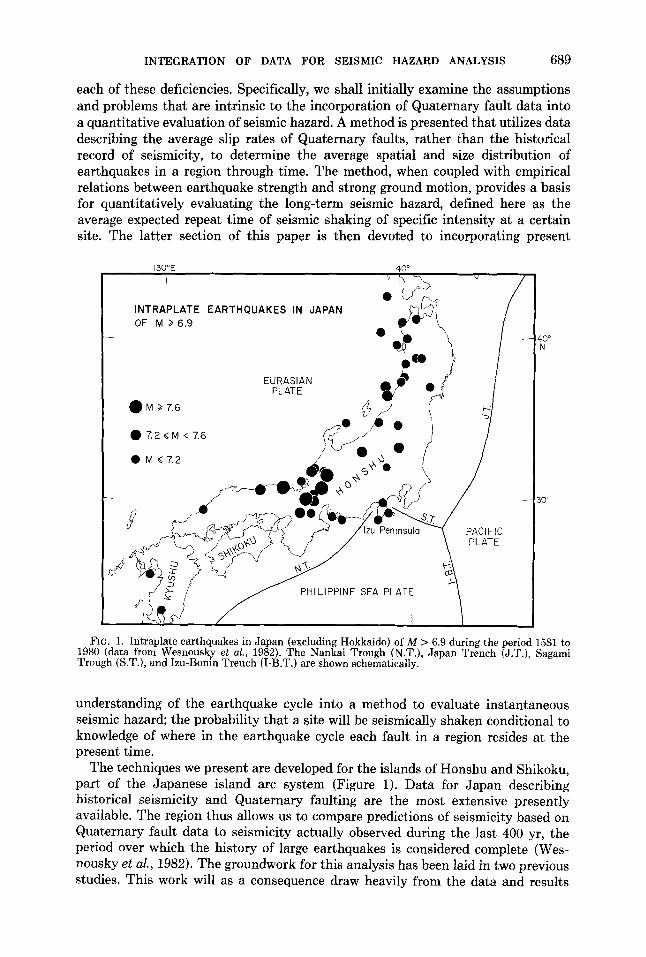
FIG. 1. Intraplate earthquakes in Japan (excluding Hokkaido) of M > 6.9 during the period 1581 to 1980 (data from Wesnousky et al., 1982). The Nankai Trough (N.T.), Japan Trench (J.T.), Sagami Trough (S.T.), and Izu-Bonin Trench (I-B.T.) are shown schematically.
understanding of the earthquake cycle into a method to evaluate instantaneous seismic hazard; the probability that a site will be seismically shaken conditional to knowledge of where in the earthquake cycle each fault in a region resides at the present time.
The techniques we present are developed for the islands of Honshu and Shikoku, part of the Japanese island arc system (Figure 1). Data for Japan describing historical seismicity and Quaternary faulting are the most extensive presently available. The region thus allows us to compare predictions of seismicity based on Quaternary fault data to seismicity actually observed during the last 400 yr, the period· over which the history of large earthquakes is considered complete (W esnousky et al., 1982). The groundwork for this analysis has been laid in two previous studies. This work will as a consequence draw heavily from the data and results
690 WESNOUSKY, SCHOLZ, SHIMAZAKI, AND MATSUDA
presented in Wesnousky et al. (1982, 1983). To illustrate the potential use of the techniques developed, maps are produced to display both the long-term and instantaneous seismic hazard due to intraplate and plate boundary earthquakes in Japan.
SEISMICITY AND FAULTING IN JAPAN
A description of seismicity and faulting in Japan is provided in Wesnousky et al. (1982). The characteristics essential to the following development are briefly recounted here. The Japanese island arc lies along the eastern edge of the Eurasian plate and is bounded to the east and south by the Pacific and Philippine sea plates, respectively (Figure 1). The majority of earthquakes, particularly the largest (M > 8), occur along the Japan Trench and Sagami and Nankai Troughs. Earthquakes along the plate boundaries generally show low-angle thrust mechanisms and are interpreted to indicate that the Pacific and Philippine sea plates are subducting beneath the Eurasian plate (Fitch and Scholz, 1971; Kanamori, 1971a, 1972; Ando, 1974, 1975; Abe, 1977; Scholz and Kato, 1978). Seismicity is also observed to occur
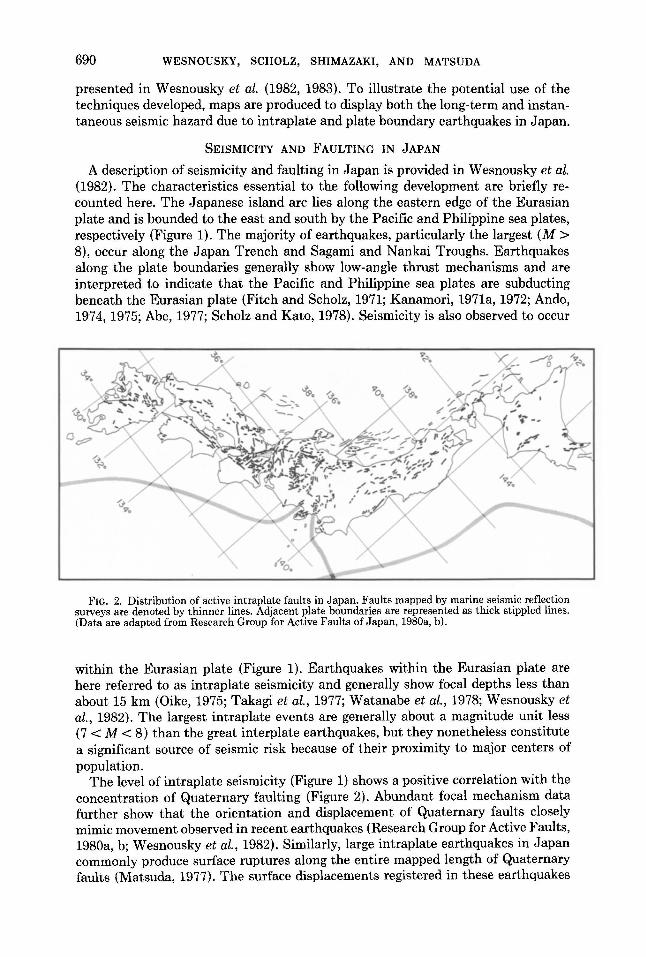
FIG. 2. Distribution of active intraplate faults in Japan. Faults mapped by marine seismic reflection surveys are denoted by thinner lines. Adjacent plate boundaries are represented as thick stippled lines. (Data are adapted from Research Group for Active Faults of Japan, 1980a, b).
within the Eurasian plate (Figure 1). Earthquakes within the Eurasian plate are here referred to as intraplate seismicity and generally show focal depths less than about 15 km (Oike, 1975; Takagi et al., 1977; Watanabe et al., 1978; Wesnousky et al., 1982). The largest intraplate events are generally about a magnitude unit less (7 < M < 8) than the great interplate earthquakes, but they nonetheless constitute a significant source of seismic risk because of their proximity to major centers of population.
The level of intraplate seismicity (Figure 1) shows a positive correlation with the concentration of Quaternary faulting (Figure 2). Abundant focal mechanism data further show that the orientation and displacement of Quaternary faults closely mimic movement observed in recent earthquakes (Research Group for Active Faults, 1980a, b; Wesnousky et al., 1982). Similarly, large intraplate earthquakes in Japan commonly produce surface ruptures along the entire mapped length of Quaternary faults (Matsuda, 1977). The surface displacements registered in these earthquakes
INTEGRATION OF DATA FOR SEISMIC HAZARD ANALYSIS 691
are in the same sense, although less than, the total geologic offset documented across the fault. The data thus strongly support the concept that the total displacement documented on Quaternary faults in intraplate Japan is the cumulative result of the repeated occurrence of earthquakes through the Quaternary period (Sugimura, 1967; Research Group for Quaternary Tectonic Map, 1977; Wesnousky et al., 1982).
LONG-TERM SEISMIC HAZARD
Intraplate earthquakes. Two requirements must be met if Quaternary fault data are to provide the basis for quantitatively evaluating seismic hazard. It must first be established that the average rates of slip, and hence, seismicity on faults has been steady during the Quaternary period, and further, are representative of present rates. Second, the capability must exist to predict the average rate of seismicity on a Quaternary fault as a function of the geologically assessed parameters of fault length and slip rate. Each of these requirements are the subject of detailed study in Wesnousky et al. (1982, 1983). A synopsis of those analyses is presented here.
The seismic moment M 0 is a more fundamental measure of earthquake strength than is magnitude M. M 0 and M can each be measured with instrumental data. M 0,
however, may further be related to physical parameters that describe the fault source, whereas M cannot, except indirectly through its empirical relation with M 0
(e.g., Hanks and Kanamori, 1979). For shearing on a fault, M 0 is equal to JIUA,
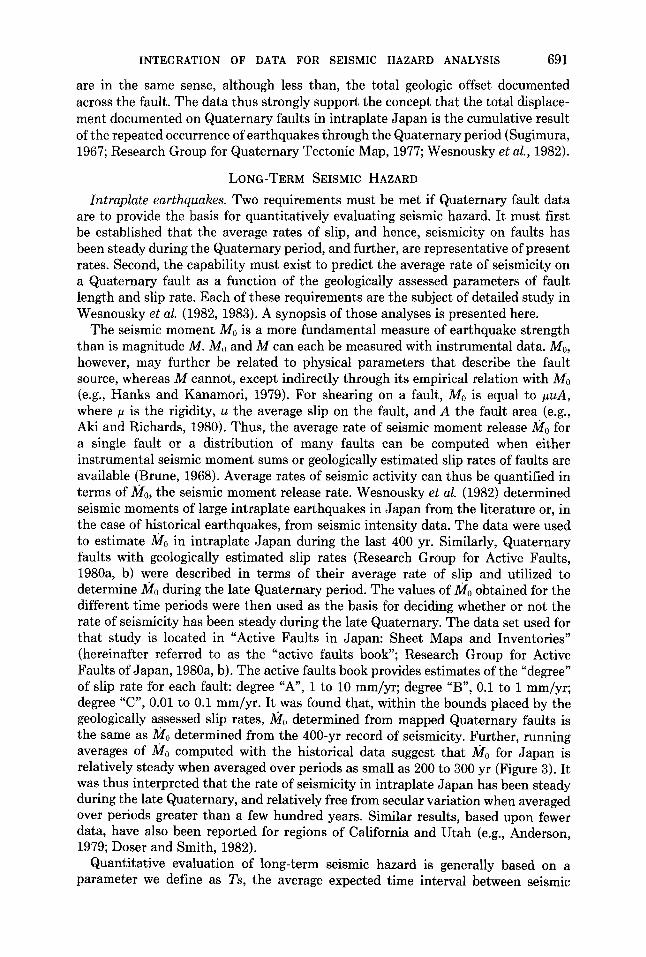
where Jl is the rigidity, u the average slip on the fault, and A the fault area (e.g., Aki and Richards, 1980). Thus, the average rate of seismic moment release M0 for a single fault or a distribution of many faults can be computed when either instrumental seismic moment sums or geologically estimated slip rates of faults are available (Brune, 1968). Average rates of seismic activity can thus be quantified in terms of Mo, the seismic moment release rate. Wesnousky et al. (1982) determined seismic moments of large intraplate earthquakes in Japan from the literature or, in the case of historical earthquakes, from seismic intensity data. The data were used to estimate M0 in intraplate Japan during the last 400 yr. Similarly, Quaternary faults with geologically estimated slip rates (Research Group for Active Faults, 1980a, b) were described in terms of their average rate of slip and utilized to determine Mo during the late Quaternary period. The values of M0 obtained for the different time periods were then used as the basis for deciding whether or not the rate of seismicity has been steady during the late Quaternary. The data set used for that study is located in "Active Faults in Japan: Sheet Maps and Inventories" (hereinafter referred to as the "active faults book"; Research Group for Active Faults of Japan, 1980a, b). The active faults book provides estimates of the "degree" of slip rate for each fault: degree "A", 1 to 10 mm/yr; degree "B", 0.1 to 1 mm/yr; degree "C", 0.01 to 0.1 mm/yr. It was found that, within the bounds placed by the geologically assessed slip rates, Mo determined from mapped Quaternary faults is the same as Mo determined from the 400-yr record of seismicity. Further, running averages of Mo computed with the historical data suggest that M0 for Japan is relatively steady when averaged over periods as small as 200 to 300 yr (Figure 3). It was thus interpreted that the rate of seismicity in intraplate Japan has been steady during the late Quaternary, and relatively free from secular variation when averaged over periods greater than a few hundred years. Similar results, based upon fewer data, have also been reported for regions of California and Utah (e.g., Anderson, 1979; Doser and Smith, 1982).
Quantitative evaluation of long-term seismic hazard is generally based on a parameter we define as Ts, the average expected time interval between seismic
692 WESNOUSKY, SCHOLZ, SHIMAZAKI, AND MATSUDA
shakings of a given strength at a specific site. Ts is thus a function of the average repeat time T of earthquakes on each fault in an area that may cause a certain level of ground shaking at the site of interest. Estimation of T for a geologic fault, as a function of fault length and slip rate, requires a mechanical understanding of fault behavior. There presently coexist two schools of thought concerning fault mechanics. The first school is based on the observation (e.g., Ishimoto and Iida, 1939; Gutenberg and Richter, 1944) that the magnitude frequency distribution of earthquakes in a broad region that includes many faults generally satisfies the relation
log N =a- bM, (1)
where N is the number of events with magnitude greater than or equal to M, and a and b are empirical constants. In addition to being true for a regional data set, many investigators have also assumed that seismicity particular to a single fault, or fault segment, also obeys equation (1) (e.g., Nur, 1978; Hanks, 1979; Andrews, 1980; von Seggern, 1980). A major implication of this idea is that, during the repeat time
~ 10 E u
~ 5 c ,., -o
"' "'g 2
o I .::;;:
w 0 ::J f-
.5
8
z (') 7 <( ::;;:
INTRAPLATE JAPAN ?. '' : \ .a--0-4 r-o ----r------------- ____ ._, ... "*"4....,,----~-~----- 10
, f \ I
\ ! ~~ \ ~ \ \ /
~ \ '4 I I A I
\ ), b..'0--0/ 'o.-o--O' IY
2
.5
c 1600 1700 1800 1900 1980
FIG. 3. Earthquakes of M > 6.9 as a function of time for intraplate Japan plotted beneath 50-yr (small circles) and 200-yr (solid circles) running averages of the seismic moment release rate (1025 dynecm/yr).
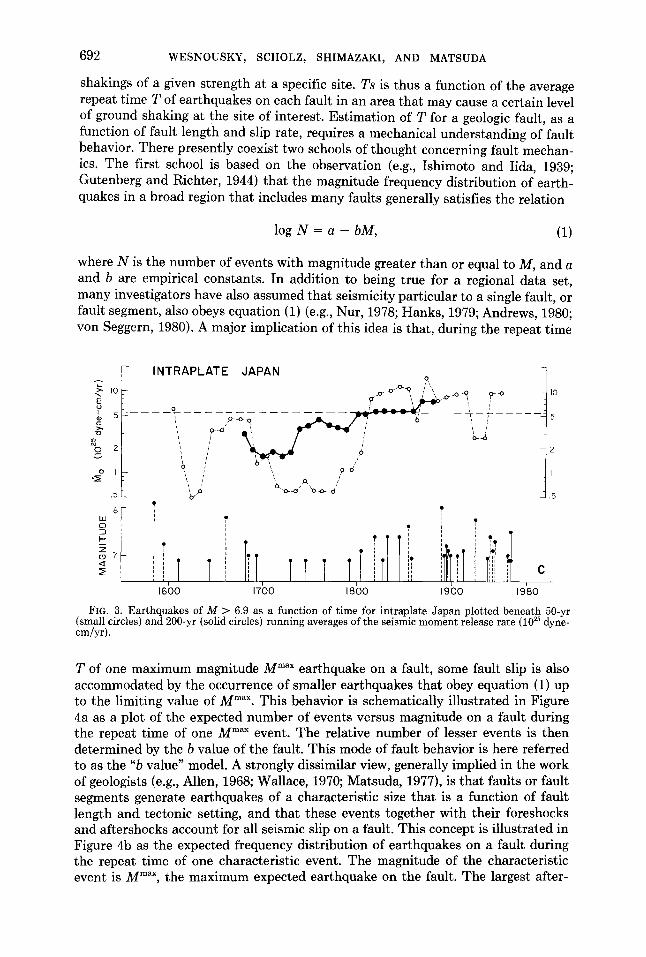
T of one maximum magnitude Mmax earthquake on a fault, some fault slip is also accommodated by the occurrence of smaller earthquakes that obey equation (1) up to the limiting value of Mmax. This behavior is schematically illustrated in Figure 4a as a plot of the expected number of events versus magnitude on a fault during the repeat time of one Mmax event. The relative number of lesser events is then determined by the b value of the fault. This mode of fault behavior is here referred to as the "b value" model. A strongly dissimilar view, generally implied in the work of geologists (e.g., Allen, 1968; Wallace, 1970; Matsuda, 1977), is that faults or fault segments generate earthquakes of a characteristic size that is a function of fault length and tectonic setting, and that these events together with their foreshocks and aftershocks account for all seismic slip on a fault. This concept is illustrated in Figure 4b as the expected frequency distribution of earthquakes on a fault during the repeat time of one characteristic event. The magnitude of the characteristic event is Mmax, the maximum expected earthquake on the fault. The largest after-
INTEGRATION OF DATA FOR SEISMIC HAZARD ANALYSIS 693
shock Ma is usually one to two magnitude units less than Mmax, and in accord with observation (e.g., Utsu, 1971) the sequence of aftershocks is assumed to obey equation (1). The total slip registered by aftershocks is generally less than about 5 per cent of that occurring in the main shock Mmax (Scholz, 1972). For convenience, we label this the maximum magnitude model. Confidence in maps of Ts computed with Quaternary fault data is critically dependent on our understanding of which of the two models best depicts the true behavior of faults.
Wesnousky et al. (1983) presented an empirical test to resolve which of the two fault models best represents the actual behavior of faults. It was initially assumed in that study that the occurrence of earthquakes on a fault is described by either the maximum magnitude model or the b value model. The two fault models were recast in terms of seismic moment so that the occurrence rate of seismicity on a fault could be expressed as a function of the length and geologic slip rate of each fault. Each of the idealized fault models together with data describing the slip rates
(/)
1-z w > w
(/) 1-z w > w
n
b
Maximum Magnitude
FrG. 4. Seismicity on a fault described by the (a) b value and (b) maximum magnitude models of fault behavior.
and lengths of Quaternary faults in southwest Japan (Research Group for Active Faults, 1980a, b) were then employed to compute the seismicity for each fault and the resulting moment-frequency distribution resulting from earthquakes on all faults during a 400-yr period. For the computations, the maximum expected earthquake for each fault was assumed to be proportional to the mapped fault length. The assumption was based on the observation that large intraplate earthquakes in Japan commonly rupture over the complete length of preexisting, mapped faults (Matsuda, 1977). M 0max for each mapped fault was thus estimated from an empirical relation between seismic moment and rupture length (log M 0 = 23.5 + 1.94 x log l) developed for recent Japanese intraplate earthquakes by Wesnousky et al. (1983). The repeat times T of M omax events and, when assuming the b value model, smaller earthquakes were taken to be inversely proportional to the moment release rate M 0g of each fault, which in turn is simply a function of the geologically assessed slip rate of the fault. Hence, for example, the average expected repeat time T of M 0max events on a fault that behaves according to the maximum magnitude model is approximated to
694 WESNOUSKY, SCHOLZ, SHIMAZAKI, AND MATSUDA
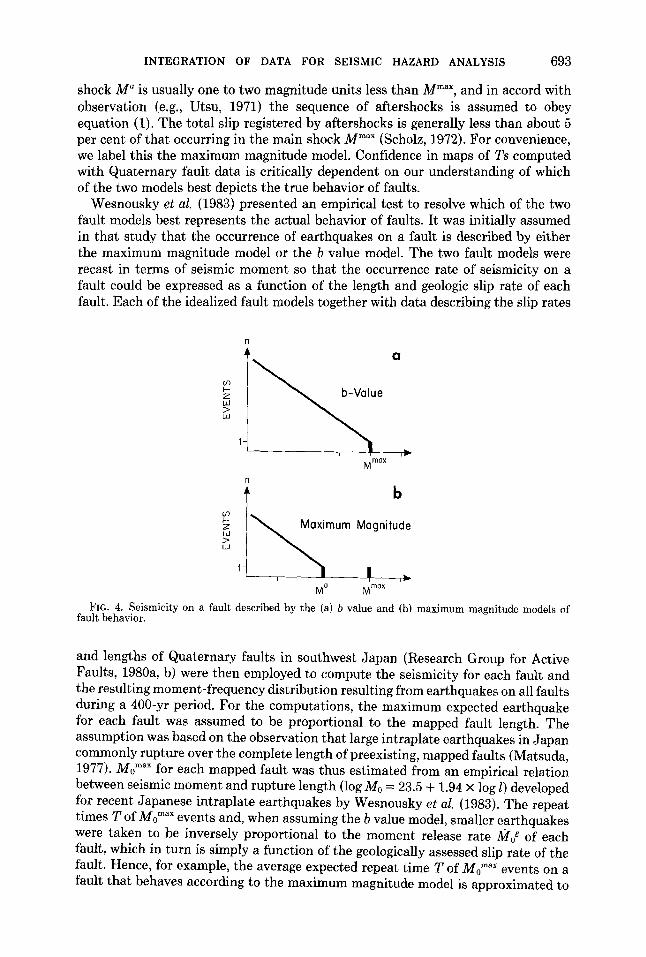
equal M 0max/Ml. Comparison of the number of earthquakes predicted from the Quaternary fault data with each fault model to the seismicity actually observed during the last 400 yr provided the test to decide which fault model most accurately depicts the gross characteristics of fault behavior. The results of that comparison are repeated here in Figure 5 as a plot of the cumulative number of earthquakes versus log M 0• The 400-yr record of seismicity for southwest Japan is displayed as open symbols. Data for events of log M0 > 26.0 (open circles) are from the 400-yr record of seismicity presented by Wesnousky et al. (1982). Data describing events of log M 0 ~ 26.0 (open triangles) are from recent catalogs that describe only the last 100 yr of seismicity (Utsu, 1979; Japan Meteorological Agency, 1958, 1966, 1968, and monthly volumes thereafter). For Figure 5 then, the number of events with log M 0 ~ 26.0 recorded during the last 100 yr has been multiplied by 4. Magnitudes of events listed in these recent catalogues are converted to Mo with the relation log M 0 = 1.5 M + 16.1. This relation is representative of a large suite of earthquakes (Thatcher and Hanks, 1973; Purcaru and Berckhemer, 1978; Hanks
1000 SOUTHWEST JAPAN
(/)
I- 100 z w > w LL 0
0::: w co :;;:, 10 :::J z
26 28
log {M0 l {dyne-em)
FIG. 5. Cumulative number of events per 400 yr predicted from the geologic data with the maximum magnitude (solid circles) and b values (shaded region) models of fault behavior. The observed 400-yr record of seismicity (open symbols) is shown for comparison.
and Kanamori, 1979) and is in general accord with the data set of Japanese intraplate earthquakes (Wesnousky, 1982). The close agreement between the seismicity predicted with the maximum magnitude model (solid circles) and the observed seismicity (open symbols), as compared to the poorer fit to the observed data predicted by the b value model (shaded region), was interpreted to support the maximum magnitude model of fault behavior.
Briefly reiterating, the study of Japan presented in Wesnousky et al. (1982) and analyses in other regions of the world (e.g., Brune, 1968; Anderson, 1979; Doser and Smith, 1982) are consistent with the idea that, in areas characterized by shallow seismicity and surface faulting, geologically determined slip rates of Quaternary faults are representative of present day rates of seismicity. Wesnousky et al. (1983) further provided evidence for the maximum magnitude model of fault behavior, whereby the average repeat time of earthquakes on a fault can be approximated to
INTEGRATION OF DATA FOR SEISMIC HAZARD ANALYSIS 695
equal
(2)
years, where M 0max is the seismic moment of the maximum expected earthquake and M l is the geologically determined moment release rate of the fault. The studies thus provide an initial foundation on which we may begin to base estimates of longterm seismic hazard on knowledge of Quaternary faulting in a region. Specifically, with empirical relations between seismic moment and the areal distribution of strong ground motions, the maximum magnitude model and data describing the
YEARS
,,,, 2~ = ~~ M~ 51- 1oo !!!! I 0 I - 500 illl 501 -1000 D >looo
a) INTRAPLATE
b) INTERPLATE
c) COMBINED
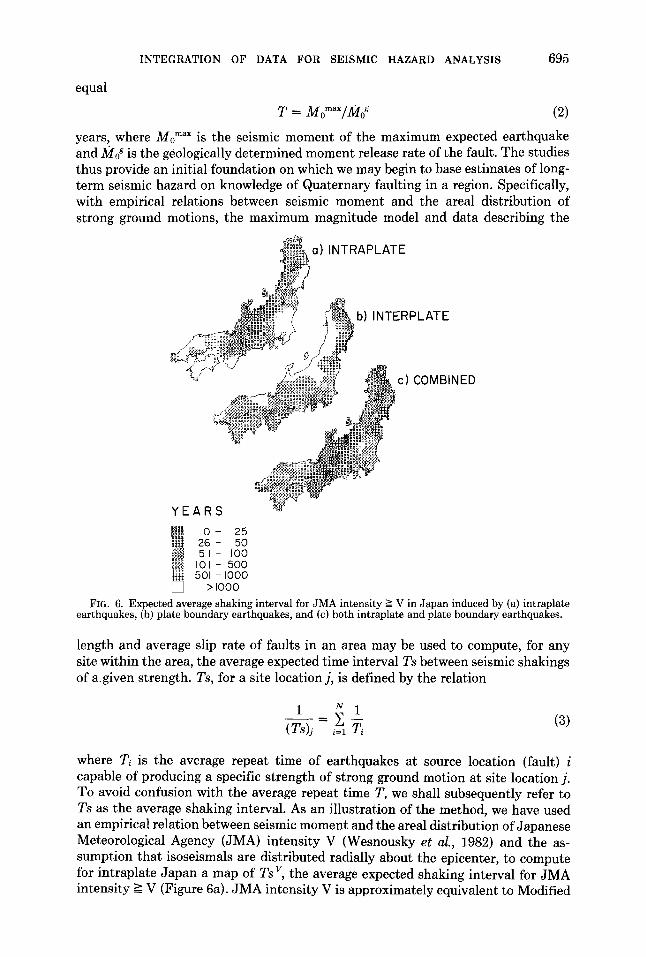
FIG. 6. Expected average shaking interval for JMA intensity E;; V in Japan induced by (a) intraplate earthquakes, (b) plate boundary earthquakes, and (c) both intraplate and plate boundary earthquakes.
length and average slip rate of faults in an area may be used to compute, for any site within the area, the average expected time interval Ts between seismic shakings of a. given strength. Ts, for a site location j, is defined by the relation
1 N 1 -=L-(Ts)j i=l Ti
(3)
where Ti is the average repeat time of earthquakes at source location (fault) i capable of producing a specific strength of strong ground motion at site location j. To avoid confusion with the average repeat time T, we shall subsequently refer to Ts as the average shaking interval. As an illustration of the method, we have used an empirical relation between seismic moment and the areal distribution of Japanese Meteorological Agency (JMA) intensity V (Wesnousky et al., 1982) and the assumption that isoseismals are distributed radially about the epicenter, to compute for intraplate Japan a map of Ts v, the average expected shaking interval for JMA intensity~ V (Figure 6a). JMA intensity Vis approximately equivalent to Modified
696 WESNOUSKY, SCHOLZ, SHIMAZAKI, AND MATSUDA
Mercalli intensity VIII (Trifunac and Brady, 1975). The measure of seismic intensity is used here as a convenience. With similar relations between seismic moment, ground acceleration, and source-site distance (e.g., Hanks, 1976; Kanamori, 1979), the technique could just as readily be used to map the expected recurrence interval of specific levels of strong ground acceleration.
The shortest average shaking intervals in Figure 6a are found in central Japan. This is in accord with the observation that central Japan is characterized by the greatest concentration of Quaternary faults. In northeast Japan, average shaking intervals on the Japan Sea coast are shorter than predicted along the Pacific coast. This reflects the expected occurrence of earthquakes resulting from slip on intraplate faults located in and near the Sea of Japan. The longest predicted average shaking intervals are found in the region immediately northeast of the Izu Peninsula (Kanto district), along the Pacific coast of northeast Honshu, Shikoku, and western Honshu. The Kanto district is a large subsiding sedimentary basin. The large average shaking intervals in this area may thus result from an incomplete active fault data set. The low hazard in the Kanto district suggested by the long shaking intervals should further be viewed with caution because portions of this area are characterized by high levels of seismicity at moderate depths of about 60 to 80 km that are not associated with surface faulting, and not examined in this analysis. In contrast, the longer intervals between shaking predicted along the Pacific coast of northeast Honshu, Shikoku, and western Honshu are a consequence of the low concentration and low rates of slip of faults in these regions.
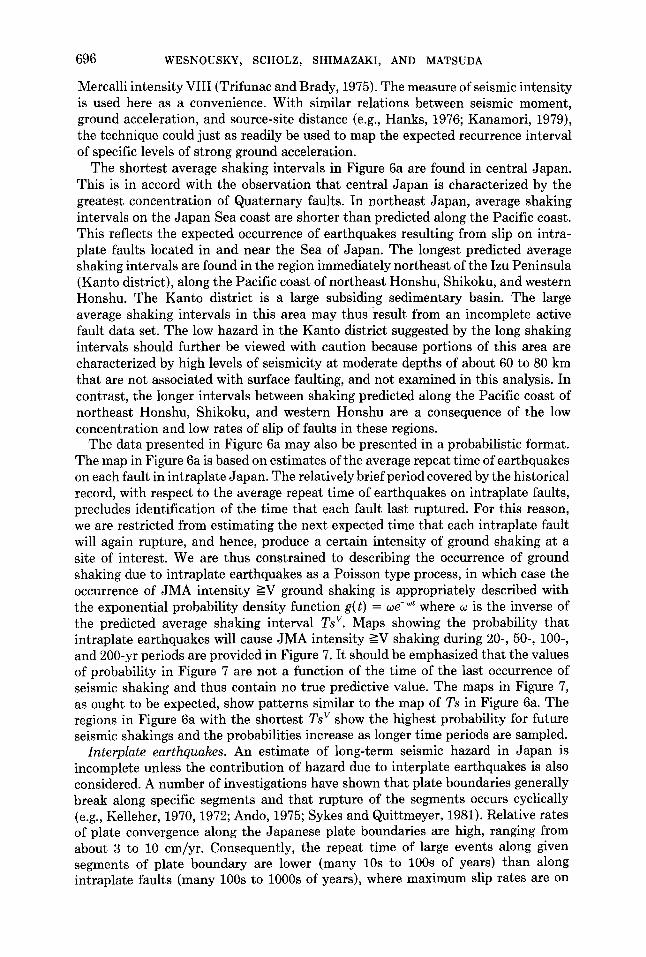
The data presented in Figure 6a may also be presented in a probabilistic format. The map in Figure 6a is based on estimates of the average repeat time of earthquakes on each fault in intraplate Japan. The relatively brief period covered by the historical record, with respect to the average repeat time of earthquakes on intraplate faults, precludes identification of the time that each fault last ruptured. For this reason, we are restricted from estimating the next expected time that each intraplate fault will again rupture, and hence, produce a certain intensity of ground shaking at a site of interest. We are thus constrained to describing the occurrence of ground shaking due to intraplate earthquakes as a Poisson type process, in which case the occurrence of JMA intensity ~V ground shaking is appropriately described with the exponential probability density function g( t) = we-wt where w is the inverse of the predicted average shaking interval Ts v. Maps showing the probability that intraplate earthquakes will cause JMA intensity ~V shaking during 20-, 50-, 100-, and 200-yr periods are provided in Figure 7. It should be emphasized that the values of probability in Figure 7 are not a function of the time of the last occurrence of seismic shaking and thus contain no true predictive value. The maps in Figure 7, as ought to be expected, show patterns similar to the map of Ts in Figure 6a. The regions in Figure 6a with the shortest Ts v show the highest probability for future seismic shakings and the probabilities increase as longer time periods are sampled.
Interplate earthquakes. An estimate of long-term seismic hazard in Japan is incomplete unless the contribution of hazard due to interplate earthquakes is also considered. A number of investigations have shown that plate boundaries generally break along specific segments and that rupture of the segments occurs cyclically (e.g., Kelleher, 1970, 1972; Ando, 1975; Sykes and Quittmeyer, 1981). Relative rates of plate convergence along the Japanese plate boundaries are high, ranging from about 3 to 10 em/yr. Consequently, the repeat time of large events along given segments of plate boundary are lower (many lOs to lOOs of years) than along intraplate faults (many lOOs to 1000s of years), where maximum slip rates are on
INTEGRATION OF DATA FOR SEISMIC HAZARD ANALYSIS 697
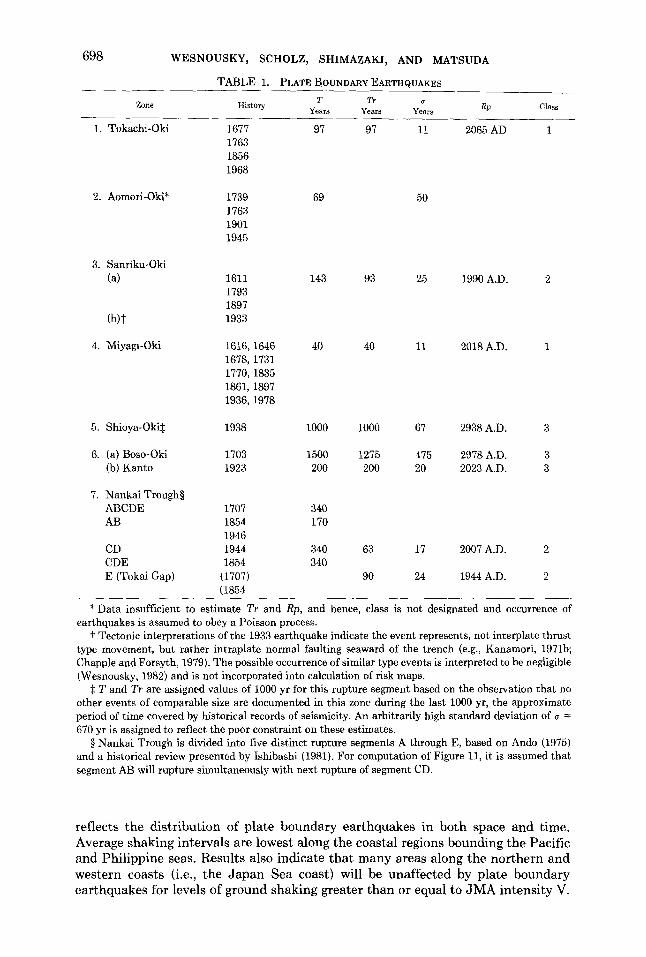
the order of millimeters per year. Thus, unlike intraplate faults, the historical record for Japan is generally sufficient to estimate the average repeat times T of rupture along major segments of the plate boundaries. Both the expected severity and extent of seismic shaking resulting from plate boundary events may further be identified with published isoseismal maps of historical earthquakes. The average shaking interval Ts due to interplate events can thus also be defined with equation (3). A map showing Ts v due to interplate earthquakes is shown in Figure 6b.
PROBABILITY
I .9-1.00 .8- .89 .5- .79
i'l* . I- .49 gg .01-.09 D <.ol
INTRAPLATE
d) 200yr
FIG. 7. Probability that intraplate earthquakes will cause ground shaking of JMA intensity ?;.V during (a) 20-, (b) 50-, (c) 100-, and (d) 200-yr periods of time.
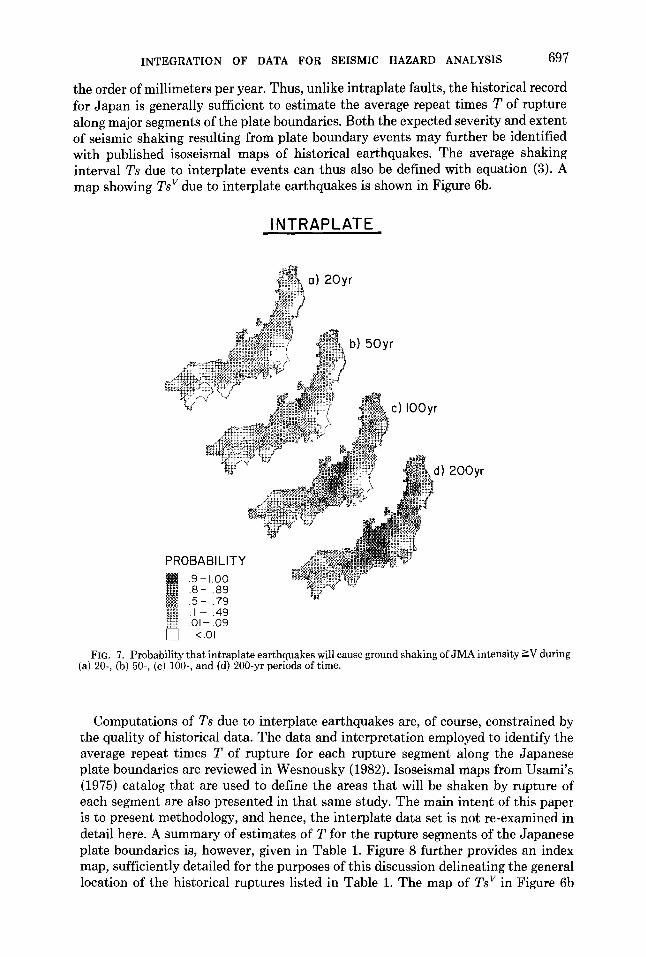
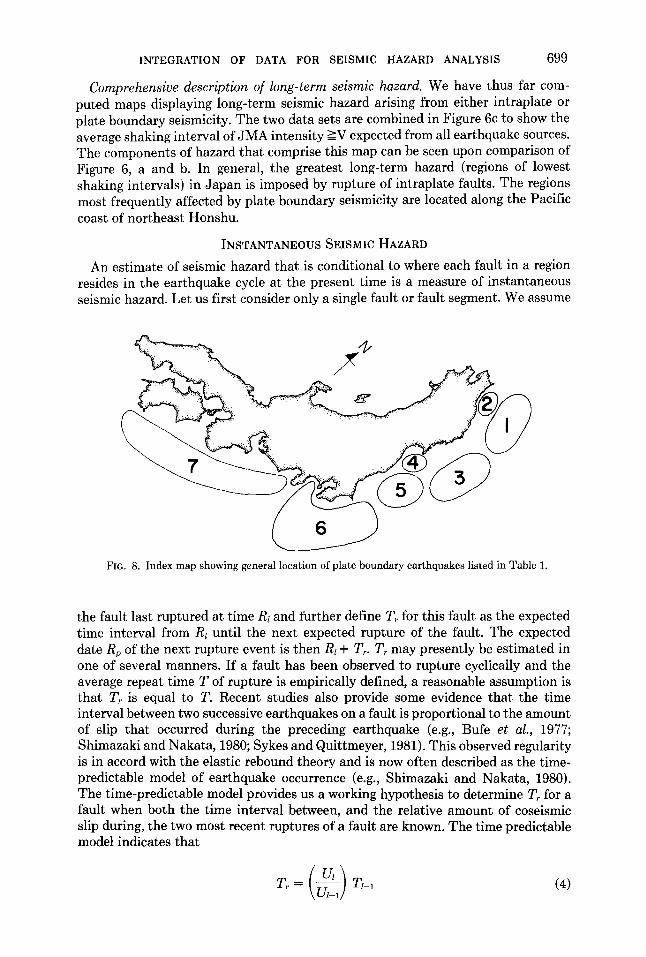
Computations of Ts due to interplate earthquakes are, of course, constrained by the quality of historical data. The data and interpretation employed to identify the average repeat times T of rupture for each rupture segment along the Japanese plate boundaries are reviewed in Wesnousky (1982). Isoseismal maps from Usami's (1975) catalog that are used to define the areas that will be shaken by rupture of each segment are also presented in that same study. The main intent of this paper is to present methodology, and hence, the interplate data set is not re-examined in detail here. A summary of estimates ofT for the rupture segments of the Japanese plate boundaries is, however, given in Table 1. Figure 8 further provides an index map, sufficiently detailed for the purposes of this discussion delineating the general location of the historical ruptures listed in Table 1. The map of Ts v in Figure 6b
698 WESNOUSKY, SCHOLZ, SHIMAZAKI, AND MATSUDA
TABLE 1. PLATE BOUNDARY EARTHQUAKES
Zone
1. Tokachi-Oki
2. Aomori-Oki*
3. Sanriku-Oki (a)
(b)t
4. Miyagi-Oki
5. Shioya-Okit
6. (a) Boso-Oki (b) Kanto
7. Nankai Trough§ ABCDE AB
CD CDE E (Tokai Gap)
History
1677 1763 1856 1968
1739 1763 1901 1945
1611 1793 1897 1933
1616, 1646 1678, 1731 1770,1835 1861, 1897 1936, 1978
1938
1703 1923
1707 1854 1946 1944 1854
(1707) (1854
T Years
97
69
143
40
1000
1500 200
340 170
340 340
Tr Years
97
93
40
1000
1275 200
63
90
Years
11
50
25
11
67
475 20
17
24
Rp
2065 AD
1990 A.D.
2018A.D.
2938 A.D.
2978A.D. 2023 A.D.
2007 A.D.
1944 A.D.
Class
1
2
1
3
3 3
2
2
* Data insufficient to estimate Tr and Rp, and hence, class is not designated and occurrence of earthquakes is assumed to obey a Poisson process.
t Tectonic interpretations of the 1933 earthquake indicate the event represents, not interplate thrust type movement, but rather intraplate normal faulting seaward of the trench (e.g., Kanamori, 1971b; Chapple and Forsyth, 1979). The possible occurrence of similar type events is interpreted to be negligible (Wesnousky, 1982) and is not incorporated into calculation of risk maps.
t T and Tr are assigned values of 1000 yr for this rupture segment based on the observation that no other events of comparable size are documented in this zone during the last 1000 yr, the approximate period of time covered by historical records of seismicity. An arbitrarily high standard deviation of <J = 670 yr is assigned to reflect the poor constraint on these estimates.
§ Nankai Trough is divided into five distinct rupture segments A through E, based on Ando (1975) and a historical review presented by Ishibashi (1981). For computation of Figure 11, it is assumed that segment AB will rupture simultaneously with next rupture of segment CD.
reflects the distribution of plate boundary earthquakes in both space and time. Average shaking intervals are lowest along the coastal regions bounding the Pacific and Philippine seas. Results also indicate that many areas along the northern and western coasts (i.e., the Japan Sea coast) will be unaffected by plate boundary earthquakes for levels of ground shaking greater than or equal to JMA intensity V.
INTEGRATION OF DATA FOR SEISMIC HAZARD ANALYSIS 699
Comprehensive description of long-term seismic hazard. We have thus far computed maps displaying long-term seismic hazard arising from either intraplate or plate boundary seismicity. The two data sets are combined in Figure 6c to show the average shaking interval of JMA intensity ?;.V expected from all earthquake sources. The components of hazard that comprise this map can be seen upon comparison of Figure 6, a and b. In general, the greatest long-term hazard (regions of lowest shaking intervals) in Japan is imposed by rupture of intraplate faults. The regions most frequently affected by plate boundary seismicity are located along the Pacific coast of northeast Honshu.
INSTANTANEOUS SEISMIC HAZARD
An estimate of seismic hazard that is conditional to where each fault in a region resides in the earthquake cycle at the present time is a measure of instantaneous seismic hazard. Let us first consider only a single fault or fault segment. We assume
FIG. 8. Index map showing general location of plate boundary earthquakes listed in Table 1.
the fault last ruptured at time Rt and further define Tr for this fault as the expected time interval from R1 until the next expected rupture of the fault. The expected date Rp of the next rupture event is then Rt + Tr. Tr may presently be estimated in one of several manners. If a fault has been observed to rupture cyclically and the average repeat time T of rupture is empirically defined, a reasonable assumption is that Tr is equal to T. Recent studies also provide some evidence that the time interval between two successive earthquakes on a fault is proportional to the amount of slip that occurred during the preceding earthquake (e.g., Bufe et al., 1977; Shimazaki and Nakata, 1980; Sykes and Quittmeyer, 1981). This observed regularity is in accord with the elastic rebound theory and is now often described as the timepredictable model of earthquake occurrence (e.g., Shimazaki and Nakata, 1980). The time-predictable model provides us a working hypothesis to determine Tr for a fault when both the time interval between, and the relative amount of coseismic slip during, the two most recent ruptures of a fault are known. The time predictable model indicates that
(4)
700 WESNOUSKY, SCHOLZ,. SHIMAZAKI, AND MATSUDA
where Tz-1 is the repeat time between the two most recent events and U1 and U1_ 1
are the coseismic slip during the most recent and preceding ruptures, respectively. Similarly, if the date and coseismic slip are only known for the most recent earthquake, an estimate of Tr may be obtained if an independent measure of the rate of strain accumulation on the fault is available. For such a case, Tr may be estimated to equal the amount of time necessary to accumulate strain equal to that released in the previous earthquake (e.g., Scholz and Kato, 1978; Sykes and Quittmeyer, 1981). In practice, estimates of Tr, and hence RP computed with the above methods are associated with some uncertainty and will not be precise. If concerned with hazard from a single fault, the uncertainty may aptly be expressed by a simple error bar. To assess the instantaneous seismic hazard due to number of faults, it is of greater practical benefit to represent confidence in predictions of Tr in terms of a probability function.
Few data exist to quantify the distribution of errors that accompany estimates of Tn and hence, RP computed with the time-predictable model. It is difficult, for example, to characterize the errors brought about by uncertainties in estimates of coseismic slip during past earthquakes, particularly when coseismic slip is calculated with historical, preinstrumental data. For the purposes of this paper, we simply assume that estimates of Tr will distribute normally about the actual observed recurrence time, when Tr is determined with either the time-predictable model or knowledge of the average repeat time between ruptures of a particular fault or fault segment. Estimates of Tn and hence, RP are thus assumed to be adequately described with a normal probability density function, specifically
( )
2
1 1 t-Rp
n(t) = -- e 2 u (J./2; . (5)
The standard deviation u is a measure of the confidence given to predicted values of RP. Briefly deferring discussion of how we may compute u, efforts are presently directed at demonstrating how, with equation (5), the time-dependent behavior of fault rupture can be incorporated into an analysis and expression of instantaneous seismic hazard.
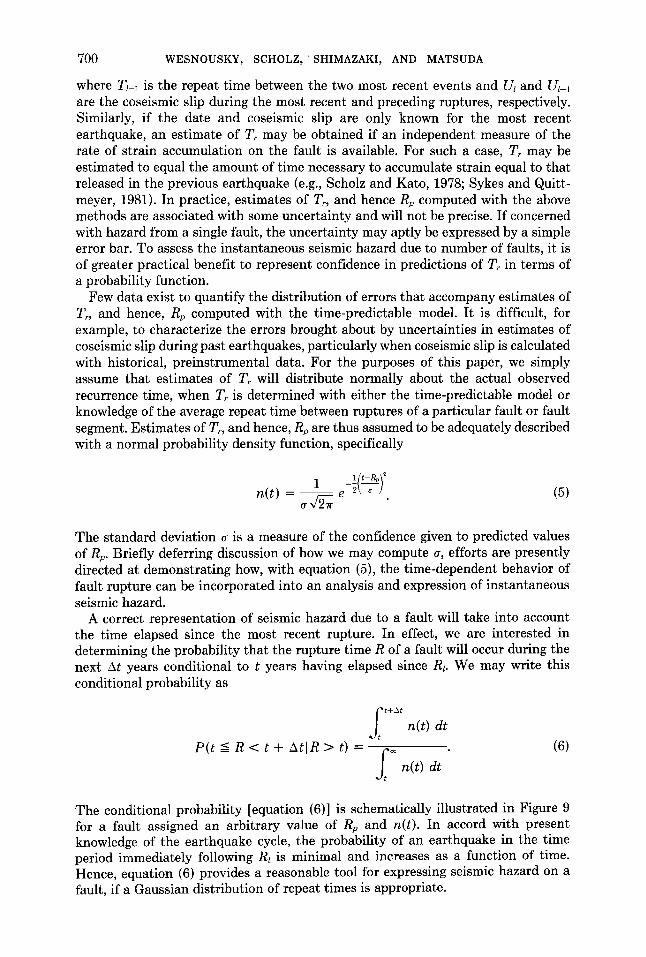
A correct representation of seismic hazard due to a fault will take into account the time elapsed since the most recent rupture. In effect, we are interested in determining the probability that the rupture time R of a fault will occur during the next M years conditional to t years having elapsed since Rt. We may write this conditional probability as
It+..'.t
n(t) dt
(6) P(t ~ R < t + MIR > t) = Joo n(t) dt
t
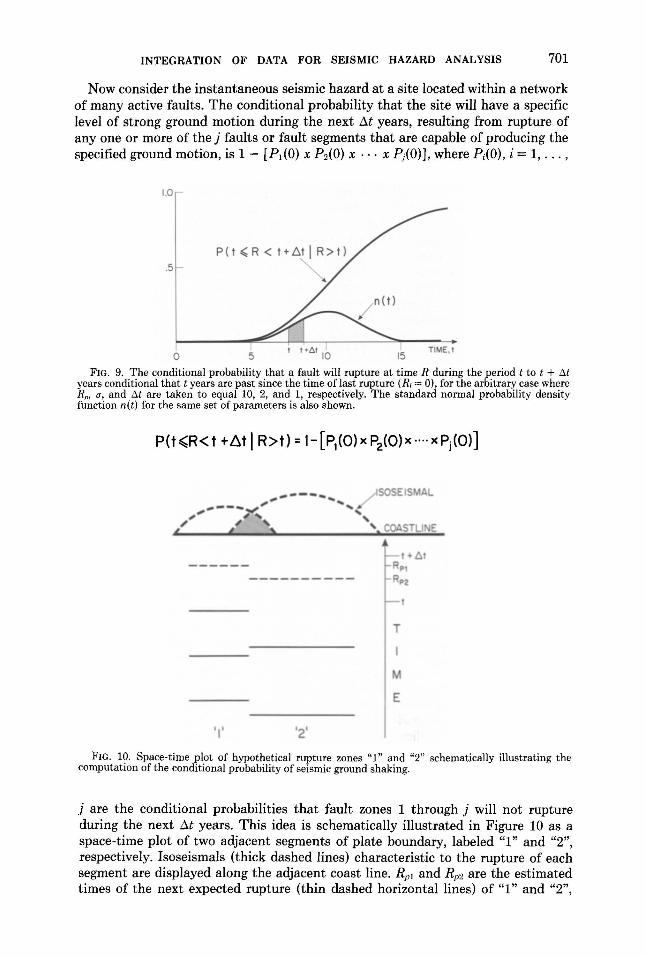
The conditional probability [equation (6)] is schematically illustrated in Figure 9 for a fault assigned an arbitrary value of RP and n(t). In accord with present knowledge of the earthquake cycle, the probability of an earthquake in the time period immediately following R1 is minimal and increases as a function of time. Hence, equation (6) provides a reasonable tool for expressing seismic hazard on a fault, if a Gaussian distribution of repeat times is appropriate.
INTEGRATION OF DATA FOR SEISMIC HAZARD ANALYSIS 701
Now consider the instantaneous seismic hazard at a site located within a network of many active faults. The conditional probability that the site will have a specific level of strong ground motion during the next !lt years, resulting from rupture of any one or more of the j faults or fault segments that are capable of producing the specified ground motion, is 1 - [P1 (0) x P2(0) x · · · x Pj(O)], where Pi(O), i = 1, ... ,
1.0
p ( t ~ R < t + ll.t I R > t) .5
0 5 15 TIME. I
FIG. 9. The conditional probability that a fault will rupture at time R during the period t to t + !:J.t years conditional that t years are past since the time oflast rupture (Rt = 0), for the arbitrary case where Rp, a, and !:J.t are taken to equal 10, 2, and 1, respectively. The standard normal probability density function n(t) for the same set of parameters is also shown.
,..---... SOSEIS AL ... ... ... -----~*' ' ,... , ... ,
,~ t' ) '. COAS E
•
.,. '2'
T
M
E
FIG. 10. Space-time plot of hypothetical rupture zones "1" and "2" schematically illustrating the computation of the conditional probability of seismic ground shaking.
j are the conditional probabilities that fault zones 1 through j will not rupture during the next !lt years. This idea is schematically illustrated in Figure 10 as a space-time plot of two adjacent segments of plate boundary, labeled "1" and "2", respectively. Isoseismals (thick dashed lines) characteristic to the rupture of each segment are displayed along the adjacent coast line. Rp1 and Rp2 are the estimated times of the next expected rupture (thin dashed horizontal lines) of "1" and "2",
702 WESNOUSKY, SCHOLZ, SHIMAZAKI, AND MATSUDA
respectively. P1(0) and P2(0) are the conditional probabilities that the rupture segments will not break during the period t to t + At, respectively. The figure illustrates that seismic hazard at a site will be a function of the time since past ruptures as well as the spatial distribution of faults. Hence, in Figure 10, the instantaneous seismic hazard will always be greater in that area (shaded) which is affected by ruptures of both "1" and "2" than those areas which are shaken by rupture of either "1" or "2", but not both. The repeat time of ruptures along individual intraplate faults in Japan are as a rule greater than the length of the existing historical record. An evaluation of the instantaneous seismic hazard due to intraplate faults in Japan is thus not presently possible. The repeat times of large Japanese interplate earthquakes are, in contrast, characteristically shorter than found for intraplate faults. As a result, sufficient data do exist to constrain both the time and size of past interplate ruptures as well as to estimate the time until the next rupture of each segment (e.g., Wesnousky, 1982). The historical record of plate boundary earthquakes in Japan thus provides us the opportunity to demonstrate the computation of instantaneous seismic hazard.
The history of ruptures along the plate boundaries of Japan is summarized in Wesnousky (1982). The data have been used to identify those segments of plate boundary that have ruptured and further estimate RP and u for each of the respective segments (Wesnousky, 1982). The results of the analysis are summarized in Table 1 in conjunction with Figure 8. The data available to estimate RP vary greatly from one rupture zone to another. The accuracy to which RP, and hence, u can be estimated is strongly dependent on the type, quality, and quantity of data available. Based on such factors, we assign each rupture zone along the Japanese plate boundaries to one of three broad classes. Accordingly, a slightly different approach is used to estimate rJ in each class of rupture zone. A rupture zone is designated as class 1 when the historical record shows evidence of four or more earthquakes that have occurred at regularly spaced intervals of time. The standard deviation rJ for class 1 is taken to equal the standard deviation of the observed repeat times. Class 2 indicates that data are available to determine the date of the last two or more earthquakes as well as to estimate the relative amount of coseismic slip that occurred in the two most recent events. Data are thus sufficient to use the time predictable model to estimate RP but insufficient to warrant assessment of u from data within the zone itself. As a result, rJ for class 2 zones is based on the data set of Sykes and Quittmeyer (1981). Sykes and Quittmeyer (1981) examined the plate boundaries of the world and found five sites where three or more events are known to have occurred sequentially along the same segment of plate boundary. For each location, they used the time-predictable model and information of the relative slip during the earliest two events to predict the time interval between the two most recent events. Their results provide a crude check on the range of errors that can be expected when using the time predictable model. The ratios of their predicted repeat times to the observed intervals range from about 0.8 to 1.5, with a standard deviation of 0.27. The standard deviation rJ for estimates of RP in class 2 zones for Japan are assumed to equal 0.27 times the predicted time interval Tr between R1 and RP. Class 3 zones are those where data are available to document only the date, R1, and approximate coseismic slip u of the most recent damaging earthquake, and the longterm average seismic slip rate u or, analogously, a measurement of the interseismic rate of strain accumulation, on the fault. The recurrence time Tr between R1 and RP is thus determined with the relation Tr = uju. To estimates of RP made in this
INTEGRATION OF DATA FOR SEISMIC HAZARD ANALYSIS 703
manner, a is assigned on the basis of the quality of data used to define u and u (Wesnousky, 1982).
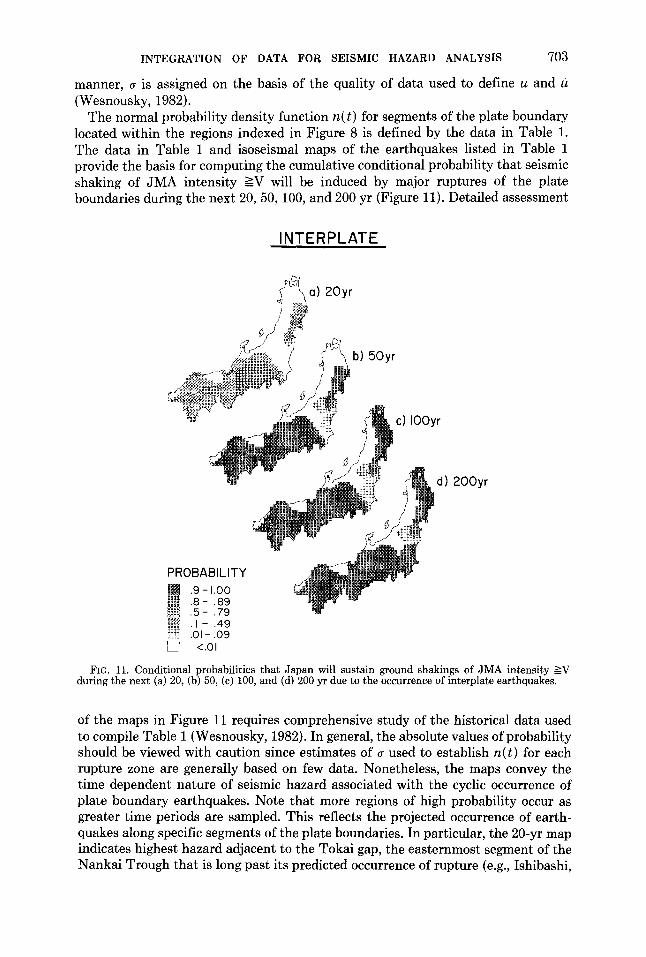
The normal probability density function n( t) for segments of the plate boundary located within the regions indexed in Figure 8 is defined by the data in Table 1. The data in Table 1 and isoseismal maps of the earthquakes listed in Table 1 provide the basis for computing the cumulative conditional probability that seismic shaking of JMA intensity ?;.V will be induced by major ruptures of the plate boundaries during the next 20, 50, 100, and 200 yr (Figure 11). Detailed assessment
PROBABILITY
"'' ~~~ !i~f 0
.9-1.00
.8- .89
.5- .79
.I- .49
.01-.09 <.01
INTERPLATE
d) 200yr
FIG. 11. Conditional probabilities that Japan will sustain ground shakings of JMA intensity ~V during the next (a) 20, (b) 50, (c) 100, and (d) 200 yr due to the occurrence of interplate earthquakes.
of the maps in Figure 11 requires comprehensive study of the historical data used to compile Table 1 (Wesnousky, 1982). In general, the absolute values of probability should be viewed with caution since estimates of a used to establish n( t) for each rupture zone are generally based on few data. Nonetheless, the maps convey the time dependent nature of seismic hazard associated with the cyclic occurrence of plate boundary earthquakes. Note that more regions of high probability occur as greater time periods are sampled. This reflects the projected occurrence of earthquakes along specific segments of the plate boundaries. In particular, the 20-yr map indicates highest hazard adjacent to the Tokai gap, the easternmost segment of the Nankai Trough that is long past its predicted occurrence of rupture (e.g., Ishibashi,
704 WESNOUSKY, SCHOLZ, SHIMAZAKI, AND MATSUDA
1981). Figure llb reflects data that suggest the Nankai Trough and portions of the Japan Trench adjacent to the east coast on northeast Honshu will experience major ruptures during the next 50 yr. The 100-yr map projects the occurrence of a major Tokachi-oki rupture (northeast Honshu), and similarly, the 200-yr map the probable occurrence of a major earthquake along the Sagami Trough.
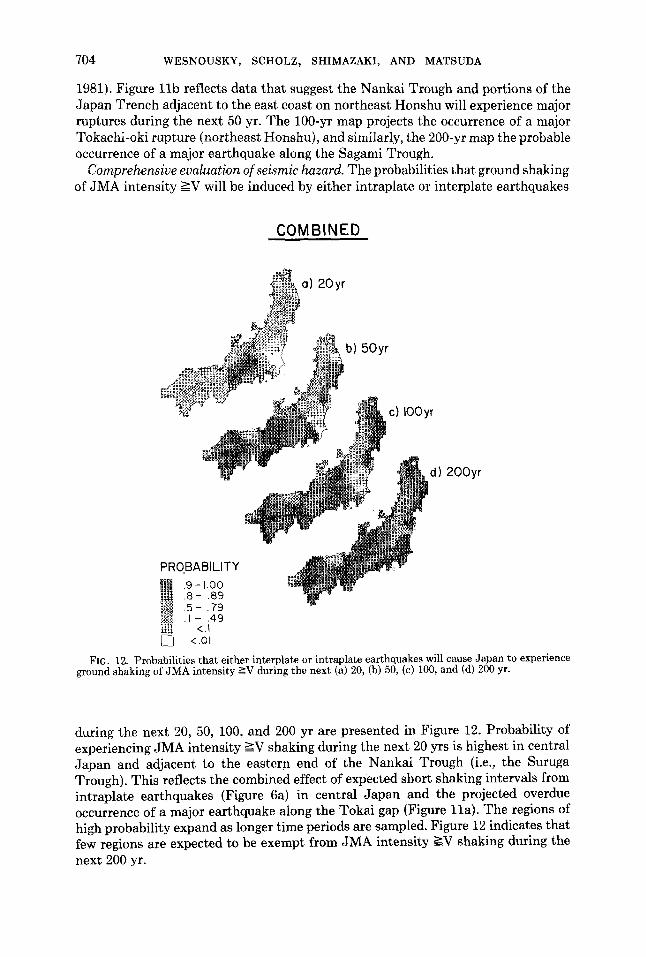
Comprehensive evaluation of seismic hazard. The probabilities that ground shaking of JMA intensity ~V will be induced by either intraplate or interplate earthquakes
COMBINED
d) 200yr
FIG. 12. Probabilities that either interplate or intraplate earthquakes will cause Japan to experience ground shaking of JMA intensity ~V during the next (a) 20, (b) 50, (c) 100, and (d) 200 yr.
during the next 20, 50, 100, and 200 yr are presented in Figure 12. Probability of experiencing JMA intensity ~V shaking during the next 20 yrs is highest in central Japan and adjacent to the eastern end of the Nankai Trough (i.e., the Suruga Trough). This reflects the combined effect of expected short shaking intervals from intraplate earthquakes (Figure 6a) in central Japan and the projected overdue occurrence of a major earthquake along the Tokai gap (Figure lla). The regions of high probability expand as longer time periods are sampled. Figure 12 indicates that few regions are expected to be exempt from JMA intensity ?;V shaking during the next 200 yr.
INTEGRATION OF DATA FOR SEISMIC HAZARD ANALYSIS 705
DISCUSSION AND CONCLUSIONS
Estimates of seismic hazard are generally based on regional magnitude frequency statistics obtained from data listed in earthquake catalogs. In such analyses, probabilistic estimates of future strong ground motions are based primarily on the regional b value and an estimate of the maximum expected earthquake (e.g., Kawasumi, 1951; Cornell, 1968; Algermissen and Perkins, 1976; Ozaki et al., 1978; Kitagawa and Ozaki, 1979; Algermissen et al., 1982). Hazard analyses performed in this manner are generally limited by both the quality and length of the historical record. Error in estimates of long-term seismicity, and hence, seismic hazard are probable when based on too short a historical record. Active faults, in contrast, record long-term averages of the rate of slip that takes place during earthquakes. The results described in this work and Wesnousky et al. (1982, 1983) support the hypothesis that a complete knowledge of the geologic record of fault offsets in a region is sufficient to predict both the spatial as well as the size distribution of earthquakes. This result may be particularly useful for the analysis of seismic hazard in other areas of active faulting, such as the Western United States, where historical records of seismicity are relatively short or absent. The map displaying the average expected recurrence time between seismic shakings of JMA intensity ~V in Japan illustrates how quantitative estimates of long-term average seismic hazard may be based primarily on data describing the average slip rates of Quaternary faults in a region, rather than the historical record of seismicity.
Sufficient data now exist to leave little doubt that the potential for a major earthquake on a fault is far less immediately after a major earthquake (excluding aftershocks and rare cases of multiple main shocks) than it is after a long hiatus (e.g., McCann et al., 1979). Recent observations also suggest that the length of the quiescent period between major shocks on a fault can be forecast within certain bounds with the time-predictable model when adequate data exist to describe the time and coseismic slip of past ruptures (Shimazaki and Nakata, 1980; Sykes and Quittmeyer, 1981). These concepts have been incorporated into a methodology to assess the regional seismic hazard in Japan due to plate boundary earthquakes. The technique conveys seismic hazard as a time-dependent function with respect to the recent history of earthquakes along the adjacent plate boundaries. This contrasts to conventional methods of hazard analysis whereby the occurrence of earthquakes is described as a Poisson process. A similar description of the seismic hazard from intraplate earthquakes in Japan is not presently possible because the repeat times of intraplate faults in Japan are generally on the order of thousands of years or more. The historical record is consequently too short to document the occurrence time of the last earthquake on each fault. Recent efforts, however, have shown that trenching across active faults, (e.g., Clark et al., 1972; Sieh, 1978; Matsuda et al., 1981) can constrain the date of prehistoric intraplate earthquakes. Such work gives hope that geologic data may eventually allow us to constrain not only the average repeat time but also the date of the last major earthquake on a majority of large intraplate faults in Japan, as well as in other regions of the world. This would ideally furnish sufficient information to formulate the hazard from intraplate faults in time-dependent terms in a manner similar to that used for plate boundary seismicity. Until such data exist, however, we are constrained to describing the occurrence of ground shaking produced by intraplate earthquakes as a stochastic process.
706 WESNOUSKY, SCHOLZ, SHIMAZAKI, AND MATSUDA
ACKNOWLEDGMENTS
David W. Simpson and C. Barry Raleigh provided critical reviews of the manuscript. Discussions with Tom Hanks are also gratefully acknowledged. The research was supported by National Science Foundation Grants CME 80 22096 and CEE 82 06853.
REFERENCES
Aki, K. and P. G. Richards (1980). Quantitative Seismology: Theory and Methods, W. H. Freeman, San Francisco, California.
Algermissen, S. T. and D. M. Perkins (1976). A probabilistic estimate of maximum acceleration in rock in the contiguous United States, U.S. Geol. Surv., Open-File Rept. 76-416, 45 pp.
Algermissen, S. T., D. M. Perkins, P. C. Thenhaus, S. L. Hanson, and B. L. Bender (1982). Probabilistic estimates of maximum acceleration and velocity in rock in the contiguous United States, U.S. Geol. Surv., Open-File Rept. 82cl033, 99 pp.
Allen, C. R. (1968). The tectonic environment of seismically active and inactive areas along the San Andreas fault system, Proc. Conference on Geologic Problems of San Andreas Fault System, Stanford University Press, Stanford, California, 70-82. -
Allen, C. R. (1975). Geological criteria for evaluating seismicity, Bull. Geol. Soc. Am. 86, 1041-1057. Anderson, J. G. (1979). Estimating the Seismicity from Geological Structure for seismic-risk studies,
Bull Seism. Soc. Am. 69, 135-158. Ando, M. (1974). Seismotectonics of the 1923 Kanto earthquake, J. Phys. Earth 22,263-277. Ando, M. (1975). Source mechanisms and tectonic significance of historical earthquakes along the
Nankai trough, Japan, Tectonophysics 27, 119-140. Andrews, D. J. (1980). A stochastic fault model, 1. Static case, J. Geophys. Res. 85, 3867-3877. Brune, J. N. (1968). Seismic moment, seismicity, and rate of slip along major fault zones, J. Geophys.
Res. 73, 777-784. Bufe, C. G., P. W. Harsh, and R. 0. Burford (1977). Steady-state seismic slip-a precise recurrence model,
Geophys. Res. Letters 4, 91-94. Chapple, W. M. and D. W. Forsyth (1979). Earthquakes and bending of plates at trenches, J. Geophys.
Res. 84, 6729-7849. Clark, M. M., A. Grantz, and M. Rubin (1972). Holocene activity of the Coyote Creek fault as recorded
in sediments of Lake Cahuilla, The Borrego Mountain Earthquake of April 9, 1968, U.S. Geol. Surv. Profess. Paper 787, 190-207.
Cornell, C. A. (1968). Engineering seismic risk analysis, Bull. Seism. Soc. Am. 58, 1583-1606. Davies, G. F. and J. N. Brune (1971). Regional and global fault rates from seismicity, Nature Phys. Sci.
229, 101-107. Doser, D. I. and R. B. Smith (1982). Seismic moment rates in the Utah Region, Bull. Seism. Soc. Am.
72, 525-552. Fitch, T. J. and C. H. Scholz (1971). Mechanisms of underthrusting in southwest Japan: A model of
convergent plate interactions, J. Geophys. Res. 76, 7260-7292. Gutenberg, B. and C. F. Richter (1944). Frequency of earthquakes in California, Bull. Seism. Soc. Am.
34, 185-188. Hanks, T. (1976). Observations and estimation of long-period strong ground motion in Los Angeles
Basin, Earthquake Eng. Struct. Dyn. 4, 473-488. Hanks, T. (1979). b values and w-' seismic source models: implications for tectonic stress variations
along active crustal fault zones and the estimation of high-frequency strong ground motion, J. Geophys. Res. 84, 2235-2242.
Hanks, T. and H. Kanamori (1979). A moment magnitude scale, J. Geophys. Res. 84, 2348-2350. Imamura, A. (1930). Topographic changes accompanying earthquakes or volcanic eruptions, Earthquake
Invest. Comm. Foreign Languages, Tokyo, Publ. 25, 1-143. Ishibashi, K. (1981). Specification of a soon to occur seismic faulting in the Tokai District, Central
Japan, based upon seismotectonics, in Earthquake Prediction: An International Review, series 4, D. W. Simpson and P. G. Richards, Editors, Am. Geophys. Union, Washington, D.C., 297-332.
Ishimoto, M. and K. Iida (1939). Observations sur les seisms enregistre par le microseismograph construite dernierment (I), (in French with Japanese summary), Bull. Earthquake Res. Inst., Tokyo Uniu. 17, 443-4 78.
Japan Meteorological Agency (1958). Catalogue of major earthquakes which occurred in and near Japan (1926-1956), Seism. Bull., Suppl. 1, 1-91, Tokyo, Japan.
Japan Meteorological Agency (1966). Catalogue of major earthquakes in and near Japan (1957-1962), Seism. Bull., Suppl. 2, 1-49, Tokyo, Japan.
INTEGRATION OF DATA FOR SEISMIC HAZARD ANALYSIS 707
Japan Meteorological Agency (1968). Catalogue of major earthquakes in and near Japan (1963-1967), Seism. Bull., Suppl. 3, 1-62, Tokyo, Japan.
Kanamori, H. (1971a). Focal mechanics of the Tokachi-Oki earthquake of May 16, 1968: contortion of the lithosphere at a junction of two trenches, Tectonophysics 12, 1-13.
Kanamori, H. (1971b). Seismological evidence for a lithospheric normal faulting-The Sanriku earthquake of 1933, Phys. Earth Planet. Interiors 4, 289-300.
Kanamori, H. (1972). Tectonic implications of the 1944 Tonankai and the 1946 Nankaido earthquakes, Phys. Earth Planet. Interiors 5, 129-139.
Kanamori, H. (1973). Mode of strain release associated with major earthquakes in Japan, Ann. Rev. Earth Planet. Sci. 1, 213-239.
Kanamori, H. (1979). A semi-empirical approach to prediction of long period ground motions from great earthquakes, Bull Seism. Soc. Am. 69, 1645-1670.
Kawasumi, H. (1951). Measures of earthquake danger and expectancy of maximum intensity throughout Japan as inferred from the seismic activity in historical times, Bull. Earthquake Res. Inst., Tokyo Univ. 29, 469-482.
Kelleher, J. A. (1970). Space-time seismicity of the Alaska-Aleutian seismic zone, J. Geophys. Res. 75, 5745.
Kelleher, J. A. (1972). Rupture zones of large South American earthquakes and some predictions, J. Geophys. Res. 77, 2087-2103.
Kitagawa, Y. and M. Ozaki (1979). Study of the regional characteristics of earthquake motions in Japan (Part 2), Trans. Archit. Inst. Jpn. 277, 33-43.
Matsuda, T. (1977). Estimation of future destructive earthquakes from active faults on land in Japan, J. Phys. Earth, Suppl. 25 795-855.
Matsuda, T., S. Kaizuka, Y. Ota, T. Imaizuma, Y. Ikeda, S. Hirano, and M. Togo (1981). Preliminary report on the trench across the Tanna fault, Izu, Japan (in Japanese), Chiri Tokyo 26(6), 122-129.
McCann, W. R., S. P. Nishenko, L. R. Sykes, and J. Krause (1979). Seismic gaps and plate tectonics; seismic potential for major boundaries, Pageoph 117, 149-207.
Nur, A. (1978). Nonuniform friction as a physical basis for earthquake mechanics, Pageoph 116, 1-26. Purcaru, G. and H. Berckhemer (1978). A magnitude scale for very large earthquakes, Tectonophysics
49, 189-198. Oike, K. (1975). On a list of hypocenters compiled by the Tottori Microearthquake Observatory (in
Japanese with English abstract), J. Seism. Soc. Jpn. 28, 331-346. Ozaki, M., Y. Kitagawa, and S. Hattori (1978). Study on the regional characteristics of earthquake
motions in Japan (part 1), Trans. Archit. Inst. Jpn. 266, 31-40. Reid, H. F. (1910). The California earthquake of April 18, 1906, The mechanics of the earthquake;
Report 2, State Earthquake Invest. Comm., Carnegie Institute, Washington, D.C., 192 pp. Research Group for Active Faults of Japan (1980a). Active faults in Japan, sheet maps and inventories
(in Japanese), University of Tokyo Press, Tokyo, Japan, 363 pp. Research Group for Active Faults of Japan (1980b). Active faults in and around Japan: the distribution
and the degree of activity, J. Nat. Disaster Sci. 2(2), 61-99. Research Group for Quaternary Tectonic Map (March, 1977). Explanatory text of the Quaternary
tectonic map of Japan, National Research Center for Disaster Prevention, Science and Technology Agency. Tokyo, Japafi; 167 pp.
Scholz, C. H. (1972). Crustal movements in tectonic areas, in Forerunners of Strong Earthquakes, Tectonophysics, E. F. Savarensky and T. Rikitake, Editors, Elsevier Publishing Co., Amsterdam, 201-217.
Scholz, C. H. and T. Kato (1978). The behavior of a convergent plate boundary: Crustal deformation in the South Kanto District, Japan, J. Geophys. Res. 83, 783-797.
Shimazaki, K. (1974). Nemuro-Oki earthquake of June 17 1973: a lithospheric rabound at the upper half of the interface, Phys. Earth. Planet. Interiors 9, 314-327.
Shimazaki, K. and T. Nakata (1980). Time-predictable recurrence model for large earthquakes, Geophys. Res. Letters 7, 279-282.
Sieh, K. E. (1978). Prehistoric large earthquakes produced by slip on the San Andreas fault at Pallett Creek, California, J. Geophys. Res. 83, 3907-3939.
Sugimura, A. (1967). Uniform rates and duration period of Quaternary earth movements in Japan, J. Geosci. Osaka City Univ. 10, 1-4.
Sykes, L. R. and R. C. Quittmeyer (1981). Repeat times of great earthquakes along simple plate boundaries, in Earthquake Prediction: An International Review, Maurice Ewing Series, 4, D. W. Simpson and P. G. Richards, Editors, Am. Geophys. Union, Washington, D.C., 297-332.
Takagi, A., A. Hasegawa, and N. Umino (1977). Seismic activity in the northeastern Japan arc, J. Phys. Earth 25, 595.
708 WESNOUSKY, SCHOLZ, SHIMAZAKI, AND MATSUDA
Thatcher, W. and T. C. Hanks (1973). Hanks source parameters of southern California earthquakes, J. Geophys. Res. 78, 8547-8546.
Trifunac, M. D., and A. G. Brady (1975). On the correlation of seismic intensity scales with the peaks of recorded strong ground motion, Bull. Seism. Soc. Am. 65, 139-162.
Usami, T. (1975). Descriptive Catalogue of Disaster Earthquakes in Japan (in Japanese), University of Tokyo Press, Tokyo, Japan, 327 pp.
Utsu, T. (1971). Aftershocks and earthquake statistics (III), J. Fac. Sci., Hokkaido University Series VII (Geophysics), 3, 379-441.
Utsu, T. (1979). Seismicity of Japan from 1885 through 1925-A new catalogue of earthquakes of M < 6 felt in Japan and smaller earthquakes which caused damage in Japan (in Japanese with English abstract), Bull. Earthquake Res. Inst., Tokyo Univ. 54, 223-308.
von Seggern, D. (1980). A random stress model for seismicity statistics and earthquake prediction, Geophys. Res. Letters 7, 637-664.
Wallace, R. E. (1970). Earthquake recurrence intervals on the San Andreas Fault, Bull. Geol. Soc. Am. 81, 2875-2890.
Watanabe, K., N. Hirano, andY. Kishimoto (1978). Seismicity in the Hokuriku district (in Japanese with English abstract), J. Seism. Soc. Jpn. 31, 35-47.
Wesnousky, S. G. (1982). Crustal deformation and earthquake risk in Japan, Ph.D. Thesis, Columbia University, New York.
Wesnousky, S. G., C. H. Scholz, and K. Shimazaki (1982). Deformation of an island arc: rates of moment release and crustal shortening in intraplate Japan determined from seismicity and Quaternary fault data, J. Geophys. Res. 87, 6829-6852.
Wesnousky, S. G., C. H. Scholz, K. Shimazaki and T. Matsuda (1983). Earthquake frequency distribution and the mechanics of faulting, J. Geophys. Res. 88, 9331-9340.
LAMONT-DOHERTY GEOLOGICAL OBSERVATORY OF COLUMBIA UNIVERSITY
PALISADES, NEW YORK 10964 (S.G.W., C.H.S.) CONTRIBUTION No. 3536
DEPARTMENT OF GEOLOGICAL SCIENCES COLUMBIA UNIVERSITY NEW YORK, NEW YORK 10027 (S.G.W., C.H.S.)
Manuscript received 19 April 1983
EARTHQUAKE RESEARCH INSTITUTE UNIVERSITY OF TOKYO BUNKYO-KU, TOKYO, JAPAN (K.S., T.M.)