integrating unmanned aerial vehicle photogrammetry in ... · advances in unmanned aerial vehicles...
TRANSCRIPT

Integrating unmanned aerial vehicle photogrammetry in
design compliance audits and structural modelling of pit walls
F Medinac University of Toronto, Canada
K Esmaeili University of Toronto, Canada
Abstract
Existing field data collection methods for pit slope assessment are manual, time consuming, and can expose
technical manpower in hazardous conditions. Advances in unmanned aerial vehicles (UAVs) technology allows
collecting photogrammetry data of pit slopes. This aerial approach is fast, on demand and can improve the
spatial and temporal resolution of the collected data. The collected data can be used to generate digital
elevation models (DEMs) and point clouds to assess the bench face angle and catch benches. Furthermore,
virtual mapping can be used to collect detailed structural data.
This study presents the application of UAV technology to collect data at a pit wall, in Nevada, USA. A DEM is
generated to conduct a design compliance audit of the pit slope. The aerial photogrammetry data is used to
generate a point cloud of the slope for virtual structural mapping. The structural mapping data is integrated
with the surveyed pit slope geometry to generate a conditioned discrete fracture network (DFN) model. The
discontinuities mapped on the slope surface are replicated in the DFN model, while behind the wall, a
constrained stochastic model is used to describe the structural complexity of the rock mass. This combined
deterministic-stochastic DFN model is used to conduct a kinematic stability analysis of the pit slope. The
results are compared to the field observations of slope failure.
Keywords: UAVs, conditioned DFN, structural mapping, design compliance, open pit
1 Introduction
A fundamental aspect of mine design is the characterisation of rock masses encountered in the mine area by
collecting and analysing geotechnical data. This data is commonly used to design pit slopes in the preliminary
stages of mine design and to re-evaluate the slope stability as mining progresses during the operations. The
rock mass characterisation data can be further leveraged and used for other analyses, such as blast
optimisation or kinematic analysis. Accordingly, it is critical to ensure the collected geotechnical data is
accurate, well-documented, and sufficient to develop a knowledge of the rock mass (Hadjigeorgiou 2012).
Rocks are well known to be heterogeneous and discontinuous at multiple scales. Rock heterogeneity can be
perceived in different forms including material, structural and geometrical heterogeneity and at different
scales such as micro, meso and macro scale (Eivazy et al. 2017). In open pit mines with moderate to
competent rock mass, structural heterogeneity and anisotropy in meso (bench) and macro (multiple bench)
scales generally play a major role in pit slope stability.
Both manual and remote sensing methods can be used for collection of structural data. Conventional manual
mapping techniques such as line mapping or window mapping are well established for collecting data with
defined guidelines for systematic collection of the data (Brady & Brown 2004; Read & Stacey 2009). The
remote sensing approach is being gradually adopted by the mining industry, which is reflected in the
significant increase in research in this field (Derron & Jaboyedoff 2010). However, predominantly terrestrial
remote sensing techniques are used and relatively few published works have addressed the use of aerial
remote sensing methods using unmanned aerial vehicles (UAVs) and photogrammetry (Francioni et al. 2015).
There are some well-documented disadvantages and biases associated with conventional manual
techniques. These techniques require mine technical staff to be at the rock face to conduct the mapping,
Slope Stability 2020 - PM Dight (ed.)© Australian Centre for Geomechanics, Perth, ISBN 978-0-9876389-7-7
Slope Stability 2020 1439
https://papers.acg.uwa.edu.au/p/2025_99_Esmaeili/

limiting the data collection to areas that can be accessed. The collection process is manual and time
consuming. The exposure to hazards can lead technical staff to increase the speed of mapping to reduce the
health and safety risk, resulting in poor quality, inaccurate, or insufficient data being mapped. Collected
manual structural data are generally biased including: orientation, size, truncation and censoring bias, as well
as F-bias (the traces on the rock face provide a biased measure of the sizes of the discs that produced
the traces).
Remote sensing techniques offer advantages over the conventional data collection method: increased areal
coverage, access to unreachable areas, reduced cutoff and censoring bias, reduced field data collection time,
and improve safety (Read & Stacey 2009). However, several limitations remain with terrestrial remote
sensing techniques. These include vegetation or occlusions, multiple survey location requirements, and an
increased distance from the target wall which can affect the resolution of the results. Figure 1 shows a
schematic of some of the limitations encountered by the terrestrial manual and remote sensing methods.
Using UAVs can reduce the limitations of terrestrial-based remote sensing by eliminating the need for
multiple survey locations and further increasing the speed of data collection.
Figure 1 Schematic of some limitations encountered by manual and terrestrial mapping techniques
Another important aspect of slope performance assessment is the collection of design compliance data. It is
important to develop a slope monitoring program to ensure the design parameters are maintained. Having
a structured approach that monitors slope performance can improve the condition of the final walls (Catalan
& Onederra 2016). The catch bench widths and bench face angles are commonly monitored as part of these
programs. If back-break occurs, the capacity of catch benches is reduced, increasing costs and reducing
safety. Therefore, there is an economic and safety incentive to ensure the slope performance is as desired.
Conventional methods used for pit slope performance assessment are also relatively manual and time
consuming. They involve visual inspections and assessment of blast damage, which can be highly subjective.
Other methods include GPS surveying of the crests of benches; however, due to regulations on how close
personnel can walk to the edge, the crest location is often estimated. Slope angles can be measured using
clinometers and Brunton compasses. Terrestrial laser scanning (TLS) can be also used to assess the slope
performance and to generate precise digital elevation models for design compliance metrics, however, to
achieve a high precision and accuracy multiple survey points are required.
The use of UAVs for remote sensing may resolve some of the limitations discussed, and supplement manually
collected field data. This paper presents a case study of an open pit mine, investigating the integration of
UAV technology for geotechnical data acquisition and design compliance assessment. The UAV collected data
are used to extract geotechnical information that can be used as input to conduct geotechnical stability
analysis and assess the design compliance.
Integrating unmanned aerial vehicle photogrammetry in designcompliance audits and structural modelling of pit walls
F Medinac and K Esmaeili
1440 Slope Stability 2020
2 Methodology
2.1 Case study
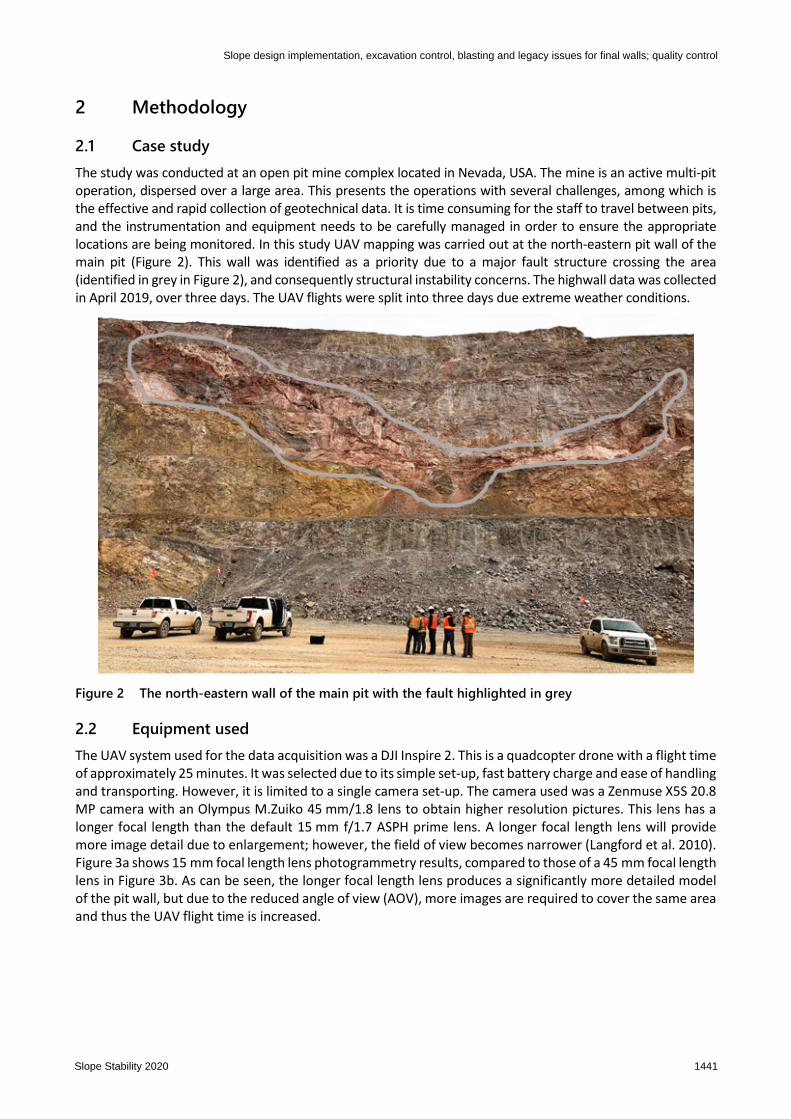
The study was conducted at an open pit mine complex located in Nevada, USA. The mine is an active multi-pit
operation, dispersed over a large area. This presents the operations with several challenges, among which is
the effective and rapid collection of geotechnical data. It is time consuming for the staff to travel between pits,
and the instrumentation and equipment needs to be carefully managed in order to ensure the appropriate
locations are being monitored. In this study UAV mapping was carried out at the north-eastern pit wall of the
main pit (Figure 2). This wall was identified as a priority due to a major fault structure crossing the area
(identified in grey in Figure 2), and consequently structural instability concerns. The highwall data was collected
in April 2019, over three days. The UAV flights were split into three days due extreme weather conditions.
Figure 2 The north-eastern wall of the main pit with the fault highlighted in grey
2.2 Equipment used
The UAV system used for the data acquisition was a DJI Inspire 2. This is a quadcopter drone with a flight time
of approximately 25 minutes. It was selected due to its simple set-up, fast battery charge and ease of handling
and transporting. However, it is limited to a single camera set-up. The camera used was a Zenmuse X5S 20.8
MP camera with an Olympus M.Zuiko 45 mm/1.8 lens to obtain higher resolution pictures. This lens has a
longer focal length than the default 15 mm f/1.7 ASPH prime lens. A longer focal length lens will provide
more image detail due to enlargement; however, the field of view becomes narrower (Langford et al. 2010).
Figure 3a shows 15 mm focal length lens photogrammetry results, compared to those of a 45 mm focal length
lens in Figure 3b. As can be seen, the longer focal length lens produces a significantly more detailed model
of the pit wall, but due to the reduced angle of view (AOV), more images are required to cover the same area
and thus the UAV flight time is increased.
Slope design implementation, excavation control, blasting and legacy issues for final walls; quality control
Slope Stability 2020 1441

Figure 3 Difference in pit wall image detail between (a) A 15 mm lens; (b) A 45 mm lens
2.3 Image collection and photogrammetry reconstruction
Generally, photogrammetry refers to any process by which a 3D model is created from 2D images (Kasser &
Egels 2002). In this work, the 2D images were collected by using the UAV systems. The quality of the images
significantly impacts the results of photogrammetry and depends on multiple parameters including overlap
between photos, distance from the target, flight height, lighting conditions, weather conditions, lens focal
length, lens AOV, and camera resolution. Some of these parameters can be controlled by the operator,
whereas others such as the weather and lighting conditions cannot be controlled.
It is critical to select an appropriate ground sampling distance (GSD), the ground distance covered within a
pixel, for an image captured. The GSD determines the size of the smallest identifiable feature in a 3D model.
To map joints 0.3 m and larger, typically, a GSD of 1 to 2.5 cm/pixel is required; however, small GSDs increase
the computational requirements to generate a point cloud. A GSD of 0.7 cm/pixel was achieved for the
experiments conducted at the mine by using a front and side image overlap of 80% and flying 96 m away
from the pit wall. To collect all the data required for the photogrammetry reconstruction, 20 flight lines were
generated to cover the whole pit wall, with a flight distance and time of 6,831.8 m and 63 min, respectively.
A total of 1,618 images were collected during these flights.
Monitoring pit wall prisms along the benches were used as ground control points (GCPs) when they were
clearly visible. The use of GCPs improves the location accuracy of the 3D point cloud, and consequently the
mapping results. Furthermore, it can be used to verify the location error of the point cloud and ensure the
point cloud can be used for mapping.
The collected images were used to reconstruct a 3D point cloud model. Agisoft Metashape (2018), a
commercially available software, was used for the model reconstruction. The software relies on 2D feature
matches (triangulations) and the camera motion, structure from motion (SfM), to build 3D models
(Szeliski 2011). The processing time depends on the desired quality of point cloud, which can be determined
by the end-user. If a low resolution is required, it may be ineffective to generate a dense, high-resolution
cloud. The higher resolution requires longer processing time, and more memory to manipulate the model.
Integrating unmanned aerial vehicle photogrammetry in designcompliance audits and structural modelling of pit walls
F Medinac and K Esmaeili
1442 Slope Stability 2020

Time saving can be achieved by constructing a point cloud of appropriate resolution for the desired task. In
this case, the result was a 21.2 GB high-resolution point cloud with over 400 M points, covering a 28,420 m2
area. In addition to this, a DEM was generated using this data to conduct a design compliance audit.
2.4 Virtual joint mapping using point cloud model
One of the key advantages of photogrammetry is that once a 3D point cloud model is generated, it is possible
to conduct virtual structural mapping on the cloud. Furthermore, a permanent record of the rock conditions
and mapping is created. As previously discussed, joints are defined by their orientation, persistence,
frequency and surface geometry. The availability of a 3D point cloud for detailed mapping can ensure
collecting accurate joint parameters, increasing the reliability of 3D structural models that could be
developed using input joint parameters (Elmo et al. 2015).
In this study, 3D point cloud manipulation and mapping were conducted in CloudCompare (2019), an
open-source software running under a General Public License, giving users the freedom to use and modify
the software. It has specific features and tools designed for structural and geological mapping which can be
used to measure geometrical characteristics of discontinuities such as dip, dip direction, and trace length.
Since the generated point cloud was of high quality it was possible to use the Compass Tool (Thiele
et al. 2017) for semi-automatic mapping (Figure 4). The semi-automatic tool works based on a least-cost path
function to follow a joint trace between the user specified start and end points. Then, to estimate the joint
orientation, the principal components of the points along the trace are calculated and their planarity is
evaluated. If the points pass a planarity test, planes are fitted to the points using a RANSAC algorithm and
the plane with the largest number of inliers (points below a threshold distance from the plane) is used to
calculate the joint orientation using a least squares regression after removing the outliers (Thiele et al. 2015).
Several least-cost path functions can be used, each being suited for different scenarios.
Figure 4 Point cloud generated for the highwall with an example of the point cloud segmenting and mapping
The dip angle, dip direction, trace length, and coordinates of each joint that could be identified on the wall
were measured. Major structures were identified, including the main fault running along the wall at an
orientation of 85°/052° (dip/dip direction) with a true thickness of approximately 3.8 m (grey outline in
Figure 2). The mapping took 58 h to complete and 1,146 joints were identified, the results of which are shown
in Figure 5. The joint data is highly dispersed, which can be attributed to the relatively large area covered by
Slope design implementation, excavation control, blasting and legacy issues for final walls; quality control
Slope Stability 2020 1443

the mapping and the presence of the fault. The joint trace length data (Figure 5b) does not match the negative
exponential distribution (Priest & Hudson 1976). This may have been caused by truncation bias, as the joint
data in the 0 to 1 m bin is harder to identify in the model than joints larger than 1 m.
Once the structural mapping was completed in the point cloud model, it can be used to conduct further
geospatial analysis of the pit walls. The areal fracture intensity (P21), the ratio of the total length of joints to
the area mapped, can be easily obtained and mapped on the pit wall, to describe the spatial variation of rock
structures along the pit wall. A high P21 indicates higher fracture intensity, where the rock is heavily jointed
and likely contains smaller rock blocks. Figure 6 shows the P21 heat map of a section of the pit wall where the
red colour represents areas with relatively higher fracture intensity.
(a)
(b)
Figure 5 Mapping results of highwall. (a) Stereonet of identified joints; (b) Histogram of joints trace length
Integrating unmanned aerial vehicle photogrammetry in designcompliance audits and structural modelling of pit walls
F Medinac and K Esmaeili
1444 Slope Stability 2020

Figure 6 Mapped point cloud used to estimate the P21. (a) Section of the pit wall mapped; (b) Calculated P21
2.5 Discrete facture networks generation
Using collected structural data, it is possible to assess the stability of the slope. Both deterministic and
stochastic analysis methods, such as discrete fracture networks (DFNs), can be used to conduct slope stability
assessment. A DFN model is a stochastic model that represents the inherent rock mass structural variability.
To develop a DFN model structural data needs to be collected including orientations, intensity, trace length,
and terminations of the joint sets. High quality input data is required to ensure a DFN model represents the
field observations and is reliable for further analyses.
In this study, the DFN model was generated based on the physical locations of the joints mapped on the pit
wall using an aggregate approach, where all the joints were modelled as a single set. The joint trace centroids,
trace lengths, their dip and dip directions, and joint plane normals, mapped on the pit wall were exported
from the point cloud model. These traces were directly imported into FracMan® (Golder Associates 2018)
and inserted on the surveyed pit wall surface to replicate the mapping joints (Figure 7).
Figure 7 Trace map of the joints identified during the virtual mapping on the pit wall, imported into the
as-built pit wall surface in FracMan (the red colour represents the fault)
Slope design implementation, excavation control, blasting and legacy issues for final walls; quality control
Slope Stability 2020 1445

The trace map of identified joints was used to generate a conditional DFN model. It is important to note that
the joints generated based on the traces are not fully deterministic; the joints generated have a known
orientation, trace length and trace location but the joint size is variable. Furthermore, the traces could be
formed by the centre of the joint radius, an edge, or a chord, so analytical estimations of the joint size are
required (Rogers et al. 2017). Various analytical methods have been developed to estimate the joint size from
the trace length data, as discussed in the literature (Tonon 2007; Zhang et al. 2002). Due to the ease of
implementation, the method discussed by Zhang et al. (2002) was used to estimate the joint size. The joint
radius of the mapped data was fit by a log-normal distribution with a mean radius of 2.88 m and a standard
deviation of 2.74 m. This distribution was used to generate the joint size in the DFN model. For the
semi-deterministic model, the size and centre of the joints were stochastically generated while adhering to
the determinist constraint that each joint had to fit onto a mapped trace, such that all the mapped traces
were replicated.
In order to generate joint sets within the rock mass, behind the pit wall surface, the DFN model was further
populated with stochastic joints using bootstrapping from the mapped joint data. Bootstrapping is a
statistical procedure that draws values from the existing data, with replacement, rather than a fitted
distribution (Golder Associates 2018). The volumetric intensity of jointing (P32) was set using an iterative
process of picking an arbitrary P32 and adjusting it until the P21 of the model on the pit slope matched the
field P21. Ten stochastic DFN models were generated. For each of the 10 stochastic DFN generations, a subset
was created where the joints intercepting the pit surface were removed, since those were conditioned based
on the tracemap. These subsets were considered the stochastically generated sets and were combined with
the joints generated deterministically, using the traces. The result was 10 semi-deterministic and stochastic
(Det-Sto) DFN models. Figure 8 shows a representation of the DFN model for the pit wall.
Figure 8 A semi-deterministic and stochastic discrete fracture network model of the pit wall
3 Analysis
The following section outlines the design compliance analysis and kinematic slope stability analysis
conducted on the pit highwall using the UAV collected data.
3.1 Design compliance
The DEM and point cloud model were used to conduct a design compliance audit of the bench face angle
(BFA), bench width, and bench coverage for the north-east wall mapped using the UAV system.
Integrating unmanned aerial vehicle photogrammetry in designcompliance audits and structural modelling of pit walls
F Medinac and K Esmaeili
1446 Slope Stability 2020

3.1.1 Bench face angle assessment
Ensuring that the design BFA is achieved is a critical component of an open pit operation because it gives
feedback to technical staff whether the current practices are adequate. If the BFA is shallower than design,
it will result in more waste mining and potentially the loss of ore. These two consequences can have a
negative economic impact on the operation. Having a BFA that is steeper than design can increase the risk of
pit slope instability, thereby increasing the safety and economic risk profile of an operation. Therefore, a
monitoring and assessing strategy is required.
A digital elevation model (DEM) raster built using the 3D georeferenced point cloud can be used to assess
the bench performance. The DEM can either be created from the captured images themselves, in Metashape,
or from the point cloud in CloudCompare. Once a DEM is created, it can be analysed in GIS software such as
QGIS. This raster is a 2D map in which each pixel represents an area at a specific elevation. The smallest GSD,
in this case, should be maintained in the raster since identifiable features are typically an order of magnitude
larger than the size of the GSD. The slope angles are calculated from the raster based on nearest neighbour
algorithms, which rely on small GSDs for accuracy. Once the slope is calculated the raster can be down
sampled to increase the size of the GSD, to give more meaningful results such as those presented in Figure 9.
Furthermore, the DEM can be used to create cross sections to estimate the cumulative distribution of BFA
for each bench.
Figure 9 shows the slope model of the five benches covered by the UAV survey, with colours are used to
visualise the slope angles. The blue, purple and pink colours identify areas where the slope is below 68°,
green is the areas where the target design slope angle (70o) is achieved, and red the areas which are steeper
than design. Areas of over-hang can be identified by a shallow section followed by steep slope, as outlined in
yellow box in Figure 9. Green is the dominant colour on the lower benches and east side; however, areas
around the fault are mainly red with sections of pink and blue. This suggests that the fault has a major impact
on the BFA.
Figure 9 Slope model of the northeast pit wall showing the as-built bench face angle for five benches with
an area of over-hang identified in yellow. The target BFA is 70°
Slope design implementation, excavation control, blasting and legacy issues for final walls; quality control
Slope Stability 2020 1447

The design bench height at the mine is 40 ft (12.2 m) for single, and 80 ft (24.3 m) for double benches.
Figure 10 shows the A-A’ and B-B’ cross sections shown in Figure 9. The top bench is single with the four
benches below being double benches. The cross sections show that the target BFA slope is achieved for some
of the benches, however, angles lower than the design target are more likely to occur than steeper angles.
The bench back-break can be also observed in certain benches. The observations also demonstrated that the
curves at the bench toes are related to the accumulation of the sloughed rock material along the toe and not
associated with a hard toe.
Figure 10 Sections A-A' and B-B' of the digital elevation model created and shown in Figure 9
3.1.2 Bench width assessment
Using the DEM model, it is possible to conduct a bench width analysis which can be used as an evaluation
criterion for blasting performance (Catalan & Onederra 2016) as well as bench coverage. Catch benches are
legislated safety design features in open pits. Their primary purpose is to prevent rock blocks from flowing
down and thus damaging equipment or injuring personnel. They can also increase wall stability by reducing
the bench-scale block sizes and overall slope angle. Taking this into consideration, it is crucial to ensure the
bench width satisfies the design specifications which requires a monitoring strategy.
To measure the bench width in the DEM model, first, the toe and crest of the benches were identified in the
model; manual delineation is required for this. Once the toe and crest of each bench have been traced, they
were discretised into equally spaced points, and the perpendicular distance between them was calculated.
The discretisation impacts the results, so a sensitivity analysis is required to select the optimal value. In this
study, a 0.5 m spacing resulted in the correct matching of 91% of the points. This data was used as the basis
of a statistical analysis of bench width. The catch bench design width at the mine is 32 ft (9.7 m) for single
benches and 40 ft (12.2 m) for double benches. The slope model was used to determine the variation of the
bench width starting with the lowest bench (1) to the top bench (5). Figure 11 presents the histogram of
bench width analysis for Bench 1 (single bench) which demonstrates the distribution of distances from the
toe to the crest measured in 0.5 m intervals.
Integrating unmanned aerial vehicle photogrammetry in designcompliance audits and structural modelling of pit walls
F Medinac and K Esmaeili
1448 Slope Stability 2020

Figure 11 Histogram of measured bench width for Bench 1 width
Table 1 presents the results of the bench width analysis. As can be seen from the results only Bench 5 shows
good agreement with the designed bench width (9.7 m); the width of Benches 1, 2, 3 and 4 are smaller than
design. The smaller bench widths may have been caused by back-break of the benches, specifically towards
the crests of the benches. Some visible wedge failures along Benches 2 and 4 can be identified.
Table 1 Results of bench width analysis
Bench Average width (m) Median width (m) Standard deviation (m)
1 8.6 9.1 1.4
2 7.0 7.5 2.4
3 7.8 7.8 1.0
4 11.1 11.5 2.1
5 9.9 10.4 2.1
3.1.3 Bench coverage assessment
In addition to the bench width analysis, the volume of sloughed material can also be calculated using the
DEM by outlining the areas where the sloughed material is accumulated and calculating the volume for them
(Figure 12). Table 2 shows the results of the bench coverage analysis. Significant sloughed material has been
accumulated on Bench 2, with other benches ranging from 16% to 24% coverage. Bench 5 was clean, and no
sloughed material was visible. These results show that care might be required in areas where the ground
conditions are poor. The areas along the main fault account for most of the back-break. This analysis can be
used to supplement visual observations of sloughage and for developing a criterion for recognising when
benches require clean up, e.g. if more than 40% of the bench is covered or if the volume of an area exceeds
the theoretical volume required to create a slope of 30° (where material can slide down).
Slope design implementation, excavation control, blasting and legacy issues for final walls; quality control
Slope Stability 2020 1449

Figure 12 Digital elevation model showing bench widths in blue and sloughed material in orange with the
coverage volume in m3
Table 2 Results of bench coverage analysis
Bench Bench area (m2) Bench coverage(m2) % coverage Coverage volume (m3)
1 1,529 238 16% 421
2 1,816 684 38% 1,448
3 1,775 349 20% 1,331
4 2,163 528 24% 1,461
5 1,869 NA NA NA
3.2 Kinematic stability analysis
To investigate the stability analysis of the surveyed pit wall, the developed 3D DFN models (discussed in
Section 2.4.) were used to conduct a kinematic slope stability analysis. A wedge analysis was performed for
each DFN model to investigate the size and number of the wedges formed on the slope surface. The FracMan
rock wedge tool was used to do the kinematic analysis. The tool works based on key block theory developed
by Goodman & Shi (1985) and uses the fracture network geometry to identify blocks formed on the slope
surface. The stability of each block is then assessed using the Mohr–Coulomb failure criterion for sliding. The
rock at the pit has a density of 2.7 kg/m3 and a conservative friction angle of 27° was used for the joints and
they were assumed to be cohesionless. The stable and unstable blocks were identified and their volumes
were recorded. Figure 13 shows the unstable (red) and stable (green) wedges formed behind the pit wall in
one of the DFN realisations. There are relatively few wedges formed in this model.
Integrating unmanned aerial vehicle photogrammetry in designcompliance audits and structural modelling of pit walls
F Medinac and K Esmaeili
1450 Slope Stability 2020

Figure 13 View of unstable (red) and stable (green) wedges formed in one DFN model generation, with the
fault zone overlain in red
The wedge analysis results are plotted in Figure 14 as cumulative distributions of the wedge volume. The P80
varied from 12 m3 to approximately 71 m3, with an average of 31 m3. Only two DFN models had a larger P80
than the average. The kinematic analysis of the wedges determined that there were on average 10 unstable
or failed wedges in each model. A histogram of the aggregated failed wedge volumes of all the model runs is
presented in Figure 15. Volumes smaller than 1 m3 accounted for 85% of all the failures; suggesting that the
mode of failure is not dominantly structurally controlled for the north-eastern wall. None of the models
replicated a visually observed failure in the wall, indicating that wedge failure is unlikely the cause of the
failures identified. An alternative explanation for the failure was sloughage due to the weak and highly
weathered rock surrounding the fault. The weak rock sloughed when excavated until it reached a stronger
rock unit contact which prevented further unravelling, thereby making it seem like a wedge failure. This
hypothesis is supported by the large volume of loose and small size sloughed material accumulated at the
base of the failures (see Figure 12).
Figure 14 Size distribution of the wedges generated by using the deterministic-stochastic model
Slope design implementation, excavation control, blasting and legacy issues for final walls; quality control
Slope Stability 2020 1451
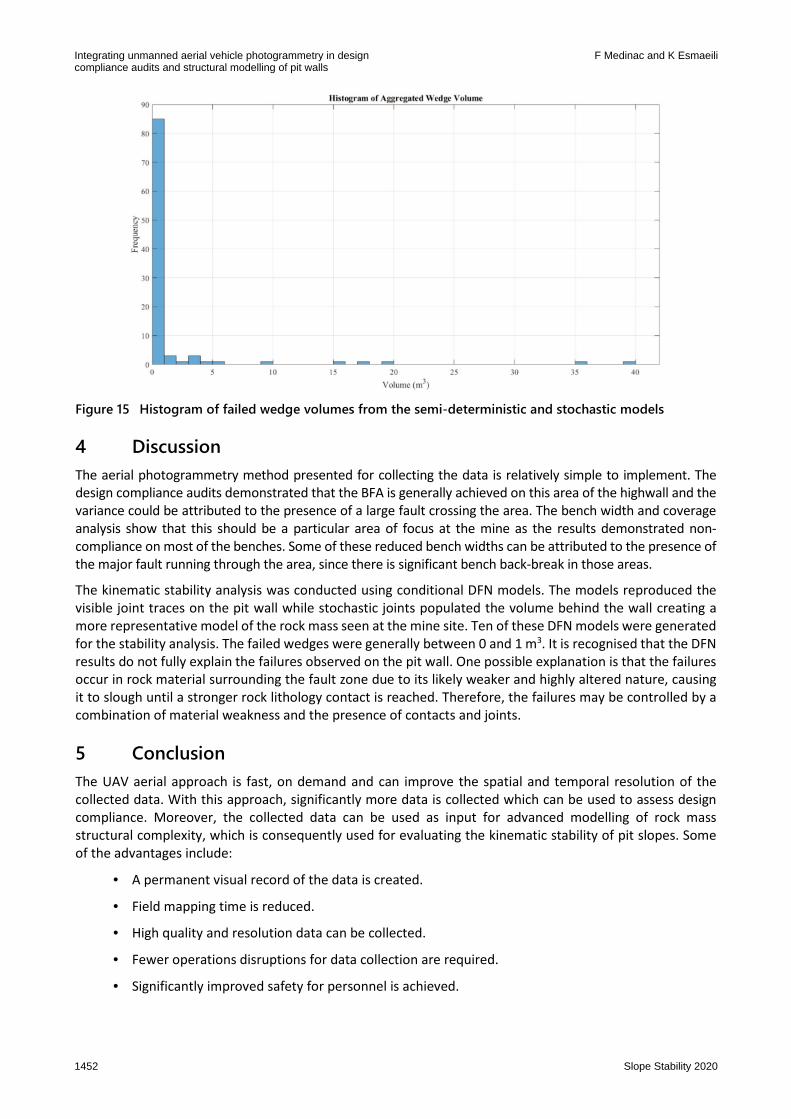
Figure 15 Histogram of failed wedge volumes from the semi-deterministic and stochastic models
4 Discussion
The aerial photogrammetry method presented for collecting the data is relatively simple to implement. The
design compliance audits demonstrated that the BFA is generally achieved on this area of the highwall and the
variance could be attributed to the presence of a large fault crossing the area. The bench width and coverage
analysis show that this should be a particular area of focus at the mine as the results demonstrated non-
compliance on most of the benches. Some of these reduced bench widths can be attributed to the presence of
the major fault running through the area, since there is significant bench back-break in those areas.
The kinematic stability analysis was conducted using conditional DFN models. The models reproduced the
visible joint traces on the pit wall while stochastic joints populated the volume behind the wall creating a
more representative model of the rock mass seen at the mine site. Ten of these DFN models were generated
for the stability analysis. The failed wedges were generally between 0 and 1 m3. It is recognised that the DFN
results do not fully explain the failures observed on the pit wall. One possible explanation is that the failures
occur in rock material surrounding the fault zone due to its likely weaker and highly altered nature, causing
it to slough until a stronger rock lithology contact is reached. Therefore, the failures may be controlled by a
combination of material weakness and the presence of contacts and joints.
5 Conclusion
The UAV aerial approach is fast, on demand and can improve the spatial and temporal resolution of the
collected data. With this approach, significantly more data is collected which can be used to assess design
compliance. Moreover, the collected data can be used as input for advanced modelling of rock mass
structural complexity, which is consequently used for evaluating the kinematic stability of pit slopes. Some
of the advantages include:
• A permanent visual record of the data is created.
• Field mapping time is reduced.
• High quality and resolution data can be collected.
• Fewer operations disruptions for data collection are required.
• Significantly improved safety for personnel is achieved.
Integrating unmanned aerial vehicle photogrammetry in designcompliance audits and structural modelling of pit walls
F Medinac and K Esmaeili
1452 Slope Stability 2020

Furthermore, the data is of high temporal resolution, as flyovers of the same areas can be done even once
access is lost. The UAV can be flown over the same areas to monitor any changes/degradation to the pit wall
and rock mass condition. The point cloud availability makes it possible to revisit areas of interest and
preserves a record of the rock conditions at the time. The achieved BFAs can be recorded to track
performance against design. Monitoring the BFA is critical as a shallower face angle can reduce the
inter-ramp and overall pit slope angles. The presented methods for assessing the slope are rapid and
relatively simple to integrate into a slope monitoring program. Also, additional structural data can be
collected for building 3D structural models, resulting in more robust stability analysis.
Despite many advantages of the UAV systems, there are some limitations associated with UAV data
collection. The placement of suitable GCPs in-pit wall mapping is a challenge. The weather and lighting
conditions have a significant impact on UAV application as UAVs cannot be used in harsh weather conditions
(e.g. heavy rain, snow or heavy winds). Dust conditions can also have an adverse effect on data collection;
dust in the air or covering the pit walls reduces the image quality and feature matching effectiveness, and it
can impact the UAV causing overheating, blocking moving parts, and damaging electronic components.
Acknowledgement
The authors thank Natural Sciences and Engineering Research Council of Canada for the financial support of
this research project.
References
Agisoft Metashape 2018, version 1.5.5, computer software, Agisoft LLC, St. Petersburg, https://www.agisoft.com/
Brady, BHG & Brown, ET 2004, Rock Mechanics for underground mining: Third edition, Springer Netherlands, Dordrecht.
Catalan, A & Onederra, I 2016, ‘Implementation of leading practice in geotechnical and blasting performance evaluations at the
Centinela sulphide mine’, Mining Technology, vol. 125, no. 3, pp. 156–173, https://doi.org/10.1179/
1743286315Y.0000000025
CloudCompare 2019, version 2.10.2 Zephyrus, computer software, GPL software, http://cloudcompare.org/
Derron, MH & Jaboyedoff, M 2010, ‘LIDAR and DEM techniques for landslides monitoring and characterization’, Natural Hazards and
Earth System Sciences, vol. 10, pp. 1877–1879, https://doi.org/10.5194/nhess10-1877-2010
Eivazy, H, Esmaeili, K & Jean, R 2017, ‘Modelling Geomechanical Heterogeneity of Rock Masses Using Direct and Indirect Geostatistical
Conditional Simulation Methods’, Rock Mechanics and Rock Engineering, vol. 50, no. 12, pp. 3175–3195, https://doi.org/
10.1007/s00603-017-1293-0
Elmo, D, Stead, D & Rogers, S 2015, ‘Guidelines for the Quantitative Description of Discontinuities for use in Discrete Fracture Network
Modelling’, 13th ISRM International Congress of Rock Mechanics, International Society for Rock Mechanics and Rock
Engineering, Lisbon.
Francioni, M, Salvini, R, Stead, D, Giovannini, R, Riccucci, S, Vanneschi, C & Gullì, D 2015, ‘An integrated remote sensing-GIS approach
for the analysis of an open pit in the Carrara marble district, Italy: Slope stability assessment through kinematic and numerical
methods’, Computers and Geotechnics, vol. 67, pp. 46–63, https://doi.org/10.1016/j.compgeo.2015.02.009
Golder Associates Ltd 2018, FracMan® User’s Manual Release 7.7, http://www.softfactory.kr/download/
FracMan/FracMan_Manual.pdf
Goodman, R & Shi, G 1985, Block Theory and Its Application to Rock Engineering, Prentice-Hall, Inc., Englewood Cliffs.
Hadjigeorgiou, J 2012, ‘Where do the data come from?’, Mining Technology, vol. 121, no. 4, pp. 236–247,
https://doi.org/10.1179/1743286312Y.0000000026
Kasser, M & Egels, Y 2002, Digital Photogrammetry, Taylor & Francis, London.
Langford, M, Fox, A & Sawdon Smith, R 2010, ‘Using different focal length lenses, camera kits’, in M Langford, A Fox & R Sawdon
Smith (eds), Langford’s Basic Photography (Ninth Edition), Focal Press, Kidlington.
Priest, SD & Hudson, JA 1976, ‘Discontinuity spacings in rock’, International Journal of Rock Mechanics and Mining Sciences &
Geomechanics Abstracts, vol. 13, no. 5, pp. 135–148.
Read, J & Stacey, P (eds) 2009, Guidelines for Open Pit Slope Design, CSIRO Publishing, Melbourne.
Rogers, SF, Bewick, RP, Brzovic, A & Gaudreau, D 2017, 'Integrating photogrammetry and discrete fracture network modelling for
improved conditional simulation of underground wedge stability', in J Wesseloo (ed.), Proceedings of the Eighth International
Conference on Deep and High Stress Mining, Australian Centre for Geomechanics, Perth, pp. 599–610.
Szeliski, R 2011, Computer Vision, Springer London, London, https://doi.org/10.1007/978-1-84882-935-0
Thiele, ST, Micklethwaite, S, Bourke, P, Verrall, M & Kovesi, P 2015, ‘Insights into the mechanics of en-échelon sigmoidal vein
formation using ultra-high resolution photogrammetry and computed tomography’, Journal of Structural Geology, vol. 77,
pp. 27–44, https://doi.org/10.1016/j.jsg.2015.05.006
Slope design implementation, excavation control, blasting and legacy issues for final walls; quality control
Slope Stability 2020 1453

Thiele, ST, Grose, L, Samsu, A, Micklethwaite, S, Vollgger, SA & Cruden, AR 2017, ‘Rapid, semi-automatic fracture and contact mapping
for point clouds, images and geophysical data’, Solid Earth, vol. 8, no. 6, pp. 1241–1253, https://doi.org/10.5194/se-8-1241-2017
Tonon, F 2007, ‘Determining fracture size probability distribution functions from trace length probability distribution functions’,
Proceedings of the 11th Congress of the International Society for Rock Mechanics, International Society for Rock Mechanics
and Rock Engineering, Lisbon, pp. 215–222.
Zhang, L, Einstein, HH & Dershowitz, WS 2002, ‘Stereological relationship between trace length and size distribution of elliptical
discontinuities’, Géotechnique, vol. 52, no. 6, pp. 419–433, https://doi.org/10.1680/geot.52.6.419.38737
Integrating unmanned aerial vehicle photogrammetry in designcompliance audits and structural modelling of pit walls
F Medinac and K Esmaeili
1454 Slope Stability 2020