integrating agent-based computational economics … · integrating agent-based computational...
TRANSCRIPT
Integrating Agent-based Computational Economics in the
Teaching of Principles of Microeconomics
Mark E. McBride ∗
Department of EconomicsMiami UniversityOxford, OH 45056ph: 513 529-2864
email: [email protected]://mcbridme.sba.muohio.edu/ace/
December 8, 2008
∗Do not quote without permission. I would like to thank the Richard T. Farmer School of Business forfinancial support for the research described herein. I would also like to thank Leigh Tesfatsion, RobertAxtell, Allen Wilhite, and members of the Trento CEEL Summer Institute 2006 for their useful commentson the ZI Trader and the Small World Netlogo models. Any errors of comission or omission remain thoseof the author.
Abstract
In an agent-based computational economics (ACE) model, heterogeneous autonomoussoftware agents operate in a simulated dynamic environment; typically where the agentsmay or may not learn, have less than perfect information and less than perfect ra-tionality. ACE models stress the economic process instead of equilibria, stress localinteractions instead of global, stress emergent patterns in complex systems, and fo-cuses on the out-of-equilibrum dynamics of the system. ACE modeling complementsour traditional models by sharing the common goal of trying to understand economicsystems. Given the large literature that has developed on the past 20 years (Tesfatsionand Judd, 2006) in a wide variety of economics and the growth of easy to use softwaretools, the time is appropriate for integrating the insights from ACE models into theteaching of principles.
The paper discusses the advantages of integrating ACE models into the principlesof microeconomics using five NetLogo models: zero-intelligence trading in a double-auction, iterated prisoner’s dilemma, evolutionary prisoner’s dilemma, wealth distribu-tion, and pricing in small worlds. Each model builds from notable or seminal articlesin the ACE literature. For each model, suggestions for integrating the model into thecourse are provided including a guide to the issues raised by the ACE model and asample laboratory exercise. These new models allow the instructor to address newquestions more deeply such as is it the structure of the market or the rationality of theindividuals that lead to market efficiency, the role of alternative pricing institutions,the role of heterogeneity of market participants, the role of limited information andlocal interactions, and the role of network effects on pricing.
I. Inroduction
With the advent of the publication of the second volume of Handbook on Computational
Economics: Agent-based Computational Economics in 2006, the rich insights of a compu-
tational approach can be brought to the teaching of principles of microeconomics. In an
agent-based computational economics (ACE) model, heterogeneous autonomous software
agents operate in a simulated dynamic environment; typically where the agents may or
may not learn, have less than perfect information and less than perfect rationality. ACE
models stress the economic process instead of equilibria, stress local interactions instead of
global, stress emergent patterns in complex systems, and focuses on the out-of-equilibrum
dynamics of the system. ACE modeling complements our traditional models by sharing the
common goal of trying to understand economic systems. Given the large literature that has
developed on the past 20 years (Tesfatsion and Judd, 2006) in a wide variety of economics
and the growth of easy to use software tools, the time is appropriate for integrating the
insights from ACE models into the teaching of principles. The use of ACE models begins
to develop the student’s skill at using inductive reasoning instead of deductive reasoning -
the main paradigm of teaching principles of economics.
In the prevailing view, Siegfried (1998, p. 60) and Siegfried (1991, p.21) define the
goal of economics as “Enabling students to develop a capacity to think like an economist’
. . . Thinking like an economist involves using chains of deductive reasoning in conjunction
with simplified models to illuminate economic phenomena. . . ” Saunders (1998) identifies
four major objectives for a course in economics: knowledge of basic terms, understanding
basic economic concepts and principles, the ability to apply economic principles to new
situations, and the ability to interpret economic data. These objectives can be characterized
as skill oriented instead of feedback oriented. These skills, though, move toward the student
making active use of the knowledge learned. Fels (1993) suggests three methods of avoiding
inert knowledge: use of schemas, anchored instruction, and argument reconstruction and
evaluation. Students use schema’s to organize and file away information for use at a later
time. In order for the student to effectively use the information stored, the principle
must be taught as a general concept with application to several domains. In addition, by
anchoring the instruction to a particular example when beginning a concept, the instructor
can keep referring back to the example to illustrate the generality of the concept. Finally,
repetitive training of students to separate a logical argument into the component steps
in order to evaluate the argument imbues in the student the discipline to construct and
evaluate logical arguments. These views (and other similar views espoused by economists)
are clearly dominated by a paradigm within the profession of using deductive reasoning
within teaching principles of economics.
Starting approximately 10-15 years ago, calls for changing the way principles of eco-
nomics is taught increasingly arose on two main fronts. First, a large literature on using
experiments in the classroom was tied in with a call for active learning. Proponents of
using experiments as a pedagogical tool claim many advantages to their use. Experiments,
particularly the competitive market type, show the market as a social system with a natural
order (DeYoung, 1993). Using experiments reinforces the basic theoretical principle(s) that
students are seeing for the first time (DeYoung, 1993; Frank, 1997; Walker, 1987; Wells,
1991) and allows the instructor to build from those principles in new ways (Joyce, 1996;
Ortmann and Scroggins, 1996). The bottom up participatory approach provides credibility
to the theoretical model (Holt and McDaniel, 1998; Wells, 1991), effectively allowing deeper
learning due to the belief that theory is relevant (Holt and McDaniel, 1998) even if later
theories are presented without an experiment (Wells, 1991). The use of experiments has not
only an experiential participatory nature (Neral and Ray, 1995, Ortmann and Scroggins,
1996) but is also providing a common minimum level of experiences (Neral and Ray, 1995)
2
by creating a relevant description of the economic world as a learning environment. These
experiences involve active learning processes (Neral and Ray, 1995) that reflect a research
process (Frank, 1997; Joyce 1996). The active learning process increases student interest
(Gremmen and Potter, 1997; Holt and McDaniel, 1998; Ortmann and Scroggins, 1996)
and student motivation (Gremmen and Potter, 1997; Holt and McDaniel, 1998; Ortmann
and Scroggins, 1996; Wells, 1991). Many feel these claims are persuasive, so much so that
“Even non-experimentalists have realized that these laboratory exercises can be effective
teaching devices” (Holt and McDaniel, 1998, p. 257)
Second, Becker (1997, 2003) argues that the decline in economics majors may reflect
in part the teaching of principles of economics not keeping up with the current litera-
ture in economics. Becker (2003) believes that innovations in economics are not being
integrated into the teaching of undergraduate economics; yet, as he points out, we have
the tools to teach at the forefront of the profession. Further, Colander (2000b) relates his,
largely unsuccessful, experiences in trying to integrate complexity theory and dynamic pro-
cesses into the principles textbooks due to strong negative reactions from reviewers. Brock
(2000) notes that textbooks could include software that make dynamic processes real to
the students and expresses a belief that teaching using induction is needed so students
can understand how patterns are revealed in systems. Stodder (2000) furthers the call
to get students back to inductive reasoning. Colander (2000a) notes that textbooks em-
body previous economists’ inductive insights translated into models which are then taught
deductively.
The goal of the paper is not to argue for one approach to teaching or the other - both are
important and are complementary approaches. And both approaches have been presented
more clearly and ably by others. The goal of the paper is to present an additional simulation
approach besides experiments for use in principles of microeconomics that continue the
3
student down the road of using induction to identify patterns. The paper provides a
very brief overview of agent-based computational economics and the Netlogo modeling
tool in part II. Part III discusses five different models that I have used in principles of
microeconomics. For each model, a brief overview of the literature is provided along with
a description of the model and a few teaching suggestions as to how the model can be
incorporated into principles of microeconomics. The concluding remarks discusses new
directions that are being considered in integrating agent-based computational economics
into the teaching of principles of microeconomics.
II. Agent-based Computational Economics
Agent-based computational economics, also known as agent-based modeling, involves a
system of autonomous interacting software agents which exhibits emergent properties that
cannot be deduced by simple aggregation of the individual agent properties. An ACE model
begins with assumptions about the agents (heterogeneous characteristics, information sets,
behavioral rules) and their environment and then uses a simulation to generate ”histories”
that reveal the dynamic consequences of those assumptions. An ACE model starts in very
much the same approach as a typical deductive model in economics: rigorously specified
set of assumptions of the system. However, it differs from traditional economics models in
that an ACE model does not prove theorems with generality; typically because a tractable
mathematical solution is not feasible. By using simulation and an experimental design the
model generates data suitable for analysis by induction. The goals of the approach (Tes-
fatsion and Judd, 2006) can include empirical understanding, normative understanding,
hueristic, and methodological advancement. Tesfatsion and Judd (2006) provide a recent
4
summary of the literature in ACE modeling to date.1
Netlogo is a general agent-based modeling tool that is freely available and cross-
platform.2 The Netlogo computer language is based on Logo, originally designed by Wally
Feurzeig and Seymour Papert for teaching computer science concepts to children. Both
Logo and Netlogo were designed to have a low threshold of entry for beginners and no
ceiling on the needs of power users. Netlogo contains a large sample library of agent-based
models drawn from Art, Biology, Chemistry, Physics, Computer Science, Earth Science,
Mathematics, Networks, Social Sciences, and System Dynamics. One of the strengths of
Netlogo for teaching is the very low threshold for students to explore the sample models or
models created by the instructor; particularly when delivered via the web. The student can
easily vary parameters in the model to quickly experience the implications of the changing
parameters for dynamic processes and emergent behavior. Netlogo also contains a unique
interface called BehaviorSpace which allows the user to construct experimental designs,
execute those designs, and then output relevant data for further statistical analysis.
Using ACE models to complement classroom activities in principles of microeconomics
has the same advantages of using classroom experiments enumerated earlier. ACE mod-
els provide additional advantages in challenging the student to inductively learn what
economists are learning from complexity theory and to explore the role of dynamic pro-
cesses and emergent properties of economies grown from the bottom up. Further ACE
models avoid some of the problems with experiments: experiments are difficult to conduct
for large lecture sections of courses and they can involve significant time expenditures when
conducted in class. Combining classroom experiments with ACE models can generate pow-
erful insights as the two approaches complement each other (Duffy, 2006). By delivering1Also see Leigh Tesfatsion’s web site at http://www.econ.iastate.edu/tesfatsi/ace.htm . It provides the
largest collection of resources available in one location to assist in learning about ACE.2Netlogo is available at http://ccl.northwestern.edu/netlogo/ .
5
simulation models via the web or the desktop, students can explore the models without
the time pressure of class (and should be actively encouraged to explore and to look for
the relationship between model parameters and emergent patterns).
III. Models and Teaching Suggestions
A. Zero-Intelligence Trading Model
1. Netlogo Model
The first model addresses two core topics in the teaching of principles of microeconomics:
demand and supply and rationality. Experimental economics has a long tradition of placing
human subjects in simulated double auction markets. The results of the double-auction
experiments consistently support that human agents can achieve high levels of market
efficiency quickly (through few rounds of trading) and even in relatively thin markets (few
buyers and sellers). Gode and Sunder (1993) conducted experiments comparing human
agents with zero-intelligence artificial agents in double-auction markets and found that the
zero-intelligence agents can lead to high levels of market efficiency even given their random
decision making. They concluded that rationality is not a necessary assumption for the
market to achieve efficiency and that the market institution provides the first order effect
on market efficiency. A considerable literature arose in response to Gode and Sunder; see
Duffy (2006) for a summary.
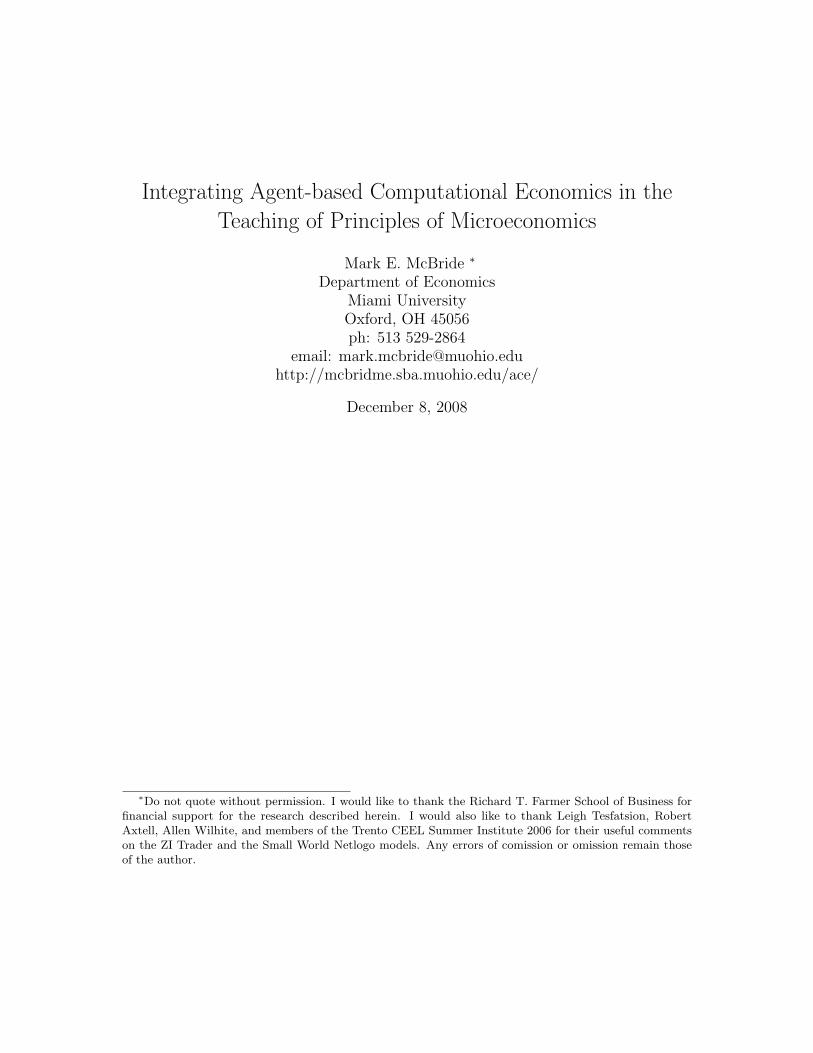
The Netlogo model (Figure 1) implements the zero-intelligence constrained (ZI-C)
traders from Gode and Sunder. The ZI-C traders cannot make a trade that will yield
a negative profit, i.e., buyers cannot buy at a price higher than their buyer value and
sellers cannot sell for a price below their seller cost. In the zero-intelligence trader model,
buyers are randomly assigned buyer values between zero and maxBuyerValue. Sellers are
6
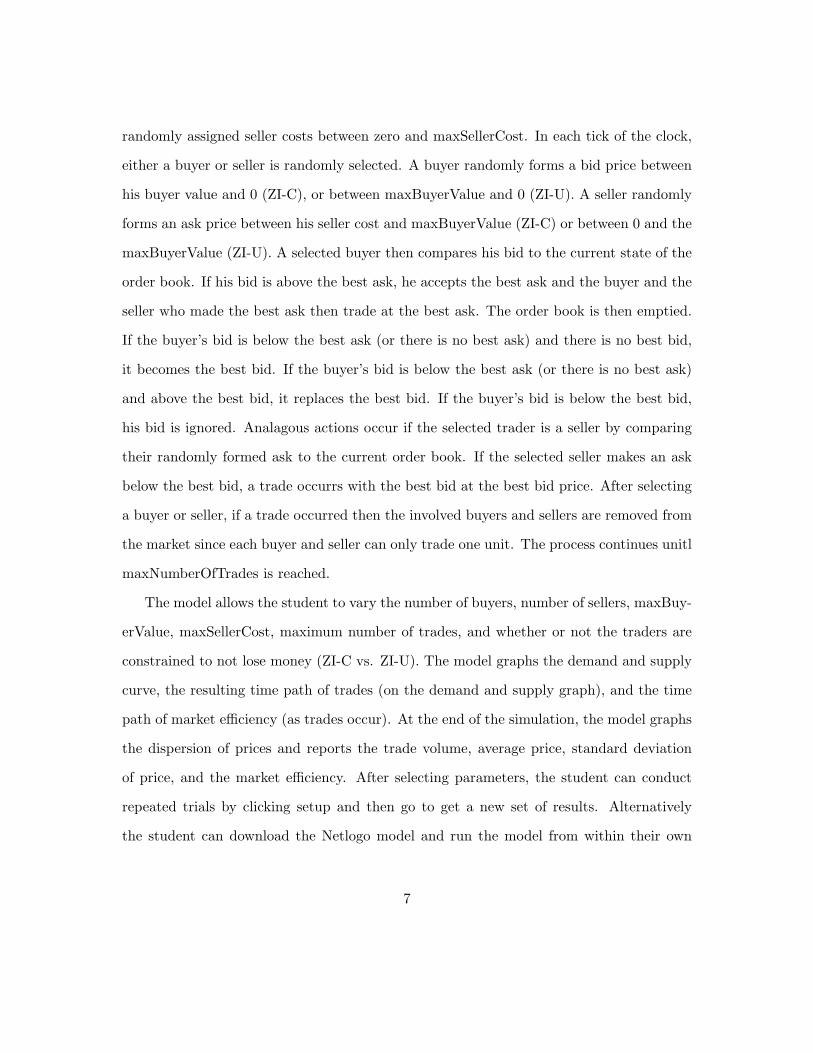
randomly assigned seller costs between zero and maxSellerCost. In each tick of the clock,
either a buyer or seller is randomly selected. A buyer randomly forms a bid price between
his buyer value and 0 (ZI-C), or between maxBuyerValue and 0 (ZI-U). A seller randomly
forms an ask price between his seller cost and maxBuyerValue (ZI-C) or between 0 and the
maxBuyerValue (ZI-U). A selected buyer then compares his bid to the current state of the
order book. If his bid is above the best ask, he accepts the best ask and the buyer and the
seller who made the best ask then trade at the best ask. The order book is then emptied.
If the buyer’s bid is below the best ask (or there is no best ask) and there is no best bid,
it becomes the best bid. If the buyer’s bid is below the best ask (or there is no best ask)
and above the best bid, it replaces the best bid. If the buyer’s bid is below the best bid,
his bid is ignored. Analagous actions occur if the selected trader is a seller by comparing
their randomly formed ask to the current order book. If the selected seller makes an ask
below the best bid, a trade occurrs with the best bid at the best bid price. After selecting
a buyer or seller, if a trade occurred then the involved buyers and sellers are removed from
the market since each buyer and seller can only trade one unit. The process continues unitl
maxNumberOfTrades is reached.
The model allows the student to vary the number of buyers, number of sellers, maxBuy-
erValue, maxSellerCost, maximum number of trades, and whether or not the traders are
constrained to not lose money (ZI-C vs. ZI-U). The model graphs the demand and supply
curve, the resulting time path of trades (on the demand and supply graph), and the time
path of market efficiency (as trades occur). At the end of the simulation, the model graphs
the dispersion of prices and reports the trade volume, average price, standard deviation
of price, and the market efficiency. After selecting parameters, the student can conduct
repeated trials by clicking setup and then go to get a new set of results. Alternatively
the student can download the Netlogo model and run the model from within their own
7
machine which would allow them to run more sophisticated experimental designs.
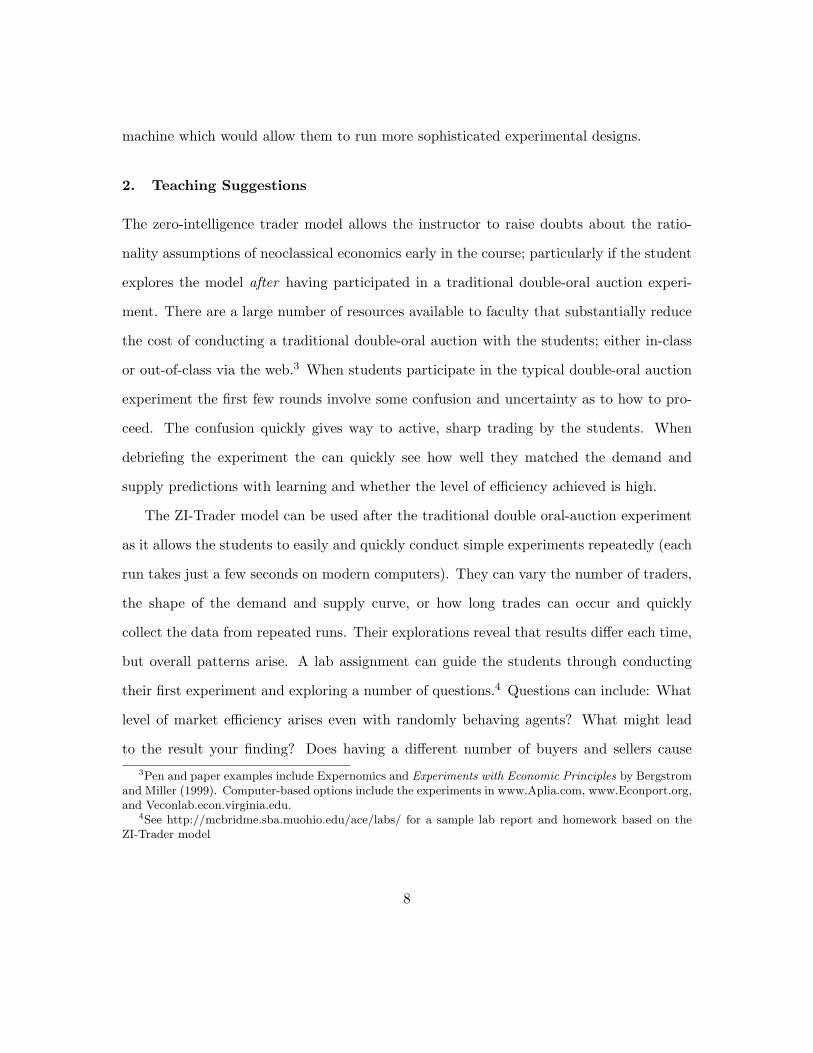
2. Teaching Suggestions
The zero-intelligence trader model allows the instructor to raise doubts about the ratio-
nality assumptions of neoclassical economics early in the course; particularly if the student
explores the model after having participated in a traditional double-oral auction experi-
ment. There are a large number of resources available to faculty that substantially reduce
the cost of conducting a traditional double-oral auction with the students; either in-class
or out-of-class via the web.3 When students participate in the typical double-oral auction
experiment the first few rounds involve some confusion and uncertainty as to how to pro-
ceed. The confusion quickly gives way to active, sharp trading by the students. When
debriefing the experiment the can quickly see how well they matched the demand and
supply predictions with learning and whether the level of efficiency achieved is high.
The ZI-Trader model can be used after the traditional double oral-auction experiment
as it allows the students to easily and quickly conduct simple experiments repeatedly (each
run takes just a few seconds on modern computers). They can vary the number of traders,
the shape of the demand and supply curve, or how long trades can occur and quickly
collect the data from repeated runs. Their explorations reveal that results differ each time,
but overall patterns arise. A lab assignment can guide the students through conducting
their first experiment and exploring a number of questions.4 Questions can include: What
level of market efficiency arises even with randomly behaving agents? What might lead
to the result your finding? Does having a different number of buyers and sellers cause3Pen and paper examples include Expernomics and Experiments with Economic Principles by Bergstrom
and Miller (1999). Computer-based options include the experiments in www.Aplia.com, www.Econport.org,and Veconlab.econ.virginia.edu.
4See http://mcbridme.sba.muohio.edu/ace/labs/ for a sample lab report and homework based on theZI-Trader model
8
the efficiency of the ZI-traders to go up or down? On average, how much of the market
efficiency were the zero-intelligence traders able to achieve? How would you interpret that
result, i.e., do traders have to be rational for the market to be efficient? After completing
a lab report outside of class, the instructor can lead an in-class discussion of the results
focusing on the role of institutions and rationality in market outcomes.
B. Iterated Prisoner’s Dilemma
1. Netlogo Model
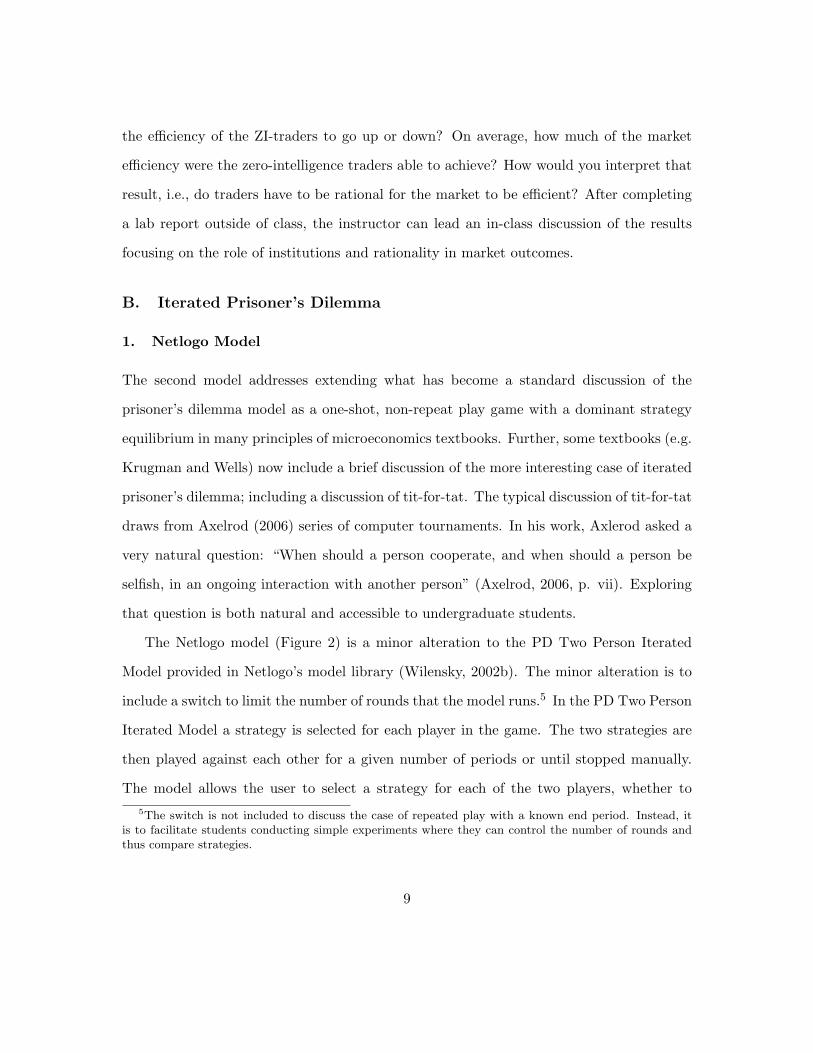
The second model addresses extending what has become a standard discussion of the
prisoner’s dilemma model as a one-shot, non-repeat play game with a dominant strategy
equilibrium in many principles of microeconomics textbooks. Further, some textbooks (e.g.
Krugman and Wells) now include a brief discussion of the more interesting case of iterated
prisoner’s dilemma; including a discussion of tit-for-tat. The typical discussion of tit-for-tat
draws from Axelrod (2006) series of computer tournaments. In his work, Axlerod asked a
very natural question: “When should a person cooperate, and when should a person be
selfish, in an ongoing interaction with another person” (Axelrod, 2006, p. vii). Exploring
that question is both natural and accessible to undergraduate students.
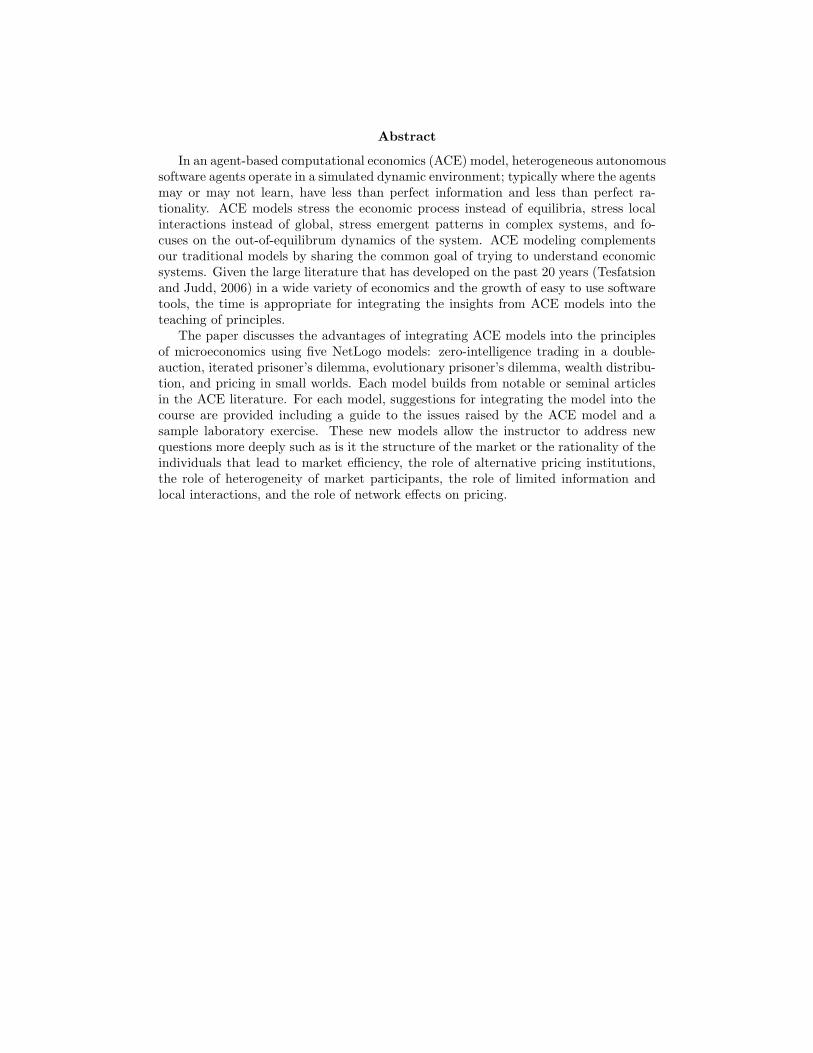
The Netlogo model (Figure 2) is a minor alteration to the PD Two Person Iterated
Model provided in Netlogo’s model library (Wilensky, 2002b). The minor alteration is to
include a switch to limit the number of rounds that the model runs.5 In the PD Two Person
Iterated Model a strategy is selected for each player in the game. The two strategies are
then played against each other for a given number of periods or until stopped manually.
The model allows the user to select a strategy for each of the two players, whether to5The switch is not included to discuss the case of repeated play with a known end period. Instead, it
is to facilitate students conducting simple experiments where they can control the number of rounds andthus compare strategies.
9
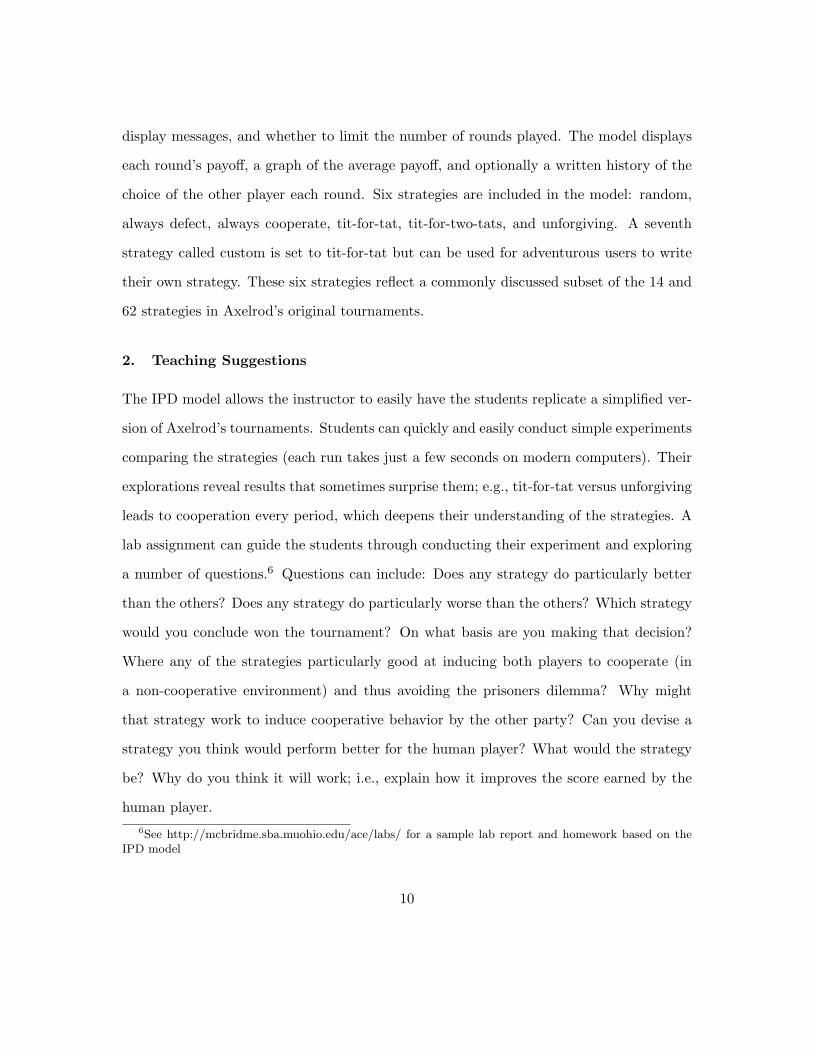
display messages, and whether to limit the number of rounds played. The model displays
each round’s payoff, a graph of the average payoff, and optionally a written history of the
choice of the other player each round. Six strategies are included in the model: random,
always defect, always cooperate, tit-for-tat, tit-for-two-tats, and unforgiving. A seventh
strategy called custom is set to tit-for-tat but can be used for adventurous users to write
their own strategy. These six strategies reflect a commonly discussed subset of the 14 and
62 strategies in Axelrod’s original tournaments.
2. Teaching Suggestions
The IPD model allows the instructor to easily have the students replicate a simplified ver-
sion of Axelrod’s tournaments. Students can quickly and easily conduct simple experiments
comparing the strategies (each run takes just a few seconds on modern computers). Their
explorations reveal results that sometimes surprise them; e.g., tit-for-tat versus unforgiving
leads to cooperation every period, which deepens their understanding of the strategies. A
lab assignment can guide the students through conducting their experiment and exploring
a number of questions.6 Questions can include: Does any strategy do particularly better
than the others? Does any strategy do particularly worse than the others? Which strategy
would you conclude won the tournament? On what basis are you making that decision?
Where any of the strategies particularly good at inducing both players to cooperate (in
a non-cooperative environment) and thus avoiding the prisoners dilemma? Why might
that strategy work to induce cooperative behavior by the other party? Can you devise a
strategy you think would perform better for the human player? What would the strategy
be? Why do you think it will work; i.e., explain how it improves the score earned by the
human player.6See http://mcbridme.sba.muohio.edu/ace/labs/ for a sample lab report and homework based on the
IPD model
10
After completing a lab report outside of class, the instructor can lead an in-class dis-
cussion of the results focusing on which strategy did the best and why. Axelrod’s insights
into why tit-for-tat did well are clear to the students as they can inductively arrive at the
similar conclusions.7,8 Following the discussion of the lab results, the instructor is now in
a position to lead a more rich discussion of cartels and other IPD situations but may want
to have the students explore the third model before that discussion.
C. Evolutionary Prisoner’s Dilemma
1. Netlogo Model
The third model continues the discussion of IPD by implementing a version of a basic
evolutionary model. Axelrod (2006) followed up his tournaments with a simple evolutionary
model. In his evolutionary model, each competitor was given one of the strategies. In
successive rounds, competitors were given a new strategy using a proportional selection
method. Strategies that did better in the previous round were selected more often for the
next round. Again, tit-for-tat came out as the winner. However, Axelrod’s models had a
fixed award for defection which limits the richness of the oligopoly market insights that
can be drawn from the models. The third model differs from Axelrod’s evolutionary model
in that it is more clearly an agent-based model where agents operate on local information
only and the defection award can be controlled (and varied) as the simulation is running.
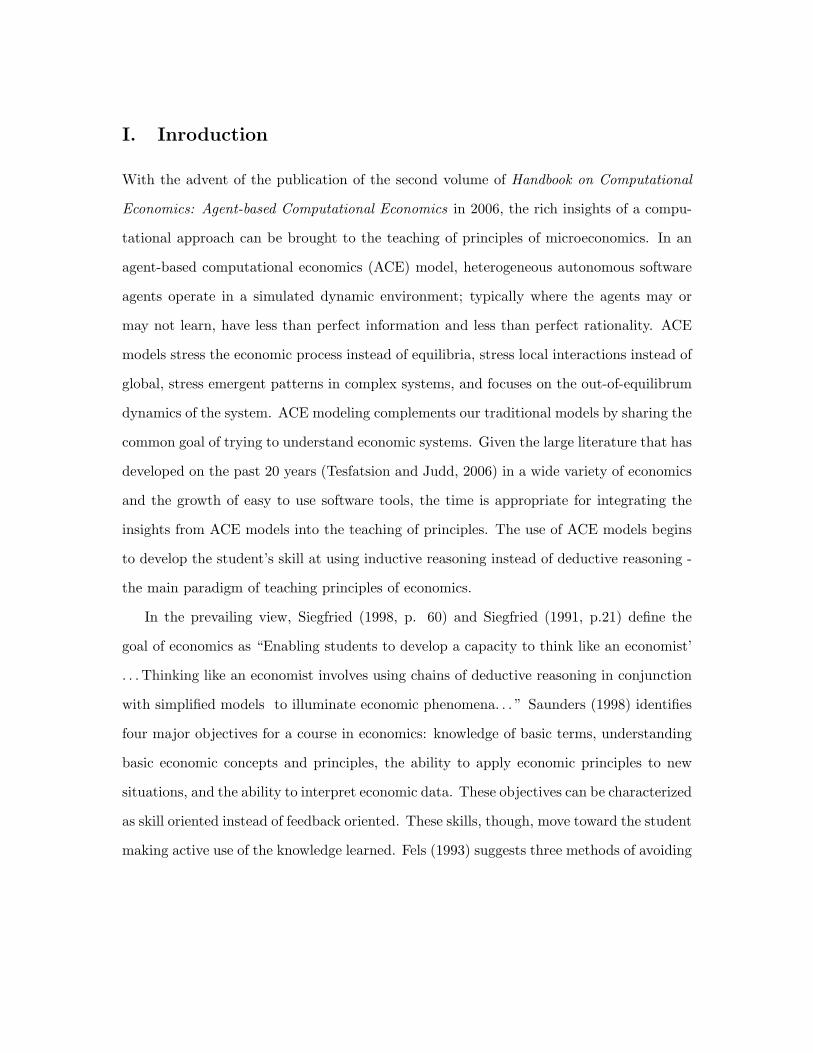
The Netlogo model (Figure 3) is the PD Basic Evolutionary Model provided in Net-
logo’s model library (Wilensky, 2002c). In the PD Basic Evolutionary Model the agents
exist over a rectangle landscape.9 Each agent is randomly given a strategy of cooperate7In the six strategies given, tit-for-tat does not necessarily come out on top; unforgiving does better
against random and does as well as tit-for-tat against the other strategies.8Axelrod (2006) argues that tit-for-tat does well because it plays nice by cooperating at the start, is
provocable because it retaliates immediately, is forgiving because it immediately forgives, is very clear, andit plays well against itself.
9Actually, the topology is a torus since the agents at the top edge interact with the agents at the bottom
11
or defect at the start. At each round of the game, the agents play against their eight
neighbors.10 An agent that cooperated earns a score equal to the number of neighbors that
also cooperated. An agent that defects earns a score equal to the number of neighbors who
cooperated multiplied by the defection award multiplier. Each agent selects its strategy
for the next round by mimicking the strategy of its neighbor with the highest score.11
The model has only two settable parameters: percentage of agents who initially cooperate
and the defection award multiplier. The model runs continuously, keeping track of each
agent’s current and prior decisions through color coding: blue if agent played (cooperate,
cooperate), red for (defect, defect), green for (cooperate, defect), and yellow for (defect,
cooperate). The user can adjust the defection award multiplier while the simulation is
running.
2. Teaching Suggestions
The PD Basic Evolutionary model allows the instructor to have the students start thinking
about process and patterns, not static equilibria. The model will evolve to all defecting or
all cooperating given certain parameter combinations. But, more importantly, by exploring
the model the students can find parameter values where patterns emerge with areas of
cooperation, areas of defection, and areas in transition. Adjusting the defection award
multiplier can cause periods of turmoil as new patterns of cooperation and defection arise.
The students begin to understand that the static equilibria taught in principles can be
expanded to dynamic processes that evolve and change as conditions change in the market.
A lab assignment can guide the students through conducting an experiment and exploring
edge and the agents on the right edge interact with the agents on the left edge.10A Moore neighborhood.11The agent changes even if the neighbor with the highest score has a lower score then the agent himself.
12
a number of questions.12 Questions can include: What determines when defection spreads
through the society instead of cooperation (and vice-versa)? Is it possible for a“stable”
situation to exist in the society where defection and cooperation co-exist? How would you
characterize the patterns that evolve as the defection award multiplier is varied?
The PD Basic Evolutionary model follows naturally after the discussion of IPD using
the previous model. After completing a lab report outside of class, the instructor can lead
an in-class discussion of the results focusing on the process and patterns that arise and
their determinants. These discussions begin to lead the students away from the notions
that complex markets only yield static equilibria.
D. Wealth Distribution
1. Netlogo Model
The fourth model moves directly into using a classic agent-based computational economics
model to provide insights into sources of inequality in the distribution of wealth. Epstein
and Axtell (1996) developed an artificial world called Sugarscape to study a variety of
social phenomenon including trade, migration, group formation, combat, interaction with
the environment, transmission of culture, propagation of disease, and population dynamics.
In the simplest version of Sugarscape, Epstein and Axtell examined life and death in
their artificial society where agents gather and consume a single renewable resource (e.g.
sugar) over a landscape. Agents are heterogenous in the ability to locate sugar and their
metabolism for consuming sugar. Agents have a single goal of locating, consuming, and
collecting sugar. The emergent pattern in this rudimentary society is a highly skewed
distribution of wealth. The results are striking because the emergent pattern was the result
of local interactions of heterogeneous autonomous agents and illustrations self-organization.12See http://mcbridme.sba.muohio.edu/ace/labs/ for a sample lab report and homework based on the
PD Basic Evolutionary model
13
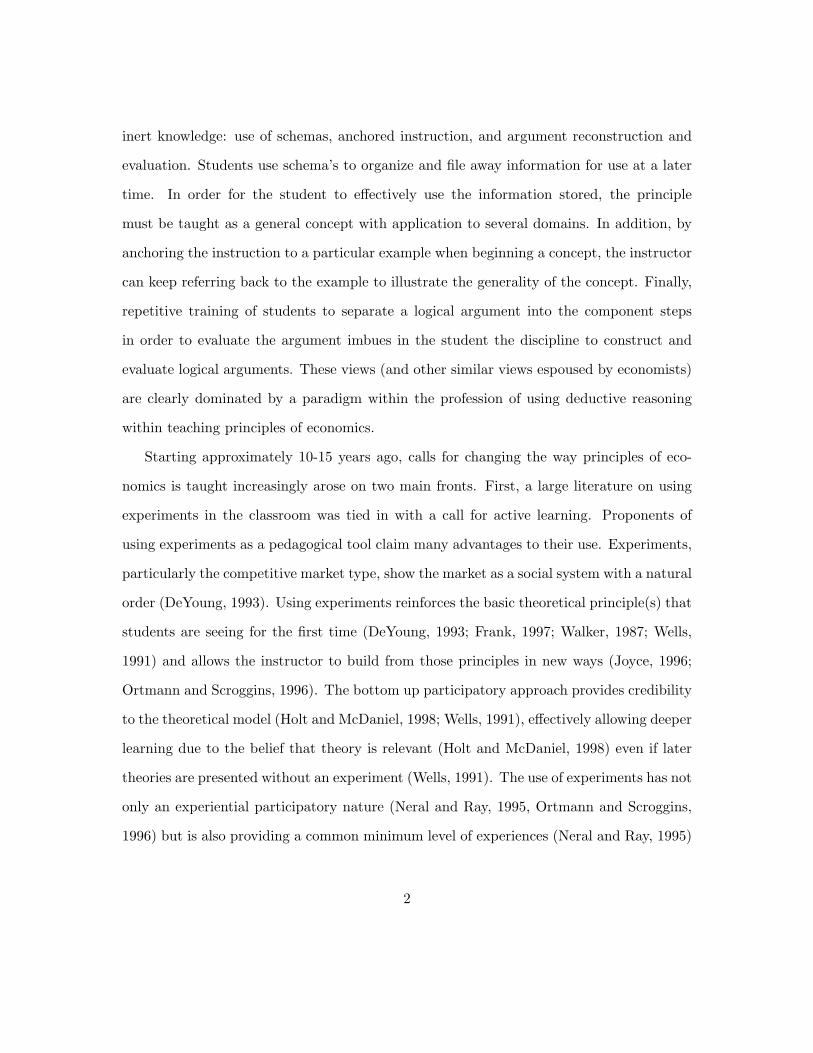
The Netlogo model (Figure 4) is the Wealth Distribution Model provided in Netlogo’s
model library (Wilensky, 1998). The Wealth Distribution Model is based on Epstein and
Axtell’s Sugarscape model. In the Wealth Distribution Model the agents exist over a
rectangle landscape.13 At start up each agent is randomly given a life expectancy, vision,
and metabolism within the ranges specified by the user settable parameters. Each patch of
land is given a semi-random amount of grain. Agents start with a roughly equal distribution
of wealth. Once the simulation is begun, the agents, in random order, look for the largest
amount of grain within their vision and move toward it. Each tick of the clock they
consumer an amount of grain equal to their metabolism. If the life expectancy runs out
or if they run out of grain, the agent dies leaving one off-spring. Off-spring do not inherit.
The off-spring is given random life expectancy, vision, metabolism and grain; just as if they
were created at the start of the simulation. The model runs continuously, keeping track of
each agent’s current wealth (grain holdings) and graphing the percentage of agents by class
over time, the Lorenz curve, and the Gini-Coefficient over time.14 The emergent behavior
of the model under most parameter combinations is a highly skewed distribution of wealth.
2. Teaching Suggestions
The Wealth Distribution Model allows the instructor to have the students continue to
thinking about process and patterns that arise through self-organization of heterogeneous
agents in local interactions. The model evolves to a skewed distribution of wealth even
if the parameters are selected to give the agent’s the best chance of finding grain and
low metabolisms. The students begin to understand that while a particular agent may
have wealth increase or decrease over time due to their local circumstances, the skewed13Actually, the topology is a torus since the agents at the top edge interact with the agents at the bottom
edge and the agents on the right edge interact with the agents on the left edge.14An agent is defined as being low income if they have less than 1/3 of the maximum wealth value held
by an agent and middle income if between 1/3 and 2/3 of the maximum.
14
distribution of wealth is an emergent property of the dynamic system. A lab assignment
can guide the students through conducting an experiment and exploring a number of
questions.15 Questions can include: How does the num-grain-grown affect the distribution
of wealth? Does life-expectancy-max affect the distribution of wealth? Why, given a
roughly equal distribution of income, does the inequality arise? Does inequality illustrate
Pareto’s Law? What factors seem to be most important? What insights can this model
help you gain about the nature of wealth inequality in a society?
The Wealth Distribution model follows naturally after the discussion an initial discus-
sion of income and wealth distribution which usual summarizes that the an individual’s
income depends on resource prices, resource endowments, and choices. After completing
a lab report outside of class, the instructor can lead an in-class discussion of the results
focusing on the conditions under which the skewed distribution arise and the likely causes.
These discussions begin to lead the students into concepts of emergent structures within
economic systems.
E. Small Worlds
1. Netlogo Model
The last model addresses that is unlikely to be covered in the majority of principles of
microeconomics courses: small worlds and networks. At least one textbook (Krugman
and Wells) includes materials on network effects focusing on the information economy and
positive feedback loops. However, the small world model focuses on how the network
structure among agents impacts emergent patterns. While not a topic typically covered
in principles of microeconomics, the topic is very timely and resonates well with young
internet savvy students. This simulation is based on a model of bilateral exchange in15See http://mcbridme.sba.muohio.edu/ace/labs/ for a sample lab report based on the PD Basic Evolu-
tionary model
15
small world networks developed by Wilhite (2001). Wilhite studied the impact of network
structure on the key elements of the trade process: search, negogiation, and exchange. In
particular, he focused on the implication of small world networks on trade. In a small
world network, an agent is only a few connections away from any other agent. Small world
networks were popularized among students in the game ”six degrees of Kevin Bacon” where
participants try to link any one actor/actress to another actor/actress through third party
actors/actresses that they have shared a movie with (starting with Kevin Bacon).
The Netlogo model (Figure 5) is an adaptation of the model presented in WIlhite (2001).
In Wilhite’s mnodel, 500 agents are placed in one of four network structures (described
below). Each agent is given a random endowment of each of two goods. Good 1 can only
be held and traded in integer units while good two is perfectly divisible. Each agent has
a Cobb-Douglas utility function dependent on the two goods and all trades must satisfy
their budget constraint. Prices are specified in terms of amount of good 2 paid for a unit
of good 1.
In each round of the model, every agent (in random order) is given the opportunity to
search among all agents to which he has a network connection to find the best agent to
trade with. Agent’s are fully rational in the neoclassical sense - maximizing utility subject
to a budget constraint. The pair of agents then trade using bilateral exchange until further
trade would not improve both agent’s welfare. Rounds of trading continue until a round
occurs with no trades. The four network structures Wilhite implements are:
Global: All agents are connected to every other agents. Thus each agent is able to trade
with every other agent.
Locally Disconnected: The agents are split into distinct groups. Agents are connected
only to other agents in their group. Thus each agent can only trade with agents in
their group and no trade takes place across groups.
16
Locally Connected: The agents are split into distinct groups as in the locally disconnect
network. The groups are then arranged in a circle and each group overlaps its neigh-
boring groups by sharing one member. Thus every group has two agents who are
common to different adjacent groups. The common agents can trade with members
of either group while the rest of the members of a group can only trade within the
group.
Small World: The agents are formed into a locally connect network. Then a small num-
ber of agents are randomly selected to connect with agents in other groups. There
are two restrictions on these crossover connections. First, a crossover agent cannot
be one of the common traders shared between adjacent groups. Second, the new
connection cannot connect two groups who already have a common agent.
This model implements the major features of Wilhite’s model. The number of agents
is smaller due to limitations in clearly graphing the alternative network structures. In
addition, this model allows you to specify experiments with alternative values for key
parameters: number of agents, number of groups, number of crossover agents, and the
maximum endowment that can be randomly set for each good for each agent. After choos-
ing parameters and pressing setup, the model displays the network structure. Selecting the
highlight button and then hovering the mouse over an agent on the network highlights all
the agents with whom the selected agent can trade giving students very visual feedback on
the alternative network structures. Selecting go executes the simulation until the equilib-
rium condition of no trades in a given round is met. The model graphs the average price of
each group and provides monitors for a wide range of results from the model; notably the
total number of searches, total trades, global average price, standard deviation of global
price, predicted price, and the number of rounds to achieve equilibrium.
17
2. Teaching Suggestions
The Small Worlds model provides a somewhat non-standard topic for principles of microe-
conomics. Currently the model is used at the end of the course in a section on networks
and network effects. Note that the model is essentially neoclassical with agent’s trading
based on rational utility maximizing agents. The novel aspect of Wilhite’s work is the focus
on the impact of network structure on trade costs: search, negotiation, and exchange. The
model could be used to just focus on those issues as a stand alone topic or draw out the
implications for international trade.16 The different network structures could represent full
global trade, autarky, trade between geographic neighbors, and finally trade between geo-
graphic neighbors with selected trade between countries (small worlds). If the instructor
has discussed the law of one price, the model can be used to examine the impact of network
structure on price convergence.
The Small World model allows the students to easily and quickly complete a small scale
replication of the experiment conducted by Wilhite (2001). Repeated runs take very little
time and there are only four network structures to compare. A lab assignment can guide
the student through the small scale replication and exploring a number of questions raised
by Wilhite.17 Questions can include: How would you describe the differences between the
four network structures in terms of ability to trade? How close did each network structure
come to the predicted equilibrium price? How much dispersion was there in the actual
prices (std dev)? Which model came the closest in predicting price? Which had the
smallest std deviation? Which had the fewest searches? The fewest trades? Converged
most quickly? What criteria could be used to determine which network structure is the
best for promoting efficient trade among people?16Particularly for the wealth of the crossover agents versus the non-crossover agents.17See http://mcbridme.sba.muohio.edu/ace/labs/ for a sample lab report based on the Small World
model
18
IV. Concluding Remarks
Models drawn from agent-based computational economics provide a rich opportunity for
the teaching of principles of microeconomics. LIke experiments, ACE models show markets
as a complex system dynamic processes and emergent properties, reinforce the basic theo-
retical principle(s) that students are learning, and allow the instructor to build from those
principles in new ways that reflect advances in economics. The “bottom up” approach of
building systems with autonomous heterogeneous agents acting locally effectively allows
deeper learning due to the belief that markets are complex systems. The use of ACE
models has not only an experiential participatory nature but is also providing a common
minimum level of experiences by creating a relevant description of the economic world as
a learning environment. These experiences involve active learning processes that reflect a
research process of using both deduction and induction to arrive at understanding.
The five models presented are representative of what can be done using a relatively
low-cost tool such as Netlogo. For example, while the second model compared alternative
iterated prisoner’s dilemma strategies, Netlogo provides another model - PD N-Person
Iterated model (Wilensky, 2002a) - where agents wander the spatial landscape playing one
of a particular set of strategies. Whenever an agent encounters another agent, the two
agents play a PD game. Agents remember the history of interaction with every other
agent they meet. The model allows you to specify how many agents play each of the
available strategies and reports the average payoff level to each strategy. The model differs
from Axelrod’s (2006) tournaments in that how often each strategy plays against other
strategies is a random event. As another example, Colander (2000b) suggests using Brian
Arthur’s El Farol problem to help students move from simple choice models to complex
choices models. Netlogo’s sample library includes a version of the El Farol model. Finally,
there is a growing community of user contributed models; many of which are suitable for
19
inclusion in principles of microeconomics.18
Future plans include continuing to improve the existing lab reports for the five models
to take the students into using both deduction and induction as a means of understanding
economics, adding additional models to the available computational labs19, and refining
the approach taken in the course.
18See http://ccl.northwestern.edu/netlogo/models/community/ .19A spatial pricing model with learning is nearing completion
20
References
R. Axelrod. 2006. The Evolution of Cooperation. Perseus Books Group, revised edition.
W. E. Becker. 1997. Teaching economics to undergraduates. Journal of Economic Litera-
ture, 35(3):1347–1373.
W. E. Becker. 2003. Economics: The sexy social science? undergraduate choice: sexy or
non-sexy? Southern Economic Journal, 70(1):219–223.
T. C. Bergstrom and J. H. Miller. 1999. Experiments with Economic Principles. McGraw-
Hill Companies, Inc., 2nd edition.
W. A. Brock. 2000. Some Santa Fe scenery. In D. Colander, editor, The Complexity Vi-
sion and The Teaching of Economics, chapter 2, pages 29–49. Edward Elgar Publishers,
Cheltenham, U.K. and Northampton, Mass.
D. Colander. 2000a. Introduction. In D. Colander, editor, The Complexity Vision and The
Teaching of Economics, pages 1–16. Edward Elgar Publishers, Cheltenham, U.K. and
Northampton, Mass.
D. Colander. 2000b. Complexity and the teaching of economics In D. Colander, editor, The
Complexity Vision and The Teaching of Economics, chapter 7, pages 121–136. Edward
Elgar Publishers, Cheltenham, U.K. and Northampton, Mass.
R. DeYoung. 1993. Market experiments: The laboratory versus the classroom. Journal of
Economic Education, 24(4):335–351.
J. Duffy. 2006. Agent-based models and human subject experiments. In L. Tesfatsion and
K. L. Judd, editors, Handbook of Computational Economics: Agent-Based Computational
21
Economics, volume 2 of Handbooks of Computational Economics, chapter 19, pages 949–
1011. North-Holland, Amsterdam.
J. M. Epstein and R. Axtell. 1996. Growing Artificial Societies: Social Science From the
Bottom Up. Complex Adaptive Systems Series. Brookings Institute Press, Washington,
D.C.
R. Fels. 1993. This is what I do, and I like it. Journal of Economic Education, 24(4):365–
370.
B. Frank. 1997. The impact of classroom experiments on the learning of economics: An
empirical investigation. Economic Inquiry, 35(4):763–769.
D. K. Gode and S. Sunder. 1993. Allocative efficiency of markets with zero-intelligence
traders: Market as a partial substitute.. Journal of Political Economy, 101(1):119–137.
H. Gremmen and J. Potters. 1997. Assessing the efficacy of gaming in economic education.
Journal of Economic Education, 28(4):291–303.
C. A. Holt, and T. McDaniel. 1998. Experimental economics in the classroom. In W. B.
Walstad, and P. Saunders., editors, Teaching Undergraduate Economics: A Handbook
for Instructors, pages 257–268. Irwin McGraw-Hill, London and Toronto.
B. P. Joyce. 1996. Experiments and the intermediate micro class. Classroom Expernomics,
5(1):1–4.
J. Neral and M. Ray. 1995. Teaching tools: Experiential learning in the undergraduate
classroom: Two exercises. Economic Inquiry, 33(1):170–174.
A. Ortmann and A. Scroggins. 1996. The Ordinary Business of Students’ Lives, or, Busi-
22
ness as Usual? A Plea for the Incorporation of Game Theory, Experiments, and Expe-
riential Learning in the Principles Course. Irwin.
P. Saunders. 1998. Learning thoery and instructional objectives. In W. B. Walstad, and
P. Saunders., editors, Teaching Undergraduate Economics: A Handbook for Instructors,
pages 85–108. Irwin McGraw-Hill, London and Toronto.
J. Siegfried, R. Bartlett, W. Hansen, A. Kelley, D. McCloskey, and T. Tietenberg. 1991.
The economics major - Can and should we do better than a B-?. American Economic
Review : Papers and Proceedings, 81(2):20–25.
J. J. Siegfried. 1998. The goals and objectives of the economics major. In W. B. Wal-
stad, and P. Saunders., editors, Teaching Undergraduate Economics: A Handbook for
Instructors, pages 59–72. Irwin McGraw-Hill, London and Toronto.
J. Stodder. 2000. Putting induction back: Economics without the ’Con’ of pure deduction.
In D. Colander, editor, The Complexity Vision and The Teaching of Economics, chap-
ter 9, pages 147–166. Edward Elgar Publishers, Cheltenham, U.K. and Northampton,
Mass.
L. Tesfatsion and K. L. Judd. 2006. Handbook of Computational Economics: Agent-Based
Computational Economics, volume 2 of Handbooks of Computational Economics. North-
Holland, Amsterdam.
J. Walker. 1987. Experimental economics in the classroom. Journal of Economic Education,
18(1):51–57.
D. A. Wells. 1991. Laboratory experiments for undergraduate instruction in economics.
Journal of Economic Education, 22(3):293–300.
23
U. Wilensky. 1998. Netlogo wealth distribution model.
http://ccl.northwestern.edu/netlogo/models/WealthDistribution. Center for Connected
Learning and Computer-Based Modeling, Northwestern University, Evanston, IL.
U. Wilensky. 2002a. Netlogo pd n-person iterated model.
http://ccl.northwestern.edu/netlogo/models/PDN-PersonIterated. Center for Con-
nected Learning and Computer-Based Modeling, Northwestern University, Evanston,
IL.
U. Wilensky. 2002b. Netlogo pd two person iterated model.
http://ccl.northwestern.edu/netlogo/models/PDTwoPersonIterated. Center for Con-
nected Learning and Computer-Based Modeling, Northwestern University, Evanston,
IL.
U. Wilensky. 2002c. PD basic evolutionary model.
http://ccl.northwestern.edu/netlogo/models/PDBasicEvolutionary. Center for Con-
nected Learning and Computer-Based Modeling, Northwestern University, Evanston,
IL.
A. Wilhite. 2001. Bilateral trade and ’small-world’ networks. Computational Economics,
18(1):49–64.
24
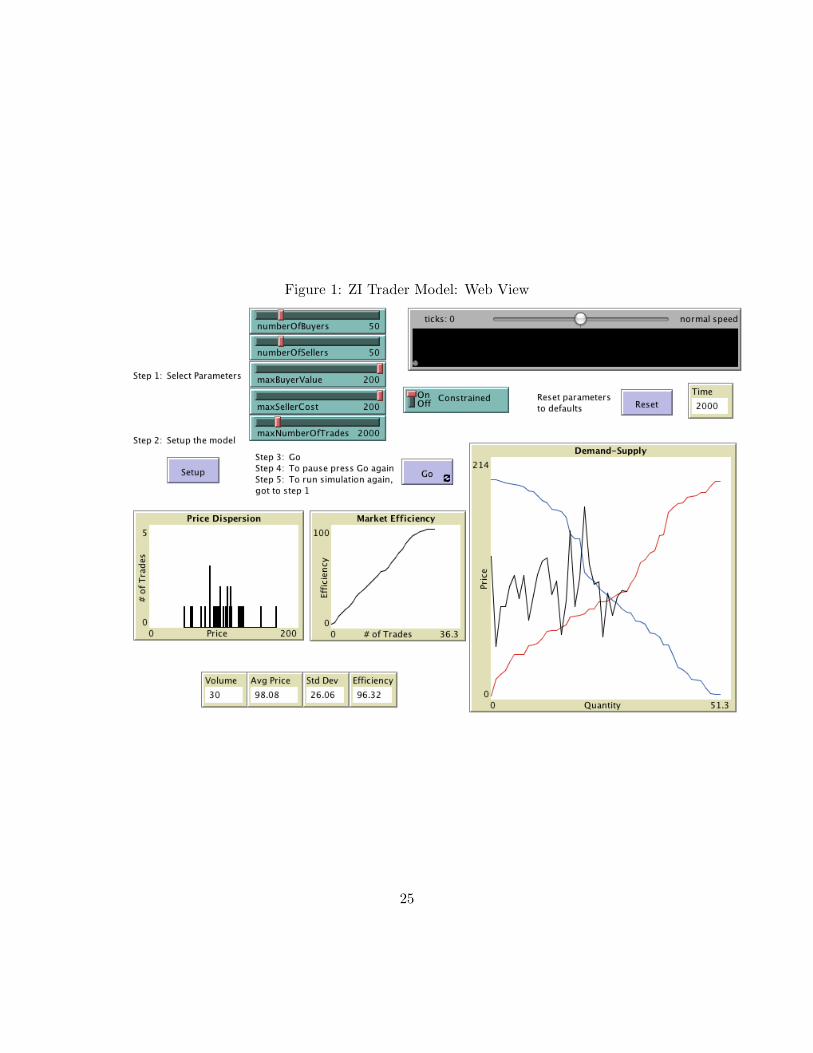
Figure 1: ZI Trader Model: Web View
25
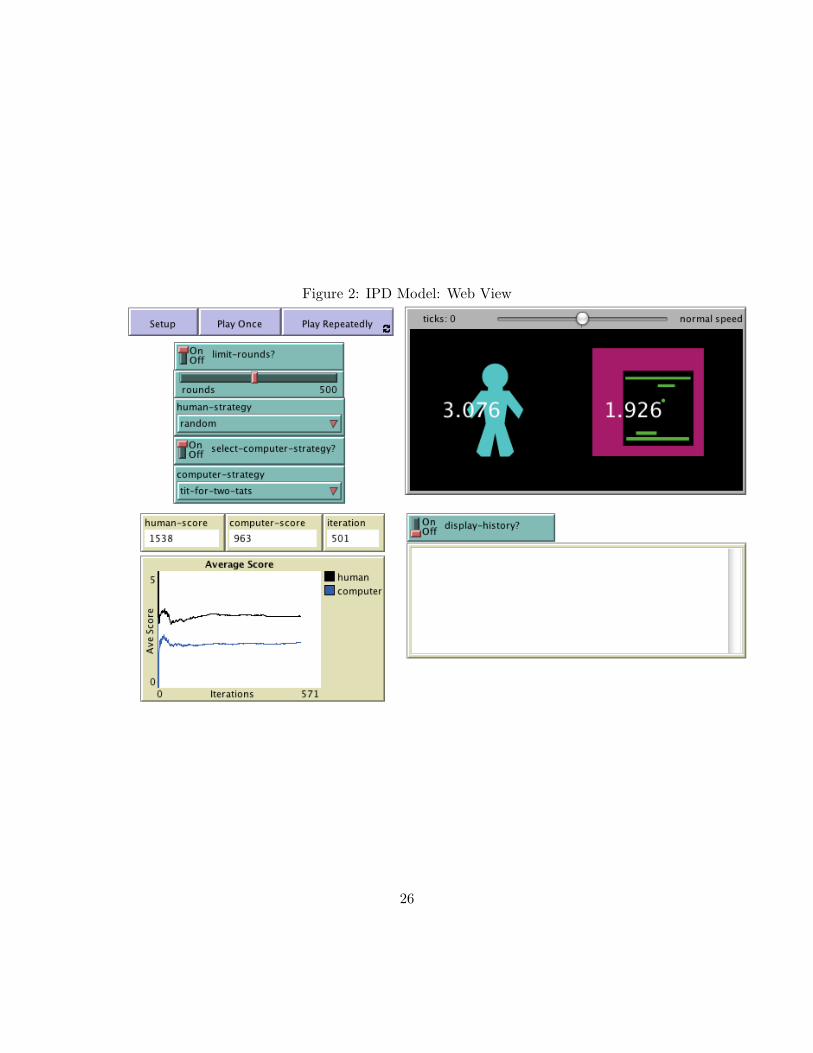
Figure 2: IPD Model: Web View
26
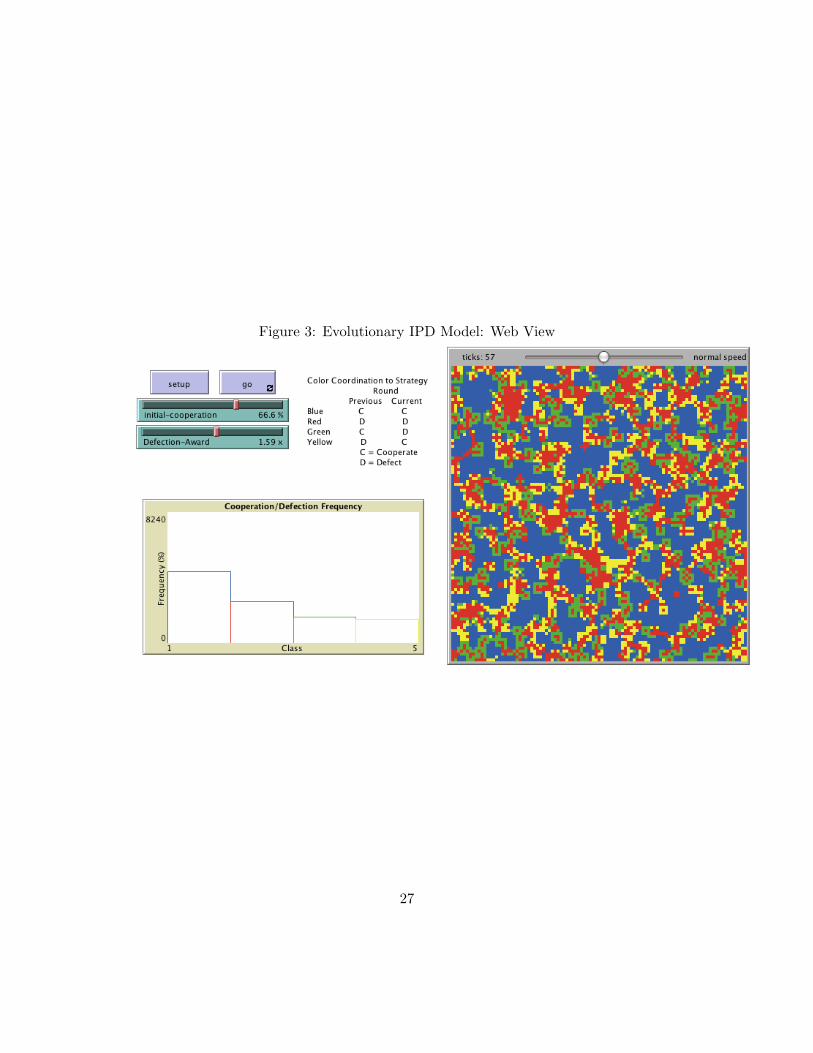
Figure 3: Evolutionary IPD Model: Web View
27
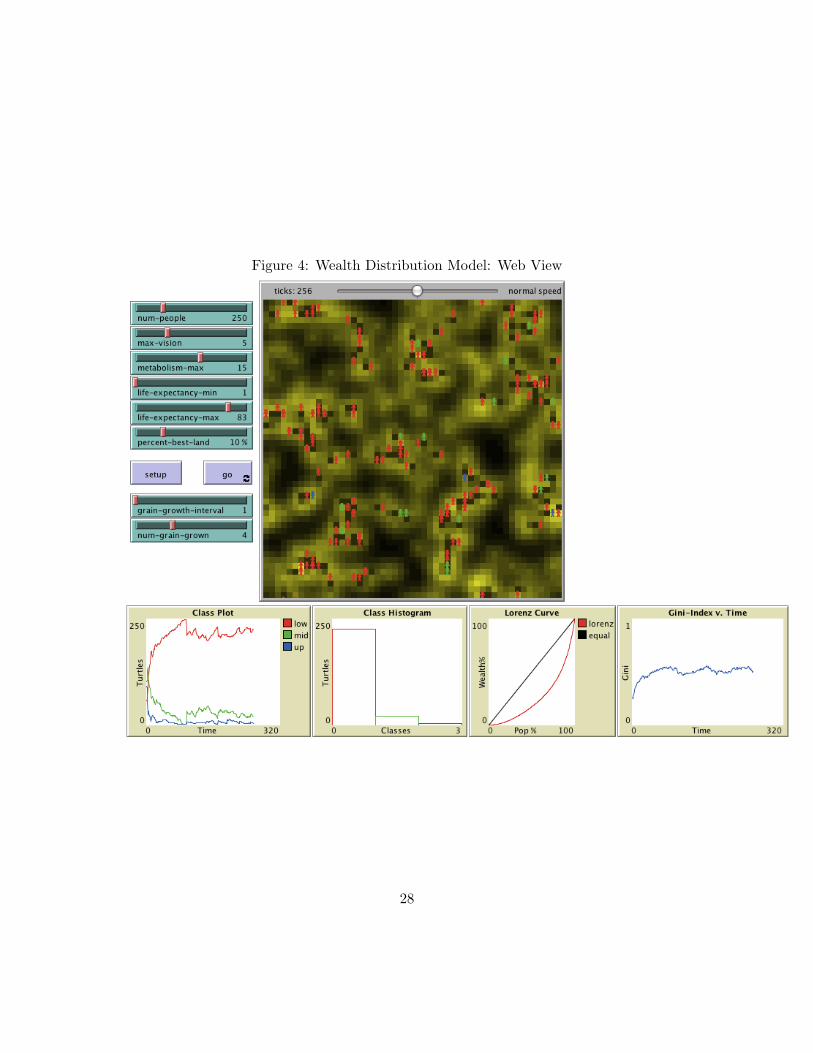
Figure 4: Wealth Distribution Model: Web View
28
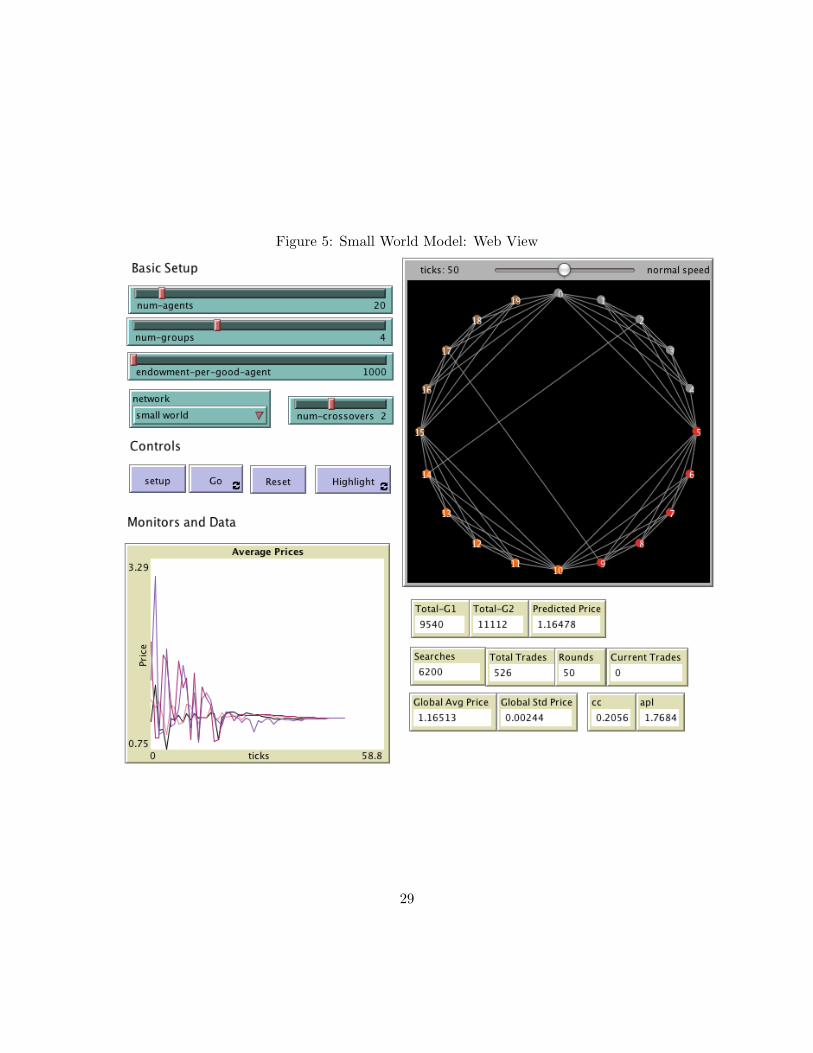
Figure 5: Small World Model: Web View
29