integrated resrecovery - build a biogas plant · integrated resrecovery anaerobic digestion...
TRANSCRIPT
WORLD BANK TECH\ICAL PAPER NUMIBEER 49 W TP- 49Integrated Resrecovery
Anaerobic DigestionPrinciples and Practices for Biogas Systems
Charles G. Gunnerson and David C. Stuckey
1 /\
- *-J
rAl UNDP Project Management Report Number 5____ A joint contribution by the United Nations Development Programme and the World Bank,ml ,99 to the International Drinking Water Supply and Sanitation Decade
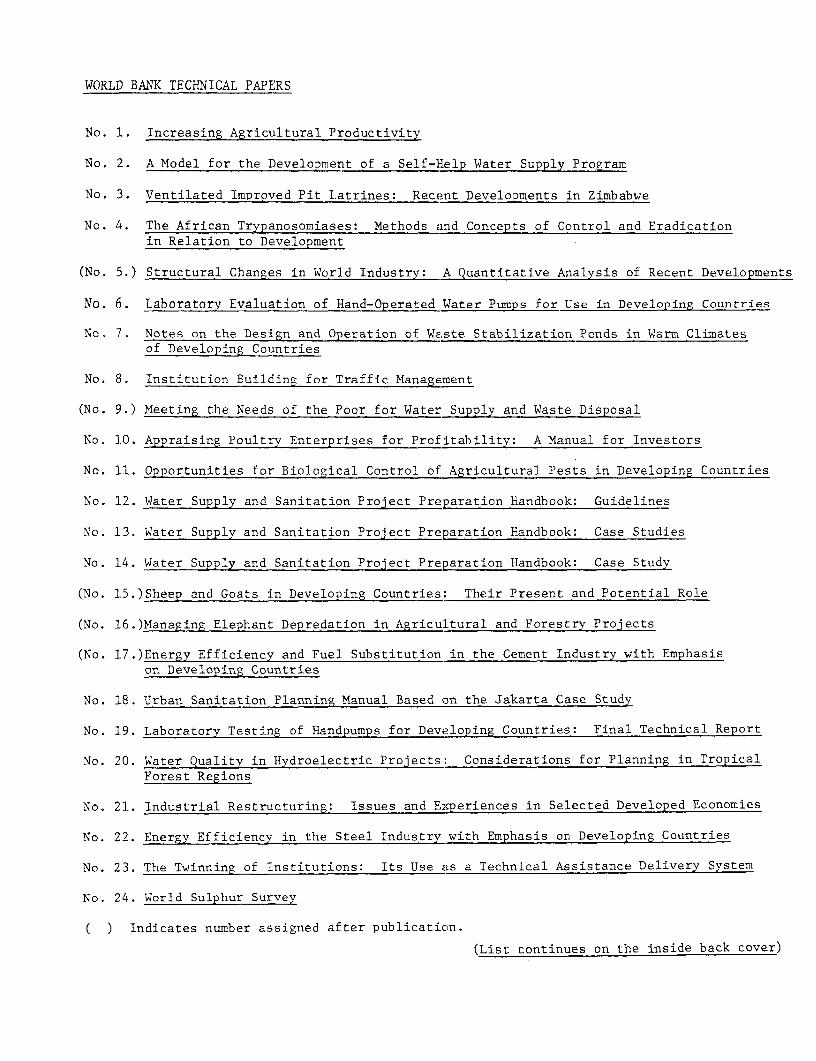
WORLD BANK TECHNICAL PAPERS
No. 1. Increasing Agricultural Productivity
No. 2. A Model for the Development of a Self-Help Water Supply Program
No. 3. Ventilated Improved Pit Latrines: Recent Developments in Zimbabwe
No. 4. The African Trypanosomiases: Methods and Concepts of Control and Eradicationin Relation to Development
(No. 5.) Structural Changes in World Industry: A Quantitative Analysis of Recent Developments
No. 6. Laboratory Evaluation of Hand-Operated Water Pumps for Use in Developing Countries
No. 7. Notes on the Design and Operation of Waste Stabilization Ponds in Warm Climatesof Developing Countries
No. 8. Institution Building for Traffic Management
(No. 9.) Meeting the Needs of the Poor for Water Supply and Waste Disposal
No. 10. Appraising Poultry Enterprises for Profitabilitv: A Manual for Investors
No. 11. Opportunities for Biological Control of Agricultural Pests in Developing Countries
No. 12. Water Supply and Sanitation Project Preparation handbook: Guidelines
No. 13. Water Supply and Sanitation Project Preparation Eandbook: Case Studies
No. 14. Water Supply and Sanitation Project Preparation Handbook: Case Study
(No. 15.)Sheep and Goats in Developing Countries: Their Present and Potential Role
(No. 16.)Managing Elephant Depredation in Agricultural and Forestry Projects
(No. 17.)Energy Efficiency and Fuel Substitution in the Cement Industry with Emphasison Developing Countries
No. 18. Urban Sanitation Planning Manual Based on the Jakarta Case Study
No. 19. Laboratory Testing of Handpumps for Developing Countries: Final Technical Report
No. 20. Water Quality in Hydroelectric Projects: Considerations for Planning in TropicalForest Regions
No. 21. Industrial Restructuring: Issues and Experiences in Selected Developed Economies
No. 22. Energy Efficiency in the Steel Industry with Emphasis on Developing Countries
No. 23. The Twinning of Institutions: Its Use as a Technical Assistance Delivery System
No. 24. World Sulphur Survey
) Indicates number assigned after publication.
(List continues on the inside back cover)

Integrated Resource Recovery
UNDP Project Management Report Number 5
INTEGRATED RESOURCE RECOVERY SERIESGLO/80/004Number 5
This is the fifth in a series of reports being prepared by theResource Recovery Project as part of a global effort to realize the goal ofthe United Nations International Drinking Water Supply and SanitationDecade, which is to extend domestic and community water supply andsanitation services throughout the developing world during 1981 to 1990.The project objective is to encourage resource recovery as a means ofoffsetting some of the costs of community sanitation.
Volumes published to date include:
Recycling from Municipal Refuse: A State of the Art Review andAnnotated Bibliography
Remanufacturing: The Experience of the United States andImplicaitons for Developing Countries
Aguaculture: A Component of Low Cost Sanitation Technology
Municipal Waste Processing Ln Europe: A Status Report onSelected Materials and Energy Recovery Projects
Other proposed volumes in this series include reports on:
CompostingDemand AnalysisEffluent IrrigationTransferable TechnologiesUltimate (marine) Disposal
Cover design. Traditional and modern energy recovery systems in developingcountries (clockwise from top). Community biogas system, Qin Long Commune,China. Biogas training poster showing modern construction methods, China.Household organic waste conversion system; the digester is a 1982 design,China. Nightsoil biogas holder and scrubber (foreground), Chuncheon,Republic of Korea. Cattle dung being dried for use as traditional fuel,Calcutta, India. Current KVIC design for gobar (cattle dung) biogasgenerator, India.
WORLD BANK TECHNICAL PAPER NUMBER 49
Anaerobic DigestionPrinciples and Practices for Biogas Systems
Charles G. Gunnerson and David C. Stuckey
with major contributions byMartin Greeley, Rolf T. Skrinde, and Roscoe F. Ward
The World BankWashington, D.C., U.S.A.
Copyright () 1986The Intemational Bank for Reconstructionand Development/THE WORLD BANK
1818 H Street, N.W.Washington, D.C. 20433, U.S.A.
All rights reservedManufactured in the United States of AmericaFirst printing April 1986
This is a document published informally by the World Bank. In order that theinformation contained in it can be presented with the least possible delay, thetypescript has not been prepared in accordance vwith the procedures appropriate toformal printed texts, and the World Bank accepts no responsibility for errors. Thepublication is supplied at a token charge to defray part of the cost of manufacture anddistribution.
The World Bank does not accept responsibility for the views expressed herein, whichare those of the author(s) and should not be attributed to the World Bank or to itsaffiliated organizations. The findings, interpretations, and conclusions are the resultsof research supported by the Bank; they do not necessarily represent official policy ofthe Bank. The designations employed, the presentation of material, and any maps usedin this document are solely for the convenience of the reader and do not imply theexpression of any opinion whatsoever on the part of the World Bank or its affiliatesconcerning the legal status of any country, territory, city, area, or of its authorities, orconcerning the delimitation of its boundaries or national affiliation.
The most recent World Bank publications are described in the annual spring and falllists; the continuing research program is described in the annual Abstracts of CurrentStudies. The latest edition of each is available free of charge from the Publications SalesUnit, Department T, The World Bank, 1818 H Stbeet, N.W., Washington, D.C. 20433,U.S.A., or from the European Office of the Bank, 66 avenue d'Iena, 75116 Paris, France.
Charles G. Gunnerson is an environmental engineering advisor with the NationalOceanic and Atmospheric Administration of the U.S. Department of Commerce, andDavid C. Stuckey is a professor at the Imperial College, London; both are consultantsto the World Bank.
Library of Congress Cataloging-in-Publication Data
Gunnerson, Charles G.Anaerobic digestion.
(World Bank technical paper ; no. 49) (UNDP projectmanagement report ; no. 5) (Integrated resourcerecovery series ; )
Bibliography: p.1. Biogas--Developing countries. I. Stuckey, David.
II. Title. III. Series. IV. Series: UNDP projectmanagement report ; no. 5. V. Series: Integratedresource recovery series ;TP359.B48G85 1986 665.7'76 86-5577ISBN 0-8213-0752-5
v
ABSTRACT
This report is part of a joint global research, development anddemonstration effort of the United Nations Development Programme and theWorld Bank. It explores the history, technology, and applications ofanaerobic digestion, the biological process by which organic materials aredegraded in the absence of oxygen to produce a combustible gas, methane(CH4 ), and carbon dioxide (CO2). This process occurs naturally in wet,decaying organic matter (biomass) found in swamps, bottom muds of streams,and garbage dumps. Since about 1900, it has been used in engineeredsystems for treatment and stabilization of municipal or industrialsludges. Starting around 1920, systems have been operated so as to capturethe biogas, identical to marsh gas which contains about 55-75 percentmethane, as an energy source. In addition to producing a fuel substitute,benefits of digestion include reduction or elimination of pathogens inhuman and animal wastes and production of a stable, generallyenvironmentally acceptable slurry or sludge which can be used as afertilizer and soil conditioner. The increases in population, standards ofliving, and energy demands, along with decreases in supplies oftraditional fuels -- conditions that were exacerbated by the 1973 andsubsequent oil crises -- have contributed to a current high level ofinterest in the science, technology, utilization, and economics of bilogas.
Anaerobic digestion is approached as an integral part of aresource recovery system. This report summarizes the current and potentialstatus and practice of anaerobic digestion in developing countries andprovides an overview of the subject plus practical data for building ananaerobic digester. Relevant information includes a survey of existingsystems and description of various models in current use, as well as adetailed exploration of the technical aspects of anaerobic digestion inboth the text and the appendix. Emphasis is on applying new engineeringconcepts to low-cost technologies, on energy, and on environmental andagricultural benefits. Energy and health benefits from digestion of nightsoil, septage, and sludges can be achieved by properly engineered andoperated biogas technologies.
This report is directed to local professionals, consultants,students, and others concerned with biogas systems.

I
- vii -
F OREWORD
In 1981, a three-year Global Research and Development Project onIntegrated Resource Recovery (Waste Recycling) was initiated as ProjectGLO/80/004 by the United Nations Development Programme through its Divisionfor Global and Interregional Projects. The World Bank, via its WaterSupply and Urban Development Department (WUD), agreed to act as executingagency.
The primary project goal is to achieve economic and socialbenefits through sustainable resource recovery activities in the developingcountries by the recycling and reuse of solid and liquid wastes frommunicipal and commercial sources.
Increasing recognition of both the need for technical andeconomic efficiency in the allocation and utilization of resources and therole that appropriate recycling can play in the waste and sanitation sectorhas led to the inclusion of this project in the formal activities of theUnited Nations International Drinking Water Supply and Sanitation (IDWSS)Decade. This particular report has also received the cooperation andsupport of the International Reference Center for Waste Disposal (IRCWD) ofthe Swiss Federal Institutes of Technology (EAWAG) as part of theircontribution to IDWSS.
The increases in population, standards of living, and energydemands, along with the increases in traditional fuels -- conditions thatwere exacerbated by the 1973 and subsequent oil crises -- have contributedto a current high level of interest in the science, technology,utilization, and economics of anaerobic digestion.
In this study, anaerobic digestion is approached as an integralpart of a resource recovery system. The report summarizes the current andpotential status and practice of anaerobic digestion in developingcountries and provides an overview of the subject plus practical data forbuilding an anaerobic digester. Emphasis is on applying new engineeringconcepts to low-cost technologies, on energy, and on environmental andagricultural benefits. Energy and health benefits from digestion of nightsoil, septage, and sludges can be achieved by properly engineered andoperated biogas technologies.
This report is directed to local professionals, consultants,students and others concerned with biogas systems. It is one of a set ofpublications to be produced by the project management, four of which havealready been distributed. We shall be grateful for comments on anyadditional sources of data for our future publications.
S. Arlosoroff, ChiefApplied Technology Unit (WUD)

- ix -
TABLE OF CONTENTS
List of Tables ....................................................... xi
List of Figures .....0... *............. ........... 0.0............... 0.0 .... *-.. xiii
Preface and Acknowledgments ... ....... .... ... -.. ... ......... ...... . xv
Chapter 1. Introduction and Overview .. ....... 1............... I
Historical Background. . .. .... .. .. I
Present Interest in Biogas........... . .... ..................... . 2
Objectives of the Review ........................ ............... 3
Overview ................................................. .. .. . 4
Conclusions ..**.... ...................................................... 6
Chapter 2. Fundamentals of Anaerobic Digestion ............ 8
Microbiology and Biochemistry.... 8
The Effects of Environmental Factors on Anaerobic Digestion..... 8
Biodegradability of Digester Feedstock .. 13
Kinetic Models.. 14
Health Aspects ........ ...... .14
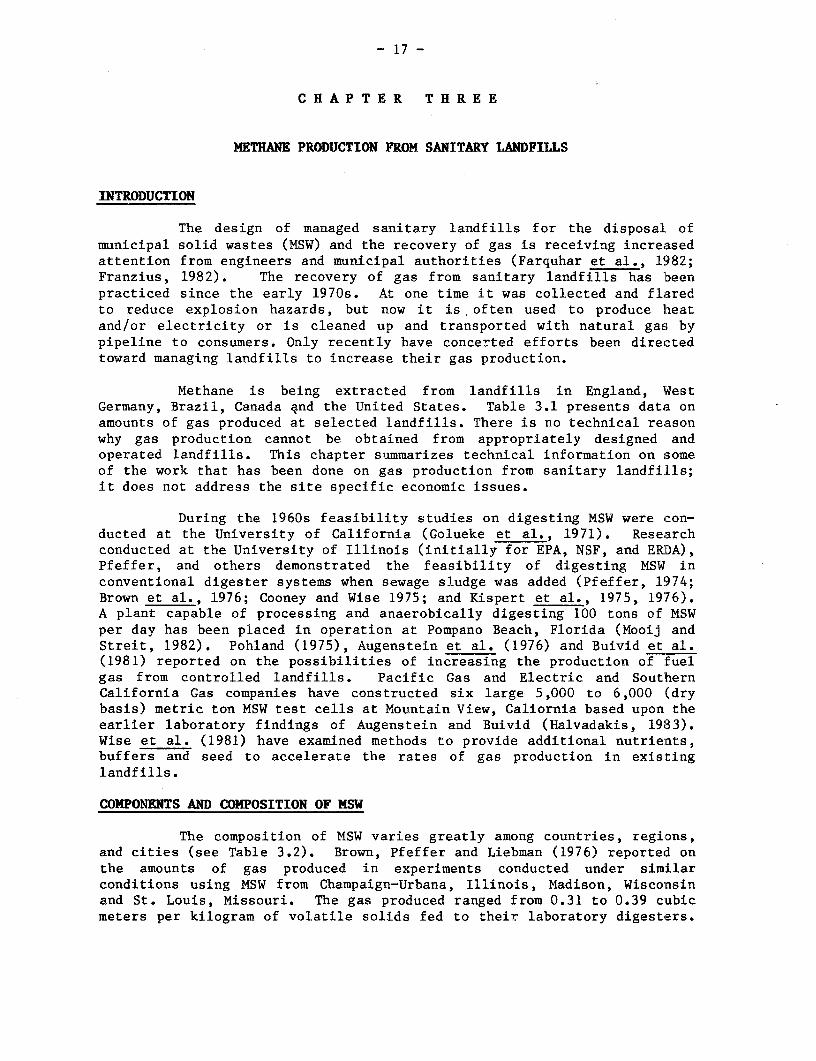
Chapter 3. Methane Production from Sanitary Landfills 17
Introduction ....... ....... .. .... 17
Components and Composition of M SW .17
Methane Generation 19........... 19
Variables Affecting Landfill Gas Produ ction. 21
Gas Collection and Utilization.................. . 25
Summary .................... ........ O- .. 28
Conlsonsc.l us....i on...s...**....... 0..... 28
Chapter 4. Anaerobic Processes and Digester Design.................. 30
Digester Types and Stage of Development............ ........ 30
Sizing of Digesters .i.. .. t er........... .... .. 41
Chapter 5. Outputs and Their Uses....... 57
Composition and Uses of Biogas..ee............................. 57
Composition and Uses of Digester Slurry ........ ........... 58
x
Chapter 6. Integrated Resource Recovery Systems Using
Anaerobic Digestion ... ....... . 68
Possible IRR Systems ... . ....... .............. ..................... . 68
Methodology to Assess IRR Systems ............................... 69
Optimization of Biogas within IRR Systems .. 73
Existing IRR Systems ..... .. ................... . 73
Chapter 7. Economic Justification ....... ........................... 75
Introduction ...... .............................. 75
Economic Evaluation--Definitions and Problem Areas .............. 75
Review of Past Studies ...................... 76
Problems in Measurement and Valuation ... 88
Conclusions .. . ................... 91
Chapter 8. A Survey of Biogas Programs in Developing Countries ...... 93
Northern Africa ................ . ...... ................... 93
Sub-Saharan Africa . . . ............ 94
Latin America ...... 95
China ................. .. 98
Southeast Asia .... . . .. .......... . . ... . 99
Indian Subcontinent ........... .................... ... . .. 101
Appendix I. Fundamental Considerations in Anaerobic Digestion ....... 103
Microbiology and Biochemistry ................ ......... ........ 103
Environmental Factors in Anaerobic Digestion .... 107
Biodegradability of Digester Feedstock .......................... 114
K(inetic Models ........................................................... 121
Appendix II. Glossary ........ .... .. ..... 132
References ............ ............................................... 137
- xi -
L I S T O F T A B L E S
3.1. Gas Production Rates at Selected Landfills ..................... 18
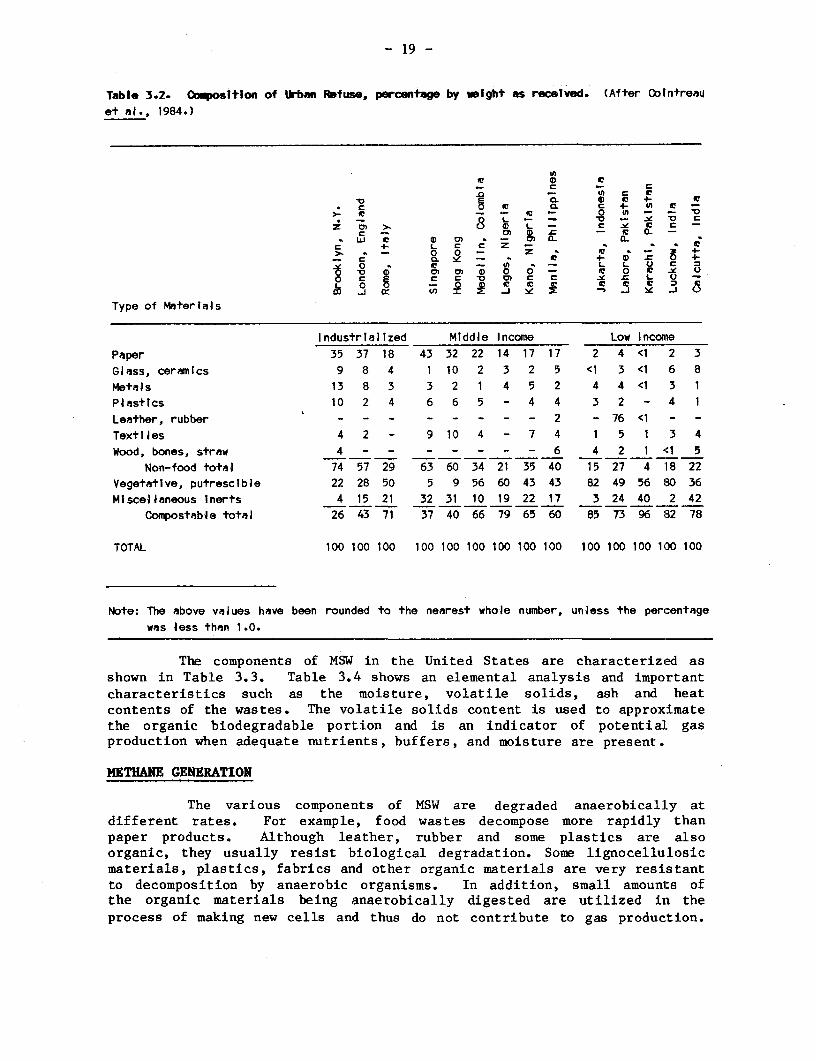
3.2. Composition of Urban Refuse ... ..... .......................... 19
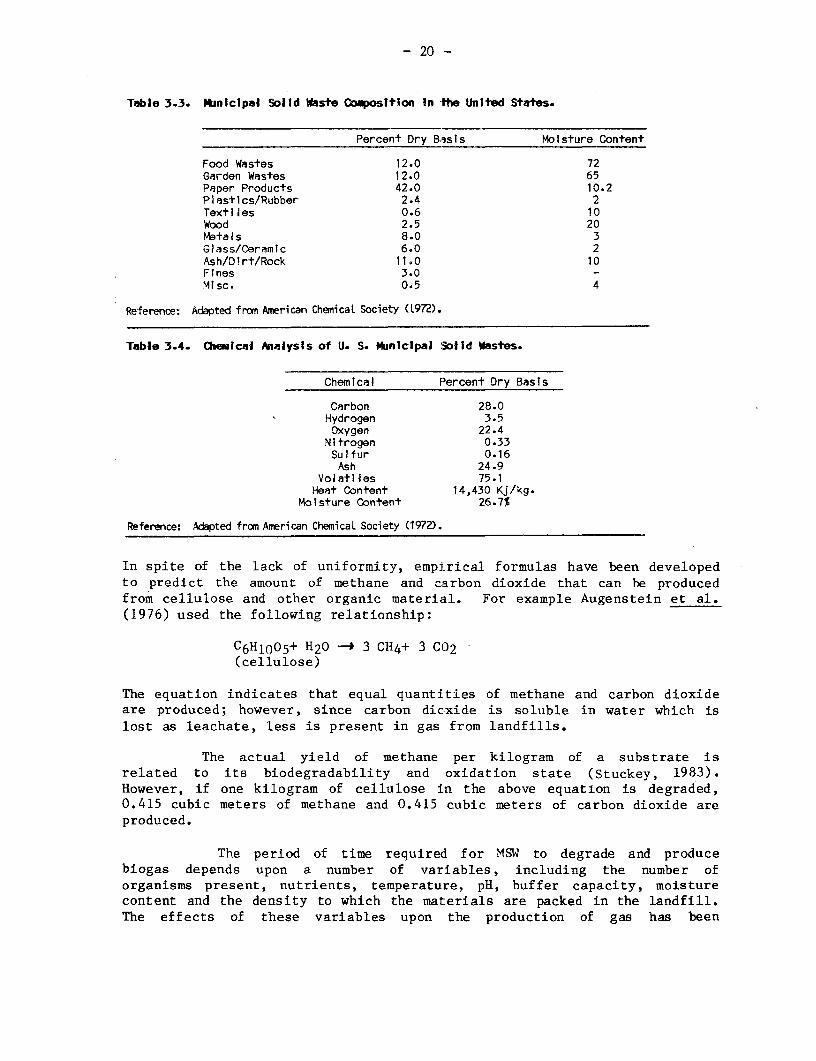
3.3. Municipal Solid Waste Composition in the United States......... 20
3.4. Chemical Analysis of U.S. Municipal Solid Wastes............... 20
4.1. Comparison of Completely Mixed Digester withPlug Flow Digester . .. ..... . .-. . ...... n... 37
4.2. Estimated Manure and Biogas Production Rates.oo ............... 44
4.3. Composition of Cattle Feedlot Manures........................... 44
4.4. Reported Volumetric Efficiencies at Temperatures between27°C and 35°C ...... ............... o.... o.o......... .o..o................. 46
4.5. Relationship among Temperature, Digester Size and MethaneProduction--Cas e h ...e ... Size nd- Mthan ...... 48
4.6. Relationship between Digester Size and Methane Production ...... 49
4.7. Relationship between Digester Size and Methane Production--Case 2 .... ................... _ _ ...... oooo ........o........ 0-0 ..... 51
4.8o Relationship between Digester Size and Methane Production---Case 3 .......... .... o_............ oooo_ ..... .*o *.6o........ ....... 52
4.9. Design and Operating Data for Five Large Dairy ManureDigesters--Case 4 . . .... - .. ... ....... . ........ . 53
4.10. Comparison of Calculated Digester Sizes Operating at 27°CAmbient Temperatures. . ..... .-.- . .... .............. .. 56
5.1. Nitrogen Loss Due to Composting or Digestion.......O........... 60
5.2. Ammonia Losses from Stored Mesophilic Effluent.. ................. 61
5.3. Estimated Quantities of Manures or Fertilizers Needed toSupply One Kilogram of Nitrogen to Any Given Area ofCropland ................... ...o.... ..o. .................... -... ..... 61
5.4. Effect of Digester Sludge on Physical and Chemical Proper-
ties of Soil . .... .................................. 63
5.5. Effect of Biogas Phosphohumate on Some Major Crops............. 64
5.6. Chemical Composition of Organic Digested Manures............... 64
5.7. Comparison of Amino Acid Composition of Cattle Waste, DriedCentrifuged Fermenter Biomass, Fermenter Influent andFermenter Effluent ...........-..................... o.e.e.......... -o...... 66
5.8. Protein Digestibility Coefficients. ..... ......................................-... 67
5.9. Influence of Digester Effluent on Metabolism, Digestibilityand Growth of Beef Steers .... ......... 67
- xii -
6.1. Pura Energy Source Activity Matrix ............................ 71
6.2. End Uses of Energy in Pura . .................................... 71
6.3. Selection of Sources and Devices for Pura., .................... 72
6.4. Community Plant for Pura Village ................... 72
7.1. Alternative Evaluations of the KVIC Two Cubic Meter BiogasPlant .......................................................... 78
I.1. Concentration of Soluble Heavy Metals Exhibiting 50% Inhibi-tion of Anaerobic Digesters . ..... .. ................... . 113
I.2. Highest Dose of Metal That Will Allow Satisfactory Digestionof Sludge (continuous dosage) ......... ..... ........ . 113
I.3. Values for ae and Y in Equation 23 for Methane Fermentationof Various Waste Components . . .... oo .............. ............ .. 116
I.4 Biodegradability of Various Digesttsrs Feeds . o..... 118
I.5 Anaerobic Biodegradability of Plant Constituents .. 119
- xiii -
L I S T O F F I G U R E S
2.1. Relative Digestion Time of Plain-Sedimentation Sludge Diges-ted at Temperatures of I0°C to 70°C ................ ........... 10
2.2. The Effect of Temperature on Methanogens .................. ..... 11
2.3. Influence of Time and Temperature on Selected Pathogens inNightsoil and Sludge .............. ................ ........... .. .. 16
3.1. Potential Methane Production from Municipal Solid WasteLandfills ........ **, * * * * * *............................. 22
3.2. Solid Wastes Converted to Gas over Time ....... 23
3.3. Percent Total Gas Yield Per Year, Managed Landfill . . 23
3.4. Gas Production from a Landfill in Brail .. 28
4.1. Batch Digester ..................................... 30
4.2. Fixed Dome (Chinese) Digester .................................. 32
4.3. Floating Cover (Indian) Digester ................ I .............. 33
4.4. Bag (Taiwan, China) Digester .................... ... 35
4.5. Plug Flow Digester ............................................. 36
4.6. Anaerobic Filter ............. . 38
4.7. Anaerobic Baffled Reactor (ABR) ............... 39
4.8. Anaerobic Contact Digester .................................... .. . 40
4.9. Upflow Anaerobic Sludge Blanket (UASB) ......................... 40
4.10. Effect of Oc on the Relative Breakdown of Degradable WasteComponents and Methane Production ............................ . 43
4.11. Interrelationships between Hydraulic Retention Time,Operating Temperature, and Methane Production in AnaerobicDigestion (Biogas) Systems.for Cattle Manure ................... 49
5.1. Some Alternative Options for Utilization of 100 Kilograms ofFresh Cattle Dung .... ......................................... 62
5.2. Average Standing Crop of Fish in Fish Pond Experiments inWhich Fish were Fed with Different Combinations of Commer-cial Pellets and Thermophilically Digested Slurry ofCow Manure .................... .. ............ 65
6.1. Components of the Integrated Bio-Energy System ............. .... 69
6.2. Energy Generation and Use in Rural Areas ....................... 70
6.3. Community Plant for Pura Village ........................... .... 72
I.1. Simplified Scheme of the Pathways Involved in the Catabo-lism of Carbohydrates by Fermentative Bacteria and theGeneral Trends in the Formation of the Major Endproducts atLow and High Partial Pressures of H2 ... .0 ......... ... 106

- xiv -
1.2 Proton Activity Relationship for Methanogenesis ................ 108
I.3 Logarithmic Equilibrium Diagram of the Distribution of theMain Solute, Inorganic, pH-buffering Species in the Super-natant of Digested Sewage Sludge .............................. 110
I.4 Composition of Biogas Depending on Mean Oxidation State ofCarbon in the Substrate, Assuming Total Mineralization......... 115
- xv -
PREFACE AND ACKNOWLEDGMENTS
The purpose of this report is to provide information to off:Lcialsin the developing countries about those anaerobic digestion facilitiesthroughout the world that provide energy and health benefits from digestionof crop wastes and animal offal, night soil, septage, and sludges. A briefhistory of the subject; a primer on the fundamentals of anaierobicdigestion, landfills, and digester designs; a discussion of the variousoutputs and their uses, alone or in integrated resource recovery sytems; anoverview of the economics involved; and a survey of existing biogasprograms are included within the text. Appendix I provides more detailedtechnological information for the engineer, and Appendix II comprises aglossary of terms. A detailed Bibliography supplies additional sources ofinformation.
The generous help and collaboration of a number of people duringthe preparation of this report are gratefully acknowledged. The support ofMr. Roland Schertenleib, Director, International Reference Center for WasteDisposal (IRCWD), Swiss. Federal Institutes of Technology (EAWAG), inDuebendorf, Switzerland, is especially acknowledged.
Thanks are also due to six short-term consultants who collectedinformation in the various regions of the world: in Latin America, Dr.Alvara Umana of the University of Costa Rica, and Guillermo Duarte Monroy;in Northern Africa, Dr. M. M. El-Halwagi of the National Research Cenitre inCairo, Egypt; in Southern Africa, Dr. P. A. M. Misiko of Egerton College,Njoro, Kenya; in Southeast Asia, Prof. Oei Ban Liang of the BandungInstitute of Technology, Bandung, Indonesia; and in China, Chan U Sam ofMacau.
In addition, Mick Howes of the Institute of Development Studiesof the University of Sussex provided considerable input on the social/institutional aspects of biogas; Andrew Barnett of the InternaltionalDevelopment Research Centre, Ottawa, was of great help in reviewing andcommenting on the chapters on the economics and diffusion of biogas; Mr.C. P. Halvadakis of Biosferiki in Athens made significant comments :in hisreview, especially on methane production from sanitary landfills; andProf. G. Lettinga and his colleagues of the Agriculture University inWageningen, Netherlands, presented a thorough review of the report as awhole.
Ms. Elissa Bellassai was invaluable in helping plot and designnumerous graphs and in formatting the bulk of the finished paper. Theproduction process was ably assisted by Ms. Deirdre Murphy and Mrs.Margaret Carnes.

A
C H A P T E R O N E
INTRODUCTION AND OVERVIEW
In recent years the conversion of biomass materials to methanefor use as an energy source has excited interest throughout the world.This conversion is accomplished by anaerobic digestion, the biologicalprocess by wh-ch organic materials or feedstocks are degraded in theabsence of oxygen to produce a combustible gas, methane (CH4), and carbondioxide (Co2). The energy product is often called "biogas." In India thecommon name is 'gobar gas" after the Hindi word for cattle dung, which isthe predominant organic feed for their anaerobic digesters. Another termwhich is occasionally used in Europe is "bihugas," which is an abbreviationfor "biological humus and gas." For the sake of convenience the term"biogas" will be used throughout this review since it is the term mostcommonly used in the literature when referring to the product of anaerobicdigestion in developing countries.
Other benefits of digestion include reduction or elimination ofpathogens, depending upon temperature, and production of a stable,generally environmentally acceptable slurry or sludge which can be used asa fertilizer and soil conditioner.
HISTORICAL BACKGROUND
One of the earliest to mention the mysterious appearance offlickering lights and flames emerging from below the surface of the earthwas Plinius (van Brakel, 1980). The explanation for this phenomenon wasthat it was the product of the local dragon, and it is highly probable thatthese occurrences gave rise to the myth of dragons. The Romans calledthese mysterious dancing flames "ignis fatuus"--foolish fire, for manypeople who were fascinated by them were lured into trackless swamps. InEnglish the term "will-o-wisp" is derived from these ephemeral flames.
In 1630 Van Helmont recorded the emanation of an inflammable gasfrom decaying organic matter. In 1667 Shirley described this gas moreprecisely, and is sometimes considered to be its discoverer. However,Volta is generally recognized as putting methane digestion on a scientificfooting. From a number of observations he concluded in 1776 that:
a. the amount of gas that evolves is a function of the amount ofdecaying vegetation in the sediments from which the gas emerges;and
b. certain proportions of the gas so obtained form an explosivemixture with air.
In 1804 Dalton established the chemical composition of methane,and in 1806 Henry confirmed that town gas was very similar to Vo]ta's"marsh gas." In 1808 Davy established that methane was produced from
- 2 -
decomposing cattle manure, which may be the first time readily availableorganic wastes were recognized as a source of energy.
It was not until toward the end of the 19th century thatmethanogenesis was found to be connected to microbial activity. In 1868Bechamp, a student of Pasteur, named the "organism" responsible for methaneproduction from ethanol. This organism was apparently a mixed populationsince Bechamp was able to show that depending on the substrate differentfermentation products were formed. Popoff, in 1875, was the first tosystematically investigate the formation of methane using different complexsubstrates, and he found that with cellulose the end products were methane,carbon dioxide and some hydrogen, while with acetate no methane wasproduced. However, in 1876 Herter, a collaborator of Hoppe-Seyler,reported that acetate in sewage sludge was converted stoichiometrically toequal amounts of methane and carbon dioxide (Zehnder 1978, 1982).
In 1884 Gayon, another student of Pasteur, fermented manure at35°C, obtaining 100 liters of methane per cubic meter of manure. It wasconcluded that the fermentation could be a source of gas for heating andlighting, and the "Compagnie des Omnibus" in Paris requested that Gayondesign an installation in which the manure of their many horses could bedigested to methane to be used for street lighting. Gayon declined,however, saying that his work was only preliminary (van Brakel, 1980). Asearly as 1896 gas from sewage was used for lighting streets in Exeter,England, and gas from human wastes in the Matinga Leper Asylum in Bombay,India was used to provide lighting in 1897.
In 1906 Sohngen was able to enrich for two distinct acetateutilizing bacteria, and he found that formate, and hydrogen plus carbondioxide could act as precursors for methane. This remained the majorbreakthrough in the microbiology of methane bacteria for thirty years.
On the applied side, Buswell began studies of anaerobic digestionin the late 1920s and developed a solid base of information on such issuesas the fate of nitrogen in anaerobic digestion, the stoichiometry of reac-tion, the production of energy from farm wastes and the use of the processfor industrial wastes (Buswell and Neave, 1930; Buswell and Hatfield,1936).
Barker's studies contributed significantly to our knowledge ofmethane bacteria, and his enrichment cultures enabled him to perform manyof the common biochemical studies (Barker, 1956). Schnellen was the firstworker to isolate two methane bacteria in 1947, Methanosarcina barkeri andMethanobacterium formicium. Much of this work is still relevant today, andthose who are developing biogas as an energy source would gain much fromreview of this earlier work.
PRESENT INTEREST IN BIOGAS
The technology of anaerobic digestion has not yet realized itsfull potential for energy production. In industrialized countries biogasprograms are often hindered by operational difficulties, a lack of basic
understanding of the fundamentals involved, and little engineeringinnovation. In some developing countries, on the other hand, developmentof biogas programs has lacked urgency because of readily available andinexpensive noncommercial fuels such as firewood.
Biogas technology is also potentially useful in the recycle ofnutrients back to the soil. Burning of noncommercial fuel sources such asdung and agricultural residues leads to a severe ecological imbalance sincethe nutrients (nitrogen, phosphorus and micronutrients) are essent:Lallylost from the ecosystem. Biogas production from organic materials not onlyproduces energy, but preserves the nutrients, which can be recycled back tothe land in the form of a slurry. The organic content also acts as a soilconditioner by contributing humus. Fertilizing and conditioning of soilcan be achieved by simply using other fuel sources and recycling the wasteback to the land without burning it. However, while data are sparse,Chinese workers report that digested biomass increases agricull:uralproductivity by as much as 30% over farmyard manure on an equivalent basis(van Buren, 1979). This is due in part to the biochemical processesoccurring during digestion which cause the nitrogen in the digested slurryto be more accessible for plant utilization, and to the fact that lessnitrogen is lost during, digestion than in storage or composting. Thisaspect of biogas technology may, in fact, be more important than the! gasproduced (Gosling, 1980).
In the area of public health and pollution control, bLogastechnology can solve another major problem, that of disposal of sanLtarywastes. Digestion of these wastes can reduce the parasite and pathogenicbacterial counts by over 90% (Feacham et al., 1983; McGarry and Stainforth,1978; van Buren, 1979), breaking the vicious circle of reinfection viadrinking water, which in many rural areas is untreated. Industrial wastetreatment using anaerobic digestion is also possible.
To summarize, biogas technology is receiving increased attentiondue to its potential to alleviate the following problems:
a. dependence on imported commercial fuels;
b. deforestation and resulting erosion leading to loss in agri-cultural productivity;
c. shortage of inexpensive fertilizers to increase food produc-tion;
d. disposal of sanitary wastes which could cause severe publichealth problems; and
e. disposal of industrial wastes which cause water pollution.
OBJECTIVES OF THE REVIEW
Many planners and engineers have expressed an interest in acohesive discussion of anaerobic digestion and biogas techno:Logy.
-4-
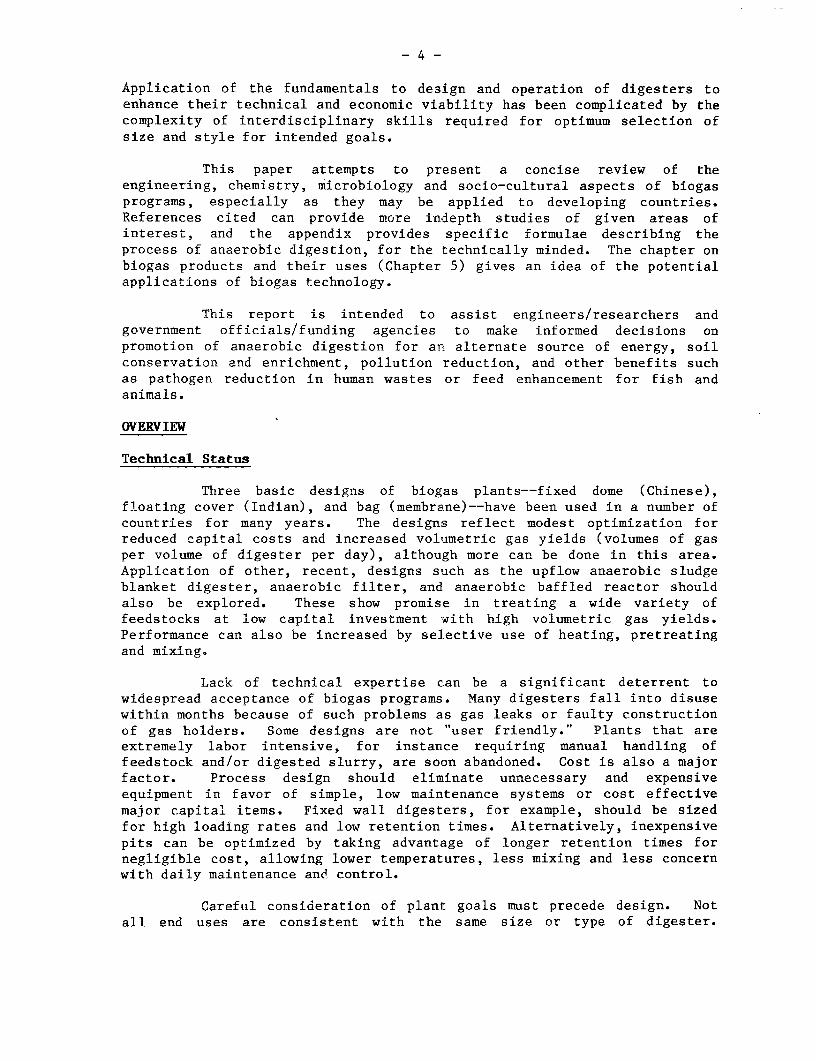
Application of the fundamentals to design and operation of digesters toenhance their technical and economic viability has been complicated by thecomplexity of interdisciplinary skills required for optimum selection ofsize and style for intended goals.
This paper attempts to present a concise review of theengineering, chemistry, microbiology and socio-cultural aspects of biogasprograms, especially as they may be applied to developing countries.References cited can provide more indepth studies of given areas ofinterest, and the appendix provides specific formulae describing theprocess of anaerobic digestion, for the technically minded. The chapter onbiogas products and their uses (Chapter 5) gives an idea of the potentialapplications of biogas technology.
This report is intended to assist engineers/researchers andgovernment officials/funding agencies to make informed decisions onpromotion of anaerobic digestion for ar alternate source of energy, soilconservation and enrichment, pollution reduction, and other benefits suchas pathogen reduction in human wastes or feed enhancement for fish andanimals.
OVERVIEW
Technical Status
Three basic designs of biogas plants--fixed dome (Chinese),floating cover (Indian), and bag (membrane)--have been used in a number ofcountries for many years. The designs reflect modest optimization forreduced capital costs and increased volumetric gas yields (volumes of gasper volume of digester per day), although more can be done in this area.Application of other, recent, designs such as the upflow anaerobic sludgeblanket digester, anaerobic filter, and anaerobic baffled reactor shouldalso be explored. These show promise in treating a wide variety offeedstocks at low capital investment with high volumetric gas yields.Performance can also be increased by selective use of heating, pretreatingand mixing.
Lack of technical expertise can be a significant deterrent towidespread acceptance of biogas programs. Many digesters fall into disusewithin months because of such problems as gas leaks or faulty constructionof gas holders. Some designs are not user friendly." Plants that areextremely labor intensive, for instance requiring manual handling offeedstock and/or digested slurry, are soon abandoned. Cost is also a majorfactor. Process design should eliminate unnecessary and expensiveequipment in favor of simple, low maintenance systems or cost effectivemajor capital items. Fixed wall digesters, for example, should be sizedfor high loading rates and low retention times. Alternatively, inexpensivepits can be optimized by taking advantage of longer retention times fornegligible cost, allowing lower temperatures, less mixing and less concernwith daily maintenance and control.
Careful consideration of plant: goals must precede design. Notall end uses are consistent with the same size or type of digester.
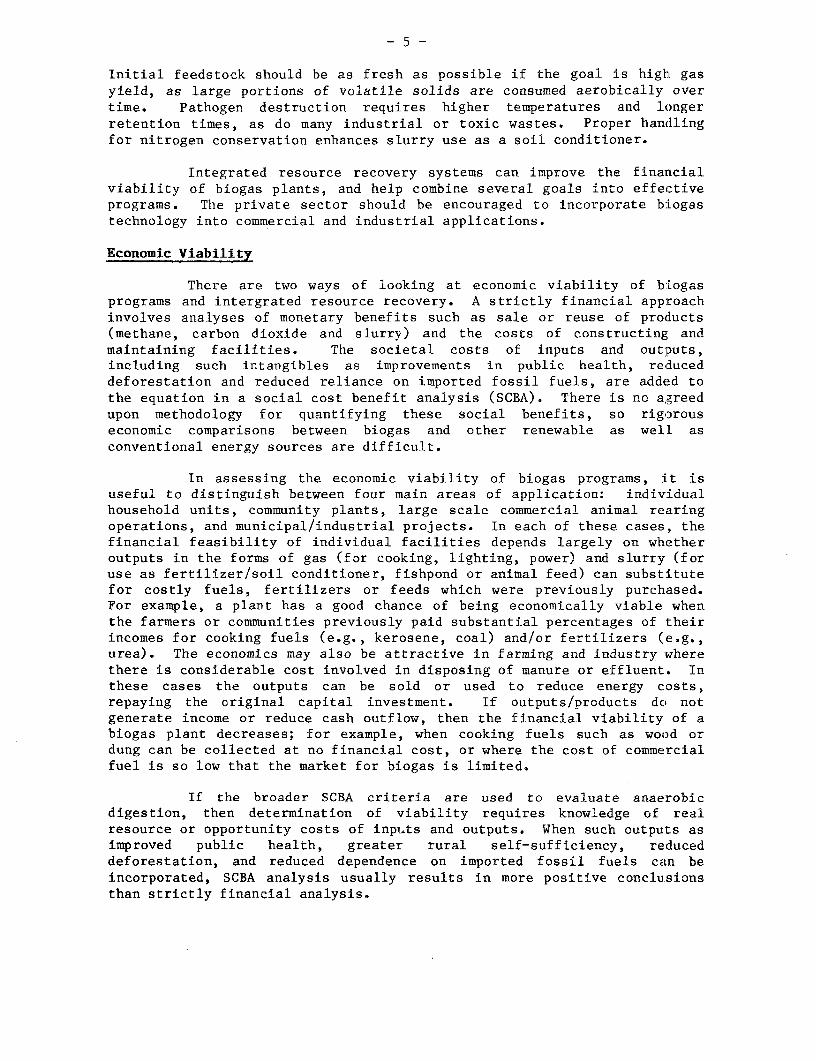
Initial feedstock should be as fresh as possible if the goal is high. gasyield, as large portions of volatile solids are consumed aerobically overtime. Pathogen destruction requires higher temperatures and longerretention times, as do many industrial or toxic wastes. Proper handlingfor nitrogen conservation enhances slurry use as a soil conditioner.
Integrated resource recovery systems can improve the financialviability of biogas plants, and help combine several goals into effectiveprograms. The private sector should be encouraged to incorporate b:iogastechnology into commercial and industrial applications.
Economic Viability
There are two ways of iooking at economic viability of biogasprograms and intergrated resource recovery. A strictly financial approachinvolves analyses of monetary benefits such as sale or reuse of products(methane, carbon dioxide and slurry) and the costs of constructing andmaintaining facilities. The societal costs of inputs and outputs,including such intangibles as improvements in public health, reduceddeforestation and reduced reliance on imported fossil fuels, are added tothe equation in a social cost benefit analysis (SCBA). There is no agreedupon methodology for quantifying these social benefits, so rigorouseconomic comparisons between biogas and other renewable as well asconventional energy sources are difficult.
In assessing the economic viability of biogas programs, it isuseful to distinguish between four main areas of application: individualhousehold units, community plants, large scale commercial animal rearingoperations, and municipal/industrial projects. In each of these cases, thefinancial feasibility of individual facilities depends largely on whetheroutputs in the forms of gas (for cooking, lighting, power) and slurry (foruse as fertilizer/soil conditioner, fishpond or animal feed) can substitutefor costly fuels, fertilizers or feeds which were previously purchased.For example, a plant has a good chance of being economically viable whenthe farmers or communities previously paid substantial percentages of theirincomes for cooking fuels (e.g., kerosene, coal) and/or fertilizers (e.g.,urea). The economics may also be attractive in farming and industry wherethere is considerable cost involved in disposing of manure or effluent. Inthese cases the outputs can be sold or used to reduce energy costs,repaying the original capital investment. If outputs/products dci notgenerate income or reduce cash outflow, then the financial viability of abiogas plant decreases; for example, when cooking fuels such as wood ordung can be collected at no financial cost, or where the cost of commercialfuel is so low that the market for biogas is limited.
If the broader SCBA criteria are used to evaluate anaerobicdigestion, then determination of viability requires knowledge of realresource or opportunity costs of inputs and outputs. When such outputs asimproved public health, greater rural self-sufficiency, reduceddeforestation, and reduced dependence on imported fossil fuels can beincorporated, SCBA analysis usually results in more positive conclusionsthan strictly financial analysis.
-6-
Biogas Programs in Developing Countries
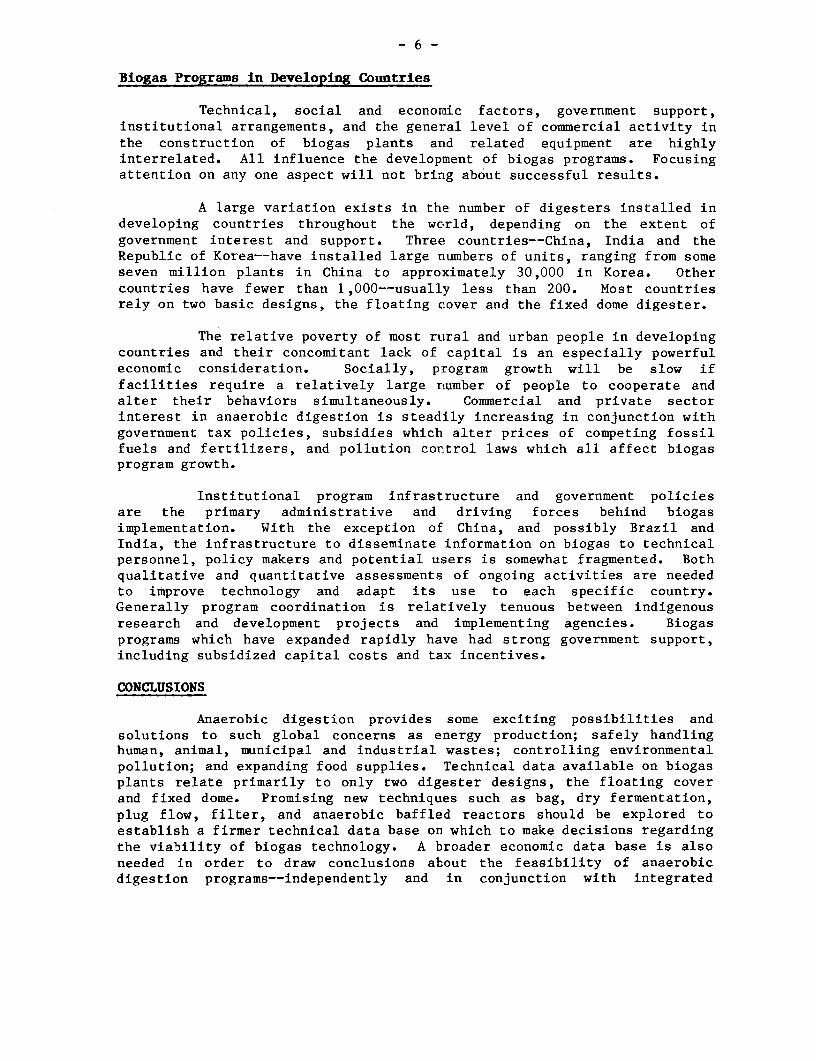
Technical, social and economic factors, government support,institutional arrangements, and the general level of commercial activity inthe construction of biogas plants and related equipment are highlyinterrelated. All influence the development of biogas programs. Focusingattention on any one aspect will not bring about successful results.
A large variation exists in the number of digesters installed indeveloping countries throughout the world, depending on the extent ofgovernment interest and support. Three countries--China, India and theRepublic of Korea--have installed large numbers of units, ranging from someseven million plants in China to approximately 30,000 in Korea. Othercountries have fewer than 1 ,000--usually less than 200. Most countriesrely on two basic designs, the floating cover and the fixed dome digester.
The relative poverty of most rural and urban people in developingcountries and their concomitant lack of capital is an especially powerfuleconomic consideration. Socially, program growth will be slow iffacilities require a relatively large number of people to cooperate andalter their behaviors simultaneously. Commercial and private sectorinterest in anaerobic digestion is steadily increasing in conjunction withgovernment tax policies, subsidies which alter prices of competing fossilfuels and fertilizers, and pollution control laws which all affect biogasprogram growth.
Institutional program infrastructure and government policiesare the primary administrative and driving forces behind biogasimplementation. With the exception of China, and possibly Brazil andIndia, the infrastructure to disseminate information on biogas to technicalpersonnel, policy makers and potential users is somewhat fragmented. Bothqualitative and quantitative assessments of ongoing activities are neededto improve technology and adapt its use to each specific country.Generally program coordination is relatively tenuous between indigenousresearch and development projects and implementing agencies. Biogasprograms which have expanded rapidly have had strong government support,including subsidized capital costs and tax incentives.
CONCLUSIONS
Anaerobic digestion provides some exciting possibilities andsolutions to such global concerns as energy production; safely handlinghuman, animal, municipal and industrial wastes; controlling environmentalpollution; and expanding food supplies. Technical data available on biogasplants relate primarily to only two digester designs, the floating coverand fixed dome. Promising new techniques such as bag, dry fermentation,plug flow, filter, and anaerobic baffled reactors should be explored toestablish a firmer technical data base on which to make decisions regardingthe viability of biogas technology. A broader economic data base is alsoneeded in order to draw conclusions about the feasibility of anaerobicdigestion programs--independently and in conjunction with integrated

- 7 -
resource recovery plans--under other conditions of design, feedstock,social and environmental considerations, and target areas of application.
Ongoing research, experimental and functional programs throughoutthe world are rapidly adding to our knowledge of anaerobic digestion, andshould provide increasingly efficient and useful designs to improve thequality of life everywhere.
CHAPTER TWO
FUNDAMENTALS OF ANAFROBIC DIGESTION
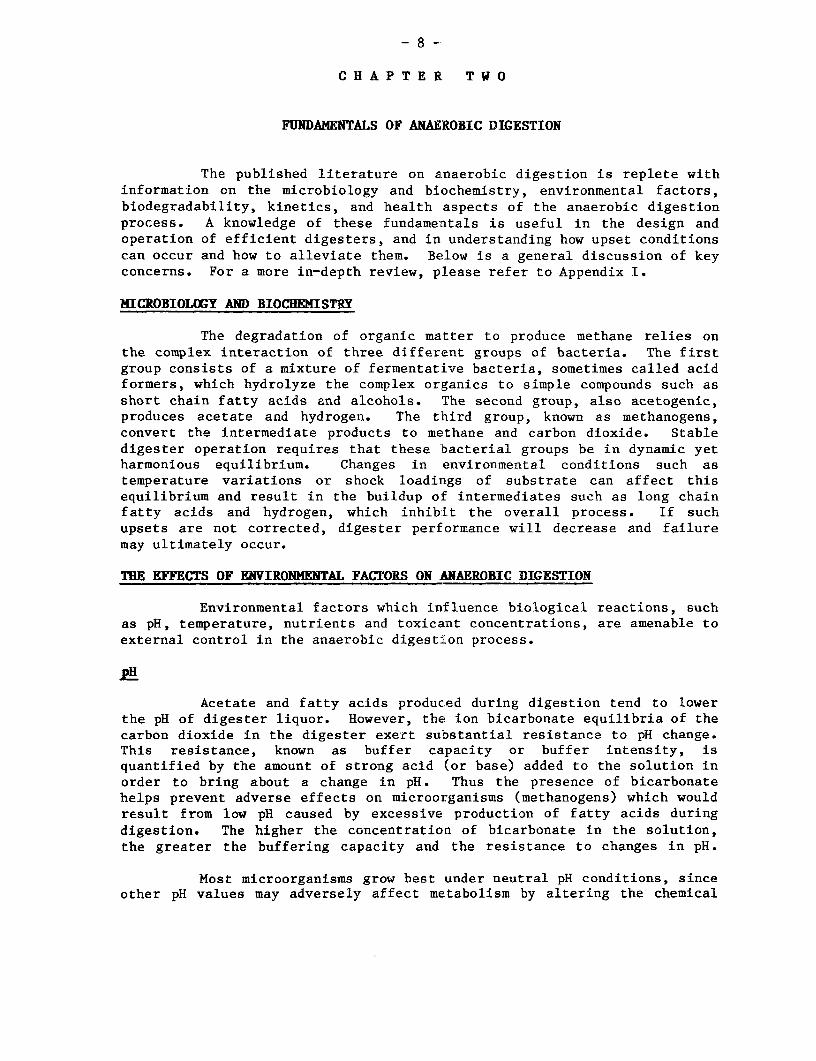
The published literature on aLnaerobic digestion is replete withinformation on the microbiology and biochemistry, environmental factors,biodegradability, kinetics, and health aspects of the anaerobic digestionprocess. A knowledge of these fundamentals is useful in the design andoperation of efficient digesters, and in understanding how upset conditionscan occur and how to alleviate them. Below is a general discussion of keyconcerns. For a more in-depth review, please refer to Appendix I.
MICROBIOLOGY AND BIOCHEMISTRY
The degradation of organic matter to produce methane relies onthe complex interaction of three different groups of bacteria. The firstgroup consists of a mixture of fermentative bacteria, sometimes called acidformers, which hydrolyze the complex organics to simple compounds such asshort chain fatty acids and alcohols. The second group, also acetogenic,produces acetate and hydrogen. The third group, known as methanogens,convert the intermediate products to methane and carbon dioxide. Stabledigester operation requires that these bacterial groups be in dynamic yetharmonious equilibrium. Changes in environmental conditions such astemperature variations or shock loadings of substrate can affect thisequilibrium and result in the buildup of intermediates such as long chainfatty acids and hydrogen, which inhibit the overall process. If suchupsets are not corrected, digester performance will decrease and failuremay ultimately occur.
THE EFFECTS OF ENVIRONMENTAL FACTORS ON jANAEROBIC DIGESTION
Environmental factors which influence biological reactions, suchas pH, temperature, nutrients and toxicant concentrations, are amenable toexternal control in the anaerobic digest--on process.
pH
Acetate and fatty acids produced during digestion tend to lowerthe pH of digester liquor. However, the ion bicarbonate equilibria of thecarbon dioxide in the digester exert substantial resistance to pH change.This resistance, known as buffer capacity or buffer intensity, isquantified by the amount of strong acid (or base) added to the solution inorder to bring about a change in pH. Thus the presence of bicarbonatehelps prevent adverse effects on microorganisms (methanogens) which wouldresult from low pH caused by excessive production of fatty acids duringdigestion. The higher the concentration of bicarbonate in the solution,the greater the buffering capacity and the resistance to changes in pH.
Most microorganisms grow best under neutral pH conditions, sinceother pH values may adversely affect metabolism by altering the chemical
- 9 -
equilibrium of enzymatic reactions, or by actually destroying the enzymes.The methanogenic group of organisms is the most pH sensitive. Low pH couldcause the chain of biological reactions in digestion to cease.
There are two main operational strategies for correcting anunbalanced, low pH condition in a digester. The first approach is to stopthe feed and allow the methanogenic population time to reduce the fattyacid concentration and thus raise the pH to an acceptable level of at least6.8. Stopping the feed also slows the activity of the ferment:ativebacteria and thus reduces acid production. Once the pH returns to normal,feeding can be recommenced at reduced levels and then increased graduallyso as to avoid further drops in pH.
A second method involves addition of chemicals to raise the pHand provide additional buffer capacity. Reducing the feed rate inconjunction with chemical addition may be necessary in some cases. Anadvantage of chemical addition is that the pH can be stabilized immediatelyand the unbalanced populations allowed to correct themselves more quickly.Calcium hydroxide (lime) is often used. Sodium carbonate (soda ash), whilemore expensive, can prevent calcium carbonate precipitation. Ammonia isalso useful, but must be used with care to avoid toxicity.
Temperature
The metabolic and growth rates of chemical and biochemicalreactions tend to increase with temperature, within the temperaturetolerances of the microorganisms. Too high a temperature, however, willcause the metabolic rate to decline due to degradation (denaturing) ofenzymes which are critical to the life of the cell. Microorganisms exhibitoptimum growth and metabolic rates within a well defined range oftemperatures which is specific to each species, particularly the upperlimit which depends on the thermostability of the protein moleculessynthesized by each particular type of organism.
Methanogenic bacteria are more sensitive to changes intemperature than other organisms present in digesters. This is due to thefaster growth rate of the other groups, such as the fermenters which canachieve substantial catabolism even at low temperatures (Schmid and Lipper,1969). All bacterial populations in digesters are fairly resilient toshort term temperature upsets up to about two hours, and return rapidly tonormal gas production rates when the temperature is restored. However,numerous or prolonged temperature drops can result in unbalancedpopulations and lead to the low pH problems discussed in the previoussection. Temperature variations as small as 2°C can have adverse affectson mesophilic (e-35*C) digestion or 0.5°C with thermophilic (e-550C)digestion.
Two distinct temperature regions for digestion of sewage sludgehave been noted. Optimum digestion occurs at about 3500 (mesophilic range)and 550C (thermophilic range), with decreased activity at around 45°C (seeFigure 2.1). This response to temperature may be due to effects onmethanogenic bacteria, since these appear to exhibit similar optimal
- 10 -
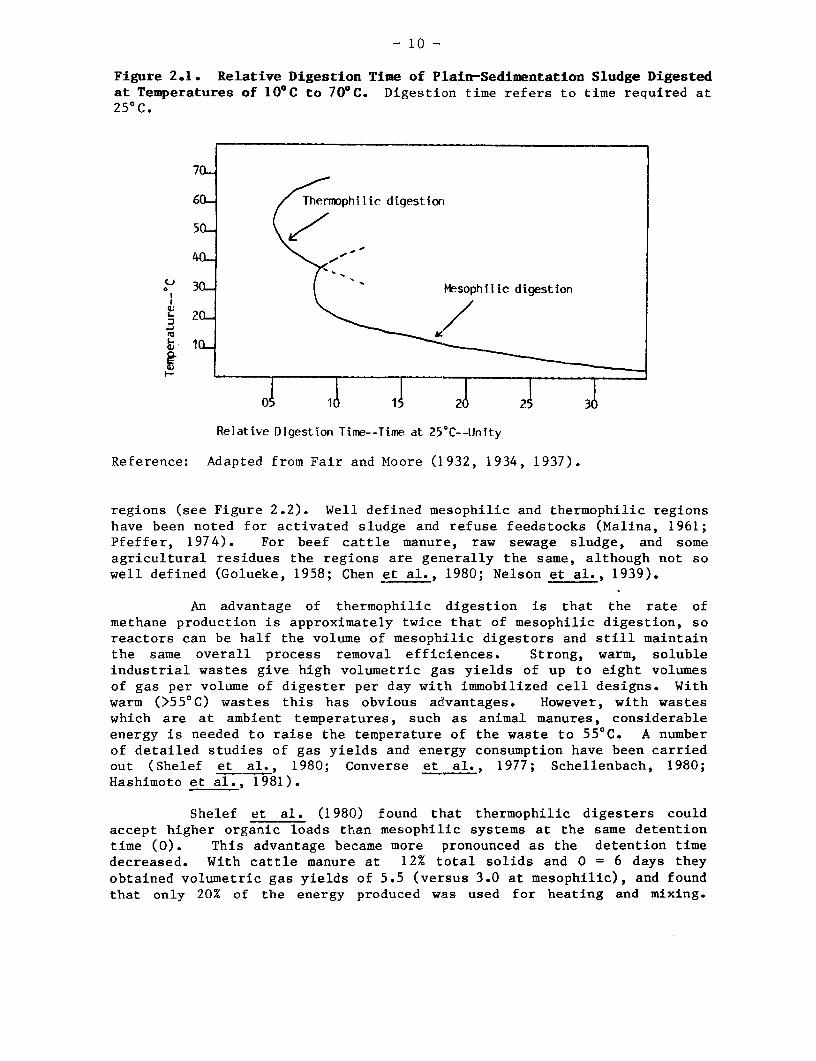
Figure 2.1. Relative Digestion Time of Plain-Sedimentation Sludge Digestedat Temperatures of 10°C to 700C. Digestion time refers to time required at250 C.
7Q
60L ermophilic digestion
50C
3 Mesophillc digestion
a; 1Q
O 1l 11 2 21 3
Relative Digestion Time--Time at 25°C--Unity
Reference: Adapted from Fair and Moore (1932, 1934, 1937).
regions (see Figure 2.2). Well defined mesophilic and thermophilic regionshave been noted for activated sludge and refuse feedstocks (Malina, 1961;Pfeffer, 1974). For beef cattle manure, raw sewage sludge, and someagricultural residues the regions are geilerally the same, although not sowell defined (Golueke, 1958; Chen et al., 1980; Nelson et al., 1939).
An advantage of thermophilic digestion is that the rate ofmethane production is approximately twice that of mesophilic digestion, soreactors can be half the volume of mesophilic digestors and still maintainthe same overall process removal efficiences. Strong, warm, solubleindustrial wastes give high volumetric gas yields of up to eight volumesof gas per volume of digester per day with immobilized cell designs. Withwarm (>55°C) wastes this has obvious aelvantages. However, with wasteswhich are at ambient temperatures, such as animal manures, considerableenergy is needed to raise the temperature of the waste to 55°C. A numberof detailed studies of gas yields and energy consumption have been carriedout (Shelef et al., 1980; Converse et al., 1977; Schellenbach, 1980;Hashimoto et al., 1981).
Shelef et al. (1980) found that thermophilic digesters couldaccept higher organic loads than mesophilic systems at the same detentiontime (0). This advantage became more pronounced as the detention timedecreased. With cattle manure at 12% total solids and 0 = 6 days theyobtained volumetric gas yields of 5.5 (versus 3.0 at mesophilic), and foundthat only 20% of the energy produced was used for heating and mixing.
- 11 -
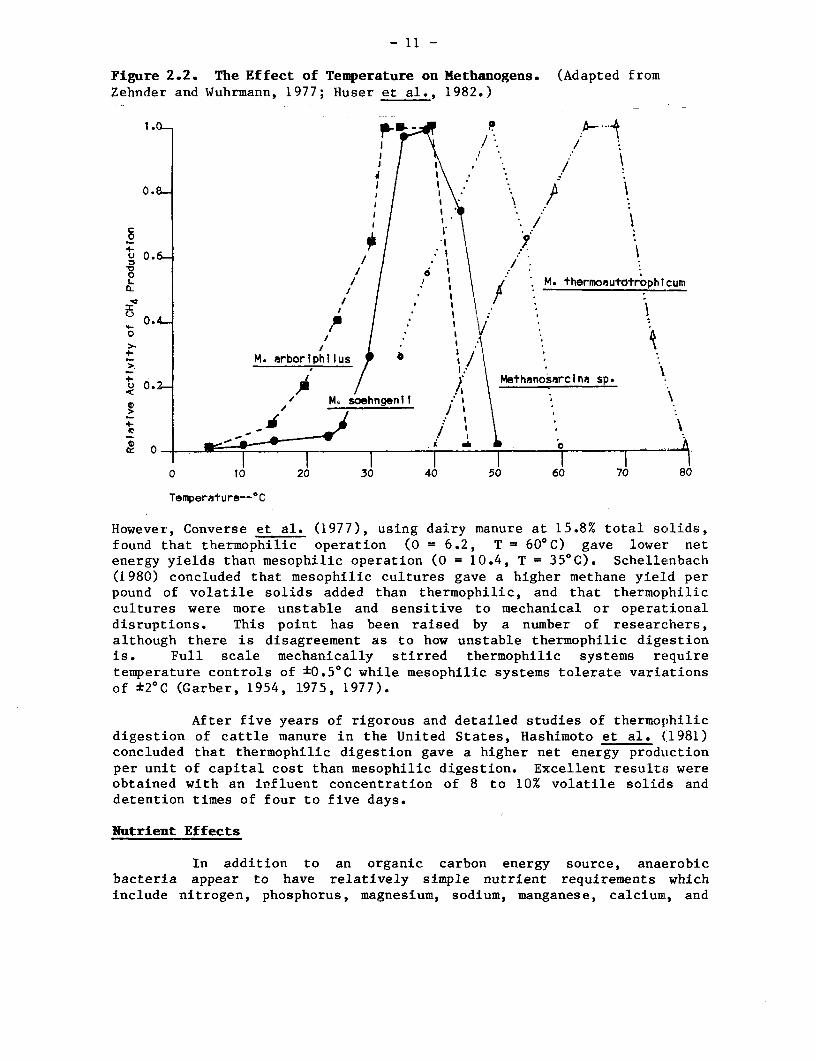
Figure 2.2. The Effect of Temperature on Methanogens. (Adapted fromZehnder and Wuhrmann, 1977; Huser et al., 1982.)
1.0fn.-
!I / x
0. . ,
> ' Ms soehnGenl~ I A, <
0 0_ j * ° - -eM. thermoautotrophwcum
:t M. ~~~arborip/hilus
(1980 concluded that mesophiliccultr ga Methanoiarcmna sp.
0 ~ ~~~~~~~~A k
0 to 20 30 40 50 60 70 80
Temperature--'C
However, Converse et al. (1977), using dairy manure at 15.8% total sculds,found that thermophilic operation (0 = 6.2, T = 60'C) gave lower- netenergy yields than mesophilic operation (0 = 10.4, T = 3500). SchellE~nbach(1980) concluded that mesophilic cultures gave a higher methane yield perpound of volatile solids added than thermophilic, and that thermophiliccultures were more unstable and sensitive to mechanical or operat:ionaldisruptions. This point has been raised by a number of researchers,although there is disagreement as to how unstable thermophilic digestionis. Full scale mechanically stirred thermophilic systems requiretemperature controls of *0.50C while mesophilic systems tolerate variationsof *20C (Garber, 1954, 1975, 1977).
After five years of rigorous and detailed studies of thermophilicdigestion of cattle manure in the United States, Hashimoto et al. (11981)concluded that thermophilic digestion gave a higher net energy productionper unit of capital cost than mesophilic digestion. Excellent results wereobtained with an influent concentration of 8 to 10% volatile solids anddetention times of four to five days.
Nutrient Effects
In addition to an organic carbon energy source, anaerobicbacteria appear to have relatively simple nutrient requirements whichinclude nitrogen, phosphorus, magnesium, sodium, manganese, calcium, and
- 12 -
cobalt (Speece and McCarty, 1962). Nutrient levels should be at least inexcess of the optimum concentrations needed by the methanogenic bacteria,since these are the most severely inhibited by slight nutrientdeficiences. Nutrient additions are often required in order to permitgrowth in digestion of simple substrates such as glucose, substrates suchas industrial wastes, and crop residues. However, nutrient deficiencyshould not be a problem with most complex feedstocks, since thesesubstrates usually provide more than sufficient quantities.
An essential nutrient can become toxic to organisms if itsconcentration in the substrate becomes too great (see below). In the caseof nitrogen, it is particularly important to maintain an optimal level toachieve good digester performance without toxic effects.
Toxicity Effects
Toxic compounds affect digestion by slowing down the rate ofmetabolism at low concentrations or by poisoning or killing the organismsat high concentrations. The methanogenic bacteria are generally the mostsensitive, although all groups involved in digestion can be affected. Dueto their slow growth, inhibition of the methanogens can lead to processfailure in completely mixed systems due to washout of bacterial mass.
In order to control and adjust operation to minimize toxiceffects, it is important to indentify inhibition in its early stages. Thetwo main inhibition indicators are:
a. Reduction in methane yield over time, indicated by two ormore consecutive decreases of iiore than 10% in daily yieldat a constant loading rate; and
b. Increase in volatile acids concentration over time,generally occurring when the total volatile acids (expressedas acetic acid) exceed the normaal range of about 250 to 500milligrams per liter.
The major toxicants usually encountered with natural feedstocksare ammonia, volatile acids, and heavy metals.
Ammonia
Ammonia toxicity is often a problem in feedstocks with a highprotein content. Ammonia is rapidly formed in a digester by deamination ofprotein constituents. Free ammonia has been found to be much more toxicthan ammonium ion, and thus ammonia toxicity thresholds are very sensitiveto pH below seven. In general, free amraonia levels should be kept belowabout 80 milligrams per liter to prevent inhibition (Anderson et al.,1982). A much higher concentration of about 1,500 to 3,000 milligrams perliter of ammonium ion can be tolerated (McCarty, 1964a; Fischer et al.,1979; Hart, 1963; Schmid and Lipper, 1969). Concentrations of free ammoniaand ammonium ion are related by equilibrium reactions and pH.
- 13 -
Volatile Acids
High concentrations of volatile acids such as acetate, propionateor butyrate are associated with toxicity effects. It is not clear whetherthse acids are themselves toxic, or whether acid buildup (pH <6.8) ismerely a manifestation of toxicity. Among these acids, inhibitory effectshave been demonstrated only for propionate, and only at relatively highconcentrations of greater than 1,000 milligrams per liter (Hobson and Shaw,1976).
Heavy Metals
Certain heavy metals are toxic to anaerobic organisms, evean atlow concentrations. Heavy metal ions inhibit metabolism and kill organismsby inactivating the sulfhydryl groups of their enzymes in formingmercaptides (Mosey et al., 1971). Since these reactions involve metalions, it is the soluble fraction that is the toxic form and toxic effectsare thus affected by the solubilities of heavy metals under variousdigester conditions (Theis and Hayes, 1979). Since many heavy metals forminsoluble sulfides or hydroxides under pH conditions in the range of thosefound in digesters, one way to avoid heavy metal toxicity is to addchemicals such as sulfates which will form non-toxic complexes or insolubleprecipitates. Toxic substances can also be removed from the feedstock ordiluted to below the toxic threshold level.
Influence of Carbon/Nitrogen Ratio on Digestion
Nitrogen present in the feedstock has two benefits: (a) itprovides an essential element for synthesis of amino acids, enzymes andprotoplasm; and (b) it is converted to ammonia which, as a strong base,neutralizes the volatile acids produced by fermentative bacteria and thushelps maintain neutral pH conditions essential for cell growth. Anoverabundance of nitrogen in the substrate can lead to excessive ammoniaformation, resulting in toxic effects (see above). Thus it is importantthat the proper amount of nitrogen be in the feedstock to avoid eithernutrient limitation (too little nitrogen) or ammonia toxicity (too muchnitrogen). The carbon/nitrogen (C/N) ratio of the feedstock has been foundto be a useful parameter in evaluating these effects and providing optimalnitrogen levels. A C/N ratio of 30 is often cited as optimum (Fry, 1975;NAS, 1977; BORDA, 1980; UNEP, 1981). Since not all of the carbon andnitrogen in the feedstock are available to be used for digestion, theactual available C/N ratio is a function of feedstock characteristics anddigestion operational parameters, and overall C/N values can actually varyconsiderably from less than 10 to over 90 and still result in efficientdigestion.
BIODEGRADABILITY OF DIGESTER FEEDSTOCK
In general, most natural organic wastes can be digested; ligninis the major exception. In developing countries the primary substrate iscattle dung due to large cattle populations. This is a good substratesince it is moderately degradable and is well balanced nutritionally (C/N =25:1). Swine and poultry manures produce even more biogas per unit weight
- 14 --
and at higher rates. Human wastes (nightsoil), while high in nitrogen (C/N= 6), can also be digested easily, although carbohydrate wastes could beadded to raise the C/N ratio and provide more gas.
Agricultural residues (e.g., wheat, rice straw) are usuallyreadily available, and, while they have high C/N ratios, they can bedigested in admixture with manures and nightsoil. These wastes are usuallyquite biodegradable, and can be made more so by physical size reduction,and by precomposting. However, problems can arise with these materialsbecause they float in the digester and form hard scum layers on thesurface.
Plants such as water hyacinth, duckweed, etc., can also bedegraded easily, and give quite high gas yields. In these cases, digestionof these weeds can solve the problem caused by excess weed growth in canalsand provide energy as well. Since their primary productivity is very high,the opportunity exists to create an energy farm by cultivating theseweeds, perhaps in wastewater, which would also solve the problem ofwastewater treatment.
Wastes generated in urban areas of developing countries (garbage,organic domestic and industrial wastes) are in principle also amenable toanaerobic digestion. However, these fetedstocks have not been thoroughlyexplored in developing countries.
KINETIC MODELS
Although the basing of digester size on solids residence time orvolatile solids loading is standard practice, a better understanding ofanaerobic digestion can sometimes be obtained by examining kinetic modelswhich describe the anaerobic process in terms of bacterial growth. Kineticmodels are also useful as a basis for interpretation of laboratory or fieldperformance data. In Appendix I several models which have been used todescribe anaerobic digestion are presented and briefly discussed toindicate their potential use in the design of anaerobic systems.
HEALTH ASPECTS
One of the benefits of anaerobic digestion is its effect onpublic health. Pathogens discharged in fecal material include viruses,bacteria, protozoa and helminths. The spread of disease from thesepathogens depends on a variety of factors, including amounts present,latency, persistence, multiplication rate, and infective dose. Disease canbe controlled by appropriate treatment and disposal practices, anddigestion of fecal wastes can result in a considerable reduction ofpathogens. Nevertheless, due to the high concentration of pathogenspresent in fecal material, some digested sludges may still contain somepathogens and should be handled with care.
There are a number of factors which influence the survival ofpathogens during digestion:
- 15 -
a. Temperature of the digester contents;
b. Detention time;
c. Chemical environment such as pH, ammonia concentration, andabsence of oxygen;
d. microbial environment; and
e. physical characteristics of the digester.
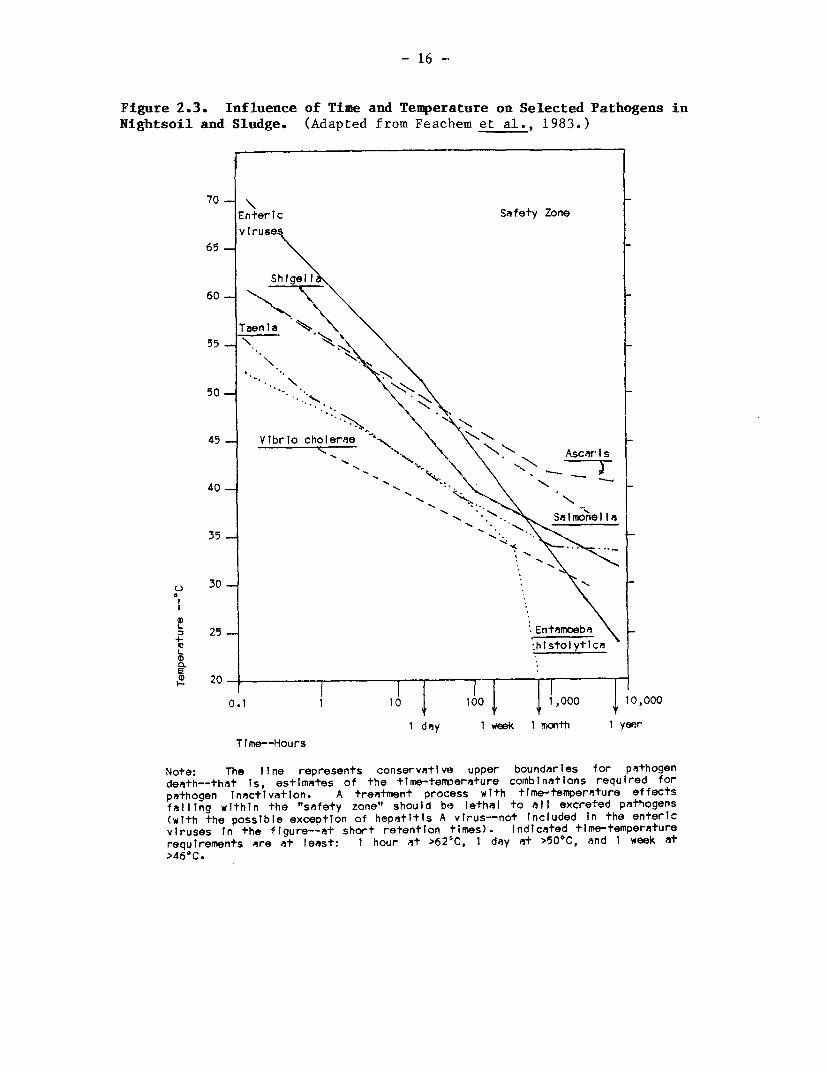
High temperature is the most effective method of killing patho-gens since they are biological entities comprised of proteins which usuallydenature at temperatures in the range of 50 to 70°C. Time and temperatureare intimately related. The higher the temperature, the shorter the timerequired for pathogen destruction, and vice versa. The influence of timeand temperature on a number of pathogens is shown in Figure 2.3. Thecurves represent estimated time-temperature combinations for pathogeninactivation. Since considerable mortality occurs prior to inactivation,these are conservative upper limits. At thermophilic temperatures (55 to60uC) the figure shows ttiat detention times of only one day are required,and data gathered by Garber et al. (1975) and Garber (1977) on the killrates of Salmonella and fecal streps at mesophilic and thermophilictemperatures bear this point out. With 20 days detention time kill ratesof 102 and >104 were found for mesophilic and thermophilic tempera,turesrespectively. However, even with thermophilic digestion, counts of fecalstreps as high a 104/100 ml were measured in the effluent.
Numerous studies of pathogen die-off in biogas plants operatingat lower than mesophilic temperatures have been carried out in China; ingeneral, parasite egg removals of from 90 to 95% are possible, although attimes Ascaris are only reduced by 30 to 40%. Semi-quantitative data (UNEP,1981) also reveal that after digesters are installed in an area there aresignificant declines in parasite infections, enteritis, and bacillarydysentery.
Further treatment of the digested sludge (e.g., by air drying orcomposting) reduces pathogens still further, and in the latter case, ifproperly operated, produces a pathogen free product. Dried sludgie maystill contain some pathogens, but when applied correctly (e.g., plcughedunder) presents no health risks. If suitable low cost methods for excretadisposal are not provided in a community, then digestion of nightsoil andanimal manure will result in an improvement in environmental and publichealth.
- 16 -
Figure 2.3. Influence of Time and Temperature on Selected Pathogens inNightsoil and Sludge. (Adapted from Feachem et al., 1983.)
70 - \
Entertc Safety Zonev I ruses
65-
Shige I60-
Taenia %
55 -.
50 -' \
45 Vibrio cholerae N Ascaris
40 - 1 !j
t dey 1 wesk S1lmonel lyar
35 N
30
25 -Entame'
L
20
0.1 1 1 100 1 000 10.000
I day i week l mcwth 1yeprTime--Hours
Note: The Itne represents conservative upper boundaries for pathogendeath--that Is, estimates of the time-temperature combinations required forpathogen inactlvation. A treatment process with ttme-temperature effectsfalling within the "safety zone" should be lethal to all excreted pathogens(wlth the posstble exceptton of hepetitis A virus--not tncluded In the entericviruses In the figure--at short retention times). Indicated time-temperaturerequirements are at least: 1 hour at >62'C, 1 day at >50°C, and 1 week at>460 C.
- 17 -
C H A P T E R T H R E E
METHANE PRODUCTION FROM SANITARY LANDFILLS
INTRODUCTION
The design of managed sanitary landfills for the disposal ofmunicipal solid wastes (MSW) and the recovery of gas is receiving increasedattention from engineers and municipal authorities (Farquhar et al., 1982;Franzius, 1982). The recovery of gas from sanitary landfills has beenpracticed since the early 1970s. At one time it was collected and flaredto reduce explosion hazards, but now it is often used to produce heatand/or electricity or is cleaned up and transported with natural gas bypipeline to consumers. Only recently have concerted efforts been directedtoward managing landfills to increase their gas production.
Methane is being extracted from landfills in England, WestGermany, Brazil, Canada 4nd the United States. Table 3.1 presents data onamounts of gas produced at selected landfills. There is no technical reasonwhy gas production cannot be obtained from appropriately designed andoperated landfills. This chapter summarizes technical information on someof the work that has been done on gas production from sanitary landfiLls;it does not address the site specific economic issues.
During the 1960s feasibility studies on digesting MSW were con-ducted at the University of California (Golueke et al., 1971). Researchconducted at the University of Illinois (initially for EPA, NSF, and ERDA),Pfeffer, and others demonstrated the feasibility of digesting MSW inconventional digester systems when sewage sludge was added (Pfeffer, 1974;Brown et al., 1976; Cooney and Wise 1975; and Kispert et al., 1975, 1976).A plant capable of processing and anaerobically digesting 100 tons of MSWper day has been placed in operation at Pompano Beach, Florida (Mooij andStreit, 1982). Pohland (1975), Augenstein et al. (1976) and Buivid et al.(1981) reported on the possibilities of increasing the production of fuelgas from controlled landfills. Pacific Gas and Electric and SoutihernCalifornia Gas companies have constructed six large 5,000 to 6,000 (drybasis) metric ton MSW test cells at Mountain View, Caliornia based upon theearlier laboratory findings of Augenstein and Buivid (Halvadakis, 1983).Wise et al. (1981) have examined methods to provide additional nutrients,buffers and seed to accelerate the rates of gas production in existinglandfills.
CONPONENTS AND COMPOSITION OF MSW
The composition of MSW varies greatly among countries, regions,and cities (see Table 3.2). Brown, Pfeffer and Liebman (1976) reported onthe amounts of gas produced in experiments conducted under similarconditions using MSW from Champaign-Urbana, Illinois, Madison, Wisconsinand St. Louis, Missouri. The gas produced ranged from 0.31 to 0.39 cubicmeters per kilogram of volatile solids fed to their laboratory digesters.
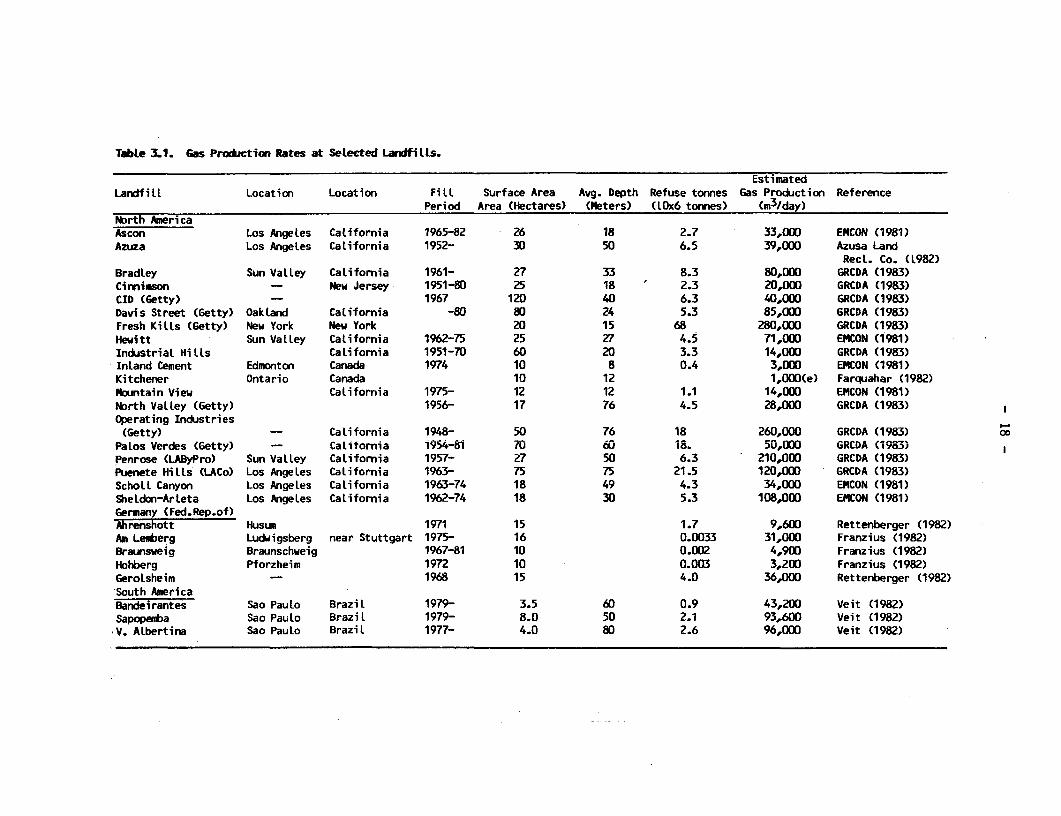
Table 3.1. Gas Production Rates at Selected Landfilts.
EstimatedLandfilL Location Location Fill Surface Area Avg. Depth Refuse tonnes Gas Production Reference
Period Area (Hectares) (Meters) (lOx6 tonnes) (m3 /day)NDrth AmericaAscon Los Angeles California 1965-82 26 18 2.7 33,000 ENCON (1981)Azuza Los Angeles California 1952- 30 50 6.5 39,000 Azusa Land
Recl. Co. (1982)Bradley Sun Valley California 1961- 27 33 8.3 80,000 GRCDA (1983)Cinnimson - New Jersey 1951-80 25 18 2.3 20,000 GRCDA (1983)CID (Getty) 1967 120 40 6.3 40,000 GRCDA (1983)Davis Street (Getty) Oakland California -80 80 24 5.3 85,000 GRCDA (1983)Fresh Kills (Getty) New York New York 20 15 68 280,000 GRCDA (1983)Hewitt Sun Valley California 1962-75 25 27 4.5 71,000 EMCON (1981)Industrial Hills California 1951-70 60 20 3.3 14,000 GRCDA (1983)Inland Cement Edmonton Canada 1974 10 8 0.4 3,000 ENCON (1981)Kitchener Ontario Canada 10 12 1,000(e) Farquahar (1982)Mbuntain View California 1975- 12 12 1.1 14,000 EMCON (1981)North Valley (Getty) 1956- 17 76 4.5 28,000 GRCDA (1983)Operating Industries(Getty) - California 1948- 50 76 18 260,000 GRCDA (1983) OD
Palos Verdes (Getty) - California i954-81 70 60 18. 50,000 GRCDA (1983)Penrose (LAByPro) Sun Valley California 1957- 27 50 6.3 210,000 GRCDA (1983)Puenete Hills (LACo) Los Angeles California 1963- 75 75 21.5 120,000 GRCDA (1983)Scholl Canyon Los Angeles California 1963-74 18 49 4.3 34,000 EMCON (1981)SheLdon-Arleta Los Angeles California 1962-74 18 30 5.3 108,000 EMCON (1981)Germany (Fed.Rep.of)Ahrenshott Husum 1971 15 1.7 9,600 Rettenberger (1982)Am Lenberg Ludwigsberg near Stuttgart 1975- 16 0.0033 31,000 Franzius (1982)Braunsweig Braunschweig 1967-81 10 0.002 4,900 Franzius (1982)Hohberg Pforzheim 1972 10 0.003 3,200 Franzius (1982)Gerolsheim 1968 15 4.0 36,000 Rettenberger (1982)South AmericaBandeirantes Sao Paulo Brazil 1979- 3.5 60 0.9 43,200 Veit (1982)Sapopemba Sao Paulo Brazil 1979- 8.0 50 2.1 93,600 Veit (1982)V. Albertina Sao Paulo Brazil 1977- 4.0 80 2.6 96,000 Veit (1982)
- 19 -
Table 3.2. Oomposition of Urban Refuse, percentage by weight as recelved. (After CoIntreaoet al., 1984.)
0
z m 8 ~~0 .LC a E 0D * i 0. 6 CL 4-
Z' C0 C -a c> %! _ _~~~ - 0 en .- - V
O- L .- _ X _ v cZ m > C.) GD L - c -S ZC C -
c _) >. l) , r
O c n c) c c v c L0 ~ ~ 00 0 C-
m j K _n m i j le _j s 4 j v
Type of Materials
Industrialized Middle Income Low Inconie
Paper 35 37 18 43 32 22 14 17 17 2 4 <1 2 3Glass, ceramics 9 8 4 1 10 2 3 2 5 <1 3 <1 6 8Metals 13 8 3 3 2 1 4 5 2 4 4 <1 3 1Plastics 10 2 4 6 6 5 - 4 4 3 2 - 4 1Leather, rubber -…2 - 76 <1 - -
Textiles 4 2 9 10 4 -7 4 1 5 1 3 4Wood, bones, straw 4 _ -_ - - 6 4 2 1 <1 5
Non-food total 74 5729 63 60 34 21 35 40 15 27 4 18 22Vegetative, putrescible 22 28 50 5 9 56 60 43 43 82 49 56 80 36Miscellaneous Inerts 4 15 21 32 31 10 19 22 17 3 24 40 2 42
Compostable total 26 43 71 37 40 66 79 65 60 85 73 96 S2 78
TOTAL 100 100 100 100 100 100 100 100 100 100 100 100 100 100
Note: The above values have been rounded to the nearest whole number, unless the percentagewas less than 1.0.
The components of MSW in the United States are characterized asshown in Table 3.3. Table 3.4 shows an elemental analysis and importantcharacteristics such as the moisture, volatile solids, ash and heatcontents of the wastes. The volatile solids content is used to approximatethe organic biodegradable portion and is an indicator of potential. gasproduction when adequate nutrients, buffers, and moisture are present.
METHANE GENERATION
The various components of MSW are degraded anaerobically atdifferent rates. For example, food wastes decompose more rapidly thanpaper products. Although leather, rubber and some plastics are alsoorganic, they usually resist biological degradation. Some lignocellulosicmaterials, plastics, fabrics and other organic materials are very resistantto decomposition by anaerobic organisms. In addition, small amounts ofthe organic materials being anaerobically digested are utilized in theprocess of making new cells and thus do not contribute to gas production.
- 20 -
Table 3.3. Municlpal Solid Waste Composition In the United States.
Percent Dry Basis Moisture Content
Food Wastes 12.0 72Garden Wastes 12.0 65Paper Products 42.0 10.2Plastics/Rubber 2.4 2Textl les 0.6 10Wood 2.5 20Metals 8.0 3Glass/Ceramic 6.0 2Ash/Dlrt/Rock 11.0 10Fines 3.0Misc. 0.5 4
Reference: Adapted frcn American ChemicaL Society (l972).
Table 3.4. Cheicai Analysis of U. S. Muntcipal Solid Wastes.
Chemical Percent Dry Basis
Carbon 28.0Hydrogen 3.5Oxygen 22.4
Nitrogen 0.33Sulfur 0.16Ash 24.9
Volatiles 75.1Heat Content 14,430 KJ/kg.
Moisture Content 26.7%
Reference: Adapted fram Arerican Chemical Society (1972).
In spite of the lack of uniformity, empirical formulas have been developedto predict the amount of methane and carbon dioxide that can be producedfrom cellulose and other organic material. For example Augenstein et al.(1976) used the following relationship:
C6H105+ H20 -4 3 CH4+ 3 C02(cellulose)
The equation indicates that equal quantities of methane and carbon dioxideare produced; however, since carbon dioxide is soluble in water which islost as leachate, less is present in gas from landfills.
The actual yield of methane per kilogram of a substrate isrelated to its biodegradability and oxidation state (Stuckey, 1983).However, if one kilogram of cellulose in the above equation is degraded,0.415 cubic meters of methane and 0.415 cubic meters of carbon dioxide areproduced.
The period of time require(I for MSW to degrade and producebiogas depends upon a number of variables, including the number oforganisms present, nutrients, temperature, pH, buffer capacity, moisturecontent and the density to which the materials are packed in the landfill.The effects of these variables upon the production of gas has been
- 21 -
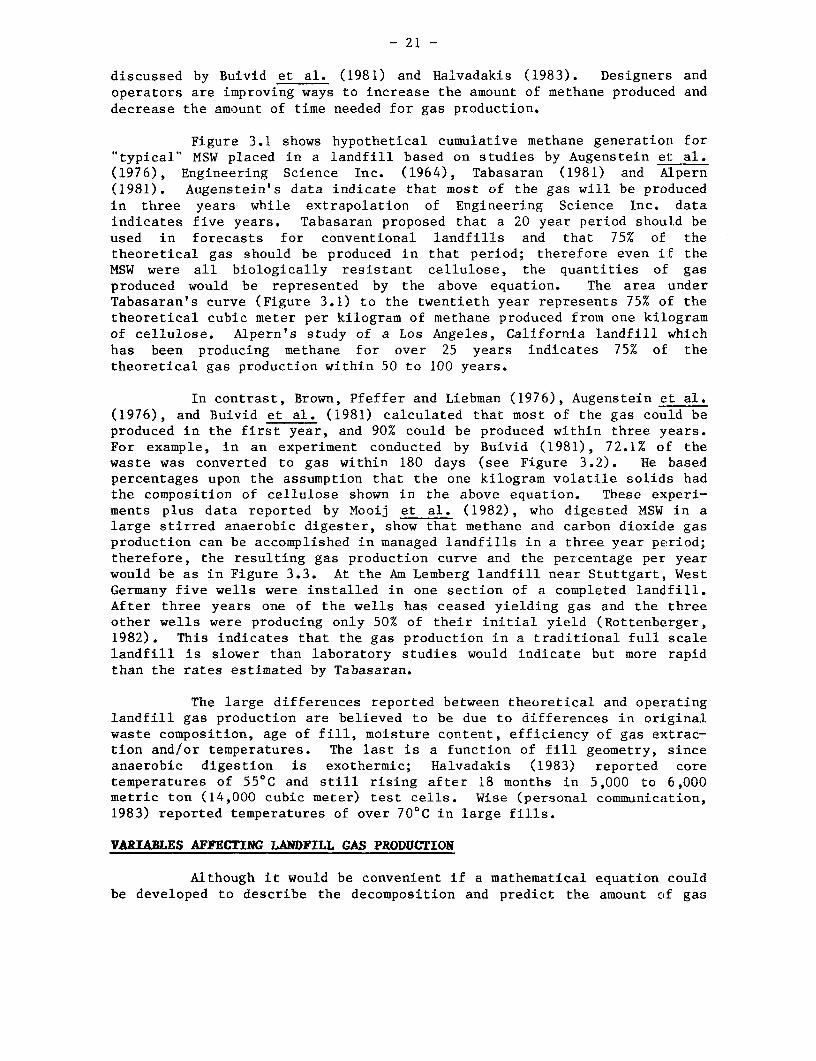
discussed by Buivid et al. (1981) and Halvadakis (1983). Designers andoperators are improving ways to increase the amount of methane produced anddecrease the amount of time needed for gas production.
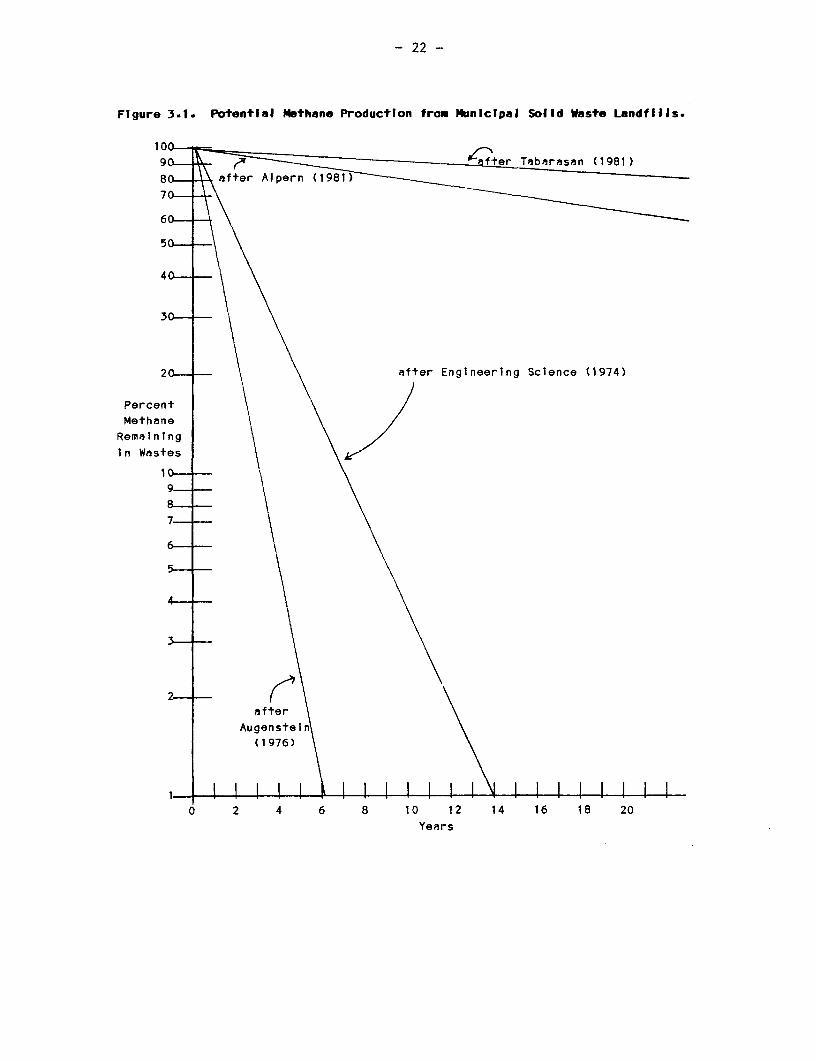
Figure 3.1 shows hypothetical cumulative methane generation for"typical" MSW placed in a landfill based on studies by Augenstein el: al.(1976), Engineering Science Inc. (1964), Tabasaran (1981) and Alpern(1981). Augenstein's data indicate that most of the gas will be producedin three years while extrapolation of Engineering Science Inc. dataindicates five years. Tabasaran proposed that a 20 year period should beused in forecasts for conventional landfills and that 75% of thetheoretical gas should be produced in that period; therefore even if theMSW were all biologically resistant cellulose, the quantities of gasproduced would be represented by the above equation. The area underTabasaran's curve (Figure 3.1) to the twentieth year represents 75% of thetheoretical cubic meter per kilogram of methane produced from one kilogramof cellulose. Alpern's study of a Los Angeles, California landfill whichhas been producing methane for over 25 years indicates 75% of thetheoretical gas production within 50 to 100 years.
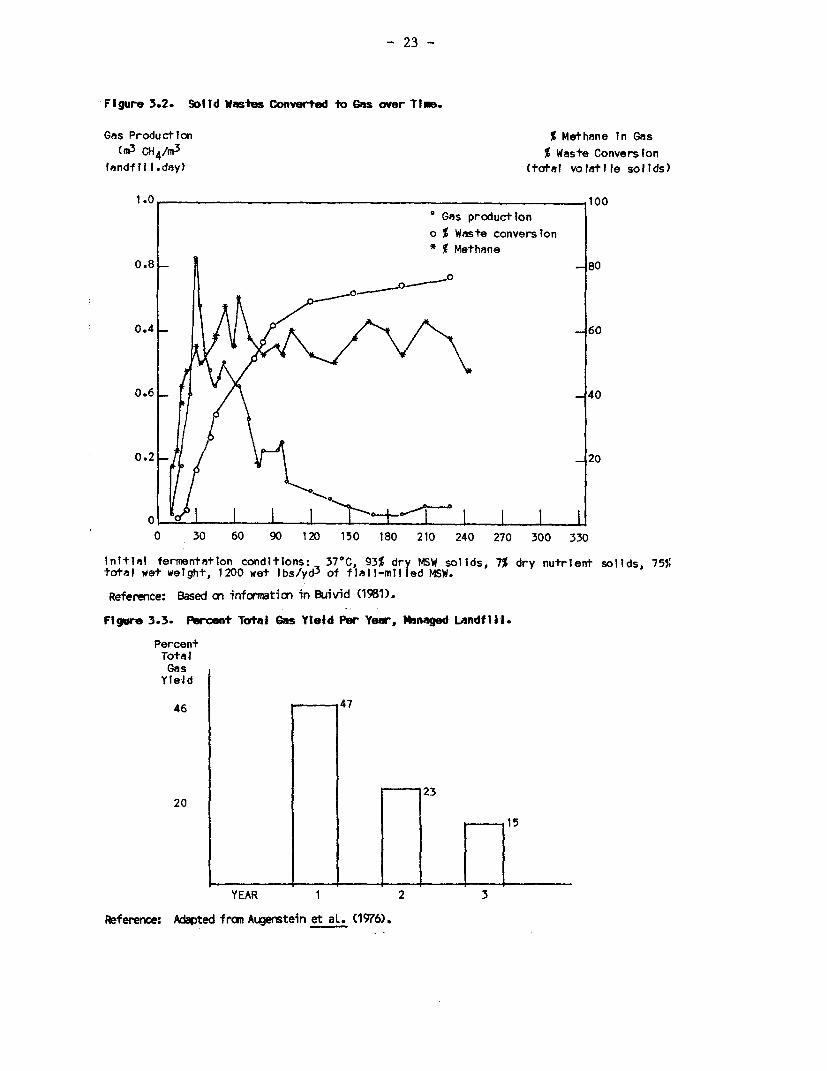
In contrast, Brown, Pfeffer and Liebman (1976), Augenstein et al.(1976), and Buivid et al. (1981) calculated that most of the gas could beproduced in the first year, and 90% could be produced within three years.For example, in an experiment conducted by Buivid (1981), 72.1% of thewaste was converted to gas within 180 days (see Figure 3.2). He basedpercentages upon the assumption that the one kilogram volatile solids hadthe composition of cellulose shown in the above equation. These experi-ments plus data reported by Mooij et al. (1982), who digested MSW in alarge stirred anaerobic digester, show that methane and carbon dioxide gasproduction can be accomplished in managed landfills in a three year period;therefore, the resulting gas production curve and the percentage per yearwould be as in Figure 3.3. At the Am Lemberg landfill near Stuttgart, WestGermany five wells were installed in one section of a completed landfill.After three years one of the wells has ceased yielding gas and the threeother wells were producing only 50% of their initial yield (RottenbElrger,1982). This indicates that the gas production in a traditional full scalelandfill is slower than laboratory studies would indicate but more rapidthan the rates estimated by Tabasaran.
The large differences reported between theoretical and operatinglandfill gas production are believed to be due to differences in originalwaste composition, age of fill, moisture content, efficiency of gas extrac-tion and/or temperatures. The last is a function of fill geometry, sinceanaerobic digestion is exothermic; Halvadakis (1983) reported coretemperatures of 55°C and still rising after 18 months in 5,000 to 6,000metric ton (14,000 cubic meter) test cells. Wise (personal communication,1983) reported temperatures of over 70°C in large fills.
VARIABLES AFFECTING LANDFILL GAS PRODUCTION
Although it would be convenient if a mathematical equation couldbe developed to describe the decomposition and predict the amount of gas
- 22 --
Figure 3.1. Potentala Nethane Production from Municipal Solid Waste Landfills.
10010_ - a ter Thbnrasan (1981)
80- after Alpern (1981)
70-
60
50
40_
30 -
20-- after Engineering Science (1974)
PercentMethane
Remaining
In Wastes
9- _
7-
2- after
Augenstein(1976)
1-0 2 4 6 8 10 12 14 16 18 20
Years
- 23 -
Figure 3.2. SolId Wastes Converted to Gas over Time.
Gas Production % Methane In Gas
Im3 CH4/m3 % Waste Conversion
landfill.day) (total volatile solids)
1.0 100
° Gas productiono % Waste conversion
* Methane0.8 -80
0.4 - 60
0.6 - ~~~~~~~~~~~~~~~40
0 I~~~~~~~~~~~~~~~~~2
0 30 60 90 120 150 180 210 240 270 300 330
initial fermentation conditions: 370C, 93% dry MSW solids, 7% dry nutrient solids, 75%total wet weight, 1200 wet lbs/yd 3 of flail-milled MSW.
Reference: Based on informaticn in Buivid (1981).
Flgure 3.3. Percent Totai Gas Yi eld Per Year, tbnaged LandftIl.
PercentTotaGas
Yield
46 47
20
YEAR 1 2 3
Reference: Adapted fran ALQerstein et aL. (1976).
- 24 -
produced, those familiar with laboratory experiments dealing with thebreakdown of pure substance are aware of the difficulties of using a singleequation to define all reactions for a heterogeneous material such as MSW.EMCON (1980) reviewed several mathematical models, and Halvadakis (1983)developed two additional models, of time dependence of gas production, butit is difficult in a model to take into account all the variables whichhave an impact upon the rates of anaerobic decomposition. Some of thesevariables are listed below.
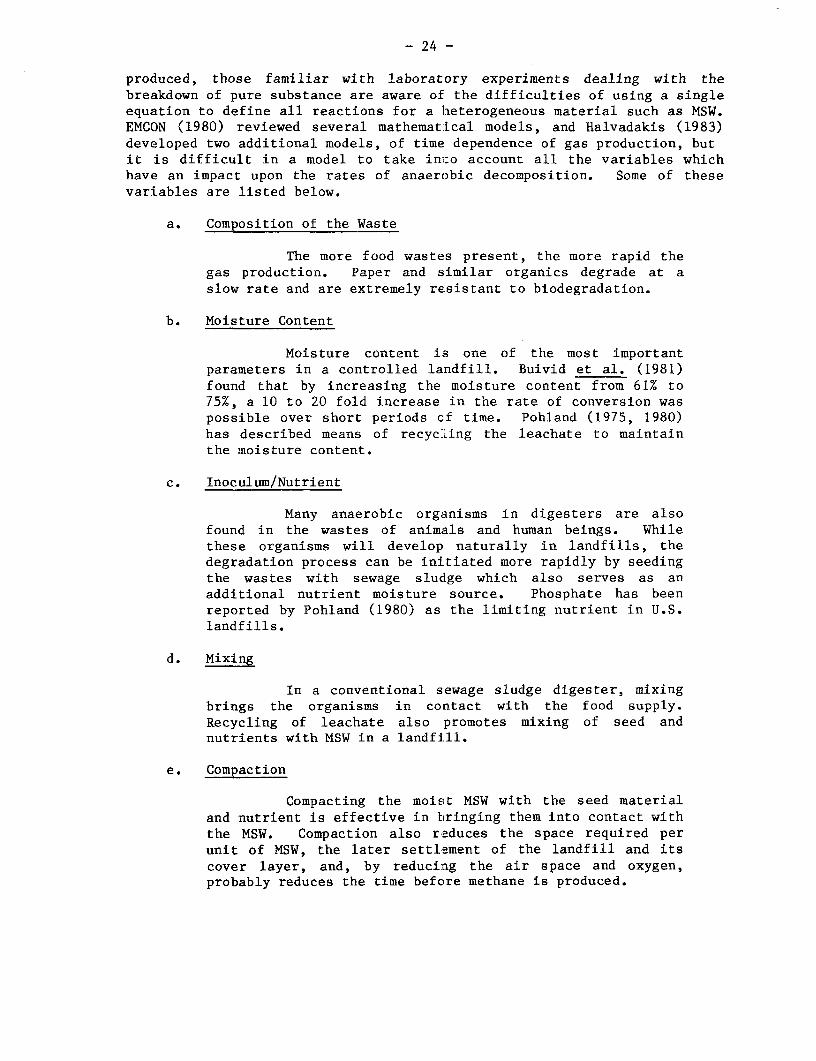
a. Composition of the Waste
The more food wastes present, the more rapid thegas production. Paper and similar organics degrade at aslow rate and are extremely resistant to biodegradation.
b. Moisture Content
Moisture content is one of the most importantparameters in a controlled landfill. Buivid et al. (1981)found that by increasing the moisture content from 61% to75%, a 10 to 20 fold increase in the rate of conversion waspossible over short periods of time. Pohland (1975, 1980)has described means of recyc:Ling the leachate to maintainthe moisture content.
C. Inoculum/Nutrient
Many anaerobic organisms in digesters are alsofound in the wastes of animals and human beings. Whilethese organisms will develop naturally in landfills, thedegradation process can be initiated more rapidly by seedingthe wastes with sewage sluclge which also serves as anadditional nutrient moisture source. Phosphate has beenreported by Pohland (1980) as the limiting nutrient in U.S.landfills.
d. Mixing
In a conventional sewage sludge digester, mixingbrings the organisms in contact with the food supply.Recycling of leachate also promotes mixing of seed andnutrients with MSW in a landfill.
e. Compaction
Compacting the moist MSW with the seed materialand nutrient is effective in bringing them into contact withthe MSW. Compaction also reduces the space required perunit of MSW, the later settliement of the landfill and itscover layer, and, by reducing the air space and oxygen,probably reduces the time before methane is produced.
- 25 -
f. Size Reduction
Previous experience has shown that large materialsshould be reduced in size whenever possible. The smallerparticles make compaction easier and present more surfacearea for the organisms to attack.
g. Temperature
The temperature within the landfill will riseslightly during the initial stages of aerobic breakdownwhich occurs prior to the utilization of oxygen initiallycontained within the fill. Anaerobic degradation is alsoslightly exothermic and therefore landfill temperatures, asstated above, are higher than the ambient air temperatures(Leckie et al., 1979).
h. Recycling of the Leachate
Experiments have been performed on leachaterecycling, as described by Buivid (1981) and Pohland (1975,1980). Leachate maintains the moisture content and providesa nutrient, buffer, inoculum and bacterial seed. Followingthe experiments of Veit and Zulaut (1982) at new Brazilianlandfills, a system was devised to collect and recycle theleachate and the gas.
i. Gas Collection and Utilization
Empirical numbers such as 62 cubic meters of gasproduced per metric ton of MSW as received are sometimesused to estimate gas yield (Baron et al., 1981). Thesenumbers are usually based on site specific data which cannotbe applied to other locations without normalizing them totake into account varying composition, moisture content.,etc.
GAS COLLECTION AND UTILIZATION
Collection and sale of biogas from landfills require carefulconsideration. The percentage of gas recovered depends on the constructionand operation of the fill. Ideally the landfill should be constructed sothat all wastes and liquids are totally contained and all gas totallycollected. Collection systems are sometimes installed while landfills arebeing filled. The system must recover the gas without interfering with thefill operation. A review of various gas collection and utilization systemsis contained in reports by Baron et al. (1981) and Ham et al. (1979).
There have been varying degrees of success in commerciallycollecting, utilizing and selling the landfill gas in the United States.Veit (1982) estimated in a study of a proposed project at Recife, Brazilthat 80% of gas produced could be sold. The amount of gas produced is
- 26 -
sometimes difficult to estimate, however, because of unknown quantities ofdecomposable organic matter. Experiments at test cells in Mountain View,California as describe by Pacey (1982) and elsewhere should provideincreasingly reliable estimates of gas production, collection, and sales;however engineers and municipal authorities need to know the probable rangeof values. The following example provides a method for estimating gasproduction and recovery.
Santos and Recife Analyses
Two analyses are available from studies made by Veit and Zulaut(1982) of MSW in coastal cities in Brazil; (1) the Santos analysis for MSWreported to be collected from areas near the beach and (2) the Recifeanalysis. The organic portions of the samples were:
Santos Recife
Paper 20.86 25.9Other organics 19.9 49.5Fabrics 2.57 1.9
The moisture content of the MSW was reported to be 60% for both samples.
In order to calculate the range of methane yields that might becollected and sold from a landfill in Brazil a number of assumptions mustbe made:
a. Total Dry Weight
The moisture content is assumed to be uniformlydistributed among the components comprising the MSW. (Inpractice, variations occur because market and food wastesusually have a higher moisture content than streetsweepings, paper and metals.) Total dry weight equals 400kilograms per metric ton of refuse.
b. Organic Fraction
It is assumed that paper and other organics arebiodegradable in the presence of adequate nutrients, buffersand seed, while the fabrics are not. In reality, the "otherorganics" fraction will contains plastics, lignocellulosicmaterials like wood, and other materials which resistanaerobic digestion. The rates of anaerobic decompositionare fastest for food wastes, followed in order by paper,grass clippings and tree trimmings, wood, and rubber.
The organic fractions as determined from theanalyses above are:
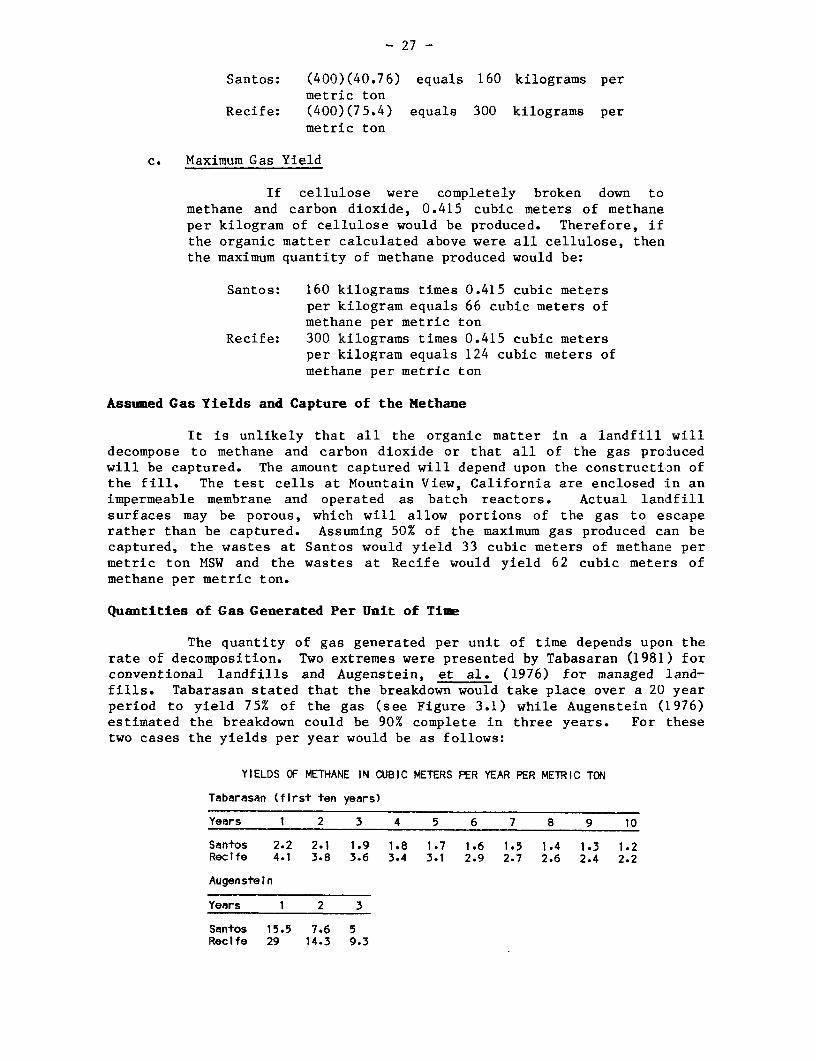
- 27 -
Santos: (400)(40.76) equals 160 kilograms permetric ton
Recife: (400)(75.4) equals 300 kilograms permetric ton
c. Maximum Gas Yield
If cellulose were completely broken down tomethane and carbon dioxide, 0.415 cubic meters of methaneper kilogram of cellulose would be produced. Therefore, ifthe organic matter calculated above were all cellulose, thenthe maximum quantity of methane produced would be:
Santos: 160 kilograms times 0.415 cubic metersper kilogram equals 66 cubic meters ofmethane per metric ton
Recife: 300 kilograms times 0.415 cubic metersper kilogram equals 124 cubic meters ofmethane per metric ton
Assumed Gas Yields and Capture of the Methane
It is unlikely that all the organic matter in a landfill willdecompose to methane and carbon dioxide or that all of the gas producedwill be captured. The amount captured will depend upon the construction ofthe fill. The test cells at Mountain View, California are enclosed in animpermeable membrane and operated as batch reactors. Actual landfillsurfaces may be porous, which will allow portions of the gas to escaperather than be captured. Assuming 50% of the maximum gas produced can becaptured, the wastes at Santos would yield 33 cubic meters of methanes permetric ton MSW and the wastes at Recife would yield 62 cubic meters ofmethane per metric ton.
Quantities of Gas Generated Per Unit of Time
The quantity of gas generated per unit of time depends upon therate of decomposition. Two extremes were presented by Tabasaran (1981) forconventional landfills and Augenstein, et al. (1976) for managed land-fills. Tabarasan stated that the breakdown would take place over a 20 yearperiod to yield 75% of the gas (see Figure 3.1) while Augenstein (1976)estimated the breakdown could be 90% complete in three years. For thesetwo cases the yields per year would be as follows:
YIELDS OF METHANE IN CUBIC METERS PER YEAR PER METRIC TON
Tabarasan (first ten years)
Years 1 2 3 4 5 6 7 8 9 10
Santos 2.2 2.1 1.9 1.8 1.7 1.6 1.5 1.4 1.3 1.2Recife 4.1 3.8 3.6 3.4 3.1 2.9 2.7 2.6 2.4 2.2
Augenstein
Years 1 2 3
Santos 15.5 7.6 5Recife 29 14.3 9.3
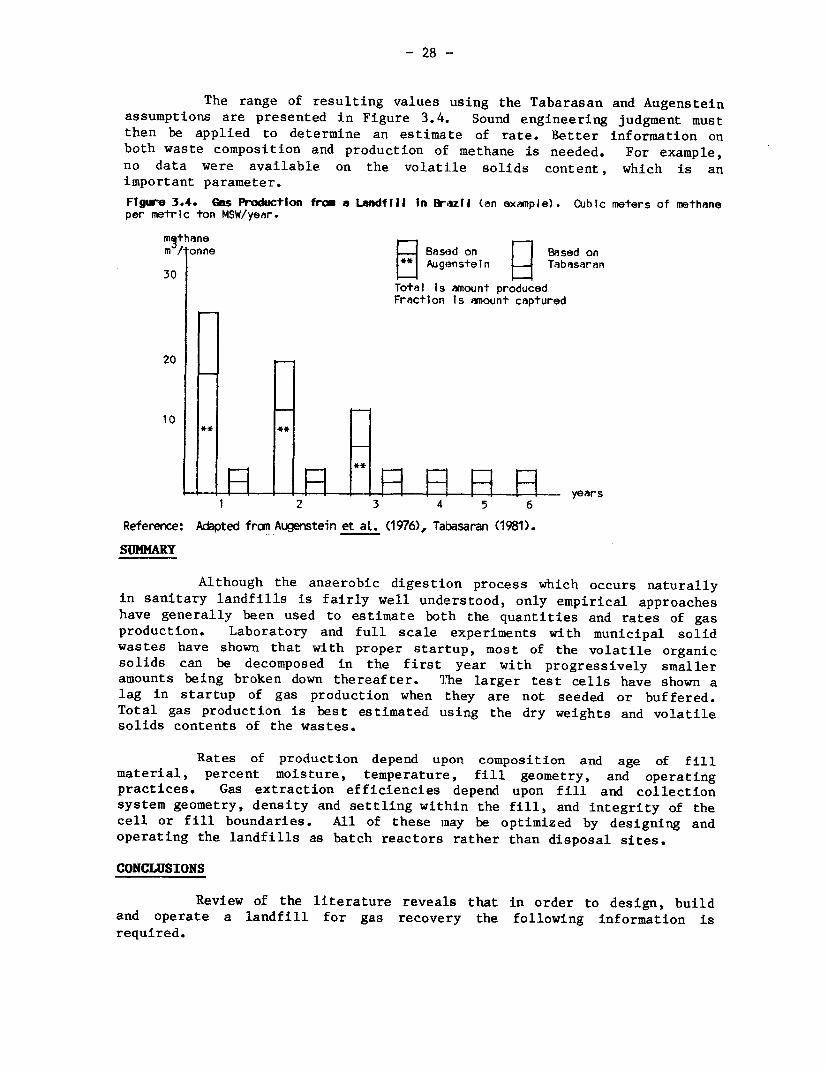
- 28 --
The range of resulting values using the Tabarasan and Augensteinassumptions are presented in Figure 3.4. Sound engineering judgment mustthen be applied to determine an estimate of rate. Better information onboth waste composition and production of methane is needed. For example,no data were available on the volatile solids content, which is animportant parameter.
Flgure 3.4. Gas Productlon from a Landfil In Bruiz1l (an exampJe). Cubic meters of methaneper metric ton MSW/year.
m•hanem / onne = Based on Based on
** Augenstein Tabasaran30
Total Is amount producedFraction Is anount captured
20
10
_] B -_ H 0 El | E years
i 2 3 4 5 6
Reference: Adapted frcm Augerstein et aL. (1976), Tabasaran (1981).
although the anaerobic digestion process which occurs naturallyin sanitary landfills is fairly well understood, only empirical approacheshave generally been used to estimate both the quantities and rates of gasproduction. Laboratory and full scale experiments with municipal solidwastes have shown that with proper startup, most of the volatile organicsolids can be decomposed in the first year with progressively smalleramounts being broken down thereafter. The larger test cells have shown alag in startup of gas production when they are not seeded or buffered.Total gas production is best estimated using the dry weights and volatilesolids contents of the wastes.
Rates of production depend upon composition and age of fillmaterial, percent moisture, temperature, fill geometry, and operatingpractices. Gas extraction efficiencies depend upon fill and collectionsystem geometry, density and settling within the fill, and integrity of thecell or fill boundaries. All of these may be optimized by designing andoperating the landfills as batch reactors rather than disposal sites.
CONCLUSIONS
Review of the literature reveals that in order to design, buildand operate a landfill for gas recovery the following information isrequired.
- 29 -
a. Characteristics of both the total waste and its variouscomponents which go into the landfill, such asbiodegradability, moisture content, nutrients and pH;
b. Preparation of the materials going into the fill, such asshredding, seeding, compaction, buffering;
c. Site characteristics, materials used to cover the fill, andgas collection system; and
d. Rates of gas production from materials similar to thosegoing into the fill.
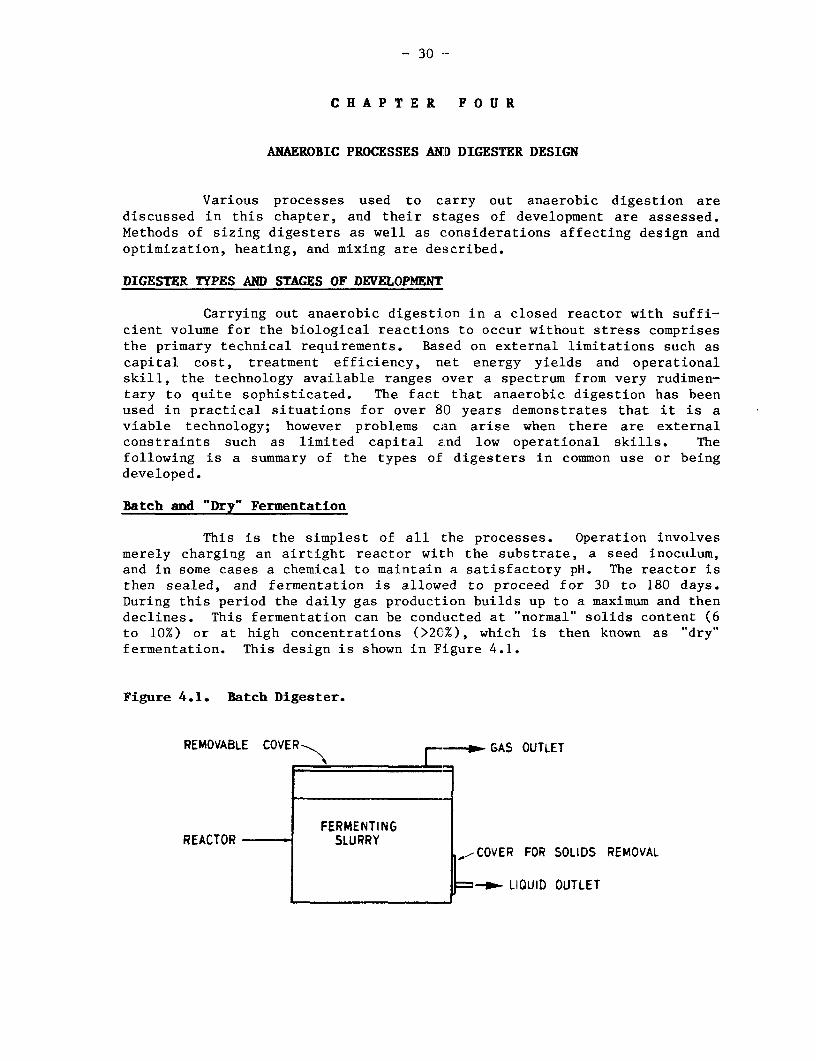
- 30 --
C H A P T E R F O U R
ANAEROBIC PROCESSES AND DIGESTER DESIGN
Various processes used to carry out anaerobic digestion arediscussed in this chapter, and their stages of development are assessed.Methods of sizing digesters as well as considerations affecting design andoptimization, heating, and mixing are described.
DIGESTER TYPES AND STAGES OF DEVELOPMENT
Carrying out anaerobic digestion in a closed reactor with suffi-cient volume for the biological reactions to occur without stress comprisesthe primary technical requirements. Based on external limitations such ascapital cost, treatment efficiency, net energy yields and operationalskill, the technology available ranges over a spectrum from very rudimen-tary to quite sophisticated. The fact that anaerobic digestion has beenused in practical situations for over 80 years demonstrates that it is aviable technology; however problems can arise when there are externalconstraints such as limited capital aLnd low operational skills. Thefollowing is a summary of the types of digesters in common use or beingdeveloped.
Batch and -Dry Fermentation
This is the simplest of all t:he processes. Operation involvesmerely charging an airtight reactor with the substrate, a seed inoculum,and in some cases a chemical to maintain a satisfactory pH. The reactor isthen sealed, and fermentation is allowed to proceed for 30 to 180 days.During this period the daily gas production builds up to a maximum and thendeclines. This fermentation can be conducted at "normal" solids content (6to 10%) or at high concentrations (>2C%), which is then known as "dry"fermentation. This design is shown in Figure 4.1.
Figure 4.1. Batch Digester.
REMOVABLE COVER r o GAS OUTLET
FERMENTI NGREACTOR SLURRY
,,COVER FOR SOLIDS REMOVAL
-_ - LIQUID OUTLET
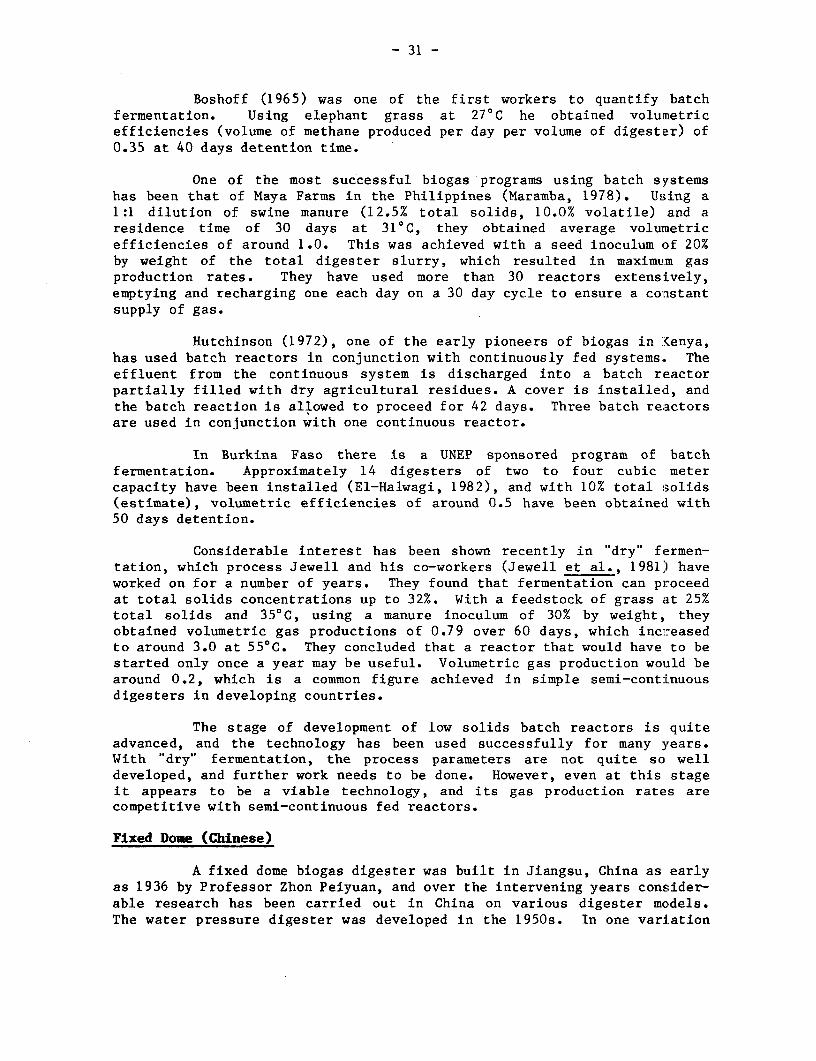
- 31 -
Boshoff (1965) was one of the first workers to quantify batchfermentation. Using elephant grass at 2700 he obtained volumetricefficiencies (volume of methane produced per day per volume of digester) of0.35 at 40 days detention time.
One of the most successful biogas programs using batch systemshas been that of Maya Farms in the Philippines (Maramba, 1978). Using a1:1 dilution of swine manure (12.5% total solids, 10.0% volatile) and aresidence time of 30 days at 31°C, they obtained average volumetricefficiencies of around 1.0. This was achieved with a seed inoculum Df 20%by weight of the total digester slurry, which resulted in maximum gasproduction rates. They have used more than 30 reactors extensively,emptying and recharging one each day on a 30 day cycle to ensure a co nstantsupply of gas.
Hutchinson (1972), one of the early pioneers of biogas in ]Kenya,has used batch reactors in conjunction with continuously fed systems. Theeffluent from the continuous system is discharged into a batch reactorpartially filled with dry agricultural residues. A cover is installed, andthe batch reaction is allowed to proceed for 42 days. Three batch reiactorsare used in conjunction with one continuous reactor.
In Burkina Faso there is a UNEP sponsored program of batchfermentation. Approximately 14 digesters of two to four cubic metercapacity have been installed (El-Halwagi, 1982), and with 10% total solids(estimate), volumetric efficiencies of around 0.5 have been obtained with50 days detention.
Considerable interest has been shown recently in "dry" fermen-tation, which process Jewell and his co-workers (Jewell et al., 1981) haveworked on for a number of years. They found that fermentation can proceedat total solids concentrations up to 32%. With a feedstock of grass at 25%total solids and 35°C, using a manure inoculum of 30% by weight, theyobtained volumetric gas productions of 0.79 over 60 days, which increasedto around 3.0 at 550 C. They concluded that a reactor that would have to bestarted only once a year may be useful. Volumetric gas production would bearound 0.2, which is a common figure achieved in simple semi-continuousdigesters in developing countries.
The stage of development of low solids batch reactors is quiteadvanced, and the technology has been used successfully for many years.With "dry" fermentation, the process parameters are not quite so welldeveloped, and further work needs to be done. However, even at this stageit appears to be a viable technology, and its gas production rates arecompetitive with semi-continuous fed reactors.
Fixed Done (Chinese)
A fixed dome biogas digester was built in Jiangsu, China as earlyas 1936 by Professor Zhon Peiyuan, and over the intervening years consider-able research has been carried out in China on various digester models.The water pressure digester was developed in the 1950s. In one variation
- 32 -
the displaced effluent flows onto the roof of the reactor, enabling theroof to withstand the gas pressure within more easily.
In terms of absolute numbers the fixed dome is by far the mostcommon digester type in developing countries. The reactor consists of agas tight chamber constructed of bricks, stone or poured concrete. Boththe top and bottom of the reactor are hemispherical, and are joinedtogether by straight sides. The inside surface is sealed by many thinlayers of mortar to make it gas tight, although gas leakage through thedome is often a major problem in this type of design. The digester is fedsemi-continuously (i.e., once a day) and the inlet pipe is straight andends at midlevel in the digester. There is a manhole plug at the top ofthe digester to facilitate entrance for cleaning, and the gas outlet pipeexits from the manhole cover (see Figure 4.2).
Figure 4.2. Fixed Dome (Chinese) Digester
REMOVABLE MANHOLE LOOSE COVERIN'LET GAS OUTLET4- /COVER SEAED WITH CLAY
S G A S 1 0 C=GA
-\ -Y - - SPLACEMENT TANK
_ . _ SLURRY . S OUTLET PIPE
The gas produced during digestion is stored under the dome anddisplaces some of the digester contents into the effluent chamber, leadingto gas pressures in the dome of between 1 and 1.5 meters of water. Thiscreates quite high structural forces and is the reason that the reactor hasa hemispherical top and bottom.
At the present time there are approximately six to seven millionof these digesters in China (Chan U Sam, 1982), and many in India and othercountries. The typical feed to these digesters is usually a mixture ofswine or cattle manure dung, water hyacinth, nightsoil, and agriculturalresidues, depending on their availability and carbon/nitrogen ratios.Agricultural residues are usually pretreated by composting with nightsoiland lime before digestion (UNEP, 1981). Gas production rates are on theorder of 0.1 to 0.2 volumes of gas per volume of digester per day (Chan USam, 1982), with detention times of 60 days at 25°C.
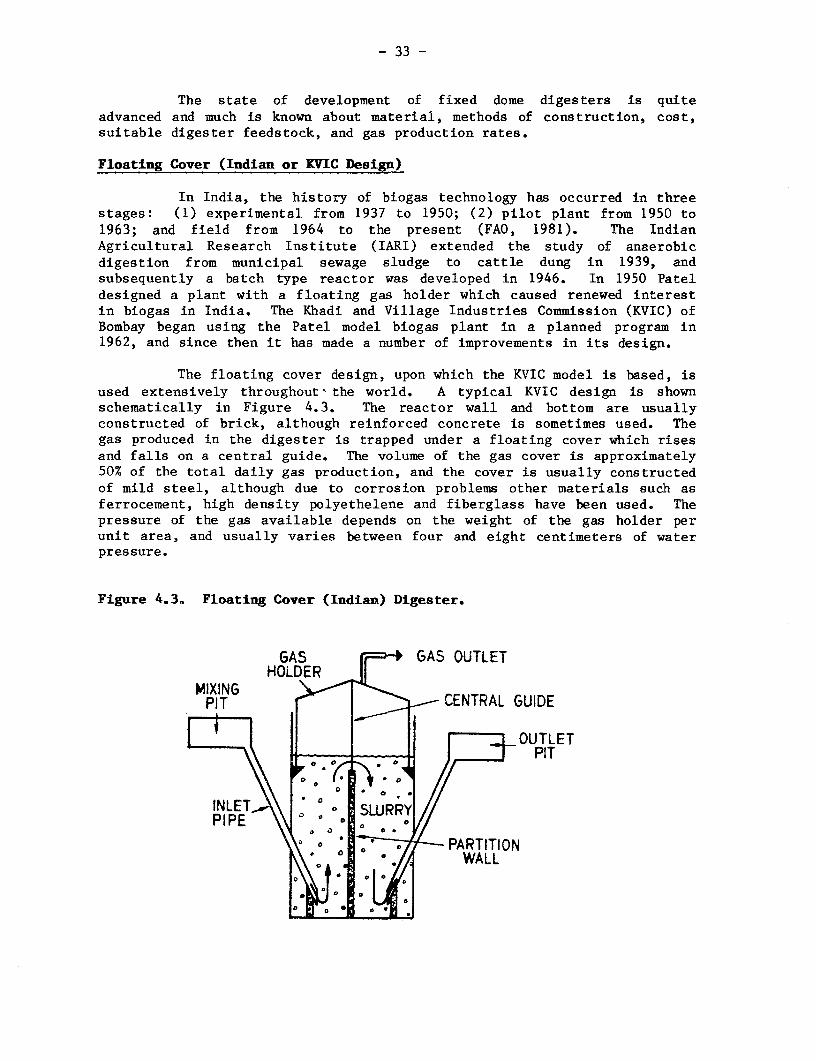
- 33 -
The state of development of fixed dome digesters is quiteadvanced and much is known about material, methods of construction, cost,suitable digester feedstock, and gas production rates.
Floating Cover (Indian or KVIC Design)
In India, the history of biogas technology has occurred in threestages: (1) experimental from 1937 to 1950; (2) pilot plant from 1950 to1963; and field from 1964 to the present (FAO, 1981). The IndianAgricultural Research Institute (IARI) extended the study of anaerobicdigestion from municipal sewage sludge to cattle dung in 1939, andsubsequently a batch type reactor was developed in 1946. In 1950 Pateldesigned a plant with a floating gas holder which caused renewed interestin biogas in India. The Khadi and Village Industries Commission (KVIC) ofBombay began using the Patel model biogas plant in a planned programa in1962, and since then it has made a number of improvements in its design.
The floating cover design, upon which the KVIC model is based, isused extensively throughout, the world. A typical KVIC design is shownschematically in Figure 4.3. The reactor wall and bottom are usuallyconstructed of brick, although reinforced concrete is sometimes used. Thegas produced in the digester is trapped under a floating cover which risesand falls on a central guide. The volume of the gas cover is approximately50% of the total daily gas production, and the cover is usually constructedof mild steel, although due to corrosion problems other materials such asferrocement, high density polyethelene and fiberglass have been used. Thepressure of the gas available depends on the weight of the gas holder perunit area, and usually varies between four and eight centimeters of waterpressure.
Figure 4.3. Floating Cover (Indian) Digester.
GAS GAS OUTLETHOLDER
MIXINGPIT CENTRAL GUIDE
OUTLETPIT
INLET SRPIPE 0a SLURY
o 0 ~~~PARTITION* 0 ~~WALL
00~~~~~~
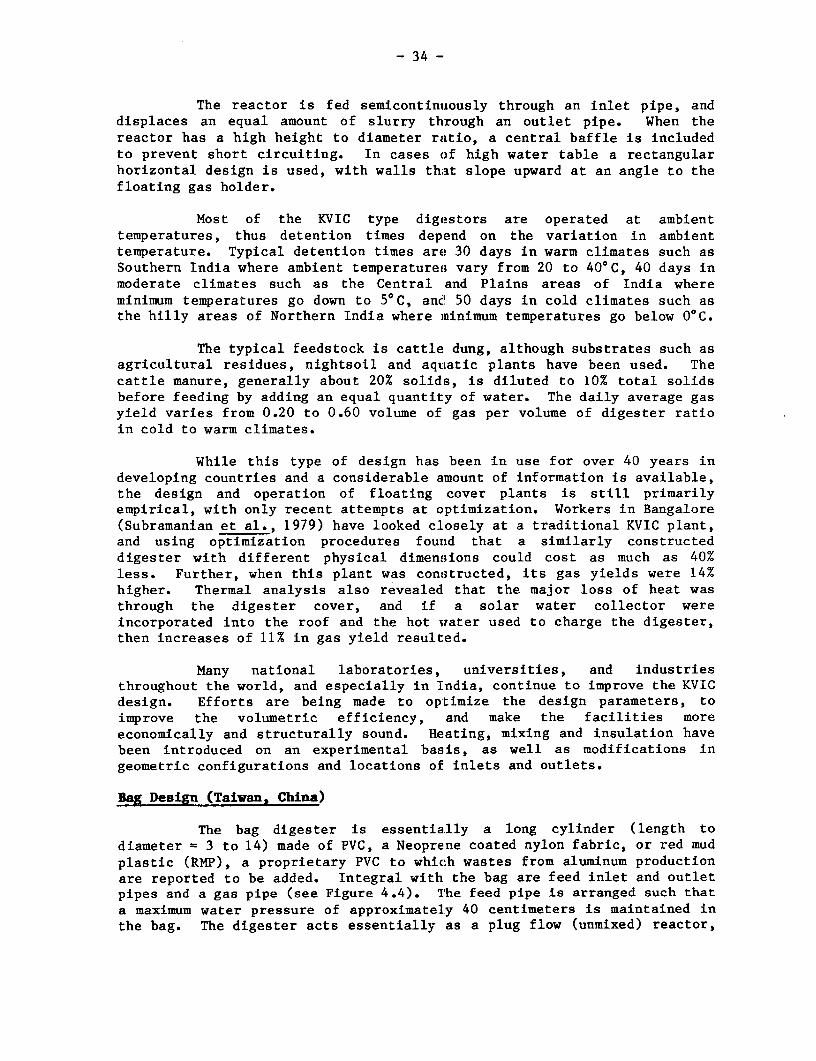
- 34 -
The reactor is fed semicontinuously through an inlet pipe, anddisplaces an equal amount of slurry through an outlet pipe. When thereactor has a high height to diameter ratio, a central baffle is includedto prevent short circuiting. In cases of high water table a rectangularhorizontal design is used, with walls that slope upward at an angle to thefloating gas holder.
Most of the KVIC type digestors are operated at ambienttemperatures, thus detention times depend on the variation in ambienttemperature. Typical detention times are 30 days in warm climates such asSouthern India where ambient temperatures vary from 20 to 400C, 40 days inmoderate climates such as the Central and Plains areas of India whereminimum temperatures go down to 5°C, andl 50 days in cold climates such asthe hilly areas of Northern India where minimum temperatures go below 00C.
The typical feedstock is cattle dung, although substrates such asagricultural residues, nightsoil and aquatic plants have been used. Thecattle manure, generally about 20% solids, is diluted to 10% total solidsbefore feeding by adding an equal quantity of water. The daily average gasyield varies from 0.20 to 0.60 volume of gas per volume of digester ratioin cold to warm climates.
While this type of design has been in use for over 40 years indeveloping countries and a considerable amount of information is available,the design and operation of floating cover plants is still primarilyempirical, with only recent attempts at optimization. Workers in Bangalore(Subramanian et al., 1979) have looked closely at a traditional KVIC plant,and using optimization procedures found that a similarly constructeddigester with different physical dimensions could cost as much as 40%less. Further, when this plant was constructed, its gas yields were 14%higher. Thermal analysis also revealed that the major loss of heat wasthrough the digester cover, and if a solar water collector wereincorporated into the roof and the hot water used to charge the digester,then increases of 11% in gas yield resulted.
Many national laboratories, universities, and industriesthroughout the world, and especially in India, continue to improve the KVICdesign. Efforts are being made to optimize the design parameters, toimprove the volumetric efficiency, and make the facilities moreeconomically and structurally sound. Heating, mixing and insulation havebeen introduced on an experimental basis, as well as modifications ingeometric configurations and locations of inlets and outlets.
Bag Design (Taiwan, China)
The bag digester is essentially a long cylinder (length todiameter - 3 to 14) made of PVC, a Neoprene coated nylon fabric, or red mudplastic (RMP), a proprietary PVC to which wastes from aluminum productionare reported to be added. Integral with the bag are feed inlet and outletpipes and a gas pipe (see Figure 4.4). Ihe feed pipe is arranged such thata maximum water pressure of approximately 40 centimeters is maintained inthe bag. The digester acts essentially as a plug flow (unmixed) reactor,
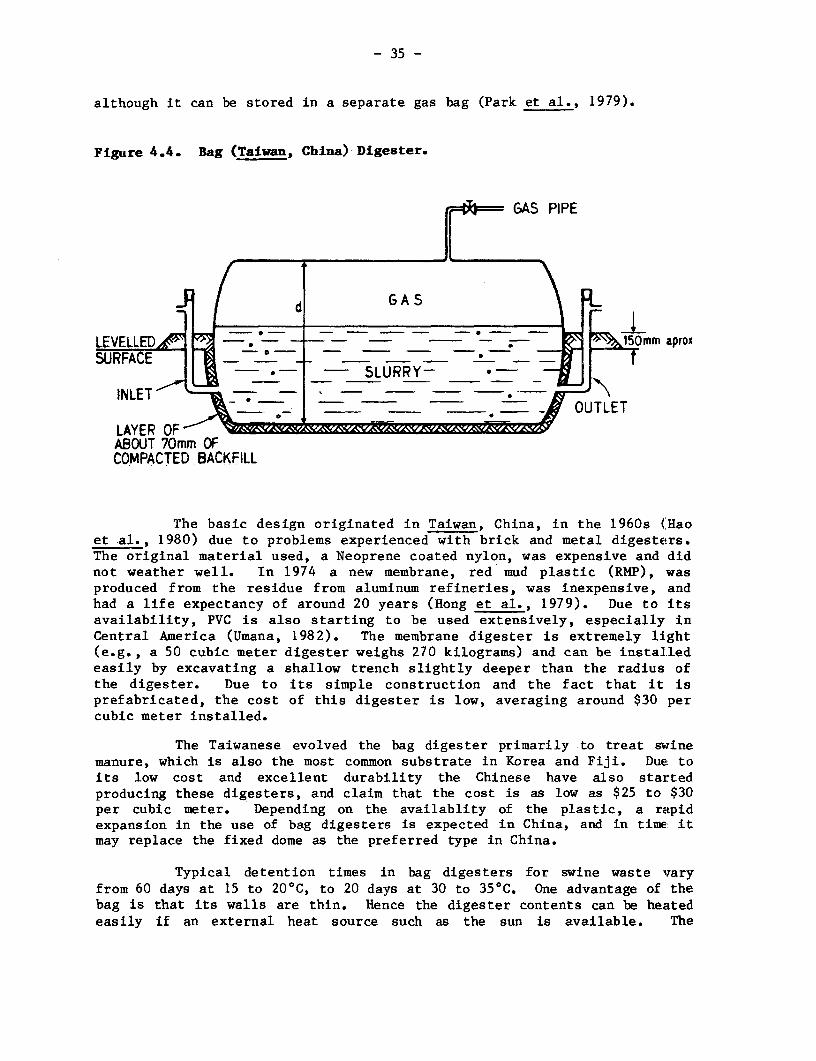
- 35 -
although it can be stored in a separate gas bag (Park et al., 1979).
Figure 4.4. Bag (Taiwan, China) Digester.
~~GAS PIPE
F ~~~d G A S
LEVELLED -. *= - - . _ 150mm aproxSURFACE - -SLURRY-
INLET TE
LAYER OFABOLJUT 70mm OFCOMPACTED BACKFILL
The basic design originated in Taiwan, China, in the 1960s (Haoet al., 1980) due to problems experienced with brick and metal digesters.The original material used, a Neoprene coated nylon, was expensive and didnot weather well. In 1974 a new membrane, red mud plastic (RMP), wasproduced from the residue from aluminum refineries, was inexpensive, andhad a life expectancy of around 20 years (Hong et al., 1979). Due to itsavailability, PVC is also starting to be used extensively, especially inCentral America (Umana, 1982). The membrane digester is extremely light(e.g., a 50 cubic meter digester weighs 270 kilograms) and can be installedeasily by excavating a shallow trench slightly deeper than the radius ofthe digester. Due to its simple construction and the fact that it isprefabricated, the cost of this digester is low, averaging around $30 percubic meter installed.
The Taiwanese evolved the bag digester primarily to treat swinemanure, which is also the most common substrate in Korea and Fiji. Due toits low cost and excellent durability the Chinese have also startedproducing these digesters, and claim that the cost is as low as $25 to $30per cubic meter. Depending on the availablity of the plastic, a rapidexpansion in the use of bag digesters is expected in China, and in time itmay replace the fixed dome as the preferred type in China.
Typical detention times in bag digesters for swine waste varyfrom 60 days at 15 to 20°C, to 20 days at 30 to 35°C. One advantage of thebag is that its walls are thin. Hence the digester contents can be heatedeasily if an external heat source such as the sun is available. The
- 36 -
Chinese have found that average temperatures in bag digesters compared withdome types are 2 to 7°C higher. Hence volumetric gas rates can be from 50to 300% higher in the bag (0.235 to 0.61 volumes of gas per volume ofdigester per day). Park et al. (1981) a:Lso found this to be true in Korea,and obtained volumetric gas productions varying from 0.14 in winter (8°C)to 0.7 in summer (320C) for swine manure.
In their present state of deveLopment, bag digesters appear to bevery competitive due to their low cost. However, more data is needed ontheir durability with regard to weather and mechanical failure (e.g., sharpobjects piercing the bag). The potential for increasing their performanceby heating with solar tents should also be explored.
Plug Flow
The plug flow reactor, while similar to the bag reactor, isconstructed of different materials and classified separately. A typicalplug flow reactor consists of a trench lined with either concrete or animpermeable membrane (see Figure 4.5). To ensure true plug flowconditions, the length has to be considerably greater than the width anddepth. The reactor is covered with e-ther a flexible cover gas holderanchored to the ground or with a concrete or galvanized iron top. In thelatter type a gas storage vessel is required. The inlet and outlet to thereactor are at opposite ends, and feeding is carried out semicontinuously,with the feed displacing an equal amount of effluent at the other end.
Figure 4.5. Plug Flow Digester.
INLETPIT FLEXIBLE MEMBRANE GAS OUTLET
OUTLETPIT
0 ~~~~~~0
\ .S;URRY .................. °COMPACTED0 BAC
r ° .................... o((#.AND INSULATIONt ia- *J ............................. SECTION
The first documented use of this type of reactor was in theRepublic of South Africa in 1957 (Fry, 1975), where it was insulated andheated to 35°C. Volumetric gas rates of 1 to 1.5 were obtained withdetention times of 40 days and loading rates of 3.4 kilograms total solidsper cubic meter per day.
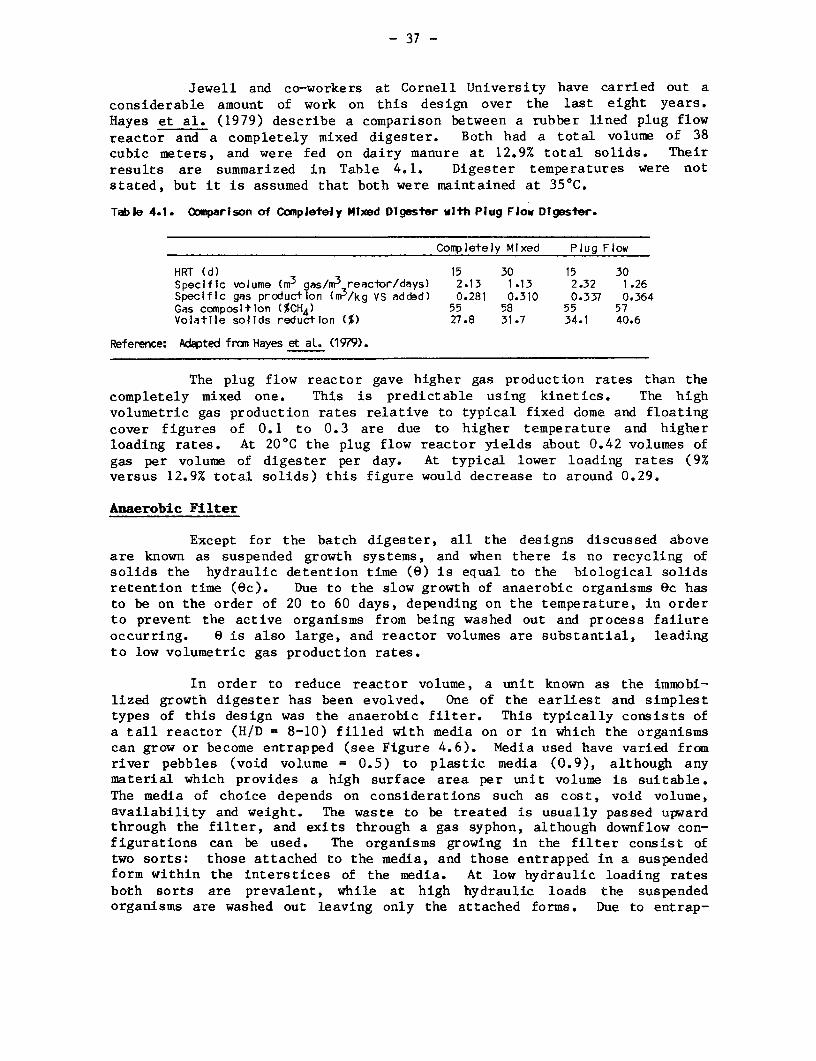
- 37 -
Jewell and co-workers at Cornell University have carried out aconsiderable amount of work on this design over the last eight years.Hayes et al. (1979) describe a comparison between a rubber lined plug flowreactor and a completely mixed digester. Both had a total volume of 38cubic meters, and were fed on dairy manure at 12.9% total solids. Theirresults are summarized in Table 4.1. Digester temperatures were notstated, but it is assumed that both were maintained at 35°C.
Table 4.1. (omparlson of Completely Mixed Digester with Plug Flow Digester.
Completely Mixed Plug Flow
HRT (d) 15 30 15 30Specific volume Cm3 gas/m3 reactor/days) 2.13 1.13 2.32 1.26Specific gas production (m3/kg VS added) 0.281 0.310 0.337 0.364Gas composition (%CH4) 55 58 55 57Volatile solids reduction (%) 27.8 31.7 34.1 40.6
Reference: Adated fran Hayes et aL. (1979).
The plug flow reactor gave higher gas production rates thaLn thecompletely mixed one. This is predictable using kinetics. The highvolumetric gas production rates relative to typical fixed dome and floatingcover figures of 0.1 to 0.3 are due to higher temperature and higherloading rates. At 20°C the plug flow reactor yields about 0.42 volumes ofgas per volume of digester per day. At typical lower loading rates (9%versus 12.9% total solids) this figure would decrease to around 0.29.
Anaerobic Filter
Except for the batch digester, all the designs discussed aboveare known as suspended growth systems, and when there is no recycling ofsolids the hydraulic detention time (O) is equal to the biological solidsretention time (ec). Due to the slow growth of anaerobic organisms (}c hasto be on the order of 20 to 60 days, depending on the temperature, in orderto prevent the active organisms from being washed out and process failureoccurring. 8 is also large, and reactor volumes are substantial, leadingto low volumetric gas production rates.
In order to reduce reactor volume, a unit known as the immobi-lized growth digester has been evolved. One of the earliest and simplesttypes of this design was the anaerobic filter. This typically consists ofa tall reactor (H/D = 8-10) filled with media on or in which the organismscan grow or become entrapped (see Figure 4.6). Media used have varied fromriver pebbles (void volume = 0.5) to plastic media (0.9), although anymaterial which provides a high surface area per unit volume is suitable.The media of choice depends on considerations such as cost, void volume,availability and weight. The waste to be treated is usually passed upwardthrough the filter, and exits through a gas syphon, although downflow con-figurations can be used. The organisms growing in the filter consist oftwo sorts: those attached to the media, and those entrapped in a suspendedform within the interstices of the media. At low hydraulic loading ratesboth sorts are prevalent, while at high hydraulic loads the suspendedorganisms are washed out leaving only the attached forms. Due to entrap-
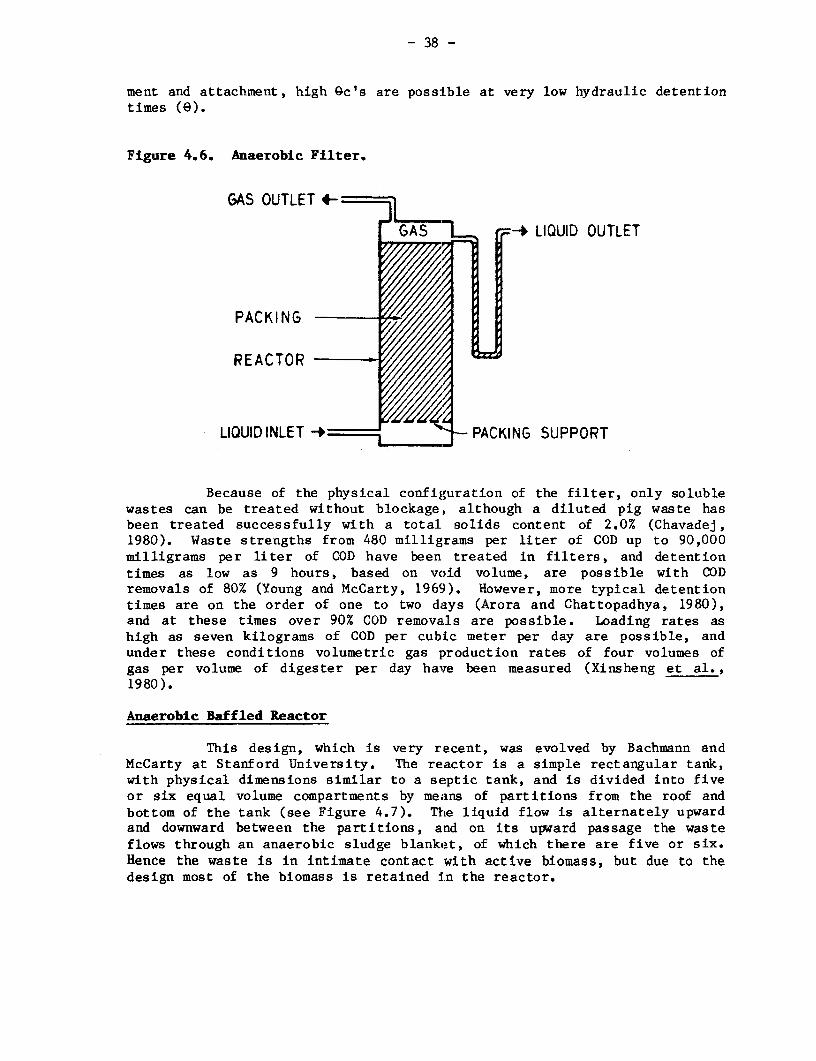
- 38 -
ment and attachment, high Gc's are possible at very low hydraulic detentiontimes (8).
Figure 4.6. Anaerobic Filter.
GAS OUTLET
GAS -+ LIQUID OUTLET
PACKING
REACTOR
LIQUID INLET - PACKING SUPPORT
Because of the physical configuration of the filter, only solublewastes can be treated without blockage, although a diluted pig waste hasbeen treated successfully with a total solids content of 2.0% (Chavadej,1980). Waste strengths from 480 milligrams per liter of COD up to 90,000milligrams per liter of COD have been treated in filters, and detentiontimes as low as 9 hours, based on void volume, are possible with CODremovals of 80% (Young and McCarty, 1969). However, more typical detentiontimes are on the order of one to two days (Arora and Chattopadhya, 1980),and at these times over 90% COD removals are possible. Loading rates ashigh as seven kilograms of COD per cubic meter per day are possible, andunder these conditions volumetric gas production rates of four volumes ofgas per volume of digester per day have been measured (Xinsheng et al.,1980).
Anaerobic Baffled Reactor
This design, which is very recent, was evolved by Bachmann andMcCarty at Stanford University. The reactor is a simple rectangular tank,with physical dimensions similar to a septic tank, and is divided into fiveor six equal volume compartments by means of partitions from the roof andbottom of the tank (see Figure 4.7). The liquid flow is alternately upwardand downward between the partitions, and on its upward passage the wasteflows through an anaerobic sludge blanket, of which there are five or six.Hence the waste is in intimate contact with active biomass, but due to thedesign most of the biomass is retained in the reactor.
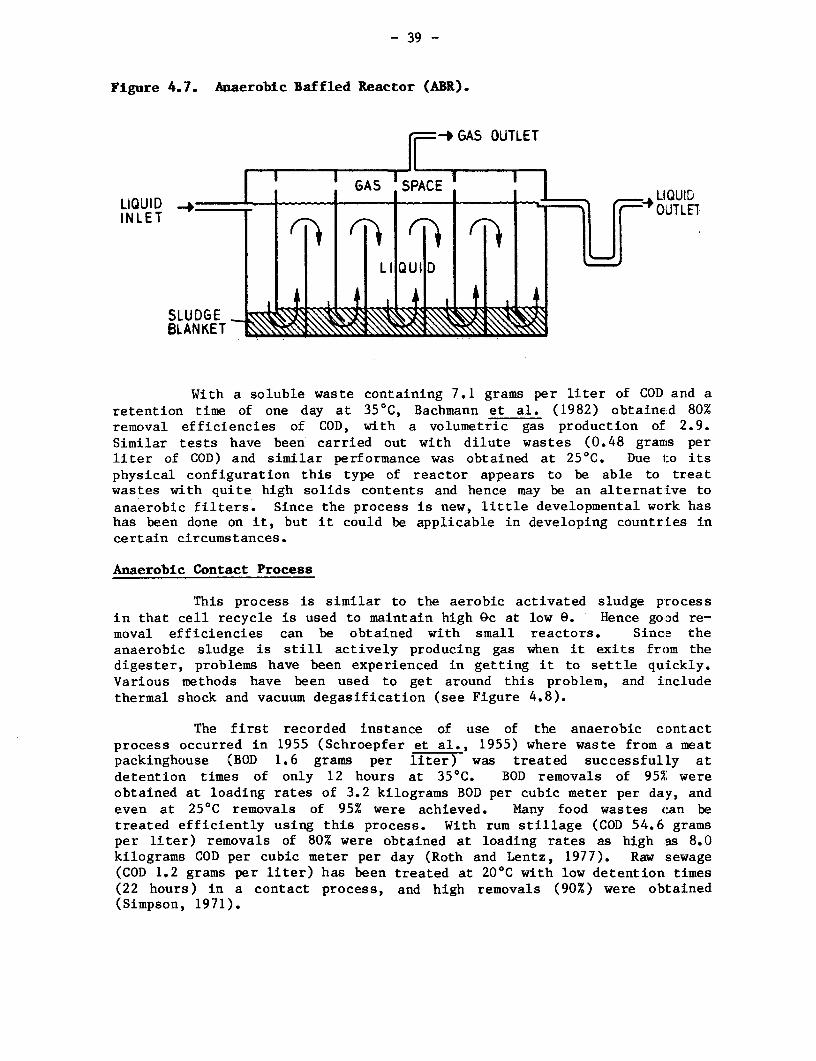
- 39 -
Figure 4.7. Anaerobic Baffled Reactor (ABR).
-4 GAS OUTLET
LIQUID LI -QUIDIN LET 'TT
SLUDGE.BLANKET
With a soluble waste containing 7.1 grams per liter of COD and aretention time of one day at 35°C, Bachmann et al. (1982) obtained 80%removal efficiencies of COD, with a volumetric gas production of 2.9.Similar tests have been carried out with dilute wastes (0.48 grams perliter of COD) and similar performance was obtained at 25°C. Due t:o itsphysical configuration this type of reactor appears to be able to treatwastes with quite high solids contents and hence may be an alternative toanaerobic filters. Since the process is new, little developmental work hashas been done on it, but it could be applicable in developing countries incertain circumstances.
Anaerobic Contact Process
This process is similar to the aerobic activated sludge processin that cell recycle is used to maintain high Qc at low O. Hence good re-moval efficiencies can be obtained with small reactors. Sinc,e theanaerobic sludge is still actively producing gas when it exits from thedigester, problems have been experienced in getting it to settle quickly.Various methods have been used to get around this problem, and includethermal shock and vacuum degasification (see Figure 4.8).
The first recorded instance of use of the anaerobic contactprocess occurred in 1955 (Schroepfer et al., 1955) where waste from a meatpackinghouse (BOD 1.6 grams per liter) was treated successfully atdetention times of only 12 hours at 35°C. BOD removals of 95% wereobtained at loading rates of 3.2 kilograms BOD per cubic meter per day, andeven at 25°C removals of 95% were achieved. Many food wastes can betreated efficiently using this process. With rum stillage (COD 54.6 gramsper liter) removals of 80% were obtained at loading rates as high as 8.0kilograms COD per cubic meter per day (Roth and Lentz, 1977). Raw sewage(COD 1.2 grams per liter) has been treated at 20°C with low detention times(22 hours) in a contact process, and high removals (90%) were obtained(Simpson, 1971).
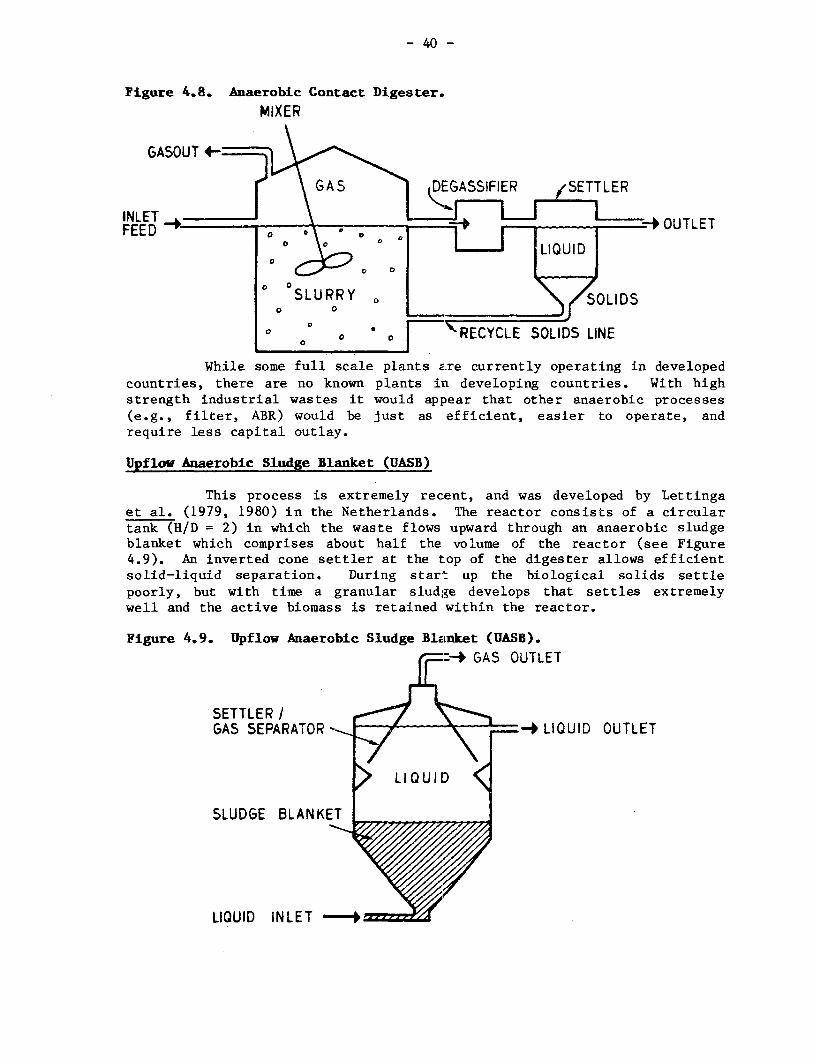
- 40 -
Figure 4.8. Anaerobic Contact Digester.
MIXER
GASOUTeA
1 GAS DFGASSIFIER (SETTLER
INLET \-- iFEED ̂ t I _OUTLET
° sb ° ° l , ~~LIQUID
SLURRY LIDS0 0
° o RECYCLE SOLIDS LINE
While some full scale plants are currently operating in developedcountries, there are no known plants in developing countries. With highstrength industrial wastes it would appear that other anaerobic processes(e.g., filter, ABR) would be just as efficient, easier to operate, andrequire less capital outlay.
Upflow Anaerobic Sludge Blanket (UASB)
This process is extremely recent, and was developed by Lettingaet al. (1979, 1980) in the Netherlands. The reactor consists of a circulartank (H/D = 2) in which the waste flows upward through an anaerobic sludgeblanket which comprises about half the volume of the reactor (see Figure4.9). An inverted cone settler at the top of the digester allows efficientsolid-liquid separation. During start up the biological solids settlepoorly, but with time a granular sludge develops that settles extremelywell and the active biomass is retained within the reactor.
Figure 4.9. Upflow Anaerobic Sludge Blanket (UASB).
4 GAS OUTLET
SETTLER /GAS SEPARATOR - LIQUID OUTLET
> LIQUID <
SLUDGE BLANKET
LIQUID INLET _
- 41 -
With predominantly soluble industrial wastes (potato processingwastewater) loading rates as high as 40 kilograms COD per cubic meter perday are possible with detention times as low as 3.5 hours. Under theseconditions volumetric gas production figures of 8.0 are possible (Lettingaet al., 1980). Since the process does not use media to maintain the activebiomass, total solids content in the feed can be as high as 3.0%.
At present there are approximately 11 full scale plants (100 to400 cubic meters) in operation in Europe, and a 1,400 cubic meter plant isbeing constructed in the United States. Operation requires a relativelyhigh degree of sophistication, especially during the critical start upphase. In most cases, alternative designs (filter, ABR) are available witha lower degree of complexity, and most of the advantages of the UASBprocess.
SIZING OF DIGESTERS
Designing a properly sized digester to maximize biogas productionper unit of reactor volume is important in maintaining low capitalconstruction costs. The digester should be sized to achieve desiredperformance goals, and must be large enough to avoid "washout."
As discussed in Chapter 2, anaerobic digestion depends on thebiological activity of slowly reproducing methanogenic bacteria. Thebacteria must be given sufficient time to reproduce so they can (1) replacecells lost with the effluent sludge, and (2) adjust their population sizeto follow fluctuations in organic loading. If the rate of bacteria lostfrom the digester with the effluent slurry exceeds the growth rate, thebacterial population in the digester will decline or be "washed out" of thesystem. Washout is avoided by maintaining a sufficient residence time forsolids, and thus bacterial cells, within the digester.
Design goals could be the maximizing of gas production withminimal capital investment, achieving pollution control and reduction ofpathogens, or simply the production of a reasonable amount of gas with aminimum of operational attention. Criteria must be established prior todesign, since not all goals can necessarily be achieved with a singledesign. Assuming that adequate performance data are available for thefeedstock under anticipated operating conditions, the designer can optimizethe digester size and other features such as degree of heating and mixingto meet the desired criteria and avoid washout.
Sewage Sludge Digesters
A number of empirical methods have been employed in the design ofconventional sewage sludge digesters, where emphasis has been pollutioncontrol rather than maximizing gas production. A discussion of sewagesludge digestion is included here since many laboratory and field studiesmade on this feedstock have led to our present day understanding of thedigestion process. Conservative design parameters applicable to sewagesludge treatment, however, result in digester sizes of up to 50% largerthan needed for plants designed to maximize methane production.
- 42 -
Design of large installations, particularly those with atypicalfeedstocks, is based on a fundamental urnderstanding of anaerobic processeswhich achieve desired performance goals. Large installations can alsoafford considerable operational attention, allowing process optimizationsuch as control of temperatures to improve gas production rate per unitdigester volume.
A major sizing parameter normaLly used in the design of anaerobicdigesters is the mean cell (or solids) residence time, ec. The mean cellresidence time is defined as the mass of bacterial cells in the digesterdivided by the mass of cells removed from the digester per day. For aconventional digester without solids recycle, Oc is equivalent to the hy-draulic retention time, 6, and is thus directly related to digester volume.It has been found that at a given temperature most digester performanceparameters of interest can be correlated with Oc, and that washout can bebe avoided if Oc is maintained above a critical minimum value, ecm.
Figure 4.10 illustrates the relationship between Oc and the per-formance of a laboratory scale anaerobic digester fed with raw primarysludge. It shows how the production of methane, as well as the reductionof degradable proteins, carbohydrates, lipids, chemical oxygen demand, andvolatile solids, are related to ec. As 9c is reduced, the concentration ofeach component in the effluent gradually increases until Bc reaches a valuebeyond which the effluent concentrations rapidly increase. This breakpointindicates the ec at which washout of microorganisms begins; that is, thepoint at which the rate the organisms leave the system exceeds their rateof reproduction. If ec is lowered to a critical point, the process willfail completely.
Temperature has an important effect on bacterial growth ratesand, accordingly, changes the relationship between Oc and digester perfor-mance. The critical mean cell residence time, ecm, is also affected bytemperature. O'Rourke (1968) found that the ecm for the digestion of pri-mary sewage sludge in a bench scale digester was 4.2 days at 35°C (95°F),7.0 days at 25°C (77°F), and 10.1 days at 10°C (50°F). For sewage sludgedigestion, it is normally recommended that the design Oc be at least 2.5times Gcm to provide a margin of safety for process stability.
In industrialized countries, heating of digesters is commonpractice and the trend has been toward thermophilic digestion, while indeveloping countries digesters are usually operated at ambient tempera-tures. Because the anaerobic digestion process essentially stops at 10°C,the digester contents must be maintaineeL at a temperature higher than thisfor significant gas production. Therefore design is based on criticaltemperature periods of the year, using anticipated temperature within thedigester rather than ambient air temperature.
Digestion of Agricultural Residues
Anaerobic digesters can utilize a large number of organicmaterials as feedstocks. These include animal manures, human wastes, cropresidues, food processing and other wastes, or mixtures of one or more ofthese residues and wastes.
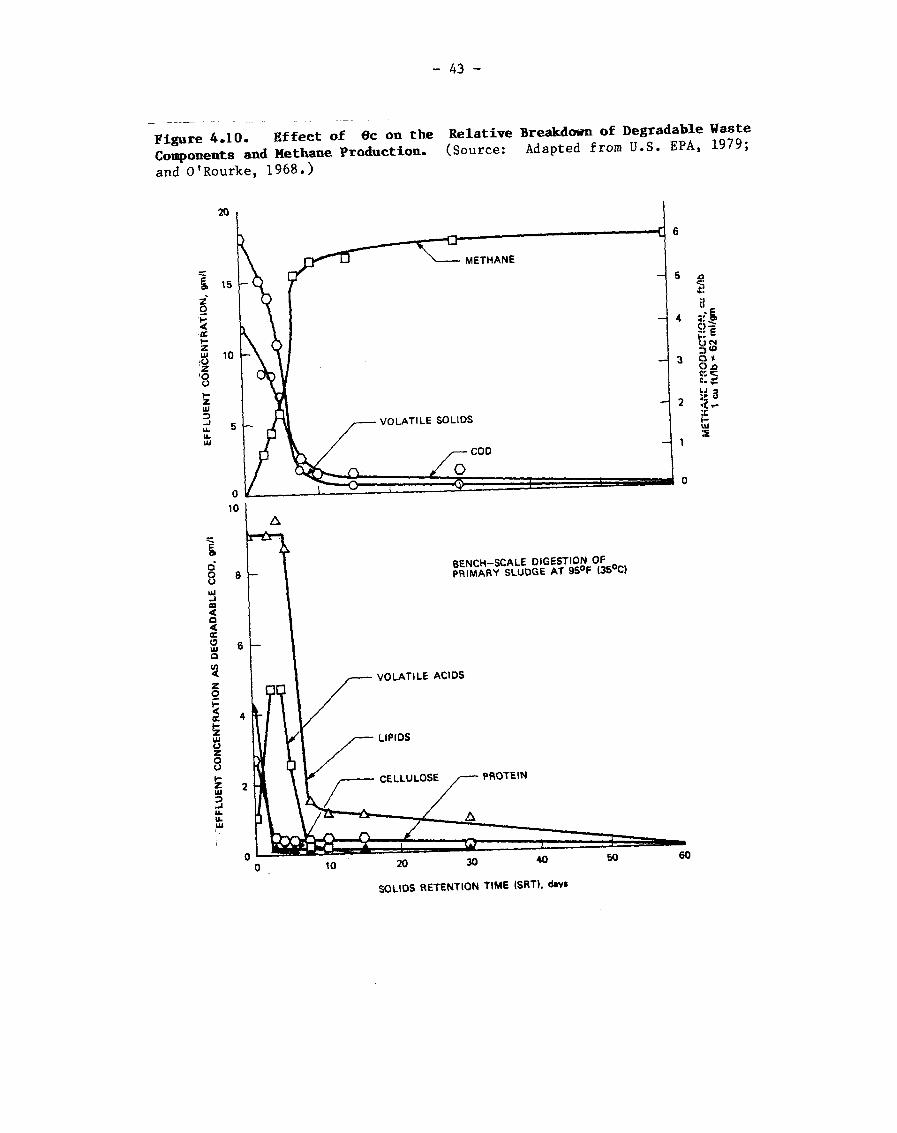
- 43 -
Figure 4.10. Effect of Oc on the Relative Breakdown of Degradable Waste
Components and Methane Production. (Source: Adapted from U.S. EPA, 1979;
and O'Rourke, 1968.)
20
6
,15 5 x
4I- ~~~~~~~~~~~~~~~~~~~~~~~4
10
z 3 S OU0 0.0
I.n
z Y 2
5 VOLATILE SOLIDS
CO
0 _ 010
O 8 ~~~~~~~~BENCH-SCALE DIGE-STION OFu ~~~~~~~~~PRIMARY SLUDGE AT 95OF (35OC)
4
VLAILE CIDz0
2 ELUO-PRTI
z 03 4 06
CELLULSREENT PROTIEINR),dv
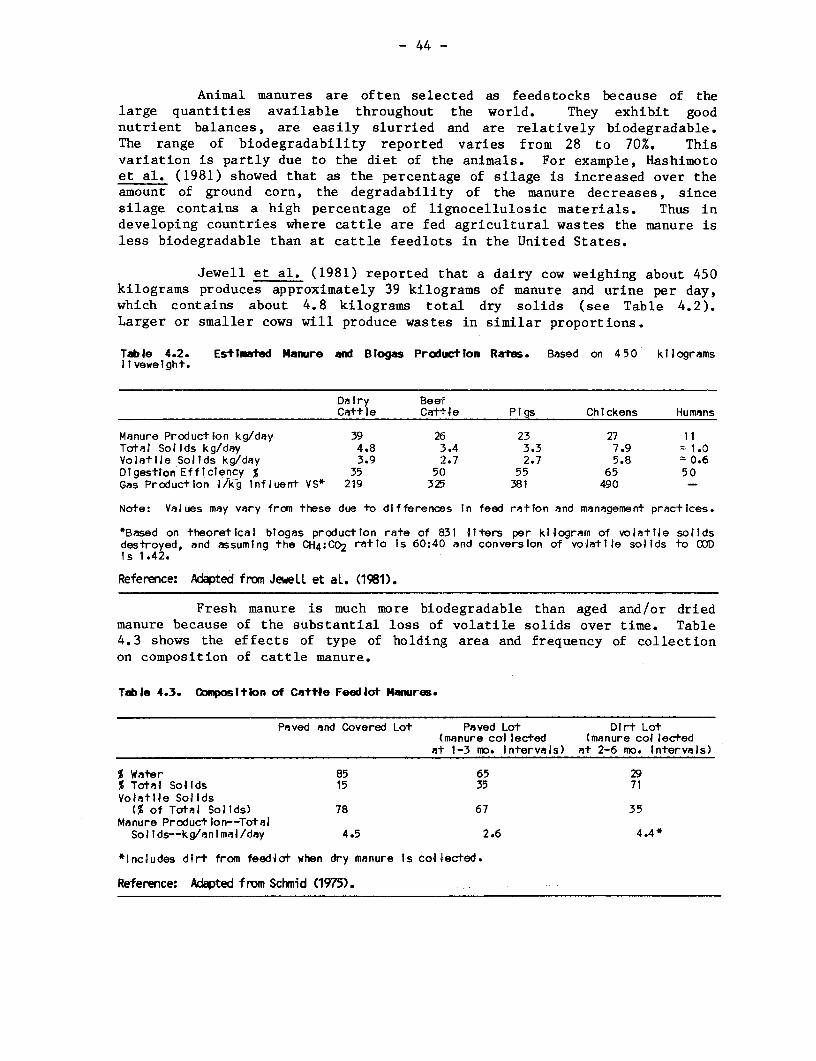
- 44 --
Animal manures are often selected as feedstocks because of thelarge quantities available throughout the world. They exhibit goodnutrient balances, are easily slurried and are relatively biodegradable.The range of biodegradability reported varies from 28 to 70%. Thisvariation is partly due to the diet of the animals. For example, Hashimotoet al. (1981) showed that as the percentage of silage is increased over theamount of ground corn, the degradability of the manure decreases, sincesilage contains a high percentage of lignocellulosic materials. Thus indeveloping countries where cattle are fedt agricultural wastes the manure isless biodegradable than at cattle feedlots in the United States.
Jewell et al. (1981) reported that a dairy cow weighing about 450kilograms produces approximately 39 kilograms of manure and urine per day,which contains about 4.8 kilograms total dry solids (see Table 4.2).Larger or smaller cows will produce wastes in similar proportions.
TabJe 4.2. Estimated Manure and Blogas Production Raes. Based on 4 50 kilogramsI i vewe I ght.
Da I ry BeefCattle Catt I e Pigs Chickens Humans
Manure Production kg/day 39 26 23 27 11Total Solids kg/day 4.8 3.4 3.3 7.9 =1.0Volatile SoJlds kg/day 3.9 2.7 2.7 5.8 =0.6DIgestion Efficiency % 35 5C) 55 65 50Gas Production IJkg Influent VS* 219 325 381 490 -
Note: Values may vary from these due to differences In feed ration and management practices.
*Based on theoretical blogas production rate of 831 Iters per ktiogram of volatile solidsdestroyed, and assuming the CH4 :C02 ratio Is 60:40 and converslon of volatile solids to CODIs 1.42.
Reference: Ada,ted from JewelL et aL. (1981).
Fresh manure is much more biodegradable than aged and/or driedmanure because of the substantial loss of volatile solids over time. Table4.3 shows the effects of type of holding area and frequency of collectionon composition of cattle manure.
Table 4.3. Omposition of Cattle Feedlot anures.
Paved and Covered Lot Paved Lot Dirt Lot(manure col lected (manure collected
at 1-3 mo. Intervals) at 2-6 mo. Intervals)
% Water 85 65 29% Total Solids 15 35 71Volatile Solids
(% of Total SolIds) 78 67 35Manure Production--Total
Solids--kg/animal/day 4.5 2.6 4.4*
*Includes dirt from feedlot when dry manure Is collected.
Reference: Adapted from Schmid (1975).
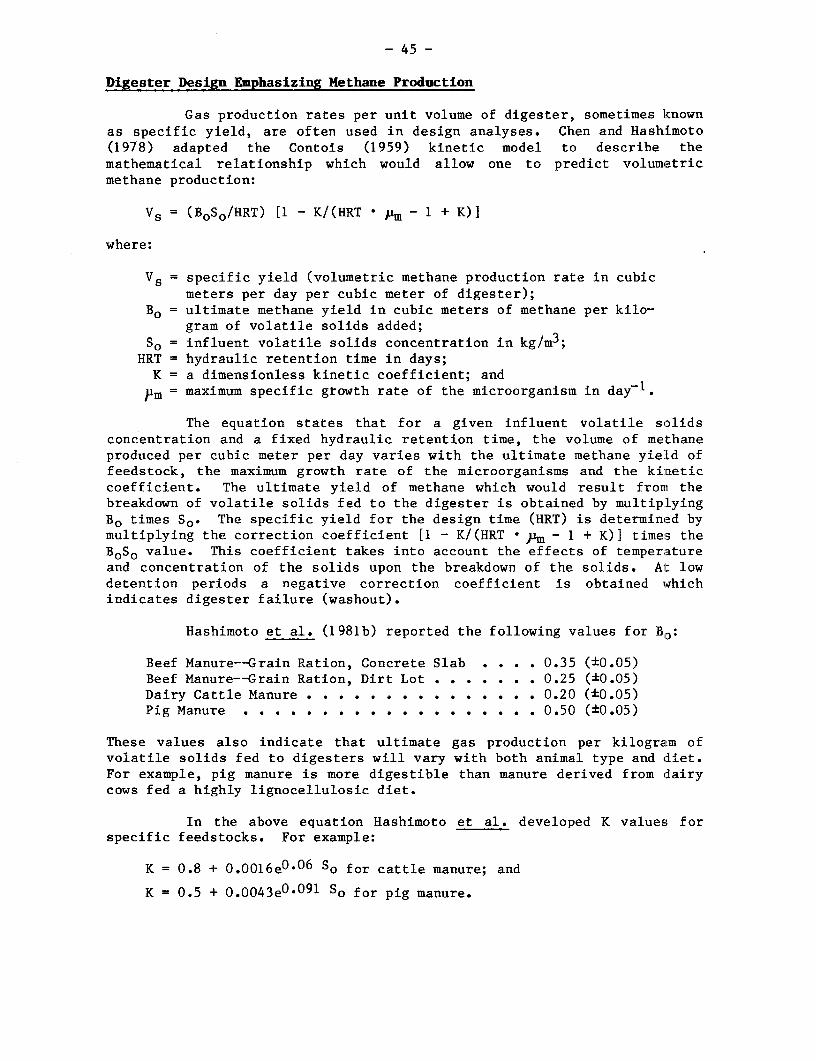
- 45 -
Digester Design Emphasizing Methane Production
Gas production rates per unit volume of digester, sometimes knownas specific yield, are often used in design analyses. Chen and Hashimoto(1978) adapted the Contois (1959) kinetic model to describe themathematical relationship which would allow one to predict volumetricmethane production:
Vs = (BOSO/HRT) [1 - K/(HRT * pm - 1 + K)]
where:
Vs = specific yield (volumetric methane production rate in cubicmeters per day per cubic meter of digester);
Bo = ultimate methane yield in cubic meters of methane per kilo-gram of volatile solids added;
SO= influent volatile solids concentration in kg/m3;HRT = hydraulic retention time in days;K = a dimensionless kinetic coefficient; andm= maximum specific gtowth rate of the microorganism in dayfl.
The equation states that for a given influent volatile solidsconcentration and a fixed hydraulic retention time, the volume of methaneproduced per cubic meter per day varies with the ultimate methane yieLd offeedstock, the maximum growth rate of the microorganisms and the kineticcoefficient. The ultimate yield of methane which would result from thebreakdown of volatile solids fed to the digester is obtained by multiplyingBo times SO. The specific yield for the design time (HRT) is determinead bymultiplying the correction coefficient [1 - K/(HRT - pm - 1 + K)] times theBoSo value. This coefficient takes into account the effects of temperatureand concentration of the solids upon the breakdown of the solids. At lowdetention periods a negative correction coefficient is obtained whichindicates digester failure (washout).
Hashimoto et al. (1981b) reported the following values for B.:
Beef Manure--Grain Ration, Concrete Slab . . . . 0.35 (±0.05)Beef Manure--Grain Ration, Dirt Lot . . . . . . . 0.25 (±0.05)Dairy Cattle Manure . . . . . . . . . . . . . . . 0.20 (±0.05)Pig Manure . . . . . . . . . . . . . . . . . . . 0.50 (±0.05)
These values also indicate that ultimate gas production per kilogram ofvolatile solids fed to digesters will vary with both animal type and diet.For example, pig manure is more digestible than manure derived from dairycows fed a highly lignocellulosic diet.
In the above equation Hashimoto et al. developed K values forspecific feedstocks. For example:
K = 0.8 + 0.0016e 0 .0 6 SO for cattle manure; and
K = 0.5 + 0.0043e 0 *0 9 1 So for pig manure.
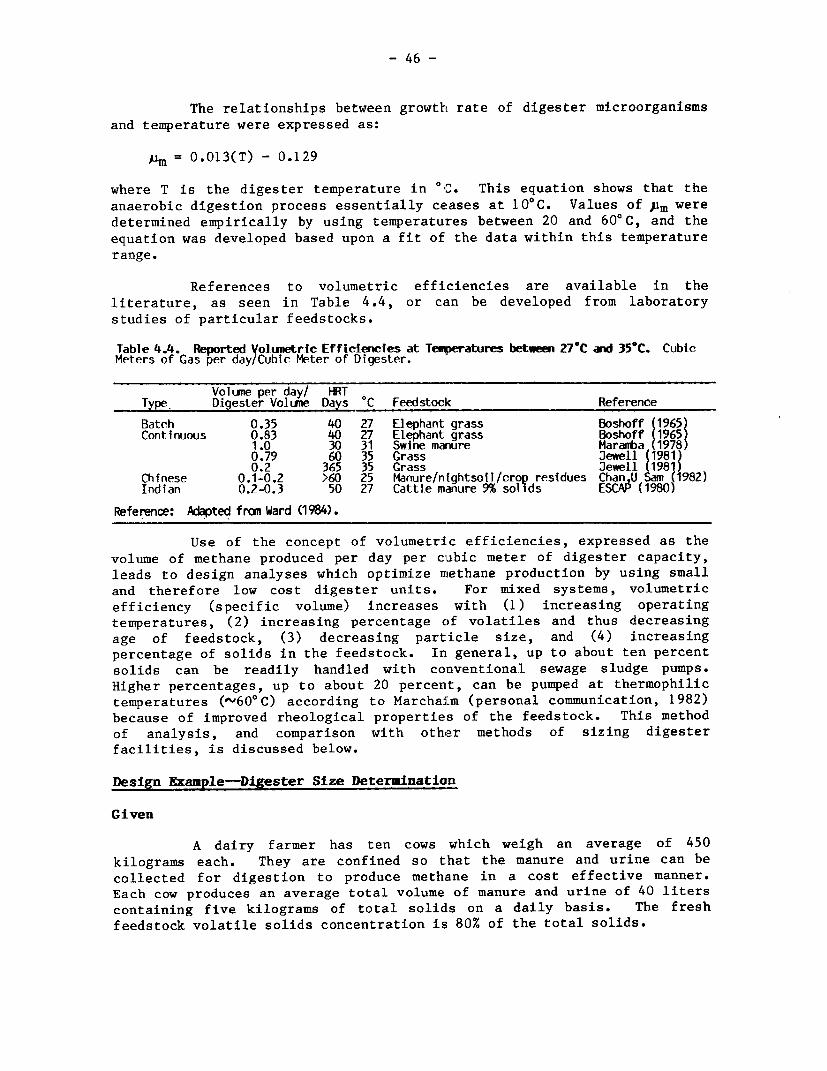
- 46 -
The relationships between growth rate of digester microorganismsand temperature were expressed as:
jam = 0.013(T) - 0.129
where T is the digester temperature in °C. This equation shows that theanaerobic digestion process essentially ceases at 10C. Values of Pm weredetermined empirically by using temperatures between 20 and 600C, and theequation was developed based upon a fit of the data within this temperaturerange.
References to volumetric efficiencies are available in theliterature, as seen in Table 4.4, or can be developed from laboratorystudies of particular feedstocks.
Table 4.4. Reported Volumetric Efficiencies at Teumperatures betweem 27C ard 35'C. CubicMeters of Gas per day/Cubic Meter of Digester.
Volume per day/ HRTTyvpe Digester Volune Days °C Feedstoclk Reference
Batch 0.35 40 27 Elephant grass Boshoff (1965)Continuous 0.83 40 27 Elephant grass Boshoff (1965
1.0 30 31 Swine manure Maramba (19780.79 60 35 Grass Jewell (1981)0.2 365 35 Grass Jewell (1981)
Chtinese 0.1-0.2 >60 25 Manure/nightsoil/crop residues Chan U Sam (1982)Indian 0.2-0.3 50 27 Cattle manure 9% sol ds ESCAI (1980)
Reference: Adapted fran Ward (1984).
Use of the concept of volumetric efficiencies, expressed as thevolume of methane produced per day per cubic meter of digester capacity,leads to design analyses which optimize methane production by using smalland therefore low cost digester units. For mixed systems, volumetricefficiency (specific volume) increases with (1) increasing operatingtemperatures, (2) increasing percentage of volatiles and thus decreasingage of feedstock, (3) decreasing particle size, and (4) increasingpercentage of solids in the feedstock. In general, up to about ten percentsolids can be readily handled with conventional sewage sludge pumps.Higher percentages, up to about 20 percent, can be pumped at thermophilictemperatures ('60°C) according to MarchaiLm (personal communication, 1982)because of improved rheological properties of the feedstock. This methodof analysis, and comparison with other methods of sizing digesterfacilities, is discussed below.
Design Example-Digester Size Determination
Given
A dairy farmer has ten cows which weigh an average of 450kilograms each. They are confined so that the manure and urine can becollected for digestion to produce methane in a cost effective manner.Each cow produces an average total volume of manure and urine of 40 literscontaining five kilograms of total solids on a daily basis. The freshfeedstock volatile solids concentration is 80% of the total solids.
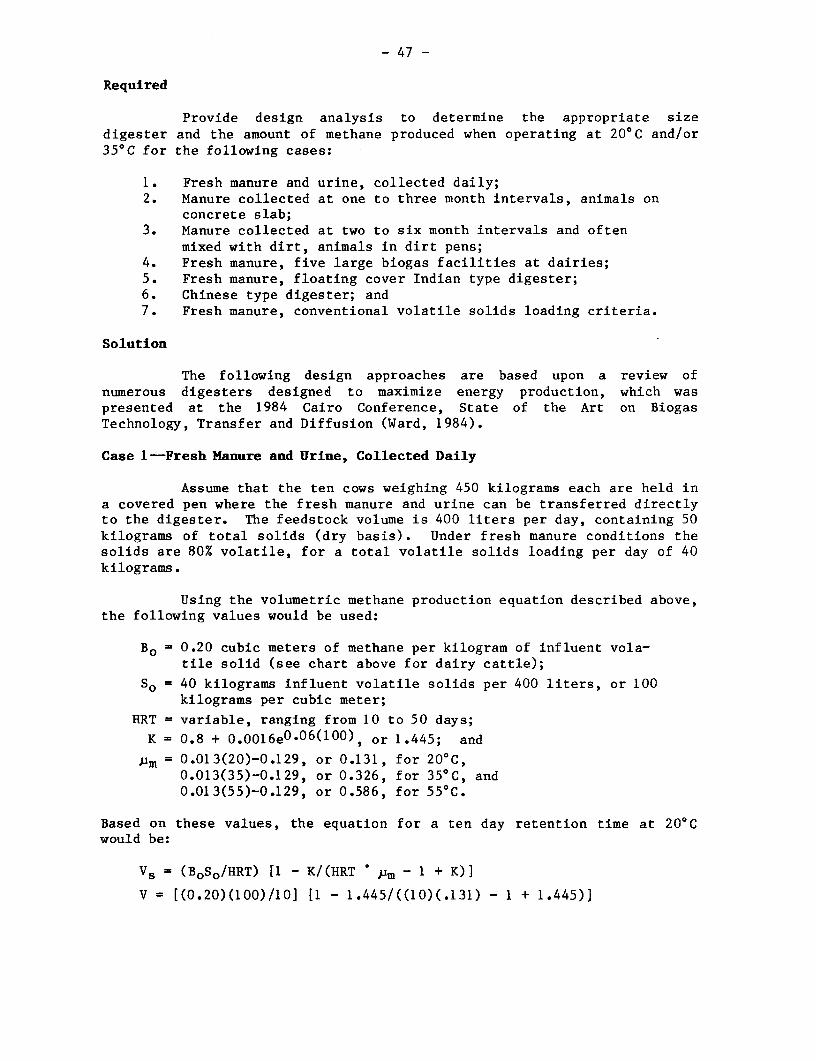
- 47 -
Required
Provide design analysis to determine the appropriate sizedigester and the amount of methane produced when operating at 20°C and/or35°C for the following cases:
1. Fresh manure and urine, collected daily;2. Manure collected at one to three month intervals, animals on
concrete slab;3. Manure collected at two to six month intervals and often
mixed with dirt, animals in dirt pens;4. Fresh manure, five large biogas facilities at dairies;5. Fresh manure, floating cover Indian type digester;6. Chinese type digester; and7. Fresh manure, conventional volatile solids loading criteria.
Solution
The following design approaches are based upon a review ofnumerous digesters designed to maximize energy production, which waspresented at the 1984 Cairo Conference, State of the Art on BiogasTechnology, Transfer and Diffusion (Ward, 1984).
Case 1-Fresh Manure and Urine, Collected Daily
Assume that the ten cows weighing 450 kilograms each are held ina covered pen where the fresh manure and urine can be transferred directlyto the digester. The feedstock volume is 400 liters per day, containirLg 50kilograms of total solids (dry basis). Under fresh manure conditions thesolids are 80% volatile, for a total volatile solids loading per day cf 40kilograms.
Using the volumetric methane production equation described above,the following values would be used:
B0 = 0.20 cubic meters of methane per kilogram of influent vola-tile solid (see chart above for dairy cattle);
SO= 40 kilograms influent volatile solids per 400 liters, or 100kilograms per cubic meter;
HRT = variable, ranging from 10 to 50 days;K = 0.8 + 0.0016e 0 . 0 6 (100), or 1.445; and
JUm = 0.013(20)-0.129, or 0.131, for 20°C,0.013(35)-0.129, or 0.326, for 35°C, and0.013(55)-0.129, or 0.586, for 55°C.
Based on these values, the equation for a ten day retention time at 200Cwould be:
Vs = (BOSO/HRT) [1 - K/(HRT j)m - 1 + K)]
V = [(0.20)(100)/10] [1 - 1.445/((10)(.131) - 1 + 1.445)]
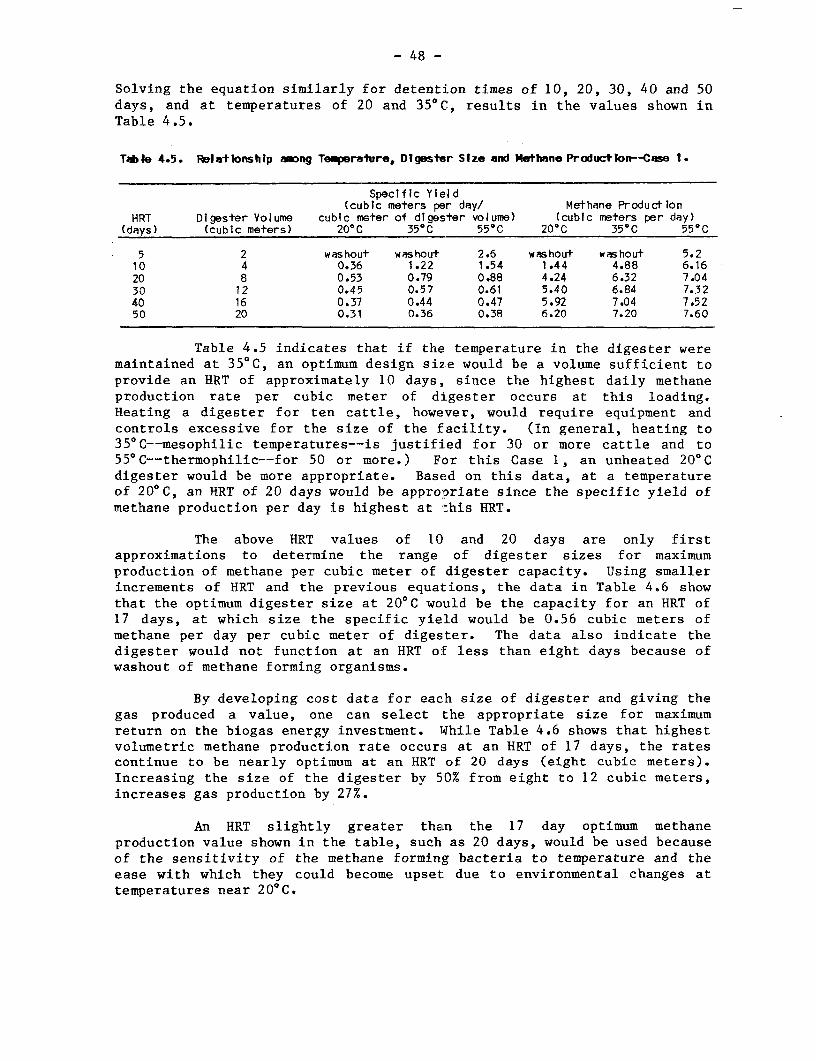
- 48 -
Solving the equation similarly for detention times of 10, 20, 30, 40 and 50days, and at temperatures of 20 and 350C, results in the values shown inTable 4.5.
Table 4.5. Relationship ang Temperalure, Digester Size and 1ethane Productior--Case 1.
Specific Yield(cubic meters per day/ Methane Production
HRT Digester Volume cubic meter of digester volume) (cubic meters per day)(days) (cubic meters) 20°C 35°C 55°C 20° 350C 55°C
5 2 washout washout 2.6 washout washout 5.210 4 0.36 1.22 1.54 1.44 4.88 6.1620 8 0.53 0.79 0.88 4.24 6.32 7.0430 12 0.45 0.57 0.61 5.40 6.84 7.3240 16 0.37 0.44 0.47 5.92 7.04 7.5250 20 0.31 0.36 0.38 6.20 7.20 7.60
Table 4.5 indicates that if the temperature in the digester weremaintained at 35°C, an optimum design size would be a volume sufficient toprovide an HRT of approximately 10 days, since the highest daily methaneproduction rate per cubic meter of diLgester occurs at this loading.Heating a digester for ten cattle, however, would require equipment andcontrols excessive for the size of the facility. (In general, heating to350C--mesophilic temperatures--is justified for 30 or more cattle and to55°C--thermophilic--for 50 or more.) For this Case 1, an unheated 20°Cdigester would be more appropriate. Based on this data, at a temperatureof 20°C, an HRT of 20 days would be appropriate since the specific yield ofmethane production per day is highest at this HRT.
The above HRT values of 10 and 20 days are only firstapproximations to determine the range of digester sizes for maximumproduction of methane per cubic meter of digester capacity. Using smallerincrements of HRT and the previous equations, the data in Table 4.6 showthat the optimum digester size at 20°C would be the capacity for an HRT of17 days, at which size the specific yield would be 0.56 cubic meters ofmethane per day per cubic meter of digester. The data also indicate thedigester would not function at an HRT oE less than eight days because ofwashout of methane forming organisms.
By developing cost data for each size of digester and giving thegas produced a value, one can select the appropriate size for maximumreturn on the biogas energy investment. W4hile Table 4.6 shows that highestvolumetric methane production rate occurs at an HRT of 17 days, the ratescontinue to be nearly optimum at an HRT of 20 days (eight cubic meters).Increasing the size of the digester by 50% from eight to 12 cubic meters,increases gas production by 27%.
An HRT slightly greater thaLn the 17 day optimum methaneproduction value shown in the table, such as 20 days, would be used becauseof the sensitivity of the methane forming bacteria to temperature and theease with which they could become upset: due to environmental changes attemperatures near 20°C.
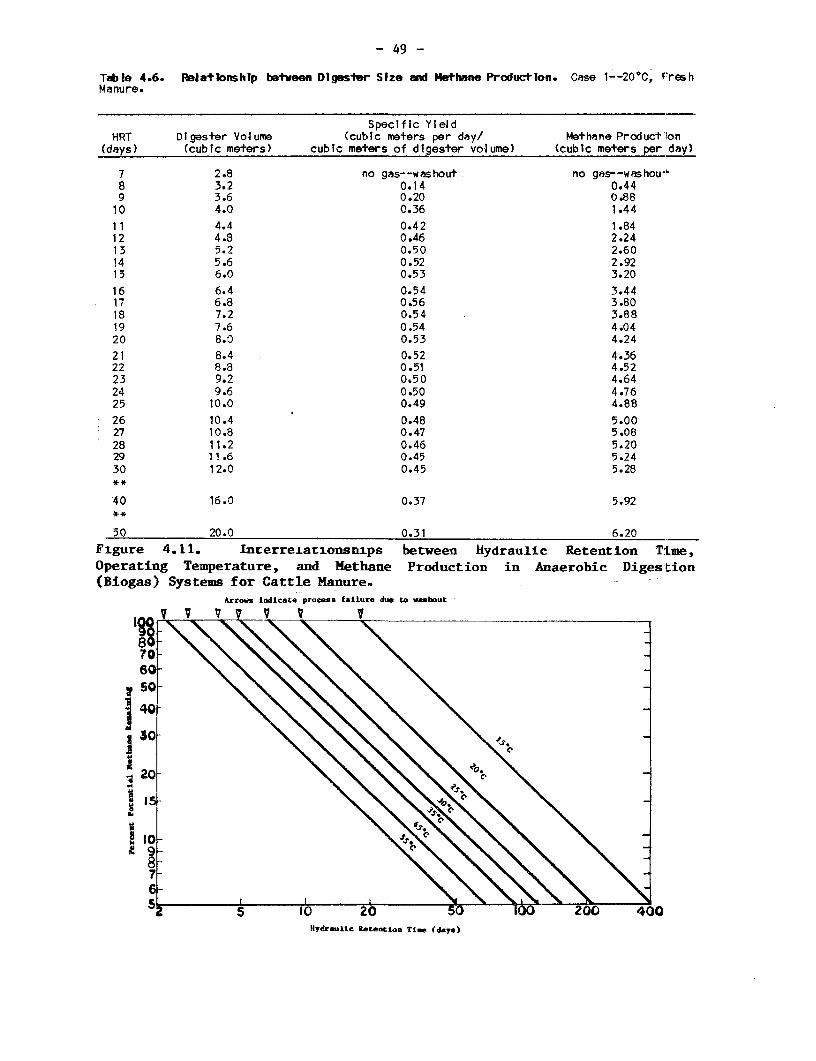
- 49 -
Table 4.6. Rbiationship between Dlgester Slze and Methane Production. Case 1--20°C, FreshManure.
Specific YieldHRT Digester VoJume (cubic meters per day/ Methane Productilon
(days) (cubic meters) cubic meters of digester volume) (cubic meters per day)
7 2.8 no gas--washout no gas--washout8 3.2 0.14 0.449 3.6 0.20 0.8810 4.0 0.36 1.44
11 4.4 0.42 1.8412 4.8 0.46 2.2413 5.2 0.50 2.6014 5.6 0.52 2.9215 6.0 0.53 3.20
16 6.4 0.54 3.4417 6.8 0.56 3.8018 7.2 0.54 3.8819 7.6 0.54 4.0420 8.0 0.53 4.24
21 8.4 0.52 4.3622 8.8 0.51 4.5223 9.2 0.50 4.6424 9.6 0.50 4.7625 10.0 0.49 4.88
26 10.4 0.48 5.0027 10.8 0.47 5.0828 11.2 0.46 5.2029 11.6 0.45 5.2430 12.0 0.45 5.28**
40 16.0 0.37 5.92**
50 20.0 0.31 6.20Figure 4.11. InterreiLationsnips between Hydraulic Retention Time,Operating Temperature, and Methane Production in Anaerobic Digestion(Biogas) Systems for Cattle Manure.
Arrows indicate proess failure due to mbout
70- 60-
50-
44030 -
20-
.4
lo- ~ ~ ~ ~ ~ ~ C
8-7-
S tO 20 200 400Hydraulic RetentLon Tim (days)
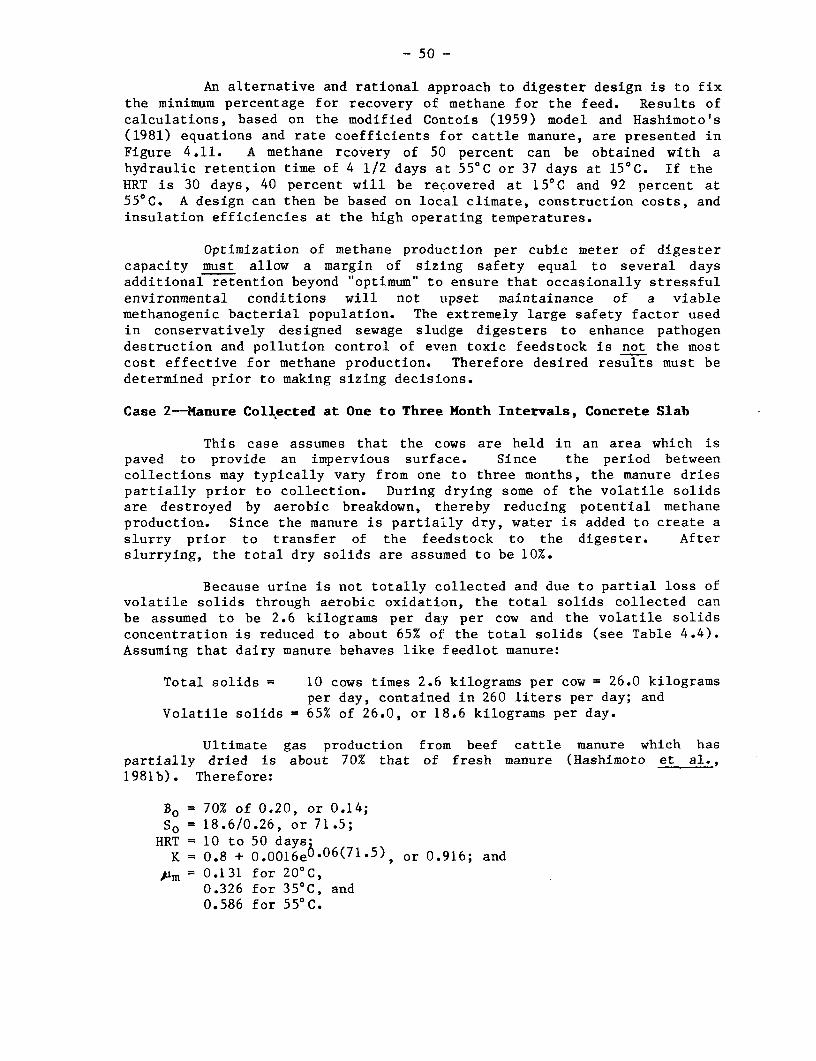
- 50 -
An alternative and rational approach to digester design is to fixthe minimum percentage for recovery of methane for the feed. Results ofcalculations, based on the modified Contois (1959) model and Hashimoto's(1981) equations and rate coefficients for cattle manure, are presented inFigure 4.11. A methane rcovery of 50 percent can be obtained with ahydraulic retention time of 4 1/2 days at 55°C or 37 days at 15°C. If theHRT is 30 days, 40 percent will be recovered at 1 5C and 92 percent at55°C. A design can then be based on local climate, construction costs, andinsulation efficiencies at the high operating temperatures.
Optimization of methane production per cubic meter of digestercapacity must allow a margin of sizing safety equal to several daysadditional retention beyond "optimum" to ensure that occasionally stressfulenvironmental conditions will not upset maintainance of a viablemethanogenic bacterial population. The extremely large safety factor usedin conservatively designed sewage sludge digesters to enhance pathogendestruction and pollution control of even toxic feedstock is not the mostcost effective for methane production. Therefore desired results must bedetermined prior to making sizing decisions.
Case 2-Manure Collected at One to Three Month Intervals, Concrete Slab
This case assumes that the cows are held in an area which ispaved to provide an impervious surface. Since the period betweencollections may typically vary from one to three months, the manure driespartially prior to collection. During drying some of the volatile solidsare destroyed by aerobic breakdown, thereby reducing potential methaneproduction. Since the manure is partia-Lly dry, water is added to create aslurry prior to transfer of the feedstock to the digester. Afterslurrying, the total dry solids are assumed to be 10%.
Because urine is not totally collected and due to partial loss ofvolatile solids through aerobic oxidation, the total solids collected canbe assumed to be 2.6 kilograms per day per cow and the volatile solidsconcentration is reduced to about 65% of the total solids (see Table 4.4).Assuming that dairy manure behaves like feedlot manure:
Total solids = 10 cows times 2.6 kilograms per cow = 26.0 kilogramsper day, contained in 260 liters per day; and
Volatile solids = 65% of 26.0, or 18.6 kilograms per day.
Ultimate gas production from beef cattle manure which haspartially dried is about 70% that of fresh manure (Hashimoto et al.,1981b). Therefore:
Bo = 70% of 0.20, or 0.14;SO = 18.6/0.26, or 71.5;
HRT= 10 to 50 daysK= 0.8 + 0.0016e6.06(71.5), or 0.916; and
PM = 0.131 for 20°C,0.326 for 35°C, and0.586 for 55°C.
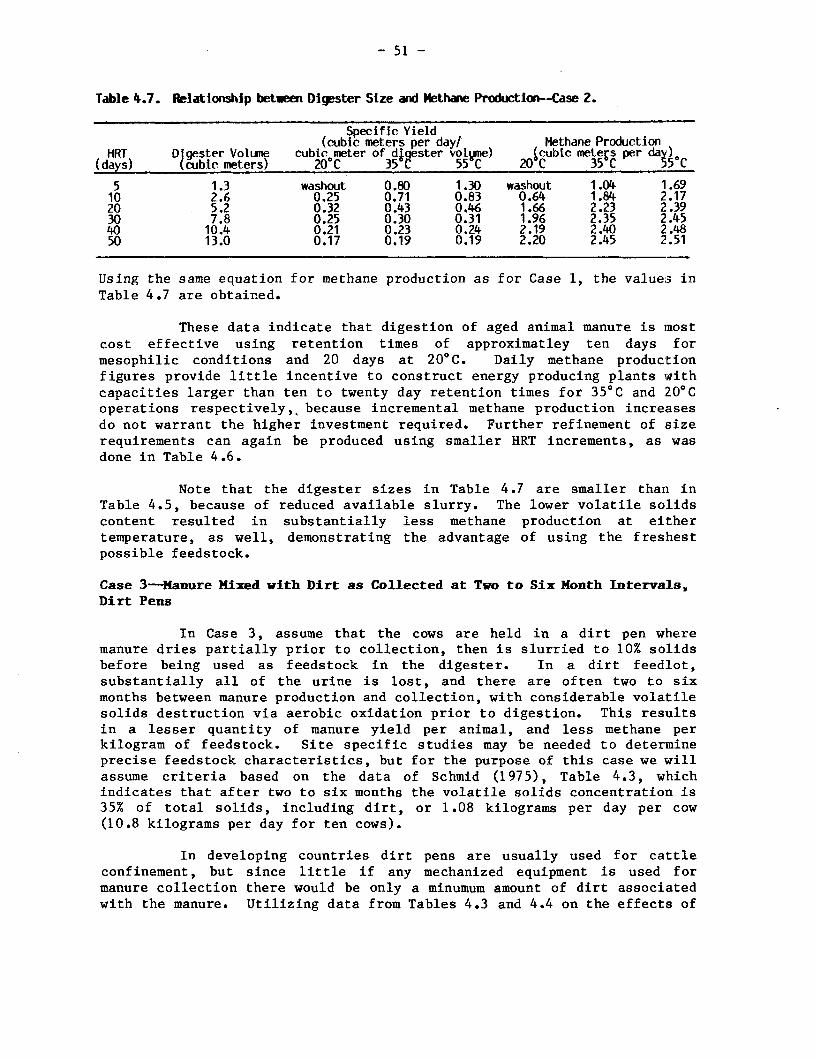
- 51 -
Table 4.7. Relationship betwen Digester Size and Hethane Production--Case 2.
Specific Yield(cubic meters per day/ Methane Production
HRT Digester Volume cubie meter of diqester vol,ne) icubic meters per day)(days) (cubic meters) 20°C 35C 55 C 20 C 35 C 55°C
5 1.3 washout 0.80 1.30 washout 1.04 1.6910 2.6 0.25 0.71 0.83 0.64 1.84 2.1720 5.2 0.32 0.43 0.46 1.66 2.23 2.3930 7.8 0.25 0.30 0.31 1.96 2.35 2.4540 10.4 0.21 0.23 0.24 2.19 2.40 2.4850 13.0 0.17 0.19 0.19 2.20 2.45 2.51
Using the same equation for methane production as for Case 1, the values inTable 4.7 are obtained.
These data indicate that digestion of aged animal manure is mostcost effective using retention times of approximatley ten days formesophilic conditions and 20 days at 20°C. Daily methane productionfigures provide little incentive to construct energy producing plants withcapacities larger than ten to twenty day retention times for 35°C and 20°Coperations respectively,, because incremental methane production increasesdo not warrant the higher investment required. Further refinement of sizerequirements can again be produced using smaller HRT increments, as wasdone in Table 4.6.
Note that the digester sizes in Table 4.7 are smaller than inTable 4.5, because of reduced available slurry. The lower volatile solidscontent resulted in substantially less methane production at eithertemperature, as well, demonstrating the advantage of using the freshestpossible feedstock.
Case 3-Hanure Mixed with Dirt as Collected at Two to Six Month Intervals,Dirt Pens
In Case 3, assume that the cows are held in a dirt pen wheremanure dries partially prior to collection, then is slurried to 10% solidsbefore being used as feedstock in the digester. In a dirt feedlot,substantially all of the urine is lost, and there are often two to sixmonths between manure production and collection, with considerable volatilesolids destruction via aerobic oxidation prior to digestion. This resultsin a lesser quantity of manure yield per animal, and less methane perkilogram of feedstock. Site specific studies may be needed to determineprecise feedstock characteristics, but for the purpose of this case we willassume criteria based on the data of Schmid (1975), Table 4.3, whichindicates that after two to six months the volatile solids concentration is35% of total solids, including dirt, or 1.08 kilograms per day per cow(10.8 kilograms per day for ten cows).
In developing countries dirt pens are usually used for cattleconfinement, but since little if any mechanized equipment is used formanure collection there would be only a minumum amount of dirt associatedwith the manure. Utilizing data from Tables 4.3 and 4.4 on the effects of
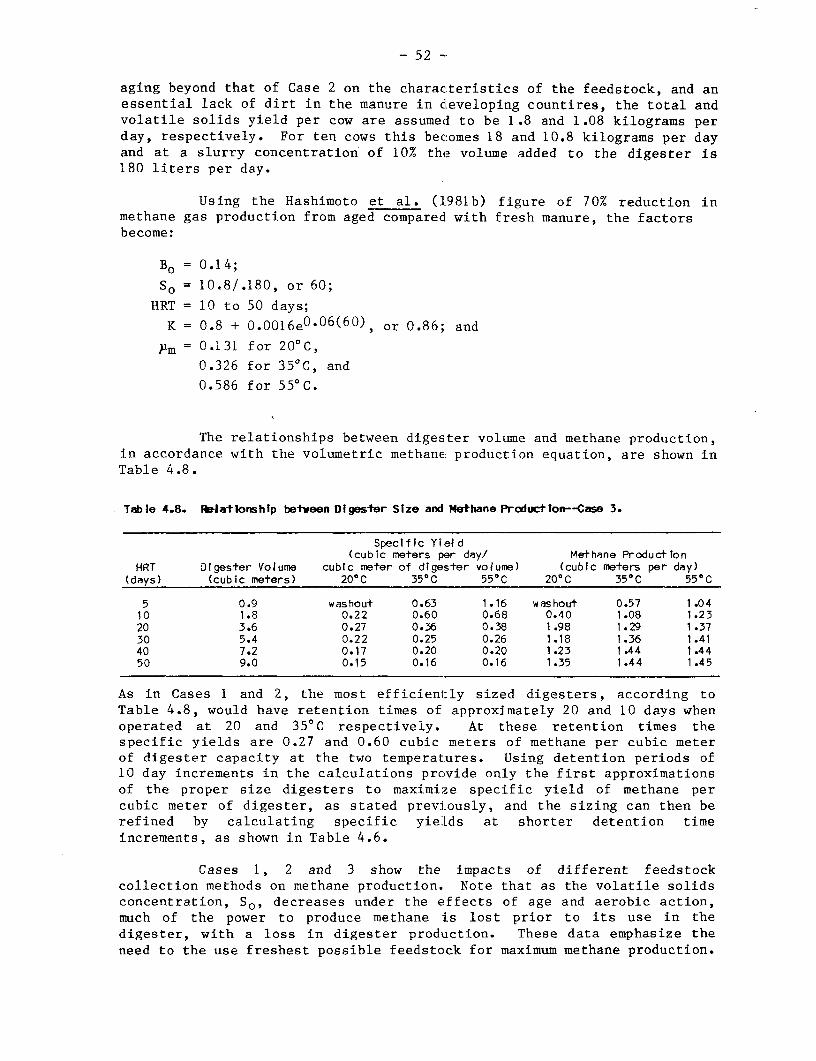
- 52 --
aging beyond that of Case 2 on the characteristics of the feedstock, and anessential lack of dirt in the manure in developing countires, the total andvolatile solids yield per cow are assumed to be 1 .8 and 1 .08 kilograms perday, respectively. For ten cows this becomes 18 and 10.8 kilograms per dayand at a slurry concentration of 10% the volume added to the digester is180 liters per day.
Using the Hashimoto et al. (1981b) figure of 70% reduction inmethane gas production from aged compared with fresh manure, the factorsbecome:
Bo = 0.14;
SO = 10.8/.180, or 60;
HRT = 10 to 50 days;
K = 0.8 + 0.0016e°-°6(6 0), or 0.86; and
pm = 0.131 for 20°C,
0.326 for 35°C, and
0.586 for 55°C.
The relationships between digester volume and methane production,in accordance with the volumetric methane production equation, are shown inTable 4.8.
Table 4.8. Ielatlonship between Digester Size and Methane Production-Case 3.
Specific Yield(cublc meters per day/ Methane Production
HRT Digester Volume cubic meter of digester volume) (cubic meters per day)(days) (cubic meters) 200C 35°C 55°C 20°C 35°C 55°C
5 0.9 washout 0.63 1.16 washout 0.57 1.0410 1.8 0.22 0.60 0.68 0.40 1.08 1.2320 3.6 0.27 0.36 0.38 1.98 1.29 1.3730 5.4 0.22 0.25 0.26 1.18 1.36 1.4140 7.2 0.17 0.20 0.20 1.23 1.44 1.4450 9.0 0.15 0.16 0.16 1.35 1.44 1.45
As in Cases 1 and 2, the most efficiently sized digesters, according toTable 4.8, would have retention times of approximately 20 and 10 days whenoperated at 20 and 35°C respectively. At these retention times thespecific yields are 0.27 and 0.60 cubic meters of methane per cubic meterof digester capacity at the two temperatures. Using detention periods of10 day increments in the calculations provide only the first approximationsof the proper size digesters to maximize specific yield of methane percubic meter of digester, as stated previously, and the sizing can then berefined by calculating specific yieLds at shorter detention timeincrements, as shown in Table 4.6.
Cases 1, 2 and 3 show the impacts of different feedstockcollection methods on methane production. Note that as the volatile solidsconcentration, SOP decreases under the effects of age and aerobic action,much of the power to produce methane is lost prior to its use in thedigester, with a loss in digester production. These data emphasize theneed to the use freshest possible feedstcck for maximum methane production.
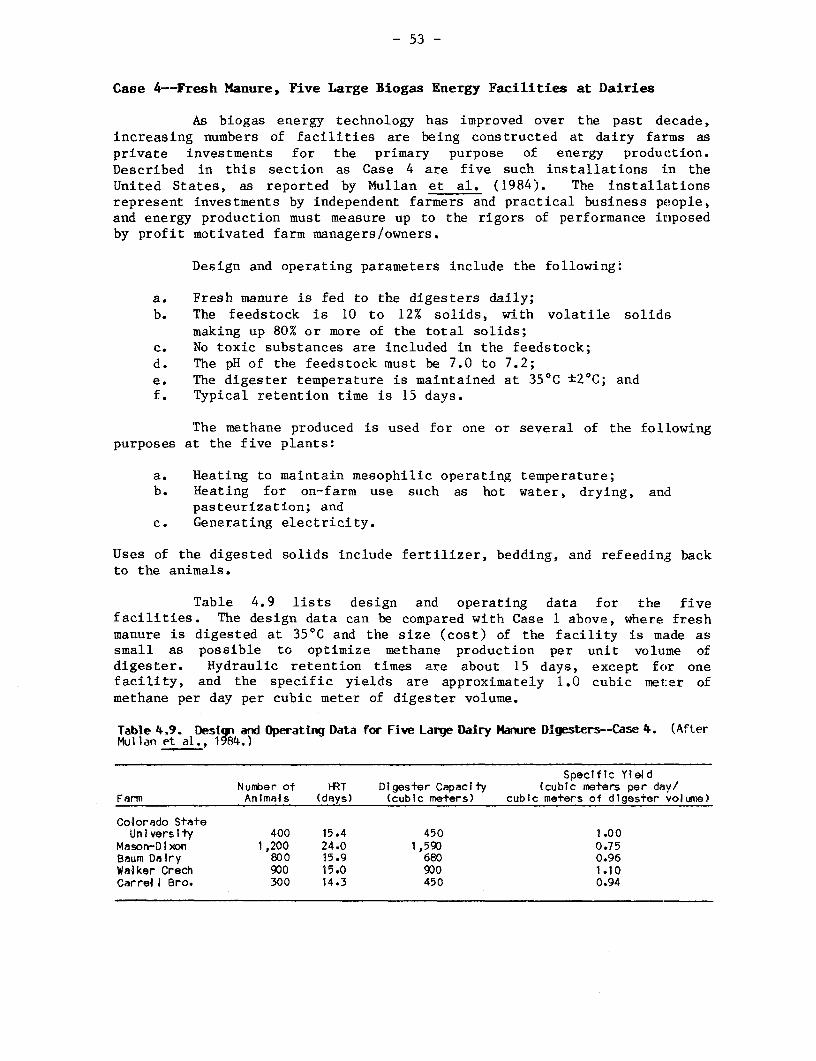
- 53 -
Case 4--Fresh Manure, Five Large Biogas Energy Facilities at Dairies
As biogas energy technology has improved over the past decade,increasing numbers of facilities are being constructed at dairy farms asprivate investments for the primary purpose of energy production.Described in this section as Case 4 are five such installations in theUnited States, as reported by Mullan et al. (1984). The installationsrepresent investments by independent farmers and practical business people,and energy production must measure up to the rigors of performance imposedby profit motivated farm managers/owners.
Design and operating parameters include the following:
a. Fresh manure is fed to the digesters daily;b. The feedstock is 10 to 12% solids, with volatile solids
making up 80% or more of the total solids;c. No toxic substances are included in the feedstock;d. The pH of the feedstock must be 7.0 to 7.2;e. The digester temperature is maintained at 35°C ±20 C; andf. Typical retention time is 15 days.
The methane produced is used for one or several of the followingpurposes at the five plants:
a. Heating to maintain mesophilic operating temperature;b. Heating for on-farm use such as hot water, drying, and
pasteurization; andc. Generating electricity.
Uses of the digested solids include fertilizer, bedding, and refeeding backto the animals.
Table 4.9 lists design and operating data for the fivefacilities. The design data can be compared with Case 1 above, where freshmanure is digested at 35°C and the size (cost) of the facility is made assmall as possible to optimize methane production per unit volume ofdigester. Hydraulic retention times are about 15 days, except for onefacility, and the specific yields are approximately 1.0 cubic meter ofmethane per day per cubic meter of digester volume.
Table, 4.9. Desig and Operating Data for Five Large Dairy Manure Digesters-Case 4. (AfterMul Ian et al., 1 84.)
Specific YieldNumber of HRT Digester Capacity (cubic meters per day/
Farm Animals (days) (cubic meters) cubic meters of digester volume)
Colorado StateUniversity 400 15.4 450 1.00
Mason-Dixon 1,200 24.0 1,590 0.75Baum Dairy 800 15.9 680 0.96Walker Crech 900 15.0 900 1.10Carrel I Bro. 300 14.3 450 0.94
- 54 -
Comparing Tables 4.5 and 4.9 reveals that the HRTs used for largesuccessful operating digesters are between the 10 and 20 day retentionperiods in Table 4.9, as is the volumetric methane production rate. Asdiscussed above with respect to Table 4.6, it is important not only tooptimize the digester size in order to achieve maximum methane productionper unit volume of digester capacity, but it is also necessary to provide asufficient margin of safety to allow for occasional environmental stresswithin the digester caused by such conditions as temperature variations andirregular periods and volumes of digester loadings. From these data we cansee that the five large units are designed so as to optimize methaneproduction in a cost effectiove manner.
Case 5-Fresh Manure, Floating Cover Indian Type Digesters
A number of guidelines are available which discuss the design ofIndian type floating cover digesters. These include the Guidebook onBiogas Development (1980) published by the Economic and Social Commissionfor Asia and the Pacific, Methane Generation from Human, Animal, andAgricultural Wastes by the National Academy of Sciences (1977), andothers. These are all largely based uponl KVIC publications.
Nearly all biogas plants in India are designed for averageambient temperature operation, which is taken to be 27°C. Note that themonthly average summer temperatures are reported to vary from about 28°C inthe south to as much as 35°C in the Deccan Plain. Corresponding wintertemperatures range from 26°C to about 10°C at elevations below 300 meters(Walter et al., 1975). The approach has been to select a gas productionrate for the digester based on the type of feedstock. For example, withthe Indian design ESCAP has assumed that one kilogram of as-received cattlemanure mixed with one liter of water will produce an average 36 liters ofbiogas per day over a 50 day digestion period at 27°C.
The KVIC model is conservative. First, the assumption that 50days are required at 27°C to produce 22 to 40 liters of biogas per kilogramof manure does not take into account the feedstock's biodegradability orage. Fresh manure is more digestable than dried manure, and although thefeedstock is assumed to be relatively fresh, in many cases it has beensubjected to considerable drying and aerobic biological action prior tocollection. Second, data by O'Rourke (1968) and others indicate that at27°C approximately 80% of the digestible matter is degraded in 15 days, and90% in 30 days. Third, the assumed addition of one liter of water perkilogram of manure will produce a total solids concentration of 3 to 12%depending on the age of the manure. Marchaim (1982) reports operatingdigesters at 16 to 18% solids. The least: amount of water necessary to makeup the slurry should be used to keep the digester to a minimal size.
Recent publications indicate the Indian design criteria ischanging to HRTs of 30 days for south India, 40 days for central India, and55 days for the cooler mountain areas.
Using the given conditions of ten cows producing 400 liters ofmanure per day, the volume of an Indian style digester with a 50 day
- 55 -
retention time is determined by adding an equal amount of water tco themanure and multiplying by 50 days. The size in this case is 0.4 cubicmeters times two times 50 equals 40 cubic meters. Forty and 30 dayretention times would require 32 and 24 cubic meter digesters,respectively. These sizes are all substantially larger than even theapproximately twenty cubic meters required when optimizing the design forbiogas production at a temperature as low as 20°C, as discussed in Case 1.
Daily biogas production from an Indian style unit would be 36liters per day per kilogram of fresh manure times 400 kilograms per day, or14.4 cubic meters, of which 8.6 cubic meters would be methane (150:40methane to carbon dioxide ratio). This would result in a volumetricmethane production rate of 0.17 cubic meters of methane per day per cubicmeter of digester capacity, as compared with 0.53 cubic meters of methaneper cubic meter digester capacity at an HRT of 20 days at 20°C (see Table4.5). Comparison of volumetric methane production values also demonstratesthe conservative nature of the Indian style design.
Case 6-Chinese Style Digesters
Translations of The Chinese Biogas Manual are available in manylanguages. In its English translation (van Buren, 1979) this manualdescribes the objectives of the initial development of the ChineseDigester: to dispose of human excreta to prevent disease; to produce asoil conditioner and fertilizer; and to provide energy which could be usedfor cooking.
In many areas of China both manure and nightsoil are applied toagricultural land as soil conditioners. Digesters are made large toprovide storage, which minimizes loss of ammonia nitrogen from animal andhuman wastes prior to application. Slurry is removed twice a year foruse. Therefore storage is a primary design criterion and the volumetricefficiency for methane production does not apply.
Normal size criteria are 1.5 to two cubic meters of digestervolume per person contributing nightsoil, and one cubic meter perapproximately 20 kilograms liveweight of pigs on premises. Additionalvolume may be required for other animal wastes and agricultural cropresidues added.
Table 4.2, which includes data on cow and pig manure productionbased on 450 kilograms liveweight, indicates that more cow than pig manureis produced at the same animal weight. Therefore 10 cows weighing a totalof 4,500 kilograms produce more digester feedstock than their equivalentweight of pigs. Designing according to the criteria above would produce solarge a digester as to have little relationship to the concept of design tooptimize biogas production. Biogas becomes merely a useful additionalbenefit to pathogen destruction, soil conditioning and storage.
Case 7-Fresh Manure, Conventional Volatile Solids Loading Criteria
A standard design criterion for sizing mesophilic sewage sludgedigesters is the weight of volatile solids which are fed daily per unit
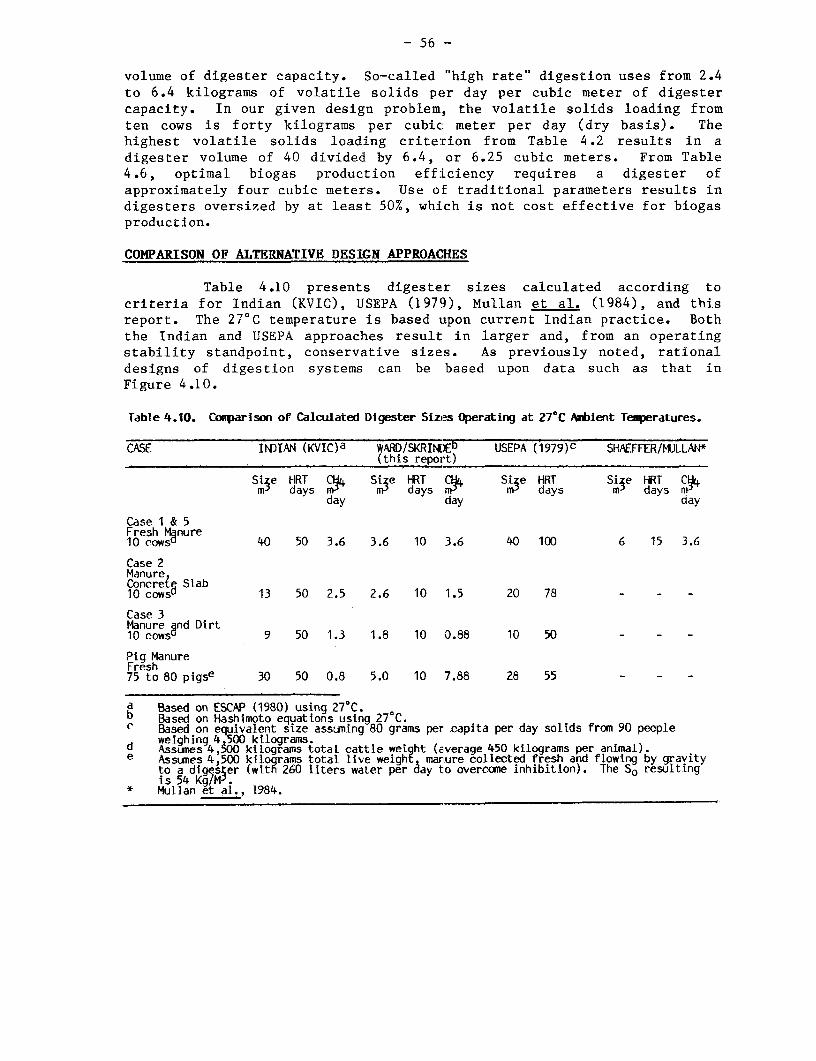
- 56 -
volume of digester capacity. So-called "high rate" digestion uses from 2.4to 6.4 kilograms of volatile solids per day per cubic meter of digestercapacity. In our given design problem, the volatile solids loading fromten cows is forty kilograms per cubic meter per day (dry basis). Thehighest volatile solids loading criterion from Table 4.2 results in adigester volume of 40 divided by 6.4, or 6.25 cubic meters. From Table4.6, optimal biogas production efficiency requires a digester ofapproximately four cubic meters. Use of traditional parameters results indigesters oversized by at least 50%, which is not cost effective for biogasproduction.
COMPARISON OF ALTERNATIVE DESIGN APPROACHES
Table 4.10 presents digester sizes calculated according tocriteria for Indian (KVIC), USEPA (1979), Mullan et al. (1984), and thisreport. The 27°C temperature is based uipon current Indian practice. Boththe Indian and USEPA approaches result in larger and, from an operatingstability standpoint, conservative sizes. As previously noted, rationaldesigns of digestion systems can be based upon data such as that inFigure 4.10.
Table 4.10. Conparismn of Calculated Digester Sizes Operating at 27TC Ambient Temperatures.
CASE INDIAN (KVIC)a WARD/SKRIND)E USEPA (1979)c SHAEFFER/MULLAN*(this report)
Si e HRT 014 Sige HRT Cd4 Size HRT Size HRT Cl4,.1 days mv rm days m?3 mvi days mai days m'
day day day
Case 1 & 5Fresh M nure10 COWsU 40 50 3.6 3.6 10 3.6 40 100 6 15 3.6
Case 2ManureConcrete Slab10 cowsd 13 50 2.5 2.6 10 1.5 20 78 - - -
Case 3Manure and Dirt10 cowsa 9 50 1.3 1.8 10 0.88 10 50 - - -
Pig ManureFresh75 to 80 pigse 30 50 0.8 5.0 10 7.88 28 55 - - -
a Based on ESCAP (1980) using 27°C.b Based on Hashimoto equations using 27°C.C Based on equivalent size assuming 80 grams per zapita per day solids from 90 people
weighing 4 500 kilograms.d Assumes 4,600 kilograms total cattle weight (average 450 kilograms per animal).e Assunes 4,500 kiloqrams total live weight manure collected fresh and flowing by gravity
to a digester (with 260 liters water per day to overcome inhibition). The SO resultingIs 54 Kg/M'.
* Mullan et al., 1984.
- 57 -
C H A P T E R F I V E
OUTPUTS AND THEIR USES
COMPOSITION AND USES OF BIOGAS
Composition
The proportion of methane to carbon dioxide in biogas depends onthe substrate, and can be predicted by the Symons and Buswell'sequation.l/ Factors such as temperature, pH and pressure can alter the gascomposition slightly. Typical gas compositions for carbohydrate feeds are55% methane and 45% carbon dioxide, while for fats the gas contains as muchas 75% methane.
Pure methane has a calorific value of 9,100 kilocalories:2/ percubic meter at 15.5°C and one atmosphere; the calorific value of biogasvaries from 4,800 to 6,900 kilocalories per cubic meter. In terms ofenergy equivalents, 1.33 to 1.87, and 1.5 to 2.1 cubic meters of biogas areequivalent to one liter of gasoline and diesel fuel respectively. Biogashas an approximate specific gravity of 0.86 (air = 1.0), and a flame speedfactor of 11.1, which is low, and therefore the flame will "lift off"burners which are not properly designed (ESCAP, 1980).
Domestic Uses
The primary domestic uses of biogas are cooking and lighting.Because biogas has different properties from other commonly used gases suchas propane and butane and is only available at low pressures (four to eightcentimeters of water), stoves capable of burning biogas efficiently requirespecial design. To ensure that the flame does not "lift off," the ratio ofthe total area of burner parts to the area of the injector orifice shouldbe between 225 and 300:1 (FAO, 1981). Recent Indian designs have thermalefficiencies of around 60% (Mahin, 1982). In China the Beijing-4 designhas a thermal efficiency of 59 to 62%, depending on the pressure (Chan USam, 1982).
Lighting can be provided with a gas mantle, or by generatingelectricity. Highest lamp efficiencies require gas pressures of 40 cm,which are only possible with fixed dome digesters.
Reported gas consumptions for cooking and lighting are 0.34 to0.41 cubic meters per capita per day and 0.15 cubic meters per hour per 100candle power respectively (NAS, 1977). A typical family of six usesapproximately 2.9 cubic meters a day of biogas.
/CnHa0b + (n - a - b)H20 --- > (n - a + b)C°2 + (2-y+ 8a - 4)CH4
2/ 1 kilocalories (kcal) = 3.968 British Thermal Units (Btu) = 1.163 x
10-3 kilowatt hours (kWh) = 4.187 megajoules (MJ).
- 58 -
Agricultural and Industrial Uses
Biogas can be used as a fuel in stationary and mobile engines, tosupply motive power, pump water, drive machinery (e.g., threshers,grinders) or generate electricity. It can be used in both spark andcompression (diesel) engines. The spark ignition engine is easily modifiedto run on biogas by using a gas carburetor. Ignition systems need not bealtered other than minor timing adjustments. At the standard compressionratios a decrease in power results. Supplementary fuels can be used withbiogas in spark ignition engines.
Where the biogas supply varies or there is a small quantityavailable, dual fuel diesel engines have been used successfully. Normallythe modifications are simple. The engine is usually started with purediesel fuel and the biogas increased gradually until it comprises around80% of the fuel intake. If the gas supply is interrupted, normal operationcan still proceed with 100% diesel fuel. With 80% biogas, engineperformance is good and 20% more horsepower is delivered than with dieselalone (Sharma, 1980).
Normal thermal efficiencies of these engines are 25-30%, and theyuse approximately 0.45 cubic meters of biogas per horsepower-hour.Converting this to electricity, approximately 0.75 cubic meters of biogasis required per kilowatt hour. There were 301 small biogas power stationsin China at the end of 1979, generating 1,500 kilowatts in Sichuan provincealone. A recent report describes a 90 kilowatt station operating on biogasfrom nightsoil digestion (National Office for Biogas Development, 1982).
Due to the low thermal efficiency of these engines a largefraction of the biogas energy can be recovered from the cooling water andexhaust gases. This energy can be used to heat the digester or for spaceheating of animal sheds, greenhouses, and buildings.
A concern in the use of biogas in internal combustion engines isthat the hydrogen sulphide in the gas is slightly corrosive. However, inChina engines were run for five years with no internal corrosion noted(Chan U Sam, 1982). In general, the operating lives of the engines areexpected to be between 12,000 and 20,000 hours, depending on the enginespeed and horsepower (Picken and Soliman, 1981).
Biogas is not a very convenient fuel for motive power, since itis difficult and expensive to compress due to its low critical pressure.However, if stored in one to two cubic meter bags it can power small farmtractors with diesel engines for limited distances.
COMPOSITION AND USES OF DIGESTER SLURRY
Composition
The slurry discharged from a digester contains 2 to 12% solidsand consists of refractory organics, new cells formed during digestion, andash. The slurry can be used in its liquid or solid fractions, dried, or as
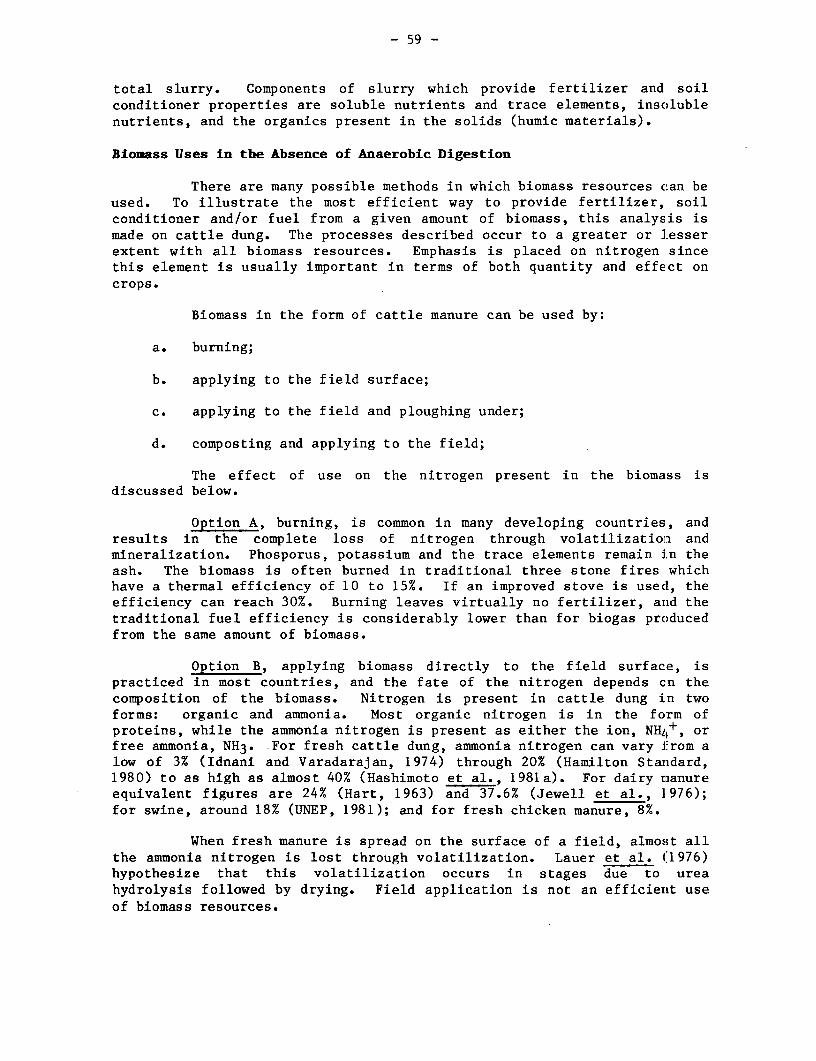
- 59 -
total slurry. Components of slurry which provide fertilizer and soilconditioner properties are soluble nutrients and trace elements, insolublenutrients, and the organics present in the solids (humic materials).
Biomass Uses in the Absence of Anaerobic Digestion
There are many possible methods in which biomass resources can beused. To illustrate the most efficient way to provide fertilizer, soilconditioner and/or fuel from a given amount of biomass, this analysis ismade on cattle dung. The processes described occur to a greater or lesserextent with all biomass resources. Emphasis is placed on nitrogen sincethis element is usually important in terms of both quantity and effect oncrops.
Biomass in the form of cattle manure can be used by:
a. burning;
b. applying to the field surface;
C. applying to the field and ploughing under;
d. composting and applying to the field;
The effect of use on the nitrogen present in the biomass isdiscussed below.
Option A, burning, is common in many developing countries, andresults in the complete loss of nitrogen through volatilization andmineralization. Phosporus, potassium and the trace elements remain in theash. The biomass is often burned in traditional three stone fires whichhave a thermal efficiency of 10 to 15%. If an improved stove is used, theefficiency can reach 30%. Burning leaves virtually no fertilizer, and thetraditional fuel efficiency is considerably lower than for biogas producedfrom the same amount of biomass.
Option B, applying biomass directly to the field surface, ispracticed in most countries, and the fate of the nitrogen depends con thecomposition of the biomass. Nitrogen is present in cattle dung in twoforms: organic and ammonia. Most organic nitrogen is in the form ofproteins, while the ammonia nitrogen is present as either the ion, NHZ,+, orfree ammonia, NH3 . For fresh cattle dung, ammonia nitrogen can vary from alow of 3% (Idnani and Varadarajan, 1974) through 20% (Hamilton Standard,1980) to as high as almost 40% (Hashimoto et al., 1981a). For dairy manureequivalent figures are 24% (Hart, 1963) and 37.6% (Jewell et al., 1976);for swine, around 18% (UNEP, 1981); and for fresh chicken manure, 8%.
When fresh manure is spread on the surface of a field, almost allthe ammonia nitrogen is lost through volatilization. Lauer et al. ('1976)hypothesize that this volatilization occurs in stages due to ureahydrolysis followed by drying. Field application is not an efficient useof biomass resources.
- 60 -
Option C, ploughing fresh manure into the field, prevents loss ofammonia through volatilization, and almost all the nitrogen is conserved.However, under certain conditions organisms can nitrify free ammonia tonitrite (NO2-) and nitrate (NO3-). These ions are relatively soluble andcan be leached from the soil. Implementation of this option is relativelytime consuming, especially if the biomass is manure produced daily, and isnot practiced often.
Option D, composting, is a common way of recycling biomass indeveloping countries. The biomass is piled in a heap (with agriculturalresidues some animal manure is added) and left to decompose aerobically.The pile is occasionally turned over or otherwise aerated. Compost may bestored for an indefinite period of time before it is applied to the field.The composted biomass has few degradable organics, is essentiallyinoffensive to handle, is reduced in volume, and does not attract flies orother insects. However, there is a loss of nitrogen during composting andstoring. Data on nitrogen loss reported by Yawalkar and Agrawal (undated)is listed in Table 5.1.
Table 5.1. Nitrogen Loss Due -to Compost1ng or Dlgestlon.
Nitrogen EffectivenessField Practice Index (percent)
Manure spread and ploughed In Immediately 100Effluent from digester Introduced Immediately
Into irrigation water 100Drted digester plant effluent spread and ploughed 85Manure piled 2 days before spreading and ploughing 80Manure piled for 14 days 55Manure piled for 30 days 50
Biomass Uses Following Anaerobic Digestion
Anaerobic digestion provides both fuel and fertilizer, whileoptions A through D above provide one or the other, but not both.Nitrogen can be lost during digestion only by reduction of nitrate tonitrogen gas and volatilization of ammonia into the biogas. Since there isvery little nitrate present in manure, the loss through reduction isotherwise insignificant. Loss of nitrogen through volatilization hasattracted little attention; in one study the loss amounted to only 1.3% ofthe total Kjeldahl nitrogen (TKN) (Idnani and Varadarajan, 1974).
Since there is a destruction of organic matter during digestion,the percentage of nitrogen measured in the slurry rises. Nitrogen isconserved during anaerobic digestion. For example, a 23% reduction intotal solids concentration is accompanied by a corresponding increase inthe nitrogen content of the remaining solids. This may create an illusionof "new" nitrogen if only the Kjeldahl nitrogen is considered. Jewell etal. (1976) found that the TKN for dairy manure increased from 5.2% to 6.9%of the solids during digestion and Hart (1963) found increases from 3.7% to3.9% of the solids. Rajabapaiah et al. (1979) also carried out detailedmass balances on a KVIC digester and found that nitrogen was conserved.
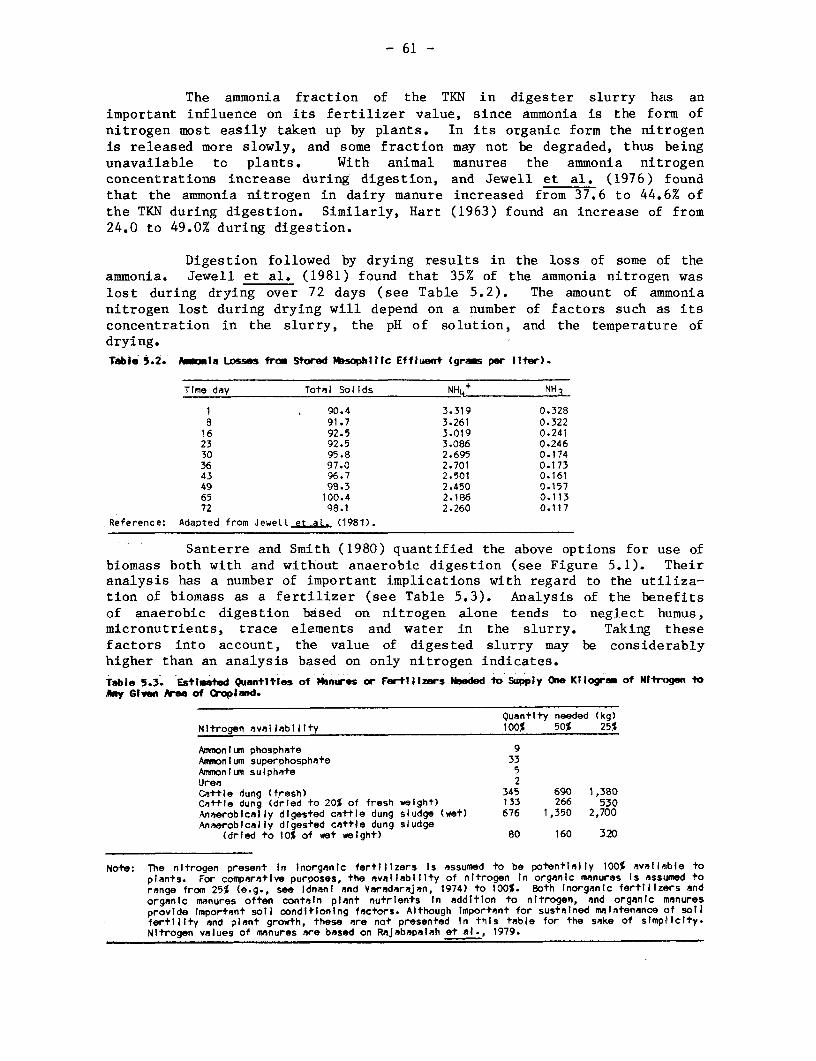
- 61 -
The ammonia fraction of the TKN in digester slurry has animportant influence on its fertilizer value, since ammonia is the form ofnitrogen most easily taken up by plants. In its organic form the nitrogenis released more slowly, and some fraction may not be degraded, thus beingunavailable to plants. With animal manures the ammonia nitrogenconcentrations increase during digestion, and Jewell et al. (1976) foundthat the ammonia nitrogen in dairy manure increased from 37.6 to 44.6% ofthe TKN during digestion. Similarly, Hart (1963) found an increase of from24.0 to 49.0% during digestion.
Digestion followed by drying results in the loss of some of theammonia. Jewell et al. (1981) found that 35% of the ammonia nitrogen waslost during drying over 72 days (see Table 5.2). The amount of ammonianitrogen lost during drying will depend on a number of factors such as itsconcentration in the slurry, the pH of solution, and the temperature ofdrying.Table 5.2. h ona Losses from Stored MIsophilic Effluent (gras per liter).
Time day Total Solids NH4+ NH_
i 90.4 3.319 0.3288 91.7 3.261 0.322
16 92.5 3.019 0.24123 92.5 3.086 0.24630 95.8 2.695 0.17436 97.0 2.701 0.17343 96.7 2.501 0.16149 98.3 2.450 0.15765 100.4 2.186 0.11372 98.1 2.260 0.117
Reference: Adapted from JeweLl et aL. (1981).
Santerre and Smith (1980) quantified the above options for use ofbiomass both with and without anaerobic digestion (see Figure 5.1). Theiranalysis has a number of important implications with regard to the utiliza-tion of biomass as a fertilizer (see Table 5.3). Analysis of the benefitsof anaerobic digestion based on nitrogen alone tends to neglect humus,micronutrients, trace elements and water in the slurry. Taking thesefactors into account, the value of digested slurry may be considerablyhigher than an analysis based on only nitrogen indicates.
Table 5.3. Estimated Quantities of isbures or Fertilizers Needed to Supply One Kilogre of Nitrogen toAny Given hree of Cropland.
Quantity needed (kg)Nitrogen availability 100% 50% 25%
Ammoniun phosphate 9Ammonium superphosphate 33Ammonium sulphate 5Urea 2Cattle dung (fresh) 345 690 1,380Cattle dung (dried to 20% of fresh weight) 133 266 530Anaerobically digested cattle dung sludge (wet) 676 1,350 2,700Anaerobically digested cattle dung sludge
(dried to 10% of wet weight) 80 160 320
Note: The nitrogen present in inorganic fertilizers Is assumed to be potentially 100% available toplants. For comparative purposes, the availabillty of nitrogen in organic manures is assumed torange from 25% (e.g., see Idnani and VaradaraJan, 1974) to 100%. Both inorganic fertilizers andorganic manures often contaln plant nutrients in addition to nitrogen, and organic rnanuresprovide important soil conditloning factors. Although Important for sustained maintenance of soilfertility and plant growth, these are not presented In this table for the sake of simplicity.Nitrogen values of manures are based on RaJabapalah et al., 1979.
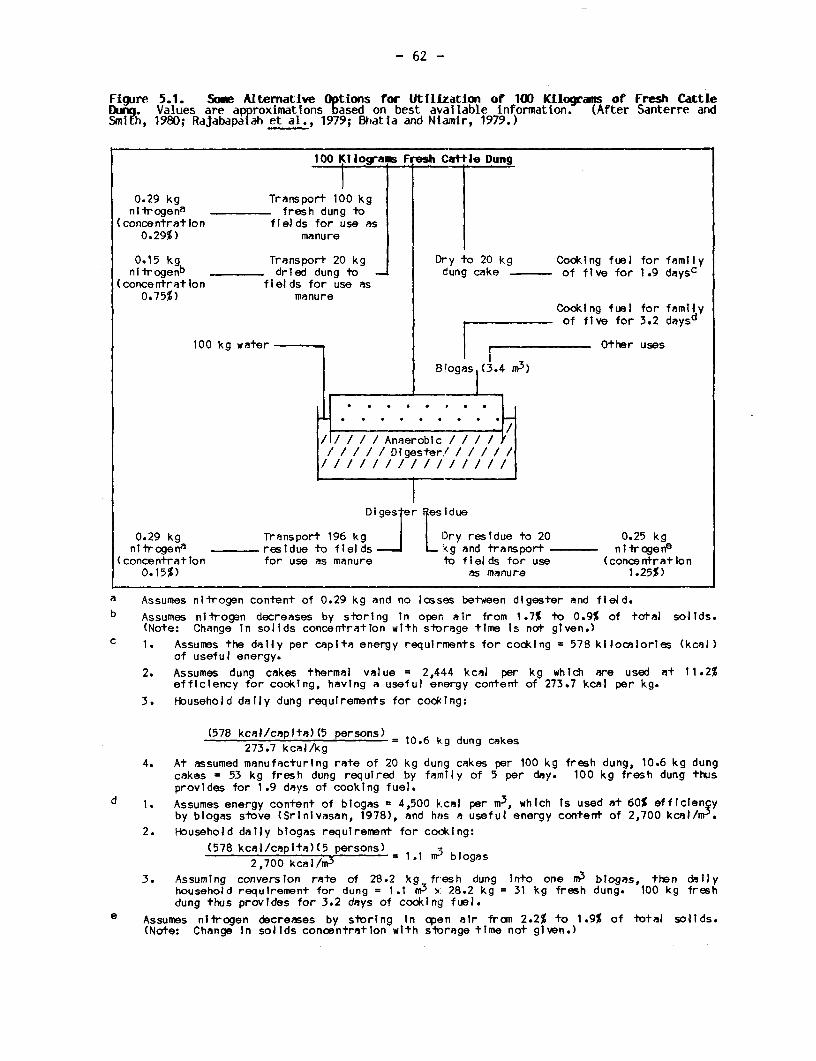
- 62 -
Figure 5.1. Some Alternative Options for Utilization of 100 Kilorgrams of Fresh CattleBung. Values are approximations based on best available information. (After Santerre andSmith, 1980; Rajabapalah et al., 1979; Bhatla and Nlamir, 1979.)
100 Kliograes Fresh Cattie Dung
0.29 kg Transport 100 kgni-trogena fresh dung to
(concentration fields for use as0.29%) manure
0.15 kg Transport 20 kg Dry to 20 kg Cooking fuel for familynitrogenb dried dung to dung cake - of five for 1.9 daysC
(concentration fields for use as0.75%) manure
Cooking fuel for famtlyof five for 3.2 daysd
100 kg water Other uses
Bioga (3.4 m33)
t a Aaeobic /////Digester'/////Diges er iesidue
0.29 kg Transport 196 kg Dry residue to 20 0.25 kgnitrogena residue to fields _ L_ and transport nItrogene
(concentration for use as manure to fields for use (concentration0.15%) as manure 1.25%)
a Assumes nitrogen content of 0.29 kg and no losses between digester and field.b Assumes nitrogen decreases by storing In open air from 1.7% to 0.9% of total solids.
(Note: Change In solids concentration with storage time is not given.)c 1. Assumes the daily per capita energy requirments for cooking 578 kilocalories (kcal)
of useful energy.2. Assumes dung cakes thermal value = 2,444 kcal per kg which are used at 11.2%
efficiency for cooking, having a useful erergy content of 273.7 kcal per kg.3. Household daily dung requirements for cooking:
(578 kcal/capita)(5 persons) = 10.6 kg dung cakes273.7 kcal/kg
4. At assumed manufacturing rate of 20 kg dung cakes per 100 kg fresh dung, 10.6 kg dungcakes = 53 kg fresh dung required by family of 5 per day. 100 kg fresh dung thusprovides for 1.9 days of cooking fuel.
d l. Assumes energy content of biogas = 4,500 kcal per m3, which Is used at 60% efficlencyby blogas stove (Srlnivasan, 1978), and has a useful energy content of 2,700 kcal/m.
2. Household daily biogas requirement for cooking:(578 kcal/capita)(5 persons) -
2,700 kcal/m3 = 1.1 M 9- blogas
3. Assuming conversion rate of 28.2 kg fresh dung Into one m3 blogas, then dailyhousehold requirement for dung = 1.1 r3 x 28.2 kg = 31 kg fresh dung. 100 kg freshdung thus provides for 3.2 days of cooking fuel.
e Assumes nitrogen decreases by storing in apsn air from 2.2% to 1.9% of total solids.(Note: Change In solids concentration with storage time not given.)
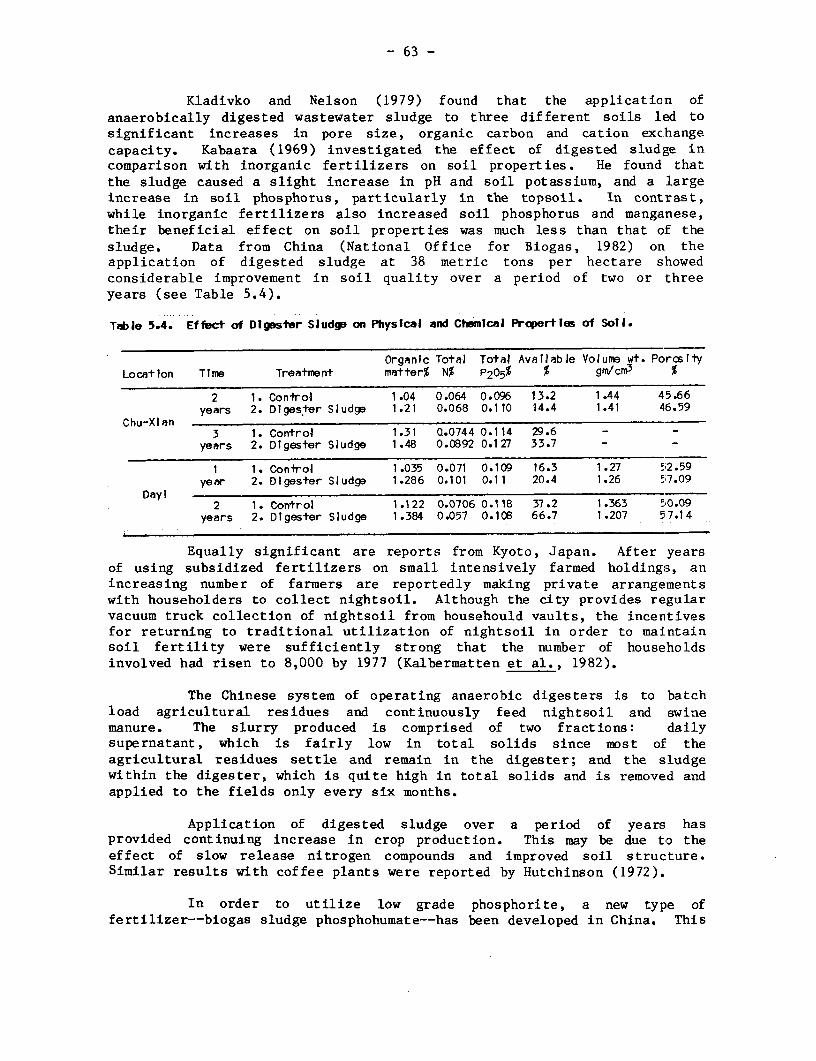
- 63 -
Kladivko and Nelson (1979) found that the applicaticn ofanaerobically digested wastewater sludge to three different soils led tosignificant increases in pore size, organic carbon and cation exchangecapacity. Kabaara (1969) investigated the effect of digested sludge incomparison with inorganic fertilizers on soil properties. He found thatthe sludge caused a slight increase in pH and soil potassium, and a largeincrease in soil phosphorus, particularly in the topsoil. In contrast,while inorganic fertilizers also increased soil phosphorus and manganese,their beneficial effect on soil properties was much less than that cf thesludge. Data from China (National Office for Biogas, 1982) on theapplication of digested sludge at 38 metric tons per hectare showedconsiderable improvement in soil quality over a period of two or threeyears (see Table 5.4).
Table 5.4. Effect of Digester Sludge on Physical and Chemical Properties of Solt.
Organic Total TotFl AvalJable Volume wt. PorosHyLocation Time Treatment ma,tter% N% P205% % gnVcmr %
2 1. Conlrol 1.04 0.064 0.096 13.2 1.44 45.66years 2. Digester Sludge 1.21 0.068 0.110 14.4 1.41 46.59
Chu-Xi an3 1. Control 1.31 0.0744 0.114 29.6 - -
years 2. Dlgester Sludge 1.48 0.0892 0.127 33.7 - -
1 1. Conlrol 1.035 0.071 0.109 16.3 1.27 52.59year 2. Digester Sludge 1.286 0.101 0.11 20.4 1.26 57.09
2 1. Control 1.122 0.0706 0.118 37.2 1.363 50.09years 2. Digester Sludge 1.384 0.057 0.108 66.7 1.207 57.14
Equally significant are reports from Kyoto, Japan. After yearsof using subsidized fertilizers on small intensively farmed holdings, anincreasing number of farmers are reportedly making private arrangementswith householders to collect nightsoil. Although the city provides regularvacuum truck collection of nightsoil from househould vaults, the incentivesfor returning to traditional utilization of nightsoil in order to maintainsoil fertility were sufficiently strong that the number of householdsinvolved had risen to 8,000 by 1977 (Kalbermatten et al., 1982).
The Chinese system of operating anaerobic digesters is to batchload agricultural residues and continuously feed nightsoil and swinemanure. The slurry produced is comprised of two fractions: dailysupernatant, which is fairly low in total solids since most of theagricultural residues settle and remain in the digester; and the sludgewithin the digester, which is quite high in total solids and is removed andapplied to the fields only every six months.
Application of digested sludge over a period of years hasprovided continuing increase in crop production. This may be due to theeffect of slow release nitrogen compounds and improved soil structure.Similar results with coffee plants were reported by Hutchinson (1972).
In order to utilize low grade phosphorite, a new type offertilizer--biogas sludge phosphohumate--has been developed in China. This
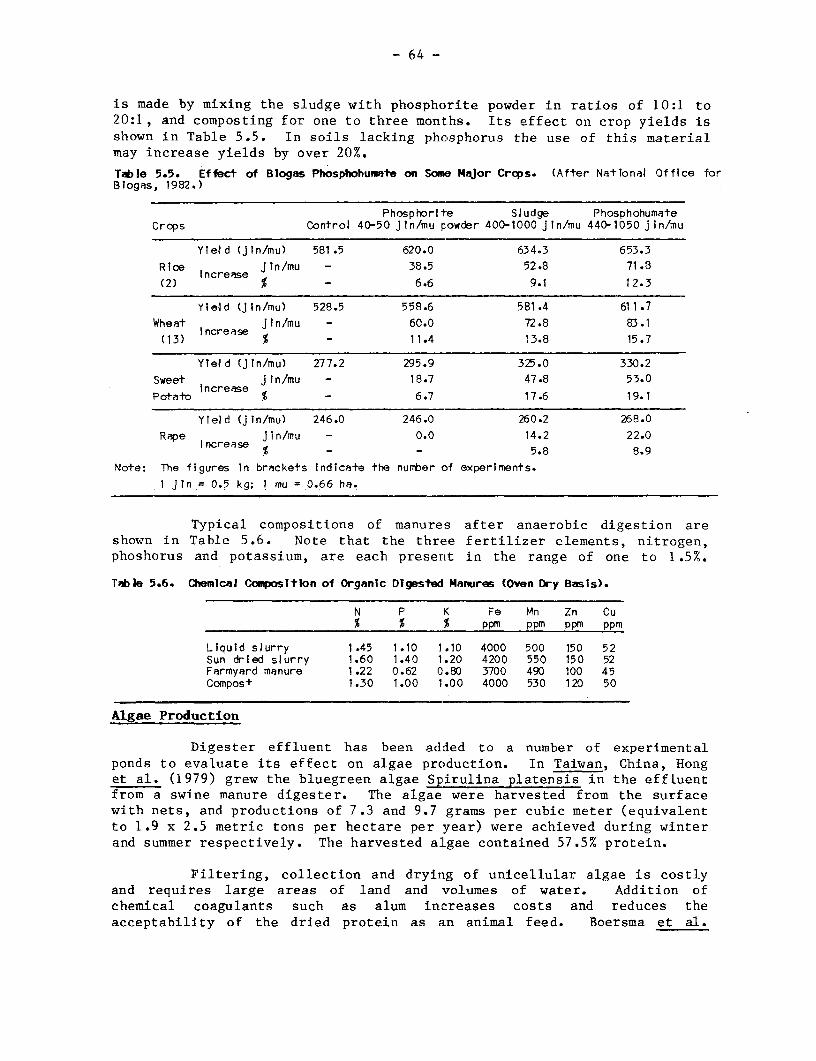
- 64 -
is made by mixing the sludge with phosphorite powder in ratios of 10:1 to20:1, and composting for one to three months. Its effect on crop yields isshown in Table 5.5. In soils lacking phosphorus the use of this materialmay increase yields by over 20%.
Table 5.5. Effect of Blogas Phosphohumate on Sona Major Crcps. (After Nattonal Office forBlogas, 1982.)
Phosphorite SJudge PhosphohumateCrops Control 40-50 Jin/mu powder 400-1000 j in/mu 440-1050 j in/mu
YIeld (jin/mu) 581.5 620.0 634.3 653.3Rice Jn/mu - 38.5 52.8 71.8
increase-(2) % - 6.6 9.1 12.3
Yield (jin/mu) 528.5 558.6 581.4 611.7Wheat IJn/mu - 60.0 72.8 83.1(13) % 11.4 13.8 15.7
Yield (jin/mu) 277.2 295.9 325.0 330.2Sweet jIn/mu - 18.7 47.8 53.0
increase-Potato % - 6.7 17.6 19.1
YIeld (jin/mu) 246.0 246.0 260.2 268.0Rape jin/mu - 0.0 14.2 22.0
% - - 5.8 8.9
Note: The figures In brackets Indicate the number of experiments.i Jtn = 0.5 kg; I mu = 0.66 ha.
Typical compositions of manures after anaerobic digestion areshown in Table 5.6. Note that the three fertilizer elements, nitrogen,phoshorus and potassium, are each present in the range of one to 1.5%.
Tale 5.6. ChemIcal Composition of Organic Digesied Manures (Oven Dry Basis).
N P K Fe Mn Zn CuS % % ppm ppm ppm ppm
Liquid slurry 1.45 1.10 1.10 4000 500 150 52Sun dried slurry 1.60 1.40 1.20 4200 550 150 52Farmyard manure 1.22 0.62 0.80 3700 490 100 45Compost 1.30 1.00 1.00 4000 530 120 50
Algae Production
Digester effluent has been added to a number of experimentalponds to evaluate its effect on algae production. In Taiwan, China, Honget al. (1979) grew the bluegreen algae lp;irulina platensis in the effluentfrom a swine manure digester. The algae were harvested from the surfacewith nets, and productions of 7.3 and 9.7 grams per cubic meter (equivalentto 1.9 x 2.5 metric tons per hectare per year) were achieved during winterand summer respectively. The harvested a:Lgae contained 57.5% protein.
Filtering, collection and drying of unicellular algae is costlyand requires large areas of land and volumes of water. Addition ofchemical coagulants such as alum increases costs and reduces theacceptability of the dried protein as an animal feed. Boersma et al.
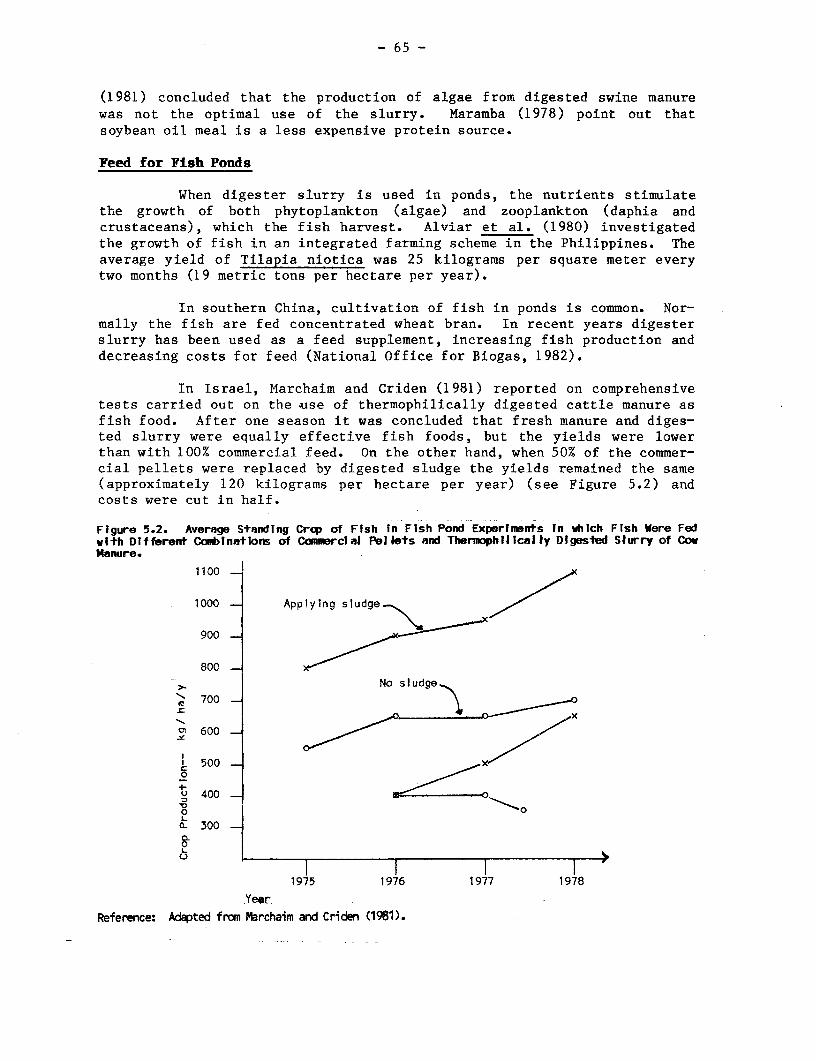
- 65 -
(1981) concluded that the production of algae from digested swine manurewas not the optimal use of the slurry. Maramba (1978) point out thatsoybean oil meal is a less expensive protein source.
Feed for Fish Ponds
When digester slurry is used in ponds, the nutrients stimulatethe growth of both phytoplankton (algae) and zooplankton (daphia andcrustaceans), which the fish harvest. Alviar et al. (1980) investigatedthe growth of fish in an integrated farming scheme in the Philippines. Theaverage yield of Tilapia niotica was 25 kilograms per square meter everytwo months (19 metric tons per hectare per year).
In southern China, cultivation of fish in ponds is common. Nor-mally the fish are fed concentrated wheat bran. In recent years digesterslurry has been used as a feed supplement, increasing fish production anddecreasing costs for feed (National Office for Biogas, 1982).
In Israel, Marchaim and Criden (1981) reported on comprehensivetests carried out on the ~use of thermophilically digested cattle manure asfish food. After one season it was concluded that fresh manure and diges-ted slurry were equally effective fish foods, but the yields were lowerthan with 100% commercial feed. On the other hand, when 50% of the comner-cial pellets were replaced by digested sludge the yields remained the same(approximately 120 kilograms per hectare per year) (see Figure 5.2) andcosts were cut in half.
F Igure 5.2. Average Standtng Crqp of Fish In Fish Pond Exper1nents In which Fish Were Fedwith Different Coubinations of Cammercial Pellets and Thermophillcaily Digesiud Slurry of CowManure.
1100 _
1000 _ Applying sludge
900 _
800SoNo sludge
700 -
ot 600 -
L 500-0
, 400 _ '
X 300
0L
0J 1975 1976 1977 1978
R yearReference: Adapted frorn Marchaimrn d Criden (1981).
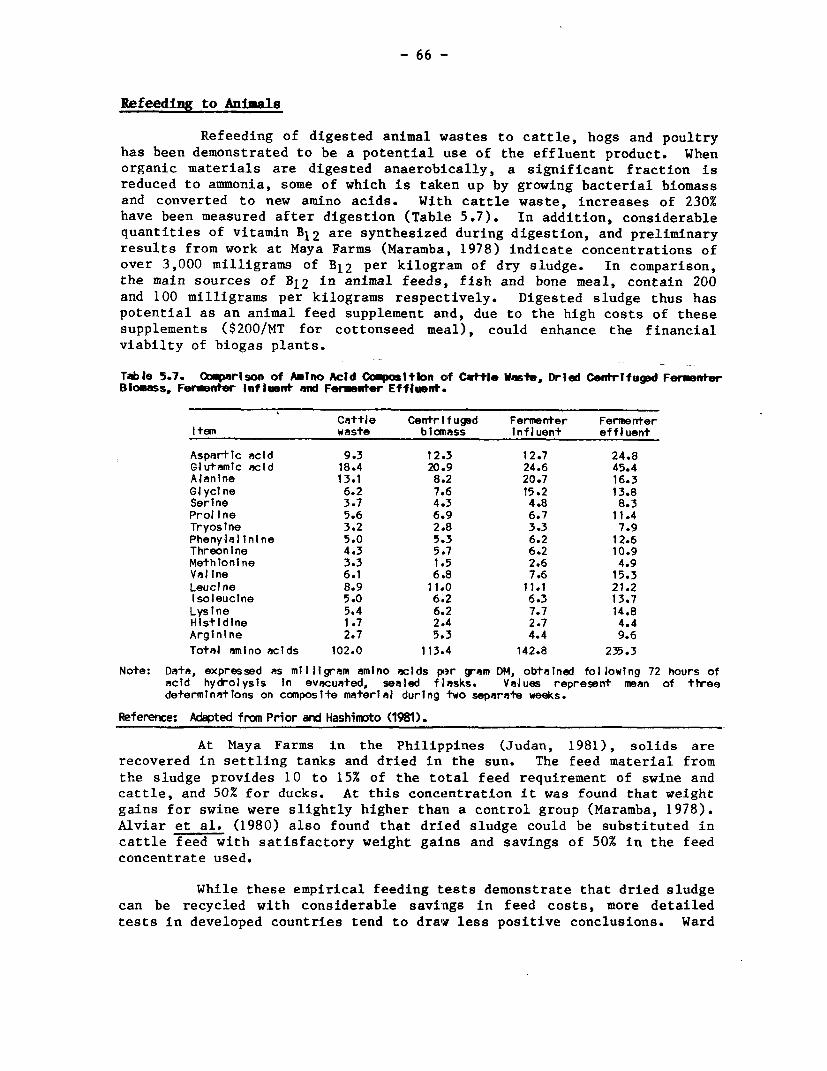
- 66 -
Refeeding to Animals
Refeeding of digested animal wastes to cattle, hogs and poultryhas been demonstrated to be a potential use of the effluent product. Whenorganic materials are digested anaerobically, a significant fraction isreduced to ammonia, some of which is taken up by growing bacterial biomassand converted to new amino acids. With cattle waste, increases of 230%have been measured after digestion (Table 5.7). In addition, considerablequantities of vitamin B12 are synthesized during digestion, and preliminaryresults from work at Maya Farms (Maramba, 1978) indicate concentrations ofover 3,000 milligrams of B12 per kilogram of dry sludge. In comparison,the main sources of B12 in animal feeds, fish and bone meal, contain 200and 100 milligrams per kilograms respectively. Digested sludge thus haspotential as an animal feed supplement and, due to the high costs of thesesupplements ($200/MT for cottonseed meal), could enhance the financialviabilty of biogas plants.
Tble 5.7. Oomparlson of Amino Acid Coosition of Cattle Wa1e, Dried Centrwfugpd FerenterBlowAss, Fermnter Influent and Fermeeter Effluent.
Cattle Centrifuged Fermenter FermenterItem waste bicomass Influen+ effluent
Aspartic acid 9.3 12.3 12.7 24.8Glutamic acid 18.4 20.9 24.6 45.4Alanine 13.1 8.2 20.7 16.3Glycine 6.2 7.6 15.2 13.8Serlne 3.7 4.3 4.8 8.3Proline 5.6 6.9 6.7 11.4Tryosine 3.2 2.8 3.3 7.9Phenylalinine 5.0 5.3 6.2 12.6Threonine 4.3 5.7 6.2 10.9Methionine 3.3 1.5 2.6 4.9Val Ine 6.1 6.8 7.6 15.3Leuclne 8.9 11.0 11.1 21.2Isoleucine 5.0 6.2 6.3 13.7Lysine 5.4 6.2 7.7 14.8Hlstidine 1.7 2.4 2.7 4.4Arginine 2.7 5.3 4.4 9.6Total amino acids 102.0 113.4 142.8 235.3
Note: Data, expressed as milllgram amino acids per gram DM, obtained following 72 hours ofacid hydrolysis In evacuated, sealed flasks. Values represent mean of threedeterminations on composite materlal during two separate weeks.
Reference: Adapted from Prior and Hashimoto (1981).
At Maya Farms in the Philippines (Judan, 1981), solids arerecovered in settling tanks and dried in the sun. The feed material fromthe sludge provides 10 to 15% of the total feed requirement of swine andcattle, and 50% for ducks. At this concentration it was found that weightgains for swine were slightly higher than a control group (Maramba, 1978).Alviar et al. (1980) also found that dried sludge could be substituted incattle feed with satisfactory weight gains and savings of 50% in the feedconcentrate used.
While these empirical feeding tests demonstrate that dried sludgecan be recycled with considerable savings in feed costs, more detailedtests in developed countries tend to draw less positive conclusions. Ward
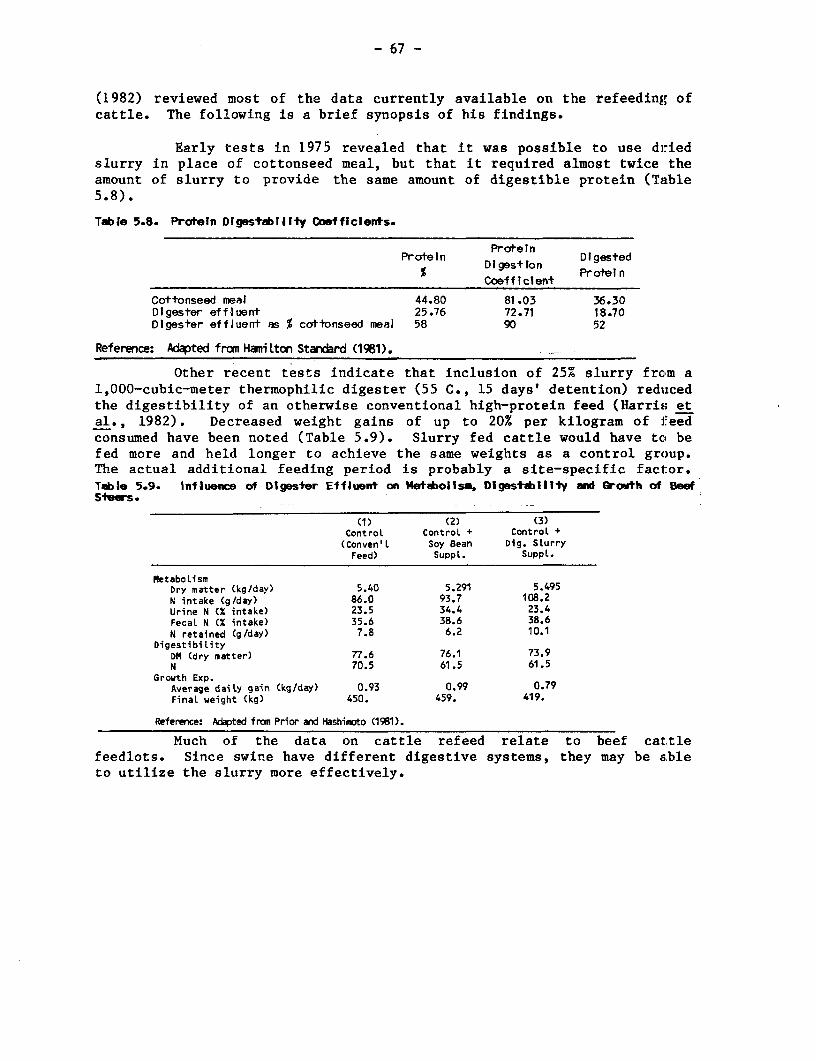
- 67 -
(1982) reviewed most of the data currently available on the refeeding ofcattle. The following is a brief synopsis of his findings.
Early tests in 1975 revealed that it was possible to use driedslurry in place of cottonseed meal, but that it required almost twice theamount of slurry to provide the same amount of digestible protein (Table5.8).
Table 5.8. Protein DlgestablII-ty Coefficients.
Proteln Dogestion Digested% Digestion Protelin
Coef f Icien+Cottonseed meaJ 44.80 81.03 36.30Digester effluent 25.76 72.71 18.70Digester effluent as % cottonseed meal 58 90 52
Reference: Adapted fron Hanm Lton Standard 1981). --
Other recent tests indicate that inclusion of 25% slurry from a1,000-cubic-meter thermophilic digester (55 C., 15 days' detention) reducedthe digestibility of an otherwise conventional high-protein feed (Harris etal., 1982). Decreased weight gains of up to 20% per kilogram of ieedconsumed have been noted (Table 5.9). Slurry fed cattle would have tco befed more and held longer to achieve the same weights as a control group.The actual additional feeding period is probably a site-specific factor.Tab e 5.9. Influence of Dlgester Effluent on Metrbollsu, Dtgestdbiity and Growth of BeefSteers.
(1) (2) (3)Control Control + Control +
(Conven'L Soy Bean Dig. SlurryFeed) SuppL. SuppL.
MetaboLismDry matter (kg/day) 5.40 5.291 5.495N intake (g/day) 86.0 93.7 108.2Urine N (% intake) 23.5 34.4 23.4Fecal N (X intake) 35.6 38.6 38.6N retained (g/day) 7.8 6.2 10.1
DigestibilityDM (dry matter) 77.6 76.1 73.9N 70.5 61.5 61.5
Growth Exp.Average daily gain (kg/day) 0.93 0.99 0.79FinaL weight (kg) 450. 459. 419.
Reference: Adapted from Prior and Hashimoto (1981).
Much of the data on cattle refeed relate to beef cattlefeedlots. Since swine have different digestive systems, they may be ableto utilize the slurry more effectively.
- 68 --
C H A P T E R S I X
INTEGRATED RESOURCE RECOVERY SYSTIES USING ANAEROBIC DIGESTION
The most efficient use of biogas systems in developing countriesis incorporation into food and fuel cycles in integrated resource recoveryschemes. This section examines several possible systems in relation totheir effect on fuel and food supplies. A general methodology is describedwhich enables rational choices in selection of integrated resource recovery(IRR) systems, and constraints and optimization procedures for IRR systemsare discussed. In addition, several state-of-the-art IRR systems indeveloping countries are presented and analyzed.
POSSIBLE IRR SYSTEMS
The variety of feeds, biogas techniques, and end uses of biogasand slurry results in a large number of possible IRR systems. Theinteractions between fuel, food and fertilizers in an IRR system arecomplex (see Figure 6.1). If fuel supply is the desired primaryoutput from such a system, then the nutrients present in the slurry couldeither be recycled back to the fields to grow more crops and provideresidue for feedstock, or be used to grovr feedstock directly. For example,the high primary productivity of water hyacinths would provide a high yieldof biomass, resulting in corresponding energy yields.
The end use to which the biogas is put also has implications interms of fuel production. If it is used solely to satisfy cooking andlighting requirements, it will not result in any feedback into fuelproduction. However, if some of the gas is used in a dual fuel engine, thepower generated can be used to irrigate fields, resulting in increasedagricultural residues available for digestion. In addition, the waste heatproduced by the engine can be used as heat for household purposes, or toheat the digester, which would allow a smaller digester to produce the sameamount of gas, reducing capital investment. The net result could be anenergy loop leading to increased amounts of energy available from a givenamount of land. The relative fractions of gas used for cooking and powergeneration influence the amplitude of this loop, and optimizationtechniques would maximize the gains from these "feedback" loops.
Food production is influenced by the presence of nutrients withinthe slurry. The most common method of using this slurry in integratedsystems is to recycle it to the fields as a fertilizer/soil conditioner.The method of handling the slurry can influence its efficacy as afertilizer, and hence the quantity of food and residuals produced.However, there are other methods of utilizing the slurry which can increasethe amount of food, including refeeding to animals and growing algae orfish. Also, the end use of biogas is important in this context sinceutilization of all the gas for pumping irrigation water and poweringtractors as opposed to cooking and lighting would increase the quantity offood produced from a given amount of landl.
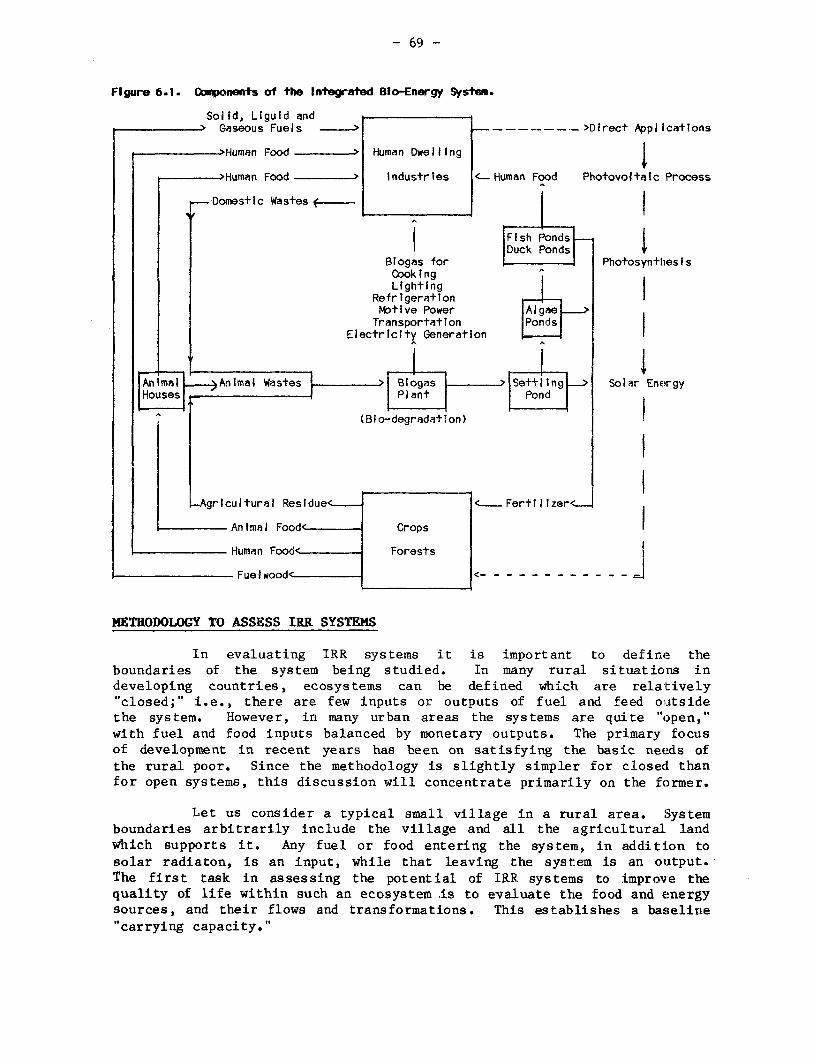
- 69 -
Figure 6.1. O(mponents of the Integrated Blo-Energy System.
Solid, Liguid andGaseous Fuels -- - >Direct Applications
>Human Food. > Human Dwelling I
>Human Food I Industries <- Human Food Photovoltalc Process
Domestic Wastes f i l
,~~~~~~~~~~~~~~~u nDuck Ponds
Btogas for PhotosynthiesisCookingLight ing
RefrigeratlonMbtive Power AlgaeTransportation Ponds
Electricity Generation
Animal ____>Animal Wastes > Blogas Settling Solar EnergyHouses . Plant Pond
(Bio-degradation) I
_Agricultural Residue< <- Fertilizer<__
Animal Foode Crops
Human Food< Forestsl
Fuelwood< <- - - - - - - - - __- - 1
METHODOLOGY TO ASSESS IRR SYSTEMS
In evaluating IRR systems it is important to define theboundaries of the system being studied. In many rural situations indeveloping countries, ecosystems can be defined which are relatively"closed;" i.e., there are few inputs or outputs of fuel and feed outsidethe system. However, in many urban areas the systems are quite "open,"with fuel and food inputs balanced by monetary outputs. The primary focusof development in recent years has been on satisfying the basic needs ofthe rural poor. Since the methodology is slightly simpler for closecd thanfor open systems, this discussion will concentrate primarily on the former.
Let us consider a typical small village in a rural area. Systemboundaries arbitrarily include the village and all the agricultural landwhich supports it. Any fuel or food entering the system, in addition tosolar radiaton, is an input, while that leaving the system is an output.The first task in assessing the potential of IRR systems to improve thequality of life within such an ecosystem is to evaluate the food and energysources, and their flows and transformations. This establishes a baseline"carrying capacity."
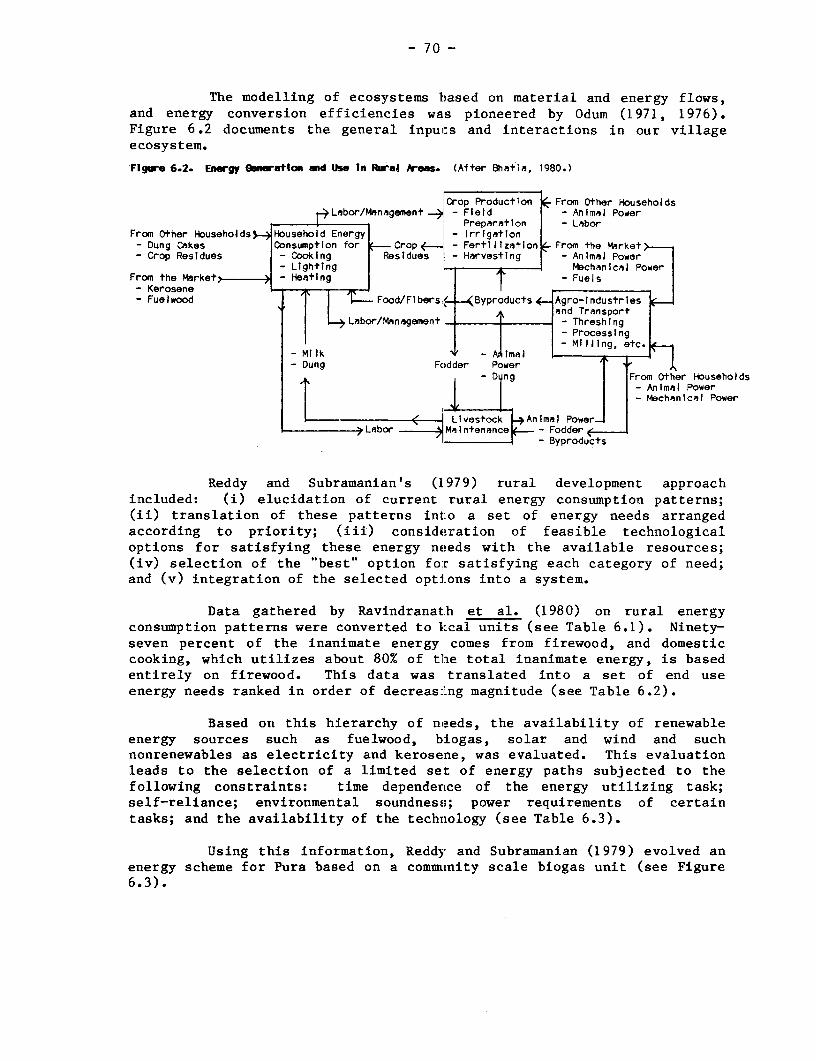
- 70 -
The modelling of ecosystems based on material and energy flows,and energy conversion efficiencies was pioneered by Odum (1971, 1976).Figure 6.2 documents the general inpuits and interactions in our villageecosystem.
Figure 6.2. Energy G wation and Use In Rural Aers. (After Bhatia, 1980.)
iCrop Productlon - From Other HousehoJdsLabor/Management g - Field - AnimaJ Power
I4 lPreparation - LaborFror Other Households Household Energy - Irrigation
- Dung Cakes Consumptlon for Crop - - Fertilizntlon From the Mhrket>- Crop Residues - Cooking Residues - Harvesting - Animal Power
- LIghting i_ *MbchanicaJ PowerFrom the Market) - Heating - Fuels
- KeroseneT- Fuelwood Food/Flbers.( q Byproducts 4-_ Agro-Industries
> . S . ~~~~~~~~and TrAnsportLabor/Management Threshing
-Processing
- Milk Ailmal Miling,- Dung Fodder Power
- D ng Fromn Orther Households- AnimAl Power- MschAnical Power
_ < I .ivestoc _>~~Animal Power-Labor Melntenance - Fodder (
- Byproducts
Reddy and Subramanian's (1979) rural development approachincluded: (i) elucidation of current rural energy consumption patterns;(ii) translation of these patterns into a set of energy needs arrangedaccording to priority; (iii) consideration of feasible technologicaloptions for satisfying these energy needs with the available resources;(iv) selection of the "best" option for satisfying each category of need;and (v) integration of the selected options into a system.
Data gathered by Ravindranath et al. (1980) on rural energyconsumption patterns were converted to kcal units (see Table 6.1). Ninety-seven percent of the inanimate energy comes from firewood, and domesticcooking, which utilizes about 80% of the total inanimate energy, is basedentirely on firewood. This data was translated into a set of end useenergy needs ranked in order of decreasing magnitude (see Table 6.2).
Based on this hierarchy of needs, the availability of renewableenergy sources such as fuelwood, biogas, solar and wind and suchnonrenewables as electricity and kerosene, was evaluated. This evaluationleads to the selection of a limited set of energy paths subjected to thefollowing constraints: time dependence of the energy utilizing task;self-reliance; environmental soundness; power requirements of certaintasks; and the availability of the technology (see Table 6.3).
Using this information, Reddy and Subramanian (1979) evolved anenergy scheme for Pura based on a commtnity scale biogas unit (see Figure6.3).

- 71 -
Table 6.1. Pura Energy Source Activity Ihtrtx (mllitons of Kcals/year).
Agriculture Domestic Lighting Industry Total
Human 7.97 50.78 - 4.97 63.72(Man) (4.98) (20.59) - (4.12) (29.69)(Woman) (2.99) (22.79) - (0.85) (29.63)(Child) - (7.40) - (7.40)
Bullock 12.40 - - - 12.40Firewood - 789.66 - 33.93 823.59Kerosene - - 17.40 1.40 18.80Electricity 6.25 - 2.65 0.71 9.61
Total 26.62 840.44 20.05 41.01 928.12
Reference: Adapted from Pavindranath et al. (1980).
Table 6.2. End Uses of Energy In Pura.
Inanimate and Animal Energy
Input Outputenergy/yRar EffIciency energy/yeas
End Use (kcal/10 ) (Estimates) (kcal x 10 )
1. Heating (95-250C) 688.9 5 34.42. Heating ( 55'C) 112.4 5 5.63. Heating ( 800'C) 23.8 5 1.24. Lighting 20.1 2.5 0.54.1 Lighting (electrical) (2.7) 10 (0.3)4.2 Lighting (kerosene) (17.4) 1 (0.2)5. Mobile Power 12.4 20 2.56. Stationary Power 7.0 80 5.66.1 Water Lifting (6.3) 80 (5.0)6.2 Flour Milling (0.7) 80 (0.6)
Total 864.6 49\.8
Human Energy
Human Energy Expenditure
Hours/day/ kcal 4Human Activity Hours/year household year x 10
1. Domestic 255,506 12.5 50.81.1 Livestock Grazing (117,534) (5.7) (23.4)1.2 Cooking (58,766) (2.9) (11.7)1.3 Firewood Gathering (45,991) (2.3) (9.1)1.4 Fetching Water (33,215) (1.6) (6.6)2. Agriculture 34,848 1.7 13.03. Industry 20,730 1.0 5.0
Total 311,084 15.2 63.8
Reference: Adapted fran Ravindranath et at. (1980).
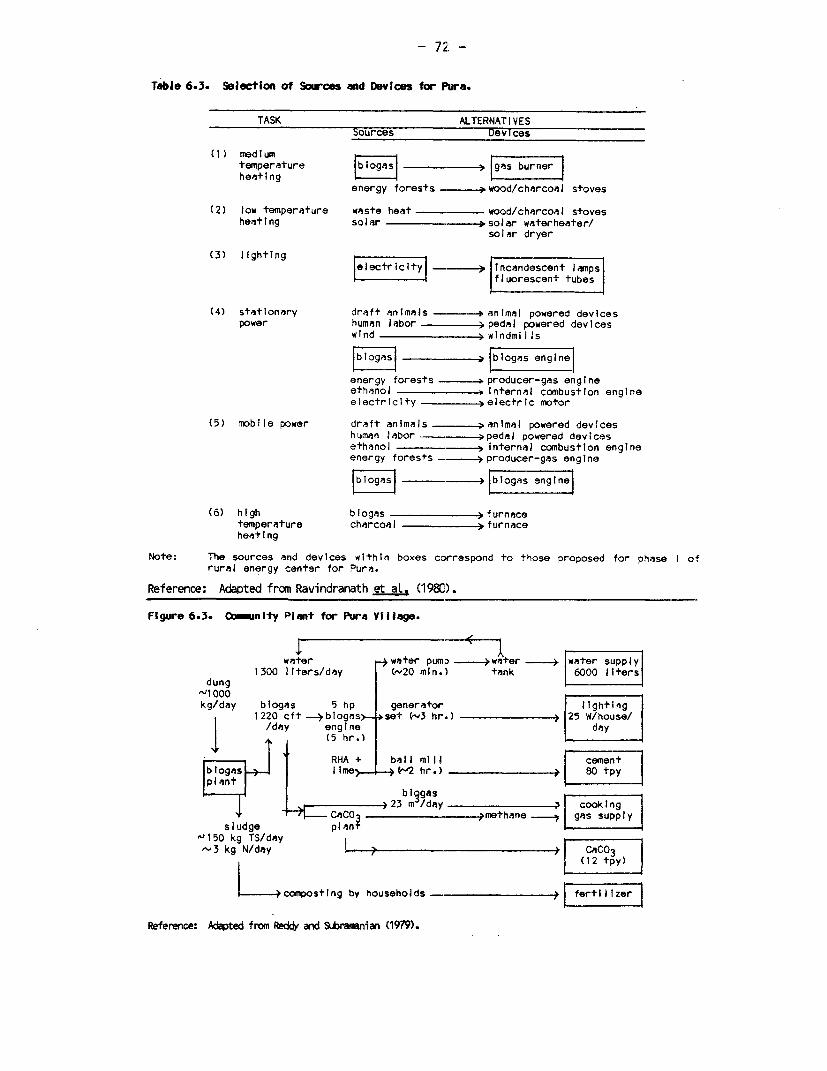
- 72. -
Table 6.3. Selection of Souroes and Devices for Fura.
TASK ALTERNATIVESSources Devices
(1) mediumtemperature b i g rnerheating
energy forests _- ; wood/charcoal stoves
(2) low temperature waste heat wood/charcoal stovesheattng solar - solar waterheater/
solar dryer
(3) lightingelectrictty _ Incandescent lamps
fluorescent tubes
(4) stationary draft animals - - antmal powered devicespower human labor > pedal powered devices
wtnd > windmills
H |~~~~~blogas engine
energy forests _ producer-gas engineethanol -- - Internal combustion engineelectricity - -electric motor
(5) mobilJe power draft animals _ .>animal powered deviceshuman labor - - pedal powered devicesethanol - internal combustion engineenergy forests - producer-gas engine
HbioGa| > |blogas englne]
(6) high biogas )-.furnacetemperature charcoal -- >furnaceheating
Note: The sources and devices within boxes ccrrespond to those proposed for phase I ofrural energy center for Pura.
Reference: Adapted from Ravindranath et al. (1980).
Figure 6.3. Cb unity Plant for Pura Village.
water water pump >water -_ water supply1300 liters/day (-20 min.) tank 6000 liters
dung,j
1000
kg/day btogas 5 hp generator lighting1220 cft --4blogas>_ set (-3 hr.) i 25 W/house//day engtne day
(5 hr.)
RHA + ball millbio l Ime L- 2 hr. 4 80 tpy
plantbIqgas
u23 m /day cooking, - -Ca'CO ______methane . gas supply
sludge planf _''150 kg TS/day-~3 kg N/day L , jCaCO 3
compostlng by households - feiltzer
Reference: Adapted from Reddy ard Subramanian (1979).
- 73 -
This integrated scheme relies on a number of key concepts:
a. selection of the most appropriate sources to match tasks;
b. cascading; i.e., using waste heat from a high quality sourceto perform tasks requiring low quality sources;
c. combining energy sources; e.g., using solar to preheat waterbefore being boiled by biogas;
d. spatial task integration; and
e. time sharing of energy devices.
OPTIMIZATION OF BIOGAS WITHIN IRR SYSTEMS
Within the broad context of optimization of IRR systems describedabove, there is a role for the optimization of individual techniques. Thisinvolves emphasizing such considerations as energy, nutrient recycling,public health or the environment.
For energy the prime parameter to optimize is the volumetric gasproduction rate. This gives a measure of the amount of energy produced perday per unit of capital invested, or size of digester. While typical ratesfor developing country designs vary from 0.1 to 0.4 volumes of gas pervolume of digester per day, these can be much higher when using optimizeddesign and operating conditions.
Since nutrients are essentially conserved during digestion,optimization for highest yields depends on the available C/N ratio in thefeed and the retention time. Public health considerations are dominatedprimarily by the retention times and temperature of the waste iLn thedigester. At mesophilic temperatures of 350C, excreta needs retentiontimes of 40 to 50 days to be rendered essentially pathogen free andbiochemically stable.
EXISTING IRR SYSTEMS
In recent years a number of IRR systems have been established indeveloping countries (Chan, 1973; Alviar et al., 1980; Solly 1980; Marchaimet al., 1981; Meta Systems, 1981). Probably the most well known of theseare Maya Farms in the Philippines and Xinbu village in China.
Maya Farms evolved to utilize a byproduct of flour milling (i.e.,pollard) as a pig feed. The farm was established near Manila on 24hectares. In the early seventies the primary concern was to reduce theodors from pig manure. Anaerobic digestion was investigated and found toreduce the odors, but the effluent slurry presented water pollutionproblems, so sludge conditioning techniques were developed. In late 1973due to rising oil prices Maya Farms commenced experiments on the possibleuses of both biogas and the slurry produced. A research program was set upto investigate the various digester designs (Maramba, 1978) and possible
- 74 -
uses of the slurry as an animal feed, to grow algae and fish and irrigatecrops. By 1981 the farm covered 36 hectares and contained 25,000 pigs, 70cattle and 10,000 ducks.
Maya Farms designed and imp:Lemented three integrated farmingsystems, varying in size from a smaLl family farm model to a largecommercial feedlot venture (Judan, 1981). The family farm is based on 1.2hectares of land with 1.0 hectares being used for crops (rice or corn) andthe rest devoted to a cattle shed, fishpond, biogas works, accommodationand a pig sty containing four sows. The digester is a two chambercontinuously fed unit which is fed the swine waste and manure from twowater buffalo. The gas produced is more than enough to supply the family'senergy requirements for cooking, and also powers a refrigerator and gasmantle lamp. Solids in the slurry are refed to the pigs and constitute 10%of their feed, while the liquid slurry is used to raise fish in a 200square meter pond and to fully fertilize all the cropland throughout theyear.
The medium scale system is based on 12 hectares of land and a 48sow piggery. The gas is sufficient to pump water for the farmhouse andlivestock and to irrigate the 12 hectares of cropland. The large systemwas designed for 500 sow units and no agricultural land, approximating anintensive animal feedlot. The gas produced is used for pumping water,lighting the pigpens and operating a feed mill; however, in this case thereis a gas surplus amounting to roughly 40% of the output. Various end usesof this gas have been suggested. Payback periods varied from 18 to 39months (for the family farm system).
In these examples the IRR system evolved empirically. Moreefficient systems are possible if all the energy and food flows within thesystem are fully integrated. With more open systems such as intensiveanimal feedlots, the prime parameter to optimize may be financial returns.
The Xinbu production brigade is situated in the delta of thePearl River in Guangdong Province, China, and comprises 282 families with1,570 persons. The brigade controls 1,528 mu (100 hectares) of farmlandand fresh water fish ponds: 834 mu for fish ponds; 321 mu for mulberryfields; 188 mu for sugarcane; and the remaining 180 mu are separate plots(Hu Bing-hong, 1982). The brigade started to install biogas units in 1976and by the end of 1977 80% of the families were utilizing biogas. Theseunits supply some 50% of the families' fuel requirements, and in addition17 families are using solar roof panels which, with biogas, supply 70 to80% of their energy needs. The biogas is used for cooking and generatingelectricity for lighting, and the waste heat from the engine is used to drysilkworm cocoons. Solar dryers are a:Lso used to carry out the lattertask. The slurry is used to feed fish ponds and fertilize the fieldsgrowing mulberry, sugar cane and Napier grass. In addition, some of theslurry is used to grow mushrooms. In the six years the scheme has been inoperation, the output from the brigade (in yuan) has risen by 150% (HuBing-hong, 1982), and the general sanitary conditions of the village haveimproved considerably.
- 75 -
C H A P T E R S E V E N
ECONOMIC JUSTIFICATION
INTRODUCTION
For economic analysis, biogas facilities can be broadly clividedinto two categories: (1) those in which there is a significant economiccost associated with the handling and disposal of organic feedstocks, and(2) those in which this cost is negligible. Examples of the first areainclude sewage disposal, industrial waste treatment, and manure disposalfrom intensive livestock farming. The second category includes householdand community scale plants in poor rural communities.
While industrialized countries have experience in area (1), thereis a shortage of experience and data on which to base relevant economicanalyses. However, a few studies do provide some preliminary indication ofeconomic justification.
The special attraction of biogas plants in area (2) is that,unlike traditional usages, both fertilizer and fuel are obtained from thesame source material. Most of the economic data and analyses come from theIndian biogas program.
ECONOMIC EVALUATION-DEFINITIONS AND PROBLEM AREAS
Economic evaluation of small scale biogas plants requiresmeasuring and valuing the fertilizer and fuel output, then comparing thegross value of output with the costs of plant construction and operation toarrive at a benefit-cost ratio or other index of value.
Financial and Economic Analyses
In this review both financial and economic (social) analyses areconsidered. Financial analysis identifies "the money profit accruing tothe project operating entity, whereas social profit measures the effect ofthe project on the fundamental objectives of the whole economy" (Squire andvan der Tak, 1975). Financial analysis is based upon market prices,including taxes and subsidies, and can be applied at the household, firm,sectoral or national level, according to the purposes of the evaluation.Economic (social) analysis is typically undertaken at the national leveland uses shadow (or accounting) prices that reflect the true economic worthof project inputs and outputs to society.
An intermediate approach is based on using shadow rather thanmarket prices to value costs and benefits. The terms "financial" and"social" will be used to distinguish between the use of market and shadowprices, respectively. Following Gittinger (1972), "financial" alsoincludes the imputed values of such inputs and outputs of biogas plantswhich are produced and consumed at home rather than purchased or sold inthe market.
- 76 --
Secondary benefits and costs should be incorporated into aneconomic evaluation. Biogas plants can generate a variety of social andenvironmental benefits that are sometimes relevant to financial analysis(e.g., reduced medical bills), and generally relevant to social analysis.These benefits have been examined in detail in Barnett (1978) and Bhatia(1980).
A major force behind renewable energy technology research anddevelopment, including biogas, has been the need to eliminate deforestationby using substitutes for traditional fuelwood. The issues raised, apartfrom the use of reforestation costs to value fuelwood substitutes, includeclimate, agricultural productivity, and local institutional and marketeffects of deforestation. These secondary benefits create two problems foranalysis: the first is one of measurement and valuation of secondarybenefits, and the second is one of comparability of biogas with otherenergy technologies that have a different, and commonly smaller array ofsecondary benefits.
In China, improved sanitation has been a principal objective ofsome biogas programs. Secondary benefits include improved health.
REVIEW OF PAST STUDIES
Several reviews of cost benefit studies of biogas have beenpublished, notably, Barnett (1978), Sanghi (1979), Mukherjee and Arya(1980), ESCAP (1981), de Lucia and Bhatia (1980) and Mazumdar (1982).These reviews relate almost solely to Indian experience. While Chineseexperience is almost as extensive, the only economic evaluation found isone study of Ximbu village in Guangdong province (Nian-guo, 1982). TheChinese (fixed dome) design has, however, been evaluated in Thailand(Thongkaimook, 1982) and India (Singh and Singh, 1978). Limited informa-tion is available on small scale and community units for the Philippines(Galano et al., n.d.; Alicbusan et al., n.d.), Nepal (Berger, 1976; Pang,1978; Pradhan, n.d.), Thailand (Prasith-raithsint et al., 1979;Thongkaimook, 1982), Bangladesh (Rahman, 1976), Ethiopia (Tarrant, 1977),Kenya (Pyle, n.d.), Honduras (Roesor, 1979), Pakistan (Qurishi, 1978) andFiji (Chan, 1975).
Only four of these studies were based on household level field-work: Moulik and Srivastava (1975), and ICAR (1976) in India, Prasith-raithsint et al. (1979) in Thailand, and Galano et al. (n.d.) in thePhilippines. These did not actually measure physical inputs and outputs,but relied on questionnaires, which may limit the reliability ofconclusions. There was no consensus on methods of analysis, and manystudies did not provide sufficient information to appraise the suitabilityof the methods used. None of the studies attempted to value secondarybenefits.
The Indian studies, however, include ten substantive evaluationsfrom which tentative conclusions can be drawn. A major problem with thesestudies so far as their relevance for future programs is concerned is thatthey are all based on the Khadi and Village Industries Commission (KVIC)
- 77 -
floating dome designs which are very expensive to construct in comparisonwith the Chinese designs--mainland (fixed dome) and Taiwanese (bag).However, the KVIC design continues to be the major design promoted inIndia. These studies are also valuable because India, which has a largecattle population and regions where the scarcity of fuelwood is becomi"ng amajor problem, represents one of the potentially most favorable locat:ionsfor diffusion of biogas technology. While currently available studies donot allow regional differences within India to be analyzed except at themost basic level (e.g., the effect of lower winter temperatures in thenorth), even tentative conclusions on the determinants of economicviability will be useful in identifying possible locations in othercountries. In addition they illustrate the methodological problems inevaluation, and help define one of the requirements for future stuclies.
Two Prominent Indian Case Studies
K. S. Parikh wrote the first comprehensive economic cost-benefitanalysis of Indian biogas units in 1963, and produced a revised version in1976 in which he concluded that family sized biogas plants have "a grossreturn of 14-18 per cent,purely in financial terms...(and) from a scicialbenefit/cost point of view, the plants are even more attractive." Incontrast Bhatia, who has written extensively on renewable ernergytechnologies and cost-benefit analysis, concluded (1977) that "the presentestimates of benefits and costs do not indicate that investment in biogasunits is economic from the viewpoint of society."
Both these studies are based upon KVIC two cubic meters ofgas per day plants (see Table 7.1). But while Parikh shows substantialbenefits, Bhatia demonstrates substantial losses from an investment in theplant. This is even more difficult to explain than the bare figuressuggest, for Bhatia used shadow prices and Parikh market prices. In mostcases, Bhatia's shadow prices of inputs and outputs decreased the mairketvalues of costs, and, in the case of the fertilizer value of slurry,increased the value of benefits.
Bhatia improved upon most sensitivity analyses in biogasevaluations by varying the values of three parameters at the same time,rather than just one or two. His selection of the five parameters foralternative valuation (gas end use, value of manure, plant investment cost,calorific value of alternative fuels and plant size) also reflects theuncertainties that prevent consensus on the economic worth of plants.Other analysts have also done this but often in a less systematic way; forinstance, uncertainty about the most appropriate fuel to use for valuinggas results in several fuels being used, without any guidance as to what isthought to be correct. Bhatia also provided convincing arguments (seebelow) for not assuming any additional fertilizer value for digestedslurry. His shadow prices put 20% premiums on steel and cement and 30% onforeign exchange for fertilizers and kerosene, and used a zero shadow wagerate for unskilled labor.
Bhatia improved the methodology of biogas cost-benefit studies,particularly with regard to his sensitivity analysis and the thoroughness
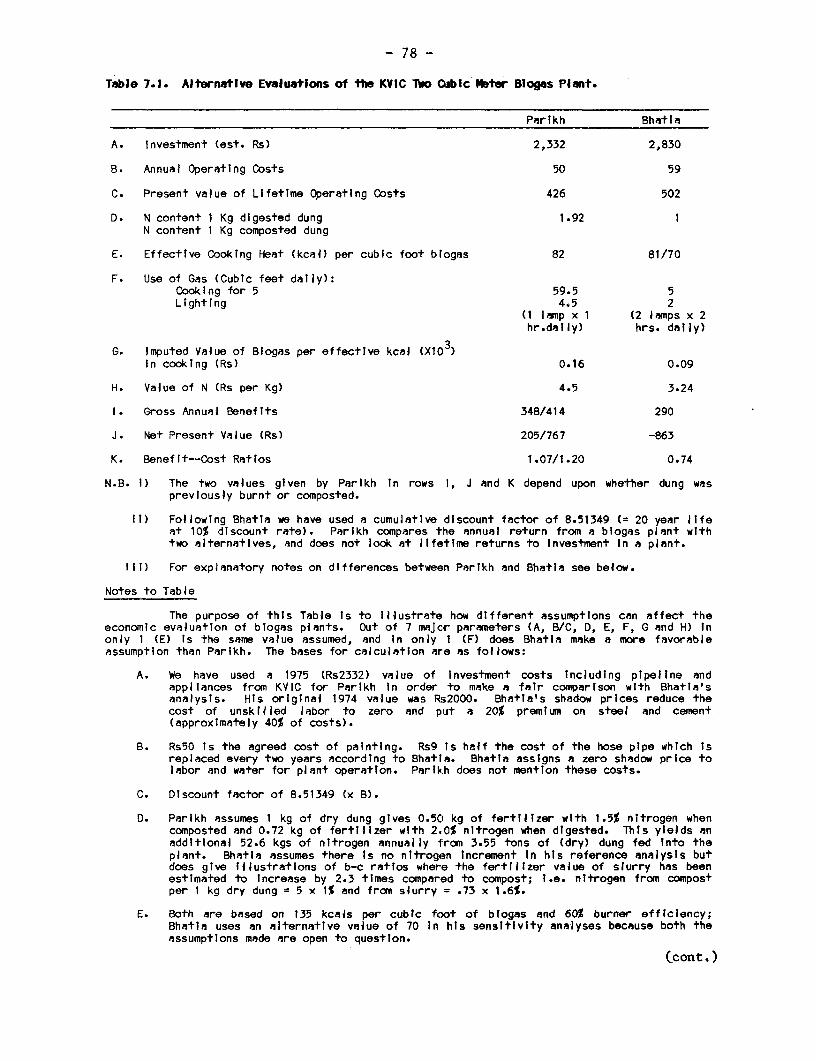
- 78 -
Table 7.1. Alternative Evaluations of the KVIC Two Qibic Obter Bloges Plant.
Parikh BhatiA
A. Investment (est. Rs) 2,332 2,830
B. Annual Operating Costs 50 59
C. Present value of Lifetime Operating Costs 426 502
D. N content 1 Kg digested dung 1.92 1N content 1 Kg composted dung
E. Effective Cooking Heat (kcal) per cubic foot biogas 82 81/70
F. Use of Gas (Cubic feet daily):Cooking for 5 59.5 5Lighting 4.5 2
(1 lamp x 1 (2 lamps x 2hr.dally) hrs. daily)
G. Imputed Value of Biogas per effective kcal (X103)In cooking (Rs) 0.16 0.09
H. Value of N (Rs per Kg) 4.5 3.24
1. Gross Annual Benefits 348/414 290
J. Net Present Value (Rs) 205/767 -863
K. Benefit--Cost Ratios 1.07/1.20 0.74
N.B. I) The two values given by Parikh In rows 1, J and K depend upon whether dung waspreviously burnt or composted.
iI) Following BhatTa we have used a cumulative discount factor of 8.51349 (= 20 year lifeat 10% discount rate). Parikh compares the annual return from a blogas plant withtwo alternatives, and does not look at lifetime returns to Investment In a plant.
ill) For explanatory notes on differences between Parikh and Bhatia see below.
Notes to Table
The purpose of this Table Is to Illustrate how different assumptions can affect theeconomic evaluation of blogas plants. Out of 7 maJor parameters (A, B/C, D, E, F, G and H) Inonly 1 (E) Is the same value assumed, and In only 1 (F) does Bhatia make a more favorableassumption than Parikh. The bases for calculation are as follows:
A. We have used a 1975 (Rs2332) value of Investment costs Including pipeline andappliances from KVIC for Parikh In order to make a fair comparison wlth Bhatia'sanalysis. His original 1974 value was Rs2000. Bhatia's shadow prices reduce thecost of unskilled labor to zero and put a 20% premium on steel and cement(approximately 40% of costs).
B. Rs5O Is the agreed cost of painting. Rs9 Is half the cost of the hose pipe which Isreplaced every two years according to Bhatla. Bhatla assigns a zero shadow price tolabor and water for plant operation. Parlkh does not mention these costs.
C. Discount factor of 8.51349 (x B).
D. Parikh assumes 1 kg of dry dung gives 0.50 kg of fertilizer with 1.5% nitrogen whencomposted and 0.72 kg of fertilizer with 2.0% nitrogen when dtgested. This yields anadditional 52.6 kgs of nitrogen annually from 3.55 tons of (dry) dung fed Into theplant. Bhatia assumes there Is no nitrogen Increment In his reference analysis butdoes give Illustrations of b-c ratios where the fertilizer value of slurry has beenestimated to Increase by 2.3 times compared to compost; I.e. nitrogen from compostper 1 kg dry dung = 5 x 1% and from slurry = .73 x 1.6%.
E. Both are based on 135 kcals per cubic foot of blogas and 60% burner efficiency;Bhatia uses an alternative value of 70 in his sensitivity analyses because both theassumptions made are open to question.
(cont.)
- 79 -
Table 7.1 (cont.)
F. Bhatia's estimate is higher here bacause he assumes a 70 cubic foot (2 mi3) output,whereas Parlkh assumes the plant only produces 64 cubic feet. This difference Inoutput for the same plant reflects a confusion In technical knowledge, but also showshow Important the other differences are for Parikh establishes a far superllorbenefit-cost ratio with a 10% smaller yield of gas. (Both Parikh and Bhatia havetaken account of seasonal differences In gas output.)
G. Parikh uses the market price of dung cakes and Bhatla the shadow price of soft coketo calculate blogas value.
H. Bhatials nitrogen value Is based upon a cif price of urea (50% nitrogen) of $135 pertonne with a 30% foreign exchange premiun and a Rs300 per tonne transport cost.Parlkh's nitrogen value Is assumed, without any explanatlon, to be Rs4.5 per kg.
of his discussion of parameters. For example, he discussed the effect onNPV of changes in the transport cost of coke, and in the effective heatavailable from biogas. Of the criticisms which have been made (Mukherjeeand Arya, 1980), two have not been effectively dealt with by the author.First, and of less practical consequence, he used a value of less than 1¢(U.S.) per kilowatt hour for electricity, only citing a reference to anearlier paper of his in justification, whereas Tyner and Adams (1977)calculated the shadow price of a centrally generated electricity supply atfrom 2.2 to 8.5t (U.S.) (at only 10% capacity utilization). In practicethis difference, which at minimum doubles his estimate, is not importantbecause Bhatia uses the higher kerosene figure to value the light frombiogas in his reference analysis. The second criticism concerns his use ofa zero shadow wage for the "unskilled" labor in mining coal and producingsoft coke. Since this results in a large reduction in the replacement costof biogas for cooking, and since cooking is the major use of biogas, use ofa zero shadow wage substantially reduces the value of biogas.
Bhatia's use of the opportunity cost of soft coke, the mostabundant energy resource in India suitable for cooking, to value the gascan also be criticized. Kerosene, firewood, crop residues and dung are thesource of cooking fuel for most villagers. The biomass replacement cost ofbiogas has a much lower value than kerosene replacement if the market priceof wood is used, and as Moulik et al. (1978) demonstrated, with low costsof firewood, investment in biogas incurs major losses.
Prior to Bhatia's paper, Parikh's 1963 analysis remained the mostthorough study available on the economics of biogas. In that study hesuggested that where dung was burned, the prospects of biogas were best andtherefore that within India Madras (Tamil Nadu), Uttar Pradesh, West Bengaland Kerala should develop biogas programs. He compared biogas with wood,gasoline and diesel as the cheapest alternatives at 1963 prices, and alsoargued that other fuel possibilities, such as electricity, kerosene andcoal, were too expensive. Like Bhatia he assumed a zero shadow wage, andlooked at variability in effective heat according to volume of biogas,methane content and end use efficiency. He argued that slurry gives morenitrogen, and consequently more food than composting, based on the all-India average figure of 36% of available dung used as fuel. He also drewattention, as did Bhatia, to the non-nitrogen benefits in using slurry forsoil improvement, and to the social and economic benefits of improvedhealth through use of smokeless fuels.
- 80 -
This study formed the basis for Parikh's later paper, although hemade significant changes in assumptions between the two analyses. First,he used only purchased dung cakes, instead of wood and dung cakes, as thetraditional fuel replaced by gas. Second, he assumed in the later studythat the quality of fertilizer in the slurry was better than from compostedmanure. The consequence of the first assumption was that in his analysis,households that now burned dung could save Rs298 per year by investing in abiogas unit, whereas households that composted dung would receive a benefitof Rs364. In his earlier study, the input cost of wood per kcal used incooking was higher than that of dung. The second change was to give thedigested slurry an assumed nitrogen value of 2% of the dry weight of slurrycompared with 1.5% in dung, and to assume a larger quantity of fertilizer(0.72 to 0.5 kilograms) was available as slurry from one kilogram of drydung. In his earlier study he referred to such a difference, but did notinclude it in his analysis; as a consequence of this change, the economicsof biogas units improved considerably.
The differences between Parikh and Bhatia are due to their choiceof fuels with which to measure the replacement of biogas in cooking, andtheir valuation of the fertilizer content in digester slurry and compostedmanure. Bhatia's use of shadow prices tends to reduce differences betweenthem, except for the price he used to value gas. Parikh's use of dungcakes valued at market prices led to much larger savings through adoptionof biogas for cooking than did Bhatia's use of soft coke at shadow prices.Parikh's estimate of the enhanced fertilizer value in slurry (52.6 kilo-grams of nitrogen annually) compares with Bhatia's assumption of no differ-ence between the two.
Other Indian Studies of Household Units
Other studies also confirm the sensitivity of economic analysesto the value of biogas and slurry. Moulik et al.'s study (1978) was basedon a field survey in four Indian states and is of particular value, sincemost other analyses are desk based. They draw attention to two majorpoints of interest. Using the price of firewood to value gas, the studymeasured the gas replacement cost at different levels of firewood prices tocalculate the break even points of NPV o;. plants. It established substan-tial economies of scale which are important when considering development oflarge biogas plants for community use. It also emphasized the problem ofpoor financial returns when plant owners did not purchase fuels prior toinstallation; only in the very largest plants was the return fromfertilizer alone sufficient to make the plant viable. The authors did notsay how this was calculated, but they used the price of local compostrather than the price of imported chemical fertilizer to value the slurry.Their analysis included a 20% subsidy of capital costs received by farmersfrom KVIC to promote biogas. To achieve financial viability a moresubstantial subsidy would be required when firewood has a low opportunitycost. This is more likely to occur when it is collected rather thanpurchased. In such cases even a 100% subsidy of the initial purchase pricecould not improve cash flow, because generally neither the gas nor theslurry could be traded to generate cash for meeting maintenance costs.
- 81 -
Only a few, comparatively rich farmers in India have plants.Sathianathan (1975), ICAR (1976) and Sirohi (1977), though they discuss theproblem of cash flow, are all advocates of biogas despite thisdistributional bias; using basically similar assumptions they alldemonstrate benefit-cost ratios higher than one. Such results, however,depend on assumptions that appear to bear little relationship to actualfarm-level choices. Unlike Bhatia, these authors do not argue that theirassumptions are based on the most appropriate alternative from society'sviewpoint. For example, Sirohi (1977) valued slurry fertilizer at twotimes the value of an equivalent amount of farmyard manure. He also usedthe opportunity cost of kerosene to value all biogas.
Contrasting this advocacy literature with-the analyses presentedby skeptics highlights the sensitivity of conclusions to choice ofassumptions. Sathianathan, for example, following KVIC, assumes no laborcosts in operation, while in other analyses such costs are the singlelargest item, and account for the negative NPV. French (1979) producessimilarly negative results, and again treatment of labor was the criticalfactor.
To draw even broad conclusions from these different studies isdifficult given the doubts that exist concerning the validity of some ofthe assumptions. For example, in some studies (e.g., Parikh, 1976) thevalue of dung as fuel is greater than its value as compost; in others(e.g., Bhavani, 1976) the reverse is true.
Community Level Plants in India
The introduction of large scale (greater than 40 cubicmeter) plants for use by rural communities has been prompted by twoimportant considerations. First, the alternative of a household plant. isnot an option for most Indian households. Only 5% of the cattle owninghouseholds have the minimum five animals needed to provide feedstock(Prasad et al., 1974), and perhaps even less could bear the additional cashoutlays involved in the substitution of biogas for fuelwood and dung thatwas previously collected by family labor. Second, economies of scale areone of a number of potential techno-economic advantages of community overhousehold plants. Offsetting these considerations are the diseconomies ofscale involved in a community gas distribution network, in the largervolumes of dung required at one site, and in the greater organizationalrequirements.
Two community plants have been evaluated in some detail; one atFateh Singh Ka Purwa in Uttar Pradesh by Bahadur and Agarwal (n.d.), Ghate(1979), and Bhatia and Niamir (1979), and one in Kubadthal, Gujarat byMoulik (1982). Evaluating community plants has the same drawbacks ashousehold units in valuing inputs and outputs, so it is not surprising thatthree evaluations of the Uttar Pradesh plant arrived at three differenteconomic benefit-cost ratios; 1.14:1, 1.54:1 and 0.6:1. Moulik's financialanalysis of the Gujarat plant did not include a final estimate of financialviability, but it was evident from current performance that the profit fromplant operation would not meet the loan and interest payments due. Other
- 82 --
analyses agreed that the plant was not financially viable, though Ghate(p. 24) suggested that at least part of the deficit on the costs ofcooking, lighting and water supply (from a biogas powered tubewell) couldbe met through a surplus generated by the dual fuel engine used for cropprocessing.
Financially nonviable plants can be justifiably supported throughstate subsidies if economic analysis is sufficiently positive. The authorsof the four studies cited above agreed that at present the basis for anaccurate economic benefit-cost analysis is lacking, and, therefore, thattheir conclusions were tentative. Bhatia and Niamir, who found a benefit-cost ratio less than one, summarize the problems of economic analysis asfollows:
"It is interesting to note that the entire economics ofbiogas technology seem to rest on the following assumptions:
a. The calorific content of different fuels such ascow dung cakes, fuelwood used in cooking, plantresidues, kerosene and biogas.
b. The efficiencies with which these fuels are beingused currently, or the possible equipment whichcould lead to higher efficiencies.
c. The NPK contents of different organic fertilisers,and the yield-fertiliser response under differentagronomic conditions and crop rotations.
d. The behavioural aspects of the energy sources ororganic fertilisers such as present use patterns,actual and perceived constraints to their useetc...
Unfortunately, the sponsoring of research to collect data onthese parameters is not considered important by the scientificcommunity, or by policy makers."
One important difference from the analysis of household plants isthe greater complexity of community plant end use possibilities. Gasavailability varied in the Fateh Singh Ka Purwa plant from below 1900 cubicfeet per day in winter, to above 2700 cubic feet in summer (Bhatia andNiamir, Table 10). This gas was used for cooking; a generator to supplylighting and to power a tubewell; and a dual fuel engine running a flourmill, a thresher and a chaff cutter. The proportion of gas distributed tothese different end uses has been considered to be a critical determinantof both the financial and social worth of the plant because both market andshadow prices of the gas will vary. An alternative approach to economicevaluation assumes the highest value use until the demand is met, then thenext, etc. This higher use(s) requires a unique fuel characteristic withunique replacement value. The combination of end uses that will maximizebenefits depends upon the assumptions used to value gas put to different
- 83 -
end uses. In their social analysis all three studies used the shadow priceof soft coke or coal to value biogas in cooking. They arrived at t:hreedifferent estimates: 11.6, 15 and 38.3% as the share of cooking in thetotal benefits. Bhatia and Niamir (1979) also used the social price ofdung and fuelwood to value biogas in cooking to give a second estimat:e of63% of total benefits from this end use. In this second estimate, dung wasvalued using the shadow price of imported fertilizer. Under thisassumption over half of the total benefits were due to the use of dung forfertilizer instead of for cooking which is now carried out using biogas.Since cooking uses about 60% of the gas, these widely differing percent:ages(11.6 to 63%) can be used to support a case for or against the use ofbiogas for cooking in preference to other end uses (different initialinvestment and operating costs will also affect the calculatiLon).Financial analysis of the value of different end uses was less equivocal;non-cooking uses, particularly diesel substituting ones, are better.
What these ambiguous results demonstrate is the inability ofsocial and financial analysis to determine policy in the absence of astrategic energy policy framework. The possible deforestation and los1s ofagricultural output associated with fuelwood and dung use has to beevaluated in conjunction with the foreign exchange costs of diesel importsin the case above, but this is only one example of the types of valuationimplicit in all energy policy decisions. A second, and equally cruciallimitation, is the difficulty analysts face in incorporating secondarybenefits. Some, such as health benefits, are extremely difficult toquantify, while others, such as improved community spirit through asuccessful biogas program, are impossible. In the community programsdiscussed above, a variety of secondary benefits were acknowledged byparticipants as being very important to their perception of the value ofbiogas plants. This was particularly true of women who benefited fromimproved kitchen conditions, and savings on cooking time.
The technology evaluated in the above studies was an expensiveKVIC design. In a Southern Indian village a community plant is being builtto meet the specific village energy requirements, and financial viabilityis possible (Lichtman, 1983). It is worth noting, though that both theplants discussed above were also financially viable on paper. A second,and critical feature of the Southern Indian program is the involvement ofthe villagers in the planning of the biogas plant. In both the plantsdiscussed above the chief reasons for their difficulties wereorganizational, rather than economic or technical. Moulik in the Gujaratstudy, and Bahadur and Agarwal in the Uttar Pradesh study, provide detaileddescriptions of numerous organizational and operational problems that wererelated to village social structure, and the relationship between thevillagers and the implementing agency. All the authors of these studiesagree that the solution of such social problems with community plantsrequires the involvement of users from the very first stages of planning.
A Case Study in China
While several technical studies (Shian et al., 1979), andinformation on approaches to extension organization (McGarry and
- 84 -
Stainforth, 1978; van Buren, 1979; Sheridan, 1981; Stuckey, 1982) areavailable, economic analyses in English are less common, and only one iscurrently available (Nian-Guo, 1982). The evaluation is of 86 householdplants and one community plant in a village of 90 households in SouthChina. The data employed are itemized, but the study does not describe theassumptions behind the data estimates uses, or whether they were based onactual user experience. A six cubic meter household plant was estimated tocost Y209.93 (about US$105) to construct. Operating benefits wereestimated at Z34.32 per year for fuel saving, *105 for labor saving, and*36 for the fertilizer value of the slurry. These are presumed to be netoperating benefits as no operating or maintenance costs are given. Basedon these figures, Nian-guo calculates a 1.25 year payback period, while thelife of the digester was estimated at 10 to 15 years.
The community plant consisted of seven digesters totalling 200cubic meters, with a construction cost of Y7,000. Auxiliaries cost aroundY3,500, and the generator, switchboard and grid cost Y5,000, giving a totalinvestment cost of Y15,500. Net of operating costs, annual benefits fromelectricity, fuel saving, labor saving and food processing were valued atY4,163 which gave a 3.75 year payback period. Additional benefits not in-cluded were: increased by-product income due to the enhanced fertilizervalue of digested manure, better quality biogas-dried silkworm cocoons,sanitary improvements, and better living style.
On a recent trip to China, Stuckey (1982) obtained some data oncurrent costs and benefits from family size units (six to eight cubicmeters). The estimated cost of these units was #150 (materials and labor),and savings in fuel (coal) and fertilizer (urea) amounted to around Y50 to70 per year. Based on these figures, the payback period was less than 3years, making family size units in China financially viable.
Both Thongkaimook (1982) and Singh and Singh (1978), in comparingthe Indian and Chinese designs, concluded that the Chinese design issuperior on economic grounds. The chief disadvantage of the Indian designis its high cost and the short life of the gas holder. The Chinese designis now being used in the multi-model bJogas program in the Indian SixthPlan, and further detailed economic comparison should be possible soon.
However, the successes of the Chinese program in diffusing biogas(as reported in non-economic literature) are products of determined experi-mentation, careful organization and diversification in operation as much asbetter technology. In fact, there have been many failures for technicalreasons, which have provided lessons, particularly on construction tech-niques for gas domes, and the failure rate of new plants is now very low(Stuckey, 1982).
Experience of Economic Evaluation in Other Countries
Evidence on household and community plants from other countriesis extremely scarce and provides little additional knowledge that mightresolve some of the uncertainties that the India studies have raised. Onlya few of the studies available were based on actual user experience.Rahman (1976) gives a breakdown of costs and benefits of a modified Indian
- 85 -
design used in Bangladesh, without any firm conclusion on its economicviability. However, with a net annual operating profit of Tk.581, and aninitial construction cost of Tk.7,600, only very low interest rates on aloan for construction would make the plant financially viable.
Of three Nepalese desk studies based on Indian design (threecubic meter) plants, only Berger (1976) estimated a positive benefit-costratio (1.67:1), while Pradhan (n.d.) and Pang (1978) argued thatconstruction cost reductions were critical if biogas was to be financiallyfeasible for any but the richer farmers.
In Thailand, an empirical study of Indian design plants byPrasith-raithsint et al. (1979) found that household plants on average hada payback period of five years. No other estimates of economic worth werecalculated. No benefits were claimed for the slurry as this was not usedby plant owners. The high cost of plants, a lack of technical knou-how,the availability of other fuels, and the shortage of dung were the mainreasons given by the 94.5% of current nonusers who said they did not want aplant.
In the Philippines, an empirical study by Galano et al. (n.d.)reported positive financial benefit-cost ratios for 21 locally designedhousehold plants and that larger plants had the best ratios. They statedthat their use of liquified petroleum gas rather than traditional fuels mayhave resulted in an overevaluation of benefits. Based on this analysis,they provided a number of recommendations for hastening diffusion of biogasin the Philippines. A more detailed economic analysis by Alicbusan et al.(n.d.) reached similar favorable conclusions, with an estimated paybackperiod of 2.3 years for a 510 cubic foot plant.
A Kenyan desk study by Pyle (n.d.) investigated the economicviability of two local designs. He found both to have positive net presentvalues at all levels of plant life, but that there were significanteconomies of scale when comparing a one cubic meter with a four cubic meterplant. The smaller plants were only a marginal proposition when a lowvalue for slurry was used, and generally the results were extremelysensitive to the value placed on the slurry. He concluded that moredetailed and accurate field studies were necessary.
A desk study by Roeser (1979) of two household plants in Hondurasshowed that the economic viability of the plants depended critically uponthe relative time spent on dung and firewood collection. At low dungcollection times, the largest plant (360 cubic feet) was viable. Thesmaller plant (180 cubic feet) was viable only when cooking rather thanlighting was the end use adopted. However, in the absence of subsidizedkerosene for lighting, use of biogas for lighting was viable at low dungcollection and preparation times. He recommended further study beforediffusing biogas, and drew attention to the importance of comparing the useof a biogas plant for cooking with the use of an improved stove. If thefuel efficient "Lorena" stove could reduce firewood collection time to onehour per day, use of biogas for cooking was not as profitable to thehousehold as use of the stove.
- 86 -
Tarrant (1977) undertook a comprehensive evaluation of the use ofa community plant for generation of electricity in Debarek, Ethiopia. Heconcluded, using three different measures of social worth, that the projectwas viable at current oil prices (the fuel used to value biogas), but thatthe project was not financially viable. However, the detailed figuresprovided on financial and social costs and benefits suggest that a subsidyto cover the financial deficit would still leave the project sociallyviable. He concluded that more detailed field evidence was required onthree critical parameters: electricity demand projections, slurry transportcosts, and the value of dung, to firm up the estimates presented.
Industrial and Comercial Feedlots
Developed countries using anaerobic digestion to treat industrialwastes include Israel, the United States, the Federal Republic of Germanyand the Netherlands. In developing countries only a few large scale unitsare known to exist, although some laboratory work has been carried out inIndia, Brazil and China. The largest number are in China, and Stuckey(1982) obtained some tentative economic data during a recent study tour.The best documented case involved a distillery in Louzi County (130 kilo-meters from Chengdu, Sichuan Province), which treated 130 cubic meters perday of stillage with a 2,000 cubic meter thermophilic digester. The gasproduced (3,000 cubic meters per day) was used to cook meals for 200workers, fuel a boiler, run a bus and truck (using compressed gas), andgenerate electricity. The total capital cost of the digester and ancillaryequipment was Y188,000, and it was estimated that savings in coal (700 tonsper annum) and electricity (500,000 kilowatt hours) amounted to Y82,800per year. The estimated payback period was less than three years.
Another unit (100 cubic meters) was installed in a leathertannery in Jiading County (20 kilometers from Shanghai) to treat the sludgegenerated, produce energy, and reduce the amount of solids to dispose of.The approximate capital cost of the unit was Y60,000. However, the annualsavings in energy and reduced sludge disposal costs are unknown.
Because of a lack of field data, no conclusions can be drawnabout the economic viability of biogas in industrial applications; however,a number of important points can be made. First, since industries generatelarger volumes of liquid and solid wastes than families and small villages,there are often substantial costs involved in handling and disposing ofthese wastes. However, if a biogas unit is installed, these disposal costscan be reduced, and the resulting savings can be used to offset the cost ofthe plant.
Second, since many industrial wastes are soluble and quite bio-degradable, efficient new techniques such as the filter, ABR and UASB canbe used to treat the waste at low capital costs per unit volume. Inaddition, economies of scale should also reduce the capital input per unitvolume of waste treated.
Third, the biogas produced from treating industrial wastesanaerobically is a valuable commercial fuel, and can substitute for many of
- 87 -
the fossil fuels currently being used in industries in developingcountries.
Fourth, use of the effluent (liquid and solids) from a biogasplant led to a large number of income generating activities, includingselling the slurry as a fertilizer/soil conditioner; raising fish or ducks;growing mushrooms or other crops; and drying the effluent to sell as a feedadditive for animals. These uses may lead to an integrated resourcerecovery operation which could result in a net cash income,
Finally, factors which normally inhibit the adoption of biogas atthe family or community level, such as lack of capital and technicalexpertise, would not normally present a problem for industrial biogasplants. ' Diffusion need only be limited by the financial viability of thebiogas unit.
Experience in the use of anaerobic digestion to treat the manuregenerated in commercial feedlots in developing countries is also limited,although the one case of Maya Farms in the Philippines has been reasonablywell documented.
Maya Farms is one of the pioneers of large scale biogasapplications in the developing countries, and the technology forms anintegral part of an intensive animal rearing farm located withinMetropolitan Manila. Manure from 22,000 pigs is fed into a variety ofbatch and continuously fed digesters which produce a total of 66,000 cubicfeet of biogas per day. The gas produced is used directly as a fuel in theprocessing plants, or substitutes for gasoline in a number of engines whichdrive a variety of equipment and machinery. In addition, some of the gasis used in motors to generate electricity which is used on site.
The slurry is separated into two fractions, liquid and solid, andthe liquid is used to fertilize crops and feed fish ponds, while the solidsare refed to pigs, cattle and ducks. These solids supply around 10 to 15%of the total feed requirements of the pigs and cattle, and 50% of the feedfor the ducks.
Based on actual operating data from Maya Farms, Judan (1981)estimated the benefits from small (4 sows), medium (48 sows), and large(500 sows) farms using biogas units in the Philippines. In his analysis hecalculated benefits in terms of savings on inputs of fuel, feed andfertilizer that would have been necessary in the absence of the biogasunit. For the small farm, 27% of the benefits came from fuel savings, 54%from animal feed savings, and 19% from the fertilizer saved. In the mediumfarm, the respective savings were 36, 52 and 12%, while in the large onethey were 21, 79 and 0%, since no crops were fertilized. The mostimportant benefit is derived from refeeding the slurry solids to the pigs.
These results are qualitatively consistent with Israeliexperience in which feeding a 12% solids slurry from thermophilic digestionof dairy manures to fish ponds or beef feedlots provided most of thebenefits (Marchaim, 1982).
- 88 -
Judan provides a summary statement of the investment andoperating expenses of Maya Farms, and estimated payback periods of 39months (small), 21 months (medium), and 30 months (large). This studyprovides a strong economic case for the development of integrated systemsthat efficiently utilize all the outputs from a biogas unit by substitutingfor purchased farm inputs. However, since this conclusion rests on thebenefits accruing from refeeding the sludge solids to animals, cautionshould be exercised as there is still some controversy about the effects ofrefeeding. A recent review by Ward (1982) states that "most recent testshave indicated that the digester residues have a negative effect on thetotal digestable nutrients and metabolizable energy in the mixed feeds.Decreased (animal weight) gains of up to 20% per kg of feed consumed havebeen noted. Thus the cattle would have to be fed more and held longer toobtain equal final conditions with cattle not fed the effluent." This mayoffset any potential savings from refeeding with digester effluent.
One study evaluated experience with anaerobic digestion inindustrialized countries with particular reference to its transferabilityto developing countries. Marchaim et al. (1981) describe a conceptual 200cubic meter thermophilic digester system in Israel being fed cattle manure(15 to 18% total solids), where the biogas was used for heating and powergeneration, and the slurry to fertilize crops, feed fish, cultivatemushrooms, and as a partial feed for sheep and calves. Their positiveeconomic analysis also depended on the income generated from the slurry inthe form of feed. When no income was available from the slurry, the "breakeven" point (i.e., when the net present value of the whole operation iszero) occurred when the price of gasoline was US$1.22 per gallon. If allthe slurry were sold as feed, then the plant would be economically viableat any gasoline price above US$0.23 per gallon. They claimed this analysiswould be valid in similar situations in developing countries, e.g., avillage cooperative in Gujarat, India; however, this claim should beregarded with some caution since the technology used (thermophilic,continuous mixing, high loading rates) is quite sophisticated, and maycause problems in developing countries.
PROBLEKS IN MEASUREMENT AND VALUATION
Inputs (Costs)
Construction
Plant costs have been specified in some detail by KVIC for thefull range of sizes of the only design promoted on a large scale in India.Shadow prices have also been calculated by French (1979), Bhatia (1977) andBhavani (1976) by valuing labor at a zero shadow wage, and steel and cement(40% of initial costs) with a 20% premium over market prices to reflecttheir real resource costs. It is this treatment of labor that is the mostproblematic. The total (KVIC estimated) construction costs of a plant arevery high (Rs2332 for 2 cubic meters at 1975 market prices), and proponentsof biogas plants reduce these costs in economic analyses by presuming thatland for the site and labor used in construction have no opportunity cost.Except in the most densely settled villages, land can be treated at no cost
- 89 -
since the quantities involved are so small. However, the assumption of azero shadow wage of labor will be valid only when labor is completely idlebecause of the lack of work opportunities, not through choice. Lal (1974),in a detailed discussion of this issue, estimated for each Indian Statenon-zero shadow wage rates for both skilled and unskilled labor. It isunlikely that a shadow wage for unskilled labor of 70 to 80% of the marketwage is typically correct, though it can be greater than 100% in the peakseason.
Evidence on adoption behavior suggests that in practice thefinancial cost of construction materials in relation to farm cash incomesis the most important factor. To make these costs manageable, KVI[C hasorganized large subsidies (varying between RslOOO and Rs1950 for the 3cubic meter plant) to farmers who have the collateral (five animals is acommon figure). Since no farmer purchases a plant without a loan, it meansin effect that at current construction costs they are only accessible tofarmers who can provide this collateral. The one thing that practicallyall analysts agree upon is the urgent need to reduce costs if the programis going to have any opportunity to involve poorer households. The Indiandesign using steel gasholders has a higher initial capital cost than theChinese designs: mainland or Taiwanese. Optimization of the design withrespect to relative material costs, or substitution by one of thesealternative designs, would result in cost reduction, and provide thepossibility for more widespread adoption.
Organic Feedstocks
In India these consist primarily of cow dung. The correct socialopportunity cost of dung is its value in the best alternative use, which isusually assumed to be as fertilizer. This simplifies the analysis becausefertilizer is both an input and output of the system. Bhatia, for example,used a zero net social opportunity cost (what he calls the economic" cost)because the costs and benefits largely offset each other, and only regardedany increments to fertilizer value as a benefit.
Bhavani (1976) introduced an extra stage in the process by givinga composite estimate based on two opportunity costs of dung: for fuel andfor fertilizer. Her opportunity cost thus takes account of dung previouslyused as fuel and as fertilizer. She has taken their replacement costsusing a calorifically equivalent amount of coal, and an NPK equivalentamount of imported fertilizer. These "efficiency or real resource costs"make dung in fertilizer use 2.6 times more expensive than dung in fueluse. In her social cost-benefit analysis, her three reference situations(with their benefit-cost ratios) were:
a. all dung used as fuel (1.898);
b. all dung used as manure (1.234); and
c. dung used one-third as fuel and two-thirds as manure (1.4556).
- 90 -
She concluded that "it is obvious that the whole economics of biogas plantsdepend on the proportion of cow dung which is used as fertiliser before theintroduction of biogas plants," since the more dung was burned previously,the better the economics of the biogas plant become. Strictly speaking,the derivation of shadow prices requires that a scarce resource be giventhe value of its next best alternative use, so for Bhavani the technicallycorrect approach (given her data) would be to value dung at importedfertilizer prices.
For financial analysis, one should use the price of dung asfertilizer and as cakes in proportion to those two uses of dung previously,since this is the true replacement cost to the farmer. In most analyses,e.g., Parikh's and KVIC's, this has meant that, unlike Bhavani's analysis,where dung was burned the financial returns to the farmer from biogas arelower than when it was composted. This is because the price of dung ascake for fuel is higher than dung as manure. For example, for dung inputsfor a 3 cubic meter plant the KVIC annual values (Sathianathan, 1975) areRs338 for fuel, and Rs165 for manure. The correct cost in a financialanalysis for most farm households may in fact only be an imputed value offamily labor time involved in collection of dung, rather than the marketvalue of dung either in the form of cakes or manure, since these marketvalues are never actually received except by larger farmers. Thisassumption does not improve the economics of biogas plants, rather thereverse, for it means that the replacement costs of the biogas plant outputshould be valued in the same way as the dung input. In practice, mostIndian farm households are not able to afford the investment anyway, andfor the few that can the assumption of a market value for dung isreasonable.
Labor Time Involved in Collection of Organic Materials and Water, DigesterOperation and Maintenance
Since it is usually assumed that an equal amount of labor isrequired to collect dung for traditional uses (fuel or manure) as for thebiogas plant, frequently no extra value is assigned in financial analysisfor labor costs of dung collection. With the larger farmers who havebiogas plants, cow dung is often collected only from the farmyard, and itis more convenient to aggregate this labor requirement with other laboruses. A constant water supply is a requirement which often restrictspossible plant locations since many villages do not have adequate yearround supplies. The other main tasks are mixing water and dung, feedingthe plant, stirring, and spreading an equivalent amount of slurry from theplant onto the compost pit. In total these tasks have been variouslyestimated to require 7 to 10 minutes per cubic foot of plant capacity, 35minutes per 100 cubic feet, 4 hours per 100 cubic feet, one hour per 60cubic feet (Berger, 1976 for Nepal) and the time it takes to smoke acigarette (for China, van Buren, 1979). Except at harvest time, or insmall or poor families, it is unlikely that the small quantities of laborused have a significant opportunity cost. Often rich farm households,where the family members do not have to contribute physical labor, willhave permanent farm servants who are not fully employed. In a social
- 91 -
cost-benefit analysis, the labor to run the plant is more plausibly valuedat zero in contrast to the labor used in construction.
Maintenance
Poor maintenance has been said to be the single most importantcause of plant failure in the KVIC design, particularly the failure topaint the gas holder to avoid corrosion. The KVIC estimates of parts lifehave generally been overoptimistic and highly variable. Assumptions onplant life vary between 15 and 40 years. Depending on the discount rate, alife of more than 25 years has little impact upon benefit-cost ratios.According to a survey by Moulik et al. (1978), the major item of expensewas the gas holder. Maintenance costs averaged Rs470 per year (beforediscounting) during the first eight years of operation of a 100 cubic feetplant, and increased by nearly Rs1500 when replacement of the holder becamenecessary. Since there is little substantive data available, KVICestimates are generally adopted. Its estimate of Rs180 (Rs5O painting costand Rs130 depreciation) is much lower than Moulik et al.'s (1978). In thestudies by Parikh and Bhatia, even lower values were used.
Extension
An often neglected major input which should be incorporated, intoa social cost-benefit analysis is extension. Survey evidence suggests thataccess to technical assistance is a major determinant of plant performance,and yet social benefit-cost studies rarely consider this as a cost item.Program extension services are not social overhead capital, bul: areintegral to the satisfactory performance of individual plants. They shouldappear as a cost item at least to the extent that literature, training pro-grams and village level workers are involved. There is mounting evidencethat the economics of plants, once constructed, are closely tied to theavailability of extension services (Moulik et al., 1978; van Buren, 1979).
Outputs (Benefits)
As discussed in Chapter 2, the primary outputs of an anaerobicdigester are biogas and slurry, which can be put to a variety of end uses.Depending on the quantity and quality of each, the type of fuel or otherproduct considered relevant when discussing replacement costs and the enduse, both economic and financial values can vary widely.
CONCLUSIONS
There is a dearth of substantive data on which to evaluate theeconomic viability of biogas in developing countries. This is particularlyacute in the area of industrial and commercial feedlot applications, butless so with household and community level applications. However, in thelatter two cases most of the data come from India, and are derived fromtheoretical design figures using the floating cover design with cattle dungas the primary feedstock. With such a narrow data base few, if any, con-clusions can be drawn about the viability of biogas under other circumstan-
- 92 -
ces, for example, using different designs and feeds in different social andenvironmental milieus, and in varying areas of application.
In addition to a lack of substantive data, existing economicevaluations suffer from the lack of an agreement upon methodology. Commonproblem areas include: lack of data on the effect of technical parameterson plant performance; valuation of inputs; valuation of biogas in relationto substitutable fuels and end uses; valuation of slurry with regard to itsuse as a fertilizer/soil conditioner and animals feed; marginal utility ofoutput; and valuation of secondary benei-its. A consensus on methodologyshould be developed to allow economic data to be compared among variousapplications, under varying circumstances, and to enable rigorous economiccomparisons between biogas and other renewable energy technologies, or withconventional energy sources.
The financial viability of biogas plants depends on whetheroutputs in the form of gas and slurry can substitute for fuels, fertilizersor feeds which were previously purchased with money. If so, the resultingcash savings can be used to repay the capital and maintenance costs, andthe plant has a good chance of being financially viable. However, if theoutputs do not generate a cash inflow, or reduce cash outflow, then plantslose financial viability. Finally, if broader social criteria such as SCBAare used to evaluate biogas, conclusions will be more favorable than astrictly financial analysis.
Household biogas units may not be universally financially viablein some countries such as India; in other countries, such as China, theywill be viable due to cash savings in fuels and fertilizers. Socialviability is difficult to evaluate because of problems in valuing secondarybenefits.
The financial viability of community scale plants is limited byconsiderations similar to those for household units, although economies ofscale will tend to make them a better prospect financially. However, itappears that the primary barriers to diffusion are not economic ortechnical, but rather social and organizational. Since the benefits from acommunity plant can be shared by poorer households that would not be ableto afford the investment and operating cost of household units, communityplants may be more socially viable than the smaller units.
The financial viability of biogas units in industry andcommercial feedlots appears promising, although more data are needed on thecash benefits from animal refeeding and integrated resource recoveryschemes.
- 93 -
CHAPTER EIGHT
A SURVEY OF BIOGAS PROGRAMS IN DEVELOPING COUNTRIES
The following survey, while not exhaustive, is representative.
NORTHERN AFRICA
There are not many biogas programs in this region. Thosecountries working with biogas are, in order of decreasing commitment:Egypt, Sudan, Burkina Faso, Algeria, Cameroon, Mali, Senegal, Liberia andTunisia (El-Halwagi, 1982).
In Egypt three organizations are working with biogas; theNational Research Centre (NRC--Dr. M. M. El-Halwagi) in Dokki, Cairo; theAgricultural Research Centre (ARC--Dr. M. N. Alaa El-Din) at Giza; and theFaculty of Agriculture at Fayoum.
NRC has engineers, microbiologists, parasitologists and ruralsociologists, and is partly financed by the United States Agency forInternational Development (USAID). It has three experimental fixed andfloating cover digesters of eight to ten cubic meters at its laboratory,and has installed two fixed and three floating cover digesters in selectedvillages. Its primary goal is to provide gas for cooking and lighting.Several large demonstration units to be used to generate electricity forcattle raising and poultry rearing properties are also planned.
NRC is also negotiating with the National Organization forResconstruction and Development of Egyptian Villages (ORDEV) to construct1,000 demonstration units in 15 governorates with partial funding fromUSAID. This three year plan includes the establishment of a biogastraining center at the NRC to train engineers, technicians and skilledlabor to build 50 units the first year, under direct NRC supervision. Overthe next two years it plans to construct, operate and follow up on 950units with minimum NRC involvement (El-Halwagi, 1982).
Laboratory and field scale digester design, pathogen studies,fertilizer evaluation and sociological analysis are other NRC projects(El-Halwagi, 1979). Its approach has been to develop a technicalunderstanding of biogas before going further. It is proceeding withlimited implementation in both traditional and planned villages chosen bysociological fieldwork, and is monitoring these units to ensure they areboth technically and socially successful. NRC considers itself a center ofknowledge rather than an implementing agency.
ARC is partly funded by FAO, and primarily employs agronomists.Its main focus is family sized digesters to provide gas for cooking andlighting. Thirteen units have been installed to date, mostly eight to ten
- 94 -
cubic meter fixed dome or floating cover designs. There is one 150 cubicmeter bag digester on a chicken farm, and there are current plans foranother 24 units, primarily for cattle and poultry manure (Alaa El-Din etal., 1982).
ARC has publicized biogas through newspapers, radio, TV and slideshows in villages. It also cooperates at the national level with otherinstitutes (Alaa El-Din et al., 1982). It has been working on thedigestibility of various agricultural residues and municipal wastes, thefertilizer effect of the slurry and the health effects of the effluent. Ingeneral ARC has been fairly active in promoting biogas technology, and hasinstalled more units than NRC.
At the national level Egypt has a coordinating committee compris-ed of representatives from the governmenl: and various research institutes.Development of a cohesive national policy is pending (El-Halwagi--personalcommunication, 1982).
Other Countries
The Sudan conducted a joint project with the German Agency forTechnical Cooperation (GTZ) on water hyacinth utilization from 1976 to1981. Three designs were tested: floating cover, fixed dome and bag. Thelast design was found to be the best for both gas production andconstruction. The project terminated for lack of technical infrastructure,support, and public awareness. The Sudlanese are now building technicalexpertise in their universities and research institutes.
In Burkina Faso the Inter-African Committee on Hydraulic Studies(CIEH) and the Institute for Tropical Agronomic Research (IRAT) arecarrying out a joint study on batch fermentation of agricultural residuesand cattle manure to produce fertilizer and biogas for irrigation pumps andmotors (Thery, 1977). To date about 14 two to four cubic meter units havebeen built (Sola, 1979).
Algeria started work on biogas in 1938, and by 1956 theAgricultural Institute of Algeria was operating eight digesters with atotal capacity of 300 cubic meters, using cattle manure. Recently (ECWA,1981) the Ministry of Energy has expressed interest in reactivating thiswork.
Other programs in the region include a GTZ project in Cameroon, aUSAID demonstration project in Mali, and a future pilot project underthe United Nations Environmental Programme (UNEP) rural energy scheme inSenegal.
SUB-SAHARAN AFRICA
In general the extension of biogas technology in Sub-SaharanAfrica is constrained by limited available resources. Nationalcoordination has not yet been developed. Implementation often outstripstechnical research and development and follow up is inadequate, resulting
- 95 -
in many failures. There is a general need to develop indigenous technicalexpertise along with stronger national institutions before wide scaleimplementation is attempted.
Interest in biogas appears high. Some 400 units have been builtin three countries, Kenya, Tanzania and Ethiopia.
Kenya
Kenya has between 150 and 200 units (Ward, 1981; King, 1978).Most research and development is being done by the Department ofAgricultural Engineering, University of Nairobi (R. P. King), EgertonCollege (P. A. M. Misiko), and the Tunnel Co., Ltd. (T. Hutchinson). Aloosely coordinated national committee of government and universityrepresentatives under the Department of Energy is responsible fordissemination of information on biogas.
Tanzania
Lyamchai and Mushi (1982) estimated that 120 digesters had beeninstalled in Tanzania by 1979, but 40% of them were no longer functioning.The primary design used was the mild steel floating cover, but problemswere experienced with corrosion. A cheaper alternative design has beendeveloped by the Arusha Appropriate Technology Group (AATG) using sevenmetal drums lashed together with wire. Some of the cost savings are offsetby gas leaks around the floating drums.
Information dissemination is carried out by the Small IndustriesDevelopment Organization (SIDO) and consists of showing demonstrationplants to interested people. Pamphlets have been printed in Kiswahilidescribing plant size and giving construction details (Lyamchai and Mushi,1982).
Ethiopia
Ethiopia is reported to have about 100 digesters, but few detailsare available. Megerson (1980) reported that the floating cover type isthe most widely used, and that efforts have been concentrated on reducingthe capital cost of digesters and manufacturing methane burning lamps andstoves from local materials.
LATIN AMERICA
[The following section is a summary of a short term stucly ofbiogas in Latin America commissioned by IRCWD (Umana, 1982).]
Although Brazil has managed to organize and implement a verysuccessful biogas program, the remaining Latin American countries do notappear to have coherent national policies on biogas. Six countries,Mexico, Venezuela, Ecuador, Peru, Trinidad and Tobago, and Bolivia, whichare net oil exporters, and Colombia, which produces some of its ownpetroleum needs, have limited incentive for developing renewable energy
- 96 -
sources. An interregional organization, the Latin American EnergyCommission (OLADE) attempted to promote biogas in Bolivia, Guyana, Haiti,Honduras, Jamaica and Nicaragua. Ten digesters of varying designsincluding batch, plug flow and fixed dome were to be built in eachcountry. Only 50 digesters were built in two years, about half of whichare reported to be working satisfactorily, at a cost of $800,000. Whilethe program helped to make people aware of the new technology, additionaldevelopment of administrative and technical infrastructures is needed.
Brazil
Brazil's program is only a few years old, but is verysuccessful. During the period 1980-81, 1,600 digesters were built. Theestimated total number of digesters in Brazil in 1982 was 2,300.
This national program was established in 1979, with the BrazilianEnterprise for Technical Assistance and Rural Extention (EMBRAPA) playingthe lead role. EMBRAPA employs 25 State Biogas Managers located in thedifferent states. State Managers operate through approximately 30,000agricultural extension officers who are attached to the State Enterprisefor Agricultural Extension (EMATER).
The Ministry of Agriculture has established a biomass unit tooversee all agroenergy programs; the unit coordinates policy with theMinistry of Mines and Energy, which is ultimately in charge of nationalenergy policy. In addition to this government network, the BrazilianEnterprise for Agricultural Research (EMBRATER) and other institutes anduniversities carry out basic research in anaerobic digestion. The NationalCouncil for Technological Research (CNPQ) presently supports 110 researchprojects.
Adaptation and development of b-iogas focusses on small and mediumscale farmers who want to modernize their life and become integrated withthe mainstream of industrial society. The program emphasizes uses of gasother than cooking, including motors, pumps, refrigerators, electricity forradio and TV, etc. An effective educational campaign has been devised toreach the small scale farmer with simple cartoonlike publications and radioand TV programs. A recent national TV program generated 2,000 letters toEMBRAPA requesting more information and construction plans. EMPBRATER hasheld 128 courses to train approximately 2,000 technicians. A number ofconferences and seminars have been held to exchange information betweenresearchers and implementers.
The floating cover and fixed dome designs predominate, but twoindigenously developed models, the Marinha and Macroenergetica, arebecoming popular. The floating cover design has an average volume of 11.4cubic meters, costs a reported $55 to $85 per cubic meter and representsover 70% of the existing units. The fixed dome model is smaller, 8.4 cubicmeters, but considerably cheaper at $25 to $45 per cubic meter, andrepresents about 14% of the existing units. Due to its cost the fixed domedesign is preferred for domestic applications, but the floating coverdesign is favored for its simple construction and controllable gas
- 97 -
pressure. A large capital goods industry has sprung up to manufactureequipment to use the gas.
This program is well planned by a strong national organization,with good technical input and an integrated implementation program. Inaddition, the financial side has been well covered with approximately threemillion dollars available through EMBRATER to finance construction. Sincethe program has only been operating for a short time there has been littlechance for substantial feedback, but continued gains in biogas technologycan be anticipated.
Central America
Central America has approximately 110 digesters. There is activeexperimentation on the floating cover, fixed dome, a Guatemalan model, andtwo PVC plug flow digesters. The plug flow design is reported to costabout $30 per cubic meter, and units of 5 to 50 cubic meters have beenbuilt, but the lifetime and operational characteristics of this model havenot yet been sufficiently tested. Research and development are beingcarried out at the Meso-American Centre for Studies of AppropriateTechnology (CEMAT) in Guatemala, and at the Technological Institute (ITCR)and University of Costa Rica. Most support has come from bilateral aidorganizations, USAID and the International Development Research Centre(IDRC) or regional programs (ICAITI, OLADE).
Mexico
There are an estimated 150 digesters in Mexico, mostly developedby research institutes such as the Instituto de Investigaciones Electricas(IIE) of Cuernavaca, and the Fundacion Ecodesarrollo Xochicalli (FEXAC).Due to plentiful petroleum reserves, national interest in biogas is limitedto digesters used mainly for sanitation rather than energy.
Andean Countries
In the Andean region there is also little interest in digestiondue to fossil fuel production. Some research is being done by the CentralUniversity and CADAFE in Venezuela, "Las Gaviotas" and the University ofthe Andes in Colombia, INE and ESPOL in Ecuador, and INTINTEC and theTechnical University of Cajamarca in Peru. The last two institutes areworking on the utilization of digester slurry as fertilizer on vegetables.There are approximately 120 digesters in this region.
South Oriental Countries
The South Oriental region, Argentina, Uruguay and Paraguay, hasthe least development in Latin America, due to the availability of cheapfossil fuels (mainly gas), and the large urban populations thatcharacterize the region. Only 20 digesters are known to exist. However,there are a number of groups in Argentina which are carrying out bisicresearch including the Instituto Nacional de Tecnologia Apropriada (INTA),CEFOBI at the University of Rosario, and PROIMI at the University of
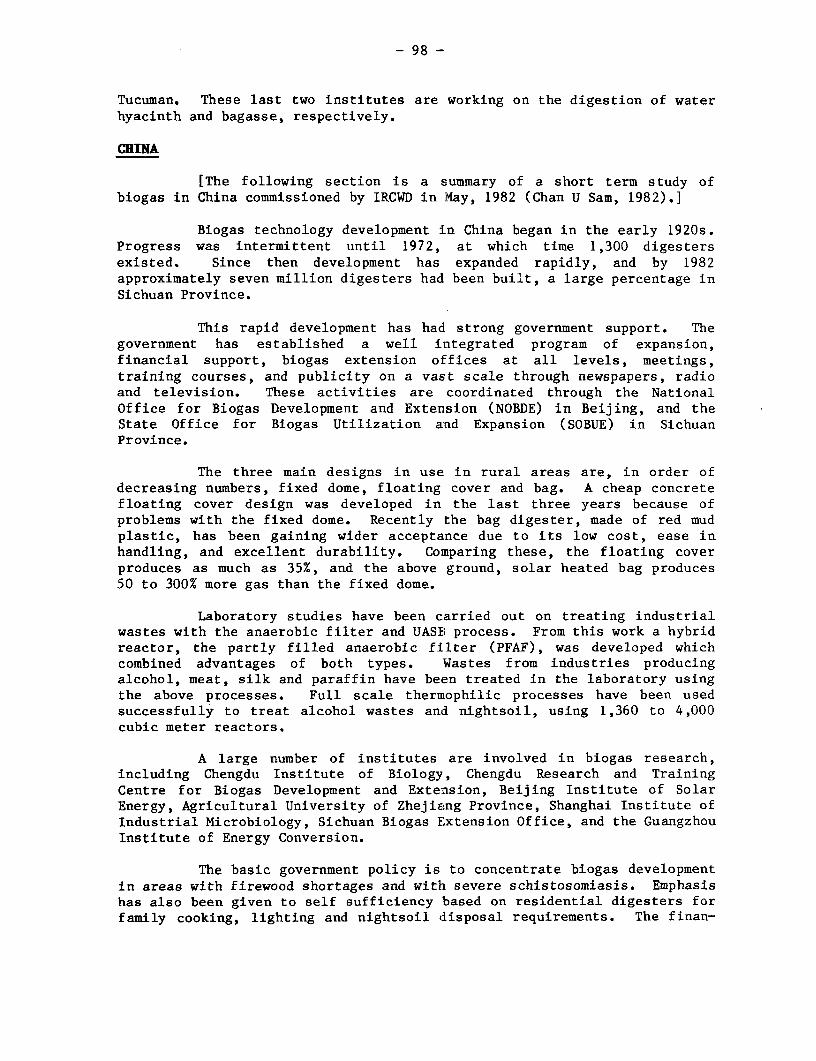
- 98 -
Tucuman. These last two institutes are working on the digestion of waterhyacinth and bagasse, respectively.
CHINA
[The following section is a summary of a short term study ofbiogas in China commissioned by IRCWD in May, 1982 (Chan U Sam, 1982).]
Biogas technology development in China began in the early 1920s.Progress was intermittent until 1972, at which time 1,300 digestersexisted. Since then development has expanded rapidly, and by 1982approximately seven million digesters had been built, a large percentage inSichuan Province.
This rapid development has had strong government support. Thegovernment has established a well integrated program of expansion,financial support, biogas extension offices at all levels, meetings,training courses, and publicity on a vast scale through newspapers, radioand television. These activities are coordinated through the NationalOffice for Biogas Development and Extension (NOBDE) in Beijing, and theState Office for Biogas Utilization and Expansion (SOBUE) in SichuanProvince.
The three main designs in use in rural areas are, in order ofdecreasing numbers, fixed dome, floating cover and bag. A cheap concretefloating cover design was developed in the last three years because ofproblems with the fixed dome. Recently the bag digester, made of red mudplastic, has been gaining wider acceptance due to its low cost, ease inhandling, and excellent durability. Comparing these, the floating coverproduces as much as 35%, and the above ground, solar heated bag produces50 to 300% more gas than the fixed dome.
Laboratory studies have been carried out on treating industrialwastes with the anaerobic filter and UASB process. From this work a hybridreactor, the partly filled anaerobic filter (PFAF), was developed whichcombined advantages of both types. Wastes from industries producingalcohol, meat, silk and paraffin have been treated in the laboratory usingthe above processes. Full scale thermophilic processes have been usedsuccessfully to treat alcohol wastes and nightsoil, using 1,360 to 4,000cubic meter reactors.
A large number of institutes are involved in biogas research,including Chengdu Institute of Biology, Chengdu Research and TrainingCentre for Biogas Development and Extension, Beijing Institute of SolarEnergy, Agricultural University of Zhejiang Province, Shanghai Institute ofIndustrial Microbiology, Sichuan Biogas E:xtension Office, and the GuangzhouInstitute of Energy Conversion.
The basic government policy is to concentrate biogas developmentin areas with firewood shortages and with severe schistosomiasis. Emphasishas also been given to self sufficiency based on residential digesters forfamily cooking, lighting and nightsoil disposal requirements. The finan-
- 99 -
cial capacity of the family unit, aided by subsidies from the collectiveand the state, is relied on for the financing of family digesters. Thesesubsidies vary from region to region. Families requiring further assis-tance receive additional subsidies or loans at 1.8% interest from theAgricultural Bank.
Over 400 small and large generators provide electricity fordomestic and industrial use, and small two-wheeled tractors powered bybiogas are quite common. Some large facilities generate enough gas to makeit economic to compress for use in trucks and buses. Attempts have evenbeen made to produce organic chemicals (CH2Cl2, CHCl3, carbon tetra-chloride) from the biogas. However, after some initial enthusiasm in theearly 1970s, interest waned due to the complexity of the process, highcapital investment, and its unprofitable nature.
In order to disseminate information on biogas to technologists,provincial and local officials, a comprehensive institutional infrastruc-ture has been established under the State Leading Group on Biogas Construc-tion, comprised of representatives from various departments of the StateCouncil. The executive iLnstitution SOBUE holds annual meetings for direc-tors and staffs of biogas implementation agencies and research institutjionsto discuss projects and coordinate activies in biogas. Meetings of techni-cal panels on fermentation, digester construction, biogas utilization,digested slurry utilization and sanitation are also held once a year.
Significant research is appraised by experts to determine whereit should be widely publicized. These appraisal conferences also provideopportunities to exchange detailed research experiences. In addition,meetings for directors of biogas offices in major provinces and cities areheld every year to exchange experiences, discuss approaches to problemsolving, and to develop programs for further research.
A great deal of effort has been expended in training biogastechnicians. Government financed training courses, taking from 15 to 30days, teach basic biogas theory. Several digesters are built during thecourse. Two or three people from an area are trained, then they return totheir villages and train others.
During the 1970s, emphasis was directed to local adaptation andimplementation of biogas generation. A large number of digesters werebuilt. China's biogas program now promotes standardized designs in whichpromising ones like the bag digester are implemented. At the nationallevel, problems and research advances are continually evaluated and fedback into the implementation program. In summary, China's program issophisticated and integrates research and development, implementation,financing and extension within a cohesive national biogas policy.
SOUTEKAST ASIA
Most biogas activity in Southeast Asia is in the Republic ofKorea; the Philippines; Taiwan, China; and Thailand, with by far thegreatest number of digesters in Korea.
- 100 --
Federal Republic of Korea
In 1969 the government, through its Office of Rural Development(ORD), began a large scale implementation of biogas. By 1975 about 29,000household units had been installed (Park and Park, 1981). The basic designconsisted of a concrete lined cylinder with a wooden floating cover linedwith plastic. In 1976, due to problems with cold weather operation, thegovernment changed the emphasis from small digesters to village scale unitswith both heating and mixing. This was accomplished with a "bubble gun"mixer. Park et al. (1979) showed that in winter only 32% of the gasproduction was required for heating, and when solar collectors were usedthis dropped to only 16% (Park and Park, 1981). The present status ofvillage scale implementation is not known.
Most research is done by the ORD. However, the Institute ofAgricultural Engineering is experimenting with PVC bag and concrete fixeddome digesters (FAO, 1981), and the College of Agriculture at Suweon isworking on a two stage digester of reinforced plastic insulated with paddyhusk.
Philippines
In the Philippines, Maya Farns, an agroindustrial division ofLiberty Flour Mills, pioneered use of biogas technology in 1972. In 1979it was estimated that there were 240 digesters in the Philippines, of which73% were operating (Galano et al., n.d.).
In September 1976 the Philippines established a nonconventionalenergy program with biogas as one of its components (Terrado, 1981). Theprogram was primarily under the control of the Energy Development Board,which organized a regional and metropolitan program. Twelve demonstrationdigesters were built by technicians trained by Maya Farms personnel, onstate farms owned by the Bureau of Animal Industry. Progress wasconstrained by lack of resources for adequate organization and maintenance.
Research is being conducted on optimum conditions for gasgeneration, rates of loading, dilution, mixing and retention, andvariations in temperature by the National Institute of Science andTechnology (NOST), the University of the Philippines at Los Banos, theCentral Luzon State University, and Maya Farms.
Thailand
Biogas technology was introduced into Thailand in 1960 by theDepartment of Health in order to hygenically dispose of animal wastes.After the energy crisis in 1973 biogas became a major subject of interestfor a number of government agencies and the public. In 1981 there wereapproximately 300 digesters in Thailand (FAO, 1981), mostly five cubicmeter floating cover design, but Ratasuk et al. (1979) reported that 61%had fallen into disuse.
- 101 -
Gas is used for cooking and lighting. Some research has beencarried out utilizing 1.5 cubic meter concrete water jars as digesters, andpreliminary studies have been undertaken on fixed dome designs. The maininstitutes carrying out research are the Applied Scientific ResearchCorporation and the Asian Institute of Technology (AIT).
Taiwan, China
Taiwan has been involved in biogas since the mid 1970s. The bagdigester made of red mud plastic was one of its major innovations. Theprimary digester feed in Taiwan is swine manure, and work has been carriedout to grow algae for animal feed using the digester effluent. The numberof digesters in Taiwan is estimated at over one thousand.
INDIAN SUBCONTINENT
This region is comprised of the following countries: India,Nepal, Sri Lanka, Pakistan and Bangladesh. There is substantialdocumentation on biogas, especially in India.
India
At this time there are approximately 100,000 digesters in India,very unevenly distributed among the states as each government placesdifferent emphasis on biogas (Moulik, 1982). Many of these have becomeinoperative because of limited resources for extension and support. Theprimary focus of the Indian program is to provide fuel for cooking andlighting in rural domestic situations, mainly using eight to ten cubicmeter floating cover digesters. In recent years, in order to reduce thecapital cost of units, a lot of work has been done on the fixed dome Janata(Public) digester. Singh and Singh (1978) claimed that installation costscould be reduced by changing to the Janata design. Other designs such asthe bag and plug flow do not appear to have penetrated into India at all.Besides cooking and lighting, biogas has also been used quite extensivelyfor pumping and power generation.
In 1975 an All-India Coordinated Biogas program was initiated bythe Department of Science and Technology involving the following researchinstitutes already working on some aspect of this technology: (1) theKhadi and Villages Industries Commission (KVIC), (2) the Indian Council onAgricultural Research Institute (ICAR), (3) the Planning Research andAction Division (PRAD) of the government of Uttar Pradesh, (4) theStructural Engineering Research Centre, (5) the Indian Institute ofManagement (IIM), (6) the National Environmental Engineering ResearchInstitute (NEERI), and (7) the Department of Physics, Lucknow University(TATA, 1981, 1982). In addition, the New Delhi and Bangalore campuses ofthe Indian Institute of Technology are carrying out research.
Previously information flowed through the All India Committee onBiogas in New Delhi. In 1983 the Department of New Energy Sources (DNES)was created to coordinate and improve implementation of biogas policies,research and development, demonstration, extention and construction of
- 102 -
household and community units throughoul: India. The new department and itsadvisory Commission for Additional Sources of Energy will eliminate earlierproblems of coordination and communicat"ion.
Nepal
In Nepal there are approximately 1,200 digesters operating,mostly floating cover, but a few fixed dome. In addition there are threecommunity scale plants. The biogas produced is used primarily for cookingand lighting, although in some cases it has been used to power irrigationpumps.
The primary research, development and implementation institutesin Nepal are the Development and Consulting Services (DCS) of the ButwalTechnical Institute, the Energy Research and Development Group (ERDG) inTribhuvan University, and the Gobar Gas Company, which is a private companyset up by DCS to commercialize biogas. DCS is very effective in publishingall the information it has available, which is circulated quite widely.
Sri Lanka
In Sri Lanka there were approximately 150 digesters in 1981,and it was estimated that by the end of that year there would be close to300 (Santerre, 1981). Of the digesters installed, approximately 45% werefloating cover designs, while the remainder were fixed dome. Most of thedigesters were family sized, and the gas produced was used for cooking andlighting. The primary institutes involved with biogas in Sri Lanka are theCeylon Electricity Board, and the Industrial Development Board.
Pakistan
The Appropriate Technology Development Organization (ATDO--1980)estimated that 60 units had been installed in Pakistan, and that 50 morewere under construction. Most of these were small, three to ten cubicmeters, and primarily for family cooking and lighting. The mainorganizations working with biogas are ATDO in Islamabad, and the EnergyResources Cell of the Ministry of PetroLeum and Natural Resources.
Bangladesh
Bangladesh has a few biogas units installed, mostly in researchinstitutes such as the Bangladesh Agricultural University and theBangladesh University of Engineering and Technology at Dacca.
- 103 -
A P P E N D I X I
FUNDAMENTAL CONSIDERATIONS IN ANAEROBIC DIGESTION
This Appendix augments Chapter 2, providing information on iJunda-mental aspects of anaerobic digestion. Included are microbiology andbiochemistry, environmental influences on the digestion process, biodegrad-ability, and kinetic modeling. Although these subjects are addressed to adepth which should be adequate for most readers, the numerous referencescited are sources of additional information.
MICROBIOLOGY AND BIOCHEMISTRY
The biological processes in anaerobic digestion are complex,natural phenomena which take place continuously throughout the world. Itis important to understand the reactions involved in order to constructfacilities which utilize to maximum benefit the forces of nature.
Catabolism
All living organisms require energy for cell maintenance andgrowth. In nonphotosynthetic organisms, this energy is derived from theoxidative degradation of substrate material such as carbohydrates or fattyacids. Degradation of complex organic compounds into simpler compoundswith release of energy is known as catabolism. The energy released duringoxidation of substrate is captured and stored in the cell in the form ofATP (adenosine triphosphate, the major energy storage compound in cells).To preserve electroneutrality, oxidation of the substrate must be accompa-nied by reduction of another compound, for example:
4CH3RCHOCOOH + 1102 --------> 12CO2 + 10H20 + energy (1)
lactic acid + oxygen ------- > diaoxid + water + energy
In this case, the acid is oxidized to carbon dioxide while oxygenis reduced (by transfer of hydrogen) to form water.
The main catabolic processes by which energy can be derived areclassified according to the type of compound which is reduced while thesubstrate is being oxidized. Respiration refers to a catabolic reaction inwhich an inorganic compound is reduced. The reaction shown above forlactic acid is an example of aerobic respiration in which oxygen is avail-able to the organism and is ultimately reduced to water. This allowscomplete conversion of the organic carbon to carbon dioxide and results inthe greatest possible release of energy from the substrate. In theabsence of oxygen, some organisms can undergo catabolism by reducinginorganics such as nitrate, sulfate or carbon dioxide to form nitrogen,hydrogen sulfide, or methane, respectively.
- 104 -
In the absence of inorganic oxidants, catabolism can proceed byconcomitant oxidation and reduction of the organic substrate itself. Thisprocess is termed fermentation, and is characterized by reduction of anorganic (rather than inorganic) compound, for example:
C6H1 2 0j6 -yets> 2CH3CH2 0H + 2C02 + energy
carbon (2)glucose -----> ethanol +dio id + energy
Here, two moles of carbon are oxidized to carbon dioxide whilefour moles of carbon are reduced to form ethanol. Since all the carbon inthe glucose molecule cannot be completely converted to carbon dioxide, muchof the energy available in the substrate compound remains untapped (i.e.,substantial energy still resides in the ethanol product). Hence, fermenta-tion reactions yield only a small amount of energy compared with aerobicrespiration. For example, a cell growing under anaerobic conditions mustdegrade about 20 times more glucose than a cell growing under aerobic con-ditions, in order to obtain an equal amount of energy. Because cell growthrequires energy, the growth rate of anaerobic organisms is very slow, andaerobes can easily out-compete anaerobes if oxygen is present.
The slow growth rate of anaerobic organisms has important impli-cations for anaerobic digesters. First, it requires that digesters bedesigned and operated to retain the organisms in the system for long enoughperiods to maintain the large bacterial population needed for efficientsubstrate utilization. Second, low cell yield means that anaerobic systemshave low requirements for nutrients (such as phosphorus and potassium) andproduce little excess cell mass.
Anaerobic Degradation of Complex SubstraLtes
The organics in digester feed materials such as manure or agri-cultural residues can be classified into three main components: carbohy-drates, proteinaceous compounds, and lipids (fats). The carbohydratesnormally occur in the form of complex lignocellulosic fibers, proteins arelarge molecules made up of amino acid (peptide) chains, and fats areglycerides mostly comprised of various straight-chain fatty acids. Thusdigester feedstocks are composed of very complex organic matter which mustbe solubilized and broken down into smaller compounds in order to beassimilated by cells.
The first step in this degradation is enzymatic hydrolysis whichoccurs in the substrate solution (outside of the cells) by the action ofexocellular enzymes produced by the cells. Hydrolysis results in formationof sugars from carbohydrates, amino acids from proteins, and fatty acidsfrom lipids, as well as other products. The smaller compounds thusproduced can be absorbed by the cells and undergo reactions to eitherderive energy or synthesize new cell material.
- 105 -
In the case of cellulose, three enzymes are utilized sequentiallyto degrade the carbohydrates to simple sugars such as glucose. Inside thecell, these sugars are degraded to pyruvate, a major intermediate productin cell metabolism from which numerous end products can be formed. Themain end products are C02, H2 and acetate. However, depending on cultureconditions such as pH, temperature and partial pressure of hydrogen,different reaction pathways are available which can also lead to formationof reduced compounds such as propionate, butyrate, and lactate.
Similarly, the amino acids obtained from hydrolysis of proteinsare degraded to form NH3, C02, acetate, formate, and propionate. Inorganicnitrogen compounds can also be degraded, with urea converted to ammonia andnitrate reduced to N2. The fatty acids formed from lipids are principallydegraded to acetate and molecular hydrogen (H2) end products, althoughreduced products such as propionate and butyrate can also result dependingon conditions.
Catabolism of complex substrates proceeds initially by hydrolysisfollowed by degradation to form a relatively small variety of end pro-ducts. These include C02, NH3, H2, formate, acetate, propionate, butyrate,lactate, succinate, and ethanol. This degree of catabolism is carried outby a certain group of organisms known as fermentative bacteria. Althoughthese end products still contain a substantial amount of energy which couldbe utilized for cell metabolism, fermentative bacteria are incapable oftheir further degradation. Further catabolism is carried out by othergroups of bacteria resulting in the ultimate end products of anaerobicdigestion, methane and carbon dioxide.
The Microbial Stages of Anaerobic Digestion
According to present theory, methane production in anaerobicsystems occurs in stages from the activity of three main groups ofbacteria: (1) fermentative (acid producing), (2) acetogenic (hydrogenproducing), and (3) methanogenic (methane producing) bacteria. Asdiscussed in the previous section, the fermentative bacteria are involvedin the hydrolysis and breakdown of complex substrates into simple endproducts such as C02, H2, and carboxylic acids. This occurs via two maincatabolic pathways. In simplified form these are:
substrate ----- > C02 + H2 + acetate (3)
substrate ----> propionate + butyrate + ethanol (4)
The products from the first pathway above can be utilizeddirectly by the third group of bacteria to produce methane. It hasrecently been discovered (Bryant et al., 1976), however, that reaction (3)is favored thermodynamically only at a low hydrogen partial pressure. Athigh hydrogen partial pressure the fermentative bacteria shift to altiernatecatabolic pathways (e.g., reaction 4) resulting in the formation of reducedorganic compounds such as propionate, butyrate and ethanol. This isillustrated in Figure I.1.
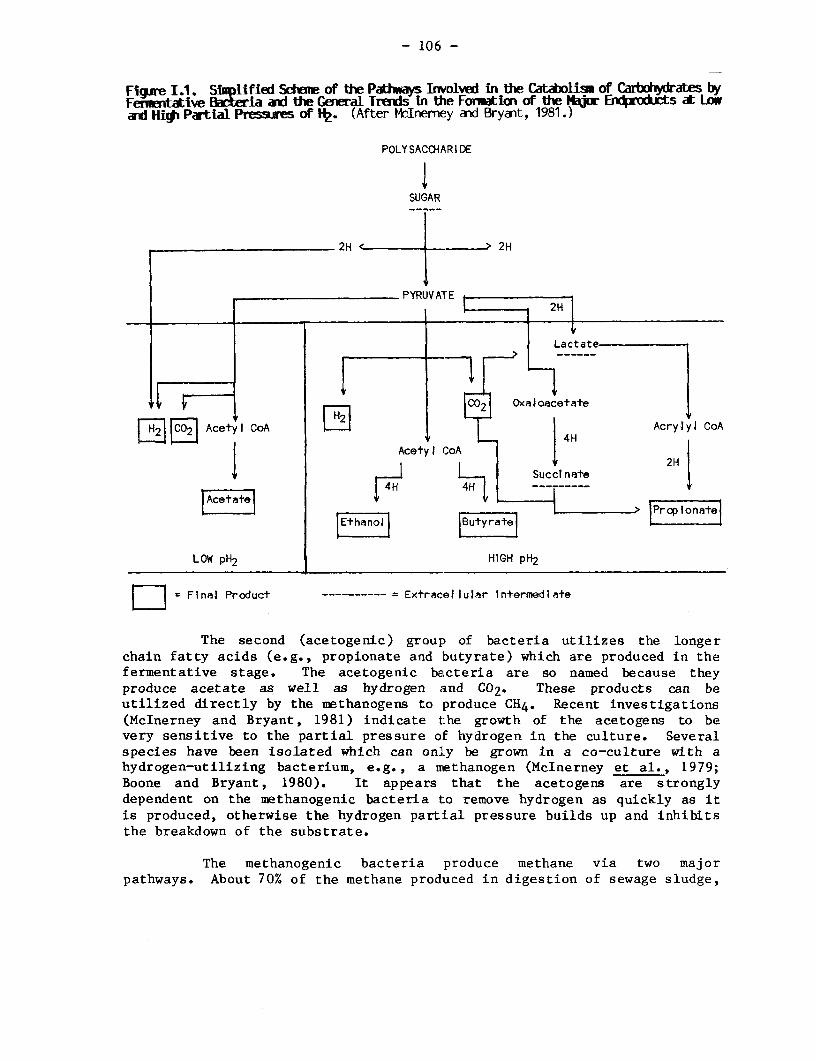
- 106 -
Figure 1.1. ShlIified Sduhe of the Patuways Involved in the Catabolism of Carbohydrates byFeniwetative Baeria ad the General Treds in tihe Fonation of the NMj EnxdprodLts dt Loaad Higi Patial Prsres of Hj. (After McInemey and Bryant, 1981.)
POLYSACCHARI DE
1SUGAR
2H > 2H
= ~~~~~~~PYRU VA1 E
1 [ ~~~~~~~~~~~~~~~La ct a te
2 C 2 Acetyl CoA AcryIyI CoA
AcetylI CoA
|~~~~~~~~ SuccPr lnate 2
LOW pH2 HIGH pH2
D = Final Product -- = Extracel lular Intermedalte
The second (acetogenic) group of bacteria utilizes the longerchain fatty acids (e.g., propionate and butyrate) which are produced in thefermentative stage. The acetogenic bacteria are so named because theyproduce acetate as well as hydrogen and C02. These products can beutilized directly by the methanogens to produce CH4. Recent investigations(McInerney and Bryant, 1981) indicate the growth of the acetogens to bevery sensitive to the partial pressure of hydrogen in the culture. Severalspecies have been isolated which can only be grown in a co-culture with ahydrogen-utilizing bacterium, e.g., a methanogen (McInerney et al., 1979;Boone and Bryant, 1980). It appears that the acetogens are stronglydependent on the methanogenic bacteria to remove hydrogen as quickly as itis produced, otherwise the hydrogen partial pressure builds up and inhibitsthe breakdown of the substrate.
The methanogenic bacteria produce methane via two majorpathways. About 70% of the methane produced in digestion of sewage sludge,
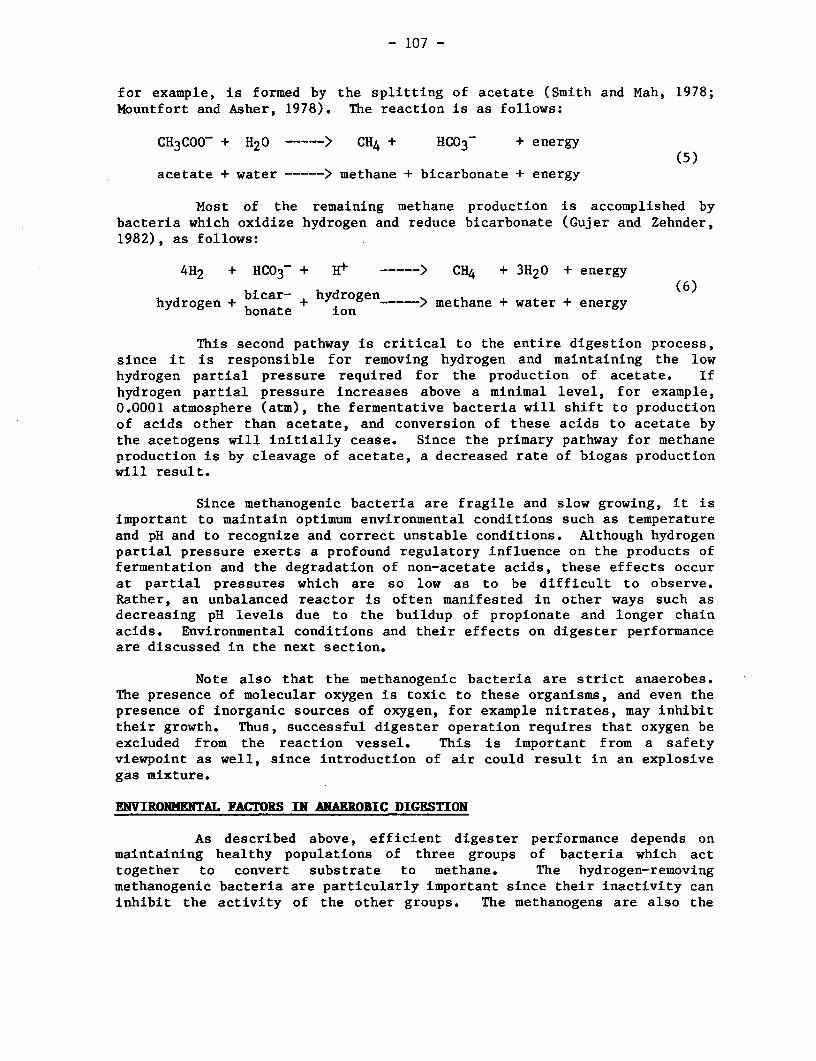
- 107 -
f or example, is formed by the splitting of acetate (Smith and Mah, 1978;Mountfort and Asher, 1978). The reaction is as follows:
CH3COO + H20 > CH4 + HC03- + energy(5)
acetate + water -----> methane + bicarbonate + energy
Most of the remaining methane production is accomplished bybacteria which oxidize hydrogen and reduce bicarbonate (Gujer and Zehnder,1982), as follows:
4H2 + HC03- + H+ -----> CH4 + 3H20 + energy
bicar- + hydrogen (6)hydrogen + bicar-+ hydogn ….> methane + water + energy
bonate ion
This second pathway is critical to the entire digestion process,since it is responsible for removing hydrogen and maintaining the lowhydrogen partial pressure required for the production of acetate. Ifhydrogen partial pressure increases above a minimal level, for example,0.0001 atmosphere (atm), the fermentative bacteria will shift to productionof acids other than acetate, and conversion of these acids to acetate bythe acetogens will initially cease. Since the primary pathway for methaneproduction is by cleavage of acetate, a decreased rate of biogas productionwill result.
Since methanogenic bacteria are fragile and slow growing, it isimportant to maintain optimum environmental conditions such as temperatureand pH and to recognize and correct unstable conditions. Although hydrogenpartial pressure exerts a profound regulatory influence on the products offermentation and the degradation of non-acetate acids, these effects occurat partial pressures which are so low as to be difficult to observe.Rather, an unbalanced reactor is often manifested in other ways such asdecreasing pH levels due to the buildup of propionate and longer chainacids. Environmental conditions and their effects on digester performanceare discussed in the next section.
Note also that the methanogenic bacteria are strict anaerobes.The presence of molecular oxygen is toxic to these organisms, and even thepresence of inorganic sources of oxygen, for example nitrates, may inhibittheir growth. Thus, successful digester operation requires that oxygen beexcluded from the reaction vessel. This is important from a safetyviewpoint as well, since introduction of air could result in an explosivegas mixture.
ENVIRONNENTAL FACTORS IN ANAEROBIC DIGESTION
As described above, efficient digester performance depends onmaintaining healthy populations of three groups of bacteria which acttogether to convert substrate to methane. The hydrogen-removingmethanogenic bacteria are particularly important since their inactivity caninhibit the activity of the other groups. The methanogens are also the
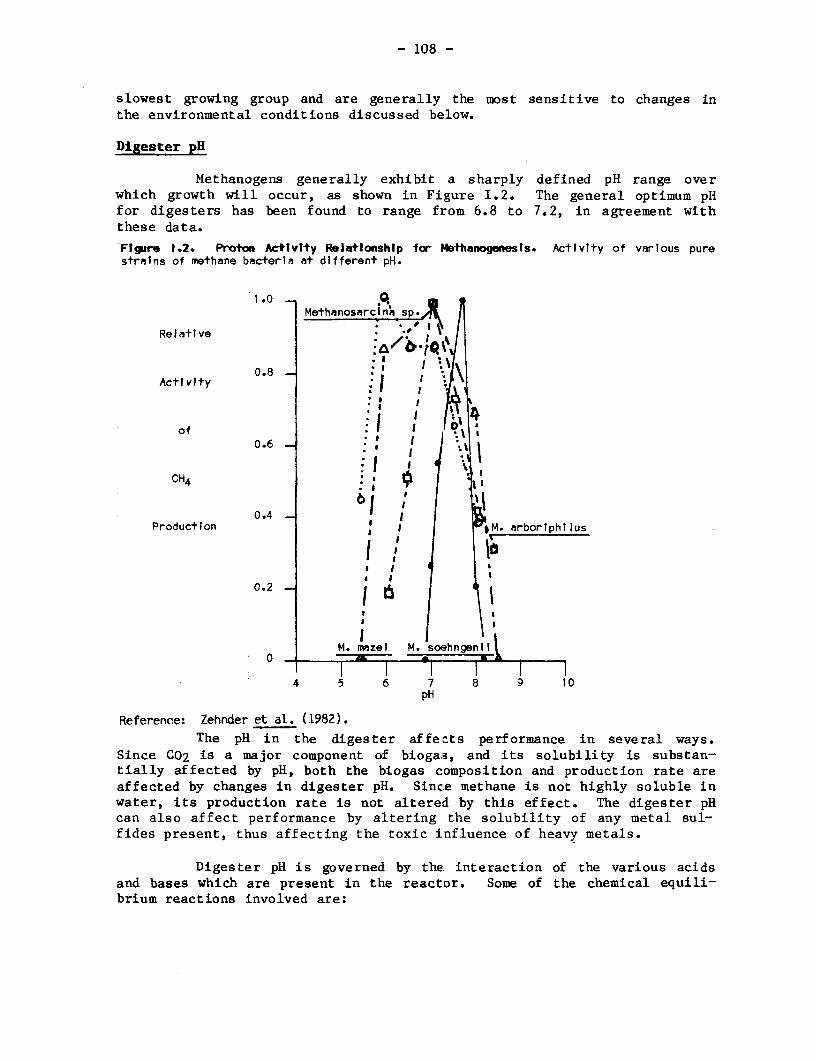
- 108 -
slowest growing group and are generally the most sensitive to changes inthe environmental conditions discussed below.
Digester pH
Methanogens generally exhibit a sharply defined pH range overwhich growth will occur, as shown in Figure I.2. The general optimum pHfor digesters has been found to range from 6.8 to 7.2, in agreement withthese data.
Flgure 1.2. Proton Activity Relationship for Ithanogenesis. Activity of various purestrains of methane bacteria at different pH.
1.0 -10 MethanosrcI sp
Relative
0.8Activity
of 1o 1 0.6 'I
CH4
0.4Production M. arboriphilus
0.2
M. mnazel M. soehngenii
4 5 6 7 8 9 10pH
Reference: Zehnder et al. (1982).The pH in the digester affects performance in several ways.
Since CO2 is a major component of biogais, and its solubility is substan-tially affected by pH, both the biogas composition and production rate areaffected by changes in digester pH. Since methane is not highly soluble inwater, its production rate is not altered by this effect. The digester pHcan also affect performance by altering the solubility of any metal sul-fides present, thus affecting the toxic influence of heavy metals.
Digester pH is governed by the interaction of the various acidsand bases which are present in the reactor. Some of the chemical equili-brium reactions involved are:
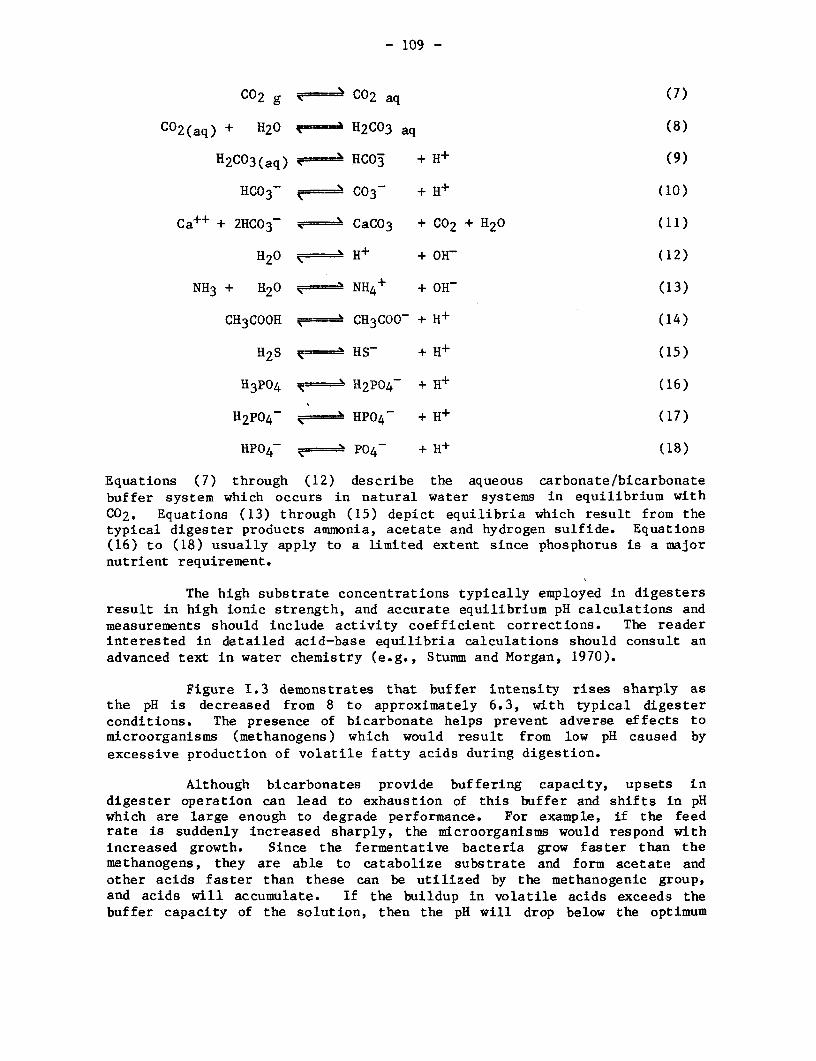
- 109 -
C02 g 02 aq (7)
C02(aq) + H20 x 1H2C03 aq (8)
H2C03(aq) > ' HC03 + H+ (9)
HC03 - C03 + H+ (10)
Ca++ + 2HC03 ' CaC03 + Co2 + H20 (11)
H20 < ' H+ + OH- (12)
NH3 + H20 ' NH4 + + OH ('13)
CH3C00H CH3COO + (14)
H2S HS- + H+ (15)
H3 P0 4 ;K H2P04 + H+ (16)
H 2P04 x HP04 + H (17)
HP04 - P04 + H+ (18)
Equations (7) through (12) describe the aqueous carbonate/bicarbonatebuffer system which occurs in natural water systems in equilibrium withC02 . Equations (13) through (15) depict equilibria which result from thetypical digester products ammonia, acetate and hydrogen sulfide. Equations(16) to (18) usually apply to a limited extent since phosphorus is a majornutrient requirement.
The high substrate concentrations typically employed in dige.stersresult in high ionic strength, and accurate equilibrium pH calculations andmeasurements should include activity coefficient corrections. The readerinterested in detailed acid-base equilibria calculations should consult anadvanced text in water chemistry (e.g., Stumm and Morgan, 1970).
Figure 1.3 demonstrates that buffer intensity rises sharply asthe pH is decreased from 8 to approximately 6.3, with typical digesterconditions. The presence of bicarbonate helps prevent adverse effects tomicroorganisms (methanogens) which would result from low pH caused byexcessive production of volatile fatty acids during digestion.
Although bicarbonates provide buffering capacity, upsets indigester operation can lead to exhaustion of this buffer and shifts in pHwhich are large enough to degrade performance. For example, if the feedrate is suddenly increased sharply, the microorganisms would respond withincreased growth. Since the fermentative bacteria grow faster than themethanogens, they are able to catabolize substrate and form acetate andother acids faster than these can be utilized by the methanogenic group,and acids will accumulate. If the buildup in volatile acids exceeds thebuffer capacity of the solution, then the pH will drop below the optimum
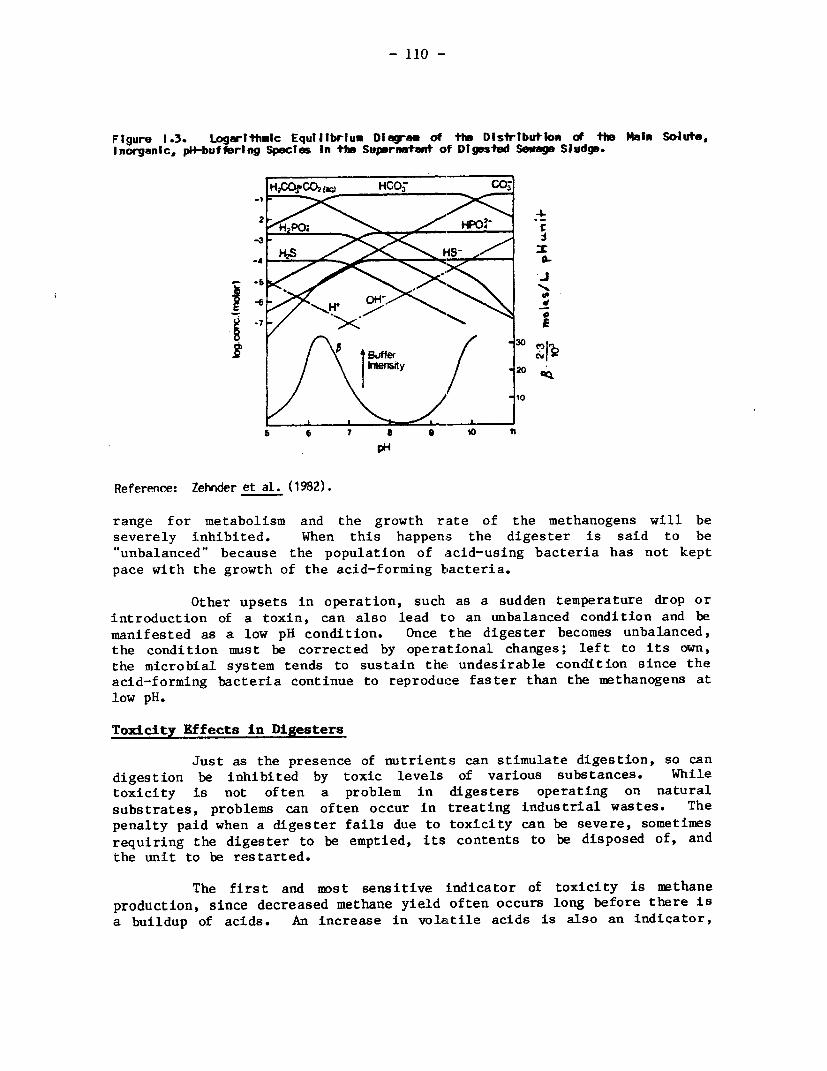
- 110 -
FIgure 1.3. LogarithmIc Equilibrium Dlagym of th Distribution of the Main Solute,Inorganic, pH-bufferlng SpecTs In the Supernatant of Digested Sewage Sludge.
HPCOrCO2(w H005 C03;
.4-2 _.
5 7 a s io 1
pH
Reference: Zehnder et al. (1982).
range for metabolism and the growth rate of the methanogens will beseverely inhibited. When this happenss the digester is said to be"unbalanced" because the population of acid-using bacteria has not keptpace with the growth of the acid-forming bacteria.
Other upsets in operation, such as a sudden temperature drop orintroduction of a toxin, can also lead to an unbalanced condition and bemanifested as a low pH condition. Once the digester becomes unbalanced,the condition must be corrected by operational changes; left to its own,the microbial system tends to sustain the! undesirable condition since theacid-forming bacteria continue to reproduce faster than the methanogens atlow pH.
Toxicity Effects in Dige6ters
Just as the presence of nutrients can stimulate digestion, so candigestion be inhibited by toxic levels of various substances. Whiletoxicity is not often a problem in digesters operating on naturalsubstrates, problems can often occur in treating industrial wastes. Thepenalty paid when a digester fails due to toxicity can be severe, sometimesrequiring the digester to be emptied, its contents to be disposed of, andthe unit to be restarted.
The first and most sensitive indicator of toxicity is methane
production, since decreased methane yield often occurs long before there isa buildup of acids. An increase in volartile acids is also an indicator,
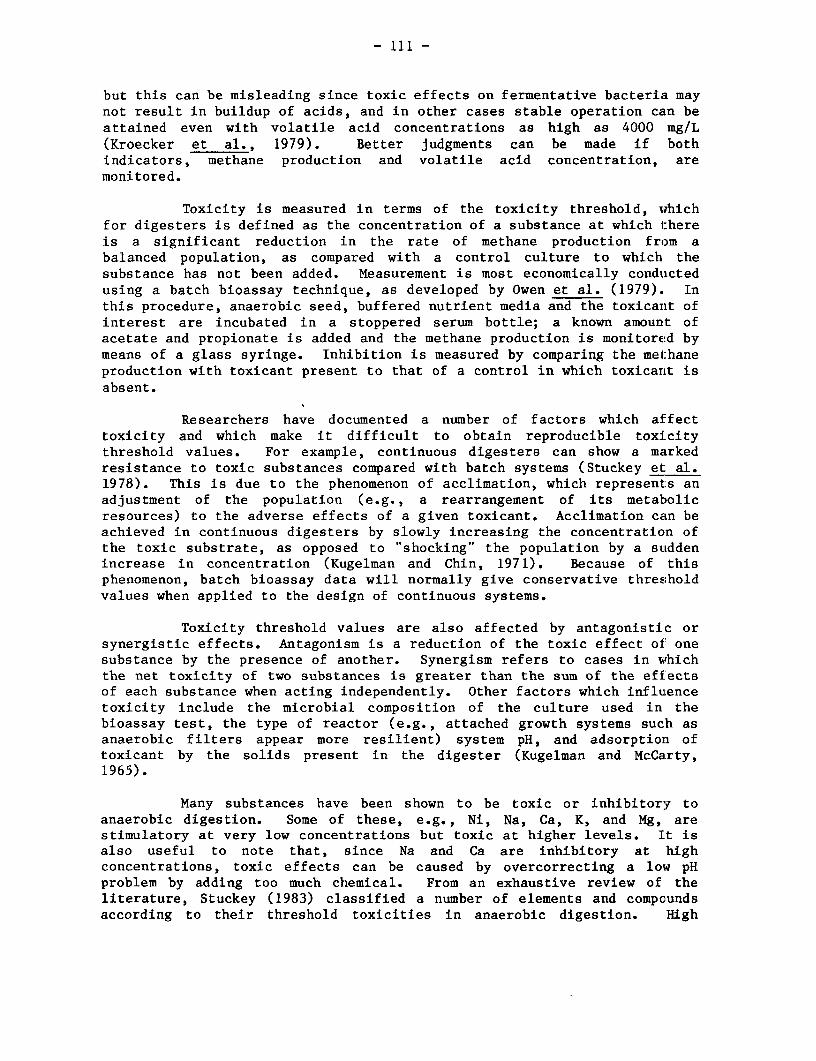
- ill -
but this can be misleading since toxic effects on fermentative bacteria maynot result in buildup of acids, and in other cases stable operation can beattained even with volatile acid concentrations as high as 4000 mg/L(Kroecker et al., 1979). Better judgments can be made if bothindicators, methane production and volatile acid concentration, aremonitored.
Toxicity is measured in terms of the toxicity threshold, whichfor digesters is defined as the concentration of a substance at which thereis a significant reduction in the rate of methane production from abalanced population, as compared with a control culture to which thesubstance has not been added. Measurement is most economically conductedusing a batch bioassay technique, as developed by Owen et al. (1979). Inthis procedure, anaerobic seed, buffered nutrient media and the toxicant ofinterest are incubated in a stoppered serum bottle; a known amount ofacetate and propionate is added and the methane production is monitored bymeans of a glass syringe. Inhibition is measured by comparing the methaneproduction with toxicant present to that of a control in which toxicant isabsent.
Researchers have documented a number of factors which affecttoxicity and which make it difficult to obtain reproducible toxicitythreshold values. For example, continuous digesters can show a markedresistance to toxic substances compared with batch systems (Stuckey et: al.1978). This is due to the phenomenon of acclimation, which represents anadjustment of the population (e.g., a rearrangement of its metabolicresources) to the adverse effects of a given toxicant. Acclimation can beachieved in continuous digesters by slowly increasing the concentration ofthe toxic substrate, as opposed to "shocking" the population by a suddenincrease in concentration (Kugelman and Chin, 1971). Because of thisphenomenon, batch bioassay data will normally give conservative thresholdvalues when applied to the design of continuous systems.
Toxicity threshold values are also affected by antagonistic orsynergistic effects. Antagonism is a reduction of the toxic effect of onesubstance by the presence of another. Synergism refers to cases in whichthe net toxicity of two substances is greater than the sum of the effectsof each substance when acting independently. Other factors which influencetoxicity include the microbial composition of the culture used in thebioassay test, the type of reactor (e.g., attached growth systems such asanaerobic filters appear more resilient) system pH, and adsorption oftoxicant by the solids present in the digester (Kugelman and McCarty,1965).
Many substances have been shown to be toxic or inhibitory toanaerobic digestion. Some of these, e.g., Ni, Na, Ca, K, and Mg, arestimulatory at very low concentrations but toxic at higher levels. It isalso useful to note that, since Na and Ca are inhibitory at highconcentrations, toxic effects can be caused by overcorrecting a low pHproblem by adding too much chemical. From an exhaustive review of theliterature, Stuckey (1983) classified a number of elements and compoundsaccording to their threshold toxicities in anaerobic digestion. High
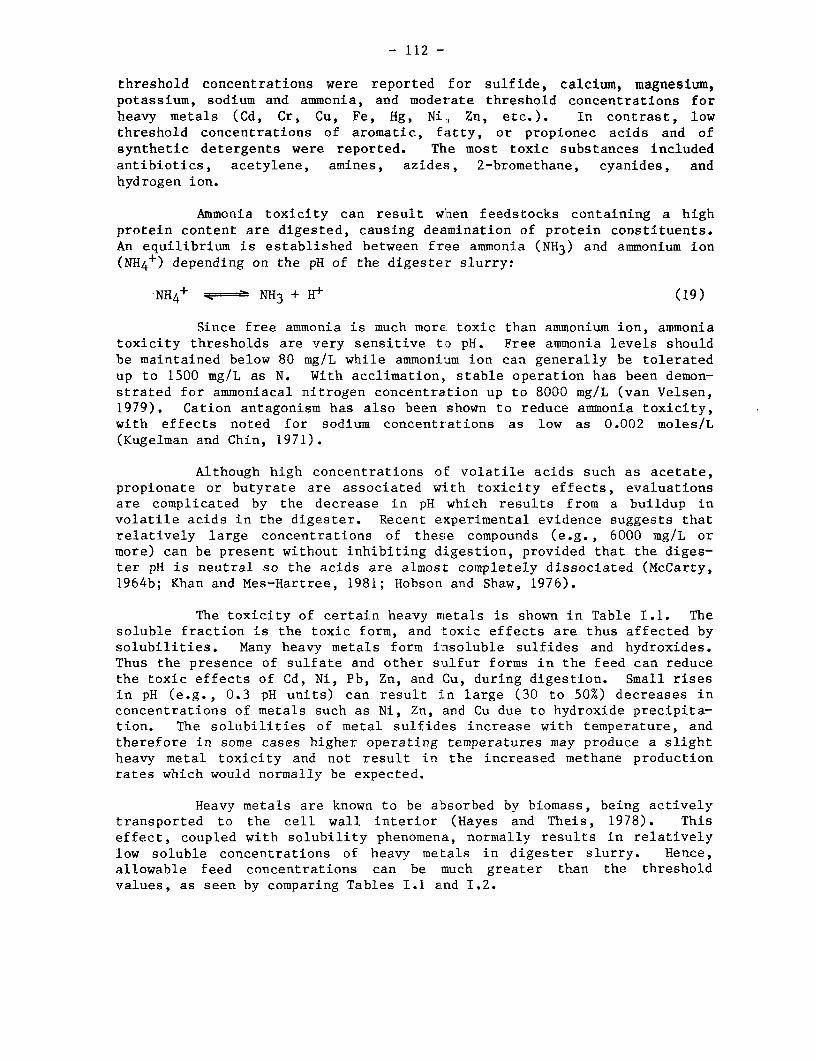
- 112 -
threshold concentrations were reported for sulfide, calcium, magnesium,potassium, sodium and ammonia, and moderate threshold concentrations forheavy metals (Cd, Cr, Cu, Fe, Hg, Ni, Zn, etc.). In contrast, lowthreshold concentrations of aromatic, fatty, or propionec acids and ofsynthetic detergents were reported. The most toxic substances includedantibiotics, acetylene, amines, azides, 2-bromethane, cyanides, andhydrogen ion.
Ammonia toxicity can result wnen feedstocks containing a highprotein content are digested, causing deamination of protein constituents.An equilibrium is established between free ammonia (NH3) and ammonium ion(NH4+) depending on the pH of the digester slurry:
-NH4+ - -NH 3 + H+ (19)
Since free ammonia is much more toxic than ammonium ion, ammoniatoxicity thresholds are very sensitive to pH. Free ammonia levels shouldbe maintained below 80 mg/L while ammonium ion can generally be toleratedup to 1500 mg/L as N. With acclimation, stable operation has been demon-strated for ammoniacal nitrogen concentration up to 8000 mg/L (van Velsen,1979). Cation antagonism has also been shown to reduce ammonia toxicity,with effects noted for sodium concentrations as low as 0.002 moles/L(Kugelman and Chin, 1971).
Although high concentrations of volatile acids such as acetate,propionate or butyrate are associated with toxicity effects, evaluationsare complicated by the decrease in pH which results from a buildup involatile acids in the digester. Recent experimental evidence suggests thatrelatively large concentrations of these compounds (e.g., 6000 mg/L ormore) can be present without inhibiting digestion, provided that the diges-ter pH is neutral so the acids are almost completely dissociated (McCarty,1964b; Khan and Mes-Hartree, 1981; Hobson and Shaw, 1976).
The toxicity of certain heavy metals is shown in Table I.1. Thesoluble fraction is the toxic form, and toxic effects are thus affected bysolubilities. Many heavy metals form insoluble sulfides and hydroxides.Thus the presence of sulfate and other sulfur forms in the feed can reducethe toxic effects of Cd, Ni, Pb, Zn, and Cu, during digestion. Small risesin pH (e.g., 0.3 pH units) can result in large (30 to 50%) decreases inconcentrations of metals such as Ni, Zn, and Cu due to hydroxide precipita-tion. The solubilities of metal sulfides increase with temperature, andtherefore in some cases higher operating temperatures may produce a slightheavy metal toxicity and not result in the increased methane productionrates which would normally be expected.
Heavy metals are known to be absorbed by biomass, being activelytransported to the cell wall interior (Hayes and Theis, 1978). Thiseffect, coupled with solubility phenomena, normally results in relativelylow soluble concentrations of heavy metals in digester slurry. Hence,allowable feed concentrations can be much greater than the thresholdvalues, as seen by comparing Tables I.1 and I.2.
- 113 -
Table l.I. Concentration of Soluble Heavy Metals Exhibiting 50% inhTbifton of AnaerobicDigesters (after Stuckey, 1983).
Cation Approxlmate Concentration in mg/)
Fe++ t -10Zn++ 10-4Cd++ 10-7Cu+ i0-12Cu++ 10-16
Table 1.2. Highest Dose of Metal that WIIl AJlow Satisfactory Anaerobic Digestion of Sludge(continuous dosage).
Concentration InInfluent Sewage, mg/llter
MetalPrimary Sludge Combined Sludge
Digestion Dlgestion
Chromium (V I) 50 50*Copper 10 5Nickel 40 10*Zinc 10 10
*Higher dose not studled.
Reference: Adapted from Kugelman and Chin (1971).
Methods which can be used to control toxicity are:
a. Remove toxic substances from the feed (or keep them out);
b. Dilute the feed to below the toxic threshold value;
c. Add chemicals to form a non-toxic complex or insolubleprecipitate; and/or
d. Add an antagonistic substance.
The first two methods may be straightforward in some cases but
impractical in others. The third method has been demonstrated using
ferrous sulfate addition. Since iron is the most soluble of the heavy
metal sulfides, its presence causes the precipitation of other metals.Potential toxicity due to soluble iron is kept in check if sufficient
alkalinity is present, since iron carbonate will precipitate (Lawrence and
McCarty, 1964; Mosey, 1976; Grady and Lim, 1980). An example of the fourth
method is the reduction of sodium toxicity by addition of potassium andcalcium chlorides (McCarty, 1964a).
The Influence of C/N Ratio on Digestion
Nitrogen requirements are best evaluated based on the net rate ofbiomass production in the digester. This is because the amount of nitrogen
- 114 -
required as a nutrient is governed mainly by the quantity of protoplasm (orcells) produced, and because the N content of anaerobic cells is approxi-mately a fixed percentage of the total cell mass. Thus, the higher theoverall cell yield, the higher is the nitrogen requirement. Evaluation ofnet cell yield, in turn, involves the effects of the feedstock biodegrada-bility and reactor residence time.
Of the total carbon in the feed material, much but not all isusually degradable; the relatively nondegradable portion (e.g., lignin)passes through the digester essentially unchanged and requires no nitro-gen. The fraction of the degradable carbon which is actually degraded isdetermined by the hydraulic residence time and other operating conditionssuch as temperature and pH. Only part of the carbon which is actuallydegraded is synthesized into cell mass, since much of it is converted intogaseous products (i.e., CH4 and C02). This last factor is largely a func-tion of the mean cell residence time, e< , since net cell yield is reducedat long ec due to endogenous respiration and cell lysis. Thus it is evi-dent that the amount of nitrogen required per quantity of carbon in thefeed (i.e., the optimum feed C/N ratio) can vary considerably for differentdigester feeds, designs and operating conditions.
Actual feedstocks have widely varying C/N ratios. Stuckey (1983)assembled C/N ratio information from a variety of sources (Barnett, 1978;BORDA, 1980; Chynoweth, et al., 1978; Fry, 1975; Hills, 1979; NAS, 1977;Polprasert, 1982; UNEP, 1981; van Brakel, 1980; Wolverton and McDonald,1978). Reported C/N ratios varied from about 1 for human or animal urineto from 5 to 10 for human feces, 7 to 15 for poultry or swine manure, 15 to30 for sheep, and 20 to 35 for cattle and horses. Ratios for forage,grasses, hay, and water hyacinth were from about 10 to 30 and for straw andplant stalks from 30 to 150. Raw and rotted sawdust were about 500 and200, respectively. Household garbage varied from 20 to 35. Optimum C/Nratios can be determined for specific cases by assessing the factorsdiscussed above. For feedstocks with non-optimum C/N ratios, adjustment ofthe ratio may improve performance or may even be essential for successfuloperation. For example, the C/N ratio of a feed could be empiricallyadjusted upwards by mixing it with a carbohydrate-rich material (e.g.,straw added to nightsoil). In other cases, dilution with water may be apractical way to alleviate NH3 toxicity which would otherwise result from afeed having a low C/N ratio.
BIODEGRADABILITY OF DIGESTER FEEDSTOCK
Biodegradability and Gas Production
Methane, of course, is one of the major products of interest indigester operation. The quality of the biogas depends on the relativeamounts of CH4 and C02 ultimately produced. The methane content obtainablefrom a given feedstock material can be estimated if the average chemicalcomposition of the feed is known. Suppose, for example, that the feed to adigester contained only carbohydrates with an average composition ofC6H1005- Assuming complete conversion to C02 and CH4, the digestionprocess would be described by the following balanced reaction:
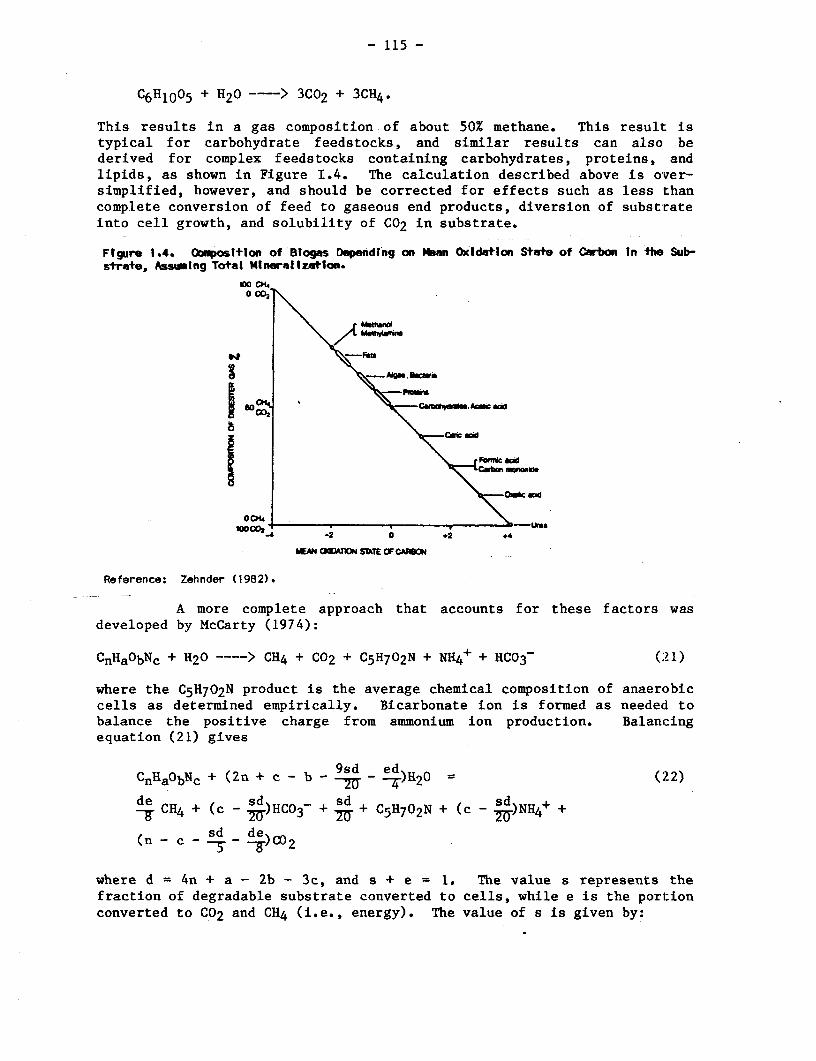
- 115 -
C6H1005 + H20 ----> 3CO2 + 3CH4.
This results in a gas composition of about 50% methane. This resull: istypical for carbohydrate feedstocks, and similar results can also bederived for complex feedstocks containing carbohydrates, proteins, andlipids, as shown in Figure I.4. The calculation described above is over-simplified, however, and should be corrected for effects such as less thancomplete conversion of feed to gaseous end products, diversion of substrateinto cell growth, and solubility of C02 in substrate.
Figure 1.4. Oompositlon of Blogps Depending on Ms.. Oxidation State of Carbon In the Sub-stra+e, Assumng Total Mineralizaton.
o co,a
-F-
PNO
sos........ MgFeShcw
Iao~~~~~~~~~~~;~n awmdAcaGa o
lOOW4 -2 0 42 .4
MEAN OmJ1nN STATE OF CAMCBO
Reference: Zehnder (1982).
A more complete approach that accounts for these factors wasdeveloped by McCarty (1974):
CnHaObNc + H20 ----> CH4 + C02 + C5H702N + NH4+ + HC03- (21)
where the C5H702N product is the average chemical composition of anaerobiccells as determined empirically. Bicarbonate ion is formed as needed tobalance the positive charge from ammonium ion production. Balancingequation (21) gives
CnHaObNc + (2n + c - b - 9sd _ ed)H20 (22)
de -sd +sd +CO (sd -
- CH4 + (c - jZ)HC03 + Of + CsH702N + (c - -Rp)NH4+ +
(n - c - sd - L)CO2
where d 4n + a - 2b - 3c, and s + e = 1. The value s represents thefraction of degradable substrate converted to cells, while e is the portionconverted to C02 and CH4 (i.e., energy). The value of s is given by:
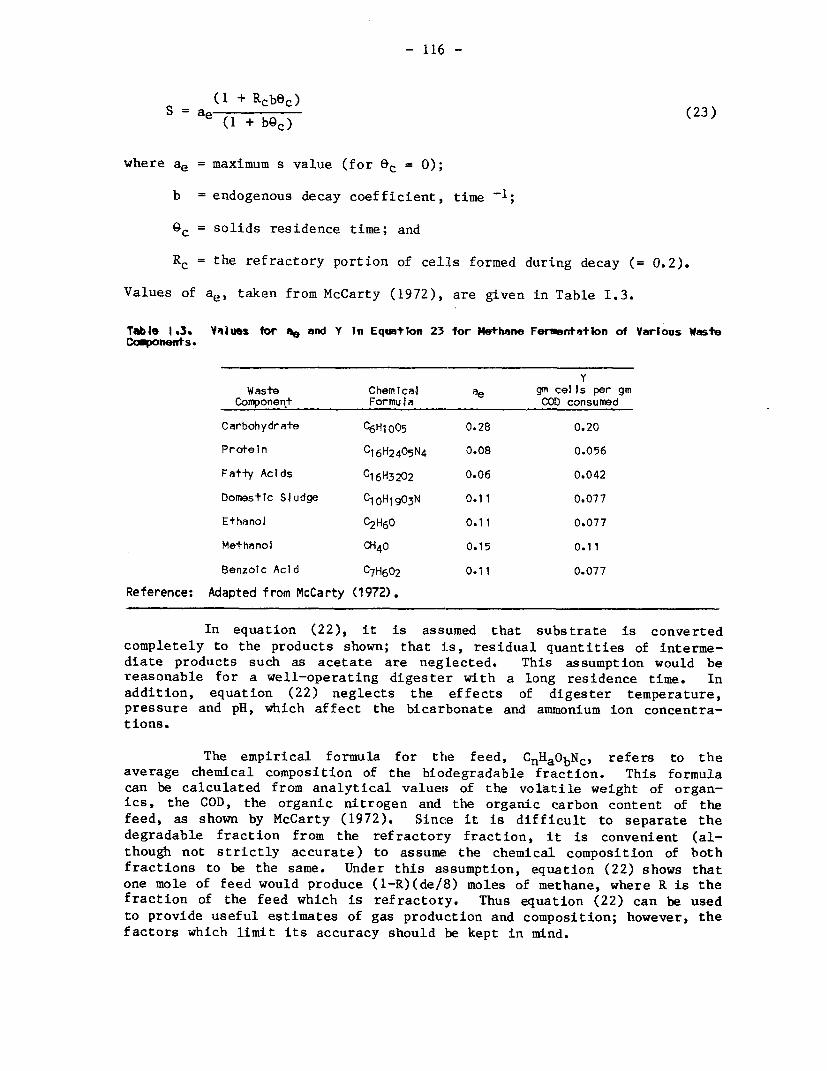
- 116 -
( 1 + Rcbec )S = ae( Rbc (23)
(1 + bgc)
where ae = maximum s value (for &C = 0);
b = endogenous decay coefficient, time -;
QC = solids residence time; and
Rc = the refractory portion of cells formed during decay (= 0.2).
Values of ae, taken from McCarty (1972), are given in Table I.3.
Table 1.3. Values for A and Y In Equmion 23 for Methane Fermentation of Various WasteCcuponents.
Waste Chemical ae gm cells per gmComponer\t Formula COD consumed
Carbohydrate C6H1005 0.28 0.20
Prot-eln C16 H2 405N4 0.08 0.056
Fatty Acids C16 H3 202 0.06 0.042
Domestic Sludge C10 H19 03N 0.11 0.077
Ethanol C2H6 0 0.11 0.077
Methanol CH40 0.15 0.11
Benzolc Acid C7 H6 02 0.11 0.077
Reference: Adapted from McCarty (1972).
In equation (22), it is assumed that substrate is convertedcompletely to the products shown; that is, residual quantities of interme-diate products such as acetate are neglected. This assumption would bereasonable for a well-operating digester with a long residence time. Inaddition, equation (22) neglects the effects of digester temperature,pressure and pH, which affect the bicarbonate and ammonium ion concentra-tions.
The empirical formula for the feed, CnHaObNc, refers to theaverage chemical composition of the biodegradable fraction. This formulacan be calculated from analytical values of the volatile weight of organ-ics, the COD, the organic nitrogen and the organic carbon content of thefeed, as shown by McCarty (1972). Since it is difficult to separate thedegradable fraction from the refractory fraction, it is convenient (al-though not strictly accurate) to assume the chemical composition of bothfractions to be the same. Under this assumption, equation (22) shows thatone mole of feed would produce (l-R)(de/8) moles of methane, where R is thefraction of the feed which is refractory. Thus equation (22) can be usedto provide useful estimates of gas production and composition; however, thefactors which limit its accuracy should be kept in mind.
- 117 -
Another method of estimating biogas production is by means of amaterial balance. This can be done by measuring the chemical oxygen demand(COD) of all the streams (including biogas) which enter and exit: thedigester. COD is determined analytically by addition of a strong chemicaloxidant such as dichromate ion to a sample, and is a measure of- theequivalent oxygen required by the sample to oxidize its constituents tocompounds such as C02 and H20 (Standard Methods, 1978).
Of the products in the gas phase, carbon dioxide has zero CODsince it is fully oxidized. The COD of methane can be calculated from thestoichiometry of its oxidation reaction:
CH4 + 202 ---- > C02 + H20 (24)
From this we can see that one mole of methane requires two molesof oxygen and thus has a COD of 2 x 32g = 64g. Since one mole of gasoccupies approximately 22.4 liters at standard conditions (ideal gas law),one liter of methane (at STP) is equivalent to 64/22.4 - 2.86g of COD.
For an anaerobic process with no oxygen present, COD is aconservative parameter. That is, the sum of all COD inputs to a digesteris equal to the sum of all its COD outputs. This means that the CODremoved from the feed (i.e., influent COD minus effluent COD) is equal tothe COD of the biogas. Hence, removal of one gram of COD from the feedresults in one gram of gaseous COD, or 1/2.86 = 0.35 liters of methane atSTP. Applied to a continuous flow digester at steady state conditions, thevolumetric methane production rate is:
V = 0.35 (Si - SO) Q (25)
where Si = influent COD, g/L;
SO = effluent COD, g/L;
Q = influent flow rate, L/d; and
V = methane production rate (at STP), L/d.
Equation (25) accounts for the biodegradability of the feedthrough the term SO,i which includes the refractory fraction of the feed.SO also accounts for residual levels of degradable organics which are inthe effluent due to incomplete conversion. In using equation (25), Si andSO are measured analytically for a feedstock of interest.
As COD can be correlated with the volatile solids (VS) content ofa sample, VS analyses can be used in predicting gas production. However,the relationship between COD and VS is empirical, varying considerably fromsample to sample. For example, the COD/VS ratio for a carbohydrate isabout 1.1 whereas that for a lipid is about 2.9 and that for a protein is
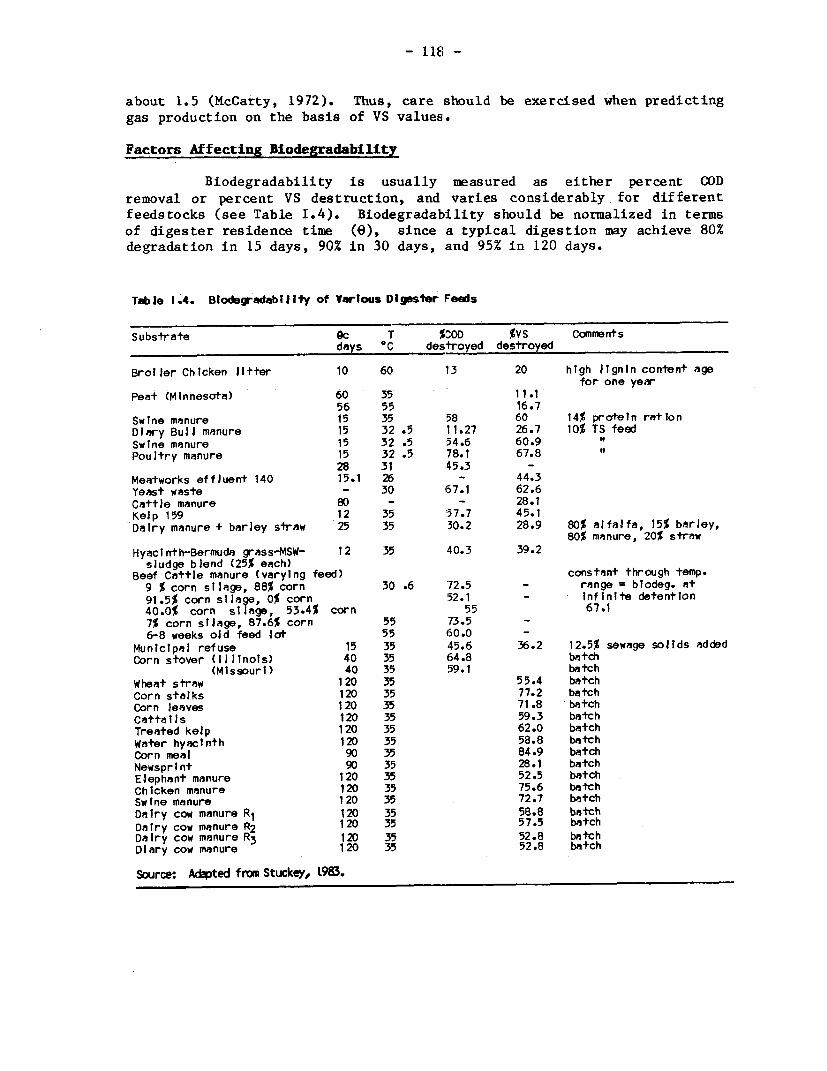
- 118; -
about 1.5 (McCarty, 1972). Thus, care should be exercised when predictinggas production on the basis of VS values.
Factors Affecting Biodegradability
Biodegradability is usually measured as either percent CODremoval or percent VS destruction, and varies considerably for differentfeedstocks (see Table I.4). Biodegradability should be normalized in termsof digester residence time (e), since a typical digestion may achieve 80%degradation in 15 days, 90% in 30 days, and 95% in 120 days.
Table 1.4. Blodegradabilt ty of Various Digester Feeds
Substrate Qc T %SOD %VS Commentsdays eC destroyed destroyed
Broiler Chlcken litter 10 60 13 20 high lignin content agefor one year
Peat (Minmnesota) 60 35 11.156 55 16.7
Swtne manure 15 35 58 60 14% proteln ratlonDiary Bull manure 15 32 .5 11.27 26.7 10% TS feedSwine manure 15 32 .5 54.6 60.9Poultry manure 15 32 .5 78.1 67.8
28 31 45.3 -Meatworks effluent 140 15.1 26 - 44.3Yeast waste - 30 '57.1 62.6Cattle manure 80 - - 28.1Kelp 159 12 35 57.7 45.1Dairy manure + barJey straw 25 35 30.2 28.9 80% alfalfa, 15% barley,
80% manure, 20% strawHyacinth-Bermuda grass-MSW- 12 35 40.3 39.2
sludge blend (25% each)Beef Cattle manure (varying feed) constant through temp.
9 % corn silage, 88% corn 30 .6 72.5 - range = blodeg. at91.5% corn slJage, 0% corn 52.1 I Infinite detention40.0% corn sl lage, 53.4% corn 55 67.17% corn silJage, 87.6% corn 55 73.56-8 weeks old feed lot 55 60.0 -
Municipal refuse 15 35 45.6 36.2 12.5% sewage solids addedCorn stover (Illinois) 40 35 64.8 batch
(Missourl) 40 35 59.1 batchWheat straw 120 35 55.4 batchCorn stalks 120 35 77.2 batchCorn leaves 120 35 71.8 batchCattails 120 35 59.3 batchTreated kelp 120 35 62.0 batchWater hyacinth 120 35 58.8 batchCorn meal 90 35 84.9 batchNewsprInt 90 35 28.1 batchElephant manure 120 35 52.5 batchChicken manure 120 35 75.6 batchSwine manure 120 35 72.7 batchDalry cow manure R1 120 35 58.8 batchDairy cow manure R2 120 35 57.5 batchDairy cow manure R3 120 35 52.8 batchDiary cow manure 120 35 52.8 batch
Source: Adoted from Stuckey, L983.
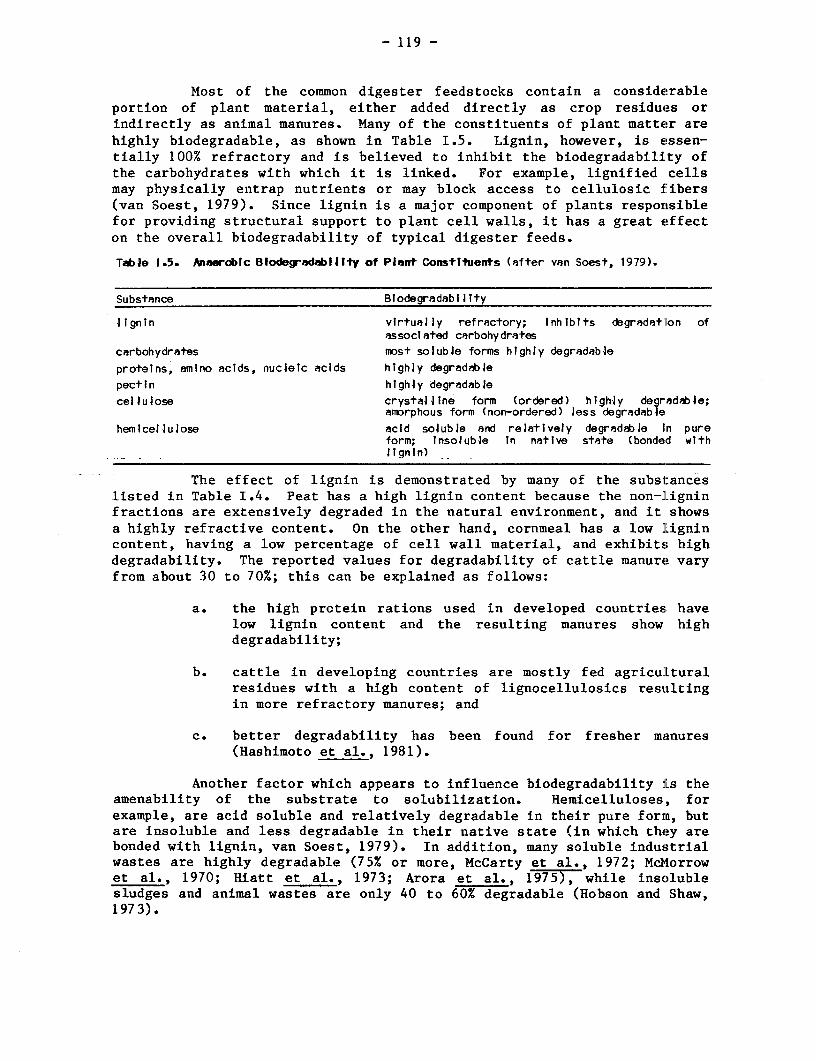
- 119 -
Most of the common digester feedstocks contain a considerableportion of plant material, either added directly as crop residues orindirectly as animal manures. Many of the constituents of plant matter arehighly biodegradable, as shown in Table I.5. Lignin, however, is eessen-tially 100% refractory and is believed to inhibit the biodegradability ofthe carbohydrates with which it is linked. For example, lignified cellsmay physically entrap nutrients or may block access to cellulosic fibers(van Soest, 1979). Since lignin is a major component of plants responsiblefor providing structural support to plant cell walls, it has a great effecton the overall biodegradability of typical digester feeds.
Table 1.5. Anaerobic Biodegradablity of Plant Constitue.ts (after van Soest, 1979).
Substance Biodegradabi lI ty
lignin virtually refractory; inhlbits degradation ofassociated carbohydrates
carbohydrates most soluble forms highly degradableproteins, amino acids, nucleic acids highly degradablepectin highly degradablecellulose crystallne form (ordered) highly degradable;
amorphous form (non-ordered) less degradablehemicellulose acid soluble and relatively degradable in pure
form; Insoluble In native state (bonded withlign in)
The effect of lignin is demonstrated by many of the subsl:anceslisted in Table 1.4. Peat has a high lignin content because the non-ligninfractions are extensively degraded in the natural environment, and it showsa highly refractive content. On the other hand, cornmeal has a low lignincontent, having a low percentage of cell wall material, and exhibits highdegradability. The reported values for degradability of cattle manure varyfrom about 30 to 70%; this can be explained as follows:
a. the high protein rations used in developed countries havelow lignin content and the resulting manures show highdegradability;
b. cattle in developing countries are mostly fed agricuLturalresidues with a high content of lignocellulosics resultingin more refractory manures; and
c. better degradability has been found for fresher manures(Hashimoto et al., 1981).
Another factor which appears to influence biodegradability iLs theamenability of the substrate to solubilization. Hemicelluloses, forexample, are acid soluble and relatively degradable in their pure form, butare insoluble and less degradable in their native state (in which they arebonded with lignin, van Soest, 1979). In addition, many soluble industrialwastes are highly degradable (75% or more, McCarty et al., 1972; McMorrowet al., 1970; Hiatt et al., 1973; Arora et al., 1975), while insolublesludges and animal wastes are only 40 to 60% degradable (Hobson and Shaw,1973).
- 120 -
Analytical Measurement of Biodegradabili yt
In most cases, experimental determination of biodegradability ispreferable to use of literature values, due to the numerous variables whichaffect biodegradability. Operation of a continuous flow digester at a longdetention time yields the best data, but is time consuming and expensive.Use of less expensive methods (e.g., batch incubations) reduces cost andallows assessment of more variables (such as C/N ratio, temperature, pre-treatment, etc.).
Owen et al. (1979) developed an incubation technique using glassserum bottles to measure the biodegradability of a substrate. Detailedexperimental techniques are given in the paper, but in principle the assayis as follows. The serum bottle (250 ml) is flushed with a 70% N2, 30% CO2gas mixture and a known amount (with respect to COD) of the substrate isplaced into the bottle together with an anaerobic seed and bufferednutrient media. A rubber serum cap is inserted into the top of the bottleto seal it, and the bottle is incubated at the temperature of interest.From time to time, the gas volume produced in the bottle is measured bymeans of a wetted glass syringe inserted through the rubber cap. Each timethe volume is measured, the gas composition (%C02, N2, CH4) is determinedby a gas chromatograph. As discussed previously, the amount of methaneproduced can be directly related to the removal of COD from the substrate,and hence the degradation of substrate can be determined as a function ofreaction time.
To determine the refractory portion (R) of the substrate, it isassumed that the degradable portion is completely converted to CH4 and C02products as the reaction time approaches infinity (Morris et al., 1977).Extrapolation of the data to infinite reaction time gives R, since anysubstrate COD remaining is refractory.
This batch bioassay method is very flexible since a large numberof bottles can be set up at one time, and it is inexpensive since it onlyrequires glassware and a few chemicals. In developing countries where gaschromatography equipment may not be available, older and simpler methodsmight be used such as C02 absorption in hydroxide and ignition of methane.
Care should be exercised in reporting and comparing biodegradabi-lity data since the term is used loosely in the literature and confusioncan result. This is best illustrated by an example. Suppose a solution ofglucose containing 100 mg/L COD is to be digested. Digestion would typi-cally convert 80 mg/L COD of this COD to methane and 20 mg/L to biologicalcells. Although glucose is 100% biodegradable, COD measurements of theinfluent and effluent would show only an 80% reduction.
- 121 -
Pretreatment Methods to Increase Biodegradability
Since most common digester feeds are only 40 to 60% degradable,substantial increases in gas yield could be achieved if the substrate couldbe rendered 100% biodegradable. This is particularly true for feeds whichcontain a large amount of refractory lignocellulosics such as agriculturalresidues. There are three main methods for increasing biodegradabilitywhich are briefly discussed below.
Physical-chemical methods involve reaction with an acid or alkaliat ambient or elevated temperature (100 to 200°C). Various researchershave demonstrated improvements in biodegradability of 100% or more usingheat or chemical treatments on feedstocks such as cornstalks, municipalsolid waste, activated sludge, rice straw, and sugar cane bagasse (Buswelland Hatfield, 1936; Gossett, 1976; Owen, 1979; Stuckey, 1980; Robbins etal., 1979; Han and Callihan, 1974; McFarlane and Pfeffer, 1981). Nonethe-less, these methods do not appear to be economical due to the high cost ofchemicals or heating equipment involved.
Physical methods include cutting, grinding or shredding of thefeedstock to increase surface area for enzymatic attack. Availablie data(Nelson et al., 1939; Ghosh and Klass, 1979; Buswell and Hatfield, 1936;Wolverton et al., 1975; Colberg et al., 1980) in this area are contradic-tory, but it appears that substantial positive effects require reduction toa very small particle size (e.g., to a flour form). More studies areneeded to better define the potential of this technique.
Biological pretreatment methods include aerobic composting andfeeding to animals followed by dung collection. While the latter method isobviously a widespread practice, composting appears to be common mainly inChina (UNEP, 1981). Compost piles are prepared by cutting crop residuesinto small pieces and mixing these with limewater and excreta. Compostingcan reduce scum formation and increase gas yield, but it also consumes someof the organic substrate in the composting process itself; hence thecomposting time should be adjusted to maximize gas yields. This methodappears promising since it is simple to carry out, but further work shouldbe performed to quantify the benefits and optimize the parameters involved.
KINETIC MODELS
Monod Model
For a bacterial culture under conditions in which an essentialnutrient (or substrate) is present in limited amounts, Monod (1949) showedthat the growth rate can be described by the following hyperbolic function:
SP = Pm KS+S (26)
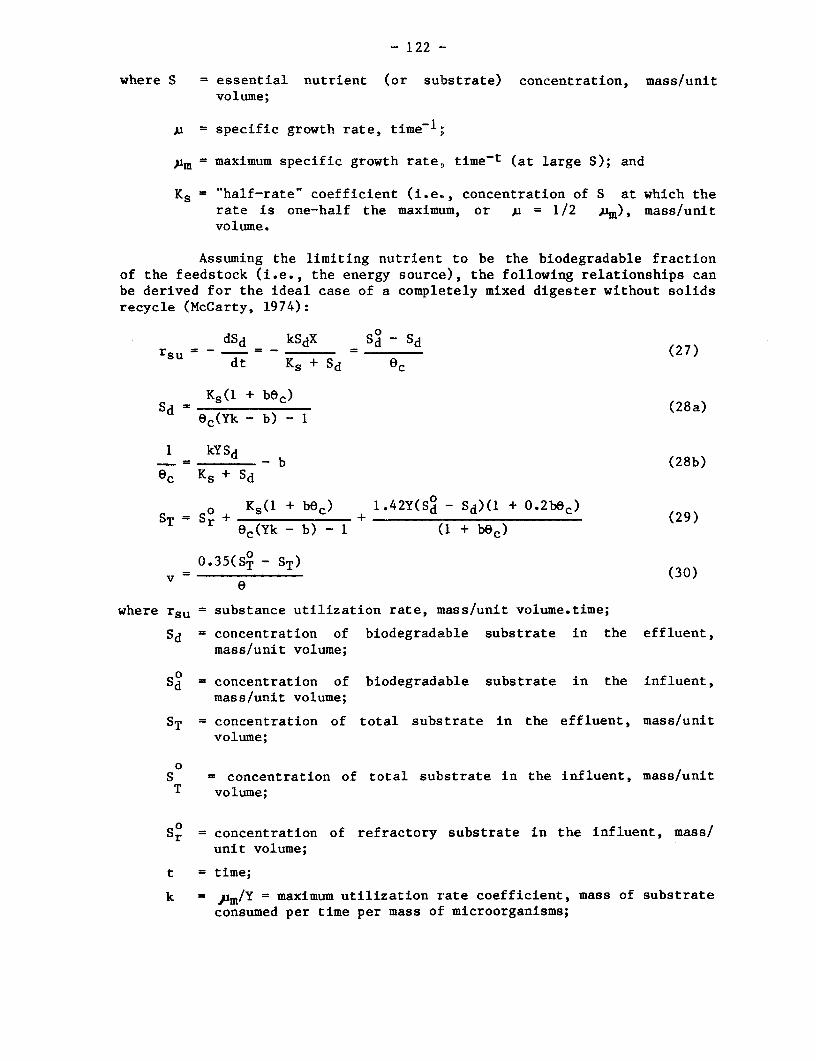
- 122 --
where S = essential nutrient (or sulbstrate) concentration, mass/unitvolume;
,u = specific growth rate, time1;;
pm = maximum specific growth rate} time-t (at large S); and
Ks = "half-rate" coefficient (i.e., concentration of S at which therate is one-half the maximum, or ,u = 1/2 jum), mass/unitvolume.
Assuming the limiting nutrient to be the biodegradable fractionof the feedstock (i.e., the energy source), the following relationships canbe derived for the ideal case of a completely mixed digester without solidsrecycle (McCarty, 1974):
"_ _ dSd __kSdX -d Sd (27)
dt Ks + Sd Ec
Ks(1 + bec)
ec(Yk - b) - 1
1 kYSd1 kYSd -b (28b)ec Ks + Sd
o KKs( + bec) 1.42Y(So - Sd)(1 + 0.2bec) (29)0 + - + d (29)___ __
e c(Yk - b) - 1 (1 + bec)
0.35(So - ST) (30)v e (0
where rsu = substance utilization rate, mass/unit volume.time;
Sd = concentration of biodegradable substrate in the effluent,mass/unit volume;
S0 = concentration of biodegradable substrate in the influent,mass/unit volume;
ST = concentration of total substrate in the effluent, mass/unitvolume;
0S = concentration of total substrate in the influent, mass/unitT volume;
Sr = concentration of refractory substrate in the influent, mass/unit volume;
t = time;
k = jum/Y = maximum utilization rate coefficient, mass of substrateconsumed per time per mass of microorganisms;
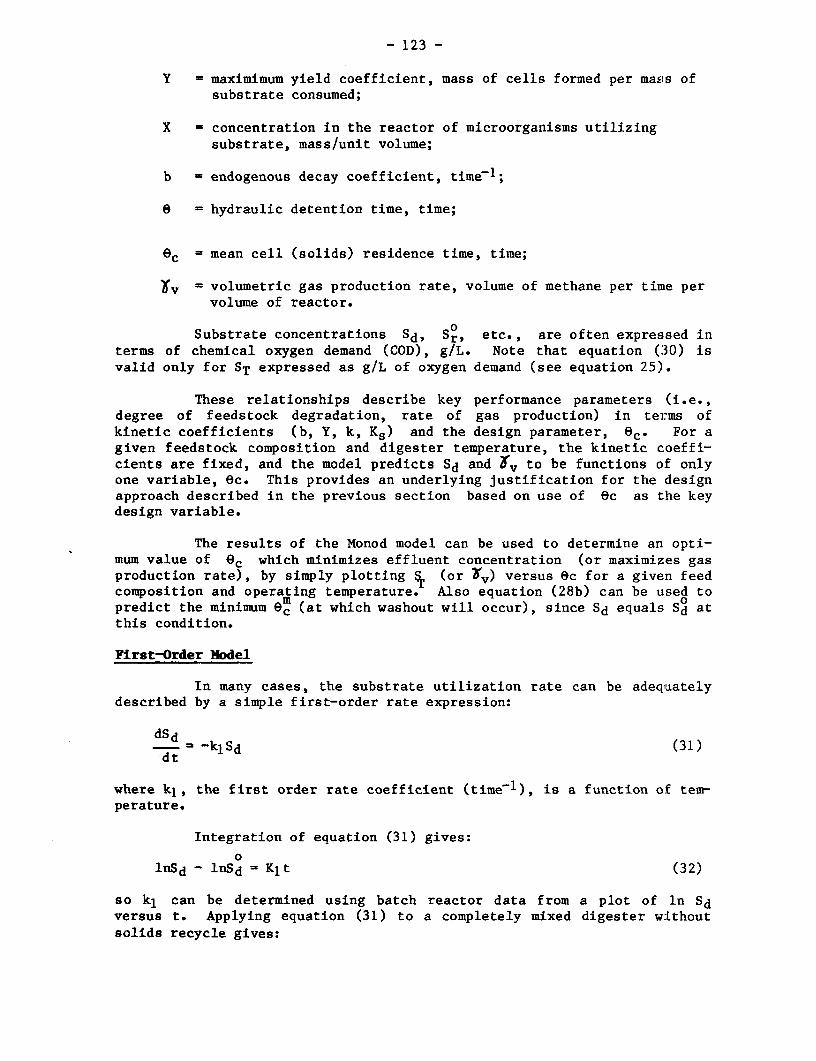
- 123 -
Y = maximimum yield coefficient, mass of cells formed per mass ofsubstrate consumed;
X = concentration in the reactor of microorganisms utilizingsubstrate, mass/unit volume;
b = endogenous decay coefficient, time71 ;
8 = hydraulic detention time, time;
ec = mean cell (solids) residence time, time;
Xtv = volumetric gas production rate, volume of methane per time pervolume of reactor.
0Substrate concentrations Sd, Sr$ etc., are often expressed in
terms of chemical oxygen demand (COD), g/L. Note that equation (30) isvalid only for ST expressed as g/L of oxygen demand (see equation 25).
These relationships describe key performance parameters (i.e.,degree of feedstock degradation, rate of gas production) in terms ofkinetic coefficients (b, Y, k, K.) and the design parameter, ec. For agiven feedstock composition and digester temperature, the kinetic coeffi-cients are fixed, and the model predicts Sd and 3'v to be functions of onlyone variable, Oc. This provides an underlying justification for the designapproach described in the previous section based on use of ec as the keydesign variable.
The results of the Monod model can be used to determine an opti-mum value of 9c which minimizes effluent concentration (or maximizes gasproduction rate), by simply plotting e (or t'v) versus Oc for a given feedcomposition and operating temperature. Also equation (28b) can be used topredict the minimum ec (at which washout will occur), since Sd equals S atthis condition.
First-Order Model
In many cases, the substrate utilization rate can be adequatelydescribed by a simple first-order rate expression:
d = -klSd (31)
where kl, the first order rate coefficient (time-1 ), is a function of tem-perature.
Integration of equation (31) gives:
0lnSd - lnSd 5 K1t (32)
so kl can be determined using batch reactor data from a plot of ln Sdversus t. Applying equation (31) to a completely mixed digester withoutsolids recycle gives:
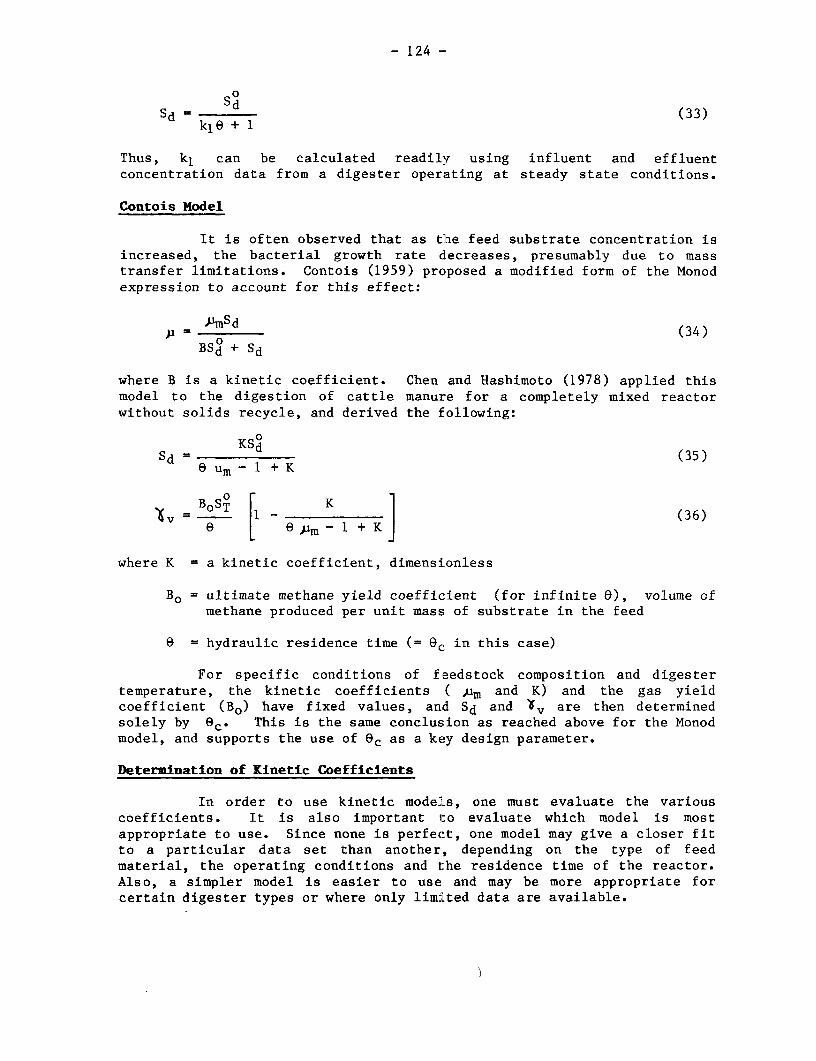
- 124 -
S d (33)d kle + 1
Thus, k1 can be calculated readily using influent and effluentconcentration data from a digester operating at steady state conditions.
Contois Model
It is often observed that as the feed substrate concentration isincreased, the bacterial growth rate decreases, presumably due to masstransfer limitations. Contois (1959) proposed a modified form of the Monodexpression to account for this effect:
Pm5 d (Pu = JSd(34)
BSd + Sd
where B is a kinetic coefficient. Chen and Hashimoto (1978) applied thismodel to the digestion of cattle manure for a completely mixed reactorwithout solids recycle, and derived the following:
0
Sd = KSd (35)a um - 1 + K
Xv = ET - K ] (36)
where K a kinetic coefficient, dimensionless
B0 = ultimate methane yield coefficient (for infinite i), volume ofmethane produced per unit mass of substrate in the feed
0 = hydraulic residence time (= 9c in this case)
For specific conditions of feedstock composition and digestertemperature, the kinetic coefficients ( um and K) and the gas yieldcoefficient (BO) have fixed values, and Sd and Wv are then determinedsolely by 8c* This is the same conclusion as reached above for the Monodmodel, and supports the use of Oc as a key design parameter.
Determination of Kinetic Coefficients
In order to use kinetic models, one must evaluate the variouscoefficients. It is also important to evaluate which model is mostappropriate to use. Since none is perfect, one model may give a closer fitto a particular data set than another, depending on the type of feedmaterial, the operating conditions and the residence time of the reactor.Also, a simpler model is easier to use and may be more appropriate forcertain digester types or where only limiLted data are available.
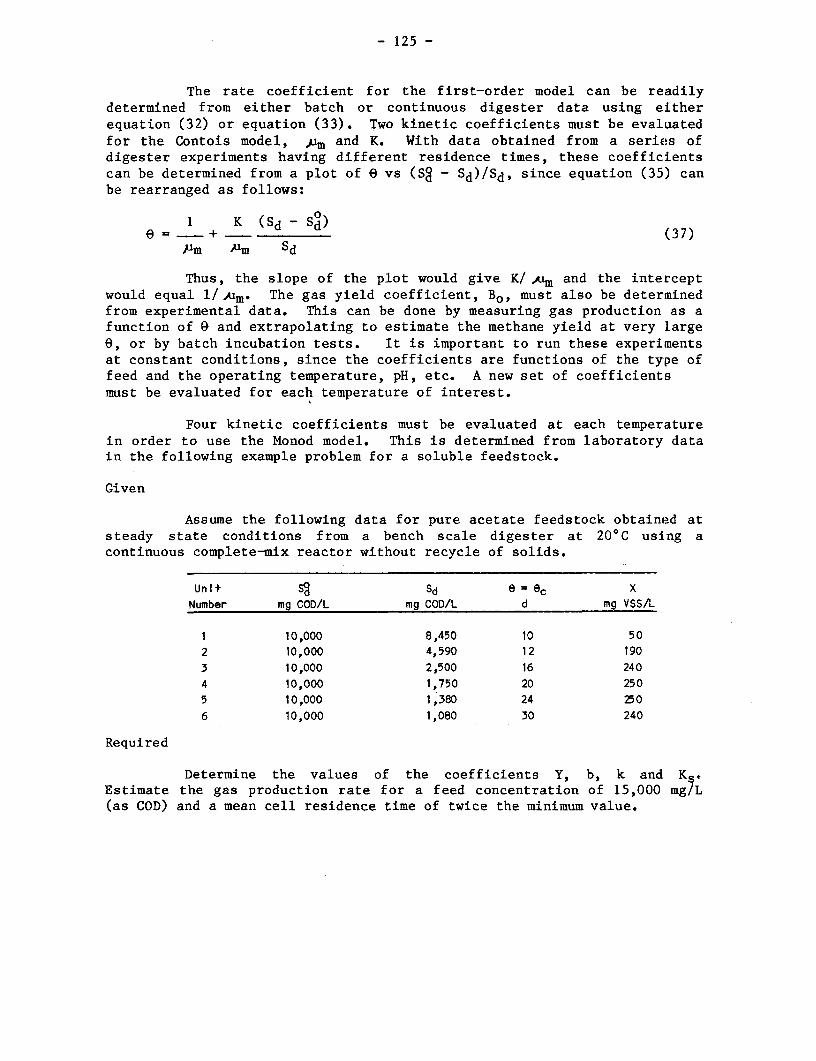
- 125 -
The rate coefficient for the first-order model can be readilydetermined from either batch or continuous digester data using eitherequation (32) or equation (33). Two kinetic coefficients must be evaluatedfor the Contois model, )am and K. With data obtained from a series ofdigester experiments having different residence times, these coefficientscan be determined from a plot of 0 vs (S2 - Sd)/Sd, since equation (35) canbe rearranged as follows:
1 K (Sd - Sod)0 - (37)
Pm Am Sd
Thus, the slope of the plot would give K/ JUm and the interceptwould equal 1/,um. The gas yield coefficient, Bo, must also be determinedfrom experimental data. This can be done by measuring gas production as afunction of 9 and extrapolating to estimate the methane yield at very large0, or by batch incubation tests. It is important to run these experimentsat constant conditions, since the coefficients are functions of the type offeed and the operating temperature, pH, etc. A new set of coefficientsmust be evaluated for each temperature of interest.
Four kinetic coefficients must be evaluated at each temperaturein order to use the Monod model. This is determined from laboratory datain the following example problem for a soluble feedstock.
Given
Assume the following data for pure acetate feedstock obtained atsteady state conditions from a bench scale digester at 20°C using acontinuous complete-mix reactor without recycle of solids.
Unit I Sd e = ec xNumber mg COD/L mg COD/L d mg VSS/L
1 10,000 8,450 10 502 10,000 4,590 12 1903 10,000 2,500 16 2404 10,000 1,750 20 2505 10,000 1,380 24 2506 10,000 1,080 30 240
Required
Determine the values of the coefficients Y, b, k and Ks.Estimate the gas production rate for a feed concentration of 15,000 mg/L(as COD) and a mean cell residence time of twice the minimum value.
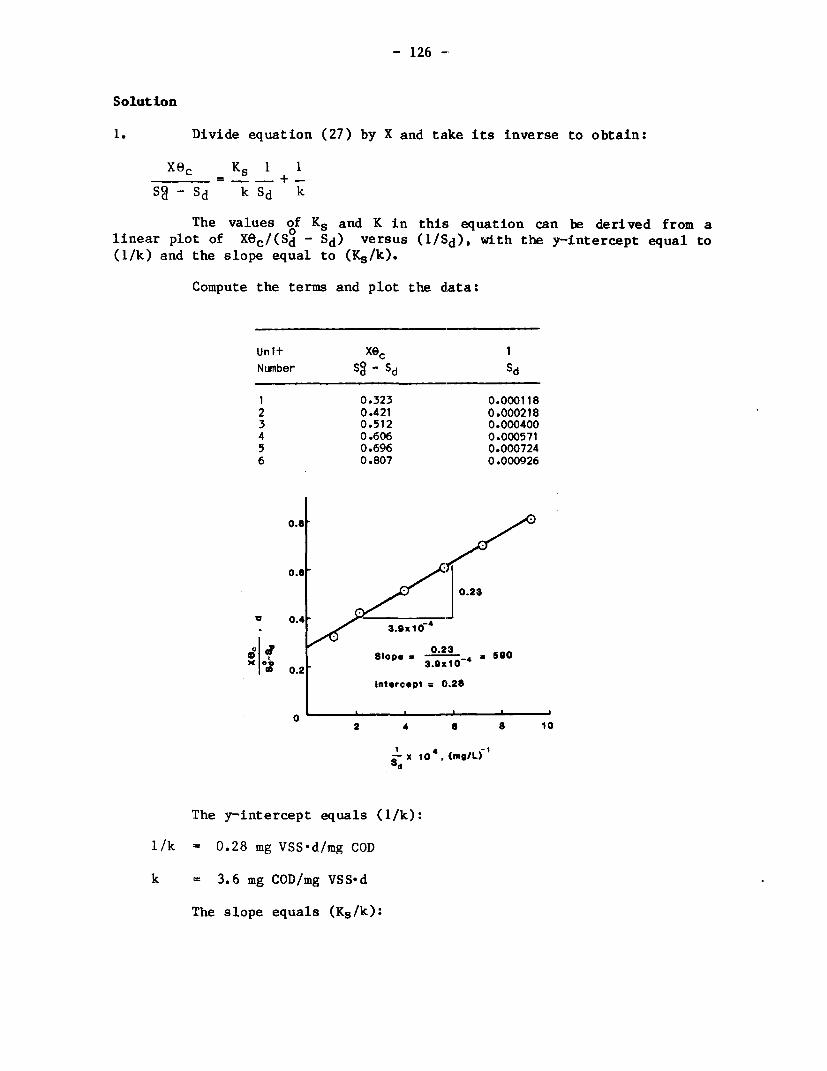
- 126 -
Solution
1. Divide equation (27) by X and take its inverse to obtain:
xec Ks 1 1
SR - Sd k Sd k
The values of Ks and K in this; equation can be derived from alinear plot of Xec/(Sd - Sd) versus (i/Sd), with the y-intercept equal to(1/k) and the slope equal to (Ks/k).
Compute the terms and plot the data:
Unit XeC 1
Number S - Sd Sd
1 0.323 0.0001182 0.421 0.0002183 0.512 0.0004004 0.606 0.0005715 0.696 0.0007246 0.807 0.000926
0.61
o.o jo0.23
0.4 -. OlOX O. '-X.9xto3.9 I 6`
9 1 S l o p o 0.23 00 *slope= 46CO 0.2 301
Intercept = 0.28
02 4 6 8 10
Sx 414, (rngL)
The y-intercept equals (1/k):
1/k = 0.28 mg VSS-d/mg COD
k = 3.6 mg COD/mg VSS.d
The slope equals (Ks/k):
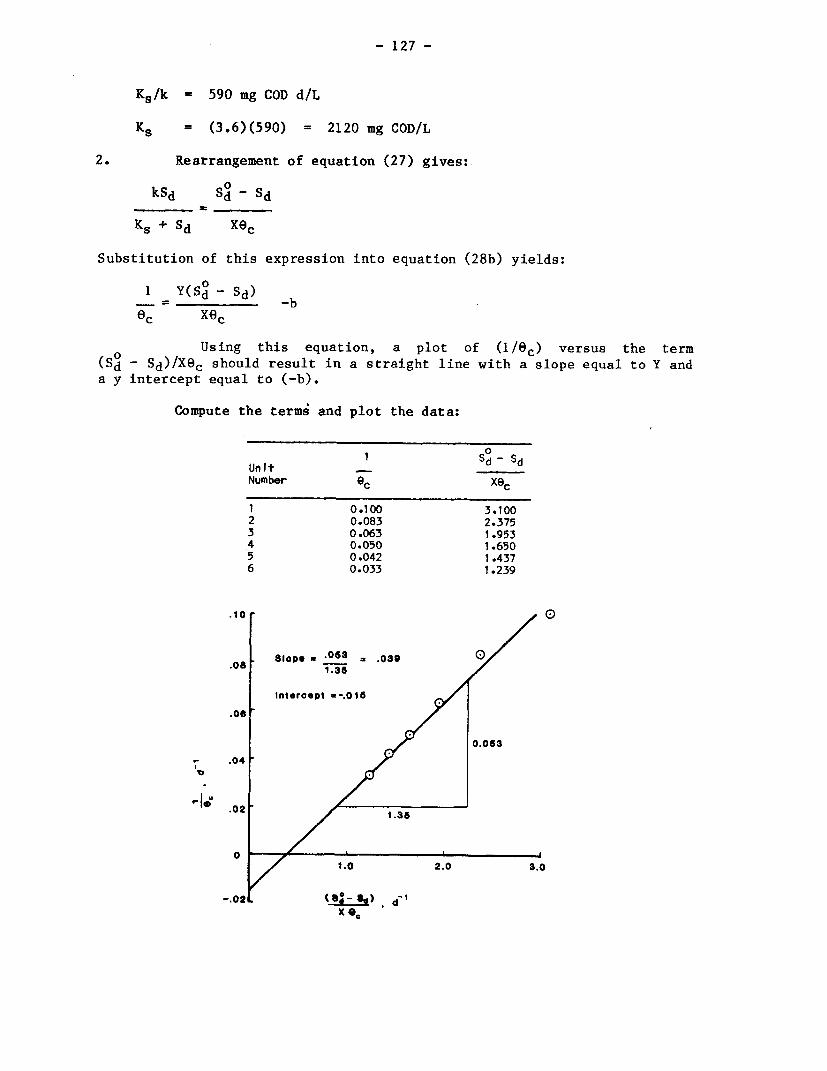
- 127 -
Ks/k = 590 mg COD d/L
Ks = (3.6)(590) = 2120 mg COD/L
2. Rearrangement of equation (27) gives:
0 kSd Sd -Sd
Ks + Sd xec
Substitution of this expression into equation (28b) yields:
1 Y(Sd' - Sd) b
(C Xf)c
Using this equation, a plot of (1/6c) versus the t:erm(Sd - Sd)/X9c should result in a straight line with a slope equal to Y anda y intercept equal to (-b).
Compute the terms and plot the data:
. ._0
Uni1t _ Sd - SdNumber c Xec
1 0.100 3.1002 0.083 2.3753 0.063 1.9534 0.050 1.6505 0.042 1.4376 0.033 1.239
.10
.Os Sopes .063 .039 .08 ~~1.36
Intercept *-.o15
.O6
0.063
7 .04
02 1.35
0/10 2.0 3.0
X 0.
- 128 -
The y-intercept equals (-b):
b = -(-0.015) = 0.015 d-1
The slope equals Y:
Y = 0.039 mg VSS/mg COD utilized
3. Compute em for a feed concentration of 15,000 mg/L by setting Sdequal to Sd in equation (28b):
1 kYSd (3.6)(.039)(15,000)- =0 - b = - 0.015 = 0.108em Ks+ Sd (2120 + 15,000)
em =9.25 dc
4. Calculate the effluent concentration using equation (28a), withec = 20m = 18.5 d:
Ks(l + b6c) (2120)[1 + .015(18.5)]Sd = = = 2050 mg COD/L
ec(Yk - b) - 1 18.5[.039(3.6) - .0151 - 1
5. Estimate the gas production rate using equation (30):
0.35(ST - ST)
e
mwhere e = Oc = 2 ec = 18.5 d and ST = Sd, because acetate is 100%degradable.
Thus,
0.35(15 - 2.05)v -- 035158-2.0 = 0.245 L methane/L reactor volume-d
18.5
Note that the units of ST to use in equation (30) are g COD/L.
As defined in the Monod model, X is the concentration of anaero-bic bacterial mass which is utilizing substrate in the digester. In theabove example, the value of X was taken as equal to the volatile solidscontent of the insolubles present in the digester. this is a reasonableassumption for such cases in which the f-eed contains no insoluble matterand thus all the solids in the digester can be presumed to be activeanaerobic bacterial matter. For most biogas feedstocks of interest,however, a substantial quantity of insoluble matter is introduced with thefeed, and it is difficult to determine what portion of the solids in thedigester constitute anaerobic bacterial mass. This means that X cannot bedetermined readily for most cases of practical interest, and thus therelations derived from the Monod model (equations 27 through 30) are mostuseful for soluble feedstocks (e.g., industrial wastewater). Digesterswith insoluble feeds are designed based on substrate-limited conditions, asassumed in the Monod model, but because X is difficult to measure, ec is
- 129 -
often used directly as a design parameter rather than relationships such asgiven in equations (27) through (30).
Application of Kinetic Models to Design of Various Digester Types
The discussions above have been directed mainly towards thesizing of continuous flow digesters without solids recycle. This sectionbriefly discusses examples of design approaches which can be used to sizeother types of anaerobic systems.
For batch reactions, the first-order model is typically used.For digestion of tropical vegetable material (e.g., grass, coffee husks),Boshoff (1967) used a formula similar to equation 32:
y = G(1 -e kit) (38)
where y = quantity of gas produced in time t;
G = quantity of gas produce at t - infinity; and
kl= first-order rate coefficient, time-1.
Once G and kl are evaluated (for a given feed and temperature),equation (38) can be used to calculate the time required in the reactor toproduce a desired amount of gas.
The performance of a plug flow reactor is approximately equal tothat obtained by several completely mixed reactors in series, as shown byJewell et al. (1980) using a first-order kinetic model. For n reactors inseries, it can be shown from equation (33) that the substrate concentrationin the final reactor is given by:
0n Sd-d = k16 n (39)
1 +n
where Sn , biodegradable substrate concentation in effluent from the nth(final) reactor, mass/unit volume;
n = number of reactors in series; and
9n= hydraulic residence time of the reactor series
(= 01 + 02 + * * * + On - ec)-
A plug flow reactor is more closely approximated if n is verylarge (n-->oO), in which case:
1im [ kl nlnn -- > V + 1-ex ep(kle) (40)
- 130 -
and
Sd= sd exp(-kle) (41)
This expression is of the same form as the result given above fora batch reactor (equation 38).
The factors affecting the k:Lnetics of waste removal in ananaerobic filter are complex but can be described using a first-order model(equation 31)(Young, 1968).
Due to vertical mixing with gas production, the kinetic behaviorin a filter lies between that of a plug flow reactor and that of acompletely mixed reactor. Filter performance data appear to be betterdescribed by the completely mixed reactor model, equation (33).
Here e is equal to the filter void volume divided by the flowrate of the feed stream. Values for kl, evaluated for many feedstocks andfilters, are approximately 0.45 hour-1 (McCarty, 1974), which for a deten-tion time of 10 hours would give a removal efficiency of the biodegradablefraction of 82%. However, for plastic media, kl tended to be lower, withvalues around 0.1 hour-1. The value of kl is determined experimentallyand is dependent on such factors as surface area of the media, biofilmdepth, mass transfer, and the kinetics of the reaction within the biofilm.Unfortunately, no method yet exists to evaluate kl from a fundamental view-point, although recent work on aerobic biofilm kinetics (Rittman andMcCarty, 1980) may be used eventually to predict anaerobic filter perfor-mance.
The performance of the contact process can be described by equa-tions expressed in terms of the solids residence time, Gc' such as equation(28b). Solids are retained in the contact system by use of a clarifier andsolids recycle stream, and thus the solids residence time (9c) can begreatly increased compared to the hydraulic residence time (0). Hence thereactor size (which depends on 0 rather than 0c) can be substantially re-duced compared with the volume of a digester without solids recycle.
Finally, for the ABR and UASB reactors, the kinetics appear tolie between those for suspended growth (e.g., completely mixed) and fixedfilm (e.g., anaerobic filter) systems. Since the fundamentals of fixedfilms are still poorly understood, design of these processes would probablyrequire laboratory or pilot scale experimentation, with assessment of per-formance based on loading rates and on ec.
Factors Influencing the Sizing of Anaerobic Digesters
In the foregoing discussion, the solids residence time has beengiven as a key variable affecting digester performance. It is important toconsider other factors as well in sizing digesters. Suppose a digester isto be sized to achieve the maximum methane production rate per unit ofreactor volume, and that the Contois model has been found to be applica-
- 131 -
ble. From equation (36), the volumetric gas production rate is a functionof:
a. Bo, the ultimate biodegradability (i.e., the yield ofmethane per gram of volatile solids added as 0 approachesinfinity);
0b. St, the feed substrate concentration, mass/unit volume;
c. 0, the residence time; and
d. K and jum, kinetic constants
The ultimate biodegradability, Bo0 is a function of the chemicalstructure and compostion of the feed (e.g., glucose is 100% degradablewhereas lignin is virtually refractory). Pretreatment methods can be usedto increase Bo.
At low concentration (e.g., up to about 3.5%VS), Wv increases0 0
linearly with increased ST. At higher concentrations, increases in ST haveless effect, apparently due to mass transfer limitations. This phenomenonis best expressed in terms of the loading rate, SO/8. At low loading rates(e.g., up to 1 kg VS per m3 of reactor per day) and constant conditions,methane yield per kg of VS is constant (i.e., independent of loading). Atsome higher loading rate, the methane yield per kg of VS will fall off.This critical loading rate depends on feed properties, and is much higherfor soluble substrates than for insoluble feeds.
The kinetic coefficients also strongly affect Yv* These are! inturn affected by the temperature of the system and by the presence of toxi-cants. Decreased uAm and increased Ks occur in the presence of toxicants.Increased temperature results in increased values of um; typical correc-tions are:
um = 0.13T - 0.129 (42)
where T is in degrees Celsius (Hashimoto et al., 1981), and:
_ kT exp(T - 20) (43),02 0
where T = temperature, °C;
PT = specific growth rate at temperature T, time -1;
p20 = specific growth rate at 20°C, time-1; and
kT = temperature-activity coefficient, dimensionless.
- 132 --
A P P E N D I X I I
GLOSSAIY
Acid-forming Bacteria--The group of bacteria in a digester that producevolatile acids as one of the by-products of their metabolism.
Active Volume--The actual volume available in a digester for bacterialaction. It is calculated by subtracting the volume occupied by grit andscum from the volume of the digester occupied by sludge.
Aerobic--In the presence of free oxygen.
Aerobic Bacteria--Bacteria which live and reproduce only in an environmentcontaining oxygen which is available for their respiration, such asatmospheric oxygen or oxygen dissolved in water.
Alkaline--The condition in which there is present a sufficient amount ofalkali substances to result in a pH above 7.0.
Anaerobic--Without the presence of free oxygen.
Anaerobic Bacteria--Bacteria that live and reproduce in an environmentcontaining no free or dissolved oxygen.
Anaerobic Contact Process--An anaerobic digestion process in whichthe microorganisms are separated from the effluent slurry by sedimentationor other means and returned to the digester to increase the rate ofstabilization.
Anaerobic Digester--A reactor that is constructed to bring about thedegradation of organic matter by anaerobLc bacteria.
Anaerobic Digestion--The degradation and stabilization of organic materialsbrought about by the action of anaerobic bacteria with the production ofbiogas (biomethanation). The process is slightly exothermic (heat-producing).
Batch-Feed Digester--A digester which retains all the feedstock added in asingle charge. Di'scharge of the entire batch occurs at the end of theretention time.
Benefits--Tangible benefits of a biogas system are those that are easilyquantifiable and have a monetary value. Such benefits include the value ofthe gas and the fertilizer produced. [ntangible benefits are those thatare not so easily quantified or related to a monetary value. Examplesinclude the value of an improvement in environmental sanitation.
- 133 -
Biofeed--Solids recovered from digested sludge and processed into feedmaterial.
Biogas--A mixture of gases, predominantly methane and carbon dioxide,produced by anareobic fermentation.
Biogas Plant--A facility used to process organic matter to produce biogasand sludge; it consists mainly of a digester and gasholder.
Buffer Capacity--A measure of the capacity of water or wastewater foroffering a resistance to changes in pH.
Calorific Value--The amount of heat that can be obtained from a fuel,usually expressed in terms of calories per unit weight (volume) of thefuel.
Catabolism--Destructive metabolism involving the production of energy andresulting in the breakdown of complex materials within the organism.
Carbon/Nitrogen Ratio (C/N Ratio)--The ratio of organic carbon to that oftotal nitrogen.
Coliform--A rod-shaped bacterium found in intestinal tracts of mostanimals, which is often used as an indicator to detect fecal contamination.
Composting--Controlled decomposition of organic matter under aerobicconditions by which material is transformed to humus. The process isexothermic resulting in a rise in temperature.
Continuous-Feed Digester--A digester which is regularly charged with smallamounts of fresh slurry at short intervals; the freshly charged slurryautomatically displaces an equal volume of effluent and the processcontinues without interruption.
Degradation--The breakdown of substances by chemical, physical, and/orbiological action.
Denitrification--Anaerobic reduction of nitrogen compounds, such asnitrates, to elemental nitrogen.
Detention Time--The theoretical period of residence in a given volume orunit. It is normally calculated by dividing the active volume of the unitby the rate of flow of the liquid through it.
Dewatering--The process of removing water from the effluent slurry of adigester by evaporation or filtration.
Digester--The unit in which anaerobic digestion takes place, which may beconstructed so as to store the biogas produced by anaerobic digestion.
Digester Slurry--Mixture of fermented organic matter and water.
- 134 -
Digestion--The controlled decomposition of organic substances, normallyunder anaerobic conditions.
Effluent--The sludge or spent slurry from a continuous-fed digester.
Enzyme--A complex organic substance (protein) produced by living cells andhaving the property of accelerating transformations such as digestionprocesses.
Facultative--The ability of microorganisms to live under either aerobic oranaerobic conditions.
Floating Gasholder--A biogas container consisting of an inverted open-toptank floating over a pool of liquid suclh as digester slurry; it rises whenit fills with biogas and sinks as the gas is depleted. The weight of thefloating cover controls the pressure of the gas which is discharged fromthe gasholder.
Gasholder--k=seh-arate -appurtenance that receives and stores the gasproduced in a digester.
Grit--Heavy mineral matter often present in digester feedstock such assand, gravel, and cinders, which accumulates in the bottom of the digester.
Humus--The end product of a composting or digestion process.
Hydraulic-Retention Time--The average time that a liquid stays in a reactorbefore it is discharged. It is equal to the active volume of the reactordivided by the flow rate of the liquid entering it. It is usuallyexpressed in days but may be as short as hours.
Inactivation--The process by which parasite eggs, pathogenic bacteria andviruses are rendered inactive and hence unable to propagate.
Inoculant, Inoculum---Any material, such as previously digested feedstock,that is added to a newly started digester to hasten the degradation oforganic matter and the production of methane.
Inorganic Matter--Material in solution or suspension, such as sand, salt,iron, calcium, and other minerals, which are not degraded bymicroorganisms.
Manure--Animal excreta, normally fecal matter from livestock.
Manure Slurry--The mixture of manure and water coming from livestock pens.
Mesophilic--Within a moderate temperature range, normally 30-40°C.
Metabolism--The biochemical changes in living cells by which energy isprovided for vital processes and activities, and new material issynthesized (catabolism + anabolism).
Methane (CH4)--A colorless, odorless, flammable gas and the main
constituent of natural gas, coal gas and biogas.
- 135 -
Methane Forming Bacteria--The group of bacteria in a digester that usesacetate and H2 as energy sources and produces methane.
Night Soil--Human feces and urine collected by buckets or vacuum trucks.
Organic Matter--Materials which come from animal or vegetable sources.Organic matter generally can be degraded by bacteria and othermicroorganisms.
Pathogen--Disease-causing organism.
Plug Flow--Movement without mixing in the axial (longitudinal) direction ina digester. The opposite of complete-mixing in digesters.
Retention Time--The number of days that organic matter or bacteria remainin the digester. See also Detention Time.
Sludge--The slurry of settled particles resulting from the process ofsedimentation.
Sludge Digestion--A process by which organic matter in sludge is gasified,liquified, mineralized, or converted to a more stable form, usually byanaerobic organisms.
Specific Volume--Daily volume of biogas produced per unit volume ofdigester.
Supernatant--Liquid removed from settled sludge. Supernatant colmmonlyrefers to the liquid between the sludge in the lower portion and the scumon the surface of an anaerobic digester.
Suspended Solids--Solids that are in suspension in water or other liquids.
Thermophilic--Of a relatively high temperature, normally in the range of50-80°C.
Toxicity--A condition that will inhibit or destroy the growth or functionof an organism.
Total Solids--The sum of dissolved and suspended constituents in a sample,usually stated in milligrams per liter.
Volatile Acids--Short chain (C1 - C2) fatty acids which are produced byacid forming bacteria. They are soluble in water, can be steam-distilledat atmospheric pressure, and are commonly reported as equivalent to aceticacid (moles/L of acid x 60 = mg/L of acetic acid).
Volatile Solids--The solids that volatilize and therefore are lost onignition of a sample of dry solids at 550°C. Representing the organicmatter in the sample, the volatile solids are expressed as a percentage ofthe total solids.

- 137 -
R E F E R E N C E S
Alaa El-Din, M.N., El-Shimi, S.M., Mahmou, M.H., Abd. El-Aziz, I.M., Ali,B.E., Mohamed, M.E., and Anton, G.G. (1982). Progress report on theactivities of the FAO/MOA project TCP/EGY 0003 (MI): Biogas for ruralpopulation. Dept. of Agricultural Microbiology, Institute of Soils andWater Research, Agricultural Research Center, Giza, Egypt.
Alicbusan, R.V., Abad, E.J., Silverio, M., and Arceo, T.L. (n.d.). Econo-mic and net-energy analysis of biogas systems. National Institute ofScience and Technology, Manila, Philippines.
Alpern, R. (1981). Landfill gas potential of Angeles City refuse. M.S.thesis, Department of Civil Engineering, University of Southern Cali-fornia, Los Angeles.
Alviar, C.J., Baoy, G.T., Calangi, D.B., Castillo, A.C., Averion, M.O.,Elefano, S.C., Santos, R.S., Benet, R., and Hocon, R. (1980). Cow manurebiogas production and utilization in an integrated farm system at theAlabang dairy project. Paper presented at the 47th Annual Convention ofthe Philippines Veterinary Medical Association, February.
American Chemical Society (1972). Solid Waste II. Washington, D.C.,U.S.A.
Anderson, G.K., Donnelly, T., and McKeown, K.J. (1982). "Identificationand control of inhibition in the anaerobic treatment of industrial waste-waters." Process Biochemistry, 17 (4) 28-32.
Arora, H.C., Chattopadhya, S.N., and Routh, T. (1975). "Treatment of vege-table tanning effluent by the anaerobic contact filter process." WaterPoll. Contr. (G.B.), 74 (5) 584.
Arora, H.C., and Chattopadhya (1980). "Anaerobic contact filter process:a suitable method for the treatment of vegetable tanning effluents,"Water Poll. Contr. (G.B.), 79 (5) 501-6.
Augenstein, D.C., Wise D.L., and Wentworth, R.L. (1976). "Fuel gas recov-ery from controlled landfilling of municipal wastes," Resource Recovery &Conservation, 2, 103.
Azusa Land Reclamation Co. (1982) Report to Government Refuse Collection &Disposal Assn., Inc., Washington, D.C.
Bachmann, A., Beard, V.L., and McCarty, P.L. (1982). Comparison of fixed-film reactors with a modified sludge blanket reactor. Proceedings of the1st International Conference on Fixed-Film Biological Processes, KingsIsland, Ohio, April.
- 138 -
Bahadur, S., and Agarwal, S.C. (n.d.). Community biogas plant at FatehSingh Ka Purwa--an evaluation. Planning Research and Action Division(PRAD), State Planning Institute, Lucknow, India.
Barker, H.A. (1956). Bacterial fermentations. CIBA Lectures in MicrobialBiochemistry, Institute of Microbiology, Rutgers, New Jersey, USA.
Barnett, A. (1978). "Biogas technology: A social and economic assess-ment." In Barnett, A., Pyle, L., and Subramanian, S.K., BiogasTechnology in the Third World: A Multldisciplinary Review, InternationalDevelopment Research Center, Ottawa, Canada.
Baron, J.L., Eberhard, R.C., Phillips, L.C., Shadel, S.L., and Yoshiaka,G.A. (1981). "Landfill Methane Utilization Technology Workbook" U.S.Dept. of Energy Report No. CPE-8101, Johns Hopkins University AppliedPhysics Laboratory, Baltimore, Maryland, 1981.
Berger, R.L. (1976). Economics of gobar gas. Division of ConsultingServices, United Mission to Nepal, Butwal, Nepal.
Bhatia, R. (1977). Economic appraisal of biogas units in India: frameworkfor social benefit cost analysis. Economic and Political Weekly, Bombay,India.
Bhatia, R., and Niamir, M. (1979). Renewable energy sources: thecommunity biogas plant. Presented at: a seminar in the Department ofApplied Sciences, Harvard University, Cambridge, Mass., November.
Bhatia, R. (1980). Energy and rural development--ar analytical frameworkfor socio-economic assessment, technology and policy alternatives.Working document for participants at the Research Implementation Workshopon Energy and Rural Development, Chiang-Mai, Thailand, February, EastWest Center, Honolulu, Hawaii, U.S.A.
Bhavani, S. (1976). "Biogas for fuel and fertilizers in rural India - asocial cost-benefit analysis." Indian Journal of Agric. Econ., 31 (3)219-31.
Boersma, L., Gasper, E., Oldfield, J.E., and Cheeke, P.R. (1981). MethodsFor the recovery of nutrients and energy from swine manure. 2. Protein."Neth. J. Agric. Sci., 29, 99-112.
Boone, D.R., and Bryant, M.P., (1980). "Propionate-degrading bacteriumSyntrophobacter wolinii, sp. nov., gen. nov. from methanogenic eco-systems." Appl. Environ Microbio., 40, 626-32.
BORDA Biogas Manual (1980). Biogas manual for the realization of biogasprogrammes, Bremen, FRG, 1-116.
Boshoff, W.H. (1965). "Methane gas production by batch and continuousfermentation." Tropical Science, 3, 155-65.
- 139 -
Boshoff, W.H. (1967). "Reaction velocity constants for batch methanefermentation on farms, notably in the tropics." J. Agric. Sci. Camb.,68, 347-9.
Brown, J.W., Pfeffer, J.T., and Liebman, J.C. (1976). Biological conver-sion of organic refuse to methane, U.S. Energy Research & DevelopmentAdministration Report COO/2917-3, University of Illinois, Urbana,Illinois, 1976.
Bryant, M.P., Wolin, E.A., Wolin, M.J., and Wolfe, R.S. (1967). "Methano-bacilus omeliamskii, a symbiotic association of two species of bac-teria." Arch. Mikrobiol., 59, 20.
Buivid, M.D., Wise, D.L., Blanchet, M. J., Remedios, E.C., Jenkins, B.M.,Boyd, W.F., and Pacey, J.G. (1981). "Fuel Gas Enhancement by ControlledLandfilling of Municipal Solid Wastes," Resource Recovery & Conservation,6, 3.
Buswell, A.M. and Hatfield, W.D. (eds.) (1936). Anaerobic Fermentations,State of Illinois, Dept. of Registration and Education, Div. of the StateWater Survey, Urbana, Illinois, Bulletin No. 32, 1-193.
Buswell, A.M., and Neave, S.L. (1930). Laboratory Studies of Sludge Diges-tion. State of Illinois, Dept. of Registration and Education, Div. ofthe State Water Survey, Urbana, Illinois, Bulletin No. 30, 1-84.
Chan, G.L. (1973). Integrated rural development. In a workshop organizedby the Dept. of Agriculture, Papua, New Guinea, Port Moresby, Papua NewGuinea, July.
Chan, G.L. (1975). Socio-economic aspects of various biogas systems. Eco-nomic and Social Commission for Asia and the Pacific, Workshop on BiogasTechnology and Utilization, October, Manila, Philippines.
Chan, U Sam (1982). State of the art review on the integrated use ofanaerobic processes in China. Internal report prepared for IRCWD,September.
Chavadej, S. (1980). Anaerobic filter for biogas production. ThaiInstitute of Scientific and Technological Research, Bangkok, Thailand,January.
Chen, Y.R., and Hashimoto, A.G. (1978). "Kinetics of methane fermenta-tion." Biotech. and Bioeng. Symp., No. 8 269-82.
Chen, Y.R., et al. (1980). "Effect of temperature on methane fermentationkinetics of beef-cattle manure." Biotech. and Bioeng. Symp., No. 10,325-39.
Chynoweta, D.P., et al. (1978). Biomethanation of giant brown kelp,macrocystitis pyrifera. Symposium papers on Energy from Biomass andWastes, August, Washington, D.C., 229-51.
- 140 -
Cointreau, S.J., Gunnerson, C.G., Huls J.M., and Seldman, N.N. (1984).Recycling from Municipal Refuse, WorLd Bank Technical Paper No. 30,Washington, D.C.
Colberg, P.J., Baugh, K., Everhart, T., Bachmann, A., Harrison, D.,Young, Y.L., and McCarty, P.L. (1980). Heat treatment of organics forincreasing anaerobic biodegradability. Civil Eng. Dept. TechnicalReport No. 253, Stanford University, Stanford, CA, USA.
Contois, D.E. (1959). "Kinetics of bactierial growth: relationship betweenpopulation density and specific growth rate of continuous cultures." J.Gen. Microbiol., 21, 40-50.
Converse, J.C., Evans, G.W., Verhoven, C.R., Gibbon, W., and Gibbon, M.(1977). Performance of a large size anaerobic digester for poultrymanure. ASAE Paper No. 77-0451, ASAE, St. Joseph, MI 49085.
Cooney, C.L. and Wise, D.L (1975). "Thermophilic Anaerobic Digestion ofSolid Wastes for Fuel Gas Production," Biotechnology & Bioengineering,17, 1119.
de Lucia, R.J., and Bhatia, R. (1980). Economics of renewable energytechnologies in the rural third world. Meta Systems, Cambridge, Mass.,USA, October.
Department of Non-Conventional Energy Sources (DNES), Annual Report1982-83. Ministry of Energy, Government of India, New Delhi.
ECWA (1981). New and renewable energy in the Arab world. United NationsEconomic Commission for Western Asia, Beirut, January.
El-Halwagi, M.M. (1979). The development and application of biogastechnology in rural areas of Egypt, first progress report of appliedscience and technology. Project No. 263-0016, National Research Centre,Dokki, Cairo, Egypt, March.
El-Halwagi, M.M. (1982). The state of the art of anaerobic digestion inthe Arab speaking countries and West Africa. Internal report preparedfor IRCWD, June.
EMCON (1981). State of the art of methane gas enhancement in landfills,report for U.S. Dept. of Energy, EMCON Associates, San Jose, California,June, 1981.
Engineering Science, Inc. (1964). Azusa Experimental Fill--Study 5, TableIII, Engineering Science, Inc., Berkeley, California.
ESCAP (1980). Guidebook on biogas develoment, Energy Resources DevelopmentSeries, No. 21.
ESCAP (1981). Renewable sources of energy. ECDC-TCDC, Vol. II, BIOGAS.
- 141 -
Fair, G.M., and Moore, E.W. (1932). "Heat and energy relations in thedigestion of sewage solids-III. Effect of temperature of incubation uponthe course of digestion." Sewage Works J., 4 (4) 589-600.
Fair, G.M., and Moore, E.W. (1934). "Time and rate of sludge digestion;and their variation with temperature." Sewage Works J., 6 (1) 3-13.
Fair, G.M., and Moore, E.W. (1937). "Observations on the digestion of asewage sludge over a wide range of temperatures." Sewage Works J., 9 (1)3-5.
FAO (1981). The development and use of biogas technology in rural areas ofAsia. Project Field Document No. 10. Improving Soil Fertility ThroughRecycling. FAO/UNDP Regional Project RAS/75/004. UN Food andAgriculture Organization, Rome.
Farquhar, G.J., Clement, B.N., and Constable, T.N. (1982). "AnInvestigation of Gas Production, Extraction & Utilization at a CanadianLandfill," Ver8ffentlichungen des Instituts fur Stadtbauwesen TechnischeUniversitgt Braunschweig, Gas- und Wasserhaushaft von Malldeponien,Braunchsweig, FRG.
Feachem, R., Bradley, D.J. Garelick, H., and Mora, D.D. (1983). Sanitationand disease: health aspects of excreta and waste water managemenl-, J.Wiley and Sons, Chichester, U.K.
Fischer, J.R., Iannotti, E.L., Porter, J.H., and Garcia, A. (1979)."Producing methane gas from swine manure in a pilot-size digester."Trans. ASAE, 22, 370.
Franzius, V. (1982), "Utilization of landfill gas in Federal Republic ofGermany BMFT Projects," edited by K. Thome-Kozmiensky, RecyclingInternational-Recovery of Energy and Materials from Residues and Wastes,E. Freitag, Berlin, 1982.
French, D. (1979). The economics of renewable energy systems fordeveloping countries, Washington DC, USA.
Fry, L.J. (1975). Practical building of methane power plants for ruralenergy independence, D.A. Knox, Andover, Hamsphire, USA.
Galano, R.I., de los Santos, A.G., Alicbusan, R., Belarmino, P.A., andCaron, G.M. (n.d.). Biogas technology: social and economic evaluation.De LaSalle University, Manila, Philippines.
Garber, W.F. (1954). Pilot-scale studies of thermophilic digestion atLos Angeles. Sewage and Ind. Wastes, 26, 1202.
Garber, W.F., O'Hara, G.T., Colbaugh, J.E., and Raksit, S.K. (1975).Thermophilic digestion at the Hyperion treatment plant. J. Water Poll.Cont. Fed., 47 (5) 950-61.
- 142 -
Garber, W.F. (1977). Certain aspects of anaerobic digestion of wastewatersolids in the thermophilic range at the Hyperion treatment plant. Prog.Wat. Tech., 8, 401-6.
Ghate, B.P. (1979). Biogas, A pilot plant to investigate a decentralisedenergy system: Planning Research and Action Division, Planning Dept.,State Planning Institute, Uttar Pradesh, India.
Ghosh, S., and Klass, D.L. (1979). The production of substitute natural gasand recyclables from municipal solid waste. Recyc. Berl., 79, (2) 789-94.
Gittinger, J.P. (1972). Economic Analysis of Agricultural Projects, TheJohns Hopkins Press, Baltimore and London.
Golueke, C.G. (1958). "Temperature effects on anaerobic digestion of rawsewage sludge." Sewage and Ind. Wastes, 30 (10) 1225-32.
Golueke, C.G., Ed. (1971). Comprehensive studies of solid waste manage-ment, Report to the U.S. Environmental Protection Agency, University ofCalifornia, Berkeley, California.
Gosling, D. (1980). Renewable energy resources in Thailand and thePhilippines. Dept. of Theology, University of Hull, Hull, U.K.
Gossett, J.M. (1976). Heat treatment of refuse for increasing anaerobicbiodegradability. Ph.D. Thesis, Civil Eng. Dept., Stanford University,California, USA.
Grady, C.P.L. and Lim, H.C. (1980). Biological Wastewater Treatment,Theory and Application, Marcel Dekker, Inc., New York and Basel, 883-6.
GRCDA (Government Refuse Collection and Disposal Assn.) (1983). ProjectSummary, Landfill Gas Control and Utilization Projects. GRCDA, P.O. Box7219, Silver Spring, Md. 20910, USA.
Gujer, W., and Zehnder, A.J.B. (1982). Conversion processes in anaerobicdigestion. Presented at the IAWPR Specialized Seminar on AnaerobicTreatment of Wastewater in Fixed-Film Reactors, Copenhagen, Denmark,June.
Halvadakis, C.P. (1983) Methanogenesis in solid waste landfill bioreactors,Ph.D. Dissertation, Stanford University, Palo Alto, California, USA.
Hamilton Standard (1980). Methane generation from cattle residue at a dirtfeedlot. U.S. Dept. of Energy Report DO)E/ET/20039-20, Hamilton Standard,Windsor Locks, Connecticut, USA.
Hamilton Standard (1981). Full scale experimental anaerobic fermentationfacility: final report for design, construction & operation. U.S. Dept.of Energy Report DOE/ET/20009-T1. Hamilton Standard, Windsor Locks.Connecticut, USA.
Han, Y.W. and Calliban, C.D. (1974). Cellulose fermentation: effect ofsubstrate pretreatment on microbial growth. Appl. Microbial, 27 (1),159-65.
- 143 -
Hao, P.L.C., Yu, A.P., and Tang, H.S. (1980). Design and development of ared-mud plastic digester. Union Industrial Research Laboratories, Indus-trial technology Research Institute, Hsinchu, Taiwan.
Harris, J.M., Shirley, R.L., and Palmer, A.Z. (1982). Nutritive value ofmethane fermentation residue in diets fed to feedlot steers. J. AnimalScience, 55 (6) 1293-1302.
Hart, S.A. (1963). "Digestion tests of livestock wastes." J. Wat. Poll.Cont. Fed., 35 (6) 748-59.
Hashimoto, A.G., Chen Y.R., and Varel, V.H. (1981a). Anaerobic fermentationof beef cattle manure, final report. SERI (Solar Energy Res. Inst.),Colorado, USA, January, SERI/TR-98372-1, 1-67.
Hashimoto, A.G., Varel, V.H., and Chen, Y.R. (1981b). "Ultimate methaneyield from beef cattle manure: Effect of temperature, ration constitu-ents, antibiotics and manure age." Agric. Wastes, 3 (4) 241-56.
Hayes, T.D., Jewell, W.J.', Dell'Orto, S., Fanfoni, K.J., Leuschner, A.P.,and Sherridan, D.R. (1979). "Anaerobic digestion of cattle manure." InAnaerobic Digestion, Stafford, D.A., Wheatley, B.I., and Hughes, D.E.(eds), Applied Science, London, UK.
Hayes, T.D., and Theis, T.L. (1978). "The distribution of heavy metals inanaerobic digestion." J.Wat. Poll. Cont. Fed., 50 (1) 61-72.
Hiatt, W.C., Carr, A.D., and Andres, J.F. (1973). "Anaerobic digestion ofrum distillery wastes." Proc. 28th Conf. on Industrial Wastes, PurdueUniversity, 966.
Hills, D.J. (1979). Effects of carbon:nitrogen ratio on anaerobic diges-tion of dairy manure, Agric. Wastes, 1, 267-78.
Hobson, P.N., and Shaw, B.G. (1973). "The anerobic digestion of waste froman intensive pig unit." Water Res., 7, 437-49.
Hobson, P.N., and Shaw, B.G. (1976). "Inhibition of methane production byMethanobacterium formicicum." Water Res., 10, 849-52.
Hong, C.M., Koh, M.T., Chow, T.Y., Tsai, P.H., and Chung, K.T. (1979).Utilization of hog wastes in Taiwan through anerobic fermentation. Foodand Fertilizer Technology Center, Taipei, City, Taiwan, Extension Bulle-tin No. 131, October (FFTC EB 131).
Hu Bing-hong (1982). State of application and economic benefits from bio-gas and solar energy utilized in Xinbu Brigade of Leliu Commune. Scienceand Technology Commission, Shunde County, Guangdong, China, mimeo.
Huser, B.A., Wuhrmann, K., and Zehnder, A.J.B. (1982). Methanothrixsoehngenii, gen. nov. sp. nov., a new acetotrophic non-hydrogen-oxidizingmethane bacterium. Arch. Microbiol., 132, 1-9.
- 144 -
Hutchinson, T.H. (1972)."Methane farming in Kenya."Comp. Sci.,13,Nov.,30-1.
ICAR (1976). The economics of cow dung gas plants, Indian Council of Agri-cultural Research, New Delhi, India.
Idnani, M.A., and Varadarajan, S. (1974). Preparation of fuel gas andmanure by anaerobic fermentation of organic materials. Indian Council ofAgricultural Research, Technical Bull. No. 46, New Delhi, India.
Jewell, W.J., Davis, H.R., Gunkel, W.W., Lathwell, D.J., Martin, J.H.,McCarty, T.R., Morris, G.R., Price, D.R., and Williams, D.W. (1976).Report prepared for the U.S. Energy Research and DevelopmentAdministration, Report No. TIB 27164.
Jewell, W.J., Dell'Orto, S., Fanfoni, K.J., Fast, S.J., Jackson, D.A., Ka-brick, R.M., and Gottung, E.J.(1981).Crop residue conversion to biogas bydry fermentation. Presented at 1981 Winiter Mtg., ASAE, Chicago, USA, Dec.
Jewell, W.J., Dell'Orto, S., Fanfoni, K.J., Hayes, T.D., Lensehner, A.P.,and Sherman, D.F. (1980). AnaerobLc fermentation of agriculturalresidue: Potential for improvement and implementation. U.S. Dept. ofEnergy, Project No. DE-AC02-76ET20051, April, Vol. II, Final Report,1-599.
Judan, A.A. (1981). Biogas works at Maya farms: its socio-economicaspects. Maya Farms Bio-energy Consult.nts, Liberty Flour Mills, mimeo.
Kabaara, A.M. (1969). Effect of methane sludge on soil properties. KenyaCoffee, monthly bulletin, December.
Khan, A.W., and Mes-Hartree, M. (1981). "Metabolics of acetate and hydro-gen by a mixed population of anaerobes capable of converting cellulose tomethane." J. Applic. Bacteriology, 50, 283-8.
King, R.P. (1978). The development of biogas-slurry plants and systems inKenya. Prepared for ITDG (London), Dept. of Agric. Eng., Nairobi Univer-sity, Nairobi, Kenya, June.
Kispert, R.G., Sedek, S.G., and Wise, D.L.(1975),"An Economic Evaluation ofFuel Gas Production from Solid Wastes," Res. Recov. and Cons., 1, 95-109.
Kispert, R.G., Sedek, S.G., and Wise, D.L. (1976), "An Evaluation ofmethane production from Solid Wastes," Resource Recovery and Conserva-tion, Vol. 1, pp. 245-255.
Kladivko, E.J., and Nelson, D.W. (1979). Changes in Soil properties fromapplication of anaerobic sludge. J. Walt. Poll. Cont. Fed, 51, 325-32.
Kroecker, E.J., Schulte, D.D., Sparling, A.B., and Lapp, H.M. (1979).Anaerobic treatment process stability. J.W.P.C.F., 51 (4) 718-27.
Kugelman, I.J., and Chin, K.K. (1971). "Toxicity synergism and antagonismin anaerobic waste treatment processes." In Anaerobic Biological Treat-ment Processes, Adv. in Chem., Series 105, Pohland, F.G. (ed.) AmericanChem. Soc., Washington DC, USA, 55.
- 145 -
Kugelman, I.J., and McCarty, P.L. (1965). "Cation toxicity and stimulationin anaerobic waste treatment." I Slug feed studies. J. Wat. Poll. Cont.Fed., 37, 97-115.
Lal, D. (1974). Study on social process for evaluating public investmentprojects. Tech. working papers Nos. 1-15. Planning Commission, ProjectAppraisal Division, New Delhi, India.
Lauer, D.A., Bouldin, D.R., and Klausner, S.D. (1976). Ammonia volatiliza-tion from dairy manure spread on the soil surface." J.Env.Qual.,5,134-41.
Lawrence, A.W., and McCarty, P.L. (1964). "The effect of sulfides on an-aerobic treatment." Proc. 19th Ind. Waste Conference, Purdue University.
Leckie, J.D., Pacey, J.G., and Halvadkis, C.P. (1979), "Landfill managementwith moisture control," Proc. Amer. Soc. of Civil Eng., 107, EE2, 337-55.
Lettinga, G., Van der Geest, A.Th., Habma, S., and Van der Laan, J. (1979).Anaerobic treatment of methanolic wastes. Wat. Res., 13, 725-37.
Lettinga, G., Van Velsen, A.F.M., Habma, S.W., De Zeeuw, W.,and Klapwijk,A.(1980). Use of the upflow sludge blanket (USB) reactor concept for bio-logical wastewater treatment, especially for anaerobic treatment. B3io-tech and Bioeng., 22, 699-734.
Lichtman, R. (1983). Biogas systems in India. VITA, Washington, D.C.,USA.
Lyamchai, A.A., and Mushi, S.J.S. (1982). Outline of biogas technoLogydevelopment in Tanzania. Paper presented at the UNESCO/UNIDO Workshop onBiogas Technology in Africa, Arusha, Tanzania, February.
Mahin, D.B. (1982). Biogas in developing countries. Bioenergy SystemReport to USAID, Washington, DC.
Malina Jr., J.F. (1961). The effect of temperature of high-rate digestionof activated sludge. Proceedings, 16th Industrial Waste Conference,Purdue, 232-50.
Maramba, F.D. (1978). Biogas and waste recycling. The Philippine exper-ience. Maya Farms Division, Liberty Flour Mills, Inc., Metro Manila,Philippines.
Marchaim, U., Prochenski, D., Perach, Z., Lombrozo, E., Dvoskin, D., andCriden, J. (1981). The Israeli anaerobic digestion process--"NEFA*H":utilization of agricultural wastes to produce energy, animal and fishfood supplements and industrial products. A paper presented at theSecond International Symposium of Anaerobic Digestion, 6-11 September,Travermunde, Germany.
- 146 -
Marchaim, U., and Criden, J. (1981). "Research and development in theutilization of agricultural wastes in Israel for energy, feedstockfodder, and industrial products." In Fuel Gas Production from Biomass,Vol. I. Wise, D.L. (ed.), CRC Press, 'Boca Raton, Florida, USA, 95-120.
Marchaim, U. (1982). Personal communication.
Mazumdar, R. (1982). Review of the literature on the promotion of biogassystems (pilot ed.). Tata Energy Res. Inst., Doc. Center, Bombay, India.
McCarty, P.L. (1964a). "Anaerobic waste treatment fundamentals, Parts oneto four." Public Works, September-December.
McCarty, P.L. (1964b). "The methane fermentation." In Principles and Ap-lications in Aquatic Microbiology, Heukelekian, H., and Dondero, N.C.(eds.), John Wiley & Sons, New York, 3l4.
McCarty, P.L. (1972). Stoichiometry of biological reactions. Presentedat the International Conference Towards a Unified Concept of BiologicalWaste Treatment Design, Atlanta, Georgia, October.
McCarty, P.L. (1974). Anaerobic processes. Presented at the BirminghamShort Course on Design Aspects of Biological Treatment, IAWPR, BirminghamUK, September.
McCarty, P.L., Hann, D.J., McDermott, G.N., and Weaver, P.J. (1972)."Treatability of oily wastewaters from food processing and soap manufac-turing." Proc. 27th Conference on Industrial Wastes, Purdue University.
McFarlane, P.N., and Pfeffer, J.T. (1981). Biological conversion of bio-mass to methane; first subcontract report, 1 Jan. 1980 to 31 March 1981,SERI, Colorado, USA, SERI/TR-98357-1; July, 1-163.
McGarry, M.G., and Stainforth, M.G. (eds.) (1978). Compost, fertilizer,and biogas production from human and farm wastes in the People's Republicof China. Pub. IDRC-TS8e, International Development Research Center,Ottawa, Canada.
McInerney, M.J., Bryant, M.P., and Pfennig, N. (1979). "Anaerobicbacterium that degrades fatty acids in syntrophic association withmethanogens." Arch. Microbiol.,122, 129-35.
McInerney, M.J., and Bryant, M.P. (1981). "Review of methane fermentationfundamentals." Fuel Gas Production from Biomass, Vol. I, Wise, D.L.(ed.), CRC Press, Boca Raton FL, USA, 19-46
McMorrow, M.J., Burbank Jr., N.C., Young, R.H.F., Lau, L.S., and Klemmer,H.W. (1970). "Anaerobic digestion of pineapple mill wates." Proc. 25thInternational Conference on Industrial Wastes, Purdue University, 575.
Megerson, B. (1980). Introduction and popularization of biogas technology--The Ethiopian attempt and experience. ARSI Rural Development Project,Addis Ababa, Ethiopia.
- 147 -
Meta Systems (1981).Waste streams and integrated resource recovery systemsin developing countries. Consultancy report for AID. Holworthy St.,Mass. 01238, USA.
Mooij, H.P., and Streit, M. (1982). "ASEF Solid Wastes to Methane Gas,Pompano Beach, Florida, REFCON Technical Studies Report," U.S. Dept. ofEnergy, Waste Management Inc., Oak Brook, Ill., Feb. 1982.
Monod, J. (1949). "The growth of bacterial cultures." Ann. Rev. of Micro-biol., 3, 371-94.
Morris, G.R., Jewell, W.J., and Loehr, R.C. (1977). Anaerobic fermentationof animal wastes: A kinetic design evaluation. Proc. 32nd IndustrialWaste Conf., Purdue University, Lafayette, Ind., USA, 1-12.
Mosey, B.S. (1976). Assessment of the maximum concentration of heavy metalsin crude sewage which will not inhibit the anaerobic digstion of sludge.Wat. Poll. Cont.(G.B.), 75.
Mosey, F.E., Swanwick, J,D., and Hughes, D.A. (1971). "Factors affectingthe availability of heavy metals to inhibit anaerobic digestion." Wat.Poll. Control (G.B.), 668-80.
Moulik, T.K. (1982). Biogas energy in India. Academic Book Center,Ahmedabad, India.
Moulik, T.K., and Srivastava, U.K. (1975). Biogas plants at the villagelevel: problems and prospects in Gujarat. Center for Management inAgriculture, Indian Institute of Management, Ahmedabad, India.
Moulik, T.K., Srivastava, U.K., and Shingi, D.M. (1978). Bio-gas system inIndia, a socio-economic evaluation. Center for Management in Agricul-ture, Indiani Institute of Management, Ahmedabad, India.
Mountfort, D.O., and Ashner, R.A. (1978). "Changes in proportion of ace-tate and carbon dioxide used as methane precursors during the anaerobicdigestion of bovine waste." Appl. Env. Microbiol., 36, 648-54.
Mukherjee, S.K., and Arya, A. (1980). Comparative analysis of social cost-benefit studies of biogas plants. Presented at the Energy and RuralDevelopment Research Implementation Workshop, Chiang Mai, Thailand.
Mullan, J.D., Wyosnick, D.R., Gilleo, and Sheaffer, J.R. (1984). Apreliminary analysis of several working anaerobic digestion systems.World Bank data.
NAS (1977). Methane generation from human, animal, and agriculturalwastes. National Academy of Science, Washington, D.C.
National Office for Biogas Development and Extension (1982). Biogas inChina. Report at the technical consultation among developing countrieson large-scale biogas technology. Beijing, People's Republic of China.
- 148 --
Nelson, G.H., Straka, R.P., and Levine, M. (1939). "Effect of temperatureof digestion, chemical composition, and size of particles on productionof fuel gas from farm wastes." J. Agric. Research, 58, 273-87,Washington, D.C., USA.
Nian-Guo, Li (1982). Is the Xinbu system economically feasible? GuangzhouInstitute of Energy Conversion, Chinese Academy of Sciences, Beijing.
Odum, H.T. (1971).Environment, power and society. Wiley Intersci.,New York.
Odum, H.T., and Odum, E.C. (1971). E.nergy Basis for Man and Nature.McGraw-Hill, New York.
O'Rourke, J.T.(1968). Kinetics of anaerobic waste treatment at reduced tem-peratures. Ph.D. Thesis, Civil Eng. Dept., Stanford Univ., Calif., USA.
Owen, W.F., Stuckey, D.C., Healy Jr., J.B. Young, L.Y., and McCarty, P.L.(1979). "Bioassay for monitoring biochemical methane potential andanaerobic toxicity." Water Res. 13 (6), 485.
Pacey, J.G. (1982), Controlled landfill demonstration project--discussionof the first year of operation, Veroffentlichungen des Instituts furStadtbauwesen, Technische Universitat Braunschweig, Gas- und Wasser-haushaft von M'ulldeponien, Brauwnsweig, FRG.
Pang, A. (1978). Economics of gobar gas. Development and Consulting Ser-vices, United Mission to Nepal, Butwal, Nepal.
Parikh, K.S. (1963). Benefit-cost analysis of bio-gas plants in India.M.Sc. Thesis, Massachusetts Institute of Technology.
Parikh, K.S. (1976). Energy, Second India Studies. Macmillan Company ofIndia Ltd., Delhi, India.
Park, Y.D., and Park, N.J. (1981). A study of feasibility on the villagescale biogas plants through a farm demonstration trial during the winterseason. Research Reports of the OffLce of Rural Development, Suweon,Korea, 23, November.
Park, Y.D., Park, J.J., and Lim, J.H. (1979). A study of capability onPVC-bag type biogas generator. Research Reports of the Office of RuralDevelopment, Suweon, Korea, 23, November.
Pfeffer, J.T. (1974) Reclamation of energy from organic wastes, finalreport to U.S. Environmental Protection Agency, University of Illinois,Urbana, Illinois.
Pfeffer, J.T. (1974). "Temperature effects on anaerobic fermentation ofdomestic refuse." Biotech. and Bioeng., XVI, 771-87.
Picken, D.J., and Soliman, H.A. (1981). "The use of anaerobic digester gasas an engine fuel." J. Agric. Eng. Res., 26, 1-7.
- 149 -
Pohland, F.G. (1975). "Accelerated solid waste stabilization leachatetreatment by leachate recycle through sanitary landfills," Progress inWater Technology, 7 (1).
Pohland, F.G. (1980). Leachate recycle as landfill management option,"J. Environ. Eng. Div., Proc. Amer. Soc. of Civ. Eng., 80, EE6, Dece!mber.
Polprasert, C., Kanok-Nukulchai, W., and Rajput, V.S. (1982). A ferro-cement digester: Biogas and biomass production. J.Ferrocem.,12 (1):25-34.
Pradham, R.S.(n.d.) Status of biogas plants in Nepal.CEDA, Kattmandu, Nepal.
Prasad, C.R., Prasad, K.K., and Reddy, A.K.N. (1974). Biogas plants: Pros-pects, problems and tasks." Economic and Political Weekly, 9 (32-4).
Prasith-rathsint, S., Chupikoolchai, S., Arthornthurasook, T., Sukruya-pongse, P. (1979). The social and economic evaluation of biogas techno-logy in rural Thailand. IDRC Project File No. 3-p-77-00 7 6-0 4-02.
Prior, R.L., and Hashimoto, A.G. (1981). "Potential for fermented cattleresidue as a feed ingredient for livestock." In Fuel gas production frombiomass, Vol. II, Wise, D.L. (ed.), CRS Press, Boca Raton, Florida, USA,215-38.
Pyle, D.L. (n.d.) A preliminary assessment of the economics of biogas inKenya. Mimeo, Imperial College, London, U.K.
Qurishi, F.S. (1978). Biogas technology: evaluation of socio-economiceffects on the life of a rural family. Paper presented at the Economicand Social Commission for Asia and the Pacific, Expert Group MeetSing onBiogas Development, 20-6 June, Bangkok, Thailand.
Rahman, M. (1976). A preliminary report on the Academy biogas generator.Bangladesh Academy for Rural Development, Kotbari, Camilla.
Rajabapaiah, P., Ramanayya, K.V., Mohan, S.R., and Reddy, A.K.N. (1979)."Studies in biogas technology: Part I, performance of a conventionalbiogas plant." Proc. Indian Academy Sci., C2, Part 3, 357-63.
Ratusuk, S., Chantramonklasri, N., Srimuni, R., Ploypatarapunyo, P.,Chavadej, S., Sailamai, S., and Sunthonsan, W. (1979). Final report onpre-feasibility study of the biogas technology application in rural areasof Thailand. Environment and Development Research Dept., Applied Scien-tific Research Corporation of Thailand, submitted to IDRC, Canada.
Ravindranath, N.H., Nagaraju, S.M., Somashekar, H.I., Channeswarappa, A.,Balakrishna, M., Balachandran, B.N., and Reddy, A.K.N. (1980). An Indianvillage agricultural ecosystem--case study of Ungra Village, part I:main observations. Proceedings of Energy from Biomass conference,Brighton, November, 45-73.
Reddy, A.K.N., and Subramanian, D.K. (1979). "The design of rural energycenters." Proc. Indian Acad. Sci., X2, 395-416.
- 150 -
Rittman, R.E., and McCarty, P.L. (1980). "Model of steady state biofilmkinetics." Biotech. and Bioeng., 22, 2343.
Robbins, J.E., Arnold, M.T., and Lacher, S.L. (1979). Methane productionfrom cattle waste and de-lignified straw. Infection and Immunity, 38(1), 175-7.
Roeser, R.W. (1979). Cost-benefit analysis of biogas production in Pes-pire, Honduras. The Fletcher School, Tufts U. AID Contr. 522-T-411, Apr.
Roth, L.A., and Lentz, C.P. (1977). Anaerobic digestion of rum stillage."Canadian Institute Food Science Technol. J., 10 (2) 105-8.
Rottenberger, G. (1982). Personal communication.
Sanghi, A.K. (1979). Biogas in rural India: a perspective. Bureau of theBudget, Office of Planning, Springfield, Illinois, USA.
Santerre, M.T. (1981). Anevaluation of-biogas; windmill; and other ruralenergy technologies in Sri Lanka. Tech. memo TM-81-2, East-West Centre,Honolulu, Hawaii.
Santerre, M.T., and Smith, K.R. (1980). Application of the FLEAT approachto rural household and community anaerobic digestion systems. Report PR-80-5, East-West Centre, Honolulu, Hawaiii.
Sathianathan, M.A. (1975). Biogas: achievements and challenges. Associa-tion of Voluntary Agencies for Rural Development, New Delhi, India.
Schllenbach, S. (1980). Imperial Valley biogas project, operations andmethane production from cattle manure, October 1978 to November 1979. InSymposium Papers: Energy from Biomass and Wastes, IV, IGT, Chicago,Ill., USA.
Schmid, L.A. (1975). "Feedlot Waste to Useful Energy." Proc. Am. Soc.Civil Engrs., EE5, 101, EE5, 787.
Schmid, L.A., and Lipper, R.Z. (1969). Swine wastes, characterization andanaerobic digestion. Proc. Conf. on Agric. Waste Mgt., Cornell Univ.,Ithaca, N.Y., 50-7.
Schroepfer, G.J., Fullen, W.J., Johnson, A.S., Ziemke, N.T., and Anderson,J.J. (1955). "The anaerobic contact process as applied to packinghousewastes." Sewage and Ind. Wastes, 27 (4), 460-86.
Sharma, Y.N. (1980). Biogas development and application in India. Presen-ted at the Workshop on Low Cost Enetrgy for Water Pumping, Botswana,November, mimeo.
Shelef, G., Kimchie, S., and Grynberg, H. (1980). "High-rate thermophilicanaerobic digestion of agricultural wastes." Biotech. and Bioeng. Symp.No. 10, 341-51.
- 151 -
Sheridan, M. (1981). Peasant innovation and diffusion of agricultural tech-nology in China. Cornell Univ. Center for Intl Studies.
Shian, S., Chang, M. Ye, Y., and Chang, W. (1979). "The construction ofsimple biogas digesters in the Province of Szechwan, China." Auric.Wastes, 4, 247-58.
Simpson, D.E. (1971). "Investigations on a pilot-plants contact digesterfor the treatment of a dilute urban waste." Water Research, 5, 523-:32.
Singh, R.B., and Singh, K.K. (1978). Janata biogas plants: Preliminary re-port on design and cost. Planning Res. and Action Div., State PlamningDiv., Uttar Pradesh, India.
Sirohi, A.S. (1977). Cost-benefit analysis of biogas plants in India.'Work-shop on Biogas Systems, Mgt. Dev. Inst., New Delhi, India.
Smith, M.R., and Mah, R.A. (1978). "Growth and methanogenesis byMethanosarcins strain 227 on acetate and methanol." Appl. Environ.Microbiol., 36, 870.
Sola, G. (1979). Contribution of the biogas research team working in UpperVolta. Presented at the UNEP-China Training Seminar.
Solly, R.K. (1980). Integrated biogas systems in Fiji and the SouthPacific. Khadigramodyog, December, 156-63.
Speece, R.E., and McCarty, P.L. (1962). Nutrient requirements andbiological solids accumulation in anaerobic digestion. Paper presentedat the 1st International Conference on Water Pollution Research, London,UK, September.
Squire, L., and van der Tak, H.G. (1975). Economic Analysis of Projects.The John Hopkins University Press, Baltimore and London.
Srinivasan, H.R. (1978). Design aspects of KVIC biogas plants. Paper sub-mitted to Export Group Meeting on Biogas Development, Bangkok, June.KVIC, Bombay, India, 1-21.
Standard Methods for the Examination of Water and Wastewater (1975), 14thed., American Public Health Association.
Stuckey, D.C. (1980). Thermochemical pretreatment of nitrogenous organicsto increase methane yields. Ph.D. thesis, Stanford U., Calif., USA.
Stuckey, D.C. (1982). Biogas in China: a back-to-office report on a studytour of China. IRCWD, Dubendorf, Switzerland, December.
Stuckey, D.C. (1983). Biogas in developing countries. UnpubLishedreport. International Reference Center for Waste Disposal. SwissFederal Technical Institute (EAWAG), Duebendorf, Switzerland.
- 152 -
Stuckey, D.C., Parkin, G.F., Owen, W.F., and McCarty, P.L. (1978). Compar-ative evaluation of anaerobic toxicity by batch and semi-continuousassays. J.W.P.C.F., 52 (4), 720-9.
Stumm, W., and Morgan, J.J. (1970). Aquatic Chemistry, An Introduction Em-phasizing Chemical Equilibrium in Natural Waters, Wiley Intersci., N.Y.
Subramanian, D.K., Rajabapaiah, P., and Reddy, A.K.N. (1979). "Studies inbiogas technology." Part II--optimization of plant dimensions. Proc.Indian Acad. Science, C2 (3), 365-75.
Tabasaran, Oktay (1981). Production of methane from municipal sanitarylandfills and its utilization, presented at NATO Advanced Studies Insti-tute, Bogazici University, Istanbul, Turkey, June.
Tarrant, J. (1977). Waste not, want not. Biogas fuel for rural electrifi-cation in Debarek, Ethiopia. Mimeo.
TATA Energy Research Institute (1982). Biogas handbook. Pilot Edition.Bombay, India. March.
TATA Energy Research Institute. (1981) Renewable energy research inIndia, Bombay, India. August.
Terrado, E.M. (1981). "Biogas development: the Philippines." In BiomassEnergy Projects: Planning and Management, Goodman, L.J., and Love, R.M.(eds.), Pergamon Press, New York.
Theis, T.L., and Hayes, T.D. (1979). "Chemistry of heavy metals in anaero-bic digestion." Chemistry of Wastewater Technology, Chapter 23, AnnArbor Science, Ann Arbor, Mich. USA, 403-19.
Thery, D. (1977). "Biogas: a program for Sahelian countries." Ecodevelop-ment News, October, 33-5.
Thongkaimook, A. (1982). Economic analysis of some biogas technologies inthe Tropics. M.Sc. Thesis, Asian Institute of Technology, Bangkok, Thai-land.
Tyner, W.E., and Adams, J. (1977). "Rural electrification in India:biogas versus large-scale power." Asian Survey, 17 (8) 724-34.
Umana, A. (1982). State of the art review of anaerobic processes in LatinAmerica. Internal Report prepared for IRCWD, August.
UNEP (1981). Biogas fertilizer system. Technical Report on a TrainingSeminar in China. United Nations Environmental Programme, Nairobi,Kenya.
USEPA (1979). Sludge Treatment and Disposal. United States EnvironmentalProtection Agency. Washington, D.C.
- 153 -
van Brakel, J. (1980). The Ignis Fatuus of Biogas Small-Scale AnaerobicDigesters ("Biogas Plants"): A Critical Review of the Pre-1970 Litera-ture, Delft University Press.
van Buren, A. (ed.) (1979). A Chinese Biogas Manual--Popularizing Techno-logy in the Countryside, trans. Cook, M., Interm. Tech. Publ. Ltd., July.
Van Soest, P.J. (1979). Forages Fiber and the Rumen, Freeman, SanFrancisco, Calif., USA.
Van Velsen, A.F.M. (1979). "Adaptation of methanogenic sludge to highammonia-nitrogen concentrations." Water Res., 13 (10), 995.
Veit, M.A. (1982). Personal communication.
Veit, M.A. and Zulaut (1982). Brazil landfill gas potential. World Bankdata.
Walter, H. Harnickell, E., and Mueller-Dambois (1975). Climate-diagramMaps. Springer-Verlag, Berlin.
Ward, R.F. (1981). Digesters for the third world. Presented at a SecondInternational Symposium on Anaerobic Digestion. Travemunde, FRG.
Ward, R.F. (1982). The refeeding of digested cattle manure. World Bankdata. Washington, D.C.
Ward, R.F. (1984). Engineering design of biogas units for developing coun-tries. Intl. Conf. on Biogas Tech. Transfer and Diffusion, Cairo, Nov.
Wise, D.L., Kispert, R.G., Langton, E.W. (1981), "A Review of Bioconversionof Systems for Energy Recovery from Municipal Solid Wastes, Part II--FuelGas Production," Resources and Conservation, 6, 117-136.
Wise, D.L., Kispert, R.G. (1981), "A Review of Bioconversion of Systems forEnergy Recovery from Municipal Solid Wastes, Part III--Economic Evalua-tion," Resources and Conservation, 6, 137-142.
Wise, D.L. Personal Communication, 1983.
Wolverton, B.C., McDonald, R.C., and Gordon, J. (1975). Bio-conversion ofwater hyacinths into methane gas; Part I. National Space TeclnologyLaboratories, Report no. TM X-72725, 1-13.
Wolverton, B.C., and McDonald, R.C. (1978). Nutritional composition ofwater hyacinths grown on domestic sewage. NASA/ERL Rep. No. 173,Washington, D.C., USA.
Xinsheng, M., Ruchen, C., Nian-guo, L., Chengchun, H., and Shearer, W.(1980). "The Xinbu system: an integrated rural production system."Development Forum, 8 (9) November.
- 154 -
Yawalkar, K.S., and Agrawal, I.P. (n.d.). Manures and fertilizers. Agro-horticultural Publishing House, Nagpur, India.
Young, J.C. (1968). The anaerobic filter for waste treatment. Ph.D.Thesis, Civil Eng. Dept., Stanford University, Stanford, Calif., USA.
Young, J.C. and McCarty, P.L. (1969). "The anaerobic filter for wastetreatment." J. Wat. Poll. Cont. Fed., 41 (5), R 160-73.
Zehnder, A.J.B., and Wuhrmann, K. (1977). Arch. Microbiol., 111, 199.
Zehnder, A.J.B., Ingvorsen, K., and Marti, T. (1982). Microbiology ofmethane bacteria. Presented at the 2nd Intl. Symp. on AnaerobicDigestion. Travemunde, FRG, September, 1-26.
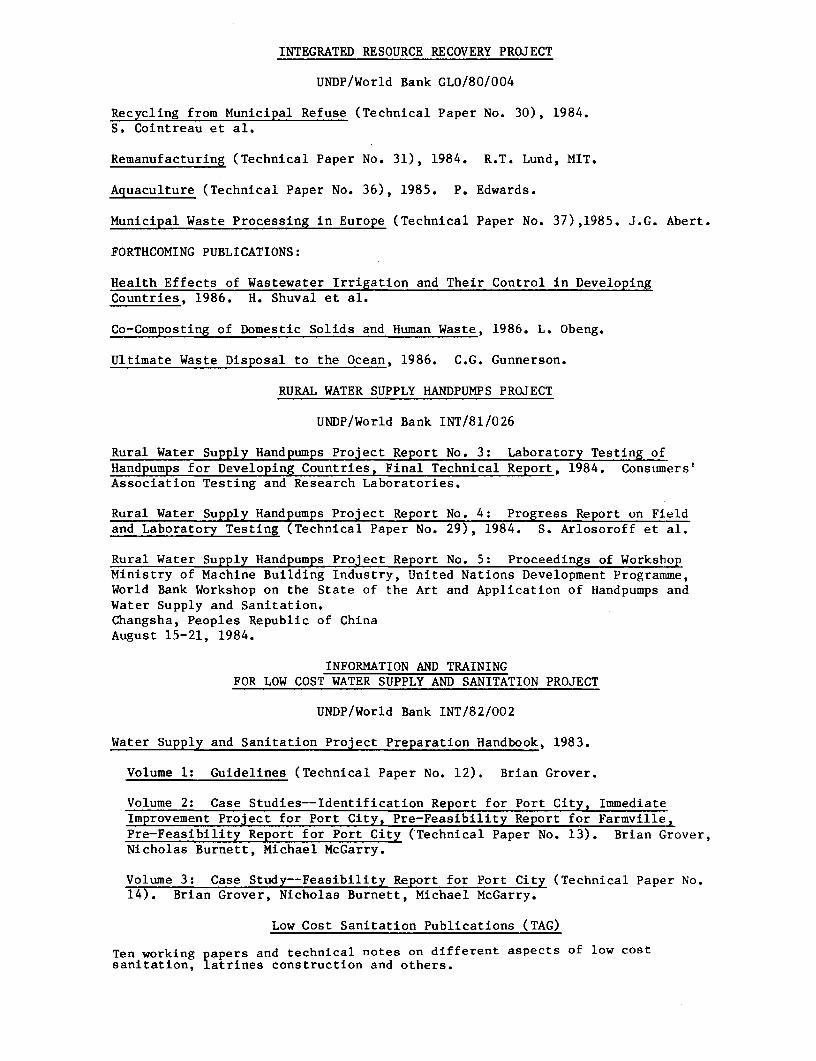
INTEGRATED RESOURCE RECOVERY PROJECT
UNDP/World Bank GLO/80/004
Recycling from Municipal Refuse (Technical Paper No. 30), 1984.S. Cointreau et al.
Remanufacturing (Technical Paper No. 31), 1984. R.T. Lund, MIT.
Aguaculture (Technical Paper No. 36), 1985. P. Edwards.
Municipal Waste Processing in Europe (Technical Paper No. 37),1985. J.G. Abert.
FORTHCOMING PUBLICATIONS:
Health Effects of Wastewater Irrigation and Their Control in DevelopingCountries, 1986. H. Shuval et al.
Co-Composting of Domestic Solids and Human Waste, 1986. L. Obeng.
Ultimate Waste Disposal to the Ocean, 1986. C.G. Gunnerson.
RURAL WATER SUPPLY HANDPUMPS PROJECT
UNDP/World Bank INT/81/026
Rural Water Supply Handpumps Project Report No. 3: Laboratory Testing ofHandpumps for Developing Countries, Final Technical Report, 1984. Consumers'Association Testing and Research Laboratories.
Rural Water Supply Handpumps Project Report No. 4: Progress Report on Fieldand Laboratory Testing (Technical Paper No. 29), 1984. S. Arlosoroff et al.
Rural Water Supply Handpumps Project Report No. 5: Proceedings of WorkshopMinistry of Machine Building Industry, United Nations Development Programme,World Bank Workshop on the State of the Art and Application of Handpumps andWater Supply and Sanitation.Changsha, Peoples Republic of ChinaAugust 15-21, 1984.
INFORMATION AND TRAININGFOR LOW COST WATER SUPPLY AND SANITATION PROJECT
UNDP/World Bank INT/82/002
Water Supply and Sanitation Project Preparation Handbook, 1983.
Volume 1: Guidelines (Technical Paper No. 12). Brian Grover.
Volume 2: Case Studies--Identification Report for Port City, ImmediateImprovement Project for Port City, Pre-Feasibility Report for FarmvillesPre-Feasibility Report for Port City (Technical Paper No. 13). Brian Grover,Nicholas Burnett, Michael McGarry.
Volume 3: Case Study--Feasibility Report for Port City (Technical Paper No.14). Brian Grover, Nicholas Burnett, Michael McGarry.
Low Cost Sanitation Publications (TAG)
Ten working papers and technical notes on different aspects of low costsanitation, latrines construction and others.

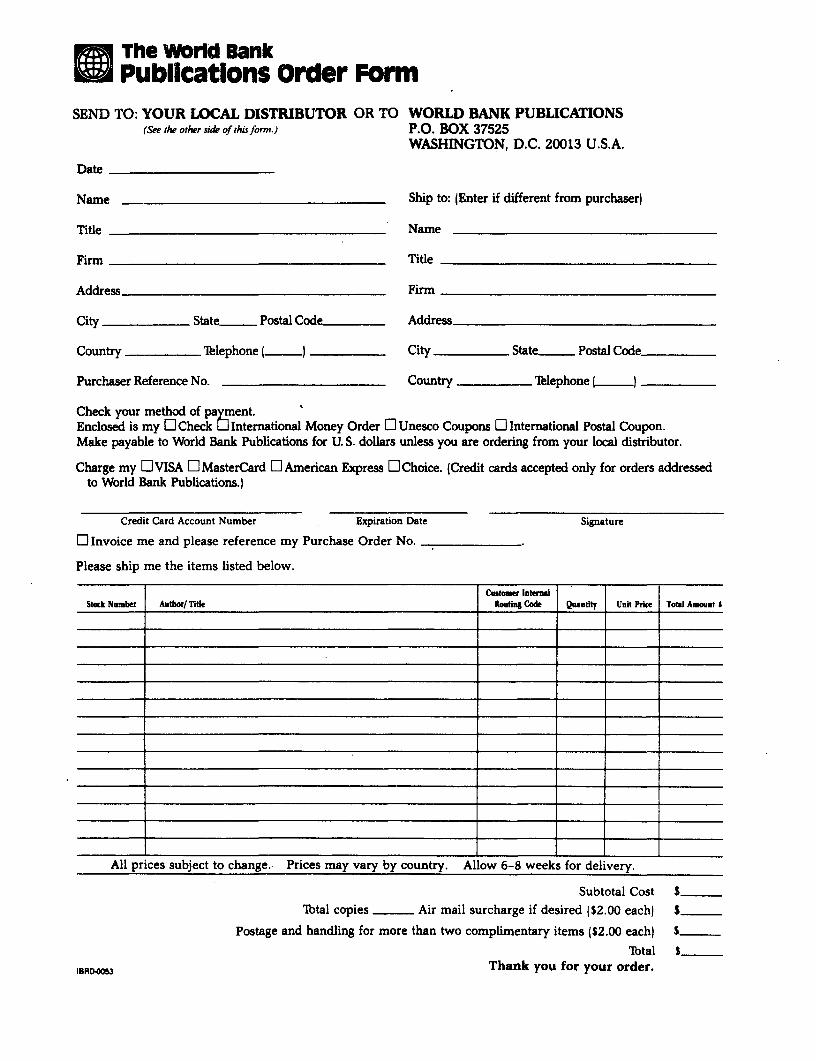
The Wold BankPublications Order Form
SEND TO: YOUR LOCAL DISTRIBUTOR OR TO WORLD BANK PUBLICATIONS(See the other sde of this form.) P.O. BOX 37525
WASHINGTON, D.C. 20013 U.S.A.
Date
Name Ship to: CEnter if different from purchaser)
Title Name
Firm Title
Address Firm
City State Postal Code_ _ Address
Country Telephone ( City State-_ Postal Code..
Purchaser Reference No. Country Telephone l )
Check your method of payment.Enclosed is my El Check 3 International Money Order a Unesco Coupons 0 International Postal CouponMake payable to World Bank Publications for U S. dollars unless you are ordering from your local distributor.
Charge my 2 VISA 3l MasterCard El American Express LI Choice. (Credit cards accepted only for orders addressedto World Bank Publications.)
Credit Card Account Number Expiration Date Signature
r3 Invoice me and please reference my Purchase Order No.
Please ship me the items listed below.
Cutoenr lnter_Stock Number Author/ Tite Routing Code Quatity Unit Price Total Amonat £
All prices subject to change. Prices may vary by country. Allow 6-8 weeks for delivery.
Subtotal Cost Sibtal copies Air mail surcharge if desired ($2.00 each) $
Postage and handling for more than two complimentary items ($2.00 each) $S
Ibtal SIBRD053 Thank you for your order.
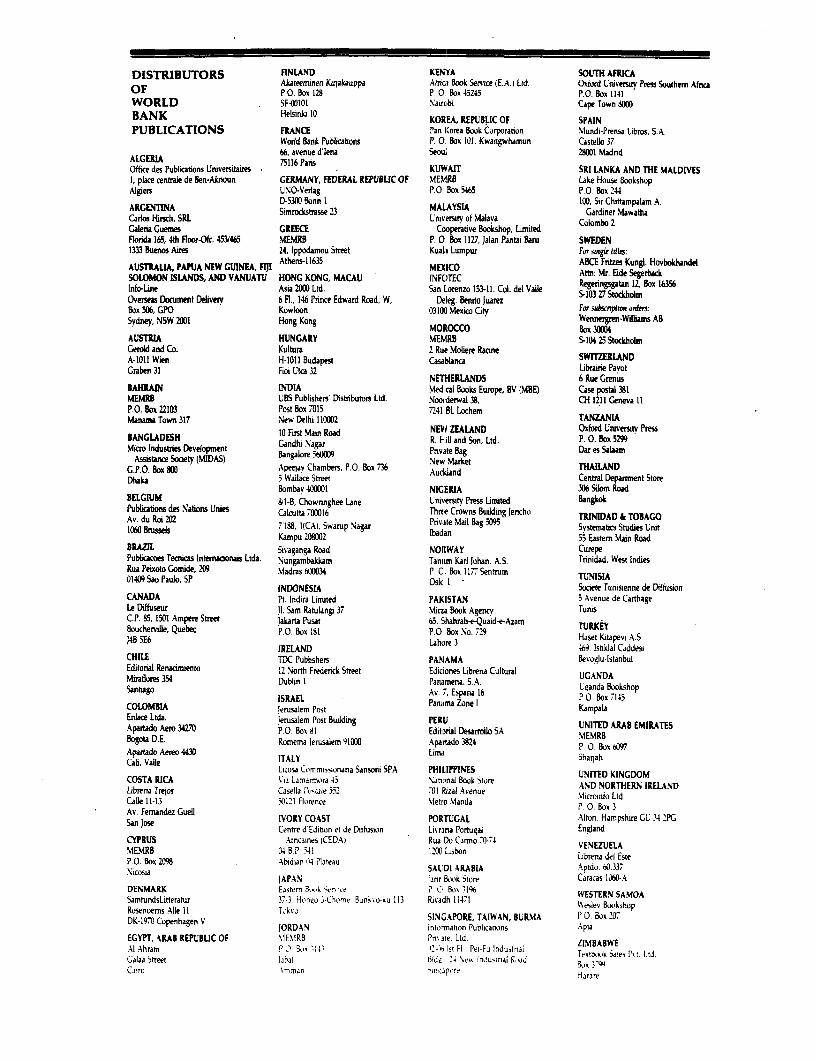
DISTRIBUTORS FINLAND KEN rA SOUTH AFRICAAkateeminen KaLakauppa AicGi bock Serice (E.A. I Ltd. Oxtord University Press Southem AfncAOF P o. B3ox 128l P. 0. Bo0x 45245 P.O. Box l1141
WORLD SF-00OIO Naircbi Cape Town BMKOBANK Helsink 10 KOREA, REPUBLIC OF SPAIN
PUBLICATIONS FIANCE Pan Korea Book Corporabon Mundi-Prensa Libros. S.A.Word Bank Publications P. 0. Box 101, Kwangwhamun Castello 37
ALGERIA 66. avenue d'Iena Seoui 28fiDI MadndOffice des Publications Universitaires 1 Pas KULAIT SRI LANKA AND THE MALDIVES1, place centraie de Ben-Aknwun GERMANY, FEDERAL REPUBLIC OF MEMRB Lake House BookshopAlgiers UNO-Verlag P.O. Box 5465 P.O Box 244
A N-309 Bonn 1 B10, Sir Chittampaiam A.ARGENTINA Simrockatrasse Z3 MAIAYSIA Gardiner MawathaCados Hirsch, SRL University of Malaya Colombo 1Galena Guemnes GREECE Cooperative Bookshop, Limited Colombo 2Flonda 165, 4th FHor-Ofc. 453/465 MEMRB P. O Box 1127, Jalan Pantai Baru SWEDEN1333 Buenos Aires 24. Ippodamou Street Kuali Lumpur For single titks:
AUSTRALIA, PAPUA NEW GUINEA, FIUI Athens-11635 MEXICO ABCE Fntzes Kungl. HovbokhandelSOLOMON ISlANDS, AND VANUATU HONG KONG, MACAU INFOTEC Attn: Mr. Eide SegerbackInfo-Line Asia 2000 Ltd. San Lorenzo 153-11. Col. del Vafle Regenn-sgatan 12, Box 16356Overseas Document Delivery 6 Fl., 146 Prince Edward Road, W, Deleg. Benito Juarez S-103 27 StockhoimBox 506, GPO Kowloon 03101 Mexico City Fonr surb ton orlasASydney, NSW 2001 Hong Kong OllOCCO Be -W m AB
AUSTRIA HUNGARY MEMtRB S-104 25 StockholmGerald and Co. Kultura 2 Rue Moliere RacineA-1011 Wien H-1011 Budapest Csablanca sibreLANDGraben 31 Fioi Utca 32 Lbtam Pavot
NETHERLANDS 6 Rue GrenusBAHRAIN INDIA Medical Books Europe, BV (MBE) Case postal 381MEMRB UBS Publishers Distibutors Ltd. %Noorderwal 38. CH 1211 Geneva 11P.O. Box 22103 Post Box 7015 7241 BL Lochem TA IAManama Town 317 New Delhi 11 D02 ANZANBANGUADESH GI First Main Road NEHe ZEALAND Oxford Universitq Press
BANGLADESH ~ ~ ~ ~ ~ ~ ~ ~ ~ ~ ~ R.Hllad o. t.P.O0. Box 5299Micro Industries Development Gandlo NagarPnvate an Dar Ltd.
Asitan Socieq (MIDAS) Bangalore s36M Pnvite Sag Dar es SalnG.P.O. Box fJO Apeetav Chambers. P.O. Box 736 Auckland Cent THAILANDDhakit 5 WaLace Street Central Depamnnt Store
Bombav 400001 NIGERIA 306 Silom RoadBELGIUM Il-B, Chowringhee Lane Univ'ersitv Press Limited BangkokPublications des Natons Unies Calcutta 700016 Three Crowns Building Jencho TRINIDAD 6 TOBAGOAv. du Roi 202 7188, I(CA), Swarup Nagar Private Mail Bag j095 tematics S Uni1060 BruLsbKmu2802laa Svstematics Studies UnitKampu OB00)32 Ibadan 55 EasternrMain RoadBRAZIL Sivaganga Road NORWAY CurepePublcacoes TecnLcas lnternaionais Ltda. Nungambakkam Tanim Karl Johan, A.S. Trinidad, West IndiesRua Peixoto Gomide, 209 Madras WMf034 P. C. Box 11,7 Sentrunm01409 Sao Paulo, SP OSIO, I TUNISIA
INDONESIA Societe Tunisienne de DiffusionCANADA Pt. Indira Limited PAXISTAN S Avenue de CarthageLe Dffusm ji. Sam Ratulangi 37 Mina Book Agency TunisC.P. 85,1501 Ampere Street Jakarta Pusat 65. Shahrah-e-Quaid-e-Azam TURKEYBouchervile, Quebec P.O. Box 181 P.CO Box NO. 72 lsTURKtaEY iA.
b4 5E6 P.fx11Lahor 3 Haset Kitapevi A.SIRELAND or469e lstiklal Caddesi
CHILE TDC Publishers PANAMA Bevoglu-bstanbulEditorial Renacunuento 12 North Frederick Street Ediciones Librena Cultural UGANDAMratlores 354 Dubirn I Panoimena, S.A. UjGANDABoktoSantigo ISRAEL Av. 7, Espana 16 PUO Box ,liS
COLOMBIA jerusalem Post Panama Zone KampalaEnlace Ltda. Jerusalem Post Budlding PERU UIE RBEIAEApartado Aero 34270 PO Box 81 Editrial Desarrolo SA UNITEDARAEMIRATESbopota D.E. Romema Jerusalem 91000 Apartado 3824 0. Box 7Apartado Aeeo 4430 ITALY Lini Shariab
Licosa Commissionana Sansoni SPA PHILIPPINESCOSTA RICA Via Larnarnora 43 Natonal Book Store UNITED KINGDOMLibreria Trejos Casella P- tile 32 -,01 Rizal Avenue ADcro R No Ltd.Calle 11-13 ;0121 Florence Metb Manda P 0. Box 3
Sa. ene IVORY COAST PORTUGAL Alton, Hampshire GUC14 2PGCentre d Edition et de Drifusion Lirrina Portugal England
CYPRUS Aincaines iCEDAt Rua Do Carmo 70-74 VENEZUELAMEMRB 4 B.P. ;41 120O Lisbon LErEZUEP.O. Box 2098 Abidjan 04 Plateau Librena del EsteNicosia SAL'Di ARABIA Aptdo. 60O.337
JAPAN lanr Book Store Caracas 1060-ADENMARK Eastern Sssk iern P e 1 05 31% WESTERN SAMOASamtundsLitteratur 37-3 Honeoo -Chome Bunk;o4ku 113 Ravadh 11471 Weslev BookshopRosenoers Alle ll Tok, SINGAPORE, TAIWAN, BURMA P 0 Box 207DK-19,0 Copenhagen V JORDAN Iniormation Publicanons Apia
EGYPT, ARAB REPUBLIC OF MEMRB Pn\ 3te. Ltd.Al Ahram PO Box di I'. t s Fl . Pet-Fu lndustrnal ZIMBABWEGalaa Street ai'al B3lde 4 \e. industrial Road Bt °'ieCairo Amman l',jrp0re Harare

WORLD BANK TECHNICAL PAPERS (continued)
No. 25. Industrialization in Sub-Saharan Africa: Strategies and Performance
No. 26. Small Enterprise Development: Economic Issues from African Experience
No. 27. Farming Systems in Africa: The Great Lakes Highlands of Zaire, Rwanda,and Burundi (also available in French as 27F)
No. 28. Technical Assistance and Aid Agency Staff: Alternative Techniquesfor Greater Effectiveness
No. 29. Handpumps Testing and Development: Progress Report on Field and Laboratory Testing
No. 30. Recycling from Municipal Refuse: A State-of-the-Art Review and Annotated Bibliography
No. 31. Remanufacturing: The Experience of the United States and Implicationsfor Developing Countries
No. 32. World Refinery Industry: Need for Restructuring
No. 33. Guidelines for Calculating Financial and Economic Rates of Return for DFC Projects
No. 34. Energy Efficiency in the Pulp and Paper Industry with Emphasis on Developing Countries
No. 35. Potential for Energy Efficiency in the Fertilizer Industry
No. 36. Aguaculture: A Component of Low Cost Sanitation Technology
No. 37. Municipal Waste Processing in Europe: A Status Report on Selected Materialsand Energy Recovery Projects
No. 38. Bulk Shipping and Terminal Logistics
No. 39. Cocoa Production: Present Constraints and Priorities for Research
No. 40. Irrigation Design and Management: Experience in Thailand
No. 41. Fuel Peat in Developing Countries
No. 42. Administrative and Operational Procedures for Programs for Sites and Servicesand Area Upgrading
No. 43. Farming Systems Research: A Review
No. 44. Animal Health Services in Sub-Saharan Africa: Alternative Approaches
No. 45. The International Road Roughness Experiment: Establishing Correlationand a Calibration Standard for Measurements
No. 46. Guidelines for Conducting and Calibrating Road Roughness Measurements
No. 47. Guidelines for Evaluating the Management Information Systems of Industrial Enterprises
No. 48. Handpumps Testing and Development: Proceedings of a Workshop in China
The World Bank UNDP
Headquarters New York1818 H Street, N.W. United Nations Development Programme
Washington, D.C. 20433, U.S.A- I UJnited Nations Plaza
Telephone: (202) 477-1234 New York, New York 10017Telex: WUI 64145 WORLDBANK Telephone: (212) 754-1234
RCA 248423 WORLDBK Telex: 125980 (domestic)Cable Address: INTBAFRAD 232-422 (overseas)
WASHINGTONDC Cable Address: UNDEVPRONEW YORK
Europeant Office66, avenue d'Ilna Geneva Office75116 Paris, France Palais des Nations
CHS-1211 Geneva 10Telephone: (1) 47.23.54.21 SwitzerlandTelex: 842-620628
Telephone: 98-84-00
Tokyo Office DBHTelephone: DDH98-58-50
Kokusai Building Telex: (UNDP) 28.96.20 or (UN) 28.96.96
1-1 Marunouchi 3-chome Cable Address: UNDEVPRO
Chiyoda-ku, Tokyo 100, Japan GENEVA (SWITZERLAND)
Telephone: (03) 214-5001 Tokyo OfficeTelex: 781-26838 Shin Aoyama Building
Room 2255I-:, Minami-Aoyama I-ChomeMinato-KuTokyo 107, Japan
Telephone: 03-475-1619/20Telex: J28 334
AB TKOPI J28 334Cable Address: UNDEVPRO
TOKYO (JAPAN)
ISSN 0253-7494ISBN 0-8213-0752-5