integrated location assessment ii - dtm-iom …iraqdtm.iom.int/lastdtmround/ila ii_part1 thematic...
TRANSCRIPT

INTEGRATEDLOCATIONASSESSMENT II
INTEGRATEDLOCATIONASSESSMENT II
October 2017
PART I THEMATIC OVERVIEW
International Organization for Migration | IOM-Iraq MissionDisplacement Tracking Matrix | DTM


IOM DIsclaIMer
The opinions expressed in the report are those of the authors and do not necessarily reflect the views of the International Organization for Migration (IOM).
IOM is committed to the principle that humane and orderly migration benefits migrants and society. As an intergovernmental organization, IOM acts with its partners in the international community to: assist in meeting the operational challenges of migration; advance understanding of migration issues; encourage social and economic development through migration; and uphold the human dignity and well-being of migrants.
The information contained in this report is for general information purposes only. Names and boundaries on DTM information products do not imply official endorsement or acceptance by IOM. The information in the DTM portal and in this report is the result of data collected by IOM field teams and complements information provided and generated by governmental and other entities in Iraq. IOM Iraq endeavors to keep this information as up to date and accurate as possible, but makes no claim — expressed or implied — on the completeness, accuracy and suitability of the information provided through this report. Challenges that should be taken into account when using DTM data in Iraq include the fluidity of the displaced population movements along with repeated emergencies and limited or no access to parts of the country. In no event will IOM be liable for any loss or damage, whether direct, indirect or consequential, related to the use of this report and the information provided herein.
acKNOWleDGeMeNTsIOM Iraq thanks the U.S. Department of State, Bureau of Population, Refugees and Migration (PRM) for its continued support. IOM Iraq also expresses its gratitude to IOM Iraq’s Rapid Assessment and Response Team (RART) members for their work in collecting the data, often in very difficult circumstances; their tireless efforts are the groundwork of this report.
The International Organization for Migration (Iraq Mission)
Main Office in Baghdad
Office for Central Iraq UNAMI Compound (Diwan 2)
International Zone, Baghdad, Iraq
Tel: +3908 3105 2600
Email: [email protected] / [email protected]
Website: www.iomiraq.net
More information:
• iraqdtm.iom.int
• iraqdtm.iom.int/ILA2.aspx
© Copyright © DTM-Iraq Mission 2017.
All rights reserved. No part of this publication may be reproduced, stored in a retrieval system, or transmitted in any form or by any means, electronic, mechanical, photocopying, recording or otherwise without the prior written permission of the publisher.

eXecUTIVe sUMMarY
INTrODUcTION
MeTHODOlOGY aND cOVeraGe
THeMaTIc OVerVIeW ON DIsPlaceMeNT aND reTUrN
POPULATION AND MOVEMENTS
BOX: FOCUS ON MOSUL CORRIDOR
ETHNO-RELIGIOUS COMPOSITION AND CHANGE
BOX: MINORITIES IN DISPLACEMENT
INFRASTRUCTURE, FACILITIES AND SERVICES, RESIDENCES AND LAND
SECURITY INCIDENTS AND PROTECTION CONCERNS
CONFLICT AND COHESION
LIVING CONDITIONS
SHELTER ISSUES
BOX: HOUSING, LAND AND PROPERTY RIGHTS CHALLENGES
REASONS, INTENTIONS AND OBSTACLES
Displacement Tracking Matrix
Government of Iraq
Housing, Land and Property
Internally Displaced Person
Improvised Explosive Device
Integrated Location Assessment
International Organization for Migration
Iraqi Security Forces
Islamic State in Iraq and the Levant
Kurdistan Region of Iraq
Non-Food Item
US Department of State, Bureau of Population, Refugees and Migration
Rapid Assessment and Response Team
Unexploded Ordnance
cONTeNTs
acrONYMs
1
3
4
6
7
12
13
15
16
18
20
25
28
31
31
DTM
GOI
HlP
IDP
IeD
Ila
IOM
IsF
IsIl
KrI
NFI
PrM
rarT
UXO

october 2017
The end of 2016 and the first half of 2017 saw a notable trend of spontaneous returns within Iraq. IOM estimates that more than 700,000 internally displaced persons (IDPs) have returned to their homes during the first six months of the year.1 Considering that nearly 90% of families who are still displaced are reported to be determined to return home and that the most cited obstacle is lack of security in their location of origin, in the context of recent and forthcoming security improvements, an increasing number of returns is expected in the near future.
Returning home, however, may just be the beginning of a new journey, as returnees often face new challenges. In nearly half of the surveyed locations – with peaks of 96% and 84% in Baghdad and Kirkuk respectively – most returnees are reported as unemployed; 32% returned to properties that have suffered significant to complete damage (with peaks of 57% and 53% in Diyala and Kirkuk respectively); and 60% and 43% are concerned about the poor quality of health services and of water. In addition, most of these returnees were displaced for more than three years, meaning that they return carrying the stress and financial weakening that result from long-term displacement. Although to a certain extent, the general security situation has stabilized since mid-2014, personal security continues to be a concern in daily life and episodes of domestic violence and petty crimes – and to a lesser extent sexual assaults and kidnapping – are still reported.
Whether they need to rebuild property and livelihood, regain their occupied homes or access essential services, returnee families remain a vulnerable population in Iraq and are in urgent need of assistance to ensure their choices are sustainable. The analysis conducted at location level shows how – notwithstanding the level of available resources or wealth – the fair and just governance of these resources and the righteous enforcement of law and order appear to favour social cohesion and foster re-integration, regardless of ethno-religious differences. This is undoubtedly the most important finding of the assessment, as community cohesion and the prevention of conflict are essential to rebuild a peaceful and united society.
Other key findings of the assessment are summarized below: » After July 2016, total number of IDPs has been in constant
decline – excluding major occupied areas where military operations took place. Three areas shaped the recent trend of displacement: Al-Shirqat and Baji (Salah al-Din) and Qayara (Ninewa) as of mid-June 2016; Hawija (Kirkuk) as of August 2016; and most dramatically Mosul (Ninewa) as of October 2016.
» The central and northern governorates concentrate most of those who remain displaced, with a total 62%. Nearly one out of three families (32%) is in the Kurdistan Region of Iraq (KRI), while southern governorates cumulatively host 6% of the IDP population.2
» Return movements, which concern seven of the eight governorates – but Babylon – from where IDPs originally fled, are consistent with the evolving conflict dynamics. Occupied locations in Salah al-Din and Diyala were the first to be retaken, and return movements started there as early as 2015. Anbar was the governorate where most returns took place in both 2016 and 2017, followed by Ninewa in 2017.
» The analysis per ethno-religious affiliation shows that Arab and Kurdish Sunni Muslims have mostly returned home, while Turkmen Shias as well as Sunni Muslims, Yazidis, Christians and Shabak Shias remain displaced across Iraq. For over 20,000 IDP families belonging to these ethno-religious groups “fear due to a change in ethno-religious composition of the place of origin” was cited among the top three obstacles to return.
1. Population figures from DTM Round 76, July 2017.
2. To facilitate analysis, Iraq’s territory was divided in three regions: the Kurdistan Region of Iraq (KRI), including Dahuk, Sulaymaniyah and Erbil;
the South, including Basrah, Missan, Najaf, Thi-Qar, Qadissiya and Muthanna; and Central North including Anbar, Babylon, Baghdad, Diyala,
Kerbala, Kirkuk, Ninewa, Salah al-Din and Wassit.
eXecUTIVe sUMMarY
Integrated location assessment II
OctOber 20171
International Organization for Migration | IOM-Iraq MissionDisplacement Tracking Matrix | DTM

october 2017
» Long-term intentions of IDPs are in line with last year’s findings: 90% are determined to return home. Only in Basrah and Najaf are families reported as considering to locally integrate in their location of displacement. Wishing to remain in a location that is homogeneous in ethno-religious composition is possibly the major pull factor, as those who express this intention are mostly Shias. Probably for similar reasons, Yazidi and Chaldean Christian IDPs in KRI wish to move abroad – push factor.
» Short-term intentions show a significant shift towards local integration as many of those who intended to return have already done so: the share of families willing to stay has increased from 32% in 2015 to 75% in 2017. In fact, obstacles such as the lack of a shelter to return to, of services back home, and of funds to afford the trip appear to be more important than security issues in the location of origin.
» Difficulties in returning to the habitual residence may also be related to the fact that in some cases, those who remain in displacement are the poorest and most vulnerable families, strained by long years on the move. In locations where there are female-headed households, and particularly households headed by minor females, “lack of money” is consistently among the top three obstacles to return.
» Lack of funds, though, can act both as a pull factor to stay in displacement and as a push factor fostering returns. Comparing the governorates of Anbar and Salah al-Din shows that while in Anbar lack of money was rated as a top obstacle to return by intra-governorate IDPs, in Salah al-Din 40% of returns were triggered by lack of funds to stay in displacement.
» The same trend is observed regarding the choice of the displacement destination. The main motivation for nearly 30% of families is the presence of extended family/relatives/friends and as a community of similar ethnic-religious-linguistic background. For 25% of families, it was reportedly their only choice as they could not afford any other place (compared to 8% in 2016). When the drive for security and peace becomes less important, factors behind the choice of the displacement destination are most likely the same that keep families in displacement and inhibit or delay the return to the location of origin.
» Residential and infrastructure damage is widespread. Nearly one third of returnees are reported to have returned to houses that have suffered significant to complete damage, and 60% to moderately damaged residences. Regarding infrastructure, most damage appears to affect roads, followed by the public power grid and tap water networks.
» Central and northern governorates were the hardest hit by armed conflict, although damage was also reported in Basrah, Wassit, Kerbala, Thi-Qar and Najaf – thus indicating that limited reconstruction has taken place. In addition, for half or more of the surveyed locations in some districts of Diyala and Salah al-Din, and for one third of those in Makhmur district in Erbil, reportedly arable and grazing land was not accessible due to landmines or flooding.
» Generalized violence has overall decreased, and terrorist attacks and kidnapping were reported in Kirkuk, Salah al-Din, Diyala and Baghdad governorates alone. The level of conflict appears to be rather low overall, and main returnee hotspots were identified only in the four districts of Kadhimia and Mahmoudiyah (Baghdad), and Al-Daur and Samarra (Salah al-Din).3
» Decreasing violence has led to more long-term concerns over economic security: 80% of IDPs and 63% of returnees cited access to employment as one of their top three needs. Therefore, the first child protection concern mentioned is child labour – which is directly linked to economic hardship and the high share of families who rely on informal labour to earn a living.
» IDPs are on average more concerned about accessing means of living than returnees; the latter rated water and health, respectively, as second and third top needs. The poor quality of both services is a cause of concern particularly in Baghdad (for 70% of families), and should be highlighted because of the wider implications for health and disease prevention.
» The share of IDPs settled in critical shelters and returnees unable to return to their habitual residence seems to have slightly increased compared to 2016. Concerning IDPs, it might be that less affluent IDPs are unable to return to their habitual shelter. Concerning returnees, the issue might be lack of legal documentation, as it was rated among the top three house, land and property (HLP) challenges in nearly one out of four locations – i.e. for 20% of returnee families.
3. Both in Samarra and Al-Daur the most cited parties in conflict are militias on one side and civilians and/or returnees on the other, while many
key informants in Baghdad have preferred not to name any specific conflicting parties.
Integrated location assessment II
OctOber 2017 2
International Organization for Migration | IOM-Iraq MissionDisplacement Tracking Matrix | DTM

october 2017
INTrODUcTION
4. http://iraqdtm.iom.int/Downloads/DTM%20Special%20Reports/DTM%20Integrated%20Location%20Assessment%20II/DTM_Integrated_LA_II_Questionnaire.pdf
5. The definition of returnees is not related to the criteria of returning in safety and dignity, nor with a defined strategy of durable solutions. Dis-placed families who have returned to their sub-district of origin are counted as returnees even if they have not returned to their habitual address.
The DTM considers as IDPs all Iraqis who were forced to flee from 1 January 2014 onwards and are still displaced within national borders at the moment of the assessment.
Returnees are defined as IDPs who have now returned to the location (big area or sub-district) where they used to live prior to being displaced, irrespective of whether they have returned to their former residence or to another shelter type.5
The Displacement Tracking Matrix (DTM) is IOM’s information management system to track and monitor population displacement during crises. Composed of a variety of tools and processes, the DTM regularly and systematically captures and processes multi-layered data and disseminates a wide array of information products that facilitate a better understanding of the evolving needs of a displaced population, be that on site or en route. DTM data includes information relevant to all sectors of humanitarian assistance, such as demographic figures, shelter, water and sanitation, health, food and protection, making data useful for humanitarian actors at all levels.
In Iraq, the DTM Programme monitors population displacement since 2004. In 2014, following the worsening of the armed conflict and the increasing need for information on the displaced population, the Programme was reinforced. Currently the DTM collects data on IDPs and returnees through a system of Rapid Assessment and Response Teams (RARTs) – composed of 123 field staff present throughout the Iraqi territory – which in turn gather information through an extended network of over 9,500 key informants as well as direct visits to identified locations hosting IDPs, returnees or both (see Methodology).
DTM figures, key findings and reports are published online and available on the portal of DTM Iraq at http://iraqdtm.iom.int; and updates are recorded daily as new assessments are completed. The Emergency Tracking is the real-time component of the methodology, aiming to provide displacement and return data with a 24- to 72-hour data turnover – such as the Mosul portal – during medium- to large-scale crises. Monthly reports are the core of DTM information, as they provide a countrywide monitoring of displacement and return movements. Location assessments, on the other hand, provide a more in-depth analysis of displacement and return trends and are completed in three-month data collection cycles.
The Integrated Location Assessment (ILA) belongs to this more comprehensive category, as it provides a simultaneous and in-depth profiling of both displacement and return movements in Iraq. Focusing on both populations at the same time allows to: capture overarching trends of population movements; evaluate the burden that forced displacement poses on some governorates;
and outline social and living conditions, basic needs, intentions and vulnerabilities shared by IDPs and returnees. Compared to previous assessment, conducted from May to October 2016, the current ILA is more focused on return patterns, and specifically on social cohesion issues.
The report starts with a brief description of the methodology and coverage of the assessment, followed by a first section (I) offering a thematic overview at country level. Chapters are structured around six main topics: (i) population movements, including ethno-religious composition and change thereof; (ii) infrastructure, facilities/services, residential and land damage; (iii) social conditions, including security, vulnerabilities and protection issues; (iv) social conflict and cohesion; (v) living conditions and shelter issues; (vi) intentions, reasons and obstacles to return. The second section (II) provides profiles for the 18 Iraqi governorates. Key themes identified in Section I are reviewed and discussed at the governorate and district level. Attention has been given to governorates witnessing large return movements, with context profiling and an assessment of the main issues that returnees face when returning to their home location.
The form used for the assessment can be downloaded from the Iraq DTM portal.4
IDPs
Returnees
International Organization for Migration | IOM-Iraq MissionDisplacement Tracking Matrix | DTM Integrated location assessment II
OctOber 20173

october 2017
MeTHODOlOGY aND cOVeraGe
The Integrated Location Assessment collects detailed information on IDP and returnee families living in locations identified through the DTM Master Lists. The reference unit of the assessment is the location, and information is collected at the aggregate level, that is, on the majority of IDPs and returnees living in a location, and not on individual families.
At the start of the cycle, the list of identified locations hosting IDPs and/or returnees in the most up-to-date Master Lists is given to the field RART and is used as a baseline. The data-collection cycle takes approximately three months and new locations identified during the implementation phase are not subject to the assessment.
Where access is possible, identified locations are visited and directly assessed by IOM’s RARTs through interviews with several key informants (including members of the IDP and returnee communities) and direct observation. At the end of the visits, RARTs fill one form with the summary of the information collected and the data is then uploaded to the server and stored as one assessment.
The Integrated Location Assessment II was conducted from 11 March to end of May 2017 and covered 3,583 locations hosting at least one or more IDP and/or returnee families, reaching 279,019 returnee families and 354,976 IDP families (corresponding to 1,674,114 returnee and 2,129,856 IDP individuals). Details about the population hosted in the surveyed locations are provided in the figure below. Findings in
this report either reflect the locations where displaced and/or returned populations reside, or, whenever applicable, have been weighted according to the respective number of IDP or returnee families in these locations so that results can be projected at the level of families.
Overall coverage stands at 93%, mostly due to the progress in DTM’s field capacity. It remains lower than 90% only in four governorates: Kirkuk (61%), Anbar (64%), Ninewa (71%) and Salah al-Din (89%), because of accessibility challenges mostly due to ISIL’s occupation of certain areas in these governorates at the time of data collection. It should be noted, however, that an increase was recorded since the last ILA conducted in 2016, as additional areas were retaken and security conditions improved.
Although some questions specifically target IDPs and others target returnees, routinely collected core information includes:
» Geographic location » Governorate of origin (IDPs) and of last displacement
(returnees) » Wave/period of displacement and return » Ethno-religious affiliation » Shelter type » Reasons of displacement/return and future intentions » Common security incidents » Needs and concerns associated to fulfilling living needs » Specific protection indicators and risks.
37%39%
29%
11%
7%
Not assessedAssessed
Ninewa Kirkuk Anbar Overall
Salah al-Din
Figure 1. ILA Coverage
International Organization for Migration | IOM-Iraq MissionDisplacement Tracking Matrix | DTM Integrated location assessment II
OctOber 2017 4
365LOCATIONS WITHRETURNEES ONLY
3,009LOCATIONS WITHIDPs ONLY
BOTHIDPs ANDRETURNEES
International Organization for Migration | IOM-Iraq MissionDisplacement Tracking Matrix | DTM Integrated Location Assessment II
5 october 2017
In addition to the above-mentioned information, IOM has in-cluded a specific section that reports on social cohesion, will-ingness of communities to work together, and levels of trust/ mistrust and conflict among different groups. By incorporating this section, the DTM tool will allow humanitarian actors to know whether new ethno-religious and social tensions have aris-en or whether previous tensions –which might have been among the drivers of conflict in the region– remain active.
All sections of the report, except for the most recent population trends that were extrapolated from the October 2017 Baseline (Master List Round 81), are based on the ILA dataset collected from March to May 2017. All comparisons with 2016 come from the dataset of the previous ILA I conducted from July to October 2016.
Shelter type was collected according to three categories: pri-vate dwellings (host communities, rented houses and hotels/motels); critical shelter arrangements (informal settlements, religious buildings, schools, unfinished or abandoned buildings and other formal settlements/collective centres); and unknown (applies to locations that are not accessible or when the shelter type cannot be identified). Camps were not assessed, as the ILA methodology is designed for urban and rural areas (location – fifth administrative level), while camps require a different meth-odology (camp profiling, formal site assessment) and are usually included in the government’s records.
In June 2017, DTM organized a workshop to validate the pre-liminary findings with the field teams, and follow-up data clean-ing at the governorate level was conducted until the end of the month. The ILA II dataset and interactive dashboards were re-leased on the DTM portal in July 2017 (http://iraqdtm.iom.int/ILA2.aspx).
International Organization for Migration | IOM-Iraq MissionDisplacement Tracking Matrix | DTM Integrated location assessment II

International Organization for Migration | IOM-Iraq MissionDisplacement Tracking Matrix | DTM Integrated Location Assessment II
6october 2017

International Organization for Migration | IOM-Iraq MissionDisplacement Tracking Matrix | DTM Integrated Location Assessment II
7 october 2017
PoPulation and MoveMents
There are currently 3,174,270 IDPs – almost 5% of who are displaced since the first half of 2014 – and 2,331,678 returnees in Iraq. The most significant concentration of the displaced population is in the central and northern governorates (62%), particularly in Salah al-Din (15%), Baghdad (14%), Kirkuk (12%) and Ninewa (9%). Nearly one out of three IDPs (32%) is settled in the Kurdistan Region of Iraq (KRI), with the governorates of Erbil (15%) and Dahuk (11%) hosting the largest
concentrations. Except for Najaf (3%), southern governorates have been less affected by the waves of displacement, cumulatively hosting 6% of IDP population.
Until now, returns have interested seven of the eight governorates from where IDPs originally fled – all but Babylon, as only a minority of IDPs come from there.7 Most returns were to Anbar (46%) and Salah al-Din (22%) governorates; slightly fewer than
6. Population figures from the October 2017 Baseline (Master List Round 81) were used for IDP/returnee estimates.
7. Displacement in northern Babylon occurred in 2013, when the armed groups seized control of Jurf Al-Sakhar and surroundings, forcing residents
to leave. Government-backed Shia militias retook Jurf Al-Sakhar in October 2015, but Sunni families –—the majority of those who fled the city
and resettled in the southern district of Al-Musayab or in Baghdad governorate – remained displaced for fear of persecutions. No return move-
ments have been recorded to date for this reason. See IOM DTM Babylon Governorate profile, June–September 2015. See also UNHCR Position
on Returns to Iraq, High Commissioner for Refugees, November 2016; and Musings on Iraq, More Returns Leads to Slight Decline in Displaced
in Iraq, 20 September 2016, http://bit.ly/2e32daD.
P e
r s i a
n G u l f
IRAN
SYRIA
TURKEY
JORDAN
KUWAIT
SAUDI ARABIA
Anbar
Najaf
Muthanna
NinewaErbil
Diyala
Wassit
Basrah
Missan
Salah al-Din
Thi-Qar
Kirkuk Sulaymaniyah
Dahuk
Qadissiya
Kerbala
Baghdad
Babylon
IDP locations
District boundary
Governorate boundary
Country boundary
Distribution of IDP locations
Low
High
Map 1. DIsTrIBUTION OF IDPs
International Organization for Migration | IOM-Iraq MissionDisplacement Tracking Matrix | DTM Integrated Location Assessment II
8october 2017
Anbar
Najaf
Muthanna
NinewaErbil
Diyala
Wassit
Basrah
Missan
Salah al-Din
Thi-Qar
Kirkuk Sulaymaniyah
Dahuk
Qadissiya
Kerbala
Baghdad
Babylon
IRAN
SYRIA
TURKEY
JORDAN
KUWAIT
P e
r s i a
n G u l f
SAUDI ARABIA
Returnee locations
District boundary
Governorate boundary
Country boundary
Distribution of returnee locations
Low
High
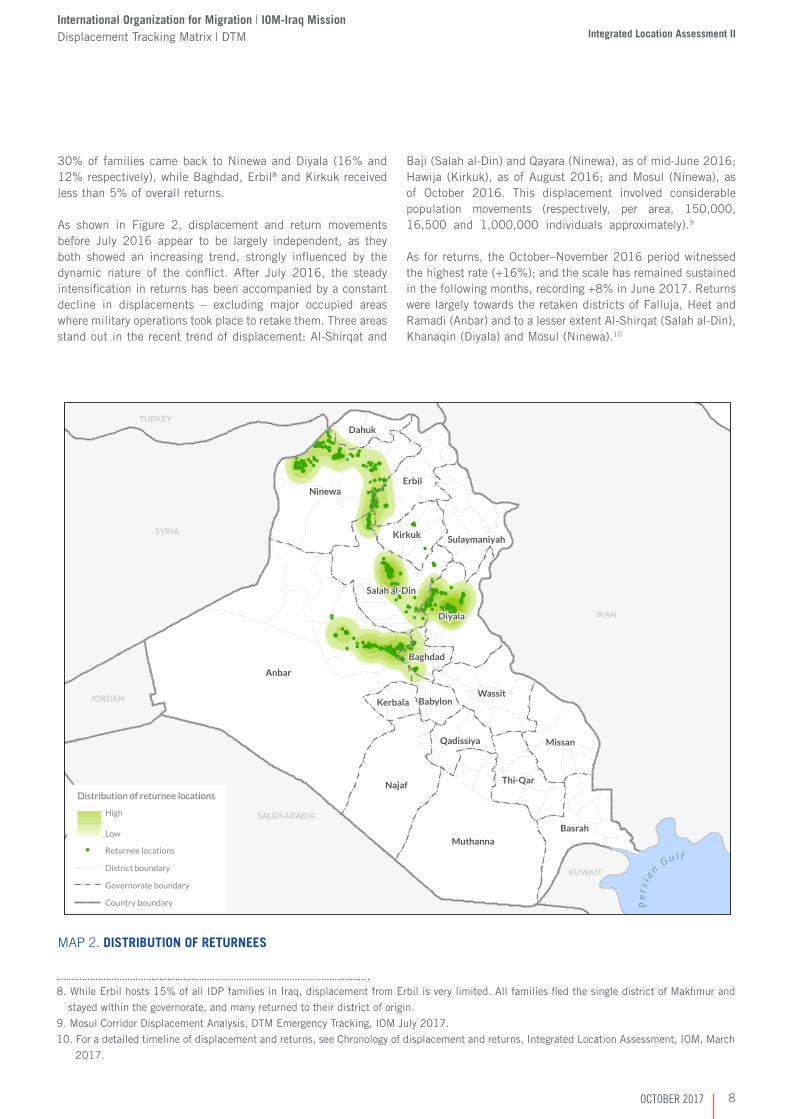
Map 2. DIsTrIBUTION OF reTUrNees
30% of families came back to Ninewa and Diyala (16% and 12% respectively), while Baghdad, Erbil8 and Kirkuk received less than 5% of overall returns.
As shown in Figure 2, displacement and return movements before July 2016 appear to be largely independent, as they both showed an increasing trend, strongly influenced by the dynamic nature of the conflict. After July 2016, the steady intensification in returns has been accompanied by a constant decline in displacements – excluding major occupied areas where military operations took place to retake them. Three areas stand out in the recent trend of displacement: Al-Shirqat and
Baji (Salah al-Din) and Qayara (Ninewa), as of mid-June 2016; Hawija (Kirkuk), as of August 2016; and Mosul (Ninewa), as of October 2016. This displacement involved considerable population movements (respectively, per area, 150,000, 16,500 and 1,000,000 individuals approximately).9
As for returns, the October–November 2016 period witnessed the highest rate (+16%); and the scale has remained sustained in the following months, recording +8% in June 2017. Returns were largely towards the retaken districts of Falluja, Heet and Ramadi (Anbar) and to a lesser extent Al-Shirqat (Salah al-Din), Khanaqin (Diyala) and Mosul (Ninewa).10
8. While Erbil hosts 15% of all IDP families in Iraq, displacement from Erbil is very limited. All families fled the single district of Makhmur and
stayed within the governorate, and many returned to their district of origin.
9. Mosul Corridor Displacement Analysis, DTM Emergency Tracking, IOM July 2017.
10. For a detailed timeline of displacement and returns, see Chronology of displacement and returns, Integrated Location Assessment, IOM, March
2017.

International Organization for Migration | IOM-Iraq MissionDisplacement Tracking Matrix | DTM Integrated Location Assessment II
9 october 2017
Following July 2016, the decreasing trend in IDP figures became increasingly associated with the steady inten-sification of returns. The last peak in displacement is associated with the Mosul retaking.
Before July 2016, IDP and returnee movements were largely independent, both displaying an increasing trend.
Figure 2. DIsPlaceMeNT aND reTUrN TreNDsbefore and after July 2016
11. The governorate of Kirkuk is the centre of the northern Iraqi petroleum industry and thus of great strategic and economic importance to Bagh-
dad’s Central Government.
12. See Box “Focus on Mosul corridor”.
4,000,000
3,500,000
3,000,000
2,500,000
2,000,000
1,500,000
1,000,000
500,000
0
Aug
‘16
Sep
‘16
Oct
‘16
Nov
‘16
Dec
‘16
Jan
‘17
Feb
‘17
Mar
‘17
Apr
‘17
May
‘17
Jun
‘17
Jul ‘
17
Aug
‘17
Oct
‘17
Sep
‘17
3,174,270IDPs
2,331,678Returnees
AFTER JULY 2016
Jul ‘
15
Aug
‘15
Sep
‘15
Oct
‘15
Nov
‘15
Dec
‘15
Jan
‘16
Feb
‘16
Mar
‘16
Apr
‘16
May
‘16
Jun
‘16
Jul ‘
16
3,369,252IDPs
796,758Returnees
BEFORE JULY 2016
Overall, between January 2014 and March 2017 nearly one out of four surveyed locations had been either occupied (16%) or attacked (3%) by ISIL. Occupation mostly took place in Ninewa, Salah al-Din, Anbar and western areas of Diyala (Map 3). As of March 2017, some areas of Ninewa (Telafar, Ba’aj and Hatra districts), Salah al-Din (parts of Al Shirqat district and some western areas), west Anbar and Kirkuk (Hawija district only) remained under ISIL control.11 At the time of data collection, hostilities in Kirkuk were still ongoing, but have stalled since the beginning of the Mosul offensive.
As shown in Map 4, the surveyed districts in Salah al-Din and Diyala were the first to be retaken, followed by northern districts
of Ninewa (mostly before December 2015). The retaking of previously insecure areas allowed a first wave of large-scale returns to Salah al-Din. Between December 2015 and October 2016, the offensives to regain control of cities and districts in eastern Anbar took place, with Ramadi, Heet and then Falluja retaken – and the governorate recorded, and still does, the highest percentage of returns. Between October and December 2016, military operations succeeded in retaking control of most surveyed areas in eastern Ninewa. February 2017 marked the start of the military operations to retake west Mosul. In 2016 three out of four families in displacement were originally from Ninewa and Anbar, and in 2017, Ninewa alone accounts for 40% of IDP families.12

International Organization for Migration | IOM-Iraq MissionDisplacement Tracking Matrix | DTM Integrated Location Assessment II
10october 2017
IRAN
SYRIA
SAUDI ARABIA
TURKEY
JORDAN
KUWAIT
Anbar
Najaf
Muthanna
NinewaErbil
Diyala
Wassit
Basrah
Missan
Salah al-Din
Thi-Qar
Kirkuk Sulaymaniyah
Dahuk
Qadissiya
Kerbala
Baghdad
Babylon
P e
r s i a
n G u l f
ISIL occupied
ISIL attacked
Never occupied
Districts boundary
Governorates boundary
Country boundary
Assessed locations by ISIL crisis
Map 3. lOcaTION OccUPIeD Or aTTacKeD
Anbar
Najaf
Muthanna
NinewaErbil
Diyala
Wassit
Basrah
Missan
Salah al-Din
Thi-Qar
Kirkuk Sulaymaniyah
Dahuk
Qadissiya
Kerbala
Baghdad
Babylon
IRAN
SYRIA
SAUDI ARABIA
TURKEY
JORDAN
KUWAIT
Jan to Dec 2015
Up to Dec 2014
Districts boundary
Governorates boundary
Country boundary
Jan to Dec 2016
Jan to Mar 2017
Assessed locations by periods of recapture
P e
r s i a
n G u l f
Map 4. TIMelINe OF THe PrOGressION: lOcaTIONs reTaKeN

International Organization for Migration | IOM-Iraq MissionDisplacement Tracking Matrix | DTM Integrated Location Assessment II
11 october 2017
IDPs Returnees
10%
30%
20%
9% 21% 16% 17% 15%10% 14% 10% 4%8% 15%23%15% 24%
0Pre-Jun ‘14 Jun-Jul ‘14 Aug ‘14 Post Sep ‘14 Post Apr ‘15 Post Mar ‘16 Post 17 Oct ‘16
Nearly half of current IDPs �edbetween June and August 2014.
Only 4% of returns concerns familieswho �ed during the retaking of Mosul.
Comparing internal displacement and internal returns provides valid insights. One out of two IDP families remained within their governorate of origin, except for those IDPs from Anbar and Ninewa, where prolonged conflict and lack of security forced the population to move farther away, likely more than once. For families who remained within the two governorates, the drive for security and peace was weaker than the need to remain in the vicinity or presence of extended family/relatives/friends, as shown by the high share of families who are hosted or settled in critical shelters (around 40% compared to an overall share of 15%). As for returns, the proximity of the area of displacement
Of those who remain displaced, nearly half are long-term IDPs who fled during the Mosul and Sinjar crises (June to August 2014), mostly from the governorates of Ninewa and Salah al-Din. Most Turkmen Shias, Turkmen Sunnis and Yazidis who
have not yet returned were displaced during one of these two periods. On the other hand, 15% of current displaced families are recent IDPs who fled because of the operations to retake Mosul. At the time of the assessment, this group accounted for only 4% of all returns.
to that of origin not only ensures a more viable journey of return, but also allows families to check on the conditions of their prop-erties before undertaking the trip back home (18% of returnees cited proximity among the top three reasons for returning). In this sense, once safety and security conditions in the location are re-established, return is more likely to occur when displace-ment was within the same governorate. This can be observed in Anbar, where over 60% of recent returns involve families who were displaced within the governorate – to the point that only 12% of current IDP families displaced in Anbar are originally from the governorate itself (they were 35% in 2016).
In Kirkuk and Erbil, all returns were intra-governorate.Internal displacement is prevalent in all governorates but Ninewa and Anbar.
Figure 3. INTerNal DIsPlaceMeNT aND INTerNal reTUrNs
Figure 4. IDPs aND reTUrNees Per WaVe OF DIsPlaceMeNT
Salah al-Din
Ninewa
Kirkuk
Erbil
Diyala
Baghdad
Babylon
Anbar5
0%
40
%
30
%
20
%
10
%0
60
%
90
%
70
%
80
%
10
0%
50
%
60
%
70
%
80
%
90
%
10
0%
40
%
10
%
30
%
20
% 02016 2017 IDPs 2016 2017Returnees
57% 37%
34%
35%
55%
79%
88%
61%73%
87%
81%
100%100%
100%100%
73%
29%21%
67%64%
54%46%
51%57%
77%69%
100%91%
35%12%

International Organization for Migration | IOM-Iraq MissionDisplacement Tracking Matrix | DTM Integrated Location Assessment II
12october 2017
As of July 2017, nearly 820,000 individuals remained displaced following the military offensive to retake Mosul city
and its surroundings, which began on 17 October 2016 and led to a mass exodus along safe corridors into territory
controlled by the Iraqi Security Forces (ISF). Ongoing hostilities in Kirkuk, Salah al-Din and Erbil caused additional
displacement movements along the Mosul corridor, albeit more limited. The DTM has identified three main phases of
displacement flows to facilitate analysis (Figure 5). The first phase lasted for a couple of weeks, until the ISF reached
the edge of the city; hostilities mainly affected rural areas and nearly 17,000 individuals displaced. The second phase,
which lasted until 25 February 2017, is linked to the retaking of east Mosul: displacement flows continued throughout
this period, with over 200,000 individuals. The third phase was marked by the retaking of west Mosul: military
operations progressed more slowly and caused more large-scale damage and displacements, with nearly 800,000
individuals. Nearly all IDPs remained within Ninewa, settling in emergency camps and/or screening sites, or moved in
with host families.14 Returns towards east Mosul started as early as November 2016, although at a very slow pace until
January 2017. Homecoming greatly increased at the beginning of June 2017 (+32%), although the violence of the final
offensive triggered new displacements. While the east Mosul population has mostly returned home, west Mosul families
remain in displacement. Their return may be deterred by ongoing violence, security risks in the area, lack of services
and infrastructure and residential damage caused by the prolonged conflict – families originally from Mosul said that
one of the main obstacles to their return was that their house is occupied or destroyed.
13. The information reported in the box is related to the displacement caused by the Mosul operations, which started on 17 October 2016 and
aimed at regaining control of Mosul city and surroundings. Figures are cumulative of all the persons affected by the Mosul crisis, from the be-
ginning of the crisis to the end of June 2017. For more information see DTM ET Mosul Crisis Report, IOM, July 2017.
14. The security situation (hostilities were still ongoing in Salah al-Din and Anbar) and the restrictive regulations in and out of Ninewa (need for
security clearance and sponsorship) did not leave much room for alternatives. The location of displacement and type of settlement was mostly
dictated by the IDPs place of origin and the availability of shelter.
FoCus on MosuL CorrIdor13
Figure 5. MOsUl cOrrIDOr - DIsPlaceMeNT TIMelINe17 October 2016 - 29 June 2017
Oct ‘
16
Nov
‘16
Dec
‘16
Feb
‘17
Mar
‘17
Apr ‘
17
May
‘17
Jun
‘17
Jul ‘
17
Jan
‘17
0200,000400,000600,000800,000
1,000,0001,200,000
Cumulative Number of returnees (individuals)Number of IDPs (individuals)
819,5341,021,476
201,942
Phase 3Phase 2Phase 1 25 Feb ‘17 – 29 Jun ‘171 Nov ‘16 – 25 Feb ‘1717 Oct ‘16 – 1 Nov ‘16
The military operations to retake the city of Mosul and its surroundings begin
The hostilities reach Kokjali,a suburb at the edge of eastern Mosul. The operations to retake east Mosul city begin
The Iraqi PM announces that all neighborhoods in east Mosul are under ISF control
Firstdisplacement movements from west Mosul are recorded
Iraqi Forces take over Al-Nuri mosque
The Iraqi PM announces that all neighborhoods in west Mosul are under ISF control and that the city of Mosul is fully retaken
17 Oct '16 1 Nov ‘16 24 Jan ‘17 19 Feb ‘17 25 Feb ‘17 29 Jun ‘17 9 Jul ‘17The beginning of the military operations to retake west Mosul are announced

International Organization for Migration | IOM-Iraq MissionDisplacement Tracking Matrix | DTM Integrated Location Assessment II
13 october 2017
eTHNO-relIGIOUs cOMPOsITION aND cHaNGe sINce 2014
Before the current humanitarian crisis, Iraq was home to many ethnic and religious groups – including minorities such as Christians, Shabaks, Turkmens, Yazidis and Kakais – that tend-ed to be concentrated geographically, albeit not always in con-tiguous areas. Arab Sunni Muslims were predominant in central and western Iraq; Arab Shia Muslims mainly inhabited southern Iraq; Kurds – both Sunni and Shia – were settled in the north and north-eastern regions, in the KRI and the disputed districts; while Christians and other non-Muslim minorities mostly resid-ed in north western Iraq, particularly in Ninewa Governorate. Major cities such as Baghdad and Basrah also hosted multiple ethno-religious groups.15
Since the fall of Mosul, ethnic and religious groups have fol-lowed different displacement and return paths. IOM’s hotspots analysis conducted in 2016 showed that most groups (except Kurds and Chaldean Christians) clustered in displacement to form homogeneous ethno-religious spots. For instance, Shias concentrated in the Shia-dominated south and Sunnis in the Kurdish north and mixed Sunni-Shia central parts of the coun-try. Kurdish areas were also most likely to receive many ethnic and religious groups, the only exceptions being Assyrian Chris-tians and Turkmen Shias, who clustered respectively in mixed Shia-Sunni and predominantly Shia areas (Map 5).
Anbar
Najaf
Muthanna
NinewaErbil
Diyala
Wassit
Basrah
Missan
Salah al-Din
Thi-Qar
Kirkuk
Sulaymaniyah
Dahuk
Qadissiya
BabylonKerbala
Baghdad
IRAN
SYRIA
SAUDI ARABIA
TURKEY
JORDAN
KUWAIT
P e
r s i a
n G u l f
Districts boundary
Governorates boundary
Country boundary
Arab Shia Muslim
Arab Sunni Muslim
Chaldean Christian
Assyrian Christian
Kurdish Shia Muslim
Kurdish Sunni Muslim
Yazidi
Sahabak Shia Muslim
Sahabak Sunni Muslim
Turkmen Shia Muslim
Turkmen Sunni Muslim
IDP Ethnic/Religious groups (pie)
Th
e m
ajo
rity
Eth
nic
/Rel
igio
us
gro
up
s in
Iraq
(bac
kgro
un
d)*
Shia
Sun
ni
Sun
ni
Shia+
Ch
rist
ian
sK
urd
sTu
rko-
man
s
*Source: Empirical Studies of Conflict (ESOC), Princeton University, 2012
15. Information is based on the shapefile of Empirical Studies of Conflict (ESOC). Published in 2012, this data is based on the American Central
Intelligence Agency (CIA) ethno-religious maps and Izady ethnic maps on Baghdad, and reflect ethnic/religious majorities. The areas identified
are: Arab Sunni, Arab Shia, Kurdish, and Arab Shia/Sunni mix. See Ethno-Religious groups and displacement in Iraq, 2nd Report, IOM 2016.
Map 5. eTHNO-relIGIOUs DIsTrIBUTION OF IDPs

International Organization for Migration | IOM-Iraq MissionDisplacement Tracking Matrix | DTM Integrated Location Assessment II
14october 2017
16. Only changes in the prevalent ethno-religious component were assessed.
17. There was evidence of Sunnis not returning home especially in the district of Tikrit (Salah al-Din), where most families who left have not yet
returned, and where there has been a shift from Arab Sunni to Arab or Turkmen Shia majority. In Tikrit, mistrust between groups, arbitrary
arrests and kidnappings were also reported. Shias seem unwilling to see Sunni return due to the violence suffered during ISIS occupation.
Evidence of distrust between returnees and stayers was also found in the two districts of Al Khalis and Al Muqdadiyah (Diyala) – which host a
mixed Sunni-Shia population.
Map 6. eTHNO-relIGIOUs DIsTrIBUTION OF reTUrNees
P e
r s i a
n G u l f
P e
r s i a
n G u l f
Anbar
Najaf
Muthanna
Ninewa
Erbil
Diyala
Wassit
Basrah
Missan
Salah al-Din
Thi-Qar
KirkukSulaymaniyah
Dahuk
Qadissiya
BabylonKerbala
Baghdad IRAN
SYRIA
SAUDI ARABIA
TURKEY
JORDAN
KUWAITDistricts boundary
Governorates boundary
Country boundary
Arab Shia Muslim
Arab Sunni Muslim
Chaldean Christian
Assyrian Christian
Kurdish Shia Muslim
Kurdish Sunni Muslim
Yazidi
Sahabak Shia Muslim
Sahabak Sunni Muslim
Turkmen Shia Muslim
Turkmen Sunni Muslim
Returnee Ethnic/Religious groups (pie)
Th
e m
ajo
rity
Eth
nic
/Rel
igio
us
gro
up
s in
Iraq
(bac
kgro
un
d)*
Shia
Sun
ni
Sun
ni
Shia+
Ch
rist
ian
sK
urd
sTu
rko-
man
s
*Source: Empirical Studies of Conflict (ESOC), Princeton University, 2012
This trend is partly reflected in the ethno-religious change as-sessed at location level.16 In Erbil, and to a lesser extent in Sulaymaniyah, Kirkuk and Diyala, the shift has been from Kurd-ish Sunni to Arab Sunni. In some Dahuk locations, Chaldean Christians have been replaced by Yazidis and Sunnis, while in Baghdad and Salah al-Din some Arab Sunni communities now are prevalently Arab Shia.17 In Ninewa, the shift has mostly been from Kurdish Sunni Muslims to Yazidis, while most Chal-dean Christians, Kakais, Shabak Shia Muslims have left and
not yet returned. It should be noted that over 20,000 families (accounting for over 13% of all families who fled Ninewa) cited “fear as a result of a change in ethno-religious composition of the place of origin” among the first three obstacles to return. Although fear was mostly mentioned as the third obstacle, this finding provides important insights on the IDPs’ personal as-sessment of the conditions in their location of origin and the ongoing presence of ethnic tensions.

International Organization for Migration | IOM-Iraq MissionDisplacement Tracking Matrix | DTM Integrated Location Assessment II
15 october 2017
18. Information on this section is mostly based on DTM data, Ethno-Religious groups and displacement in Iraq, 2nd Report, IOM 2016, and The
future of Iraq’s Minorities and Other Vulnerable Groups after ISIS, IILHR, 2017. Intentions were calculated only for locations where the men-
tioned minority is the largest group among IDP and there is no multiple majority. Percentages reflect location.
19. The future of Iraq’s Minorities and Other Vulnerable Groups after ISIS, IILHR, 2017.
20. The future of Iraq’s Minorities and Other Vulnerable Groups after ISIS, IILHR, 2017.
The 2017 analysis per ethno-religious affiliation shows that 89% of returnees and 67% of IDPs in Iraq are Arab Sunni Muslims. Turkmen Shia Muslims, Yazidis and Kurdish Sunni Muslims account for a significant share of the displaced population (altogether almost 23%), but for a smaller percentage of returnees (8% overall, because of low figures for Turkmen Shia Muslims and Yazidis). Just like in 2016, while Arab Sunni and Kurdish Sunni Muslims have mostly returned home, Turkmen Shia and Sunni Muslims, Yazidis, Christians and Shabak Shias remain displaced across Iraq (Map 6).
Turkmen shias, the third largest ethnic group in Iraq, mostly fled from Ninewa to southern and eastern governorates – from Kirkuk as far as Wassit – during the second wave associated with the Mosul crisis. Their presence in the disputed territories (between KRI and GoI) as well as ethno-religious tensions were the main cause of displacement. As a result, relatively fewer Turkmen Shias (77% compared to 88% overall) reported wishing to go back to their original places, while a remarkably significant number (22%) wants to integrate in their present location (versus 9% overall). Although comparatively fewer, Turkmen Sunni also remain displaced. They mostly fled Salah al-Din and Ninewa during the second wave (June–July 2014) and remained within Salah al-Din or settled in Kirkuk. Although generalized violence was the main reason of displacement for them as well, nearly all reported intending to return home.
Yazidis, the second largest group among IDPs, are an ancient ethno-religious group, although often assimilated ethnically with Kurds and pressured to identify as such. For this reason, they are not only accused of being heretics but also have been regularly the target of violence, even before ISIL’s offensive. The entire Yazidi IDP population has fled Ninewa, mostly during the Sinjar crisis (third wave), due to generalized violence and direct threats to family members, and mostly re-settled in Dahuk. Similar to Turkmen Shias, relatively fewer Yazidis (79%) intend to return home; nearly 8% of families’ long-term intention is
to emigrate.
Iraqi christians, as a religious group, include a number of distinct ethnic sub-groups, such as Armenians, Assyrians, Chaldeans, Syriacs as well as Arabs. It is estimated that prior to June 2014, half or more of the Christian community – between 65,000 and 120,000 families – had already left Iraq.19 The greatest displacement waves were of Chaldeans who displaced from Ninewa during the Sinjar crisis, mostly due to generalized violence and direct threats, and resettled in Erbil and Dahuk. Syriacs account for the second most numerous Christian group of IDPs
with nearly 2,000 families, also settled in KRI. Other sub-groups are comparatively fewer and are hosted in Basrah, Baghdad and Ninewa. Their main long-term intention is to return home (86%).
Another minority group still in displacement is that of shabak shias. Their community has been living for centuries in Ninewa, close to Mosul. Though culturally distinct, just like Yazidis, Shabak have been pressured to identify as Kurdish and suffered persecution from both Kurds and Arabs, as part of the broader territorial dispute over some areas of Ninewa.20 There were significant numbers of Shabak Shia IDPs in the third wave of displacement and generalized violence and direct threats to families were the main reason for their displacement. Most remained within the governorate, while other sought refuge in Kerbala, Najaf and within the KRI. Like many other ethno-religious groups, nearly all Shabak Shias (92%) want to return to their places of origin. There are also 2,700 Shabak Sunni families who remain in displacement within Ninewa or KRI. Intent to return home, many have already done so.
MInorItIes In dIspLACeMent18
Figure 6. MINOrITIes IN DIsPlaceMeNT - No. OF IDP aND reTUrNee FaMIlIes
10
,00
0
35
,00
0
30
,00
0
25
,00
0
20
,00
0
15
,00
00IDPs
Returnees
Four ethno-religious minorities remain displaced.
These four ethno-religious groups are visibly fewer in thereturnee population.
Shabak Shia
Christian
Yazidi
Turkmen
International Organization for Migration | IOM-Iraq MissionDisplacement Tracking Matrix | DTM Integrated Location Assessment II
16october 2017
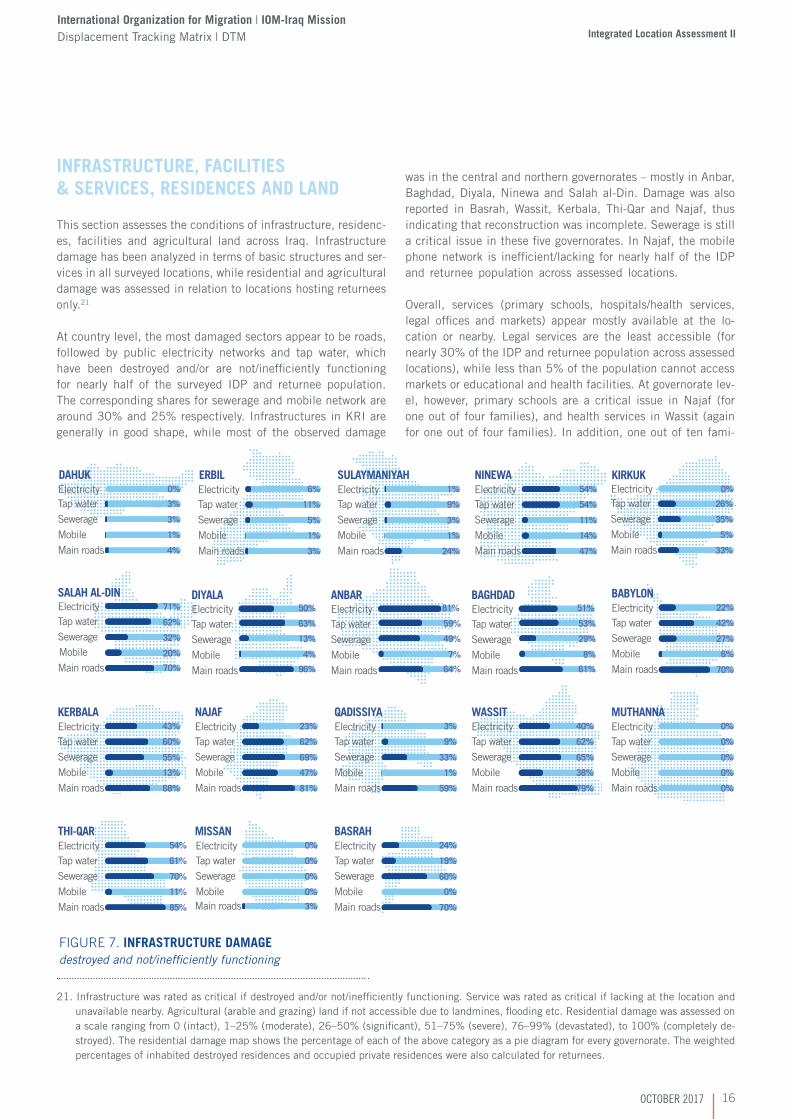
INFrasTrUcTUre, FacIlITIes & serVIces, resIDeNces aND laND
This section assesses the conditions of infrastructure, residenc-es, facilities and agricultural land across Iraq. Infrastructure damage has been analyzed in terms of basic structures and ser-vices in all surveyed locations, while residential and agricultural damage was assessed in relation to locations hosting returnees only.21
At country level, the most damaged sectors appear to be roads, followed by public electricity networks and tap water, which have been destroyed and/or are not/inefficiently functioning for nearly half of the surveyed IDP and returnee population. The corresponding shares for sewerage and mobile network are around 30% and 25% respectively. Infrastructures in KRI are generally in good shape, while most of the observed damage
was in the central and northern governorates – mostly in Anbar, Baghdad, Diyala, Ninewa and Salah al-Din. Damage was also reported in Basrah, Wassit, Kerbala, Thi-Qar and Najaf, thus indicating that reconstruction was incomplete. Sewerage is still a critical issue in these five governorates. In Najaf, the mobile phone network is inefficient/lacking for nearly half of the IDP and returnee population across assessed locations.
Overall, services (primary schools, hospitals/health services, legal offices and markets) appear mostly available at the lo-cation or nearby. Legal services are the least accessible (for nearly 30% of the IDP and returnee population across assessed locations), while less than 5% of the population cannot access markets or educational and health facilities. At governorate lev-el, however, primary schools are a critical issue in Najaf (for one out of four families), and health services in Wassit (again for one out of four families). In addition, one out of ten fami-
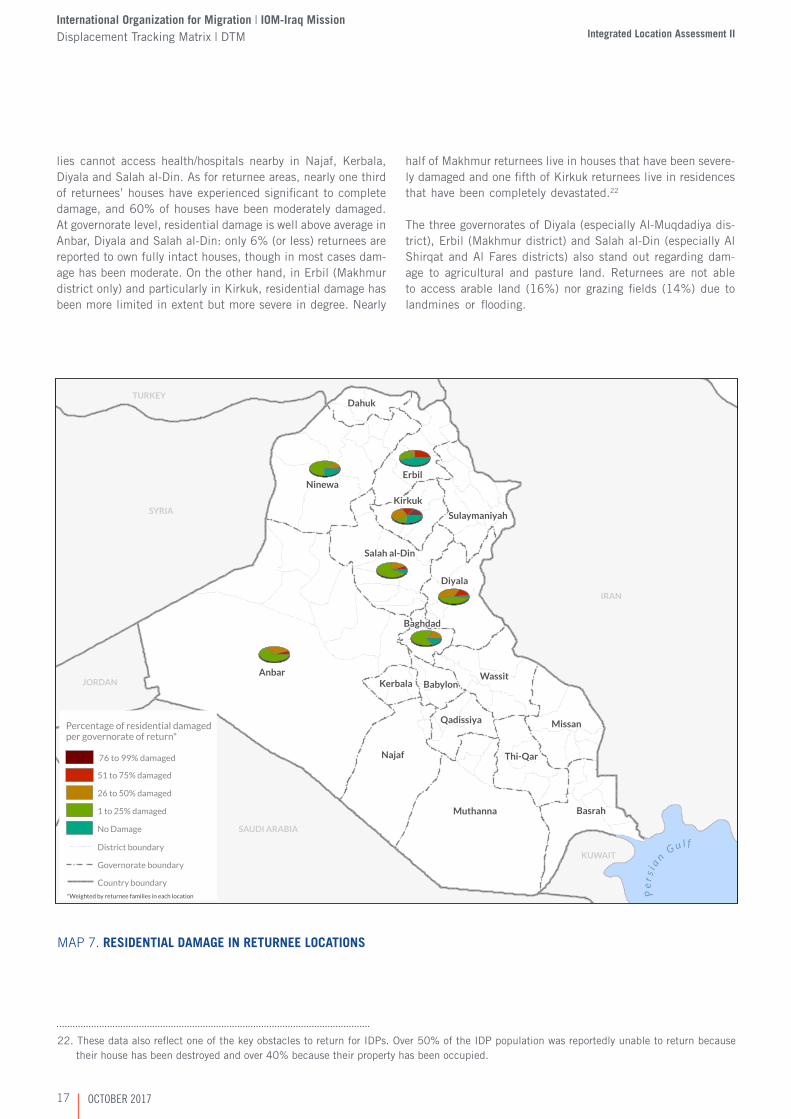
21. Infrastructure was rated as critical if destroyed and/or not/inefficiently functioning. Service was rated as critical if lacking at the location and unavailable nearby. Agricultural (arable and grazing) land if not accessible due to landmines, flooding etc. Residential damage was assessed on a scale ranging from 0 (intact), 1–25% (moderate), 26–50% (significant), 51–75% (severe), 76–99% (devastated), to 100% (completely de-stroyed). The residential damage map shows the percentage of each of the above category as a pie diagram for every governorate. The weighted percentages of inhabited destroyed residences and occupied private residences were also calculated for returnees.
Tap waterSewerageMobileMain roads
DAHUK
3%
3%
1%
4%
Tap waterSewerageMobile
Mobile
Main roads
KIRKUK
26%
35%
SALAH AL-DIN
5%
33%
Tap waterSewerageMobileMain roads
ERBIL
11%
Electricity
Tap waterSewerage
Main roads
ElectricityDIYALA
6%Electricity 0%
5%
1%
3%
Tap waterSewerageMobileMain roads
SULAYMANIYAHElectricity
9%
1%
3%
1%
24%
Tap waterSewerageMobileMain roads
NINEWAElectricity
54%
54%
11%
14%
47%
Tap waterSewerageMobileMain roads
BABYLONElectricity
42%
22%
27%
6%
70%
KERBALA
Tap waterSewerageMobileMain roads
NAJAF
Main roads
62%
Electricity 23%
69%
47%
81%
Tap waterSewerageMobileMain roads
60%
Electricity 43%
55%
13%
68%
Tap waterSewerageMobileMain roads
QADISSIYAElectricity
9%
3%
33%
1%
59%
Tap waterSewerageMobileMain roads
WASSITElectricity
62%
40%
65%
38%
79%
Tap waterSewerageMobileMain roads
Electricity0%
0%
0%
0%
0%
MUTHANNA
71%
Electricity 0%
62%
32%
20%
70%
Tap waterSewerageMobileMain roads
Electricity 50%
63%
13%
4%
96%
ANBAR
Tap waterSewerageMobileMain roads
Electricity 81%
59%
49%
7%
64%
BAGHDAD
Tap waterSewerageMobileMain roads
Electricity 51%
53%
29%
8%
61%
THI-QAR MISSAN
3%
Tap waterSewerageMobileMain roads
61%
Electricity 54%
70%
11%
Tap waterSewerageMobile
0%
Electricity 0%
0%
0%
85%
Tap waterSewerageMobileMain roads
BASRAHElectricity
19%
24%
60%
0%
70%
Figure 7. INFrasTrUcTUre DaMaGedestroyed and not/inefficiently functioning
International Organization for Migration | IOM-Iraq MissionDisplacement Tracking Matrix | DTM Integrated Location Assessment II
17 october 2017
lies cannot access health/hospitals nearby in Najaf, Kerbala, Diyala and Salah al-Din. As for returnee areas, nearly one third of returnees’ houses have experienced significant to complete damage, and 60% of houses have been moderately damaged. At governorate level, residential damage is well above average in Anbar, Diyala and Salah al-Din: only 6% (or less) returnees are reported to own fully intact houses, though in most cases dam-age has been moderate. On the other hand, in Erbil (Makhmur district only) and particularly in Kirkuk, residential damage has been more limited in extent but more severe in degree. Nearly
half of Makhmur returnees live in houses that have been severe-ly damaged and one fifth of Kirkuk returnees live in residences that have been completely devastated.22
The three governorates of Diyala (especially Al-Muqdadiya dis-trict), Erbil (Makhmur district) and Salah al-Din (especially Al Shirqat and Al Fares districts) also stand out regarding dam-age to agricultural and pasture land. Returnees are not able to access arable land (16%) nor grazing fields (14%) due to landmines or flooding.
22. These data also reflect one of the key obstacles to return for IDPs. Over 50% of the IDP population was reportedly unable to return because their house has been destroyed and over 40% because their property has been occupied.
Map 7. resIDeNTIal DaMaGe IN reTUrNee lOcaTIONs
Anbar
Najaf
Muthanna
NinewaErbil
Diyala
Wassit
Basrah
Missan
Salah al-Din
Thi-Qar
Kirkuk
Sulaymaniyah
Dahuk
Qadissiya
BabylonKerbala
Baghdad
P e
r s i a
n G u l f
IRAN
SYRIA
SAUDI ARABIA
TURKEY
JORDAN
KUWAIT
76 to 99% damaged
51 to 75% damaged
26 to 50% damaged
1 to 25% damaged
No Damage
District boundary
Governorate boundary
Country boundary
Percentage of residential damagedper governorate of return*
*Weighted by returnee families in each location

International Organization for Migration | IOM-Iraq MissionDisplacement Tracking Matrix | DTM Integrated Location Assessment II
18october 2017
secUrITY INcIDeNTs aND PrOTecTION cONcerNs
To a certain extent, general security in Iraq has stabilized since the summer of 2014, when violence reached its peak, caus-ing the worst waves of displacement. As a result, for 75% of the returnee families, safety in their area of origin was cited among the top three reasons for their return (it was 67% last year). Nevertheless, personal security continues to be a concern in daily life and home violence and petty crimes were report-ed to affect 60% of IDPs and returnees countrywide. Slightly over 15% of families are settled in locations where episodes of kidnapping and/or terrorist attacks were reported, while sexual assaults were reported as affecting less than 5% of the popu-lation.
Security incidents differ significantly by area; most terrorist at-tacks and kidnapping incidents were reported for Kirkuk, Salah al-Din, Diyala and Baghdad governorates alone. Petty crimes and domestic violence are prevalent in Sulaymaniyah, Kirkuk, Baghdad and particularly Wassit, where sexual assaults were also reported. Sexual aggressions are an issue in Kerbala and Dahuk too, reportedly affecting 12% and 31% of the population respectively.
Figure 8. secUrITY INcIDeNTs% of population living in locations where incidents were reported
SometimesOften
Home Violence
Petty Crimes
Kidnappings
Terrorist Attacks
Sexual Assaults
13%3%
16%1%
5%
3%57%3%60%
Al-Rutba
Baiji
Hatra
Heet
Ana
Kut
Al-Ka'im
Ra'ua
Al-Ba'aj
Ramadi
Sinjar
Baladrooz
Badra
Mosul
Falluja
Kifri
Telafar
Haditha
Erbil
Tikrit
Tooz
Akre
Khanaqin
Soran
Daquq
Al-Daur
Kalar
Amedi
Kirkuk
Makhmur
Kerbala
Balad
Chamchamal
Dokan
Al-Hawiga
Al-Azezia
Samarra
Zakho
Ali Al-Gharbi
Sumel
Koisnjaq
Al-Mahawil
Halabja
Tilkaif
Pshdar
Sharbazher
Shaqlawa
Sulaymaniya
Dabes
Mada'in
Al-Suwaira
Al-Thethar
Mergasur
Al-Fares
Dahuk
Al-Khalis
Rania
Al-Shirqat
Amara
Penjwin
Hashimiya
Ain Al-Tamur
Al-Shikhan
Mahmoudiya
Choman
Al-Hai
Tarmia
Al-Hamdaniya
Al-Muqdadiya
Al-Na'maniya
Al-Hindiya
Hilla
Al-Musayab
Ba'quba
Karkh
Kadhimia
Abu Ghraib
Darbandikhan
Diwaniya
Al ResafaThawra1
District boundary
Governorate boundary
Country boundary
Percentage of locations without access to usable land (arable & grazing) per district of return
3% - 21%
21% - 37%
37% - 64%
Full access to 3% inaccess
64% - Almost no access
Anbar
Ninewa
Erbil
Diyala
Wassit
Salah al-Din
Kirkuk
Sulaymaniyah
Dahuk
Kerbala Babylon
Missan
Baghdad
TURKEY
SYRIA
IRAN
Map 8. access TO araBle aND GrazING laND aT reTUrNee lOcaTIONs

International Organization for Migration | IOM-Iraq MissionDisplacement Tracking Matrix | DTM Integrated Location Assessment II
19 october 2017
In Wassit, family composition may account for the high inci-dence of home violence and sexual assaults: in 40% of loca-tions, it was reported that most families are separated, and one out of four households is either female- or minor-headed. This may also be the cause in Kerbala, where 20% of households are either female- or minor-headed. The difference between the percentage of domestic violence in Sulaymaniyah and KRI may be explained by the higher rate of family separation among IDPs living in Sulaymaniyah (in Sulaymaniyah nearly all KIs reported that domestic violence occurs “sometimes”, while in Dahuk half of them reported it, and in Erbil, 28%). Domestic and age- and gender-based violence may also be related to the share of indi-viduals living in critical shelters (22% of IDPs, countrywide).
Protection concerns of families reflect the evolution in the secu-rity situation: decreasing generalized violence has led to more long-term concerns over economic security. Both IDPs and re-turnees’ most important child protection concern is child labour (reported as affecting over 75% of families) – which is directly related to the difficult economic situation – while domestic vi-olence and underage marriage were cited as affecting around 50% and 45% of families respectively. As for general protec-tion issues, IDPs reported being mostly concerned about entry sponsorships (48%), suspension of aid or salaries (31%) and lack of documentation and other legal entitlements (24%). As for returnee families, their first protection concern is arbitrary arrests (18%), indicating troubled return dynamics, especially in Diyala and Salah al-Din.
Overall, evictions were reported in around 10% of locations hosting IDP families (in nearly 80% of locations in Kirkuk and to a certain extent in Anbar and Salah al-Din). However, a consis-tent share of the displaced population is concerned about being evicted by the government (21%) and property owners (18%). IDPs seem more at risk of private owner-evictions in Baghdad, Diyala, Kerbala, Salah al-Din, Wassit as well as in the southern governorates of Najaf, Muthanna and Thi-Qar.23 Only in Bab-ylon, Wassit and southern governorates are IDPs free to move without special permissions, while movement for both IDPs and returnees is restricted in all other governorates – and forbidden for both IDPs and residents in the sub-district of Markaz Tooz in Salah al-Din.24 Again, these challenges are further exacerbated for more vulnerable categories such as female- or minor-headed households, mentally and/or physically challenged individuals, minor mothers and unaccompanied children. Overall, in 77% of locations with returnees and in 80% of locations with IDPs, at least one vulnerable population category was reported.
Figure 9. secUrITY INcIDeNTs% of population living in locations where incidents were reported
DAHUK
KIRKUKSALAH AL-DIN
ERBIL
DIYALA
SULAYMANIYAH
BAGHDAD
NINEWA
BABYLON
KERBALA
NAJAF
QADISSIYA
WASSIT
MUTHANNA
ANBAR
1%10%2%
THI-QAR
MISSAN
BASRAH6%17%
48% 40%3%4%
18%
2%3%54%
11%7%8% 1%
14%
9% 13%43% 4%
5%48%
2%5%21% 1%
1%
1%4%2% 5%
Most IDP families are dividedSome IDP families are divided Minor-Headed Household
In Wassit and Kerbala, between one fourth and one �tfth of household are female or minor headed and family separation are also prevalent
Female-Headed Household
2%2%63% 1%
1%5%7%
3%6%2%
2%5%39%
4%4%14%
7%77%
3%2%
10%10%21% 23%
3%
23. In Kerbala, Wassit, Najaf and Qadissiyah many IDPs are hosted in religious buildings. The high risk of eviction might therefore be correlated with the pilgrimage season and the need to support the incoming religious visitors.
24. IDPs settled in the Markaz Tooz district, who are mostly displaced within their governorate of origin, indicated that they are involuntarily staying in displacement, and wish to return home. Contrary to the overall trend, their most frequently indicated and urgent protection concern is the status of detained family members.

International Organization for Migration | IOM-Iraq MissionDisplacement Tracking Matrix | DTM Integrated Location Assessment II
20october 2017
25. In 2016, discriminations towards IDPs were reported in Kerbala and in Salah al-Din. Contrary to the overall trend, Kerbala also stood out as the governorate where the interaction between communities was virtually non-existent.
26. Questions essentially focused on mistrust, physical attacks and threats, favouritism, cooperation on common projects and (re)integration mech-anisms. For details, see ILA II Questionnaire.
27. The variables of mistrust between groups, attacks between groups and fighting groups were used for the computation of conflict score, while cooperation projects and cooperation groups were used for the cooperation index. Figures are given for districts with at least 10 locations or at least 100 IDP families, and for all districts hosting returnees. The governorates of Anbar, Ninewa and Salah al-Din were excluded from the computation of IDP indexes, as most locations host also returnees).
cONFlIcT aND cOHesION
Social cohesion is a complex concept: it involves rights and responsibilities, perception of belonging, fairness and trust, and relationships between different groups. This complexity can make social cohesion difficult to measure. In 2016, the relation among groups was rated as “good” in 97% of the surveyed locations.25 However, groups did not work together or collaborate in common projects, and mechanisms to facilitate reintegration were not in place in over half of the locations. This contradiction was partly explained by the fact that in some locations, the projects that were included in the questionnaire were not relevant to the communities assessed. Nevertheless,
it became clear that more investigation was needed, therefore a new section addressing the issue was included in the 2017 Integrated Location Assessment.26
To identify and understand the situation and experience of different communities, separate composite conflict and cooperation indexes were calculated for 3,009 locations hosting IDPs only and 573 locations hosting returnees (with or without IDPs or host community). The mean scores of the conflict index at district level are in Map 9 and 10.27
Najaf
Kut
Amara
Al-Zubair
Baladrooz
Badra
Kifri
Afaq
Erbil
Khanaqin
Soran
Daquq
Nassriya
Kalar
Al-Rifa'i
Kirkuk
Makhmur
Al-Hai
Hamza
Kerbala
Fao
Ali Al-Gharbi
Chamchamal
Dokan
Diwaniya
Al-Azezia
Zakho
Al-Shatra
Sumel
Al-Mahawil
Koisnjaq
Pshdar
Mada'in
Shaqlawa
Basrah
Hashimiya
Al-Maimouna
Al-Qurna
Al-Khidhir
Halabja
SharbazherDabes
Al-Suwaira
Al-Chibayish
Sulaymaniya
Al-Rumaitha
MergasurDahuk
Al-Khalis
Rania
Al-Midaina
Penjwin
Ain Al-Tamur
Al-Kahla
Kufa
Mahmoudiya
Suq Al-Shoyokh
Al-Na'maniya
Shatt Al-Arab
Hilla
Al-Muqdadiya
Choman
Qal'at Saleh
Al-Hindiya
Al-Samawa
Abu Al-Khaseeb
Ba'quba
Al-Musayab
Karkh
Al-Mejar Al-Kabir
Al-ShamiyaAl-Manathera
Abu Ghraib
Kadhimia
Darbandikhan
AdhamiaAl Resafa
IRAN
KUWAIT
TURKEY
SYRIA
SAUDI ARABIA
Districts boundary
Governorates boundary
No apparent conflict
Low risk of conflict
Medium risk of conflict
High risk of conflict
Country boundary
Weighted mean score of the conflict index at district level (IDP)*
*Both the indices were calculated based on the locations hosting IDPs alone.
Soran
AmediZakho
Sumel
Pshdar
Shaqlawa
Dahuk
Rania
IRAN
KUWAIT
TURKEY
SYRIA
Kut
Afaq
Al-Hai
Al-Na'maniya
Najaf
Amara
Al-Zubair
Baladrooz
Kifri
Erbil
Khanaqin
Soran
Daquq
Nassriya
Kalar
Al-Rifa'i
Kirkuk
Amedi
Hamza
Kerbala
Chamchamal
Dokan
Diwaniya
Al-Azezia
Zakho
Al-Shatra
Sumel
Al-Mahawil
Koisnjaq
Pshdar
Mada'in
Shaqlawa
Basrah
Hashimiya
Al-Qurna
Al-Khidhir
Halabja
Sharbazher
Al-Suwaira
Sulaymaniya
Al-Rumaitha
Dahuk
Al-Khalis
Rania
Al-Midaina
Kufa
Mahmoudiya
Suq Al-ShoyokhShatt Al-Arab
Hilla
Al-Hindiya
Al-Samawa
Abu Al-Khaseeb
Ba'quba
Al-Musayab
Karkh
Al-Mejar Al-Kabir
Al-ShamiyaAl-Manathera
Abu Ghraib
Darbandikhan
AdhamiaAl Resafa
IRAN
SAUDI ARABIA KUWAIT
TURKEY
SYRIA
SAUDI ARABIA*Both the indices were calculated based on the locations hosting IDPs alone.
Country boundary
Districts boundaryGovernortes boundary
No cooperation
Medium to high cooperation
Limited cooperation
Weighted mean score of the cooperation index at district level (IDP)*
*Both the indices were calculated based on the locations hosting IDPs alone.
Map 9. cONFlIcT aND cOOPeraTION - IDPs

International Organization for Migration | IOM-Iraq MissionDisplacement Tracking Matrix | DTM Integrated Location Assessment II
21 october 2017
28. Personal connections/nepotism.
Map 10. cONFlIcT aND cOOPeraTION - reTUrNees
Heet
Baiji
Ramadi
Sinjar
Mosul
Kifri
Telafar
Falluja
Tikrit
Tooz
KhanaqinAl-Daur
Daquq
Kirkuk
Makhmur
Balad
Samarra
Tilkaif
Al-Fares
Al-Khalis
Al-Shirqat
Al-Hamdaniya
Mahmoudiya
Al-Muqdadiya
Abu Ghraib
Kadhimia
IRAN
SYRIA
TURKEY
KUWAITSAUDI ARABIA
Weighted mean score of the conflict index at district level (returnees)
Districts boundary
Governorates boundary
No apparent conflict
Low risk of conflict
Medium risk of conflict
Country boundary
Heet
Baiji
Ramadi
Sinjar
Mosul
Kifri
Telafar
Falluja
Tikrit
Tooz
KhanaqinAl-Daur
Daquq
Kirkuk
Makhmur
Balad
Samarra
Tilkaif
Al-Fares
Al-Khalis
Al-Shirqat
Al-Hamdaniya
Mahmoudiya
Al-Muqdadiya
Abu Ghraib
Kadhimia
IRAN
SYRIA
TURKEY
KUWAIT
SAUDI ARABIA
Heet
Baiji
Ramadi
Sinjar
Mosul
Kifri
Telafar
Falluja
TikritTooz
KhanaqinAl-Daur
Daquq
Kirkuk
Makhmur
Balad
Samarra
Tilkaif
Al-Fares
Al-Khalis
Al-Shirqat
Al-Hamdaniya
Mahmoudiya
Al-Muqdadiya
Abu Ghraib
Kadhimia
IRAN
SAUDI ARABIA
SYRIA
TURKEY
KUWAIT
Weighted mean score of the cooperation index at district level (returnees)
Limited cooperation
No cooperation
Districts boundary
Governorates boundary
Country boundary
Medium to high cooperation
Overall, the level of conflict appears to be low: around 70% of districts display no apparent conflict and less than 10% have low conflict risk. Social tension for IDP-only districts appears to be lowest in KRI and southern governorates, while medium to high levels of conflict were detected in Baghdad (Abu Ghraib, Adhamia, Al Resafa, Khadimia and Thawra2), Diyala (Ba’quba) and Wassit (Al Hai and Kut). Where returnees are also present, main “hotspots” were identified in Baghdad (Kadhimia, but also in Mahmoudiyah) and in Salah al-Din (Al-Daur and Samarra).
The potential signs of social tension reported most often concern individual incidents such as physical attacks and, in general, distrust/dislike among different groups. Most tensions occurred between IDPs and host community members or owners and occupiers in IDP-only locations; and between IDPs and returnees, and IDPs and host communities in mixed locations. In Thawra2, evidence of tribal conflict was also reported. However, it should be noted that overall – particularly in Baghdad – a high percentage of the surveyed key informants refused to give an explicit answer or selected “other” as fighting groups, indicating that they did not wish to specify which group, or that there are other sources of conflict.
Just as in ILA I, “no cooperation between groups” was recorded in over 70% of locations hosting IDPs only, and in 48% of location hosting returnees, while advanced cooperation was reported in only 5% of locations hosting returnees (and almost none in those hosting IDPs only). The most recorded positive action appears to be “using each other’s ‘wasta’28 to request services from the government, such as hospitals, schools, roads, etc.” and clearing rubble and rebuilding damaged houses. The governorate of Sulaymaniyah recorded the highest cooperation score, while positive hotspots hosting both returnees and IDPs were found in Salah al-Din (Al-Daur and Samarra), Kirkuk (Kirkuk), and Baghdad (Kadhimia). Cooperation is highest between tribes in Kirkuk, and between IDPs and host communities in Baghdad.
The relatively higher scores of conflict and cooperation recorded in Al-Daur and Samarra (Salah al-Din) may be explained by the presence of various groups in these two districts. While conflict reportedly occurs between militia and civilians, returnees and IDPs (some of who are recent IDPs) and several tribes appear to cooperate.

International Organization for Migration | IOM-Iraq MissionDisplacement Tracking Matrix | DTM Integrated Location Assessment II
22october 2017
29. The GLM Univariate analysis enables to investigate the effects of one or more independent factors/variables on a dependent variable – i.e. the conflict score. The unit of analysis for the IDP model are 2,812 IDP-only locations outside Anbar, Ninewa and Salah al-Din, while independent factors include: presence of occupied residences, evictions, freedom of movement, crime, favouritism, different majoritarian ethno-religious group, intention to locally integrate and governorate of displacement. For the binary factor variables the ‘no’ answer served as the reference group, while Baghdad served as the reference for the governorate of displacement, as the capital and governorate with most IDP-only locations. The R2 of the IDP model is .446. The unit of analysis of the returnee model are 574 returnee locations (with or without IDPs). The governorates of Erbil and Kirkuk have been combined due to small figures and close geographical proximity. Independent factors include: the share of re-turnees with jobs, destroyed residences, the presence of more than one controlling actor (in particular militias) and the governorate of return. In regard to the binary factor variables the ‘no’ answer served as the reference group, while Salah al-Din was chosen as the reference governorate of return, as the first province that received large-scale returns. The R2 of the returnee model is .406.
30. Another minor factor reducing the conflict score is whether evictions of certain groups have taken place in a certain location since 2014. It might be the case that problematic individuals were evicted, though this hypothesis needs more investigation.
Furthermore, a univariate general linear model (GLM) analysis has been undertaken to investigate the effect of some factors either negatively or positively associated with tension, on the conflict score.29 These factors do not necessarily cause low or high conflict, but they can be used to explain and to a certain extent predict the levels of conflict for a given location. Findings for IDP-only and returnee locations are displayed in Figure 10.
Overall, belonging to a different ethno-religious group or the nature of the security actor(s) do not seem to have a significant effect on the conflict level. Factors that significantly increase the conflict score are, for the IDP model, a high degree of favouritism, existence of occupied residences, incidence of
crime and to a lesser degree a history of forced returns. For the returnee model, the presence of occupied residences in the location, followed by militias in sole or joint control of the location, and favouritism had the greatest influence on the conflict score. The presence of security actors collaboratively controlling the location had a slight effect on conflict level as well (See Map 11). Interestingly, locations where unemployment and destruction of residences are more prevalent have lower levels of conflict than locations where most returnees have jobs or where destruction levels are below 50% when other factors are controlled for.30 It could be the case that those locations with relatively more resources have also more competition (and conflict) over the use of those resources.
High degree of favouritism
Incidence of crime
Existence ofoccupied residences
-0.46Long-term intention for
local integrationIDPs ever forced toreturn in location
-0.12Major IDP ER is differentfrom major ER of location
Freedom of movementfor IDPs in governorate
2.23
1.58 0.810.98 0.66 0.04
Presence ofoccupied residences
-1.78More than half of
residences destroyed
-0.60Any group evictedfrom the location
-0.24More than onemajor ER group
0.01Controlled by ER
other than majorityor plurality
0.56Controlled by
more than one actor
Likelihood of increasing con�ictindex compared to the opposite situation
Con�ictfactors
Con�ict factors(independent variables)
0.99High degree of
favouritism
1.40Militias
in control
0.79
0.000.00
Majority of returneeshave jobs
Regression | IDP
Regression | Returnee
A high degree of favourism increases con�ict score by 1.58 points with a very strong signi�cance* when other factors are controlled for
The presences Increases con�ict score by 2.2 points with a very strong signi�cance* when other factors are controlled for
very strong signi�cance (p value < 0.01)
strong signi�cance(p value < 0.05)
not statistically signi�cant(p value > 0.05)
* The p-value, or probability value, weights the strength of the evidence, or statistical signi�cance of the results. The smaller the p-value, the larger the signi�cance, because the hypothesis under consideration (the null hypothesis) may not adequately explain the observation. Conversely if the p-value is greater than 0.05, there is weak evidence against the conjecture.
Figure 10. cONFlIcT scOre aND cONFlIcT FacTOrs (IDP-only and returnee locations)

International Organization for Migration | IOM-Iraq MissionDisplacement Tracking Matrix | DTM Integrated Location Assessment II
23 october 2017
-3.51Dahuk
-3.47Muthanna
-3.38Sulaymaniyah
-2.89Missan
-2.63Erbil
4.05Baghdad
1.37Diyala
-0.56Anbar
-0.28Erbil & Kirkuk
-0.11Ninewa
-2.61Basrah
-2.34Babylon
-2.17Diyala
-2.97Kirkuk
-2.77Thi-Qar
-2.39Najaf
-2.16Qadissiya
-1.87Kerbala
0.77Wassit
Regression | IDP
Regression | Returnee Only Wassit displays a higher con�ict score than Baghdad
Baghdad and Diyala show higher con�ict score than Salah al-Din
Likelihood of increasing con�ict index compared to Baghdad (IDP)/Salah al-Din (Returnee)
0.000.00
very strong signi�cance (p value < 0.01)
strong signi�cance(p value < 0.05)
not statistically signi�cant(p value > 0.05)
* The p-value, or probability value, weights the strength of the evidence or statistical signi�cance of the results. The smaller the p-value, the larger the signi�cance, because the hypothesis under consideration (the null hypothesis) may not adequately explain the observation. Conversely if the p-value is greater than 0.05, there is weak evidence against the conjecture.
Figure 11. cONFlIcT scOres cOMPareD TO reFereNce GOVerNOraTe (governorates of displacement and return)
Governorates of displacement and return were also tested against a “reference” governorate. Baghdad was used for the governorates of displacement, as the capital and governorate with most IDP-only locations, while Salah al-Din was chosen for the governorates of return, as the first governorate that received large-scale returns. Findings are shown in Figure 11.
All displacement governorates except Wassit show significantly lower conflict scores compared to Baghdad. Although relatively few (1% of all IDP families, 4,391 families overall), Wassit IDPs seem particularly vulnerable, a characteristic that may foster favouritism towards the host community – in fact, the only tension recorded was between IDPs and residents. As for
governorates of return, Baghdad and Diyala have significantly higher conflict scores than Salah al-Din, confirming the presence of troubled return dynamics. The district of Hawija (Kirkuk) was not accessible, which may explain the low conflict values recorded for Kirkuk –mistrust and fighting may in fact be present in some areas.
Overall, it can be argued that per se, available resources or wealth and the diversity of ethno-religious groups in a location do not necessarily lead to conflict. It rather seems that fair and just resource governance, absence of favouritism and the righteous provision of law and order appear to reduce the potential of conflict.
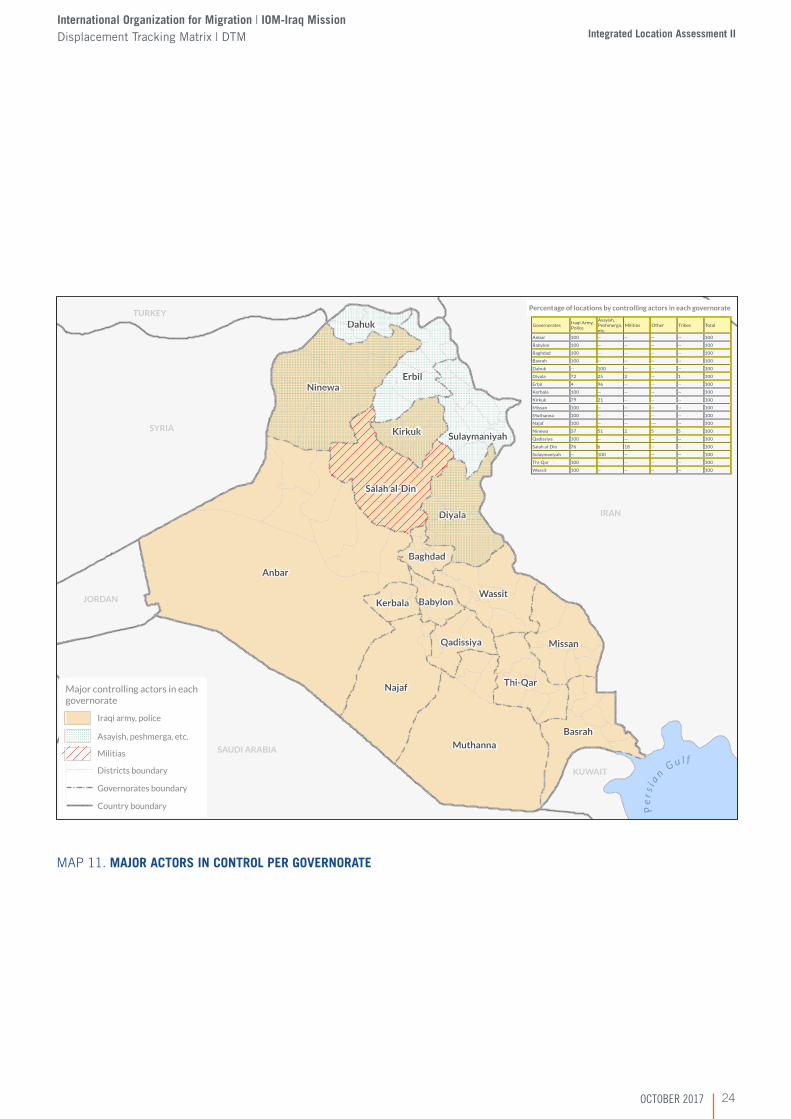
International Organization for Migration | IOM-Iraq MissionDisplacement Tracking Matrix | DTM Integrated Location Assessment II
24october 2017
Percentage of locations by controlling actors in each governorate
Anbar
Najaf
Muthanna
NinewaErbil
Diyala
Wassit
Basrah
Missan
Thi-Qar
Kirkuk Sulaymaniyah
Dahuk
Qadissiya
Kerbala
Baghdad
Babylon
IRAN
SYRIA
SAUDI ARABIA
TURKEY
JORDAN
KUWAIT
Iraqi army, police
Asayish, peshmerga, etc.
Militias
Districts boundary
Governorates boundary
Country boundary
Major controlling actors in eachgovernorate
GovernoratesIraqi Army, Police
Asayish, Peshmerga, etc.
Militias Other Tribes Total
Anbar 100 -- -- -- -- 100
Babylon 100 -- -- -- -- 100
Baghdad 100 -- -- -- -- 100
Basrah 100 -- -- -- -- 100
Dahuk -- 100 -- -- -- 100
Diyala 72 25 2 -- 1 100
Erbil 4 96 -- -- -- 100
Kerbala 100 -- -- -- -- 100
Kirkuk 79 21 -- -- -- 100
Missan 100 -- -- -- -- 100
Muthanna 100 -- -- -- -- 100
Najaf 100 -- -- --- -- 100
Ninewa 37 51 2 5 5 100
Qadissiya 100 -- -- -- -- 100
Salah al-Din 76 6 18 -- -- 100
Sulaymaniyah -- 100 -- -- -- 100
Thi-Qar 100 -- -- -- -- 100
Wassit 100 -- -- -- -- 100
Salah al-Din
P e
r s i a
n G u l f
Map 11. MaJOr acTOrs IN cONTrOl Per GOVerNOraTe

International Organization for Migration | IOM-Iraq MissionDisplacement Tracking Matrix | DTM Integrated Location Assessment II
25 october 2017
lIVING cONDITIONs
As previously noted, the relatively decreasing level of violence has led to more long-term concerns over economic security. In locations covering 80% of IDPs and 63% of returnees, ac-cess to employment was cited among the top three needs and over 75% of both IDPs and returnees stated that there are not enough jobs. ILA I found that the majority of IDPs were un-employed in 60% of the locations, with peaks of 95% in loca-tions across Ninewa, Qadissiya, Erbil, Anbar and Missan.31 ILA II reveals that in almost half of the locations (49%, weighted by returnee families) most returnees have no jobs, with peaks of 96% and 84% unemployment in locations in Baghdad and Kirkuk respectively.
Even when jobs are available, they might not provide sufficient income: 11% of IDPs and 12% of returnees reported that their salaries were insufficient. This is especially the case of families
displaced in Kerbala and Najaf and of those who returned to Diyala. To earn a living, families rely on more than one source – most incomes are from the public sector (83%), while the pri-vate sector is relevant for around 60% of families (39% private business and 22% paid jobs). One out of three returnee families relies on agriculture and one out of two on informal labour and/or pensions. The situation appears critical in Baghdad, where earnings mostly come from informal labour (90%), less than 20% of families rely on pensions and many returnees depend on the help of friends/relatives (17%) and/or cash grants/aid (26%). Over 40% of IDPs in Sulaymaniyah were reported to be unable to access jobs because they were under-qualified, which is also the case for half of those who went back to Kirkuk. Dis-tance and unequal access to jobs were considerably less import-ant for both populations and were mentioned only for significant shares of Ninewa returnees.
96% 84%
Baghdad Kirkuk NinewaDiyala Salah al-DinAnbar Erbil
68%51% 45%43%
% Unemployed returnees
38%
Figure 12. UNeMPlOYMeNT % of locations where most returnees do not have jobs
Figure 13. MaIN sOUrces OF INcOMe FOr reTUrNees
Overall most returnees are unemployed in half of the surveyed locations, with peaks of 96% and 84% in Baghdad and Kirkuk.
Paid jobs in the public sector are the main source of income for over 80% of returnees. However one out of two families also relies on informal commerce/irregular labour.
Paid job (public) PensionInformal commerce/irregular daily labour
BusinessAgriculture/farming/herding
Paid job (private)
Cash grants or other aid
from national institutions
Money fromfamily and/or friends abroad
Savings
% % of returnees
83% 51%50%38%32%22%8%6%5%
31. Integrated Location Assessment I, IOM March 2017.

International Organization for Migration | IOM-Iraq MissionDisplacement Tracking Matrix | DTM Integrated Location Assessment II
26october 2017
The main concern of IDPs in general is related to accessing means of living (such as food, household and non-food items –NFI– and shelter). Returnees, on the other hand, are more concerned about water and health (second and third top needs respectively). Health services were rated mostly as too expensive (37%), of poor quality (13%) and overcrowded (8%), while water of bad quality (44%), too expensive (28%) and insufficient (23%). The poor quality of both services is cause of concern particularly in Baghdad (affecting 70% of returnee families), and should underscored because of the wider implications for health and disease prevention. Bad colour and/or taste of water is an issue also for around 70% of families who came back to Diyala and Erbil (Makhmur), while returnees in Kirkuk and Salah al-Din are more concerned about inconsistent water supply. Returnee families were also more likely to express concern about education because schools are few and often overcrowded. In Erbil 75% of families raised the issue; in Salah al-Din, nearly 60%.
The ranking of concerns is reflected in the share of IDPs and returnees who need information on the same issues. In addition to employment, the displaced population is reported as interested in cash aid (51%) and food distribution (48%). Specifically, over 80% of families displaced in Baghdad, Babylon, Najaf, Qadissiya, Muthanna and Missan need information about cash aid – which may be an indication that they are greatly dependent on this form of assistance. More information on food distribution was needed by 90% of IDPs in Anbar, Dahuk, Basrah and Missan. One out of four IDP families reportedly needs more information about the security situation of the location of origin and this figure is almost double for IDPs in Erbil, Kirkuk, Qadissiya and Wassit. As to returnees, their most needed information is on health care and support to rebuild their houses.
Figure 14. MOsT PressING IssUes FOr IDPs aND reTUrNees
Access to employment
Drinking water
Education
Food
Health
Household items and NFI
Shelter/housing
63%
43%
38%
31% 43%
41%
47%
44%
22%
29%
60%
11%
14%
80%
Employment is the most pressing issue for both IDP and returnee families In addition, IDPs are also concerned about NFI and shelter/housing, and returnees about health and drinking water.

International Organization for Migration | IOM-Iraq MissionDisplacement Tracking Matrix | DTM Integrated Location Assessment II
27 october 2017
Figure 15. MOsT NeeDeD INFOrMaTION FOr IDPs aND reTUrNees
Security situation (origin)
Access to employment/livelihoods
Cash aid
Status of detained family member(s)
Personal documentation
Land/property documentation
Family reuni�cation mechanisms
Food distributions
Health care
NFI distribution
Rent assistance
Options/support to rebuild their houses
Rubble, IED and UXO removal
23%
41%
37%
41%
29%
15%
3%18%
41%
38%
56%
47%
7%
20%
10%
15%
11%
4%
5%
12%
51%
60%
Information on access to employment/livelihoods is the most needed information for IDPs and returnees. While cash aid and food distribution are also a priority for IDPs, returnees are in great need of information about health care and options/support to rebuild their houses.
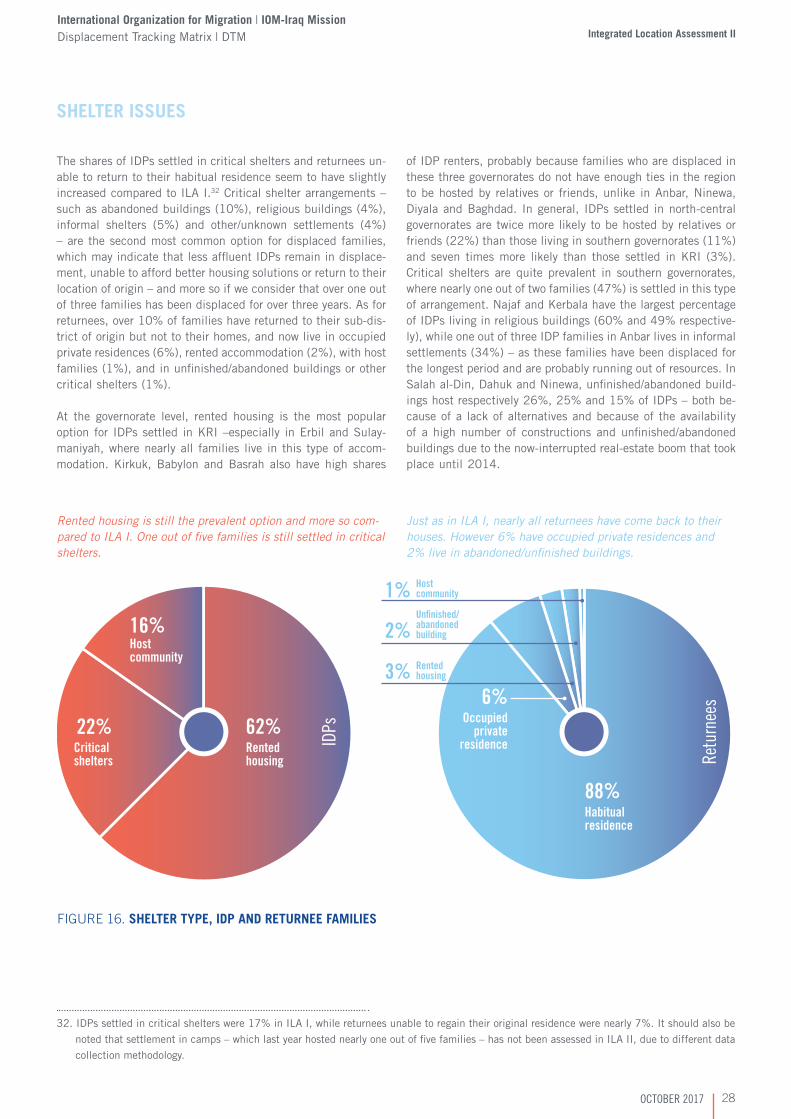
International Organization for Migration | IOM-Iraq MissionDisplacement Tracking Matrix | DTM Integrated Location Assessment II
28october 2017
Figure 16. sHelTer TYPe, IDP aND reTUrNee FaMIlIes
sHelTer IssUes
The shares of IDPs settled in critical shelters and returnees un-able to return to their habitual residence seem to have slightly increased compared to ILA I.32 Critical shelter arrangements – such as abandoned buildings (10%), religious buildings (4%), informal shelters (5%) and other/unknown settlements (4%) – are the second most common option for displaced families, which may indicate that less affluent IDPs remain in displace-ment, unable to afford better housing solutions or return to their location of origin – and more so if we consider that over one out of three families has been displaced for over three years. As for returnees, over 10% of families have returned to their sub-dis-trict of origin but not to their homes, and now live in occupied private residences (6%), rented accommodation (2%), with host families (1%), and in unfinished/abandoned buildings or other critical shelters (1%).
At the governorate level, rented housing is the most popular option for IDPs settled in KRI –especially in Erbil and Sulay-maniyah, where nearly all families live in this type of accom-modation. Kirkuk, Babylon and Basrah also have high shares
of IDP renters, probably because families who are displaced in these three governorates do not have enough ties in the region to be hosted by relatives or friends, unlike in Anbar, Ninewa, Diyala and Baghdad. In general, IDPs settled in north-central governorates are twice more likely to be hosted by relatives or friends (22%) than those living in southern governorates (11%) and seven times more likely than those settled in KRI (3%). Critical shelters are quite prevalent in southern governorates, where nearly one out of two families (47%) is settled in this type of arrangement. Najaf and Kerbala have the largest percentage of IDPs living in religious buildings (60% and 49% respective-ly), while one out of three IDP families in Anbar lives in informal settlements (34%) – as these families have been displaced for the longest period and are probably running out of resources. In Salah al-Din, Dahuk and Ninewa, unfinished/abandoned build-ings host respectively 26%, 25% and 15% of IDPs – both be-cause of a lack of alternatives and because of the availability of a high number of constructions and unfinished/abandoned buildings due to the now-interrupted real-estate boom that took place until 2014.
Rentedhousing
Hostcommunity
Criticalshelters
62%
Habitual residence
88%
Occupiedprivate
residence
6%
Rentedhousing3%
Un�nished/abandonedbuilding2%
Hostcommunity1%
22%
16%
IDPs
Retu
rnee
s
Rented housing is still the prevalent option and more so com-pared to ILA I. One out of five families is still settled in critical shelters.
Just as in ILA I, nearly all returnees have come back to their houses. However 6% have occupied private residences and 2% live in abandoned/unfinished buildings.
32. IDPs settled in critical shelters were 17% in ILA I, while returnees unable to regain their original residence were nearly 7%. It should also be
noted that settlement in camps – which last year hosted nearly one out of five families – has not been assessed in ILA II, due to different data
collection methodology.

International Organization for Migration | IOM-Iraq MissionDisplacement Tracking Matrix | DTM Integrated Location Assessment II
29 october 2017
0
40%
20%
60%
80%
100%
Unknown Other formal settlement Hotel/Motel School buildingReligious building
Informal settlements Un�nished/abandoned building Occupied private residenceHost community
Rented housing
Basr
ah
Mis
san
Thi-Q
ar
Mut
hann
a
Qadi
ssiy
a
Naja
f
Was
sit
Kerb
ala
Baby
lon
Bagh
dad
Anba
r
Diya
la
Sala
h al
-Din
Kirk
uk
Nine
wa
Sula
yman
iyah
Erbi
l
Dahu
k
Figure 17. IDP TYPe OF sHelTer Per GOVerNOraTe
Figure 18. IDP TYPe OF sHelTer Per GOVerNOraTe
As for returnees, the situation is particularly critical in Anbar (13% of families reported they live in occupied private residences), Diyala (12% of families in unfinished/abandoned buildings), and Kirkuk (7% of families hosted by other families). In these three governorates, the share of houses that have suffered significant to severe damage or have been completely destroyed in returnee locations ranges from 38% to 57%.
Figure 19 shows main housing issues and concerns for IDPs. Overall, housing was rated among the top three needs of 44% of IDPs. Most families living in Thi-Qar and Muthanna are reported as affected – in Muthanna mostly because of high rental prices and in Thi-Qar due to the poor quality of housing. The issue of poor housing quality was also reported in Najaf and Kerbala, where 62% and 49% of families are settled in religious buildings. In Kerbala, 2% of families reported that IDPs were prevented from renting. High rental prices affect three out of four families in KRI, Baghdad, Missan and Basrah. Overcrowding is more prevalent in Anbar and Salah al-Din, where respectively three fourth and one fourth of families live with other families or in informal settlements. In Babylon, where both overcrowding and high prices were reported by over 40% of cases, most IDPs need information on rent assistance. This kind of information is also needed by IDP families settled in Sulaymaniyah (37%), Thi-Qar, Qadissiya, Kerbala and Diyala (around 30% for the three of them).
Furthermore, shelter problems – i.e. house badly damaged or property occupied – were cited among the main obstacles to return for respectively 51% and 41% of IDPs (see Intentions).
0
40%
20%
60%
80%
100%
Other/unknown Un�nished/abandoned building
Occupied private residenceHost community Rented housing
Habitual residence
Sala
h al
-Din
Nine
wa
Kirk
uk
Erbi
l
Diya
la
Bagh
dad
Anba
r

International Organization for Migration | IOM-Iraq MissionDisplacement Tracking Matrix | DTM Integrated Location Assessment II
30october 2017
Figure 19. IDP sHelTer IssUes
Figure 20. reTUrNee sHelTer IssUes
As for returnees, overall housing was rated among top three needs for almost one out of three cases. The share is more than double in Diyala (68%), where 14% of families could not return to their residence and where nearly 60% of houses have undergone significant to complete damage, and Baghdad (78%), where 20% of returnees live in rented accommodations of poor quality as many were forced to move to cheaper accommodations because they could not continue paying rent in a previous shelter.33 The poor quality of housing is also an issue for nearly all families living in Erbil and Diyala, (which comes as no surprise considering that 12% of Diyala returnees live in abandoned/unfinished buildings); while overcrowding is more prevalent in Kirkuk, with nearly 60% of families living in overcrowded shelters and 7% hosted by other families. Information on rent assistance is most needed by returnee families settled in Salah al-Din and Ninewa, where respectively 41% and 36% of families complained about high rental prices.
DAHUK KIRKUKERBIL
DIYALA
SULAYMANIYAH NINEWA
BABYLON
KERBALA NAJAF QADISSIYAWASSIT MUTHANNA
ANBAR BAGHDAD
THI-QAR MISSAN BASRAH
SALAH AL-DIN66%
26%
37%
17%
43%
<1%
100%
20%
37%
14%
8%
<1%
3%
91%
98%
51%
17%
31%
33%
51%
36%
24%
28%
41%
67%
54%
31%
14%
14%
73%
26%
3%
13%
71%
44%
42%
18%
29%
39%
66%
11%
47%
52%
42%
57%
28%
44%
20%
27%
36%
27%
25%
7%
48%
7%
4%
10%
12%
86%
4%
1%
37%
99%
62%
5%
10%
12%
85%
41%
15%
8%
25%
76%
20%
11%
70%
6%
19%
72%
25%
15%
29%
60%
100%
35%
<1%
65%
Housing is among top three needsHousing price is too expensive
Housing quality is poorHousing is overcrowded
Need more information on rent assistance
SALAH AL-DIN29%
38%21%59%<1%
41%9%
28%25%52%<1%
36%
<1%
91%36%12%
9%
67%
91%6%
<1%
3%78%
20%15%21%15%
64%
KIRKUK33%
59%41%<1%
41%
NINEWA
ERBIL
BAGHDAD
ANBAR25%
39%37%6%
24%
DIYALA
Housing is among top three needs
Housing price is too expensive
Housing quality is poor
Housing is overcrowdedNeed information on options/support torebuild houses Need information on IED/UXO removal
33. Over 60% of residents that had not returned to their property did not provide reasons for not doing so and only 22% stated that they did not
return because of damage to their houses.

International Organization for Migration | IOM-Iraq MissionDisplacement Tracking Matrix | DTM Integrated Location Assessment II
31 october 2017
The irregular/unauthorized ownership of housing, land and property (HLP) is common to all post-conflict situations. As IDPs begin to return to their original homes and reclaim their former properties, disputes over HLP rights are likely to emerge because unregistered/unofficial transfers of property or expropriation may have taken place during displacement; former properties may be occupied by other families; land boundaries might have changed and returnees may have lost the documentation to prove their claims.
Returnee ownership problems are summarised in the figure below. The most relevant issue appears to be lack of documentation, as it was rated among the top three HLP challenges in nearly one out of four locations (hosting around 20% of families). The issue is particularly significant in Salah al-Din (47% of families), Ninewa (33%) and Diyala (27%), wherein over 15% of the locations of the three governorates (hosting respectively 29%, 27% and 10% of families) government records were destroyed. Lack of money to pay for replacement documents is the main issue in one out of four locations (hosting 11% of the returnee families). Returnees in Diyala and Baghdad encounter the greatest difficulties (40% and 30% of families respectively) to replace documents. In Diyala, the process of replacement appears particularly complicated as competent offices are far away from the locations assessed and the process is time-consuming (over 75% of families returned to locations where such difficulties are reportedly experienced).
HousIng, LAnd And property rIgHts CHALLenges
2% 12%
Government restriction onacquiring/renewing documents
Recordsare destroyed
Unclear/complicated replacement
No money for replacement of documents
No of�ce or too far
Time consumingreplacement
Lost documentation
7% 11% 13% 11%
% Returnee ownership problems
19%
Figure 21. HlP IssUes FOr reTUrNees(% of population hosted in locations reporting the issue)
Figure 22. IDPs INTeNTIONs IN THe sHOrT aND lONG TerM in 2015, 2016 and 2017
reasONs, INTeNTIONs aND OBsTacles
Long-term intentions of IDPs are in line with last year’s findings: nearly 90% are determined to return home. Only in Basrah, Najaf, Thi-Qar and Kerbala are significant shares of families considering to locally integrate or resettle. Ethno-religious affil-iation may be motivating families to stay (involuntarily), mostly of Shia families (whether Turkmen, Shabak or Arab), who often fear terrorist attacks and changes in the ethno-religious compo-sition at the location of origin. Ethno-religious affiliation may also explain why Kurdish Yazidi and Chaldean Christian IDPs settled in Dahuk (15%) and to a certain extent in Erbil (2%), are considering the possibility of moving abroad – they are the only two groups who wish to do so.
Short-term intentions show a shift towards local integration: the share of families willing to stay in displacement has increased from 32% in 2015 to 75% in 2017. This shift in attitudes appears somehow more realistic, as if protracted displacement had made IDPs realize that carrying out their intentions de-pends on a variety of factors, not only security; financial means, access to property and basic services upon return are equally important.
At governorate level, the highest share of families involuntarily staying on the short term were in Basrah, Kerbala and Thi-Qar,
0
40%
20%
60%
80%
100%
Return Local integration
Move to a third location inside or outside Iraq
Other/unknown
2017
long
term
2016
long
term
2015
long
term
2017
sho
rt te
rm
2016
sho
rt te
rm
2015
sho
rt te
rm

International Organization for Migration | IOM-Iraq MissionDisplacement Tracking Matrix | DTM Integrated Location Assessment II
32october 2017
but also in Baghdad, Babylon and Salah al-Din, where one out of four families is unable to return to their area of origin. IDPs in Baghdad are among the poorest, as nearly all families cannot afford food and NFIs and 80% are in great need of information
about cash aid. Similar to ILA I, families displaced in Anbar are the most determined to return home (99%), while nearly all families settled in Qadissiya, Wassit, Missan, Dahuk and Sulay-maniyah are voluntarily willing to stay.
ST LT
ST
ST
ST
ST
ST
ST
ST
Anbar
Najaf
Muthanna
NinewaErbil
Diyala
Wassit
Basrah
Missan
Salah al-Din
Thi-Qar
KirkukSulaymaniyah
Dahuk
Qadissiya
BabylonKerbala
Baghdad
IRAN
SYRIA
SAUDI ARABIA
TURKEY
JORDAN
KUWAIT
Percentages of short term intentions of IDPs- country wide
Percentages of long term intentions of IDPs- country wide
ST
ST ST
ST
ST
LT
LT
LT
LT
LT
LT
LT
LT
LT
LT
LT LT
LT
(Short Term) ST LT (Long Term)
Go abroadStay in the current location (involuntarily)
Stay in the current location (voluntarily)
Move to a third location – within the country
Return to their place of origin
Unknown/Others
Go abroadLocally integrate in the current location (involuntarily)
Locally integrate in the current location (voluntarily)
Move to a third location – within the country
Return to their place of origin
Unknown/Others
*Weighted by IDP families in each location
Percentage of long/short term IDP intentions per governorate*P
e r s
i a n G
u l f
ST
ST
ST
ST
ST
LT
LT
LTST
LT
60% 15%
24%
88%
7%
2%2%
1%
1%
Map 12. sHOrT aND lONG TerM IDP INTeNTIONs Per GOVerNOraTe
Short-term findings are confirmed by observing the most rated obstacles to return. Although the security conditions in the lo-cation of origin were still cited as important for nearly 70% of IDPs, the absence of a shelter – whether destroyed or occupied – to return to (92%) and the lack of services back home (52%) have gained importance in hindering the return potential.
Difficulties in going back to the location of origin may also be related to the fact that often, families who remain in displace-ment are among the poorest and most vulnerable families and are strained by long years of movement. In locations where there
are female-headed households, and particularly households headed by female minors, “lack of money” is recurrently among the top three obstacles to return.
Lack of money can act both as a pull factor to stay in displace-ment and a push factor fostering returns.34 In fact, the lack of financial means to remain in displacement is the only relevant push factor in the decision to return of nearly half of return-ee families. Other push factors – such as the worsening of the security situation in the location of displacement, negative in-centives and evictions – were mentioned overall for less than
34. Push factors were considered as: evictions from the last place of displacement by government authorities or private owners, lack of financial
means to stay at previous location, the deterioration of the security situation in the location of displacement and negative incentives (threats
from local authorities/withholding of salaries or aid). Pull factors: safety of the location of origin, possibility to work/recreate economic activities
(livelihoods), presence of family members who had already returned, encouragement by community/religious leaders, incentives by government
authorities or humanitarian/development actors, and the option of checking the general conditions of the location of origin.

International Organization for Migration | IOM-Iraq MissionDisplacement Tracking Matrix | DTM Integrated Location Assessment II
33 october 2017
75%
66%
47%
28%
22%
18%
18%
1%
1%
2%
4%
67%
58%
42%
13%
5%
43%
33%
4%
1%
1%
The location is safe
Possibility to work
No means to stay in displacement
Encouragement
Incentives/support
After checking location of origin
Join family members
Negative incentives
Worsening of security in displacement
Evicted
Other
ILA II ILA I
8% of families. Among the most recent pull factors, the role of community/religious leaders appears to have gained importance in encouraging returns and, together with incentives provided
Comparing Anbar and Salah al-Din governorates provides a per-fect example of the dilemma that IDPs face when their resourc-es are depleted: while intra-governorate IDPs in Anbar rated lack of money as a top obstacle to return, in Salah al-Din 40% of returns were triggered by the lack of funds.35 This means that where the expectations of recreating livelihoods are high, family members have already returned and therefore it is pos-sible to check the conditions in the locations of origin; it also means that lack of funds may prompt returns, such as in Salah al-Din. However, when needed factors to restart a new life are less available, such as in Anbar, IDPs are more likely to stay in displacement if they have the means to do so.
67% 52% 51% 41% 30% 26%11%
The area of return isinsecure/unsafe due toon-going con�ict, UXO,landmines, militias etc.
Absence of servicesback home
House in placeof origin isdestroyed
Unable to returnbecause property
is inhabited
Lack of money Unable to return becausethe security forces inthe origin area do not
allow a return
Fear as a resultof the changedethno-religiouscomposition of
the place of origin
% of IDP familiesFigure 24. OBsTacles TO reTUrN
Figure 23. PrIMarY reasONs TO reTUrN ILA I and ILA II
35. In Salah al-Din and Anbar governorates, reasons to return have been compared with obstacles to return for IDPs originating from both governo-
rates. The two governorates were chosen for comparison because they account for most returns (46% Anbar, 22% Salah al-Din). In addition,
Salah al-Din was the first governorate to receive large-scale returns as early as 2015, followed by Anbar in 2016.
by the government and/or humanitarian actors, was reported for nearly half of returnee families.
The comparison also showcases how in Anbar, positive factors such as encouragement by community/religious leaders and incentives/support provided by government authorities or hu-manitarian/development actors motivated respectively 42% and 32% of returns; while in Salah al-Din over 20% of returns were pushed by negative factors, such as threats from local authorities or withholding of salaries or aid (19% overall), evictions (1%) and worsening of the security situation in displacement (0.4%). IDPs originally from Salah al-Din not only have been pushed into return, but also half of those who remain in displacement were reported to be unable to return to their exact area of origin because security forces would not allow their return.

International Organization for Migration | IOM-Iraq MissionDisplacement Tracking Matrix | DTM Integrated Location Assessment II
34october 2017
87%
56%
52%
42%
33%
4%
14%
1%
61%
74%
41%
25%
5%
32%
33%
19%
<1%
1%
1%
The location is safe
Possibility to work
No means to stay in displacement
Encouragement
Incentives/support
After checking location of origin
Join family members
Negative incentives
Worsening of security in displacement
Evicted
Other
Anbar Salah al-Din
Apparently, IDPs originally from Salah al-Din who are displaced within the governorate are more worried about security than about livelihoods in their location of origin, than those IDPs displaced outside the governorate. In Anbar, nearly all intra-gov-ernorate IDPs have no security concerns but lack the money to return, and 73% cannot access their residences because they are occupied. Extra-governorate IDPs seem on average more concerned about security and the condition of their residences – over 60% of families reported that their houses were com-pletely destroyed.
Peace and security are still the main drivers for choosing the destination of displacement (26%), although nearly 30% of families chose their destination based on whether they had ex-tended family/relatives/friends or a community of similar eth-nic-religious-linguistic background there, and 25% of families could not afford any other place/did not have any other choice (it was 8% in 2016). When the drive for security and peace los-es grip, factors that explain the choice of the displacement des-tination are most likely the same that keep families in displace-ment and inhibit or delay the return to the location of origin.
Figure 25. PrIMarY reasONs TO reTUrN (aNBar aND salaH al-DIN)
Figure 26. reasONs FOr cHOOsING THe DesTINaTION OF DIsPlaceMeNT ILA I AND ILA II
Security and peace
Presence of family,relatives or friends
Cannot afford other places/No other choices
Availability of housing
Proximity to origin
Same ethnic-linguistic-religious background
Availability of services
Availability of jobs
26% 49%
25% 21%
8%23%
13%12%
5%6%
2%3%
1%3%
1%2%
ILA II ILA I

International Organization for Migration | IOM-Iraq MissionDisplacement Tracking Matrix | DTM Integrated Location Assessment II
35 october 2017

International Organization for Migration | IOM-Iraq MissionDisplacement Tracking Matrix | DTM Integrated Location Assessment II
36october 2017

International Organization for Migration | IOM-Iraq MissionDisplacement Tracking Matrix | DTM Integrated Location Assessment II
37 october 2017
INTEGRATED LOCATIONASSESSMENT II
October 2017
International Organization for Migration | IOM-Iraq MissionDisplacement Tracking Matrix | DTM
THEMATIC OVERVIEWPART I